UNITED STATES
SECURITIES AND EXCHANGE COMMISSION
Washington, D.C. 20549
FORM N-CSR
CERTIFIED SHAREHOLDER REPORT OF REGISTERED
MANAGEMENT
INVESTMENT COMPANIES
Investment Company Act File Number 811-4946
THOMPSON IM FUNDS, INC.
(Exact name of registrant as specified in charter)
918 Deming Way
Madison, Wisconsin 53717
(Address of principal executive offices)--(Zip code)
John W. Thompson
Chief Executive Officer and President
Thompson IM Funds, Inc.
918 Deming Way
Madison, Wisconsin 53717
(Name and address of agent for service)
With a copy to:
Fredrick G. Lautz, Esq.
Quarles & Brady LLP
411 East Wisconsin Avenue
Milwaukee, Wisconsin 53202
Registrant's telephone number, including area code: (608) 827-5700
Date of fiscal year end: November 30, 2013
Date of reporting period: November 30, 2013
Form N-CSR is to be used by management investment companies to file reports with the Commission not later than 10 days after the transmission to stockholders of any report that is required to be transmitted to stockholders under Rule 30e-1 under the Investment Company Act of 1940 (17 CFR 270.30e-1). The Commission may use the information provided on Form N-CSR in its regulatory, disclosure review, inspection and policymaking roles.
A registrant is required to disclose the information specified by Form N-CSR, and the Commission will make this information public. A registrant is not required to respond to the collection of information contained in Form N-CSR unless the Form displays a currently valid Office of Management and Budget ("OMB") control number. Please direct comments concerning the accuracy of the information collection burden estimate and any suggestions for reducing the burden to Secretary, Securities and Exchange Commission, 450 Fifth Street, N.W., Washington, DC 20549-0609. The OMB has reviewed this collection of information under the clearance requirements of 44 U.S.C. § 3507.
Item 1. Report to Stockholders.
THOMPSON IM FUNDS, INC.
ANNUAL REPORT TO SHAREHOLDERS
NOTE ON FORWARD-LOOKING STATEMENTS
The matters discussed in this report may constitute forward-looking statements. These include any Advisor or portfolio manager predictions, assessments, analyses or outlooks for individual securities, industries, investment styles, market sectors, interest rates, economic trends and/or markets. These statements involve risks and uncertainties. In addition to the general risks described for each Fund in its current Prospectus, other factors bearing on these reports include the accuracy of the Advisor’s or portfolio manager’s forecasts and predictions, the appropriateness of the investment strategies designed by the Advisor or portfolio manager and the ability of the Advisor or portfolio manager to implement its strategies efficiently and successfully. Any one or more of these factors, as well as other risks affecting the securities markets generally, could cause the actual results of any Fund to differ materially as compared to its benchmarks.
1
THOMPSON IM FUNDS, INC.
ANNUAL REPORT TO SHAREHOLDERS
November 30, 2013
CONTENTS
| Page(s) |
| LARGECAP FUND | |
| Investment review | 3-5 |
| Schedule of investments | 6-7 |
| |
| MIDCAP FUND | |
| Investment review | 8-10 |
| Schedule of investments | 11-12 |
| |
| BOND FUND | |
| Investment review | 13-16 |
| Schedule of investments | 17-27 |
| |
| FUND EXPENSE EXAMPLES | 28 |
| |
| FINANCIAL STATEMENTS | |
| Statements of assets and liabilities | 29 |
| Statements of operations | 30 |
| Statements of changes in net assets | 31 |
| Notes to financial statements | 32-37 |
| Financial highlights | 38-40 |
| |
| REPORT OF INDEPENDENT REGISTERED PUBLIC ACCOUNTING FIRM | 41 |
| |
| DIRECTORS AND OFFICERS | 42-43 |
| |
| ADDITIONAL INFORMATION | 44-47 |
This report contains information for existing shareholders of Thompson IM Funds, Inc. It
does not constitute an offer to sell. This Annual Report is authorized for distribution to prospective investors
only when preceded or accompanied by a Fund Prospectus, which contains information about
the Funds’ objectives and policies, risks, management, expenses and other information.
A Prospectus can be obtained by calling 1-800-999-0887.
Please read your Prospectus carefully.
2
| LARGECAP FUND INVESTMENT REVIEW (Unaudited) |
| November 30, 2013 |
Portfolio Managers
James T. Evans, CFA
Jason L. Stephens, CFA
John W. Thompson, CFA
Performance
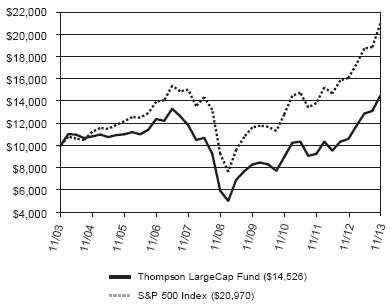
The LargeCap Fund produced a total return of 36.33% for the fiscal year ended November 30, 2013, as compared to its benchmark, the S&P 500 Index, which returned 30.30%.
Comparison of Change in Value of a Hypothetical $10,000 Investment
| Average Annual Total Returns |
| Through 11/30/13 |
| 1 Year | 3 Year | 5 Year | 10 Year |
| Thompson LargeCap Fund | 36.33% | 17.12% | 19.27% | 3.80% |
| S&P 500 Index | 30.30% | 17.73% | 17.60% | 7.69% |
Gross Expense Ratio as of 03/31/13 was 1.31%.
Net Expense Ratio after reimbursement was 1.15% as of 12/1/13.*
* The Advisor has contractually agreed to waive management fees and/or reimburse expenses incurred by the LargeCap Fund through March 31, 2015 so that the annual operating expenses of the Fund do not exceed 1.15% of its average daily net assets.
Performance data quoted represents past performance; past performance does not guarantee future results. The investment return and principal value of an investment will fluctuate so that an investor’s shares, when redeemed, may be worth more or less than their original cost. Current performance of the Fund may be lower or higher than the performance quoted. Performance data current to the most recent month-end may be obtained by calling 1-800-999-0887 or visiting www.thompsonim.com.
Results include the reinvestment of all dividends and capital gains distributions. Investment performance reflects all fee waivers that may be in effect. In the absence of such waivers, total return would be reduced. The performance information reflected in the graph and the table above does not reflect the deduction of taxes that a shareholder would pay on fund distributions or the redemption of fund shares, nor does it imply future performance. The S&P 500 Index is an unmanaged index commonly used to measure the performance of U.S. stocks. You cannot directly invest in an index.
The S&P 500 Index is a product of S&P Dow Jones Indices LLC and has been licensed for use by Thompson Investment Management, Inc. S&P® and S&P 500® are registered trademarks of Standard & Poor’s Financial Services LLC (“S&P”). The Thompson IM Funds are not sponsored, endorsed, sold or promoted by S&P Dow Jones Indices LLC, Dow Jones, S&P or their respective affiliates, and none of S&P Dow Jones Indices LLC, Dow Jones, S&P nor their respective affiliates makes any representation regarding the advisability of investing in such products.
See Notes to Financial Statements.
3
| LARGECAP FUND INVESTMENT REVIEW (Unaudited) (Continued) |
| November 30, 2013 |
Management Commentary
The fiscal year proved to be a good one for shareholders, with strong relative and absolute performance. Our pro-cyclical positioning of the portfolio was rewarded, with both sector and individual issue attribution contributing to relative returns. Consumer Discretionary, Technology and Consumer Staples were the best performing areas in the portfolio, but winners were also scattered throughout most of the other areas of the market. Only Health Care was materially disappointing. While our individual holdings in that sector performed in line with the overall sector, our failure to overweight the total sector hurt our relative performance as it bucked the trend and outperformed despite typically being defensive in nature.
Going forward, we believe the market is fairly valued and has the potential to offer investors returns comparable to future earnings growth. This is in contrast to the past four years, when the market was cheap and offered the prospect of both earnings growth and multiple expansion. As a result, we feel it is unlikely that the S&P 500’s return over the next four years will match the 25.72% annualized return investors have enjoyed since the market bottom in March 2009. Instead, something closer to the long term historical averages (which tend to match earnings growth) seems more reasonable to us.
Even if our intermediate forecast is correct, it doesn’t mean the market will move in a linear fashion. It wouldn’t surprise us to see a reversal of the massive flows out of equities into fixed income, as rising rates are likely to cause returns in that sector to be depressed for the next several years. As a result, money could flood back into equities and we could see positive returns beyond those expected from earnings growth alone. This could be followed by a consolidation period where returns may be stagnant. Said another way, we believe markets tend to run until they are overvalued relative to their intrinsic worth, rather than merely fairly valued. As such, we believe that large cap stocks still have the potential to produce attractive returns in the near-term from here.
Whether the market’s return is linear or front-end loaded, we believe either scenario benefits more from a greater emphasis on stock selection, as we believe betting broadly on the overall market is unlikely to provide outsized returns from this point. We believe this plays to our strength as managers. Since the current team of portfolio managers took over the management of the LargeCap Fund in January 2009, the cumulative return through the end of the fiscal year has been 158.02% versus 143.04% for the S&P 500 index. Much of this relative return was generated by individual stock selection, rather than a broad market call or sector weightings. In an environment where security analysis is at an even greater premium, we are hopeful that shareholders will continue to be rewarded going forward too.
Opinions expressed are subject to change, are not guaranteed and should not be considered investment advice.
Mutual fund investing involves risk. Principal loss is possible. Investments in smaller companies involve additional risks such as limited liquidity and greater volatility. Investments in American Depositary Receipts (“ADRs”) are subject to some extent to the risks associated with directly investing in securities of foreign issuers, including the risk of changes in currency exchange rates, expropriation or nationalization of assets, and the impact of political, diplomatic, or social events. Investments in real estate securities may involve greater risk and volatility including greater exposure to economic downturns and changes in real estate values, rents, property taxes, tax, and other laws. A REIT’s share price may decline because of adverse developments affecting the real estate industry.
Please refer to the Schedule of Investments on page 6 of this report for holdings information. The management commentary above as well as Fund holdings and asset/sector allocations should not be considered a recommendation to buy or sell any security. In addition, please note that Fund holdings and asset/sector allocations are subject to change.
Earnings Growth is a measure of growth in a company’s net income over a specific period, often one year. It is not a prediction of the fund’s future returns.
See Notes to Financial Statements.
4
| LARGECAP FUND INVESTMENT REVIEW (Unaudited) (Continued) |
| November 30, 2013 |
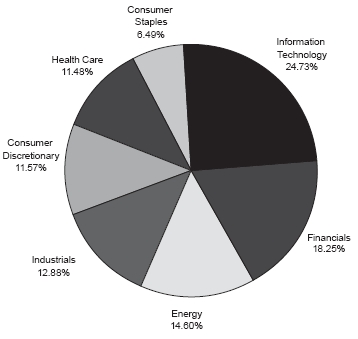
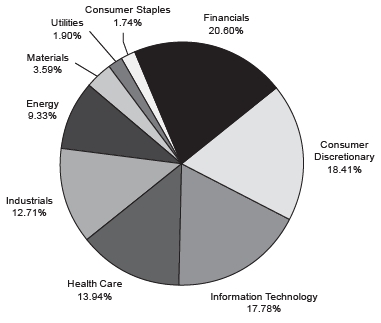
Sector Weightings at 11/30/13
% of Total Investments
| Top 10 Equity Holdings at 11/30/13 |
| | % of Fund’s |
| Company | Industry | Net Assets |
| Microsoft Corp. | Software & Computer Services | 3.32% |
| Exxon Mobil Corp. | Oil & Gas Producers | 2.81% |
| Bank of America Corp. | Banks | 2.51% |
| Qualcomm, Inc. | Technology Hardware & Equipment | 2.17% |
| General Electric Co. | General Industrials | 2.09% |
| JPMorgan Chase & Co. | Banks | 2.09% |
| Citigroup Inc. | Banks | 2.08% |
| Express Scripts Holding Co. | Health Care Equipment & Services | 2.04% |
| Walgreen Co. | Food & Drug Retailers | 1.96% |
| JDS Uniphase Corp. | Technology Hardware & Equipment | 1.93% |
As of November 30, 2013, 100.1% of the Fund’s net assets were in equity and short-term investments.
See Notes to Financial Statements.
5
| LARGECAP FUND SCHEDULE OF INVESTMENTS |
| November 30, 2013 |
| | | | | Shares | | Value |
| COMMON STOCKS - 99.8% | | | | | |
| | | | | | |
| Consumer Discretionary - 11.6% | | | | | |
| | Automobiles & Parts - 2.9% | | | | | |
| | Harley-Davidson, Inc. | | 14,650 | | $ | 981,843 |
| | Johnson Controls, Inc. | | 36,400 | | | 1,838,564 |
| | LKQ Corp. (a) | | 22,850 | | | 757,478 |
| | | | | | | 3,577,885 |
| | General Retailers - 3.5% | | | | | |
| | Bed Bath & Beyond Inc. (a) | | 16,075 | | | 1,254,332 |
| | Kohl’s Corp. | | 29,335 | | | 1,621,639 |
| | Target Corp. | | 23,835 | | | 1,523,772 |
| | | | | | | 4,399,743 |
| | Household Products - 1.4% | | | | | |
| | D.R. Horton, Inc. | | 34,225 | | | 680,393 |
| | Jarden Corp. (a) | | 19,185 | | | 1,078,964 |
| | | | | | | 1,759,357 |
| | Leisure Goods - 0.6% | | | | | |
| | Brunswick Corp. | | 16,300 | | | 744,910 |
| | |
| | Media - 2.4% | | | | | |
| | The Walt Disney Co. | | 17,800 | | | 1,255,612 |
| | Time Warner Inc. | | 13,225 | | | 869,015 |
| | Viacom Inc. Class B | | 11,175 | | | 895,900 |
| | | | | | | 3,020,527 |
| | Personal Goods - 0.8% | | | | | |
| | Hanesbrands, Inc. | | 13,550 | | | 949,855 |
| | |
| Consumer Staples - 6.6% | | | | | |
| | Beverages - 1.1% | | | | | |
| | PepsiCo, Inc. | | 15,650 | | | 1,321,799 |
| | |
| | Food & Drug Retailers - 4.6% | | | | | |
| | CVS Caremark Corp. | | 19,525 | | | 1,307,394 |
| | Walgreen Co. | | 41,350 | | | 2,447,920 |
| | Wal-Mart Stores, Inc. | | 24,150 | | | 1,956,391 |
| | | | | | | 5,711,705 |
| | Household Goods & | | | | | |
| | Home Construction - 0.9% | | | | | |
| | The Procter & Gamble Co. | | 12,825 | | | 1,080,122 |
| | |
| Energy - 14.6% | | | | | |
| | Oil & Gas Producers - 12.7% | | | | | |
| | Anadarko Petroleum Corp. | | 12,992 | | | 1,153,949 |
| | Apache Corp. | | 13,300 | | | 1,216,817 |
| | Chevron Corp. | | 17,795 | | | 2,178,820 |
| | Devon Energy Corp. | | 24,200 | | | 1,467,004 |
| | Encana Corp. | | 50,225 | | | 963,818 |
| | Exxon Mobil Corp. | | 37,470 | | | 3,502,696 |
| | Forest Oil Corp. (a) | | 170,825 | | | 755,047 |
| | Hess Corp. | | 10,920 | | | 885,940 |
| | Noble Energy, Inc. | | 17,525 | | | 1,230,956 |
| | PetroChina Co. Ltd. ADR | | 10,925 | | | 1,300,512 |
| | Southwestern Energy Co. (a) | | 32,275 | | | 1,247,752 |
| | | | | | | 15,903,311 |
| | Oil Equipment, Services & | | | | | |
| | Distribution - 1.9% | | | | | |
| | Helmerich & Payne, Inc. | | 7,950 | | | 612,150 |
| | Schlumberger Ltd. | | 19,519 | | | 1,725,870 |
| | | | | | | 2,338,020 |
| Financials - 17.9% | | | | | |
| | Banks - 10.5% | | | | | |
| | Associated Banc-Corp | | 74,115 | | | 1,277,743 |
| | Bank of America Corp. | | 198,350 | | | 3,137,897 |
| | Citigroup Inc. | | 49,150 | | | 2,601,018 |
| | First Horizon National Corp. | | 110,510 | | | 1,238,817 |
| | JPMorgan Chase & Co. | | 45,575 | | | 2,607,801 |
| | PNC Financial Services Group, Inc. | | 12,530 | | | 964,184 |
| | SunTrust Banks, Inc. | | 17,825 | | | 645,800 |
| | Zions Bancorporation | | 22,150 | | | 649,660 |
| | | | | | | 13,122,920 |
| | Financial Services - 5.4% | | | | | |
| | CIT Group Inc. | | 25,400 | | | 1,282,192 |
| | Discover Financial Services | | 12,070 | | | 643,331 |
| | MSCI Inc. (a) | | 38,075 | | | 1,690,149 |
| | Northern Trust Corp. | | 21,595 | | | 1,273,889 |
| | State Street Corp. | | 26,400 | | | 1,916,904 |
| | | | | | | 6,806,465 |
| | Insurance - 1.0% | | | | | |
| | Aflac, Inc. | | 18,760 | | | 1,245,101 |
| | |
| | Real Estate Investment | | | | | |
| | Trusts - 1.0% | | | | | |
| | DiamondRock Hospitality Co. | | 56,425 | | | 644,938 |
| | Host Hotels & Resorts Inc. | | 33,425 | | | 615,354 |
| | | | | | | 1,260,292 |
| Health Care - 11.5% | | | | | |
| | Health Care Equipment & | | | | | |
| | Services - 6.2% | | | | | |
| | Baxter Int’l. Inc. | | 18,910 | | | 1,294,389 |
| | Express Scripts Holding Co. (a) | | 37,775 | | | 2,544,146 |
| | Henry Schein, Inc. (a) | | 5,565 | | | 634,410 |
| | Hologic, Inc. (a) | | 61,525 | | | 1,377,545 |
| | Medtronic, Inc. | | 11,565 | | | 662,906 |
| | ResMed Inc. | | 12,100 | | | 590,601 |
| | Zimmer Holdings, Inc. | | 7,350 | | | 671,864 |
| | | | | | | 7,775,861 |
See Notes to Financial Statements.
6
| LARGECAP FUND SCHEDULE OF INVESTMENTS (Continued) |
| November 30, 2013 |
| | | | | Shares | | Value |
| COMMON STOCKS (continued) | | | | | | |
| | | | | | | |
| Health Care (continued) | | | | | | |
| | Health Care Services - 1.4% | | | | |
| | McKesson Corp. | | 10,200 | | $ | 1,692,078 | |
| | | |
| | Pharmaceuticals & | | | | | | |
| | Biotechnology - 3.9% | | | | | | |
| | Amgen Inc. | | 8,140 | | | 928,611 | |
| | Celgene Corp. (a) | | 8,100 | | | 1,310,337 | |
| | Exact Sciences Corp. (a) | | 117,000 | | | 1,436,760 | |
| | Johnson & Johnson | | 12,635 | | | 1,196,029 | |
| | | | | | | 4,871,737 | |
| Industrials - 12.9% | | | | | | |
| | Construction & Materials - 1.4% | | | | |
| | | Masco Corp. | | 76,400 | | | 1,712,888 | |
| | | |
| | Electrical Equipment - 1.2% | | | | |
| | Emerson Electric Co. | | 22,625 | | | 1,515,649 | |
| | | |
| | General Industrials - 3.7% | | | | | | |
| | General Electric Co. | | 97,950 | | | 2,611,347 | |
| | 3M Co. | | 14,670 | | | 1,958,592 | |
| | | | | | | 4,569,939 | |
| | Industrial Engineering - 4.7% | | | | |
| | ABB Ltd. ADR | | 91,075 | | | 2,326,966 | |
| | Illinois Tool Works Inc. | | 16,025 | | | 1,275,269 | |
| | Ingersoll-Rand PLC (a) | | 10,300 | | | 735,626 | |
| | Rockwell Automation, Inc. | | 13,775 | | | 1,564,564 | |
| | | | | | | 5,902,425 | |
| | Industrial Transportation - 1.0% | | | | |
| | FedEx Corp. | | 9,125 | | | 1,265,637 | |
| | | |
| | Support Services - 0.9% | | | | | | |
| | Mobile Mini, Inc. (a) | | 27,950 | | | 1,129,180 | |
| | | |
| Information Technology - 24.7% | | | | |
| | Computer Programs - 1.4% | | | | | | |
| | Electronic Arts Inc. (a) | | 46,885 | | | 1,039,909 | |
| | Take-Two Interactive | | | | | | |
| | Software, Inc. (a) | | 41,100 | | | 672,396 | |
| | | | | | | 1,712,305 | |
| | Electronic & Electrical | | | | | | |
| | Equipment - 0.9% | | | | | | |
| | Maxwell Technologies, Inc. (a) | | 145,450 | | | 1,156,328 | |
| | | |
| | Internet Programs & | | | | | | |
| | Services - 0.8% | | | | | | |
| | eBay Inc. (a) | | 19,070 | | | 963,416 | |
| | | | | | | | |
| | IT Services - 1.7% | | | | | | |
| | Alliance Data Systems Corp. (a) | | 3,750 | | | 908,475 | |
| | Visa Inc. Class A | | 6,020 | | | 1,224,829 | |
| | | | | | | 2,133,304 | |
| | Software & Computer | | | | | | |
| | Services - 6.2% | | | | | | |
| | Google Inc. Class A (a) | | 1,925 | | | 2,039,711 | |
| | Microsoft Corp. | | 108,551 | | | 4,139,050 | |
| | Oracle Corp. | | 45,250 | | | 1,596,872 | |
| | | | | | | 7,775,633 | |
| | Technology Hardware & | | | | | | |
| | Equipment - 13.7% | | | | | | |
| | Altera Corp. | | 37,000 | | | 1,193,250 | |
| | Broadcom Corp. Class A | | 70,915 | | | 1,892,721 | |
| | Cisco Systems, Inc. | | 107,985 | | | 2,294,681 | |
| | EMC Corp. | | 52,975 | | | 1,263,454 | |
| | Hewlett-Packard Co. | | 49,400 | | | 1,351,090 | |
| | Intel Corp. | | 92,725 | | | 2,210,564 | |
| | JDS Uniphase Corp. (a) | | 197,910 | | | 2,402,627 | |
| | Linear Technology Corp. | | 22,645 | | | 963,545 | |
| | Maxim Integrated Products, Inc. | | 30,930 | | | 880,886 | |
| | Qualcomm, Inc. | | 36,730 | | | 2,702,593 | |
| | | | | | | 17,155,411 | |
| | |
| | TOTAL COMMON STOCKS | | | | | | |
| | (COST $104,266,213) | | | | | 124,573,803 | |
| | |
| SHORT-TERM INVESTMENTS - 0.3% | | | | | | |
| | | | | | | |
| Money Market Funds - 0.3% | | | | | | |
| | Fidelity Money Market Portfolio | | | | | | |
| | Class I, 0.045% (b) | | 366,363 | | | 366,363 | |
| | |
| | Total Money Market Funds | | | | | 366,363 | |
| | |
| | TOTAL SHORT-TERM | | | | | | |
| | INVESTMENTS (COST $366,363) | | | | | 366,363 | |
| | |
| | TOTAL INVESTMENTS - 100.1% | | | | | | |
| | (COST $104,632,576) | | | | | 124,940,166 | |
| | |
| | NET OTHER ASSETS AND | | | | | | |
| | LIABILITIES - (0.1%) | | | | | (141,920 | ) |
| | |
| | NET ASSETS - 100.0% | | | | $ | 124,798,246 | |
| | |
| (a) Non-income producing security. | | | | | | |
| (b) Interest rate shown represents the 7-day yield at November 30, 2013. | | | | |
| | |
| ADR: American Depositary Receipt | | | | | | |
| PLC: Public Limited Company | | | | | | |
See Notes to Financial Statements.
7
| MIDCAP FUND INVESTMENT REVIEW (Unaudited) |
| November 30, 2013 |
Portfolio Managers
James T. Evans, CFA
Jason L. Stephens, CFA
John W. Thompson, CFA
Performance
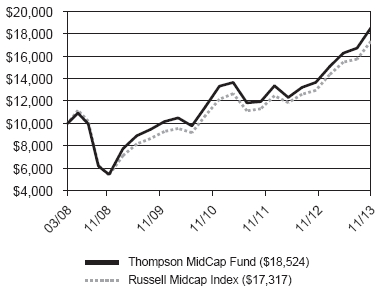
The MidCap Fund produced a total return of 35.65% for the fiscal year ended November 30, 2013, as compared to its benchmark, the Russell Midcap Index, which returned 33.81%.
Comparison of Change in Value of a Hypothetical $10,000 Investment
| Average Annual Total Returns |
| Through 11/30/13 |
| | | | Since | |
| | | | Inception | |
| 1 Year | 3 Year | 5 Year | (03/31/08) | |
| Thompson MidCap Fund | 35.65% | 17.19% | 24.55% | 11.49% | |
| Russell Midcap Index | 33.81% | 17.34% | 22.67% | 10.17% | |
Gross Expense Ratio as of 03/31/13 was 1.83%.
Net Expense Ratio after reimbursement was 1.30%.*
* The Advisor has contractually agreed to waive management fees and/or reimburse expenses incurred by the MidCap Fund through March 31, 2014 so that the annual operating expenses of the Fund do not exceed 1.30% of its average daily net assets.
Performance data quoted represents past performance; past performance does not guarantee future results. The investment return and principal value of an investment will fluctuate so that an investor’s shares, when redeemed, may be worth more or less than their original cost. Current performance of the Fund may be lower or higher than the performance quoted. Performance data current to the most recent month-end may be obtained by calling 1-800-999-0887 or visiting www.thompsonim.com.
Results include the reinvestment of all dividends and capital gains distributions. Investment performance reflects all fee waivers that may be in effect. In the absence of such waivers, total return would be reduced. The performance information reflected in the graph and the table above does not reflect the deduction of taxes that a shareholder would pay on fund distributions or the redemption of fund shares, nor does it imply future performance. The Russell Midcap Index measures the performance of the 800 smallest companies in the Russell 1000 Index based on total market capitalization. You cannot directly invest in an index.
Russell Investment Group is the source and owner of the trademarks, service marks, and copyrights related to the Russell Indexes. Russell® is a trademark of Russell Investment Group.
See Notes to Financial Statements.
8
| MIDCAP FUND INVESTMENT REVIEW (Unaudited) (Continued) |
| November 30, 2013 |
Management CommentaryPositive relative performance for the fiscal year came both from good sector allocation decisions and solid stock selection. The best stock selection was in the Financial Sector, with Associated Banc-Corp and MSCI Inc. performing well. The worst stock selection was in Consumer Staples. The Fund’s securities in this sector actually appreciated nicely. They just didn’t keep up with some exceptional sector performers, such as Green Mountain Coffee Roasters, Inc. Overall, we’re very pleased with the portfolio’s performance, and are focused on keeping the Fund competitive in the coming years.
We often discuss our investment strategy and how we use fundamental analysis to inform our portfolio decisions. The broader question of why to invest in mid cap stocks at all is also worth exploring. There are some commonalities to be found among many of the positions in the portfolio. First, these are companies that have generally moved beyond the intense uncertainty of the startup phase that can sometimes plague stocks in the small cap universe. You may not have heard of them, but they’re usually capable of generating a profit and have the potential to grow it. Not all of them will thrive, but the risk of outright failure is typically less than you’ll find in small caps.
Second, each story is often driven by a distinct edge that allows them to either consolidate a fragmented market or take market share from large companies. It could be a transformational technology like 3D printers, such as those produced by Stratasys and 3D Systems. In Alliance Data Systems’ case, the company provides a conduit through which companies can target their marketing to the specific populations that are most likely to want their products. Jarden is leveraging an efficient distribution network to revitalize brands that have been undervalued and underutilized by previous stewards. These sorts of distinct edges are in contrast to many large cap companies, which in many cases are much more affected by macroeconomic trends. Large caps tend to depend more on gross domestic product (GDP) growth and stock buybacks to drive their earnings growth, because in many cases their markets are saturated and their “edge” is being challenged by smaller companies.
Mid cap stocks can therefore be an attractive option for some U.S. equity investors. Mid cap investors may in the long run experience less volatility than small cap investors, and will own companies that in the aggregate have the potential to grow earnings at an attractive rate over time despite macroeconomic fluctuations.
Opinions expressed are subject to change, are not guaranteed and should not be considered investment advice.
Mutual fund investing involves risk. Principal loss is possible. Midcap companies tend to have limited liquidity and greater volatility than large-capitalization companies. Investments in American Depositary Receipts (“ADRs”) are subject to some extent to the risks associated with directly investing in securities of foreign issuers, including the risk of changes in currency exchange rates, expropriation or nationalization of assets, and the impact of political, diplomatic, or social events. Investments in real estate securities may involve greater risk and volatility including greater exposure to economic downturns and changes in real estate values, rents, property taxes, tax, and other laws. A REIT’s share price may decline because of adverse developments affecting the real estate industry.
Please refer to the Schedule of Investments on page 11 of this report for holdings information. The management commentary above as well as Fund holdings and asset/sector allocations should not be considered a recommendation to buy or sell any security. In addition, please note that Fund holdings and asset/sector allocations are subject to change.
Earnings Growth is a measure of growth in a company’s net income over a specific period, often one year. It is not a prediction of the fund’s future returns.
See Notes to Financial Statements.
9
| MIDCAP FUND INVESTMENT REVIEW (Unaudited) (Continued) |
| November 30, 2013 |
Sector Weightings at 11/30/13
% of Total Investments
| Top 10 Equity Holdings at 11/30/13 |
| | % of Fund’s |
| Company | Industry | Net Assets |
| MSCI Inc. | Financial Services | 2.08% |
| Broadcom Corp. Class A | Technology Hardware & Equipment | 2.03% |
| First Horizon National Corp. | Banks | 2.02% |
| JDS Uniphase Corp. | Technology Hardware & Equipment | 2.01% |
| Darden Restaurants, Inc. | Travel & Leisure | 1.86% |
| Jarden Corp. | Household Products | 1.84% |
| Associated Banc-Corp | Banks | 1.78% |
| Northern Trust Corp. | Financial Services | 1.78% |
| Kohl’s Corp. | General Retailers | 1.78% |
| Bed Bath & Beyond Inc. | General Retailers | 1.75% |
As of November 30, 2013, 100.5% of the Fund’s net assets were in equity and short-term investments.
See Notes to Financial Statements.
10
| MIDCAP FUND SCHEDULE OF INVESTMENTS |
| November 30, 2013 |
| | | | Shares | | Value |
| COMMON STOCKS - 100.0% | | | | | |
| | | | | | |
| Consumer Discretionary - 18.6% | | | | | |
| Automobiles & Parts - 2.9% | | | | | |
| Allison Transmission Holdings, Inc. | | 14,850 | | $ | 404,217 |
| Harley-Davidson, Inc. | | 5,575 | | | 373,636 |
| LKQ Corp. (a) | | 9,670 | | | 320,561 |
| | | | | | 1,098,414 |
| General Retailers - 7.0% | | | | | |
| | Bed Bath & Beyond Inc. (a) | | 8,430 | | | 657,793 |
| Chico’s FAS, Inc. | | 16,275 | | | 304,180 |
| Jos. A. Bank Clothiers, Inc. (a) | | 9,385 | | | 533,256 |
| Kohl’s Corp. | | 12,085 | | | 668,059 |
| Nordstrom, Inc. | | 7,600 | | | 472,796 |
| | | | | | 2,636,084 |
| Household Products - 2.4% | | | | | |
| D.R. Horton, Inc. | | 10,125 | | | 201,285 |
| Jarden Corp. (a) | | 12,312 | | | 692,427 |
| | | | | | 893,712 |
| Leisure Goods - 1.1% | | | | | |
| Brunswick Corp. | | 8,900 | | | 406,730 |
| |
| Personal Goods - 3.3% | | | | | |
| Coach, Inc. | | 10,780 | | | 624,162 |
| Hanesbrands, Inc. | | 8,540 | | | 598,654 |
| | | | | | 1,222,816 |
| Travel & Leisure - 1.9% | | | | | |
| Darden Restaurants, Inc. | | 13,150 | | | 701,289 |
| | |
| Consumer Staples - 1.8% | | | | | |
| Food Producers - 1.8% | | | | | |
| Ingredion Inc. | | 2,725 | | | 188,461 |
| McCormick & Co., Inc. | | 2,043 | | | 140,967 |
| The J. M. Smucker Co. | | 3,162 | | | 329,607 |
| | | | | | 659,035 |
| Energy - 9.4% | | | | | |
| Oil & Gas Producers - 7.1% | | | | | |
| Bill Barrett Corp. (a) | | 6,190 | | | 166,449 |
| Denbury Resources Inc. (a) | | 4,685 | | | 78,146 |
| Encana Corp. | | 19,825 | | | 380,442 |
| Forest Oil Corp. (a) | | 48,125 | | | 212,713 |
| Goodrich Petroleum Corp. (a) | | 6,300 | | | 121,212 |
| Murphy Oil Corp. | | 3,551 | | | 230,566 |
| Noble Energy, Inc. | | 9,150 | | | 642,696 |
| Oasis Petroleum Inc. (a) | | 4,100 | | | 189,133 |
| Range Resources Corp. | | 4,485 | | | 348,260 |
| Southwestern Energy Co. (a) | | 5,100 | | | 197,166 |
| Ultra Petroleum Corp. (a) | | 4,175 | | | 85,462 |
| | | | | | 2,652,245 |
| Oil Equipment, Services & | | | | | |
| Distribution - 2.3% | | | | | |
| Cameron Int’l. Corp. (a) | | 3,375 | | | 186,941 |
| Dresser-Rand Group, Inc. (a) | | 4,220 | | | 238,177 |
| FMC Technologies, Inc. (a) | | 3,775 | | | 181,578 |
| Helmerich & Payne, Inc. | | 3,470 | | | 267,190 |
| | | | | | 873,886 |
| Financials - 20.2% | | | | | |
| Banks - 7.1% | | | | | |
| Associated Banc-Corp | | 38,930 | | | 671,153 |
| First Horizon National Corp. | | 67,720 | | | 759,141 |
| Flagstar Bancorp, Inc. (a) | | 15,525 | | | 284,884 |
| Regions Financial Corp. | | 19,160 | | | 186,427 |
| SunTrust Banks, Inc. | | 10,595 | | | 383,857 |
| Zions Bancorporation | | 13,460 | | | 394,782 |
| | | | | | 2,680,244 |
| Financial Services - 7.4% | | | | | |
| CIT Group Inc. | | 11,305 | | | 570,676 |
| Discover Financial Services | | 8,929 | | | 475,916 |
| Eaton Vance Corp. | | 6,745 | | | 282,008 |
| MSCI Inc. (a) | | 17,610 | | | 781,708 |
| Northern Trust Corp. | | 11,375 | | | 671,011 |
| | | | | | 2,781,319 |
| Insurance - 1.8% | | | | | |
| Cincinnati Financial Corp. | | 5,440 | | | 285,110 |
| Unum Group | | 11,255 | | | 377,830 |
| | | | | | 662,940 |
| Real Estate Investment | | | | | |
| Trusts - 3.9% | | | | | |
| Annaly Capital Management Inc. | | 35,125 | | | 356,870 |
| DiamondRock Hospitality Co. | | 33,100 | | | 378,333 |
| Host Hotels & Resorts Inc. | | 19,585 | | | 360,560 |
| LaSalle Hotel Properties | | 11,620 | | | 363,938 |
| | | | | | 1,459,701 |
| Health Care - 14.0% | | | | | |
| Health Care Equipment & | | | | | |
| Services - 10.0% | | | | | |
| Hanger, Inc. (a) | | 10,800 | | | 419,472 |
| Henry Schein, Inc. (a) | | 3,169 | | | 361,266 |
| Hologic, Inc. (a) | | 22,075 | | | 494,259 |
| Masimo Corp. (a) | | 7,500 | | | 214,725 |
| MedAssets Inc. (a) | | 25,865 | | | 557,132 |
| Natus Medical Inc. (a) | | 20,900 | | | 481,327 |
| Patterson Cos., Inc. | | 7,580 | | | 314,494 |
| ResMed Inc. | | 11,421 | | | 557,459 |
| Zimmer Holdings, Inc. | | 4,150 | | | 379,351 |
| | | | | | 3,779,485 |
| Health Care Services - 1.1% | | | | | |
| McKesson Corp. | | 2,495 | | | 413,896 |
See Notes to Financial Statements.
11
| MIDCAP FUND SCHEDULE OF INVESTMENTS (Continued) |
| November 30, 2013 |
| | | | Shares | | Value |
| COMMON STOCKS (continued) | | | | | | |
| | | | | | | |
| Health Care (continued) | | | | | | |
| Pharmaceuticals & | | | | | | |
| Biotechnology - 2.9% | | | | | | |
| Exact Sciences Corp. (a) | | 43,475 | | $ | 533,873 | |
| Illumina, Inc. (a) | | 2,325 | | | 227,850 | |
| Myriad Genetics, Inc. (a) | | 10,550 | | | 313,863 | |
| | | | | | 1,075,586 | |
| Industrials - 12.7% | | | | | | |
| Construction & | | | | | | |
| Materials - 3.0% | | | | | | |
| Masco Corp. | | 27,050 | | | 606,461 | |
| Mueller Water Products, Inc. Class A | | 27,900 | | | 240,219 | |
| USG Corp. (a) | | 10,350 | | | 283,487 | |
| | | | | | 1,130,167 | |
| Electrical Equipment - 1.3% | | | | | | |
| Regal-Beloit Corp. | | 6,630 | | | 487,835 | |
| | |
| Industrial Engineering - 4.7% | | | | | | |
| Ingersoll-Rand PLC (a) | | 8,350 | | | 596,357 | |
| Rockwell Automation, Inc. | | 5,025 | | | 570,739 | |
| SPX Corp. | | 6,375 | | | 603,330 | |
| | | | | | 1,770,426 | |
| Industrial Transportation - 0.9% | | | | | | |
| Expeditors Int’l. of | | | | | | |
| Washington, Inc. | | 8,175 | | | 355,122 | |
| | |
| Support Services - 2.8% | | | | | | |
| Cintas Corp. | | 6,595 | | | 366,023 | |
| Mobile Mini, Inc. (a) | | 10,420 | | | 420,968 | |
| W.W. Grainger, Inc. | | 1,063 | | | 274,169 | |
| | | | | | 1,061,160 | |
| Information Technology - 17.8% | | | | | | |
| Computer Programs - 1.8% | | | | | | |
| Electronic Arts Inc. (a) | | 13,540 | | | 300,317 | |
| Take-Two Interactive | | | | | | |
| Software, Inc. (a) | | 23,460 | | | 383,806 | |
| | | | | | 684,123 | |
| Electronic & Electrical | | | | | | |
| Equipment - 1.7% | | | | | | |
| Maxwell Technologies, Inc. (a) | | 82,225 | | | 653,689 | |
| | |
| Internet Programs & | | | | | | |
| Services - 1.3% | | | | | | |
| Liquidity Services, Inc. (a) | | 21,500 | | | 498,155 | |
| | |
| IT Services - 2.0% | | | | | | |
| Alliance Data Systems Corp. (a) | | 1,950 | | | 472,407 | |
| Fiserv, Inc. (a) | | 2,672 | | | 293,626 | |
| | | | | | 766,033 | |
| Technology Hardware & | | | | | | |
| Equipment - 11.0% | | | | | | |
| Altera Corp. | | 11,750 | | | 378,937 | |
| Broadcom Corp. Class A | | 28,630 | | | 764,135 | |
| Cavium Inc. (a) | | 12,550 | | | 454,310 | |
| InvenSense Inc. (a) | | 16,900 | | | 292,201 | |
| JDS Uniphase Corp. (a) | | 62,231 | | | 755,484 | |
| Linear Technology Corp. | | 8,915 | | | 379,333 | |
| Maxim Integrated Products, Inc. | | 19,916 | | | 567,208 | |
| Stratasys Ltd. (a) | | 2,025 | | | 238,484 | |
| 3D Systems Corp. (a) | | 3,850 | | | 289,366 | |
| | | | | | 4,119,458 | |
| Materials - 3.6% | | | | | | |
| Chemicals - 2.9% | | | | | | |
| Ecolab Inc. | | 5,181 | | | 555,248 | |
| Int’l. Flavors & Fragrances Inc. | | 6,010 | | | 530,983 | |
| | | | | | 1,086,231 | |
| | Household Materials - 0.7% | | | | | | |
| The Scotts Miracle-Gro Co. Class A | | 4,596 | | | 269,234 | |
| | | | | | | |
| Utilities - 1.9% | | | | | | |
| Electricity - 0.5% | | | | | | |
| | Pepco Holdings, Inc. | | 9,513 | | | 181,508 | |
| | | | | | | |
| | Gas, Water & Multiutilities - 1.4% | | | | | | |
| MDU Resources Group, Inc. | | 8,625 | | | 255,904 | |
| | SCANA Corp. | | 5,950 | | | 280,662 | |
| | | | | | 536,566 | |
| | | | | | | | |
| | TOTAL COMMON STOCKS | | | | | | |
| | (COST $30,890,271) | | | | | 37,597,089 | |
| |
| SHORT-TERM INVESTMENTS - 0.5% | | | | | | |
| | | | | | | |
| Money Market Funds - 0.5% | | | | | | |
| Fidelity Money Market Portfolio | | | | | | |
| Class I, 0.045% (b) | | 200,199 | | | 200,199 | |
| | | | | | | |
| | Total Money Market Funds | | | | | 200,199 | |
| | | | | | | |
| | TOTAL SHORT-TERM | | | | | | |
| | INVESTMENTS (COST $200,199) | | | | | 200,199 | |
| | | | | | | |
| | TOTAL INVESTMENTS - 100.5% | | | | | | |
| | (COST $31,090,470) | | | | | 37,797,288 | |
| | | | | | | |
| | NET OTHER ASSETS AND | | | | | | |
| | LIABILITIES - (0.5%) | | | | | (189,270 | ) |
| | | | | | | |
| | NET ASSETS - 100.0% | | | | $ | 37,608,018 | |
| | | | | | | |
| (a) | Non-income producing security. | | | | | | |
| (b) | Interest rate shown represents the 7-day yield rate at November 30, 2013. | |
| | | | | | | |
| PLC: Public Limited Company | | | | | | |
See Notes to Financial Statements.
12
| BOND FUND INVESTMENT REVIEW (Unaudited) |
| November 30, 2013 |
Portfolio Managers
James T. Evans, CFA
Jason L. Stephens, CFA
John W. Thompson, CFA
Performance
The Bond Fund produced a total return of 3.24% for the fiscal year ended November 30, 2013, as compared to its benchmark, the Barclays U.S. Government/Credit 1-5 Year Index, which returned 0.68%, and as compared to the Barclays U.S. Credit 1-5 Year Index, which returned 1.69%.
Comparison of Change in Value of a Hypothetical $10,000 Investment
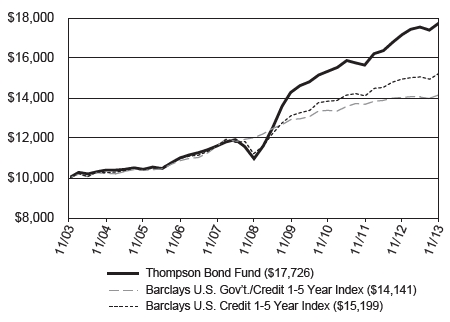
Average Annual Total Returns
Through 11/30/13 |
| 1 Year | | 3 Year | | 5 Year | | 10 Year |
| Thompson Bond Fund | 3.24% | | 4.98% | | 10.06% | | 5.89% |
| Barclays U.S. Gov’t./Credit 1-5 Year Index | 0.68% | | 1.82% | | 3.29% | | 3.53% |
| Barclays U.S. Credit 1-5 Year Index | 1.69% | | 3.17% | | 6.27% | | 4.28% |
| Gross Expense Ratio as of 03/31/13 was 0.78%. | 30-Day SEC Yield as of 11/30/13 was 2.87%. |
Performance data quoted represents past performance; past performance does not guarantee future results. The investment return and principal value of an investment will fluctuate so that an investor’s shares, when redeemed, may be worth more or less than their original cost. Current performance of the Fund may be lower or higher than the performance quoted. Performance data current to the most recent month-end may be obtained by calling 1-800-999-0887 or visiting www.thompsonim.com.
Results include the reinvestment of all dividends and capital gains distributions. Investment performance reflects all fee waivers that may have been in effect. In the absence of such waivers, total return would have been reduced. The performance information reflected in the graph and the table above does not reflect the deduction of taxes that a shareholder would pay on fund distributions or the redemption of fund shares, nor does it imply future performance. The Barclays U.S. Government/Credit 1-5 Year Index is a market-value-weighted index of all investment-grade bonds with maturities of more than one year and less than 5 years. The Barclays U.S. Credit 1-5 Year Index is a market-value-weighted index which includes virtually every major investment-grade rated corporate bond with 1-5 years remaining until maturity that serves as a supplementary benchmark. You cannot directly invest in an index.
Barclays® is a trademark of Barclays Bank PLC.
See Notes to Financial Statements.
13
| BOND FUND INVESTMENT REVIEW (Unaudited) (Continued) |
| November 30, 2013 |
Management Commentary
The basic strategy that has helped the Fund over the past several years continues in place. We are overweight corporate bonds because in our opinion shareholders are being paid to take credit risk instead of interest rate risk. This can and probably will change at some point in the future. For now we expect the corporate overweight to continue.
The fiscal year saw an overall reversal of a three decade decline in interest rates. Over the course of the entire fiscal year, the prevailing yields on the 5-Year Treasury rose by almost 80 basis points while the yields on the 10-Year Treasury increased over 100 basis points. The impact of these changes on bond prices was, predictably, negative. By the end of June, both the Fund’s primary and secondary benchmarks had suffered negative returns during the fund fiscal year to date, and the Bond Fund’s performance was only modestly positive. While recent months have restored all three returns to positive territory, the overall performance of bonds was depressed because of the rising rates.
However, despite this overall pattern there were three distinctly different environments for bond investors during the fiscal year. For the first 4-5 months credit spreads were narrow – especially at the long end of the Fund’s maturity ladder1. There simply wasn’t enough of a reward being offered on most bonds relative to the interest-rate risk being taken to justify continuing to buy bonds in this portion of the Fund’s maturity structure. We responded by increasing our purchases of short maturity corporate bonds coming due in one year or less. We essentially determined that it was prudent to sacrifice higher yield in exchange for less risk.
Conversely, amidst the substantial market dislocation in June we increased the purchase of bonds at the long end of the Fund’s maturity ladder (2017 - 2020). Generally, we use sales of additional Fund shares and revenues from bond maturities and bond interest to finance new bond purchases. However, during this period we found prices so attractive that we actually sold many short maturity bonds to take advantage of them. These were similar to the actions we took in the fall of 2011, but more dramatic. In this case, we decided that it was in the best interest of shareholders for us to take increased interest-rate risk on purchases, because we felt we were getting rewarded so well on price and yield.
The final few months of the fiscal year marked a return to “normalcy.” Interest rates and credit spreads didn’t change much from the beginning to the end. Even with substantial public hand wringing over the potential beginning-of-the-end of the Federal Reserve’s Quantitative Easing, the market was generally rational. Consequently, we were able to identify many attractive opportunities throughout the period, but not to the extent that required significant selling of existing holdings.
The point of reviewing all this is to illustrate that one of our philosophies is to try to take advantage of the opportunities given by the market, and not more. We depend on our credit research to give us the comfort to buy bonds when we think the market has overreacted. We were genuinely excited at the end of June, because we believed that the severe market disruption had given us the opportunity to improve the overall profile of the Fund. At the same time, as much as we like yield, we are loath to stretch for it. The market generally tells us what to do. If there aren’t great opportunities, we’ll stay more conservative with purchases. If there are, we’ll be aggressive. Hopefully, if we employ this strategy well over time, value will accrue to shareholders.
____________________
1 In a bond ladder, the bonds’ maturity dates are evenly spaced across several months or several years so that the bonds are maturing and the proceeds are being reinvested at regular intervals.
See Notes to Financial Statements.
14
| BOND FUND INVESTMENT REVIEW (Unaudited) (Continued) |
| November 30, 2013 |
Opinions expressed are subject to change, are not guaranteed and should not be considered investment advice.
Mutual fund investing involves risk. Principal loss is possible. Investments in debt securities typically decrease in value when interest rates rise. The risk is usually greater for longer-term debt securities. Investments in bonds of foreign issuers involve greater volatility, political and economic risks, and differences in accounting methods. Investment by the Fund in lower-rated and non-rated securities presents a greater risk of loss to principal and interest than higher-rated securities.
Please refer to the Schedule of Investments on page 17 of this report for holdings information. The management commentary above as well as Fund holdings should not be considered a recommendation to buy or sell any security. In addition, please note that Fund holdings are subject to change.
The federal government guarantees interest payments from government securities while dividend payments carry no such guarantee. Government securities, if held to maturity, guarantee the timely payment of principal and interest.
SEC Yield is a standardized yield computed by dividing the net investment income per share earned during the 30-day period prior to quarter-end and was created to allow for fairer comparisons among bond funds.
Basis point is a unit that is equal to 1/100th of 1%, and is used to denote the change in a financial instrument.
Yield is the income earned from a bond, which takes into account the sum of the interest payment, the redemption value at the bond’s maturity, and the initial purchase price of the bond.
Although the makeup of the Fund’s portfolio is constantly changing, as of November 30, 2013, 87.75% of the Fund’s portfolio was invested in corporate bonds. Due to prevailing market conditions, the composition of the Fund’s portfolio as of that date was consistent with the composition of the Fund’s portfolio over the past 5 years. In addition, as of November 30, 2013, 84.16% of the Fund’s portfolio was invested in bonds rated BBB. For portfolio information current as of the most recent quarter-end, please call 1-800-999-0887 or visit our website at www.thompsonim.com. Compared to a portfolio that is more evenly allocated between government and corporate bonds, a portfolio that is heavily allocated to corporate bonds may provide higher returns, but is also subject to greater levels of credit and liquidity risk and to greater price fluctuations. A portfolio that is significantly allocated to bonds having lower investment-grade ratings may also be subject to greater levels of credit and liquidity risk and experience greater price fluctuations than a portfolio comprised of higher-rated investment-grade bonds.
See Notes to Financial Statements.
15
| BOND FUND INVESTMENT REVIEW (Unaudited) (Continued) |
| November 30, 2013 |
| Portfolio Concentration at 11/30/13 | |
| (Includes cash and cash equivalents) | |
| % Total Investments | |
| Quality | |
| U.S. Government & Agency Issues | 0.04% | |
| AA | 3.19% | |
| A | 4.72% | |
| BBB | 84.16% | |
| BB and Below | 3.58% | |
| Not Rated | 3.94% | |
| Money Market Funds | 0.37% | |
| 100.00% | |
| | |
| Effective Maturity | |
| Under 1 year | 14.94% | |
| 1 to 3 years | 23.27% | |
| 3 to 5 years | 46.35% | |
| 5 to 10 years | 15.44% | |
| 100.00% | |
| | |
| Asset Allocation | |
| Corporate Bonds | 87.75% | |
| Asset-Backed Securities | 8.82% | |
| Taxable Municipal Bonds | 2.62% | |
| Convertible Bonds | 0.40% | |
| Money Market Funds | 0.37% | |
| Federal Agency Mortgage-Backed Securities | 0.04% | |
| 100.00% | |
| | | |
See Notes to Financial Statements.
16
| BOND FUND SCHEDULE OF INVESTMENTS |
| November 30, 2013 |
| | | | Principal | | | |
| | | Amount | | Value |
| BONDS - 97.4% | | | | | | |
| | | | | | | |
| Asset-Backed Securities - 8.6% | | | | | | |
| Ameritech Capital Funding Corp. | | | | | | |
| 9.100% due 6/1/2016 | | $ | 3,936 | | $ | 4,423 |
| |
| AWAS Aviation Capital Ltd. | | | | | | |
| 7.000% due 10/17/2016 (d) | | | 40,803,296 | | | 42,333,420 |
| |
| Basketball Properties Ltd. | | | | | | |
| 6.650% due 3/1/2025 (d) | | | 5,541,238 | | | 5,974,824 |
| |
| Beaver Valley II Funding | | | | | | |
| 9.000% due 6/1/2017 | | | 4,000 | | | 4,035 |
| |
| British Airways PLC | | | | | | |
| 5.625% due 6/20/2020, | | | | | | |
| Series 2013-1 (d) | | | 30,160,000 | | | 31,215,600 |
| 5.625% due 6/20/2020, | | | | | | |
| Series 2013-1 | | | 100,000 | | | 103,500 |
| |
| Continental Airlines | | | | | | |
| 9.250% due 5/10/2017, | | | | | | |
| Series 2009-2 B | | | 630,959 | | | 697,209 |
| 6.000% due 1/12/2019, | | | | | | |
| Series 2010-1 B | | | 74,449 | | | 76,124 |
| |
| Delta Air Lines | | | | | | |
| 6.375% due 1/2/2016, | | | | | | |
| Series 2010-1 B | | | 8,945,000 | | | 9,481,700 |
| 9.750% due 12/17/2016, | | | | | | |
| Series 2009-1 B | | | 822,069 | | | 928,938 |
| 6.821% due 8/10/2022, | | | | | | |
| Series 2007-1 A | | | 10,338,144 | | | 11,630,412 |
| 6.718% due 1/2/2023, | | | | | | |
| Series 2002-1 G-1 | | | 4,561 | | | 5,120 |
| |
| Doric Nimrod Air Alpha | | | | | | |
| 6.125% due 11/30/2019, | | | | | | |
| Series 2013-1 (d) | | | 13,000,000 | | | 13,455,000 |
| |
| Doric Nimrod Air | | | | | | |
| Finance Alpha Ltd. | | | | | | |
| 6.500% due 5/30/2021, | | | | | | |
| Series 2012-1 B (d) | | | 35,925,294 | | | 36,647,033 |
| |
| Express Pipeline LP | | | | | | |
| 7.390% due 12/31/2017 (d) | | | 2,358,000 | | | 2,544,025 |
| | | | | | | |
| Federal Express Corp. | | | | | | |
| 7.630% due 1/1/2015, | | | | | | |
| Series 1993 | | | 2,721,808 | | | 2,789,853 |
| 7.020% due 1/15/2016, | | | | | | |
| Series 1998 | | | 2,267,442 | | | 2,397,820 |
| |
| FPL Energy Caithness | | | | | | |
| Funding Corp. | | | | | | |
| 7.645% due 12/31/2018 (d) | | | 2,168,960 | | | 2,306,149 |
| |
| General American Railcar | | | | | | |
| 6.690% due 9/20/2016, | | | | | | |
| Series 1997-1 (d) | | | 264,926 | | | 277,510 |
| 6.210% due 9/20/2017, | | | | | | |
| Series II | | | 5,218,170 | | | 5,492,124 |
| 7.760% due 8/20/2018, | | | | | | |
| Series III (d) | | | 989,318 | | | 1,038,796 |
| |
| Maritimes & Northeast | | | | | | |
| Pipeline LLC | | | | | | |
| 7.500% due 5/31/2014 (d) | | | 7,862,677 | | | 8,068,506 |
| |
| Midwest Family Housing LLC | | | | | | |
| 5.168% due 7/1/2016 (d) | | | 262,000 | | | 266,357 |
| |
| Norfolk Southern Railway Co. | | | | | | |
| 6.150% due 4/1/2014 | | | 25,000 | | | 25,448 |
| |
| Northwest Airlines | | | | | | |
| 7.575% due 3/1/2019, | | | | | | |
| Series 1999-2 A | | | 1,115,080 | | | 1,265,616 |
| 7.027% due 11/1/2019, | | | | | | |
| Series 2007-1 A | | | 8,032,103 | | | 8,917,241 |
| 6.264% due 11/20/2021, | | | | | | |
| Series 2002-1 G-2 | | | 1,156,226 | | | 1,183,050 |
| 7.041% due 4/1/2022, | | | | | | |
| Series 2001-1 A-1 | | | 427,929 | | | 483,560 |
| |
| PP&L Montana LLC | | | | | | |
| 8.903% due 7/2/2020 | | | 2,108,419 | | | 2,357,255 |
| |
| Prologis, Inc. | | | | | | |
| 7.810% due 2/1/2015 | | | 2,010,600 | | | 2,049,401 |
| |
| Total Asset-Backed Securities | | | | | | 194,020,049 |
See Notes to Financial Statements.
17
| BOND FUND SCHEDULE OF INVESTMENTS (Continued) |
| November 30, 2013 |
| | Principal | | | |
| | Amount | | Value |
| BONDS (continued) | | | | | | |
| | | | | | | |
| Convertible Bonds - 0.4% | | | | | | |
| EMC Corp. | | | | | | |
| 1.750% due 12/1/2013 | | $ | 1,000,000 | | $ | 1,483,231 |
| |
| Hospitality Properties Trust | | | | | | |
| 3.800% due 3/15/2027 | | | 7,309,000 | | | 7,436,908 |
| |
| Total Convertible Bonds | | | | | | 8,920,139 |
| |
| Corporate Bonds - 85.8% | | | | | | |
| Advance Auto Parts, Inc. | | | | | | |
| 5.750% due 5/1/2020 | | | 21,826,000 | | | 23,899,819 |
| |
| Air Lease Corp. | | | | | | |
| 5.625% due 4/1/2017 | | | 26,060,000 | | | 28,600,850 |
| |
| Ameren Corp. | | | | | | |
| 8.875% due 5/15/2014 | | | 1,427,000 | | | 1,477,877 |
| |
| American Express | | | | | | |
| 6.650% due 9/15/2015 | | | 90,000 | | | 97,251 |
| 6.900% due 9/15/2015 | | | 277,000 | | | 301,869 |
| |
| American Financial Group, Inc. | | | | | | |
| 9.875% due 6/15/2019 | | | 1,751,000 | | | 2,293,689 |
| |
| American General Finance | | | | | | |
| 6.000% due 10/15/2014 | | | 1,000,000 | | | 1,015,000 |
| 6.000% due 12/15/2014 | | | 1,000,000 | | | 1,000,581 |
| |
| American Standard Inc. | | | | | | |
| 5.500% due 4/1/2015 | | | 25,000 | | | 26,491 |
| |
| Ameriprise Financial, Inc. | | | | | | |
| 7.518% due 6/1/2066 (a) | | | 3,200,000 | | | 3,512,000 |
| |
| Amphenol Corp. | | | | | | |
| 4.750% due 11/15/2014 | | | 698,000 | | | 723,586 |
| |
| Arden Realty LP | | | | | | |
| 5.250% due 3/1/2015 | | | 3,040,000 | | | 3,158,904 |
| |
| Aspen Insurance Holdings Ltd. | | | | | | |
| 6.000% due 8/15/2014 | | | 4,826,000 | | | 5,009,827 |
| |
| Astoria Financial Corp. | | | | | | |
| 5.000% due 6/19/2017 | | | 30,082,000 | | | 31,915,317 |
| | | | | | | |
| Avnet, Inc. | | | | | | |
| 5.875% due 3/15/2014 | | | 3,750,000 | | | 3,802,965 |
| 6.000% due 9/1/2015 | | | 225,000 | | | 242,869 |
| 6.625% due 9/15/2016 | | | 551,000 | | | 621,291 |
| |
| Avon Products, Inc. | | | | | | |
| 5.750% due 3/1/2018 | | | 5,275,000 | | | 5,709,064 |
| 6.500% due 3/1/2019 | | | 25,992,000 | | | 28,510,833 |
| 4.600% due 3/15/2020 | | | 500,000 | | | 507,141 |
| |
| Axis Capital Holdings | | | | | | |
| 5.750% due 12/1/2014 | | | 5,627,000 | | | 5,900,191 |
| |
| Bank of America Corp. | | | | | | |
| 5.350% due 9/15/2015 | | | 549,000 | | | 580,615 |
| 5.250% due 12/1/2015 | | | 333,000 | | | 358,310 |
| 5.625% due 10/14/2016 | | | 935,000 | | | 1,047,293 |
| 6.000% due 8/15/2017 | | | 115,000 | | | 124,935 |
| 6.050% due 8/15/2017 | | | 948,000 | | | 1,042,587 |
| 5.750% due 12/1/2017 | | | 555,000 | | | 635,674 |
| 5.350% due 3/15/2018 | | | 81,000 | | | 87,819 |
| 5.800% due 2/15/2019 | | | 10,000 | | | 11,065 |
| 7.625% due 6/1/2019 | | | 730,000 | | | 912,893 |
| 6.400% due 8/15/2019 | | | 141,000 | | | 159,324 |
| 6.750% due 8/15/2019 | | | 671,000 | | | 788,873 |
| 4.625% due 3/30/2020 (b) | | | 710,000 | | | 696,723 |
| 5.560% due 11/23/2020 (b) | | | 95,000 | | | 95,603 |
| |
| Bear Stearns Cos. LLC | | | | | | |
| 2.630% due 3/10/2014 (a) | | | 270,000 | | | 268,604 |
| |
| Best Buy Co., Inc. | | | | | | |
| 3.750% due 3/15/2016 | | | 17,902,000 | | | 18,528,570 |
| |
| Black Hills Corp. | | | | | | |
| 9.000% due 5/15/2014 | | | 2,452,000 | | | 2,542,253 |
| |
| BMC Software, Inc. | | | | | | |
| 7.250% due 6/1/2018 | | | 26,928,000 | | | 28,173,420 |
| |
| Boston Scientific Corp. | | | | | | |
| 6.250% due 11/15/2015 (a) | | | 3,358,000 | | | 3,680,076 |
| |
| Brocade Communications | | | | | | |
| Systems, Inc. | | | | | | |
| 6.875% due 1/15/2020 | | | 13,363,000 | | | 14,398,632 |
See Notes to Financial Statements.
18
| BOND FUND SCHEDULE OF INVESTMENTS (Continued) |
| November 30, 2013 |
| | | | Principal | | | |
| | | Amount | | Value |
| BONDS (continued) | | | | | | |
| | | | | | | |
| Corporate Bonds (continued) | | | | | | |
| CA, Inc. | | | | | | |
| 6.125% due 12/1/2014 | | $ | 1,953,000 | | $ | 2,051,152 |
| |
| Capital One Financial | | | | | | |
| 6.150% due 9/1/2016 | | | 300,000 | | | 336,788 |
| | |
| Carpenter Technology Corp. | | | | | | |
| 7.060% due 5/21/2018 | | | 500,000 | | | 543,084 |
| 7.030% due 5/22/2018 | | | 8,000 | | | 8,680 |
| |
| Centel Capital Corp. | | | | | | |
| 9.000% due 10/15/2019 | | | 10,000 | | | 12,102 |
| | |
| CenterPoint Energy, Inc. | | | | | | |
| 6.850% due 6/1/2015 | | | 192,000 | | | 208,384 |
| |
| Citigroup, Inc. | | | | | | |
| 5.000% due 9/15/2014 | | | 12,627,000 | | | 13,024,738 |
| 3.000% due 12/28/2014 (a) | | | 1,050,000 | | | 1,049,475 |
| 6.010% due 1/15/2015 | | | 165,000 | | | 174,347 |
| 5.500% due 2/15/2017 | | | 180,000 | | | 199,783 |
| 4.250% due 12/15/2018 (b) | | | 15,000 | | | 14,943 |
| 4.000% due 8/11/2020 (b) | | | 240,000 | | | 239,549 |
| |
| Cliffs Natural Resources Inc. | | | | | | |
| 3.950% due 1/15/2018 | | | 1,200,000 | | | 1,215,096 |
| 5.900% due 3/15/2020 | | | 47,285,000 | | | 49,652,087 |
| 4.875% due 4/1/2021 | | | 500,000 | | | 490,441 |
| |
| CNA Financial Corp. | | | | | | |
| 5.850% due 12/15/2014 | | | 1,552,000 | | | 1,633,126 |
| 6.950% due 1/15/2018 | | | 605,000 | | | 702,222 |
| |
| Commercial Net Lease | | | | | | |
| Realty, Inc. | | | | | | |
| 6.250% due 6/15/2014 | | | 1,060,000 | | | 1,089,263 |
| 6.150% due 12/15/2015 | | | 443,000 | | | 486,683 |
| |
| CommonWealth REIT | | | | | | |
| 5.875% due 9/15/2020 | | | 7,141,000 | | | 7,354,916 |
| |
| Computer Sciences Corp. | | | | | | |
| 6.500% due 3/15/2018 | | | 19,477,000 | | | 22,631,008 |
| |
| Continental Resources, Inc. | | | | | | |
| 8.250% due 10/1/2019 | | | 10,897,000 | | | 11,959,457 |
| | | | | | | | |
| Con-way Inc. | | | | | | |
| 7.250% due 1/15/2018 | | | 13,089,000 | | | 14,960,596 |
| |
| Countrywide Financial Corp. | | | | | | |
| 5.000% due 5/11/2015 | | | 30,000 | | | 29,810 |
| 5.750% due 6/24/2015 (b) | | | 560,000 | | | 556,903 |
| 7.500% due 7/28/2015 (b) | | | 140,000 | | | 137,247 |
| 6.250% due 5/15/2016 | | | 952,000 | | | 1,056,061 |
| 5.250% due 5/27/2020 | | | 279,000 | | | 281,487 |
| 6.000% due 8/26/2020 (b) | | | 140,000 | | | 140,006 |
| |
| Countrywide Home Loans, Inc. | | | | | | |
| 6.000% due 1/24/2018 | | | 1,112,000 | | | 1,097,427 |
| 5.500% due 5/16/2018 | | | 242,000 | | | 241,788 |
| |
| Coventry Health Care, Inc. | | | | | | |
| 6.125% due 1/15/2015 | | | 1,136,000 | | | 1,204,008 |
| 5.950% due 3/15/2017 | | | 354,000 | | | 401,951 |
| |
| Darden Restaurants | | | | | | |
| 7.125% due 2/1/2016 | | | 336,000 | | | 369,990 |
| |
| Discover Financial Services | | | | | | |
| 6.450% due 6/12/2017 | | | 590,000 | | | 671,582 |
| 10.250% due 7/15/2019 | | | 10,592,000 | | | 13,639,212 |
| |
| Dominion Resources, Inc. | | | | | | |
| 7.500% due 6/30/2066 (a) | | | 8,625,000 | | | 9,261,094 |
| |
| Domtar Corp. | | | | | | |
| 9.500% due 8/1/2016 | | | 580,000 | | | 678,972 |
| 10.750% due 6/1/2017 | | | 19,809,000 | | | 25,007,238 |
| |
| Dow Chemical Co. | | | | | | |
| 2.850% due 5/15/2016 | | | 18,000 | | | 18,103 |
| |
| Duquesne Light Holdings Inc. | | | | | | |
| 5.500% due 8/15/2015 | | | 6,819,000 | | | 7,242,412 |
| |
| Embraer Overseas Ltd. | | | | | | |
| 6.375% due 1/24/2017 | | | 500,000 | | | 547,500 |
| |
| Endurance Specialty | | | | | | |
| Holdings Ltd. | | | | | | |
| 6.150% due 10/15/2015 | | | 6,168,000 | | | 6,674,251 |
See Notes to Financial Statements.
19
| BOND FUND SCHEDULE OF INVESTMENTS (Continued) |
| November 30, 2013 |
| | | | | Principal | | | |
| | | | Amount | | Value |
| BONDS (continued) | | | | | | |
| | | | | | | |
| Corporate Bonds (continued) | | | | | | |
| | | Enel Finance Int’l. N.V. | | | | | | |
| | 6.250% due 9/15/2017 (d) | | $ | 2,706,000 | | $ | 3,050,233 |
| | 5.125% due 10/7/2019 (d) | | | 5,000,000 | | | 5,408,450 |
| | 5.125% due 10/7/2019 | | | 500,000 | | | 540,845 |
| | |
| | Expedia, Inc. | | | | | | |
| | 7.456% due 8/15/2018 | | | 17,549,000 | | | 20,624,375 |
| | 5.950% due 8/15/2020 | | | 18,711,000 | | | 20,217,460 |
| | |
| | Fairfax Financial Holdings Ltd. | | | | | | |
| | 8.250% due 10/1/2015 | | | 1,904,000 | | | 2,119,104 |
| | 7.375% due 4/15/2018 | | | 26,711,500 | | | 30,286,808 |
| | 5.800% due 5/15/2021 (d) | | | 12,040,000 | | | 12,316,210 |
| | |
| | Fidelity National Financial, Inc. | | | | | | |
| | 6.600% due 5/15/2017 | | | 16,009,000 | | | 17,885,111 |
| | |
| | Fidelity National Information | | | | | | |
| | Services, Inc. | | | | | | |
| | 7.875% due 7/15/2020 | | | 46,710,000 | | | 51,264,225 |
| | |
| | First Horizon National Corp. | | | | | | |
| | 5.375% due 12/15/2015 | | | 895,000 | | | 966,190 |
| | |
| | First Tennessee Bank | | | | | | |
| | 5.050% due 1/15/2015 | | | 2,757,000 | | | 2,865,653 |
| | 5.650% due 4/1/2016 | | | 5,247,000 | | | 5,674,541 |
| | |
| | Ford Motor Credit Co. | | | | | | |
| | 3.250% due 6/20/2014 | | | 46,000 | | | 46,208 |
| | 1.750% due 9/20/2014 | | | 10,000 | | | 9,948 |
| | |
| | Fortune Brands, Inc. | | | | | | |
| | 5.375% due 1/15/2016 | | | 10,000 | | | 10,870 |
| | |
| | Frontier Oil Corp. | | | | | | |
| | 6.875% due 11/15/2018 | | | 22,736,000 | | | 24,441,200 |
| | |
| | Gazprom OAO Via Gaz | | | | | | |
| | Capital S.A. | | | | | | |
| | 8.125% due 7/31/2014 (d) | | | 9,996,000 | | | 10,432,825 |
| | 4.950% due 5/23/2016 (d) | | | 5,000,000 | | | 5,312,500 |
| | 9.250% due 4/23/2019 (d) | | | 1,500,000 | | | 1,841,250 |
| | |
| | GE Capital Trust I | | | | | | |
| | 6.375% due 11/15/2067 (a) | | | 14,107,000 | | | 15,235,560 |
| | | | | | | | |
| | General Electric Capital Corp. | | | | | | |
| | 4.200% due 2/15/2014 | | | 51,000 | | | 51,242 |
| | 5.600% due 7/15/2014 | | | 500,000 | | | 513,789 |
| | 5.000% due 8/15/2014 | | | 17,000 | | | 17,453 |
| | 5.250% due 6/15/2015 | | | 25,000 | | | 26,475 |
| | 5.400% due 6/15/2015 | | | 59,000 | | | 62,454 |
| | 5.500% due 8/15/2015 | | | 30,000 | | | 32,042 |
| | 5.000% due 4/15/2016 | | | 45,000 | | | 48,532 |
| | 6.750% due 4/15/2018 | | | 373,000 | | | 439,795 |
| | 6.300% due 5/15/2018 | | | 1,790,000 | | | 2,055,285 |
| | 6.000% due 7/15/2018 | | | 57,000 | | | 64,431 |
| | 6.000% due 7/15/2018 | | | 39,000 | | | 44,369 |
| | 6.375% due 11/15/2067 (a) | | | 34,491,000 | | | 37,422,735 |
| | |
| | Genworth Financial Inc. | | | | | | |
| | 5.750% due 6/15/2014 | | | 4,198,000 | | | 4,325,174 |
| | 8.625% due 12/15/2016 | | | 8,264,000 | | | 9,919,568 |
| | 6.515% due 5/22/2018 | | | 17,629,000 | | | 20,346,740 |
| | 7.700% due 6/15/2020 | | | 8,418,000 | | | 10,122,233 |
| | 7.200% due 2/15/2021 | | | 423,000 | | | 495,610 |
| | |
| | GFI Group Inc. | | | | | | |
| | 10.375% due 7/19/2018 (a) | | | 551,000 | | | 563,397 |
| | |
| | GMAC LLC | | | | | | |
| | 0.000% due 6/15/2015 (c) | | | 1,250,000 | | | 1,193,750 |
| | |
| | Goldman Sachs Group, Inc. | | | | | | |
| | 5.625% due 1/15/2017 | | | 565,000 | | | 625,124 |
| | |
| | Great Plains Energy Inc. | | | | | | |
| | 6.875% due 9/15/2017 | | | 30,000 | | | 34,486 |
| | |
| | Harsco Corp. | | | | | | |
| | 5.750% due 5/15/2018 | | | 24,634,000 | | | 26,129,358 |
| | |
| | HCP, Inc. | | | | | | |
| | 6.000% due 3/1/2015 | | | 5,879,000 | | | 6,239,330 |
| | 7.072% due 6/8/2015 | | | 703,000 | | | 764,650 |
| | |
| | Hewlett-Packard Co. | | | | | | |
| | 5.500% due 3/1/2018 | | | 6,498,000 | | | 7,267,279 |
| | |
| | Horace Mann Educators Corp. | | | | | | |
| | 6.850% due 4/15/2016 | | | 9,223,000 | | | 10,068,528 |
See Notes to Financial Statements.
20
| BOND FUND SCHEDULE OF INVESTMENTS (Continued) |
| November 30, 2013 |
| | | | | Principal | | | |
| | | | Amount | | Value |
| BONDS (continued) | | | | | | |
| | | | | | | | |
| Corporate Bonds (continued) | | | | | | |
| | Hospira, Inc. | | | | | | |
| | 6.050% due 3/30/2017 | | $ | 13,212,000 | | $ | 14,570,141 |
| | |
| | Hospitality Properties Trust | | | | | | |
| | 7.875% due 8/15/2014 | | | 11,141,000 | | | 11,296,506 |
| | 5.125% due 2/15/2015 | | | 5,248,000 | | | 5,386,085 |
| | 6.300% due 6/15/2016 | | | 296,000 | | | 321,558 |
| | 5.625% due 3/15/2017 | | | 2,913,000 | | | 3,189,470 |
| | 6.700% due 1/15/2018 | | | 3,507,000 | | | 3,962,598 |
| | | |
| | Host Hotels & Resorts LP | | | | | | |
| | 5.875% due 6/15/2019 | | | 3,720,000 | | | 4,036,944 |
| | 6.000% due 11/1/2020 | | | 396,000 | | | 431,762 |
| | |
| | HRPT Properties Trust | | | | | | |
| | 6.400% due 2/15/2015 | | | 10,000 | | | 10,319 |
| | 5.750% due 11/1/2015 | | | 3,332,000 | | | 3,489,447 |
| | 6.250% due 8/15/2016 | | | 3,833,000 | | | 4,104,886 |
| | 6.250% due 6/15/2017 | | | 2,241,000 | | | 2,404,217 |
| | 6.650% due 1/15/2018 | | | 22,275,000 | | | 24,290,754 |
| | |
| | HSBC Finance Corp. | | | | | | |
| | 3.300% due 1/10/2014 (a) | | | 335,000 | | | 335,027 |
| | 2.500% due 1/15/2014 | | | 5,000 | | | 5,008 |
| | 2.400% due 2/15/2014 | | | 30,000 | | | 30,045 |
| | 2.500% due 2/15/2014 | | | 696,000 | | | 697,709 |
| | 4.950% due 3/15/2014 | | | 10,000 | | | 10,100 |
| | 2.000% due 4/15/2014 | | | 100,000 | | | 100,296 |
| | 2.050% due 4/15/2014 | | | 20,000 | | | 20,063 |
| | 2.150% due 4/15/2014 | | | 25,000 | | | 25,088 |
| | 5.600% due 4/15/2014 | | | 756,000 | | | 762,353 |
| | 1.900% due 6/15/2014 | | | 20,000 | | | 20,012 |
| | 2.000% due 7/15/2014 | | | 40,000 | | | 40,098 |
| | 5.000% due 7/15/2014 | | | 20,000 | | | 20,383 |
| | 5.250% due 7/15/2014 | | | 43,000 | | | 43,843 |
| | 5.500% due 7/15/2014 | | | 90,000 | | | 92,051 |
| | 4.500% due 8/15/2014 | | | 236,000 | | | 240,910 |
| | 6.000% due 8/15/2014 | | | 562,000 | | | 579,456 |
| | 6.000% due 8/15/2014 | | | 86,000 | | | 88,630 |
| | 4.600% due 9/15/2014 | | | 64,000 | | | 65,472 |
| | 4.700% due 9/15/2014 | | | 15,000 | | | 15,376 |
| | 5.650% due 9/15/2014 | | | 163,000 | | | 168,526 |
| | 5.700% due 9/15/2014 | | | 74,000 | | | 76,597 |
| | 5.800% due 9/15/2014 | | | 184,000 | | | 189,529 |
| | 5.850% due 9/15/2014 | | | 346,000 | | | 356,203 |
| | 5.650% due 10/15/2014 | | | 75,000 | | | 77,747 |
| | 5.750% due 10/15/2014 | | | 283,000 | | | 293,857 |
| | 5.350% due 11/15/2014 | | | 59,000 | | | 61,266 |
| | 5.600% due 2/15/2018 | | | 250,000 | | | 278,599 |
| | |
| | HSBC USA Inc. | | | | | | |
| | 9.500% due 4/15/2014 | | | 157,000 | | | 162,011 |
| | |
| | Iberdrola Finance Ireland Ltd. | | | | | | |
| | 5.000% due 9/11/2019 (d) | | | 12,453,000 | | | 13,510,422 |
| | |
| | Ingram Micro Inc. | | | | | | |
| | 5.250% due 9/1/2017 | | | 1,000,000 | | | 1,066,702 |
| | |
| | International Game Technology | | | | | | |
| | 7.500% due 6/15/2019 | | | 598,000 | | | 705,224 |
| | |
| | Jabil Circuit, Inc. | | | | | | |
| | 7.750% due 7/15/2016 | | | 779,000 | | | 886,112 |
| | 8.250% due 3/15/2018 | | | 43,363,000 | | | 51,385,155 |
| | |
| | Janus Capital Group Inc. | | | | | | |
| | 6.119% due 4/15/2014 | | | 40,000 | | | 40,262 |
| | |
| | John Hancock Life Ins. Co. | | | | | | |
| | 5.000% due 12/15/2013 | | | 5,000 | | | 5,005 |
| | 5.450% due 9/15/2015 | | | 201,000 | | | 212,110 |
| | 5.450% due 10/15/2015 | | | 29,000 | | | 30,742 |
| | 5.500% due 11/15/2015 | | | 75,000 | | | 79,582 |
| | 5.250% due 12/15/2015 | | | 25,000 | | | 26,453 |
| | 5.500% due 12/15/2015 | | | 25,000 | | | 26,576 |
| | 5.000% due 4/15/2016 | | | 60,000 | | | 63,523 |
| | |
| | JPMorgan Chase & Co. | | | | | | |
| | 7.900% due 4/30/2018 (a) (e) | | | 46,244,000 | | | 51,099,620 |
| | 5.250% due 5/15/2018 | | | 65,000 | | | 65,011 |
| | 5.250% due 3/15/2019 | | | 20,000 | | | 19,892 |
| | |
| | Lexmark International, Inc. | | | | | | |
| | 6.650% due 6/1/2018 | | | 3,370,000 | | | 3,802,108 |
| | |
| | LG&E and KU Energy LLC | | | | | | |
| | 2.125% due 11/15/2015 (d) | | | 150,000 | | | 153,075 |
See Notes to Financial Statements.
21
| BOND FUND SCHEDULE OF INVESTMENTS (Continued) |
| November 30, 2013 |
| | | | | Principal | | | |
| | | | Amount | | Value |
| BONDS (continued) | | | | | | |
| | | | | | | |
| Corporate Bonds (continued) | | | | | | |
| | Liberty Property LP | | | | | | |
| | 5.650% due 8/15/2014 | | $ | 36,000 | | $ | 37,129 |
| | |
| | Manufacturers & Traders | | | | | | |
| | Trust Co. | | | | | | |
| | 5.585% due 12/28/2020 (a) | | | 347,000 | | | 356,928 |
| | |
| | Marriott International, Inc. | | | | | | |
| | 5.810% due 11/10/2015 | | | 373,000 | | | 406,750 |
| | |
| | Masco Corp. | | | | | | |
| | 4.800% due 6/15/2015 | | | 1,475,000 | | | 1,541,375 |
| | 6.125% due 10/3/2016 | | | 4,502,000 | | | 5,019,730 |
| | 5.850% due 3/15/2017 | | | 2,985,000 | | | 3,253,650 |
| | 6.625% due 4/15/2018 | | | 13,126,000 | | | 14,504,230 |
| | 7.125% due 3/15/2020 | | | 1,440,000 | | | 1,634,400 |
| | |
| | Maytag Corp. | | | | | | |
| | 5.000% due 5/15/2015 | | | 50,000 | | | 52,556 |
| | |
| | MBIA Inc. | | | | | | |
| | 6.400% due 8/15/2022 | | | 51,353,000 | | | 51,096,235 |
| | |
| | MBNA Corp. | | | | | | |
| | 5.000% due 6/15/2015 | | | 800,000 | | | 848,880 |
| | |
| | Merrill Lynch & Co. | | | | | | |
| | 5.000% due 1/15/2015 | | | 343,000 | | | 358,947 |
| | 5.300% due 9/30/2015 | | | 1,712,000 | | | 1,841,391 |
| | 6.050% due 5/16/2016 | | | 3,000,000 | | | 3,321,588 |
| | 6.400% due 8/28/2017 | | | 3,048,000 | | | 3,543,007 |
| | 6.875% due 4/25/2018 | | | 233,000 | | | 278,168 |
| | 6.500% due 7/15/2018 | | | 2,668,000 | | | 3,138,222 |
| | 6.875% due 11/15/2018 | | | 2,316,000 | | | 2,795,829 |
| | 8.400% due 11/1/2019 | | | 310,000 | | | 391,216 |
| | |
| | Morgan Stanley | | | | | | |
| | 4.750% due 4/1/2014 | | | 820,000 | | | 830,608 |
| | 6.000% due 5/13/2014 | | | 695,000 | | | 711,896 |
| | 4.200% due 11/20/2014 | | | 496,000 | | | 512,819 |
| | 6.000% due 4/28/2015 | | | 3,753,000 | | | 4,010,002 |
| | 4.000% due 7/24/2015 | | | 200,000 | | | 209,565 |
| | 5.375% due 10/15/2015 | | | 1,000,000 | | | 1,078,672 |
| | 5.750% due 10/18/2016 | | | 2,178,000 | | | 2,439,044 |
| | 6.250% due 8/28/2017 | | | 1,045,000 | | | 1,209,083 |
| | 5.950% due 12/28/2017 | | | 2,933,000 | | | 3,384,852 |
| | 6.625% due 4/1/2018 | | | 10,152,000 | | | 11,968,924 |
| | 7.300% due 5/13/2019 | | | 4,020,000 | | | 4,929,987 |
| | 6.250% due 7/8/2019 (b) | | | 139,000 | | | 144,630 |
| | 5.625% due 9/23/2019 | | | 400,000 | | | 459,254 |
| | 5.500% due 1/26/2020 | | | 10,000 | | | 11,303 |
| | 3.500% due 10/15/2020 (b) | | | 1,457,000 | | | 1,455,938 |
| | |
| | Mylan Inc. | | | | | | |
| | 7.875% due 7/15/2020 (d) | | | 3,600,000 | | | 4,090,108 |
| | |
| | NASDAQ OMX Group, Inc. | | | | | | |
| | 4.000% due 1/15/2015 | | | 250,000 | | | 258,488 |
| | |
| | National City Bank of Indiana | | | | | | |
| | 4.250% due 7/1/2018 | | | 200,000 | | | 215,788 |
| | |
| | National Retail Properties Inc. | | | | | | |
| | 6.875% due 10/15/2017 | | | 2,273,000 | | | 2,656,446 |
| | |
| | National Rural Utilities | | | | | | |
| | 7.200% due 10/1/2015 | | | 30,000 | | | 32,714 |
| | |
| | NationsBank Corp. | | | | | | |
| | 7.750% due 8/15/2015 | | | 2,251,000 | | | 2,491,515 |
| | |
| | NET Servicos de | | | | | | |
| | Comunicacao S.A. | | | | | | |
| | 7.500% due 1/27/2020 | | | 43,980,000 | | | 47,718,300 |
| | |
| | NIPSCO Capital Markets, Inc. | | | | | | |
| | 7.860% due 3/27/2017 | | | 40,000 | | | 45,832 |
| | |
| | NiSource Finance Corp. | | | | | | |
| | 5.400% due 7/15/2014 | | | 230,000 | | | 236,654 |
| | |
| | Northern Indiana Public | | | | | | |
| | Service Co. | | | | | | |
| | 7.590% due 6/12/2017 | | | 182,000 | | | 207,519 |
| | |
| | Ohio Casualty Corp. | | | | | | |
| | 7.300% due 6/15/2014 | | | 497,000 | | | 512,823 |
| | |
| | Owens Corning | | | | | | |
| | 6.500% due 12/1/2016 | | | 3,372,000 | | | 3,769,609 |
| | |
| | Petrobras Energia S.A. | | | | | | |
| | 5.875% due 5/15/2017 (d) | | | 13,500,000 | | | 14,310,000 |
| | 5.875% due 5/15/2017 | | | 20,549,000 | | | 21,781,940 |
See Notes to Financial Statements.
22
| BOND FUND SCHEDULE OF INVESTMENTS (Continued) |
| November 30, 2013 |
| | | | | Principal | | | |
| | | | Amount | | Value |
| BONDS (continued) | | | | | | |
| | | | | | | | |
| Corporate Bonds (continued) | | | | | | |
| | Petrobras Int’l. Finance Co. | | | | | | |
| | 7.875% due 3/15/2019 | | $ | 11,150,000 | | $ | 12,895,945 |
| | 5.750% due 1/20/2020 | | | 2,370,000 | | | 2,463,824 |
| | |
| | Petrohawk Energy Corp. | | | | | | |
| | 7.875% due 6/1/2015 | | | 208,000 | | | 213,200 |
| | | 7.250% due 8/15/2018 | | | 41,891,000 | | | 45,347,007 |
| | 6.250% due 6/1/2019 | | | 157,000 | | | 171,538 |
| | |
| | Pitney Bowes Inc. | | | | | | |
| | 5.750% due 9/15/2017 | | | 67,000 | | | 74,200 |
| | 6.250% due 3/15/2019 | | | 918,000 | | | 1,034,576 |
| | 5.250% due 1/15/2037 | | | 43,717,000 | | | 46,589,600 |
| | |
| | Platinum Underwriters | | | | | | |
| | Finance, Inc. | | | | | | |
| | 7.500% due 6/1/2017 | | | 15,017,000 | | | 16,954,944 |
| | |
| | PNC Funding Corp. | | | | | | |
| | 5.250% due 11/15/2015 | | | 352,000 | | | 380,288 |
| | |
| | PNM Resources Inc. | | | | | | |
| | 9.250% due 5/15/2015 | | | 617,000 | | | 685,641 |
| | |
| | PPL Energy Supply, LLC | | | | | | |
| | 5.400% due 8/15/2014 | | | 15,000 | | | 15,503 |
| | 6.500% due 5/1/2018 | | | 1,000,000 | | | 1,128,617 |
| | |
| | Principal Life Income | | | | | | |
| | Funding Trusts | | | | | | |
| | 5.000% due 4/15/2014 | | | 30,000 | | | 30,419 |
| | 5.000% due 4/15/2014 | | | 40,000 | | | 40,634 |
| | 5.000% due 4/15/2014 | | | 5,000 | | | 5,071 |
| | 3.398% due 4/1/2016 (a) | | | 50,000 | | | 50,848 |
| | |
| | Prologis, Inc. | | | | | | |
| | 6.875% due 3/15/2020 | | | 4,000 | | | 4,792 |
| | |
| | Protective Life Corp. | | | | | | |
| | 4.875% due 11/1/2014 | | | 820,000 | | | 846,918 |
| | |
| | Protective Life Secured Trusts | | | | | | |
| | 4.250% due 3/15/2014 | | | 20,000 | | | 20,141 |
| | |
| | Provident Cos., Inc. | | | | | | |
| | 7.000% due 7/15/2018 | | | 1,057,000 | | | 1,225,154 |
| | | | | | | | |
| | Prudential Financial, Inc. | | | | | | |
| | 6.200% due 1/15/2015 | | | 1,100,000 | | | 1,167,404 |
| | 5.000% due 3/16/2015 | | | 140,000 | | | 146,012 |
| | 8.875% due 6/15/2038 (a) | | | 31,958,000 | | | 38,749,075 |
| | |
| | Prudential PLC | | | | | | |
| | 11.750% due 12/23/2014 (a) (e) | | | 3,936,000 | | | 4,324,680 |
| | |
| | Qwest Corp. | | | | | | |
| | 7.500% due 10/1/2014 | | | 1,495,000 | | | 1,572,933 |
| | |
| | R.R. Donnelley & Sons Co. | | | | | | |
| | 5.500% due 5/15/2015 | | | 3,314,000 | | | 3,487,985 |
| | 8.600% due 8/15/2016 | | | 327,000 | | | 378,503 |
| | 6.125% due 1/15/2017 | | | 2,791,000 | | | 3,038,701 |
| | |
| | Regions Bank / Birmingham AL | | | | | | |
| | 7.500% due 5/15/2018 | | | 15,723,000 | | | 18,749,678 |
| | |
| | Regions Financial Corp. | | | | | | |
| | 7.750% due 11/10/2014 | | | 2,787,000 | | | 2,959,042 |
| | |
| | Royal Bank of Scotland | | | | | | |
| | Group PLC | | | | | | |
| | 3.000% due 9/14/2022 (b) | | | 20,000 | | | 19,987 |
| | |
| | Ryder System, Inc. | | | | | | |
| | 5.850% due 3/1/2014 | | | 102,000 | | | 103,311 |
| | |
| | Seagate HDD Cayman | | | | | | |
| | 7.750% due 12/15/2018 | | | 7,375,000 | | | 8,130,937 |
| | 6.875% due 5/1/2020 | | | 11,272,000 | | | 12,258,300 |
| | |
| | Security Benefit Life Insurance | | | | | | |
| | 8.750% due 5/15/2016 (d) | | | 8,000,000 | | | 9,011,064 |
| | |
| | Seminole Indian Tribe of Florida | | | | | | |
| | 8.030% due 10/1/2020 (d) | | | 37,500,000 | | | 41,250,000 |
| | |
| | Skyway Concession Co. LLC | | | | | | |
| | 0.528% due 6/30/2017 (a) (d) | | | 11,275,000 | | | 10,062,937 |
| | |
| | SL Green Realty Corp. | | | | | | |
| | 5.000% due 8/15/2018 | | | 16,015,000 | | | 17,195,578 |
See Notes to Financial Statements.
23
| BOND FUND SCHEDULE OF INVESTMENTS (Continued) |
| November 30, 2013 |
| | | | | Principal | | | |
| | | | Amount | | Value |
| BONDS (continued) | | | | | | |
| | | | | | | |
| Corporate Bonds (continued) | | | | | | |
| | SLM Corp. | | | | | | |
| | 4.300% due 12/15/2013 | | $ | 2,000 | | $ | 1,999 |
| | 5.150% due 12/15/2013 | | | 60,000 | | | 59,980 |
| | 5.250% due 12/15/2013 | | | 30,000 | | | 29,991 |
| | 3.638% due 1/31/2014 (a) | | | 127,000 | | | 126,864 |
| | | 4.700% due 3/15/2014 | | | 25,000 | | | 24,898 |
| | 4.950% due 3/15/2014 | | | 15,000 | | | 14,949 |
| | 5.150% due 3/15/2014 | | | 10,000 | | | 9,971 |
| | 3.318% due 4/1/2014 (a) | | | 155,000 | | | 154,242 |
| | 3.898% due 6/2/2014 (a) | | | 70,000 | | | 69,633 |
| | 5.050% due 11/14/2014 | | | 142,000 | | | 146,970 |
| | 3.268% due 12/15/2014 (a) | | | 444,000 | | | 438,969 |
| | 5.000% due 3/15/2015 (b) | | | 11,000 | | | 10,848 |
| | 5.000% due 4/15/2015 | | | 425,000 | | | 444,125 |
| | 3.468% due 9/15/2015 (a) | | | 90,000 | | | 88,678 |
| | 5.000% due 9/15/2015 | | | 55,000 | | | 53,950 |
| | 5.000% due 9/15/2015 | | | 140,000 | | | 137,319 |
| | 5.000% due 9/15/2015 | | | 46,000 | | | 45,119 |
| | 5.250% due 9/15/2015 | | | 75,000 | | | 73,879 |
| | 3.568% due 12/15/2015 (a) | | | 128,000 | | | 127,661 |
| | 5.150% due 3/15/2017 | | | 3,085,000 | | | 2,992,450 |
| | 4.800% due 6/15/2017 (b) | | | 59,000 | | | 56,216 |
| | 5.100% due 6/15/2017 (b) | | | 35,000 | | | 33,676 |
| | 4.700% due 12/15/2017 (b) | | | 33,000 | | | 30,980 |
| | 5.250% due 3/15/2018 | | | 5,000 | | | 4,762 |
| | 5.450% due 3/15/2018 | | | 74,000 | | | 70,998 |
| | 5.600% due 3/15/2018 | | | 30,000 | | | 28,951 |
| | 5.000% due 6/15/2018 | | | 168,000 | | | 167,944 |
| | 5.600% due 6/15/2018 | | | 29,000 | | | 27,832 |
| | 8.450% due 6/15/2018 | | | 9,790,000 | | | 11,405,350 |
| | 5.200% due 12/15/2018 (b) | | | 30,000 | | | 27,970 |
| | 5.450% due 12/15/2018 (b) | | | 46,000 | | | 43,371 |
| | 5.250% due 3/15/2019 | | | 42,000 | | | 38,995 |
| | 5.500% due 3/15/2019 | | | 800,000 | | | 752,080 |
| | 5.500% due 3/15/2019 (b) | | | 375,000 | | | 369,283 |
| | 5.900% due 3/15/2019 (b) | | | 30,000 | | | 28,727 |
| | 6.000% due 3/15/2019 (b) | | | 110,000 | | | 105,776 |
| | 6.000% due 3/15/2019 (b) | | | 61,000 | | | 58,658 |
| | 6.200% due 3/15/2019 (b) | | | 44,000 | | | 42,699 |
| | 6.250% due 3/15/2019 (b) | | | 20,000 | | | 19,453 |
| | 5.190% due 4/24/2019 | | | 731,000 | | | 711,605 |
| | 3.768% due 5/3/2019 (a) | | | 217,000 | | | 208,774 |
| | 5.000% due 6/15/2019 | | | 158,000 | | | 144,376 |
| | 5.000% due 6/15/2019 | | | 48,000 | | | 43,861 |
| | 5.150% due 6/15/2019 | | | 11,000 | | | 10,071 |
| | 6.000% due 6/15/2019 | | | 25,000 | | | 23,947 |
| | 6.000% due 6/15/2019 | | | 94,000 | | | 90,041 |
| | 5.500% due 9/15/2019 | | | 5,000 | | | 4,647 |
| | 6.000% due 9/15/2019 | | | 43,000 | | | 41,000 |
| | 8.000% due 3/25/2020 | | | 20,888,000 | | | 23,707,880 |
| | 6.000% due 9/15/2020 (b) | | | 15,000 | | | 14,110 |
| | 6.250% due 9/15/2020 (b) | | | 154,000 | | | 146,922 |
| | 6.500% due 12/15/2020 (b) | | | 71,000 | | | 71,032 |
| | 6.750% due 12/15/2020 (b) | | | 306,000 | | | 299,228 |
| | 6.750% due 12/15/2020 (b) | | | 95,000 | | | 92,898 |
| | 6.000% due 6/15/2021 (b) | | | 67,000 | | | 65,000 |
| | 6.000% due 6/15/2021 | | | 40,000 | | | 36,539 |
| | 6.000% due 6/15/2021 | | | 251,000 | | | 229,253 |
| | 6.000% due 6/15/2021 | | | 381,000 | | | 349,510 |
| | 6.150% due 6/15/2021 | | | 271,000 | | | 251,089 |
| | 6.150% due 6/15/2021 | | | 152,000 | | | 140,832 |
| | 7.000% due 6/15/2021 (b) | | | 194,000 | | | 189,962 |
| | 7.250% due 1/25/2022 | | | 805,000 | | | 853,300 |
| | 5.400% due 4/25/2023 (b) | | | 70,000 | | | 59,848 |
| | |
| | Springleaf Finance Corp. | | | | | | |
| | 6.900% due 12/15/2017 | | | 1,000,000 | | | 1,080,000 |
| | |
| | StanCorp Financial Group, Inc. | | | | | | |
| | 6.900% due 6/1/2067 (a) | | | 401,000 | | | 398,995 |
| | |
| | State Bank of India/London | | | | | | |
| | 4.125% due 8/1/2017 (d) | | | 8,000,000 | | | 8,110,272 |
| | |
| | Steelcase Inc. | | | | | | |
| | 6.375% due 2/15/2021 | | | 787,000 | | | 869,208 |
| | |
| | Sunoco, Inc. | | | | | | |
| | 4.875% due 10/15/2014 | | | 2,495,000 | | | 2,577,617 |
| | 9.625% due 4/15/2015 | | | 6,466,000 | | | 7,200,725 |
| | |
| | SunTrust Bank | | | | | | |
| | 5.000% due 9/1/2015 | | | 690,000 | | | 734,447 |
| | 5.450% due 12/1/2017 | | | 51,000 | | | 56,218 |
| | |
| | Susa Partnership L.P. | | | | | | |
| | 8.200% due 6/1/2017 | | | 16,000 | | | 19,098 |
| | 7.450% due 7/1/2018 | | | 130,000 | | | 155,863 |
| | |
| | Tech Data Corp. | | | | | | |
| | 3.750% due 9/21/2017 | | | 4,301,000 | | | 4,425,587 |
See Notes to Financial Statements.
24
| BOND FUND SCHEDULE OF INVESTMENTS (Continued) |
| November 30, 2013 |
| | | | | Principal | | | |
| | | | Amount | | Value |
| BONDS (continued) | | | | | | |
| | | | | | | |
| Corporate Bonds (continued) | | | | | | |
| | Telecom Italia | | | | | | |
| | 6.175% due 6/18/2014 | | $ | 1,805,000 | | $ | 1,849,109 |
| | 6.999% due 6/4/2018 | | | 28,868,000 | | | 31,916,663 |
| | 7.175% due 6/18/2019 | | | 1,480,000 | | | 1,652,398 |
| | |
| | Textron Financial Corp. | | | | | | |
| | 5.125% due 8/15/2014 | | | 135,000 | | | 138,747 |
| | 6.200% due 3/15/2015 | | | 14,000 | | | 14,920 |
| | |
| | | Transatlantic Holdings, Inc. | | | | | | |
| | 5.750% due 12/14/2015 | | | 2,590,000 | | | 2,822,724 |
| | |
| | 21st Century Insurance Group | | | | | | |
| | | 5.900% due 12/15/2013 | | | 363,000 | | | 363,543 |
| | |
| | UDR, Inc. | | | | | | |
| | 5.500% due 4/1/2014 | | | 421,000 | | | 427,156 |
| | 5.250% due 1/15/2015 | | | 690,000 | | | 721,067 |
| | |
| | Unitrin, Inc. | | | | | | |
| | 6.000% due 11/30/2015 | | | 10,185,000 | | | 10,944,750 |
| | 6.000% due 5/15/2017 | | | 8,974,000 | | | 9,965,223 |
| | |
| | Unum Group | | | | | | |
| | 7.125% due 9/30/2016 | | | 2,200,000 | | | 2,514,842 |
| | |
| | Warner Chilcott Co. LLC | | | | | | |
| | 7.750% due 9/15/2018 | | | 46,392,000 | | | 50,509,290 |
| | |
| | Weingarten Realty Investors | | | | | | |
| | 4.857% due 1/15/2014 | | | 807,000 | | | 810,692 |
| | |
| | Wells Fargo & Co. | | | | | | |
| | 7.980% due 3/15/2018 (a) (e) | | | 46,026,000 | | | 51,664,185 |
| | |
| | Western Union Co. | | | | | | |
| | 5.930% due 10/1/2016 | | | 33,095,000 | | | 36,995,676 |
| | |
| | Westinghouse Credit | | | | | | |
| | 8.875% due 6/14/2014 | | | 93,000 | | | 96,994 |
| | |
| | Westvaco Corp. | | | | | | |
| | 7.650% due 3/15/2027 | | | 268,000 | | | 284,454 |
| | 7.500% due 6/15/2027 | | | 796,000 | | | 839,760 |
| | |
| | Weyerhaeuser Co. | | | | | | |
| | 6.950% due 8/1/2017 | | | 195,000 | | | 227,848 |
| | | | | | | | |
| | White Mountains Re Group, Ltd. | | | | | | |
| | 6.375% due 3/20/2017 (d) | | | 18,996,000 | | | 20,874,400 |
| | |
| | Willis N.A. Inc. | | | | | | |
| | 6.200% due 3/28/2017 | | | 1,801,000 | | | 1,982,321 |
| | |
| | WPP Finance UK | | | | | | |
| | 5.875% due 6/15/2014 | | | 505,000 | | | 518,814 |
| | |
| | Wyndham Worldwide | | | | | | |
| | 6.000% due 12/1/2016 | | | 2,615,000 | | | 2,897,799 |
| | 5.750% due 2/1/2018 | | | 2,020,000 | | | 2,232,453 |
| | |
| | Wynn Las Vegas LLC | | | | | | |
| | 7.875% due 5/1/2020 | | | 3,615,000 | | | 3,990,056 |
| | 7.750% due 8/15/2020 | | | 41,546,000 | | | 46,323,790 |
| | |
| | XL Capital | | | | | | |
| | 5.250% due 9/15/2014 | | | 4,220,000 | | | 4,373,608 |
| | |
| | Zions Bancorporation | | | | | | |
| | 3.400% due 6/30/2014 | | | 15,000 | | | 15,032 |
| | 7.750% due 9/23/2014 | | | 14,349,000 | | | 15,072,376 |
| | 3.500% due 9/15/2015 | | | 4,790,000 | | | 4,783,332 |
| | 2.550% due 11/16/2015 | | | 1,966,000 | | | 1,966,594 |
| | 5.500% due 5/10/2016 | | | 2,943,000 | | | 2,934,409 |
| | 2.750% due 5/16/2016 | | | 11,315,000 | | | 11,333,647 |
| | 4.000% due 6/20/2016 | | | 60,000 | | | 62,609 |
| | 5.000% due 8/1/2016 | | | 3,650,000 | | | 3,652,183 |
| | 5.250% due 11/7/2016 | | | 1,158,000 | | | 1,156,641 |
| | 3.050% due 2/15/2017 | | | 3,700,000 | | | 3,716,446 |
| | 4.500% due 3/27/2017 | | | 1,125,000 | | | 1,206,846 |
| | |
| | Total Corporate Bonds | | | | | | 1,931,230,456 |
| | |
| Federal Agency Mortgage- | | | | | | |
| | Backed Securities - 0.0% | | | | | | |
| | Fannie Mae | | | | | | |
| | 6.000% due 8/1/2014, | | | | | | |
| | Pool #25-5434F | | | 2,860 | | | 2,904 |
| | 7.000% due 7/1/2015, | | | | | | |
| | Pool #53-5461F | | | 2,824 | | | 2,902 |
| | 8.000% due 9/1/2015, | | | | | | |
| | Pool #53-5460F | | | 6,506 | | | 6,739 |
| | 6.500% due 1/1/2019, | | | | | | |
| | Pool #76-9194F | | | 50,295 | | | 53,902 |
See Notes to Financial Statements.
25
| BOND FUND SCHEDULE OF INVESTMENTS (Continued) |
| November 30, 2013 |
| | | | | Principal | | | |
| | | | Amount | | Value |
| BONDS (continued) | | | | | | |
| | | | | | | | |
| Federal Agency Mortgage- | | | | | | |
| | Backed Securities (continued) | | | |
| | Fannie Mae (continued) | | | | | | |
| | 6.000% due 10/1/2037, | | | | | | |
| | Pool #88-8736F | | $ | 284,073 | | $ | 304,581 |
| | 6.000% due 3/1/2038, | | | | | | |
| | Pool #25-7134F | | | 194,731 | | | 208,534 |
| | |
| | Freddie Mac | | | | | | |
| | 4.500% due 5/1/2018, | | | | | | |
| | Pool #P1-0032 | | | 36,855 | | | 37,879 |
| | 6.500% due 12/1/2018, | | | | | | |
| | Pool #C9-0241 | | | 35,675 | | | 39,572 |
| | 6.000% due 11/1/2021, | | | | | | |
| | Pool #G1-2449 | | | 62,284 | | | 68,117 |
| | 6.000% due 2/1/2022, | | | | | | |
| | Pool #G1-2758 | | | 110,398 | | | 120,683 |
| | |
| | Ginnie Mae | | | | | | |
| | 5.500% due 6/15/2017, | | | | | | |
| | Pool #58-4476X | | | 1,427 | | | 1,525 |
| | 5.500% due 7/20/2018, | | | | | | |
| | Pool #00-3411M | | | 11,194 | | | 11,949 |
| | 7.000% due 5/15/2033, | | | | | | |
| | Pool #78-2071X | | | 48,777 | | | 58,417 |
| | 5.500% due 6/20/2038, | | | | | | |
| | Pool #00-4163M | | | 47,542 | | | 50,250 |
| | |
| | Total Federal Agency Mortgage- | | | | |
| | Backed Securities | | | | | | 967,954 |
| | |
| Taxable Municipal Bonds - 2.6% | | | | |
| | Casino Reinvestment | | | | | | |
| | | Development Authority NJ | | | | |
| | 5.340% due 6/1/2020 | | | 2,990,000 | | | 2,950,054 |
| | |
| | City of Detroit MI Water Supply | | | | |
| | System Revenue | | | | | | |
| | 3.607% due 7/1/2016 | | | 500,000 | | | 497,385 |
| | |
| | County of Reeves TX Certs. | | | | | | |
| | of Participation | | | | | | |
| | 4.800% due 12/1/2013 | | | 5,000 | | | 5,000 |
| | 5.150% due 12/1/2014 | | | 20,000 | | | 20,106 |
| | 6.150% due 12/1/2015 | | | 930,000 | | | 962,057 |
| | 7.000% due 12/1/2015 | | | 10,000 | | | 10,576 |
| | 6.000% due 12/1/2016 | | | 75,000 | | | 78,129 |
| | 5.000% due 12/1/2017 | | | 45,000 | | | 43,765 |
| | 6.250% due 12/1/2017 | | | 20,000 | | | 20,358 |
| | 7.400% due 12/1/2017 | | | 135,000 | | | 142,141 |
| | 6.500% due 12/1/2018 | | | 80,000 | | | 81,648 |
| | 7.500% due 12/1/2018 | | | 15,000 | | | 15,643 |
| | 6.750% due 12/1/2019 | | | 585,000 | | | 598,502 |
| | 6.125% due 12/1/2020 | | | 375,000 | | | 384,529 |
| | 6.875% due 12/1/2020 | | | 320,000 | | | 327,526 |
| | 6.375% due 12/1/2021 | | | 15,000 | | | 14,516 |
| | 7.000% due 12/1/2021 | | | 140,000 | | | 143,221 |
| | 7.700% due 12/1/2021 | | | 2,890,000 | | | 3,010,051 |
| | |
| | Garza County TX Public | | | | | | |
| | Facility Corp. | | | | | | |
| | 6.200% due 10/1/2020 | | | 1,335,000 | | | 1,354,037 |
| | |
| | Lancaster PA Parking Authority | | | | | | |
| | 5.760% due 12/1/2017 | | | 525,000 | | | 551,854 |
| | |
| | LL & P Wind Energy, Inc. WA | | | | | | |
| | 5.733% due 12/1/2017 (d) | | | 395,000 | | | 401,715 |
| | 5.983% due 12/1/2022 (d) | | | 7,295,000 | | | 7,242,695 |
| | |
| | Los Angeles CA Community | | | | | | |
| | College District | | | | | | |
| | 4.760% due 8/1/2015 | | | 40,000 | | | 40,946 |
| | |
| | Puerto Rico Commonwealth | | | | | | |
| | Gov’t. Development Bank | | | | | | |
| | 4.704% due 5/1/2016 | | | 24,080,000 | | | 20,457,164 |
| | 3.875% due 2/1/2017 | | | 8,000,000 | | | 6,300,640 |
| | 4.375% due 2/1/2019 | | | 12,395,000 | | | 8,979,682 |
| | |
| | Willacy County TX Local | | | | | | |
| | Gov’t. Corp. | | | | | | |
| | 7.800% due 12/1/2028 | | | 60,000 | | | 61,297 |
| | |
| | Willacy County TX Public | | | | | | |
| | Facility Corp. | | | | | | |
| | 5.000% due 12/1/2015 | | | 1,230,000 | | | 1,262,570 |
| | 6.000% due 12/1/2016 | | | 1,330,000 | | | 1,381,112 |
| | 6.000% due 12/1/2017 | | | 240,000 | | | 250,879 |
| | |
| | Total Taxable Municipal Bonds | | | | | | 57,589,798 |
| | |
| | TOTAL BONDS | | | | | | |
| | (COST $2,169,060,002) | | | | | | 2,192,728,396 |
See Notes to Financial Statements.
26
| BOND FUND SCHEDULE OF INVESTMENTS (Continued) |
| November 30, 2013 |
| | | | | Shares | | Value |
| SHORT-TERM INVESTMENTS - 0.3% | | | | | | |
| | | | | | | |
| Money Market Funds - 0.3% | | | | | | |
| | Fidelity Money Market Portfolio | | | | | | |
| | Class I, 0.045% (f) | | | 8,066,748 | | $ | 8,066,748 |
| | |
| | Total Money Market Funds | | | | | | 8,066,748 |
| | | |
| | TOTAL SHORT-TERM INVESTMENTS | | | |
| | (COST $8,066,748) | | | | | | 8,066,748 |
| | |
| | TOTAL INVESTMENTS - 97.7% | | | | | | |
| | (COST $2,177,126,750) | | | | | | 2,200,795,144 |
| | |
| | NET OTHER ASSETS AND | | | | | | |
| | LIABILITIES - 2.3% | | | | | | 51,267,205 |
| | |
| | NET ASSETS - 100.0% | | | | | $ | 2,252,062,349 |
| (a) | Interest rate shown represents the current coupon rate at November 30, 2013. |
| (b) | Security is a “step-up” bond where the coupon increases or steps up at a predetermined date. |
| (c) | Zero-coupon security. |
| (d) | Security is exempt from registration under Rule 144A under the Securities Act of 1933. This security may be resold in transactions that are exempt from registration, normally to qualified institutional buyers. |
| (e) | Perpetual maturity, date shown represents next contractual call date. |
| (f) | Interest rate shown represents the 7-day yield at November 30, 2013. |
PLC: Public Limited Company
See Notes to Financial Statements.
27
| FUND EXPENSE EXAMPLES (Unaudited) |
| November 30, 2013 |
Example
A Fund shareholder may incur two types of costs: (1) transaction costs such as redemption fees; and (2) ongoing costs, including management fees and other Fund expenses. This example is intended to help you understand your ongoing costs (in dollars) of investing in a Fund and to compare these costs with the ongoing costs of investing in other mutual funds.
The example is based on an investment of $1,000 invested at the beginning of the period and held for the entire period from June 1, 2013 to November 30, 2013.
Actual Expenses
The first line of the table below under each Fund provides information about actual account values and actual expenses for such Fund. You may use the information in this line, together with the amount you invested, to estimate the expenses that you paid over the period. Simply divide your account value by $1,000 (for example, an $8,600 account value divided by $1,000 = 8.6), then multiply the result by the number in the first line under the heading entitled “Expenses Paid During Period” to estimate the expenses you paid on your account during this period.
Hypothetical Example for Comparison Purposes
The second line of the table below under each Fund provides information about hypothetical account values and hypothetical expenses based on such Fund’s actual expense ratio and an assumed rate of return of 5% per year before expenses, which is not the Fund’s actual return. The hypothetical account values and expenses may not be used to estimate the actual ending account balance or expenses you paid for the period. You may use this information to compare the ongoing costs of investing in each Fund and other funds. To do so, compare the 5% hypothetical example with the 5% hypothetical examples that appear in the shareholder reports of the other funds.
Please note that the expenses shown in the table are meant to highlight your ongoing costs only and do not reflect any transactional costs, such as redemption fees. Therefore, the second line of the table is useful in comparing ongoing costs only, and will not help you determine the relative costs of owning different funds. In addition, if these transactional costs were included, your costs would have been higher.
| | Beginning | | Ending | | Expenses Paid During |
| | Account Value | | Account Value | | Period* |
| | 06/01/13 | | 11/30/13 | | 06/01/13-11/30/13 |
| Thompson LargeCap Fund | | | | | | |
| Actual | | $1,000.00 | | $1,118.08 | | $6.37 |
| Hypothetical (5% return before expenses) | | $1,000.00 | | $1,018.98 | | $6.07 |
| Thompson MidCap Fund | | | | | | |
| Actual | | $1,000.00 | | $1,132.18 | | $6.95 |
| Hypothetical (5% return before expenses) | | $1,000.00 | | $1,018.48 | | $6.58 |
| Thompson Bond Fund | | | | | | |
| Actual | | $1,000.00 | | $1,006.69 | | $3.72 |
| Hypothetical (5% return before expenses) | | $1,000.00 | | $1,021.29 | | $3.75 |
| * | Expenses are equal to the annualized [net] expense ratio for each Fund (LargeCap Fund: 1.20%; MidCap Fund: 1.30%; and Bond Fund: 0.74%), multiplied by the average account value over the period, multiplied by 183/365 (to reflect the one-half year period). |
| |
| For more information, please refer to the Funds’ Prospectus. |
See Notes to Financial Statements.
28
| STATEMENTS OF ASSETS AND LIABILITIES |
| November 30, 2013 (In thousands, except per share amounts) |
| | LARGECAP | | MIDCAP | | BOND |
| | FUND | | FUND | | FUND |
| ASSETS | | | | | | | | | | | | | | |
| Total investments in securities, at value (Cost $104,633, $31,090 and | | | | | | | | | | | | | | |
| $2,177,127, respectively) | | | $ | 124,940 | | | | | $ | 37,797 | | | $ | 2,200,795 |
| Due from sale of securities | | | | 3,225 | | | | | | 4 | | | | 4,577 |
| Receivable from fund shares sold | | | | 13 | | | | | | 3 | | | | 24,937 |
| Dividends and interest receivable | | | | 225 | | | | | | 42 | | | | 33,487 |
| Prepaid expenses | | | | 9 | | | | | | 5 | | | | 93 |
| Total Assets | | | | 128,412 | | | | | | 37,851 | | | | 2,263,889 |
| LIABILITIES | | | | | | | | | | | | | | |
| Due on purchase of securities | | | | 3,461 | | | | | | 184 | | | | 6,947 |
| Payable for fund shares redeemed | | | | 4 | | | | | | 1 | | | | 3,531 |
| Accrued expenses payable | | | | 41 | | | | | | 33 | | | | 137 |
| Due to Advisor | | | | 108 | | | | | | 25 | | | | 1,212 |
| Total Liabilities | | | | 3,614 | | | | | | 243 | | | | 11,827 |
| NET ASSETS | | | $ | 124,798 | | | | | $ | 37,608 | | | $ | 2,252,062 |
| Net Assets consist of: | | | | | | | | | | | | | | |
| Capital stock ($.001 par value) | | | $ | 171,980 | | | | | $ | 27,121 | | | $ | 2,201,067 |
| Undistributed net investment income | | | | 364 | | | | | | – | | | | 21,532 |
| Accumulated net realized gain (loss) on investments | | | | (67,853 | ) | | | | | 3,780 | | | | 5,795 |
| Net unrealized appreciation on investments | | | | 20,307 | | | | | | 6,707 | | | | 23,668 |
| Net Assets | | | $ | 124,798 | | | | | $ | 37,608 | | | $ | 2,252,062 |
| Shares of capital stock outstanding (unlimited shares authorized) | | | | 2,685 | | | | | | 2,679 | | | | 189,031 |
| Offering and redemption price/Net asset value per share | | | $ | 46.47 | | | | | $ | 14.04 | | | $ | 11.91 |
See Notes to Financial Statements.
29
| STATEMENTS OF OPERATIONS |
| Year Ended November 30, 2013 (In thousands) |
| | LARGECAP | | MIDCAP | | BOND |
| | FUND | | FUND | | FUND |
| Investment income | | | | | | | | | | | | | | | | |
| Dividends(1) | | | $ | 1,854 | | | | | $ | 392 | | | | $ | – | |
| Interest | | | | – | | | | | | – | | | | | 80,058 | |
| | | | 1,854 | | | | | | 392 | | | | | 80,058 | |
| Expenses | | | | | | | | | | | | | | | | |
| Investment advisory fees | | | | 1,049 | | | | | | 306 | | | | | 10,766 | |
| Shareholder servicing costs | | | | 32 | | | | | | 40 | | | | | 1,163 | |
| Administrative & accounting services fees | | | | 118 | | | | | | 45 | | | | | 538 | |
| Custody fees | | | | 15 | | | | | | 8 | | | | | 173 | |
| Federal & state registration | | | | 40 | | | | | | 34 | | | | | 133 | |
| Directors fees | | | | 23 | | | | | | 19 | | | | | 101 | |
| Professional fees | | | | 38 | | | | | | 36 | | | | | 70 | |
| Other expenses | | | | 35 | | | | | | 11 | | | | | 390 | |
| Total expenses | | | | 1,350 | | | | | | 499 | | | | | 13,334 | |
| Less expenses reimbursed by Advisor | | | | (2 | ) | | | | | (101 | ) | | | | – | |
| Net expenses | | | | 1,348 | | | | | | 398 | | | | | 13,334 | |
| Net investment income (loss) | | | | 506 | | | | | | (6 | ) | | | | 66,724 | |
| Net realized gain on investments | | | | 15,555 | | | | | | 4,145 | | | | | 7,031 | |
| Net unrealized appreciation (depreciation) on investments | | | | 17,741 | | | | | | 5,045 | | | | | (17,723 | ) |
| Net gain (loss) on investments | | | | 33,296 | | | | | | 9,190 | | | | | (10,692 | ) |
| Net increase in net assets resulting from operations | | | $ | 33,802 | | | | | $ | 9,184 | | | | $ | 56,032 | |
| |
| |
| (1)Net of foreign withholding taxes | | | $ | 7 | | | | | $ | 1 | | | | $ | – | |
See Notes to Financial Statements.
30
| STATEMENTS OF CHANGES IN NET ASSETS |
| (In thousands) |
| | LARGECAP | | MIDCAP | | BOND |
| | FUND | | FUND | | FUND |
| | Year Ended | | Year Ended | | Year Ended | | Year Ended | | Year Ended | | Year Ended |
| | November 30, | | November 30, | | November 30, | | November 30, | | November 30, | | November 30, |
| | 2013 | | 2012 | | 2013 | | 2012 | | 2013 | | 2012 |
| Operations | | | | | | | | | | | | | | | | | | | | | | | | | | | | | | | | | | | | |
| Net investment income (loss) | | | $ | 506 | | | | | $ | 509 | | | | | $ | (6 | ) | | | | $ | (6 | ) | | | | $ | 66,724 | | | | | $ | 35,828 | | |
| Net realized gain on investments | | | | 15,555 | | | | | | 12,001 | | | | | | 4,145 | | | | | | 2,194 | | | | | | 7,031 | | | | | | 2,478 | | |
| Net unrealized appreciation (depreciation) | | | | | | | | | | | | | | | | | | | | | | | | | | | | | | | | | | | | |
| on investments | | | | 17,741 | | | | | | 756 | | | | | | 5,045 | | | | | | 314 | | | | | | (17,723 | ) | | | | | 44,436 | | |
| Net increase in net assets resulting | | | | | | | | | | | | | | | | | | | | | | | | | | | | | | | | | | | | |
| from operations | | | | 33,802 | | | | | | 13,266 | | | | | | 9,184 | | | | | | 2,502 | | | | | | 56,032 | | | | | | 82,742 | | |
| Distributions to Shareholders | | | | | | | | | | | | | | | | | | | | | | | | | | | | | | | | | | | | |
| Distributions from net investment income | | | | (538 | ) | | | | | (359 | ) | | | | | – | | | | | | – | | | | | | (57,323 | ) | | | | | (31,675 | ) | |
| Distributions from net realized gains on | | | | | | | | | | | | | | | | | | | | | | | | | | | | | | | | | | | | |
| securities transactions | | | | – | | | | | | – | | | | | | (2,062 | ) | | | | | (1,957 | ) | | | | | (2,354 | ) | | | | | (1,596 | ) | |
| Total distributions to shareholders | | | | (538 | ) | | | | | (359 | ) | | | | | (2,062 | ) | | | | | (1,957 | ) | | | | | (59,677 | ) | | | | | (33,271 | ) | |
| | | | | | | | | | | | | | | | | | | | | | | | | | | | | | | | | | | | | |
| Fund Share Transactions (See Note 4) | | | | (8,076 | ) | | | | | (17,383 | ) | | | | | 5,931 | | | | | | 6,390 | | | | | | 963,424 | | | | | | 586,782 | | |
| | | | | | | | | | | | | | | | | | | | | | | | | | | | | | | | | | | | | |
| Total Increase (Decrease) in Net Assets | | | | 25,188 | | | | | | (4,476 | ) | | | | | 13,053 | | | | | | 6,935 | | | | | | 959,779 | | | | | | 636,253 | | |
| | | | | | | | | | | | | | | | | | | | | | | | | | | | | | | | | | | | | |
| Net Assets | | | | | | | | | | | | | | | | | | | | | | | | | | | | | | | | | | | | |
| Beginning of period | | | | 99,610 | | | | | | 104,086 | | | | | | 24,555 | | | | | | 17,620 | | | | | | 1,292,283 | | | | | | 656,030 | | |
| End of period | | | $ | 124,798 | | | | | $ | 99,610 | | | | | $ | 37,608 | | | | | $ | 24,555 | | | | | $ | 2,252,062 | | | | | $ | 1,292,283 | | |
| Undistributed net investment income (loss) | | | | | | | | | | | | | | | | | | | | | | | | | | | | | | | | | | | | |
| included in net assets at end of period | | | $ | 364 | | | | | $ | 396 | | | | | $ | – | | | | | $ | (6 | ) | | | | $ | 21,532 | | | | | $ | 10,999 | | |
See Notes to Financial Statements.
31
| NOTES TO FINANCIAL STATEMENTS |
| November 30, 2013 |
NOTE 1 - ORGANIZATION
Thompson IM Funds, Inc. (the “Company”) is a Wisconsin corporation registered under the Investment Company Act of 1940, as amended (the “1940 Act”), as an open-end, diversified management investment company.
The Company consists of separate mutual funds series (each, a “Fund,” and collectively, the “Funds”): Thompson LargeCap Fund (the “LargeCap Fund”), Thompson MidCap Fund (the “MidCap Fund”) and Thompson Bond Fund (the “Bond Fund”). The assets and liabilities of each Fund are segregated and a shareholder’s interest is limited to the Fund in which the shareholder owns shares. The objectives and strategies of each Fund are described in the Funds’ Prospectus.
NOTE 2 - SIGNIFICANT ACCOUNTING POLICIES
The following is a summary of significant accounting policies followed by the Funds in the preparation of their financial statements.
SECURITY VALUATION - Each Fund’s investments are valued at their market prices (generally the last reported sales price on the exchange where the securities are primarily traded or, for Nasdaq-listed securities, at their Nasdaq Official Closing Prices) or, where market quotations are not readily available or are unreliable, at fair value as determined in good faith pursuant to procedures established by the Funds’ Board of Directors (the “Funds’ Board”). Market quotations for the common stocks in which the Funds invest are nearly always readily available; however, market quotations for debt securities are often not readily available. Fair values of debt securities are typically based on valuations published by an independent pricing service, which uses various valuation methodologies such as matrix pricing and other analytical pricing models as well as market transactions and dealer quotations. Debt securities with remaining maturities of 60 days or less are generally valued at amortized cost basis. Exchange-traded options are valued at the last reported sale price on an exchange on which the option is traded. If no sales are reported on a particular day, the mean between the highest bid and lowest asked quotations at the close of the exchanges will be used. Investments in money market mutual funds are generally priced at the ending NAV provided by the service agent of the funds.
When a security is “fair valued,” consideration is given to the facts and circumstances relevant to the particular situation, including a review of various factors set forth in the Pricing Policies and Procedures adopted by the Funds’ Board, which includes factors such as fundamental analytical data relating to the investment, which may include consideration of yields or prices of securities of comparable quality, coupon rate, maturity and type of issue, nature and duration of any restrictions on disposition of the security and an evaluation of forces that influence the market in which the securities are purchased or sold. Fair value pricing is an inherently subjective process, and no single standard exists for determining fair value. Different funds could reasonably arrive at different values for the same security. No securities in any of the Funds were fair valued as of November 30, 2013.
In accordance with generally accepted accounting principles in the United States of America (“GAAP”), fair value is defined as the price that the Fund would receive to sell an investment or pay to transfer a liability in an orderly transaction with an independent buyer in the principal market, or in the absence of a principal market, the most advantageous market for the investment or liability. GAAP established a three-tier hierarchy to maximize the use of observable market data and minimize the use of unobservable inputs and to establish classification of fair value measurements for disclosure purposes.
Various inputs are used in determining the value of each Fund’s investments. These inputs are summarized in the three broad levels listed below:
Level 1 – Quoted prices in active markets for identical securities.
Level 2 – Other significant observable inputs (including quoted prices for similar securities, interest rates, prepayment speeds, credit risk, etc.).
Level 3 – Significant unobservable inputs (including the Fund’s own assumptions in determining the fair value of investments).
Inputs may include price information, specific and broad credit data, liquidity statistics, and other factors. The Fund considers observable data to be that market data which is readily available, regularly distributed or updated, reliable and verifiable, not proprietary, and provided by independent sources that are actively involved in the relevant market. The determination of
32
| NOTES TO FINANCIAL STATEMENTS (Continued) |
| November 30, 2013 |
what constitutes “observable” requires significant judgment by the Fund. The categorization of a financial instrument within the hierarchy is based upon the pricing transparency of the instrument and does not necessarily correspond to the Fund’s perceived risk of that instrument. Investments whose values are based on quoted market prices in active markets, and which are therefore classified as level-1 securities, include active listed equities and certain U.S. government obligations.
Investments that trade in markets that are not considered to be active, but are valued based on quoted market prices, dealer quotations or alternative pricing sources supported by observable inputs, are classified as level-2 securities. These include certain U.S. government obligations, most government agency securities, investment-grade corporate bonds, sovereign government bonds, municipal bonds, and less liquid listed equities. Level-2 investments include positions that are not traded in active markets.
Investments classified as level-3 securities have significant unobservable inputs, as they trade infrequently or not at all. Level-3 instruments include private-placement and less liquid corporate and municipal debt securities. When observable prices are not available for these securities, the Fund uses one or more valuation techniques (e.g., the market approach, the income approach, or the cost approach) for which sufficient and reliable data is available. Within level 3, the use of the market approach generally consists of using comparable market transactions, while the use of the income approach generally consists of using the net present value of estimated future cash flows, adjusted as appropriate for liquidity, credit, market and/or other risk factors. The inputs used by the Fund in estimating the value of level-3 investments include the original transaction price and recent transactions in the same or similar instruments.
The following is a summary of the inputs used to value the Funds’ investments as of November 30, 2013:
| | LargeCap Fund |
| Assets | | Level 1 | | Level 2 | | Level 3 | | Total |
| Investment Securities: | | | | | | | | | | | | |
| Common Stocks | | $ | 124,573,803 | | $ | – | | $ | – | | $ | 124,573,803 |
| Short-term securities | | | 366,363 | | | – | | | – | | | 366,363 |
| Total Assets | | $ | 124,940,166 | | $ | – | | $ | – | | $ | 124,940,166 |
| |
| | MidCap Fund |
| Assets | | Level 1 | | Level 2 | | Level 3 | | Total |
| Investment Securities: | | | | | | | | | | | | |
| Common Stocks | | $ | 37,597,089 | | $ | – | | $ | – | | $ | 37,597,089 |
| Short-term securities | | | 200,199 | | | – | | | – | | | 200,199 |
| Total Assets | | $ | 37,797,288 | | $ | – | | $ | – | | $ | 37,797,288 |
| |
| | Bond Fund |
| Assets | | Level 1 | | Level 2 | | Level 3 | | Total |
| Investment Securities: | | | | | | | | | | | | |
| Bonds | | $ | – | | $ | 2,192,728,396 | | $ | – | | $ | 2,192,728,396 |
| Short-term securities | | | 8,066,748 | | | – | | | – | | | 8,066,748 |
| Total Assets | | $ | 8,066,748 | | $ | 2,192,728,396 | | $ | – | | $ | 2,200,795,144 |
There were no transfers between level-1 and level-2 securities and the Funds did not invest in any level-3 investments as of and during the fiscal year ended November 30, 2013. It is the Funds’ policy to record transfers at the end of the reporting period. Refer to each Fund’s Schedule of Investments for additional information regarding security types and industry classifications.
33
| NOTES TO FINANCIAL STATEMENTS (Continued) |
| November 30, 2013 |
SECURITIES TRANSACTIONS AND INVESTMENT INCOME - Investment securities transactions are accounted for on the trade date. Gains or losses realized on sales of securities are determined by comparing the identified cost of the security lot sold with the net sales proceeds. Discounts/premiums on debt securities purchased are accreted/amortized over the life of the respective securities on the same basis for book and tax purposes. Dividend income is recorded on the ex-dividend date. Interest income is recorded as earned. Income and capital gains on some foreign securities may be subject to foreign withholding taxes, which are accrued as applicable, and have been provided for in accordance with the Funds’ understanding of the applicable country’s tax rules and rates.
OPTIONS - Each Fund may enter into options transactions for hedging purposes and will not use these instruments for speculation. Each Fund may use options to hedge against anticipated declines in the market value of portfolio securities and increases in the market value of securities it intends to purchase and protect against exposure to interest rate changes. Each Fund may also use options to enhance total return or invest in eligible asset classes with greater efficiency and lower cost than is believed to be possible through direct investment. The use of options for hedging purposes involves certain risks and may result in a loss if changes in the value of the option move in a direction different than anticipated, rendering the hedging strategy unsuccessful.
Each Fund may write covered call/put options for which premiums received are recorded as liabilities and are subsequently adjusted to the current fair value of the options written. Premiums received from writing options that expire unexercised are treated as realized gains. Premiums received from writing options which are either exercised or closed are offset against the proceeds received or amount paid on the transaction to determine realized gains or losses.
SECURITIES PURCHASED ON A WHEN-ISSUED OR DELAYED-DELIVERY BASIS - Each Fund may purchase securities on a when-issued or delayed-delivery basis. When-issued securities are securities purchased with delivery to occur at a later date at a stated price and/or yield, thereby involving the risk that the price and/or yield obtained may be more or less than those available in the market when delivery takes place. At the time a Fund makes a commitment to purchase a security on a when-issued basis, the Fund records the transaction and reflects the value of the security in determining net asset value. Each Fund designates and maintains cash and marketable securities at least equal in value to commitments for when-issued securities.
VARIABLE-RATE DEMAND NOTES - The Funds invest in short-term variable-rate demand notes, which are unsecured instruments. The Funds may be susceptible to credit risk with respect to these instruments to the extent the issuer defaults on its payment obligation.
PERMANENT BOOK AND TAX DIFFERENCES - Generally accepted accounting principles require that permanent financial reporting and tax differences relating to shareholder distributions be reclassified in the capital accounts.
EXPENSES - Each Fund is charged for those expenses that are directly attributed to it. Expenses that are not readily identifiable to a specific Fund are generally allocated among the Funds in proportion to the relative sizes of the Funds.
USE OF ESTIMATES - The preparation of financial statements in conformity with GAAP requires management to make estimates and assumptions that affect the reported amounts of assets and liabilities and disclosure of contingent assets and liabilities at the date of the financial statements and the reported amounts of revenues and expenses during the reporting period. Actual results could differ from these estimates.
DISTRIBUTIONS TO SHAREHOLDERS - Distributions to shareholders from net investment income and realized gains on securities for the LargeCap Fund and MidCap Fund normally are declared at least annually. Bond Fund distributions to shareholders from net investment income normally are declared on a quarterly basis, and distributions to shareholders from realized gains on securities normally are declared at least annually. Distributions are recorded on the ex-dividend date.
FEDERAL INCOME TAXES - No provision has been made for federal income taxes since the Funds have elected to be taxed as regulated investment companies and intend to distribute substantially all income to shareholders and otherwise comply with the provisions of the Internal Revenue Code applicable to regulated investment companies.
34
| NOTES TO FINANCIAL STATEMENTS (Continued) |
| November 30, 2013 |
LINE OF CREDIT - The Funds have established an unsecured line of credit (“LOC”) with U.S. Bank N.A. which expires November 14, 2014 used primarily to finance redemption payments. Each individual Fund’s borrowing under the LOC is limited to either 5% of the value of that Fund’s total assets or any explicit borrowing limits imposed by the Funds’ Board, whatever is less. As of November 30, 2013, the limits established by the Funds’ Board are: LargeCap Fund - $6,000,000, MidCap Fund - $1,700,000 and Bond Fund - $100,000,000. The LOC was drawn upon during the year; however, as of November 30, 2013, there were no borrowings by the Funds outstanding under the LOC. The following table shows the average balance, average interest rate and interest expense incurred by the Funds on borrowings under the LOC for the fiscal year ended November 30, 2013.
| | | | Average | | Average | | Interest |
| | Fund | | | Balance | | Interest Rate | | Expense |
| LargeCap Fund | | $ | 106,532 | | 3.250% | | | $ | 3,510 | |
| MidCap Fund | | $ | 11,764 | | 3.250% | | | $ | 386 | |
| Bond Fund | | $ | 1,823,504 | | 3.250% | | | $ | 60,125 | |
GUARANTEES AND INDEMNIFICATIONS - Under the Funds’ organizational documents, each Director, officer, employee or other agent of the Funds (including the Funds’ investment manager) is indemnified, to the extent permitted by the 1940 Act, against certain liabilities that may arise out of performance of their duties to the Funds. Additionally, in the normal course of business, the Funds enter into contracts that contain a variety of indemnification clauses. The Funds’ maximum exposure under these arrangements is unknown as this would involve future claims that may be made against the Funds that have not yet occurred. However, the Funds have not had prior claims or losses pursuant to these contracts and believe the risk of loss to be remote.
ACCOUNTING FOR UNCERTAINTY IN INCOME TAXES - As of and during the fiscal year ended November 30, 2013, the Funds did not have a liability for unrecognized tax benefits in the accompanying financial statements. Also, the Funds recognized no interest or penalties related to unrecognized tax benefits during the same period. The Funds recognize interest and penalties, if any, related to unrecognized tax benefits as income tax expense in the Statements of Operations. Generally, each of the tax years in the four-year period ended November 30, 2013 remains subject to examination by taxing authorities. The Funds are also not aware of any tax positions for which it is reasonably possible that the total amounts of unrecognized tax benefits will significantly change in the next twelve months.
SUBSEQUENT EVENTS - The Funds have evaluated subsequent events through the issuance of the Funds’ financial statements and have determined that such subsequent events do not have an impact on the Funds’ financial statements.
NOTE 3 - INVESTMENT ADVISORY AND ADMINISTRATIVE AND ACCOUNTING SERVICES AGREEMENTS AND OTHER TRANSACTIONS WITH AFFILIATES
The Investment Advisory Agreement pursuant to which Thompson Investment Management, Inc. (“TIM” or “Advisor”) is retained by the Funds provides for compensation to TIM (computed daily and paid monthly) at the following annual rates: for the LargeCap Fund and MidCap Fund - 1.00% of the first $50 million of average daily net assets and 0.90% of average daily net assets in excess of $50 million; and for the Bond Fund - 0.65% of the first $50 million of average daily net assets and 0.60% of average daily net assets in excess of $50 million.
The Advisor is contractually bound to waive management fees and/or reimburse expenses incurred by the LargeCap Fund from March 31, 2013 through November 30, 2013 and the MidCap Fund and Bond Fund from December 1, 2012 through March 31, 2014, so that the annual operating expenses of the Funds do not exceed the following percentages of their respective average daily net assets: LargeCap Fund-1.20%, MidCap Fund-1.30% and Bond Fund-0.80%. Prior to March 31, 2013, the applicable expense limitation percentage for the LargeCap Fund was 1.40%. The Advisor reimbursed expenses incurred by the LargeCap Fund in the amount of $2,206 for the period from March 31, 2013 through November 30, 2013, and the MidCap Fund in the amount of $101,402 for the period from December 1, 2012 through November 30, 2013. The Funds are not obligated to reimburse the Advisor for any fees or expenses waived in previous fiscal years.
35
| NOTES TO FINANCIAL STATEMENTS (Continued) |
| November 30, 2013 |
Pursuant to an Administrative and Accounting Services Agreement, TIM maintains the Funds’ financial records in accordance with the 1940 Act, prepares all necessary financial statements of the Funds and calculates the net asset value per share of the Funds on a daily basis. As compensation for its services, each Fund pays TIM a fee computed daily and payable monthly at the annual rate of 0.15% of average daily net assets up to $30 million, 0.10% of the next $70 million of average daily net assets and 0.025% of average daily net assets in excess of $100 million, with an annual minimum fee of $30,000 per Fund. The calculations of daily net asset value are subcontracted to U.S. Bancorp Fund Services, resulting in fees paid by TIM for the fiscal year ended November 30, 2013 in the amounts of $34,649, $33,058 and $213,525 for the LargeCap Fund, MidCap Fund and Bond Fund, respectively.
The Funds reimburse the Advisor for a portion of amounts paid by the Advisor out of the Advisor’s own resources under various shareholder, account maintenance, networking and other services provided to the Funds by broker-dealers and other intermediaries. The amount reimbursed by the Funds is equal to (1) for those accounts maintained through a shareholder servicing arrangement, an annual rate of no more than 0.10% of the average daily net assets of the omnibus accounts in the Funds for which all broker-dealers and other intermediaries, in the aggregate, are responsible, and (2) for those accounts maintained through a networking arrangement, no more than $6 per year per account in the Funds for which the broker-dealers and other intermediaries are responsible; provided however, in all cases only one of these fees shall be applicable to the assets in an account. This amount has been determined by the Funds’ Board to approximate the transfer agency fees that would otherwise have been payable by the Funds if such broker-dealers and intermediaries did not maintain these accounts. For the fiscal year ended November 30, 2013, the amounts reimbursed by the Funds to the Advisor were $27,925, $4,401 and $697,287 for the LargeCap Fund, MidCap Fund and Bond Fund, respectively.
As of November 30, 2013, retirement plan investments by certain employees of the Advisor represent 5.01% of the net assets of the MidCap Fund.
NOTE 4 - FUND SHARE TRANSACTIONS (in thousands)
Transactions in shares of the Funds were as follows:
| | Year Ended | | Year Ended |
| | November 30, 2013 | | November 30, 2012 |
| | Shares | | Dollars | | Shares | | Dollars |
| LargeCap Fund | | | | | | | | | | | | | | |
| Shares sold | | 323 | | | $ | 13,589 | | | 447 | | | $ | 14,978 | |
| Shares issued in reinvestment of dividends | | 14 | | | | 517 | | | 12 | | | | 343 | |
| Shares issued in reinvestment of realized gains | | – | | | | – | | | – | | | | – | |
| Shares redeemed | | (559 | ) | | | (22,182 | ) | | (1,014 | ) | | | (32,704 | ) |
| Net decrease | | (222 | ) | | $ | (8,076 | ) | | (555 | ) | | $ | (17,383 | ) |
| |
| MidCap Fund | | | | | | | | | | | | | | |
| Shares sold | | 488 | | | $ | 6,084 | | | 549 | | | $ | 6,096 | |
| Shares issued in reinvestment of dividends | | – | | | | – | | | – | | | | – | |
| Shares issued in reinvestment of realized gains | | 195 | | | | 2,058 | | | 205 | | | | 1,953 | |
| Shares redeemed | | (181 | ) | | | (2,211 | ) | | (157 | ) | | | (1,659 | ) |
| Net increase | | 502 | | | $ | 5,931 | | | 597 | | | $ | 6,390 | |
| |
| Bond Fund | | | | | | | | | | | | | | |
| Shares sold | | 144,318 | | | $ | 1,716,983 | | | 69,563 | | | $ | 810,480 | |
| Shares issued in reinvestment of dividends | | 4,549 | | | | 53,604 | | | 2,562 | | | | 29,525 | |
| Shares issued in reinvestment of realized gains | | 188 | | | | 2,229 | | | 136 | | | | 1,521 | |
| Shares redeemed | | (68,208 | ) | | | (809,392 | ) | | (21,964 | ) | | | (254,744 | ) |
| Net increase | | 80,847 | | | $ | 963,424 | | | 50,297 | | | $ | 586,782 | |
36
| NOTES TO FINANCIAL STATEMENTS (Continued) |
| November 30, 2013 |
NOTE 5 - PURCHASE AND SALE OF SECURITIES
Investment transactions for the fiscal year ended November 30, 2013 were as follows:
| | Securities other than U.S. | | | | | | | | | | |
| | Government and Short-term | | | | | | | | | | |
| | Investments | | U.S. Government Securities |
| | Purchases | | Sales | | Purchases | | Sales |
| LargeCap Fund | | $ | 42,280,903 | | $ | 50,455,350 | | | $ | – | | | | $ | – | |
| MidCap Fund | | $ | 18,033,961 | | $ | 14,156,258 | | | $ | – | | | | $ | – | |
| Bond Fund | | $ | 1,595,327,137 | | $ | 228,879,418 | | | $ | 70,228 | | | | $ | 14,947 | |
NOTE 6 - INCOME TAX INFORMATION
At November 30, 2013, the investment cost and aggregate unrealized appreciation and depreciation on investments for federal income tax purposes were as follows:
| | | | | | | | | | | | | | | | | | Net unrealized | | Distributable | | Distributable |
| | | | | | | Unrealized | | Unrealized | | appreciation | | ordinary | | long-term |
| | Federal tax cost | | appreciation | | depreciation | | (depreciation) | | income | | capital gains |
| LargeCap Fund | | | $ | 104,971,807 | | | | $ | 23,277,286 | | | | $ | (3,308,927 | ) | | | | $ | 19,968,359 | | | | $ | 364,330 | | | | $ | – | |
| MidCap Fund | | | $ | 31,243,495 | | | | $ | 7,443,385 | | | | $ | (889,592 | ) | | | | $ | 6,553,793 | | | | $ | 246,002 | | | | $ | 3,686,265 | |
| Bond Fund | | | $ | 2,177,126,750 | | | | $ | 49,594,085 | | | | $ | (25,925,691 | ) | | | | $ | 23,668,394 | | | | $ | 21,532,361 | | | | $ | 5,794,499 | |
The tax basis of investments for tax and financial reporting purposes differ principally due to wash sales and straddles.
The tax components of distributions paid during the fiscal year ended November 30, 2013, capital loss carryforward as of November 30, 2013 and tax basis post-October losses as of November 30, 2013, which are not being recognized for tax purposes until the first day of the following fiscal year are:
| | Ordinary | | Long-term | | Net capital | | |
| | income | | capital gains | | loss | | Post-October |
| | distributions | | distributions | | carryforward* | | Losses |
| LargeCap Fund | | | $ | 538,254 | | | | $ | – | | | | $ | 67,514,030 | | | $– |
| MidCap Fund | | | $ | – | | | | $ | 2,062,420 | | | | $ | – | | | $– |
| Bond Fund | | | $ | 57,322,991 | | | | $ | 2,353,544 | | | | $ | – | | | $– |
| * | The LargeCap Fund has capital losses in the amount of $19,758,747 and $47,755,283 which expire on November 30, 2016 and November 30, 2017, respectively. |
The tax components of distributions paid during the fiscal year ended November 30, 2012 are:
| | Ordinary | | Long-term |
| | income | | capital gains |
| | distributions | | distributions |
| LargeCap Fund | | | $ | 358,796 | | | | $ | – | |
| MidCap Fund | | | $ | 165,439 | | | | $ | 1,791,599 | |
| Bond Fund | | | $ | 31,793,469 | | | | $ | 1,478,148 | |
The following distributions were declared on December 18, 2013, payable to shareholders on December 19, 2013 (Unaudited):
| | Ordinary income | | Long-term capital gains |
| | distributions | | distributions |
| | Amount | | Per share | | Amount | | Per share |
| LargeCap Fund | | $ | 472,077 | | $0.18 | | $ | – | | | $ | – | |
| MidCap Fund | | $ | 246,171 | | $0.09 | | $ | 3,687,221 | | | $ | 1.38 | |
| Bond Fund | | $ | 27,152,350 | | $0.14 | | $ | 5,801,616 | | | $ | 0.03 | |
37
The following table presents information relating to a share of capital stock outstanding for the entire period.
| | Year Ended November 30, |
| | 2013 | | 2012 | | 2011 | | 2010 | | 2009 |
| LARGECAP FUND | | | | | | | | | | | | | | | |
| |
| Net Asset Value, Beginning of Period | | $34.27 | | | $30.07 | | | $29.20 | | | $27.04 | | | $19.75 | |
| Income from Investment Operations | | | | | | | | | | | | | | | |
| Net investment income | | 0.19 | | | 0.18 | | | 0.08 | | | 0.01 | | | 0.07 | |
| Net realized and unrealized gains | | | | | | | | | | | | | | | |
| on investments and options | | 12.20 | | | 4.13 | | | 0.80 | | | 2.20 | | | 7.51 | |
| Total from Investment Operations | | 12.39 | | | 4.31 | | | 0.88 | | | 2.21 | | | 7.58 | |
| Less Distributions | | | | | | | | | | | | | | | |
| Distributions from net investment income | | (0.19 | ) | | (0.11 | ) | | (0.01 | ) | | (0.05 | ) | | (0.29 | ) |
| Distributions from net realized gains | | – | | | – | | | – | | | – | | | – | |
| Total Distributions | | (0.19 | ) | | (0.11 | ) | | (0.01 | ) | | (0.05 | ) | | (0.29 | ) |
| |
| Net Asset Value, End of Period | | $46.47 | | | $34.27 | | | $30.07 | | | $29.20 | | | $27.04 | |
| |
| Total Return | | 36.33% | | | 14.37% | | | 3.02% | | | 8.17% | | | 38.88% | |
| |
| Ratios/Supplemental Data | | | | | | | | | | | | | | | |
| Net assets, end of period (millions) | | $124.8 | | | $99.6 | | | $104.1 | | | $125.8 | | | $144.1 | |
| Ratios to average net assets: | | | | | | | | | | | | | | | |
| Ratio of expenses | | 1.21% | | | 1.31% | | | 1.31% | | | 1.36% | | | 1.54% | |
| Ratio of expenses without reimbursement | | 1.22% | | | 1.31% | | | 1.31% | | | 1.36% | | | 1.54% | |
| Ratio of net investment income | | 0.46% | | | 0.47% | | | 0.24% | | | 0.05% | | | 0.32% | |
| Ratio of net investment income | | | | | | | | | | | | | | | |
| without reimbursement | | 0.45% | | | 0.47% | | | 0.24% | | | 0.05% | | | 0.32% | |
| Portfolio turnover rate | | 38% | | | 30% | | | 40% | | | 37% | | | 63% | |
See Notes to Financial Statements.
38
| FINANCIAL HIGHLIGHTS (Continued) |
| |
The following table presents information relating to a share of capital stock outstanding for the entire period.
| | Year Ended November 30, |
| | 2013 | | 2012 | | 2011 | | 2010 | | 2009 |
| MIDCAP FUND | | | | | | | | | | | | | | | |
| |
| Net Asset Value, Beginning of Period | | $11.28 | | | $11.15 | | | $11.36 | | | $9.39 | | | $6.18 | |
| Income from Investment Operations | | | | | | | | | | | | | | | |
| Net investment income | | – | | | – | | | – | | | – | | | 0.01 | |
| Net realized and unrealized gains | | | | | | | | | | | | | | | |
| on investments | | 3.71 | | | 1.38 | | | 0.44 | | | 2.02 | | | 3.25 | |
| Total from Investment Operations | | 3.71 | | | 1.38 | | | 0.44 | | | 2.02 | | | 3.26 | |
| Less Distributions | | | | | | | | | | | | | | | |
| Distributions from net investment income | | – | | | – | | | – | | | – | (a) | | (0.05 | ) |
| Distributions from net realized gains | | (0.95 | ) | | (1.25 | ) | | (0.65 | ) | | (0.05 | ) | | – | |
| Total Distributions | | (0.95 | ) | | (1.25 | ) | | (0.65 | ) | | (0.05 | ) | | (0.05 | ) |
| |
| Net Asset Value, End of Period | | $14.04 | | | $11.28 | | | $11.15 | | | $11.36 | | | $9.39 | |
| |
| Total Return | | 35.65% | | | 14.41% | | | 3.69% | | | 21.71% | | | 53.04% | |
| |
| Ratios/Supplemental Data | | | | | | | | | | | | | | | |
| Net assets, end of period (millions) | | $37.6 | | | $24.6 | | | $17.6 | | | $15.7 | | | $9.6 | |
| Ratios to average net assets: | | | | | | | | | | | | | | | |
| Ratio of expenses | | 1.30% | | | 1.30% | | | 1.30% | | | 1.30% | | | 1.30% | |
| Ratio of expenses without reimbursement | | 1.63% | | | 1.83% | | | 1.96% | | | 2.34% | | | 4.21% | |
| Ratio of net investment income (loss) | | (0.02% | ) | | (0.03% | ) | | (0.19% | ) | | (0.09% | ) | | 0.12% | |
| Ratio of net investment loss | | | | | | | | | | | | | | | |
| without reimbursement | | (0.35% | ) | | (0.56% | ) | | (0.85% | ) | | (1.14% | ) | | (2.79% | ) |
| Portfolio turnover rate | | 47% | | | 44% | | | 47% | | | 39% | | | 61% | |
(a) Less than .005 per share.
See Notes to Financial Statements.
39
| FINANCIAL HIGHLIGHTS (Continued) |
| |
The following table presents information relating to a share of capital stock outstanding for the entire period.
| | Year Ended November 30, |
| | 2013 | | 2012 | | 2011 | | 2010 | | 2009 |
| BOND FUND | | | | | | | | | | | | | | | |
| |
| Net Asset Value, Beginning of Period | | $11.95 | | | $11.33 | | | $11.54 | | | $11.16 | | | $9.24 | |
| Income from Investment Operations | | | | | | | | | | | | | | | |
| Net investment income | | 0.41 | | | 0.41 | | | 0.42 | | | 0.34 | | | 0.63 | |
| Net realized and unrealized gains (losses) | | | | | | | | | | | | | | | |
| on investments | | (0.03 | ) | | 0.67 | (a) | | (0.17 | )(a) | | 0.46 | (a) | | 2.01 | |
| Total from Investment Operations | | 0.38 | | | 1.08 | | | 0.25 | | | 0.80 | | | 2.64 | |
| Less Distributions | | | | | | | | | | | | | | | |
| Distributions from net investment income | | (0.40 | ) | | (0.43 | ) | | (0.40 | ) | | (0.34 | ) | | (0.72 | ) |
| Distributions from net realized gains | | (0.02 | ) | | (0.03 | ) | | (0.06 | ) | | (0.08 | ) | | – | |
| Total Distributions | | (0.42 | ) | | (0.46 | ) | | (0.46 | ) | | (0.42 | ) | | (0.72 | ) |
| |
| Net Asset Value, End of Period | | $11.91 | | | $11.95 | | | $11.33 | | | $11.54 | | | $11.16 | |
| |
| Total Return | | 3.24% | | | 9.70% | | | 2.16% | | | 7.33% | | | 30.05% | |
| |
| Ratios/Supplemental Data | | | | | | | | | | | | | | | |
| Net assets, end of period (millions) | | $2,252.1 | | | $1,292.3 | | | $656.0 | | | $437.5 | | | $134.2 | |
| Ratios to average net assets: | | | | | | | | | | | | | | | |
| Ratio of expenses | | 0.74% | | | 0.78% | | | 0.80% | | | 0.80% | | | 0.75% | |
| Ratio of expenses without reimbursement | | 0.74% | | | 0.78% | | | 0.84% | | | 0.87% | | | 1.20% | |
| Ratio of net investment income | | 3.73% | | | 3.90% | | | 3.89% | | | 3.52% | | | 6.40% | |
| Ratio of net investment income | | | | | | | | | | | | | | | |
| without reimbursement | | 3.73% | | | 3.90% | | | 3.86% | | | 3.44% | | | 5.95% | |
| Portfolio turnover rate | | 33% | | | 16% | | | 14% | | | 10% | | | 85% | |
| (a) | Realized and unrealized gains and losses per share are balancing amounts necessary to reconcile the change in net asset value per share in the period. It does not agree to the aggregate gains and losses in the Statement of Operations due to the fluctuation in share transactions. |
See Notes to Financial Statements.
40
REPORT OF INDEPENDENT REGISTERED PUBLIC ACCOUNTING FIRM
To the Shareholders and Board of Directors of
Thompson IM Funds, Inc.
We have audited the accompanying statements of assets and liabilities, including the schedules of investments, of Thompson IM Funds, Inc., comprising Thompson LargeCap Fund, Thompson MidCap Fund, and Thompson Bond Fund (the “Funds”) as of November 30, 2013, and the related statements of operations for the year then ended, the statements of changes in net assets for each of the two years in the period then ended, and the financial highlights for each of the four years in the period then ended. These financial statements and financial highlights are the responsibility of the Funds’ management. Our responsibility is to express an opinion on these financial statements and financial highlights based on our audits. The financial highlights for the year ended November 30, 2009, were audited by another independent registered public accounting firm, whose report dated January 22, 2010, expressed an unqualified opinion on those highlights.
We conducted our audits in accordance with the standards of the Public Company Accounting Oversight Board (United States). Those standards require that we plan and perform the audit to obtain reasonable assurance about whether the financial statements and financial highlights are free of material misstatement. An audit includes examining, on a test basis, evidence supporting the amounts and disclosures in the financial statements. Our procedures included confirmation of securities owned as of November 30, 2013, by correspondence with the custodian and brokers. An audit also includes assessing the accounting principles used and significant estimates made by management, as well as evaluating the overall financial statement presentation. We believe that our audits provide a reasonable basis for our opinion.
In our opinion, the financial statements and financial highlights referred to above present fairly, in all material respects, the financial position of each of the Funds constituting Thompson IM Funds, Inc. as of November 30, 2013, the results of their operations for the year then ended, the changes in their net assets for each of the two years in the period then ended, and the financial highlights for each of the four years in the period then ended, in conformity with accounting principles generally accepted in the United States of America.
 |
| COHEN FUND AUDIT SERVICES, LTD. |
| Cleveland, Ohio |
| January 21, 2014 |
41
| DIRECTORS AND OFFICERS (Unaudited) |
| (Information as of 12/31/13) |
| | Position(s) | | | | | | |
| | Held with | | | | Number of | | Other |
| | Thompson IM | | | | Thompson IM | | Directorships |
| | Funds, Inc. and | | Principal Occupation(s) | | Funds Overseen | | Held |
| Name and Age | | Length of Time Served(1) | | During Past Five Years | | by Director | | by Director |
| Independent Directors: |
| | | | | | | | | |
John W. Feldt
Birth date: 5/2/42 | | Chairman since
July 2012 Director since 1987 | | - Currently retired
- Senior Vice President of Finance of the University of Wisconsin Foundation from 1984 to 2006
- Former Vice President of Finance for the University of Wisconsin Foundation
| | 3 | | Baird Funds,
Inc.
(9 funds) |
| | | | | | | | | |
George E. Austin
Birth date: 9/15/52 | | Director since 2011 | | - President of AVA Civic Enterprises Inc. (consulting firm), since January 2011
- Director of W. Jerome Frautschi Foundation Inc. (private foundation), since December 2012; President from 1998 to December 2012
- Director of the Home Savings Bank since 1998
- Director of Overture Development Corporation (support organization for Overture Center Foundation), since 2001; President from 2001 to 2009
| | 3 | | None |
| | | | | | | | | |
Patricia Lipton
Birth date: 12/9/42 | | Director since 2007 | | - Currently retired
- Executive Director, State of Wisconsin Investment Board (“SWIB”) from 1989 to 2004
- Assistant Executive Director, SWIB from 1982 to 1989
- Former Director, State Tax Policy Bureau of the Wisconsin Department of Revenue
| | 3 | | None |
| |
Interested Directors and Officers: |
| | | | | | | | | |
John W. Thompson(2)
Birth date: 7/26/43 | | Director since 1987 Chairman from 1987 to
January 2009 Chief Executive Officer
since 2005 President since
January 2009 | | - President of Thompson Investment Management, Inc. (“TIM”) since 2004
- President of Thompson Plumb & Associates, Inc. (“TPA”) (investment advisor) from 1984 to 2003
- Treasurer of TPA from 1993 to 2003
- A Chartered Financial Analyst
| | 3 | | None |
| | | | | | | | | |
Jason L. Stephens(2)
Birth date: 10/15/74 | | Director since 2011 Vice President since
2009 Secretary from 2005 to
2010 | | - Chief Operating Officer of TIM since June 2009
- Corporate Secretary of TIM since 2004
- Portfolio Manager of TIM since 2007
- Research Analyst of TIM from 2004 to 2007
- Research Analyst of TPA from 2003 to 2003
- A Chartered Financial Analyst
| | 3 | | None |
| | | | | | | | |
42
| DIRECTORS AND OFFICERS (Unaudited) (Continued) |
| (Information as of 12/31/13) |
| | Position(s) | | | | | | |
| | Held with | | | | Number of | | Other |
| | Thompson IM | | | | Thompson IM | | Directorships |
| | Funds, Inc. and | | Principal Occupation(s) | | Funds Overseen | | Held |
| Name and Age | | Length of Time Served(1) | | During Past Five Years | | by Director | | by Director |
James T. Evans
Birth date: 6/6/75 | | Vice President since
2009 | | - Chief Investment Officer of TIM since June 2009
- Portfolio Manager of TIM since 2008
- Research Analyst of TIM from 2005 to 2008
- Managing Director of Nakoma Capital Management, from 2000 to 2005
- A Chartered Financial Analyst
| | N/A | | N/A |
| | | | | | | | | |
Penny M. Hubbard
Birth date: 6/2/61 | | Chief Financial Officer
and Treasurer since
2005 | | - Vice President - Administrative Services of TIM since 2004
- Assistant Vice President - Client Services of TPA and various other capacities 1984-2004
| | N/A | | N/A |
| | | | | | | | | |
Nedra S. Pierce
Birth date: 10/2/61 | | Chief Compliance
Officer since 2006 | | - Chief Compliance Officer of TIM since 2006
- Director of Business Development of TIM from 2004 to 2006 and since June 2010
- Director of Business Development of TPA from 1998 to 2003
| | N/A | | N/A |
| | | | | | | | | |
Lesley T. Bailey
Birth date: 9/30/78 | | Secretary since 2010 | | - Fund Accounting and Administration at TIM since 2004
- Fund Accounting and Administration at TPA from 2001 to 2004
| | N/A | | N/A |
| | | | | | | | | |
Sarah M. Baumgartner
Birth date: 2/21/84 | | Assistant Secretary
since 2012 | | - Fund Accounting and Administration at TIM since 2007
| | N/A | | N/A |
The address of each Director and officer as it relates to the Company’s business is 918 Deming Way, Madison WI 53717.
(1) Officers of the Investment Company serve one-year terms, subject to annual reappointment by the Board of Directors. Directors of the Investment Company serve a term of indefinite length until their resignation or removal, and stand for re-election by shareholders as and when required under the 1940 Act.
(2) John W. Thompson and Jason L. Stephens are “interested persons” of the Investment Company by virtue of their position with the Investment Company and TIM.
43
| ADDITIONAL INFORMATION (Unaudited) |
| |
| THOMPSON IM FUNDS |
| |
| INVESTMENT ADVISOR |
| Thompson Investment Management, Inc. |
| 918 Deming Way |
| Madison, Wisconsin 53717 |
| |
| DISTRIBUTOR |
| Quasar Distributors, LLC |
| 615 East Michigan Street |
| Milwaukee, Wisconsin 53202 |
| |
| TRANSFER AGENT |
| U.S. Bancorp Fund Services, LLC |
| 615 East Michigan Street |
| Milwaukee, Wisconsin 53202 |
| |
| INDEPENDENT REGISTERED |
| PUBLIC ACCOUNTING FIRM |
| Cohen Fund Audit Services, Ltd. |
| 1350 Euclid Avenue, Suite 800 |
| Cleveland, OH 44115 |
| |
| LEGAL COUNSEL |
| Quarles & Brady LLP |
| 411 East Wisconsin Avenue |
| Milwaukee, Wisconsin 53202 |
The Statement of Additional Information contains additional information about the directors and officers of Thompson IM Funds, Inc. and is available without charge, upon request, by calling 1-800-999-0887.
Proxy Voting Policy
A description of the policies and procedures that the Funds use to determine how to vote proxies relating to portfolio securities and information regarding how the Funds actually voted proxies during the most recent 12-month period ended June 30 are available without charge, upon request, by calling 1-800-999-0887, through the Funds’ website at www.thompsonim.com and on the SEC’s website at www.sec.gov.
Information About Portfolio Securities
The Funds file complete schedules of their portfolio holdings with the Securities and Exchange Commission for the Funds’ first and third quarters of its fiscal year on Form N-Q. The Funds’ Forms N-Q are available on the Securities and Exchange Commission’s website at www.sec.gov. You may also review and copy those documents by visiting the Securities and Exchange Commission’s Public Reference Room in Washington, D.C. Information on the operation of the Public Reference Room may be obtained by calling the Securities and Exchange Commission at 1-800-SEC-0330. The Funds’ Forms N-Q are also available without charge, upon request, by calling 1-800-999-0887.
44
| ADDITIONAL INFORMATION (Unaudited) (Continued) |
| |
Board Approval of Investment Advisory Agreement
The Investment Company Act of 1940 (the “Act”) requires that the Investment Advisory Agreement (the “Agreement”) for Thompson IM Funds, Inc. (the “Funds”) be approved annually by a vote of a majority of the Board of Directors, including a majority of the Directors who are not parties to the Agreement or “interested persons” of the Funds as that term is defined in the Act (the “Independent Directors”). At its meeting on November 7, 2013, the Board of Directors of the Funds, including all of the Independent Directors, voted unanimously to renew the existing Agreement between the Funds and Thompson Investment Management, Inc. (the “Advisor”) for each of the LargeCap Fund, the MidCap Fund and the Bond Fund (each of these series of the Funds is sometimes referred to as a “Fund” in this section).
The Board’s approval was based on its consideration and evaluation of a variety of factors, including: (1) the nature, extent, and quality of the services provided by the Advisor; (2) the performance of each of the Funds in comparison to its benchmark index and to a peer group of mutual funds; (3) the management fees and total operating expenses of each Fund, including comparative information with respect to a peer group of mutual funds and with fees charged by the Advisor to other clients whose assets are managed under similar objectives and strategies; (4) the extent to which economies of scale may be realized as a Fund grows; and (5) whether fee levels reflect any potential economies of scale for the benefit of shareholders.
In connection with the renewal process, both the Independent Directors as well as the full Board met separately in person on November 7, 2013, and the full Board met by telephone on October 25, 2013, to consider information relevant to the renewal process. The Independent Directors and the full Board are referred to collectively as the “Board” in this section.
To facilitate evaluation of the Agreement, the Board received and reviewed information prepared or compiled by the Advisor as well as an independent analysis of each Fund’s performance, expenses, and profitability prepared by Lipper Inc. (“Lipper”). Information reviewed included a memorandum from Fund counsel discussing the fiduciary duty of Directors under Section 15(c) of the Act; an executive summary and memorandum from Fund management providing its recommendation for renewal of the Agreement; the Advisor’s analysis of profitability of the Agreement to the Advisor and the profitability of related service contracts with the Advisor; a separate profitability comparison prepared by Lipper; a detailed statistical report from Lipper comparing each Fund’s respective performance and expenses with both a comparison “group” and a comparison “universe” of other funds; information regarding the composition of and fees charged for standardized investment products offered to separately managed account clients of the Advisor; the Advisor’s Form ADV which, among other things, showed fees charged by the Advisor to manage the investments of other clients with objectives and programs similar to the Funds; the Agreement and other service agreements with the Advisor; and background information on the Funds’ portfolio managers and reports from the Funds’ Chief Compliance Officer. In addition, the Board had received and considered detailed information on the Funds’ investment performance and expenses at each of its quarterly meetings during the year as well as in-person reports from the Fund’s portfolio managers and reports from the Funds’ Chief Compliance Officer. Throughout the review and approval process, the Independent Directors were represented by independent legal counsel.
The Board considered the nature, extent, and quality of services provided by the Advisor, including services required to be provided under the Agreement, services required to be provided under other agreements with the Advisor and with affiliates of the Advisor, and additional services provided by the Advisor that were not required under any of those agreements. The Board considered the background and experience of the Funds’ portfolio managers, other advisory personnel, compliance personnel, and other support personnel. It noted that in addition to considering these factors at this meeting, it had also considered many of these factors during the course of its quarterly meetings over the past year as well as at its October 25 special telephonic meeting. The Board noted that, in addition to investment management and broker-selection services, the Advisor prepares compliance and other materials for each of the Board’s meetings; provides office space, equipment, information technology and administrative services necessary for operation of the Funds; and performs regular compliance and risk analysis functions for the Funds. The Board believed that the nature, extent, and quality of services provided by the Advisor were comparable to those provided by advisors to comparable funds and that such services were adequate for the Funds’ needs.
In reviewing the investment performance of each of the Funds, the Board reviewed the one-, two-, three-, four-, five- and ten-year and life-of-fund performances of the Bond Fund and LargeCap Fund and the one-, two-, three-, four-, and five-year and life-of-fund performances of the MidCap Fund. The MidCap Fund commenced operations on March 31, 2008, so only approximately five years of performance information was available for that Fund.
The Board noted that the Bond Fund ranked in the top 20 percent of its comparison group and its comparison universe over each period. The Board further noted that the Bond Fund had outperformed its benchmark index for the one-, three-, five-, and ten-year periods.
The Board observed that the investment performance of the LargeCap Fund during the periods being compared had markedly improved in more recent periods relative to the median performance of its comparison group and comparison universe, with the Fund in the first and second quintiles of its comparison group for the one- and three-year periods, respectively; however, the LargeCap Fund had
45
| ADDITIONAL INFORMATION (Unaudited) (Continued) |
| |
underperformed its benchmark index for the five- and ten-year periods. The Board noted that adjustments to the security and sector weightings in the Fund taken over the past several years to align the Fund more closely with its benchmark were continuing to achieve their intended effect of reducing volatility and thereby reducing the risk of significantly underperforming the Fund’s benchmark. The Board observed that based on the Fund’s above-median performance during the past one- and three-year periods, the LargeCap Fund’s relative performance continued to trend in a positive direction.
The performance of the MidCap Fund ranked in the top 40 percent of the Fund’s Lipper comparison group for the three-year period and in the top 20 percent of both the Fund’s Lipper comparison group and its comparison universe for the one- and five-year and life-of-fund periods. The Fund ranked above the median of its comparison universe for the two- and three-year periods. The Board further noted that the MidCap Fund had outperformed its benchmark index for the one-year, five-year, and life-of-fund periods.
After considering the performances of the Bond Fund, LargeCap Fund and MidCap Fund, the Board determined that relative to the performances of comparable funds and to each Fund’s benchmark index, the performance of the Bond Fund was exceptional and that the performance of the MidCap Fund and LargeCap Fund was acceptable.
In reviewing the cost of services provided to the Funds and profits realized by the Advisor from these relationships, the Board compared information relating to the various management fees charged to separately managed accounts of the Advisor that have relatively analogous investment objectives as those of a Fund. Among the information reviewed by the Board was information relating to standardized investment products offered to separately managed account clients of the Advisor. The Board determined that these standardized products in most instances had investment objectives and styles that were sufficiently different from the investment objectives and styles of any of the Funds so as to make the comparison inapt. With respect to those standardized products available to separately managed account clients of the Advisor that the Board determined to be sufficiently similar in investment objective and strategy to a Fund to be relevant for comparative purposes, the Board determined that in light of the significantly different level of services and resources required for the management of these products and the Funds, the management fees charged by the Advisor with respect to each of the Funds were reasonable relative to the management fees charged by the Advisor with respect to the relevant standardized separately managed account product.
The Board noted that the Bond Fund’s contractual management fee was the highest of its Lipper comparison group and comparison universe. The Board also noted, however, that the Fund’s total expense ratio was below the median of its Lipper comparison group and in the top 60 percent of its comparison group, which the Board determined was reasonable.
The information provided by Lipper indicated that the advisory fees and total expense ratio of the LargeCap Fund were one of the highest in both the Fund’s Lipper comparison group and its comparison universe. The Board, however, observed that the Advisor was proposing a more substantial fee waiver that would create a ceiling on the maximum total expense ratio that the Fund could incur at 1.15 percent of average daily net assets of the Fund. The Board noted that if this fee waiver had been in place during the prior year, the Fund’s total expense ratio would have been in the third quintile of its Lipper comparison group. The Board also noted that the recent growth in total assets invested across the Funds could have the effect of reducing non-management expenses further, whereas these non-management expenses were currently above the median of the Fund’s comparison group and its comparison universe. After taking into account all of these considerations, the Board determined that the management fee and total expense ratio of the LargeCap Fund were reasonable.
The Board noted that the MidCap Fund’s contractual management fee, after waiver of a portion thereof by the Advisor, ranked in the top 40 percent of lowest management fees of funds in the MidCap Fund’s Lipper comparison group while ranking in the top 20 percent of its comparison universe. The Board noted that the non-management expense ratio of the Fund continued to be one of the highest in the Fund’s Lipper comparison group and comparison universe, and considered the reasons why this was the case. The Board observed that, given the relatively low level of assets in the Fund, the opportunity existed for non-management expenses to decline as the MidCap Fund grows in assets, thereby having a decreasing impact on the Fund’s total expenses. The Board observed that the actual total expense ratio of the Fund, despite the Fund’s relatively high non-management expenses, was lower than the median actual total expense ratio for funds in the Fund’s comparison group while falling in the top 80 percent for funds in the Fund’s comparison universe, which the Board believed was reasonable.
With regard to profitability, the Board noted that the Advisor’s pre-tax profitability, both before and after accounting for marketing fees borne by the Advisor, ranked near the median for comparable firms. The Board further determined that the operating margins of the Advisor were reasonable. After reviewing information provided by Lipper and reviewing the Advisor’s own analysis, the Board concluded that the cost of services provided by the Advisor and its affiliates to the Funds and the profits realized with respect thereto were reasonable.
46
| ADDITIONAL INFORMATION (Unaudited) (Continued) |
| |
The Board also considered whether economies of scale might be realized as the Funds’ assets increase. It noted that the Agreement provides for a fee breakpoint at $50 million of assets. This breakpoint is equal to ten basis points for the LargeCap Fund and MidCap Fund and five basis points for the Bond Fund. The Board considered that an increase in assets could provide economies of scale in the Funds’ operations. However, it noted that the level of assets of the LargeCap Fund presented no opportunity for such economies. The Board noted that the MidCap Fund continued to lack scale in comparison to other funds having similar investment objectives. Therefore the Board concluded that the MidCap Fund was unlikely to realize material economies of scale until its assets grew significantly. The Board noted that the Bond Fund had continued to grow significantly over the past year and that opportunities for economies of scale were becoming more likely, although the Board determined that the Bond Fund had not yet reached a point where the Fund was realizing any material economies of scale.
47
Item 2. Code of Ethics.
As of the end of the period covered by this report on Form N-CSR, the Registrant has adopted a Code of Ethics (as defined in Item 2(b) of Form N-CSR) that applies to the Registrant’s principal executive officer, principal financial officer and principal accounting officer. The Registrant’s Code of Ethics (as defined in Item 2(b) of Form N-CSR) and any amendments or waivers thereto are available on the Registrant’s website at www.thompsonim.com.
Item 3. Audit Committee Financial Expert.
The Registrant’s Board of Directors has determined that the Registrant has at least one audit committee financial expert serving on its audit committee. John Feldt, a director of the Registrant since 1987, has been determined to be an audit committee financial expert and is “independent” within the meaning of Item 3(a)(2) of Form N-CSR. Mr. Feldt, currently retired, was the Senior Vice President-Finance for the University of Wisconsin Foundation from 1984 through 2006. In such capacity, he oversaw the investment and accounting functions for the Foundation. These duties required Mr. Feldt to supervise the Foundation’s controller and approve the Foundation’s accounting and audit information.
Item 4. Principal Accountant Fees and Services.
The following table sets forth information as to the fees billed to the Registrant for each of the last two fiscal years for audit-related, tax and other services and products provided by Cohen Fund Audit Services, Ltd, the Registrant’s principal accountant.
| | Fiscal Year Ended November 30, |
| | | 2012 | | | | 2013 | |
| Audit Fees(1) | | | $ | 34,500.00 | | | | $ | 36,000.00 | |
| Audit-Related Fees(2) | | | $ | 0.00 | | | | $ | 0.00 | |
| Tax Fees(3) | | | $ | 9,000.00 | | | | $ | 9,000.00 | |
| All Other Fees(4) | | | $ | 0.00 | | | | $ | 0.00 | |
| TOTAL | | | $ | 43,500.00 | | | | $ | 45,000.00 | |
____________________
| (1) | | This category relates to professional services rendered by the principal accountant for the audit of the Registrant's annual financial statements or services that are normally provided by the accountant in connection with statutory and regulatory filings or engagements for those fiscal years. |
| |
| (2) | | This category relates to assurance and related services by the principal accountant that are reasonably related to the performance of the audit of the Registrant's financial statements and are not reported under "Audit Fees" above. |
| |
| (3) | | This category relates to professional services rendered by the principal accountant for tax compliance, tax advice and tax planning. For 2012 and 2013, the tax services provided by the Registrant’s principal accountant specifically related to the preparation of the Registrant’s federal and state income and excise tax returns and a review of the Registrant’s distributions of capital gains and dividend and interest income. |
| | |
| (4) | | This category relates to products and services provided by the principal accountant other than those reported under "Audit Fees," "Audit-Related Fees," and "Tax Fees" above. |
2
Cohen Fund Audit Services, Ltd. did not bill any amounts over the last two fiscal years for services or products provided to Thompson Investment Management, Inc., the Registrant's investment advisor, or any entity controlling, controlled by or under common control with such advisor that provides ongoing services for the Registrant.
The audit committee of the Registrant’s Board of Directors has not adopted any pre-approval policies and procedures (as described in paragraph (c)(7) of Rule 2-01 of Regulation S-X) regarding the provision of audit or non-audit services to the Registrant.
No services described in paragraphs (b)-(d) of this Item were approved by the audit committee pursuant to paragraph (c)(7)(i)(C) of Rule 2-01 of Regulation S-X.
Item 5. Audit Committee of Listed Registrants.
Not applicable to this Registrant because it is not a “listed issuer” within the meaning of Rule 10A-3 under the Securities Exchange Act of 1934.
Item 6. Investments.
The required Schedules of Investments in securities of unaffiliated issuers is included as part of the Registrant’s Annual Report to shareholders dated as of November 30, 2013 provided under Item 1 of this Form N-CSR.
Item 7. Disclosure of Proxy Voting Policies and Procedures for Closed-End Management Investment Companies
Not applicable to this Registrant because it is not a closed-end management investment company.
Item 8. Portfolio Managers of Closed-End Management Investment Companies.
Not applicable to this Registrant because it is not a closed-end management investment company.
Item 9. Purchases of Equity Securities by Closed-End Management Investment Companies and Affiliated Purchasers.
Not applicable to this Registrant because it is not a closed-end management investment company.
Item 10. Submission of Matters to a Vote of Securities Holders.
The Registrant has not made any material changes to the procedures by which shareholders may recommend nominees to the Registrant's Board of Directors after the Registrant last provided disclosure in response to the requirements of Item 407(c)(2)(iv) of Regulation S-K or this Item.
3
Item 11. Controls and Procedures.
| | (a) | | Disclosure Controls and Procedures. Based on an evaluation of the Registrant’s disclosure controls and procedures (as defined in Rule 30a-3(c) under the Investment Company Act of 1940) carried out under the supervision and with the participation of the Registrant’s management, including its principal executive and financial officers, within 90 days prior to the filing date of this report on Form N-CSR, the Registrant’s principal executive and financial officers have concluded that the design and operation of the Registrant’s disclosure controls and procedures are effective in providing reasonable assurance that the information required to be disclosed on Form N-CSR is recorded, processed, summarized and reported within the applicable time periods. |
| |
| (b) | | Change in Internal Controls Over Financial Reporting. There were no changes in the Registrant’s internal control over financial reporting (as defined in Rule 30a-3(d) under the Investment Company Act of 1940) that occurred during the Registrant’s second fiscal quarter of the period covered by this Form N-CSR that have materially affected, or are reasonably likely to materially affect, the Registrant’s internal control over financial reporting. |
Item 12. Exhibits
The following exhibits are attached to this Form N-CSR:
| Exhibit No. | | Description of Exhibit | |
| 12(a)(1) | | The Code of Ethics for the Registrant’s Principal Executive Officer, Principal Financial Officer and Principal Accounting Officer referred to in Item 2 was filed as Exhibit 12(a)(1) to the Registrant’s Certified Shareholder Report on Form N-CSR filed on January 28, 2005, and is incorporated herein by reference |
| | | | |
| 12(a)(2)-1 | | Certification of Principal Executive Officer Required by Section 302 of the Sarbanes-Oxley Act of 2002 |
| | | |
| 12(a)(2)-2 | | Certification of Principal Financial Officer Required by Section 302 of the Sarbanes-Oxley Act of 2002 |
| | | |
| 12(b) | | Certification of Chief Executive Officer and Chief Financial Officer Required by Section 906 of the Sarbanes-Oxley Act of 2002 |
4
SIGNATURES
Pursuant to the requirements of the Securities Exchange Act of 1934 and the Investment Company Act of 1940, the Registrant has duly caused this report to be signed on its behalf by the undersigned, thereunto duly authorized, on this 21st day of January, 2014.
| THOMPSON IM FUNDS, INC. |
| |
| By: | | /s/ John W. Thompson |
| | John W. Thompson, Chief Executive |
| | Officer and President |
Pursuant to the requirements of the Securities Exchange Act of 1934 and the Investment Company Act of 1940, this report has been signed below by the following persons on behalf of the Registrant and in the capacities indicated on this 21st day of January, 2014.
| By: | | /s/ John W. Thompson |
| | | John W. Thompson, Chief Executive |
| | Officer and President (Principal |
| | Executive Officer) |
| |
| By: | | /s/ Penny Hubbard |
| | Penny Hubbard, Chief Financial |
| | Officer (Principal Financial Officer) |
5