UNITED STATES
SECURITIES AND EXCHANGE COMMISSION
Washington, D.C. 20549
FORM N-CSR
CERTIFIED SHAREHOLDER REPORT OF REGISTERED
MANAGEMENT
INVESTMENT COMPANIES
Investment Company Act File Number 811-4946
THOMPSON IM FUNDS, INC.
(Exact name of registrant as specified in charter)
918 Deming Way
Madison, Wisconsin 53717
(Address of principal executive offices)--(Zip code)
Jason L. Stephens
Chief Executive Officer
Thompson IM Funds, Inc.
918 Deming Way
Madison, Wisconsin 53717
(Name and address of agent for service)
With a copy to:
Matthew C. Vogel, Esq.
Quarles & Brady LLP
411 East Wisconsin Avenue
Milwaukee, Wisconsin 53202
Registrant's telephone number, including area code: (608) 827-5700
Date of fiscal year end: November 30, 2018
Date of reporting period: November 30, 2018
Form N-CSR is to be used by management investment companies to file reports with the Commission not later than 10 days after the transmission to stockholders of any report that is required to be transmitted to stockholders under Rule 30e-1 under the Investment Company Act of 1940 (17 CFR 270.30e-1). The Commission may use the information provided on Form N-CSR in its regulatory, disclosure review, inspection and policymaking roles.
A registrant is required to disclose the information specified by Form N-CSR, and the Commission will make this information public. A registrant is not required to respond to the collection of information contained in Form N-CSR unless the Form displays a currently valid Office of Management and Budget ("OMB") control number. Please direct comments concerning the accuracy of the information collection burden estimate and any suggestions for reducing the burden to Secretary, Securities and Exchange Commission, 450 Fifth Street, N.W., Washington, DC 20549-0609. The OMB has reviewed this collection of information under the clearance requirements of 44 U.S.C. § 3507.
Item 1. Report to Stockholders.
THOMPSON IM FUNDS, INC.
ANNUAL REPORT TO SHAREHOLDERS
NOTE ON FORWARD-LOOKING STATEMENTS
The matters discussed in this report may constitute forward-looking statements. These include any Advisor or portfolio manager predictions, assessments, analyses or outlooks for individual securities, industries, investment styles, market sectors, interest rates, economic trends and/or markets. These statements involve risks and uncertainties. In addition to the general risks described for each Fund in its current Prospectus, other factors bearing on these reports include the accuracy of the Advisor’s or portfolio manager’s forecasts and predictions, the appropriateness of the investment strategies designed by the Advisor or portfolio manager and the ability of the Advisor or portfolio manager to implement its strategies efficiently and successfully. Any one or more of these factors, as well as other risks affecting the securities markets generally, could cause the actual results of any Fund to differ materially as compared to its benchmarks.
THOMPSON IM FUNDS, INC.
ANNUAL REPORT TO SHAREHOLDERS
November 30, 2018
CONTENTS
| | | Page(s) |
| LargeCap Fund | | |
| Investment review | | 2-4 |
| Schedule of investments | | 5-8 |
| |
| MidCap Fund | | |
| Investment review | | 9-11 |
| Schedule of investments | | 12-15 |
| |
| Bond Fund | | |
| Investment review | | 16-18 |
| Schedule of investments | | 19-33 |
| |
| Fund Expense Examples | | 34 |
| |
| Financial Statements | | |
| Statements of assets and liabilities | | 35 |
| Statements of operations | | 36 |
| Statements of changes in net assets | | 37 |
| Notes to financial statements | | 38-44 |
| Financial highlights | | 45-47 |
| |
| Report of Independent Registered Public Accounting Firm | | 48 |
| |
| Directors and Officers | | 49-50 |
| |
| Additional Information | | 51-54 |
This report contains information for existing shareholders of Thompson IM Funds, Inc. It
does not constitute an offer to sell. This Annual Report is authorized for distribution to prospective investors
only when preceded or accompanied by a Fund Prospectus, which contains information about
the Funds’ objectives and policies, risks, management, expenses and other information.
A Prospectus can be obtained by calling 1-800-999-0887.
Please read your Prospectus carefully.
1
| LARGECAP FUND INVESTMENT REVIEW(Unaudited) |
| November 30, 2018 |
Portfolio Managers
James T. Evans, CFA
Jason L. Stephens, CFA
Performance
The LargeCap Fund produced a total return of 1.72% for the fiscal year ended November 30, 2018, as compared to its benchmark, the S&P 500 Index, which returned 6.27%.
| Comparison of Change in Value of a Hypothetical $10,000 Investment |
 |
| Average Annual Total Returns |
| Through 11/30/18 |
| | 1 Year | | 3 Year | | 5 Year | | 10 Year |
| Thompson LargeCap Fund | | 1.72% | | 10.23% | | 8.08% | | 13.54% |
| S&P 500 Index | | 6.27% | | 12.16% | | 11.12% | | 14.32% |
Gross Expense Ratio as of 03/31/18 was 1.22%.
Net Expense Ratio after reimbursement as of 12/01/18 was 1.03%.*
| * | The Advisor has contractually agreed to waive management fees and/or reimburse expenses incurred by the LargeCap Fund through March 31, 2020, so that the annual operating expenses of the Fund do not exceed 1.03% of its average daily net assets. Net expense ratios are current as of the most recent Prospectus and are applicable to investors. |
Performance data quoted represents past performance; past performance does not guarantee future results. The investment return and principal value of an investment will fluctuate so that an investor’s shares, when redeemed, may be worth more or less than their original cost. Current performance of the Fund may be lower or higher than the performance quoted. Performance data current to the most recent month-end may be obtained by calling 1-800-999-0887 or visiting www.thompsonim.com.
Results include the reinvestment of all dividends and capital gains distributions. Investment performance reflects all fee waivers that may be in effect. In the absence of such waivers, total return would be reduced. The performance information reflected in the graph and the table above does not reflect the deduction of taxes that a shareholder would pay on fund distributions or the redemption of fund shares, nor does it imply future performance. The S&P 500 Index is an unmanaged index commonly used to measure the performance of U.S. stocks. You cannot directly invest in an index.
The S&P 500 Index is a product of S&P Dow Jones Indices LLC and has been licensed for use by Thompson Investment Management, Inc. S&P®and S&P 500®are registered trademarks of Standard & Poor’s Financial Services LLC (“S&P”). The Thompson IM Funds are not sponsored, endorsed, sold or promoted by S&P Dow Jones Indices LLC, Dow Jones, S&P or their respective affiliates, and none of S&P Dow Jones Indices LLC, Dow Jones, S&P nor their respective affiliates makes any representation regarding the advisability of investing in such products.
See Notes to Financial Statements.
2
| LARGECAP FUND INVESTMENT REVIEW(Unaudited) (Continued) |
| November 30, 2018 |
Management Commentary
The Fund’s lag relative to its benchmark for the fiscal year was primarily driven by underperformance in the Consumer Discretionary, Financial and Industrial sectors. While some of the discrepancy can be attributed to poor security selection, we believe that a broader trend was at play. Specifically, one segment of the market seemed to be discounting the possibility of an impending recession while another did not. Many of the Fund’s holdings recorded record earnings during the year, yet their stock prices remain mired in a sideways or worse pattern. In other words, the market appeared to be assuming said earnings will not be sustainable. Short of a recession, we do not believe this to be the case.
We’ve seen this divergence between growth and value stocks before, but the differential over recent time periods has been particularly acute. In fact, the S&P 500 Growth Index outperformed the S&P 500 Value Index by 7.8% during the fiscal year and by 22.45% over the previous two fiscal years. While our “Growth at a Reasonable Price” strategy generally leads us to invest in a blend of growth and value stocks, over different points in the economic cycle the Fund typically drifts more in one direction or the other. Coming out of the financial crisis, many great companies saw their stock prices depressed notwithstanding their growth prospects. Thus, the Fund tilted slightly to the growth side at the time based on the abundance of attractive opportunities we found. In the last few years we have tilted more towards the value side, as many of the best growth companies appreciated to what we believed were unrealistic earnings multiples and were in our opinion no longer attractive.
Even though our current value bias has cost the Fund relative performance over the past fiscal year, we believe it remains the best option for shareholders going forward based on the existing set of opportunities. Many quality firms with strong free cash flow and growing earnings have been trading at a discount to the S&P 500 index’s price-to-earnings (P/E) ratio. While a few of these firms may ultimately turn out to be unforeseen value traps, our view is that the majority should prosper as long as the economy can avoid a recession. If our belief that a recession is not imminent proves to be false, we expect the high-flying growth names that have led the market will likely suffer the greatest relative hit to their stock prices. Either way, it suggests to us that the current fund positioning is the best one for shareholders going forward.
Opinions expressed are subject to change, are not guaranteed and should not be considered investment advice.
Mutual fund investing involves risk. Principal loss is possible. Investments in smaller companies involve additional risks such as limited liquidity and greater volatility. Investments in American Depositary Receipts (“ADRs”) are subject to some extent to the risks associated with directly investing in securities of foreign issuers, including the risk of changes in currency exchange rates, expropriation or nationalization of assets, and the impact of political, diplomatic, or social events. Investments in real estate securities may involve greater risk and volatility including greater exposure to economic downturns and changes in real estate values, rents, property taxes, and tax and other laws. A real estate investment trust’s (REIT’s) share price may decline because of adverse developments affecting the real estate industry.
Please refer to the Schedule of Investments on page 5 of this report for holdings information. The management commentary above as well as Fund holdings and asset/sector allocations should not be considered a recommendation to buy or sell any security. In addition, please note that Fund holdings and asset/sector allocations are subject to change.
Free Cash Flow is a measure of financial performance calculated as operating cash flow minus capital expenditures. Free cash flow (FCF) represents the cash that a company is able to generate after laying out the money required to maintain or expand its asset base.
Price-To-Earnings (P/E) Ratio is a valuation ratio of a company’s current share price compared to its per-share earnings. Divide market value of a share by the earnings per share.
S&P 500 Growth Index is a market capitalization weighted index. It consists of stocks within the S&P 500 Index that exhibit strong growth characteristics - sales growth, the ratio of earnings change to price, and momentum.
S&P 500 Value Index is a market capitalization weighted index. It consists of stocks within the S&P 500 Index that exhibit strong value characteristics - the ratios of book value, earnings, and sales to price.
Earnings Growth is a measure of growth in a company’s net income over a specific period, often one year. It is not a prediction of the Fund’s future returns.
See Notes to Financial Statements.
3
| LARGECAP FUND INVESTMENT REVIEW(Unaudited) (Continued) |
| November 30, 2018 |
| Sector Weightings at 11/30/18 |
| % of Total Investments |
| |

|
| Top 10 Equity Holdings at 11/30/18 |
| | | | % of Fund’s |
| Company | | Industry | | Net Assets |
| Alphabet, Inc. Class A | | Interactive Media & Services | | 3.26% |
| Microsoft Corp. | | Software | | 2.99% |
| Exxon Mobil Corp. | | Oil, Gas & Consumable Fuels | | 2.49% |
| The Walt Disney Co. | | Entertainment | | 2.36% |
| Hanger, Inc. | | Health Care Providers & Services | | 2.30% |
| Bank of America Corp. | | Banks | | 2.27% |
| CBS Corp. Class B | | Media | | 2.27% |
| JPMorgan Chase & Co. | | Banks | | 2.10% |
| Cisco Systems, Inc. | | Communications Equipment | | 2.06% |
| Pfizer Inc. | | Pharmaceuticals | | 2.01% |
As of November 30, 2018, 99.8% of the Fund’s net assets were in equity and short-term investments.
See Notes to Financial Statements.
4
| LARGECAP FUND SCHEDULE OF INVESTMENTS |
| November 30, 2018 |
| | Shares | | Value |
| COMMON STOCKS - 99.7% | | | | $121,374,631 |
| (COST $126,080,464) | | | | |
| |
| Communication Services - 10.6% | | | | 12,903,114 |
| Entertainment - 3.3% | | | | |
| The Walt Disney Co. | | 24,850 | | 2,869,926 |
| Viacom Inc. Class B | | 37,775 | | 1,165,737 |
| Interactive Media & Services - 5.0% | | | | |
| Alphabet Inc. Class A (a) | | 3,575 | | 3,966,999 |
| Facebook, Inc. Class A (a) | | 15,200 | | 2,137,272 |
| Media - 2.3% | | | | |
| CBS Corp. Class B | | 51,000 | | 2,763,180 |
| |
| Consumer Discretionary - 11.1% | | | | 13,544,888 |
| Automobiles - 1.0% | | | | |
| Harley-Davidson, Inc. | | 28,400 | | 1,201,036 |
| Distributors - 1.0% | | | | |
| LKQ Corp. (a) | | 45,225 | | 1,259,064 |
| Hotels, Restaurants & Leisure - 1.4% | | | | |
| Starbucks Corp. | | 25,975 | | 1,733,052 |
| Household Durables - 1.1% | | | | |
| TopBuild Corp. (a) | | 26,352 | | 1,342,634 |
| Internet & Direct Marketing Retail - 2.0% | | | | |
| eBay Inc. (a) | | 81,895 | | 2,444,566 |
| Leisure Products - 0.9% | | | | |
| Brunswick Corp. | | 19,700 | | 1,044,888 |
| Multiline Retail - 0.8% | | | | |
| Target Corp. | | 14,060 | | 997,698 |
| Specialty Retail - 1.9% | | | | |
| Bed Bath & Beyond Inc. | | 82,600 | | 1,063,888 |
| Lumber Liquidators Holdings, Inc. (a) | | 100,175 | | 1,265,210 |
| Textiles, Apparel & Luxury Goods - 1.0% | | | | |
| Hanesbrands, Inc. | | 74,975 | | 1,192,852 |
| |
| Consumer Staples - 4.3% | | | | 5,188,435 |
| Food & Staples Retailing - 2.0% | | | | |
| Walgreens Boots Alliance, Inc. | | 28,825 | | 2,440,613 |
| Household Products - 2.3% | | | | |
| Kimberly-Clark Corp. | | 13,168 | | 1,519,192 |
| The Procter & Gamble Co. | | 13,000 | | 1,228,630 |
| |
| Energy - 6.8% | | | | 8,308,116 |
| Energy Equipment & Services - 0.9% | | | | |
| Schlumberger Ltd. | | 24,144 | | 1,088,894 |
| Oil, Gas & Consumable Fuels - 5.9% | | | | |
| Chevron Corp. | | 10,170 | | 1,209,620 |
| Devon Energy Corp. | | 45,025 | | 1,217,026 |
| EOG Resources, Inc. | | 8,500 | | 878,135 |
| Exxon Mobil Corp. | | 38,070 | | 3,026,565 |
| Noble Energy, Inc. | | 37,400 | | 887,876 |
See Notes to Financial Statements.
5
| LARGECAP FUND SCHEDULE OF INVESTMENTS(Continued) |
| November 30, 2018 |
| | Shares | | Value |
| COMMON STOCKS(continued) | | | | |
| |
| Financials - 15.2% | | | | $18,459,562 |
| Banks - 9.5% | | | | |
| Bank of America Corp. | | 97,500 | | 2,769,000 |
| CIT Group Inc. | | 32,275 | | 1,498,528 |
| Citigroup Inc. | | 37,530 | | 2,431,569 |
| JPMorgan Chase & Co. | | 22,955 | | 2,552,366 |
| PNC Financial Services Group, Inc. | | 6,795 | | 922,625 |
| SunTrust Banks, Inc. | | 10,450 | | 655,111 |
| Zions Bancorporation, N.A. | | 14,525 | | 706,787 |
| Capital Markets - 4.2% | | | | |
| Northern Trust Corp. | | 18,635 | | 1,849,151 |
| State Street Corp. | | 30,225 | | 2,207,029 |
| The Goldman Sachs Group, Inc. | | 5,550 | | 1,058,330 |
| Consumer Finance - 0.5% | | | | |
| Discover Financial Services | | 8,820 | | 628,866 |
| Insurance - 1.0% | | | | |
| Fidelity National Financial, Inc. | | 35,125 | | 1,180,200 |
| |
| Health Care - 20.4% | | | | 24,744,034 |
| Biotechnology - 6.8% | | | | |
| AbbVie Inc. | | 21,525 | | 2,029,162 |
| Amgen Inc. | | 5,975 | | 1,244,294 |
| Celgene Corp. (a) | | 32,875 | | 2,374,232 |
| Exact Sciences Corp. (a) | | 29,500 | | 2,300,410 |
| MiMedx Group Inc. (a) | | 89,500 | | 269,395 |
| Health Care Equipment & Supplies - 1.3% | | | | |
| Abbott Laboratories | | 21,000 | | 1,555,050 |
| Health Care Providers & Services - 8.3% | | | | |
| Cigna Corp. | | 6,000 | | 1,340,280 |
| CVS Health Corp. | | 26,800 | | 2,149,360 |
| Hanger, Inc. (a) | | 139,475 | | 2,793,684 |
| HCA Healthcare, Inc. | | 9,800 | | 1,411,102 |
| McKesson Corp. | | 18,960 | | 2,360,520 |
| Pharmaceuticals - 4.0% | | | | |
| Johnson & Johnson | | 8,410 | | 1,235,429 |
| Merck & Co., Inc. | | 15,500 | | 1,229,770 |
| Pfizer Inc. | | 53,025 | | 2,451,346 |
| |
| Industrials - 8.5% | | | | 10,492,593 |
| Air Freight & Logistics - 1.3% | | | | |
| FedEx Corp. | | 6,975 | | 1,597,275 |
| Airlines - 0.8% | | | | |
| Delta Air Lines, Inc. | | 17,000 | | 1,032,070 |
| Building Products - 3.3% | | | | |
| Johnson Controls Int’l. PLC | | 55,741 | | 1,938,672 |
| Masco Corp. | | 67,075 | | 2,125,607 |
See Notes to Financial Statements.
6
| LARGECAP FUND SCHEDULE OF INVESTMENTS(Continued) |
| November 30, 2018 |
| | Shares | | Value |
| COMMON STOCKS(continued) | | | | |
| |
| Industrials (continued) | | | | |
| Electrical Equipment - 0.9% | | | | |
| ABB Ltd. ADR | | 54,175 | | $1,098,669 |
| Industrial Conglomerates - 1.4% | | | | |
| General Electric Co. | | 233,025 | | 1,747,687 |
| Trading Companies & Distributors - 0.8% | | | | |
| HD Supply Holdings, Inc. (a) | | 23,875 | | 952,613 |
| |
| Information Technology - 21.4% | | | | 26,078,408 |
| Communications Equipment - 3.4% | | | | |
| Cisco Systems, Inc. | | 52,260 | | 2,501,686 |
| Lumentum Holdings Inc. (a) | | 13,700 | | 609,239 |
| Viavi Solutions Inc. (a) | | 105,735 | | 1,072,153 |
| Electronic Equipment, Instruments & Components - 2.0% | | | | |
| Corning Inc. | | 48,925 | | 1,576,363 |
| II-VI Inc. (a) | | 16,500 | | 617,430 |
| Maxwell Technologies, Inc. (a) | | 93,997 | | 235,932 |
| IT Services - 3.0% | | | | |
| Alliance Data Systems Corp. | | 10,750 | | 2,153,870 |
| PayPal Holdings, Inc. (a) | | 10,570 | | 907,012 |
| Visa Inc. Class A | | 4,300 | | 609,353 |
| Semiconductors & Semiconductor Equipment - 6.8% | | | | |
| Infineon Technologies A.G. ADR | | 87,050 | | 1,845,460 |
| Intel Corp. | | 31,600 | | 1,558,196 |
| Maxim Integrated Products, Inc. | | 24,755 | | 1,384,300 |
| NXP Semiconductors N.V. | | 16,000 | | 1,333,920 |
| Qualcomm Inc. | | 37,330 | | 2,174,846 |
| Software - 4.7% | | | | |
| Microsoft Corp. | | 32,801 | | 3,637,303 |
| Oracle Corp. | | 42,475 | | 2,071,081 |
| Technology Hardware, Storage & Peripherals - 1.5% | | | | |
| Apple Inc. | | 10,025 | | 1,790,264 |
| |
| Materials - 1.4% | | | | 1,655,481 |
| Metals & Mining - 1.4% | | | | |
| Freeport-McMoRan Inc. | | 138,650 | | 1,655,481 |
See Notes to Financial Statements.
7
| LARGECAP FUND SCHEDULE OF INVESTMENTS(Continued) |
| November 30, 2018 |
| | Shares | | Value |
| SHORT-TERM INVESTMENTS - 0.1% | | | | $100,000 |
| (COST $100,000) | | | | |
| | | | | |
| Money Market Funds - 0.1% | | | | 100,000 |
| First American Gov’t. Obligations Fund Class X, 2.131% (b) | | 100,000 | | 100,000 |
| | | | | |
| TOTAL INVESTMENTS - 99.8% (COST $126,180,464) | | | | 121,474,631 |
| | | | | |
| NET OTHER ASSETS AND LIABILITIES - 0.2% | | | | 242,420 |
| | | | | |
| NET ASSETS - 100.0% | | | | $121,717,051 |
| (a) | Non-income producing security. |
| (b) | Represents the 7-day yield at November 30, 2018. |
| Abbreviations: |
| ADR | | American Depositary Receipt |
| A.G. | | Aktiengesellschaft is the German term for a public limited liability corporation. |
| N.V. | | Naamloze Vennootschap is the Dutch term for a public limited liability corporation. |
| PLC | | Public Limited Company |
The Global Industry Classification Standard (“GICS”) was developed by and is the exclusive property and a service mark of MSCI Inc. (“MSCI”) and Standard & Poor’s Financial Services LLC (“S&P”) and is licensed for use by Thompson Investment Management, Inc. Neither MSCI, S&P, nor any other party involved in making or compiling the GICS or any GICS classifications makes any warranties with respect thereto or the results to be obtained by the use thereof, and no such party shall have any liability whatsoever with respect thereto.
See Notes to Financial Statements.
8
| MIDCAP FUND INVESTMENT REVIEW(Unaudited) |
| November 30, 2018 |
Portfolio Managers
James T. Evans, CFA
Jason L. Stephens, CFA
Performance
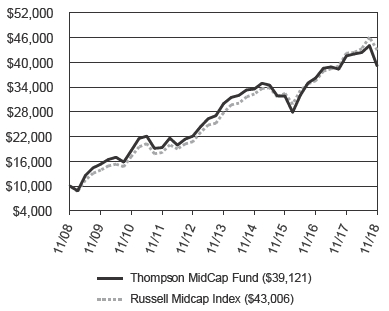
The MidCap Fund produced a total return of -5.85% for the fiscal year ended November 30, 2018, as compared to its benchmark, the Russell Midcap Index, which returned 1.89%.
| Comparison of Change in Value of a Hypothetical $10,000 Investment |
 |
| Average Annual Total Returns |
| Through 11/30/18 |
| | 1 Year | | 3 Year | | 5 Year | | 10 Year |
| Thompson MidCap Fund | | -5.85% | | 7.14% | | 5.47% | | 14.62% |
| Russell Midcap Index | | 1.89% | | 9.84% | | 9.14% | | 15.71% |
Gross Expense Ratio as of 03/31/18 was 1.44%.
Net Expense Ratio after reimbursement as of 03/31/18 was 1.15%.*
| * | The Advisor has contractually agreed to waive management fees and/or reimburse expenses incurred by the MidCap Fund through March 31, 2020, so that the annual operating expenses of the Fund do not exceed 1.15% of its average daily net assets. Net expense ratios are current as of the most recent Prospectus and are applicable to investors. |
Performance data quoted represents past performance; past performance does not guarantee future results. The investment return and principal value of an investment will fluctuate so that an investor’s shares, when redeemed, may be worth more or less than their original cost. Current performance of the Fund may be lower or higher than the performance quoted. Performance data current to the most recent month-end may be obtained by calling 1-800-999-0887 or visiting www.thompsonim.com.
Results include the reinvestment of all dividends and capital gains distributions. Investment performance reflects all fee waivers that may be in effect. In the absence of such waivers, total return would be reduced. The performance information reflected in the graph and the table above does not reflect the deduction of taxes that a shareholder would pay on fund distributions or the redemption of fund shares, nor does it imply future performance. The Russell Midcap Index measures the performance of the 800 smallest companies in the Russell 1000 Index based on total market capitalization. You cannot directly invest in an index.
FTSE Russell is the source and owner of the trademarks, service marks, and copyrights related to the Russell Indexes. “FTSE®” and “Russell®” are trademarks of the London Stock Exchange Group.
See Notes to Financial Statements.
9
| MIDCAP FUND INVESTMENT REVIEW(Unaudited) (Continued) |
| November 30, 2018 |
Management Commentary
The Fund’s lag for the fiscal year was primarily driven by underperformance in the Consumer Discretionary, Information Technology and Financials sectors. Historically, the Fund’s “big losers” from an individual security perspective have tended to be offset by its “big winners” over time. While we did benefit this fiscal year from some outsized performers like Hanger and Exact Sciences, we didn’t have enough of them to offset big losers like REV Group and Accelerate Diagnostics. In the long run, we would expect our batting average at each extreme typically to be more balanced, as it has been in the past. We believe that the larger reason for the Fund’s divergence from its benchmark is more likely related to an increase in investor uncertainty with respect to the future economic growth prospects of the U.S. economy.
For example, the Fund’s investments in the Financials sector lagged those of its benchmark by -1.05% during the period. There were no “big losers” in this sector among the stocks held by the Fund. The problem was instead that the Fund favored banks over other financial companies, and bank stocks have not recently kept up with our perception of their underlying economic performance. Additionally, investments in other sectors that benefit from housing turnover also underperformed. While the housing sector has shown signs of slowing, we believe it’s premature to infer that a sharp downturn is imminent, though stock performance would suggest otherwise. Many other pro-cyclical industries are performing poorly, as well.
Investor enthusiasm driven by tax cuts seems to have been replaced by anxiety related to Federal Reserve interest rate policy and the potential for a trade war with China. While trade policy is important, we do believe that investors have potentially been overreacting. Many investors tend to fight the last battle, which in this case means selling the financial-and housing-related stocks that were central to the Great Recession. Today we believe bank balance sheets are on the whole as strong as ever, and that the housing sector is actually likely undersupplied. Whatever problem emerges as the source of the next bear market, we believe it will be somewhere else.
The potential for a recession increases when the benefits from recent tax cuts wear off in the second half of 2019. For now, we believe the odds of a material slowdown are still low. However, an exogenous event or policy error (such as a trade war) could change this outlook. While we have still maintained a slightly pro-cyclical tilt in the Fund, we will continue to take these factors into account as they relate to the fundamental prospects of the companies in which we invest, and make adjustments to the portfolio as our outlook changes.
Opinions expressed are subject to change, are not guaranteed and should not be considered investment advice.
Mutual fund investing involves risk. Principal loss is possible. Midcap companies tend to have more limited liquidity and greater volatility than large-capitalization companies. Investments in American Depositary Receipts (“ADRs”) are subject to some extent to the risks associated with directly investing in securities of foreign issuers, including the risk of changes in currency exchange rates, expropriation or nationalization of assets, and the impact of political, diplomatic, or social events. Investments in real estate securities may involve greater risk and volatility including greater exposure to economic downturns and changes in real estate values, rents, property taxes, and tax and other laws. A real estate investment trust’s (REIT’s) share price may decline because of adverse developments affecting the real estate industry.
Please refer to the Schedule of Investments on page 12 of this report for holdings information. The management commentary above as well as Fund holdings and asset/sector allocations should not be considered a recommendation to buy or sell any security. In addition, please note that Fund holdings and asset/sector allocations are subject to change.
Earnings Growth is a measure of growth in a company’s net income over a specific period, often one year. It is not a prediction of the Fund’s future returns.
See Notes to Financial Statements.
10
| MIDCAP FUND INVESTMENT REVIEW(Unaudited) (Continued) |
| November 30, 2018 |
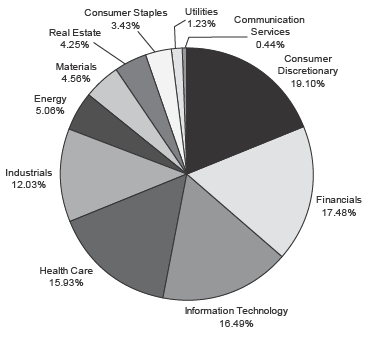
| Sector Weightings at 11/30/18 |
| % of Total Investments |
 |
| Top 10 Equity Holdings at 11/30/18 |
| | % of Fund’s |
| Company | Industry | Net Assets |
| Hanger, Inc. | Health Care Providers & Services | 3.94% |
| Newell Brands, Inc. | Household Durables | 2.40% |
| Alliance Data Systems Corp. | IT Services | 2.17% |
| Exact Sciences Corp. | Biotechnology | 2.13% |
| CIT Group Inc. | Banks | 2.11% |
| Northern Trust Corp. | Capital Markets | 1.92% |
| Masco Corp. | Building Products | 1.83% |
| First Horizon National Corp. | Banks | 1.82% |
| Associated Banc-Corp | Banks | 1.77% |
| LKQ Corp. | Distributors | 1.77% |
As of November 30, 2018, 100.0%, of the Fund’s net assets were in equity and short-term investments.
See Notes to Financial Statements.
11
| MIDCAP FUND SCHEDULE OF INVESTMENTS |
| November 30, 2018 |
| | | | Shares | | Value |
| COMMON STOCKS - 100.0% | | | | $ | 45,008,308 |
| (COST $42,218,838) | | | | | |
| |
| Communication Services - 0.4% | | | | | 198,503 |
| Entertainment - 0.4% | | | | | |
| Take-Two Interactive Software, Inc. (a) | | 1,810 | | | 198,503 |
| |
| Consumer Discretionary - 19.1% | | | | | 8,598,912 |
| Automobiles - 1.1% | | | | | |
| Harley-Davidson, Inc. | | 11,875 | | | 502,194 |
| Distributors - 1.8% | | | | | |
| LKQ Corp. (a) | | 28,645 | | | 797,477 |
| Hotels, Restaurants & Leisure - 0.7% | | | | | |
| Extended Stay America, Inc. | | 17,800 | | | 323,960 |
| Household Durables - 5.7% | | | | | |
| D.R. Horton, Inc. | | 12,325 | | | 458,737 |
| Newell Brands, Inc. | | 46,231 | | | 1,081,805 |
| PulteGroup Inc. | | 20,075 | | | 532,389 |
| TopBuild Corp. (a) | | 9,640 | | | 491,158 |
| Leisure Products - 2.2% | | | | | |
| Brunswick Corp. | | 10,675 | | | 566,202 |
| Mattel, Inc. (a) | | 31,550 | | | 438,545 |
| Specialty Retail - 4.3% | | | | | |
| Bed Bath & Beyond Inc. | | 38,250 | | | 492,660 |
| Lumber Liquidators Holdings, Inc. (a) | | 47,475 | | | 599,609 |
| Party City Holdco Inc. (a) | | 43,000 | | | 513,850 |
| Urban Outfitters, Inc. (a) | | 8,375 | | | 319,004 |
| Textiles, Apparel & Luxury Goods - 3.3% | | | | | |
| Hanesbrands, Inc. | | 49,365 | | | 785,397 |
| Skechers U.S.A., Inc. Class A (a) | | 25,775 | | | 695,925 |
| |
| Consumer Staples - 3.4% | | | | | 1,546,070 |
| Beverages - 1.4% | | | | | |
| Molson Coors Brewing Co. Class B | | 9,575 | | | 629,748 |
| Food Products - 2.0% | | | | | |
| The Hain Celestial Group, Inc. (a) | | 14,075 | | | 291,352 |
| The J. M. Smucker Co. | | 5,980 | | | 624,970 |
| |
| Energy - 5.1% | | | | | 2,276,835 |
| Energy Equipment & Services - 1.4% | | | | | |
| Helmerich & Payne, Inc. | | 3,510 | | | 212,706 |
| TechnipFMC PLC | | 17,125 | | | 395,416 |
| Oil, Gas & Consumable Fuels - 3.7% | | | | | |
| Cameco Corp. | | 19,750 | | | 234,630 |
| Devon Energy Corp. | | 10,250 | | | 277,058 |
| Noble Energy, Inc. | | 26,675 | | | 633,265 |
| Pioneer Natural Resources Co. | | 1,475 | | | 217,931 |
| Southwestern Energy Co. (a) | | 63,450 | | | 305,829 |
See Notes to Financial Statements.
12
| MIDCAP FUND SCHEDULE OF INVESTMENTS(Continued) |
| November 30, 2018 |
| | | | Shares | | Value |
| COMMON STOCKS(continued) | | | | | |
| |
| Financials - 17.5% | | | | $ | 7,862,370 |
| Banks - 9.1% | | | | | |
| Associated Banc-Corp | | 34,443 | | | 798,044 |
| CIT Group Inc. | | 20,480 | | | 950,886 |
| First Horizon National Corp. | | 49,645 | | | 818,646 |
| Regions Financial Corp. | | 16,035 | | | 263,776 |
| SunTrust Banks, Inc. | | 8,520 | | | 534,119 |
| Zions Bancorporation, N.A. | | 14,635 | | | 712,139 |
| Capital Markets - 4.0% | | | | | |
| Eaton Vance Corp. | | 12,470 | | | 507,903 |
| Northern Trust Corp. | | 8,730 | | | 866,278 |
| State Street Corp. | | 5,975 | | | 436,295 |
| Consumer Finance - 1.2% | | | | | |
| Discover Financial Services | | 7,404 | | | 527,905 |
| Insurance - 2.1% | | | | | |
| Fidelity National Financial, Inc. | | 17,525 | | | 588,840 |
| Unum Group | | 9,580 | | | 344,018 |
| Thrifts & Mortgage Finance - 1.1% | | | | | |
| Flagstar Bancorp, Inc. (a) | | 15,825 | | | 513,521 |
| |
| Health Care - 15.9% | | | | | 7,170,067 |
| Biotechnology - 3.2% | | | | | |
| Exact Sciences Corp. (a) | | 12,300 | | | 959,154 |
| MiMedx Group Inc. (a) | | 92,375 | | | 278,049 |
| Xencor, Inc. (a) | | 4,800 | | | 201,648 |
| Health Care Equipment & Supplies - 1.2% | | | | | |
| Hologic, Inc. (a) | | 12,425 | | | 551,794 |
| Health Care Providers & Services - 8.3% | | | | | |
| Acadia Healthcare Co., Inc. (a) | | 15,675 | | | 532,480 |
| Hanger, Inc. (a) | | 88,594 | | | 1,774,538 |
| Henry Schein, Inc. (a) | | 3,575 | | | 318,890 |
| McKesson Corp. | | 2,665 | | | 331,792 |
| Patterson Cos., Inc. | | 10,980 | | | 278,563 |
| Premier, Inc. Class A (a) | | 13,075 | | | 518,554 |
| Life Sciences Tools & Services - 1.5% | | | | | |
| Accelerate Diagnostics, Inc. (a) | | 44,500 | | | 657,265 |
| Pharmaceuticals - 1.7% | | | | | |
| Jazz Pharmaceuticals PLC (a) | | 5,075 | | | 767,340 |
| |
| Industrials - 12.0% | | | | | 5,415,932 |
| Building Products - 2.8% | | | | | |
| A.O. Smith Corp. | | 9,700 | | | 459,586 |
| Masco Corp. | | 25,950 | | | 822,356 |
| Commercial Services & Supplies - 0.5% | | | | | |
| Hudson Technologies, Inc. (a) | | 225,325 | | | 245,604 |
| Electrical Equipment - 1.2% | | | | | |
| Regal Beloit Corp. | | 7,030 | | | 549,605 |
See Notes to Financial Statements.
13
| MIDCAP FUND SCHEDULE OF INVESTMENTS(Continued) |
| November 30, 2018 |
| | | Shares | | Value |
| COMMON STOCKS(continued) | | | | |
| |
| Industrials (continued) | | | | |
| Machinery - 5.9% | | | | |
| Ingersoll-Rand PLC | | 5,625 | | $582,300 |
| Kornit Digital Ltd. (a) | | 14,250 | | 328,035 |
| Mueller Water Products, Inc. Class A | | 30,525 | | 321,428 |
| REV Group, Inc. | | 40,050 | | 488,610 |
| SPX Corp. (a) | | 7,650 | | 226,287 |
| SPX Flow, Inc. (a) | | 18,515 | | 694,868 |
| Trading Companies & Distributors - 1.6% | | | | |
| HD Supply Holdings, Inc. (a) | | 17,475 | | 697,253 |
| |
| Information Technology - 16.6% | | | | 7,422,035 |
| Communications Equipment - 2.1% | | | | |
| Lumentum Holdings Inc. (a) | | 8,000 | | 355,760 |
| Viavi Solutions Inc. (a) | | 56,231 | | 570,182 |
| Electronic Equipment, Instruments & Components - 1.6% | | | | |
| II-VI Inc. (a) | | 15,400 | | 576,268 |
| Maxwell Technologies, Inc. (a) | | 49,997 | | 125,492 |
| IT Services - 3.6% | | | | |
| Alliance Data Systems Corp. | | 4,870 | | 975,753 |
| Black Knight, Inc. (a) | | 6,735 | | 305,365 |
| Fiserv, Inc. (a) | | 4,138 | | 327,440 |
| Semiconductors & Semiconductor Equipment - 6.3% | | | | |
| Cypress Semiconductor Corp. | | 34,500 | | 479,550 |
| Infineon Technologies A.G. ADR | | 29,225 | | 619,570 |
| Marvell Technology Group Ltd. | | 34,304 | | 552,637 |
| Maxim Integrated Products, Inc. | | 8,066 | | 451,051 |
| NXP Semiconductors N.V. | | 9,000 | | 750,330 |
| Technology Hardware, Storage & Peripherals - 3.0% | | | | |
| CPI Card Group Inc. (a) | | 150,397 | | 458,711 |
| Electronics for Imaging, Inc. (a) | | 23,050 | | 638,024 |
| Pure Storage, Inc. Class A (a) | | 12,475 | | 235,902 |
| |
| Materials - 4.6% | | | | 2,051,445 |
| Chemicals - 1.3% | | | | |
| Ecolab Inc. | | 2,105 | | 337,831 |
| Int’l. Flavors & Fragrances Inc. | | 1,535 | | 217,402 |
| Containers & Packaging - 1.6% | | | | |
| AptarGroup, Inc. | | 2,100 | | 218,505 |
| Crown Holdings, Inc. (a) | | 10,000 | | 512,800 |
| Metals & Mining - 1.7% | | | | |
| Freeport-McMoRan Inc. | | 54,670 | | 652,760 |
| Lundin Mining Corp. | | 25,900 | | 112,147 |
See Notes to Financial Statements.
14
| MIDCAP FUND SCHEDULE OF INVESTMENTS(Continued) |
| November 30, 2018 |
| | | Shares | | Value |
| COMMON STOCKS(continued) | | | | |
| |
| Real Estate - 4.2% | | | | $1,913,724 |
| Equity Real Estate Investment - 3.2% | | | | |
| DiamondRock Hospitality Co. | | 42,600 | | 449,004 |
| Host Hotels & Resorts Inc. | | 23,335 | | 443,365 |
| Kimco Realty Corp. | | 34,550 | | 564,893 |
| Real Estate Management & Development - 1.0% | | | | |
| Realogy Holdings Corp. | | 23,700 | | 456,462 |
| |
| Utilities - 1.2% | | | | 552,415 |
| Electric Utilities - 0.5% | | | | |
| Xcel Energy, Inc. | | 4,350 | | 228,158 |
| Multi-Utilities - 0.7% | | | | |
| MDU Resources Group, Inc. | | 12,250 | | 324,257 |
| |
| SHORT-TERM INVESTMENTS - 0.0%^ | | | | 3,925 |
| (COST $3,925) | | | | |
| |
| Money Market Funds - 0.0%^ | | | | 3,925 |
| First American Gov’t. Obligations Fund Class X, 2.131% (b) | | 3,925 | | 3,925 |
| |
| TOTAL INVESTMENTS - 100.0% (COST $42,222,763) | | | | 45,012,233 |
| |
| NET OTHER ASSETS AND LIABILITIES - 0.0%^ | | | | 16,983 |
| |
| NET ASSETS - 100.0% | | | | $45,029,216 |
| (a) | Non-income producing security. |
| (b) | Represents the 7-day yield at November 30, 2018. |
| ^ | Rounds to 0.0%. |
| Abbreviations: |
| ADR | American Depositary Receipt |
| A.G. | Aktiengesellschaft is the German term for a public limited liability corporation. |
| N.V. | Naamloze Vennootschap is the Dutch term for a public limited liability corporation. |
| PLC | Public Limited Company |
The Global Industry Classification Standard (“GICS”) was developed by and is the exclusive property and a service mark of MSCI Inc. (“MSCI”) and Standard & Poor’s Financial Services LLC (“S&P”) and is licensed for use by Thompson Investment Management, Inc. Neither MSCI, S&P, nor any other party involved in making or compiling the GICS or any GICS classifications makes any warranties with respect thereto or the results to be obtained by the use thereof, and no such party shall have any liability whatsoever with respect thereto.
See Notes to Financial Statements.
15
| BOND FUND INVESTMENT REVIEW(Unaudited) |
| November 30, 2018 |
Portfolio Managers
James T. Evans, CFA
Jason L. Stephens, CFA
Performance
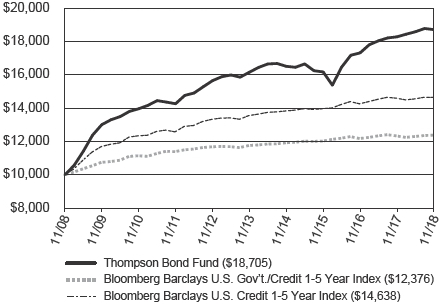
The Bond Fund produced a total return of 2.37% for the fiscal year ended November 30, 2018, as compared to its benchmark, the Bloomberg Barclays U.S. Government/Credit 1-5 Year Index, which returned 0.36%, and as compared to the Bloomberg Barclays U.S. Credit 1-5 Year Index, which returned 0.31%.
| Comparison of Change in Value of a Hypothetical $10,000 Investment |
 |
| Average Annual Total Returns |
| Through 11/30/18 |
| | 1 Year | | 3 Year | | 5 Year | | 10 Year |
| Thompson Bond Fund | | | 2.37% | | | | 4.98% | | | | 2.98% | | | | 6.46% | |
| Bloomberg Barclays U.S. Gov’t./Credit 1-5 Year Index | | | 0.36% | | | | 0.98% | | | | 1.03% | | | | 2.16% | |
| Bloomberg Barclays U.S. Credit 1-5 Year Index | | | 0.31% | | | | 1.58% | | | | 1.55% | | | | 3.88% | |
| Gross Expense Ratio as of 03/31/18 was 0.71%. | 30-Day SEC Yield as of 11/30/18 was 3.72%. |
Performance data quoted represents past performance; past performance does not guarantee future results. The investment return and principal value of an investment will fluctuate so that an investor’s shares, when redeemed, may be worth more or less than their original cost. Current performance of the Fund may be lower or higher than the performance quoted. Performance data current to the most recent month-end may be obtained by calling 1-800-999-0887 or visiting www.thompsonim.com.
Results include the reinvestment of all dividends and capital gains distributions. Investment performance reflects all fee waivers that may have been in effect. In the absence of such waivers, total return would have been reduced. The performance information reflected in the graph and the table above does not reflect the deduction of taxes that a shareholder would pay on fund distributions or the redemption of fund shares, nor does it imply future performance. The Bloomberg Barclays U.S. Government/Credit 1-5 Year Index is a market-value-weighted index of all investment-grade bonds with maturities of more than one year and less than 5 years. The Bloomberg Barclays U.S. Credit 1-5 Year Index is a market-value-weighted index which includes virtually every major investment-grade rated corporate bond with 1-5 years remaining until maturity that serves as a supplementary benchmark. You cannot directly invest in an index.
Bloomberg®is a trademark and service mark of Bloomberg Finance L.P. Barclays®is a trademark and service mark of Barclays Bank PLC.
See Notes to Financial Statements.
16
| BOND FUND INVESTMENT REVIEW(Unaudited) (Continued) |
| November 30, 2018 |
Management Commentary
The fiscal year was a difficult one for many fixed income strategies. Five year or less Treasury yields rose between 67 and 118 basis points depending on the maturity, depressing overall returns as prices fell to compensate. Corporate bonds weren’t much better, as spreads widened by 42 basis points on 10-year BBB-rated securities during the period, countering much of the extra income that an investor would normally expect to receive by holding the riskier asset class. As a result, the Fund’s primary and supplementary benchmarks were only able to eke out small gains for the year after spending most of the fiscal year before early August in negative territory. So while the Fund’s 2.37% return for the fiscal year may not be the largest annual return generated for shareholders over the past decade, it’s one that we are particularly proud of given the circumstances.
During the fiscal year, the Fund’s corporate bond overweight coupled with an allocation to asset-backed and commercial mortgage bonds gave the Fund extra income relative to its benchmarks. While these positions were an important component of the Fund’s outperformance, merely concluding that the corporate position was the dominant factor behind the Fund’s performance does not tell the full story. After all, absent extraordinary issue selection, a corporate overweight coupled with a duration of 2-3 years would likely have generated performance somewhat similar to the 0.31% return of the Bloomberg Barclays U.S. Credit 1-5 Year Index.
The key in our opinion to the Fund’s relative success during the period was instead a combination of the shape of the yield curve coupled with a low Fund duration. Because the yield curve for non-government bonds was relatively flat, we were able to buy bonds in the 1-2 year maturity timeframe and earn income that was only modestly below yields available on longer-maturity bonds. At the same time, the short duration helped to reduce both interest-rate and spread-widening risk that hurt many of our peers and the benchmarks. This is because the change in price of a corporate bond from wider spreads is roughly equal to the combination of the change in the spread times the duration of said bond. By keeping the duration small, we were able to reduce the overall impact of a given change in spreads.
Looking forward, we like how the Fund is positioned. The SEC yield of the Fund as of the end of the fiscal year was 3.72%, suggesting that the Fund’s holdings are likely to provide a competitive return for shareholders going forward. We continue to find bargains in the 1-2 year space and see little reason at this time to purchase longer maturities except for the occasional exceptional bond. At some point it very likely will make sense to extend, once the yield curve is steeper than today, either due to long-term rates having risen or because the Federal Reserve has begun a rate-cutting cycle to fight a recession. If we were to extend we would probably concurrently increase the Fund’s allocation to government securities in an effort to reduce the portfolio’s credit risk. However, neither scenario appears imminent to us. Thus, as we look ahead to the next fiscal year we will likely continue with the strategy that served us so well over the past year.
Opinions expressed are subject to change, are not guaranteed and should not be considered investment advice.
Mutual fund investing involves risk. Principal loss is possible. Investments in debt securities typically decrease in value when interest rates rise. The risk is usually greater for longer-term debt securities. Investments in bonds of foreign issuers involve greater volatility, political and economic risks, and differences in accounting methods. Investment by the Fund in lower-rated and non-rated securities presents a greater risk of loss to principal and interest than higher-rated securities.
Please refer to the Schedule of Investments on page 19 of this report for holdings information. The management commentary above as well as Fund holdings should not be considered a recommendation to buy or sell any security. In addition, please note that Fund holdings are subject to change.
The federal government guarantees interest payments from government securities while dividend payments carry no such guarantee. Government securities, if held to maturity, guarantee the timely payment of principal and interest.
Basis Points is a unit that is equal to 1/100th of 1%, and is used to denote the change in a financial instrument. The basis point is commonly used for calculating changes in interest rates, equity indexes and the yield of a fixed-income security.
Duration is a commonly used measure of the potential volatility of the price of a debt security, or the aggregate market value of a portfolio of debt securities, prior to maturity. Securities with a longer duration generally have more volatile prices than securities of comparable quality with a shorter duration.
SEC Yield is a standardized yield computed by dividing the net investment income per share earned during the 30-day period prior to quarter-end and was created to allow for fairer comparisons among bond funds.
Spread is the percentage point difference between yields of various classes of bonds compared to treasury bonds.
Yield is the income earned from a bond, which takes into account the sum of the interest payment, the redemption value at the bond’s maturity, and the initial purchase price of the bond.
Yield Curve is a line that plots the interest rates, at a set point in time, of bonds having equal credit quality but differing maturity dates.
Credit Ratings are provided by Standard & Poor’s, who assign a rating based on their analysis of the issuer’s creditworthiness. The highest rating given is AAA and the lowest is C.
See Notes to Financial Statements.
17
| BOND FUND INVESTMENT REVIEW(Unaudited) (Continued) |
| November 30, 2018 |
The purpose of Moody’s ratings is to provide investors with a simple system of gradation by which relative creditworthiness of securities may be noted. Gradations of creditworthiness are indicated by rating symbols, with each symbol representing a group in which the credit characteristics are broadly the same. The highest rating assigned by Moody’s is AAA and the lowest is C.
Although the makeup of the Bond Fund’s portfolio is constantly changing, as of November 30, 2018, 74.60% of the Fund’s portfolio was invested in corporate bonds. Due to prevailing market conditions, the composition of the Fund’s portfolio as of that date was consistent with the composition of the Fund’s portfolio over the past 5 years. In addition, as of that date 64.91% of the Fund’s portfolio was invested in securities rated BBB by Standard & Poor’s, while an additional 4.09% of the Fund’s portfolio was rated below investment-grade and 16.67% of the Fund’s portfolio was not rated by Standard & Poor’s. For portfolio information current as of the most recent quarter-end, please call 1-800-999-0887 or visit our website at www.thompsonim.com. Compared to a portfolio that is more evenly allocated between government and corporate bonds, a portfolio that is heavily allocated to corporate bonds may provide higher returns but is also subject to greater levels of credit and liquidity risk and to greater price fluctuations. A portfolio that is significantly allocated to bonds having lower and below-investment-grade ratings may also be subject to greater levels of credit and liquidity risk and experience greater price fluctuations than a portfolio comprised of higher-rated investment-grade bonds.
| Asset Allocation at 11/30/18 |
| (Includes cash equivalents) |
| % of Total Investments |
| Corporate Bonds | 74.60% |
| Asset-Backed Securities | 11.00% |
| U.S. Government & Agency Securities | 5.25% |
| Commercial Mortgage-Backed Securities | 3.55% |
| Taxable Municipal Bonds | 3.09% |
| Sovereign Bonds | 1.52% |
| Commercial Paper | 0.68% |
| Tax-Exempt Municipal Bonds | 0.17% |
| U.S. Government Agency Mortgage-Backed Securities | 0.07% |
| Residential Mortgage-Backed Securities | 0.07% |
| 100.00% |
| |
| Quality Composition at 11/30/18^ |
| (Includes cash equivalents) |
| % of Total Investments |
| U.S. Government & Agency Issues | 5.32% |
| AAA | 0.47% |
| AA | 1.65% |
| A | 12.30% |
| BBB | 73.46% |
| BB and Below | 6.47% |
| Not Rated | 0.33% |
| 100.00% |
| ^ | The Bond Fund’s quality composition is calculated using ratings from Standard & Poor’s. If Standard & Poor’s does not rate a holding then Moody’s is used. If Standard & Poor’s and Moody’s do not rate a holding then Fitch is used. For certain securities that are not rated by any of these three agencies, credit ratings from other Nationally Recognized Statistical Credit Rating Organizations (NRSRO) agencies may be used. Not rated category includes holdings that are not rated by any NRSRO. All ratings are as of 11/30/18. |
| Top 10 Bond Holdings by Issuer at 11/30/18 |
| % of Fund’s Net Assets |
| XL Group PLC | 2.20% |
| MBIA Inc. | 1.98% |
| Barclays PLC | 1.93% |
| County of Racine WI Anticipation Notes | 1.71% |
| Fannie Mae | 1.70% |
| Ford Motor Credit Co. LLC | 1.67% |
| General Electric Co. | 1.41% |
| Becton Dickinson and Co. | 1.30% |
| First Tennessee Bank N.A. | 1.23% |
| Federal Home Loan Banks | 1.21% |
See Notes to Financial Statements.
18
| BOND FUND SCHEDULE OF INVESTMENTS |
| November 30, 2018 |
| | | Rate (%) | | Maturity Date | | Principal Amount | | | Value |
| BONDS - 97.6% | | | | | | | | $ | 3,569,807,362 |
| | (COST $3,629,856,593) | | | | | | | | | |
| |
| Asset-Backed Securities - 10.9% | | | | | | | | | 398,358,070 |
| Air Canada, Series 2013-1B (h) | | 5.375 | | 11/15/22 | | 7,795,721 | | | 7,941,890 |
| Air Canada, Series 2015-1B (h) | | 3.875 | | 09/15/24 | | 1,944,723 | | | 1,898,574 |
| Air Canada, Series 2015-2B (h) | | 5.000 | | 06/15/25 | | 4,668,520 | | | 4,715,206 |
| Airspeed Ltd., Series 2007-1A G1 (1 month LIBOR + 0.270%, | | | | | | | | | |
| floor 0.000%) (c)(h) | | 2.577 | | 06/15/32 | | 2,528,344 | | | 2,428,910 |
| America West Airlines, Series 1999-1 | | 7.930 | | 07/02/20 | | 1,632,290 | | | 1,638,983 |
| America West Airlines, Series 2000-1 | | 8.057 | | 01/02/22 | | 18,936 | | | 19,958 |
| America West Airlines, Series 2001-1 | | 7.100 | | 10/02/22 | | 3,296,396 | | | 3,436,492 |
| American Airlines, Series 2013-2 A | | 4.950 | | 07/15/24 | | 431,826 | | | 440,985 |
| American Airlines, Series 2015-1 B | | 3.700 | | 11/01/24 | | 2,733,715 | | | 2,655,257 |
| American Airlines, Series 2015-2 B | | 4.400 | | 03/22/25 | | 5,123,666 | | | 5,065,256 |
| Applebee’s Funding LLC / IHOP Funding LLC, Series 2014-1 A2 (h) | | 4.277 | | 09/05/44 | | 39,658,410 | | | 39,196,405 |
| British Airways PLC, Series 2013-1 B (h) | | 5.625 | | 12/20/21 | | 14,721,505 | | | 14,958,521 |
| British Airways PLC, Series 2013-1 B (h) | | 5.625 | | 12/20/21 | | 30,663 | | | 31,156 |
| Business Jet Securities, LLC, Series 2018-1 A (h) | | 4.335 | | 02/15/33 | | 7,251,485 | | | 7,240,540 |
| Business Jet Securities, LLC, Series 2018-1 B (h) | | 6.048 | | 02/15/33 | | 1,044,138 | | | 1,068,583 |
| Cajun Global LLC, Series 2017-1A A2 (h) | | 6.500 | | 08/20/47 | | 9,550,000 | | | 9,726,484 |
| CAL Funding II Ltd., Series 2012-1A A (h) | | 3.470 | | 10/25/27 | | 1,094,708 | | | 1,081,779 |
| CAL Funding II Ltd., Series 2013-1A A (h) | | 3.350 | | 03/27/28 | | 2,812,333 | | | 2,779,520 |
| Castle Aircraft Securitization Trust, Series 2015-1A A (h) | | 4.703 | | 12/15/40 | | 775,845 | | | 779,678 |
| Continental Airlines, Series 1999-2 A-1 | | 7.256 | | 09/15/21 | | 12,059 | | | 12,293 |
| Continental Airlines, Series 1999-2 C | | 6.236 | | 09/15/21 | | 391,930 | | | 397,809 |
| Continental Airlines, Series 2010-1 B | | 6.000 | | 07/12/20 | | 1,368,485 | | | 1,372,317 |
| Continental Airlines, Series 2012-1 B | | 6.250 | | 10/11/21 | | 4,498,622 | | | 4,597,592 |
| Continental Airlines, Series 2012-2 B | | 5.500 | | 04/29/22 | | 7,343,535 | | | 7,490,406 |
| Cronos Containers Program I Ltd., Series 2013-1A A (h) | | 3.080 | | 04/18/28 | | 5,341,958 | | | 5,256,519 |
| Cronos Containers Program I Ltd., Series 2014-1A A (h) | | 3.040 | | 08/18/29 | | 1,046,729 | | | 1,027,938 |
| Delta Air Lines, Series 2007-1 B | | 8.021 | | 02/10/24 | | 1,648,290 | | | 1,804,927 |
| Delta Air Lines, Series 2012-1B (h) | | 6.875 | | 11/07/20 | | 456,139 | | | 462,525 |
| Doric Nimrod Air Alpha, Series 2013-1 B (h) | | 6.125 | | 11/30/21 | | 9,304,892 | | | 9,444,465 |
| Doric Nimrod Air Alpha, Series 2013-1 B (h) | | 6.125 | | 11/30/21 | | 1,516,165 | | | 1,538,907 |
| Doric Nimrod Air Finance Alpha Ltd., Series 2012-1 B (h) | | 6.500 | | 05/30/21 | | 2,338,501 | | | 2,352,422 |
| ECAF I Ltd., Series 2015-1A A2 (h) | | 4.947 | | 06/15/40 | | 3,864,053 | | | 3,941,379 |
| ECAF I Ltd., Series 2015-1A B1 (h) | | 5.802 | | 06/15/40 | | 19,081,000 | | | 19,021,274 |
| Element Rail Leasing LLC, Series 2014-1A B1 (h) | | 4.406 | | 04/19/44 | | 10,158,750 | | | 10,123,544 |
| Element Rail Leasing LLC, Series 2015-1A B1 (h) | | 4.175 | | 02/19/45 | | 16,917,000 | | | 16,341,282 |
| EngenCap ABS Trust, Series 2016-1 A (h) | | 3.670 | | 12/21/26 | | 23,281,248 | | | 22,466,404 |
| FPL Energy Caithness Funding Corp. (h) | | 7.645 | | 12/31/18 | | 964,237 | | | 966,647 |
| FRS LLC, Series 2013-1A B (h) | | 3.960 | | 04/15/43 | | 1,594,874 | | | 1,588,580 |
| Global Container Assets Ltd., Series 2015-1A A1 (h) | | 2.100 | | 02/05/30 | | 589,048 | | | 587,859 |
| Global SC Finance II SRL (SEACO), Series 2013-1A A (h) | | 2.980 | | 04/17/28 | | 7,950,000 | | | 7,780,617 |
| Global SC Finance II SRL (SEACO), Series 2014-1A A1 (h) | | 3.190 | | 07/17/29 | | 4,624,000 | | | 4,522,566 |
| Harley Marine Financing LLC, Series 2018-1A A2 (h) | | 5.682 | | 05/15/43 | | 14,775,000 | | | 13,736,318 |
| HP Communities LLC (h) | | 5.320 | | 03/15/23 | | 271,471 | | | 277,309 |
| Icon Brand Holdings LLC, Series 2012-1A A (h) | | 4.229 | | 01/25/43 | | 8,229,185 | | | 7,419,891 |
| Latam Airlines Group, Series 2015-1 B | | 4.500 | | 08/15/25 | | 4,285,412 | | | 4,107,568 |
| Merlin Aviation Holdings D.A.C., Series 2016-1 A (h) | | 4.500 | | 12/15/32 | | 12,146,813 | | | 12,246,652 |
See Notes to Financial Statements.
19
| BOND FUND SCHEDULE OF INVESTMENTS(Continued) |
| November 30, 2018 |
| | | Rate (%) | | Maturity Date | | Principal Amount | | Value |
| BONDS(continued) | | | | | | | | |
| |
| Asset-Backed Securities (continued) | | | | | | | | |
| | Merlin Aviation Holdings D.A.C., Series 2016-1 B (h) | | 6.500 | | 12/15/32 | | 1,333,735 | | $1,346,679 |
| METAL LLC, Series 2017-1 A (h) | | 4.581 | | 10/15/42 | | 13,541,324 | | 13,468,603 |
| METAL LLC, Series 2017-1 B (h) | | 6.500 | | 10/15/42 | | 20,763,364 | | 21,085,661 |
| Northwest Airlines, Series 1999-2 A | | 7.575 | | 09/01/20 | | 102,082 | | 103,103 |
| Northwest Airlines, Series 2000-1 G (d) | | 7.150 | | 04/01/21 | | 6,721 | | 6,709 |
| Northwest Airlines, Series 2002-1 G-2 | | 6.264 | | 05/20/23 | | 1,051,671 | | 1,069,654 |
| Prudential Securities Structured Assets, Inc., Series 1998-1 A | | | | | | | | |
| (1 month LIBOR + 0.420%, floor 0.000%) (c)(h) | | 2.727 | | 03/02/25 | | 10,548,703 | | 9,849,851 |
| SBA Tower Trust, Series 2014-1A C (h) | | 2.898 | | 10/15/44 | | 1,301,000 | | 1,295,842 |
| Spirit Master Funding, LLC, Series 2014-2A A (h) | | 5.760 | | 03/20/41 | | 16,716,601 | | 17,148,576 |
| Spirit Master Funding, LLC, Series 2014-4A A1 (h) | | 3.501 | | 01/20/45 | | 4,853,256 | | 4,821,567 |
| Spirit Master Funding, LLC, Series 2017-1A B (h) | | 5.490 | | 12/20/47 | | 5,000,000 | | 5,033,944 |
| TAL Advantage V LLC, Series 2014-1A B (h) | | 4.100 | | 02/22/39 | | 2,939,998 | | 2,898,214 |
| TAL Advantage V LLC, Series 2014-2A A2 (h) | | 3.330 | | 05/20/39 | | 2,245,833 | | 2,226,628 |
| Textainer Marine Containers V Ltd., Series 2017-1A B (h) | | 4.850 | | 05/20/42 | | 1,629,784 | | 1,613,595 |
| TGIF Funding LLC, Series 2017-1A A2 (h) | | 6.202 | | 04/30/47 | | 29,100,000 | | 29,048,493 |
| United Air Lines, Series 2013-1 B | | 5.375 | | 02/15/23 | | 1,582,681 | | 1,609,794 |
| US Airways, Series 1999-1 A | | 8.360 | | 07/20/20 | | 3,551 | | 3,587 |
| US Airways, Series 2001-1 G | | 7.076 | | 09/20/22 | | 360,531 | | 377,404 |
| US Airways, Series 2012-1 B | | 8.000 | | 04/01/21 | | 16,677,556 | | 17,206,735 |
| US Airways, Series 2013-1B | | 5.375 | | 05/15/23 | | 76,850 | | 78,751 |
| Virgin Australia Trust, Series 2013-1 A (h) | | 5.000 | | 04/23/25 | | 73,348 | | 74,493 |
| |
| Commercial Mortgage-Backed Securities - 3.4% | | | | | | | | 128,383,280 |
| CG-CCRE Commercial Mortgage Trust, Series 2014-FL1 D | | | | | | | | |
| (1 month LIBOR + 2.750%, floor 2.750%) (c)(h) | | 5.057 | | 06/15/31 | | 12,000,000 | | 11,970,865 |
| COMM Mortgage Trust, Series 2012-CR1 D (c)(h) | | 5.321 | | 05/15/45 | | 4,774,000 | | 4,752,311 |
| COMM Mortgage Trust, Series 2012-CR3 E (c)(h) | | 4.753 | | 10/15/45 | | 5,000,000 | | 4,477,291 |
| COMM Mortgage Trust, Series 2013-CR9 D (c)(h) | | 4.257 | | 07/10/45 | | 4,898,000 | | 4,141,335 |
| COMM Mortgage Trust, Series 2014-CC17 D (c)(h) | | 4.801 | | 05/10/47 | | 5,210,000 | | 4,901,947 |
| GS Mortgage Securities Trust, Series 2010-C1 E (h) | | 4.000 | | 08/10/43 | | 17,741,000 | | 16,872,417 |
| J.P. Morgan Chase Commercial Mortgage Securities Trust, | | | | | | | | |
| Series 2014-C20 D (c)(h) | | 4.571 | | 07/15/47 | | 5,000,000 | | 4,408,782 |
| J.P. Morgan Chase Commercial Mortgage Securities Trust, | | | | | | | | |
| Series 2014-C22 D (c)(h) | | 4.558 | | 09/15/47 | | 4,966,000 | | 4,191,696 |
| Morgan Stanley Bank of America Merrill Lynch Trust, | | | | | | | | |
| Series 2014-C18 D (h) | | 3.389 | | 10/15/47 | | 5,000,000 | | 4,047,264 |
| Morgan Stanley Bank of America Merrill Lynch Trust, | | | | | | | | |
| Series 2015-C22 D (c)(h) | | 4.237 | | 04/15/48 | | 5,000,000 | | 4,333,549 |
| Morgan Stanley Capital I Trust, Series 2011-C2 D (c)(h) | | 5.485 | | 06/15/44 | | 1,000,000 | | 990,796 |
| OBP Depositor LLC Trust, Series 2010-OBP A (h) | | 4.646 | | 07/15/45 | | 8,939,000 | | 9,064,324 |
| Palisades Center Trust, Series 2016-PLSD B (h) | | 3.357 | | 04/13/33 | | 4,500,000 | | 4,426,794 |
| TRU Trust, Series 2016-1 A (1 month LIBOR + 2.250%, | | | | | | | | |
| floor 1.750%) (c)(h) | | 4.557 | | 11/15/30 | | 5,631,561 | | 5,632,065 |
| TRU Trust, Series 2016-1 B (1 month LIBOR + 3.150%, | | | | | | | | |
| floor 2.750%) (c)(h) | | 5.457 | | 11/15/30 | | 14,600,000 | | 14,618,507 |
| TRU Trust, Series 2016-1 C (1 month LIBOR + 4.000%, | | | | | | | | |
| floor 4.000%) (c)(h) | | 6.307 | | 11/15/30 | | 14,575,000 | | 14,353,313 |
See Notes to Financial Statements.
20
| BOND FUND SCHEDULE OF INVESTMENTS(Continued) |
| November 30, 2018 |
| | | Rate (%) | | Maturity Date | | Principal Amount | | Value |
| BONDS(continued) | | | | | | | | |
| |
| Commercial Mortgage-Backed Securities (continued) | | | | | | | | |
| UBS-Barclays Commercial Mortgage Trust, Series 2012-C4 D (c)(h) | | 4.481 | | 12/10/45 | | 5,000,000 | | $4,621,427 |
| Wells Fargo Commercial Mortgage Trust, Series 2014-LC16 D (h) | | 3.938 | | 08/15/50 | | 7,072,000 | | 5,789,143 |
| WFRBS Commercial Mortgage Trust, Series 2011-C4 E (c)(h) | | 5.231 | | 06/15/44 | | 5,000,000 | | 4,789,454 |
| |
| Corporate Bonds - 73.9% | | | | | | | | 2,700,701,782 |
| | Actavis Funding SCS | | 2.450 | | 06/15/19 | | 6,259,000 | | 6,240,226 |
| Acuity Brands Lighting, Inc. | | 6.000 | | 12/15/19 | | 310,000 | | 317,784 |
| AerCap Ireland Capital Ltd. / AerCap Global Aviation Trust | | 3.750 | | 05/15/19 | | 500,000 | | 500,373 |
| AerCap Ireland Capital Ltd. / AerCap Global Aviation Trust | | 4.625 | | 10/30/20 | | 580,000 | | 583,271 |
| AerCap Ireland Capital Ltd. / AerCap Global Aviation Trust | | 4.500 | | 05/15/21 | | 10,401,000 | | 10,457,694 |
| Aircastle Ltd. | | 6.250 | | 12/01/19 | | 16,744,000 | | 17,117,758 |
| Aircastle Ltd. | | 7.625 | | 04/15/20 | | 2,000,000 | | 2,093,603 |
| Aircastle Ltd. | | 5.125 | | 03/15/21 | | 9,562,000 | | 9,732,506 |
| Aircastle Ltd. | | 5.500 | | 02/15/22 | | 8,263,000 | | 8,475,349 |
| American Tower Corp. | | 3.400 | | 02/15/19 | | 2,375,000 | | 2,375,551 |
| Ameriprise Financial, Inc. | | 7.300 | | 06/28/19 | | 4,640,000 | | 4,745,782 |
| Amphenol Corp. | | 2.550 | | 01/30/19 | | 1,749,000 | | 1,747,159 |
| AmTrust Financial Services, Inc. | | 6.125 | | 08/15/23 | | 23,096,000 | | 21,789,923 |
| Anadarko Petroleum Corp. | | 8.700 | | 03/15/19 | | 2,874,000 | | 2,918,721 |
| Anadarko Petroleum Corp. | | 6.950 | | 06/15/19 | | 6,830,000 | | 6,940,045 |
| Andeavor Logistics LP / Tesoro Logistics Finance Corp. | | 6.250 | | 10/15/22 | | 36,112,000 | | 37,014,800 |
| Anheuser-Busch InBev Worldwide Inc. | | 6.875 | | 11/15/19 | | 990,000 | | 1,021,562 |
| Arbor Realty Trust, Inc. | | 5.625 | | 05/01/23 | | 12,500,000 | | 12,658,210 |
| ARC Properties Operating Partnership, L.P. | | 3.000 | | 02/06/19 | | 3,475,000 | | 3,473,251 |
| ArcelorMittal | | 5.125 | | 06/01/20 | | 2,805,000 | | 2,847,356 |
| Arconic Inc. | | 6.150 | | 08/15/20 | | 22,236,000 | | 22,901,523 |
| Arconic Inc. | | 5.400 | | 04/15/21 | | 7,102,000 | | 7,201,428 |
| Arrow Electronics, Inc. | | 6.000 | | 04/01/20 | | 3,600,000 | | 3,697,425 |
| Associated Banc-Corp | | 2.750 | | 11/15/19 | | 23,397,000 | | 23,266,802 |
| Assured Guaranty US Holdings Inc. (3 month LIBOR + 2.380%) (c) | | 4.714 | | 12/15/66 | | 24,129,000 | | 22,681,260 |
| AT&T Inc. | | 5.800 | | 02/15/19 | | 7,950,000 | | 7,995,077 |
| Australia & New Zealand Banking Group Ltd. | | 2.250 | | 06/13/19 | | 3,000,000 | | 2,986,621 |
| AutoNation, Inc. | | 5.500 | | 02/01/20 | | 16,099,000 | | 16,416,123 |
| Avery Dennison Corp. | | 5.375 | | 04/15/20 | | 1,401,000 | | 1,427,563 |
| Avon Products, Inc. (e) | | 6.600 | | 03/15/20 | | 500,000 | | 503,750 |
| AXIS Specialty Finance PLC | | 2.650 | | 04/01/19 | | 5,797,000 | | 5,783,082 |
| Bank of America Corp. | | 5.490 | | 03/15/19 | | 344,000 | | 346,202 |
| Bank of America Corp. (5.125% to 06/17/19, | | | | | | | | |
| then 3 month LIBOR + 3.387%) (c)(g) | | 5.125 | | 06/17/19 | | 6,753,000 | | 6,719,910 |
| Bank of America Corp. | | 6.750 | | 08/15/19 | | 150,000 | | 153,371 |
| Bank of America Corp. (5.200% to 06/01/23, | | | | | | | | |
| then 3 month LIBOR + 3.135%) (c)(g) | | 5.200 | | 06/01/23 | | 2,500,000 | | 2,435,000 |
| Bank of America Corp. (4.0 times (USISDA10 - USISDA02 - 0.250%), | | | | | | | | |
| floor 0.000%, cap 10.000%) (c) | | 0.000 | | 11/19/30 | | 671,000 | | 402,600 |
| Bank of the Ozarks, Inc. (5.500% to 07/01/21, | | | | | | | | |
| then 3 month LIBOR + 4.425%) (c) | | 5.500 | | 07/01/26 | | 19,475,000 | | 19,868,356 |
| Barclays Bank PLC (d) | | 2.250 | | 09/13/19 | | 15,000,000 | | 14,849,992 |
| Barclays Bank PLC (CPI YOY + 1.000%, floor 0.000%) (c) | | 3.699 | | 03/16/23 | | 4,435,000 | | 4,306,385 |
See Notes to Financial Statements.
21
| BOND FUND SCHEDULE OF INVESTMENTS(Continued) |
| November 30, 2018 |
| | | Rate (%) | | Maturity Date | | Principal Amount | | Value |
| BONDS(continued) | | | | | | | | |
| |
| Corporate Bonds (continued) | | | | | | | | |
| | Barclays Bank PLC (3 month LIBOR + 0.650%, | | | | | | | | |
| floor 1.650%, cap 6.000%) (c) | | 3.232 | | 02/05/25 | | 15,000,000 | | $14,390,074 |
| Barclays Bank PLC (5.0 times (USISDA30 - USISDA05), | | | | | | | | |
| floor 0.000%, cap 10.000%) (c) | | 0.735 | | 04/30/29 | | 2,425,000 | | 1,857,550 |
| Barclays Bank PLC (8.0 times (USISDA30 - USISDA05 - 0.250%), | | | | | | | | |
| floor 0.000%, cap 8.000%) (c) | | 0.000 | | 08/28/29 | | 2,721,000 | | 1,901,968 |
| Barclays PLC | | 2.750 | | 11/08/19 | | 33,492,000 | | 33,149,645 |
| Barrick (PD) Australia Finance Pty. Ltd. | | 4.950 | | 01/15/20 | | 420,000 | | 426,660 |
| BCB Bancorp, Inc. (5.625% to 08/01/23, | | | | | | | | |
| then 3 month LIBOR + 2.720%) (c)(h) | | 5.625 | | 08/01/28 | | 8,000,000 | | 7,969,509 |
| Becton Dickinson and Co. | | 2.133 | | 06/06/19 | | 5,416,000 | | 5,384,629 |
| Becton Dickinson and Co. | | 2.675 | | 12/15/19 | | 16,919,000 | | 16,777,190 |
| Becton Dickinson and Co. (3 month LIBOR + 1.030%) (c) | | 3.353 | | 06/06/22 | | 25,355,000 | | 25,296,230 |
| Bemis Co., Inc. | | 6.800 | | 08/01/19 | | 1,186,000 | | 1,212,422 |
| BGC Partners Inc. (h) | | 5.375 | | 12/09/19 | | 1,500,000 | | 1,531,355 |
| BGC Partners Inc. | | 5.375 | | 12/09/19 | | 17,716,000 | | 18,086,318 |
| BHP Billiton Finance USA Ltd. (6.250% to 10/19/20, then USSW5 | | | | | | | | |
| +4.971% to 10/19/25, +5.221% to 10/19/40, then +5.971%) (c)(h) | | 6.250 | | 10/19/75 | | 7,951,000 | | 8,176,013 |
| BMW US Capital, LLC (h) | | 1.850 | | 09/15/21 | | 10,000,000 | | 9,506,406 |
| Boardwalk Pipelines, LP | | 5.750 | | 09/15/19 | | 2,945,000 | | 2,998,379 |
| BorgWarner, Inc. | | 8.000 | | 10/01/19 | | 3,907,000 | | 4,060,707 |
| Brambles USA, Inc. (h) | | 5.350 | | 04/01/20 | | 1,750,000 | | 1,787,232 |
| Braskem Finance Ltd. (h) | | 5.750 | | 04/15/21 | | 10,000,000 | | 10,260,500 |
| Braskem Finance Ltd. (h) | | 5.750 | | 04/15/21 | | 21,788,000 | | 22,355,577 |
| British Sky Broadcasting Group plc (h) | | 2.625 | | 09/16/19 | | 500,000 | | 496,685 |
| Brunswick Corp. (h) | | 4.625 | | 05/15/21 | | 10,828,000 | | 10,834,214 |
| Buckeye Partners, L.P. | | 5.500 | | 08/15/19 | | 5,965,000 | | 6,031,168 |
| Buckeye Partners, L.P. | | 4.875 | | 02/01/21 | | 822,000 | | 833,263 |
| CA, Inc. | | 5.375 | | 12/01/19 | | 8,606,000 | | 8,735,274 |
| Cabot Corp. | | 7.420 | | 12/11/18 | | 1,000,000 | | 1,000,667 |
| Cadence BanCorp (h) | | 4.875 | | 06/28/19 | | 3,500,000 | | 3,500,616 |
| Campbell Soup Co. | | 4.500 | | 02/15/19 | | 14,325,000 | | 14,356,229 |
| Campbell Soup Co. | | 8.875 | | 05/01/21 | | 3,750,000 | | 4,130,207 |
| Canadian Oil Sands Ltd. (h) | | 7.750 | | 05/15/19 | | 990,000 | | 1,006,555 |
| Capital Funding Bancorp, Inc. (h) | | 6.000 | | 12/01/23 | | 20,000,000 | | 20,123,512 |
| Capital One Bank USA N.A. | | 2.250 | | 02/13/19 | | 1,250,000 | | 1,247,736 |
| Capital One Bank USA N.A. | | 8.800 | | 07/15/19 | | 8,907,000 | | 9,192,636 |
| Capital One N.A. | | 2.400 | | 09/05/19 | | 2,217,000 | | 2,202,475 |
| Capital One N.A. | | 1.850 | | 09/13/19 | | 19,682,000 | | 19,463,151 |
| Carpenter Technology Corp. | | 5.200 | | 07/15/21 | | 3,500,000 | | 3,560,955 |
| CBL & Associates LP | | 5.250 | | 12/01/23 | | 7,075,000 | | 5,872,250 |
| CBL & Associates LP | | 4.600 | | 10/15/24 | | 5,889,000 | | 4,711,200 |
| Citigroup, Inc. | | 2.450 | | 01/10/20 | | 1,000,000 | | 989,386 |
| Citigroup, Inc. (4.0 times (USISDA10 - USISDA02 - 0.250%), | | | | | | | | |
| floor 0.000%, cap 10.000%) (c) | | 0.000 | | 11/19/30 | | 727,000 | | 462,954 |
| Citigroup, Inc. (5.0 times (USISDA30 - USISDA05), | | | | | | | | |
| floor 0.000%, cap 10.000%) (c) | | 0.330 | | 12/20/33 | | 1,485,000 | | 971,487 |
| Citizens Bank, N.A. | | 2.450 | | 12/04/19 | | 10,000,000 | | 9,913,141 |
| Citizens Bank, N.A. | | 2.250 | | 03/02/20 | | 3,668,000 | | 3,613,567 |
See Notes to Financial Statements.
22
| BOND FUND SCHEDULE OF INVESTMENTS(Continued) |
| November 30, 2018 |
| | | Rate (%) | | Maturity Date | | Principal Amount | | Value |
| BONDS(continued) | | | | | | | | |
| |
| Corporate Bonds (continued) | | | | | | | | |
| | Citizens Bank, N.A. (3 month LIBOR + 0.950%) (c) | | 3.336 | | 03/29/23 | | 10,000,000 | | $10,011,707 |
| CNH Industrial Capital LLC | | 3.375 | | 07/15/19 | | 9,221,000 | | 9,186,790 |
| CommonWealth REIT | | 5.875 | | 09/15/20 | | 6,412,000 | | 6,562,531 |
| Compass Bank | | 2.750 | | 09/29/19 | | 2,534,000 | | 2,522,082 |
| ConnectOne Bancorp, Inc. (5.200% to 02/01/23, | | | | | | | | |
| then 3 month LIBOR + 2.840%) (c) | | 5.200 | | 02/01/28 | | 1,935,000 | | 1,917,396 |
| Constellation Brands, Inc. | | 3.875 | | 11/15/19 | | 2,317,000 | | 2,321,183 |
| Continental Resources, Inc. | | 5.000 | | 09/15/22 | | 15,814,000 | | 15,810,764 |
| Controladora Mabe S.A. de C.V. (h) | | 7.875 | | 10/28/19 | | 10,000,000 | | 10,450,000 |
| County Bancorp, Inc. (5.875% to 06/01/23, | | | | | | | | |
| then 3 month LIBOR + 2.884%) (c) | | 5.875 | | 06/01/28 | | 7,500,000 | | 7,524,666 |
| CRB Group, Inc. (h) | | 6.250 | | 06/15/23 | | 5,000,000 | | 5,072,475 |
| Credit Suisse A.G. New York | | 5.400 | | 01/14/20 | | 18,903,000 | | 19,204,808 |
| CVS Health Corp. | | 2.250 | | 12/05/18 | | 14,994,000 | | 14,993,743 |
| D.R. Horton, Inc. | | 3.750 | | 03/01/19 | | 28,856,000 | | 28,849,459 |
| D.R. Horton, Inc. | | 4.000 | | 02/15/20 | | 271,000 | | 271,298 |
| Delphi Financial Group, Inc. | | 7.875 | | 01/31/20 | | 3,428,000 | | 3,587,178 |
| Deutsche Bank AG (3 month LIBOR + 1.450%) (c) | | 3.895 | | 01/18/19 | | 949,000 | | 949,395 |
| Deutsche Bank AG | | 2.500 | | 02/13/19 | | 12,981,000 | | 12,938,450 |
| Deutsche Bank AG | | 2.850 | | 05/10/19 | | 20,927,000 | | 20,801,520 |
| Deutsche Bank AG (3 month LIBOR + 1.910%) (c) | | 4.528 | | 05/10/19 | | 250,000 | | 250,000 |
| Deutsche Bank AG | | 3.150 | | 01/22/21 | | 250,000 | | 241,081 |
| Deutsche Bank AG | | 4.250 | | 10/14/21 | | 2,057,000 | | 2,006,599 |
| Deutsche Bank AG | | 4.250 | | 10/14/21 | | 313,000 | | 305,331 |
| Devon Energy Corp. | | 2.250 | | 12/15/18 | | 80,000 | | 79,986 |
| Devon Energy Corp. | | 6.300 | | 01/15/19 | | 172,000 | | 172,493 |
| Diamond 1 Finance Corp. / Diamond 2 Finance Corp. (h) | | 3.480 | | 06/01/19 | | 2,500,000 | | 2,494,621 |
| Digital Realty Trust, L.P. | | 5.875 | | 02/01/20 | | 304,000 | | 310,511 |
| Discover Bank | | 8.700 | | 11/18/19 | | 1,681,000 | | 1,758,341 |
| Discover Bank | | 7.000 | | 04/15/20 | | 4,450,000 | | 4,630,909 |
| Discover Financial Services | | 10.250 | | 07/15/19 | | 11,309,000 | | 11,749,144 |
| Dominion Gas Holdings, LLC | | 2.500 | | 12/15/19 | | 9,530,000 | | 9,435,197 |
| Dominion Resources, Inc. | | 1.875 | | 01/15/19 | | 1,250,000 | | 1,248,088 |
| Dominion Resources, Inc. | | 2.500 | | 12/01/19 | | 3,400,000 | | 3,366,393 |
| DPL Inc. | | 6.750 | | 10/01/19 | | 24,151,000 | | 24,452,888 |
| Dr Pepper Snapple Group, Inc. | | 2.600 | | 01/15/19 | | 5,000,000 | | 4,996,545 |
| Drawbridge Special Opportunities Fund L.P. (h) | | 5.000 | | 08/01/21 | | 15,000,000 | | 14,969,644 |
| Eagle Bancorp, Inc. (5.000% to 08/01/21, | | | | | | | | |
| then 3 month LIBOR + 3.850%) (c) | | 5.000 | | 08/01/26 | | 6,474,000 | | 6,483,565 |
| Eaton Corp. | | 6.950 | | 03/20/19 | | 340,000 | | 343,814 |
| Embraer Overseas Ltd. | | 6.375 | | 01/15/20 | | 13,540,000 | | 13,844,785 |
| Enable Midstream Partners, LP (b) | | 2.400 | | 05/15/19 | | 11,864,000 | | 11,792,090 |
| Enbridge Energy Partners, L.P. | | 9.875 | | 03/01/19 | | 3,010,000 | | 3,056,971 |
| Energy Transfer Partners, L.P. | | 9.700 | | 03/15/19 | | 10,549,000 | | 10,718,172 |
| Energy Transfer Partners, L.P. | | 9.000 | | 04/15/19 | | 2,817,000 | | 2,874,133 |
| EnLink Midstream Partners, LP | | 2.700 | | 04/01/19 | | 14,213,000 | | 14,105,682 |
| Enogex LLC (h) | | 6.250 | | 03/15/20 | | 1,295,000 | | 1,328,806 |
| Ensco PLC | | 8.000 | | 01/31/24 | | 12,306,000 | | 11,198,460 |
| Enstar Group Ltd. | | 4.500 | | 03/10/22 | | 25,056,000 | | 25,057,362 |
See Notes to Financial Statements.
23
| BOND FUND SCHEDULE OF INVESTMENTS(Continued) |
| November 30, 2018 |
| | | | Rate (%) | | Maturity Date | | Principal Amount | | Value |
| BONDS(continued) | | | | | | | | |
| |
| Corporate Bonds (continued) | | | | | | | | |
| Enterprise Products Operating LLC (3 month LIBOR + 2.7775%) (c) | | 5.099 | | 06/01/67 | | 8,538,000 | | $8,025,720 |
| Enterprise Products Operating LLC (5.250% to 08/16/27, | | | | | | | | |
| then 3 month LIBOR + 3.033%) (c) | | 5.250 | | 08/16/77 | | 6,666,000 | | 5,670,147 |
| Everest Reinsurance Holdings Inc. (3 month LIBOR + 2.385%) (c) | | 5.001 | | 05/01/67 | | 24,386,000 | | 23,166,700 |
| Exelon Generation Co., LLC | | 5.200 | | 10/01/19 | | 624,000 | | 633,679 |
| Exelon Generation Co., LLC | | 2.950 | | 01/15/20 | | 8,229,000 | | 8,176,618 |
| Express Scripts, Inc. | | 7.250 | | 06/15/19 | | 1,022,000 | | 1,042,912 |
| Exxon Mobil Corp. (3 month LIBOR + 0.780%) (c) | | 3.101 | | 03/01/19 | | 400,000 | | 400,683 |
| Fidelity Federal Bancorp (6.875% to 10/15/23, | | | | | | | | |
| then 3 month LIBOR + 3.790%) (c)(h) | | 6.875 | | 10/15/28 | | 6,500,000 | | 6,584,869 |
| Fifth Third Bancorp (4.900% to 09/30/19, | | | | | | | | |
| then 3 month LIBOR + 3.129%) (c)(g) | | 4.900 | | 09/30/19 | | 31,391,000 | | 30,920,135 |
| First Niagara Financial Group, Inc. | | 6.750 | | 03/19/20 | | 4,993,000 | | 5,191,394 |
| First Tennessee Bank N.A. | | 2.950 | | 12/01/19 | | 45,336,000 | | 45,081,268 |
| Flagstar Bancorp, Inc. | | 6.125 | | 07/15/21 | | 42,360,000 | | 44,058,679 |
| Flex Ltd. | | 4.625 | | 02/15/20 | | 5,650,000 | | 5,674,556 |
| Flushing Financial Corp. (5.250% to 12/15/21, | | | | | | | | |
| then 3 month LIBOR + 3.440%) (c) | | 5.250 | | 12/15/26 | | 730,000 | | 748,308 |
| FMC Corp. | | 5.200 | | 12/15/19 | | 5,000,000 | | 5,096,091 |
| Ford Motor Credit Co. LLC | | 2.375 | | 03/12/19 | | 1,155,000 | | 1,151,672 |
| Ford Motor Credit Co. LLC | | 2.262 | | 03/28/19 | | 5,562,000 | | 5,540,535 |
| Ford Motor Credit Co. LLC | | 2.021 | | 05/03/19 | | 1,000,000 | | 993,087 |
| Ford Motor Credit Co. LLC | | 1.897 | | 08/12/19 | | 15,170,000 | | 14,948,838 |
| Ford Motor Credit Co. LLC | | 2.597 | | 11/04/19 | | 37,480,000 | | 36,984,449 |
| Ford Motor Credit Co. LLC | | 2.681 | | 01/09/20 | | 946,000 | | 932,253 |
| Ford Motor Credit Co. LLC | | 8.125 | | 01/15/20 | | 500,000 | | 520,811 |
| FS Investment Corp. | | 4.000 | | 07/15/19 | | 4,402,000 | | 4,400,918 |
| GATX Corp. | | 2.500 | | 03/15/19 | | 11,908,000 | | 11,890,307 |
| GATX Corp. | | 2.600 | | 03/30/20 | | 3,291,000 | | 3,247,043 |
| General Electric Capital Corp. | | 5.100 | | 02/15/19 | | 522,000 | | 522,000 |
| General Electric Capital Corp. (3 month LIBOR + 1.000%) (c) | | 3.436 | | 04/15/23 | | 10,075,000 | | 9,017,125 |
| General Electric Capital Corp. (3 month LIBOR + 0.380%) (c) | | 2.962 | | 05/05/26 | | 5,148,000 | | 4,191,568 |
| General Electric Co. (5.000% to 01/21/21, | | | | | | | | |
| then 3 month LIBOR + 3.330%) (c)(g) | | 5.000 | | 01/21/21 | | 46,706,000 | | 37,131,270 |
| General Electric Co. / LJ VP Holdings LLC (h) | | 3.800 | | 06/18/19 | | 750,000 | | 746,025 |
| General Mills, Inc. | | 5.650 | | 02/15/19 | | 1,940,000 | | 1,948,284 |
| General Motors Financial Co., Inc. | | 2.400 | | 05/09/19 | | 750,000 | | 746,722 |
| General Motors Financial Co., Inc. | | 3.150 | | 01/15/20 | | 6,918,000 | | 6,868,394 |
| General Motors Financial Co., Inc. | | 2.650 | | 04/13/20 | | 5,730,000 | | 5,655,939 |
| Genworth Financial Inc. | | 7.700 | | 06/15/20 | | 2,918,000 | | 2,969,065 |
| Glencore Funding LLC (h) | | 2.500 | | 01/15/19 | | 2,146,000 | | 2,143,725 |
| Goldman Sachs Group, Inc. | | 2.300 | | 12/13/19 | | 5,000,000 | | 4,946,909 |
| Goldman Sachs Group, Inc. (3.000% to 08/31/19, then 4.000%) (d) | | 3.000 | | 08/31/20 | | 15,000,000 | | 14,707,135 |
| Goldman Sachs Group, Inc. (3 month LIBOR + 1.600%) (c) | | 4.306 | | 11/29/23 | | 11,736,000 | | 11,861,835 |
| Hainan Airlines Hong Kong Co., Ltd. (h) | | 3.625 | | 02/07/20 | | 14,737,000 | | 14,636,906 |
| Harley-Davidson Financial Services, Inc. (h) | | 2.400 | | 09/15/19 | | 1,500,000 | | 1,487,389 |
| Harley-Davidson Financial Services, Inc. (h) | | 2.150 | | 02/26/20 | | 11,848,000 | | 11,648,795 |
| Harley-Davidson Financial Services, Inc. (h) | | 2.150 | | 02/26/20 | | 500,000 | | 491,593 |
| HCA Inc. | | 4.250 | | 10/15/19 | | 1,611,000 | | 1,615,028 |
See Notes to Financial Statements.
24
| BOND FUND SCHEDULE OF INVESTMENTS(Continued) |
| November 30, 2018 |
| | | | Rate (%) | | Maturity Date | | Principal Amount | | Value |
| BONDS(continued) | | | | | | | | |
| |
| Corporate Bonds (continued) | | | | | | | | |
| HCA Inc. | | 6.500 | | 02/15/20 | | 11,351,000 | | $11,663,153 |
| Health Care REIT, Inc. | | 4.125 | | 04/01/19 | | 5,750,000 | | 5,754,054 |
| Hillshire Brands Co. | | 4.100 | | 09/15/20 | | 1,935,000 | | 1,946,479 |
| Holcim US Finance Sarl & Cie S.C.S. (h) | | 6.000 | | 12/30/19 | | 1,650,000 | | 1,691,910 |
| Home BancShares Inc. (5.625% to 04/15/22, | | | | | | | | |
| then 3 month LIBOR + 3.575%) (c) | | 5.625 | | 04/15/27 | | 4,950,000 | | 5,051,416 |
| Hughes Satellite Systems Corp. | | 6.500 | | 06/15/19 | | 9,068,000 | | 9,192,685 |
| Humana Inc. | | 2.625 | | 10/01/19 | | 3,013,000 | | 3,002,869 |
| Husky Energy Inc. | | 7.250 | | 12/15/19 | | 10,901,000 | | 11,207,100 |
| Hyundai Capital Services, Inc. (h) | | 1.625 | | 08/30/19 | | 1,180,000 | | 1,163,183 |
| International Lease Finance Corp. | | 6.250 | | 05/15/19 | | 1,553,000 | | 1,569,491 |
| International Lease Finance Corp. | | 4.625 | | 04/15/21 | | 322,000 | | 326,285 |
| Investar Holding Corp. (6.000% to 03/30/22, | | | | | | | | |
| then 3 month LIBOR + 3.945%) (c) | | 6.000 | | 03/30/27 | | 500,000 | | 515,802 |
| INVISTA Finance LLC (h) | | 4.250 | | 10/15/19 | | 32,165,000 | | 32,071,721 |
| IPALCO Enterprises, Inc. | | 3.450 | | 07/15/20 | | 865,000 | | 859,748 |
| Jersey Central Power & Light Co. | | 7.350 | | 02/01/19 | | 500,000 | | 503,538 |
| JM Smucker Co. | | 2.200 | | 12/06/19 | | 7,500,000 | | 7,393,287 |
| Johnson Controls, Inc. | | 5.000 | | 03/30/20 | | 1,000,000 | | 1,018,057 |
| JPMorgan Chase & Co. (3 month LIBOR + 3.470%) (c)(g) | | 5.990 | | 01/30/19 | | 14,903,000 | | 14,958,886 |
| JPMorgan Chase & Co. (5.000% to 07/01/19, | | | | | | | | |
| then 3 month LIBOR + 3.320%) (c)(g) | | 5.000 | | 07/01/19 | | 7,500,000 | | 7,474,500 |
| Juniper Networks, Inc. | | 3.125 | | 02/26/19 | | 2,200,000 | | 2,200,541 |
| Keysight Technologies, Inc. | | 3.300 | | 10/30/19 | | 22,001,000 | | 21,960,852 |
| Kinder Morgan Energy Partners, L.P. | | 2.650 | | 02/01/19 | | 2,231,000 | | 2,227,006 |
| Kinder Morgan Energy Partners, L.P. | | 9.000 | | 02/01/19 | | 6,179,000 | | 6,234,221 |
| Kinder Morgan Inc. | | 3.050 | | 12/01/19 | | 15,901,000 | | 15,784,833 |
| Laclede Group, Inc. | | 2.550 | | 08/15/19 | | 4,695,000 | | 4,657,706 |
| Land O’ Lakes, Inc. (h) | | 6.000 | | 11/15/22 | | 4,167,000 | | 4,308,326 |
| Life Technologies Corp. | | 6.000 | | 03/01/20 | | 334,000 | | 343,425 |
| Lincoln National Corp. (3 month LIBOR + 2.3575%) (c) | | 4.998 | | 05/17/66 | | 25,985,000 | | 22,009,295 |
| Lincoln National Corp. (3 month LIBOR + 2.040%) (c) | | 4.509 | | 04/20/67 | | 25,070,000 | | 20,682,750 |
| Lloyds Bank PLC (h) | | 5.800 | | 01/13/20 | | 600,000 | | 614,102 |
| Manufacturers & Traders Trust Co. (1 month LIBOR + 1.215%) (c) | | 3.552 | | 12/28/20 | | 14,173,000 | | 14,176,762 |
| Manufacturers & Traders Trust Co. (3 month LIBOR + 0.640%) (c) | | 2.961 | | 12/01/21 | | 1,007,000 | | 999,611 |
| MarkWest Energy Partners, L.P. / MarkWest Energy Finance Corp. | | 5.500 | | 02/15/23 | | 1,403,000 | | 1,429,087 |
| Marriott Int’l., Inc. | | 3.000 | | 03/01/19 | | 7,825,000 | | 7,818,496 |
| MBIA Inc. | | 6.400 | | 08/15/22 | | 75,059,000 | | 72,431,935 |
| Medtronic Global Holdings S.C.A. | | 1.700 | | 03/28/19 | | 100,000 | | 99,639 |
| Merrill Lynch & Co. (3 month LIBOR + 0.760%) (c) | | 3.094 | | 09/15/26 | | 3,870,000 | | 3,632,980 |
| Meta Financial Group, Inc. (5.750% to 08/15/21, | | | | | | | | |
| then 3 month LIBOR + 4.630%) (c) | | 5.750 | | 08/15/26 | | 3,200,000 | | 3,279,342 |
| MetLife, Inc. (5.250% to 06/15/20, | | | | | | | | |
| then 3 month LIBOR + 3.575%) (c)(g) | | 5.250 | | 06/15/20 | | 5,490,000 | | 5,468,040 |
| Metropolitan Edison Co. | | 7.700 | | 01/15/19 | | 1,511,000 | | 1,518,890 |
| Midcontinent Express Pipeline LLC (h) | | 6.700 | | 09/15/19 | | 22,665,000 | | 22,874,864 |
| Minnwest Corp. (5.875% to 07/15/23, | | | | | | | | |
| then 3 month LIBOR + 2.980%) (c)(h) | | 5.875 | | 07/15/28 | | 6,000,000 | | 6,021,078 |
| Mizuho Bank, Ltd. (h) | | 2.650 | | 09/25/19 | | 4,545,000 | | 4,530,098 |
See Notes to Financial Statements.
25
| BOND FUND SCHEDULE OF INVESTMENTS(Continued) |
| November 30, 2018 |
| | | | Rate (%) | | Maturity Date | | Principal Amount | | Value |
| BONDS(continued) | | | | | | | | |
| |
| Corporate Bonds (continued) | | | | | | | | |
| Molson Coors Brewing Co. | | 1.900 | | 03/15/19 | | 1,977,000 | | $1,970,056 |
| Molson Coors Brewing Co. | | 2.250 | | 03/15/20 | | 17,686,000 | | 17,375,249 |
| Morgan Stanley | | 2.450 | | 02/01/19 | | 10,000,000 | | 9,988,719 |
| Morgan Stanley (CPI YOY + 2.000%, floor 0.000%, cap 8.000%) (c) | | 4.699 | | 04/01/21 | | 130,000 | | 129,350 |
| Morgan Stanley (CPI YOY + 2.000%, floor 0.000%, cap 8.000%) (c) | | 4.699 | | 06/09/23 | | 100,000 | | 98,750 |
| Motiva Enterprises LLC (h) | | 5.750 | | 01/15/20 | | 1,330,000 | | 1,353,158 |
| MPT Operating Partnership, L.P. / MPT Finance Corp. | | 6.375 | | 03/01/24 | | 24,820,000 | | 25,688,700 |
| Mylan N.V. | | 2.500 | | 06/07/19 | | 6,592,000 | | 6,553,770 |
| National Bank of Canada | | 2.100 | | 12/14/18 | | 19,613,000 | | 19,610,208 |
| NetApp, Inc. | | 2.000 | | 09/27/19 | | 220,000 | | 217,646 |
| Newell Brands, Inc. | | 2.600 | | 03/29/19 | | 10,250,000 | | 10,218,956 |
| NexBank Capital, Inc. (5.500% to 03/15/21, | | | | | | | | |
| then 3 month LIBOR + 4.355%) (c)(h) | | 5.500 | | 03/16/26 | | 14,500,000 | | 14,587,282 |
| Noble Holding Int’l. Ltd. | | 4.625 | | 03/01/21 | | 6,657,000 | | 6,374,078 |
| Nordea Bank AB (h) | | 2.125 | | 05/29/20 | | 8,150,000 | | 7,989,098 |
| Northpointe Bank (6.875% to 10/01/23, | | | | | | | | |
| then 3 month LIBOR + 3.765%) (c)(h) | | 6.875 | | 10/01/28 | | 5,000,000 | | 5,055,244 |
| Nutrien Ltd. | | 6.750 | | 01/15/19 | | 3,974,000 | | 3,989,260 |
| Nutrien Ltd. | | 4.875 | | 03/30/20 | | 4,902,000 | | 4,983,046 |
| NXP B.V. / NXP Funding LLC (h) | | 4.125 | | 06/15/20 | | 2,000,000 | | 1,997,540 |
| NXP B.V. / NXP Funding LLC (h) | | 4.125 | | 06/01/21 | | 15,442,000 | | 15,268,278 |
| ONEOK Partners, L.P. | | 8.625 | | 03/01/19 | | 10,106,000 | | 10,230,933 |
| Pacific Continental Corp. (5.875% to 06/30/21, | | | | | | | | |
| then 3 month LIBOR + 4.715%) (c) | | 5.875 | | 06/30/26 | | 500,000 | | 504,447 |
| Pearson Funding Four PLC (h) | | 3.750 | | 05/08/22 | | 3,300,000 | | 3,217,318 |
| Penske Truck Leasing Co., L.P. / PTL Finance Corp. (h) | | 3.050 | | 01/09/20 | | 5,265,000 | | 5,238,742 |
| Pentair Finance S.A. | | 2.650 | | 12/01/19 | | 6,160,000 | | 6,114,616 |
| Perrigo Finance Unlimited Co. | | 3.500 | | 03/15/21 | | 900,000 | | 883,871 |
| Pershing Road Development Co., LLC | | | | | | | | |
| (3 month LIBOR + 0.400%) (c)(h) | | 2.721 | | 09/15/22 | | 2,738,000 | | 2,696,930 |
| Pershing Road Development Co., LLC | | | | | | | | |
| (3 month LIBOR + 0.400%) (c)(h) | | 2.734 | | 09/15/22 | | 1,000,000 | | 985,000 |
| Pershing Road Development Co., LLC | | | | | | | | |
| (3 month LIBOR + 0.400%) (c)(h) | | 2.721 | | 09/15/23 | | 3,791,000 | | 3,705,703 |
| Pershing Road Development Co., LLC | | | | | | | | |
| (3 month LIBOR + 0.400%) (c)(h) | | 2.734 | | 09/15/23 | | 1,705,000 | | 1,666,638 |
| Pershing Road Development Co., LLC | | | | | | | | |
| (3 month LIBOR + 0.400%) (c)(h) | | 2.721 | | 09/15/24 | | 3,399,000 | | 3,288,533 |
| Pershing Road Development Co., LLC | | | | | | | | |
| (3 month LIBOR + 0.400%) (c)(h) | | 2.734 | | 09/15/24 | | 1,815,000 | | 1,756,013 |
| Pershing Road Development Co., LLC | | | | | | | | |
| (3 month LIBOR + 0.400%) (c)(h) | | 2.734 | | 09/15/25 | | 1,530,000 | | 1,472,625 |
| Pershing Road Development Co., LLC | | | | | | | | |
| (3 month LIBOR + 0.400%) (c)(h) | | 2.721 | | 09/15/26 | | 865,000 | | 826,075 |
| Phillips 66 (3 month LIBOR + 0.750%) (c)(h) | | 3.186 | | 04/15/20 | | 18,241,000 | | 18,244,622 |
| Principal Financial Group, Inc. (4.700% to 05/15/20, | | | | | | | | |
| then 3 month LIBOR + 3.044%) (c) | | 4.700 | | 05/15/55 | | 32,000,000 | | 31,040,000 |
| Progress Energy, Inc. | | 7.050 | | 03/15/19 | | 2,185,000 | | 2,209,325 |
| Prospect Capital Corp. | | 4.250 | | 06/15/20 | | 500,000 | | 494,032 |
| Protective Life Corp. | | 7.375 | | 10/15/19 | | 8,311,000 | | 8,595,108 |
See Notes to Financial Statements.
26
| BOND FUND SCHEDULE OF INVESTMENTS(Continued) |
| November 30, 2018 |
| | | | Rate (%) | | Maturity Date | | Principal Amount | | Value |
| BONDS(continued) | | | | | | | | |
| |
| Corporate Bonds (continued) | | | | | | | | |
| Public Service Co. of Oklahoma | | 5.150 | | 12/01/19 | | 7,450,000 | | $7,597,810 |
| QBE Capital Funding III Ltd. (7.250% to 05/24/21, | | | | | | | | |
| then USSW10 + 4.050%) (c)(h) | | 7.250 | | 05/24/41 | | 1,795,000 | | 1,884,750 |
| Quest Diagnostics Inc. | | 4.750 | | 01/30/20 | | 3,950,000 | | 4,015,166 |
| QVC Inc. | | 3.125 | | 04/01/19 | | 19,683,000 | | 19,649,116 |
| R. J. Reynolds Tobacco Co. | | 8.125 | | 06/23/19 | | 1,875,000 | | 1,919,708 |
| RBB Bancorp (6.500% to 03/31/21, | | | | | | | | |
| then 3 month LIBOR + 5.160%) (c)(h) | | 6.500 | | 03/31/26 | | 2,000,000 | | 2,087,102 |
| RBB Bancorp (6.180% to 12/01/23, | | | | | | | | |
| then 3 month LIBOR + 3.150%) (c)(h) | | 6.180 | | 12/01/28 | | 5,000,000 | | 5,000,728 |
| ReadyCap Holdings, LLC (h) | | 7.500 | | 02/15/22 | | 26,000,000 | | 26,588,605 |
| Reckson Operating Partnership, L.P. | | 7.750 | | 03/15/20 | | 874,000 | | 917,554 |
| Reed Elsevier Capital Inc. | | 8.625 | | 01/15/19 | | 7,648,000 | | 7,692,368 |
| Reinsurance Group of America, Inc. | | 6.450 | | 11/15/19 | | 4,423,000 | | 4,538,063 |
| Reinsurance Group of America, Inc. (3 month LIBOR + 2.665%) (c) | | 4.999 | | 12/15/65 | | 33,029,000 | | 32,368,420 |
| Renasant Corp. (5.000% to 09/01/21, | | | | | | | | |
| then 3 month LIBOR + 3.840%) (c) | | 5.000 | | 09/01/26 | | 4,100,000 | | 4,093,131 |
| RenRe North America Holdings Inc. | | 5.750 | | 03/15/20 | | 3,200,000 | | 3,277,884 |
| Rockies Express Pipeline LLC (h) | | 5.625 | | 04/15/20 | | 8,985,000 | | 9,074,850 |
| Royal Bank of Canada (6.100% where USISDA10 | | | | | | | | |
| is greater than or equal to 1.784%) (c) | | 6.100 | | 08/15/19 | | 2,000,000 | | 2,024,000 |
| Royal Bank of Scotland Group PLC | | 6.400 | | 10/21/19 | | 1,165,000 | | 1,191,064 |
| RPM Int’l., Inc. | | 6.125 | | 10/15/19 | | 4,013,000 | | 4,104,198 |
| Ryder System, Inc. | | 2.350 | | 02/26/19 | | 775,000 | | 773,620 |
| SAIC, Inc. | | 4.450 | | 12/01/20 | | 13,028,000 | | 13,093,140 |
| Select Income REIT | | 3.600 | | 02/01/20 | | 16,526,000 | | 16,399,677 |
| Select Income REIT | | 4.150 | | 02/01/22 | | 10,919,000 | | 10,790,840 |
| Select Income REIT | | 4.250 | | 05/15/24 | | 6,441,000 | | 6,094,085 |
| Senior Housing Properties Trust | | 3.250 | | 05/01/19 | | 23,183,000 | | 23,124,378 |
| Senior Housing Properties Trust | | 6.750 | | 04/15/20 | | 4,824,000 | | 4,937,185 |
| Senior Housing Properties Trust | | 6.750 | | 12/15/21 | | 7,390,000 | | 7,821,137 |
| SESI LLC | | 7.125 | | 12/15/21 | | 38,264,000 | | 36,159,480 |
| Shire Acquisitions Investments Ireland DAC | | 1.900 | | 09/23/19 | | 33,465,000 | | 32,949,573 |
| Silversea Cruise Finance Ltd. (h) | | 7.250 | | 02/01/25 | | 23,000,000 | | 24,667,500 |
| SLM Corp. | | 5.190 | | 04/24/19 | | 529,000 | | 527,016 |
| SLM Corp. (d) | | 6.250 | | 09/15/20 | | 172,000 | | 168,689 |
| SLM Corp. (d) | | 6.750 | | 12/15/20 | | 306,000 | | 302,026 |
| SLM Corp. (d) | | 6.750 | | 12/15/20 | | 95,000 | | 93,766 |
| SLM Corp. (d) | | 8.000 | | 12/15/20 | | 71,000 | | 71,746 |
| SLM Corp. | | 6.000 | | 06/15/21 | | 261,000 | | 251,954 |
| SLM Corp. | | 6.150 | | 06/15/21 | | 146,000 | | 141,443 |
| SLM Corp. | | 7.250 | | 01/25/22 | | 602,000 | | 614,040 |
| Smithfield Foods, Inc. (h) | | 2.700 | | 01/31/20 | | 9,125,000 | | 8,978,977 |
| Smithfield Foods, Inc. (h) | | 2.650 | | 10/03/21 | | 4,578,000 | | 4,348,050 |
| Southern National Bancorp of Virginia, Inc. (5.875% to 01/31/22, | | | | | | | | |
| then 3 month LIBOR + 3.950%) (c)(h) | | 5.875 | | 01/31/27 | | 2,000,000 | | 2,048,787 |
| Southern Power Co. | | 1.950 | | 12/15/19 | | 11,891,000 | | 11,677,982 |
| Southside Bancshares, Inc. (5.500% to 09/30/21, | | | | | | | | |
| then 3 month LIBOR + 4.297%) (c) | | 5.500 | | 09/30/26 | | 980,000 | | 998,064 |
See Notes to Financial Statements.
27
| BOND FUND SCHEDULE OF INVESTMENTS(Continued) |
| November 30, 2018 |
| | | | Rate (%) | | Maturity Date | | Principal Amount | | Value |
| BONDS(continued) | | | | | | | | |
| |
| Corporate Bonds (continued) | | | | | | | | |
| Sprint Spectrum Co. LLC (b)(h) | | 3.360 | | 03/20/23 | | 25,658,250 | | $25,369,595 |
| Standard Chartered PLC (h) | | 2.100 | | 08/19/19 | | 16,075,000 | | 15,939,048 |
| Standard Chartered PLC (h) | | 2.400 | | 09/08/19 | | 11,000,000 | | 10,914,684 |
| Standard Chartered PLC (h) | | 2.400 | | 09/08/19 | | 3,700,000 | | 3,671,303 |
| Stanley Black & Decker Inc. (5.750% to 12/15/18, | | | | | | | | |
| then 3 month LIBOR + 4.304%) (c) | | 5.750 | | 12/15/53 | | 22,492,000 | | 22,379,540 |
| Steelcase Inc. | | 6.375 | | 02/15/21 | | 4,000,000 | | 4,170,919 |
| Sumitomo Mitsui Banking Corp. (3 month LIBOR + 0.940%) (c) | | 3.385 | | 01/18/19 | | 600,000 | | 600,324 |
| Synchrony Financial | | 2.600 | | 01/15/19 | | 26,975,000 | | 26,943,439 |
| TECO Finance, Inc. | | 5.150 | | 03/15/20 | | 2,800,000 | | 2,855,457 |
| Textron Inc. | | 7.250 | | 10/01/19 | | 2,000,000 | | 2,065,032 |
| Toyota Motor Credit Corp. (3 month LIBOR + 0.260%, | | | | | | | | |
| floor 0.000%) (c) | | 2.668 | | 01/09/19 | | 340,000 | | 340,035 |
| TransCanada PipeLines Ltd. (3 month LIBOR + 2.210%) (c) | | 4.826 | | 05/15/67 | | 19,398,000 | | 16,439,805 |
| Twenty-First Century Fox America, Inc. | | 6.900 | | 03/01/19 | | 5,728,000 | | 5,781,487 |
| Tyco Electronics Group S.A. | | 2.375 | | 12/17/18 | | 3,573,000 | | 3,572,321 |
| United Business Media plc (h) | | 5.750 | | 11/03/20 | | 6,915,000 | | 7,089,918 |
| United Rentals N.A., Inc. | | 4.625 | | 07/15/23 | | 12,607,000 | | 12,528,206 |
| United Technologies Corp. | | 8.875 | | 11/15/19 | | 10,000,000 | | 10,540,593 |
| UTB Financial Holding Co. (6.500% to 09/01/23, | | | | | | | | |
| then 3 month LIBOR + 3.620%) (c)(h) | | 6.500 | | 09/01/28 | | 6,000,000 | | 6,094,722 |
| Viacom Inc. | | 5.625 | | 09/15/19 | | 1,180,000 | | 1,203,445 |
| Viacom Inc. | | 2.750 | | 12/15/19 | | 280,000 | | 278,494 |
| Walgreen Co. | | 5.250 | | 01/15/19 | | 2,510,000 | | 2,515,917 |
| Walgreens Boots Alliance, Inc. | | 2.700 | | 11/18/19 | | 5,732,000 | | 5,688,310 |
| Western Union Co. (3 month LIBOR + 0.800%) (c) | | 3.453 | | 05/22/19 | | 43,980,000 | | 44,009,278 |
| Weyerhaeuser Co. | | 7.375 | | 10/01/19 | | 34,000 | | 35,045 |
| Willis North America Inc. | | 7.000 | | 09/29/19 | | 1,674,000 | | 1,721,785 |
| Worthington Industries, Inc. | | 6.500 | | 04/15/20 | | 8,000,000 | | 8,248,446 |
| WT Holdings, Inc. (h) | | 7.000 | | 04/30/23 | | 17,000,000 | | 17,025,500 |
| XL Group PLC (3 month LIBOR + 2.4575%) (c)(g) | | 4.894 | | 12/31/18 | | 85,311,000 | | 80,298,979 |
| |
| Residential Mortgage-Backed Securities - 0.1% | | | | | | | | 2,418,580 |
| Hawaii Housing Finance & Development Corp. | | 2.600 | | 07/01/37 | | 347,892 | | 323,285 |
| Minnesota Housing Finance Agency | | 2.700 | | 09/01/41 | | 2,252,860 | | 2,095,295 |
| |
| Sovereign Bonds - 1.4% | | | | | | | | 54,983,005 |
| Bayerische Landesbank (3 month LIBOR + 1.160% where | | | | | | | | |
| (USISDA30 - USISDA02) is greater than -0.250%) (c) | | 3.558 | | 10/02/21 | | 6,000,000 | | 6,106,643 |
| Comision Federal de Electricidad (h) | | 4.875 | | 05/26/21 | | 5,285,000 | | 5,232,203 |
| Petroleos Mexicanos | | 8.000 | | 05/03/19 | | 2,871,000 | | 2,905,452 |
| Petroleos Mexicanos | | 6.000 | | 03/05/20 | | 10,000,000 | | 10,135,500 |
| Petroleos Mexicanos | | 6.375 | | 02/04/21 | | 14,793,000 | | 14,926,285 |
| Petroleos Mexicanos | | 3.500 | | 01/30/23 | | 6,025,000 | | 5,427,922 |
| Petroleos Mexicanos | | 4.875 | | 01/18/24 | | 11,080,000 | | 10,249,000 |
| |
| Taxable Municipal Bonds - 3.1% | | | | | | | | 111,728,841 |
| California Statewide Communities Development Authority | | 5.370 | | 06/01/21 | | 425,000 | | 429,917 |
| Casino Reinvestment Development Authority NJ | | 5.340 | | 06/01/20 | | 3,105,000 | | 3,120,152 |
See Notes to Financial Statements.
28
| BOND FUND SCHEDULE OF INVESTMENTS(Continued) |
| November 30, 2018 |
| | Rate (%) | | Maturity Date | | Principal Amount | | Value |
| BONDS(continued) | | | | | | | | |
| | | | | | | | | |
| Taxable Municipal Bonds (continued) | | | | | | | | |
| City of Berwyn IL General Obligation | | 3.550 | | 12/01/18 | | 480,000 | | $480,000 |
| City of Long Beach CA Pension Obligation | | 5.180 | | 09/01/21 | | 3,180,000 | | 3,286,753 |
| City of Miami FL | | 6.750 | | 12/01/18 | | 530,000 | | 530,021 |
| City of Newark NJ | | 3.057 | | 04/01/20 | | 700,000 | | 690,445 |
| County of Cuyahoga OH | | 5.000 | | 12/01/19 | | 95,000 | | 95,016 |
| County of Ohio WV Special District Excise Tax Revenue | | 4.000 | | 03/01/19 | | 250,000 | | 250,460 |
| County of Ohio WV Special District Excise Tax Revenue | | 3.500 | | 03/01/20 | | 495,000 | | 495,010 |
| County of Ohio WV Special District Excise Tax Revenue | | 4.000 | | 03/01/20 | | 575,000 | | 579,905 |
| County of Racine WI Anticipation Notes | | 3.050 | | 12/01/20 | | 62,900,000 | | 62,532,664 |
| County of Reeves TX Certs. of Participation | | 5.625 | | 12/01/18 | | 31,840 | | 31,817 |
| County of Reeves TX Certs. of Participation | | 6.500 | | 12/01/18 | | 57,714 | | 57,673 |
| County of Reeves TX Certs. of Participation | | 7.500 | | 12/01/18 | | 8,973 | | 8,966 |
| County of Reeves TX Certs. of Participation | | 6.750 | | 12/01/19 | | 1,320,000 | | 1,108,840 |
| County of Reeves TX Certs. of Participation | | 6.125 | | 12/01/20 | | 680,000 | | 523,280 |
| County of Reeves TX Certs. of Participation | | 6.875 | | 12/01/20 | | 370,000 | | 284,545 |
| County of Reeves TX Certs. of Participation | | 6.375 | | 12/01/21 | | 45,000 | | 32,974 |
| County of Reeves TX Certs. of Participation | | 7.000 | | 12/01/21 | | 500,000 | | 366,300 |
| County of Reeves TX Certs. of Participation | | 7.700 | | 12/01/21 | | 3,340,000 | | 2,478,480 |
| Eastern Illinois University | | 5.450 | | 04/01/19 | | 515,000 | | 517,261 |
| Eastern Illinois University | | 5.600 | | 04/01/20 | | 585,000 | | 587,504 |
| Eastern Illinois University | | 5.700 | | 04/01/21 | | 125,000 | | 125,559 |
| Fannin County TX Public Facility Corp. | | 5.200 | | 10/01/19 | | 515,000 | | 500,117 |
| Fannin County TX Public Facility Corp. | | 5.650 | | 10/01/21 | | 825,000 | | 751,385 |
| Florida State Mid-Bay Bridge Authority | | 3.784 | | 10/01/21 | | 2,800,000 | | 2,784,180 |
| Garza County TX Public Facility Corp. | | 6.200 | | 10/01/20 | | 855,000 | | 743,098 |
| Guam Gov’t. Business Privilege Tax Revenue | | 4.383 | | 01/01/22 | | 1,535,000 | | 1,556,475 |
| LL & P Wind Energy, Inc. WA (h) | | 5.983 | | 12/01/22 | | 8,595,000 | | 8,836,605 |
| New Jersey Economic Development Authority | | 3.300 | | 06/15/19 | | 1,000,000 | | 999,920 |
| New Jersey Economic Development Authority | | 3.290 | | 07/01/19 | | 320,000 | | 320,122 |
| New Jersey Sports & Exposition Authority | | 6.076 | | 03/01/23 | | 415,000 | | 441,236 |
| North Texas Tollway Authority | | 8.910 | | 02/01/30 | | 535,000 | | 566,223 |
| Pontotoc County OK Educational Facilities Authority | | 4.119 | | 09/01/23 | | 215,000 | | 216,524 |
| Public Finance Authority WI Student Housing Revenue | | 4.500 | | 07/01/21 | | 1,110,000 | | 1,098,112 |
| San Luis AZ Facility Development Corp. | | 5.350 | | 05/01/19 | | 1,240,000 | | 1,217,903 |
| San Luis AZ Facility Development Corp. | | 5.600 | | 05/01/20 | | 670,000 | | 610,819 |
| San Luis AZ Facility Development Corp. | | 5.700 | | 05/01/20 | | 850,000 | | 774,911 |
| San Luis AZ Facility Development Corp. | | 5.800 | | 05/01/21 | | 1,055,000 | | 897,731 |
| San Luis AZ Facility Development Corp. | | 5.900 | | 05/01/21 | | 980,000 | | 833,902 |
| San Luis AZ Facility Development Corp. | | 6.100 | | 05/01/22 | | 1,030,000 | | 823,454 |
| San Luis AZ Facility Development Corp. | | 6.200 | | 05/01/22 | | 1,035,000 | | 827,431 |
| State of Connecticut General Obligation | | 2.300 | | 01/15/19 | | 1,000,000 | | 999,100 |
| Summit County OH Development Finance Authority | | 6.250 | | 05/15/26 | | 630,000 | | 632,394 |
| Town of Hamden CT General Obligation | | 4.000 | | 08/15/19 | | 680,000 | | 682,176 |
| Town of Oyster Bay NY General Obligation | | 3.800 | | 02/01/20 | | 1,725,000 | | 1,722,119 |
| Town of Oyster Bay NY General Obligation | | 3.950 | | 02/01/21 | | 890,000 | | 887,686 |
| Utah Infrastructure Agency Telecommunications | | | | | | | | |
| Revenue and Refunding | | 3.500 | | 10/15/23 | | 3,050,000 | | 2,971,676 |
| Willacy County TX Public Facility Corp. | | 5.600 | | 12/01/18 | | 420,000 | | 420,000 |
See Notes to Financial Statements.
29
| BOND FUND SCHEDULE OF INVESTMENTS(Continued) |
| November 30, 2018 |
| | | | Rate (%) | | Maturity Date | | Principal Amount | | Value |
| BONDS(continued) | | | | | | | | |
| | | | | | | | | |
| Tax-Exempt Municipal Bonds - 0.2% | | | | | | | | $6,144,806 |
| Casino Reinvestment Development Authority NJ | | 5.250 | | 06/01/19 | | 5,000,000 | | 5,014,750 |
| Puerto Rico Commonwealth | | 5.500 | | 07/01/19 | | 130,000 | | 131,977 |
| Puerto Rico Electric Power Authority | | 5.000 | | 07/01/19 | | 770,000 | | 776,722 |
| Puerto Rico Highways & Transportation Authority | | 4.125 | | 07/01/19 | | 120,000 | | 120,192 |
| Puerto Rico Municipal Finance Agency | | 5.250 | | 08/01/19 | | 100,000 | | 101,165 |
| | | | | | | | | |
| U.S. Government Agency Mortgage-Backed Securities - 0.1% | | | | | | | | 2,701,625 |
| Fannie Mae REMIC, Series 2013-29 Class AI IO | | 2.500 | | 04/25/28 | | 6,378,394 | | 449,412 |
| Freddie Mac, Series C9-0241 | | 6.500 | | 12/01/18 | | 165 | | 165 |
| Freddie Mac REMIC, Series 4136 Class IH IO | | 3.500 | | 09/15/27 | | 8,871,085 | | 804,849 |
| Freddie Mac REMIC, Series 4238 Class NS IO (-1.0 times 1 month | | | | | | | | |
| LIBOR + 6.700%, floor 0.000%, cap 6.700%) (c) | | 4.394 | | 02/15/42 | | 3,807,845 | | 474,448 |
| Freddie Mac Structured Agency Credit Risk Debt Notes, | | | | | | | | |
| Series 2014-HQ1 M2 (1 month LIBOR + 2.500%, floor 0.000%) (c) | | 4.815 | | 08/25/24 | | 947,897 | | 949,798 |
| Ginnie Mae, Series 78-2071X | | 7.000 | | 05/15/33 | | 20,438 | | 22,953 |
| | | | | | | | | |
| U.S. Government & Agency Securities - 4.5% | | | | | | | | 164,387,373 |
| Fannie Mae | | 1.125 | | 12/14/18 | | 302,000 | | 301,895 |
| Fannie Mae | | 1.050 | | 07/12/19 | | 1,000,000 | | 990,264 |
| Fannie Mae | | 1.125 | | 07/26/19 | | 500,000 | | 494,959 |
| Fannie Mae | | 0.875 | | 08/02/19 | | 7,950,000 | | 7,855,872 |
| Fannie Mae | | 1.350 | | 08/26/19 | | 305,000 | | 302,086 |
| Fannie Mae | | 1.750 | | 09/12/19 | | 2,680,000 | | 2,660,195 |
| Fannie Mae (f) | | 0.000 | | 10/09/19 | | 12,140,000 | | 11,854,533 |
| Fannie Mae | | 1.100 | | 10/17/19 | | 1,412,000 | | 1,392,044 |
| Fannie Mae | | 1.230 | | 10/17/19 | | 28,663,000 | | 28,289,808 |
| Fannie Mae | | 1.000 | | 10/24/19 | | 4,035,000 | | 3,972,809 |
| Fannie Mae | | 1.750 | | 11/26/19 | | 1,564,000 | | 1,548,654 |
| Fannie Mae | | 1.250 | | 12/30/19 | | 100,000 | | 98,388 |
| Fannie Mae | | 1.350 | | 12/30/19 | | 100,000 | | 98,469 |
| Fannie Mae | | 1.375 | | 12/30/19 | | 433,000 | | 426,586 |
| Fannie Mae | | 1.580 | | 12/30/19 | | 150,000 | | 148,102 |
| Fannie Mae | | 1.625 | | 01/21/20 | | 1,137,000 | | 1,122,425 |
| Fannie Mae | | 1.650 | | 01/27/20 | | 550,000 | | 542,975 |
| Federal Farm Credit Banks | | 1.400 | | 03/27/19 | | 300,000 | | 298,994 |
| Federal Farm Credit Banks | | 1.030 | | 04/05/19 | | 4,382,000 | | 4,360,664 |
| Federal Farm Credit Banks | | 1.190 | | 04/22/19 | | 245,000 | | 243,775 |
| Federal Farm Credit Banks | | 1.180 | | 06/13/19 | | 1,180,000 | | 1,171,361 |
| Federal Farm Credit Banks | | 1.550 | | 09/27/19 | | 190,000 | | 188,220 |
| Federal Farm Credit Banks | | 1.140 | | 10/07/19 | | 650,000 | | 641,039 |
| Federal Farm Credit Banks | | 1.250 | | 10/22/19 | | 975,000 | | 962,305 |
| Federal Farm Credit Banks | | 1.360 | | 10/28/19 | | 155,000 | | 153,085 |
| Federal Farm Credit Banks | | 1.160 | | 11/01/19 | | 422,000 | | 415,968 |
| Federal Farm Credit Banks | | 1.550 | | 11/15/19 | | 1,000,000 | | 988,577 |
| Federal Farm Credit Banks | | 5.150 | | 11/15/19 | | 103,000 | | 105,276 |
| Federal Farm Credit Banks | | 1.100 | | 11/18/19 | | 169,000 | | 166,333 |
| Federal Farm Credit Banks | | 2.390 | | 12/05/19 | | 270,000 | | 268,926 |
| Federal Farm Credit Banks | | 1.500 | | 12/19/19 | | 233,000 | | 229,824 |
See Notes to Financial Statements.
30
| BOND FUND SCHEDULE OF INVESTMENTS(Continued) |
| November 30, 2018 |
| | | Rate (%) | | Maturity Date | | Principal Amount | | Value |
| BONDS(continued) | | | | | | | | |
| | | | | | | | | |
| U.S. Government & Agency Securities (continued) | | | | | | | | |
| | Federal Farm Credit Banks | | 4.250 | | 01/06/20 | | 146,000 | | $148,278 |
| Federal Farm Credit Banks | | 1.520 | | 01/17/20 | | 440,000 | | 433,838 |
| Federal Home Loan Banks | | 1.750 | | 12/14/18 | | 1,925,000 | | 1,924,671 |
| Federal Home Loan Banks | | 2.250 | | 05/03/19 | | 3,815,000 | | 3,811,288 |
| Federal Home Loan Banks | | 1.625 | | 06/14/19 | | 840,000 | | 835,761 |
| Federal Home Loan Banks | | 2.375 | | 07/16/19 | | 745,000 | | 743,803 |
| Federal Home Loan Banks | | 1.375 | | 07/26/19 | | 425,000 | | 421,530 |
| Federal Home Loan Banks | | 0.875 | | 08/05/19 | | 11,620,000 | | 11,481,838 |
| Federal Home Loan Banks | | 5.125 | | 08/15/19 | | 975,000 | | 991,174 |
| Federal Home Loan Banks | | 1.250 | | 08/22/19 | | 340,000 | | 336,538 |
| Federal Home Loan Banks | | 2.375 | | 09/13/19 | | 215,000 | | 214,446 |
| Federal Home Loan Banks | | 4.500 | | 09/13/19 | | 405,000 | | 410,446 |
| Federal Home Loan Banks (2.280% to 12/20/18, 2.530% to 03/20/19, | | | | | | | | |
| 2.780% to 06/20/19 then 3.030%) (d) | | 2.280 | | 09/20/19 | | 125,000 | | 124,969 |
| Federal Home Loan Banks | | 1.000 | | 09/26/19 | | 3,000,000 | | 2,958,780 |
| Federal Home Loan Banks | | 1.500 | | 09/27/19 | | 500,000 | | 495,093 |
| Federal Home Loan Banks | | 1.125 | | 10/03/19 | | 500,000 | | 493,403 |
| Federal Home Loan Banks | | 1.125 | | 10/11/19 | | 200,000 | | 197,185 |
| Federal Home Loan Banks | | 2.625 | | 10/18/19 | | 5,000,000 | | 4,993,715 |
| Federal Home Loan Banks | | 2.750 | | 10/24/19 | | 1,000,000 | | 999,725 |
| Federal Home Loan Banks | | 1.400 | | 10/29/19 | | 550,000 | | 543,244 |
| Federal Home Loan Banks | | 1.375 | | 11/15/19 | | 5,600,000 | | 5,526,920 |
| Federal Home Loan Banks | | 1.250 | | 12/13/19 | | 1,500,000 | | 1,476,850 |
| Federal Home Loan Banks | | 2.375 | | 12/13/19 | | 1,870,000 | | 1,861,576 |
| Federal Home Loan Banks | | 4.125 | | 12/13/19 | | 1,100,000 | | 1,115,302 |
| Federal Home Loan Banks | | 1.390 | | 12/26/19 | | 175,000 | | 172,459 |
| Federal Home Loan Banks | | 1.450 | | 12/27/19 | | 200,000 | | 197,213 |
| Federal Home Loan Banks (d) | | 5.400 | | 12/30/19 | | 1,020,000 | | 1,048,023 |
| Federal Home Loan Banks | | 3.000 | | 05/28/20 | | 1,000,000 | | 1,000,409 |
| Financing Corp. (f) | | 0.000 | | 09/26/19 | | 1,322,000 | | 1,292,827 |
| Freddie Mac | | 1.125 | | 04/15/19 | | 1,000,000 | | 995,045 |
| Freddie Mac | | 1.500 | | 06/27/19 | | 178,000 | | 176,790 |
| Freddie Mac | | 0.875 | | 07/19/19 | | 1,253,000 | | 1,239,322 |
| Freddie Mac | | 1.050 | | 07/26/19 | | 1,000,000 | | 989,609 |
| Freddie Mac | | 1.375 | | 08/15/19 | | 247,000 | | 244,769 |
| Freddie Mac | | 1.500 | | 09/27/19 | | 100,000 | | 98,962 |
| Freddie Mac | | 1.250 | | 09/30/19 | | 732,000 | | 722,860 |
| Freddie Mac | | 1.250 | | 10/02/19 | | 966,000 | | 954,024 |
| Freddie Mac | | 1.650 | | 10/30/19 | | 400,000 | | 395,934 |
| Freddie Mac | | 1.750 | | 11/27/19 | | 150,000 | | 148,442 |
| Freddie Mac (f) | | 0.000 | | 11/29/19 | | 5,053,000 | | 4,912,489 |
| Freddie Mac | | 1.500 | | 12/26/19 | | 1,800,000 | | 1,777,018 |
| Freddie Mac | | 1.375 | | 12/30/19 | | 475,000 | | 467,763 |
| Freddie Mac | | 1.500 | | 01/17/20 | | 6,422,000 | | 6,332,965 |
| Freddie Mac (1.500% to 05/18/19, 2.000% to 11/18/19, | | | | | | | | |
| then 3.000%) (d) | | 1.500 | | 05/18/20 | | 100,000 | | 99,050 |
| Freddie Mac | | 1.500 | | 06/24/20 | | 2,000,000 | | 1,957,218 |
| New Valley Generation I | | 7.299 | | 03/15/19 | | 7,745 | | 7,825 |
| Residual Funding Corp. (f) | | 0.000 | | 10/15/19 | | 620,000 | | 605,088 |
See Notes to Financial Statements.
31
| BOND FUND SCHEDULE OF INVESTMENTS(Continued) |
| November 30, 2018 |
| | | | | | | Shares or | | |
| | | Rate (%) | | Maturity Date | | Principal Amount | | Value |
| BONDS(continued) | | | | | | | | |
| | | | | | | | | |
| U.S. Government & Agency Securities (continued) | | | | | | | | |
| | U.S. Treasury Bonds | | 1.625 | | 07/31/19 | | 3,000,000 | | $2,979,961 |
| U.S. Treasury Bonds | | 1.000 | | 09/30/19 | | 5,000,000 | | 4,931,055 |
| U.S. Treasury Bonds | | 1.500 | | 10/31/19 | | 5,000,000 | | 4,944,727 |
| U.S. Treasury Bonds | | 1.500 | | 11/30/19 | | 5,000,000 | | 4,938,672 |
| U.S. Treasury Bonds | | 1.125 | | 12/31/19 | | 1,000,000 | | 982,617 |
| U.S. Treasury Bonds | | 1.625 | | 12/31/19 | | 5,000,000 | | 4,939,453 |
| | | | | | | | | |
| SHORT-TERM INVESTMENTS - 1.4% | | | | | | | | 50,468,761 |
| (COST $50,474,896) | | | | | | | | |
| | | | | | | | | |
| Commercial Paper - 0.7% | | | | | | | | 24,622,360 |
| AT&T Inc. (f)(h) | | 0.000 | | 05/28/19 | | 25,000,000 | | 24,622,360 |
| | | | | | | | | |
| Money Market Funds - 0.0%^ | | | | | | | | 100,000 |
| First American Gov’t. Obligations Fund Class X (a) | | 2.131 | | | | 100,000 | | 100,000 |
| | | | | | | | | |
| U.S. Government & Agency Securities - 0.7% | | | | | | | | 25,746,401 |
| U.S. Treasury Bills (b) | | 2.229 | | 01/02/19 | | 5,000,000 | | 4,990,164 |
| U.S. Treasury Bills (b) | | 2.313 | | 02/28/19 | | 4,000,000 | | 3,977,597 |
| U.S. Treasury Bills (b) | | 2.447 | | 04/18/19 | | 5,000,000 | | 4,954,006 |
| U.S. Treasury Bills (b) | | 2.490 | | 05/23/19 | | 3,000,000 | | 2,964,874 |
| U.S. Treasury Bills (b) | | 2.483 | | 06/20/19 | | 5,000,000 | | 4,931,939 |
| U.S. Treasury Bills (b) | | 2.583 | | 08/15/19 | | 4,000,000 | | 3,927,821 |
| | | | | | | | | |
| TOTAL INVESTMENTS - 99.0% (COST $3,680,331,489) | | | | | | | | 3,620,276,123 |
| | | | | | | | | |
| NET OTHER ASSETS AND LIABILITIES - 1.0% | | | | | | | | 34,918,236 |
| | | | | | | | | |
| NET ASSETS - 100.0% | | | | | | | | $3,655,194,359 |
| (a) | Rate shown represents the 7-day yield at November 30, 2018. |
| (b) | Rate shown represents the current coupon rate for corporate bonds and the current yield for U.S. Treasury Bills at November 30, 2018. |
| (c) | Variable rate security. Interest rates reset periodically. Interest rate shown reflects the rate in effect at November 30, 2018. For securities based on a published reference rate and spread, the reference rate and spread are indicated in the description above. Certain variable rate securities are not based on a published reference rate and spread but are determined by the issuer or agent and are based on current market conditions. These securities do not indicate a reference rate and spread in their description above. |
| (d) | Security is a “step-up” bond where the coupon increases or steps up at a predetermined date. Securities which do not indicate a future coupon rate in their description above are at their final coupon rate at November 30, 2018. |
| (e) | Rate is subject to adjustment due to credit ratings service downgrades or subsequent upgrades. |
| (f) | Zero-coupon security. |
| (g) | Perpetual maturity; date shown represents next contractual call date. |
| (h) | Security subject to restrictions on resale under federal securities laws and which therefore may only be resold upon registration under the Securities Act of 1933, as amended, or in transactions exempt from registration, including sales to qualified institutional buyers under Rule 144A of the Securities Act of 1933, as amended. It has been deemed liquid under guidance approved by the Board. At November 30, 2018, the aggregate value of these securities was $1,014,948,160, representing 27.8% of net assets. |
| ^ | Rounds to 0.0%. |
See Notes to Financial Statements.
32
| BOND FUND SCHEDULE OF INVESTMENTS(Continued) |
| November 30, 2018 |
| Abbreviations: |
| CPI YOY | | Consumer Price Index Year-on-Year Growth Rate |
| IO | | Interest Only Security |
| LIBOR | | London Interbank Offered Rate |
| USISDA02 | | 2-Year Dollar ICE Swap Rate |
| USISDA05 | | 5-Year Dollar ICE Swap Rate |
| USISDA10 | | 10-Year Dollar ICE Swap Rate |
| USISDA30 | | 30-Year Dollar ICE Swap Rate |
| USSW5 | | 5-Year Dollar Semi Annual 30/360 Swap Rate |
| USSW10 | | 10-Year Dollar Semi Annual 30/360 Swap Rate |
| | | |
| A.B. | | Aktiebolag is the Swedish term for limited liability corporation. |
| A.G. | | Aktiengesellschaft is the German term for a public limited liability corporation. |
| B.V. | | Besloten Vennootschap is the Dutch term for a private limited liability corporation. |
| DAC | | Designated Activity Company |
| N.V. | | Naamloze Vennootschap is the Dutch term for a public limited liability corporation. |
| PLC | | Public Limited Company |
| Pty. Ltd. | | Proprietary Limited Company under Australian law. |
| REIT | | Real Estate Investment Trust |
| REMIC | | Real Estate Mortgage Investment Conduit |
| S.A. | | Generally designates corporations in various countries, mostly those employing civil law. This translates literally as anonymous company. |
| S.A. de C.V. | | Sociedad Anónima de Capital Variable is the term for limited liability companies in Mexico. |
| SARL | | Société à responsabilité limitée is the Luxembourg term for a limited liability corporation. |
| SCA | | Société en commandite par actions is the Luxembourg term for a partnership limited by shares. |
| SCS | | Société en commandite simple is the Luxembourg equivalent of a limited partnership. |
| SRL | | Società a responsabilità limitata is the Italian term for a public limited company. |
See Notes to Financial Statements.
33
| FUND EXPENSE EXAMPLES(Unaudited) |
| November 30, 2018 |
Example
A Fund shareholder may incur two types of costs: (1) transaction costs such as redemption fees; and (2) ongoing costs, including management fees and other Fund expenses. This example is intended to help you understand your ongoing costs (in dollars) of investing in a Fund and to compare these costs with the ongoing costs of investing in other mutual funds.
The example is based on an investment of $1,000 invested at the beginning of the period and held for the entire period from June 1, 2018 to November 30, 2018.
Actual Expenses
The first line of the table below under each Fund provides information about actual account values and actual expenses for such Fund. You may use the information in this line, together with the amount you invested, to estimate the expenses that you paid over the period. Simply divide your account value by $1,000 (for example, an $8,600 account value divided by $1,000 = 8.6), then multiply the result by the number in the first line under the heading entitled “Expenses Paid During Period” to estimate the expenses you paid on your account during this period.
Hypothetical Example for Comparison Purposes
The second line of the table below under each Fund provides information about hypothetical account values and hypothetical expenses based on such Fund’s actual expense ratio and an assumed rate of return of 5% per year before expenses, which is not the Fund’s actual return. The hypothetical account values and expenses may not be used to estimate the actual ending account balance or expenses you paid for the period. You may use this information to compare the ongoing costs of investing in each Fund and other funds. To do so, compare the 5% hypothetical example with the 5% hypothetical examples that appear in the shareholder reports of the other funds.
Please note that the expenses shown in the table are meant to highlight your ongoing costs only and do not reflect any transactional costs, such as redemption fees. Therefore, the second line of the table is useful in comparing ongoing costs only, and will not help you determine the relative costs of owning different funds. In addition, if these transactional costs were included, your costs would have been higher.
| | | | Beginning | | Ending | | |
| Six-Month Period Ended November 30, 2018 | | Expense Ratio | | Account Value | | Account Value | | Expenses Paid |
| | for the Period | | 06/01/18 | | 11/30/18 | | During the Period* |
| LargeCap Fund | | | | | | | | | | |
| Actual | | 1.05% | | $1,000.00 | | | $995.84 | | | $5.25 |
| Hypothetical (5% return before expenses) | | 1.05% | | $1,000.00 | | | $1,019.74 | | | $5.32 |
| MidCap Fund | | | | | | | | | | |
| Actual | | 1.15% | | $1,000.00 | | | $917.43 | | | $5.53 |
| Hypothetical (5% return before expenses) | | 1.15% | | $1,000.00 | | | $1,019.23 | | | $5.82 |
| Bond Fund | | | | | | | | | | |
| Actual | | 0.71% | | $1,000.00 | | | $1,003.44 | | | $3.57 |
| Hypothetical (5% return before expenses) | | 0.71% | | $1,000.00 | | | $1,021.44 | | | $3.60 |
| * | Expenses are equal to the annualized [net] expense ratio for each Fund, multiplied by the average account value over the period, multiplied by 183/365 (to reflect the one-half year period). |
| |
| For more information, please refer to the Funds’ Prospectus. |
See Notes to Financial Statements.
34
| STATEMENTS OF ASSETS AND LIABILITIES |
| November 30, 2018(In thousands, except per share amounts) |
| | LARGECAP | | MIDCAP | | BOND |
| | FUND | | FUND | | FUND |
| |
| Assets | | | | | | | | | | | | |
| Total investments in securities, at value (Cost $126,180, | | | | | | | | | | | | |
| $42,223 and $3,680,331, respectively) | | | $121,475 | | | | $45,012 | | | | $3,620,276 | |
| Cash | | | 210 | | | | – | | | | 8,455 | |
| Due from sale of securities | | | 1,995 | | | | 12 | | | | – | |
| Receivable from fund shares sold | | | 78 | | | | – | | | | 18,496 | |
| Dividends and interest receivable | | | 192 | | | | 58 | | | | 36,159 | |
| Prepaid expenses | | | 8 | | | | 5 | | | | 113 | |
| Total assets | | | 123,958 | | | | 45,087 | | | | 3,683,499 | |
| Liabilities | | | | | | | | | | | | |
| Due on purchase of securities | | | 2,114 | | | | – | | | | 19,768 | |
| Payable for fund shares redeemed | | | 7 | | | | – | | | | 6,433 | |
| Accrued expenses payable | | | 30 | | | | 27 | | | | 112 | |
| Accrued directors expense payable | | | – | | | | – | | | | 2 | |
| Due to Advisor | | | 90 | | | | 31 | | | | 1,990 | |
| Total liabilities | | | 2,241 | | | | 58 | | | | 28,305 | |
| Net assets | | | $121,717 | | | | $45,029 | | | | $3,655,194 | |
| Net assets consist of | | | | | | | | | | | | |
| Capital stock ($.001 par value) | | | $126,036 | | | | $40,077 | | | | $3,841,964 | |
| Total distributable earnings (accumulated deficit) | | | (4,319 | ) | | | 4,952 | | | | (186,770 | ) |
| Net assets | | | $121,717 | | | | $45,029 | | | | $3,655,194 | |
| Net asset value per share | | | | | | | | | | | | |
| Shares of capital stock outstanding (unlimited shares | | | | | | | | | | | | |
| authorized) | | | 1,834 | | | | 3,745 | | | | 321,330 | |
| Offering and redemption price | | | $66.36 | (a) | | | $12.02 | | | | $11.38 | |
| (a) | Does not recalculate due to rounding. |
See Notes to Financial Statements.
35
| STATEMENTS OF OPERATIONS |
| Year Ended November 30, 2018(In thousands) |
| | LARGECAP | | MIDCAP | | BOND |
| | FUND | | FUND | | FUND |
| |
| Investment income | | | | | | | | | | | | |
| Interest | | | $1 | | | | $1 | | | | $119,111 | |
| Dividends | | | 2,384 | | | | 674 | | | | – | |
| Less foreign taxes withheld | | | (6 | ) | | | (1 | ) | | | – | |
| Total investment income | | | 2,379 | | | | 674 | | | | 119,111 | |
| Expenses | | | | | | | | | | | | |
| Investment advisory fees | | | 1,205 | | | | 501 | | | | 18,247 | |
| Shareholder servicing costs | | | 80 | | | | 29 | | | | 1,377 | |
| Administrative & accounting services fees | | | 122 | | | | 65 | | | | 849 | |
| Custody fees | | | 12 | | | | 6 | | | | 236 | |
| Directors fees | | | 26 | | | | 22 | | | | 142 | |
| Federal & state registration | | | 36 | | | | 35 | | | | 118 | |
| Professional fees | | | 39 | | | | 38 | | | | 83 | |
| Other expenses | | | 30 | | | | 18 | | | | 469 | |
| Total expenses | | | 1,550 | | | | 714 | | | | 21,521 | |
| Less expenses reimbursed by Advisor | | | (202 | ) | | | (137 | ) | | | – | |
| Net expenses | | | 1,348 | | | | 577 | | | | 21,521 | |
| Net investment income | | | 1,031 | | | | 97 | | | | 97,590 | |
| Realized and unrealized gain (loss) | | | | | | | | | | | | |
| Net realized gain (loss) on investments | | | (9 | ) | | | 2,276 | | | | (24,455 | ) |
| Net unrealized appreciation (depreciation) on investments | | | 1,306 | | | | (5,204 | ) | | | (10,607 | ) |
| Net realized and unrealized gain (loss) | | | 1,297 | | | | (2,928 | ) | | | (35,062 | ) |
| Increase (Decrease) in net assets resulting | | | | | | | | | | | | |
| from operations | | | $2,328 | | | | ($2,831 | ) | | | $62,528 | |
See Notes to Financial Statements.
36
| STATEMENTS OF CHANGES IN NET ASSETS |
| (In thousands) |
| | LARGECAP | | MIDCAP | | BOND |
| | FUND | | FUND | | FUND |
| |
| | Year Ended | | Year Ended | | Year Ended | | Year Ended | | Year Ended | | Year Ended |
| | November 30, | | November 30, | | November 30, | | November 30, | | November 30, | | November 30, |
| | 2018 | | 2017 | | 2018 | | 2017 | | 2018 | | 2017 |
| Operations | | | | | | | | | | | | | | | | | | | | | | | | |
| Net investment income | | | $1,031 | | | | $720 | | | | $97 | | | | $29 | | | | $97,590 | | | | $73,657 | |
| Net realized gain (loss) on investments | | | (9 | ) | | | 23,322 | | | | 2,276 | | | | 3,508 | | | | (24,455 | ) | | | (1,198 | ) |
| Net unrealized appreciation | | | | | | | | | | | | | | | | | | | | | | | | |
| (depreciation) on investments | | | 1,306 | | | | (6,513 | ) | | | (5,204 | ) | | | 2,967 | | | | (10,607 | ) | | | 55,402 | |
| Net increase (decrease) in net assets | | | | | | | | | | | | | | | | | | | | | | | | |
| resulting from operations | | | 2,328 | | | | 17,529 | | | | (2,831 | ) | | | 6,504 | | | | 62,528 | | | | 127,861 | |
| Distributions to shareholders (a) | | | | | | | | | | | | | | | | | | | | | | | | |
| Distributions from net | | | | | | | | | | | | | | | | | | | | | | | | |
| investment income | | | | | | | (930 | ) | | | | | | | (23 | ) | | | | | | | (80,820 | ) |
| Distributions from net realized gains | | | | | | | | | | | | | | | | | | | | | | | | |
| on securities transactions | | | | | | | – | | | | | | | | (2,027 | ) | | | | | | | – | |
| Total distributions to shareholders | | | (1,071 | ) | | | (930 | ) | | | (3,632 | ) | | | (2,050 | ) | | | (88,362 | ) | | | (80,820 | ) |
| Fund share transactions | | | | | | | | | | | | | | | | | | | | | | | | |
| (see note 4) | | | (8,545 | ) | | | (5,115 | ) | | | 640 | | | | 2,553 | | | | 1,060,386 | | | | 553,066 | |
| Total increase (decrease) | | | | | | | | | | | | | | | | | | | | | | | | |
| in net assets | | | (7,288 | ) | | | 11,484 | | | | (5,823 | ) | | | 7,007 | | | | 1,034,552 | | | | 600,107 | |
| Net assets | | | | | | | | | | | | | | | | | | | | | | | | |
| Beginning of year | | | 129,005 | | | | 117,521 | | | | 50,852 | | | | 43,845 | | | | 2,620,642 | | | | 2,020,535 | |
| End of year | | | $121,717 | | | | $129,005 | | | | $45,029 | | | | $50,852 | | | | $3,655,194 | | | | $2,620,642 | |
| Undistributed net investment | | | | | | | | | | | | | | | | | | | | | | | | |
| income included in net | | | | | | | | | | | | | | | | | | | | | | | | |
| assets at end of period (a) | | | | | | | $642 | | | | | | | | $29 | | | | | | | | $13,338 | |
| (a) | For the year ended November 30, 2018, the Funds have adopted amendments to Regulation S-X. Distributions from net investment income and from net realized gains on securities transactions are no longer required to be separately disclosed and parenthetical disclosure of undistributed net investment income is no longer required. |
See Notes to Financial Statements.
37
| NOTES TO FINANCIAL STATEMENTS |
| November 30, 2018 |
NOTE 1 - ORGANIZATION
Thompson IM Funds, Inc. (the “Company”) is a Wisconsin corporation registered under the Investment Company Act of 1940, as amended (the “1940 Act”), as an open-end, diversified management investment company.
The Company consists of separate mutual funds series (each, a “Fund,” and collectively, the “Funds”): Thompson LargeCap Fund (the “LargeCap Fund”), Thompson MidCap Fund (the “MidCap Fund”) and Thompson Bond Fund (the “Bond Fund”). The assets and liabilities of each Fund are segregated and a shareholder’s interest is limited to the Fund in which the shareholder owns shares. The objectives and strategies of each Fund are described in the Funds’ Prospectus.
NOTE 2 - SIGNIFICANT ACCOUNTING POLICIES
The following is a summary of significant accounting policies followed by the Funds in the preparation of their financial statements. The Funds are investment companies and accordingly follow the investment company accounting and reporting guidance of the Financial Accounting Standards Board (“FASB”) Accounting Standards Codification Topic 946 Financial Services — Investment Companies.
VALUATION POLICY AND PROCEDURES - The Funds’ Board of Directors (the “Funds’ Board”) has adopted methods for valuing securities set forth in the Funds’ Pricing Policies and Procedures, including circumstances in which market quotes are not readily available or deemed to be unreliable, and has delegated authority to the Advisor to apply those methods in making fair value determinations, subject to oversight by the Funds’ Board. The Advisor has established a valuation committee that, along with other Advisor employees, administers, implements, and oversees the fair valuation process and makes fair value decisions. The valuation committee regularly reviews its own fair value decisions, as well as valuations, valuation techniques and services furnished by pricing services; considers circumstances in the markets which may require it to make or adjust valuation determinations; and reviews previous valuation determinations. The valuation committee reports on its activities and any changes to the fair valuation guidelines to the Funds’ Board.
SECURITY VALUATION - Each Fund’s equity securities, including common stocks, ADRs and REITs, are valued at their market prices (generally the last reported sales price on the exchange where the securities are primarily traded or, for Nasdaq-listed securities, at their Nasdaq Official Closing Prices). If no sales are reported on a particular day, the mean between the highest bid and lowest asked quotations at the close of the exchanges will generally be used. Investments in money market mutual funds are generally priced at the ending net asset value provided by the service agent of the funds.
Fixed-income securities such as corporate bonds, asset-backed securities, mortgage-backed securities, U.S. government and agency securities, sovereign bonds, municipal bonds and commercial paper are typically valued based on valuations published by an independent pricing service, which uses various valuation methodologies such as matrix pricing and other analytical pricing models as well as market transactions and dealer quotations. Factors considered by pricing services include market characteristics such as benchmark yield curves, option-adjusted spreads, credit spreads and fundamental analytical data relating to the issuer. Short-term investments in fixed-income securities (those with remaining maturities of 60 days or less) are generally valued on an amortized cost basis.
Where market quotations are not readily available or are unreliable, a value is determined in good faith pursuant to procedures established by the Funds’ Board. When determining the value of a security, consideration is given to the facts and circumstances relevant to the particular situation, which includes factors such as fundamental analytical data relating to the investment, which may include consideration of yields or prices of securities of comparable quality, coupon rate, maturity and type of issue, nature and duration of any restrictions on disposition of the security and an evaluation of forces that influence the market in which the securities are purchased or sold. Fair value pricing is an inherently subjective process, and no single standard exists for determining fair value. Different funds could reasonably arrive at different values for the same security.
VALUATION MEASUREMENTS – In accordance with generally accepted accounting principles in the United States of America (“GAAP”), fair value is defined as the price that the Fund would receive to sell an investment or pay to transfer a liability in an orderly transaction with an independent buyer in the principal market, or in the absence of a principal market the most advantageous market for the investment or liability. GAAP established a three-tier hierarchy to maximize the use of observable market data and minimize the use of unobservable inputs and to establish classification of fair value measurements for disclosure purposes.
38
| NOTES TO FINANCIAL STATEMENTS(Continued) |
| November 30, 2018 |
Various inputs are used in determining the value of each Fund’s investments. These inputs are summarized in the three broad levels listed below:
| Level 1 – | Quoted prices in active markets for identical securities. |
| | | |
| Level 2 – | Other significant observable inputs (including quoted prices for similar securities, interest rates, prepayment speeds, credit risk, etc.). |
| | |
| Level 3 – | Significant unobservable inputs (including the Fund’s own assumptions in determining the fair value of investments). |
Inputs may include price information, specific and broad credit data, liquidity statistics, and other factors. The Fund considers observable data to be that market data which is readily available, regularly distributed or updated, reliable and verifiable, not proprietary, and provided by independent sources that are actively involved in the relevant market. The determination of what constitutes “observable” requires significant judgment by the Fund. The categorization of a financial instrument within the hierarchy is based upon the pricing transparency of the instrument and does not necessarily correspond to the Fund’s perceived risk of that instrument. Investments whose values are based on quoted market prices in active markets, and which are therefore classified as level-1 securities, include active listed equities and certain U.S. government obligations.
Investments that trade in markets that are not considered to be active, but are valued based on quoted market prices, dealer quotations or alternative pricing sources supported by observable inputs, are classified as level-2 securities. These include certain U.S. government obligations, most government agency securities, investment-grade corporate bonds, asset-backed securities, mortgage-backed securities, sovereign bonds, municipal bonds, and less liquid listed equities. Level-2 investments include positions that are not traded in active markets.
Investments classified as level-3 securities have significant unobservable inputs, as they trade infrequently or not at all. Level-3 instruments include private-placement and less liquid corporate and municipal debt securities. When observable prices are not available for these securities, the Fund uses one or more valuation techniques (e.g., the market approach, the income approach, or the cost approach) for which sufficient and reliable data is available. Within level 3, the use of the market approach generally consists of using comparable market transactions, while the use of the income approach generally consists of using the net present value of estimated future cash flows, adjusted as appropriate for liquidity, credit, market and/or other risk factors. The inputs used by the Fund in estimating the value of level-3 investments include the original transaction price and recent transactions in the same or similar instruments.
The following is a summary of the inputs used to value the Funds’ investments as of November 30, 2018:
| LargeCap Fund |
| | Level 1 | | Level 2 | | Level 3 | | Total |
| Common stocks | | $121,374,631 | | | $– | | | | $– | | | $121,374,631 |
| Short-term investments | | 100,000 | | | – | | | | – | | | 100,000 |
| Total | | $121,474,631 | | | $– | | | | $– | | | $121,474,631 |
| |
| MidCap Fund |
| | Level 1 | | Level 2 | | Level 3 | | Total |
| Common stocks | | $45,008,308 | | | $– | | | | $– | | | $45,008,308 |
| Short-term investments | | 3,925 | | | – | | | | – | | | 3,925 |
| Total | | $45,012,233 | | | $– | | | | $– | | | $45,012,233 |
| | | | | | | | | | | | | |
| Bond Fund |
| | Level 1 | | Level 2 | | Level 3 | | Total |
| Bonds | | $- | | | $3,569,807,362 | | | | $– | | | $3,569,807,362 |
| Short-term investments | | 100,000 | | | 50,368,761 | | | | – | | | 50,468,761 |
| Total | | $100,000 | | | $3,620,176,123 | | | | $– | | | $3,620,276,123 |
39
| NOTES TO FINANCIAL STATEMENTS(Continued) |
| November 30, 2018 |
The Funds did not invest in any level-3 investments as of and during the fiscal year ended November 30, 2018. Refer to each Fund’s Schedule of Investments for additional information regarding security types and industry classifications.
SECURITIES TRANSACTIONS AND INVESTMENT INCOME - Investment securities transactions are accounted for on the trade date. Gains or losses realized on sales of securities are determined by comparing the identified cost of the security lot sold with the net sales proceeds. Discounts/premiums on debt securities purchased are accreted/amortized over the life of the respective securities using the effective interest method for both book and tax purposes. Dividend income is recorded on the ex-dividend date. Interest income is recorded as earned. Income and capital gains on some foreign securities may be subject to foreign withholding taxes, which are accrued as applicable, and have been provided for in accordance with the Funds’ understanding of the applicable country’s tax rules and rates. The ability of the issuers of the debt securities held by the Funds to meet their obligations may be affected by economic developments in a specific industry, state, or region. Debt obligations may be placed on non-accrual status and related interest income may be reduced by ceasing current accruals and writing off interest receivables when the collection of all or a portion of interest has become doubtful. A debt obligation is removed from non-accrual status when the issuer resumes interest payments or when collectability of interest is reasonably assured.
EXPENSES - Each Fund is charged for those expenses that are directly attributed to it. Expenses that are not readily identifiable to a specific Fund are generally allocated among the Funds in proportion to the relative sizes of the Funds.
SECURITIES PURCHASED ON A WHEN-ISSUED OR DELAYED-DELIVERY BASIS - Each Fund may purchase securities on a when-issued or delayed-delivery basis. When-issued securities are securities purchased with delivery to occur at a later date at a stated price and/or yield, thereby involving the risk that the price and/or yield obtained may be more or less than those available in the market when delivery takes place. At the time a Fund makes a commitment to purchase a security on a when-issued basis, the Fund records the transaction and reflects the value of the security in determining net asset value. Each Fund designates and maintains cash and marketable securities at least equal in value to commitments for when-issued securities.
LINE OF CREDIT - The Funds have established an unsecured line of credit (“LOC”) with U.S. Bank N.A. which expires November 8, 2019, used primarily to finance redemption payments. Each individual Fund’s borrowing under the LOC is limited to 5% of the value of that Fund’s net assets, 33.33% of the value of the Fund’s investments, or any explicit borrowing limits imposed by the LOC, whatever is less. Interest is charged at the prime rate, which was 5.25% as of November 30, 2018. As of November 30, 2018, the limits established are: LargeCap Fund - $6,000,000, MidCap Fund - $2,300,000 and Bond Fund - $145,000,000. All terms and borrowing limits imposed by the LOC are subject to review and approval by the Funds’ Board. The LOC was drawn upon during the year; however, as of November 30, 2018, there were no borrowings by the Funds outstanding under the LOC. The following table shows the average balance, average interest rate, interest expense, and maximum borrowings incurred by the Funds on the LOC for the fiscal year ended November 30, 2018.
| | | | Average | | | | | | | | Date of |
| | Average | | Interest | | Interest | | Maximum | | Maximum |
| | Balance | | Rate | | Expense | | Borrowing | | Borrowing |
| LargeCap Fund | | $45,230 | | 4.80% | | | $2,201 | | | $1,189,000 | | 07/24/18 |
| MidCap Fund | | $14,405 | | 4.86% | | | $709 | | | $884,000 | | 10/24/18 |
| Bond Fund | | $56,077 | | 4.76% | | | $2,707 | | | $11,516,000 | | 04/03/18 |
40
| NOTES TO FINANCIAL STATEMENTS(Continued) |
| November 30, 2018 |
USE OF ESTIMATES - The preparation of financial statements in conformity with GAAP requires management to make estimates and assumptions that affect the reported amounts of assets and liabilities and disclosure of contingent assets and liabilities at the date of the financial statements and the reported amounts of revenues and expenses during the reporting period. Actual results could differ from these estimates.
GUARANTEES AND INDEMNIFICATIONS - Under the Funds’ organizational documents, each Director, officer, employee or other agent of the Funds (including the Funds’ investment advisor) is indemnified, to the extent permitted by the 1940 Act, against certain liabilities that may arise out of performance of their duties to the Funds. Additionally, in the normal course of business, the Funds enter into contracts that contain a variety of indemnification clauses. The Funds’ maximum exposure under these arrangements is unknown as this would involve future claims that may be made against the Funds that have not yet occurred. However, the Funds have not had prior claims or losses pursuant to these contracts and believe the risk of loss to be remote.
PERMANENT BOOK AND TAX DIFFERENCES - GAAP requires that permanent financial reporting and tax differences relating to shareholder distributions be reclassified in the capital accounts.
DISTRIBUTIONS TO SHAREHOLDERS - Distributions to shareholders from net investment income and realized gains on securities for the LargeCap Fund and MidCap Fund normally are declared at least annually. Bond Fund distributions to shareholders from net investment income normally are declared on a quarterly basis, and distributions to shareholders from realized gains on securities normally are declared at least annually. Distributions are recorded on the ex-dividend date.
FEDERAL INCOME TAXES - No provision has been made for federal income taxes since the Funds have elected to be taxed as regulated investment companies and intend to distribute substantially all income to shareholders and otherwise comply with the provisions of the Internal Revenue Code applicable to regulated investment companies.
ACCOUNTING FOR UNCERTAINTY IN INCOME TAXES - As of and during the fiscal year ended November 30, 2018, the Funds did not have a liability for unrecognized tax benefits in the accompanying financial statements. Also, the Funds recognized no interest or penalties related to unrecognized tax benefits during the same period. The Funds recognize interest and penalties, if any, related to unrecognized tax benefits as income tax expense in the Statements of Operations. The Funds are also not aware of any tax positions for which it is reasonably possible that the total amounts of unrecognized tax benefits will significantly change in the next twelve months.
SUBSEQUENT EVENTS - The Funds have evaluated subsequent events through the issuance of the Funds’ financial statements. See notes 3 and 6. There were no additional subsequent events which were deemed to have an impact on the Funds’ financial statements.
NOTE 3 - INVESTMENT ADVISORY AND ADMINISTRATIVE AND ACCOUNTING SERVICES AGREEMENTS AND OTHER TRANSACTIONS WITH AFFILIATES
The Investment Advisory Agreement pursuant to which Thompson Investment Management, Inc. (“TIM” or “Advisor”) is retained by the Funds provides for monthly compensation to TIM computed on average daily net assets at the following annual rates:
| | First | | Over |
| | $50 Million | | $50 Million |
| LargeCap Fund | | 1.00% | | 0.90% |
| MidCap Fund | | 1.00% | | 0.90% |
| Bond Fund | | 0.65% | | 0.60% |
41
| NOTES TO FINANCIAL STATEMENTS(Continued) |
| November 30, 2018 |
Effective December 1, 2018, the Advisor is contractually bound to waive management fees and/or reimburse expenses incurred by the Funds through March 31, 2020 so that the annual operating expenses of the Funds do not exceed the following percentages of their respective average daily net assets: LargeCap Fund - 1.03%, MidCap Fund - 1.15% and Bond Fund - 0.80%. Prior to December 1, 2018, the applicable expense limitation percentages were LargeCap Fund - 1.05%, MidCap Fund - 1.15% and Bond Fund - 0.80%. For the fiscal year ended November 30, 2018, the Advisor reimbursed expenses incurred by the LargeCap Fund and the MidCap Fund in the amounts of $202,041 and $137,432, respectively. The Funds are not obligated to reimburse the Advisor for any fees or expenses waived in previous fiscal years.
As of November 30, 2018, an affiliated shareholder held 11.30% of the MidCap Fund’s outstanding shares. Transactions by the shareholder may have a material impact on the Fund.
Pursuant to an Administrative and Accounting Services Agreement, TIM maintains the Funds’ financial records in accordance with the 1940 Act, prepares all necessary financial statements of the Funds and calculates the net asset value per share of the Funds on a daily basis. As compensation for its services, each Fund pays TIM a fee computed daily and payable monthly at the annual rate of 0.15% of average daily net assets up to $30 million, 0.10% of the next $70 million of average daily net assets and 0.025% of average daily net assets in excess of $100 million, with an annual minimum fee of $30,000 per Fund. The calculations of daily net asset value are subcontracted to U.S. Bank Global Fund Services, resulting in fees paid by TIM for the fiscal year ended November 30, 2018, in the following amounts:
| | Administrative & |
| | Accounting Fees Paid |
| LargeCap Fund | | | $42,127 | |
| MidCap Fund | | | $36,381 | |
| Bond Fund | | | $297,893 | |
The Funds reimburse the Advisor for a portion of amounts paid by the Advisor out of the Advisor’s own resources under various shareholder, account maintenance, networking and other services provided to the Funds by broker-dealers and other intermediaries. The amount reimbursed by the Funds is equal to (1) for those accounts maintained through a shareholder servicing arrangement, an annual rate of no more than 0.10% of the average daily net assets of the omnibus accounts in the Funds for which all broker-dealers and other intermediaries, in the aggregate, are responsible, and (2) for those accounts maintained through a networking arrangement, no more than $6 per year per account in the Funds for which the broker-dealers and other intermediaries are responsible; provided however, in all cases only one of these fees shall be applicable to the assets in an account. This amount has been determined by the Funds’ Board to approximate (or not to exceed) the transfer agency fees that would otherwise have been payable by the Funds if such broker-dealers and intermediaries did not maintain these accounts. Such amounts are recorded within Shareholder servicing costs on each Fund’s Statement of Operations. For the fiscal year ended November 30, 2018, the amounts reimbursed by the Funds to the Advisor were:
| | Intermediary |
| | Fees Reimbursed |
| LargeCap Fund | | | $22,015 | |
| MidCap Fund | | | $3,294 | |
| Bond Fund | | | $870,826 | |
42
| NOTES TO FINANCIAL STATEMENTS(Continued) |
| November 30, 2018 |
NOTE 4 - FUND SHARE TRANSACTIONS(in thousands)
Transactions in shares of the Funds were as follows:
| | Year Ended | | Year Ended |
| | November 30, 2018 | | November 30, 2017 |
| | Shares | | Dollars | | Shares | | Dollars |
| LargeCap Fund | | | | | | | | | | | | |
| Shares sold | | 77 | | | $5,252 | | | 97 | | | $5,894 | |
| Shares issued in reinvestment of distributions | | 16 | | | 1,042 | | | 16 | | | 905 | |
| Shares redeemed | | (220 | ) | | (14,839 | ) | | (196 | ) | | (11,914 | ) |
| Net increase (decrease) | | (127 | ) | | ($8,545 | ) | | (83 | ) | | ($5,115 | ) |
| MidCap Fund | | | | | | | | | | | | |
| Shares sold | | 226 | | | $2,986 | | | 321 | | | $4,078 | |
| Shares issued in reinvestment of distributions | | 274 | | | 3,593 | | | 165 | | | 2,028 | |
| Shares redeemed | | (460 | ) | | (5,939 | ) | | (280 | ) | | (3,553 | ) |
| Net increase (decrease) | | 40 | | | $640 | | | 206 | | | $2,553 | |
| Bond Fund | | | | | | | | | | | | |
| Shares sold | | 156,036 | | | $1,786,706 | | | 102,750 | | | $1,170,581 | |
| Shares issued in reinvestment of distributions | | 7,331 | | | 83,667 | | | 6,699 | | | 75,909 | |
| Shares redeemed | | (70,819 | ) | | (809,987 | ) | | (60,754 | ) | | (693,424 | ) |
| Net increase (decrease) | | 92,548 | | | $1,060,386 | | | 48,695 | | | $553,066 | |
NOTE 5 - PURCHASE AND SALE OF SECURITIES
Investment transactions for the fiscal year ended November 30, 2018 were as follows:
| | Securities other than U.S. | | | | |
| | Government and Short-term | | | | |
| | Investments | | U.S. Government Securities |
| | Purchases | | Sales | | Purchases | | Sales |
| LargeCap Fund | | $37,592,468 | | $45,835,452 | | $– | | $– |
| MidCap Fund | | $14,694,739 | | $17,592,626 | | $– | | $– |
| Bond Fund | | $2,218,781,534 | | $953,369,488 | | $839,381,462 | | $708,591,091 |
NOTE 6 – INCOME TAX INFORMATION
At November 30, 2018, the investment cost and aggregate unrealized appreciation and depreciation on investments for federal income tax purposes were as follows:
| | LARGECAP | | MIDCAP | | BOND |
| | FUND | | FUND | | FUND |
| Federal tax cost | | $126,233,190 | | | $42,396,584 | | | $3,680,492,863 | |
| | | | | | | | | | |
| Unrealized appreciation | | $11,696,041 | | | $9,092,751 | | | $8,611,708 | |
| Unrealized depreciation | | (16,454,600 | ) | | (6,477,102 | ) | | (68,828,448 | ) |
| Net unrealized appreciation (depreciation) | | (4,758,559 | ) | | 2,615,649 | | | (60,216,740 | ) |
| Distributable ordinary income | | 802,310 | | | 199,651 | | | 22,885,343 | |
| Distributable long-term capital gains | | – | | | 2,136,809 | | | – | |
| Post-October losses | | – | | | – | | | (723,325 | ) |
| Capital loss carryforwards | | (363,087 | ) | | – | | | (148,714,723 | ) |
| Total distributable earnings (accumulated deficit) | | ($4,319,336 | ) | | $4,952,109 | | | ($186,769,445 | ) |
43
| NOTES TO FINANCIAL STATEMENTS(Continued) |
| November 30, 2018 |
The tax basis of investments for tax and financial reporting purposes differ principally due to wash sales.
The tax basis post-October losses as of November 30, 2018 and capital loss carryforward as of November 30, 2018, which are not being recognized for tax purposes until the first day of the following fiscal year, are as follows:
| | LARGECAP | | MIDCAP | | BOND |
| | FUND | | FUND | | FUND |
| Post-October losses | | | | | | | | |
| Short-term | | | $– | | | $– | | $565,218 |
| Long-term | | | $– | | | $– | | 158,107 |
| Total Post-October losses | | | $– | | | $– | | $723,325 |
| Net capital loss carryforward | | | | | | | | |
| Short-term | | | $– | | | $– | | $20,433,977 |
| Long-term | | | 363,087 | | | – | | 128,280,746 |
| Total capital loss carryforward | | | $363,087 | | | $– | | $148,714,723 |
Capital losses are carried forward indefinitely and are available to offset future net realized gains, to the extent permitted by the Internal Revenue Code.
The tax components of distributions paid during the fiscal years ended November 30, 2018 and November 30, 2017 are as follows:
| | LARGECAP | | MIDCAP | | BOND |
| | FUND | | FUND | | FUND |
| Fiscal year ended November 30, 2018 | | | | | | | | |
| Distributions paid from | | | | | | | | |
| Ordinary income | | | $878,543 | | | $154,749 | | $88,361,797 |
| Long-term capital gains | | | 192,000 | | | 3,477,629 | | – |
| Total distributions paid | | | $1,070,543 | | | $3,632,378 | | $88,361,797 |
| |
| Fiscal year ended November 30, 2017 | | | | | | | | |
| Distributions paid from | | | | | | | | |
| Ordinary income | | | $929,915 | | | $363,026 | | $80,820,288 |
| Long-term capital gains | | | – | | | 1,687,109 | | – |
| Total distributions paid | | | $929,915 | | | $2,050,135 | | $80,820,288 |
The following distributions were declared on December 19, 2018, payable to shareholders on December 20, 2018:
| | LARGECAP | | MIDCAP | | BOND |
| | FUND | | FUND | | FUND |
| |
| Ordinary income distributions | | | | | | | | |
| Amount | | | $945,393 | | | $201,013 | | $30,547,251 |
| Per Share | | | $0.52 | | | $0.06 | | $0.10 |
| Long-term capital gains distributions | | | | | | | | |
| Amount | | | $– | | | $2,137,435 | | $– |
| Per Share | | | $– | | | $0.64 | | $– |
44
The following table presents information relating to a share of capital stock outstanding for the entire period.
LARGECAP FUND
| | Year Ended November 30, |
| | 2018 | | 2017 | | 2016 | | 2015 | | 2014 |
| Per share operating performance | | | | | | | | | | | | | | | |
| Net asset value, beginning of period | | $65.77 | | | $57.48 | | | $50.72 | | | $53.40 | | | $46.47 | |
| Income from investment operations | | | | | | | | | | | | | | | |
| Net investment income | | 0.55 | | | 0.37 | | | 0.47 | | | 0.35 | | | 0.27 | |
| Net realized and unrealized gains (losses) | | | | | | | | | | | | | | | |
| on investments | | 0.59 | | | 8.38 | | | 6.64 | | | (2.75 | ) | | 6.84 | |
| Total from investment operations | | 1.14 | | | 8.75 | | | 7.11 | | | (2.40 | ) | | 7.11 | |
| Less distributions | | | | | | | | | | | | | | | |
| Distributions from net investment income | | (0.45 | ) | | (0.46 | ) | | (0.35 | ) | | (0.28 | ) | | (0.18 | ) |
| Distributions from net realized gains | | (0.10 | ) | | – | | | – | | | – | | | – | |
| Total distributions | | (0.55 | ) | | (0.46 | ) | | (0.35 | ) | | (0.28 | ) | | (0.18 | ) |
| Net asset value, end of period | | $66.36 | | | $65.77 | | | $57.48 | | | $50.72 | | | $53.40 | |
| Total return | | 1.72% | | | 15.32% | | | 14.16% | | | (4.52% | ) | | 15.35% | |
| Ratios and supplemental data | | | | | | | | | | | | | | | |
| Net assets, end of period (millions) | | $121.7 | | | $129.0 | | | $117.5 | | | $111.9 | | | $128.6 | |
| Ratios to average net assets: | | | | | | | | | | | | | | | |
| Ratios of expenses | | 1.05% | | | 1.10% | | | 1.13% | | | 1.15% | | | 1.15% | |
| Ratio of expenses without reimbursement | | 1.21% | | | 1.22% | | | 1.25% | | | 1.22% | | | 1.23% | |
| Ratio of net investment income | | 0.80% | | | 0.59% | | | 0.90% | | | 0.64% | | | 0.54% | |
| Ratio of net investment income | | | | | | | | | | | | | | | |
| without reimbursement | | 0.64% | | | 0.47% | | | 0.78% | | | 0.57% | | | 0.46% | |
| Portfolio turnover rate | | 29% | | | 89% | | | 32% | | | 45% | | | 27% | |
See Notes to Financial Statements.
45
| FINANCIAL HIGHLIGHTS(Continued) |
| |
The following table presents information relating to a share of capital stock outstanding for the entire period.
MIDCAP FUND
| | Year Ended November 30, |
| | 2018 | | 2017 | | 2016 | | 2015 | | 2014 |
| Per share operating performance | | | | | | | | | | | | | | | |
| Net asset value, beginning of period | | $13.73 | | | $12.53 | | | $12.07 | | | $14.04 | | | $14.04 | |
| Income from investment operations | | | | | | | | | | | | | | | |
| Net investment income (loss) | | 0.03 | | | 0.01 | | | 0.01 | | | – | (a) | | – | (a) |
| Net realized and unrealized gains (losses) | | | | | | | | | | | | | | | |
| on investments | | (0.75 | ) | | 1.78 | | | 1.45 | | | (0.64 | ) | | 1.47 | |
| Total from investment operations | | (0.72 | ) | | 1.79 | | | 1.46 | | | (0.64 | ) | | 1.47 | |
| Less distributions | | | | | | | | | | | | | | | |
| Distributions from net investment income | | (0.01 | ) | | (0.01 | ) | | – | (a) | | – | | | – | |
| Distributions from net realized gains | | (0.98 | ) | | (0.58 | ) | | (1.00 | ) | | (1.33 | ) | | (1.47 | ) |
| Total distributions | | (0.99 | ) | | (0.59 | ) | | (1.00 | ) | | (1.33 | ) | | (1.47 | ) |
| Net asset value, end of period | | $12.02 | | | $13.73 | | | $12.53 | | | $12.07 | | | $14.04 | |
| Total return | | (5.85% | ) | | 14.78% | | | 13.82% | | | (5.10% | ) | | 11.82% | |
| Ratios and supplemental data | | | | | | | | | | | | | | | |
| Net assets, end of period (millions) | | $45.0 | | | $50.9 | | | $43.8 | | | $38.4 | | | $41.3 | |
| Ratios to average net assets: | | | | | | | | | | | | | | | |
| Ratios of expenses | | 1.15% | | | 1.20% | | | 1.25% | | | 1.30% | | | 1.30% | |
| Ratio of expenses without reimbursement | | 1.42% | | | 1.44% | | | 1.50% | | | 1.49% | | | 1.54% | |
| Ratio of net investment income (loss) | | 0.19% | | | 0.06% | | | 0.06% | | | 0.01% | | | (0.02% | ) |
| Ratio of net investment loss | | | | | | | | | | | | | | | |
| without reimbursement | | (0.08% | ) | | (0.18% | ) | | (0.19% | ) | | (0.18% | ) | | (0.27% | ) |
| Portfolio turnover rate | | 30% | | | 29% | | | 34% | | | 27% | | | 34% | |
(a) Less than .005 per share.
See Notes to Financial Statements.
46
| FINANCIAL HIGHLIGHTS(Continued) |
| |
The following table presents information relating to a share of capital stock outstanding for the entire period.
BOND FUND
| | Year Ended November 30, |
| | 2018 | | 2017 | | 2016 | | 2015 | | 2014 |
| Per share operating performance | | | | | | | | | | | | | | | |
| Net asset value, beginning of period | | $11.45 | | | $11.22 | | | $10.98 | | | $11.69 | | | $11.91 | |
| Income from investment operations | | | | | | | | | | | | | | | |
| Net investment income | | 0.36 | | | 0.35 | | | 0.49 | | | 0.49 | | | 0.45 | |
| Net realized and unrealized gains (losses) | | | | | | | | | | | | | | | |
| on investments | | (0.09 | ) | | 0.27 | | | 0.26 | | | (0.72 | ) | | (0.19 | ) |
| Total from investment operations | | 0.27 | | | 0.62 | | | 0.75 | | | (0.23 | ) | | 0.26 | |
| Less distributions | | | | | | | | | | | | | | | |
| Distributions from net investment income | | (0.34 | ) | | (0.39 | ) | | (0.51 | ) | | (0.48 | ) | | (0.45 | ) |
| Distributions from net realized gains | | – | | | – | | | – | | | – | | | (0.03 | ) |
| Total distributions | | (0.34 | ) | | (0.39 | ) | | (0.51 | ) | | (0.48 | ) | | (0.48 | ) |
| Net asset value, end of period | | $11.38 | | | $11.45 | | | $11.22 | | | $10.98 | | | $11.69 | |
| Total return | | 2.37% | | | 5.57% | | | 7.05% | | | (2.04% | ) | | 2.19% | |
| Ratios and supplemental data | | | | | | | | | | | | | | | |
| Net assets, end of period (millions) | | $3,655.2 | | | $2,620.6 | | | $2,020.5 | | | $2,744.5 | | | $3,724.0 | |
| Ratios to average net assets: | | | | | | | | | | | | | | | |
| Ratios of expenses | | 0.71% | | | 0.71% | | | 0.72% | | | 0.71% | | | 0.72% | |
| Ratio of net investment income | | 3.21% | | | 3.01% | | | 4.16% | | | 3.98% | | | 4.04% | |
| Portfolio turnover rate | | 39% | | | 43% | | | 20% | | | 29% | | | 21% | |
See Notes to Financial Statements.
47
REPORT OF INDEPENDENT REGISTERED PUBLIC ACCOUNTING FIRM
To the Shareholders and Board of Directors of
Thompson IM Funds, Inc.
Opinion on the Financial Statements
We have audited the accompanying statements of assets and liabilities, including the schedules of investments, of Thompson IM Funds, Inc. comprising Thompson LargeCap Fund, Thompson MidCap Fund, and Thompson Bond Fund (the “Funds”) as of November 30, 2018, and the related statements of operations for the year then ended, the statements of changes in net assets for each of the two years in the period then ended, including the related notes, and the financial highlights for each of the five years in the period then ended (collectively referred to as the “financial statements”). In our opinion, the financial statements present fairly, in all material respects, the financial position of each of the Funds as of November 30, 2018, the results of their operations for the year then ended, the changes in their net assets for each of the two years in the period then ended, and the financial highlights for each of the five years in the period then ended, in conformity with accounting principles generally accepted in the United States of America.
Basis for Opinion
These financial statements are the responsibility of the Funds’ management. Our responsibility is to express an opinion on the Funds’ financial statements based on our audits. We are a public accounting firm registered with the Public Company Accounting Oversight Board (United States) (“PCAOB”) and are required to be independent with respect to the Funds in accordance with the U.S. federal securities laws and the applicable rules and regulations of the Securities and Exchange Commission and the PCAOB.
We conducted our audits in accordance with the standards of the PCAOB. Those standards require that we plan and perform the audit to obtain reasonable assurance about whether the financial statements are free of material misstatement, whether due to error or fraud.
Our audits included performing procedures to assess the risks of material misstatement of the financial statements, whether due to error or fraud, and performing procedures that respond to those risks. Such procedures included examining, on a test basis, evidence regarding the amounts and disclosures in the financial statements. Our procedures included confirmation of securities owned as of November 30, 2018, by correspondence with the custodian and brokers. Our audits also included evaluating the accounting principles used and significant estimates made by management, as well as evaluating the overall presentation of the financial statements. We believe that our audits provide a reasonable basis for our opinion.
We have served as the Funds’ auditor since 2010.

COHEN & COMPANY, LTD.
Milwaukee, Wisconsin
January 25, 2019
48
| DIRECTORS AND OFFICERS(Unaudited) |
| Information as of 12/31/18 |
Name and
Birth Date | | Position(s) Held with
Thompson IM Funds, Inc.
and Length of Time Served(1) | | Principal Occupation(s)
During Past Five Years | | Number of
Thompson IM
Funds Overseen
by Director | | Other
Directorships
Held
by Director |
| Independent Directors | | | | | | | | |
George E. Austin
Birth date: 9/15/52 | | Director since 2011 | | ●President of AVA Civic Enterprises Inc. (consulting firm), since 2011 ●Director of W. Jerome Frautschi Foundation Inc. (private foundation), since 2012; President from 1998 to 2012 ●Director of the Home Savings Bank since 1998 ●Director of Overture Development Corporation (support organization for Overture Center Foundation), since 2001; President from 2001 to 2009 | | 3 | | None |
Cornelia Boyle
Birth date: 9/23/53 | | Director since 2015 | | ●Currently retired ●Director of North Track Funds, Inc. (investment company) from 2003 to 2009 ●Trustee of Ziegler Exchange Traded Trust (investment company) from 2005 to 2009 ●Executive Vice President and Chief Operations Officer, AIG Sun America Retirement Markets, Inc. (distribution and marketing company for variable annuity and retirement products) from 2000 to 2003 ●Executive Vice President, Fidelity Investments from 1996 to 2000 | | 3 | | None |
Patricia Lipton
Birth date: 12/9/42 | | Director since 2007 Chairman since 2018 | | ●Currently retired ●Executive Director, State of Wisconsin Investment Board (“SWIB”) from 1989 to 2004 ●Assistant Executive Director, SWIB from 1982 to 1989 ●Former Director, State Tax Policy Bureau of the Wisconsin Department of Revenue | | 3 | | None |
49
| DIRECTORS AND OFFICERS(Unaudited) (Continued) |
| Information as of 12/31/18 |
Name and
Birth Date | | Position(s) Held with
Thompson IM Funds, Inc.
and Length of Time Served(1) | | Principal Occupation(s)
During Past Five Years | | Number of
Thompson IM
Funds Overseen
by Director | | Other
Directorships
Held
by Director |
| Interested Directors and Officers | | | | | | |
Jason L. Stephens(2)
Birth date: 10/15/74 | | Director since 2011 Chief Executive Officer since 2015 Vice President from 2009 to 2015 | | ●Chief Executive Officer of Thompson Investment Management (“TIM”) since 2015 ●Chief Operating Officer of TIM from 2009 to 2015 ●Corporate Secretary of TIM since 2004 ●Portfolio Manager of TIM since 2007 ●A Chartered Financial Analyst | | 3 | | None |
John W. Thompson(2)
Birth date: 7/26/43 | | Director since 1987 President since 2009 Chief Executive Officer from 2005 to 2015 | | ●Chairman of TIM since 2015 ●President of TIM since 2004 ●President of Thompson Plumb & Associates, Inc. (“TPA”) (investment advisor) from 1984 to 2003 ●A Chartered Financial Analyst | | 3 | | None |
James T. Evans
Birth date: 6/6/75 | | Vice President since 2009 | | ●Chief Investment Officer of TIM since 2009 ●Portfolio Manager of TIM since 2008 ●Managing Director of Nakoma Capital Management from 2000 to 2005 ●A Chartered Financial Analyst | | N/A | | N/A |
Penny M. Hubbard
Birth date: 6/2/61 | | Chief Financial Officer and Treasurer since 2005 | | ●Vice President of TIM since 2004 ●Assistant Vice President - Client Services of TPA and various other capacities 1984-2004 | | N/A | | N/A |
Nedra S. Pierce
Birth date: 10/2/61 | | Chief Compliance Officer since 2006 | | ●Chief Compliance Officer of TIM since 2006 ●Director of Business Development of TIM from 2004 to 2006 and since 2010 ●Director of Business Development of TPA from 1998 to 2003 | | N/A | | N/A |
Lesley T. Bailey
Birth date: 9/30/78 | | Secretary since 2010 | | ●Fund Accounting and Administration at TIM since 2004 ●Fund Accounting and Administration at TPA from 2001 to 2004 | | N/A | | N/A |
Sarah M. Baumgartner
Birth date: 2/21/84 | | Assistant Secretary since 2012 | | ●Fund Accounting and Administration at TIM since 2007 | | N/A | | N/A |
The address of each Director and officer as it relates to the Company’s business is 918 Deming Way, Madison WI 53717.
(1) Officers of the Company serve one-year terms, subject to annual reappointment by the Board of Directors. Directors of the Investment Company serve a term of indefinite length until their resignation or removal, and stand for re-election by shareholders as and when required under the 1940 Act.
(2) Jason L. Stephens and John W. Thompson are “interested persons” of the Company by virtue of their position with the Company and TIM.
50
| ADDITIONAL INFORMATION(Unaudited) |
| |
| THOMPSON IM FUNDS, INC. |
| |
| Investment Advisor |
| Thompson Investment Management, Inc. |
| 918 Deming Way |
| Madison, Wisconsin 53717 |
| |
| Distributor |
| Quasar Distributors, LLC |
| 777 East Wisconsin Avenue |
| Milwaukee, Wisconsin 53202 |
| |
| Transfer Agent |
| U.S. Bank Global Fund Services |
| 615 East Michigan Street |
| Milwaukee, Wisconsin 53202 |
| |
| Independent Registered |
| Public Accounting Firm |
| Cohen & Company, Ltd. |
| 342 North Water Street, Suite 830 |
| Milwaukee, Wisconsin 53202 |
| |
| Legal Counsel |
| Quarles & Brady LLP |
| 411 East Wisconsin Avenue |
| Milwaukee, Wisconsin 53202 |
The Statement of Additional Information contains additional information about the directors and officers of Thompson IM Funds, Inc. and is available without charge, upon request, by calling 1-800-999-0887.
Proxy Voting Policy
A description of the policies and procedures that the Funds use to determine how to vote proxies relating to portfolio securities and information regarding how the Funds actually voted proxies during the most recent 12-month period ended June 30 are available without charge, upon request, by calling 1-800-999-0887, through the Funds’ website at www.thompsonim.com and on the SEC’s website at www.sec.gov.
Information About Portfolio Securities
The Funds file complete schedules of their portfolio holdings with the Securities and Exchange Commission for the Funds’ first and third quarters of its fiscal year on Form N-Q. The Funds’ Forms N-Q are available on the Securities and Exchange Commission’s website at www.sec.gov. The Funds’ Forms N-Q are also available without charge, upon request, by calling 1-800-999-0887.
51
| ADDITIONAL INFORMATION(Unaudited) (Continued) |
| |
Board Approval of Investment Advisory Agreement
The Investment Company Act of 1940 (the “Act”) requires that the Investment Advisory Agreement (the “Agreement”) for Thompson IM Funds, Inc. (the “Funds”) be approved annually by a vote of a majority of the Board of Directors, including a majority of the Directors who are not parties to the Agreement or “interested persons” of the Funds as that term is defined in the Act (the “Independent Directors”). At its meeting on November 7, 2018, the Board of Directors of the Funds, including all of the Independent Directors, voted unanimously to renew the existing Agreement between the Funds and Thompson Investment Management, Inc. (the “Advisor”) for each of the LargeCap Fund, the MidCap Fund, and the Bond Fund (each of these series of the Funds is sometimes referred to as a “Fund” in this section).
The Board’s approval was based on its consideration and evaluation of a variety of factors, including: (1) the nature, extent, and quality of the services provided by the Advisor; (2) the performance of each of the Funds in comparison to its benchmark index and to a peer group of mutual funds; (3) the management fees and total operating expenses of each Fund, including comparative information with respect to a peer group of mutual funds and with respect to fees charged by the Advisor to other clients whose assets are managed under similar objectives and strategies; (4) the extent to which economies of scale may be realized as a Fund grows; and (5) whether fee levels reflect any potential economies of scale for the benefit of shareholders. The Board generally viewed these factors in their totality, with no single factor serving as the principal reason for determining whether to renew the Agreement and with individual Board members giving different weight to different factors.
In connection with the renewal process, both the Independent Directors as well as the full Board met separately in person on November 7, 2018, and the full Board met by telephone on November 5, 2018, to consider information relevant to the renewal process. The Independent Directors and the full Board are referred to collectively as the “Board” in this section.
To facilitate evaluation of the Agreement, the Board worked with the Advisor and independent legal counsel to request, obtain, and review information prepared or compiled by the Advisor as well as an independent analysis of each Fund’s performance, expenses, and profitability prepared by Broadridge, a leading independent provider of data for independent directors of investment companies for purposes of their review of investment advisory agreements. Information reviewed included a memorandum from Fund counsel discussing the fiduciary duty of Directors under Section 15(c) of the Act; an executive summary and memorandum from Fund management providing its recommendation for renewal of the Agreement; the Advisor’s analysis of profitability of the Agreement to the Advisor and the profitability of related service contracts with the Advisor; a separate profitability comparison prepared by Broadridge; a detailed statistical report from Broadridge comparing each Fund’s respective performance and expenses with both a comparison “group” and a comparison “universe” and a report from Broadridge outlining its methodology in preparing that report; supplementary performance information as of the most recent calendar quarter for the Funds, including a comparison of each Fund’s performance to an applicable category of funds as determined by Morningstar, Inc., a ranking service widely recognized in the mutual fund industry; information regarding the composition of and fees charged for standardized investment products offered to separately managed account clients of the Advisor; the Advisor’s Form ADV, which, among other things, showed fees charged by the Advisor to manage the investments of other clients with objectives and programs similar to the Funds; the Agreement and other service agreements with the Advisor; and background information on the Funds’ portfolio managers and reports from the Funds’ Chief Compliance Officer. In addition, the Board had received and considered detailed information on the Funds’ investment performance and expenses at each of its quarterly meetings during the year as well as in-person reports from the Fund’s portfolio managers and reports from the Funds’ Chief Compliance Officer. Throughout the review and approval process, the Independent Directors were represented by independent legal counsel. The Board consulted with independent legal counsel and the Advisor throughout the review and approval process to evaluate the information provided, including the methodology employed by Broadridge in the reports produced for the Board, and to confirm that the content of the information produced as a result of its follow-up requests was satisfactory.
The Board considered the nature, extent, and quality of services provided by the Advisor, including services required to be provided under the Agreement, services required to be provided under other agreements with the Advisor and with affiliates of the Advisor, and additional services provided by the Advisor that were not required under any of those agreements. The Board considered the background and experience of the Funds’ portfolio managers, other advisory personnel, compliance personnel, and other support personnel. It noted that in addition to considering these factors at this meeting, it had also considered many of these factors during the course of its quarterly meetings over the past year as well as at its November 5 special telephonic meeting. The Board noted that, in addition to investment management and broker-selection services, the Advisor prepares compliance and other materials for each of the Board’s meetings; provides office space, equipment, information technology and administrative services necessary for operation of the Funds; and performs regular compliance and risk-analysis functions for the Funds. The Board believed that the nature, extent, and quality of services provided by the Advisor were comparable to those provided by advisors to comparable funds and that such services were adequate for the Funds’ needs, and were being performed by the Advisor in a competent and appropriate manner.
52
| ADDITIONAL INFORMATION(Unaudited) (Continued) |
| |
The Board reviewed the one-, two-, three-, four-, five- and ten-year investment performances of each Fund.
The Board observed that the investment performance for the LargeCap Fund was in the top 40 percent or top 60 percent of its Broadridge performance group for all but the three-year period, in which it ranked in the bottom 40 percent, although it compared less favorably relative to its performance universe, in which it ranked in the bottom 40 percent for all but the two-year period.
The performance of the MidCap Fund ranked in the top 40 percent of its performance group for the two- and ten-year periods, but in the bottom 40 percent for all other periods. It ranked in the top 40 percent of its performance universe for the two- and ten-year periods and in the top 60 percent for the three- and five-year periods.
The Board noted that the Bond Fund ranked in the top 20 percent of both its performance group and its performance universe for every period measured.
After considering the performances of the LargeCap Fund, MidCap Fund, and Bond Fund, the Board determined that relative to the performances of comparable funds and to each Fund’s benchmark index, the performance of each Fund was within an acceptable range.
In reviewing the cost of services provided to the Funds and profits realized by the Advisor from these relationships, the Board compared information relating to the various management fees charged to separately managed accounts of the Advisor that have relatively analogous investment objectives as those of a Fund. Among the information reviewed by the Board was information relating to standardized investment products offered to separately managed account clients of the Advisor. The Board determined that these standardized products in most instances had investment objectives and styles that were sufficiently different from the investment objectives and styles of any of the Funds so as to make the comparison inapt. With respect to those standardized products available to separately managed account clients of the Advisor that the Board determined to be sufficiently similar in investment objective and strategy to a Fund to be relevant for comparative purposes, the Board determined that in light of the significantly different level of services and resources required for the management of these products and the Funds, the management fees charged by the Advisor with respect to each of the Funds were reasonable relative to the management fees charged by the Advisor with respect to the relevant standardized separately managed account product.
The information provided by Broadridge indicated that the advisory fees of the LargeCap Fund, after taking into account the waiver of a portion of those fees, were in the highest 40 percent of the Fund’s Broadridge comparison group and highest 20 percent of the Fund’s comparison universe. That information indicated that the actual total expense ratio of the LargeCap Fund was among the highest 40 percent of its comparison universe, although its actual total expense ratio was closer to the median of its comparison group. The Board observed that the Advisor was proposing to institute a more substantial fee waiver that would further lower the ceiling on the maximum total expense ratio that the Fund could incur from 1.05 percent to 1.03 percent of average daily net assets of the Fund. After taking into account all of these considerations, the Board determined that the management fee and total expense ratio of the LargeCap Fund were reasonable.
The Board noted that the MidCap Fund’s contractual management fee ranked among the highest of funds in the MidCap Fund’s Broadridge comparison group, though after taking into account the waiver of a portion thereof by the Advisor, its total expenses ranked in the fourth quintile of its comparison group. The Board observed that the total expense ratio and the non-management expense ratio of the Fund continued to be relatively high, in particular as compared to the Fund’s Broadridge comparison universe, but that these ratios compared somewhat more favorably relative to the Fund’s comparison group. The Board observed that the opportunity existed for the total expense ratio, and in particular non-management expenses, to further decline as the MidCap Fund grows in assets. The Board considered that the Advisor was proposing to continue the fee waiver for the Fund, capping the maximum total expense ratio that the Fund could incur at 1.15 percent. After taking into account all of these considerations, the Board determined that the management fee and total expense ratio of the MidCap Fund were reasonable.
The Board noted that the Bond Fund’s contractual management fee was among the highest of its Broadridge comparison group and that its actual management fee was the highest of both its comparison group and comparison universe. The Board also noted, however, that the Fund’s total expense ratio was in the lowest 40 percent of both its Broadridge comparison group and comparison universe, which the Board determined was reasonable.
With regard to profitability, the Board noted that the Advisor’s pre-tax profitability, before accounting for marketing fees borne by the Advisor, ranked below the median of firms included in the Broadridge analysis, though it ranked somewhat above the median of firms on a post-marketing basis. The Board observed that all of the investment advisors for which profitability information was publicly available and that were included in the Broadridge comparison were publicly traded entities having markedly different marketing strategies from that of the Advisor. The Board determined that the operating margins of the Advisor were reasonable and, after reviewing information provided by Broadridge and reviewing the Advisor’s own analysis, the Board concluded that the cost of services provided by the Advisor and its affiliates to the Funds and the profits realized with respect thereto were reasonable.
53
| ADDITIONAL INFORMATION(Unaudited) (Continued) |
| |
The Board also considered whether economies of scale might be realized as the Funds’ assets increase. It noted that the Agreement provides for a fee breakpoint at $50 million of assets. This breakpoint is equal to ten basis points for the LargeCap Fund and MidCap Fund and five basis points for the Bond Fund. The Board considered that an increase in assets could provide economies of scale in the Funds’ operations. However, it noted that the level of assets of both the LargeCap Fund and the MidCap Fund presented no meaningful opportunity for such economies. Therefore the Board concluded that neither Fund was likely to realize material economies of scale until its assets grew significantly. The Board noted that assets in the Bond Fund had continued to trend upward, but determined that the Bond Fund had not yet reached a point where the Fund was realizing any material economies of scale.
The Board considered additional benefits to the Advisor arising from the Agreement, such as that the Funds may enhance the Advisor’s reputation as an investment adviser, thereby helping the Advisor to attract other clients and investment personnel. The Board determined that benefits of the sort derived from the Agreement were consistent with the benefits received by other advisers to mutual funds.
Based primarily on these considerations, the Board renewed the Agreement with respect to each Fund.
54
Item 2. Code of Ethics.
As of the end of the period covered by this report on Form N-CSR, the Registrant has adopted a Code of Ethics (as defined in Item 2(b) of Form N-CSR) that applies to the Registrant’s principal executive officer, principal financial officer and principal accounting officer. The Registrant’s Code of Ethics (as defined in Item 2(b) of Form N-CSR) and any amendments or waivers thereto are available on the Registrant’s website atwww.thompsonim.com.
Item 3. Audit Committee Financial Expert.
The Registrant’s Board of Directors has determined that the Registrant has at least one audit committee financial expert serving on its audit committee. George Austin, a director of the Registrant since 2011, has been determined to be an audit committee financial expert and is “independent” within the meaning of Item 3(a)(2) of Form N-CSR. Mr. Austin holds a Bachelor of Business Administration degree, majoring in finance, and a Master of Science degree in Business, both from the University of Wisconsin-Madison. He previously served as the chair of the audit committee of Home Savings Bank, a mutual savings institution on whose board he has served since 1998. He also has professional experience leading all aspects, including financial, of a number of major public-private civic projects as well as experience overseeing the response to independent financial and management audits.
Item 4. Principal Accountant Fees and Services.
The following table sets forth information as to the fees billed to the Registrant for each of the last two fiscal years for audit-related, tax and other services and products provided by Cohen & Company, Ltd., the Registrant’s principal accountant.
| Fiscal Year Ended November 30, |
| 2017 | | 2018 |
| Audit Fees(1) | | $ | 40,000.00 | | | | $ | 40,000.00 | |
| Audit-Related Fees(2) | | $ | 0.00 | | | | $ | 0.00 | |
| Tax Fees(3) | | $ | 9,000.00 | | | | $ | 9,000.00 | |
| All Other Fees(4) | | $ | 0.00 | | | | $ | 0.00 | |
| TOTAL | | $ | 49,000.00 | | | | $ | 49,000.00 | |
___________________
| (1) | This category relates to professional services rendered by the principal accountant for the audit of the Registrant's annual financial statements or services that are normally provided by the accountant in connection with statutory and regulatory filings or engagements for those fiscal years. |
| | |
| (2) | This category relates to assurance and related services by the principal accountant that are reasonably related to the performance of the audit of the Registrant's financial statements and are not reported under "Audit Fees" above. |
| |
| (3) | This category relates to professional services rendered by the principal accountant for tax compliance, tax advice and tax planning. For 2017 and 2018, the tax services provided by the Registrant’s principal accountant specifically related to the preparation of the Registrant’s federal and state income and excise tax returns and a review of the Registrant’s distributions of capital gains and dividend and interest income. |
| | |
| (4) | This category relates to products and services provided by the principal accountant other than those reported under "Audit Fees," "Audit-Related Fees," and "Tax Fees" above. |
2
Cohen & Company, Ltd. did not bill any amounts over the last two fiscal years for services or products provided to Thompson Investment Management, Inc., the Registrant's investment advisor, or any entity controlling, controlled by or under common control with such advisor that provides ongoing services for the Registrant.
The audit committee of the Registrant’s Board of Directors has not adopted any pre-approval policies and procedures (as described in paragraph (c)(7) of Rule 2-01 of Regulation S-X) regarding the provision of audit or non-audit services to the Registrant.
No services described in paragraphs (b)-(d) of this Item were approved by the audit committee pursuant to paragraph (c)(7)(i)(C) of Rule 2-01 of Regulation S-X.
Item 5. Audit Committee of Listed Registrants.
Not applicable to this Registrant because it is not a “listed issuer” within the meaning of Rule 10A-3 under the Securities Exchange Act of 1934.
Item 6. Investments.
The required Schedules of Investments in securities of unaffiliated issuers is included as part of the Registrant’s Annual Report to Shareholders dated as of November 30, 2018 provided under Item 1 of this Form N-CSR.
Item 7. Disclosure of Proxy Voting Policies and Procedures for Closed-End Management Investment Companies.
Not applicable to this Registrant because it is not a closed-end management investment company.
Item 8. Portfolio Managers of Closed-End Management Investment Companies.
Not applicable to this Registrant because it is not a closed-end management investment company.
Item 9. Purchases of Equity Securities by Closed-End Management Investment Companies and Affiliated Purchasers.
Not applicable to this Registrant because it is not a closed-end management investment company.
Item 10. Submission of Matters to a Vote of Securities Holders.
The Registrant has not made any material changes to the procedures by which shareholders may recommend nominees to the Registrant's Board of Directors after the Registrant last provided disclosure in response to the requirements of Item 407(c)(2)(iv) of Regulation S-K or this Item.
3
Item 11. Controls and Procedures.
| (a) | Disclosure Controls and Procedures. Based on an evaluation of the Registrant’s disclosure controls and procedures (as defined in Rule 30a-3(c) under the Investment Company Act of 1940) carried out under the supervision and with the participation of the Registrant’s management, including its principal executive and financial officers, within 90 days prior to the filing date of this report on Form N-CSR, the Registrant’s principal executive and financial officers have concluded that the design and operation of the Registrant’s disclosure controls and procedures are effective in providing reasonable assurance that the information required to be disclosed on Form N-CSR is recorded, processed, summarized and reported within the applicable time periods. |
| | |
| (b) | Change in Internal Controls Over Financial Reporting. There were no changes in the Registrant’s internal control over financial reporting (as defined in Rule 30a-3(d) under the Investment Company Act of 1940) that occurred during the Registrant’s second fiscal quarter of the period covered by this Form N-CSR that have materially affected, or are reasonably likely to materially affect, the Registrant’s internal control over financial reporting. |
Item 12. Disclosure of Securities Lending Activities for Closed-End Management Investment Companies.
Not applicable to this Registrant because it is not a closed-end management investment company.
Item 13. Exhibits.
The following exhibits are attached to this Form N-CSR:
| | Exhibit No. | | Description of Exhibit | |
| | 12(a)(1) | | The Code of Ethics for the Registrant’s Principal Executive Officer, Principal Financial Officer and Principal Accounting Officer referred to in Item 2 was filed as Exhibit 12(a)(1) to the Registrant’s Certified Shareholder Report on Form N-CSR filed on January 28, 2005, and is incorporated herein by reference |
| | | | |
| | 12(a)(2)-1 | | Certification of Principal Executive Officer Required by Section 302 of the Sarbanes-Oxley Act of 2002 |
| | | | |
| | 12(a)(2)-2 | | Certification of Principal Financial Officer Required by Section 302 of the Sarbanes-Oxley Act of 2002 |
| | | | |
| | 12(b) | | Certification of Chief Executive Officer and Chief Financial Officer Required by Section 906 of the Sarbanes-Oxley Act of 2002 |
4
SIGNATURES
Pursuant to the requirements of the Securities Exchange Act of 1934 and the Investment Company Act of 1940, the Registrant has duly caused this report to be signed on its behalf by the undersigned, thereunto duly authorized, on this 31stday of January 2019.
| THOMPSON IM FUNDS, INC. |
| |
| By: | /s/ Jason L. Stephens | |
| | Jason L. Stephens, Chief Executive |
| | Officer |
Pursuant to the requirements of the Securities Exchange Act of 1934 and the Investment Company Act of 1940, this report has been signed below by the following persons on behalf of the Registrant and in the capacities indicated on this 31stday of January 2019.
| By: | /s/ Jason L. Stephens | |
| | Jason L. Stephens, Chief Executive |
| | Officer (Principal Executive Officer) |
| | |
| By: | /s/ Penny Hubbard | |
| | Penny Hubbard, Chief Financial |
| | Officer (Principal Financial Officer) |
5