UNITED STATES
SECURITIES AND EXCHANGE COMMISSION
Washington, D.C. 20549
FORM N-CSR
CERTIFIED SHAREHOLDER REPORT OF REGISTERED
MANAGEMENT INVESTMENT COMPANIES
Investment Company Act file number 811-04708
SunAmerica Income Funds
(Exact name of registrant as specified in charter)
Harborside 5, 185 Hudson Street, Suite 3300, Jersey City, NJ 07311
(Address of principal executive offices) (Zip code)
John T. Genoy
Senior Vice President
SunAmerica Asset Management, LLC
Harborside 5,
185 Hudson Street, Suite 3300,
Jersey City, NJ 07311
(Name and address of agent for service)
Registrant’s telephone number, including area code: (201) 324-6414
Date of fiscal year end: March 31
Date of reporting period: March 31, 2021
Item 1. Reports to Stockholders
ANNUAL REPORT 2021
SUNAMERICA
Income Funds


aig.com/funds
Table of Contents
Shareholder Letter — (unaudited)
Dear Shareholders,
All of us at AIG and SunAmerica Asset Management, along with our Fund subadvisers, hope this annual report finds you and yours safe and well during these persistently challenging times.
As the COVID-19 pandemic continues to evolve, know that we remain focused on serving our Fund shareholders. As such, we are pleased to present this annual update for the SunAmerica Income Funds (the “Income Funds”) for the 12-month period ended March 31, 2021. From a broad perspective, it was a period wherein fixed income market performance was primarily driven by economic growth expectations, monetary and fiscal stimulus measures, and geopolitical events, including efforts to stem the COVID-19 pandemic. For the annual period overall, the Bloomberg Barclays U.S. Aggregate Bond Index*, a broad measure of the U.S. fixed income market, returned 0.71%.
In the second quarter of 2020, when the annual period began, global fixed income sectors generated positive returns. Political tensions were a focal point, with U.S.-China disputes reigniting, a wave of racial justice protests engulfing the U.S., and Brexit** uncertainty increasing. Global government bond yields were largely range-bound near record lows across most developed markets, supported by extremely accommodative central bank purchase programs and amplified policy responses to the pandemic and its impact on the economy and the financial markets. For example, the U.S. Federal Reserve (the “Fed”) announced a trillion-dollar lending program, which included high yield bonds. The European Central Bank (“ECB”) announced more generous terms for its targeted longer-term refinancing operations. The Bank of England (“BOE”) announced an extension of the U.K. government’s overdraft facility and increased its bond purchases. All that said, global government bond yield curves, or maturity spectrums, steepened‡, as short-term yields declined in the U.S. and the U.K. In fact, U.K. government bond yields dipped into negative territory after the BOE indicated negative rates could form part of a range of actions it might take should downside risks materialize. Most non-government bond sectors outperformed U.S. Treasuries and other sovereign bonds during the second calendar quarter. Fixed income credit sectors — both investment grade and high yield — performed especially strongly, as countries began to gradually emerge from lockdowns, vaccine developments progressed and asset purchases by the Fed commenced through its credit facilities. Emerging markets debt was also a particularly strong sector during the quarter, as emerging market central banks rapidly cut policy rates, with some banks also initiating unconventional policies, including forms of quantitative easing.
Global government bond yields ended the third quarter of 2020 mixed. Yield curves steepened, led by increases in yields on longer-term maturities in the U.S., Canada and the U.K., while most other government bond yields generally drifted lower. (Remember, there is an inverse relationship between bond prices and yield movements, so that bond prices rise when yields decrease and vice versa.) The Fed extended its emergency liquidity provisions through the end of 2020 and unveiled a new inflation policy framework that will allow inflation to modestly exceed 2% without a hawkish†† policy response. This low-for-longer and inflation tolerance policy stance by the Fed prompted the sell-off in longer-dated securities, while strong demand for U.S. Treasuries as a “safe haven” kept short-to intermediate-term yields low. The U.K.’s yield curve steepened, reflecting the backdrop of Brexit risks, disappointing economic data and rapidly rising estimates of British government borrowing needs. In contrast, Australian and Italian yields were among the major decliners. Among non-government bond sectors, performance was mixed. Credit sectors performed well, supported by expansionary fiscal policies, purchase programs by the Fed and the ECB, and strong demand, even as corporate issuance set records for the calendar year. Emerging markets debt also posted relatively strong returns. Some securitized sectors, including mortgage-backed securities, were comparatively weaker.
Global government bond yields ended the fourth quarter of 2020 mixed. Yield curves in the dollar-bloc economies, including the U.S., Australia, Canada and New Zealand, steepened, while yields in the U.K. and Germany drifted lower. Global central banks maintained highly accommodative policy stances, with the Fed providing assurance it would continue to acquire assets for the foreseeable future, and the ECB extending its Pandemic Emergency Purchase Programme through at least March 2022. Credit spreads remained mostly
range-bound in October but then rallied sharply in November and December, as positive news flow on COVID-19 vaccine development and distribution, a positive supply/demand backdrop and the passage of additional U.S. fiscal stimulus provided confidence around a stronger economic recovery in 2021.
In the first quarter of 2021, government bond yields moved sharply higher. U.S. Treasuries registered their worst quarterly return since 1980, driven by vaccine rollout progress, unprecedented fiscal stimulus and the Fed’s commitment to not preemptively hike rates in response to any transitory rise in inflation during the economic rebound. In turn, the U.S. Treasury yield curve steepened rapidly, which spilled over to other major markets, including the dollar-bloc economies. Chinese sovereign bonds represented the lone market among the 20 largest global debt markets to see yields decrease during the quarter. Most non-government bond sectors continued to outperform government bonds, with vaccine distribution gathering pace across developed markets and major central banks committing to maintain accommodative policies.
For the annual period overall, the U.S. Treasury yield curve steepened, as yields on shorter-term maturities fell and yields on intermediate- and longer-term maturities rose. The yield on the bellwether 10-year U.S. Treasury rose approximately 104 basis points† to end the annual period at 1.74%. Amongst non-U.S. Treasury sectors, high yield corporate bonds and sovereign emerging markets debt outperformed U.S. Treasuries most for the annual period as a whole, followed by investment grade corporate bonds. To a lesser extent, commercial mortgage-backed securities, asset-backed securities, mortgage-backed securities and agency securities also outpaced U.S. Treasuries.
On the following pages, you will find financial statements and portfolio information for each of the Income Funds during the annual period ended March 31, 2021.
We thank you for being a part of AIG Funds. We value your ongoing confidence in us and look forward to serving your investment needs in the future. As always, if you have any questions regarding your investments, please contact your financial professional or get in touch with us directly at 800-858-8850 or at our website, www.aig.com/funds.
Sincerely,
The SunAmerica Income Funds Investment Professionals
| | | | |
| Tim Pettee | | Robert Vanden Assem | | David L. Albrycht |
| Timothy Campion | | Dana Burns | | Frank Ossino |
| Elizabeth Mauro | | Anders Faergemann | | Eric Hess |
| | | John Yovanovic | | William Eastwood |
Past performance is no guarantee of future results.
| * | The Bloomberg Barclays U.S. Aggregate Bond Index represents securities that are SEC-registered, taxable and dollar denominated. The index covers the U.S. investment-grade fixed-rate bond market, with index components for government and corporate securities, mortgage pass-through securities and asset-backed securities. Indices are not managed and an investor cannot invest directly in an index. |
| ** | Brexit refers to the U.K.’s path out of the European Union. |
| ‡ | A steepening yield curve is one wherein the differential in yields between longer-term and shorter-term maturities widens. |
| †† | Hawkish policy tends to suggest higher interest rates; opposite of dovish. |
| † | A basis point is 1/100th of a percentage point. |
SunAmerica Income Funds
EXPENSE EXAMPLE — March 31, 2021 — (unaudited)
Disclosure of Portfolio Expenses in Shareholder Reports
As a shareholder of a fund (each, a “Fund” and collectively the “Funds”) in the SunAmerica Income Funds (the “Trust”), you may incur two types of costs: (1) transaction costs, including sales charges (loads) on purchase payments, contingent deferred sales charges and (2) ongoing costs, including management fees, distribution and service fees and other Fund expenses. The example set forth below is intended to help you understand your ongoing costs (in dollars) of investing in the Funds and to compare these costs with the ongoing costs of investing in other mutual funds. The Example is based on an investment of $1,000 invested at October 1, 2020 and held until March 31, 2021.
Actual Expenses
The “Actual” section of the table provides information about actual account values and actual expenses. You may use the information in these columns, together with the amount you invested, to estimate the expenses that you paid over the period. Simply divide your account value by $1,000 (for example, an $8,600 account value divided by $1,000 = 8.6), then multiply the result by the number in the column under the heading entitled “Expenses Paid During the Six Months Ended March 31, 2021” to estimate the expenses you paid on your account during this period. The “Expenses Paid During the Six Months Ended March 31, 2021” column and the “Annualized Expense Ratio” column do not include small account fees that may be charged if your account balance is below $500 ($250 for retirement plan accounts). In addition, the “Expenses Paid During the Six Months Ended March 31, 2021” column and the “Annualized Expense Ratio” column do not include administrative fees that may apply to qualified retirement plan accounts. See the Funds’ prospectuses, your retirement plan document and/or materials from your financial adviser for a full description of these fees. Had these fees been included, the “Expenses Paid During the Six Months Ended March 31, 2021” column would have been higher and the “Ending Account Value” column would have been lower.
Hypothetical Example for Comparison Purposes
The “Hypothetical” section of the table provides information about hypothetical account values and hypothetical expenses based on each Fund’s actual expense ratio and an annual rate of return of 5% before expenses, which is not the Fund’s actual return. The hypothetical account values and expenses may not be used to estimate the actual ending account balance or expenses you paid for the period. You may use this information to compare the ongoing costs of investing in the Funds and other funds. To do so, compare this 5% hypothetical example with the 5% hypothetical examples that appear in the shareholder reports of other funds. The “Expenses Paid During the Six Months Ended March 31, 2021” column and the “Annualized Expense Ratio” column do not include small account fees that may be charged if your account balance is below $500 ($250 for retirement plan accounts). In addition, the “Expenses Paid During the Six Months Ended March 31, 2021” column and the “Annualized Expense Ratio” column do not include administrative fees that may apply to qualified retirement plan accounts and accounts held through financial institutions. See the Funds’ prospectuses, your retirement plan document and/or materials from your financial adviser for a full description of these fees. Had these fees been included, the “Expenses Paid During the Six Months Ended March 31, 2021” column would have been higher and the “Ending Account Value” column would have been lower.
Please note that the expenses shown in the table are meant to highlight your ongoing costs only and do not reflect any transaction costs, including sales charges on purchase payments, contingent deferred sales charges, small account fees and administrative fees, if applicable to your account. Please refer to the Funds’ prospectus, your retirement plan document and/or material from your financial adviser, for more information. Therefore, the “Hypothetical” example is useful in comparing ongoing costs only, and will not help you determine the relative total costs of owning different funds. In addition, if these transaction costs and other fees were included, your costs would have been higher.
SunAmerica Income Funds
EXPENSE EXAMPLE — March 31, 2021 — (unaudited) (continued)
| | | | | | | | | | | | | | | | | | | | | | | | | | | | |
| | | Actual
| | | Hypothetical
| | | | |
Fund
| | Beginning
Account Value
at October 1,
2020
| | | Ending Account
Value using
Actual
Return at
March 31,
2021
| | | Expenses Paid
During the
Six Months
Ended
March 31,
2021
| | | Beginning
Account Value
at October 1,
2020
| | | Ending Account
Value using
a Hypothetical
5% Annual
Return at
March 31,
2021
| | | Expenses Paid
During the
Six Months
Ended
March 31,
2021
| | | Annualized
Expense
Ratio*
| |
AIG U.S. Government Securities# | | | | | | | | | | | | | | | | | | | | | | | | | | | | |
Class A | | $ | 1,000.00 | | | $ | 952.38 | | | $ | 4.82 | | | $ | 1,000.00 | | | $ | 1,020.00 | | | $ | 4.99 | | | | 0.99 | % |
Class C | | $ | 1,000.00 | | | $ | 948.21 | | | $ | 7.97 | | | $ | 1,000.00 | | | $ | 1,016.75 | | | $ | 8.25 | | | | 1.64 | % |
AIG Strategic Bond# | | | | | | | | | | | | | | | | | | | | | | | | | | | | |
Class A | | $ | 1,000.00 | | | $ | 1,028.09 | | | $ | 5.56 | | | $ | 1,000.00 | | | $ | 1,019.45 | | | $ | 5.54 | | | | 1.10 | % |
Class B | | $ | 1,000.00 | | | $ | 1,021.52 | | | $ | 9.27 | | | $ | 1,000.00 | | | $ | 1,015.76 | | | $ | 9.25 | | | | 1.84 | % |
Class C | | $ | 1,000.00 | | | $ | 1,025.07 | | | $ | 8.78 | | | $ | 1,000.00 | | | $ | 1,016.26 | | | $ | 8.75 | | | | 1.74 | % |
Class W | | $ | 1,000.00 | | | $ | 1,029.10 | | | $ | 4.55 | | | $ | 1,000.00 | | | $ | 1,020.44 | | | $ | 4.53 | | | | 0.90 | % |
AIG Flexible Credit# | | | | | | | | | | | | | | | | | | | | | | | | | | | | |
Class A | | $ | 1,000.00 | | | $ | 1,079.66 | | | $ | 5.60 | | | $ | 1,000.00 | | | $ | 1,019.55 | | | $ | 5.44 | | | | 1.08 | % |
Class C | | $ | 1,000.00 | | | $ | 1,075.60 | | | $ | 9.11 | | | $ | 1,000.00 | | | $ | 1,016.16 | | | $ | 8.85 | | | | 1.76 | % |
Class W | | $ | 1,000.00 | | | $ | 1,080.73 | | | $ | 4.46 | | | $ | 1,000.00 | | | $ | 1,020.64 | | | $ | 4.33 | | | | 0.86 | % |
| * | Expenses are equal to each Fund’s annualized expense ratio multiplied by the average account value over the period, multiplied by 182 days then divided by 365 days (to reflect the one-half year period). These ratios do not reflect transaction costs, including sales charges on purchase payments, contingent deferred sales charges, small account fees and administrative fees, if applicable to your account. Please refer to your Prospectus, your retirement plan documents and/or materials from your financial adviser for more information. |
| # | During the stated period, the investment advisor either waived a portion of or all of the fees and assumed a portion of or all expenses for the Funds. As a result, if these fees and expenses had not been waived or assumed, the “Actual/Hypothetical Ending Account Value” would have been lower and the “Actual/Hypothetical Expenses Paid During the Six Months Ended March 31, 2021” and the “Annualized Expense Ratio” would have been higher. |
SunAmerica Income Funds
STATEMENTS OF ASSETS AND LIABILITIES — March 31, 2021
| | | | | | | | | | | | |
| | | AIG U.S. Government
Securities
Fund
| | | AIG Strategic
Bond
Fund
| | | AIG Flexible
Credit
Fund
| |
ASSETS: | | | | | | | | | | | | |
Investments at value (unaffiliated)* | | $ | 115,975,841 | | | $ | 374,787,909 | | | $ | 234,262,679 | |
Repurchase agreements (cost approximates value) | | | 134,000 | | | | — | | | | — | |
Cash | | | 250 | | | | 15,401 | | | | — | |
Foreign cash* | | | — | | | | 11,442 | | | | — | |
Receivable for: | | | | | | | | | | | | |
Shares of beneficial interest sold | | | 1,876 | | | | 595,218 | | | | 498,060 | |
Dividends and interest | | | 470,804 | | | | 3,695,340 | | | | 2,224,603 | |
Investments sold | | | — | | | | 1,212,491 | | | | 148,290 | |
Investments sold on an extended settlement basis | | | — | | | | 105,453 | | | | 2,205,902 | |
Prepaid expenses and other assets | | | 5,509 | | | | 7,370 | | | | 7,156 | |
Due from investment adviser for expense reimbursements/fee waivers | | | 36,920 | | | | 85,124 | | | | 79,572 | |
Unrealized appreciation on forward foreign currency contracts | | | — | | | | 597,934 | | | | — | |
| | |
|
|
| |
|
|
| |
|
|
|
Total assets | | | 116,625,200 | | | | 381,113,682 | | | | 239,426,262 | |
| | |
|
|
| |
|
|
| |
|
|
|
LIABILITIES: | | | | | | | | | | | | |
Payable for: | | | | | | | | | | | | |
Shares of beneficial interest redeemed | | | 218,372 | | | | 1,716,301 | | | | 571,944 | |
Investments purchased | | | — | | | | 569,707 | | | | 4,110 | |
Investments purchased on an extended settlement basis | | | — | | | | 10,944,391 | | | | 8,107,645 | |
Investment advisory and management fees | | | 65,678 | | | | 204,027 | | | | 145,439 | |
Distribution and service maintenance fees | | | 39,691 | | | | 115,896 | | | | 71,141 | |
Transfer agent fees and expenses | | | 29,534 | | | | 80,421 | | | | 51,494 | |
Trustees’ fees and expenses | | | 843 | | | | 3,738 | | | | 1,824 | |
Other accrued expenses | | | 97,985 | | | | 173,718 | | | | 150,636 | |
Distributions Payable | | | 8,765 | | | | 126,455 | | | | 335,340 | |
Due to custodian | | | — | | | | — | | | | 169 | |
Commitments | | | — | | | | 37,293 | | | | 598,133 | |
Unrealized depreciation on forward foreign currency contracts | | | — | | | | 33,150 | | | | — | |
| | |
|
|
| |
|
|
| |
|
|
|
Total liabilities | | | 460,868 | | | | 14,005,097 | | | | 10,037,875 | |
| | |
|
|
| |
|
|
| |
|
|
|
Net assets | | $ | 116,164,332 | | | $ | 367,108,585 | | | $ | 229,388,387 | |
| | |
|
|
| |
|
|
| |
|
|
|
NET ASSETS REPRESENTED BY: | | | | | | | | | | | | |
Shares of beneficial interest, $0.01 | | $ | 126,004 | | | $ | 1,058,664 | | | $ | 679,292 | |
Paid-in capital | | | 129,883,257 | | | | 387,896,725 | | | | 253,518,798 | |
Total accumulated earnings (loss) | | | (13,844,929 | ) | | | (21,846,804 | ) | | | (24,809,703 | ) |
| | |
|
|
| |
|
|
| |
|
|
|
Net assets | | $ | 116,164,332 | | | $ | 367,108,585 | | | $ | 229,388,387 | |
| | |
|
|
| |
|
|
| |
|
|
|
*Cost | | | | | | | | | | | | |
Investments (unaffiliated) | | $ | 111,107,895 | | | $ | 372,374,467 | | | $ | 234,288,344 | |
| | |
|
|
| |
|
|
| |
|
|
|
Foreign cash | | $ | — | | | $ | 11,479 | | | $ | — | |
| | |
|
|
| |
|
|
| |
|
|
|
See Notes to Financial Statements
SunAmerica Income Funds
STATEMENTS OF ASSETS AND LIABILITIES — March 31, 2021 — (continued)
| | | | | | | | | | | | |
| | | AIG U.S. Government
Securities
Fund
| | | AIG Strategic
Bond
Fund
| | | AIG Flexible
Credit
Fund
| |
Class A (unlimited shares authorized): | | | | | | | | | | | | |
Net assets | | $ | 108,748,252 | | | $ | 173,599,936 | | | $ | 89,352,386 | |
Shares of beneficial interest issued and outstanding | | | 11,794,452 | | | | 50,032,841 | | | | 26,502,547 | |
Net asset value and redemption price per share (excluding any applicable contingent deferred sales charge) | | $ | 9.22 | | | $ | 3.47 | | | $ | 3.37 | |
Maximum sales charge (3.75% of offering price) | | | 0.36 | | | | 0.14 | | | | 0.13 | |
| | |
|
|
| |
|
|
| |
|
|
|
Maximum offering price to public | | $ | 9.58 | | | $ | 3.61 | | | $ | 3.50 | |
| | |
|
|
| |
|
|
| |
|
|
|
Class B (unlimited shares authorized): | | | | | | | | | | | | |
Net assets | | $ | — | | | $ | 14,059,716 | | | $ | — | |
Shares of beneficial interest issued and outstanding | | | — | | | | 4,059,383 | | | | — | |
Net asset value, offering and redemption price per share (excluding any applicable contingent deferred sales charge) | | $ | — | | | $ | 3.46 | | | $ | — | |
| | |
|
|
| |
|
|
| |
|
|
|
Class C (unlimited shares authorized): | | | | | | | | | | | | |
Net assets | | $ | 7,416,080 | | | $ | 39,402,189 | | | $ | 36,523,265 | |
Shares of beneficial interest issued and outstanding | | | 805,961 | | | | 11,328,063 | | | | 10,768,643 | |
Net asset value, offering and redemption price per share (excluding any applicable contingent deferred sales charge) | | $ | 9.20 | | | $ | 3.48 | | | $ | 3.39 | |
| | |
|
|
| |
|
|
| |
|
|
|
Class W (unlimited shares authorized): | | | | | | | | | | | | |
Net assets | | $ | — | | | $ | 140,046,744 | | | $ | 103,512,736 | |
Shares of beneficial interest issued and outstanding | | | — | | | | 40,446,104 | | | | 30,658,039 | |
Net asset value, offering and redemption price per share | | $ | — | | | $ | 3.46 | | | $ | 3.38 | |
| | |
|
|
| |
|
|
| |
|
|
|
See Notes to Financial Statements
SunAmerica Income Funds
STATEMENTS OF OPERATIONS — For the Year Ended March 31, 2021
| | | | | | | | | | | | |
| | | AIG U.S. Government
Securities
Fund
| | | AIG Strategic
Bond
Fund
| | | AIG Flexible
Credit
Fund
| |
INVESTMENT INCOME: | | | | | | | | | | | | |
Dividends (unaffiliated) | | $ | — | | | $ | 5,508 | | | $ | 685 | |
Interest (unaffiliated) | | | 2,310,365 | | | | 13,805,393 | | | | 13,645,276 | |
| | |
|
|
| |
|
|
| |
|
|
|
Total investment income* | | | 2,310,365 | | | | 13,810,901 | | | | 13,645,961 | |
| | |
|
|
| |
|
|
| |
|
|
|
EXPENSES: | | | | | | | | | | | | |
Investment advisory and management fees | | | 867,700 | | | | 2,237,830 | | | | 1,866,552 | |
Distribution and Service maintenance fees: | | | | | | | | | | | | |
Class A | | | 398,608 | | | | 567,642 | | | | 296,803 | |
Class B | | | — | | | | 147,452 | | | | — | |
Class C | | | 111,753 | | | | 464,212 | | | | 430,218 | |
Service fee — Class W | | | — | | | | 180,734 | | | | 182,312 | |
Transfer agent fees: | | | | | | | | | | | | |
Class A | | | 296,550 | | | | 388,898 | | | | 208,048 | |
Class B | | | — | | | | 35,677 | | | | — | |
Class C | | | 26,901 | | | | 108,993 | | | | 100,244 | |
Class W | | | — | | | | 269,629 | | | | 271,236 | |
Registration fees: | | | | | | | | | | | | |
Class A | | | 26,936 | | | | 29,042 | | | | 22,584 | |
Class B | | | — | | | | 14,166 | | | | — | |
Class C | | | 16,762 | | | | 20,830 | | | | 18,235 | |
Class W | | | — | | | | 29,738 | | | | 27,699 | |
Custodian and accounting fees | | | 23,792 | | | | 127,748 | | | | 62,471 | |
Reports to shareholders | | | 24,790 | | | | 49,468 | | | | 47,784 | |
Audit and tax fees | | | 64,655 | | | | 79,706 | | | | 80,762 | |
Legal fees | | | 50,179 | | | | 63,074 | | | | 60,010 | |
Trustees’ fees and expenses | | | 14,880 | | | | 39,333 | | | | 29,444 | |
Interest expense | | | 330 | | | | 91 | | | | 13,994 | |
Other expenses | | | 42,587 | | | | 55,280 | | | | 49,124 | |
| | |
|
|
| |
|
|
| |
|
|
|
Total expenses before fee waivers, expense reimbursements and expense recoupments | | | 1,966,423 | | | | 4,909,543 | | | | 3,767,520 | |
| | |
|
|
| |
|
|
| |
|
|
|
Net (fees waived and expenses reimbursed)/recouped by investment advisor (Note 3) | | | (572,183 | ) | | | (931,880 | ) | | | (1,013,458 | ) |
| | |
|
|
| |
|
|
| |
|
|
|
Net expenses | | | 1,394,240 | | | | 3,977,663 | | | | 2,754,062 | |
| | |
|
|
| |
|
|
| |
|
|
|
Net investment income (loss) | | | 916,125 | | | | 9,833,238 | | | | 10,891,899 | |
| | |
|
|
| |
|
|
| |
|
|
|
NET REALIZED AND UNREALIZED GAIN (LOSS) ON INVESTMENTS AND FOREIGN CURRENCIES: | | | | | | | | |
Net realized gain (loss) on: | | | | | | | | | | | | |
Investments (unaffiliated) | | | 1,401,137 | | | | 10,573,385 | | | | (2,522,972 | ) |
Forward contracts | | | — | | | | (1,568,282 | ) | | | — | |
Net realized foreign exchange gain (loss) on other assets and liabilities | | | — | | | | 5,050 | | | | — | |
| | |
|
|
| |
|
|
| |
|
|
|
Net realized gain (loss) on investments and foreign currencies | | | 1,401,137 | | | | 9,010,153 | | | | (2,522,972 | ) |
| | |
|
|
| |
|
|
| |
|
|
|
Change in unrealized appreciation (depreciation) on: | | | | | | | | | | | | |
Investments (unaffiliated) | | | (8,404,023 | ) | | | 21,406,436 | | | | 49,859,546 | |
Forward contracts | | | — | | | | 373,925 | | | | — | |
Change in unrealized foreign exchange gain (loss) on other assets and liabilities | | | — | | | | (183 | ) | | | — | |
| | |
|
|
| |
|
|
| |
|
|
|
Net unrealized gain (loss) on investments and foreign currencies | | | (8,404,023 | ) | | | 21,780,178 | | | | 49,859,546 | |
| | |
|
|
| |
|
|
| |
|
|
|
Net realized and unrealized gain (loss) on investments and foreign currencies | | | (7,002,886 | ) | | | 30,790,331 | | | | 47,336,574 | |
| | |
|
|
| |
|
|
| |
|
|
|
NET INCREASE (DECREASE) IN NET ASSETS RESULTING FROM OPERATIONS | | | (6,086,761 | ) | | | 40,623,569 | | | | 58,228,473 | |
| | |
|
|
| |
|
|
| |
|
|
|
* Net of foreign withholding taxes on interest and dividends of | | $ | — | | | $ | 203 | | | $ | — | |
| | |
|
|
| |
|
|
| |
|
|
|
See Notes to Financial Statements
SunAmerica Income Funds
STATEMENTS OF CHANGES IN NET ASSETS
| | | | | | | | | | | | | | | | | | | | | | | | |
| | | AIG U.S. Government
Securities Fund
| | | AIG Strategic Bond Fund
| | | AIG Flexible Credit Fund
| |
| | | For the year
ended
March 31,
2021
| | | For the year
ended
March 31,
2020
| | | For the year
ended
March 31,
2021
| | | For the year
ended
March 31,
2020
| | | For the year
ended
March 31,
2021
| | | For the year
ended
March 31,
2020
| |
INCREASE (DECREASE) IN NET ASSETS | | | | | | | | | | | | | | | | | | | | | | | | |
Operations: | | | | | | | | | | | | | | | | | | | | | | | | |
Net investment income (loss) | | $ | 916,125 | | | $ | 1,739,735 | | | $ | 9,833,238 | | | $ | 9,321,061 | | | $ | 10,891,899 | | | $ | 17,039,311 | |
Net realized gain (loss) on investments and foreign currencies | | | 1,401,137 | | | | 1,926,705 | | | | 9,010,153 | | | | 2,219,656 | | | | (2,522,972 | ) | | | (10,508,043 | ) |
Net unrealized gain (loss) on investments and foreign currencies | | | (8,404,023 | ) | | | 9,530,897 | | | | 21,780,178 | | | | (16,562,110 | ) | | | 49,859,546 | | | | (39,945,114 | ) |
| | |
|
|
| |
|
|
| |
|
|
| |
|
|
| |
|
|
| |
|
|
|
Net increase (decrease) in net assets resulting from operations | | | (6,086,761 | ) | | | 13,197,337 | | | | 40,623,569 | | | | (5,021,393 | ) | | | 58,228,473 | | | | (33,413,846 | ) |
| | |
|
|
| |
|
|
| |
|
|
| |
|
|
| |
|
|
| |
|
|
|
| | | | | | |
Distributions to shareholders from: | | | | | | | | | | | | | | | | | | | | | | | | |
Distributable earnings (Class A) | | | (1,859,353 | ) | | | (2,097,203 | ) | | | (5,433,173 | ) | | | (5,590,623 | ) | | | (3,987,394 | ) | | | (5,350,478 | ) |
Distributable earnings (Class B) | | | — | | | | — | | | | (385,245 | ) | | | (449,803 | ) | | | — | | | | — | |
Distributable earnings (Class C) | | | (95,466 | ) | | | (75,838 | ) | | | (1,251,979 | ) | | | (1,472,631 | ) | | | (1,718,396 | ) | | | (2,528,440 | ) |
Distributable earnings (Class W) | | | — | | | | — | | | | (4,228,308 | ) | | | (3,163,220 | ) | | | (5,920,680 | ) | | | (9,579,290 | ) |
| | |
|
|
| |
|
|
| |
|
|
| |
|
|
| |
|
|
| |
|
|
|
Total distributions to shareholders | | | (1,954,819 | ) | | | (2,173,041 | ) | | | (11,298,705 | ) | | | (10,676,277 | ) | | | (11,626,470 | ) | | | (17,458,208 | ) |
| | |
|
|
| |
|
|
| |
|
|
| |
|
|
| |
|
|
| |
|
|
|
Net increase (decrease) in net assets resulting from capital share transactions (Note 6) | | | (14,215,387 | ) | | | (6,229,168 | ) | | | 41,008,916 | | | | 37,021,203 | | | | (71,967,524 | ) | | | (6,163,477 | ) |
| | |
|
|
| |
|
|
| |
|
|
| |
|
|
| |
|
|
| |
|
|
|
Total increase (decrease) in net assets | | | (22,256,967 | ) | | | 4,795,128 | | | | 70,333,780 | | | | 21,323,533 | | | | (25,365,521 | ) | | | (57,035,531 | ) |
| | | | | | |
NET ASSETS: | | | | | | | | | | | | | | | | | | | | | | | | |
Beginning of period | | | 138,421,299 | | | | 133,626,171 | | | | 296,774,805 | | | | 275,451,272 | | | | 254,753,908 | | | | 311,789,439 | |
| | |
|
|
| |
|
|
| |
|
|
| |
|
|
| |
|
|
| |
|
|
|
End of period | | $ | 116,164,332 | | | $ | 138,421,299 | | | $ | 367,108,585 | | | $ | 296,774,805 | | | | 229,388,387 | | | $ | 254,753,908 | |
| | |
|
|
| |
|
|
| |
|
|
| |
|
|
| |
|
|
| |
|
|
|
See Notes to Financial Statements
SunAmerica Income Funds
FINANCIAL HIGHLIGHTS
| | | | | | | | | | | | | | | | | | | | | | | | | | | | | | | | | | | | | | | | | | | | | | | | | | | | |
AIG U.S. GOVERNMENT SECURITIES FUND
| |
Period Ended
| | Net
Asset
Value,
beginning
of period
| | | Net
investment
income(1)
| | | Net gain
(loss) on
investments
(both
realized
and
unrealized)
| | | Total from
investment
operations
| | | Dividends
from net
investment
income
| | | Distributions
from net
realized
gains on
investments
| | | Total
Distri-
butions
| | | Net
Asset
Value,
end of
period
| | | Total
Return(2)
| | | Net
Assets,
end of
period
(000’s)
| | | Ratio of
expenses
to average
net assets(3)
| | | Ratio
of net
investment
income to
average
net assets(3)
| | | Portfolio
Turnover
| |
|
Class A
| |
| 03/31/17 | | $ | 9.59 | | | $ | 0.09 | | | $ | (0.37 | ) | | $ | (0.28 | ) | | $ | (0.16 | ) | | $ | — | | | $ | (0.16 | ) | | $ | 9.15 | | | | (2.93 | )% | | $ | 148,382 | | | | 0.99 | % | | | 0.91 | % | | | 95 | % |
| 03/31/18 | | | 9.15 | | | | 0.09 | | | | (0.13 | ) | | | (0.04 | ) | | | (0.16 | ) | | | — | | | | (0.16 | ) | | | 8.95 | | | | (0.46 | ) | | | 138,599 | | | | 0.99 | | | | 1.03 | | | | 29 | |
| 03/31/19 | | | 8.95 | | | | 0.13 | | | | 0.11 | | | | 0.24 | | | | (0.15 | ) | | | — | | | | (0.15 | ) | | | 9.04 | | | | 2.71 | | | | 126,119 | | | | 0.99 | | | | 1.49 | | | | 18 | |
| 03/31/20 | | | 9.04 | | | | 0.12 | | | | 0.82 | | | | 0.94 | | | | (0.16 | ) | | | — | | | | (0.16 | ) | | | 9.82 | | | | 10.45 | | | | 126,770 | | | | 0.99 | | | | 1.34 | | | | 40 | |
| 03/31/21 | | | 9.82 | | | | 0.07 | | | | (0.52 | ) | | | (0.45 | ) | | | (0.15 | ) | | | — | | | | (0.15 | ) | | | 9.22 | | | | (4.66 | ) | | | 108,748 | | | | 0.99 | | | | 0.74 | | | | 15 | |
|
Class C
| |
| 03/31/17 | | $ | 9.59 | | | $ | 0.02 | | | $ | (0.37 | ) | | $ | (0.35 | ) | | $ | (0.10 | ) | | $ | — | | | $ | (0.10 | ) | | $ | 9.14 | | | | (3.66 | )% | | $ | 19,592 | | | | 1.64 | % | | | 0.26 | % | | | 95 | % |
| 03/31/18 | | | 9.14 | | | | 0.04 | | | | (0.13 | ) | | | (0.09 | ) | | | (0.10 | ) | | | — | | | | (0.10 | ) | | | 8.95 | | | | (1.00 | ) | | | 7,637 | | | | 1.64 | | | | 0.38 | | | | 29 | |
| 03/31/19 | | | 8.95 | | | | 0.08 | | | | 0.10 | | | | 0.18 | | | | (0.09 | ) | | | — | | | | (0.09 | ) | | | 9.04 | | | | 2.05 | | | | 7,507 | | | | 1.64 | | | | 0.84 | | | | 18 | |
| 03/31/20 | | | 9.04 | | | | 0.06 | | | | 0.81 | | | | 0.87 | | | | (0.10 | ) | | | — | | | | (0.10 | ) | | | 9.81 | | | | 9.64 | | | | 11,652 | | | | 1.64 | | | | 0.69 | | | | 40 | |
| 03/31/21 | | | 9.81 | | | | 0.01 | | | | (0.54 | ) | | | (0.53 | ) | | | (0.08 | ) | | | — | | | | (0.08 | ) | | | 9.20 | | | | (5.39 | ) | | | 7,416 | | | | 1.64 | | | | 0.09 | | | | 15 | |
| (1) | Calculated based upon average shares outstanding. |
| (2) | Total return does not reflect sales load, but does include expense reimbursements. |
| (3) | Net of the following expense reimbursements, if applicable (based on average net assets): |
| | | | | | | | | | | | | | | | | | | | |
| | | 03/31/17
| | | 03/31/18
| | | 03/31/19
| | | 03/31/20
| | | 03/31/21
| |
AIG U.S. Government Securities Fund Class A | | | 0.35 | % | | | 0.37 | % | | | 0.37 | % | | | 0.40 | % | | | 0.42 | % |
AIG U.S. Government Securities Fund Class C | | | 0.40 | | | | 0.46 | | | | 0.59 | | | | 0.67 | | | | 0.56 | |
See Notes to Financial Statements
SunAmerica Income Funds
FINANCIAL HIGHLIGHTS — (continued)
| | | | | | | | | | | | | | | | | | | | | | | | | | | | | | | | | | | | | | | | | | | | | | | | | | | | |
AIG STRATEGIC BOND FUND
| |
Period Ended
| | Net
Asset
Value,
beginning
of period
| | | Net
investment
income(1)
| | | Net gain
(loss) on
investments
(both
realized
and
unrealized)
| | | Total from
investment
operations
| | | Dividends
from net
investment
income
| | | Distributions
from net
realized
gains on
investments
| | | Total
Distri-
butions
| | | Net
Asset
Value,
end of
period
| | | Total
Return(2)
| | | Net
Assets,
end of
period
(000’s)
| | | Ratio of
expenses
to average
net assets
| | | Ratio
of net
investment
income to
average
net assets
| | | Portfolio
Turnover
| |
|
Class A
| |
| 03/31/17 | | $ | 3.27 | | | $ | 0.10 | | | $ | 0.14 | | | $ | 0.24 | | | $ | (0.11 | ) | | $ | — | | | $ | (0.11 | ) | | $ | 3.40 | | | | 7.38 | % | | $ | 163,163 | | | | 1.32 | % | | | 3.00 | % | | | 109 | % |
| 03/31/18 | | | 3.40 | | | | 0.11 | | | | (0.03 | ) | | | 0.08 | | | | (0.10 | ) | | | — | | | | (0.10 | ) | | | 3.38 | | | | 2.41 | | | | 196,712 | | | | 1.33 | | | | 3.15 | | | | 149 | |
| 03/31/19 | | | 3.38 | | | | 0.13 | | | | (0.04 | ) | | | 0.09 | | | | (0.16 | ) | | | — | | | | (0.16 | ) | | | 3.31 | | | | 2.86 | | | | 153,979 | | | | 1.14 | (3) | | | 3.89 | (3) | | | 123 | |
| 03/31/20 | | | 3.31 | | | | 0.11 | | | | (0.15 | ) | | | (0.04 | ) | | | (0.12 | ) | | | — | | | | (0.12 | ) | | | 3.15 | | | | (1.37 | ) | | | 143,815 | | | | 1.10 | (3) | | | 3.14 | (3) | | | 85 | |
| 03/31/21 | | | 3.15 | | | | 0.10 | | | | 0.33 | | | | 0.43 | | | | (0.11 | ) | | | — | | | | (0.11 | ) | | | 3.47 | | | | 13.87 | | | | 173,600 | | | | 1.10 | (3) | | | 2.91 | (3) | | | 111 | |
|
Class B
| |
| 03/31/17 | | $ | 3.27 | | | $ | 0.08 | | | $ | 0.14 | | | $ | 0.22 | | | $ | (0.09 | ) | | $ | — | | | $ | (0.09 | ) | | $ | 3.40 | | | | 6.66 | % | | $ | 29,762 | | | | 1.99 | % | | | 2.33 | % | | | 109 | % |
| 03/31/18 | | | 3.40 | | | | 0.09 | | | | (0.04 | ) | | | 0.05 | | | | (0.08 | ) | | | — | | | | (0.08 | ) | | | 3.37 | | | | 1.41 | | | | 21,875 | | | | 2.02 | | | | 2.46 | | | | 149 | |
| 03/31/19 | | | 3.37 | | | | 0.11 | | | | (0.03 | ) | | | 0.08 | | | | (0.14 | ) | | | — | | | | (0.14 | ) | | | 3.31 | | | | 2.43 | | | | 16,015 | | | | 1.86 | (3) | | | 3.17 | (3) | | | 123 | |
| 03/31/20 | | | 3.31 | | | | 0.08 | | | | (0.15 | ) | | | (0.07 | ) | | | (0.09 | ) | | | — | | | | (0.09 | ) | | | 3.15 | | | | (2.12 | ) | | | 13,423 | | | | 1.84 | (3) | | | 2.42 | (3) | | | 85 | |
| 03/31/21 | | | 3.15 | | | | 0.07 | | | | 0.33 | | | | 0.40 | | | | (0.09 | ) | | | — | | | | (0.09 | ) | | | 3.46 | | | | 12.74 | | | | 14,060 | | | | 1.84 | (3) | | | 2.18 | (3) | | | 111 | |
|
Class C
| |
| 03/31/17 | | $ | 3.29 | | | $ | 0.08 | | | $ | 0.13 | | | $ | 0.21 | | | $ | (0.09 | ) | | $ | — | | | $ | (0.09 | ) | | $ | 3.41 | | | | 6.35 | % | | $ | 128,332 | | | | 1.97 | % | | | 2.35 | % | | | 109 | % |
| 03/31/18 | | | 3.41 | | | | 0.09 | | | | (0.03 | ) | | | 0.06 | | | | (0.08 | ) | | | — | | | | (0.08 | ) | | | 3.39 | | | | 1.75 | | | | 71,103 | | | | 1.98 | | | | 2.50 | | | | 149 | |
| 03/31/19 | | | 3.39 | | | | 0.11 | | | | (0.04 | ) | | | 0.07 | | | | (0.14 | ) | | | — | | | | (0.14 | ) | | | 3.32 | | | | 2.18 | | | | 52,782 | | | | 1.81 | (3) | | | 3.22 | (3) | | | 123 | |
| 03/31/20 | | | 3.32 | | | | 0.08 | | | | (0.14 | ) | | | (0.06 | ) | | | (0.10 | ) | | | — | | | | (0.10 | ) | | | 3.16 | | | | (2.04 | ) | | | 49,730 | | | | 1.78 | (3) | | | 2.47 | (3) | | | 85 | |
| 03/31/21 | | | 3.16 | | | | 0.08 | | | | 0.33 | | | | 0.41 | | | | (0.09 | ) | | | — | | | | (0.09 | ) | | | 3.48 | | | | 13.11 | | | | 39,402 | | | | 1.78 | (3) | | | 2.26 | (3) | | | 111 | |
|
Class W
| |
| 03/31/17 | | $ | 3.27 | | | $ | 0.11 | | | $ | 0.13 | | | $ | 0.24 | | | $ | (0.12 | ) | | $ | — | | | $ | (0.12 | ) | | $ | 3.39 | | | | 7.26 | % | | $ | 40,412 | | | | 1.14 | % | | | 3.20 | % | | | 109 | % |
| 03/31/18 | | | 3.39 | | | | 0.11 | | | | (0.02 | ) | | | 0.09 | | | | (0.11 | ) | | | — | | | | (0.11 | ) | | | 3.37 | | | | 2.65 | | | | 70,239 | | | | 1.14 | | | | 3.34 | | | | 149 | |
| 03/31/19 | | | 3.37 | | | | 0.14 | | | | (0.03 | ) | | | 0.11 | | | | (0.17 | ) | | | — | | | | (0.17 | ) | | | 3.31 | | | | 3.38 | | | | 52,676 | | | | 0.94 | (3) | | | 4.06 | (3) | | | 123 | |
| 03/31/20 | | | 3.31 | | | | 0.11 | | | | (0.14 | ) | | | (0.03 | ) | | | (0.13 | ) | | | — | | | | (0.13 | ) | | | 3.15 | | | | (1.16 | ) | | | 89,806 | | | | 0.91 | (3) | | | 3.28 | (3) | | | 85 | |
| 03/31/21 | | | 3.15 | | | | 0.10 | | | | 0.33 | | | | 0.43 | | | | (0.12 | ) | | | — | | | | (0.12 | ) | | | 3.46 | | | | 13.77 | | | | 140,047 | | | | 0.90 | (3) | | | 3.08 | (3) | | | 111 | |
| (1) | Calculated based upon average shares outstanding. |
| (2) | Total return does not reflect sales load, but does include expense reimbursements. |
| (3) | Net of the following expense reimbursements and waivers, if applicable (based on average net assets): |
| | | | | | | | | | | | | | | | | | | | |
| | | 03/31/17
| | | 03/31/18
| | | 03/31/19
| | | 03/31/20
| | | 03/31/21
| |
AIG Strategic Bond Fund Class A | | | — | % | | | — | % | | | 0.23 | % | | | 0.27 | % | | | 0.27 | % |
AIG Strategic Bond Fund Class B | | | — | | | | — | | | | 0.23 | | | | 0.27 | | | | 0.27 | |
AIG Strategic Bond Fund Class C | | | — | | | | — | | | | 0.23 | | | | 0.27 | | | | 0.27 | |
AIG Strategic Bond Fund Class W | | | — | | | | — | | | | 0.23 | | | | 0.27 | | | | 0.27 | |
See Notes to Financial Statements
SunAmerica Income Funds
FINANCIAL HIGHLIGHTS — (continued)
| | | | | | | | | | | | | | | | | | | | | | | | | | | | | | | | | | | | | | | | | | | | | | | | | | | | |
AIG FLEXIBLE CREDIT FUND
| |
Period Ended
| | Net
Asset
Value,
beginning
of period
| | | Net
investment
income(1)
| | | Net gain
(loss) on
investments
(both
realized
and
unrealized)
| | | Total from
investment
operations
| | | Dividends
from net
investment
income
| | | Distributions
from net
realized
gains on
investment
| | | Total
Distri-
butions
| | | Net
Asset
Value,
end of
period
| | | Total
Return(2)
| | | Net
Assets,
end of
period
(000’s)
| | | Ratio of
expenses
to average
net assets
| | | Ratio
of net
investment
income to
average
net assets
| | | Portfolio
Turnover
| |
|
Class A
| |
| 03/31/17 | | $ | 3.29 | | | $ | 0.14 | | | $ | 0.16 | | | $ | 0.30 | | | $ | (0.15 | ) | | $ | — | | | $ | (0.15 | ) | | $ | 3.44 | | | | 9.11 | % | | $ | 144,880 | | | | 1.43 | % | | | 4.21 | % | | | 69 | % |
| 03/31/18 | | | 3.44 | | | | 0.16 | | | | (0.04 | ) | | | 0.12 | | | | (0.16 | ) | | | — | | | | (0.16 | ) | | | 3.40 | | | | 3.54 | | | | 133,268 | | | | 1.33 | (3) | | | 4.60 | (3) | | | 63 | |
| 03/31/19 | | | 3.40 | | | | 0.18 | | | | (0.09 | ) | | | 0.09 | | | | (0.18 | ) | | | — | | | | (0.18 | ) | | | 3.31 | | | | 2.75 | | | | 119,903 | | | | 1.06 | (3) | | | 5.29 | (3) | | | 57 | |
| 03/31/20 | | | 3.31 | | | | 0.17 | | | | (0.49 | ) | | | (0.32 | ) | | | (0.17 | ) | | | — | | | | (0.17 | ) | | | 2.82 | | | | (10.16 | ) | | | 75,556 | | | | 1.04 | (3) | | | 5.12 | (3) | | | 67 | |
| 03/31/21 | | | 2.82 | | | | 0.14 | | | | 0.56 | | | | 0.70 | | | | (0.15 | ) | | | — | | | | (0.15 | ) | | | 3.37 | | | | 25.13 | | | | 89,352 | | | | 1.09 | (3) | | | 4.33 | (3) | | | 72 | |
|
Class C
| |
| 03/31/17 | | $ | 3.31 | | | $ | 0.12 | | | $ | 0.15 | | | $ | 0.27 | | | $ | (0.12 | ) | | $ | — | | | $ | (0.12 | ) | | $ | 3.46 | | | | 8.38 | % | | $ | 74,241 | | | | 2.07 | % | | | 3.57 | % | | | 69 | % |
| 03/31/18 | | | 3.46 | | | | 0.14 | | | | (0.04 | ) | | | 0.10 | | | | (0.14 | ) | | | — | | | | (0.14 | ) | | | 3.42 | | | | 2.88 | | | | 58,994 | | | | 1.99 | (3) | | | 3.94 | (3) | | | 63 | |
| 03/31/19 | | | 3.42 | | | | 0.16 | | | | (0.09 | ) | | | 0.07 | | | | (0.16 | ) | | | — | | | | (0.16 | ) | | | 3.33 | | | | 2.09 | | | | 55,505 | | | | 1.72 | (3) | | | 4.63 | (3) | | | 57 | |
| 03/31/20 | | | 3.33 | | | | 0.15 | | | | (0.50 | ) | | | (0.35 | ) | | | (0.15 | ) | | | — | | | | (0.15 | ) | | | 2.83 | | | | (11.02 | ) | | | 46,393 | | | | 1.71 | (3) | | | 4.43 | (3) | | | 67 | |
| 03/31/21 | | | 2.83 | | | | 0.12 | | | | 0.57 | | | | 0.69 | | | | (0.13 | ) | | | — | | | | (0.13 | ) | | | 3.39 | | | | 24.61 | | | | 36,523 | | | | 1.75 | (3) | | | 3.70 | (3) | | | 72 | |
|
Class W
| |
| 03/31/17 | | $ | 3.29 | | | $ | 0.15 | | | $ | 0.15 | | | $ | 0.30 | | | $ | (0.15 | ) | | $ | — | | | $ | (0.15 | ) | | $ | 3.44 | | | | 9.34 | % | | $ | 157,377 | | | | 1.21 | % | | | 4.44 | % | | | 69 | % |
| 03/31/18 | | | 3.44 | | | | 0.17 | | | | (0.04 | ) | | | 0.13 | | | | (0.17 | ) | | | — | | | | (0.17 | ) | | | 3.40 | | | | 3.76 | | | | 131,163 | | | | 1.12 | (3) | | | 4.79 | (3) | | | 63 | |
| 03/31/19 | | | 3.40 | | | | 0.18 | | | | (0.07 | ) | | | 0.11 | | | | (0.19 | ) | | | — | | | | (0.19 | ) | | | 3.32 | | | | 3.26 | | | | 136,382 | | | | 0.85 | (3) | | | 5.50 | (3) | | | 57 | |
| 03/31/20 | | | 3.32 | | | | 0.17 | | | | (0.49 | ) | | | (0.32 | ) | | | (0.18 | ) | | | — | | | | (0.18 | ) | | | 2.82 | | | | (10.28 | ) | | | 132,805 | | | | 0.83 | (3) | | | 5.28 | (3) | | | 67 | |
| 03/31/21 | | | 2.82 | | | | 0.15 | | | | 0.57 | | | | 0.72 | | | | (0.16 | ) | | | — | | | | (0.16 | ) | | | 3.38 | | | | 25.79 | | | | 103,513 | | | | 0.87 | (3) | | | 4.58 | (3) | | | 72 | |
| (1) | Calculated based upon average shares outstanding. |
| (2) | Total return does not reflect sales load, but does include expense reimbursements. |
| (3) | Net of the following expense reimbursements and waivers, if applicable (based on average net assets): |
| | | | | | | | | | | | | | | | | | | | |
| | | 03/31/17
| | | 03/31/18
| | | 03/31/19
| | | 03/31/20
| | | 03/31/21
| |
AIG Flexible Credit Fund Class A | | | — | % | | | 0.11 | % | | | 0.39 | % | | | 0.40 | % | | | 0.40 | % |
AIG Flexible Credit Fund Class C | | | — | | | | 0.11 | | | | 0.39 | | | | 0.40 | | | | 0.40 | |
AIG Flexible Credit Fund Class W | | | — | | | | 0.11 | | | | 0.39 | | | | 0.40 | | | | 0.40 | |
See Notes to Financial Statements
AIG U.S. Government Securities Fund
PORTFOLIO PROFILE — March 31, 2021 — (unaudited)
Industry Allocation*
| | | | |
United States Treasury Notes | | | 57.3 | % |
United States Treasury Bonds | | | 22.4 | |
Government National Mtg. Assoc. | | | 14.3 | |
Federal Home Loan Mtg. Corp. | | | 4.5 | |
Federal National Mtg. Assoc. | | | 1.4 | |
Repurchase Agreements | | | 0.1 | |
| | |
|
|
|
| | | | 100.0 | % |
| | |
|
|
|
Credit Quality†#
| | | | |
Aaa | | | 99.3 | % |
Not Rated@ | | | 0.7 | |
| | |
|
|
|
| | | | 100.0 | % |
| | |
|
|
|
| * | | Calculated as a percentage of net assets |
| # | | Calculated as a percentage of total debt issues, excluding short-term securities. |
| @ | | Represents debt issues that either have no rating, or the rating is unavailable from the data source. |
AIG U.S. Government Securities Fund
PORTFOLIO OF INVESTMENTS — March 31, 2021
| | | | | | | | |
| Security Description | | Principal
Amount | | | Value
(Note 2) | |
| |
U.S. GOVERNMENT AGENCIES — 20.2% | |
Federal Home Loan Mtg. Corp. — 4.5% | |
3.50% due 08/01/2030 | | $ | 1,327,436 | | | $ | 1,432,311 | |
3.50% due 12/01/2044 | | | 2,035,071 | | | | 2,198,700 | |
4.00% due 04/01/2034 | | | 705,253 | | | | 763,588 | |
Federal Home Loan Mtg. Corp. REMIC
Series 3747, Class WA
3.50% due 10/15/2030(1) | | | 783,304 | | | | 847,063 | |
| | | | | | |
|
|
|
| | | | | | | | 5,241,662 | |
| | | | | | |
|
|
|
Federal National Mtg. Assoc. — 1.4% | |
2.50% due 11/01/2027 | | | 1,498,010 | | | | 1,566,766 | |
| | | | | | |
|
|
|
Government National Mtg. Assoc. — 14.3% | |
3.50% due 03/15/2042 | | | 152,947 | | | | 164,728 | |
3.50% due 06/15/2042 | | | 748,450 | | | | 805,998 | |
3.50% due 07/15/2042 | | | 134,973 | | | | 144,303 | |
3.50% due 02/20/2045 | | | 371,230 | | | | 400,675 | |
4.00% due 03/15/2039 | | | 84,045 | | | | 92,288 | |
4.00% due 06/15/2039 | | | 217,382 | | | | 238,618 | |
4.00% due 12/15/2039 | | | 125,183 | | | | 137,278 | |
4.00% due 08/15/2040 | | | 62,642 | | | | 68,420 | |
4.00% due 11/15/2040 | | | 189,448 | | | | 209,779 | |
4.00% due 09/15/2041 | | | 501,811 | | | | 555,255 | |
4.00% due 10/15/2041 | | | 22,916 | | | | 24,532 | |
4.00% due 11/15/2041 | | | 103,264 | | | | 110,684 | |
4.00% due 12/15/2041 | | | 180,005 | | | | 194,136 | |
4.00% due 01/15/2042 | | | 865,911 | | | | 956,930 | |
4.00% due 02/15/2042 | | | 200,075 | | | | 221,315 | |
4.00% due 03/15/2042 | | | 68,514 | | | | 75,000 | |
4.50% due 09/15/2033 | | | 132,851 | | | | 148,474 | |
4.50% due 04/15/2039 | | | 32,907 | | | | 37,151 | |
4.50% due 05/15/2039 | | | 51,423 | | | | 58,055 | |
4.50% due 06/15/2039 | | | 557,002 | | | | 627,950 | |
4.50% due 07/15/2039 | | | 155,441 | | | | 174,461 | |
4.50% due 09/15/2039 | | | 82,586 | | | | 93,266 | |
4.50% due 11/15/2039 | | | 72,702 | | | | 82,041 | |
4.50% due 12/15/2039 | | | 141,797 | | | | 160,086 | |
4.50% due 02/15/2040 | | | 358,603 | | | | 404,319 | |
4.50% due 03/15/2040 | | | 132,461 | | | | 149,086 | |
4.50% due 04/15/2040 | | | 68,311 | | | | 77,153 | |
4.50% due 07/15/2040 | | | 130,047 | | | | 146,409 | |
4.50% due 03/15/2041 | | | 588,438 | | | | 664,339 | |
4.50% due 04/15/2041 | | | 108,630 | | | | 120,552 | |
4.50% due 06/15/2041 | | | 110,926 | | | | 123,249 | |
4.50% due 08/15/2041 | | | 128,495 | | | | 142,777 | |
4.50% due 04/20/2044 | | | 326,271 | | | | 365,839 | |
5.00% due 08/15/2033 | | | 154,221 | | | | 177,244 | |
5.00% due 10/15/2033 | | | 267,264 | | | | 305,970 | |
5.00% due 05/15/2035 | | | 68,941 | | | | 77,759 | |
5.00% due 08/15/2035 | | | 171,924 | | | | 198,852 | |
5.00% due 05/15/2036 | | | 49,887 | | | | 58,118 | |
5.00% due 09/15/2036 | | | 68,201 | | | | 79,443 | |
5.00% due 01/15/2037 | | | 119,321 | | | | 138,564 | |
5.00% due 03/15/2037 | | | 25,039 | | | | 28,728 | |
5.00% due 04/15/2037 | | | 76,096 | | | | 85,786 | |
5.00% due 04/15/2038 | | | 176,076 | | | | 204,748 | |
5.00% due 05/15/2038 | | | 91,007 | | | | 105,604 | |
5.00% due 08/15/2038 | | | 312,000 | | | | 363,443 | |
5.00% due 02/15/2039 | | | 42,688 | | | | 49,537 | |
5.00% due 03/15/2039 | | | 30,333 | | | | 34,204 | |
| |
| | | | | | | | | |
Government National Mtg. Assoc. (continued) | |
5.00% due 04/15/2039 | | $ | 56,535 | | | $ | 65,813 | |
5.00% due 07/20/2039 | | | 450,628 | | | | 509,534 | |
5.00% due 08/15/2039 | | | 160,587 | | | | 187,112 | |
5.00% due 09/20/2039 | | | 1,432,352 | | | | 1,646,405 | |
5.00% due 10/15/2039 | | | 268,310 | | | | 310,789 | |
5.00% due 11/15/2039 | | | 227,834 | | | | 265,365 | |
5.00% due 12/15/2039 | | | 203,477 | | | | 236,900 | |
5.00% due 04/15/2040 | | | 241,619 | | | | 281,285 | |
5.00% due 05/15/2040 | | | 330,183 | | | | 382,144 | |
5.00% due 07/20/2045 | | | 172,794 | | | | 198,629 | |
5.50% due 06/15/2033 | | | 263,897 | | | | 305,319 | |
5.50% due 07/15/2033 | | | 50,704 | | | | 58,709 | |
5.50% due 10/15/2033 | | | 81,797 | | | | 94,777 | |
5.50% due 01/15/2034 | | | 305,758 | | | | 349,897 | |
5.50% due 02/15/2034 | | | 173,152 | | | | 194,676 | |
5.50% due 04/20/2035 | | | 236,974 | | | | 270,925 | |
5.50% due 09/15/2035 | | | 224,749 | | | | 263,860 | |
5.50% due 10/15/2035 | | | 99,908 | | | | 117,495 | |
5.50% due 02/15/2038 | | | 55,968 | | | | 65,346 | |
5.50% due 04/15/2038 | | | 33,284 | | | | 38,974 | |
5.50% due 09/15/2039 | | | 22,243 | | | | 25,878 | |
5.50% due 03/15/2040 | | | 146 | | | | 171 | |
6.00% due 04/15/2028 | | | 64,099 | | | | 73,509 | |
6.00% due 08/15/2033 | | | 123,036 | | | | 147,568 | |
6.00% due 12/15/2033 | | | 54,063 | | | | 61,818 | |
6.00% due 09/20/2038 | | | 485,953 | | | | 557,500 | |
6.50% due 10/15/2031 | | | 13,652 | | | | 15,245 | |
| | | | | | |
|
|
|
| | | | | | | | 16,608,789 | |
| | | | | | |
|
|
|
Total U.S. Government Agencies | | | | | | | | |
(cost $22,140,455) | | | | | | | 23,417,217 | |
| | | | | | |
|
|
|
U.S. GOVERNMENT TREASURIES — 79.7% | |
United States Treasury Bonds — 22.4% | |
2.00% due 02/15/2050 | | | 1,400,000 | | | | 1,276,406 | |
2.25% due 08/15/2049 | | | 700,000 | | | | 674,762 | |
2.50% due 02/15/2045 | | | 1,000,000 | | | | 1,018,398 | |
2.75% due 08/15/2042 | | | 1,100,000 | | | | 1,177,516 | |
2.75% due 11/15/2042 | | | 2,000,000 | | | | 2,138,906 | |
3.00% due 05/15/2042 | | | 2,000,000 | | | | 2,228,516 | |
3.00% due 02/15/2049 | | | 1,000,000 | | | | 1,120,274 | |
3.13% due 11/15/2041 | | | 1,500,000 | | | | 1,704,492 | |
3.13% due 02/15/2042 | | | 1,100,000 | | | | 1,250,863 | |
3.38% due 11/15/2048 | | | 1,000,000 | | | | 1,197,461 | |
3.50% due 02/15/2039 | | | 2,000,000 | | | | 2,393,203 | |
4.25% due 11/15/2040 | | | 3,300,000 | | | | 4,357,160 | |
4.50% due 02/15/2036 | | | 1,500,000 | | | | 1,981,875 | |
4.75% due 02/15/2041 | | | 2,500,000 | | | | 3,512,402 | |
| | | | | | |
|
|
|
| | | | | | | | 26,032,234 | |
| | | | | | |
|
|
|
United States Treasury Notes — 57.3% | |
0.13% due 04/30/2022 | | | 1,000,000 | | | | 1,000,352 | |
0.13% due 05/31/2022 | | | 1,000,000 | | | | 1,000,234 | |
0.13% due 06/30/2022 | | | 1,000,000 | | | | 1,000,156 | |
0.13% due 05/15/2023 | | | 1,000,000 | | | | 998,633 | |
0.13% due 07/15/2023 | | | 650,000 | | | | 648,654 | |
0.13% due 08/15/2023 | | | 650,000 | | | | 648,400 | |
0.25% due 04/15/2023 | | | 1,000,000 | | | | 1,001,406 | |
0.25% due 06/15/2023 | | | 600,000 | | | | 600,633 | |
AIG U.S. Government Securities Fund
PORTFOLIO OF INVESTMENTS — March 31, 2021 — (continued)
| | | | | | | | |
| Security Description | | Principal
Amount | | | Value
(Note 2) | |
| |
U.S. GOVERNMENT TREASURIES (continued) | |
United States Treasury Notes (continued) | |
0.25% due 05/31/2025 | | $ | 300,000 | | | $ | 294,234 | |
0.38% due 03/31/2022 | | | 800,000 | | | | 802,313 | |
0.50% due 03/15/2023 | | | 1,000,000 | | | | 1,006,445 | |
0.50% due 03/31/2025 | | | 800,000 | | | | 794,563 | |
0.50% due 04/30/2027 | | | 400,000 | | | | 382,875 | |
0.50% due 05/31/2027 | | | 1,000,000 | | | | 955,234 | |
0.63% due 05/15/2030 | | | 1,000,000 | | | | 909,336 | |
0.63% due 08/15/2030 | | | 1,000,000 | | | | 905,469 | |
1.25% due 07/31/2023 | | | 1,000,000 | | | | 1,023,984 | |
1.25% due 08/31/2024 | | | 500,000 | | | | 512,871 | |
1.38% due 02/15/2023 | | | 750,000 | | | | 767,051 | |
1.50% due 08/15/2022 | | | 1,000,000 | | | | 1,018,984 | |
1.50% due 09/15/2022 | | | 500,000 | | | | 509,941 | |
1.50% due 01/15/2023 | | | 800,000 | | | | 819,188 | |
1.50% due 02/28/2023 | | | 2,000,000 | | | | 2,050,859 | |
1.50% due 03/31/2023 | | | 750,000 | | | | 769,863 | |
1.50% due 09/30/2024 | | | 800,000 | | | | 827,313 | |
1.50% due 08/15/2026 | | | 2,000,000 | | | | 2,047,422 | |
1.50% due 02/15/2030 | | | 400,000 | | | | 394,813 | |
1.63% due 08/15/2022 | | | 1,000,000 | | | | 1,020,430 | |
1.63% due 11/15/2022 | | | 1,000,000 | | | | 1,023,984 | |
1.63% due 05/15/2026 | | | 1,000,000 | | | | 1,032,344 | |
1.63% due 08/15/2029 | | | 500,000 | | | | 501,426 | |
1.75% due 05/15/2022 | | | 1,875,000 | | | | 1,909,351 | |
1.75% due 05/15/2023 | | | 1,000,000 | | | | 1,032,852 | |
1.75% due 11/15/2029 | | | 1,000,000 | | | | 1,011,094 | |
1.88% due 03/31/2022 | | | 2,500,000 | | | | 2,544,238 | |
2.00% due 11/30/2022 | | | 1,000,000 | | | | 1,030,781 | |
2.00% due 02/15/2023 | | | 1,000,000 | | | | 1,034,141 | |
2.00% due 05/31/2024 | | | 1,000,000 | | | | 1,049,922 | |
2.00% due 02/15/2025 | | | 5,000,000 | | | | 5,264,062 | |
2.00% due 08/15/2025 | | | 3,000,000 | | | | 3,159,727 | |
2.00% due 11/15/2026 | | | 2,700,000 | | | | 2,831,625 | |
2.13% due 12/31/2022 | | | 1,000,000 | | | | 1,034,297 | |
2.13% due 03/31/2024 | | | 2,000,000 | | | | 2,104,844 | |
2.25% due 11/15/2024 | | | 1,000,000 | | | | 1,060,859 | |
| Security Description | | Principal
Amount | | | Value
(Note 2) | |
| |
| | | | | | | | | |
United States Treasury Notes (continued) | |
2.25% due 11/15/2025 | | $ | 1,000,000 | | | $ | 1,064,414 | |
2.25% due 08/15/2027 | | | 900,000 | | | | 953,367 | |
2.25% due 11/15/2027 | | | 2,000,000 | | | | 2,115,781 | |
2.38% due 08/15/2024 | | | 1,000,000 | | | | 1,063,984 | |
2.50% due 08/15/2023 | | | 1,000,000 | | | | 1,054,063 | |
2.50% due 05/15/2024 | | | 1,000,000 | | | | 1,065,547 | |
2.63% due 02/28/2023 | | | 3,000,000 | | | | 3,140,625 | |
2.75% due 11/15/2023 | | | 2,500,000 | | | | 2,662,109 | |
2.75% due 02/15/2024 | | | 1,000,000 | | | | 1,069,297 | |
| | | | | | |
|
|
|
| | | | | | | | 66,526,390 | |
| | | | | | |
|
|
|
Total U.S. Government Treasuries | | | | | | | | |
(cost $88,967,440) | | | | | | | 92,558,624 | |
| | | | | | |
|
|
|
Total Long-Term Investment Securities | | | | | | | | |
(cost $111,107,895) | | | | | | | 115,975,841 | |
| | | | | | |
|
|
|
REPURCHASE AGREEMENTS — 0.1% | |
Agreement with Fixed Income Clearing Corp., bearing interest at 0.00% dated 03/31/2021, to be repurchased 04/01/2021 in the amount of $134,000 and collateralized by $137,300 of United States Treasury Notes, bearing interest at 0.13% due 01/15/2024 and having an approximate value of $136,692
(cost $134,000) | | | 134,000 | | | | 134,000 | |
| | | | | | |
|
|
|
TOTAL INVESTMENTS | | | | | | | | |
(cost $111,241,895)(2) | | | 100.0 | % | | | 116,109,841 | |
Other assets less liabilities | | | 0.0 | | | | 54,491 | |
| | |
|
|
| |
|
|
|
NET ASSETS | | | 100.0 | % | | $ | 116,164,332 | |
| | |
|
|
| |
|
|
|
| (1) | Collateralized Mortgage Obligation |
| (2) | See Note 5 for cost of investments on a tax basis. |
| REMIC — | Real Estate Mortgage Investment Conduit |
The following is a summary of the inputs used to value the Fund’s net assets as of March 31, 2021 (see Note 2):
| | | | | | | | | | | | | | | | |
| | | Level 1 — Unadjusted
Quoted Prices
| | | Level 2 — Other
Observable Inputs
| | | Level 3 — Significant
Unobservable Inputs
| | | Total
| |
ASSETS: | | | | | | | | | | | | | | | | |
Investments at Value:* | | | | | | | | | | | | | | | | |
| | | | |
U.S. Government Agencies | | $ | — | | | $ | 23,417,217 | | | $ | — | | | $ | 23,417,217 | |
U.S. Government Treasuries | | | — | | | | 92,558,624 | | | | — | | | | 92,558,624 | |
Repurchase Agreements | | | — | | | | 134,000 | | | | — | | | | 134,000 | |
| | |
|
|
| |
|
|
| |
|
|
| |
|
|
|
Total Investments at Value | | $ | — | | | $ | 116,109,841 | | | $ | — | | | $ | 116,109,841 | |
| | |
|
|
| |
|
|
| |
|
|
| |
|
|
|
| * | For a detailed presentation of investments, please refer to the Portfolio of Investments. |
See Notes to Financial Statements
AIG Strategic Bond Fund
PORTFOLIO PROFILE — March 31, 2021 — (unaudited)
Industry Allocation*
| | | | |
Sovereign | | | 17.8 | % |
Federal National Mtg. Assoc. | | | 6.6 | |
Registered Investment Companies | | | 6.1 | |
Federal Home Loan Mtg. Corp. | | | 4.0 | |
Pipelines | | | 3.1 | |
Diversified Banking Institutions | | | 2.7 | |
Oil Companies-Exploration & Production | | | 2.6 | |
Real Estate Investment Trusts | | | 2.5 | |
Uniform Mtg. Backed Securities | | | 2.4 | |
Oil Companies-Integrated | | | 2.0 | |
Government National Mtg. Assoc. | | | 1.9 | |
Banks-Commercial | | | 1.8 | |
Cable/Satellite TV | | | 1.5 | |
Medical-Hospitals | | | 1.5 | |
Diversified Financial Services | | | 1.4 | |
Telephone-Integrated | | | 1.4 | |
Electric-Integrated | | | 1.3 | |
Auto-Cars/Light Trucks | | | 1.2 | |
Cruise Lines | | | 1.1 | |
United States Treasury Notes | | | 1.1 | |
Airlines | | | 1.0 | |
Electric-Generation | | | 0.8 | |
Satellite Telecom | | | 0.8 | |
Finance-Consumer Loans | | | 0.8 | |
Steel-Producers | | | 0.8 | |
Independent Power Producers | | | 0.7 | |
Food-Misc./Diversified | | | 0.7 | |
Paper & Related Products | | | 0.7 | |
Containers-Paper/Plastic | | | 0.7 | |
Medical-Drugs | | | 0.6 | |
Finance-Mortgage Loan/Banker | | | 0.6 | |
Casino Hotels | | | 0.6 | |
Human Resources | | | 0.6 | |
Enterprise Software/Service | | | 0.6 | |
Metal-Copper | | | 0.6 | |
Distribution/Wholesale | | | 0.6 | |
Oil-Field Services | | | 0.5 | |
Electric-Distribution | | | 0.5 | |
Hotels/Motels | | | 0.5 | |
Broadcast Services/Program | | | 0.5 | |
Cellular Telecom | | | 0.5 | |
Food-Wholesale/Distribution | | | 0.5 | |
Chemicals-Specialty | | | 0.5 | |
Aerospace/Defense-Equipment | | | 0.5 | |
E-Commerce/Services | | | 0.5 | |
Rental Auto/Equipment | | | 0.4 | |
Cosmetics & Toiletries | | | 0.4 | |
Retail-Restaurants | | | 0.4 | |
Security Services | | | 0.4 | |
Chemicals-Diversified | | | 0.4 | |
Retail-Petroleum Products | | | 0.4 | |
Commercial Services-Finance | | | 0.4 | |
Television | | | 0.4 | |
Containers-Metal/Glass | | | 0.4 | |
Computers-Integrated Systems | | | 0.4 | |
Investment Companies | | | 0.4 | |
Resorts/Theme Parks | | | 0.4 | |
Vitamins & Nutrition Products | | | 0.4 | |
Theaters | | | 0.4 | |
Real Estate Operations & Development | | | 0.3 | |
Insurance-Life/Health | | | 0.3 | |
| | | | |
Finance-Credit Card | | | 0.3 | % |
Protection/Safety | | | 0.3 | |
Auto-Heavy Duty Trucks | | | 0.3 | |
Computer Software | | | 0.3 | |
Building & Construction-Misc. | | | 0.3 | |
Diversified Minerals | | | 0.3 | |
Agricultural Chemicals | | | 0.3 | |
Federal Home Loan Bank | | | 0.3 | |
Transport-Air Freight | | | 0.3 | |
Food-Retail | | | 0.3 | |
Dialysis Centers | | | 0.3 | |
Direct Marketing | | | 0.3 | |
Investment Management/Advisor Services | | | 0.3 | |
Transport-Services | | | 0.3 | |
Applications Software | | | 0.3 | |
Real Estate Management/Services | | | 0.2 | |
Building Products-Doors & Windows | | | 0.2 | |
Poultry | | | 0.2 | |
Metal-Aluminum | | | 0.2 | |
Computers | | | 0.2 | |
Telecom Services | | | 0.2 | |
Finance-Auto Loans | | | 0.2 | |
Motion Pictures & Services | | | 0.2 | |
Transport-Equipment & Leasing | | | 0.2 | |
Energy-Alternate Sources | | | 0.2 | |
Multimedia | | | 0.2 | |
Coal | | | 0.2 | |
Auction Houses/Art Dealers | | | 0.2 | |
Food-Meat Products | | | 0.2 | |
Casino Services | | | 0.2 | |
Medical-Generic Drugs | | | 0.2 | |
Electronic Components-Semiconductors | | | 0.2 | |
Computer Services | | | 0.2 | |
Pharmacy Services | | | 0.2 | |
Insurance-Property/Casualty | | | 0.2 | |
Finance-Investment Banker/Broker | | | 0.2 | |
Non-Hazardous Waste Disposal | | | 0.2 | |
Metal-Iron | | | 0.2 | |
Recycling | | | 0.2 | |
Retail-Pawn Shops | | | 0.2 | |
Internet Content-Entertainment | | | 0.2 | |
SupraNational Banks | | | 0.2 | |
Oil Refining & Marketing | | | 0.2 | |
Building & Construction Products-Misc. | | | 0.2 | |
Building-Residential/Commercial | | | 0.2 | |
Finance-Leasing Companies | | | 0.2 | |
Machinery-Construction & Mining | | | 0.2 | |
Medical Labs & Testing Services | | | 0.2 | |
Auto/Truck Parts & Equipment-Original | | | 0.2 | |
Research & Development | | | 0.1 | |
Insurance-Multi-line | | | 0.1 | |
Savings & Loans/Thrifts | | | 0.1 | |
Banks-Super Regional | | | 0.1 | |
Banks-Special Purpose | | | 0.1 | |
Batteries/Battery Systems | | | 0.1 | |
Internet Telephone | | | 0.1 | |
Food-Dairy Products | | | 0.1 | |
Retail-Appliances | | | 0.1 | |
Regional Authority | | | 0.1 | |
Commercial Services | | | 0.1 | |
Electric-Transmission | | | 0.1 | |
AIG Strategic Bond Fund
PORTFOLIO PROFILE — March 31, 2021 — (unaudited) (continued)
Industry Allocation* (continued)
| | | | |
Warehousing & Harbor Transportation Services | | | 0.1 | % |
Financial Guarantee Insurance | | | 0.1 | |
Sovereign Agency | | | 0.1 | |
Consumer Products-Misc. | | | 0.1 | |
Insurance Brokers | | | 0.1 | |
Brewery | | | 0.1 | |
Retail-Automobile | | | 0.1 | |
Airport Development/Maintenance | | | 0.1 | |
Medical Products | | | 0.1 | |
Metal-Diversified | | | 0.1 | |
Industrial Gases | | | 0.1 | |
Machinery-Farming | | | 0.1 | |
Regional Agencies | | | 0.1 | |
Circuit Boards | | | 0.1 | |
Retail-Regional Department Stores | | | 0.1 | |
Petrochemicals | | | 0.1 | |
Electronic Parts Distribution | | | 0.1 | |
Oil Field Machinery & Equipment | | | 0.1 | |
Finance-Commercial | | | 0.1 | |
Insurance-Mutual | | | 0.1 | |
Medical Information Systems | | | 0.1 | |
Medical-Biomedical/Gene | | | 0.1 | |
Drug Delivery Systems | | | 0.1 | |
Insurance-Reinsurance | | | 0.1 | |
Auto Repair Centers | | | 0.1 | |
Trucking/Leasing | | | 0.1 | |
Chemicals-Other | | | 0.1 | |
Telecom Equipment-Fiber Optics | | | 0.1 | |
Aerospace/Defense | | | 0.1 | |
Gold Mining | | | 0.1 | |
Banks-Money Center | | | 0.1 | |
Semiconductor Components-Integrated Circuits | | | 0.1 | |
Electronic Measurement Instruments | | | 0.1 | |
Machinery-Electrical | | | 0.1 | |
Internet Financial Services | | | 0.1 | |
Quarrying | | | 0.1 | |
Computer Graphics | | | 0.1 | |
| | |
|
|
|
| | | | 102.1% | |
| | |
|
|
|
Credit Quality†#
| | | | |
Aaa | | | 17.4 | % |
Aa | | | 3.1 | |
A | | | 5.6 | |
Baa | | | 14.9 | |
Ba | | | 22.1 | |
B | | | 24.3 | |
Caa | | | 4.8 | |
Ca | | | 0.2 | |
Not Rated@ | | | 7.6 | |
| | |
|
|
|
| | | | 100.0 | % |
| | |
|
|
|
| * | | Calculated as a percentage of net assets |
| # | | Calculated as a percentage of total debt issues, excluding short-term securities. |
| @ | | Represents debt issues that either have no rating, or the rating is unavailable from the data source. |
AIG Strategic Bond Fund
PORTFOLIO OF INVESTMENTS — March 31, 2021
| | | | | | | | |
| Security Description | |
Principal
Amount(19) | | |
Value
(Note 2) | |
| |
ASSET BACKED SECURITIES — 1.0% | |
Diversified Financial Services — 1.0% | |
AmeriCredit Automobile Receivables Trust
Series 2019-1, Class A3
2.97% due 11/20/2023 | | $ | 132,800 | | | $ | 134,184 | |
BA Credit Card Trust
Series 2019-A1, Class A1
1.74% due 01/15/2025 | | | 200,000 | | | | 204,019 | |
BA Credit Card Trust
Series 2018-A2, Class A2
3.00% due 09/15/2023 | | | 209,000 | | | | 209,213 | |
BANK
Series 2019-BN16, Class A2
3.93% due 02/15/2052(1) | | | 239,000 | | | | 254,833 | |
Benchmark Mtg. Trust
Series 2019-B9, Class AAB
3.93% due 03/15/2052(1) | | | 300,000 | | | | 335,318 | |
BX Commercial Mtg. Trust FRS
Series 2019-IMC, Class A
1.11% (1 ML+1.00%)
due 04/15/2034*(1) | | | 400,000 | | | | 398,477 | |
Capital One Prime Auto Receivables Trust
Series 2019-2, Class A3
1.92% due 05/15/2024 | | | 100,000 | | | | 101,412 | |
CarMax Auto Owner Trust
Series 2019-2, Class A3
2.68% due 03/15/2024 | | | 62,136 | | | | 63,278 | |
CarMax Auto Owner Trust
Series 2018-4, Class A3
3.36% due 09/15/2023 | | | 138,249 | | | | 140,875 | |
Chase Mtg. Finance Corp. VRS
Series 2016-SH2, Class M2
3.75% due 12/25/2045*(2)(3) | | | 178,801 | | | | 185,321 | |
COMM Mtg. Trust VRS
Series 2016-787S, Class B
3.83% due 02/10/2036*(1)(2) | | | 132,000 | | | | 142,349 | |
GM Financial Consumer Automobile Receivables Trust
Series 2019-3, Class A3
2.18% due 04/16/2024 | | | 46,206 | | | | 46,802 | |
Honda Auto Receivables Owner Trust
Series 2020-3, Class A4
0.46% due 04/19/2027 | | | 160,000 | | | | 159,902 | |
Honda Auto Receivables Owner Trust
Series 2020-2, Class A4
1.09% due 10/15/2026 | | | 100,000 | | | | 101,331 | |
Honda Auto Receivables Owner Trust
Series 2019-1, Class A3
2.83% due 03/20/2023 | | | 51,737 | | | | 52,523 | |
JPMorgan Mtg. Trust VRS
Series 2017-6, Class A6
3.00% due 12/25/2048*(2)(3) | | | 42,701 | | | | 42,727 | |
JPMorgan Mtg. Trust VRS
Series 2018-1, Class A5
3.50% due 06/25/2048*(2)(3) | | | 28,600 | | | | 28,608 | |
Morgan Stanley Capital Barclays Bank Trust
Series 2016-MART, Class A
2.20% due 09/13/2031*(1) | | | 185,000 | | | | 185,111 | |
| | | | | | | | |
| Security Description | |
Principal
Amount(19) | | |
Value
(Note 2) | |
| |
| | | | | | | | | |
Diversified Financial Services (continued) | |
MTRO Commercial Mtg. Trust FRS
Series 2019-TECH, Class A
1.01% (1 ML+0.90%)
due 12/15/2033*(1) | | $ | 350,000 | | | $ | 350,334 | |
One Bryant Park Trust
Series 2019-OBP, Class A
2.52% due 09/15/2054*(1) | | | 390,000 | | | | 393,397 | |
Shellpoint Co-Originator Trust VRS
Series 2017-2, Class A1
3.50% due 10/25/2047*(2)(3) | | | 45,947 | | | | 46,696 | |
Toyota Auto Loan Extended Note Trust
Series 2019-1A, Class A
2.56% due 11/25/2031* | | | 100,000 | | | | 105,684 | |
Toyota Auto Receivables Owner Trust
Series 2018-C, Class A4
3.13% due 02/15/2024 | | | 125,000 | | | | 128,808 | |
| | | | | | |
|
|
|
Total Asset Backed Securities | | | | | | | | |
(cost $3,739,087) | | | | | | | 3,811,202 | |
| | | | | | |
|
|
|
U.S. CONVERTIBLE BONDS & NOTES — 0.1% | |
Oil Field Machinery & Equipment — 0.1% | |
Hi-Crush, Inc.
Senior Sec. Notes
8.00% due 04/09/2026(4)(5)(6)
(cost $235,657) | | | 260,000 | | | | 260,000 | |
| | | | | | |
|
|
|
U.S. CORPORATE BONDS & NOTES — 37.8% | |
Aerospace/Defense — 0.1% | |
BAE Systems Holdings, Inc.
Company Guar. Notes
3.85% due 12/15/2025* | | | 129,000 | | | | 141,947 | |
Teledyne Technologies, Inc.
Senior Notes
2.75% due 04/01/2031 | | | 73,000 | | | | 72,678 | |
| | | | | | |
|
|
|
| | | | | | | | 214,625 | |
| | | | | | |
|
|
|
Aerospace/Defense-Equipment — 0.4% | |
Moog, Inc.
Company Guar. Notes
4.25% due 12/15/2027* | | | 670,000 | | | | 683,400 | |
Spirit AeroSystems, Inc.
Sec. Notes
7.50% due 04/15/2025* | | | 607,000 | | | | 652,525 | |
| | | | | | |
|
|
|
| | | | | | | | 1,335,925 | |
| | | | | | |
|
|
|
Airlines — 0.7% | |
American Airlines, Inc.
Senior Sec. Notes
11.75% due 07/15/2025* | | | 1,265,000 | | | | 1,563,856 | |
Delta Air Lines, Inc.
Senior Sec. Notes
7.00% due 05/01/2025* | | | 723,000 | | | | 832,576 | |
United Airlines Holdings, Inc.
Company Guar. Notes
4.88% due 01/15/2025 | | | 325,000 | | | | 331,055 | |
| | | | | | |
|
|
|
| | | | | | | | 2,727,487 | |
| | | | | | |
|
|
|
AIG Strategic Bond Fund
PORTFOLIO OF INVESTMENTS — March 31, 2021 — (continued)
| | | | | | | | |
| Security Description | |
Principal
Amount(19) | | |
Value
(Note 2) | |
| |
U.S. CORPORATE BONDS & NOTES (continued) | |
Applications Software — 0.2% | |
SS&C Technologies, Inc.
Company Guar. Notes
5.50% due 09/30/2027* | | $ | 570,000 | | | $ | 606,480 | |
| | | | | | |
|
|
|
Auction Houses/Art Dealers — 0.2% | |
Sotheby’s
Senior Sec. Notes
7.38% due 10/15/2027* | | | 630,000 | | | | 681,257 | |
| | | | | | |
|
|
|
Auto-Cars/Light Trucks — 1.1% | |
BMW US Capital LLC
Company Guar. Notes
0.80% due 04/01/2024* | | | 104,000 | | | | 104,042 | |
Daimler Finance North America LLC
Company Guar. Notes
2.00% due 07/06/2021* | | | 228,000 | | | | 228,944 | |
Ford Motor Co.
Senior Notes
4.75% due 01/15/2043 | | | 1,344,000 | | | | 1,353,946 | |
Ford Motor Co.
Senior Notes
6.63% due 10/01/2028 | | | 865,000 | | | | 991,627 | |
Ford Motor Co.
Senior Notes
7.45% due 07/16/2031 | | | 526,000 | | | | 663,197 | |
Ford Motor Credit Co. LLC
Senior Notes
4.00% due 11/13/2030 | | | 200,000 | | | | 198,398 | |
General Motors Financial Co., Inc.
Senior Notes
0.85% due 02/26/2026 | | EUR | 225,000 | | | | 267,164 | |
General Motors Financial Co., Inc.
Senior Notes
2.75% due 06/20/2025 | | | 91,000 | | | | 94,959 | |
Hyundai Capital America
Senior Notes
3.40% due 06/20/2024* | | | 61,000 | | | | 65,046 | |
| | | | | | |
|
|
|
| | | | | | | | 3,967,323 | |
| | | | | | |
|
|
|
Auto-Heavy Duty Trucks — 0.3% | |
Allison Transmission, Inc.
Company Guar. Notes
3.75% due 01/30/2031* | | | 650,000 | | | | 629,687 | |
JB Poindexter & Co., Inc.
Senior Notes
7.13% due 04/15/2026* | | | 495,000 | | | | 522,844 | |
PACCAR Financial Corp.
Senior Notes
0.80% due 06/08/2023 | | | 85,000 | | | | 85,799 | |
| | | | | | |
|
|
|
| | | | | | | | 1,238,330 | |
| | | | | | |
|
|
|
Auto/Truck Parts & Equipment-Original — 0.1% | |
Dana, Inc.
Senior Notes
5.38% due 11/15/2027 | | | 327,000 | | | | 343,350 | |
| | | | | | |
|
|
|
Banks-Commercial — 0.5% | |
BankUnited, Inc.
Senior Notes
4.88% due 11/17/2025 | | | 176,000 | | | | 198,105 | |
| |
| | | | | | | | | |
Banks-Commercial (continued) | | | | | | | | |
BankUnited, Inc.
Sub. Notes
5.13% due 06/11/2030 | | $ | 228,000 | | | $ | 256,891 | |
Citizens Financial Group, Inc.
Sub. Notes
2.64% due 09/30/2032* | | | 107,000 | | | | 101,955 | |
First Horizon Bank
Sub. Notes
5.75% due 05/01/2030 | | | 250,000 | | | | 300,473 | |
Regions Financial Corp.
Sub. Notes
7.38% due 12/10/2037 | | | 219,000 | | | | 316,359 | |
Santander Holdings USA, Inc.
Senior Notes
3.24% due 10/05/2026 | | | 47,000 | | | | 49,574 | |
Signature Bank
Sub. Notes
4.00% due 10/15/2030 | | | 243,000 | | | | 250,551 | |
Zions Bancorp NA
Sub. Notes
3.25% due 10/29/2029 | | | 250,000 | | | | 252,733 | |
| | | | | | |
|
|
|
| | | | | | | | 1,726,641 | |
| | | | | | |
|
|
|
Banks-Super Regional — 0.1% | |
Wells Fargo & Co.
Senior Notes
2.39% due 06/02/2028 | | | 30,000 | | | | 30,734 | |
Wells Fargo & Co.
Senior Notes
3.07% due 04/30/2041 | | | 212,000 | | | | 207,314 | |
Wells Fargo & Co.
Sub. Notes
4.30% due 07/22/2027 | | | 46,000 | | | | 51,974 | |
Wells Fargo & Co.
Sub. Notes
4.65% due 11/04/2044 | | | 197,000 | | | | 226,262 | |
| | | | | | |
|
|
|
| | | | | | | | 516,284 | |
| | | | | | |
|
|
|
Batteries/Battery Systems — 0.1% | |
Energizer Holdings, Inc.
Company Guar. Notes
4.38% due 03/31/2029* | | | 495,000 | | | | 496,732 | |
| | | | | | |
|
|
|
Beverages-Non-alcoholic — 0.0% | |
Coca-Cola Co.
Senior Notes
1.00% due 03/09/2041 | | EUR | 130,000 | | | | 148,883 | |
| | | | | | |
|
|
|
Brewery — 0.1% | |
Anheuser-Busch Cos. LLC/Anheuser-Busch InBev Worldwide, Inc.
Company Guar. Notes
4.90% due 02/01/2046 | | | 127,000 | | | | 150,422 | |
Anheuser-Busch InBev Worldwide, Inc.
Company Guar. Notes
4.60% due 04/15/2048 | | | 201,000 | | | | 229,859 | |
| | | | | | |
|
|
|
| | | | | | | | 380,281 | |
| | | | | | |
|
|
|
AIG Strategic Bond Fund
PORTFOLIO OF INVESTMENTS — March 31, 2021 — (continued)
| | | | | | | | |
| Security Description | |
Principal
Amount(19) | | |
Value
(Note 2) | |
| | | | | | | | |
U.S. CORPORATE BONDS & NOTES (continued) | |
Broadcast Services/Program — 0.5% | |
Discovery Communications LLC
Company Guar. Notes
1.90% due 03/19/2027 | | EUR | 150,000 | | | $ | 188,818 | |
Discovery Communications LLC
Company Guar. Notes
5.30% due 05/15/2049 | | | 87,000 | | | | 103,816 | |
Univision Communications, Inc.
Senior Sec. Notes
5.13% due 02/15/2025* | | | 67,000 | | | | 67,670 | |
Univision Communications, Inc.
Senior Sec. Notes
6.63% due 06/01/2027* | | | 1,214,000 | | | | 1,296,461 | |
| | | | | | |
|
|
|
| | | | | | | | 1,656,765 | |
| | | | | | |
|
|
|
Building & Construction Products-Misc. — 0.2% | |
Owens Corning
Senior Notes
4.30% due 07/15/2047 | | | 34,000 | | | | 36,696 | |
Standard Industries, Inc.
Senior Notes
3.38% due 01/15/2031* | | | 415,000 | | | | 393,212 | |
Standard Industries, Inc.
Senior Notes
5.00% due 02/15/2027* | | | 135,000 | | | | 140,738 | |
| | | | | | |
|
|
|
| | | | | | | | 570,646 | |
| | | | | | |
|
|
|
Building & Construction-Misc. — 0.1% | |
VM Consolidated, Inc.
Company Guar. Notes
5.50% due 04/15/2029* | | | 471,000 | | | | 482,036 | |
| | | | | | |
|
|
|
Building Products-Air & Heating — 0.0% | |
Carrier Global Corp.
Senior Notes
3.38% due 04/05/2040 | | | 127,000 | | | | 125,709 | |
| | | | | | |
|
|
|
Building Products-Doors & Windows — 0.2% | |
Griffon Corp.
Company Guar. Notes
5.75% due 03/01/2028 | | | 730,000 | | | | 777,997 | |
| | | | | | |
|
|
|
Building Products-Wood — 0.0% | |
Masco Corp.
Senior Notes
3.13% due 02/15/2051 | | | 68,000 | | | | 63,647 | |
| | | | | | |
|
|
|
Cable/Satellite TV — 1.1% | |
Block Communications, Inc.
Company Guar. Notes
4.88% due 03/01/2028* | | | 697,000 | | | | 709,901 | |
CCO Holdings LLC/CCO Holdings Capital Corp.
Senior Notes
4.50% due 08/15/2030* | | | 557,000 | | | | 567,694 | |
CCO Holdings LLC/CCO Holdings Capital Corp.
Senior Notes
5.00% due 02/01/2028* | | | 203,000 | | | | 214,703 | |
CCO Holdings LLC/CCO Holdings Capital Corp.
Senior Notes
5.38% due 06/01/2029* | | | 565,000 | | | | 605,963 | |
| |
| | |
Cable/Satellite TV (continued) | |
Charter Communications Operating LLC/Charter Communications Operating Capital
Senior Sec. Notes
3.50% due 06/01/2041 | | $ | 33,000 | | | $ | 31,301 | |
Charter Communications Operating LLC/Charter Communications Operating Capital
Senior Sec. Notes
3.85% due 04/01/2061 | | | 134,000 | | | | 120,935 | |
Charter Communications Operating LLC/Charter Communications Operating Capital
Senior Sec. Notes
4.80% due 03/01/2050 | | | 64,000 | | | | 68,464 | |
Charter Communications Operating LLC/Charter Communications Operating Capital
Senior Sec. Notes
5.38% due 04/01/2038 | | | 17,000 | | | | 20,087 | |
Charter Communications Operating LLC/Charter Communications Operating Capital
Senior Sec. Notes
6.38% due 10/23/2035 | | | 46,000 | | | | 59,784 | |
Comcast Corp.
Company Guar. Notes
3.30% due 02/01/2027 | | | 90,000 | | | | 98,147 | |
Comcast Corp.
Company Guar. Notes
3.90% due 03/01/2038 | | | 37,000 | | | | 41,486 | |
Comcast Corp.
Company Guar. Notes
4.60% due 10/15/2038 | | | 70,000 | | | | 84,315 | |
CSC Holdings LLC
Senior Notes
5.25% due 06/01/2024 | | | 425,000 | | | | 458,469 | |
CSC Holdings LLC
Company Guar. Notes
5.50% due 04/15/2027* | | | 689,000 | | | | 723,691 | |
Time Warner Cable LLC
Senior Sec. Notes
6.55% due 05/01/2037 | | | 99,000 | | | | 128,802 | |
| | | | | | |
|
|
|
| | | | | | | | 3,933,742 | |
| | | | | | |
|
|
|
Casino Hotels — 0.1% | |
Genting New York LLC/GENNY Capital, Inc.
Senior Notes
3.30% due 02/15/2026* | | | 537,000 | | | | 535,842 | |
| | | | | | |
|
|
|
Casino Services — 0.2% | |
Caesars Entertainment, Inc.
Senior Sec. Notes
6.25% due 07/01/2025* | | | 630,000 | | | | 670,194 | |
| | | | | | |
|
|
|
Cellular Telecom — 0.1% | |
T-Mobile USA, Inc.
Senior Sec. Notes
3.00% due 02/15/2041* | | | 157,000 | | | | 146,994 | |
T-Mobile USA, Inc.
Senior Sec. Notes
3.60% due 11/15/2060* | | | 59,000 | | | | 56,185 | |
| | | | | | |
|
|
|
| | | | | | | | 203,179 | |
| | | | | | |
|
|
|
AIG Strategic Bond Fund
PORTFOLIO OF INVESTMENTS — March 31, 2021 — (continued)
| | | | | | | | |
| Security Description | |
Principal
Amount(19) | | |
Value
(Note 2) | |
| | | | | | | | |
U.S. CORPORATE BONDS & NOTES (continued) | |
Chemicals-Diversified — 0.1% | |
LYB International Finance III LLC
Company Guar. Notes
3.80% due 10/01/2060 | | $ | 53,000 | | | $ | 51,555 | |
Westlake Chemical Corp.
Senior Notes
1.63% due 07/17/2029 | | EUR | 160,000 | | | | 195,158 | |
| | | | | | |
|
|
|
| | | | | | | | 246,713 | |
| | | | | | |
|
|
|
Chemicals-Specialty — 0.2% | |
Ecolab, Inc.
Senior Notes
2.38% due 08/10/2022 | | | 102,000 | | | | 104,606 | |
Huntsman International LLC
Senior Notes
4.50% due 05/01/2029 | | | 16,000 | | | | 17,704 | |
Minerals Technologies, Inc.
Company Guar. Notes
5.00% due 07/01/2028* | | | 495,000 | | | | 510,469 | |
| | | | | | |
|
|
|
| | | | | | | | 632,779 | |
| | | | | | |
|
|
|
Circuit Boards — 0.1% | |
TTM Technologies, Inc.
Company Guar. Notes
4.00% due 03/01/2029* | | | 284,000 | | | | 280,095 | |
| | | | | | |
|
|
|
Coal — 0.2% | |
SunCoke Energy Partners LP/SunCoke Energy Partners Finance Corp.
Company Guar. Notes
7.50% due 06/15/2025* | | | 745,000 | | | | 773,869 | |
| | | | | | |
|
|
|
Commercial Services — 0.1% | |
Nielsen Finance LLC/Nielsen Finance Co.
Company Guar. Notes
5.63% due 10/01/2028* | | | 161,000 | | | | 169,251 | |
Nielsen Finance LLC/Nielsen Finance Co.
Company Guar. Notes
5.88% due 10/01/2030* | | | 255,000 | | | | 275,400 | |
| | | | | | |
|
|
|
| | | | | | | | 444,651 | |
| | | | | | |
|
|
|
Commercial Services-Finance — 0.3% | |
MPH Acquisition Holdings LLC
Company Guar. Notes
5.75% due 11/01/2028* | | | 1,035,000 | | | | 1,014,921 | |
| | | | | | |
|
|
|
Computer Services — 0.2% | |
Banff Merger Sub, Inc.
Senior Notes
9.75% due 09/01/2026* | | | 490,000 | | | | 522,133 | |
Leidos, Inc.
Company Guar. Notes
3.63% due 05/15/2025* | | | 55,000 | | | | 59,675 | |
| | | | | | |
|
|
|
| | | | | | | | 581,808 | |
| | | | | | |
|
|
|
Computer Software — 0.1% | |
Rackspace Technology Global, Inc.
Senior Sec. Notes
3.50% due 02/15/2028* | | | 480,000 | | | | 461,352 | |
| | | | | | |
|
|
|
| |
| | | | | | | | | |
Computers — 0.2% | |
Apple, Inc.
Senior Notes
1.38% due 05/24/2029 | | EUR | 120,000 | | | $ | 154,528 | |
Apple, Inc.
Senior Notes
2.05% due 09/11/2026 | | | 75,000 | | | | 77,490 | |
Dell International LLC/EMC Corp.
Senior Sec. Notes
8.10% due 07/15/2036* | | | 105,000 | | | | 153,700 | |
Hewlett Packard Enterprise Co.
Senior Notes
1.75% due 04/01/2026 | | | 221,000 | | | | 220,919 | |
Hewlett Packard Enterprise Co.
Senior Notes
6.20% due 10/15/2035 | | | 94,000 | | | | 122,845 | |
| | | | | | |
|
|
|
| | | | | | | | 729,482 | |
| | | | | | |
|
|
|
Computers-Integrated Systems — 0.4% | |
Diebold Nixdorf, Inc.
Company Guar. Notes
8.50% due 04/15/2024 | | | 420,000 | | | | 429,030 | |
Diebold Nixdorf, Inc.
Senior Sec. Notes
9.38% due 07/15/2025* | | | 279,000 | | | | 310,736 | |
NCR Corp.
Company Guar. Notes
5.13% due 04/15/2029* | | | 582,000 | | | | 588,594 | |
| | | | | | |
|
|
|
| | | | | | | | 1,328,360 | |
| | | | | | |
|
|
|
Consumer Products-Misc. — 0.1% | |
Central Garden & Pet Co.
Company Guar. Notes
5.13% due 02/01/2028 | | | 375,000 | | | | 395,625 | |
| | | | | | |
|
|
|
Containers-Metal/Glass — 0.1% | |
Silgan Holdings, Inc.
Company Guar. Notes
4.75% due 03/15/2025 | | | 501,000 | | | | 509,266 | |
| | | | | | |
|
|
|
Containers-Paper/Plastic — 0.1% | |
Graphic Packaging International LLC
Senior Sec. Notes
1.51% due 04/15/2026* | | | 71,000 | | | | 70,474 | |
Sonoco Products Co
Senior Notes
3.13% due 05/01/2030 | | | 121,000 | | | | 124,864 | |
| | | | | | |
|
|
|
| | | | | | | | 195,338 | |
| | | | | | |
|
|
|
Cosmetics & Toiletries — 0.4% | |
Coty, Inc.
Company Guar. Notes
6.50% due 04/15/2026* | | | 1,027,000 | | | | 1,034,980 | |
Edgewell Personal Care Co.
Company Guar. Notes
4.13% due 04/01/2029* | | | 600,000 | | | | 596,520 | |
| | | | | | |
|
|
|
| | | | | | | | 1,631,500 | |
| | | | | | |
|
|
|
AIG Strategic Bond Fund
PORTFOLIO OF INVESTMENTS — March 31, 2021 — (continued)
| | | | | | | | |
| Security Description | |
Principal
Amount(19) | | |
Value
(Note 2) | |
| | | | | | | | |
U.S. CORPORATE BONDS & NOTES (continued) | |
Data Processing/Management — 0.0% | |
Fiserv, Inc.
Senior Notes
1.63% due 07/01/2030 | | EUR | 120,000 | | | $ | 151,397 | |
| | | | | | |
|
|
|
Dialysis Centers — 0.3% | |
DaVita, Inc.
Company Guar. Notes
4.63% due 06/01/2030* | | | 1,050,000 | | | | 1,068,007 | |
| | | | | | |
|
|
|
Direct Marketing — 0.2% | |
Terrier Media Buyer, Inc.
Company Guar. Notes
8.88% due 12/15/2027* | | | 675,000 | | | | 726,334 | |
| | | | | | |
|
|
|
Distribution/Wholesale — 0.5% | |
H&E Equipment Services, Inc.
Company Guar. Notes
3.88% due 12/15/2028* | | | 680,000 | | | | 661,300 | |
KAR Auction Services, Inc.
Company Guar. Notes
5.13% due 06/01/2025* | | | 563,000 | | | | 569,474 | |
Performance Food Group, Inc.
Company Guar. Notes
5.50% due 10/15/2027* | | | 588,000 | | | | 614,907 | |
| | | | | | |
|
|
|
| | | | | | | | 1,845,681 | |
| | | | | | |
|
|
|
Diversified Banking Institutions — 1.0% | |
Bank of America Corp.
Senior Notes
2.46% due 10/22/2025 | | | 174,000 | | | | 182,415 | |
Bank of America Corp.
Senior Notes
3.48% due 03/13/2052 | | | 45,000 | | | | 45,706 | |
Bank of America Corp.
Senior Notes
3.65% due 03/31/2029 | | EUR | 220,000 | | | | 313,077 | |
Bank of America Corp.
Senior Notes
4.08% due 03/20/2051 | | | 22,000 | | | | 24,519 | |
Bank of America Corp.
Sub. Notes
4.18% due 11/25/2027 | | | 535,000 | | | | 594,666 | |
Citigroup, Inc.
Senior Notes
3.67% due 07/24/2028 | | | 45,000 | | | | 49,186 | |
Citigroup, Inc.
Sub. Notes
4.45% due 09/29/2027 | | | 130,000 | | | | 146,400 | |
Citigroup, Inc.
Sub. Notes
4.75% due 05/18/2046 | | | 52,000 | | | | 61,784 | |
Citigroup, Inc.
Sub. Notes
5.88% due 02/22/2033 | | | 104,000 | | | | 131,687 | |
Citigroup, Inc.
Sub. Notes
6.00% due 10/31/2033 | | | 107,000 | | | | 138,172 | |
Goldman Sachs Group, Inc.
Senior Notes
3.50% due 11/16/2026 | | | 192,000 | | | | 208,014 | |
| |
| | | | | | | | | |
Diversified Banking Institutions (continued) | | | | | | | | |
Goldman Sachs Group, Inc.
Sub. Notes
6.75% due 10/01/2037 | | $ | 195,000 | | | $ | 274,311 | |
Goldman Sachs Group., Inc.
Senior Notes
1.63% due 07/27/2026 | | EUR | 240,000 | | | | 300,225 | |
JPMorgan Chase & Co.
Senior Notes
0.65% due 09/16/2024 | | | 128,000 | | | | 128,243 | |
JPMorgan Chase & Co.
Senior Notes
1.64% due 05/18/2028 | | EUR | 120,000 | | | | 151,282 | |
JPMorgan Chase & Co.
Senior Notes
2.01% due 03/13/2026 | | | 284,000 | | | | 291,945 | |
JPMorgan Chase & Co.
Senior Notes
2.53% due 11/19/2041 | | | 239,000 | | | | 217,314 | |
Morgan Stanley
Senior Notes
3.62% due 04/01/2031 | | | 62,000 | | | | 67,236 | |
Morgan Stanley
Senior Notes
3.63% due 01/20/2027 | | | 226,000 | | | | 247,853 | |
Morgan Stanley
Sub. Notes
5.00% due 11/24/2025 | | | 19,000 | | | | 21,830 | |
| | | | | | |
|
|
|
| | | | | | | | 3,595,865 | |
| | | | | | |
|
|
|
Diversified Manufacturing Operations — 0.0% | |
General Electric Co.
Senior Notes
4.35% due 05/01/2050 | | | 33,000 | | | | 36,492 | |
Illinois Tool Works, Inc.
Senior Notes
3.50% due 03/01/2024 | | | 69,000 | | | | 74,597 | |
| | | | | | |
|
|
|
| | | | | | | | 111,089 | |
| | | | | | |
|
|
|
Drug Delivery Systems — 0.1% | |
Becton Dickinson & Co.
Senior Notes
1.90% due 12/15/2026 | | EUR | 190,000 | | | | 242,792 | |
| | | | | | |
|
|
|
E-Commerce/Services — 0.4% | |
Booking Holdings, Inc.
Senior Notes
1.80% due 03/03/2027 | | EUR | 130,000 | | | | 165,688 | |
Expedia Group, Inc.
Company Guar. Notes
2.50% due 06/03/2022 | | EUR | 155,000 | | | | 185,554 | |
Expedia Group, Inc.
Company Guar. Notes
2.95% due 03/15/2031* | | | 108,000 | | | | 106,418 | |
GrubHub Holdings, Inc.
Company Guar. Notes
5.50% due 07/01/2027* | | | 849,000 | | | | 882,960 | |
| | | | | | |
|
|
|
| | | | | | | | 1,340,620 | |
| | | | | | |
|
|
|
AIG Strategic Bond Fund
PORTFOLIO OF INVESTMENTS — March 31, 2021 — (continued)
| | | | | | | | |
| Security Description | |
Principal
Amount(19) | | |
Value
(Note 2) | |
| | | | | | | | |
U.S. CORPORATE BONDS & NOTES (continued) | |
Electric Products-Misc. — 0.0% | |
Emerson Electric Co.
Senior Notes
0.88% due 10/15/2026 | | $ | 86,000 | | | $ | 83,332 | |
| | | | | | |
|
|
|
Electric-Distribution — 0.1% | |
National Rural Utilities Cooperative Finance Corp.
Collateral Trust Bonds
2.85% due 01/27/2025 | | | 84,000 | | | | 88,815 | |
NextEra Energy Operating Partners LP
Company Guar. Notes
4.25% due 07/15/2024* | | | 425,000 | | | | 447,312 | |
| | | | | | |
|
|
|
| | | | | | | | 536,127 | |
| | | | | | |
|
|
|
Electric-Generation — 0.3% | |
Emera US Finance LP
Company Guar. Notes
4.75% due 06/15/2046 | | | 87,000 | | | | 96,729 | |
Liberty Utilities Finance GP
Company Guar. Notes
2.05% due 09/15/2030* | | | 56,000 | | | | 52,428 | |
Pattern Energy Operations LP/Pattern Energy Operations, Inc.
Company Guar. Notes
4.50% due 08/15/2028* | | | 500,000 | | | | 508,125 | |
Vistra Operations Co. LLC
Company Guar. Notes
5.00% due 07/31/2027* | | | 539,000 | | | | 555,871 | |
| | | | | | |
|
|
|
| | | | | | | | 1,213,153 | |
| | | | | | |
|
|
|
Electric-Integrated — 0.9% | |
AES Corp.
Senior Notes
2.45% due 01/15/2031* | | | 143,000 | | | | 136,615 | |
Appalachian Power Co.
Senior Notes
3.70% due 05/01/2050 | | | 84,000 | | | | 84,744 | |
Avangrid, Inc.
Senior Notes
3.20% due 04/15/2025 | | | 207,000 | | | | 221,545 | |
Consolidated Edison Co. of New York, Inc.
Senior Notes
3.95% due 04/01/2050 | | | 19,000 | | | | 20,460 | |
Dominion Resources, Inc.
Senior Notes
5.25% due 08/01/2033 | | | 159,000 | | | | 191,688 | |
DTE Electric Co.
General Refunding Mtg.
3.95% due 03/01/2049 | | | 154,000 | | | | 171,615 | |
Entergy Mississippi LLC
1st Mtg. Notes
3.50% due 06/01/2051 | | | 36,000 | | | | 36,447 | |
Entergy Texas, Inc.
1st Mtg. Bonds
4.50% due 03/30/2039 | | | 157,000 | | | | 176,882 | |
Exelon Corp.
Senior Notes
4.70% due 04/15/2050 | | | 62,000 | | | | 74,047 | |
Exelon Generation Co. LLC
Senior Notes
3.25% due 06/01/2025 | | | 3,000 | | | | 3,202 | |
| |
| | |
Electric-Integrated (continued) | |
FirstEnergy Corp.
Senior Notes
7.38% due 11/15/2031 | | $ | 134,000 | | | $ | 179,186 | |
FirstEnergy Transmission LLC
Senior Notes
2.87% due 09/15/2028* | | | 98,000 | | | | 99,107 | |
Georgia Power Co.
Senior Notes
3.25% due 03/15/2051 | | | 165,000 | | | | 157,024 | |
Interstate Power & Light Co.
Senior Notes
3.50% due 09/30/2049 | | | 91,000 | | | | 89,311 | |
Pacific Gas & Electric Co.
1st Mtg. Notes
4.30% due 03/15/2045 | | | 82,000 | | | | 79,409 | |
Public Service Co. of Colorado
1st Mtg. Bonds
2.70% due 01/15/2051 | | | 159,000 | | | | 144,446 | |
Public Service Co. of Colorado
1st Mtg. Notes
3.70% due 06/15/2028 | | | 129,000 | | | | 142,310 | |
Public Service Co. of Colorado
1st Mtg. Bonds
4.10% due 06/15/2048 | | | 89,000 | | | | 100,492 | |
South Carolina Electric & Gas Co.
1st Mtg. Bonds
5.10% due 06/01/2065 | | | 201,000 | | | | 265,510 | |
Southern California Edison Co.
1st Mtg. Bonds
1.10% due 04/01/2024 | | | 205,000 | | | | 204,981 | |
Talen Energy Supply LLC
Senior Sec. Notes
6.63% due 01/15/2028* | | | 529,000 | | | | 528,439 | |
| | | | | | |
|
|
|
| | | | | | | | 3,107,460 | |
| | | | | | |
|
|
|
Electronic Components-Semiconductors — 0.2% | |
Broadcom, Inc.
Company Guar. Notes
3.50% due 02/15/2041* | | | 56,000 | | | | 53,309 | |
Broadcom, Inc.
Company Guar. Notes
4.15% due 11/15/2030 | | | 90,000 | | | | 97,245 | |
ON Semiconductor Corp.
Company Guar. Notes
3.88% due 09/01/2028* | | | 410,000 | | | | 421,747 | |
| | | | | | |
|
|
|
| | | | | | | | 572,301 | |
| | | | | | |
|
|
|
Electronic Measurement Instruments — 0.1% | |
Trimble, Inc.
Senior Notes
4.75% due 12/01/2024 | | | 7,000 | | | | 7,833 | |
Vontier Corp.
Company Guar. Notes
2.95% due 04/01/2031* | | | 188,000 | | | | 183,413 | |
| | | | | | |
|
|
|
| | | | | | | | 191,246 | |
| | | | | | |
|
|
|
Electronic Parts Distribution — 0.0% | |
Arrow Electronics, Inc.
Senior Notes
4.00% due 04/01/2025 | | | 42,000 | | | | 45,305 | |
| | | | | | |
|
|
|
AIG Strategic Bond Fund
PORTFOLIO OF INVESTMENTS — March 31, 2021 — (continued)
| | | | | | | | |
| Security Description | |
Principal
Amount(19) | | |
Value
(Note 2) | |
| | | | | | | | |
U.S. CORPORATE BONDS & NOTES (continued) | |
Enterprise Software/Service — 0.3% | |
Donnelley Financial Solutions, Inc.
Company Guar. Notes
8.25% due 10/15/2024 | | $ | 604,000 | | | $ | 629,670 | |
Oracle Corp.
Senior Notes
2.30% due 03/25/2028 | | | 229,000 | | | | 231,544 | |
Oracle Corp.
Senior Notes
3.65% due 03/25/2041 | | | 84,000 | | | | 84,789 | |
Oracle Corp.
Senior Notes
4.10% due 03/25/2061 | | | 80,000 | | | | 82,246 | |
| | | | | | |
|
|
|
| | | | | | | | 1,028,249 | |
| | | | | | |
|
|
|
Finance-Auto Loans — 0.2% | |
Credit Acceptance Corp.
Company Guar. Notes
5.13% due 12/31/2024* | | | 80,000 | | | | 81,600 | |
Credit Acceptance Corp.
Company Guar. Notes
6.63% due 03/15/2026 | | | 757,000 | | | | 796,742 | |
| | | | | | |
|
|
|
| | | | | | | | 878,342 | |
| | | | | | |
|
|
|
Finance-Commercial — 0.1% | |
Burford Capital Global Finance LLC
Company Guar. Notes
6.25% due 04/15/2028* | | | 252,000 | | | | 258,300 | |
| | | | | | |
|
|
|
Finance-Consumer Loans — 0.7% | |
Enova International, Inc.
Company Guar. Notes
8.50% due 09/01/2024* | | | 935,000 | | | | 958,375 | |
Enova International, Inc.
Company Guar. Notes
8.50% due 09/15/2025* | | | 72,000 | | | | 74,722 | |
Springleaf Finance Corp.
Company Guar. Notes
5.38% due 11/15/2029 | | | 440,000 | | | | 468,050 | |
Springleaf Finance Corp.
Company Guar. Notes
6.88% due 03/15/2025 | | | 425,000 | | | | 483,406 | |
Synchrony Financial
Senior Notes
4.50% due 07/23/2025 | | | 360,000 | | | | 398,523 | |
| | | | | | |
|
|
|
| | | | | | | | 2,383,076 | |
| | | | | | |
|
|
|
Finance-Credit Card — 0.3% | |
Alliance Data Systems Corp.
Company Guar. Notes
4.75% due 12/15/2024* | | | 998,000 | | | | 1,024,197 | |
American Express Co.
Senior Notes
3.40% due 02/22/2024 | | | 42,000 | | | | 45,179 | |
American Express Co.
Senior Notes
4.20% due 11/06/2025 | | | 57,000 | | | | 64,431 | |
Mastercard, Inc.
Senior Notes
1.90% due 03/15/2031 | | | 48,000 | | | | 47,143 | |
| |
| | |
Finance-Credit Card (continued) | |
Visa, Inc.
Senior Notes
0.75% due 08/15/2027 | | $ | 35,000 | | | $ | 33,582 | |
| | | | | | |
|
|
|
| | | | | | | | 1,214,532 | |
| | | | | | |
|
|
|
Finance-Investment Banker/Broker — 0.2% | |
LPL Holdings, Inc.
Company Guar. Notes
4.00% due 03/15/2029* | | | 433,000 | | | | 436,247 | |
LPL Holdings, Inc.
Company Guar. Notes
4.63% due 11/15/2027* | | | 105,000 | | | | 108,938 | |
| | | | | | |
|
|
|
| | | | | | | | 545,185 | |
| | | | | | |
|
|
|
Finance-Mortgage Loan/Banker — 0.6% | |
Genworth Mtg. Holdings, Inc.
Senior Notes
6.50% due 08/15/2025* | | | 954,000 | | | | 1,030,916 | |
LD Holdings Group LLC
Company Guar. Notes
6.50% due 11/01/2025* | | | 436,000 | | | | 456,841 | |
Quicken Loans LLC/Quicken Loans Co-Issuer, Inc.
Company Guar. Notes
3.63% due 03/01/2029* | | | 624,000 | | | | 603,720 | |
Quicken Loans, Inc.
Company Guar. Notes
5.25% due 01/15/2028* | | | 143,000 | | | | 150,508 | |
| | | | | | |
|
|
|
| | | | | | | | 2,241,985 | |
| | | | | | |
|
|
|
Financial Guarantee Insurance — 0.1% | |
NMI Holdings, Inc.
Senior Sec. Notes
7.38% due 06/01/2025* | | | 354,000 | | | | 408,435 | |
| | | | | | |
|
|
|
Food-Meat Products — 0.0% | |
Smithfield Foods, Inc.
Company Guar. Notes
4.25% due 02/01/2027* | | | 59,000 | | | | 64,987 | |
Smithfield Foods, Inc.
Senior Notes
5.20% due 04/01/2029* | | | 81,000 | | | | 92,884 | |
| | | | | | |
|
|
|
| | | | | | | | 157,871 | |
| | | | | | |
|
|
|
Food-Misc./Diversified — 0.6% | |
Conagra Brands, Inc.
Senior Notes
7.00% due 10/01/2028 | | | 84,000 | | | | 108,579 | |
Dole Food Co., Inc.
Senior Sec. Notes
7.25% due 06/15/2025* | | | 705,000 | | | | 723,580 | |
Kraft Heinz Foods Co.
Company Guar. Notes
4.88% due 10/01/2049 | | | 382,000 | | | | 427,269 | |
Mars, Inc.
Senior Notes
2.38% due 07/16/2040* | | | 53,000 | | | | 48,478 | |
Nestle Holdings, Inc.
Company Guar. Notes
3.50% due 09/24/2025* | | | 152,000 | | | | 166,761 | |
AIG Strategic Bond Fund
PORTFOLIO OF INVESTMENTS — March 31, 2021 — (continued)
| | | | | | | | |
| Security Description | |
Principal
Amount(19) | | |
Value
(Note 2) | |
| | | | | | | | |
U.S. CORPORATE BONDS & NOTES (continued) | |
Food-Misc./Diversified (continued) | |
Post Holdings, Inc.
Senior Notes
4.50% due 09/15/2031* | | $ | 695,000 | | | $ | 687,355 | |
| | | | | | |
|
|
|
| | | | | | | | 2,162,022 | |
| | | | | | |
|
|
|
Food-Retail — 0.3% | |
Albertsons Cos, Inc./Safeway, Inc./New Albertsons LP/Albertsons LLC
Company Guar. Notes
4.63% due 01/15/2027* | | | 532,000 | | | | 551,389 | |
Albertsons Cos, Inc./Safeway, Inc./New Albertsons LP/Albertsons LLC
Company Guar. Notes
5.75% due 03/15/2025 | | | 63,000 | | | | 65,060 | |
Albertsons Cos, Inc./Safeway, Inc./New Albertsons LP/Albertsons LLC
Company Guar. Notes
5.88% due 02/15/2028* | | | 308,000 | | | | 327,496 | |
| | | | | | |
|
|
|
| | | | | | | | 943,945 | |
| | | | | | |
|
|
|
Food-Wholesale/Distribution — 0.5% | |
C&S Group Enterprises LLC
Company Guar. Notes
5.00% due 12/15/2028* | | | 680,000 | | | | 661,300 | |
Sysco Corp.
Company Guar. Notes
4.45% due 03/15/2048 | | | 144,000 | | | | 162,173 | |
Sysco Corp.
Company Guar. Notes
4.50% due 04/01/2046 | | | 86,000 | | | | 96,383 | |
Sysco Corp.
Company Guar. Notes
5.95% due 04/01/2030 | | | 30,000 | | | | 37,505 | |
Sysco Corp.
Company Guar. Bonds
6.60% due 04/01/2040 | | | 83,000 | �� | | | 115,547 | |
Sysco Corp.
Company Guar. Notes
6.60% due 04/01/2050 | | | 34,000 | | | | 48,978 | |
US Foods, Inc.
Senior Sec. Notes
6.25% due 04/15/2025* | | | 518,000 | | | | 555,296 | |
| | | | | | |
|
|
|
| | | | | | | | 1,677,182 | |
| | | | | | |
|
|
|
Gas-Distribution — 0.0% | |
National Fuel Gas Co.
Senior Notes
2.95% due 03/01/2031 | | | 56,000 | | | | 53,885 | |
| | | | | | |
|
|
|
Hotels/Motels — 0.5% | |
Hilton Grand Vacations Borrower LLC/Hilton Grand Vacations Borrower, Inc.
Company Guar. Notes
6.13% due 12/01/2024 | | | 755,000 | | | | 785,359 | |
Marriott International, Inc.
Senior Notes
2.85% due 04/15/2031 | | | 113,000 | | | | 111,042 | |
Marriott International, Inc.
Senior Notes
4.63% due 06/15/2030 | | | 137,000 | | | | 153,160 | |
| |
| | |
Hotels/Motels (continued) | |
Wyndham Destinations, Inc.
Senior Sec. Notes
6.63% due 07/31/2026* | | $ | 180,000 | | | $ | 204,363 | |
Wyndham Worldwide Corp.
Senior Sec. Notes
6.00% due 04/01/2027 | | | 596,000 | | | | 657,984 | |
| | | | | | |
|
|
|
| | | | | | | | 1,911,908 | |
| | | | | | |
|
|
|
Human Resources — 0.5% | |
Korn Ferry International
Company Guar. Notes
4.63% due 12/15/2027* | | | 727,000 | | | | 740,631 | |
Team Health Holdings, Inc.
Company Guar. Notes
6.38% due 02/01/2025* | | | 600,000 | | | | 528,708 | |
TriNet Group, Inc.
Company Guar. Notes
3.50% due 03/01/2029* | | | 700,000 | | | | 684,740 | |
| | | | | | |
|
|
|
| | | | | | | | 1,954,079 | |
| | | | | | |
|
|
|
Independent Power Producers — 0.7% | |
Calpine Corp.
Senior Sec. Notes
3.75% due 03/01/2031* | | | 810,000 | | | | 772,011 | |
Clearway Energy Operating LLC
Company Guar. Notes
4.75% due 03/15/2028* | | | 585,000 | | | | 608,628 | |
NRG Energy, Inc.
Company Guar. Notes
3.38% due 02/15/2029* | | | 228,000 | | | | 222,585 | |
NRG Energy, Inc.
Company Guar. Notes
3.63% due 02/15/2031* | | | 655,000 | | | | 638,625 | |
NRG Yield Operating LLC
Company Guar. Notes
5.00% due 09/15/2026 | | | 375,000 | | | | 387,413 | |
| | | | | | |
|
|
|
| | | | | | | | 2,629,262 | |
| | | | | | |
|
|
|
Instruments-Controls — 0.0% | |
Honeywell International, Inc.
Senior Notes
0.48% due 08/19/2022 | | | 64,000 | | | | 64,059 | |
| | | | | | |
|
|
|
Insurance Brokers — 0.0% | |
AmFam Holdings, Inc.
Senior Notes
3.83% due 03/11/2051* | | | 90,000 | | | | 91,184 | |
Willis North America, Inc.
Company Guar. Notes
3.88% due 09/15/2049 | | | 28,000 | | | | 29,565 | |
| | | | | | |
|
|
|
| | | | | | | | 120,749 | |
| | | | | | |
|
|
|
Insurance-Life/Health — 0.2% | |
Athene Global Funding
Sec. Notes
0.63% due 01/12/2028 | | EUR | 200,000 | | | | 231,749 | |
Athene Global Funding
Sec. Notes
1.75% due 11/24/2027 | | GBP | 100,000 | | | | 137,540 | |
AIG Strategic Bond Fund
PORTFOLIO OF INVESTMENTS — March 31, 2021 — (continued)
| | | | | | | | |
| Security Description | |
Principal
Amount(19) | | |
Value
(Note 2) | |
| | | | | | | | |
U.S. CORPORATE BONDS & NOTES (continued) | |
Insurance-Life/Health (continued) | |
Brighthouse Financial, Inc.
Senior Notes
5.63% due 05/15/2030 | | $ | 91,000 | | | $ | 106,373 | |
Ohio National Financial Services, Inc.
Senior Notes
5.55% due 01/24/2030* | | | 200,000 | | | | 217,611 | |
Principal Life Global Funding II
Sec. Notes
0.50% due 01/08/2024* | | | 86,000 | | | | 85,787 | |
Unum Group
Senior Notes
4.50% due 03/15/2025 | | | 34,000 | | | | 37,986 | |
| | | | | | |
|
|
|
| | | | | | | | 817,046 | |
| | | | | | |
|
|
|
Insurance-Multi-line — 0.0% | |
Metropolitan Life Global Funding I
Sec. Notes
0.63% due 12/08/2027 | | GBP | 100,000 | | | | 131,662 | |
| | | | | | |
|
|
|
Insurance-Property/Casualty — 0.1% | |
Chubb INA Holdings, Inc.
Company Guar. Notes
1.55% due 03/15/2028 | | EUR | 145,000 | | | | 182,400 | |
| | | | | | |
|
|
|
Internet Content-Entertainment — 0.2% | |
Netflix, Inc.
Senior Notes
4.88% due 06/15/2030* | | | 550,000 | | | | 633,347 | |
| | | | | | |
|
|
|
Internet Telephone — 0.1% | |
Cablevision Lightpath LLC
Senior Sec. Notes
3.88% due 09/15/2027* | | | 430,000 | | | | 425,700 | |
| | | | | | |
|
|
|
Investment Management/Advisor Services — 0.2% | |
AG Issuer LLC
Senior Sec. Notes
6.25% due 03/01/2028* | | | 668,000 | | | | 698,895 | |
Ameriprise Financial, Inc.
Senior Notes
3.00% due 03/22/2022 | | | 83,000 | | | | 85,169 | |
| | | | | | |
|
|
|
| | | | | | | | 784,064 | |
| | | | | | |
|
|
|
Machinery-Construction & Mining — 0.2% | |
Caterpillar Financial Services Corp.
Senior Notes
0.65% due 07/07/2023 | | | 135,000 | | | | 135,662 | |
Caterpillar Financial Services Corp.
Senior Notes
1.10% due 09/14/2027 | | | 102,000 | | | | 98,222 | |
Terex Corp.
Company Guar. Notes
5.00% due 05/15/2029* | | | 300,000 | | | | 310,560 | |
| | | | | | |
|
|
|
| | | | | | | | 544,444 | |
| | | | | | |
|
|
|
Machinery-Farming — 0.1% | |
CNH Industrial Capital LLC
Company Guar. Notes
4.20% due 01/15/2024 | | | 150,000 | | | | 163,499 | |
John Deere Capital Corp.
Senior Notes
1.50% due 03/06/2028 | | | 144,000 | | | | 140,141 | |
| | | | | | |
|
|
|
| | | | | | | | 303,640 | |
| | | | | | |
|
|
|
| |
| | |
Medical Labs & Testing Services — 0.1% | |
Catalent Pharma Solutions, Inc.
Company Guar. Notes
3.13% due 02/15/2029* | | $ | 93,000 | | | $ | 89,280 | |
Catalent Pharma Solutions, Inc.
Company Guar. Notes
5.00% due 07/15/2027* | | | 216,000 | | | | 226,260 | |
| | | | | | |
|
|
|
| | | | | | | | 315,540 | |
| | | | | | |
|
|
|
Medical Products — 0.1% | |
Stryker Corp.
Senior Notes
0.75% due 03/01/2029 | | EUR | 195,000 | | | | 232,789 | |
| | | | | | |
|
|
|
Medical-Biomedical/Gene — 0.1% | |
Amgen, Inc.
Senior Notes
3.15% due 02/21/2040 | | | 81,000 | | | | 80,486 | |
Regeneron Pharmaceuticals, Inc.
Senior Notes
1.75% due 09/15/2030 | | | 101,000 | | | | 93,335 | |
Regeneron Pharmaceuticals, Inc.
Senior Bonds
2.80% due 09/15/2050 | | | 82,000 | | | | 70,830 | |
| | | | | | |
|
|
|
| | | | | | | | 244,651 | |
| | | | | | |
|
|
|
Medical-Drugs — 0.1% | |
AbbVie, Inc.
Senior Notes
0.75% due 11/18/2027 | | EUR | 125,000 | | | | 150,671 | |
AbbVie, Inc.
Senior Notes
4.05% due 11/21/2039 | | | 79,000 | | | | 88,192 | |
AbbVie, Inc.
Senior Notes
4.25% due 11/21/2049 | | | 93,000 | | | | 104,775 | |
Bristol-Myers Squibb Co.
Senior Notes
0.75% due 11/13/2025 | | | 116,000 | | | | 114,227 | |
Bristol-Myers Squibb Co.
Senior Notes
4.55% due 02/20/2048 | | | 6,000 | | | | 7,286 | |
GlaxoSmithKline Capital, Inc.
Company Guar. Notes
3.38% due 05/15/2023 | | | 62,000 | | | | 65,872 | |
| | | | | | |
|
|
|
| | | | | | | | 531,023 | |
| | | | | | |
|
|
|
Medical-Generic Drugs — 0.2% | |
Par Pharmaceutical, Inc.
Senior Sec. Notes
7.50% due 04/01/2027* | | | 456,000 | | | | 484,819 | |
Upjohn, Inc.
Company Guar. Notes
3.85% due 06/22/2040* | | | 64,000 | | | | 65,257 | |
Viatris, Inc.
Company Guar. Notes
4.00% due 06/22/2050* | | | 175,000 | | | | 177,816 | |
| | | | | | |
|
|
|
| | | | | | | | 727,892 | |
| | | | | | |
|
|
|
AIG Strategic Bond Fund
PORTFOLIO OF INVESTMENTS — March 31, 2021 — (continued)
| | | | | | | | |
| Security Description | |
Principal
Amount(19) | | |
Value
(Note 2) | |
| | | | | | | | |
U.S. CORPORATE BONDS & NOTES (continued) | |
Medical-Hospitals — 1.4% | |
Acadia Healthcare Co., Inc.
Company Guar. Notes
5.00% due 04/15/2029* | | $ | 120,000 | | | $ | 124,526 | |
Acadia Healthcare Co., Inc.
Company Guar. Notes
5.50% due 07/01/2028* | | | 548,000 | | | | 576,907 | |
CHS/Community Health Systems, Inc.
Senior Sec. Notes
5.63% due 03/15/2027* | | | 625,000 | | | | 657,375 | |
CHS/Community Health Systems, Inc.
Sec. Notes
6.88% due 04/15/2029* | | | 332,000 | | | | 347,023 | |
HCA, Inc.
Company Guar. Notes
3.50% due 09/01/2030 | | | 1,285,000 | | | | 1,299,835 | |
LifePoint Health, Inc.
Senior Sec. Notes
4.38% due 02/15/2027* | | | 459,000 | | | | 449,820 | |
Tenet Healthcare Corp.
Senior Sec. Notes
4.63% due 07/15/2024 | | | 700,000 | | | | 711,725 | |
Tenet Healthcare Corp.
Company Guar. Notes
6.13% due 10/01/2028* | | | 849,000 | | | | 884,234 | |
| | | | | | |
|
|
|
| | | | | | | | 5,051,445 | |
| | | | | | |
|
|
|
Medical-Wholesale Drug Distribution — 0.0% | |
Cardinal Health, Inc.
Senior Notes
4.60% due 03/15/2043 | | | 139,000 | | | | 151,931 | |
| | | | | | |
|
|
|
Metal-Copper — 0.4% | |
Freeport-McMoRan, Inc.
Company Guar. Notes
4.13% due 03/01/2028 | | | 380,000 | | | | 399,456 | |
Freeport-McMoRan, Inc.
Company Guar. Notes
4.25% due 03/01/2030 | | | 343,000 | | | | 365,295 | |
Freeport-McMoRan, Inc.
Company Guar. Notes
4.38% due 08/01/2028 | | | 416,000 | | | | 441,272 | |
Freeport-McMoRan, Inc.
Company Guar. Notes
4.63% due 08/01/2030 | | | 251,000 | | | | 273,144 | |
| | | | | | |
|
|
|
| | | | | | | | 1,479,167 | |
| | | | | | |
|
|
|
Multimedia — 0.1% | |
Viacom, Inc.
Senior Notes
4.38% due 03/15/2043 | | | 272,000 | | | | 292,614 | |
Walt Disney Co.
Company Guar. Bonds
2.75% due 09/01/2049 | | | 120,000 | | | | 109,500 | |
| | | | | | |
|
|
|
| | | | | | | | 402,114 | |
| | | | | | |
|
|
|
Non-Hazardous Waste Disposal — 0.2% | |
Covanta Holding Corp.
Company Guar. Notes
5.00% due 09/01/2030 | | | 591,000 | | | | 596,910 | |
| | | | | | |
|
|
|
| | | | | | | | |
| Security Description | |
Principal
Amount(19) | | |
Value
(Note 2) | |
| |
| | |
Non-Profit Charity — 0.0% | |
Ford Foundation
Notes
2.82% due 06/01/2070 | | $ | 75,000 | | | $ | 67,217 | |
| | | | | | |
|
|
|
Oil Companies-Exploration & Production — 2.0% | |
Antero Resources Corp.
Company Guar. Notes
7.63% due 02/01/2029* | | | 417,000 | | | | 444,105 | |
Apache Corp.
Senior Notes
4.38% due 10/15/2028 | | | 450,000 | | | | 448,650 | |
Apache Corp.
Senior Notes
4.75% due 04/15/2043 | | | 403,000 | | | | 373,783 | |
Apache Corp.
Senior Notes
4.88% due 11/15/2027 | | | 29,000 | | | | 29,725 | |
California Resources Corp.
Company Guar. Notes
7.13% due 02/01/2026* | | | 650,000 | | | | 661,511 | |
Callon Petroleum Co.
Company Guar. Notes
6.38% due 07/01/2026 | | | 518,000 | | | | 409,220 | |
Continental Resources, Inc.
Company Guar. Notes
4.38% due 01/15/2028 | | | 151,000 | | | | 159,464 | |
Continental Resources, Inc.
Company Guar. Notes
5.75% due 01/15/2031* | | | 371,000 | | | | 419,178 | |
Diamondback Energy, Inc.
Company Guar. Notes
3.50% due 12/01/2029 | | | 104,000 | | | | 107,866 | |
Diamondback Energy, Inc.
Company Guar. Notes
4.40% due 03/24/2051 | | | 73,000 | | | | 74,388 | |
Endeavor Energy Resources LP/EER Finance, Inc.
Senior Notes
5.75% due 01/30/2028* | | | 325,000 | | | | 343,304 | |
EOG Resources, Inc.
Senior Bonds
4.95% due 04/15/2050 | | | 34,000 | | | | 41,356 | |
Hess Corp.
Senior Notes
6.00% due 01/15/2040 | | | 132,000 | | | | 157,568 | |
Hilcorp Energy I LP/Hilcorp Finance Co.
Senior Notes
5.75% due 02/01/2029* | | | 293,000 | | | | 295,564 | |
Hilcorp Energy I LP/Hilcorp Finance Co.
Senior Notes
6.00% due 02/01/2031* | | | 600,000 | | | | 609,000 | |
Indigo Natural Resources LLC
Senior Notes
5.38% due 02/01/2029* | | | 624,000 | | | | 614,771 | |
Marathon Oil Corp.
Senior Notes
6.60% due 10/01/2037 | | | 112,000 | | | | 139,211 | |
Marathon Oil Corp.
Senior Notes
6.80% due 03/15/2032 | | | 62,000 | | | | 77,209 | |
AIG Strategic Bond Fund
PORTFOLIO OF INVESTMENTS — March 31, 2021 — (continued)
| | | | | | | | |
| Security Description | |
Principal
Amount(19) | | |
Value
(Note 2) | |
| | | | | | | | |
U.S. CORPORATE BONDS & NOTES (continued) | |
Oil Companies-Exploration & Production (continued) | |
Occidental Petroleum Corp.
Senior Notes
5.88% due 09/01/2025 | | $ | 382,000 | | | $ | 407,308 | |
Occidental Petroleum Corp.
Senior Notes
6.13% due 01/01/2031 | | | 324,000 | | | | 357,761 | |
Occidental Petroleum Corp.
Senior Notes
6.38% due 09/01/2028 | | | 589,000 | | | | 646,489 | |
Occidental Petroleum Corp.
Senior Notes
7.50% due 05/01/2031 | | | 35,000 | | | | 40,705 | |
Range Resources Corp.
Company Guar. Notes
8.25% due 01/15/2029* | | | 378,000 | | | | 404,460 | |
| | | | | | |
|
|
|
| | | | | | | | 7,262,596 | |
| | | | | | |
|
|
|
Oil Companies-Integrated — 0.4% | |
BP Capital Markets America, Inc.
Company Guar. Notes
2.77% due 11/10/2050 | | | 135,000 | | | | 117,694 | |
BP Capital Markets America, Inc.
Company Guar. Notes
3.38% due 02/08/2061 | | | 97,000 | | | | 89,574 | |
BP Capital Markets America, Inc.
Company Guar. Notes
3.54% due 04/06/2027 | | | 232,000 | | | | 253,800 | |
Chevron Corp.
Senior Notes
1.55% due 05/11/2025 | | | 162,000 | | | | 165,242 | |
Chevron USA, Inc.
Company Guar. Notes
1.02% due 08/12/2027 | | | 59,000 | | | | 56,740 | |
Chevron USA, Inc.
Company Guar. Notes
4.20% due 10/15/2049 | | | 50,000 | | | | 56,771 | |
Chevron USA, Inc.
Company Guar. Notes
5.25% due 11/15/2043 | | | 91,000 | | | | 117,432 | |
Exxon Mobil Corp.
Senior Notes
1.41% due 06/26/2039 | | EUR | 125,000 | | | | 144,960 | |
Murphy Oil Corp.
Senior Notes
6.38% due 07/15/2028 | | | 586,000 | | | | 586,733 | |
| | | | | | |
|
|
|
| | | | | | | | 1,588,946 | |
| | | | | | |
|
|
|
Oil Refining & Marketing — 0.2% | |
PBF Holding Co. LLC/PBF Finance Corp.
Company Guar. Notes
6.00% due 02/15/2028 | | | 728,000 | | | | 537,810 | |
Valero Energy Corp.
Senior Notes
2.15% due 09/15/2027 | | | 62,000 | | | | 60,714 | |
| | | | | | |
|
|
|
| | | | | | | | 598,524 | |
| | | | | | |
|
|
|
| |
| | |
Oil-Field Services — 0.5% | |
Archrock Partners LP/Archrock Partners Finance Corp.
Company Guar. Notes
6.88% due 04/01/2027* | | $ | 616,000 | | | $ | 642,180 | |
ChampionX Corp
Company Guar. Notes
6.38% due 05/01/2026 | | | 495,000 | | | | 518,512 | |
Halliburton Co.
Senior Notes
2.92% due 03/01/2030 | | | 40,000 | | | | 39,937 | |
Halliburton Co.
Senior Notes
4.75% due 08/01/2043 | | | 47,000 | | | | 49,817 | |
Schlumberger Holdings Corp.
Senior Notes
4.00% due 12/21/2025* | | | 86,000 | | | | 95,100 | |
USA Compression Partners LP/USA Compression Finance Corp.
Company Guar. Notes
6.88% due 04/01/2026 | | | 592,000 | | | | 607,170 | |
| | | | | | |
|
|
|
| | | | | | | | 1,952,716 | |
| | | | | | |
|
|
|
Paper & Related Products — 0.4% | |
Clearwater Paper Corp.
Company Guar. Notes
4.75% due 08/15/2028* | | | 675,000 | | | | 680,063 | |
Domtar Corp.
Company Guar. Notes
6.75% due 02/15/2044 | | | 305,000 | | | | 384,774 | |
Georgia-Pacific LLC
Senior Notes
0.95% due 05/15/2026* | | | 320,000 | | | | 309,706 | |
| | | | | | |
|
|
|
| | | | | | | | 1,374,543 | |
| | | | | | |
|
|
|
Petrochemicals — 0.0% | |
Chevron Phillips Chemical Co. LLC/Chevron Phillips Chemical Co. LP
Senior Notes
3.30% due 05/01/2023* | | | 55,000 | | | | 57,875 | |
| | | | | | |
|
|
|
Pharmacy Services — 0.1% | |
Cigna Corp.
Senior Notes
3.40% due 03/15/2051 | | | 100,000 | | | | 98,158 | |
CVS Health Corp.
Senior Notes
2.70% due 08/21/2040 | | | 35,000 | | | | 32,149 | |
CVS Health Corp.
Senior Notes
4.25% due 04/01/2050 | | | 42,000 | | | | 47,004 | |
CVS Health Corp.
Senior Notes
4.78% due 03/25/2038 | | | 142,000 | | | | 167,623 | |
CVS Health Corp.
Senior Notes
5.05% due 03/25/2048 | | | 44,000 | | | | 53,847 | |
| | | | | | |
|
|
|
| | | | | | | | 398,781 | |
| | | | | | |
|
|
|
AIG Strategic Bond Fund
PORTFOLIO OF INVESTMENTS — March 31, 2021 — (continued)
| | | | | | | | |
| Security Description | |
Principal
Amount(19) | | |
Value
(Note 2) | |
| | | | | | | | |
U.S. CORPORATE BONDS & NOTES (continued) | |
Pipelines — 2.7% | |
Antero Midstream Partners LP/Antero Midstream Finance Corp.
Company Guar. Notes
5.75% due 01/15/2028* | | $ | 675,000 | | | $ | 674,156 | |
Buckeye Partners LP
Senior Notes
4.13% due 03/01/2025* | | | 248,000 | | | | 253,032 | |
Buckeye Partners LP
Senior Notes
4.50% due 03/01/2028* | | | 563,000 | | | | 564,407 | |
Cheniere Corpus Christi Holdings LLC
Senior Sec. Notes
3.70% due 11/15/2029 | | | 85,000 | | | | 89,530 | |
Cheniere Energy Partners LP
Company Guar. Notes
4.50% due 10/01/2029 | | | 392,000 | | | | 407,680 | |
Cheniere Energy, Inc.
Senior Sec. Notes
4.63% due 10/15/2028* | | | 432,000 | | | | 449,353 | |
Colorado Interstate Gas Co. LLC/Colorado Interstate Issuing Corp.
Company Guar. Notes
4.15% due 08/15/2026* | | | 49,000 | | | | 54,629 | |
DCP Midstream Operating LP
Company Guar. Notes
5.60% due 04/01/2044 | | | 165,000 | | | | 165,000 | |
DCP Midstream Operating LP
Company Guar. Notes
5.63% due 07/15/2027 | | | 294,000 | | | | 319,187 | |
DCP Midstream Operating LP
Company Guar. Notes
6.75% due 09/15/2037* | | | 130,000 | | | | 145,113 | |
Enable Midstream Partners LP
Senior Notes
4.95% due 05/15/2028 | | | 59,000 | | | | 65,006 | |
Energy Transfer Operating LP
Senior Notes
4.90% due 03/15/2035 | | | 125,000 | | | | 131,607 | |
Energy Transfer Operating LP
Senior Notes
6.13% due 12/15/2045 | | | 110,000 | | | | 125,600 | |
EnLink Midstream Partners LP
Senior Notes
5.05% due 04/01/2045 | | | 15,000 | | | | 11,603 | |
Enterprise Products Operating LLC
Company Guar. Notes
3.70% due 01/31/2051 | | | 89,000 | | | | 87,348 | |
Enterprise Products Operating LLC
Company Guar. Notes
4.25% due 02/15/2048 | | | 65,000 | | | | 68,864 | |
Genesis Energy LP/Genesis Energy Finance Corp.
Company Guar. Notes
5.63% due 06/15/2024 | | | 848,000 | | | | 828,920 | |
Genesis Energy LP/Genesis Energy Finance Corp.
Company Guar. Notes
6.50% due 10/01/2025 | | | 250,000 | | | | 245,062 | |
Genesis Energy LP/Genesis Energy Finance Corp.
Company Guar. Notes
8.00% due 01/15/2027 | | | 395,000 | | | | 399,945 | |
| |
| | |
Pipelines (continued) | |
Gray Oak Pipeline LLC
Senior Notes
2.00% due 09/15/2023* | | $ | 128,000 | | | $ | 130,283 | |
Gray Oak Pipeline LLC
Senior Notes
3.45% due 10/15/2027* | | | 75,000 | | | | 77,364 | |
Harvest Midstream I LP
Senior Notes
7.50% due 09/01/2028* | | | 823,000 | | | | 884,478 | |
Holly Energy Partners LP/Holly Energy Finance Corp.
Company Guar. Notes
5.00% due 02/01/2028* | | | 815,000 | | | | 825,432 | |
Kinder Morgan, Inc.
Company Guar. Notes
5.05% due 02/15/2046 | | | 78,000 | | | | 87,731 | |
MPLX LP
Senior Notes
2.65% due 08/15/2030 | | | 25,000 | | | | 24,481 | |
NGL Energy Operating LLC/NGL Energy Finance Corp.
Senior Sec. Notes
7.50% due 02/01/2026* | | | 800,000 | | | | 820,852 | |
NuStar Logistics LP
Company Guar. Notes
5.75% due 10/01/2025 | | | 252,000 | | | | 269,771 | |
NuStar Logistics LP
Company Guar. Notes
6.38% due 10/01/2030 | | | 379,000 | | | | 409,320 | |
ONEOK Partners LP
Company Guar. Notes
6.65% due 10/01/2036 | | | 163,000 | | | | 204,649 | |
Plains All American Pipeline LP/PAA Finance Corp.
Senior Notes
4.30% due 01/31/2043 | | | 39,000 | | | | 35,708 | |
Sunoco Logistics Partners Operations LP
Senior Notes
5.35% due 05/15/2045 | | | 14,000 | | | | 14,652 | |
Targa Resources Partners LP/Targa Resources Partners Finance Corp.
Company Guar. Notes
4.88% due 02/01/2031* | | | 499,000 | | | | 505,612 | |
Valero Energy Partners LP
Company Guar. Notes
4.38% due 12/15/2026 | | | 116,000 | | | | 129,980 | |
Williams Cos., Inc.
Senior Notes
5.75% due 06/24/2044 | | | 176,000 | | | | 215,398 | |
| | | | | | |
|
|
|
| | | | | | | | 9,721,753 | |
| | | | | | |
|
|
|
Poultry — 0.2% | |
Pilgrim’s Pride Corp.
Company Guar. Notes
5.88% due 09/30/2027* | | | 406,000 | | | | 435,110 | |
Simmons Foods, Inc.
Sec. Notes
4.63% due 03/01/2029* | | | 457,000 | | | | 461,008 | |
| | | | | | |
|
|
|
| | | | | | | | 896,118 | |
| | | | | | |
|
|
|
AIG Strategic Bond Fund
PORTFOLIO OF INVESTMENTS — March 31, 2021 — (continued)
| | | | | | | | |
| Security Description | |
Principal
Amount(19) | | |
Value
(Note 2) | |
| | | | | | | | |
U.S. CORPORATE BONDS & NOTES (continued) | | | | | | | | |
Protection/Safety — 0.3% | |
Prime Security Services Borrower LLC/Prime Finance, Inc.
Senior Sec. Notes
3.38% due 08/31/2027* | | $ | 480,000 | | | $ | 465,600 | |
Prime Security Services Borrower LLC/Prime Finance, Inc.
Senior Sec. Notes
5.25% due 04/15/2024* | | | 458,000 | | | | 488,594 | |
Prime Security Services Borrower LLC/Prime Finance, Inc.
Senior Sec. Notes
5.75% due 04/15/2026* | | | 230,000 | | | | 248,222 | |
| | | | | | |
|
|
|
| | | | | | | | 1,202,416 | |
| | | | | | |
|
|
|
Real Estate Investment Trusts — 2.3% | |
American Tower Corp.
Senior Notes
1.38% due 04/04/2025 | | EUR | 125,000 | | | | 152,993 | |
American Tower Corp.
Senior Notes
3.10% due 06/15/2050 | | | 78,000 | | | | 71,471 | |
Boston Properties LP
Senior Notes
2.55% due 04/01/2032 | | | 80,000 | | | | 76,629 | |
Brixmor Operating Partnership LP
Senior Notes
2.25% due 04/01/2028 | | | 41,000 | | | | 40,199 | |
Columbia Property Trust Operating Partnership LP
Company Guar. Notes
4.15% due 04/01/2025 | | | 90,000 | | | | 94,721 | |
CTR Partnership LP/CareTrust Capital Corp.
Company Guar. Notes
5.25% due 06/01/2025 | | | 575,000 | | | | 589,450 | |
ESH Hospitality, Inc.
Company Guar. Notes
4.63% due 10/01/2027* | | | 340,000 | | | | 359,598 | |
ESH Hospitality, Inc.
Company Guar. Notes
5.25% due 05/01/2025* | | | 270,000 | | | | 275,400 | |
Federal Realty Investment Trust
Senior Notes
1.25% due 02/15/2026 | | | 111,000 | | | | 109,554 | |
HAT Holdings I LLC/HAT Holdings II LLC
Company Guar. Notes
5.25% due 07/15/2024* | | | 522,000 | | | | 538,965 | |
HAT Holdings I LLC/HAT Holdings II LLC
Company Guar. Notes
6.00% due 04/15/2025* | | | 296,000 | | | | 312,280 | |
Hospitality Properties Trust
Senior Notes
4.38% due 02/15/2030 | | | 489,000 | | | | 449,244 | |
Host Hotels & Resorts LP
Senior Notes
3.50% due 09/15/2030 | | | 174,000 | | | | 174,094 | |
Ladder Capital Finance Holdings LLLP/Ladder Capital Finance Corp.
Company Guar. Notes
4.25% due 02/01/2027* | | | 873,000 | | | | 859,905 | |
| |
| | | | | | | | | |
Real Estate Investment Trusts (continued) | |
MGM Growth Properties Operating Partnership LP/MGP Finance Co-Issuer, Inc.
Company Guar. Notes
5.75% due 02/01/2027 | | $ | 515,000 | | | $ | 567,754 | |
MPT Operating Partnership LP/MPT Finance Corp.
Company Guar. Notes
3.50% due 03/15/2031 | | | 285,000 | | | | 279,489 | |
MPT Operating Partnership LP/MPT Finance Corp.
Company Guar. Notes
5.00% due 10/15/2027 | | | 576,000 | | | | 605,955 | |
National Health Investors, Inc.
Company Guar. Notes
3.00% due 02/01/2031 | | | 73,000 | | | | 68,182 | |
Omega Healthcare Investors, Inc.
Company Guar. Notes
3.25% due 04/15/2033 | | | 147,000 | | | | 141,123 | |
Omega Healthcare Investors, Inc.
Company Guar. Notes
3.38% due 02/01/2031 | | | 71,000 | | | | 70,371 | |
Park Intermediate Holdings LLC/PK Domestic Property LLC/PK Finance Co-Issuer
Senior Sec. Notes
5.88% due 10/01/2028* | | | 625,000 | | | | 662,656 | |
Piedmont Operating Partnership LP
Company Guar. Notes
3.15% due 08/15/2030 | | | 31,000 | | | | 30,155 | |
Public Storage
Senior Notes
0.88% due 01/24/2032 | | EUR | 160,000 | | | | 187,554 | |
Service Properties Trust
Senior Notes
4.75% due 10/01/2026 | | | 125,000 | | | | 121,875 | |
Service Properties Trust
Senior Notes
4.95% due 10/01/2029 | | | 80,000 | | | | 76,200 | |
Service Properties Trust
Senior Notes
5.25% due 02/15/2026 | | | 127,000 | | | | 127,317 | |
Service Properties Trust
Company Guar. Notes
5.50% due 12/15/2027 | | | 59,000 | | | | 62,374 | |
Spirit Realty LP
Company Guar. Notes
2.70% due 02/15/2032 | | | 57,000 | | | | 54,111 | |
Starwood Property Trust, Inc.
Senior Notes
4.75% due 03/15/2025 | | | 790,000 | | | | 820,241 | |
Starwood Property Trust, Inc.
Senior Notes
5.50% due 11/01/2023* | | | 129,000 | | | | 134,805 | |
VEREIT Operating Partnership LP
Company Guar. Notes
2.85% due 12/15/2032 | | | 46,000 | | | | 44,510 | |
Welltower, Inc.
Senior Notes
2.75% due 01/15/2031 | | | 4,000 | | | | 3,975 | |
Welltower, Inc.
Senior Notes
2.80% due 06/01/2031 | | | 172,000 | | | | 170,822 | |
| | | | | | |
|
|
|
| | | | | | | | 8,333,972 | |
| | | | | | |
|
|
|
AIG Strategic Bond Fund
PORTFOLIO OF INVESTMENTS — March 31, 2021 — (continued)
| | | | | | | | |
| Security Description | |
Principal
Amount(19) | | |
Value
(Note 2) | |
| | | | | | | | |
U.S. CORPORATE BONDS & NOTES (continued) | |
Real Estate Management/Services — 0.2% | | | | | | | | |
Cushman & Wakefield US Borrower LLC
Senior Sec. Notes
6.75% due 05/15/2028* | | $ | 511,000 | | | $ | 552,519 | |
Newmark Group, Inc.
Senior Notes
6.13% due 11/15/2023 | | | 290,000 | | | | 318,312 | |
| | | | | | |
|
|
|
| | | | | | | | 870,831 | |
| | | | | | |
|
|
|
Real Estate Operations & Development — 0.1% | | | | | | | | |
Kennedy-Wilson, Inc.
Company Guar. Notes
4.75% due 03/01/2029 | | | 483,000 | | | | 489,038 | |
| | | | | | |
|
|
|
Recycling — 0.2% | | | | | | | | |
Harsco Corp.
Company Guar. Notes
5.75% due 07/31/2027* | | | 638,000 | | | | 653,152 | |
| | | | | | |
|
|
|
Rental Auto/Equipment — 0.4% | | | | | | | | |
Ahern Rentals, Inc.
Sec. Notes
7.38% due 05/15/2023* | | | 725,000 | | | | 652,500 | |
Avis Budget Car Rental LLC/Avis Budget Finance, Inc.
Company Guar. Notes
5.38% due 03/01/2029* | | | 168,000 | | | | 173,783 | |
Avis Budget Car Rental LLC/Avis Budget Finance, Inc.
Company Guar. Notes
5.75% due 07/15/2027* | | | 508,000 | | | | 529,362 | |
NESCO Holdings II, Inc.
Sec. Notes
5.50% due 04/15/2029* | | | 226,000 | | | | 231,763 | |
| | | | | | |
|
|
|
| | | | | | | | 1,587,408 | |
| | | | | | |
|
|
|
Research & Development — 0.1% | | | | | | | | |
Jaguar Holding Co. II/PPD Development LP
Company Guar. Notes
4.63% due 06/15/2025* | | | 92,000 | | | | 95,680 | |
Jaguar Holding Co. II/PPD Development LP
Company Guar. Notes
5.00% due 06/15/2028* | | | 375,000 | | | | 390,563 | |
| | | | | | |
|
|
|
| | | | | | | | 486,243 | |
| | | | | | |
|
|
|
Resorts/Theme Parks — 0.3% | | | | | | | | |
SeaWorld Parks & Entertainment, Inc.
Senior Sec. Notes
8.75% due 05/01/2025* | | | 415,000 | | | | 449,237 | |
Six Flags Entertainment Corp.
Company Guar. Notes
5.50% due 04/15/2027* | | | 540,000 | | | | 559,575 | |
Six Flags Theme Parks, Inc.
Senior Sec. Notes
7.00% due 07/01/2025* | | | 48,000 | | | | 51,947 | |
| | | | | | |
|
|
|
| | | | | | | | 1,060,759 | |
| | | | | | |
|
|
|
Retail-Apparel/Shoe — 0.0% | | | | | | | | |
Ross Stores, Inc.
Senior Notes
1.88% due 04/15/2031 | | | 109,000 | | | | 102,091 | |
| | | | | | |
|
|
|
| |
| | |
Retail-Appliances — 0.1% | | | | | | | | |
Conn’s, Inc.
Company Guar. Notes
7.25% due 07/15/2022 | | $ | 464,000 | | | $ | 464,580 | |
| | | | | | |
|
|
|
Retail-Auto Parts — 0.0% | | | | | | | | |
Advance Auto Parts, Inc.
Company Guar. Notes
1.75% due 10/01/2027 | | | 64,000 | | | | 62,832 | |
| | | | | | |
|
|
|
Retail-Automobile — 0.1% | | | | | | | | |
Carvana Co.
Company Guar. Notes
5.50% due 04/15/2027* | | | 362,000 | | | | 363,901 | |
| | | | | | |
|
|
|
Retail-Convenience Store — 0.0% | |
7-Eleven, Inc.
Senior Notes
1.80% due 02/10/2031* | | | 109,000 | | | | 101,710 | |
| | | | | | |
|
|
|
Retail-Major Department Stores — 0.0% | |
Nordstrom, Inc.
Senior Notes
2.30% due 04/08/2024* | | | 36,000 | | | | 36,057 | |
Nordstrom, Inc.
Senior Notes
4.25% due 08/01/2031* | | | 30,000 | | | | 29,975 | |
| | | | | | |
|
|
|
| | | | | | | | 66,032 | |
| | | | | | |
|
|
|
Retail-Pawn Shops — 0.2% | |
FirstCash, Inc.
Company Guar. Notes
4.63% due 09/01/2028* | | | 627,000 | | | | 642,361 | |
| | | | | | |
|
|
|
Retail-Petroleum Products — 0.2% | |
Murphy Oil USA, Inc.
Company Guar. Notes
3.75% due 02/15/2031* | | | 55,000 | | | | 54,061 | |
Murphy Oil USA, Inc.
Company Guar. Notes
4.75% due 09/15/2029 | | | 569,000 | | | | 597,450 | |
| | | | | | |
|
|
|
| | | | | | | | 651,511 | |
| | | | | | |
|
|
|
Retail-Regional Department Stores — 0.1% | |
Kohl’s Corp.
Senior Notes
3.38% due 05/01/2031 | | | 54,000 | | | | 54,044 | |
Kohl’s Corp.
Senior Notes
5.55% due 07/17/2045 | | | 154,000 | | | | 174,052 | |
Kohl’s Corp.
Senior Notes
9.50% due 05/15/2025 | | | 39,000 | | | | 50,551 | |
| | | | | | |
|
|
|
| | | | | | | | 278,647 | |
| | | | | | |
|
|
|
Retail-Restaurants — 0.3% | |
Brinker International, Inc.
Company Guar. Notes
5.00% due 10/01/2024* | | | 344,000 | | | | 359,050 | |
Dave & Buster’s, Inc.
Senior Sec. Notes
7.63% due 11/01/2025* | | | 655,000 | | | | 700,031 | |
AIG Strategic Bond Fund
PORTFOLIO OF INVESTMENTS — March 31, 2021 — (continued)
| | | | | | | | |
| Security Description | |
Principal
Amount(19) | | |
Value
(Note 2) | |
| | | | | | | | |
U.S. CORPORATE BONDS & NOTES (continued) | |
Retail-Restaurants (continued) | |
McDonald’s Corp.
Senior Notes
3.63% due 09/01/2049 | | $ | 50,000 | | | $ | 51,815 | |
McDonald’s Corp.
Senior Notes
4.20% due 04/01/2050 | | | 48,000 | | | | 54,352 | |
| | | | | | |
|
|
|
| | | | | | | | 1,165,248 | |
| | | | | | |
|
|
|
Satellite Telecom — 0.2% | |
Hughes Satellite Systems Corp.
Company Guar. Notes
6.63% due 08/01/2026 | | | 805,000 | | | | 892,020 | |
| | | | | | |
|
|
|
Savings & Loans/Thrifts — 0.1% | |
First Niagara Financial Group, Inc.
Sub. Notes
7.25% due 12/15/2021 | | | 393,000 | | | | 411,265 | |
New York Community Bancorp, Inc.
Sub. Notes
5.90% due 11/06/2028 | | | 110,000 | | | | 119,092 | |
| | | | | | |
|
|
|
| | | | | | | | 530,357 | |
| | | | | | |
|
|
|
Security Services — 0.2% | |
Brink’s Co.
Company Guar. Notes
4.63% due 10/15/2027* | | | 711,000 | | | | 728,544 | |
Brink’s Co.
Company Guar. Notes
5.50% due 07/15/2025* | | | 68,000 | | | | 71,825 | |
| | | | | | |
|
|
|
| | | | | | | | 800,369 | |
| | | | | | |
|
|
|
Steel-Producers — 0.7% | |
Cleveland-Cliffs, Inc.
Company Guar. Notes
4.63% due 03/01/2029* | | | 344,000 | | | | 343,415 | |
Cleveland-Cliffs, Inc.
Company Guar. Notes
4.88% due 03/01/2031* | | | 106,000 | | | | 104,177 | |
Cleveland-Cliffs, Inc.
Company Guar. Notes
5.75% due 03/01/2025 | | | 392,000 | | | | 404,231 | |
Cleveland-Cliffs, Inc.
Senior Sec. Notes
6.75% due 03/15/2026* | | | 676,000 | | | | 735,150 | |
Commercial Metals Co.
Senior Notes
3.88% due 02/15/2031 | | | 668,000 | | | | 655,615 | |
Periama Holdings LLC
Company Guar. Notes
5.95% due 04/19/2026 | | | 300,000 | | | | 315,900 | |
Reliance Steel & Aluminum Co.
Senior Notes
2.15% due 08/15/2030 | | | 132,000 | | | | 126,576 | |
| | | | | | |
|
|
|
| | | | | | | | 2,685,064 | |
| | | | | | |
|
|
|
Telecom Equipment-Fiber Optics — 0.1% | |
Corning, Inc.
Senior Notes
5.45% due 11/15/2079 | | | 176,000 | | | | 218,102 | |
| | | | | | |
|
|
|
| |
| | |
Telephone-Integrated — 1.2% | |
AT&T, Inc.
Senior Notes
3.55% due 09/15/2055* | | $ | 39,000 | | | $ | 35,614 | |
AT&T, Inc.
Senior Notes
4.50% due 05/15/2035 | | | 460,000 | | | | 518,338 | |
AT&T, Inc.
Senior Notes
4.75% due 05/15/2046 | | | 37,000 | | | | 42,288 | |
AT&T, Inc.
Senior Notes
4.85% due 07/15/2045 | | | 42,000 | | | | 48,560 | |
AT&T, Inc.
Senior Notes
4.90% due 08/15/2037 | | | 47,000 | | | | 55,547 | |
CenturyLink, Inc.
Senior Notes
5.13% due 12/15/2026* | | | 484,000 | | | | 509,836 | |
CenturyLink, Inc.
Senior Notes
7.50% due 04/01/2024 | | | 525,000 | | | | 588,446 | |
Frontier Communications Corp.
Senior Sec. Notes
5.00% due 05/01/2028* | | | 645,000 | | | | 656,287 | |
Verizon Communications, Inc.
Senior Notes
0.38% due 03/22/2029 | | EUR | 255,000 | | | | 298,210 | |
Verizon Communications, Inc.
Senior Notes
1.13% due 09/19/2035 | | EUR | 127,000 | | | | 147,425 | |
Verizon Communications, Inc.
Senior Notes
1.50% due 09/18/2030 | | | 154,000 | | | | 141,250 | |
Verizon Communications, Inc.
Senior Notes
2.50% due 04/08/2031 | | GBP | 100,000 | | | | 143,965 | |
Verizon Communications, Inc.
Senior Notes
2.99% due 10/30/2056* | | | 156,000 | | | | 137,209 | |
Verizon Communications, Inc.
Senior Notes
3.55% due 03/22/2051 | | | 98,000 | | | | 97,566 | |
Verizon Communications, Inc.
Senior Notes
3.70% due 03/22/2061 | | | 124,000 | | | | 121,871 | |
Verizon Communications, Inc.
Senior Notes
4.27% due 01/15/2036 | | | 50,000 | | | | 56,458 | |
Verizon Communications, Inc.
Senior Notes
4.40% due 11/01/2034 | | | 98,000 | | | | 111,922 | |
Zayo Group Holdings, Inc.
Senior Notes
6.13% due 03/01/2028* | | | 646,000 | | | | 664,379 | |
| | | | | | |
|
|
|
| | | | | | | | 4,375,171 | |
| | | | | | |
|
|
|
Television — 0.4% | |
Belo Corp.
Company Guar. Notes
7.25% due 09/15/2027 | | | 373,000 | | | | 434,545 | |
AIG Strategic Bond Fund
PORTFOLIO OF INVESTMENTS — March 31, 2021 — (continued)
| | | | | | | | |
| Security Description | |
Principal
Amount(19) | | |
Value
(Note 2) | |
| | | | | | | | |
U.S. CORPORATE BONDS & NOTES (continued) | | | | | | | | |
Television (continued) | | | | | | | | |
Belo Corp.
Company Guar. Notes
7.75% due 06/01/2027 | | $ | 416,000 | | | $ | 484,640 | |
Gray Television, Inc.
Company Guar. Notes
4.75% due 10/15/2030* | | | 480,000 | | | | 475,800 | |
| | | | | | |
|
|
|
| | | | | | | | 1,394,985 | |
| | | | | | |
|
|
|
Theaters — 0.2% | |
Live Nation Entertainment, Inc.
Senior Sec. Notes
3.75% due 01/15/2028* | | | 120,000 | | | | 118,350 | |
Live Nation Entertainment, Inc.
Company Guar. Notes
4.75% due 10/15/2027* | | | 522,000 | | | | 525,915 | |
| | | | | | |
|
|
|
| | | | | | | | 644,265 | |
| | | | | | |
|
|
|
Tools-Hand Held — 0.0% | |
Stanley Black & Decker, Inc.
Senior Notes
3.40% due 03/01/2026 | | | 55,000 | | | | 60,319 | |
| | | | | | |
|
|
|
Transport-Air Freight — 0.3% | |
Cargo Aircraft Management, Inc.
Company Guar. Notes
4.75% due 02/01/2028* | | | 1,073,000 | | | | 1,106,531 | |
| | | | | | |
|
|
|
Transport-Equipment & Leasing — 0.0% | |
GATX Corp.
Senior Notes
4.35% due 02/15/2024 | | | 109,000 | | | | 119,346 | |
| | | | | | |
|
|
|
Transport-Marine — 0.0% | |
Kirby Corp.
Senior Notes
4.20% due 03/01/2028 | | | 89,000 | | | | 96,944 | |
| | | | | | |
|
|
|
Transport-Rail — 0.0% | |
Kansas City Southern
Company Guar. Notes
2.88% due 11/15/2029 | | | 70,000 | | | | 71,515 | |
Kansas City Southern
Company Guar. Notes
4.70% due 05/01/2048 | | | 37,000 | | | | 43,397 | |
| | | | | | |
|
|
|
| | | | | | | | 114,912 | |
| | | | | | |
|
|
|
Transport-Services — 0.1% | |
FedEx Corp. Pass Through Trust
Senior Sec. Notes
Series 2020-1, Class AA
1.88% due 08/20/2035 | | | 109,979 | | | | 106,434 | |
United Parcel Service, Inc.
Senior Notes
3.90% due 04/01/2025 | | | 66,000 | | | | 73,018 | |
| | | | | | |
|
|
|
| | | | | | | | 179,452 | |
| | | | | | |
|
|
|
Trucking/Leasing — 0.1% | |
Penske Truck Leasing Co. LP/PTL Finance Corp.
Senior Notes
3.40% due 11/15/2026* | | | 144,000 | | | | 155,590 | |
| |
| | |
Trucking/Leasing (continued) | |
Penske Truck Leasing Co. LP/PTL Finance Corp.
Senior Notes
4.20% due 04/01/2027* | | $ | 61,000 | | | $ | 68,234 | |
| | | | | | |
|
|
|
| | | | | | | | 223,824 | |
| | | | | | |
|
|
|
Vitamins & Nutrition Products — 0.3% | |
HLF Financing SARL LLC/Herbalife International, Inc.
Company Guar. Notes
7.25% due 08/15/2026* | | | 956,000 | | | | 1,001,410 | |
| | | | | | |
|
|
|
Water — 0.0% | |
Essential Utilities, Inc.
Senior Bonds
3.35% due 04/15/2050 | | | 58,000 | | | | 55,891 | |
| | | | | | |
|
|
|
Total U.S. Corporate Bonds & Notes | | | | | | | | |
(cost $133,840,365) | | | | | | | 138,649,417 | |
| | | | | | |
|
|
|
FOREIGN CORPORATE BONDS & NOTES — 16.8% | |
Agricultural Chemicals — 0.3% | |
Consolidated Energy Finance SA
Senior Notes
6.88% due 06/15/2025* | | | 520,000 | | | | 529,750 | |
OCI NV
Senior Sec. Notes
5.25% due 11/01/2024* | | | 588,000 | | | | 611,520 | |
| | | | | | |
|
|
|
| | | | | | | | 1,141,270 | |
| | | | | | |
|
|
|
Airlines — 0.2% | |
American Airlines, Inc./AAdvantage Loyalty IP, Ltd.
Senior Sec. Notes
5.50% due 04/20/2026* | | | 193,499 | | | | 201,722 | |
American Airlines, Inc./AAdvantage Loyalty IP, Ltd.
Senior Sec. Notes
5.75% due 04/20/2029* | | | 155,000 | | | | 165,199 | |
Hawaiian Brand Intellectual Property, Ltd./HawaiianMiles Loyalty, Ltd.
Senior Sec. Notes
5.75% due 01/20/2026* | | | 453,436 | | | | 481,912 | |
| | | | | | |
|
|
|
| | | | | | | | 848,833 | |
| | | | | | |
|
|
|
Airport Development/Maintenance — 0.1% | |
Heathrow Funding, Ltd.
Senior Sec. Notes
1.50% due 10/12/2027 | | EUR | 170,000 | | | | 208,168 | |
Heathrow Funding, Ltd.
Senior Sec. Notes
6.75% due 12/03/2028 | | GBP | 80,000 | | | | 139,029 | |
| | | | | | |
|
|
|
| | | | | | | | 347,197 | |
| | | | | | |
|
|
|
Appliances — 0.0% | |
Whirlpool EMEA Finance SARL
Company Guar. Notes
0.50% due 02/20/2028 | | EUR | 110,000 | | | | 127,450 | |
| | | | | | |
|
|
|
Auto-Cars/Light Trucks — 0.1% | |
RCI Banque SA
Senior Notes
1.75% due 04/10/2026 | | EUR | 120,000 | | | | 148,478 | |
AIG Strategic Bond Fund
PORTFOLIO OF INVESTMENTS — March 31, 2021 — (continued)
| | | | | | | | |
| Security Description | |
Principal
Amount(19) | | |
Value
(Note 2) | |
| | | | | | | | |
FOREIGN CORPORATE BONDS & NOTES (continued) | |
Auto-Cars/Light Trucks (continued) | | | | | | | | |
Volkswagen International Finance NV
Company Guar. Notes
4.13% due 11/16/2038 | | EUR | 100,000 | | | $ | 160,203 | |
| | | | | | |
|
|
|
| | | | | | | | 308,681 | |
| | | | | | |
|
|
|
Banks-Commercial — 1.3% | |
Akbank TAS
Senior Notes
6.80% due 02/06/2026 | | | 400,000 | | | | 398,432 | |
Banco de Credito del Peru
Sub. Notes
3.13% due 07/01/2030* | | | 300,000 | | | | 300,000 | |
Banco de Credito e Inversiones SA
Senior Notes
3.50% due 10/12/2027 | | | 490,000 | | | | 523,791 | |
Banco de Sabadell SA
Senior Notes
1.13% due 03/11/2027 | | EUR | 100,000 | | | | 120,367 | |
CaixaBank SA
Senior Notes
1.38% due 06/19/2026 | | EUR | 200,000 | | | | 244,138 | |
Canadian Imperial Bank of Commerce
Senior Notes
0.50% due 12/14/2023 | | | 80,000 | | | | 79,682 | |
Canadian Imperial Bank of Commerce
Senior Notes
0.95% due 10/23/2025 | | | 59,000 | | | | 57,838 | |
Canadian Imperial Bank of Commerce
Senior Notes
2.25% due 01/28/2025 | | | 155,000 | | | | 160,681 | |
Cooperatieve Rabobank UA
Senior Notes
1.00% due 09/24/2026* | | | 261,000 | | | | 255,944 | |
Danske Bank A/S
Sub. Notes
1.38% due 02/12/2030 | | EUR | 145,000 | | | | 172,745 | |
Danske Bank A/S
Senior Notes
2.25% due 01/14/2028 | | GBP | 100,000 | | | | 140,922 | |
Danske Bank A/S
Senior Notes
3.88% due 09/12/2023* | | | 200,000 | | | | 214,107 | |
Grupo Aval, Ltd.
Company Guar. Notes
4.38% due 02/04/2030* | | | 450,000 | | | | 453,937 | |
ING Groep NV
Senior Notes
1.40% due 07/01/2026* | | | 249,000 | | | | 247,617 | |
National Bank of Canada
Company Guar. Notes
0.55% due 11/15/2024 | | | 250,000 | | | | 249,352 | |
Philippine National Bank
Senior Notes
3.28% due 09/27/2024 | | | 600,000 | | | | 629,967 | |
Standard Chartered PLC
Senior Notes
0.90% due 07/02/2027 | | EUR | 150,000 | | | | 180,915 | |
Standard Chartered PLC
Sub. Notes
3.27% due 02/18/2036* | | | 200,000 | | | | 194,192 | |
| |
| | |
Banks-Commercial (continued) | |
Sumitomo Mitsui Trust Bank, Ltd.
Senior Notes
0.85% due 03/25/2024* | | $ | 235,000 | | | $ | 234,921 | |
| | | | | | |
|
|
|
| | | | | | | | 4,859,548 | |
| | | | | | |
|
|
|
Beverages-Non-alcoholic — 0.0% | |
Coca-Cola Femsa SAB de CV
Company Guar. Notes
1.85% due 09/01/2032 | | | 152,000 | | | | 138,913 | |
| | | | | | |
|
|
|
Building Products-Cement — 0.0% | |
Holcim Finance Luxembourg SA
Company Guar. Notes
0.50% due 04/23/2031 | | EUR | 125,000 | | | | 141,926 | |
| | | | | | |
|
|
|
Building-Residential/Commercial — 0.2% | |
Mattamy Group Corp.
Senior Notes
4.63% due 03/01/2030* | | | 215,000 | | | | 213,555 | |
Mattamy Group Corp.
Senior Notes
5.25% due 12/15/2027* | | | 339,000 | | | | 354,679 | |
| | | | | | |
|
|
|
| | | | | | | | 568,234 | |
| | | | | | |
|
|
|
Cable/Satellite TV — 0.3% | |
Altice Financing SA
Senior Sec. Notes
5.00% due 01/15/2028* | | | 1,065,000 | | | | 1,053,083 | |
| | | | | | |
|
|
|
Casino Hotels — 0.3% | |
Melco Resorts Finance, Ltd.
Senior Notes
5.38% due 12/04/2029* | | | 422,000 | | | | 448,286 | |
Wynn Macau, Ltd.
Senior Notes
5.13% due 12/15/2029* | | | 665,000 | | | | 681,625 | |
| | | | | | |
|
|
|
| | | | | | | | 1,129,911 | |
| | | | | | |
|
|
|
Cellular Telecom — 0.3% | |
Colombia Telecomunicaciones SA ESP
Senior Notes
4.95% due 07/17/2030* | | | 210,000 | | | | 221,025 | |
Numericable-SFR SA
Senior Sec. Notes
7.38% due 05/01/2026* | | | 800,000 | | | | 832,000 | |
Vodafone Group PLC
Senior Notes
4.88% due 06/19/2049 | | | 49,000 | | | | 58,093 | |
Vodafone Group PLC
Senior Notes
5.25% due 05/30/2048 | | | 71,000 | | | | 88,497 | |
| | | | | | |
|
|
|
| | | | | | | | 1,199,615 | |
| | | | | | |
|
|
|
Chemicals-Diversified — 0.3% | |
Braskem Netherlands Finance BV
Company Guar. Notes
4.50% due 01/31/2030* | | | 202,000 | | | | 202,944 | |
Braskem Netherlands Finance BV
Company Guar. Notes
4.50% due 01/31/2030 | | | 400,000 | | | | 401,868 | |
AIG Strategic Bond Fund
PORTFOLIO OF INVESTMENTS — March 31, 2021 — (continued)
| | | | | | | | |
| Security Description | |
Principal
Amount(19) | | |
Value
(Note 2) | |
| | | | | | | | |
FOREIGN CORPORATE BONDS & NOTES (continued) | |
Chemicals-Diversified (continued) | |
Trinseo Materials Operating SCA/Trinseo Materials Finance, Inc.
Company Guar. Notes
5.13% due 04/01/2029* | | $ | 429,000 | | | $ | 442,406 | |
| | | | | | |
|
|
|
| | | | | | | | 1,047,218 | |
| | | | | | |
|
|
|
Chemicals-Other — 0.1% | |
MEGlobal Canada ULC
Company Guar. Notes
5.00% due 05/18/2025* | | | 200,000 | | | | 222,250 | |
| | | | | | |
|
|
|
Chemicals-Specialty — 0.2% | |
Albemarle New Holding GmbH
Company Guar. Notes
1.63% due 11/25/2028 | | EUR | 125,000 | | | | 155,652 | |
Methanex Corp.
Senior Notes
5.13% due 10/15/2027 | | | 432,000 | | | | 441,720 | |
| | | | | | |
|
|
|
| | | | | | | | 597,372 | |
| | | | | | |
|
|
|
Computer Software — 0.1% | |
Camelot Finance SA
Senior Sec. Notes
4.50% due 11/01/2026* | | | 415,000 | | | | 429,077 | |
| | | | | | |
|
|
|
Computers — 0.0% | |
Dell Bank International DAC
Senior Notes
1.63% due 06/24/2024 | | EUR | 125,000 | | | | 152,891 | |
| | | | | | |
|
|
|
Containers-Metal/Glass — 0.2% | |
Trivium Packaging Finance BV
Company Guar. Notes
8.50% due 08/15/2027* | | | 650,000 | | | | 705,380 | |
| | | | | | |
|
|
|
Containers-Paper/Plastic — 0.4% | |
Cascades, Inc./Cascades USA, Inc.
Company Guar. Notes
5.38% due 01/15/2028* | | | 559,000 | | | | 586,950 | |
Intertape Polymer Group, Inc.
Company Guar. Notes
7.00% due 10/15/2026* | | | 674,000 | | | | 708,964 | |
| | | | | | |
|
|
|
| | | | | | | | 1,295,914 | |
| | | | | | |
|
|
|
Cruise Lines — 1.1% | |
Carnival Corp.
Senior Notes
5.75% due 03/01/2027* | | | 825,000 | | | | 848,067 | |
Carnival Corp.
Senior Notes
7.63% due 03/01/2026* | | | 133,000 | | | | 142,882 | |
NCL Corp., Ltd.
Senior Notes
3.63% due 12/15/2024* | | | 920,000 | | | | 868,250 | |
NCL Corp., Ltd.
Company Guar. Notes
5.88% due 03/15/2026* | | | 236,000 | | | | 239,160 | |
Royal Caribbean Cruises, Ltd.
Senior Notes
5.50% due 04/01/2028* | | | 151,000 | | | | 151,868 | |
Silversea Cruise Finance, Ltd.
Senior Sec. Notes
7.25% due 02/01/2025* | | | 765,000 | | | | 791,775 | |
| |
| | |
Cruise Lines (continued) | |
Viking Ocean Cruises Ship VII, Ltd.
Senior Sec. Notes
5.63% due 02/15/2029* | | $ | 113,000 | | | $ | 114,164 | |
VOC Escrow, Ltd.
Senior Sec. Notes
5.00% due 02/15/2028* | | | 899,000 | | | | 888,095 | |
| | | | | | |
|
|
|
| | | | | | | | 4,044,261 | |
| | | | | | |
|
|
|
Diversified Banking Institutions — 1.7% | |
Banco Santander SA
Senior Notes
1.38% due 01/05/2026 | | EUR | 200,000 | | | | 245,640 | |
Banco Santander SA
Senior Notes
2.71% due 06/27/2024 | | | 200,000 | | | | 211,014 | |
Barclays PLC
Senior Notes
0.75% due 06/09/2025 | | EUR | 100,000 | | | | 118,989 | |
Barclays PLC
Senior Notes
3.00% due 05/08/2026 | | GBP | 100,000 | | | | 147,061 | |
Barclays PLC
Sub. Notes
3.56% due 09/23/2035 | | | 200,000 | | | | 200,288 | |
BNP Paribas SA
Senior Notes
0.50% due 09/01/2028 | | EUR | 200,000 | | | | 233,578 | |
BNP Paribas SA
Senior Notes
1.32% due 01/13/2027* | | | 212,000 | | | | 207,242 | |
BNP Paribas SA
Senior Notes
3.38% due 01/23/2026 | | GBP | 100,000 | | | | 150,773 | |
Credit Agricole SA
Senior Notes
0.13% due 12/09/2027 | | EUR | 200,000 | | | | 230,225 | |
Credit Agricole SA
Sub. Notes
2.81% due 01/11/2041* | | | 250,000 | | | | 225,546 | |
Credit Suisse Group AG
Senior Notes
3.25% due 04/02/2026 | | EUR | 100,000 | | | | 129,860 | |
Deutsche Bank AG
Senior Notes
1.00% due 11/19/2025 | | EUR | 200,000 | | | | 238,018 | |
Deutsche Bank AG
Senior Notes
1.75% due 11/19/2030 | | EUR | 100,000 | | | | 121,338 | |
Deutsche Bank AG
Senior Notes
2.22% due 09/18/2024 | | | 150,000 | | | | 153,963 | |
HSBC Holdings PLC
Senior Notes
1.59% due 05/24/2027 | | | 200,000 | | | | 196,719 | |
HSBC Holdings PLC
Sub. Notes
3.00% due 06/30/2025 | | EUR | 200,000 | | | | 259,670 | |
HSBC Holdings PLC
Senior Notes
3.00% due 07/22/2028 | | GBP | 120,000 | | | | 177,513 | |
AIG Strategic Bond Fund
PORTFOLIO OF INVESTMENTS — March 31, 2021 — (continued)
| | | | | | | | |
| Security Description | |
Principal
Amount(19) | | |
Value
(Note 2) | |
| | | | | | | | |
FOREIGN CORPORATE BONDS & NOTES (continued) | |
Diversified Banking Institutions (continued) | |
HSBC Holdings PLC
Senior Notes
4.29% due 09/12/2026 | | $ | 200,000 | | | $ | 221,096 | |
Mitsubishi UFJ Financial Group, Inc.
Senior Notes
2.19% due 02/25/2025 | | | 207,000 | | | | 213,443 | |
Mizuho Financial Group, Inc.
Senior Notes
2.56% due 09/13/2025 | | | 474,000 | | | | 495,733 | |
Natwest Group PLC
Senior Notes
1.75% due 03/02/2026 | | EUR | 275,000 | | | | 340,262 | |
Natwest Group PLC
Sub. Notes
3.03% due 11/28/2035 | | | 400,000 | | | | 381,632 | |
Royal Bank of Scotland Group PLC
Senior Notes
2.36% due 05/22/2024 | | | 222,000 | | | | 229,034 | |
UBS Group AG
Senior Notes
0.25% due 11/05/2028 | | EUR | 200,000 | | | | 231,256 | |
UniCredit SpA
Senior Notes
1.25% due 06/16/2026 | | EUR | 235,000 | | | | 284,000 | |
UniCredit SpA
Sub. Bonds
5.46% due 06/30/2035* | | | 498,000 | | | | 527,509 | |
| | | | | | |
|
|
|
| | | | | | | | 6,171,402 | |
| | | | | | |
|
|
|
Diversified Financial Services — 0.4% | |
Fairstone Financial, Inc.
Senior Notes
7.88% due 07/15/2024* | | | 582,000 | | | | 611,100 | |
GE Capital European Funding
Company Guar. Notes
6.03% due 03/01/2038 | | EUR | 145,000 | | | | 274,566 | |
GE Capital International Funding Co. ULC
Company Guar. Notes
4.42% due 11/15/2035 | | | 473,000 | | | | 542,113 | |
| | | | | | |
|
|
|
| | | | | | | | 1,427,779 | |
| | | | | | |
|
|
|
Diversified Minerals — 0.3% | |
FMG Resources August 2006 Pty., Ltd.
Company Guar. Notes
4.38% due 04/01/2031* | | | 339,000 | | | | 345,356 | |
FMG Resources August 2006 Pty., Ltd.
Company Guar. Notes
4.50% due 09/15/2027* | | | 636,000 | | | | 679,528 | |
Teck Resources, Ltd.
Senior Notes
6.25% due 07/15/2041 | | | 160,000 | | | | 196,509 | |
| | | | | | |
|
|
|
| | | | | | | | 1,221,393 | |
| | | | | | |
|
|
|
Electric-Distribution — 0.3% | |
Energuate Trust
Company Guar. Notes
5.88% due 05/03/2027 | | | 500,000 | | | | 528,400 | |
| |
| | |
Electric-Distribution (continued) | |
Infraestructura Energetica Nova SAB de CV
Senior Notes
4.75% due 01/15/2051* | | $ | 250,000 | | | $ | 248,437 | |
National Grid PLC
Senior Notes
0.16% due 01/20/2028 | | EUR | 200,000 | | | | 230,166 | |
OmGrid Funding, Ltd.
Company Guar. Notes
5.20% due 05/16/2027 | | | 200,000 | | | | 205,500 | |
| | | | | | |
|
|
|
| | | | | | | | 1,212,503 | |
| | | | | | |
|
|
|
Electric-Generation — 0.5% | |
ACEA SpA
Senior Notes
1.50% due 06/08/2027 | | EUR | 130,000 | | | | 163,553 | |
Electricite de France SA
Senior Notes
6.13% due 06/02/2034 | | GBP | 100,000 | | | | 197,199 | |
LLPL Capital Pte, Ltd.
Senior Sec. Notes
6.88% due 02/04/2039 | | | 364,800 | | | | 425,174 | |
Minejesa Capital BV
Senior Sec. Notes
5.63% due 08/10/2037 | | | 300,000 | | | | 313,875 | |
Mong Duong Finance Holdings BV
Senior Sec. Notes
5.13% due 05/07/2029 | | | 550,000 | | | | 552,750 | |
Orsted AS
Senior Notes
2.50% due 05/16/2033 | | GBP | 100,000 | | | | 146,813 | |
SPIC Luxembourg Latin America Renewable Energy Investment Co. SARL
Company Guar. Notes
4.65% due 10/30/2023 | | | 200,000 | | | | 216,208 | |
| | | | | | |
|
|
|
| | | | | | | | 2,015,572 | |
| | | | | | |
|
|
|
Electric-Integrated — 0.3% | |
E.ON International Finance BV
Company Guar. Notes
6.25% due 06/03/2030 | | GBP | 100,000 | | | | 185,972 | |
Empresas Publicas de Medellin ESP
Senior Notes
4.25% due 07/18/2029 | | | 400,000 | | | | 405,000 | |
Empresas Publicas de Medellin ESP
Senior Notes
4.38% due 02/15/2031* | | | 320,000 | | | | 320,960 | |
Fortum Oyj
Senior Notes
1.63% due 02/27/2026 | | EUR | 190,000 | | | | 237,963 | |
| | | | | | |
|
|
|
| | | | | | | | 1,149,895 | |
| | | | | | |
|
|
|
Electric-Transmission — 0.1% | |
Transelec SA
Senior Notes
4.25% due 01/14/2025 | | | 400,000 | | | | 436,000 | |
| | | | | | |
|
|
|
Energy-Alternate Sources — 0.2% | |
Greenko Solar Mauritius, Ltd.
Senior Sec. Notes
5.95% due 07/29/2026 | | | 400,000 | | | | 427,600 | |
AIG Strategic Bond Fund
PORTFOLIO OF INVESTMENTS — March 31, 2021 — (continued)
| | | | | | | | |
| Security Description | |
Principal
Amount(19) | | |
Value
(Note 2) | |
| | | | | | | | |
FOREIGN CORPORATE BONDS & NOTES (continued) | |
Energy-Alternate Sources (continued) | |
ReNew Power Synthetic
Senior Sec. Notes
6.67% due 03/12/2024 | | $ | 200,000 | | | $ | 209,800 | |
ReNew Power, Ltd.
Senior Sec. Notes
6.45% due 09/27/2022 | | | 200,000 | | | | 207,260 | |
| | | | | | |
|
|
|
| | | | | | | | 844,660 | |
| | | | | | |
|
|
|
Finance-Consumer Loans — 0.1% | |
goeasy, Ltd.
Company Guar. Notes
5.38% due 12/01/2024* | | | 533,000 | | | | 552,321 | |
| | | | | | |
|
|
|
Finance-Leasing Companies — 0.2% | |
BOC Aviation, Ltd.
Senior Notes
2.63% due 09/17/2030* | | | 580,000 | | | | 557,818 | |
| | | | | | |
|
|
|
Food-Meat Products — 0.2% | |
BRF SA
Senior Notes
4.88% due 01/24/2030* | | | 200,000 | | | | 204,000 | |
Minerva Luxembourg SA
Company Guar. Notes
4.38% due 03/18/2031* | | | 400,000 | | | | 391,000 | |
| | | | | | |
|
|
|
| | | | | | | | 595,000 | |
| | | | | | |
|
|
|
Food-Retail — 0.0% | |
Auchan Holding SA
Senior Notes
3.25% due 07/23/2027 | | EUR | 100,000 | | | | 135,850 | |
| | | | | | |
|
|
|
Gold Mining — 0.1% | |
AngloGold Ashanti Holdings PLC
Company Guar. Notes
3.75% due 10/01/2030 | | | 208,000 | | | | 210,151 | |
| | | | | | |
|
|
|
Industrial Gases — 0.1% | |
Yingde Gases Investment, Ltd.
Company Guar. Notes
6.25% due 01/19/2023 | | | 300,000 | | | | 310,229 | |
| | | | | | |
|
|
|
Insurance-Life/Health — 0.0% | |
Athene Holding, Ltd.
Senior Notes
3.50% due 01/15/2031 | | | 44,000 | | | | 45,185 | |
Manulife Financial Corp.
Sub. Notes
4.06% due 02/24/2032 | | | 71,000 | | | | 77,966 | |
| | | | | | |
|
|
|
| | | | | | | | 123,151 | |
| | | | | | |
|
|
|
Insurance-Property/Casualty — 0.0% | |
Enstar Group, Ltd.
Senior Notes
4.95% due 06/01/2029 | | | 163,000 | | | | 182,079 | |
| | | | | | |
|
|
|
Insurance-Reinsurance — 0.1% | |
Fairfax Financial Holdings, Ltd.
Senior Notes
2.75% due 03/29/2028 | | EUR | 160,000 | | | | 202,890 | |
Fairfax Financial Holdings, Ltd.
Senior Notes
3.38% due 03/03/2031* | | | 40,000 | | | | 39,820 | |
| | | | | | |
|
|
|
| | | | | | | | 242,710 | |
| | | | | | |
|
|
|
| |
| | | | | | | | | |
Investment Companies — 0.4% | |
Huarong Finance II Co., Ltd.
Company Guar. Notes
3.75% due 05/29/2024 | | $ | 230,000 | | | $ | 241,644 | |
Huarong Finance II Co., Ltd.
Company Guar. Notes
4.63% due 06/03/2026 | | | 400,000 | | | | 432,540 | |
JAB Holdings BV
Company Guar. Notes
2.50% due 06/25/2029 | | EUR | 200,000 | | | | 265,944 | |
MDGH — GMTN BV
Company Guar. Notes
3.70% due 11/07/2049 | | | 400,000 | | | | 408,500 | |
| | | | | | |
|
|
|
| | | | | | | | 1,348,628 | |
| | | | | | |
|
|
|
Medical Products — 0.0% | |
STERIS PLC
Company Guar. Notes
3.75% due 03/15/2051 | | | 105,000 | | | | 104,911 | |
| | | | | | |
|
|
|
Medical-Drugs — 0.4% | |
Bayer AG
Senior Notes
1.38% due 07/06/2032 | | EUR | 100,000 | | | | 120,121 | |
Endo Dac/Endo Finance LLC/Endo Finco, Inc.
Senior Sec. Notes
5.88% due 10/15/2024* | | | 400,000 | | | | 402,000 | |
Endo Dac/Endo Finance LLC/Endo Finco, Inc.
Company Guar. Notes
6.00% due 06/30/2028* | | | 285,000 | | | | 230,850 | |
Shire Acquisitions Investments Ireland DAC
Company Guar. Notes
3.20% due 09/23/2026 | | | 171,000 | | | | 184,142 | |
Takeda Pharmaceutical Co., Ltd.
Senior Notes
1.38% due 07/09/2032 | | EUR | 205,000 | | | | 250,842 | |
Takeda Pharmaceutical Co., Ltd.
Senior Bonds
3.18% due 07/09/2050 | | | 204,000 | | | | 193,291 | |
Upjohn Finance BV
Company Guar. Notes
1.91% due 06/23/2032 | | EUR | 100,000 | | | | 125,751 | |
| | | | | | |
|
|
|
| | | | | | | | 1,506,997 | |
| | | | | | |
|
|
|
Metal-Aluminum — 0.1% | |
Indonesia Asahan Aluminium Persero PT
Senior Notes
6.53% due 11/15/2028 | | | 400,000 | | | | 481,500 | |
| | | | | | |
|
|
|
Metal-Copper — 0.2% | |
First Quantum Minerals, Ltd.
Company Guar. Notes
6.50% due 03/01/2024* | | | 200,000 | | | | 203,000 | |
First Quantum Minerals, Ltd.
Company Guar. Notes
6.88% due 03/01/2026* | | | 401,000 | | | | 415,035 | |
| | | | | | |
|
|
|
| | | | | | | | 618,035 | |
| | | | | | |
|
|
|
AIG Strategic Bond Fund
PORTFOLIO OF INVESTMENTS — March 31, 2021 — (continued)
| | | | | | | | |
| Security Description | |
Principal
Amount(19) | | |
Value
(Note 2) | |
| | | | | | | | |
FOREIGN CORPORATE BONDS & NOTES (continued) | |
Metal-Diversified — 0.0% | |
Glencore Capital Finance DAC
Company Guar. Notes
1.13% due 03/10/2028 | | EUR | 100,000 | | | $ | 119,220 | |
| | | | | | |
|
|
|
Metal-Iron — 0.2% | |
Mineral Resources, Ltd.
Senior Notes
8.13% due 05/01/2027* | | | 600,000 | | | | 663,306 | |
| | | | | | |
|
|
|
Motion Pictures & Services — 0.2% | |
Banijay Entertainment SASU
Senior Sec. Notes
5.38% due 03/01/2025* | | | 847,000 | | | | 874,527 | |
| | | | | | |
|
|
|
Multimedia — 0.1% | |
Globo Comunicacao e Participacoes SA
Senior Notes
4.88% due 01/22/2030* | | | 400,000 | | | | 403,000 | |
| | | | | | |
|
|
|
Oil Companies-Exploration & Production — 0.6% | |
Canadian Natural Resources, Ltd.
Senior Notes
2.95% due 07/15/2030 | | | 64,000 | | | | 63,790 | |
MEG Energy Corp.
Sec. Notes
6.50% due 01/15/2025* | | | 988,000 | | | | 1,020,555 | |
MEG Energy Corp.
Company Guar. Notes
7.13% due 02/01/2027* | | | 391,000 | | | | 409,572 | |
Oil India, Ltd.
Senior Notes
5.13% due 02/04/2029 | | | 400,000 | | | | 443,906 | |
Saka Energi Indonesia PT
Senior Notes
4.45% due 05/05/2024 | | | 425,000 | | | | 375,062 | |
| | | | | | |
|
|
|
| | | | | | | | 2,312,885 | |
| | | | | | |
|
|
|
Oil Companies-Integrated — 1.5% | |
BP Capital Markets PLC
Company Guar. Notes
0.83% due 11/08/2027 | | EUR | 125,000 | | | | 151,353 | |
BP Capital Markets PLC
Company Guar. Notes
2.27% due 07/03/2026 | | GBP | 100,000 | | | | 145,346 | |
Ecopetrol SA
Senior Notes
5.88% due 05/28/2045 | | | 270,000 | | | | 288,090 | |
Ecopetrol SA
Senior Notes
6.88% due 04/29/2030 | | | 300,000 | | | | 365,220 | |
Lukoil Securities BV
Company Guar. Notes
3.88% due 05/06/2030 | | | 400,000 | | | | 412,520 | |
Pertamina Persero PT
Senior Notes
6.50% due 05/27/2041 | | | 200,000 | | | | 247,951 | |
Petro-Canada
Senior Notes
5.95% due 05/15/2035 | | | 37,000 | | | | 46,207 | |
| |
| | |
Oil Companies-Integrated (continued) | |
Petrobras Global Finance BV
Company Guar. Notes
5.60% due 01/03/2031 | | $ | 400,000 | | | $ | 421,520 | |
Petroleos Mexicanos
Company Guar. Notes
5.35% due 02/12/2028 | | | 320,000 | | | | 311,168 | |
Petroleos Mexicanos
Company Guar. Notes
6.38% due 01/23/2045 | | | 350,000 | | | | 290,500 | |
Petroleos Mexicanos
Company Guar. Notes
6.49% due 01/23/2027 | | | 350,000 | | | | 365,715 | |
Petroleos Mexicanos
Company Guar. Notes
6.50% due 03/13/2027 | | | 220,000 | | | | 229,900 | |
Petroleos Mexicanos
Company Guar. Notes
6.63% due 06/15/2035 | | | 350,000 | | | | 332,500 | |
Petroleos Mexicanos
Company Guar. Notes
6.63% due 06/15/2035 | | | 400,000 | | | | 380,000 | |
Petroleos Mexicanos
Company Guar. Notes
6.75% due 09/21/2047 | | | 560,000 | | | | 480,278 | |
Petroleos Mexicanos
Company Guar. Notes
6.84% due 01/23/2030 | | | 800,000 | | | | 811,920 | |
Shell International Finance BV
Company Guar. Notes
1.50% due 04/07/2028 | | EUR | 140,000 | | | | 178,568 | |
Total Capital International SA
Company Guar. Notes
3.46% due 07/12/2049 | | | 46,000 | | | | 45,985 | |
| | | | | | |
|
|
|
| | | | | | | | 5,504,741 | |
| | | | | | |
|
|
|
Paper & Related Products — 0.3% | |
Inversiones CMPC SA
Company Guar. Notes
3.00% due 04/06/2031* | | | 200,000 | | | | 198,546 | |
Suzano Austria GmbH
Company Guar. Notes
3.75% due 01/15/2031 | | | 700,000 | | | | 723,625 | |
| | | | | | |
|
|
|
| | | | | | | | 922,171 | |
| | | | | | |
|
|
|
Petrochemicals — 0.1% | |
Equate Petrochemical BV
Company Guar. Notes
4.25% due 11/03/2026 | | | 200,000 | | | | 217,330 | |
| | | | | | |
|
|
|
Pipelines — 0.2% | |
AI Candelaria Spain SLU
Senior Sec. Notes
7.50% due 12/15/2028 | | | 400,000 | | | | 451,000 | |
Galaxy Pipeline Assets Bidco, Ltd.
Senior Sec. Notes
2.63% due 03/31/2036 | | | 300,000 | | | | 286,860 | |
| | | | | | |
|
|
|
| | | | | | | | 737,860 | |
| | | | | | |
|
|
|
AIG Strategic Bond Fund
PORTFOLIO OF INVESTMENTS — March 31, 2021 — (continued)
| | | | | | | | |
| Security Description | |
Principal
Amount(19) | | |
Value
(Note 2) | |
| | | | | | | | |
FOREIGN CORPORATE BONDS & NOTES (continued) | |
Real Estate Investment Trusts — 0.2% | |
Digital Dutch Finco BV
Company Guar. Notes
0.63% due 07/15/2025 | | EUR | 125,000 | | | $ | 149,475 | |
Scentre Group Trust 1/Scentre Group Trust 2
Company Guar. Notes
1.45% due 03/28/2029 | | EUR | 135,000 | | | | 166,895 | |
Unibail-Rodamco-Westfield SE
Company Guar. Notes
1.13% due 09/15/2025 | | EUR | 200,000 | | | | 241,952 | |
| | | | | | |
|
|
|
| | | | | | | | 558,322 | |
| | | | | | |
|
|
|
Real Estate Operations & Development — 0.2% | |
Aroundtown SA
Senior Notes
0.63% due 07/09/2025 | | EUR | 100,000 | | | | 118,940 | |
Aroundtown SA
Senior Notes
1.45% due 07/09/2028 | | EUR | 200,000 | | | | 244,414 | |
Aroundtown SA
Senior Notes
3.25% due 07/18/2027 | | GBP | 100,000 | | | | 147,755 | |
Logicor Financing Sarl
Company Guar. Notes
0.75% due 07/15/2024 | | EUR | 165,000 | | | | 196,791 | |
Samhallsbyggnadsbolaget i Norden AB
Senior Notes
1.75% due 01/14/2025 | | EUR | 120,000 | | | | 147,200 | |
| | | | | | |
|
|
|
| | | | | | | | 855,100 | |
| | | | | | |
|
|
|
Retail-Petroleum Products — 0.2% | |
eG Global Finance PLC
Senior Sec. Notes
6.75% due 02/07/2025* | | | 633,000 | | | | 647,242 | |
| | | | | | |
|
|
|
Satellite Telecom — 0.5% | |
Connect Finco SARL/Connect US Finco LLC
Senior Sec. Notes
6.75% due 10/01/2026* | | | 939,000 | | | | 999,791 | |
Telesat Canada/Telesat LLC
Senior Sec. Notes
4.88% due 06/01/2027* | | | 214,000 | | | | 214,000 | |
Telesat Canada/Telesat LLC
Company Guar. Notes
6.50% due 10/15/2027* | | | 767,000 | | | | 768,319 | |
| | | | | | |
|
|
|
| | | | | | | | 1,982,110 | |
| | | | | | |
|
|
|
Security Services — 0.2% | |
Garda World Security Corp.
Senior Sec. Notes
4.63% due 02/15/2027* | | | 655,000 | | | | 655,000 | |
| | | | | | |
|
|
|
Semiconductor Components-Integrated Circuits — 0.1% | |
TSMC Global, Ltd.
Company Guar. Notes
0.75% due 09/28/2025* | | | 200,000 | | | | 195,178 | |
| | | | | | |
|
|
|
Steel-Producers — 0.1% | |
Shandong Iron & Steel Xinheng International Co., Ltd.
Company Guar. Notes
6.85% due 09/25/2022 | | | 200,000 | | | | 202,097 | |
| | | | | | |
|
|
|
| |
| | |
SupraNational Banks — 0.2% | |
European Bank for Reconstruction & Development
Senior Notes
1.50% due 02/13/2025 | | $ | 165,000 | | | $ | 169,975 | |
International Bank for Reconstruction & Development
Senior Notes
0.75% due 11/24/2027 | | | 164,000 | | | | 156,893 | |
International Bank for Reconstruction & Development
Senior Notes
3.13% due 11/20/2025 | | | 88,000 | | | | 96,667 | |
International Finance Corp.
Senior Notes
0.50% due 03/20/2023 | | | 186,000 | | | | 186,604 | |
| | | | | | |
|
|
|
| | | | | | | | 610,139 | |
| | | | | | |
|
|
|
Telecom Services — 0.2% | |
Altice France Holding SA
Company Guar. Notes
6.00% due 02/15/2028* | | | 630,000 | | | | 620,733 | |
NTT Finance Corp.
Company Guar. Notes
0.34% due 03/03/2030* | | EUR | 125,000 | | | | 146,262 | |
| | | | | | |
|
|
|
| | | | | | | | 766,995 | |
| | | | | | |
|
|
|
Telephone-Integrated — 0.1% | |
Telefonica Emisiones SAU
Company Guar. Notes
5.21% due 03/08/2047 | | | 230,000 | | | | 268,953 | |
| | | | | | |
|
|
|
Transport-Rail — 0.0% | |
Canadian Pacific Railway Co.
Company Guar. Notes
6.13% due 09/15/2115 | | | 61,000 | | | | 88,349 | |
| | | | | | |
|
|
|
Transport-Services — 0.2% | |
Rumo Luxembourg SARL
Company Guar. Notes
5.25% due 01/10/2028* | | | 290,000 | | | | 304,854 | |
Yunda Holding Investment, Ltd.
Company Guar. Notes
2.25% due 08/19/2025 | | | 440,000 | | | | 435,032 | |
| | | | | | |
|
|
|
| | | | | | | | 739,886 | |
| | | | | | |
|
|
|
Vitamins & Nutrition Products — 0.1% | |
Herbalife Nutrition, Ltd./HLF Financing, Inc.
Company Guar. Notes
7.88% due 09/01/2025* | | | 190,000 | | | | 206,625 | |
| | | | | | |
|
|
|
Warehousing & Harbor Transportation Services — 0.1% | |
DP World PLC
Senior Notes
4.70% due 09/30/2049 | | | 400,000 | | | | 416,732 | |
| | | | | | |
|
|
|
Total Foreign Corporate Bonds & Notes | | | | | | | | |
(cost $60,864,545) | | | | | | | 61,755,376 | |
| | | | | | |
|
|
|
FOREIGN GOVERNMENT OBLIGATIONS — 18.2% | |
Banks-Special Purpose — 0.1% | |
Industrial Bank of Korea
Senior Notes
1.04% due 06/22/2025* | | | 312,000 | | | | 308,877 | |
AIG Strategic Bond Fund
PORTFOLIO OF INVESTMENTS — March 31, 2021 — (continued)
| | | | | | | | |
| Security Description | |
Principal
Amount(19) | | |
Value
(Note 2) | |
| | | | | | | | |
FOREIGN GOVERNMENT OBLIGATIONS (continued) | |
Banks-Special Purpose (continued) | | | | | | | | |
Korea Development Bank
Senior Notes
0.50% due 10/27/2023 | | $ | 200,000 | | | $ | 199,984 | |
| | | | | | |
|
|
|
| | | | | | | | 508,861 | |
| | | | | | |
|
|
|
Regional Agencies — 0.1% | |
Kommunekredit
Senior Notes
0.01% due 08/27/2030 | | EUR | 260,000 | | | | 303,088 | |
| | | | | | |
|
|
|
Regional Authority — 0.1% | |
Province of Quebec, Canada
Senior Notes
0.01% due 10/15/2029 | | EUR | 385,000 | | | | 447,670 | |
| | | | | | |
|
|
|
Sovereign — 17.8% | |
Arab Republic of Egypt
Senior Notes
5.75% due 05/29/2024* | | | 550,000 | | | | 576,609 | |
Arab Republic of Egypt
Senior Notes
7.05% due 01/15/2032* | | | 370,000 | | | | 364,704 | |
Arab Republic of Egypt
Senior Notes
7.60% due 03/01/2029 | | | 1,000,000 | | | | 1,063,620 | |
Arab Republic of Egypt
Senior Notes
8.50% due 01/31/2047 | | | 1,000,000 | | | | 993,800 | |
Dominican Republic
Senior Notes
4.88% due 09/23/2032 | | | 1,250,000 | | | | 1,275,000 | |
Dominican Republic
Senior Notes
5.88% due 01/30/2060* | | | 400,000 | | | | 382,600 | |
Emirate of Abu Dhabi
Senior Notes
2.50% due 04/16/2025* | | | 460,000 | | | | 484,950 | |
Emirate of Abu Dhabi
Senior Notes
2.50% due 04/16/2025 | | | 700,000 | | | | 737,968 | |
Emirate of Abu Dhabi
Senior Notes
3.13% due 10/11/2027 | | | 1,070,000 | | | | 1,161,014 | |
Emirate of Abu Dhabi
Senior Notes
3.13% due 09/30/2049 | | | 880,000 | | | | 838,094 | |
Emirate of Abu Dhabi
Senior Bonds
3.88% due 04/16/2050* | | | 200,000 | | | | 217,120 | |
Federal Republic of Ethiopia
Senior Notes
6.63% due 12/11/2024 | | | 1,070,000 | | | | 983,416 | |
Federal Republic of Nigeria
Senior Notes
7.14% due 02/23/2030 | | | 950,000 | | | | 967,983 | |
Federal Republic of Nigeria
Senior Notes
9.25% due 01/21/2049 | | | 500,000 | | | | 548,750 | |
| |
| | |
Sovereign (continued) | |
Federative Republic Of Brazil
Senior Notes
2.88% due 06/06/2025 | | $ | 750,000 | | | $ | 757,177 | |
Federative Republic of Brazil
Senior Notes
3.88% due 06/12/2030 | | | 600,000 | | | | 581,550 | |
Federative Republic of Brazil
Senior Notes
4.75% due 01/14/2050 | | | 580,000 | | | | 524,639 | |
Federative Republic of Brazil
Senior Notes
5.63% due 01/07/2041 | | | 500,000 | | | | 518,255 | |
Government of Romania
Senior Notes
3.00% due 02/14/2031 | | | 460,000 | | | | 459,519 | |
Government of Romania
Senior Notes
4.00% due 02/14/2051* | | | 500,000 | | | | 482,950 | |
Government of Ukraine
Senior Notes
7.25% due 03/15/2033* | | | 200,000 | | | | 198,960 | |
Government of Ukraine
Senior Notes
7.25% due 03/15/2033 | | | 1,020,000 | | | | 1,014,696 | |
Government of Ukraine
Senior Notes
7.75% due 09/01/2022 | | | 400,000 | | | | 421,305 | |
Government of Ukraine
Senior Notes
7.75% due 09/01/2024 | | | 250,000 | | | | 269,993 | |
Government of Ukraine
Senior Notes
9.75% due 11/01/2028 | | | 800,000 | | | | 931,406 | |
Islamic Republic of Pakistan
Senior Notes
6.88% due 12/05/2027 | | | 655,000 | | | | 682,837 | |
Islamic Republic of Pakistan
Senior Notes
8.25% due 04/15/2024 | | | 810,000 | | | | 886,950 | |
Kingdom of Bahrain
Senior Notes
4.25% due 01/25/2028* | | | 590,000 | | | | 585,521 | |
Kingdom of Bahrain
Senior Notes
5.25% due 01/25/2033* | | | 540,000 | | | | 512,968 | |
Kingdom of Bahrain
Senior Notes
6.00% due 09/19/2044 | | | 200,000 | | | | 186,500 | |
Kingdom of Bahrain
Senior Notes
7.38% due 05/14/2030* | | | 340,000 | | | | 377,434 | |
Kingdom of Bahrain
Senior Notes
7.38% due 05/14/2030 | | | 1,070,000 | | | | 1,187,807 | |
Kingdom of Saudi Arabia
Senior Notes
3.25% due 10/22/2030* | | | 1,085,000 | | | | 1,141,897 | |
AIG Strategic Bond Fund
PORTFOLIO OF INVESTMENTS — March 31, 2021 — (continued)
| | | | | | | | |
| Security Description | |
Principal
Amount(19) | | |
Value
(Note 2) | |
| | | | | | | | |
FOREIGN GOVERNMENT OBLIGATIONS (continued) | |
Sovereign (continued) | |
Kingdom of Saudi Arabia
Senior Notes
3.25% due 10/22/2030 | | $ | 1,350,000 | | | $ | 1,420,794 | |
Kingdom of Saudi Arabia
Senior Notes
3.63% due 03/04/2028 | | | 1,040,000 | | | | 1,129,700 | |
Kingdom of Saudi Arabia
Senior Notes
4.50% due 04/22/2060* | | | 300,000 | | | | 334,890 | |
Kingdom of Saudi Arabia
Senior Notes
4.63% due 10/04/2047 | | | 800,000 | | | | 895,938 | |
Kingdom of Saudi Arabia
Senior Notes
5.00% due 04/17/2049 | | | 280,000 | | | | 331,027 | |
Oriental Republic of Uruguay
Senior Notes
4.38% due 01/23/2031 | | | 187,500 | | | | 217,035 | |
People’s Republic of China
Senior Bonds
2.25% due 10/21/2050* | | | 670,000 | | | | 582,726 | |
Republic of the Philippines
Senior Notes
7.75% due 01/14/2031 | | | 530,000 | | | | 769,978 | |
Republic of Angola Senior Notes
8.25% due 05/09/2028 | | | 700,000 | | | | 670,530 | |
Republic of Angola
Senior Notes
9.50% due 11/12/2025 | | | 550,000 | | | | 574,750 | |
Republic of Cameroon
Senior Notes
9.50% due 11/19/2025 | | | 550,000 | | | | 596,403 | |
Republic of Chile
Senior Notes
2.45% due 01/31/2031 | | | 600,000 | | | | 601,512 | |
Republic of Colombia
Senior Notes
3.13% due 04/15/2031 | | | 1,295,000 | | | | 1,266,627 | |
Republic of Colombia
Senior Notes
4.50% due 03/15/2029 | | | 500,000 | | | | 545,250 | |
Republic of Colombia
Senior Notes
5.00% due 06/15/2045 | | | 230,000 | | | | 244,525 | |
Republic of Colombia
Senior Notes
7.38% due 09/18/2037 | | | 400,000 | | | | 528,000 | |
Republic of Colombia
Senior Notes
10.38% due 01/28/2033 | | | 320,000 | | | | 483,011 | |
Republic of El Salvador
Senior Notes
5.88% due 01/30/2025 | | | 570,000 | | | | 569,145 | |
Republic of El Salvador
Senior Notes
6.38% due 01/18/2027 | | | 560,000 | | | | 553,840 | |
| |
| | |
Sovereign (continued) | |
Republic of El Salvador
Senior Notes
8.63% due 02/28/2029 | | $ | 85,000 | | | $ | 90,440 | |
Republic of Ghana
Senior Notes
8.63% due 06/16/2049 | | | 560,000 | | | | 517,597 | |
Republic of Ghana
Senior Notes
8.75% due 03/11/2061* | | | 253,000 | | | | 234,364 | |
Republic of Ghana
Bank Guar. Notes
10.75% due 10/14/2030 | | | 500,000 | | | | 622,250 | |
Republic of Guatemala
Senior Notes
4.90% due 06/01/2030 | | | 700,000 | | | | 766,507 | |
Republic of Indonesia
Senior Notes
1.85% due 03/12/2031 | | | 1,250,000 | | | | 1,199,224 | |
Republic of Indonesia
Senior Notes
3.85% due 10/15/2030 | | | 500,000 | | | | 549,000 | |
Republic of Indonesia
Senior Bonds
4.13% due 01/15/2025 | | | 1,100,000 | | | | 1,204,779 | |
Republic of Ireland
Bonds
1.50% due 05/15/2050 | | EUR | 120,000 | | | | 167,981 | |
Republic of Ivory Coast
Senior Notes
6.13% due 06/15/2033 | | | 1,570,000 | | | | 1,603,629 | |
Republic of Ivory Coast
Senior Notes
6.38% due 03/03/2028 | | | 350,000 | | | | 379,330 | |
Republic of Kazakhstan
Senior Notes
5.13% due 07/21/2025 | | | 480,000 | | | | 556,800 | |
Republic of Kazakhstan
Senior Notes
6.50% due 07/21/2045 | | | 350,000 | | | | 495,958 | |
Republic of Kenya
Senior Notes
6.88% due 06/24/2024 | | | 570,000 | | | | 626,145 | |
Republic of Kenya
Senior Notes
8.00% due 05/22/2032 | | | 200,000 | | | | 212,150 | |
Republic of Panama
Senior Notes
4.50% due 04/01/2056 | | | 200,000 | | | | 218,198 | |
Republic of Panama
Senior Notes
6.70% due 01/26/2036 | | | 200,000 | | | | 269,002 | |
Republic of Paraguay
Senior Notes
4.95% due 04/28/2031* | | | 450,000 | | | | 508,505 | |
Republic of Paraquay
Senior Notes
4.95% due 04/28/2031 | | | 700,000 | | | | 791,007 | |
AIG Strategic Bond Fund
PORTFOLIO OF INVESTMENTS — March 31, 2021 — (continued)
| | | | | | | | |
| Security Description | |
Principal
Amount(19) | | |
Value
(Note 2) | |
| | | | | | | | |
FOREIGN GOVERNMENT OBLIGATIONS (continued) | |
Sovereign (continued) | |
Republic of South Africa
Senior Notes
4.30% due 10/12/2028 | | $ | 580,000 | | | $ | 570,604 | |
Republic of Sri Lanka
Senior Notes
5.75% due 04/18/2023 | | | 820,000 | | | | 555,443 | |
Republic of Sri Lanka
Senior Notes
6.75% due 04/18/2028 | | | 400,000 | | | | 242,800 | |
Republic of Sri Lanka
Senior Notes
6.85% due 11/03/2025 | | | 300,000 | | | | 187,035 | |
Republic of Sri Lanka
Senior Notes
7.55% due 03/28/2030* | | | 1,050,000 | | | | 638,820 | |
Republic of Sri Lanka
Senior Notes
7.55% due 03/28/2030 | | | 800,000 | | | | 486,720 | |
Republic of the Philippines
Senior Notes
2.95% due 05/05/2045 | | | 405,000 | | | | 378,443 | |
Republic of the Philippines
Senior Notes
3.75% due 01/14/2029 | | | 200,000 | | | | 221,685 | |
Republic of Turkey
Senior Notes
4.25% due 03/13/2025 | | | 600,000 | | | | 557,160 | |
Republic of Turkey
Senior Notes
5.13% due 02/17/2028 | | | 1,800,000 | | | | 1,624,104 | |
Republic of Turkey
Senior Notes
5.60% due 11/14/2024 | | | 360,000 | | | | 352,145 | |
Republic of Turkey
Senior Notes
5.75% due 05/11/2047 | | | 450,000 | | | | 364,568 | |
Republic of Turkey
Senior Notes
7.63% due 04/26/2029 | | | 460,000 | | | | 472,512 | |
Russian Federation
Senior Notes
4.38% due 03/21/2029 | | | 2,000,000 | | | | 2,185,000 | |
State of Qatar
Senior Notes
3.40% due 04/16/2025* | | | 330,000 | | | | 358,463 | |
State of Qatar
Senior Notes
3.75% due 04/16/2030* | | | 320,000 | | | | 357,600 | |
State of Qatar
Senior Notes
3.75% due 04/16/2030 | | | 660,000 | | | | 737,550 | |
State of Qatar
Senior Notes
4.40% due 04/16/2050* | | | 335,000 | | | | 388,600 | |
| |
| | |
Sovereign (continued) | |
State of Qatar
Senior Notes
4.40% due 04/16/2050 | | $ | 1,120,000 | | | $ | 1,299,200 | |
State of Qatar
Senior Notes
4.82% due 03/14/2049 | | | 1,140,000 | | | | 1,395,178 | |
State of Qatar
Senior Notes
5.10% due 04/23/2048 | | | 400,000 | | | | 505,520 | |
Sultanate of Oman
Senior Notes
5.38% due 03/08/2027 | | | 600,000 | | | | 620,280 | |
Sultanate of Oman
Senior Notes
6.75% due 10/28/2027* | | | 1,175,000 | | | | 1,296,025 | |
Sultanate of Oman
Senior Notes
6.75% due 10/28/2027 | | | 550,000 | | | | 606,650 | |
Sultanate of Oman
Senior Notes
7.38% due 10/28/2032* | | | 900,000 | | | | 997,875 | |
United Mexican States
Senior Notes
2.66% due 05/24/2031 | | | 600,000 | | | | 565,404 | |
United Mexican States
Senior Notes
4.50% due 01/31/2050 | | | 320,000 | | | | 322,806 | |
United Mexican States
Senior Bonds
4.75% due 03/08/2044 | | | 160,000 | | | | 168,026 | |
United Mexican States
Senior Notes
5.00% due 04/27/2051 | | | 1,150,000 | | | | 1,241,057 | |
| | | | | | |
|
|
|
| | | | | | | | 65,343,812 | |
| | | | | | |
|
|
|
Sovereign Agency — 0.1% | |
Kommunalbanken AS
Senior Notes
0.05% due 10/24/2029 | | | EUR 315,000 | | | | 369,627 | |
| | | | | | |
|
|
|
Total Foreign Government Obligations | | | | | | | | |
(cost $68,491,160) | | | | | | | 66,973,058 | |
| | | | | | |
|
|
|
U.S. GOVERNMENT AGENCIES — 15.2% | |
Federal Home Loan Bank — 0.3% | |
3.25% due 11/16/2028 | | | 1,000,000 | | | | 1,124,871 | |
| | | | | | |
|
|
|
Federal Home Loan Mtg. Corp. — 4.0% | |
2.00% due 03/01/2051 | | | 2,493,971 | | | | 2,488,339 | |
2.50% due 01/01/2028 | | | 108,578 | | | | 113,759 | |
2.50% due 04/01/2028 | | | 35,013 | | | | 36,685 | |
2.50% due 03/01/2031 | | | 60,824 | | | | 63,312 | |
2.50% due 11/01/2032 | | | 484,246 | | | | 509,741 | |
3.00% due 07/01/2045 | | | 1,028,251 | | | | 1,083,541 | |
3.00% due 10/01/2045 | | | 339,211 | | | | 357,094 | |
3.50% due 03/01/2042 | | | 173,082 | | | | 188,169 | |
3.50% due 04/01/2042 | | | 176,314 | | | | 191,167 | |
3.50% due 09/01/2043 | | | 147,435 | | | | 159,971 | |
3.50% due 07/01/2045 | | | 1,610,842 | | | | 1,734,105 | |
AIG Strategic Bond Fund
PORTFOLIO OF INVESTMENTS — March 31, 2021 — (continued)
| | | | | | | | |
| Security Description | |
Principal
Amount(19) | | |
Value
(Note 2) | |
| | | | | | | | |
U.S. GOVERNMENT AGENCIES (continued) | |
Federal Home Loan Mtg. Corp. (continued) | | | | | | | | |
3.50% due 03/01/2046 | | $ | 489,139 | | | $ | 524,612 | |
3.50% due 11/01/2047 | | | 675,240 | | | | 716,993 | |
3.50% due 01/01/2048 | | | 631,085 | | | | 674,396 | |
3.50% due 03/01/2048 | | | 2,185,405 | | | | 2,349,058 | |
3.50% due 04/01/2050 | | | 642,736 | | | | 678,271 | |
4.00% due 01/01/2046 | | | 174,183 | | | | 192,184 | |
4.00% due 07/01/2049 | | | 273,832 | | | | 297,377 | |
4.00% due 01/01/2050 | | | 297,581 | | | | 318,895 | |
4.50% due 03/01/2039 | | | 769,778 | | | | 868,312 | |
4.50% due 12/01/2039 | | | 4,617 | | | | 5,154 | |
4.50% due 07/01/2045 | | | 808,656 | | | | 879,737 | |
5.00% due 02/01/2034 | | | 11,388 | | | | 13,174 | |
5.00% due 05/01/2034 | | | 11,419 | | | | 12,841 | |
5.00% due 11/01/2043 | | | 126,031 | | | | 146,610 | |
5.50% due 05/01/2037 | | | 28,192 | | | | 33,123 | |
6.00% due 03/01/2040 | | | 22,868 | | | | 27,331 | |
6.50% due 02/01/2035 | | | 4,796 | | | | 5,454 | |
Federal Home Loan Mtg. Corp. FRS
1.74% (6 ML+1.49%)
due 02/01/2037 | | | 3,674 | | | | 3,817 | |
3.03% (12 ML+1.88%)
due 11/01/2037 | | | 44,098 | | | | 46,942 | |
Federal Home Loan Mtg. Corp. REMIC
Series 4740, Class BA
3.00% due 09/15/2045(3) | | | 112,556 | | | | 116,225 | |
Federal Home Loan Mtg. Corp. REMIC FRS
Series 3572, Class JS
6.69% (6.80%-1 ML)
due 09/15/2039(3)(7)(8) | | | 168,221 | | | | 25,679 | |
| | | | | | |
|
|
|
| | | | | | | | 14,862,068 | |
| | | | | | |
|
|
|
Federal National Mtg. Assoc. — 6.6% | |
2.00% due 07/01/2035 | | | 660,062 | | | | 677,785 | |
2.00% due 11/01/2035 | | | 582,143 | | | | 600,291 | |
2.00% due 12/01/2050 | | | 983,757 | | | | 983,553 | |
2.50% due 12/01/2026 | | | 221,260 | | | | 231,073 | |
2.50% due 08/01/2031 | | | 1,043,870 | | | | 1,086,044 | |
2.50% due 02/01/2032 | | | 453,802 | | | | 475,859 | |
2.50% due 05/01/2050 | | | 360,787 | | | | 371,539 | |
2.50% due 06/01/2050 | | | 781,991 | | | | 802,735 | |
2.50% due 07/01/2050 | | | 709,835 | | | | 732,426 | |
2.50% due 10/01/2050 | | | 476,434 | | | | 489,368 | |
3.00% due 10/01/2027 | | | 101,493 | | | | 107,179 | |
3.00% due 03/01/2030 | | | 691,556 | | | | 735,755 | |
3.00% due 10/01/2030 | | | 92,978 | | | | 98,249 | |
3.00% due 02/01/2033 | | | 859,800 | | | | 908,328 | |
3.00% due 07/01/2034 | | | 435,960 | | | | 459,741 | |
3.00% due 11/01/2039 | | | 361,989 | | | | 377,259 | |
3.00% due 12/01/2042 | | | 67,899 | | | | 72,195 | |
3.00% due 04/01/2047 | | | 1,163,506 | | | | 1,224,914 | |
3.00% due 09/01/2048 | | | 1,067,947 | | | | 1,121,016 | |
3.00% due 11/01/2048 | | | 839,992 | | | | 880,547 | |
3.00% due 06/01/2049 | | | 592,969 | | | | 625,930 | |
3.00% due 03/01/2050 | | | 750,507 | | | | 787,193 | |
3.50% due 08/01/2026 | | | 35,694 | | | | 38,085 | |
3.50% due 08/01/2027 | | | 25,214 | | | | 26,876 | |
3.50% due 10/01/2028 | | | 15,903 | | | | 17,249 | |
3.50% due 02/01/2043 | | | 80,874 | | | | 88,389 | |
| |
| | |
Federal National Mtg. Assoc. (continued) | |
3.50% due 10/01/2045 | | $ | 154,330 | | | $ | 166,106 | |
3.50% due 11/01/2045 | | | 75,703 | | | | 80,943 | |
3.50% due 03/01/2046 | | | 1,050,883 | | | | 1,123,592 | |
3.50% due 07/01/2046 | | | 79,497 | | | | 85,537 | |
3.50% due 04/01/2048 | | | 837,786 | | | | 897,942 | |
4.00% due 11/01/2025 | | | 48,486 | | | | 51,633 | |
4.00% due 03/01/2039 | | | 557,834 | | | | 601,818 | |
4.00% due 02/01/2045 | | | 876,289 | | | | 970,208 | |
4.00% due 05/01/2047 | | | 216,305 | | | | 233,969 | |
4.00% due 07/01/2047 | | | 931,875 | | | | 1,006,964 | |
4.00% due 06/01/2048 | | | 421,479 | | | | 457,599 | |
4.00% due 09/01/2048 | | | 407,010 | | | | 437,143 | |
4.00% due 01/01/2049 | | | 624,425 | | | | 670,107 | |
4.00% due 03/01/2050 | | | 548,496 | | | | 588,152 | |
4.50% due 11/01/2022 | | | 991 | | | | 1,039 | |
4.50% due 06/01/2023 | | | 3,056 | | | | 3,208 | |
4.50% due 08/01/2045 | | | 1,047,478 | | | | 1,178,610 | |
4.50% due 10/01/2048 | | | 31,130 | | | | 33,878 | |
4.50% due 11/01/2048 | | | 629,492 | | | | 686,935 | |
5.00% due 01/01/2023 | | | 1,266 | | | | 1,328 | |
5.00% due 03/01/2034 | | | 10,531 | | | | 12,224 | |
5.00% due 05/01/2035 | | | 5,966 | | | | 6,938 | |
5.00% due 05/01/2040 | | | 47,051 | | | | 54,715 | |
5.50% due 06/01/2038 | | | 14,291 | | | | 16,802 | |
6.00% due 02/01/2032 | | | 3,815 | | | | 4,288 | |
6.00% due 05/01/2034 | | | 1,005 | | | | 1,201 | |
6.00% due 10/01/2034 | | | 14,878 | | | | 16,735 | |
7.50% due 01/01/2030 | | | 722 | | | | 731 | |
8.00% due 11/01/2028 | | | 1,352 | | | | 1,479 | |
Federal National Mtg. Assoc. FRS
1.79% (6 ML+1.54%)
due 09/01/2035 | | | 33,696 | | | | 35,024 | |
2.29% (12 ML+1.77%)
due 05/01/2040 | | | 34,117 | | | | 35,927 | |
2.33% (12 ML+1.83%)
due 10/01/2040 | | | 13,590 | | | | 14,351 | |
2.33% (12 ML+1.82%)
due 10/01/2040 | | | 9,698 | | | | 10,233 | |
2.36% (12 ML+1.57%)
due 05/01/2037 | | | 7,381 | | | | 7,764 | |
2.59% (1 Yr USTYCR+2.22%)
due 10/01/2035 | | | 25,956 | | | | 27,261 | |
2.74% (12 ML+1.67%)
due 07/01/2039 | | | 30,675 | | | | 32,008 | |
2.87% (12 ML+1.91%)
due 08/01/2035 | | | 26,759 | | | | 28,324 | |
3.00% (1 Yr USTYCR+2.27%)
due 11/01/2036 | | | 16,223 | | | | 17,262 | |
Federal National Mtg. Assoc. REMIC | |
Series 2018-27, Class EA
3.00% due 05/25/2048(3) | | | 256,837 | | | | 273,881 | |
Series 2018-35, Class CD
3.00% due 05/25/2048(3) | | | 238,524 | | | | 252,304 | |
| | | | | | |
|
|
|
| | | | | | | | 24,145,741 | |
| | | | | | |
|
|
|
Government National Mtg. Assoc. — 1.9% | |
2.00% due 11/20/2050 | | | 986,903 | | | | 996,799 | |
2.50% due 05/20/2050 | | | 462,632 | | | | 477,244 | |
AIG Strategic Bond Fund
PORTFOLIO OF INVESTMENTS — March 31, 2021 — (continued)
| | | | | | | | |
| Security Description | |
Principal
Amount(19) | | |
Value
(Note 2) | |
| | | | | | | | |
U.S. GOVERNMENT AGENCIES (continued) | |
Government National Mtg. Assoc. (continued) | | | | | | | | |
2.50% due 12/20/2050 | | $ | 1,980,704 | | | $ | 2,044,032 | |
3.00% due 05/20/2046 | | | 1,027,989 | | | | 1,088,581 | |
3.00% due 05/20/2050 | | | 1,149,546 | | | | 1,197,921 | |
4.50% due 10/20/2045 | | | 768,496 | | | | 860,067 | |
4.50% due 04/20/2047 | | | 386,140 | | | | 425,255 | |
| | | | | | |
|
|
|
| | | | | | | | 7,089,899 | |
| | | | | | |
|
|
|
Uniform Mtg. Backed Securities — 2.4% | |
1.50% due April 15 TBA | | | 500,000 | | | | 502,109 | |
1.50% due April 30 TBA | | | 600,000 | | | | 579,668 | |
2.00% due April 30 TBA | | | 2,750,000 | | | | 2,741,890 | |
2.50% due April 30 TBA | | | 2,700,000 | | | | 2,768,713 | |
3.00% due April 30 TBA | | | 2,000,000 | | | | 2,083,164 | |
| | | | | | |
|
|
|
| | | | | | | | 8,675,544 | |
| | | | | | |
|
|
|
Total U.S. Government Agencies | | | | | | | | |
(cost $54,947,310) | | | | | | | 55,898,123 | |
| | | | | | |
|
|
|
U.S. GOVERNMENT TREASURIES — 1.1% | |
United States Treasury Notes — 1.1% | |
0.13% due 11/30/2022 | | | 1,038,000 | | | | 1,037,716 | |
0.13% due 12/15/2023 | | | 200,000 | | | | 199,086 | |
1.50% due 02/15/2030 | | | 1,090,000 | | | | 1,075,864 | |
1.63% due 08/15/2029 | | | 1,000,000 | | | | 1,002,851 | |
2.00% due 05/31/2021 | | | 277,000 | | | | 277,881 | |
2.50% due 01/31/2024 | | | 250,000 | | | | 265,342 | |
| | | | | | |
|
|
|
Total U.S. Government Treasuries | | | | | | | | |
(cost $3,917,901) | | | | | | | 3,858,740 | |
| | | | | | |
|
|
|
LOANS(9)(10)(11) — 4.4% | |
Aerospace/Defense-Equipment — 0.1% | |
Spirit Aerosystems, Inc. FRS
BTL-B
6.00% (1 ML+5.25%)
due 01/15/2025 | | | 111,113 | | | | 111,390 | |
WP CPP Holdings LLC FRS
BTL-B1
4.75% (3 ML+3.75%)
due 04/30/2025 | | | 122,499 | | | | 119,069 | |
| | | | | | |
|
|
|
| | | | | | | | 230,459 | |
| | | | | | |
|
|
|
Airlines — 0.1% | |
American Airlines, Inc. FRS
BTL-B
1.86% (1 ML+1.75%)
due 06/27/2025 | | | 125,000 | | | | 110,045 | |
WestJet Airlines, Ltd. FRS
BTL-B
4.00% (6 ML+3.00%)
due 12/11/2026 | | | 178,629 | | | | 173,010 | |
| | | | | | |
|
|
|
| | | | | | | | 283,055 | |
| | | | | | |
|
|
|
Apparel Manufacturers — 0.0% | |
Samsonite IP Holdings Sarl FRS
BTL-B2
5.50% (1 ML+4.50%)
due 04/25/2025 | | | 123,070 | | | | 123,839 | |
| | | | | | |
|
|
|
| |
| | |
Applications Software — 0.1% | |
Project Boost Purchaser LLC FRS
BTL-B
3.61% (1 ML+3.50%)
due 06/01/2026 | | $ | 165,177 | | | $ | 163,071 | |
Realpage, Inc. FRS
BTL
coupon TBD
due 02/17/2028 | | | 55,137 | | | | 54,838 | |
VS Buyer LLC FRS
BTL
3.11% (1 ML+3.00%)
due 02/28/2027 | | | 86,628 | | | | 86,249 | |
| | | | | | |
|
|
|
| | | | | | | | 304,158 | |
| | | | | | |
|
|
|
Athletic Equipment — 0.0% | |
Varsity Brands Holding Co., Inc. FRS
1st Lien
4.50% (1 ML+3.50%)
due 12/15/2024† | | | 143,409 | | | | 138,539 | |
| | | | | | |
|
|
|
Auction Houses/Art Dealers — 0.0% | |
Sotheby’s FRS
BTL-B
5.50% (3 ML+4.75%)
due 01/15/2027 | | | 89,507 | | | | 90,010 | |
| | | | | | |
|
|
|
Auto Repair Centers — 0.1% | |
Mavis Tire Express Services Corp. FRS
1st Lien
3.36% (1 ML+3.25%)
due 03/20/2025 | | | 138,924 | | | | 138,403 | |
Wand NewCo. 3, Inc. FRS
BTL
3.11% (1 ML+3.00%)
due 02/05/2026 | | | 101,239 | | | | 99,868 | |
| | | | | | |
|
|
|
| | | | | | | | 238,271 | |
| | | | | | |
|
|
|
Auto/Truck Parts & Equipment-Original — 0.1% | |
TI Group Automotive Systems LLC FRS
BTL
4.50% (1 ML+3.75%)
due 12/16/2024 | | | 145,640 | | | | 145,033 | |
| | | | | | |
|
|
|
Broadcast Services/Program — 0.0% | |
NEP Group, Inc. FRS
BTL
3.36% (1 ML+3.25%)
due 10/20/2025 | | | 136,850 | | | | 132,545 | |
| | | | | | |
|
|
|
Building & Construction-Misc. — 0.0% | |
Verra Mobility Corp. FRS
BTL
3.36% (1 ML+3.25%)
due 02/28/2025 | | | 96,990 | | | | 96,525 | |
| | | | | | |
|
|
|
Building Products-Air & Heating — 0.0% | |
API Heat Transfer ThermaSys Corp. FRS
1st Lien
12.25% (3 ML+12.00%)
due 12/29/2023(4)(5)(15) | | | 179,888 | | | | 76,452 | |
| | | | | | |
|
|
|
AIG Strategic Bond Fund
PORTFOLIO OF INVESTMENTS — March 31, 2021 — (continued)
| | | | | | | | |
| Security Description | |
Principal
Amount(19) | | |
Value
(Note 2) | |
| | | | | | | | |
LOANS(9)(10)(11) (continued) | |
Building Products-Doors & Windows — 0.0% | |
CHI Doors Holdings Corp. FRS
BTL
4.50% (1 ML+3.50%)
due 07/31/2025 | | $ | 135,706 | | | $ | 135,451 | |
| | | | | | |
|
|
|
Building-Heavy Construction — 0.0% | |
USIC Holdings, Inc. FRS
BTL
4.00% (1 ML+3.00%)
due 12/08/2023 | | | 105,143 | | | | 104,617 | |
| | | | | | |
|
|
|
Cable/Satellite TV — 0.1% | |
CSC Holdings LLC FRS
BTL-B
2.36% (1 ML+2.25%)
due 07/17/2025 | | | 37,045 | | | | 36,461 | |
CSC Holdings LLC FRS
BTL-B5
2.61% (1 ML+2.50%)
due 04/15/2027 | | | 150,549 | | | | 148,614 | |
UPC Broadband Holdings BV FRS
BTL-B1
3.61% (1 ML+3.50%)
due 01/31/2029 | | | 50,884 | | | | 50,703 | |
UPC Broadband Holdings BV FRS
BTL-B2
3.61% (1 ML+3.50%)
due 01/31/2029 | | | 50,884 | | | | 50,703 | |
Virgin Media Bristol LLC FRS
BTL-Q
coupon TBD
due 01/31/2029 | | | 66,000 | | | | 65,823 | |
| | | | | | |
|
|
|
| | | | | | | | 352,304 | |
| | | | | | |
|
|
|
Casino Hotels — 0.2% | |
Caesars Resort Collection LLC FRS
BTL-B
2.86% (1 ML+2.75%)
due 12/23/2024 | | | 202,964 | | | | 199,564 | |
CityCenter Holdings LLC FRS
BTL-B
3.00% (1 ML+2.25%)
due 04/18/2024 | | | 137,779 | | | | 135,923 | |
Golden Nugget, Inc. FRS
BTL-B
3.25% (2 ML+2.50%)
due 10/04/2023 | | | 125,931 | | | | 123,885 | |
Station Casinos LLC FRS
BTL-B
2.50% (1 ML+2.25%)
due 02/08/2027 | | | 87,691 | | | | 86,195 | |
| | | | | | |
|
|
|
| | | | | | | | 545,567 | |
| | | | | | |
|
|
|
Casino Services — 0.0% | |
Stars Group Holdings FRS
BTL
3.69% (3 ML+3.50%)
due 07/10/2025 | | | 71,364 | | | | 71,453 | |
| | | | | | |
|
|
|
| |
| | | | | | | | | |
Cellular Telecom — 0.1% | |
Altice France SA FRS
BTL-B12
3.79% (1 ML+3.69%)
due 01/31/2026 | | $ | 37,420 | | | $ | 37,018 | |
Altice France SA FRS
BTL-B13
4.20% (3 ML+4.00%)
due 08/14/2026 | | | 171,063 | | | | 170,079 | |
CCI Buyer, Inc. FRS
BTL
4.75% (3 ML+4.00%)
due 12/17/2027 | | | 142,381 | | | | 142,499 | |
| | | | | | |
|
|
|
| | | | | | | | 349,596 | |
| | | | | | |
|
|
|
Chemicals-Diversified — 0.0% | |
Hexion, Inc. FRS
BTL
3.74% (3 ML+3.50%)
due 07/01/2026 | | | 138,532 | | | | 138,445 | |
| | | | | | |
|
|
|
Chemicals-Specialty — 0.1% | |
Diamond BC BV FRS
BTL
3.11% (1 ML+3.00%)
due 09/06/2024 | | | 137,477 | | | | 136,660 | |
PQ Corp. FRS
BTL-B
4.00% (3 ML+3.00%)
due 02/07/2027 | | | 51,618 | | | | 51,580 | |
Starfruit US HoldCo. LLC FRS
BTL-B
2.86% (1 ML+2.75%)
due 10/01/2025 | | | 183,482 | | | | 180,500 | |
| | | | | | |
|
|
|
| | | | | | | | 368,740 | |
| | | | | | |
|
|
|
Commercial Services-Finance — 0.1% | |
MoneyGram International, Inc. FRS
BTL
7.00% (3 ML+6.00%)
due 06/30/2023 | | | 108,947 | | | | 108,648 | |
MPH Acquisition Holdings LLC FRS
BTL-B
3.75% (3 ML+2.75%)
due 06/07/2023 | | | 95,910 | | | | 95,343 | |
Travelport Finance Luxembourg SARL FRS
BTL
9.00% (3 ML+8.00%)
due 02/28/2025(22) | | | 97,324 | | | | 99,125 | |
Travelport Finance Luxembourg SARL FRS
BTL
5.25% (3 ML+5.00%)
due 05/29/2026 | | | 117,298 | | | | 95,121 | |
| | | | | | |
|
|
|
| | | | | | | | 398,237 | |
| | | | | | |
|
|
|
Computer Data Security — 0.0% | |
McAfee LLC FRS
BTL-B1
3.86% (1 ML+3.75%)
due 09/30/2024 | | | 118,868 | | | | 118,852 | |
| | | | | | |
|
|
|
AIG Strategic Bond Fund
PORTFOLIO OF INVESTMENTS — March 31, 2021 — (continued)
| | | | | | | | |
| Security Description | |
Principal
Amount(19) | | |
Value
(Note 2) | |
| | | | | | | | |
LOANS(9)(10)(11) (continued) | | | | | | | | |
Computer Graphics — 0.1% | |
Corel, Inc. FRS
BTL
5.19% (3 ML+5.00%)
due 07/02/2026 | | $ | 143,058 | | | $ | 141,628 | |
| | | | | | |
|
|
|
Computer Services — 0.0% | |
Tempo Acquisition LLC FRS
BTL-B
3.75% (1 ML+3.25%)
due 11/02/2026 | | | 118,735 | | | | 118,617 | |
| | | | | | |
|
|
|
Computer Software — 0.1% | |
Camelot Finance SA FRS
BTL-B
3.11% (1 ML+3.00%)
due 10/30/2026 | | | 100,872 | | | | 100,074 | |
Cornerstone OnDemand, Inc. FRS
BTL-B
4.36% (1 ML+4.25%)
due 04/22/2027 | | | 99,607 | | | | 99,607 | |
Rackspace Hosting, Inc. FRS
BTL
3.50% (3 ML+2.75%)
due 02/15/2028 | | | 143,182 | | | | 141,893 | |
| | | | | | |
|
|
|
| | | | | | | | 341,574 | |
| | | | | | |
|
|
|
Computers-Integrated Systems — 0.0% | |
Everi Payments, Inc. FRS
BTL
11.50% (1 ML+10.50%)
due 05/09/2024 | | | 60,653 | | | | 63,382 | |
| | | | | | |
|
|
|
Containers-Metal/Glass — 0.1% | |
Mauser Packaging Solutions Holding, Co. FRS
BTL
3.44% (3 ML+3.25%)
due 04/03/2024 | | | 187,138 | | | | 182,760 | |
| | | | | | |
|
|
|
Containers-Paper/Plastic — 0.2% | |
Charter NEX US, Inc. FRS
BTL
5.00% (1 ML+4.25%)
due 12/01/2027 | | | 93,896 | | | | 93,984 | |
Graham Packaging Co., Inc. FRS
BTL
3.75% (1 ML+3.00%)
due 08/04/2027 | | | 119,224 | | | | 118,429 | |
Patriot Container Corp. FRS
1st Lien
4.50% (1 ML+3.50%)
due 03/20/2025 | | | 107,692 | | | | 106,346 | |
Reynolds Group Holdings, Inc. FRS
BTL
3.36% (1 ML+3.25%)
due 02/05/2026 | | | 103,754 | | | | 102,522 | |
Trident TPI Holdings, Inc. FRS
BTL-B1
4.00% (3 ML+3.00%)
due 10/17/2024 | | | 86,324 | | | | 85,380 | |
| | | | | | |
|
|
|
| | | | | | | | 506,661 | |
| | | | | | |
|
|
|
| |
| | |
Cruise Lines — 0.0% | |
Hornblower Sub LLC FRS
BTL-B
0.25%
due 04/27/2025 | | $ | 114,947 | | | $ | 105,176 | |
| | | | | | |
|
|
|
Data Processing/Management — 0.0% | |
CCC Information Services, Inc. FRS
1st Lien
4.00% (1 ML+3.00%)
due 04/29/2024 | | | 135,825 | | | | 135,598 | |
| | | | | | |
|
|
|
Direct Marketing — 0.1% | |
Terrier Media Buyer, Inc. FRS
BTL
3.61% (1 ML+3.50%)
due 12/17/2026 | | | 214,371 | | | | 212,260 | |
| | | | | | |
|
|
|
Distribution/Wholesale — 0.1% | |
Fastlane Parent Co., Inc. FRS
1st Lien
4.61% (1 ML+4.50%)
due 02/04/2026 | | | 105,123 | | | | 104,794 | |
Univar USA, Inc. FRS
BTL-B3
2.36% (1 ML+2.25%)
due 07/01/2024 | | | 122,290 | | | | 121,710 | |
| | | | | | |
|
|
|
| | | | | | | | 226,504 | |
| | | | | | |
|
|
|
E-Commerce/Products — 0.0% | |
CNT Holdings I Corp. FRS
BTL
4.50% (6 ML+3.75%)
due 11/08/2027 | | | 86,098 | | | | 85,807 | |
CNT Holdings I Corp. FRS
BTL
7.50% (3 ML+6.75%)
due 10/16/2028 | | | 25,955 | | | | 26,215 | |
| | | | | | |
|
|
|
| | | | | | | | 112,022 | |
| | | | | | |
|
|
|
E-Commerce/Services — 0.1% | |
RentPath LLC FRS
2nd Lien
1.61% (3 ML+0.00%)
due 12/17/2022†(4)(5)(12)(21) | | | 1,062,906 | | | | 159,436 | |
| | | | | | |
|
|
|
Electronic Components-Misc. — 0.0% | |
AI Ladder Luxembourg Subco SARL FRS
BTL
4.61% (1 ML+4.50%)
due 07/09/2025 | | | 131,546 | | | | 131,546 | |
| | | | | | |
|
|
|
Electronic Components-Semiconductors — 0.0% | |
Bright Bidco BV FRS
BTL-B
4.50% (3 ML+3.50%)
due 06/30/2024 | | | 176,985 | | | | 134,635 | |
| | | | | | |
|
|
|
Electronic Parts Distribution — 0.1% | |
Tech Data Corp. FRS
BTL
3.61% (1 ML+3.50%)
due 06/30/2025 | | | 105,961 | | | | 106,193 | |
AIG Strategic Bond Fund
PORTFOLIO OF INVESTMENTS — March 31, 2021 — (continued)
| | | | | | | | |
| Security Description | |
Principal
Amount(19) | | |
Value
(Note 2) | |
| | | | | | | | |
LOANS(9)(10)(11) (continued) | | | | | | | | |
Electronic Parts Distribution (continued) | | | | | | | | |
Tech Data Corp. FRS
BTL
5.61% (1 ML+5.50%)
due 06/30/2025 | | $ | 121,570 | | | $ | 121,671 | |
| | | | | | |
|
|
|
| | | | | | | | 227,864 | |
| | | | | | |
|
|
|
Enterprise Software/Service — 0.3% | |
Applied Systems, Inc. FRS
1st Lien
3.50% (3 ML+3.00%)
due 09/19/2024 | | | 132,303 | | | | 131,766 | |
Banff Merger Sub, Inc. FRS
BTL
3.86% (1 ML+3.75%)
due 10/02/2025 | | | 113,839 | | | | 113,256 | |
Dcert Buyer, Inc. FRS
BTL-B
4.11% (1 ML+4.00%)
due 10/16/2026 | | | 152,348 | | | | 151,967 | |
Epicor Software Corp. FRS
BTL
4.00% (1 ML+3.25%)
due 07/30/2027 | | | 104,475 | | | | 104,116 | |
Epicor Software Corp. FRS
BTL
8.75% (1 ML+7.75%)
due 07/31/2028 | | | 13,411 | | | | 13,836 | |
Finastra USA, Inc. FRS
BTL-B
4.50% (3 ML+3.50%)
due 06/13/2024 | | | 141,524 | | | | 138,502 | |
Greeneden US Holdings II LLC FRS
BTL-B
4.75% (1 ML+4.00%)
due 12/01/2027 | | | 127,826 | | | | 127,730 | |
Sophia L.P. FRS
1st Lien
4.50% (3 ML+3.75%)
due 10/07/2027 | | | 161,166 | | | | 160,879 | |
Ultimate Software Group, Inc. FRS
1st Lien
3.86% (1 ML+3.75%)
due 05/04/2026 | | | 101,959 | | | | 101,747 | |
Ultimate Software Group, Inc. FRS
BTL
4.00% (4 ML+3.25%)
due 05/04/2026 | | | 20,759 | | | | 20,733 | |
Ultimate Software Group, Inc. FRS
2nd Lien
7.50% (3 ML+6.75%)
due 05/03/2027 | | | 35,449 | | | | 36,290 | |
| | | | | | |
|
|
|
| | | | | | | | 1,100,822 | |
| | | | | | |
|
|
|
Finance-Credit Card — 0.0% | |
Pi US Mergerco, Inc. FRS
BTL
4.50% (1 ML+3.50%)
due 01/03/2025 | | | 97,582 | | | | 97,414 | |
| | | | | | |
|
|
|
| |
| | |
Finance-Investment Banker/Broker — 0.0% | |
Deerfield Dakota Holding LLC FRS
BTL
4.75% (1 ML+3.75%)
due 04/09/2027 | | $ | 68,550 | | | $ | 68,550 | |
Motion Finco SARL FRS
BTL-B2
3.45% (3 ML+3.25%)
due 11/12/2026 | | | 8,006 | | | | 7,724 | |
Motion Finco SARL FRS
BTL-B1
3.45% (3 ML+3.25%)
due 11/12/2026 | | | 60,914 | | | | 58,769 | |
| | | | | | |
|
|
|
| | | | | | | | 135,043 | |
| | | | | | |
|
|
|
Food-Misc./Diversified — 0.1% | |
Dole Food Co., Inc. FRS
BTL-B
3.75% (1 ML+2.75%)
due 04/06/2024 | | | 80,067 | | | | 79,967 | |
Dole Food Co., Inc. FRS
BTL-B
5.00% (USFRBPLR+1.75%)
due 04/06/2024 | | | 270 | | | | 270 | |
Froneri US, Inc. FRS
BTL
2.36% (1 ML+2.25%)
due 01/29/2027 | | | 120,680 | | | | 118,889 | |
| | | | | | |
|
|
|
| | | | | | | | 199,126 | |
| | | | | | |
|
|
|
Gambling (Non-Hotel) — 0.0% | |
Scientific Games International, Inc. FRS
BTL-B5
2.86% (1 ML+2.75%)
due 08/14/2024 | | | 140,461 | | | | 137,564 | |
| | | | | | |
|
|
|
Human Resources — 0.1% | |
Creative Artists Agency LLC FRS
BTL-B
3.86% (1 ML+3.75%)
due 11/26/2026 | | | 104,888 | | | | 103,708 | |
Team Health Holdings, Inc. FRS
1st Lien
3.75% (1 ML+2.75%)
due 02/06/2024 | | | 152,292 | | | | 141,306 | |
| | | | | | |
|
|
|
| | | | | | | | 245,014 | |
| | | | | | |
|
|
|
Insurance Brokers — 0.1% | |
Alliant Holdings Intermediate LLC FRS
BTL-B1
3.36% (1 ML+3.25%)
due 05/09/2025 | | | 136,834 | | | | 134,934 | |
HUB International, Ltd. FRS
BTL-B
2.97% (3 ML+2.75%)
due 04/25/2025 | | | 137,760 | | | | 135,706 | |
| | | | | | |
|
|
|
| | | | | | | | 270,640 | |
| | | | | | |
|
|
|
Insurance-Property/Casualty — 0.1% | |
Asurion LLC FRS
BTL-B6
3.11% (1 ML+3.00%)
due 11/03/2023 | | | 93,565 | | | | 93,258 | |
AIG Strategic Bond Fund
PORTFOLIO OF INVESTMENTS — March 31, 2021 — (continued)
| | | | | | | | |
| Security Description | |
Principal
Amount(19) | | |
Value
(Note 2) | |
| |
LOANS(9)(10)(11) (continued) | |
Insurance-Property/Casualty (continued) | |
Asurion LLC FRS
BTL-B1
3.36% (1 ML+3.25%)
due 12/23/2026 | | $ | 46,635 | | | $ | 46,305 | |
Sedgwick Claims Management Services, Inc. FRS
BTL
3.36% (1 ML+3.25%)
due 12/31/2025 | | | 182,173 | | | | 179,412 | |
| | | | | | |
|
|
|
| | | | | | | | 318,975 | |
| | | | | | |
|
|
|
Internet Financial Services — 0.1% | |
Acuris Finance US, Inc. FRS
BTL-B
4.50% (3 ML+4.00%)
due 02/16/2028 | | | 41,404 | | | | 41,327 | |
ION Trading Finance, Ltd. FRS
BTL
5.00% (1 ML+4.00%)
due 11/21/2024 | | | 140,878 | | | | 140,724 | |
| | | | | | |
|
|
|
| | | | | | | | 182,051 | |
| | | | | | |
|
|
|
Internet Gambling — 0.0% | |
Golden Nugget, Inc. FRS
BTL
13.00% (3 ML+12.00%)
due 10/04/2023 | | | 14,602 | | | | 16,573 | |
| | | | | | |
|
|
|
Internet Telephone — 0.0% | |
Cablevision Lightpath LLC FRS
BTL-B
3.75% (1 ML+3.25%)
due 11/30/2027 | | | 69,855 | | | | 69,681 | |
| | | | | | |
|
|
|
Investment Companies — 0.0% | |
Nexus Buyer LLC FRS
BTL-B
3.86% (3 ML+3.75%)
due 11/09/2026 | | | 42,761 | | | | 42,526 | |
| | | | | | |
|
|
|
Investment Management/Advisor Services — 0.1% | |
Advisor Group Holdings, Inc. FRS
BTL
4.61% (1 ML+4.50%)
due 07/31/2026 | | | 144,175 | | | | 143,943 | |
| | | | | | |
|
|
|
Machinery-Electrical — 0.1% | |
Alliance Laundry Systems LLC FRS
BTL-B
4.25% (3 ML+3.50%)
due 10/08/2027 | | | 86,043 | | | | 85,774 | |
Brookfield WEC Holdings, Inc. FRS
BTL
3.25% (1 ML+2.75%)
due 08/01/2025 | | | 100,688 | | | | 99,735 | |
| | | | | | |
|
|
|
| | | | | | | | 185,509 | |
| | | | | | |
|
|
|
Machinery-General Industrial — 0.0% | |
Vertical US Newco, Inc. FRS
BTL-B
4.48% (6 ML+4.25%)
due 07/30/2027 | | | 138,656 | | | | 138,830 | |
| | | | | | |
|
|
|
| |
| | |
Machinery-Pumps — 0.0% | |
STS Operating, Inc. FRS
BTL
5.25% (1 ML+4.25%)
due 12/11/2024 | | $ | 135,663 | | | $ | 131,791 | |
| | | | | | |
|
|
|
Medical Information Systems — 0.1% | |
Athenahealth, Inc. FRS
BTL
4.45% (3 ML+4.25%)
due 02/11/2026 | | | 135,895 | | | | 136,008 | |
Navicure, Inc. FRS
BTL-B
4.75% (1 ML+4.00%)
due 10/22/2026 | | | 112,276 | | | | 112,065 | |
| | | | | | |
|
|
|
| | | | | | | | 248,073 | |
| | | | | | |
|
|
|
Medical Labs & Testing Services — 0.1% | |
Envision Healthcare Corp. FRS
1st Lien
3.86% (1 ML+3.75%)
due 10/10/2025 | | | 259,679 | | | | 223,144 | |
| | | | | | |
|
|
|
Medical-Drugs — 0.1% | |
Akorn Operating Co. LLC FRS
BTL
8.50% (3 ML+7.50%)
due 10/01/2025 | | | 49,517 | | | | 50,508 | |
Alphabet Holding Co., Inc. FRS
1st Lien
3.61% (1 ML+3.50%)
due 09/26/2024 | | | 143,766 | | | | 142,662 | |
Bausch Health Americas, Inc. FRS
BTL
2.86% (1 ML+2.75%)
due 11/27/2025 | | | 77,811 | | | | 77,340 | |
| | | | | | |
|
|
|
| | | | | | | | 270,510 | |
| | | | | | |
|
|
|
Medical-Hospitals — 0.1% | |
Cano Health LLC FRS
Delayed Draw
4.75%
due 11/19/2027(20) | | | 25,481 | | | | 25,449 | |
Cano Health LLC FRS
BTL
5.50% (3 ML+4.75%)
due 11/19/2027 | | | 69,717 | | | | 69,630 | |
RegionalCare Hospital Partners Holdings, Inc. FRS
BTL-B
3.86% (1 ML+3.75%)
due 11/16/2025 | | | 95,393 | | | | 95,105 | |
| | | | | | |
|
|
|
| | | | | | | | 190,184 | |
| | | | | | |
|
|
|
Miscellaneous Manufacturing — 0.0% | |
Excelitas Technologies Corp. FRS
2nd Lien
8.50% (3 ML+7.50%)
due 12/01/2025 | | | 105,000 | | | | 105,000 | |
| | | | | | |
|
|
|
AIG Strategic Bond Fund
PORTFOLIO OF INVESTMENTS — March 31, 2021 — (continued)
| | | | | | | | |
| Security Description | |
Principal
Amount(19) | | |
Value
(Note 2) | |
| | | | | | | | |
LOANS(9)(10)(11) (continued) | |
Non-Hazardous Waste Disposal — 0.0% | |
GFL Environmental, Inc. FRS
BTL
3.50% (3 ML+3.00%)
due 05/30/2025 | | $ | 71,351 | | | $ | 71,326 | |
| | | | | | |
|
|
|
Oil-Field Services — 0.0% | |
Apergy Corp. FRS
BTL
6.00% (3 ML+5.00%)
due 06/03/2027 | | | 118,755 | | | | 120,833 | |
| | | | | | |
|
|
|
Pharmacy Services — 0.1% | |
Change Healthcare Holdings LLC FRS
BTL
3.50% (3 ML+2.50%)
due 03/01/2024 | | | 92,789 | | | | 92,627 | |
HC Group Holdings II, Inc. FRS
BTL-B
3.86% (1 ML+3.75%)
due 08/06/2026 | | | 139,014 | | | | 138,406 | |
| | | | | | |
|
|
|
| | | | | | | | 231,033 | |
| | | | | | |
|
|
|
Physical Therapy/Rehabilitation Centers — 0.0% | |
Upstream Newco, Inc. FRS
BTL
4.61% (1 ML+4.50%)
due 11/20/2026 | | | 138,934 | | | | 138,500 | |
| | | | | | |
|
|
|
Pipelines — 0.2% | |
Blackstone CQP Holdco LP FRS
BTL-B
3.69% (3 ML+3.50%)
due 09/30/2024 | | | 191,780 | | | | 191,540 | |
Buckeye Partners LP FRS
BTL-B
2.36% (3 ML+2.25%)
due 11/01/2026 | | | 187,821 | | | | 186,569 | |
Medallion Midland Acquisition LLC FRS
BTL
4.25% (1 ML+3.25%)
due 10/30/2024 | | | 145,154 | | | | 142,341 | |
| | | | | | |
|
|
|
| | | | | | | | 520,450 | |
| | | | | | |
|
|
|
Protection/Safety — 0.0% | |
Prime Security Services Borrower LLC FRS
BTL
3.50% (3 ML+2.75%)
due 09/23/2026 | | | 108,062 | | | | 107,444 | |
| | | | | | |
|
|
|
Publishing-Periodicals — 0.0% | |
Nielsen Finance LLC FRS
BTL-B4
2.10% (1 ML+2.00%)
due 10/04/2023 | | | 99,849 | | | | 99,587 | |
| | | | | | |
|
|
|
Quarrying — 0.1% | |
US Silica Co. FRS
BTL-B
5.00% (1 ML+4.00%)
due 05/01/2025 | | | 148,872 | | | | 143,103 | |
| | | | | | |
|
|
|
| |
| | |
Real Estate Investment Trusts — 0.0% | |
Claros Mtg. Trust, Inc. FRS
BTL-B
6.00% (1 ML+5.00%)
due 08/09/2026 | | $ | 87,335 | | | $ | 87,117 | |
| | | | | | |
|
|
|
Real Estate Management/Services — 0.0% | |
Cushman & Wakefield FRS
BTL
2.86% (1 ML+2.75%)
due 08/21/2025 | | | 136,107 | | | | 133,181 | |
| | | | | | |
|
|
|
Rental Auto/Equipment — 0.0% | |
Rent-A-Center, Inc. FRS
BTL-B
4.75% (1 ML+4.00%)
due 02/17/2028 | | | 50,228 | | | | 50,395 | |
| | | | | | |
|
|
|
Research & Development — 0.0% | |
PAREXEL International Corp. FRS
BTL
2.86% (1 ML+2.75%)
due 09/27/2024 | | | 125,205 | | | | 123,640 | |
| | | | | | |
|
|
|
Resort/Theme Parks — 0.1% | |
SeaWorld Parks & Entertainment, Inc. FRS
BTL-B5
3.75% (1 ML+3.00%)
due 03/31/2024 | | | 207,821 | | | | 204,011 | |
| | | | | | |
|
|
|
Retail-Auto Parts — 0.0% | |
LS Group OpCo Acquistion LLC FRS
BTL-B
4.25% (6 ML+3.50%)
due 11/02/2027 | | | 85,924 | | | | 85,852 | |
| | | | | | |
|
|
|
Retail-Building Products — 0.0% | |
LBM Acquisition LLC FRS
Delayed Draw
coupon TBD
due 12/17/2027(20) | | | 11,812 | | | | 11,750 | |
LBM Acquisition LLC FRS
BTL-B
4.50% (3 ML+3.75%)
due 12/17/2027 | | | 53,156 | | | | 52,873 | |
| | | | | | |
|
|
|
| | | | | | | | 64,623 | |
| | | | | | |
|
|
|
Retail-Petroleum Products — 0.0% | |
EG America LLC FRS
BTL
4.20% (3 ML+4.00%)
due 02/07/2025 | | | 135,128 | | | | 132,797 | |
| | | | | | |
|
|
|
Retail-Restaurants — 0.1% | |
IRB Holding Corp. FRS
BTL-B
2.95% (3 ML+2.75%)
due 02/05/2025 | | | 136,826 | | | | 135,604 | |
Whatabrands LLC FRS
BTL-B
2.86% (1 ML+2.75%)
due 07/31/2026 | | | 120,608 | | | | 119,873 | |
AIG Strategic Bond Fund
PORTFOLIO OF INVESTMENTS — March 31, 2021 — (continued)
| | | | | | | | |
| Security Description | |
Principal
Amount(19) | | |
Value
(Note 2) | |
| |
LOANS(9)(10)(11) (continued) | |
Retail-Restaurants (continued) | |
Wok Holdings, Inc. FRS
BTL
6.36% (1 ML+6.25%)
due 03/01/2026 | | $ | 108,755 | | | $ | 103,589 | |
Zaxby’s Operating Co. LP FRS
1st Lien
4.50% (1 ML+3.75%)
due 12/28/2027 | | | 62,788 | | | | 62,690 | |
| | | | | | |
|
|
|
| | | | | | | | 421,756 | |
| | | | | | |
|
|
|
Rubber/Plastic Products — 0.0% | |
Gates Global LLC FRS
BTL-B3
3.50% (1 ML+2.75%)
due 03/31/2027 | | | 84,692 | | | | 84,428 | |
| | | | | | |
|
|
|
Satellite Telecom — 0.1% | |
Connect Finco SARL FRS
BTL-B
4.50% (1 ML+3.50%)
due 12/11/2026 | | | 115,830 | | | | 115,280 | |
Intelsat Jackson Holdings SA FRS
DIP
6.50% (3 ML+5.50%)
due 07/13/2022 | | | 38,018 | | | | 38,493 | |
Intelsat Jackson Holdings SA FRS
BTL-B3
8.00% (USFRBPLR+4.75%)
due 11/27/2023(12) | | | 184,000 | | | | 186,683 | |
Iridium Satellite LLC FRS
BTL-B
3.75% (1 ML+2.75%)
due 11/04/2026 | | | 118,303 | | | | 118,515 | |
| | | | | | |
|
|
|
| | | | | | | | 458,971 | |
| | | | | | |
|
|
|
Telecom Services — 0.0% | |
West Corp. FRS
BTL-B1
4.50% (3 ML+3.50%)
due 10/10/2024 | | | 116,368 | | | | 111,589 | |
| | | | | | |
|
|
|
Telecommunication Equipment — 0.0% | |
CommScope, Inc. FRS
BTL-B
3.36% (1 ML+3.25%)
due 04/06/2026 | | | 103,981 | | | | 103,201 | |
| | | | | | |
|
|
|
Telephone-Integrated — 0.1% | |
CenturyLink, Inc. FRS
BTL-B
2.36% (1 ML+2.25%)
due 03/15/2027 | | | 93,955 | | | | 92,825 | |
Zayo Group Holdings, Inc. FRS
BTL
3.11% (1 ML+3.00%)
due 03/09/2027 | | | 156,641 | | | | 155,243 | |
| | | | | | |
|
|
|
| | | | | | | | 248,068 | |
| | | | | | |
|
|
|
| |
| | |
Theaters — 0.2% | |
William Morris Endeavor Entertainment LLC FRS
BTL-B1
2.94% (3 ML+2.75%)
due 05/18/2025 | | $ | 562,550 | | | $ | 529,676 | |
| | | | | | |
|
|
|
Transactional Software — 0.0% | |
Solera LLC FRS
BTL-B
2.86% (1 ML+2.75%)
due 03/03/2023 | | | 122,390 | | | | 121,612 | |
| | | | | | |
|
|
|
Total Loans | | | | | | | | |
(cost $17,040,705) | | | | | | | 16,087,417 | |
| | | | | | |
|
|
|
COMMON STOCKS — 0.0% | |
Building Products-Air & Heating — 0.0% | |
API Heat Transfer, Inc.†(4)(5) | | | 171,230 | | | | 0 | |
| | | | | | |
|
|
|
Oil Field Machinery & Equipment — 0.0% | |
Hi-Crush, Inc.(4) | | | 14,240 | | | | 2,421 | |
| | | | | | |
|
|
|
Pharmacy Services — 0.0% | |
Akorn Operating Co. LLC | | | 4,216 | | | | 64,821 | |
| | | | | | |
|
|
|
Total Common Stocks | | | | | | | | |
(cost $140,109) | | | | | | | 67,242 | |
| | | | | | |
|
|
|
PREFERRED SECURITIES — 0.0% | |
Building Products-Air & Heating — 0.0% | |
API Heat Transfer, Inc.
Class A 8.63%†(4)(5)(17) | | | 37 | | | | 0 | |
| | | | | | |
|
|
|
Sovereign Agency — 0.0% | |
Federal Home Loan Mtg. Corp.
Series Z
8.38%† | | | 5,875 | | | | 29,610 | |
| | | | | | |
|
|
|
Total Preferred Securities | | | | | | | | |
(cost $127,205) | | | | | | | 29,610 | |
| | | | | | |
|
|
|
PREFERRED SECURITIES/CAPITAL SECURITIES — 1.4% | |
Banks-Money Center — 0.1% | |
BBVA Bancomer SA
5.13% due 01/18/2033* | | | 201,000 | | | | 206,781 | |
| | | | | | |
|
|
|
Building & Construction-Misc. — 0.2% | |
China Minmetals Corp.
3.75% due 11/13/2022(13) | | | 635,000 | | | | 647,700 | |
| | | | | | |
|
|
|
Diversified Banking Institutions — 0.0% | |
JPMorgan Chase & Co.
Series U
6.13% due 04/30/2024(13) | | | 134,000 | | | | 143,606 | |
| | | | | | |
|
|
|
Electric-Distribution — 0.1% | |
National Rural Utilities Cooperative Finance Corp.
4.75% due 04/30/2043 | | | 201,000 | | | | 206,306 | |
| | | | | | |
|
|
|
Electric-Generation — 0.0% | |
Electricite de France SA
4.00% due 07/04/2024(13) | | | EUR 100,000 | | | | 126,798 | |
| | | | | | |
|
|
|
AIG Strategic Bond Fund
PORTFOLIO OF INVESTMENTS — March 31, 2021 — (continued)
| | | | | | | | |
| Security Description | |
Principal
Amount(19) | | |
Value
(Note 2) | |
| | | | | | | | |
PREFERRED SECURITIES/CAPITAL SECURITIES (continued) | |
Electric-Integrated — 0.1% | |
CMS Energy Corp.
3.75% due 12/01/2050 | | $ | 44,000 | | | $ | 43,560 | |
CMS Energy Corp.
4.75% due 06/01/2050 | | | 63,000 | | | | 68,040 | |
Dominion Resources, Inc.
5.75% due 10/01/2054 | | | 64,000 | | | | 69,312 | |
| | | | | | |
|
|
|
| | | | | | | | 180,912 | |
| | | | | | |
|
|
|
Food-Dairy Products — 0.1% | |
Land O’Lakes Capital Trust I
7.45% due 03/15/2028* | | | 414,000 | | | | 480,240 | |
| | | | | | |
|
|
|
Insurance-Life/Health — 0.1% | |
M&G PLC
5.56% due 07/20/2055 | | GBP | 100,000 | | | | 158,099 | |
Prudential Financial, Inc.
5.70% due 09/15/2048 | | | 122,000 | | | | 139,330 | |
Voya Financial, Inc.
4.70% due 01/23/2048 | | | 77,000 | | | | 78,540 | |
| | | | | | |
|
|
|
| | | | | | | | 375,969 | |
| | | | | | |
|
|
|
Insurance-Multi-line — 0.1% | |
Aegon NV
4.00% due 04/25/2044 | | EUR | 145,000 | | | | 185,618 | |
Allianz SE
4.75% due 10/24/2023(13) | | EUR | 200,000 | | | | 260,984 | |
| | | | | | |
|
|
|
| | | | | | | | 446,602 | |
| | | | | | |
|
|
|
Insurance-Mutual — 0.1% | |
Liberty Mutual Group, Inc.
4.30% due 02/01/2061* | | | 285,000 | | | | 256,140 | |
| | | | | | |
|
|
|
Medical-Drugs — 0.0% | |
Merck KGaA
1.63% due 09/09/2080 | | EUR | 100,000 | | | | 119,627 | |
| | | | | | |
|
|
|
Metal-Aluminum — 0.1% | |
Chalco Hong Kong Investment Co., Ltd.
4.25% due 11/07/2021(13) | | | 400,000 | | | | 403,000 | |
| | | | | | |
|
|
|
Metal-Diversified — 0.1% | |
Chinalco Capital Holdings, Ltd.
4.10% due 09/11/2024(13) | | | 200,000 | | | | 208,100 | |
| | | | | | |
|
|
|
Oil Companies-Integrated — 0.1% | |
BP Capital Markets PLC
4.88% due 03/22/2030(13) | | | 112,000 | | | | 119,980 | |
TOTAL SE
1.75% due 04/04/2024(13) | | EUR | 125,000 | | | | 149,519 | |
| | | | | | |
|
|
|
| | | | | | | | 269,499 | |
| | | | | | |
|
|
|
Pipelines — 0.0% | |
EnLink Midstream Partners LP
6.00% due 12/15/2022(13) | | | 45,000 | | | | 27,900 | |
Enterprise Products Operating LLC
5.25% due 08/16/2077† | | | 45,000 | | | | 44,853 | |
| | | | | | |
|
|
|
| | | | | | | | 72,753 | |
| | | | | | |
|
|
|
| |
| | |
Tools-Hand Held — 0.0% | |
Stanley Black & Decker, Inc.
4.00% due 03/15/2060 | | $ | 134,000 | | | $ | 141,859 | |
| | | | | | |
|
|
|
Transport-Equipment & Leasing — 0.2% | |
AerCap Global Aviation Trust
6.50% due 06/15/2045* | | | 715,000 | | | | 745,388 | |
| | | | | | |
|
|
|
Total Preferred Securities/Capital Securities | | | | | | | | |
(cost $4,861,625) | | | | | | | 5,031,280 | |
| | | | | | |
|
|
|
ESCROWS AND LITIGATION TRUSTS — 0.0% | |
Hellas Telecommunications Luxembourg II SCA
Sub. Notes
8.46% due 01/15/2015†(4)(12)(14) | | | 1,330,000 | | | | 0 | |
ION Media Networks, Inc.†(4) | | | 655 | | | | 7,877 | |
Waterford Gaming LLC/Waterford Gaming Financial Corp.
Escrow Notes
8.63% due 09/15/2014*†(4) | | | 459,551 | | | | 2,895 | |
| | | | | | |
|
|
|
Total Escrows and Litigation Trusts | | | | | | | | |
(cost $1,813,126) | | | | | | | 10,772 | |
| | | | | | |
|
|
|
Total Long-Term Investment Securities | | | | | | | | |
(cost $350,018,795 ) | | | | | | | 352,432,237 | |
| | | | | | |
|
|
|
SHORT-TERM INVESTMENT SECURITIES — 6.1% | |
Registered Investment Companies — 6.1% | |
State Street Institutional U.S. Government Money Market Fund, Premier Class
0.04%(18)
(cost $22,355,672) | | | 22,355,672 | | | | 22,355,672 | |
| | | | | | |
|
|
|
TOTAL INVESTMENTS | | | | | | | | |
(cost $372,374,467)(16) | | | 102.1 | % | | | 374,787,909 | |
Liabilities in excess of other assets | | | (2.1 | ) | | | (7,679,324 | ) |
| | |
|
|
| |
|
|
|
NET ASSETS | | | 100.0 | % | | $ | 367,108,585 | |
| | |
|
|
| |
|
|
|
| * | Securities exempt from registration under Rule 144A of the Securities Act of 1933. These securities may be sold in transactions exempt from registration, normally to qualified institutional buyers. The Fund has no right to demand registration of these securities. At March 31, 2021, the aggregate value of these securities was $123,477,635 representing 33.6% of net assets. |
| † | Non-income producing security |
| (1) | Commercial Mortgage Backed Security |
| (2) | Certain variable rate securities are not based on a published reference rate and spread but are determined by the issuer or agent and are based on current market conditions. These securities do not indicate a reference rate and spread in their description above. |
| (3) | Collateralized Mortgage Obligation |
| (4) | Securities classified as Level 3 (see Note 2). |
| (5) | Denotes a restricted security that: (a) cannot be offered for public sale without first being registered, or being able to take advantage of an exemption from registration, under the Securities Act of 1933, as amended (the “1933 Act”); (b) is subject to a contractual restriction on public sales; or (c) is otherwise subject to a restriction on sales by operation of applicable law. Restricted securities are valued pursuant to Note 2. Certain restricted securities held by the Fund may not be sold except in exempt transactions or in a public offering registered under the 1933 Act. The Fund has no right to demand registration of these securities. The risk of investing in certain restricted securities is greater |
AIG Strategic Bond Fund
PORTFOLIO OF INVESTMENTS — March 31, 2021 — (continued)
| | than the risk of investing in the securities of widely held, publicly traded companies. To the extent applicable, lack of a secondary market and resale restrictions may result in the inability of a Fund to sell a security at a fair price and may substantially delay the sale of the security. In addition, certain restricted securities may exhibit greater price volatility than securities for which secondary markets exist. As of March 31, 2021, the Fund held the following restricted securities: |
| | | | | | | | | | | | | | | | | | | | | | | | |
Description
| | Acquisition
Date
| | | Principal
Amount/
Shares
| | | Acquisition
Cost
| | | Value
| | | Value
per
Principal
amount/
Share
| | | % of
Net
Assets
| |
Convertible Bond | | | | | | | | | | | | | | | | | | | | | | | | |
| | | | | | |
Hi-Crush, Inc. | | | 10/08/2020 | | | $ | 260,000 | | | $ | 235,657 | | | $ | 260,000 | | | $ | 100.00 | | | | 0.07 | % |
Loans | | | | | | | | | | | | | | | | | | | | | | | | |
| | | | | | |
API Heat Transfer ThermaSys Corp. 0.00% due 12/29/2023 | | | 12/31/2018 | | | | 179,888 | | | | 179,888 | | | | 76,452 | | | | 42.50 | | | | 0.02 | |
RentPath LLC 1.61% due 12/17/2022 | | | 05/14/2015 | | | | 493,906 | | | | 487,467 | | | | | | | | | | | | | |
| | | | 06/09/2015 | | | | 200,000 | | | | 197,908 | | | | | | | | | | | | | |
| | | | 01/18/2017 | | | | 4,000 | | | | 3,711 | | | | | | | | | | | | | |
| | | | 06/21/2017 | | | | 365,000 | | | | 363,063 | | | | | | | | | | | | | |
| | | | | | |
|
|
| |
|
|
| | | | | | | | | | | | |
| | | | | | | | 1,062,906 | | | | 1,052,149 | | | | 159,436 | | | | 15.00 | | | | 0.04 | |
| | | | | | |
|
|
| |
|
|
| | | | | | | | | | | | |
Common Stocks | | | | | | | | | | | | | | | | | | | | | | | | |
| | | | | | |
API Heat Transfer, Inc. | | | 12/31/2018 | | | | 171,230 | | | | 56,506 | | | | 0 | | | | 0.00 | | | | 0.00 | |
Hi-Crush, Inc. | | | 01/29/2021 | | | | 14,240 | | | | 18,782 | | | | 2,421 | | | | 0.17 | | | | 0.00 | |
Preferred Securities | | | | | | | | | | | | | | | | | | | | | |
| | | | | | |
API Heat Transfer, Inc. Class A | | | 12/31/2018 | | | | 37 | | | | 36,495 | | | | 0 | | | | 0.00 | | | | 0.00 | |
| | | | | | | | | | | | | | |
|
|
| | | | | |
|
|
|
| | | | | | | | | | | | | | | $ | 498,309 | | | | | | | | 0.13 | % |
| | | | | | | | | | | | | | |
|
|
| | | | | |
|
|
|
| (6) | PIK (“Payment-in-Kind”) security—Income may be paid in additional securities or cash at the discretion of the issuer. The security is currently paying interest in cash at the coupon rate listed. |
| (8) | Inverse Floating Rate Security that pays interest that varies inversely to changes in the market interest rates. The interest rate shown is the current interest rate at March 31, 2021. |
| (9) | Senior loans in the Fund are generally subject to mandatory and/or optional prepayment. Because of these mandatory prepayment conditions and because there may be significant economic incentives for a borrower to prepay, prepayments may occur. As a result, the actual remaining maturity may be substantially less than the stated maturities shown. |
| (10) | The Fund invests in senior loans which generally pay interest at rates which are periodically re-determined by reference to a base lending rate plus a premium. These base lending rates are generally either the lending rate offered by one or more major European banks, such as the London Inter-Bank Offered Rate (“LIBOR”) or the prime rate offered by one or more major United States banks, or the certificate of deposit rate. Senior loans are generally considered to be restrictive in that the Fund is ordinarily contractually obligated to receive approval from the Agent Bank and/or borrower prior to the disposition of a senior loan. |
| (11) | All loans in the Fund were purchased through assignment agreements unless otherwise indicated. |
| (12) | Company has filed for bankruptcy protection. |
| (13) | Perpetual maturity—maturity date reflects the next call date. |
| (14) | Security in default of interest and principal at maturity. |
| (15) | PIK (“Payment-in-Kind”) security-Income may be paid in additional securities or cash at the discretion of the issuer. The security is currently paying interest in cash at 0.25%. The security is also currently paying interest in the form of additional loans at 12.00%. |
| (16) | See Note 5 for cost of investments on a tax basis. |
| (17) | Traded in Units. 1 unit equals 1,000 shares. |
| (18) | The rate shown is the 7-day yield as of March 31, 2021. |
| (19) | Denominated in United States dollars unless otherwise indicated. |
| (20) | All or a portion of this holding is subject to unfunded loan commitments. |
| (21) | Security in default of interest. |
| (22) | PIK (“Payment-in-Kind”) security-Income may be paid in additional securities or cash at the discretion of the issuer. The security is currently paying interest in cash at 2.50%. The security is also currently paying interest in the form of additional loans at 6.50%. |
| DIP — | Debtor in Possession |
| REMIC — | Real Estate Mortgage Investment Conduit |
| TBA — | Securities purchased on a forward commitment basis with an approximate principal amount and no definite maturity date. The actual principal amount and maturity date will be determined upon settlement date. |
| TBD — | Senior loan purchased on a when issued or delayed-delivery basis. Certain details associated with this purchase are not known prior to the settlement date of the transaction. In addition, senior loans typically trade without accrued interest and therefore a coupon rate is not available prior to the settlement. |
| ULC — | Unlimited Liability Corp. |
| FRS — | Floating Rate Security |
| VRS — | Variable Rate Security |
The rates shown on FRS and VRS are the current interest rates at March 31, 2021 and unless noted otherwise, the dates are the original maturity dates.
Currency Legend
EUR – Euro Currency
GBP – British Pound
Index Legend
| 12 | ML — 12 Month USD LIBOR |
| 1 | Yr USTYCR — 1 Year US Treasury Yield Curve Rate |
| USFRBPLR — | US Federal Reserve Bank Prime Loan Rate |
Forward Foreign Currency Contracts
| | | | | | | | | | | | | | | | | | | | | | | | | | |
| Counterparty | | Contract to
Deliver | | | In Exchange
For | | | Delivery
Date | | | Unrealized
Appreciation | | | Unrealized
(Depreciation) | |
JPMorgan Chase Bank N.A. | | | EUR | | | | 4,667,000 | | | USD | | | 5,686,331 | | | | 04/15/2021 | | | $ | 212,319 | | | $ | — | |
| | | | EUR | | | | 8,695,000 | | | USD | | | 10,557,113 | | | | 06/10/2021 | | | | 346,586 | | | | — | |
| | | | GBP | | | | 1,711,000 | | | USD | | | 2,397,880 | | | | 04/15/2021 | | | | 39,029 | | | | — | |
| | | | USD | | | | 1,145,447 | | | EUR | | | 950,000 | | | | 04/15/2021 | | | | — | | | | (31,175 | ) |
| | | | USD | | | | 163,276 | | | GBP | | | 117,000 | | | | 04/15/2021 | | | | — | | | | (1,975 | ) |
| | | | | | | | | | | | | | | | | | | | |
|
|
| |
|
|
|
Unrealized Appreciation(Depreciation) | | | $ | 597,934 | | | $ | (33,150 | ) |
| | | | | | | | | | |
|
|
| |
|
|
|
| USD — | United Stated Dollar |
AIG Strategic Bond Fund
PORTFOLIO OF INVESTMENTS — March 31, 2021 — (continued)
The following is a summary of the inputs used to value the Fund’s net assets as of March 31, 2021 (see Note 2):
| | | | | | | | | | | | | | | | |
| | | Level 1 — Unadjusted
Quoted Prices
| | | Level 2 — Other
Observable Inputs
| | | Level 3 — Significant
Unobservable Inputs
| | | Total
| |
ASSETS: | | | | | | | | | | | | | | | | |
Investments at Value:* | | | | | | | | | | | | | | | | |
Asset Backed Securities | | $ | — | | | $ | 3,811,202 | | | $ | — | | | $ | 3,811,202 | |
U.S. Convertible Bonds & Notes | | | — | | | | — | | | | 260,000 | | | | 260,000 | |
U.S. Corporate Bonds & Notes | | | — | | | | 138,649,417 | | | | — | | | | 138,649,417 | |
Foreign Corporate Bonds & Notes | | | — | | | | 61,755,376 | | | | — | | | | 61,755,376 | |
Foreign Government Obligations | | | — | | | | 66,973,058 | | | | — | | | | 66,973,058 | |
U.S. Government Agencies | | | — | | | | 55,898,123 | | | | — | | | | 55,898,123 | |
U.S. Government Treasuries | | | — | | | | 3,858,740 | | | | — | | | | 3,858,740 | |
Loans: | | | | | | | | | | | | | | | | |
Building Products-Air & Heating | | | — | | | | — | | | | 76,452 | | | | 76,452 | |
E-Commerce/Services | | | — | | | | — | | | | 159,436 | | | | 159,436 | |
Other Industries | | | — | | | | 15,851,529 | | | | — | | | | 15,851,529 | |
Common Stocks: | | | | | | | | | | | | | | | | |
Pharmacy Services | | | — | | | | 64,821 | | | | — | | | | 64,821 | |
Other Industries | | | — | | | | — | | | | 2,421 | | | | 2,421 | |
Preferred Securities: | | | | | | | | | | | | | | | | |
Building Products-Air & Heating | | | — | | | | — | | | | 0 | | | | 0 | |
Sovereign Agency | | | 29,610 | | | | — | | | | — | | | | 29,610 | |
Preferred Securities/Capital Securities | | | — | | | | 5,031,280 | | | | — | | | | 5,031,280 | |
Escrows and Litigation Trusts | | | — | | | | — | | | | 10,772 | | | | 10,772 | |
Short-Term Investment Securities | | | 22,355,672 | | | | — | | | | — | | | | 22,355,672 | |
| | |
|
|
| |
|
|
| |
|
|
| |
|
|
|
Total Investments at Value | | $ | 22,385,282 | | | $ | 351,893,546 | | | $ | 509,081 | | | $ | 374,787,909 | |
| | |
|
|
| |
|
|
| |
|
|
| |
|
|
|
Other Financial Instruments:+ | | | | | | | | | | | | | | | | |
| | | | |
Forward Foreign Currency Contracts | | $ | — | | | $ | 597,934 | | | $ | — | | | $ | 597,934 | |
| | |
|
|
| |
|
|
| |
|
|
| |
|
|
|
| | | | |
LIABILITIES: | | | | | | | | | | | | | | | | |
Other Financial Instruments:+ | | | | | | | | | | | | | | | | |
| | | | |
Forward Foreign Currency Contracts | | $ | — | | | $ | 33,150 | | | $ | — | | | $ | 33,150 | |
| | |
|
|
| |
|
|
| |
|
|
| |
|
|
|
| * | For a detailed presentation of investments, please refer to the Portfolio of Investments. |
| + | Amounts represent unrealized appreciation/depreciation as of the end of the reporting period. |
At the beginning and end of the reporting period, Level 3 investments were not considered a material portion of the Fund. There were no Level 3 transfers during the reporting period.
See Notes to Financial Statements
AIG Flexible Credit Fund
PORTFOLIO PROFILE — March 31, 2021 — (unaudited)
Industry Allocation*
| | | | |
Medical-Hospitals | | | 3.8 | % |
Oil Companies-Exploration & Production | | | 3.8 | |
Auto/Truck Parts & Equipment-Original | | | 3.3 | |
Enterprise Software/Service | | | 2.9 | |
Cable/Satellite TV | | | 2.7 | |
Airlines | | | 2.5 | |
Broadcast Services/Program | | | 2.4 | |
Registered Investment Companies | | | 2.2 | |
Food-Misc./Diversified | | | 1.9 | |
Real Estate Investment Trusts | | | 1.9 | |
Telephone-Integrated | | | 1.7 | |
Containers-Metal/Glass | | | 1.7 | |
Containers-Paper/Plastic | | | 1.7 | |
Pipelines | | | 1.6 | |
Applications Software | | | 1.6 | |
Machinery-Pumps | | | 1.5 | |
E-Commerce/Services | | | 1.5 | |
Machinery-Electrical | | | 1.5 | |
Chemicals-Specialty | | | 1.5 | |
Casino Hotels | | | 1.3 | |
Medical Labs & Testing Services | | | 1.2 | |
Computer Services | | | 1.2 | |
Gambling (Non-Hotel) | | | 1.2 | |
Chemicals-Diversified | | | 1.2 | |
Satellite Telecom | | | 1.2 | |
Medical-Drugs | | | 1.2 | |
Steel-Producers | | | 1.2 | |
Casino Services | | | 1.1 | |
Paper & Related Products | | | 1.0 | |
Aerospace/Defense-Equipment | | | 1.0 | |
Oil-Field Services | | | 1.0 | |
Building & Construction Products-Misc. | | | 0.9 | |
Computers-Integrated Systems | | | 0.9 | |
Rubber/Plastic Products | | | 0.9 | |
Cruise Lines | | | 0.9 | |
Auto-Cars/Light Trucks | | | 0.9 | |
Distribution/Wholesale | | | 0.9 | |
Oil Refining & Marketing | | | 0.8 | |
Medical Information Systems | | | 0.8 | |
Medical Products | | | 0.8 | |
Medical-HMO | | | 0.8 | |
Food-Dairy Products | | | 0.8 | |
Investment Companies | | | 0.8 | |
Retail-Sporting Goods | | | 0.7 | |
Electric-Integrated | | | 0.7 | |
Food-Catering | | | 0.7 | |
Telecom Services | | | 0.7 | |
Insurance-Multi-line | | | 0.7 | |
Theaters | | | 0.7 | |
Human Resources | | | 0.7 | |
Food-Confectionery | | | 0.7 | |
Cellular Telecom | | | 0.7 | |
Transport-Equipment & Leasing | | | 0.7 | |
Medical-Wholesale Drug Distribution | | | 0.7 | |
Hotels/Motels | | | 0.7 | |
Diversified Minerals | | | 0.6 | |
Insurance-Property/Casualty | | | 0.6 | |
Commercial Services | | | 0.6 | |
E-Commerce/Products | | | 0.5 | |
Pollution Control | | | 0.5 | |
| | | | |
Finance-Credit Card | | | 0.5 | % |
Publishing-Books | | | 0.5 | |
Security Services | | | 0.5 | |
Data Processing/Management | | | 0.5 | |
Food-Retail | | | 0.5 | |
Cosmetics & Toiletries | | | 0.5 | |
Auto-Heavy Duty Trucks | | | 0.5 | |
Finance-Investment Banker/Broker | | | 0.5 | |
Electric-Generation | | | 0.5 | |
Food-Wholesale/Distribution | | | 0.5 | |
Professional Sports | | | 0.5 | |
Retail-Pet Food & Supplies | | | 0.5 | |
Technology Services | | | 0.5 | |
Oil & Gas Drilling | | | 0.5 | |
Retail-Building Products | | | 0.4 | |
Precious Metals | | | 0.4 | |
Retail-Restaurants | | | 0.4 | |
Miscellaneous Manufacturing | | | 0.4 | |
Vitamins & Nutrition Products | | | 0.4 | |
Coal | | | 0.4 | |
Tobacco | | | 0.4 | |
Aerospace/Defense | | | 0.4 | |
Internet Connectivity Services | | | 0.4 | |
Retail-Propane Distribution | | | 0.4 | |
Internet Content-Information/News | | | 0.4 | |
Building-Residential/Commercial | | | 0.4 | |
Telecommunication Equipment | | | 0.4 | |
Finance-Consumer Loans | | | 0.4 | |
Electronics-Military | | | 0.4 | |
Metal-Copper | | | 0.3 | |
Office Automation & Equipment | | | 0.3 | |
Schools | | | 0.3 | |
MRI/Medical Diagnostic Imaging | | | 0.3 | |
Housewares | | | 0.3 | |
Research & Development | | | 0.3 | |
Retail-Arts & Crafts | | | 0.3 | |
Veterinary Diagnostics | | | 0.3 | |
Retail-Automobile | | | 0.3 | |
Soap & Cleaning Preparation | | | 0.3 | |
Athletic Equipment | | | 0.3 | |
Advertising Sales | | | 0.3 | |
Computers-Memory Devices | | | 0.3 | |
Retail-Pawn Shops | | | 0.3 | |
Computer Software | | | 0.3 | |
Medical-Generic Drugs | | | 0.3 | |
Energy-Alternate Sources | | | 0.3 | |
Wireless Equipment | | | 0.3 | |
Commercial Services-Finance | | | 0.3 | |
Machinery-Thermal Process | | | 0.3 | |
Retail-Bedding | | | 0.3 | |
Building Products-Wood | | | 0.3 | |
Building & Construction-Misc. | | | 0.3 | |
Food-Flour & Grain | | | 0.3 | |
Non-Hazardous Waste Disposal | | | 0.2 | |
Pharmacy Services | | | 0.2 | |
Entertainment Software | | | 0.2 | |
Dialysis Centers | | | 0.2 | |
Footwear & Related Apparel | | | 0.2 | |
Internet Infrastructure Software | | | 0.2 | |
Diagnostic Equipment | | | 0.2 | |
Engineering/R&D Services | | | 0.2 | |
AIG Flexible Credit Fund
PORTFOLIO PROFILE — March 31, 2021 — (unaudited) (continued)
Industry Allocation* (continued)
| | | | |
Beverages-Non-alcholic | | | 0.2 | % |
Finance-Leasing Companies | | | 0.2 | |
Medical-Outpatient/Home Medical | | | 0.2 | |
Retail-Regional Department Stores | | | 0.2 | |
Radio | | | 0.2 | |
Diagnostic Kits | | | 0.2 | |
Beverages-Wine/Spirits | | | 0.2 | |
Financial Guarantee Insurance | | | 0.2 | |
Metal Processors & Fabrication | | | 0.2 | |
Semiconductor Equipment | | | 0.2 | |
Consulting Services | | | 0.2 | |
Storage/Warehousing | | | 0.2 | |
Mining Services | | | 0.1 | |
Building-Heavy Construction | | | 0.1 | |
Advanced Materials | | | 0.1 | |
Machinery-General Industrial | | | 0.1 | |
Leisure Products | | | 0.1 | |
Leisure Games | | | 0.1 | |
Internet Financial Services | | | 0.1 | |
Medical-Biomedical/Gene | | | 0.1 | |
Home & Office Products | | | 0.1 | |
Brewery | | | 0.1 | |
| | |
|
|
|
| | | | 102.1 | % |
| | |
|
|
|
Credit Quality†#
| | | | |
Baa | | | 2.6 | % |
Ba | | | 17.5 | |
B | | | 53.0 | |
Caa | | | 17.3 | |
Ca | | | 0.4 | |
Not Rated@ | | | 9.2 | |
| | |
|
|
|
| | | | 100.0 | % |
| | |
|
|
|
| * | | Calculated as a percentage of net assets |
| # | | Calculated as a percentage of total debt issues, excluding short-term securities. |
| @ | | Represents debt issues that either have no rating, or the rating is unavailable from the data source. |
AIG Flexible Credit Fund
PORTFOLIO OF INVESTMENTS — March 31, 2021
| | | | | | | | |
| Security Description | |
Principal
Amount | | | Value
(Note 2) | |
| |
U.S. CORPORATE BONDS & NOTES — 42.2% | | | | | | | | |
Advertising Sales — 0.0% | | | | | | | | |
Clear Channel Outdoor Holdings, Inc.
Company Guar. Notes
7.75% due 04/15/2028* | | $ | 10,000 | | | $ | 9,913 | |
| | | | | | |
|
|
|
Aerospace/Defense — 0.4% | |
Boeing Co.
Senior Notes
5.93% due 05/01/2060 | | | 709,000 | | | | 906,966 | |
| | | | | | |
|
|
|
Aerospace/Defense-Equipment — 1.0% | |
Spirit AeroSystems, Inc.
Company Guar. Notes
3.95% due 06/15/2023 | | | 435,000 | | | | 430,650 | |
Spirit AeroSystems, Inc.
Senior Sec. Notes
5.50% due 01/15/2025* | | | 745,000 | | | | 787,837 | |
TransDigm, Inc.
Company Guar. Notes
5.50% due 11/15/2027 | | | 1,060,000 | | | | 1,095,775 | |
| | | | | | |
|
|
|
| | | | | | | | 2,314,262 | |
| | | | | | |
|
|
|
Airlines — 1.2% | | | | | | | | |
American Airlines Group, Inc.
Company Guar. Notes
5.00% due 06/01/2022* | | | 385,000 | | | | 378,263 | |
American Airlines, Inc.
Senior Sec. Notes
11.75% due 07/15/2025* | | | 1,475,000 | | | | 1,823,469 | |
Delta Air Lines, Inc.
Senior Notes
3.75% due 10/28/2029 | | | 630,000 | | | | 613,874 | |
| | | | | | |
|
|
|
| | | | | | | | 2,815,606 | |
| | | | | | |
|
|
|
Applications Software — 0.5% | | | | | | | | |
SS&C Technologies, Inc.
Company Guar. Notes
5.50% due 09/30/2027* | | | 1,030,000 | | | | 1,095,920 | |
| | | | | | |
|
|
|
Athletic Equipment — 0.3% | |
Vista Outdoor, Inc.
Company Guar. Notes
4.50% due 03/15/2029* | | | 690,000 | | | | 682,724 | |
| | | | | | |
|
|
|
Auto-Cars/Light Trucks — 0.7% | |
Ford Motor Co.
Senior Notes
9.00% due 04/22/2025 | | | 274,000 | | | | 331,846 | |
Ford Motor Co.
Senior Notes
9.63% due 04/22/2030 | | | 181,000 | | | | 252,593 | |
Ford Motor Credit Co. LLC
Senior Notes
4.13% due 08/17/2027 | | | 660,000 | | | | 681,450 | |
Ford Motor Credit Co. LLC
Senior Notes
5.13% due 06/16/2025 | | | 235,000 | | | | 253,560 | |
| | | | | | |
|
|
|
| | | | | | | | 1,519,449 | |
| | | | | | |
|
|
|
Auto/Truck Parts & Equipment-Original — 0.8% | | | | | | | | |
American Axle & Manufacturing, Inc.
Company Guar. Notes
6.50% due 04/01/2027 | | | 900,000 | | | | 933,750 | |
| |
| | | | | | | | | |
Auto/Truck Parts & Equipment-Original (continued) | | | | | | | | |
Tenneco, Inc.
Senior Sec. Notes
5.13% due 04/15/2029* | | $ | 515,000 | | | $ | 507,764 | |
Tenneco, Inc.
Company Guar. Notes
5.38% due 12/15/2024 | | | 370,000 | | | | 370,925 | |
| | | | | | |
|
|
|
| | | | | | | | 1,812,439 | |
| | | | | | |
|
|
|
Beverages-Non-alcoholic — 0.1% | | | | | | | | |
Triton Water Holdings, Inc.
Senior Notes
6.25% due 04/01/2029* | | | 240,000 | | | | 244,800 | |
| | | | | | |
|
|
|
Broadcast Services/Program — 1.0% | |
Clear Channel Worldwide Holdings, Inc.
Senior Sec. Notes
5.13% due 08/15/2027* | | | 440,000 | | | | 442,882 | |
Clear Channel Worldwide Holdings, Inc.
Company Guar. Notes
9.25% due 02/15/2024 | | | 196,000 | | | | 203,899 | |
Diamond Sports Group LLC/Diamond Sports Finance Co.
Company Guar. Notes
6.63% due 08/15/2027* | | | 960,000 | | | | 504,000 | |
iHeartCommunications, Inc.
Company Guar. Notes
8.38% due 05/01/2027 | | | 809,966 | | | | 869,701 | |
Univision Communications, Inc.
Senior Sec. Notes
9.50% due 05/01/2025* | | | 165,000 | | | | 180,675 | |
| | | | | | |
|
|
|
| | | | | | | | 2,201,157 | |
| | | | | | |
|
|
|
Building & Construction Products-Misc. — 0.6% | | | | | | | | |
CP Atlas Buyer, Inc.
Senior Notes
7.00% due 12/01/2028* | | | 590,000 | | | | 620,119 | |
Louisiana-Pacific Corp.
Senior Notes
3.63% due 03/15/2029* | | | 870,000 | | | | 846,075 | |
| | | | | | |
|
|
|
| | | | | | | | 1,466,194 | |
| | | | | | |
|
|
|
Building & Construction-Misc. — 0.3% | | | | | | | | |
Weekley Homes LLC/Weekley Finance Corp.
Senior Notes
4.88% due 09/15/2028* | | | 570,000 | | | | 584,250 | |
| | | | | | |
|
|
|
Building-Heavy Construction — 0.1% | |
Dycom Industries, Inc.
Company Guar. Notes
4.50% due 04/15/2029* | | | 290,000 | | | | 290,447 | |
| | | | | | |
|
|
|
Building-Residential/Commercial — 0.4% | |
M/I Homes, Inc.
Company Guar. Notes
4.95% due 02/01/2028 | | | 635,000 | | | | 657,622 | |
PulteGroup, Inc.
Company Guar. Notes
7.88% due 06/15/2032 | | | 160,000 | | | | 225,109 | |
| | | | | | |
|
|
|
| | | | | | | | 882,731 | |
| | | | | | |
|
|
|
AIG Flexible Credit Fund
PORTFOLIO OF INVESTMENTS — March 31, 2021 — (continued)
| | | | | | | | |
| Security Description | |
Principal
Amount | | | Value
(Note 2) | |
| |
U.S. CORPORATE BONDS & NOTES (continued) | | | | | | | | |
Cable/Satellite TV — 2.1% | | | | | | | | |
CCO Holdings LLC/CCO Holdings Capital Corp.
Senior Notes
4.75% due 03/01/2030* | | $ | 500,000 | | | $ | 518,125 | |
CCO Holdings LLC/CCO Holdings Capital Corp.
Senior Notes
5.13% due 05/01/2027* | | | 825,000 | | | | 872,285 | |
CSC Holdings LLC
Senior Notes
5.75% due 01/15/2030* | | | 1,255,000 | | | | 1,321,822 | |
DISH DBS Corp.
Company Guar. Notes
5.00% due 03/15/2023 | | | 155,000 | | | | 161,704 | |
DISH DBS Corp.
Company Guar. Notes
7.75% due 07/01/2026 | | | 630,000 | | | | 693,945 | |
Radiate Holdco LLC/Radiate Finance, Inc.
Senior Sec. Notes
4.50% due 09/15/2026* | | | 295,000 | | | | 298,319 | |
Radiate Holdco LLC/Radiate Finance, Inc.
Senior Notes
6.50% due 09/15/2028* | | | 1,005,000 | | | | 1,061,230 | |
| | | | | | |
|
|
|
| | | | | | | | 4,927,430 | |
| | | | | | |
|
|
|
Casino Hotels — 0.3% | | | | | | | | |
Station Casinos LLC
Company Guar. Notes
4.50% due 02/15/2028* | | | 635,000 | | | | 631,825 | |
| | | | | | |
|
|
|
Casino Services — 0.3% | |
Caesars Entertainment, Inc.
Senior Sec. Notes
6.25% due 07/01/2025* | | | 390,000 | | | | 414,882 | |
Caesars Entertainment, Inc.
Senior Notes
8.13% due 07/01/2027* | | | 305,000 | | | | 336,476 | |
| | | | | | |
|
|
|
| | | | | | | | 751,358 | |
| | | | | | |
|
|
|
Cellular Telecom — 0.4% | | | | | | | | |
T-Mobile USA, Inc.
Company Guar. Notes
2.63% due 04/15/2026 | | | 125,000 | | | | 127,188 | |
T-Mobile USA, Inc.
Company Guar. Notes
3.38% due 04/15/2029 | | | 170,000 | | | | 171,751 | |
T-Mobile USA, Inc.
Company Guar. Notes
3.50% due 04/15/2031 | | | 610,000 | | | | 615,520 | |
| | | | | | |
|
|
|
| | | | | | | | 914,459 | |
| | | | | | |
|
|
|
Chemicals-Specialty — 0.3% | | | | | | | | |
Chemours Co.
Company Guar. Notes
5.75% due 11/15/2028* | | | 640,000 | | | | 673,866 | |
| | | | | | |
|
|
|
Coal — 0.4% | |
Alliance Resource Operating Partners LP/Alliance Resource Finance Corp.
Company Guar. Notes
7.50% due 05/01/2025* | | | 985,000 | | | | 916,897 | |
| | | | | | |
|
|
|
| |
| | | | | | | | | |
Commercial Services — 0.3% | |
Legends Hospitality Holding Co. LLC/Legends Hospitality Co-Issuer, Inc.
Senior Sec. Notes
5.00% due 02/01/2026* | | $ | 595,000 | | | $ | 605,413 | |
| | | | | | |
|
|
|
Computer Services — 0.7% | |
Banff Merger Sub, Inc.
Senior Notes
9.75% due 09/01/2026* | | | 530,000 | | | | 564,756 | |
Science Applications International Corp.
Company Guar. Notes
4.88% due 04/01/2028* | | | 1,105,000 | | | | 1,142,294 | |
| | | | | | |
|
|
|
| | | | | | | | 1,707,050 | |
| | | | | | |
|
|
|
Computer Software — 0.3% | | | | | | | | |
J2 Global, Inc.
Company Guar. Notes
4.63% due 10/15/2030* | | | 645,000 | | | | 653,646 | |
| | | | | | |
|
|
|
Computers-Integrated Systems — 0.2% | |
NCR Corp.
Company Guar. Notes
5.13% due 04/15/2029* | | | 575,000 | | | | 581,515 | |
| | | | | | |
|
|
|
Containers-Metal/Glass — 0.3% | |
BWAY Holding Co.
Senior Notes
7.25% due 04/15/2025* | | | 651,000 | | | | 651,000 | |
| | | | | | |
|
|
|
Containers-Paper/Plastic — 0.6% | |
Trident TPI Holdings, Inc.
Company Guar. Notes
6.63% due 11/01/2025* | | | 790,000 | | | | 803,825 | |
Trident TPI Holdings, Inc.
Company Guar. Notes
9.25% due 08/01/2024* | | | 490,000 | | | | 519,400 | |
| | | | | | |
|
|
|
| | | | | | | | 1,323,225 | |
| | | | | | |
|
|
|
Diagnostic Equipment — 0.2% | | | | | | | | |
Ortho-Clinical Diagnostics, Inc./Ortho-Clinical Diagnostics SA
Senior Notes
7.25% due 02/01/2028* | | | 234,000 | | | | 256,385 | |
Ortho-Clinical Diagnostics, Inc./Ortho-Clinical Diagnostics SA
Senior Notes
7.38% due 06/01/2025* | | | 252,000 | | | | 270,925 | |
| | | | | | |
|
|
|
| | | | | | | | 527,310 | |
| | | | | | |
|
|
|
Dialysis Centers — 0.2% | | | | | | | | |
DaVita, Inc.
Company Guar. Notes
4.63% due 06/01/2030* | | | 555,000 | | | | 564,518 | |
| | | | | | |
|
|
|
E-Commerce/Services — 0.9% | |
Cars.com, Inc.
Company Guar. Notes
6.38% due 11/01/2028* | | | 700,000 | | | | 728,875 | |
TripAdvisor, Inc
Company Guar. Notes
7.00% due 07/15/2025* | | | 550,000 | | | | 594,825 | |
AIG Flexible Credit Fund
PORTFOLIO OF INVESTMENTS — March 31, 2021 — (continued)
| | | | | | | | |
| Security Description | |
Principal
Amount | | | Value
(Note 2) | |
| |
U.S. CORPORATE BONDS & NOTES (continued) | | | | | | | | |
E-Commerce/Services (continued) | | | | | | | | |
Uber Technologies, Inc.
Company Guar. Notes
7.50% due 05/15/2025* | | $ | 730,000 | | | $ | 787,794 | |
| | | | | | |
|
|
|
| | | | | | | | 2,111,494 | |
| | | | | | |
|
|
|
Electric-Integrated — 0.6% | | | | | | | | |
PG&E Corp.
Senior Sec. Notes
5.25% due 07/01/2030 | | | 615,000 | | | | 652,853 | |
Talen Energy Supply LLC
Senior Sec. Notes
6.63% due 01/15/2028* | | | 750,000 | | | | 749,205 | |
| | | | | | |
|
|
|
| | | | | | | | 1,402,058 | |
| | | | | | |
|
|
|
Energy-Alternate Sources — 0.3% | | | | | | | | |
TerraForm Power Operating LLC
Company Guar. Notes
5.00% due 01/31/2028* | | | 590,000 | | | | 636,639 | |
| | | | | | |
|
|
|
Enterprise Software/Service — 0.5% | |
Rocket Software, Inc.
Senior Notes
6.50% due 02/15/2029* | | | 455,000 | | | | 459,095 | |
Veritas US, Inc./Veritas Bermuda, Ltd.
Senior Sec. Notes
7.50% due 09/01/2025* | | | 595,000 | | | | 618,800 | |
| | | | | | |
|
|
|
| | | | | | | | 1,077,895 | |
| | | | | | |
|
|
|
Entertainment Software — 0.2% | | | | | | | | |
Playtika Holding Corp.
Company Guar. Notes
4.25% due 03/15/2029* | | | 575,000 | | | | 566,490 | |
| | | | | | |
|
|
|
Finance-Consumer Loans — 0.4% | |
Navient Corp.
Senior Notes
5.88% due 10/25/2024 | | | 370,000 | | | | 388,540 | |
Springleaf Finance Corp.
Company Guar. Notes
6.88% due 03/15/2025 | | | 390,000 | | | | 443,596 | |
| | | | | | |
|
|
|
| | | | | | | | 832,136 | |
| | | | | | |
|
|
|
Financial Guarantee Insurance — 0.2% | | | | | | | | |
NMI Holdings, Inc.
Senior Sec. Notes
7.38% due 06/01/2025* | | | 340,000 | | | | 392,282 | |
| | | | | | |
|
|
|
Food-Catering — 0.3% | |
Aramark Services, Inc.
Company Guar. Notes
6.38% due 05/01/2025* | | | 670,000 | | | | 710,200 | |
| | | | | | |
|
|
|
Food-Dairy Products — 0.5% | |
Chobani LLC/Chobani Finance Corp., Inc.
Company Guar. Notes
7.50% due 04/15/2025* | | | 1,095,000 | | | | 1,139,490 | |
| | | | | | |
|
|
|
Food-Misc./Diversified — 0.6% | |
Dole Food Co., Inc.
Senior Sec. Notes
7.25% due 06/15/2025* | | | 670,000 | | | | 687,658 | |
Post Holdings, Inc.
Senior Notes
4.50% due 09/15/2031* | | | 720,000 | | | | 712,080 | |
| | | | | | |
|
|
|
| | | | | | | | 1,399,738 | |
| | | | | | |
|
|
|
| |
| | | | | | | | | |
Food-Retail — 0.5% | | | | | | | | |
Albertsons Cos, Inc./Safeway, Inc./New Albertsons LP/Albertsons LLC
Company Guar. Notes
4.63% due 01/15/2027* | | $ | 1,135,000 | | | $ | 1,176,365 | |
| | | | | | |
|
|
|
Food-Wholesale/Distribution — 0.5% | |
Matterhorn Merger Sub LLC/Matterhorn Finance Sub, Inc.
Senior Notes
8.50% due 06/01/2026* | | | 1,045,000 | | | | 1,068,512 | |
| | | | | | |
|
|
|
Footwear & Related Apparel — 0.2% | |
Crocs, Inc.
Company Guar. Notes
4.25% due 03/15/2029* | | | 555,000 | | | | 542,796 | |
| | | | | | |
|
|
|
Gambling (Non-Hotel) — 0.7% | |
Downstream Development Authority of the Quapaw Tribe of Oklahoma
Senior Sec. Notes
10.50% due 02/15/2023* | | | 610,000 | | | | 631,350 | |
Mohegan Gaming & Entertainment
Sec. Notes
8.00% due 02/01/2026* | | | 575,000 | | | | 580,106 | |
Scientific Games International, Inc.
Company Guar. Notes
8.25% due 03/15/2026* | | | 380,000 | | | | 407,550 | |
| | | | | | |
|
|
|
| | | | | | | | 1,619,006 | |
| | | | | | |
|
|
|
Hotels/Motels — 0.3% | | | | | | | | |
Marriott Ownership Resorts, Inc.
Company Guar. Notes
4.75% due 01/15/2028 | | | 610,000 | | | | 616,100 | |
| | | | | | |
|
|
|
Human Resources — 0.1% | |
Team Health Holdings, Inc.
Company Guar. Notes
6.38% due 02/01/2025* | | | 290,000 | | | | 255,542 | |
| | | | | | |
|
|
|
Insurance-Multi-line — 0.4% | |
Acrisure LLC/Acrisure Finance, Inc.
Senior Sec. Notes
4.25% due 02/15/2029* | | | 205,000 | | | | 201,607 | |
Acrisure LLC/Acrisure Finance, Inc.
Senior Notes
7.00% due 11/15/2025* | | | 710,000 | | | | 733,075 | |
| | | | | | |
|
|
|
| | | | | | | | 934,682 | |
| | | | | | |
|
|
|
Internet Connectivity Services — 0.4% | |
Northwest Fiber LLC/Northwest Fiber Finance Sub, Inc.
Senior Notes
10.75% due 06/01/2028* | | | 795,000 | | | | 898,111 | |
| | | | | | |
|
|
|
Investment Companies — 0.8% | |
Icahn Enterprises LP/Icahn Enterprises Finance Corp.
Company Guar. Notes
6.25% due 05/15/2026 | | | 880,000 | | | | 921,800 | |
Prospect Capital Corp.
Senior Notes
3.71% due 01/22/2026 | | | 825,000 | | | | 814,589 | |
| | | | | | |
|
|
|
| | | | | | | | 1,736,389 | |
| | | | | | |
|
|
|
AIG Flexible Credit Fund
PORTFOLIO OF INVESTMENTS — March 31, 2021 — (continued)
| | | | | | | | |
| Security Description | |
Principal
Amount | | | Value
(Note 2) | |
| |
U.S. CORPORATE BONDS & NOTES (continued) | | | | | | | | |
Machinery-Electrical — 0.2% | |
BWX Technologies, Inc.
Company Guar. Notes
4.13% due 04/15/2029* | | $ | 390,000 | | | $ | 395,405 | |
| | | | | | |
|
|
|
Machinery-Thermal Process — 0.3% | |
Cleaver-Brooks, Inc.
Senior Sec. Notes
7.88% due 03/01/2023* | | | 630,000 | | | | 617,400 | |
| | | | | | |
|
|
|
Medical Labs & Testing Services — 0.1% | |
Charles River Laboratories International, Inc.
Company Guar. Notes
3.75% due 03/15/2029* | | | 165,000 | | | | 165,261 | |
Charles River Laboratories International, Inc.
Company Guar. Notes
4.00% due 03/15/2031* | | | 140,000 | | | | 142,317 | |
| | | | | | |
|
|
|
| | | | | | | | 307,578 | |
| | | | | | |
|
|
|
Medical-Generic Drugs — 0.3% | | | | | | | | |
Par Pharmaceutical, Inc.
Senior Sec. Notes
7.50% due 04/01/2027* | | | 603,000 | | | | 641,110 | |
| | | | | | |
|
|
|
Medical-Hospitals — 2.4% | |
CHS/Community Health Systems, Inc.
Senior Sec. Notes
4.75% due 02/15/2031* | | | 315,000 | | | | 307,724 | |
CHS/Community Health Systems, Inc.
Senior Sec. Notes
6.63% due 02/15/2025* | | | 805,000 | | | | 849,782 | |
CHS/Community Health Systems, Inc.
Sec. Notes
6.88% due 04/15/2029* | | | 50,000 | | | | 52,263 | |
LifePoint Health, Inc.
Senior Sec. Notes
4.38% due 02/15/2027* | | | 835,000 | | | | 818,300 | |
LifePoint Health, Inc.
Company Guar. Notes
5.38% due 01/15/2029* | | | 170,000 | | | | 167,450 | |
LifePoint Health, Inc.
Senior Sec. Notes
6.75% due 04/15/2025* | | | 10,000 | | | | 10,625 | |
Select Medical Corp.
Company Guar. Notes
6.25% due 08/15/2026* | | | 940,000 | | | | 998,994 | |
Surgery Center Holdings, Inc.
Company Guar. Notes
6.75% due 07/01/2025* | | | 420,000 | | | | 429,324 | |
Surgery Center Holdings, Inc.
Company Guar. Notes
10.00% due 04/15/2027* | | | 425,000 | | | | 468,563 | |
Tenet Healthcare Corp.
Senior Sec. Notes
4.88% due 01/01/2026* | | | 630,000 | | | | 654,797 | |
Tenet Healthcare Corp.
Senior Sec. Notes
5.13% due 11/01/2027* | | | 292,000 | | | | 305,344 | |
Tenet Healthcare Corp.
Sec. Notes
6.25% due 02/01/2027* | | | 345,000 | | | | 364,273 | |
| | | | | | |
|
|
|
| | | | | | | | 5,427,439 | |
| | | | | | |
|
|
|
| |
| | | | | | | | | |
Metal-Copper — 0.2% | | | | | | | | |
Freeport-McMoRan, Inc.
Company Guar. Notes
5.45% due 03/15/2043 | | $ | 460,000 | | | $ | 552,294 | |
| | | | | | |
|
|
|
Office Automation & Equipment — 0.3% | |
Xerox Holdings Corp.
Company Guar. Notes
5.50% due 08/15/2028* | | | 750,000 | | | | 776,486 | |
| | | | | | |
|
|
|
Oil & Gas Drilling — 0.3% | |
Patterson-UTI Energy, Inc.
Senior Notes
5.15% due 11/15/2029 | | | 610,000 | | | | 605,983 | |
| | | | | | |
|
|
|
Oil Companies-Exploration & Production — 3.1% | |
Antero Resources Corp.
Company Guar. Notes
7.63% due 02/01/2029* | | | 210,000 | | | | 223,650 | |
Antero Resources Corp.
Company Guar. Notes
8.38% due 07/15/2026* | | | 320,000 | | | | 352,800 | |
Ascent Resources Utica Holdings LLC/ARU Finance Corp.
Senior Notes
8.25% due 12/31/2028* | | | 455,000 | | | | 473,200 | |
Callon Petroleum Co.
Company Guar. Notes
6.13% due 10/01/2024 | | | 451,345 | | | | 383,643 | |
Chesapeake Energy Corp.
Company Guar. Notes
5.50% due 02/01/2026* | | | 595,000 | | | | 619,333 | |
Chesapeake Energy Corp.
Company Guar. Notes
5.88% due 02/01/2029* | | | 60,000 | | | | 63,600 | |
CrownRock LP/CrownRock Finance, Inc.
Senior Notes
5.63% due 10/15/2025* | | | 1,015,000 | | | | 1,035,523 | |
Hilcorp Energy I LP/Hilcorp Finance Co.
Senior Notes
6.00% due 02/01/2031* | | | 415,000 | | | | 421,225 | |
Indigo Natural Resources LLC
Senior Notes
5.38% due 02/01/2029* | | | 600,000 | | | | 591,126 | |
Kosmos Energy, Ltd.
Company Guar. Notes
7.50% due 03/01/2028* | | | 575,000 | | | | 544,525 | |
Magnolia Oil & Gas Operating LLC / Magnolia Oil & Gas Finance Corp.
Company Guar. Notes
6.00% due 08/01/2026* | | | 495,000 | | | | 511,706 | |
Occidental Petroleum Corp.
Senior Notes
3.50% due 08/15/2029 | | | 525,000 | | | | 492,188 | |
Occidental Petroleum Corp.
Senior Notes
5.50% due 12/01/2025 | | | 145,000 | | | | 153,046 | |
Occidental Petroleum Corp.
Senior Notes
5.88% due 09/01/2025 | | | 255,000 | | | | 271,894 | |
AIG Flexible Credit Fund
PORTFOLIO OF INVESTMENTS — March 31, 2021 — (continued)
| | | | | | | | |
| Security Description | |
Principal
Amount | | | Value
(Note 2) | |
| |
U.S. CORPORATE BONDS & NOTES (continued) | | | | | | | | |
Oil Companies-Exploration & Production (continued) | | | | | |
Occidental Petroleum Corp.
Senior Notes
6.13% due 01/01/2031 | | $ | 215,000 | | | $ | 237,403 | |
Occidental Petroleum Corp.
Senior Notes
6.63% due 09/01/2030 | | | 385,000 | | | | 432,663 | |
WPX Energy, Inc.
Senior Notes
4.50% due 01/15/2030 | | | 393,000 | | | | 423,178 | |
| | | | | | |
|
|
|
| | | | | | | | 7,230,703 | |
| | | | | | |
|
|
|
Oil Refining & Marketing — 0.4% | | | | | | | | |
Sunoco LP/Sunoco Finance Corp.
Company Guar. Notes
4.50% due 05/15/2029* | | | 1,025,000 | | | | 1,021,156 | |
| | | | | | |
|
|
|
Oil-Field Services — 1.0% | |
CSI Compressco LP/CSI Compressco Finance, Inc.
Company Guar. Notes
7.25% due 08/15/2022 | | | 1,145,000 | | | | 1,086,605 | |
CSI Compressco LP/CSI Compressco Finance, Inc.
Senior Sec. Notes
7.50% due 04/01/2025* | | | 665,000 | | | | 674,975 | |
USA Compression Partners LP/USA Compression Finance Corp.
Company Guar. Notes
6.88% due 04/01/2026 | | | 440,000 | | | | 451,275 | |
| | | | | | |
|
|
|
| | | | | | | | 2,212,855 | |
| | | | | | |
|
|
|
Paper & Related Products — 0.2% | |
Resolute Forest Products, Inc.
Company Guar. Notes
4.88% due 03/01/2026* | | | 490,000 | | | | 491,225 | |
| | | | | | |
|
|
|
Pipelines — 1.0% | |
Antero Midstream Partners LP/Antero Midstream Finance Corp.
Company Guar. Notes
5.75% due 01/15/2028* | | | 750,000 | | | | 749,062 | |
Cheniere Energy, Inc.
Senior Sec. Notes
4.63% due 10/15/2028* | | | 475,000 | | | | 494,081 | |
EQM Midstream Partners LP
Senior Notes
4.50% due 01/15/2029* | | | 140,000 | | | | 136,424 | |
EQM Midstream Partners LP
Senior Notes
4.75% due 01/15/2031* | | | 135,000 | | | | 130,950 | |
EQM Midstream Partners LP
Senior Notes
6.00% due 07/01/2025* | | | 220,000 | | | | 236,775 | |
EQM Midstream Partners LP
Senior Notes
6.50% due 07/01/2027* | | | 250,000 | | | | 271,813 | |
Targa Resources Partners LP/Targa Resources Partners Finance Corp.
Company Guar. Notes
4.88% due 02/01/2031* | | | 310,000 | | | | 314,108 | |
| | | | | | |
|
|
|
| | | | | | | | 2,333,213 | |
| | | | | | |
|
|
|
| |
| | | | | | | | | |
Precious Metals — 0.4% | | | | | | | | |
Hecla Mining Co.
Company Guar. Notes
7.25% due 02/15/2028 | | $ | 910,000 | | | $ | 975,975 | |
| | | | | | |
|
|
|
Publishing-Books — 0.2% | |
McGraw-Hill Global Education Holdings LLC/McGraw-Hill Global Education Finance
Company Guar. Notes
7.88% due 05/15/2024* | | | 500,000 | | | | 492,500 | |
| | | | | | |
|
|
|
Real Estate Investment Trusts — 1.9% | |
ESH Hospitality, Inc.
Company Guar. Notes
4.63% due 10/01/2027* | | | 810,000 | | | | 856,688 | |
iStar, Inc.
Senior Notes
4.25% due 08/01/2025 | | | 855,000 | | | | 860,900 | |
MPT Operating Partnership LP/MPT Finance Corp. Company Guar. Notes
3.50% due 03/15/2031 | | | 780,000 | | | | 764,916 | |
Service Properties Trust
Company Guar. Notes
5.50% due 12/15/2027 | | | 335,000 | | | | 354,155 | |
Service Properties Trust
Company Guar. Notes
7.50% due 09/15/2025 | | | 505,000 | | | | 573,691 | |
Uniti Group, Inc./CSL Capital LLC
Company Guar. Notes
7.13% due 12/15/2024* | | | 880,000 | | | | 905,300 | |
| | | | | | |
|
|
|
| | | | | | | | 4,315,650 | |
| | | | | | |
|
|
|
Retail-Automobile — 0.3% | | | | | | | | |
Carvana Co.
Company Guar. Notes
5.63% due 10/01/2025* | | | 360,000 | | | | 369,306 | |
Carvana Co.
Company Guar. Notes
5.88% due 10/01/2028* | | | 340,000 | | | | 348,500 | |
| | | | | | |
|
|
|
| | | | | | | | 717,806 | |
| | | | | | |
|
|
|
Retail-Building Products — 0.4% | | | | | | | | |
BCPE Ulysses Intermediate, Inc.
Senior Notes
8.50% due 04/01/2027*(1) | | | 630,000 | | | | 653,625 | |
LBM Acquisition LLC
Company Guar. Notes
6.25% due 01/15/2029* | | | 325,000 | | | | 334,750 | |
| | | | | | |
|
|
|
| | | | | | | | 988,375 | |
| | | | | | |
|
|
|
Retail-Pawn Shops — 0.3% | | | | | | | | |
FirstCash, Inc.
Company Guar. Notes
4.63% due 09/01/2028* | | | 645,000 | | | | 660,802 | |
| | | | | | |
|
|
|
Retail-Pet Food & Supplies — 0.2% | |
PetSmart, Inc./PetSmart Finance Corp.
Senior Sec. Notes
4.75% due 02/15/2028* | | | 350,000 | | | | 358,684 | |
| | | | | | |
|
|
|
AIG Flexible Credit Fund
PORTFOLIO OF INVESTMENTS — March 31, 2021 — (continued)
| | | | | | | | |
| Security Description | |
Principal
Amount | | | Value
(Note 2) | |
| |
U.S. CORPORATE BONDS & NOTES (continued) | | | | | | | | |
Retail-Propane Distribution — 0.4% | |
Ferrellgas Escrow LLC/FG Operating Finance Escrow Corp.
Senior Notes
5.38% due 04/01/2026* | | $ | 230,000 | | | $ | 228,459 | |
Ferrellgas Escrow LLC/FG Operating Finance Escrow Corp.
Senior Notes
5.88% due 04/01/2029* | | | 250,000 | | | | 246,625 | |
Ferrellgas Partners LP/Ferrellgas Partners Finance Corp.
Senior Notes
8.63% due 06/15/2020†(2) | | | 570,000 | | | | 416,100 | |
| | | | | | |
|
|
|
| | | | | | | | 891,184 | |
| | | | | | |
|
|
|
Retail-Regional Department Stores — 0.1% | | | | | | | | |
NMG Holding Co., Inc./Neiman Marcus Group LLC
Senior Sec. Notes
7.13% due 04/01/2026* | | | 260,000 | | | | 265,200 | |
| | | | | | |
|
|
|
Retail-Restaurants — 0.4% | |
Golden Nugget, Inc.
Company Guar. Notes
8.75% due 10/01/2025* | | | 920,000 | | | | 970,600 | |
| | | | | | |
|
|
|
Schools — 0.3% | |
Adtalem Global Education, Inc.
Senior Sec. Notes
5.50% due 03/01/2028* | | | 785,000 | | | | 775,038 | |
| | | | | | |
|
|
|
Security Services — 0.5% | |
Allied Universal Holdco LLC/Allied Universal Finance Corp.
Senior Sec. Notes
6.63% due 07/15/2026* | | | 1,120,000 | | | | 1,187,738 | |
| | | | | | |
|
|
|
Steel-Producers — 1.2% | |
Cleveland-Cliffs, Inc.
Senior Sec. Notes
6.75% due 03/15/2026* | | | 415,000 | | | | 451,313 | |
Cleveland-Cliffs, Inc.
Company Guar. Notes
7.00% due 03/15/2027* | | | 585,000 | | | | 587,925 | |
Commercial Metals Co.
Senior Notes
3.88% due 02/15/2031 | | | 575,000 | | | | 564,339 | |
United States Steel Corp.
Senior Notes
6.25% due 03/15/2026 | | | 715,000 | | | | 725,725 | |
United States Steel Corp.
Senior Notes
6.88% due 03/01/2029 | | | 240,000 | | | | 246,000 | |
| | | | | | |
|
|
|
| | | | | | | | 2,575,302 | |
| | | | | | |
|
|
|
Telecommunication Equipment — 0.1% | | | | | | | | |
Plantronics, Inc.
Company Guar. Notes
4.75% due 03/01/2029* | | | 190,000 | | | | 186,675 | |
| | | | | | |
|
|
|
| |
| | | | | | | | | |
Telephone-Integrated — 1.2% | |
Cincinnati Bell, Inc.
Company Guar. Notes
7.00% due 07/15/2024* | | $ | 605,000 | | | $ | 623,906 | |
Consolidated Communications, Inc.
Senior Sec. Notes
6.50% due 10/01/2028* | | | 545,000 | | | | 588,671 | |
Frontier Communications Corp.
Sec. Notes
6.75% due 05/01/2029* | | | 895,000 | | | | 943,956 | |
Level 3 Financing, Inc.
Company Guar. Notes
3.63% due 01/15/2029* | | | 590,000 | | | | 571,563 | |
| | | | | | |
|
|
|
| | | | | | | | 2,728,096 | |
| | | | | | |
|
|
|
Theaters — 0.7% | | | | | | | | |
Cinemark USA, Inc.
Company Guar. Notes
5.88% due 03/15/2026* | | | 575,000 | | | | 588,765 | |
Live Nation Entertainment, Inc.
Company Guar. Notes
4.75% due 10/15/2027* | | | 310,000 | | | | 312,325 | |
Live Nation Entertainment, Inc.
Company Guar. Notes
5.63% due 03/15/2026* | | | 685,000 | | | | 711,441 | |
| | | | | | |
|
|
|
| | | | | | | | 1,612,531 | |
| | | | | | |
|
|
|
Tobacco — 0.4% | | | | | | | | |
Turning Point Brands, Inc.
Senior Sec. Notes
5.63% due 02/15/2026* | | | 595,000 | | | | 617,313 | |
Vector Group, Ltd.
Senior Sec. Notes
5.75% due 02/01/2029* | | | 285,000 | | | | 293,906 | |
| | | | | | |
|
|
|
| | | | | | | | 911,219 | |
| | | | | | |
|
|
|
Transport-Equipment & Leasing — 0.7% | | | | | | | | |
Fortress Transportation & Infrastructure Investors LLC
Senior Notes
6.50% due 10/01/2025* | | | 995,000 | | | | 1,039,775 | |
Fortress Transportation & Infrastructure Investors LLC
Senior Notes
6.75% due 03/15/2022* | | | 343,000 | | | | 343,429 | |
Fortress Transportation & Infrastructure Investors LLC
Senior Notes
9.75% due 08/01/2027* | | | 110,000 | | | | 125,262 | |
| | | | | | |
|
|
|
| | | | | | | | 1,508,466 | |
| | | | | | |
|
|
|
Wireless Equipment — 0.3% | | | | | | | | |
ViaSat, Inc.
Senior Notes
5.63% due 09/15/2025* | | | 625,000 | | | | 635,288 | |
| | | | | | |
|
|
|
Total U.S. Corporate Bonds & Notes | | | | | | | | |
(cost $93,425,062) | | | | | | | 96,742,271 | |
| | | | | | |
|
|
|
AIG Flexible Credit Fund
PORTFOLIO OF INVESTMENTS — March 31, 2021 — (continued)
| | | | | | | | |
| Security Description | |
Principal
Amount | | | Value
(Note 2) | |
| |
FOREIGN CORPORATE BONDS & NOTES — 7.0% | | | | | | | | |
Airlines — 0.1% | | | | | | | | |
American Airlines, Inc./AAdvantage Loyalty IP, Ltd.
Senior Sec. Notes
5.50% due 04/20/2026* | | $ | 145,000 | | | $ | 151,163 | |
American Airlines, Inc./AAdvantage Loyalty IP, Ltd.
Senior Sec. Notes
5.75% due 04/20/2029* | | | 55,000 | | | | 58,619 | |
| | | | | | |
|
|
|
| | | | | | | | 209,782 | |
| | | | | | |
|
|
|
Auto-Cars/Light Trucks — 0.2% | | | | | | | | |
Aston Martin Capital Holdings, Ltd.
Senior Sec. Notes
10.50% due 11/30/2025* | | | 445,000 | | | | 491,469 | |
| | | | | | |
|
|
|
Auto/Truck Parts & Equipment-Original — 0.3% | |
Clarios Global LP/Clarios US Finance Co.
Company Guar. Notes
8.50% due 05/15/2027* | | | 695,000 | | | | 748,348 | |
| | | | | | |
|
|
|
Cable/Satellite TV — 0.1% | |
Virgin Media Finance PLC
Company Guar. Notes
5.00% due 07/15/2030* | | | 275,000 | | | | 274,656 | |
| | | | | | |
|
|
|
Casino Services — 0.3% | |
Gateway Casinos & Entertainment, Ltd.
Sec. Notes
8.25% due 03/01/2024* | | | 800,000 | | | | 762,000 | |
| | | | | | |
|
|
|
Chemicals-Diversified — 0.1% | |
Trinseo Materials Operating SCA/Trinseo Materials Finance, Inc.
Company Guar. Notes
5.13% due 04/01/2029* | | | 250,000 | | | | 257,812 | |
| | | | | | |
|
|
|
Computers-Memory Devices — 0.3% | |
Seagate Technology PLC
Company Guar. Notes
3.38% due 07/15/2031* | | | 695,000 | | | | 668,208 | |
| | | | | | |
|
|
|
Cruise Lines — 0.9% | |
Carnival Corp.
Senior Notes
7.63% due 03/01/2026* | | | 90,000 | | | | 96,687 | |
Carnival Corp.
Senior Sec. Notes
11.50% due 04/01/2023* | | | 445,000 | | | | 510,081 | |
NCL Corp., Ltd.
Company Guar. Notes
5.88% due 03/15/2026* | | | 395,000 | | | | 400,289 | |
NCL Finance, Ltd.
Company Guar. Notes
6.13% due 03/15/2028* | | | 170,000 | | | | 173,188 | |
Royal Caribbean Cruises, Ltd.
Senior Notes
5.50% due 04/01/2028* | | | 30,000 | | | | 30,173 | |
Royal Caribbean Cruises, Ltd.
Company Guar. Notes
9.13% due 06/15/2023* | | | 680,000 | | | | 749,312 | |
| | | | | | |
|
|
|
| | | | | | | | 1,959,730 | |
| | | | | | |
|
|
|
Diversified Minerals — 0.4% | | | | | | | | |
Teck Resources, Ltd.
Senior Notes
6.13% due 10/01/2035 | | | 780,000 | | | | 955,357 | |
| | | | | | |
|
|
|
| |
| | | | | | | | | |
Gambling (Non-Hotel) — 0.1% | |
International Game Technology PLC
Senior Sec. Notes
4.13% due 04/15/2026* | | $ | 200,000 | | | $ | 205,516 | |
| | | | | | |
|
|
|
Machinery-Pumps — 0.3% | |
Titan Acquisition, Ltd./Titan Co-Borrower LLC
Senior Notes
7.75% due 04/15/2026* | | | 740,000 | | | | 769,452 | |
| | | | | | |
|
|
|
Medical-Biomedical/Gene — 0.1% | |
Concordia International Corp.
Senior Sec. Notes
8.00% due 09/06/2024 | | | 142,000 | | | | 145,536 | |
| | | | | | |
|
|
|
Medical-Drugs — 1.3% | |
Bausch Health Cos., Inc.
Senior Sec. Notes
5.75% due 08/15/2027* | | | 585,000 | | | | 629,606 | |
Bausch Health Cos., Inc.
Company Guar. Notes
7.00% due 01/15/2028* | | | 745,000 | | | | 808,735 | |
Cheplapharm Arzneimittel GmbH
Senior Sec. Notes
5.50% due 01/15/2028* | | | 850,000 | | | | 882,954 | |
Endo Dac/Endo Finance LLC/Endo Finco, Inc.
Sec. Notes
9.50% due 07/31/2027* | | | 70,000 | | | | 76,038 | |
Teva Pharmaceutical Finance Netherlands III BV
Company Guar. Notes
3.15% due 10/01/2026 | | | 235,000 | | | | 224,719 | |
Teva Pharmaceutical Finance Netherlands III BV
Company Guar. Notes
7.13% due 01/31/2025 | | | 380,000 | | | | 419,786 | |
| | | | | | |
|
|
|
| | | | | | | | 3,041,838 | |
| | | | | | |
|
|
|
Metal-Copper — 0.1% | | | | | | | | |
Taseko Mines, Ltd.
Senior Sec. Notes
7.00% due 02/15/2026* | | | 320,000 | | | | 325,760 | |
| | | | | | |
|
|
|
Miscellaneous Manufacturing — 0.4% | |
Bombardier, Inc.
Senior Notes
7.50% due 12/01/2024* | | | 675,000 | | | | 674,156 | |
Bombardier, Inc.
Senior Notes
8.75% due 12/01/2021* | | | 280,000 | | | | 293,768 | |
| | | | | | |
|
|
|
| | | | | | | | 967,924 | |
| | | | | | |
|
|
|
MRI/Medical Diagnostic Imaging — 0.3% | | | | | | | | |
Akumin, Inc.
Senior Sec. Notes
7.00% due 11/01/2025* | | | 710,000 | | | | 755,262 | |
| | | | | | |
|
|
|
Oil & Gas Drilling — 0.2% | |
Transocean, Inc.
Company Guar. Notes
11.50% due 01/30/2027* | | | 398,000 | | | | 341,373 | |
| | | | | | |
|
|
|
Oil Companies-Exploration & Production — 0.5% | |
Geopark, Ltd.
Company Guar. Notes
6.50% due 09/21/2024* | | | 995,000 | | | | 1,028,591 | |
| | | | | | |
|
|
|
AIG Flexible Credit Fund
PORTFOLIO OF INVESTMENTS — March 31, 2021 — (continued)
| | | | | | | | |
| Security Description | |
Principal
Amount | | | Value
(Note 2) | |
| |
FOREIGN CORPORATE BONDS & NOTES (continued) | | | | | |
Pipelines — 0.2% | |
Northriver Midstream Finance LP
Senior Sec. Notes
5.63% due 02/15/2026* | | $ | 445,000 | | | $ | 462,577 | |
| | | | | | |
|
|
|
Satellite Telecom — 0.6% | |
Telesat Canada/Telesat LLC
Company Guar. Notes
6.50% due 10/15/2027* | | | 1,270,000 | | | | 1,272,184 | |
| | | | | | |
|
|
|
Telecom Services — 0.2% | |
Altice France Holding SA
Company Guar. Notes
6.00% due 02/15/2028* | | | 500,000 | | | | 492,645 | |
| | | | | | |
|
|
|
Total Foreign Corporate Bonds & Notes | | | | | | | | |
(cost $16,010,618) | | | | | | | 16,136,020 | |
| | | | | | |
|
|
|
LOANS(3)(4)(5) — 49.9% | | | | | | | | |
Advanced Materials — 0.1% | | | | | | | | |
Gemini HDPE LLC FRS
BTL-B
3.50% (3 ML+3.00%)
due 12/31/2027 | | | 285,000 | | | | 283,931 | |
| | | | | | |
|
|
|
Advertising Sales — 0.2% | |
Clear Channel Outdoor Holdings, Inc. FRS
BTL
3.71% (3 ML +3.50%)
due 08/21/2026 | | | 591,000 | | | | 567,571 | |
| | | | | | |
|
|
|
Airlines — 1.2% | |
Aadvantage Loyalty LP, Ltd. FRS
BTL
coupon TBD
due 04/20/2028 | | | 185,000 | | | | 189,063 | |
Mileage Plus Holdings LLC FRS
Term B
6.25% (3 ML+5.25%)
due 06/21/2027 | | | 1,615,000 | | | | 1,714,592 | |
WestJet Airlines, Ltd. FRS
BTL-B
4.00% (6 ML+3.00%)
due 12/11/2026 | | | 857,030 | | | | 830,070 | |
| | | | | | |
|
|
|
| | | | | | | | 2,733,725 | |
| | | | | | |
|
|
|
Applications Software — 1.1% | | | | | | | | |
Grab Holdings, Inc. FRS
BTL-B
5.50% (6 ML+4.50%)
due 01/29/2026 | | | 1,490,000 | | | | 1,512,350 | |
Realpage, Inc. FRS
BTL
coupon TBD
due 02/17/2028 | | | 470,000 | | | | 467,454 | |
Weld North Education LLC FRS
BTL-B
Company Assets
4.75% (1 ML+4.00%)
due 12/21/2027 | | | 458,850 | | | | 457,703 | |
| | | | | | |
|
|
|
| | | | | | | | 2,437,507 | |
| | | | | | |
|
|
|
| |
| | | | | | | | | |
Auto-Heavy Duty Trucks — 0.5% | | | | | | | | |
Navistar, Inc. FRS
BTL-B
3.62% (1 ML+3.50%)
due 11/06/2024 | | $ | 1,153,122 | | | $ | 1,152,257 | |
| | | | | | |
|
|
|
Auto/Truck Parts & Equipment-Original — 2.2% | |
Accuride Corp. FRS
BTL
6.25% (3 ML+5.25%)
due 11/17/2023 | | | 867,107 | | | | 818,116 | |
Clarios Global LP FRS
BTL-B
3.36% (1 ML +3.25%)
due 04/30/2026 | | | 880,169 | | | | 875,035 | |
Cooper-Standard Automotive, Inc. FRS
BTL-B1
2.75% (1 ML+2.00%)
due 11/02/2023 | | | 893,596 | | | | 866,789 | |
DexKo Global, Inc. FRS
BTL-B
4.50% (3 ML+3.50%)
due 07/24/2024 | | | 682,745 | | | | 680,867 | |
KPAE Finance Sub, Inc. FRS
BTL-B
5.00% (3 ML+4.00%)
due 10/28/2027 | | | 95,000 | | | | 95,238 | |
Tenneco, Inc. FRS
BTL-B
3.11% (1 ML+3.00%)
due 10/01/2025 | | | 1,320,419 | | | | 1,284,107 | |
Truck Hero, Inc. FRS
BTL-B
4.50% (1 ML+3.75%)
due 01/31/2028 | | | 365,000 | | | | 364,283 | |
| | | | | | |
|
|
|
| | | | | | | | 4,984,435 | |
| | | | | | |
|
|
|
Beverages-Non-alcoholic — 0.1% | |
Triton Water Holdings, Inc. FRS
BTL
coupon TBD
due 03/31/2028 | | | 275,000 | | | | 273,772 | |
| | | | | | |
|
|
|
Beverages-Wine/Spirits — 0.2% | | | | | | | | |
Arterra Wines Canada, Inc. FRS
BTL-B
4.25% (3 ML+3.50%)
due 11/24/2027 | | | 418,950 | | | | 418,775 | |
| | | | | | |
|
|
|
Brewery — 0.1% | |
City Brewing Company LLC FRS
BTL-B
coupon TBD
due 04/05/2028 | | | 130,000 | | | | 129,675 | |
| | | | | | |
|
|
|
Broadcast Services/Program — 1.4% | |
Diamond Sports Group LLC FRS
BTL
3.36% (1 ML+3.25%)
due 08/24/2026 | | | 985,000 | | | | 688,680 | |
iHeartCommunications, Inc. FRS
BTL
3.11% (1 ML+3.00%)
due 05/01/2026 | | | 1,520,069 | | | | 1,500,796 | |
AIG Flexible Credit Fund
PORTFOLIO OF INVESTMENTS — March 31, 2021 — (continued)
| | | | | | | | |
| Security Description | |
Principal
Amount | | | Value
(Note 2) | |
| |
LOANS(3)(4)(5) (continued) | | | | | |
Broadcast Services/Program (continued) | |
Univision Communications, Inc. FRS
1st Lien
2.86% (1 ML+2.75%)
due 03/15/2024 | | $ | 1,031,156 | | | $ | 1,022,455 | |
| | | | | | |
|
|
|
| | | | | | | | 3,211,931 | |
| | | | | | |
|
|
|
Building & Construction Products-Misc. — 0.3% | | | | | | | | |
AZEK Co. LLC FRS
BTL
3.25% (3 ML+2.50%)
due 05/05/2024 | | | 490,267 | | | | 489,531 | |
CP Atlas Buyer, Inc. FRS
BTL-B
4.25% (3 ML+3.75%)
due 11/23/2027 | | | 205,000 | | | | 203,495 | |
| | | | | | |
|
|
|
| | | | | | | | 693,026 | |
| | | | | | |
|
|
|
Building Products-Wood — 0.3% | | | | | | | | |
84 Lumber Co. FRS
BTL-B
3.75% (3 ML+3.00%)
due 11/13/2026 | | | 139,650 | | | | 139,301 | |
LEB Holdings USA, Inc. FRS
BTL-B
4.75% (3 ML+4.00%)
due 11/02/2027 | | | 453,863 | | | | 454,430 | |
| | | | | | |
|
|
|
| | | | | | | | 593,731 | |
| | | | | | |
|
|
|
Cable/Satellite TV — 0.5% | |
Radiate Holdco LLC FRS
BTL
4.25% (1 ML+3.50%)
due 09/25/2026 | | | 238,164 | | | | 237,812 | |
UPC Broadband Holdings BV FRS
BTL-B2
3.61% (1 ML+3.50%)
due 01/31/2029 | | | 505,000 | | | | 503,197 | |
UPC Broadband Holdings BV FRS
BTL-B1
3.61% (1 ML+3.50%)
due 01/31/2029 | | | 505,000 | | | | 503,197 | |
| | | | | | |
|
|
|
| | | | | | | | 1,244,206 | |
| | | | | | |
|
|
|
Casino Hotels — 1.0% | | | | | | | | |
Caesars Resort Collection LLC FRS
BTL
4.61% (1 ML+4.50%)
due 07/21/2025 | | | 522,375 | | | | 522,767 | |
CityCenter Holdings LLC FRS
BTL-B
3.00% (1 ML+2.25%)
due 04/18/2024 | | | 947,023 | | | | 934,264 | |
Golden Nugget, Inc. FRS
BTL-B
3.25% (2 ML+2.50%)
due 10/04/2023 | | | 733,840 | | | | 721,915 | |
| | | | | | |
|
|
|
| | | | | | | | 2,178,946 | |
| | | | | | |
|
|
|
| |
| | | | | | | | | |
Casino Services — 0.5% | | | | | | | | |
Aristocrat Leisure, Ltd. FRS
BTL-B
4.75% (3 ML+3.75%)
due 10/19/2024 | | $ | 267,975 | | | $ | 268,645 | |
CCM Merger, Inc. FRS
BTL-B
4.50% (1 ML+3.75%)
due 11/04/2025 | | | 274,000 | | | | 273,486 | |
Gateway Casinos & Entertainment, Ltd. FRS
BTL
7.00% (3 ML+6.50%)
due 12/01/2023(12) | | | 550,684 | | | | 541,185 | |
| | | | | | |
|
|
|
| | | | | | | | 1,083,316 | |
| | | | | | |
|
|
|
Cellular Telecom — 0.3% | | | | | | | | |
Altice France SA FRS
BTL-B13
4.20% (3 ML+4.00%)
due 08/14/2026 | | | 635,375 | | | | 631,722 | |
| | | | | | |
|
|
|
Chemicals-Diversified — 1.1% | |
Ascend Performance Materials Operations LLC FRS
BTL-B
5.50% (3 ML+4.75%)
due 08/27/2026 | | | 408,788 | | | | 413,813 | |
Hexion, Inc. FRS
BTL
3.74% (3 ML+3.50%)
due 07/01/2026 | | | 625,356 | | | | 624,965 | |
INEOS Styrolution Group GmbH FRS
BTL-B
3.25% (3 ML+2.75%)
due 01/29/2026 | | | 410,000 | | | | 408,155 | |
Innophos Holdings, Inc. FRS
BTL-B
3.61% (1 ML+3.50%)
due 02/07/2027 | | | 826,650 | | | | 824,067 | |
NIC Acquisition Corp. FRS
BTL
4.50% (6 ML+3.75%)
due 12/29/2027 | | | 180,000 | | | | 178,987 | |
| | | | | | |
|
|
|
| | | | | | | | 2,449,987 | |
| | | | | | |
|
|
|
Chemicals-Specialty — 1.2% | | | | | | | | |
Aruba Investments Holdings LLC FRS
BTL
4.75% (3 ML+4.00%)
due 11/24/2027 | | | 340,000 | | | | 340,000 | |
Diamond BC BV FRS
BTL
3.11% (1 ML+3.00%)
due 09/06/2024 | | | 1,666,989 | | | | 1,657,091 | |
Zep, Inc. FRS
BTL
5.00% (3 ML+4.00%)
due 08/12/2024 | | | 738,225 | | | | 730,228 | |
| | | | | | |
|
|
|
| | | | | | | | 2,727,319 | |
| | | | | | |
|
|
|
AIG Flexible Credit Fund
PORTFOLIO OF INVESTMENTS — March 31, 2021 — (continued)
| | | | | | | | |
| Security Description | |
Principal
Amount | | | Value
(Note 2) | |
| |
LOANS(3)(4)(5) (continued) | | | | | |
Commercial Services — 0.3% | | | | | | | | |
Amentum Government Services Holdings LLC FRS
BTL-B
5.50% (3 ML+4.75%)
due 01/29/2027 | | $ | 610,000 | | | $ | 609,238 | |
| | | | | | |
|
|
|
Commercial Services-Finance — 0.3% | |
NAB Holdings LLC FRS
BTL
4.00% (3 ML+3.00%)
due 07/01/2024 | | | 621,795 | | | | 618,686 | |
| | | | | | |
|
|
|
Computer Services — 0.5% | |
Tempo Acquisition LLC FRS
BTL-B
3.75% (1 ML+3.25%)
due 11/02/2026 | | | 894,606 | | | | 893,711 | |
Virtusa Corp. FRS
BTL-B
5.00% (1 ML+4.25%)
due 02/11/2028 | | | 180,000 | | | | 180,113 | |
| | | | | | |
|
|
|
| | | | | | | | 1,073,824 | |
| | | | | | |
|
|
|
Computers-Integrated Systems — 0.7% | | | | | | | | |
Everi Payments, Inc. FRS
BTL-B
3.50% (1 ML+2.75%)
due 05/09/2024 | | | 975,151 | | | | 968,296 | |
Everi Payments, Inc. FRS
BTL
11.50% (1 ML+10.50%)
due 05/09/2024 | | | 54,588 | | | | 57,044 | |
NCR Corp. FRS
BTL
2.72% (3 ML+2.50%)
due 08/28/2026 | | | 525,590 | | | | 521,648 | |
| | | | | | |
|
|
|
| | | | | | | | 1,546,988 | |
| | | | | | |
|
|
|
Consulting Services — 0.2% | | | | | | | | |
Thoughtworks, Inc. FRS
BTL-B
3.45% (3 ML+3.25%)
due 03/23/2028 | | | 350,000 | | | | 349,125 | |
| | | | | | |
|
|
|
Containers-Metal/Glass — 1.4% | |
Anchor Glass Container Corp. FRS
1st Lien
3.75% (3 ML+2.75%)
due 12/07/2023 | | | 1,045,733 | | | | 920,681 | |
Anchor Glass Container Corp. FRS
BTL
6.00% (3 ML+5.00%)
due 12/07/2023 | | | 381,125 | | | | 338,248 | |
Anchor Glass Container Corp. FRS
2nd Lien
8.75% (3 ML+7.75%)
due 12/07/2024 | | | 265,333 | | | | 132,667 | |
| |
| | | | | | | | | |
Containers-Metal/Glass (continued) | |
Berlin Packaging LLC FRS
1st Lien
3.12% (3 ML +3.00%)
due 11/07/2025 | | $ | 713,718 | | | $ | 700,157 | |
Mauser Packaging Solutions Holding, Co. FRS
BTL
3.44% (3 ML+3.25%)
due 04/03/2024 | | | 1,222,375 | | | | 1,193,780 | |
| | | | | | |
|
|
|
| | | | | | | | 3,285,533 | |
| | | | | | |
|
|
|
Containers-Paper/Plastic — 1.1% | | | | | | | | |
Fort Dearborn Holding Co., Inc. FRS
1st Lien
5.00% (1 ML+4.00%)
due 10/19/2023 | | | 11,783 | | | | 11,744 | |
Fort Dearborn Holding Co., Inc. FRS
1st Lien
5.00% (3 ML+4.00%)
due 10/19/2023 | | | 1,091,873 | | | | 1,088,233 | |
Patriot Container Corp. FRS
1st Lien
4.50% (1 ML+3.50%)
due 03/20/2025 | | | 827,598 | | | | 817,253 | |
Trident TPI Holdings, Inc. FRS
BTL-B1
4.00% (3 ML+3.00%)
due 10/17/2024 | | | 605,354 | | | | 598,733 | |
| | | | | | |
|
|
|
| | | | | | | | 2,515,963 | |
| | | | | | |
|
|
|
Cosmetics & Toiletries — 0.5% | | | | | | | | |
Parfums Holding Co., Inc. FRS
1st Lien
4.11% (1 ML+4.00%)
due 06/30/2024 | | | 1,184,688 | | | | 1,171,360 | |
| | | | | | |
|
|
|
Cruise Lines — 0.0% | |
Carnival Corp. FRS
Term B
8.50% (1 ML+7.50%)
due 06/30/2025 | | | 104,213 | | | | 107,339 | |
| | | | | | |
|
|
|
Data Processing/Management — 0.5% | |
Dun & Bradstreet Corp. FRS
BTL
3.36% (1 ML +3.25%)
due 02/06/2026 | | | 1,189,542 | | | | 1,182,293 | |
| | | | | | |
|
|
|
Diagnostic Kits — 0.2% | |
Ortho-Clinical Diagnostics SA FRS
BTL
3.36% (1 ML+3.25%)
due 06/30/2025 | | | 427,617 | | | | 426,681 | |
| | | | | | |
|
|
|
Distribution/Wholesale — 0.9% | |
Infinite Bidco LLC FRS
1st Lien
4.25% (3 ML+3.75%)
due 03/02/2028 | | | 610,000 | | | | 605,425 | |
Infinite Bidco LLC FRS
2nd Lien
7.50% (3 ML+7.00%)
due 03/02/2029 | | | 655,000 | | | | 656,637 | |
AIG Flexible Credit Fund
PORTFOLIO OF INVESTMENTS — March 31, 2021 — (continued)
| | | | | | | | |
| Security Description | |
Principal
Amount | | | Value
(Note 2) | |
| |
LOANS(3)(4)(5) (continued) | | | | | |
Distribution/Wholesale (continued) | |
Protective Industrial Products, Inc. FRS
BTL
4.75% (1 ML+4.00%)
due 01/20/2028 | | $ | 510,000 | | | $ | 508,088 | |
Resideo Funding, Inc. FRS
BTL
2.75% (3 ML+2.25%)
due 02/08/2028 | | | 190,000 | | | | 189,525 | |
| | | | | | |
|
|
|
| | | | | | | | 1,959,675 | |
| | | | | | |
|
|
|
Diversified Minerals — 0.2% | | | | | | | | |
Covia Holdings Corp. FRS
BTL
5.00% (3 ML+4.00%)
due 07/31/2026 | | | 398,569 | | | | 385,117 | |
| | | | | | |
|
|
|
E-Commerce/Products — 0.4% | |
CNT Holdings I Corp. FRS
BTL
4.50% (6 ML+3.75%)
due 11/08/2027 | | | 315,000 | | | | 313,937 | |
Rodan & Fields LLC FRS
BTL
4.11% (1 ML+4.00%)
due 06/16/2025 | | | 780,114 | | | | 657,246 | |
| | | | | | |
|
|
|
| | | | | | | | 971,183 | |
| | | | | | |
|
|
|
E-Commerce/Services — 0.6% | |
Hoya Midco LLC FRS
1st Lien
4.50% (1 ML+3.50%)
due 06/30/2024 | | | 834,869 | | | | 817,128 | |
Uber Technologies, Inc. FRS
BTL-B
3.61% (1 ML+3.50%)
due 02/16/2027 | | | 644,935 | | | | 641,595 | |
| | | | | | |
|
|
|
| | | | | | | | 1,458,723 | |
| | | | | | |
|
|
|
Electric-Generation — 0.5% | | | | | | | | |
Astoria Energy LLC FRS
BTL-B
4.50% (3 ML+3.50%)
due 12/10/2027 | | | 358,044 | | | | 357,821 | |
Hamilton Projects Acquiror LLC FRS
BTL-B
5.75% (3 ML+4.75%)
due 06/17/2027 | | | 718,191 | | | | 719,268 | |
| | | | | | |
|
|
|
| | | | | | | | 1,077,089 | |
| | | | | | |
|
|
|
Electric-Integrated — 0.1% | | | | | | | | |
PG&E Corp. FRS
BTL-B
3.50% (3 ML+3.00%)
due 06/23/2025 | | | 267,975 | | | | 267,473 | |
| | | | | | |
|
|
|
Electronics-Military — 0.4% | |
AI Convoy Luxembourg SARL FRS
BTL-B
4.50% (6 ML+3.50%)
due 01/17/2027 | | | 806,850 | | | | 805,211 | |
| | | | | | |
|
|
|
| |
| | | | | | | | | |
Engineering/R&D Services — 0.2% | |
TRC Cos, Inc. FRS
BTL
5.25% (1 ML+4.50%)
due 06/21/2024 | | $ | 525,975 | | | $ | 525,318 | |
| | | | | | |
|
|
|
Enterprise Software/Service — 2.5% | |
Applied Systems, Inc. FRS
1st Lien
3.50% (3 ML+3.00%)
due 09/19/2024 | | | 585,000 | | | | 582,624 | |
Applied Systems, Inc. FRS
2nd Lien
6.25% (3 ML+5.50%)
due 09/19/2025 | | | 295,000 | | | | 295,492 | |
Aston US Finco LLC FRS
BTL-B
4.36% (3 ML+4.25%)
due 10/09/2026 | | | 460,350 | | | | 456,609 | |
Boxer Parent Co., Inc. FRS
BTL
3.86% (1 ML+3.75%)
due 10/02/2025 | | | 861,304 | | | | 856,899 | |
Epicor Software Corp. FRS
BTL
4.00% (1 ML+3.25%)
due 07/30/2027 | | | 567,150 | | | | 565,200 | |
Greeneden US Holdings II LLC FRS
BTL-B
4.75% (1 ML+4.00%)
due 12/01/2027 | | | 460,000 | | | | 459,655 | |
Hyland Software, Inc. FRS
BTL
4.25% (1 ML+3.50%)
due 07/01/2024 | | | 646,684 | | | | 645,516 | |
Hyland Software, Inc. FRS
BTL
coupon TBD
due 07/01/2024 | | | 100,000 | | | | 99,819 | |
Hyland Software, Inc. FRS
2nd Lien
coupon TBD
due 07/07/2025 | | | 95,000 | | | | 95,000 | |
Sophia L.P. FRS
1st Lien
4.50% (3 ML+3.75%)
due 10/07/2027 | | | 623,438 | | | | 622,324 | |
UKG, Inc. FRS
BTL
4.00% (4 ML+3.25%)
due 05/04/2026 | | | 905,618 | | | | 904,486 | |
Ultimate Software Group, Inc. FRS
2nd Lien
7.50% (3 ML+6.75%)
due 05/03/2027 | | | 105,000 | | | | 107,494 | |
| | | | | | |
|
|
|
| | | | | | | | 5,691,118 | |
| | | | | | |
|
|
|
Finance-Credit Card — 0.5% | | | | | | | | |
Blackhawk Network Holdings, Inc. FRS
1st Lien
3.11% (1 ML +3.00%)
due 06/15/2025 | | | 499,616 | | | | 491,587 | |
Pi US Mergerco, Inc. FRS
BTL
4.50% (1 ML+3.50%)
due 01/03/2025 | | | 750,060 | | | | 748,770 | |
| | | | | | |
|
|
|
| | | | | | | | 1,240,357 | |
| | | | | | |
|
|
|
AIG Flexible Credit Fund
PORTFOLIO OF INVESTMENTS — March 31, 2021 — (continued)
| | | | | | | | |
| Security Description | |
Principal
Amount | | | Value
(Note 2) | |
| |
LOANS(3)(4)(5) (continued) | | | | | |
Finance-Investment Banker/Broker — 0.5% | | | | | | | | |
Deerfield Dakota Holding LLC FRS
BTL
4.75% (1 ML+3.75%)
due 04/09/2027 | | $ | 1,147,009 | | | $ | 1,147,009 | |
| | | | | | |
|
|
|
Food-Catering — 0.4% | |
TKC Holdings, Inc. FRS
1st Lien
4.75% (3 ML+3.75%)
due 02/01/2023 | | | 978,593 | | | | 954,536 | |
| | | | | | |
|
|
|
Food-Confectionery — 0.7% | |
Shearer’s Foods LLC FRS
BTL
4.25% (3 ML+3.50%)
due 09/23/2027 | | | 1,570,493 | | | | 1,567,222 | |
| | | | | | |
|
|
|
Food-Dairy Products — 0.3% | |
Chobani LLC FRS
BTL-B
4.50% (1 ML+3.50%)
due 10/20/2027 | | | 671,625 | | | | 670,618 | |
| | | | | | |
|
|
|
Food-Flour & Grain — 0.3% | |
CHG PPC Parent LLC FRS
BTL-B
2.86% (1 ML+2.75%)
due 03/31/2025 | | | 584,091 | | | | 575,330 | |
| | | | | | |
|
|
|
Food-Misc./Diversified — 1.3% | |
Froneri US, Inc. FRS
BTL
2.36% (1 ML+2.25%)
due 01/29/2027 | | | 838,663 | | | | 826,214 | |
H-Food Holdings LLC FRS
1st Lien
3.80% (1 ML+3.69%)
due 05/23/2025 | | | 953,050 | | | | 943,122 | |
Sigma Bidco BV FRS
BTL-B2
3.26% (6 ML+3.00%)
due 07/02/2025 | | | 1,199,564 | | | | 1,184,869 | |
| | | | | | |
|
|
|
| | | | | | | | 2,954,205 | |
| | | | | | |
|
|
|
Gambling (Non-Hotel) — 0.4% | | | | | | | | |
Scientific Games International, Inc. FRS
BTL-B5
2.86% (1 ML+2.75%)
due 08/14/2024 | | | 906,950 | | | | 888,244 | |
| | | | | | |
|
|
|
Home & Office Products — 0.1% | |
Ozark Holdings LLC FRS
BTL-B
4.75% (1 ML+4.00%)
due 12/16/2027 | | | 136,500 | | | | 136,500 | |
| | | | | | |
|
|
|
Hotels/Motels — 0.4% | |
Playa Resorts Holding BV FRS
BTL
3.75% (1 ML+2.75%)
due 04/29/2024 | | | 859,381 | | | | 823,096 | |
| | | | | | |
|
|
|
Housewares — 0.3% | |
Carlisle FoodService Products, Inc. FRS
BTL
4.00% (6 ML+3.00%)
due 03/20/2025 | | | 746,471 | | | | 711,325 | |
| | | | | | |
|
|
|
| |
| | | | | | | | | |
Human Resources — 0.6% | |
CHG Healthcare Services, Inc. FRS
1st Lien
4.00% (6 ML+3.00%)
due 06/07/2023 | | $ | 865,893 | | | $ | 862,917 | |
Team Health Holdings, Inc. FRS
1st Lien
3.75% (1 ML+2.75%)
due 02/06/2024 | | | 259,325 | | | | 240,616 | |
TTF Holdings LLC FRS
BTL
coupon TBD
due 03/24/2028 | | | 240,000 | | | | 238,800 | |
| | | | | | |
|
|
|
| | | | | | | | 1,342,333 | |
| | | | | | |
|
|
|
Insurance-Multi-line — 0.3% | |
Acrisure LLC FRS
BTL-B
3.70% (3 ML +3.50%)
due 02/15/2027 | | | 693,249 | | | | 684,008 | |
| | | | | | |
|
|
|
Insurance-Property/Casualty — 0.6% | |
Sedgwick Claims Management Services, Inc. FRS
BTL
3.36% (1 ML+3.25%)
due 12/31/2025 | | | 1,293,691 | | | | 1,274,084 | |
| | | | | | |
|
|
|
Internet Content-Information/News — 0.4% | |
Pug LLC FRS
BTL
3.61% (1 ML+3.50%)
due 02/12/2027 | | | 922,174 | | | | 888,745 | |
| | | | | | |
|
|
|
Internet Financial Services — 0.1% | |
Acuris Finance US, Inc. FRS
BTL-B
4.50% (3 ML+4.00%)
due 02/16/2028 | | | 165,000 | | | | 164,691 | |
| | | | | | |
|
|
|
Internet Gambling — 0.0% | |
Golden Nugget, Inc. FRS
BTL
13.00% (3 ML+12.00%)
due 10/04/2023 | | | 55,000 | | | | 62,425 | |
| | | | | | |
|
|
|
Internet Infrastructure Software — 0.2% | |
Barracuda Networks, Inc. FRS
1st Lien
4.50% (3 ML+3.75%)
due 02/12/2025 | | | 532,315 | | | | 530,984 | |
| | | | | | |
|
|
|
Leisure Games — 0.1% | |
ECL Entertainment LLC FRS
BTL
coupon TBD
due 03/31/2028 | | | 185,000 | | | | 183,150 | |
| | | | | | |
|
|
|
Leisure Products — 0.1% | |
Enterprise Development Authority FRS
BTL-B
coupon TBD
due 02/18/2028 | | | 215,000 | | | | 215,538 | |
| | | | | | |
|
|
|
Machinery-Electrical — 1.3% | |
Alliance Laundry Systems LLC FRS
BTL-B
4.25% (3 ML+3.50%)
due 10/08/2027 | | | 623,438 | | | | 621,489 | |
AIG Flexible Credit Fund
PORTFOLIO OF INVESTMENTS — March 31, 2021 — (continued)
| | | | | | | | |
| Security Description | |
Principal
Amount | | | Value
(Note 2) | |
| |
LOANS(3)(4)(5) (continued) | | | | | |
Machinery-Electrical (continued) | | | | | | | | |
Brookfield WEC Holdings, Inc. FRS
BTL
3.25% (1 ML+2.75%)
due 08/01/2025 | | $ | 1,590,164 | | | $ | 1,575,115 | |
Vertiv Group Corp. FRS
BTL-B
2.87% (1 ML+2.75%)
due 03/02/2027 | | | 851,416 | | | | 844,765 | |
| | | | | | |
|
|
|
| | | | | | | | 3,041,369 | |
| | | | | | |
|
|
|
Machinery-General Industry — 0.1% | |
DXP Enterprises, Inc. FRS
BTL
5.75% (1 ML+4.75%)
due 12/16/2027 | | | 274,313 | | | | 273,627 | |
| | | | | | |
|
|
|
Machinery-Pumps — 1.2% | | | | | | | | |
CIRCOR International, Inc. FRS
BTL-B
4.25% (1 ML +3.25%)
due 12/11/2024 | | | 880,000 | | | | 869,367 | |
Star US Bidco LLC FRS
BTL-B
5.25% (1 ML+4.25%)
due 03/17/2027 | | | 923,025 | | | | 913,218 | |
Titan Acquisition, Ltd. FRS
BTL
3.27% (6 ML+3.00%)
due 03/28/2025 | | | 1,104,425 | | | | 1,081,186 | |
| | | | | | |
|
|
|
| | | | | | | | 2,863,771 | |
| | | | | | |
|
|
|
Medical Information Systems — 0.8% | | | | | | | | |
Athenahealth, Inc. FRS
BTL
4.45% (3 ML+4.25%)
due 02/11/2026 | | | 315,000 | | | | 315,262 | |
Azalea Topco, Inc. FRS
BTL
5.00% (3 ML+4.00%)
due 07/24/2026 | | | 164,588 | | | | 164,656 | |
Emerald TopCo, Inc. FRS
BTL
3.71% (3 ML+3.50%)
due 07/24/2026 | | | 522,050 | | | | 517,972 | |
Navicure, Inc. FRS
BTL-B
4.11% (1 ML+4.00%)
due 10/22/2026 | | | 723,348 | | | | 722,444 | |
Project Ruby Ultimate Parent Corp. FRS
BTL
4.00% (3 ML+3.25%)
due 03/03/2028 | | | 205,000 | | | | 203,975 | |
| | | | | | |
|
|
|
| | | | | | | | 1,924,309 | |
| | | | | | |
|
|
|
Medical Labs & Testing Services — 1.1% | | | | | | | | |
Envision Healthcare Corp. FRS
1st Lien
3.86% (1 ML+3.75%)
due 10/10/2025 | | | 819,312 | | | | 704,040 | |
eResearchTechnology, Inc. FRS
BTL
5.50% (1 ML+4.50%)
due 02/04/2027 | | | 833,700 | | | | 833,570 | |
| |
| | | | | | | | | |
Medical Labs & Testing Services (continued) | | | | | | | | |
eResearchTechnology, Inc. FRS
BTL
coupon TBD
due 02/04/2027 | | $ | 75,000 | | | $ | 74,988 | |
Phoenix Guarantor, Inc. FRS
BTL-B
coupon TBD
due 03/05/2026 | | | 730,000 | | | | 724,753 | |
Phoenix Guarantor, Inc. FRS
BTL-B2
4.25% (1 ML+3.75%)
due 03/05/2026 | | | 229,425 | | | | 227,776 | |
| | | | | | |
|
|
|
| | | | | | | | 2,565,127 | |
| | | | | | |
|
|
|
Medical Products — 0.8% | | | | | | | | |
CPI Holdco LLC FRS
BTL
4.11% (1 ML+4.00%)
due 11/04/2026 | | | 460,649 | | | | 460,764 | |
Viant Medical Holdings, Inc. FRS
1st Lien
3.86% (1 ML+3.75%)
due 07/02/2025 | | | 1,492,710 | | | | 1,442,331 | |
| | | | | | |
|
|
|
| | | | | | | | 1,903,095 | |
| | | | | | |
|
|
|
Medical-HMO — 0.8% | | | | | | | | |
One Call Corp. FRS
1st Lien
6.25% (3 ML+5.25%)
due 11/27/2022 | | | 1,867,040 | | | | 1,855,371 | |
| | | | | | |
|
|
|
Medical-Hospitals — 1.4% | |
Accelerated Health Systems LLC FRS
BTL
3.61% (1 ML+3.50%)
due 10/31/2025 | | | 865,088 | | | | 859,681 | |
AHP Health Partners, Inc. FRS
BTL
4.75% (3 ML+3.75%)
due 06/30/2025 | | | 971,392 | | | | 971,797 | |
Pluto Acquisition I, Inc. FRS
BTL-B
5.50% (1 ML+5.00%)
due 06/22/2026 | | | 299,250 | | | | 298,502 | |
RegionalCare Hospital Partners Holdings, Inc. FRS
BTL-B
3.86% (1 ML+3.75%)
due 11/16/2025 | | | 728,120 | | | | 725,921 | |
Surgery Center Holdings, Inc. FRS
BTL
4.25% (1 ML +3.25%)
due 09/03/2024 | | | 267,231 | | | | 264,415 | |
Surgery Center Holdings, Inc. FRS
BTL-B
9.00% (1 ML+8.00%)
due 09/03/2024 | | | 198,000 | | | | 199,980 | |
| | | | | | |
|
|
|
| | | | | | | | 3,320,296 | |
| | | | | | |
|
|
|
Medical-Outpatient/Home Medical — 0.2% | | | | | | | | |
Gentiva Health Services, Inc. FRS
BTL
2.88% (1 ML+2.75%)
due 07/02/2025 | | | 457,245 | | | | 454,006 | |
| | | | | | |
|
|
|
AIG Flexible Credit Fund
PORTFOLIO OF INVESTMENTS — March 31, 2021 — (continued)
| | | | | | | | |
| Security Description | |
Principal
Amount | | | Value
(Note 2) | |
| |
LOANS(3)(4)(5) (continued) | | | | | |
Medical-Wholesale Drug Distribution — 0.7% | |
Milano Acquisition Corp. FRS
BTL-B
coupon TBD
due 10/01/2027 | | $ | 205,000 | | | $ | 203,890 | |
Milano Acquisition Corp. FRS
BTL-B
4.75% (3 ML +4.00%)
due 10/01/2027 | | | 872,813 | | | | 868,084 | |
Packaging Coordinators Midco, Inc. FRS
BTL
4.50% (3 ML+3.75%)
due 11/30/2027 | | | 425,000 | | | | 424,469 | |
| | | | | | |
|
|
|
| | | | | | | | 1,496,443 | |
| | | | | | |
|
|
|
Metal Processors & Fabrication — 0.2% | | | | | | | | |
ASP Navigate Acquisition Corp. FRS
BTL
5.50% (3 ML+4.50%)
due 10/06/2027 | | | 364,088 | | | | 363,177 | |
| | | | | | |
|
|
|
Non-Hazardous Waste Disposal — 0.2% | |
GFL Environmental, Inc. FRS
BTL
3.50% (3 ML+3.00%)
due 05/30/2025 | | | 571,382 | | | | 571,178 | |
| | | | | | |
|
|
|
Oil Companies-Exploration & Production — 0.2% | |
Fieldwood Energy LLC FRS
1st Lien
7.50% (USFRBPLR+4.25%)
due 04/11/2022†(6)(7) | | | 1,085,382 | | | | 412,445 | |
| | | | | | |
|
|
|
Oil Refining & Marketing — 0.4% | |
CITGO Holding, Inc. FRS
BTL
8.00% (3 ML+7.00%)
due 08/01/2023 | | | 261,025 | | | | 250,258 | |
CITGO Petroleum Corp. FRS
BTL-B
7.25% (3 ML+6.25%)
due 03/28/2024 | | | 655,218 | | | | 656,036 | |
| | | | | | |
|
|
|
| | | | | | | | 906,294 | |
| | | | | | |
|
|
|
Paper & Related Products — 0.8% | | | | | | | | |
Klockner Pentaplast of America, Inc. FRS
BTL
coupon TBD
due 02/12/2026 | | | 955,000 | | | | 950,822 | |
Schweitzer-Mauduit International, Inc. FRS
BTL-B
coupon TBD
due 01/27/2028 | | | 925,000 | | | | 920,375 | |
| | | | | | |
|
|
|
| | | | | | | | 1,871,197 | |
| | | | | | |
|
|
|
Pharmacy Services — 0.2% | | | | | | | | |
Sunshine Luxembourg VII SARL FRS
BTL-B3
coupon TBD
due 10/01/2026 | | | 570,000 | | | | 569,185 | |
| | | | | | |
|
|
|
| |
| | | | | | | | | |
Pipelines — 0.4% | |
Medallion Midland Acquisition LLC FRS
BTL
4.25% (1 ML+3.25%)
due 10/30/2024 | | $ | 703,285 | | | $ | 689,658 | |
Traverse Midstream Partners LLC FRS
BTL
6.50% (1 ML+5.50%)
due 09/27/2024 | | | 332,935 | | | | 330,438 | |
| | | | | | |
|
|
|
| | | | | | | | 1,020,096 | |
| | | | | | |
|
|
|
Pollution Control — 0.5% | | | | | | | | |
Filtration Group Corp. FRS
BTL
3.11% (1 ML+3.00%)
due 03/29/2025 | | | 926,613 | | | | 912,907 | |
Filtration Group Corp. FRS
BTL
4.50% (1 ML+3.75%)
due 03/29/2025 | | | 333,325 | | | | 332,742 | |
| | | | | | |
|
|
|
| | | | | | | | 1,245,649 | |
| | | | | | |
|
|
|
Professional Sports — 0.5% | | | | | | | | |
UFC Holdings LLC FRS
BTL-B
3.75% (6 ML+3.00%)
due 04/29/2026 | | | 1,045,745 | | | | 1,040,952 | |
| | | | | | |
|
|
|
Publishing-Books — 0.3% | |
McGraw Hill LLC FRS
BTL-B
5.75% (3 ML+4.75%)
due 11/01/2024 | | | 708,652 | | | | 706,627 | |
| | | | | | |
|
|
|
Research & Development — 0.3% | |
Parexel International Corp. FRS
BTL-B
2.84% (1 WL+2.75%)
due 01/26/2028 | | | 750,000 | | | | 744,375 | |
| | | | | | |
|
|
|
Retail-Arts & Crafts — 0.3% | |
Michaels Stores, Inc. FRS
BTL-B
4.25% (1 ML+3.50%)
due 10/01/2027 | | | 728,004 | | | | 726,184 | |
| | | | | | |
|
|
|
Retail-Bedding — 0.3% | |
Serta Simmons Bedding LLC FRS
1st Lien
4.50% (3 ML+3.50%)
due 11/08/2023 | | | 940,800 | | | | 607,286 | |
| | | | | | |
|
|
|
Retail-Pet Food & Supplies — 0.3% | |
Petco Animal Supplies, Inc. FRS
BTL-B
4.00% (3 ML+3.25%)
due 03/03/2028 | | | 480,000 | | | | 477,771 | |
PetSmart, Inc. FRS
BTL-B
4.50% (3 ML +3.75%)
due 02/12/2028 | | | 150,000 | | | | 149,750 | |
| | | | | | |
|
|
|
| | | | | | | | 627,521 | |
| | | | | | |
|
|
|
AIG Flexible Credit Fund
PORTFOLIO OF INVESTMENTS — March 31, 2021 — (continued)
| | | | | | | | |
| Security Description | |
Principal
Amount | | | Value
(Note 2) | |
| |
LOANS(3)(4)(5) (continued) | | | | | |
Retail-Sporting Goods — 0.7% | |
Great Outdoors Group LLC FRS
BTL-B
5.00% (6 ML+4.25%)
due 03/06/2028 | | $ | 1,690,763 | | | $ | 1,687,944 | |
| | | | | | |
|
|
|
Rubber/Plastic Products — 0.9% | |
Gates Global LLC FRS
BTL-B3
3.50% (1 ML+2.75%)
due 03/31/2027 | | | 994,621 | | | | 991,513 | |
KPEX Holdings, Inc. FRS
1st Lien
4.25% (3 ML+3.25%)
due 01/31/2025 | | | 653,316 | | | | 620,447 | |
US Farathane LLC FRS
BTL-B
coupon TBD
due 12/23/2024 | | | 331,830 | | | | 329,755 | |
US Farathane LLC FRS
BTL-B
4.43% (3 ML+4.25%)
due 12/23/2024 | | | 184,526 | | | | 183,373 | |
| | | | | | |
|
|
|
| | | | | | | | 2,125,088 | |
| | | | | | |
|
|
|
Satellite Telecom — 0.6% | | | | | | | | |
Intelsat Jackson Holdings SA FRS
BTL-B3
8.00% (USFRBPLR+4.75%)
due 11/27/2023(6) | | | 840,000 | | | | 852,250 | |
Intelsat Jackson Holdings SA FRS
BTL-B5
8.63% (1 ML+8.63%)
due 01/02/2024(6) | | | 541,000 | | | | 550,017 | |
| | | | | | |
|
|
|
| | | | | | | | 1,402,267 | |
| | | | | | |
|
|
|
Semiconductor Equipment — 0.2% | | | | | | | | |
Ultra Clean Holdings, Inc. FRS
BTL-B
coupon TBD
due 08/27/2025 | | | 347,813 | | | | 347,813 | |
| | | | | | |
|
|
|
Soap & Cleaning Preparation — 0.3% | |
Kronos Acquisition Holdings, Inc. FRS
BTL-B
4.25% (3 ML+3.75%)
due 12/22/2026 | | | 698,250 | | | | 687,340 | |
| | | | | | |
|
|
|
Storage/Warehousing — 0.2% | |
Pods, LLC
BTL-B
coupon TBD
due 03/31/2028 | | | 345,000 | | | | 343,131 | |
| | | | | | |
|
|
|
Technology Services — 0.5% | |
Ion Trading Finance Ltd. FRS
BTL
coupon TBD
due 03/26/2028 | | | 235,000 | | | | 234,706 | |
Peraton Corp. FRS
BTL-B
4.50% (3 ML+3.75%)
due 02/01/2028 | | | 339,867 | | | | 339,300 | |
| |
| | | | | | | | | |
Technology Services (continued) | |
Peraton Corp. FRS
Delayed Draw
coupon TBD
due 02/01/2028(13) | | $ | 598,133 | | | $ | 597,137 | |
| | | | | | |
|
|
|
| | | | | | | | 1,171,143 | |
| | | | | | |
|
|
|
Telecom Services — 0.5% | | | | | | | | |
Securus Technologies Holdings LLC FRS
1st Lien
5.50% (3 ML+4.50%)
due 11/01/2024 | | | 533,621 | | | | 491,932 | |
West Corp. FRS
BTL-B
5.00% (3 ML+4.00%)
due 10/10/2024 | | | 668,525 | | | | 645,753 | |
| | | | | | |
|
|
|
| | | | | | | | 1,137,685 | |
| | | | | | |
|
|
|
Telecommunication Equipment — 0.3% | | | | | | | | |
Plantronics, Inc. FRS
BTL-B
2.61% (1 ML+2.50%)
due 07/02/2025 | | | 673,066 | | | | 663,331 | |
| | | | | | |
|
|
|
Telephone-Integrated — 0.5% | |
Consolidated Communications, Inc. FRS
BTL-B
5.75% (1 ML+4.75%)
due 10/02/2027 | | | 406,983 | | | | 406,779 | |
Zayo Group Holdings, Inc. FRS
BTL
3.11% (1 ML+3.00%)
due 03/09/2027 | | | 854,816 | | | | 847,183 | |
| | | | | | |
|
|
|
| | | | | | | | 1,253,962 | |
| | | | | | |
|
|
|
Veterinary Diagnostics — 0.3% | | | | | | | | |
PetVet Care Centers LLC FRS
BTL
4.25% (1 ML+3.50%)
due 02/14/2025 | | | 724,406 | | | | 721,464 | |
| | | | | | |
|
|
|
Vitamins & Nutrition Products — 0.4% | |
Milk Specialties Co. FRS
BTL
5.00% (1 ML+4.00%)
due 08/16/2023 | | | 947,352 | | | | 945,772 | |
| | | | | | |
|
|
|
Total Loans | | | | | | | | |
(cost $116,032,833) | | | | | | | 114,434,689 | |
| | | | | | |
|
|
|
COMMON STOCKS — 0.6% | | | | | | | | |
Advertising Sales — 0.1% | | | | | | | | |
Clear Channel Outdoor Holdings, Inc.† | | | 56,198 | | | | 101,156 | |
| | | | | | |
|
|
|
Auto/Truck Parts & Equipment-Original — 0.0% | |
Lear Corp. | | | 54 | | | | 9,788 | |
| | | | | | |
|
|
|
E-Commerce/Products — 0.1% | |
MYT Holding LLC, Class B†(8) | | | 57,605 | | | | 299,546 | |
| | | | | | |
|
|
|
AIG Flexible Credit Fund
PORTFOLIO OF INVESTMENTS — March 31, 2021 — (continued)
| | | | | | | | |
| Security Description | | Shares/
Principal
Amount | | | Value
(Note 2) | |
| |
COMMON STOCKS (continued) | | | | | |
Housewares — 0.0% | |
Libbey Glass LLC†(8) | | | 26,762 | | | $ | 39,474 | |
| | | | | | |
|
|
|
Mining Services — 0.1% | |
Covia Holdings Corp.(8) | | | 39,560 | | | | 311,535 | |
| | | | | | |
|
|
|
Radio — 0.2% | |
iHeartMedia, Inc., Class A† | | | 23,870 | | | | 433,241 | |
iHeartMedia, Inc., Class B†(8) | | | 29 | | | | 526 | |
| | | | | | |
|
|
|
| | | | | | | | 433,767 | |
| | | | | | |
|
|
|
Retail-Regional Department Stores — 0.1% | | | | | | | | |
NMG Parent LLC†(8) | | | 2,559 | | | | 179,130 | |
| | | | | | |
|
|
|
Total Common Stocks | | | | | | | | |
(cost $1,692,045) | | | | | | | 1,374,396 | |
| | | | | | |
|
|
|
PREFERRED SECURITIES/CAPITAL SECURITIES — 0.2% | | | | | |
Finance-Leasing Companies — 0.2% | | | | | | | | |
Capital Farm Credit ACA
5.00% due 03/15/2026*
(cost $465,000) | | $ | 465,000 | | | | 475,463 | |
| | | | | | |
|
|
|
ESCROWS AND LITIGATION TRUSTS — 0.0% | |
Venture Holdings Co. LLC
Company Guar. Notes
11.00% due 06/01/2007†(6) | | | 550,000 | | | | 0 | |
Paragon Offshore Finance Co. FRS
Escrow Loans
5.00% (USFRBPLR+1.75%)
due 07/18/2021†(9) | | | 1,745 | | | | 0 | |
Texas Competitive Electric Holdings Co. LLC/TCEH Finance, Inc.
Escrow Notes
11.50% due 10/01/2020*†(9) | | | 1,667,835 | | | | 1,335 | |
Mesquite Energy, Inc.
Senior Sec. Notes
7.25% due 07/15/2023*† | | | 405,000 | | | | 506 | |
Hellas Telecommunications Luxembourg II SCA
Sub. Notes
6.26% due 01/15/2015*†(2)(6)(9) | | | 1,025,000 | | | | 0 | |
ION Media Networks, Inc.†(9) | | | 660 | | | | 7,937 | |
Vistra Energy Corp. CVR†(8) | | | 27,942 | | | | 30,652 | |
| | | | | | |
|
|
|
Total Escrows And Litigation Trusts | | | | | | | | |
(cost $1,603,376) | | | | | | | 40,430 | |
| | | | | | |
|
|
|
Total Long-Term Investment Securities | | | | | | | | |
(cost $229,228,934) | | | | | | | 229,203,269 | |
| | | | | | |
|
|
|
SHORT-TERM INVESTMENT SECURITIES — 2.2% | | | | | |
Registered Investment Companies — 2.2% | | | | | | | | |
State Street Institutional U.S. Government Money Market Fund, Premier Class
0.04%(10)
(cost $5,059,410) | | | 5,059,410 | | | $ | 5,059,410 | |
| | | | | | |
|
|
|
TOTAL INVESTMENTS | | | | | | | | |
(cost $234,288,344) | | | 102.1 | % | | | 234,262,679 | |
Liabilities in excess of other assets | | | (2.1 | ) | | | (4,874,292 | ) |
| | |
|
|
| |
|
|
|
NET ASSETS | | | 100.0 | % | | $ | 229,388,387 | |
| | |
|
|
| |
|
|
|
| * | Securities exempt from registration under Rule 144A of the Securities Act of 1933. These securities may be sold in transactions exempt from registration, normally to qualified institutional buyers. The Fund has no right to demand registration of these securities. At March 31, 2021, the aggregate value of these securities was $87,602,918 representing 38.2% of net assets. |
| † | Non-income producing security |
| (1) | PIK (“Payment-in-Kind”) security — Income may be paid in additional securities or cash at the discretion of the issuer. The security is currently paying interest in cash at the coupon rate listed. |
| (2) | Security in default of interest and principal at maturity. |
| (3) | Senior loans in the Fund are generally subject to mandatory and/or optional prepayment. Because of these mandatory prepayment conditions |
| | and because there may be significant economic incentives for a borrower to prepay, prepayments may occur. As a result, the actual remaining maturity may be substantially less than the stated maturities shown. |
| (4) | The Fund invests in senior loans which generally pay interest at rates which are periodically re-determined by reference to a base lending rate plus a premium. These base lending rates are generally either the lending rate offered by one or more major European banks, such as the London Inter-Bank Offered Rate (“LIBOR”) or the prime rate offered by one or more major United States banks, or the certificate of deposit rate. Senior loans are generally considered to be restrictive in that the Fund is ordinarily contractually obligated to receive approval from the Agent Bank and/or borrower prior to the disposition of a senior loan. |
| (5) | All loans in the Fund were purchased through assignment agreements unless otherwise indicated. |
| (6) | Company has filed for bankruptcy protection. |
| (7) | Loan is in default of interest payment. |
| (8) | Denotes a restricted security that: (a) cannot be offered for public sale without first being registered, or being able to take advantage of an exemption from registration, under the Securities Act of 1933, as amended (the “1933 Act”); (b) is subject to a contractual restriction on public sales; or (c) is otherwise subject to a restriction on sales by operation of applicable law. Restricted securities are valued pursuant to Note 2. Certain restricted securities held by the Fund may not be sold except in exempt transactions or in a public offering registered under the 1933 Act. The Fund has no right to demand registration of these securities. The risk of investing in certain restricted securities is greater than the risk of investing in the securities of widely held, publicly traded companies. To the extent applicable, lack of a secondary market and resale restrictions may result in the inability of a Fund to sell a security at a fair price and may substantially delay the sale of the security. In addition, certain restricted securities may exhibit greater price volatility |
AIG Flexible Credit Fund
PORTFOLIO OF INVESTMENTS — March 31, 2021 — (continued)
| | than securities for which secondary markets exist. As of March 31, 2021, the Fund held the following restricted securities: |
| | | | | | | | | | | | | | | | | | | | | | | | |
Description
| | Acquisition
Date
| | | Shares
| | | Acquisition
Cost
| | | Value
| | | Value
Per
Share
| | | % of
Net
Assets
| |
Common Stocks | | | | | | | | | | | | | | | | | |
Covia Holdings Corp. | | | 02/21/2018 | | | | 39,560 | | | $ | 343,328 | | | $ | 311,535 | | | $ | 7.88 | | | | 0.14 | % |
iHeartMedia, Inc., Class B | | | 05/07/2019 | | | | 29 | | | | 522 | | | | 526 | | | | 18.15 | | | | 0.00 | |
Libbey Glass LLC | | | 12/11/2020 | | | | 26,762 | | | | 104,657 | | | | 39,474 | | | | 1.48 | | | | 0.02 | |
MYT Holding LLC | | | 11/20/2017 | | | | 10,532 | | | | 0 | | | | | | | | | | | | | |
| | | | 02/14/2018 | | | | 35,731 | | | | 0 | | | | | | | | | | | | | |
| | | | 09/17/2018 | | | | 11,129 | | | | 0 | | | | | | | | | | | | | |
| | | | 10/19/2020 | | | | 213 | | | | 0 | | | | | | | | | | | | | |
| | | | | | |
|
|
| |
|
|
| | | | | | | | | | | | |
| | | | | | | | 57,605 | | | | 0 | | | | 299,546 | | | | 5.20 | | | | 0.13 | |
| | | | | | |
|
|
| |
|
|
| | | | | | | | | | | | |
NMG Parent LLC | | | 11/20/2017 | | | | 37 | | | | 68,915 | | | | | | | | | | | | | |
| | | | 02/14/2018 | | | | 127 | | | | 239,200 | | | | | | | | | | | | | |
| | | | 09/17/2018 | | | | 39 | | | | 81,283 | | | | | | | | | | | | | |
| | | | 12/11/2020 | | | | 2,356 | | | | 180,333 | | | | | | | | | | | | | |
| | | | | | |
|
|
| |
|
|
| | | | | | | | | | | | |
| | | | | | | | 2,559 | | | | 569,731 | | | | 179,130 | | | | 70.00 | | | | 0.08 | |
| | | | | | |
|
|
| |
|
|
| | | | | | | | | | | | |
Escrows and Litigation Trusts | |
Vistra Energy Corp. CVR | | | 10/06/2016 | | | | 27,942 | | | | 0 | | | | 30,652 | | | | 1.10 | | | | 0.01 | |
| | | | | | | | | | | | | | |
|
|
| | | | | |
|
|
|
| | | | | | | | | | | | | | | $ | 860,863 | | | | | | | | 0.38 | % |
| | | | | | | | | | | | | | |
|
|
| | | | | |
|
|
|
| (9) | Securities classified as Level 3 (see Note 2). |
| (10) | The rate shown is the 7-day yield as of March 31, 2021. |
| (11) | See Note 5 for cost of investments on a tax basis. |
| (12) | PIK (“Payment-in-Kind”) security-Income may be paid in additional securities or cash at the discretion of the issuer. The security is currently paying interest in cash at 4.50%. The security is also currently paying interest in the form of additional loans at 3.00%. |
| (13) | All or a portion of this holding is subject to unfunded loan commitments. |
| CVR — | Contingent Value Rights |
| TBD — | Senior loan purchased on a when-issued or delayed-delivery basis. Certain details associated with this purchase are not known prior to the settlement date of the transaction. In addition, senior loans typically trade without accrued interest and therefore a coupon rate is not available prior to the settlement. |
| FRS — | Floating Rate Security |
The rates shown on FRS are the current interest rates at March 31, 2021 and unless noted otherwise, the dates shown are the original maturity dates.
Index Legend
| USFRBPLR — | US Federal Reserve Bank Prime Loan Rate |
The following is a summary of the inputs used to value the Fund’s net assets as of March 31, 2021 (see Note 2):
| | | | | | | | | | | | | | | | |
| | | Level 1 — Unadjusted
Quoted Prices
| | | Level 2 — Other
Observable Inputs
| | | Level 3 — Significant
Unobservable Inputs
| | | Total
| |
ASSETS: | | | | | | | | | | | | | | | | |
Investments at Value:* | | | | | | | | | | | | | | | | |
| | | | |
U.S. Corporate Bonds & Notes | | $ | — | | | $ | 96,742,271 | | | $ | — | | | $ | 96,742,271 | |
Foreign Corporate Bonds & Notes | | | — | | | | 16,136,020 | | | | — | | | | 16,136,020 | |
Loans | | | — | | | | 114,434,689 | | | | — | | | | 114,434,689 | |
Common Stocks: | | | | | | | | | | | | | | | | |
Radio | | | 433,241 | | | | 526 | | | | — | | | | 433,767 | |
Other Industries | | | 110,944 | | | | 829,685 | | | | — | | | | 940,629 | |
Preferred Securities/Capital Securities | | | — | | | | 475,463 | | | | — | | | | 475,463 | |
Escrows and Litigation Trusts | | | — | | | | 31,158 | | | | 9,272 | | | | 40,430 | |
Short-Term Investment Securities | | | 5,059,410 | | | | — | | | | — | | | | 5,059,410 | |
| | |
|
|
| |
|
|
| |
|
|
| |
|
|
|
Total Investments at Value | | $ | 5,603,595 | | | $ | 228,649,812 | | | $ | 9,272 | | | $ | 234,262,679 | |
| | |
|
|
| |
|
|
| |
|
|
| |
|
|
|
| * | For a detailed presentation of investments, please refer to the Portfolio of Investments. |
At the beginning and end of the reporting period, Level 3 investments in securities were not considered a material portion of the Fund. There were no material Level 3 transfers during the reporting period.
See Notes to Financial Statements
SunAmerica Income Funds
NOTES TO FINANCIAL STATEMENTS — March 31, 2021
Note 1. Organization
The SunAmerica Income Funds (the “Trust”) is a diversified open-end management investment company organized as a Massachusetts business trust. The Trust currently consists of three different series (each, a “Fund” and collectively, the “Funds”). Each Fund is a separate series of the Trust with distinct investment objectives and/or strategies. Each Fund is managed by SunAmerica Asset Management, LLC (the “Adviser” or “SunAmerica”), an indirect wholly-owned subsidiary of American International Group, Inc. (“AIG”). An investor may invest in one or more of the following Funds: AIG U.S. Government Securities Fund (“U.S. Government Securities Fund”), AIG Strategic Bond Fund (“Strategic Bond Fund”), and AIG Flexible Credit Fund (“Flexible Credit Fund”). The Funds are considered to be separate entities for financial and tax reporting purposes.
The investment goals and principal investment techniques for each of the Funds are as follows:
U.S. Government Securities Fund seeks high current income consistent with relative safety of capital by the active trading of U.S. Government securities, without regard to the maturities of such securities. Under normal market conditions, at least 80% of the Fund’s net assets plus any borrowing for investment purposes will be invested in such securities.
Strategic Bond Fund seeks a high level of total return by the active trading of a broad range of bonds, including both investment grade and non-investment grade U.S. and foreign bonds (which may include “junk bonds”), U.S. and foreign government and agency obligations, and mortgage-backed securities, without regard to the maturities of such securities. Under normal market conditions, at least 80% of the Fund’s net assets plus any borrowing for investment purposes will be invested in bonds.
Flexible Credit Fund seeks a high level of total return by the active trading in credit instruments. Under normal circumstances, at least 80% of the Fund’s net assets, plus any borrowings for investment purposes, will be invested in credit instruments and derivative instruments and exchange-traded funds (“ETFs”) that are linked to, or provide investment exposure to, credit instruments. The Fund considers a credit instrument to be any debt instrument or instrument with debt-like characteristics, including but not limited to, corporate and sovereign bonds, secured floating rate loans and other institutionally traded secured floating rate debt obligations (“Loans”), and securitized instruments, which are securities backed by pools of assets such as mortgages, loans, or other receivables. The credit instruments in which the Fund intends to primarily invest are U.S. and non-U.S. below investment grade, high yield bonds (commonly referred to as “junk bonds”) and Loans.
Each Fund offers multiple classes of shares. The classes within each Fund are presented in the Statements of Assets and Liabilities. The cost structure for each class is as follows:
Class A shares are offered at net asset value per share plus an initial sales charge. Additionally, purchases of Class A shares in amounts of $250,000 or more will be purchased at net asset value but will be subject to a contingent deferred sales charge on redemptions made within one year of purchase.
Class B shares are offered without an initial sales charge, although a declining contingent deferred sales charge may be imposed on redemptions made within six years of purchase. Class B shares convert automatically to Class A shares on the first business day of the month following the eighth anniversary of the issuance of such Class B shares and at such time will be subject to the lower distribution fee applicable to Class A shares.
Class C shares are offered at net asset value per share without an initial sales charge and may be subject to a contingent deferred sales charge on redemptions made within 12 months of purchase. Effective September 30, 2020, Class C shares will convert automatically to Class A shares approximately eight years after purchase and at such time will be subject to the lower distribution fee applicable to Class A shares.
Class W shares are offered at net asset value per share. The class is offered exclusively through advisory fee-based programs sponsored by certain financial intermediaries and other programs.
Each class of shares bears the same voting, dividend, liquidation and other rights and conditions except as may otherwise be provided in the Trust’s registration statement. Class A, Class B and Class C shares each makes distribution and account maintenance and service fee payments under the distribution plan pursuant to Rule 12b-1 under the Investment Company Act of
SunAmerica Income Funds
NOTES TO FINANCIAL STATEMENTS — March 31, 2021 — (continued)
1940, as amended (the “1940 Act”), with Class B and Class C shares being subject to higher distribution fee rates. Class W shares have not adopted 12b-1 Plans and make no payments thereunder, however, Class W shares pay a service fee to the Funds’ distributor for administrative and shareholder services.
Indemnifications: The Trust’s organizational documents provide current and former officers and trustees with a limited indemnification against liabilities arising out of the performance of their duties to the Trust. In addition, pursuant to Indemnification Agreements between the Trust and each of the current trustees who is not an “interested person,” as defined in Section 2(a)(19) of the 1940 Act, of the Trust (collectively, the “Disinterested Trustees”), the Trust provides the Disinterested Trustees with a limited indemnification against liabilities arising out of the performance of their duties to the Trust, whether such liabilities are asserted during or after their service as trustees. In addition, in the normal course of business, the Trust enters into contracts that contain the obligation to indemnify others. The Trust’s maximum exposure under these arrangements is unknown. Currently, however, the Trust expects the risk of loss to be remote.
Note 2. Significant Accounting Policies
The preparation of financial statements in accordance with U.S. generally accepted accounting principles (“GAAP”) requires management to make estimates and assumptions that affect the reported amounts and disclosures in the financial statements. Actual results could differ from those estimates and those differences could be significant. The Funds are considered investment companies under GAAP and follow the accounting and reporting guidance applicable to investment companies. The following is a summary of significant accounting policies consistently followed by the Trust in the preparation of its financial statements:
Security Valuation: In accordance with the authoritative guidance on fair value measurements and disclosures under GAAP, the Funds disclose the fair value of their investments in a hierarchy that prioritizes the inputs to valuation techniques used to measure the fair value. In accordance with GAAP, fair value is defined as the price that the Funds would receive upon selling an asset or transferring a liability in a timely transaction to an independent third party in the principal or most advantageous market. GAAP establishes a three-tier hierarchy to provide more transparency around the inputs used to measure fair value and to establish classification of fair value measurements for disclosure purposes. Inputs refer broadly to the assumptions that market participants would use in pricing the asset or liability, including assumptions about risk. Inputs may be observable or unobservable. Observable inputs are inputs that reflect the assumptions market participants would use in pricing the asset or liability developed based on market data obtained from sources independent of the reporting entity. Unobservable inputs are inputs that reflect the reporting entity’s own assumptions about the assumptions market participants would use in pricing the asset or liability developed based on the best information available in the circumstances. The three-tiers are as follows:
Level 1 — Unadjusted quoted prices in active markets for identical securities
Level 2 — Other significant observable inputs (including quoted prices for similar securities, interest rates, prepayment speeds, credit risk, referenced indices, quoted prices in inactive markets, adjusted quoted prices in active markets, adjusted quoted prices on foreign equity securities that were adjusted in accordance with pricing procedures approved by the Board of Trustees (“the Board”), etc.)
Level 3 — Significant unobservable inputs (includes inputs that reflect the Funds’ own assumptions about the assumptions market participants would use in pricing the security, developed based on the best information available under the circumstances)
Changes in valuation techniques may result in transfers in or out of an investment’s assigned Level within the hierarchy. The methodology used for valuing investments is not necessarily an indication of the risk associated with investing in those investments and the determination of the significance of a particular input to the fair value measurement in its entirety requires judgment and consideration of factors specific to each security.
The availability of observable inputs can vary from security to security and is affected by a wide variety of factors, including, for example, the type of security, whether the security is recently issued and not yet established in the marketplace, the liquidity of markets, and other characteristics particular to the security. To the extent that valuation is based on models or inputs that are less observable or unobservable in the market, the determination of fair value requires more judgment. Accordingly, the degree of judgment exercised in determining fair value is greatest for instruments categorized in Level 3.
SunAmerica Income Funds
NOTES TO FINANCIAL STATEMENTS — March 31, 2021 — (continued)
The summary of each Fund’s asset and liabilities classified in the fair value hierarchy as of March 31, 2021 is reported on a schedule at the end of each Fund’s Portfolio of Investments.
Stocks are generally valued based upon closing sales prices reported on recognized securities exchanges on which the securities are principally traded and are generally categorized as Level 1. Stocks listed on the NASDAQ are valued using the NASDAQ Official Closing Price (“NOCP”). Generally, the NOCP will be the last sale price unless the reported trade for the stock is outside the range of the bid/ask price. In such cases, the NOCP will be normalized to the nearer of the bid or ask price. For listed securities having no sales reported and for unlisted securities, such securities will be valued based upon the last reported bid price.
As of the close of regular trading on the New York Stock Exchange (“NYSE”), securities traded primarily on security exchanges outside the United States are valued at the last sale price on such exchanges on the day of valuation, or if there is no sale on the day of valuation, at the last-reported bid price. If a security’s price is available from more than one exchange, the Funds use the exchange that is the primary market for the security. Such securities are generally categorized as Level 1. However, depending on the foreign market, closing prices may be up to 15 hours old when they are used to price a Fund’s shares, and a Fund may determine that certain closing prices do not reflect the fair value of the security. This determination will be based on review of a number of factors, including developments in foreign markets, the performance of U.S. securities markets, and the performance of instruments trading in U.S. markets that represent foreign securities and baskets of foreign securities. If a Fund determines that closing prices do not reflect the fair value of the securities, the Fund will adjust the previous closing prices in accordance with pricing procedures approved by the Board to reflect what it believes to be the fair value of the securities as of the close of regular trading on the NYSE. The Funds may also fair value securities in other situations, for example, when a particular foreign market is closed but a Fund is open. For foreign equity securities and foreign equity futures contracts, the Funds use an outside pricing service to provide it with closing market prices and information used for adjusting those prices and when so adjusted, such securities and futures are generally categorized as Level 2.
Bonds, debentures and other debt securities are valued at evaluated bid prices obtained for the day of valuation from a Board-approved pricing service, and are generally categorized as Level 2. The pricing service may use valuation models or matrix pricing which considers information with respect to comparable bond and note transactions, quotations from bond dealers, or by reference to other securities that are considered comparable in such characteristics as rating, interest rate, and maturity date, option adjusted spread models, prepayments projections, interest rate spreads, and yield curves to determine current value. If a price is unavailable from a Board-approved pricing service, the securities may be priced at the mean of two independent quotes obtained from brokers.
Senior floating rate loans (“Loans”) are valued at the average of available bids in the market for such Loans, as provided by a Board-approved loan pricing service, and are generally categorized as Level 2.
Investments in registered investment companies that do not trade on an exchange are valued at the end of day net asset value per share. Investments in registered investment companies that trade on an exchange are valued at the last sales price or official closing price as of the close of the customary trading session on the exchange where the security is principally traded. Investments in registered investment companies are generally categorized as Level 1.
Forward foreign currency contracts (“forward contracts”) are valued at the 4:00 p.m. Eastern Time forward rate and are generally categorized as Level 2.
Other securities are valued on the basis of last sale or bid price (if a last sale price is not available) which is, in the opinion of the Adviser, the broadest and most representative market, that may be either a securities exchange or over-the-counter market and are generally categorized as Level 1 or Level 2.
The Board is responsible for the share valuation process and has adopted policies and procedures (the “PRC Procedures”) for valuing the securities and other assets held by the Funds, including procedures for the fair valuation of securities and other assets for which market quotations are not readily available or are unreliable. The PRC Procedures provide for the establishment of a pricing review committee, which is responsible for, among other things, making certain determinations in connection with the
SunAmerica Income Funds
NOTES TO FINANCIAL STATEMENTS — March 31, 2021 — (continued)
Trust’s fair valuation procedures. Securities for which market quotations are not readily available or the values of which may be significantly impacted by the occurrence of developments or significant events are generally categorized as Level 3. There is no single standard for making fair value determinations, which may result in prices that vary from those of other funds.
Derivative Instruments:
Forward Foreign Currency Contracts: During the period, the Strategic Bond Fund used forward contracts to attempt to protect securities and related receivables and payables against changes in future foreign exchange rates.
A forward contract is an agreement between two parties to buy or sell currency at a set price on a future date. The market value of the contract will fluctuate with changes in currency exchange rates. The contract is marked-to-market daily using the forward rate and the cumulative change in market value is recorded by a Fund as unrealized appreciation or depreciation. On the settlement date, a Fund records either realized gains or losses equal to the difference between the value of the contract at the time it was opened and the value at the time it was closed.
Risks to the Funds of entering into forward contracts include counterparty risk, market risk and illiquidity risk. Counterparty risk arises upon entering into these contracts from the potential inability of counterparties to meet the terms of their contracts. If the counterparty defaults, a Fund’s loss will generally consist of the net amount of contractual payments that the Fund has not yet received though the Fund’s maximum exposure due to counterparty risk could extend to the notional amount of the contract. Market risk is the risk that the value of the forward contract will depreciate due to unfavorable changes in the exchange rates. These contracts may involve market risk in excess of the unrealized appreciation or depreciation reported on the Statements of Assets and Liabilities. Illiquidity risk arises because the secondary market for forwards may have less liquidity relative to markets for other securities. Currency transactions are also subject to risks different from those of other portfolio transactions. Because currency control is of great importance to the issuing governments and influences economic planning and policy, purchases and sales of currency and related instruments can be adversely affected by government exchange controls, limitations or restrictions on repatriation of currency, and manipulations or exchange restrictions imposed by governments.
Forward foreign currency contracts outstanding at the end of the period, if any, are reported on a schedule at the end of each Fund’s Portfolio of Investments.
Master Agreements: Certain Funds that hold derivative instruments and other financial instruments may be a party to ISDA (International Swaps and Derivatives Association, Inc.) Master Agreements or similar agreements (“Master Agreements”) with certain counterparties that govern certain instruments. Master Agreements may contain provisions regarding, among other things, the parties’ general obligations, representations, agreements, collateral requirements, events of default and early termination. Collateral can be in the form of cash or securities as agreed to by the Fund and applicable counterparty. Collateral requirements are generally determined based on a Fund’s net position with each counterparty. Master Agreements may also include certain provisions that require a Fund to post additional collateral upon the occurrence of certain events, such as when a Fund’s net assets fall below a specified level. In addition, Master Agreements typically specify certain standard termination events, such as failure of a party to pay or deliver, credit support defaults and other events of default. Termination events applicable to a Fund may also occur upon a decline in the Fund’s net assets below a specified level over a certain period of time. Additional termination events applicable to counterparties may occur upon a decline in a counterparty’s long-term and short-term credit ratings below a specified level, or upon a decline in the ratings of a counterparty’s credit support provider. Upon the occurrence of a termination event, the other party may elect to terminate early and cause settlement of all instruments outstanding pursuant to a particular Master Agreement, including the payment of any losses and costs resulting from such early termination, as reasonably determined by the terminating party. Any decision by one or more of a Fund’s counterparties to elect early termination could cause a Fund to accelerate the payment of liabilities, which settlement amounts could be in excess of the amount of assets that are already posted as collateral. Typically, the Master Agreement will permit a single net payment in the event of default. Note, however, that bankruptcy or insolvency laws of a particular jurisdiction may impose restrictions on or prohibitions against the right of offset in bankruptcy, insolvency or other events. As a result, the early termination with respect to derivative instruments subject to Master Agreements that are in a net liability position could be material to a Fund’s financial statements. The Funds do not offset derivative assets and derivative liabilities that are subject to netting arrangements in the Statements of Asset and Liabilities.
SunAmerica Income Funds
NOTES TO FINANCIAL STATEMENTS — March 31, 2021 — (continued)
The following tables represent the value of derivatives held as of March 31, 2021, by their primary underlying risk exposure. The derivative contracts held during the period are not accounted for as hedging instruments under GAAP. For a detailed presentation of derivatives held as of March 31, 2021, please refer to the schedule at the end of each Fund’s Portfolio of Investments.
| | | | | | | | |
| | | Asset Derivatives
| | | Liability
Derivatives
| |
| | | Foreign
Forward
Exchange
Contracts
| | | Foreign
Forward
Exchange
Contracts
| |
Fund
| | Foreign
Exchange
Contracts(1)
| | | Foreign
Exchange
Contracts(2)
| |
Strategic Bond | | $ | 597,934 | | | $ | 33,150 | |
| | |
|
|
| |
|
|
|
Statement of Assets and Liabilities Location:
| (1) | Unrealized appreciation on forward foreign currency contracts |
| (2) | Unrealized depreciation on forward foreign currency contracts |
| | | | | | | | |
| | | Realized
Gain (Loss) on
Derivatives
Recognized in
Statement of
Operations
| | | Change in
Unrealized
Appreciation
(Depreciation) on
Derivatives
Recognized in
Statement of
Operations
| |
| | | Foreign
Forward
Exchange
Contracts
| | | Foreign
Forward
Exchange
Contracts
| |
Fund
| | Foreign
Exchange
Contracts(1)
| | | Foreign
Exchange
Contracts(2)
| |
Strategic Bond | | $ | (1,568,282 | ) | | $ | 373,925 | |
| | |
|
|
| |
|
|
|
Statement of Operations Location:
| (1) | Net realized gain (loss) on forward contracts |
| (2) | Change in unrealized appreciation (depreciation) on forward contracts |
The following table represents the average monthly balances of derivatives held during the year ended March 31, 2021:
| | | | |
| | | Average Amount
Outstanding
During the Year
| |
Fund
| | Foreign
Exchange
Contracts(1)
| |
Strategic Bond | | $ | 22,869,997 | |
| | |
|
|
|
| (1) | Amounts represent notional amounts in US dollars. |
The following tables set forth the Funds’ derivative assets and liabilities by counterparty, net of amounts available for offset under Master Agreements and net of the related collateral pledged/(received) as of March 31, 2021. The repurchase agreements held by the Funds as of March 31, 2021, are also subject to Master Agreements but are not included in the following tables. See the Portfolio of Investments of each Fund and the Notes to the Financial Statements for more information about the Funds’ holdings in repurchase agreements.
SunAmerica Income Funds
NOTES TO FINANCIAL STATEMENTS — March 31, 2021 — (continued)
| | | | | | | | | | | | | | | | | | | | | | | | | | | | | | | | | | | | | | | | | | | | |
| | | Strategic Bond Fund
| |
| | | Derivative Assets(1)
| | | Derivative Liabilities(1)
| | | | | | | | | | |
Counterparty
| | Forward
Foreign
Currency
Contracts
| | | OTC
Swaps
| | | Options
Purchased
| | | Total
| | | Forward
Foreign
Currency
Contracts
| | | OTC
Swaps
| | | Options
Written
| | | Total
| | | Net
Derivative
Assets
(Liabilities)
| | | Collateral
Pledged/
(Received)(2)
| | | Net Amount(3)
| |
JPMorgan Chase Bank N.A | | $ | 597,934 | | | $ | — | | | $ | — | | | $ | 597,934 | | | $ | 33,150 | | | $ | — | | | $ | — | | | $ | 33,150 | | | $ | 564,784 | | | $ | — | | | $ | 564,784 | |
| | |
|
|
| |
|
|
| |
|
|
| |
|
|
| |
|
|
| |
|
|
| |
|
|
| |
|
|
| |
|
|
| |
|
|
| |
|
|
|
| (1) | Gross amounts of recognized assets and liabilities not offset in the Statement of Assets and Liabilities. |
| (2) | For each respective counterparty, collateral pledged or (received) is limited to an amount not to exceed 100% of the derivative asset/liability in the table above. |
| (3) | Net amount represents the net amount due (to)/from counterparty in the event of a default based on the contractual set-off rights under the agreement. |
Mortgage-Backed Dollar Rolls: Certain Funds may enter into dollar rolls using “to be announced” (“TBA”) mortgage-backed securities (“TBA Rolls”). TBA Roll transactions involve the sale of mortgage or other asset backed securities with the commitment to purchase substantially similar securities on a specified future date. The Funds’ policy is to record the components of TBA Rolls as purchase/sale transactions. Any difference between the purchase and sale price is recorded as a realized gain or loss on the date the transaction is entered into. TBA Roll transactions involve the risk that the market value of the securities held by a Fund may decline below the price of the securities that the Fund has sold but is obligated to repurchase under the agreement. In the event that the buyer of securities in a TBA Roll transaction files bankruptcy or becomes insolvent, a Fund’s use of the proceeds from the sale of the securities may be restricted pending a determination by the other party, or its trustee or receiver, whether to enforce the Fund’s obligation to repurchase the securities. Mortgage-Backed Dollar Rolls outstanding at the end of the period, if any, are included in investments purchased/sold on an extended settlement basis in the Statement of Assets and Liabilities.
When-Issued Securities and Forward Commitments: Certain Funds may purchase or sell when-issued securities (including TBA securities) that have been authorized, but not yet issued in the market. In addition, a Fund may purchase or sell securities on a forward commitment basis. A forward commitment involves entering into a contract to purchase or sell securities, typically on an extended settlement basis, for a fixed price at a future date. The Funds may engage in when-issued or forward commitment transactions in order to secure what is considered to be an advantageous price and yield at the time of entering into the obligation. The purchase of securities on a when-issued or forward commitment basis involves a risk of loss if the value of the security to be purchased declines before the settlement date. Conversely, the sale of securities on a when-issued or forward commitment basis involves the risk that the value of the securities sold may increase before the settlement date. Securities purchased or sold on a when-issued or forward commitment basis outstanding at the end of the period, if any, are included in investments purchased/sold on an extended settlement basis in the Statement of Assets and Liabilities.
Loans: The Fund invests in senior loans which generally consist of direct debt obligations of companies (collectively, “Borrowers”), primarily U.S. companies and their affiliates, undertaken to finance the growth of the Borrower’s business internally and externally, or to finance a capital restructuring. Transactions in senior loans may settle on a delayed basis. Unsettled loans at the end of the period, if any, are included in investments purchased/sold on an extended settlement basis in the Statement of Assets and Liabilities.
Stripped Mortgage-Backed Securities: Stripped Mortgage-Backed Securities (“SMBS”) are multiple-class mortgage-backed securities. SMBS are often structured with two classes that receive different proportions of the interest and principal distributions on a pool of mortgage assets. SMBS have greater market volatility than other types of U.S. government securities in which a Fund invests. A common type of SMBS has one class receiving some of the interest and all or most of the principal (the “principal only” class) from the mortgage pool, while the other class will receive all or most of the interest (the “interest only” class). The yield to maturity on an interest only class is extremely sensitive not only to changes in prevailing interest rates, but also to the rate of principal payments, including principal prepayments, on the underlying pool of mortgage assets, and a rapid rate of principal payment may have a material adverse effect on a Fund’s yield.
Inflation-Indexed Bonds: Certain Funds may purchase inflation-indexed bonds. Inflation-indexed bonds are fixed income securities whose principal value is adjusted periodically according to the rate of inflation. Two structures are common. The U.S. Treasury and certain other issuers use a structure that reflects inflation in the principal value of the bond. Other issuers pay out any inflation related accruals as part of a semiannual coupon. The value of inflation-indexed bonds is expected to change in
SunAmerica Income Funds
NOTES TO FINANCIAL STATEMENTS — March 31, 2021 — (continued)
response to changes in real interest rates. Real interest rates, in turn, are tied to the relationship between nominal interest rates (i.e., stated interest rates) and the rate of inflation. Therefore, if the rate of inflation rises at a faster rate than nominal interest rates, real interest rates (i.e., nominal interest rates minus inflation) might decline, leading to an increase in value of inflation-indexed bonds. In contrast, if nominal interest rates increase at a faster rate than inflation, real interest rates might rise, leading to a decrease in value of inflation-indexed bonds. There can be no assurance, however, that the value of inflation-indexed bonds will be directly correlated to changes in nominal interest rates, and short-term increases in inflation may lead to a decline in their value. Coupon payments received from inflation-indexed bonds are recorded in the Statements of Operations as interest income. In addition, any increase or decrease in the principal amount of an inflation-indexed bond will be recorded in the Statements of Operations as an increase or decrease to interest income, even though principal is not paid until maturity.
Repurchase Agreements: The Funds, along with other affiliated registered investment companies, pursuant to procedures adopted by the Board and applicable guidance from the Securities and Exchange Commission (“SEC”), may transfer uninvested cash balances into a single joint account, the daily aggregate balance of which is invested in one or more repurchase agreements collateralized by U.S. Treasury or federal agency obligations. In a repurchase agreement, the seller of a security agrees to repurchase the security at a mutually agreed-upon time and price, which reflects the effective rate of return for the term of the agreement. For repurchase agreements and joint repurchase agreements, the Trust’s custodian takes possession of the collateral pledged for investments in such repurchase agreements (“repo” or collectively “repos”). The underlying collateral is valued daily on a mark to market basis, plus accrued interest to ensure that the value, at the time the agreement is entered into, is equal to at least 102% of the repurchase price, including accrued interest. In the event of default of the obligation to repurchase, a Fund has the right to liquidate the collateral and apply the proceeds in satisfaction of the obligation. If the seller defaults and the value of the collateral declines or if bankruptcy proceedings are commenced with respect to the seller of the security, realization of the collateral by a Fund may be delayed or limited.
Securities Transactions, Investment Income, Expenses, Dividends and Distributions to Shareholders: Security transactions are recorded on a trade date basis. Interest income is accrued daily from settlement date except when collection is not expected. Dividend income is recorded on the ex-dividend date except for certain dividends from foreign securities, which are recorded as soon as the Trust is informed after the ex-dividend date. Paydown gains and losses on mortgage and asset-backed securities are recorded as components of interest income on the Statements of Operations. For financial statement purposes, the Funds amortize all premiums and accrete all discounts on fixed income securities.
Realized gains and losses on the sale of investments are calculated on the identified cost basis. Funds which earn foreign income and capital gains may be subject to foreign withholding taxes and capital gains taxes at various rates. Under applicable foreign law, a withholding of tax may be imposed on interest, dividends, and capital gains from the sale of foreign securities at various rates.
Income and expenses, other than class specific expenses, are allocated daily to each class of shares based upon the relative value of dividend-eligible shares after adjusting for the current capital share activity of the respective class. Realized and unrealized gains and losses are allocated daily to each class of shares based upon the relative value of outstanding shares after adjusting for the current capital share activity of the respective class.
Expenses common to all Funds are allocated among the Funds based upon relative net assets or other appropriate allocation methods. In all other respects, expenses are charged to each Fund as incurred on a specific identification basis.
Dividends from net investment income are accrued daily and paid monthly. Capital gain distributions, if any, are paid annually. The Funds record dividends and distributions to their shareholders on the ex-dividend date. The Funds reserve the right to declare and pay dividends less frequently than disclosed above, provided that the net realized capital gains and net investment income, if any, are paid at least annually.
The amount of dividends and distributions from net investment income and net realized capital gains are determined in accordance with federal income tax regulations, which may differ from GAAP. These “book/tax” differences are either considered temporary or permanent in nature. To the extent these differences are permanent in nature, such amounts are reclassified within the capital accounts at fiscal year end based on their federal tax-basis treatment; temporary differences do not require reclassification. Net assets are not affected by these reclassifications.
SunAmerica Income Funds
NOTES TO FINANCIAL STATEMENTS — March 31, 2021 — (continued)
Each Fund is considered a separate entity for tax purposes and intends to comply with the requirements of the Internal Revenue Code, as amended, applicable to regulated investment companies and distribute all of its taxable income, including any net capital gains on investments, to its shareholders. Each Fund also intends to distribute sufficient net investment income and net capital gains, if any, so that it will not be subject to excise tax on undistributed income and gains. Therefore, no federal income tax or excise tax provision is required.
Each Fund recognizes the tax benefits of uncertain tax positions only when the position is more likely than not to be sustained, assuming examination by tax authorities. Management has analyzed each Fund’s tax positions and concluded that no liability for unrecognized tax benefits should be recorded related to uncertain tax positions. The Funds are not aware of any tax provisions for which it is reasonably possible that the total amounts of unrecognized tax benefits will change materially in the next twelve months. The Funds file U.S. federal and certain state income tax returns. The Funds federal tax returns for the prior three fiscal years remain subject to examination by the Internal Revenue Service.
Foreign Currency Translation: The books and records of the Funds are maintained in U.S. dollars. Assets and liabilities denominated in foreign currencies and commitments under forward foreign currency contracts are translated into U.S. dollars based on the exchange rate of such currencies against U.S. dollars on the date of valuation.
The Funds do not isolate that portion of the results of operations arising as a result of changes in the foreign exchange rates from the changes in the market prices of securities held at the end of the period. Similarly, the Funds do not isolate the effect of changes in foreign exchange rates from the changes in the market prices of portfolio securities sold during the period.
Realized foreign exchange gains and losses on other assets and liabilities and change in unrealized foreign exchange gains and losses on other assets and liabilities located in the Statements of Operations include realized foreign exchange gains and losses from currency gains or losses between the trade and the settlement dates of securities transactions, the difference between the amounts of interest, dividends and foreign withholding taxes recorded on the Funds’ books and the U.S. dollar equivalent amounts actually received or paid and changes in the unrealized foreign exchange gains and losses relating to the other assets and liabilities arising as a result of changes in the exchange rates.
LIBOR Risk: A fund’s investments, payment obligations and financing terms may be based on floating rates, such as LIBOR, Euro Interbank Offered Rate and other similar types of reference rates (each, a “Reference Rate”). On July 27, 2017, the Chief Executive of the UK Financial Conduct Authority (“FCA”), which regulates LIBOR, announced that the FCA will no longer persuade nor require banks to submit rates for the calculation of LIBOR and certain other Reference Rates after 2021. On March 5, 2021, the FCA and LIBOR’s administrator announced that most LIBOR settings will no longer be published after June 30, 2023. Such announcements indicate that the continuation of LIBOR and other Reference Rates on the current basis cannot and will not be guaranteed. These announcements and any additional regulatory or market changes may have an adverse impact on a fund or its investments.
Regulators and market participants are working together to identify or develop successor Reference Rates. It is expected that market participants will focus on the transition mechanisms by which the Reference Rates in existing contracts or instruments may be amended, whether through market wide protocols, fallback contractual provisions, bespoke negotiations or amendments or otherwise. Nonetheless, the termination of certain Reference Rates presents risks to a fund. At this time, it is not possible to completely identify or predict the effect of any such changes, any establishment of alternative Reference Rates or any other reforms to Reference Rates that may be enacted in the UK or elsewhere. The elimination of a Reference Rate or any other changes or reforms to the determination or supervision of Reference Rates, and these changes could have an adverse impact on the market for or value of any securities or payments linked to those Reference Rates and other financial obligations held by a fund or on its overall financial condition or results of operations. In addition, any substitute Reference Rate and any pricing adjustments imposed by a regulator or by counterparties or otherwise may adversely affect a fund’s performance and/or net asset value.
New Accounting Pronouncements: In August 2018, the FASB issued Accounting Standards Update (“ASU”) No. 2018-13 “Disclosure Framework — Changes to the Disclosure Requirements for Fair Value Measurement”. The ASU eliminates, modifies, and adds disclosure requirements for fair value measurements and is effective for fiscal years, and interim periods within those fiscal years, beginning after December 15, 2019. Adoption of the ASU had no material impact on the Funds.
SunAmerica Income Funds
NOTES TO FINANCIAL STATEMENTS — March 31, 2021 — (continued)
In March 2020, the FASB issued ASU No. 2020-04 “Facilitation of the Effects of Reference Rate Reform on Financial Reporting”, which provides optional, temporary relief with respect to the financial reporting of contracts subject to certain types of modifications due to the planned discontinuation of LIBOR and other interbank offered based reference rates at of the end of 2021. The temporary relief provided by ASU 2020-04 is effective for certain reference rate-related contract modifications that occur during the period March 12, 2020 through December 31, 2022. Management is evaluating the potential impact of ASU 2020-04 on the financial statements.
On December 3, 2020, the SEC announced that it voted to adopt a new rule that establishes an updated regulatory framework for fund valuation practices (the “Rule”). The Rule, in part, provides (i) a framework for determining fair value in good faith and (ii) provides for a fund Board’s assignment of its responsibility for the execution of valuation related activities to a fund’s investment adviser. Further, the SEC is rescinding previously issued guidance on related issues. The Rule became effective on March 8, 2021 and has a compliance date of September 8, 2022 (eighteen months following the effective date). Management is currently evaluating the Rule and its impact to the Fund.
Note 3. Investment Advisory and Management Agreement, Distribution Agreement and Service Agreement
The Trust, on behalf of each Fund, has an Investment Advisory and Management Agreement (the “Agreement”) with SunAmerica. Under the Agreement, SunAmerica provides continuous supervision of a Fund’s portfolio and administers its corporate affairs, subject to general review by the Trustees. In connection therewith, SunAmerica furnishes the Funds with office facilities, maintains certain of the Funds’ books and records, and pays the salaries and expenses of all personnel, including officers of the Funds, who are employees of SunAmerica and its affiliates.
The Funds pay SunAmerica a monthly investment advisory and management fee calculated daily at the following annual percentages of each Fund’s average daily net assets:
| | | | | | |
Fund
| | Assets
| | Management
Fees
| |
U.S. Government Securities | | $0 - $200 million | | | 0.650 | % |
| | | > $200 million | | | 0.620 | |
| | | > $400 million | | | 0.550 | |
Strategic Bond(1) | | $0 - $350 million | | | 0.650 | |
| | | > $350 million | | | 0.600 | |
Flexible Credit(2) | | $0 - $200 million | | | 0.750 | |
| | | > $200 million | | | 0.720 | |
| | | > $400 million | | | 0.550 | |
| (1) | The Advisor contractually agreed to waive its advisory fee with respect to the AIG Strategic Bond Fund through July 31, 2021, and from year to year thereafter provided such continuance is agreed to by the Advisor and approved by a majority of the Disinterested Trustees, so that the advisory fee payable by the Fund to the Advisor under the agreement equals 0.38% on the first $350 million and 0.33% above $350 million of average daily net assets. |
| (2) | The Advisor contractually agreed to waive its advisory fee with respect to the AIG Flexible Credit Fund through July 31, 2021, and from year to year thereafter provided such continuance is agreed to by the Advisor and approved by a majority of the Disinterested Trustees, so that the advisory fee payable by the Fund to the Advisor under the agreement equals 0.34% of average daily net assets. |
For the year ended March 31, 2021 the amount of investment advisory fees waived for Strategic Bond Fund and Flexible Credit Fund were $931,880 and $1,013,458, respectively. These amounts are reflected in the Statement of Operations.
The organizations described below act as subadvisers to the Trust and certain of its Funds pursuant to Subadvisory Agreements with SAAMCo. Under the Subadvisory Agreements, the subadvisers manage the investment and reinvestment of the assets of the respective Funds for which they are responsible.
Each of the subadvisers is independent of SAAMCo and discharges its responsibilities subject to the policies of the Trust’s Trustees and the oversight and supervision of SAAMCo, which pays the subadvisers’ fees.
| | | | |
Subadviser
| | Fund
| |
PineBridge Investments, LLC | | | Strategic Bond | |
Newfleet Asset Management, LLC | | | Flexible Credit | |
SunAmerica Income Funds
NOTES TO FINANCIAL STATEMENTS — March 31, 2021 — (continued)
SunAmerica has contractually agreed to waive fees and/or reimburse expenses, to the extent necessary to cap the Funds’ annual fund operating expenses at the following percentages of each Fund’s average net assets. For the purposes of waived fees and/or reimbursed expense calculations, annual Fund operating expenses shall not include extraordinary expenses (i.e., expenses that are unusual in nature and infrequent in occurrence, such as litigation), or acquired Fund fees and expenses, brokerage commissions and other transactional expenses relating to the purchase and sale of portfolio securities, interest, taxes and governmental fees, and other expenses not incurred in the ordinary course of a Fund’s business. The contractual fee waivers and expense reimbursements will continue indefinitely, subject to termination by the Trustees, including a majority of the Disinterested Trustees.
| | | | |
Fund
| | Percentage
| |
U.S. Government Securities Class A | | | 0.99 | % |
U.S. Government Securities Class C | | | 1.64 | |
Strategic Bond Class A | | | 1.40 | |
Strategic Bond Class B | | | 2.05 | |
Strategic Bond Class C | | | 2.05 | |
Strategic Bond Class W | | | 1.20 | |
Flexible Credit Class A | | | 1.45 | |
Flexible Credit Class C | | | 2.10 | |
Flexible Credit Class W | | | 1.25 | |
For the U.S. Government Securities Fund, any contractual waivers and/or reimbursements made by SunAmerica are subject to recoupment from the Fund within two years after the occurrence of the waivers and/or reimbursements, provided that the Fund is able to effect such payment to SunAmerica and remain in compliance with the expense limitations in effect at the time the waivers and/or reimbursements were made.
For the year ended March 31, 2021, pursuant to the contractual expense limitations in the above tables SunAmerica
has waived and/or reimbursed expenses as follows:
| | | | |
Fund
| | Other Expenses
Reimbursed
| |
U.S. Government Securities | | $ | 233,500 | |
| |
Fund
| | Class Specific
Expenses
| |
U.S. Government Securities Class A | | $ | 295,801 | |
U.S. Government Securities Class C | | | 42,882 | |
At March 31, 2021, expenses previously waived or reimbursed by SunAmerica that are subject to recoupment and expire
during the time period indicated are as follows:
| | | | | | | | |
| | | Other Expenses Reimbursed
| |
Fund
| | March 31, 2022
| | | March 31, 2023
| |
U.S. Government Securities | | $ | 213,543 | | | $ | 233,500 | |
| |
| | | Class Specific Expenses
Reimbursed
| |
Fund
| | March 31, 2022
| | | March 31, 2023
| |
U.S. Government Securities Class A | | $ | 295,607 | | | $ | 295,801 | |
U.S. Government Securities Class C | | | 37,873 | | | | 42,882 | |
The Trust, on behalf of each Fund, has entered into a Distribution Agreement with AIG Capital Services, Inc. (“ACS” or “Distributor”), an affiliate of the Adviser. Each Fund has adopted a Distribution Plan on behalf of each Class (other than Class W shares of the Strategic Bond and Flexible Credit Funds), in accordance with the provisions of Rule 12b-1 under the 1940 Act (each, a “Plan,” and collectively, the “Plans”), hereinafter referred to as the “Class A Plan,” the “Class B Plan” and the “Class C Plan.” In adopting the Class A Plan, the Class B Plan and the Class C Plan, the Trustees determined that there was a reasonable
SunAmerica Income Funds
NOTES TO FINANCIAL STATEMENTS — March 31, 2021 — (continued)
likelihood that each such Plan would benefit the Trust and the shareholders of the respective class. The sales charge and distribution fees of a particular class will not be used to subsidize the sale of shares of any other class.
The Class A, Class B and Class C Plans provide that the Trust, on behalf of the respective classes, shall pay the Distributor a distribution fee at an annual rate of up to 0.10%, 0.75% and 0.75%, of average daily net assets of such Fund’s Class A, Class B and Class C shares, respectively, to compensate the Distributor and certain securities firms for providing sales and promotional activities for distributing that class of shares. The distribution costs for which the Distributor may be compensated include fees paid to broker-dealers that have sold Fund shares, commissions, and other expenses such as those incurred for sales literature, prospectus printing and distribution and compensation to wholesalers. It is possible that in any given year, the amount paid to the Distributor under the Class A Plan, Class B Plan or Class C Plan may exceed the Distributor’s distribution costs as described above. Except for Class W shares of the Strategic Bond and Flexible Credit Funds, the Plans also provide that each class of shares of the Trust will also pay the Distributor an account maintenance fee at the annual rate of up to 0.25% of the aggregate average daily net assets of such class of shares to compensate the Distributor and securities firms for account maintenance activities. The Distributor does not receive or retain any distribution and/or account maintenance fees for any shares when the shareholder does not have a broker of record. For the year ended March 31, 2021, ACS received fees as reflected in the Statements of Operations based on the aforementioned rates.
The Trust, on behalf of the Strategic Bond and Flexible Credit Funds, has entered into an Administrative and Shareholder Services Agreement with ACS, pursuant to which ACS is paid an annual fee of 0.15% of average daily net assets of Class W shares as compensation for providing additional shareholder services to Class W shareholders. The Distributor does not receive or retain any distribution and/or account maintenance fees for any shares when the shareholder does not have a broker of record. For the year ended March 31, 2021, ACS earned fees as reflected in the Statements of Operations based on the aforementioned rate.
ACS receives sales charges on each Fund’s Class A shares, portions of which are reallowed to affiliated broker-dealers and non-affiliated broker-dealers. ACS also receives the proceeds of contingent deferred sales charges paid by investors in connection with certain redemptions of Class A, Class B and Class C shares. ACS has advised the Funds that for the year ended March 31, 2021, the proceeds received from Class A sales (and paid out to affiliated and non-affiliated broker-dealers) and Class A, Class B and Class C redemptions were as follows:
| | | | | | | | | | | | | | | | | | | | | | | | |
| | | Class A
| | | Class B
| | | Class C
| |
Fund
| | Sales
Charges
| | | Affiliated
Broker-dealers
| | | Non-affiliated
Broker-dealers
| | | Contingent
Deferred
Sales Charges
| | | Contingent
Deferred
Sales Charges
| | | Contingent
Deferred
Sales Charges
| |
U.S. Government Securities | | $ | 21,629 | | | $ | 5,212 | | | $ | 10,770 | | | $ | — | | | $ | — | | | $ | 2,917 | |
Strategic Bond | | | 101,078 | | | | 29,040 | | | | 47,634 | | | | 11 | | | | 78,301 | | | | 6,514 | |
Flexible Credit | | | 88,139 | | | | 2,101 | | | | 65,348 | | | | — | | | | — | | | | 2,575 | |
The Trust has entered into a Service Agreement with AIG Fund Services, Inc. (“AFS”), an affiliate of the Adviser. Under the Service Agreement, AFS performs certain shareholder account functions by assisting the Funds’ transfer agent, DST Asset Manager Solutions, Inc. (“DST”) in connection with the services that it offers to the shareholders of the Funds. The Service Agreement permits the Funds to compensate AFS for services rendered, based upon an annual rate of 0.22% of average daily net assets, which is approved annually by the Trustees. For the year ended March 31, 2021, the Funds incurred the following
SunAmerica Income Funds
NOTES TO FINANCIAL STATEMENTS — March 31, 2021 — (continued)
expenses which are included in transfer agent fees and expenses in the Statements of Operations to compensate AFS pursuant to the terms of the Service Agreement:
| | | | | | | | |
Fund
| | Expenses
| | | Payable at
March 31, 2021
| |
U.S. Government Securities Class A | | $ | 269,088 | | | $ | 20,766 | |
U.S. Government Securities Class C | | | 24,595 | | | | 1,464 | |
Strategic Bond Class A | | | 359,579 | | | | 32,445 | |
Strategic Bond Class B | | | 32,459 | | | | 2,692 | |
Strategic Bond Class C | | | 102,199 | | | | 7,476 | |
Strategic Bond Class W | | | 265,077 | | | | 26,938 | |
Flexible Credit Class A | | | 189,960 | | | | 16,618 | |
Flexible Credit Class C | | | 94,651 | | | | 6,935 | |
Flexible Credit Class W | | | 267,391 | | | | 19,329 | |
At March 31, 2021, AIG Active Allocation Fund and AIG Multi-Asset Allocation Fund, each a series of SunAmerica Series, Inc., owned a percentage of the outstanding shares of the following Funds:
| | | | | | | | |
| | | Holder
| |
Fund
| | AIG
Active
Allocation
Fund
| | | AIG
Multi-Asset
Allocation
Fund
| |
U.S. Government Securities | | | 19.07 | % | | | 17.32 | % |
Strategic Bond | | | 2.67 | | | | 2.62 | |
Flexible Credit | | | 3.11 | | | | 3.00 | |
Note 4. Purchases and Sales of Investment Securities
The cost of purchases and proceeds from sales and maturities of long-term investments during the year ended March 31, 2021 were as follows:
| | | | | | | | | | | | | | | | |
Fund
| | Purchases of Investment
Securities (Excluding U.S.
Government Securities)
| | | Sales of Investment
Securities (Excluding U.S.
Government Securities)
| | | Purchase of U.S.
Government
Securities
| | | Sales of U.S.
Government
Securities
| |
U.S. Government Securities | | $ | — | | | $ | — | | | $ | 19,091,566 | | | $ | 31,872,435 | |
Strategic Bond | | | 341,570,994 | | | | 266,856,790 | | | | 53,386,130 | | | | 93,684,494 | |
Flexible Credit | | | 176,279,513 | | | | 237,250,442 | | | | — | | | | — | |
Note 5. Federal Income Taxes
The following details the tax basis of distributions as well as the components of distributable earnings. The tax basis components of distributable earnings differ from the amounts reflected in the Statements of Assets and Liabilities by temporary book/tax differences primarily arising from wash sales, post October capital losses, late year ordinary losses, distributions payable, straddle loss deferrals, amortization of premium/discount and treatment of defaulted securities.
| | | | | | | | | | | | | | | | | | | | |
| | | Distributable Earnings
For the year ended March 31, 2021
| | | Tax Distributions
For the year ended March 31, 2021
| |
Fund
| | Ordinary
Income
| | | Long-term
Gains/ Capital
Loss Carryover
| | | Unrealized
Appreciation
(Depreciation)*
| | | Ordinary
Income
| | | Long-Term
Capital Gains
| |
U.S. Government Securities | | $ | 767,201 | | | $ | (19,212,042 | ) | | $ | 4,608,676 | | | $ | 1,954,819 | | | $ | — | |
Strategic Bond | | | 559,976 | | | | (23,749,539 | ) | | | 1,469,214 | | | | 11,298,705 | | | | — | |
Flexible Credit | | | 1,020,154 | | | | (23,474,025 | ) | | | (377,317 | ) | | | 11,626,470 | | | | — | |
| * | Unrealized appreciation (depreciation) includes amounts for derivatives and other assets and liabilities denominated in foreign currency. |
SunAmerica Income Funds
NOTES TO FINANCIAL STATEMENTS — March 31, 2021 — (continued)
| | | | | | | | |
| | | Tax Distributions
For the year ended March 31, 2020
| |
Fund
| | Ordinary
Income
| | | Long-Term
Capital Gains
| |
U.S. Government Securities | | $ | 2,173,041 | | | $ | — | |
Strategic Bond | | | 10,676,277 | | | | — | |
Flexible Credit | | | 17,458,208 | | | | — | |
As of March 31, 2021, for Federal income tax purposes, the Funds indicated below have capital loss carryforwards which are available to offset future capital gains, if any:
| | | | | | | | |
| | | Unlimited
| |
Fund
| | ST
| | | LT
| |
U.S. Government Securities | | $ | 13,829,314 | | | $ | 5,382,728 | |
Strategic Bond | | | — | | | | 23,749,539 | |
Flexible Credit | | | — | | | | 23,474,025 | |
The Funds indicated below, utilized capital loss carryforwards, which offset net realized taxable gains in the year ended March 31, 2021:
| | | | |
Fund
| | Capital Loss
Carryforward
Utilized
| |
U.S. Government Securities | | $ | 530,295 | |
Strategic Bond | | | 7,440,940 | |
Flexible Credit | | | 554,788 | |
Under the current law, capital losses realized after October 31 and late year ordinary losses may be deferred and treated as occurring on the first day of the following year. For the fiscal year ended March 31, 2021, the Funds elected to defer late year ordinary losses and post October capital losses as follows:
| | | | | | | | | | | | |
Fund
| | Deferred
Late Year
Ordinary Loss
| | | Deferred
Post-October
Short-Term
Capital Loss
(Gain)
| | | Deferred
Post-October
Long-Term
Capital Loss
(Gain)
| |
U.S. Government Securities | | $ | — | | | $ | — | | | $ | — | |
Strategic Bond | | | — | | | | — | | | | — | |
Flexible Credit | | | — | | | | — | | | | 1,561,350 | |
For the period ended March 31, 2021, the reclassifications arising from book/tax differences resulted in increases (decreases) that were primarily due to net paydown adjustments, amortization of discount/premium, treatment of litigation payments and treatment of foreign currency to the components of net assets as follows:
| | | | | | | | | | | | |
Fund
| | Accumulated
Undistributed Net
Investment Income
(Loss)
| | | Accumulated
Undistributed Net
Realized Gain
(Loss)
| | | Capital Paid-in
| |
U.S. Government Securities | | $ | 819,948 | | | $ | (819,948 | ) | | $ | — | |
Strategic Bond | | | 1,083,986 | | | | (1,119,575 | ) | | | 35,589 | |
Flexible Credit | | | 677,118 | | | | (591,833 | ) | | | (85,285 | ) |
The amounts of aggregate unrealized gain (loss) and the cost of investment securities for federal tax purposes, including short-term securities and repurchase agreements, were as follows:
| | | | | | | | | | | | | | | | |
Fund
| | Aggregate
Unrealized
Gain
| | | Aggregate
Unrealized
Loss
| | | Unrealized
Gain/(Loss)
Net
| | | Cost of
Investments
| |
U.S. Government Securities | | $ | 6,220,739 | | | $ | (1,612,063 | ) | | $ | 4,608,676 | | | $ | 111,501,165 | |
Strategic Bond | | | 10,919,372 | | | | (9,448,031 | ) | | | 1,471,341 | | | | 373,316,567 | |
Flexible Credit Bond | | | 6,372,755 | | | | (6,750,072 | ) | | | (377,317 | ) | | | 234,639,996 | |
SunAmerica Income Funds
NOTES TO FINANCIAL STATEMENTS — March 31, 2021 — (continued)
Note 6. Capital Share Transactions
Transactions in capital shares of each class of each Fund were as follows:
| | | | | | | | | | | | | | | | | | | | | | | | | | | | | | | | |
| | | U.S. Government Securities
| | | | | | | | | | | | | |
| | | Class A
| | | | | | | | | | | | | |
| | | For the
year ended
March 31, 2021
| | | For the
year ended
March 31, 2020
| | | | | | | | | | | | | |
| | | Shares
| | | Amount
| | | Shares
| | | Amount
| | | | | | | | | | | | | |
Shares sold | | | 2,236,518 | | | $ | 21,764,624 | | | | 2,586,535 | | | $ | 24,100,485 | | | | | | | | | | | | | | | | | |
Reinvested dividends | | | 179,482 | | | | 1,731,327 | | | | 207,531 | | | | 1,934,929 | | | | | | | | | | | | | | | | | |
Shares redeemed | | | (3,626,977 | ) | | | (34,987,221 | ) | | | (3,842,653 | ) | | | (35,899,452 | ) | | | | | | | | | | | | | | | | |
| | |
|
|
| |
|
|
| |
|
|
| |
|
|
| | | | | | | | | | | | | | | | |
Net increase (decrease) in shares outstanding before automatic conversion | | | (1,210,977 | ) | | | (11,491,270 | ) | | | (1,048,587 | ) | | | (9,864,038 | ) | | | | | | | | | | | | | | | | |
| | |
|
|
| |
|
|
| |
|
|
| |
|
|
| | | | | | | | | | | | | | | | |
Shares issued/(reacquired) upon automatic conversion | | | 94,688 | | | | 914,469 | | | | 15,094 | | | | 139,280 | | | | | | | | | | | | | | | | | |
| | |
|
|
| |
|
|
| |
|
|
| |
|
|
| | | | | | | | | | | | | | | | |
Net increase (decrease) | | | (1,116,289 | ) | | $ | (10,576,801 | ) | | | (1,033,493 | ) | | $ | (9,724,758 | ) | | | | | | | | | | | | | | | | |
| | |
|
|
| |
|
|
| |
|
|
| |
|
|
| | | | | | | | | | | | | | | | |
| | | | | | | | | | | | | | | | | | | | | | | | | | | | | | | | |
| | | U.S. Government Securities
| | | | | | | | | | | | | |
| | | Class C
| | | | | | | | | | | | | |
| | | For the
year ended
March 31, 2021
| | | For the
year ended
March 31, 2020
| | | | | | | | | | | | | |
| | | Shares
| | | Amount
| | | Shares
| | | Amount
| | | | | | | | | | | | | |
Shares sold | | | 483,806 | | | $ | 4,727,925 | | | | 917,819 | | | $ | 8,709,707 | | | | | | | | | | | | | | | | | |
Reinvested dividends | | | 9,602 | | | | 92,642 | | | | 7,718 | | | | 71,973 | | | | | | | | | | | | | | | | | |
Shares redeemed | | | (780,254 | ) | | | (7,544,684 | ) | | | (553,203 | ) | | | (5,146,810 | ) | | | | | | | | | | | | | | | | |
| | |
|
|
| |
|
|
| |
|
|
| |
|
|
| | | | | | | | | | | | | | | | |
Net increase (decrease) in shares outstanding before automatic conversion | | | (286,846 | ) | | | (2,724,117 | ) | | | 372,334 | | | | 3,634,870 | | | | | | | | | | | | | | | | | |
| | |
|
|
| |
|
|
| |
|
|
| |
|
|
| | | | | | | | | | | | | | | | |
Shares issued/(reacquired) upon automatic conversion | | | (94,806 | ) | | | (914,469 | ) | | | (15,104 | ) | | | (139,280 | ) | | | | | | | | | | | | | | | | |
| | |
|
|
| |
|
|
| |
|
|
| |
|
|
| | | | | | | | | | | | | | | | |
Net increase (decrease) | | | (381,652 | ) | | $ | (3,638,586 | ) | | | 357,230 | | | $ | 3,495,590 | | | | | | | | | | | | | | | | | |
| | |
|
|
| |
|
|
| |
|
|
| |
|
|
| | | | | | | | | | | | | | | | |
| | | | | | | | | | | | | | | | | | | | | | | | | | | | | | | | |
| | | Strategic Bond
| |
| | | Class A
| | | Class B
| |
| | | For the
year ended
March 31, 2021
| | | For the
year ended
March 31, 2020
| | | For the
year ended
March 31, 2021
| | | For the
year ended
March 31, 2020
| |
| | | Shares
| | | Amount
| | | Shares
| | | Amount
| | | Shares
| | | Amount
| | | Shares
| | | Amount
| |
Shares sold | | | 11,723,775 | | | $ | 40,489,625 | | | | 10,309,167 | | | $ | 34,743,163 | | | | 2,206,559 | | | $ | 7,531,595 | | | | 3,336,380 | | | $ | 11,118,974 | |
Reinvested dividends | | | 1,375,200 | | | | 4,733,156 | | | | 1,493,539 | | | | 5,029,334 | | | | 99,176 | | | | 340,859 | | | | 113,560 | | | | 381,983 | |
Shares redeemed | | | (10,140,821 | ) | | | (35,002,379 | ) | | | (13,182,469 | ) | | | (43,973,643 | ) | | | (2,218,556 | ) | | | (7,622,904 | ) | | | (3,778,634 | ) | | | (12,555,019 | ) |
| | |
|
|
| |
|
|
| |
|
|
| |
|
|
| |
|
|
| |
|
|
| |
|
|
| |
|
|
|
Net increase (decrease) in shares outstanding before automatic conversion | | | 2,958,154 | | | | 10,220,402 | | | | (1,379,763 | ) | | | (4,201,146 | ) | | | 87,179 | | | | 249,550 | | | | (328,694 | ) | | | (1,054,062 | ) |
| | |
|
|
| |
|
|
| |
|
|
| |
|
|
| |
|
|
| |
|
|
| |
|
|
| |
|
|
|
Shares issued/(reacquired) upon automatic conversion | | | 1,474,886 | | | | 5,083,563 | | | | 493,231 | | | | 1,649,276 | | | | ( 287,296 | ) | | | (976,210 | ) | | | (250,694 | ) | | | (832,069 | ) |
| | |
|
|
| |
|
|
| |
|
|
| |
|
|
| |
|
|
| |
|
|
| |
|
|
| |
|
|
|
Net increase (decrease) | | | 4,433,040 | | | $ | 15,303,965 | | | | (886,532 | ) | | $ | (2,551,870 | ) | | | ( 200,117 | ) | | $ | (726,660 | ) | | | (579,388 | ) | | $ | (1,886,131 | ) |
| | |
|
|
| |
|
|
| |
|
|
| |
|
|
| |
|
|
| |
|
|
| |
|
|
| |
|
|
|
SunAmerica Income Funds
NOTES TO FINANCIAL STATEMENTS — March 31, 2021 — (continued)
| | | | | | | | | | | | | | | | | | | | | | | | | | | | | | | | |
| | | Strategic Bond
| |
| | | Class C
| | | Class W
| |
| | | For the
year ended
March 31, 2021
| | | For the
year ended
March 31, 2020
| | | For the
year ended
March 31, 2021
| | | For the
year ended
March 31, 2020
| |
| | | Shares
| | | Amount
| | | Shares
| | | Amount
| | | Shares
| | | Amount
| | | Shares
| | | Amount
| |
Shares sold | | | 3,688,032 | | | $ | 12,667,482 | | | | 5,669,612 | | | $ | 19,212,709 | | | | 34,392,953 | | | $ | 118,154,325 | | | | 32,817,775 | | | $ | 109,353,277 | |
Reinvested dividends | | | 278,824 | | | | 960,806 | | | | 341,323 | | | | 1,153,321 | | | | 939,055 | | | | 3,234,705 | | | | 601,837 | | | | 2,022,543 | |
Shares redeemed | | | (7,168,100 | ) | | | (24,718,370 | ) | | | (5,938,367 | ) | | | (20,000,269 | ) | | | (23,435,348 | ) | | | (79,759,984 | ) | | | (20,806,887 | ) | | | (69,465,170 | ) |
| | |
|
|
| |
|
|
| |
|
|
| |
|
|
| |
|
|
| |
|
|
| |
|
|
| |
|
|
|
Net increase (decrease) in shares outstanding before automatic conversion | | | (3,201,244 | ) | | | (11,090,082 | ) | | | 72,568 | | | | 365,761 | | | | 11,896,660 | | | | 41,629,046 | | | | 12,612,725 | | | | 41,910,650 | |
| | |
|
|
| |
|
|
| |
|
|
| |
|
|
| |
|
|
| |
|
|
| |
|
|
| |
|
|
|
Shares issued/(reacquired) upon automatic conversion | | | (1,184,165 | ) | | | (4,107,353 | ) | | | (242,044 | ) | | | (817,207 | ) | | | — | | | | — | | | | — | | | | — | |
| | |
|
|
| |
|
|
| |
|
|
| |
|
|
| |
|
|
| |
|
|
| |
|
|
| |
|
|
|
Net increase (decrease) | | | (4,385,409 | ) | | $ | (15,197,435 | ) | | | (169,476 | ) | | $ | (451,446 | ) | | | 11,896,660 | | | $ | 41,629,046 | | | | 12,612,725 | | | $ | 41,910,650 | |
| | |
|
|
| |
|
|
| |
|
|
| |
|
|
| |
|
|
| |
|
|
| |
|
|
| |
|
|
|
| | | | | | | | | | | | | | | | | | | | | | | | | | | | | | | | |
| | | Flexible Credit
| | | | | | | | | | | | | |
| | | Class A
| | | | | | | | | | | | | |
| | | For the
year ended
March 31, 2021
| | | For the
year ended
March 31, 2020
| | | | | | | | | | | | | |
| | | Shares
| | | Amount
| | | Shares
| | | Amount
| | | | | | | | | | | | | |
Shares sold | | | 4,208,735 | | | $ | 13,456,439 | | | | 7,500,006 | | | $ | 24,765,601 | | | | | | | | | | | | | | | | | |
Reinvested dividends | | | 1,060,848 | | | | 3,401,156 | | | | 1,437,578 | | | | 4,721,251 | | | | | | | | | | | | | | | | | |
Shares redeemed | | | (6,444,142 | ) | | | (20,843,973 | ) | | | (18,575,282 | ) | | | (61,064,646 | ) | | | | | | | | | | | | | | | | |
| | |
|
|
| |
|
|
| |
|
|
| |
|
|
| | | | | | | | | | | | | | | | |
Net increase (decrease) in shares outstanding before automatic conversion | | | (1,174,559 | ) | | | (3,986,378 | ) | | | (9,637,698 | ) | | | (31,577,794 | ) | | | | | | | | | | | | | | | | |
| | |
|
|
| |
|
|
| |
|
|
| |
|
|
| | | | | | | | | | | | | | | | |
Shares issued/(reacquired) upon automatic conversion | | | 847,739 | | | | 2,724,533 | | | | 248,642 | | | | 804,010 | | | | | | | | | | | | | | | | | |
| | |
|
|
| |
|
|
| |
|
|
| |
|
|
| | | | | | | | | | | | | | | | |
Net increase (decrease) | | | ( 326,820 | ) | | $ | (1,261,845 | ) | | | (9,389,056 | ) | | $ | (30,773,784 | ) | | | | | | | | | | | | | | | | |
| | |
|
|
| |
|
|
| |
|
|
| |
|
|
| | | | | | | | | | | | | | | | |
| | | | | | | | | | | | | | | | | | | | | | | | | | | | | | | | |
| | | Flexible Credit
| |
| | | Class C
| | | Class W
| |
| | | For the
year ended
March 31, 2021
| | | For the
year ended
March 31, 2020
| | | For the
year ended
March 31, 2021
| | | For the
year ended
March 31, 2020
| |
| | | Shares
| | | Amount
| | | Shares
| | | Amount
| | | Shares
| | | Amount
| | | Shares
| | | Amount
| |
Shares sold | | | 818,814 | | | $ | 2,616,747 | | | | 4,361,074 | | | $ | 14,483,436 | | | | 13,061,860 | | | $ | 40,519,660 | | | | 43,533,148 | | | $ | 144,105,349 | |
Reinvested dividends | | | 378,791 | | | | 1,214,495 | | | | 539,719 | | | | 1,779,382 | | | | 1,032,857 | | | | 3,297,842 | | | | 1,595,488 | | | | 5,232,529 | |
Shares redeemed | | | (5,958,379 | ) | | | (19,153,011 | ) | | | (4,946,574 | ) | | | (16,081,944 | ) | | | (30,521,354 | ) | | | (96,476,879 | ) | | | (39,178,335 | ) | | | (124,104,435 | ) |
| | |
|
|
| |
|
|
| |
|
|
| |
|
|
| |
|
|
| |
|
|
| |
|
|
| |
|
|
|
Net increase (decrease) in shares outstanding before automatic conversion | | | (4,760,774 | ) | | | (15,321,769 | ) | | | (45,781 | ) | | | 180,874 | | | | (16,426,637 | ) | | | (52,659,377 | ) | | | 5,950,301 | | | | 25,233,443 | |
| | |
|
|
| |
|
|
| |
|
|
| |
|
|
| |
|
|
| |
|
|
| |
|
|
| |
|
|
|
Shares issued/(reacquired) upon automatic conversion | | | ( 842,491 | ) | | | (2,724,533 | ) | | | (247,238 | ) | | | (804,010 | ) | | | — | | | | — | | | | — | | | | — | |
| | |
|
|
| |
|
|
| |
|
|
| |
|
|
| |
|
|
| |
|
|
| |
|
|
| |
|
|
|
Net increase (decrease) | | | (5,603,265 | ) | | $ | (18,046,302 | ) | | | (293,019 | ) | | $ | (623,136 | ) | | | (16,426,637 | ) | | $ | (52,659,377 | ) | | | 5,950,301 | | | $ | 25,233,443 | |
| | |
|
|
| |
|
|
| |
|
|
| |
|
|
| |
|
|
| |
|
|
| |
|
|
| |
|
|
|
Note 7. Line of Credit
The Trust, along with certain other funds managed by the Adviser, has access to a $75 million committed unsecured line of credit and a $50 million uncommitted unsecured line of credit. The committed and uncommitted lines of credit are renewable on an annual basis with State Street Bank and Trust Company (“State Street”), the Trust’s custodian. Prior to September 4, 2020,
SunAmerica Income Funds
NOTES TO FINANCIAL STATEMENTS — March 31, 2021 — (continued)
interest is payable on the committed line of credit at the higher of the Federal Funds Rate (but not less than zero) plus 125 basis points or the One-Month London Interbank Offered Rate (but not less than zero) plus 125 basis points and State Street’s discretionary bid rate on the uncommitted line of credit. The Trust, on behalf of each of the Funds, has paid State Street for its own account, such Fund’s ratable portion of an upfront fee in an amount equal to $25,000 in the aggregate for the uncommitted line of credit made available by State Street to certain other funds managed by the Adviser, which are also party to the uncommitted line of credit. There is also a commitment fee of 25 basis points per annum on the daily unused portion of the committed line of credit. Effective September 4, 2020, interest on each of the committed and uncommitted lines of credit is payable at a variable rate per annum equal to the Applicable Rate plus one and one quarter of one percent (1.25%). The Applicable Rate per annum shall be equal to the higher of (a) the Federal Funds Effective Rate on such date and (b) the Overnight Bank Funding Rate on such date, plus, in each case, 10 basis points. Notwithstanding anything to the contrary, if the Federal Funds Effective Rate or the Overnight Bank Funding Rate shall be less than zero, then the Federal Funds Effective Rate or the Overnight Bank Funding Rate, shall be deemed to be zero for the purposes of determining the rate. The Trust, on behalf of each of the Funds, has paid State Street for its own account, such Fund’s ratable portion of an upfront fee in an amount equal to $40,000 in the aggregate for the uncommitted line of credit made available by State Street to certain other funds managed by the Adviser, which are also party to the uncommitted line of credit. There is also a commitment fee of 30 basis points per annum on the daily unused portion of the committed line of credit.
Borrowings under the line of credit will commence when the respective Fund’s cash shortfall exceeds $100,000. For the year ended March 31, 2021, the following Funds had borrowings:
| | | | | | | | | | | | | | | | |
Portfolio
| | Days
Outstanding
| | | Interest
Charges
| | | Average
Debt
Utilized
| | | Weighted
Average
Interest
| |
U.S. Government Securities………………………………………… | | | 5 | | | $ | 330 | | | $ | 1,680,000 | | | | 1.44 | % |
Strategic Bond ……………………………………………………. | | | 4 | | | | 91 | | | | 575,000 | | | | 1.42 | |
Flexible Credit…………………………………………………. | | | 59 | | | | 13,994 | | | | 5,890,254 | | | | 1.44 | |
At March 31, 2021, there were no borrowings outstanding.
Note 8. Interfund Lending Agreement
Pursuant to the exemptive relief granted by the Securities and Exchange Commission, the Funds are permitted to participate in an interfund lending program among investment companies advised by SunAmerica or an affiliate. The interfund lending program allows the participating Funds to borrow money from and lend money to each other for temporary or emergency purposes. An interfund loan will be made under this facility only if the participating Funds receive a more favorable interest rate than would otherwise be available from a typical bank for a comparable transaction. For the year ended March 31, 2021, none of the Funds participated in this program.
Note 9. Investment Concentration
The Flexible Credit Fund’s investment in high yield securities, whether rated or unrated, may be considered speculative and subject to greater market fluctuations and risk of loss of income and principal than lower-yielding, higher-rated, fixed-income securities. The risk of loss due to default by the issuer may be significantly greater for the holders of high yield securities, because such securities are generally unsecured and are often subordinated to other creditors of the issuer.
The Flexible Credit Fund and Strategic Bond Fund invest in participations and assignments, or act as a party to the primary lending syndicate of a variable rate senior loan interest to United States corporations, partnerships, and other entities. If the lead lender in a typical lending syndicate becomes insolvent, enters receivership or, if not FDIC insured, enters into bankruptcy, a Fund may incur certain costs and delays in receiving payment, or may suffer a loss of principal and/or interest. When a Fund purchases a participation of a senior loan interest, the Fund typically enters into a contractual agreement with the lender or other third party selling the participation but not with the borrower directly. As such, a Fund is subject to the credit risk of the borrower, selling participant, lender or other persons positioned between the Funds and the borrower.
SunAmerica Income Funds
NOTES TO FINANCIAL STATEMENTS — March 31, 2021 — (continued)
Each Fund may invest in obligations issued by agencies and instrumentalities of the U.S. Government that may vary in the level of support they receive from the government. The government may choose not to provide financial support to government sponsored agencies or instrumentalities if it is not legally obligated to do so, and if the issuer defaulted, a fund holding securities of such issuer might not be able to recover its investment from the U.S. Government. As a result of the U.S. Government Fund’s concentration in such investments, it may be subject to risks associated with U.S. Government agencies or instrumentalities.
Note 10. Other Matters
The coronavirus pandemic and the related governmental and public responses have had and may continue to have an impact on the Fund’s investments and net asset value and have led and may continue to lead to increased market volatility and the potential for illiquidity in certain classes of securities and sectors of the market. Preventative or protective actions that governments may take in respect of pandemic or epidemic diseases may result in periods of business disruption, business closures, inability to obtain raw materials, supplies and component parts, and reduced or disrupted operations for the issuers in which the Fund invests. Government intervention in markets may impact interest rates, market volatility and security pricing. The occurrence, reoccurrence and pendency of such diseases could adversely affect the economies (including through changes in business activity and increased unemployment) and financial markets either in specific countries or worldwide.
SunAmerica and Touchstone Advisors, Inc. (“Touchstone”) announced that they have entered into a definitive agreement for Touchstone to acquire certain assets related to SunAmerica’s retail mutual fund management business (the “AIG Funds”). Under the terms of the agreement, subject to shareholder approval, twelve of the AIG Funds, including the three SunAmerica Income Series Funds, are expected to be reorganized into either existing or newly created series of trusts in the Touchstone fund complex (the “Reorganizations”), and subsequently will be advised by Touchstone under its sub-advised mutual fund approach. On February 8, 2021, the Boards of Directors/Trustees of the AIG Funds unanimously approved each of the proposed Reorganizations.
SunAmerica Income Funds
REPORT OF INDEPENDENT REGISTERED PUBLIC ACCOUNTING FIRM
To the Board of Trustees of SunAmerica Income Funds and Shareholders of AIG Flexible Credit Fund, AIG Strategic Bond Fund, AIG U.S. Government Securities Fund
Opinions on the Financial Statements
We have audited the accompanying statements of assets and liabilities, including the portfolios of investments, of AIG Flexible Credit Fund, AIG Strategic Bond Fund, and AIG U.S. Government Securities Fund (each a “Fund” constituting SunAmerica Income Funds, hereafter collectively referred to as the “Funds”) as of March 31, 2021, the related statements of operations for the year then ended, the statement of changes in net assets for each of the two years in the period ended March 31, 2021, including the related notes, and the financial highlights for each of the five years in the period ended March 31, 2021 (collectively referred to as the “financial statements”). In our opinion, the financial statements present fairly, in all material respects, the financial position of each of the Funds as of the date listed in the table below, the results of each of their operations, the changes in each of their net assets and each of the financial highlights for each of the periods listed in the table below in conformity with accounting principles generally accepted in the United States of America.
Basis for Opinions
These financial statements are the responsibility of the Funds’ management. Our responsibility is to express an opinion on the Funds’ financial statements based on our audits. We are a public accounting firm registered with the Public Company Accounting Oversight Board (United States) (“PCAOB”) and are required to be independent with respect to the Funds in accordance with the U.S. federal securities laws and the applicable rules and regulations of the Securities and Exchange Commission and the PCAOB.
We conducted our audits of these financial statements in accordance with the standards of the PCAOB. Those standards require that we plan and perform the audit to obtain reasonable assurance about whether the financial statements are free of material misstatement, whether due to error or fraud.
Our audits included performing procedures to assess the risks of material misstatement of the financial statements, whether due to error or fraud, and performing procedures that respond to those risks. Such procedures included examining, on a test basis, evidence regarding the amounts and disclosures in the financial statements. Our audits also included evaluating the accounting principles used and significant estimates made by management, as well as evaluating the overall presentation of the financial statements. Our procedures included confirmation of securities owned as of March 31, 2021 by correspondence with the custodian, transfer agents, brokers and selling or agent banks; when replies were not received, we performed other auditing procedures. We believe that our audits provide a reasonable basis for our opinions.
/s/ PricewaterhouseCoopers LLP
Houston, Texas
May 27, 2021
We have served as the auditor of one or more investment companies in the AIG Funds family of funds since 1984.
SunAmerica Income Funds
TRUSTEE AND OFFICER INFORMATION — March 31, 2021 — (unaudited)
The following table contains basic information regarding the Trustees and Officers that oversee operations of the Funds and other investment companies within the Fund complex. Unless otherwise noted, the address of each Director and executive officer is Harborside 5, 185 Hudson Street, Suite 3300, Jersey City, NJ 07311.
| | | | | | | | | | |
Name and Age
| | Position(s)
Held With
Trust
| | Length of
Time Served(1)
| | Principal Occupation(s)
During Past 5 Years
| | Number of
Funds in
Fund Complex
Overseen by
Trustee(2)
| | Other Directorship(s)
Held by Trustee
During Past Five Years(3)
|
| Disinterested Trustees |
| | | | | |
Dr. Judith L. Craven Age: 75 | | Trustee | | 2001-present | | Retired. | | 72 | | Director A.G. Belo Corp. (media company) (1992 to 2014); Director, Sysco Corp. (food marketing and distribution company) (1996 to 2017); Director, Luby’s, Inc. (1998 to 2019). |
| | | | | |
Richard W. Grant Age: 75 | | Trustee Chairman of the Board | | 2011-present | | Retired. | | 23 | | None |
| | | | | |
Stephen J. Gutman Age: 77 | | Trustee | | 1986-present | | Senior Vice President and Associate Broker, The Corcoran Group (real estate) (2002 to present); President, SJG Marketing, Inc. (2009 to present). | | 23 | | None |
| | | | | |
Eileen A. Kamerick Age: 62 | | Trustee | | 2018-present | | National Association of Corporate Directors Board Leadership Fellow and financial expert; Adjunct Professor of Law, University of Chicago, Washington University in St. Louis and University of Iowa law schools (2007 to Present); formerly, Senior Advisor to the Chief Executive Officer and Executive Vice President and Chief Financial Officer of ConnectWise, Inc. (software and services company) (2015 to 2016); Chief Financial Officer, Press Ganey Associates (health care informatics company) (2012 to 2014). | | 23 | | Hochschild Mining plc (precious metals company) (2016 to Present); Associated Banc-Corp (financial services company) (2007 to Present); Legg Mason Closed End Funds (registered investment companies) (2013 to Present); Westell Technologies, Inc. (technology company) (2003 to 2016). |
SunAmerica Income Funds
TRUSTEE AND OFFICER INFORMATION — March 31, 2021 — (unaudited) (continued)
| | | | | | | | | | |
Name and Age
| | Position(s)
Held With
Trust
| | Length of
Time Served(1)
| | Principal Occupation(s)
During Past 5 Years
| | Number of
Funds in
Fund Complex
Overseen by
Trustee(2)
| | Other Directorship(s)
Held by Trustee
During Past Five Years(3)
|
| Interested Trustee |
| | | | | |
Peter A. Harbeck(4) Age: 67 | | Trustee | | 1995-present | | Retired June 2019; formerly President, CEO (1997 to 2019), and Director (1992 to 2019), SunAmerica; Director, AIG Capital Services, Inc. (“ACS”) (1993 to 2019); Chairman, President and CEO, Advisor Group, Inc. (2004 to 2016). | | 72 | | None |
| (1) | Trustees serve until their successors are duly elected and qualified. |
| (2) | The term “Fund Complex” means two or more registered investment companies that hold themselves out to investors as related companies for purposes of investment services or have a common investment adviser or any investment adviser that is an affiliate of the Adviser. The “Fund Complex” includes the Trust (3 funds), SunAmerica Money Market Funds Inc. (“SAMMF”) (1 fund), SunAmerica Equity Funds (“SAEF”) (2 funds), SunAmerica Senior Floating Rate Fund, Inc. (“SASFRF”) (1 fund), SunAmerica Series, Inc. (“SA Series”) (6 funds), Anchor Series Trust (“AST”) (4 portfolios), SunAmerica Specialty Series (6 funds), SunAmerica Series Trust (“SAST”) (61 portfolios), VALIC Company I (“VALIC I”) (45 funds), VALIC Company II (“VALIC II”) (15 funds), Seasons Series Trust (“SST”) (19 portfolios). |
| (3) | Directorships of companies required to report to the SEC under the Securities Exchange Act of 1934 (i.e., “public companies”) or other investment companies registered under the 1940 Act. |
| (4) | Mr. Harbeck is considered to be an Interested Trustee because he owns shares of American International Group, Inc., the ultimate parent of the Adviser. |
Additional information concerning the Trustees is contained in the Statement of Additional Information which is available, without charge, by calling (800) 858-8850.
SunAmerica Income Funds
TRUSTEE AND OFFICER INFORMATION — March 31, 2021 — (unaudited) (continued)
| | | | | | |
Name and Age
| | Position(s)
Held with
Trust
| | Length of
Time Served
| | Principal Occupation(s)
During Past 5 Years
|
| Officers | | | | | | |
| | | |
John T. Genoy Age: 52 | | President | | 2007-present | | Chief Financial Officer, SunAmerica (2002 to present); Senior Vice President, SunAmerica (2004 to present); Chief Operating Officer, SunAmerica (2006 to present). |
| | | |
Sharon French Age: 56 | | Executive Vice President | | 2019- present | | President and CEO of SunAmerica (since 2019); Vice President of AIG (since 2019); Executive Vice President and Head of Beta Solutions, OppenheimerFunds (2016-2019); President, F-Squared Capital, LLC (financial services) (2013-2015). |
| | | |
Gregory R. Kingston Age: 55 2919 Allen Parkway Houston, Texas 77019 | | Treasurer | | 2014-present | | Vice President, SunAmerica (2001 to present); Head of Mutual Fund Administration, SunAmerica (2014 to present). |
| | | |
James Nichols Age: 54 | | Vice President | | 2006-present | | Director, President and CEO, ACS (2006 to present); Senior Vice President, SunAmerica (2002 to present). |
| | | |
Gregory N. Bressler Age: 54 | | Secretary | | 2005-present | | Senior Vice President and General Counsel, SunAmerica (2005 to present). |
| | | |
Kathleen D. Fuentes Age: 52 | | Chief Legal Officer and Assistant Secretary | | 2013-present | | Vice President and Deputy General Counsel, SunAmerica (2006 to present). |
| | | |
Timothy P. Pettee Age: 62 | | Vice President | | 2018 to Present | | Chief Investment Officer, SunAmerica (2018 to Present); Lead Portfolio Manager-Rules Based Funds (2013 to Present); Chief Investment Officer (2003 to 2013) |
| | | |
Shawn Parry Age: 48 2919 Allen Parkway Houston, Texas 77019 | | Vice President and Assistant Treasurer | | 2014-present | | Assistant Vice President, SunAmerica (2005 to 2014); Vice President, SunAmerica (2014 to present). |
| | | |
Donna M. McManus Age: 60 | | Vice President and Assistant Treasurer | | 2014-present | | Managing Director, BNY Mellon (2009-2014); Vice President, SunAmerica, (2014 to present). |
| | | |
Christopher C. Joe Age: 51 2919 Allen Parkway Houston, Texas 77019 | | Chief Compliance Officer | | 2017 to Present | | Chief Compliance Officer, AIG Funds, Anchor Series Trust, Seasons Series Trust, SunAmerica Series Trust, VALIC Company I and VALIC Company II (2017-Present); Chief Compliance Officer, VALIC Retirement Services Company (2017-Present); Chief Compliance Officer, The Variable Annuity Life Insurance Company (2017 to Present); Chief Compliance Officer, Invesco PowerShares (2012-2017); Chief Compliance Officer, Invesco Investment Advisers, LLC (2010-2013); U.S. Compliance Director, Invesco Ltd. (2006-2014); Deputy Chief Compliance Officer, Invesco Advisers, LLC (2014-2015). |
| | | |
Matthew J. Hackethal Age: 49 | | Anti-Money Laundering (“AML”) Compliance Officer | | 2006-present | | Acting Chief Compliance Officer, AIG Funds, Anchor Series Trust, Seasons Series Trust, SunAmerica Series Trust, VALIC Company I and VALIC Company II (2016 to 2017); Chief Compliance Officer, SunAmerica (2006 to Present); Chief Compliance Officer, The Variable Annuity Life Insurance Company (2016 to 2017); AML Compliance Officer, AIG Funds, Anchor Series Trust, Seasons Series Trust, SunAmerica Series Trust, VALIC Company I and VALIC Company II (2006 to Present); and Vice President, SunAmerica (2011 to Present). |
SunAmerica Income Funds
SHAREHOLDER TAX INFORMATION — March 31, 2021 — (unaudited)
Certain tax information regarding the Fund is required to be provided to shareholders based upon each Fund’s income and distributions for the taxable year ended March 31, 2021. The information and distributions reported herein may differ from the information and distributions taxable to the shareholders for the calendar year ending December 31, 2021. The information necessary to complete your income tax returns will be included with your Form 1099-DIV which will be sent to shareholders in early 2022.
For the year ended March 31, 2021, the Funds paid the following long-term capital gains dividends along with percentage of ordinary income dividends that qualified for the dividends received deduction for corporations:
| | | | | | | | |
| | | Net
Long-Term
Capital Gains
| | | Qualifying % for the
Dividends
Received Deduction
| |
U.S. Government Securities Fund Class A | | $ | — | | | | — | % |
U.S. Government Securities Fund Class C | | | — | | | | — | |
Strategic Bond Fund Class A | | | — | | | | — | |
Strategic Bond Fund Class B | | | — | | | | 0.09 | |
Strategic Bond Fund Class C | | | — | | | | 0.09 | |
Strategic Bond Fund Class W | | | — | | | | 0.09 | |
Flexible Credit Fund Class A | | | — | | | | 0.16 | |
Flexible Credit Fund Class C | | | — | | | | 0.16 | |
Flexible Credit Fund Class W | | | — | | | | 0.16 | |
For the year ended March 31, 2021, certain dividends paid by the Strategic Bond Fund and Flexible Credit Fund may be subject to a maximum tax rate of 15%, as provided by the Jobs and Growth Tax Relief Reconciliation Act of 2003. Of the distributions paid during the fiscal year, the following represents the maximum amount that may be considered qualified dividend income:
| | | | |
| | | Amount
| |
Strategic Bond Fund | | $ | — | |
Flexible Credit Fund | | | 27 | |
SunAmerica Income Funds
COMPARISONS: PORTFOLIOS vs. INDICES — (unaudited)
As required by the Securities and Exchange Commission, the graphs on the following pages compare the performance of a $10,000 investment in the SunAmerica Income Funds’ portfolios to a similar investment in an index. Please note that “inception,” as used herein, reflects the date on which a specific class of shares commenced operations. It is important to note that the SunAmerica Income Funds are professionally managed mutual funds, while the indices are not available for investment and are unmanaged. The comparison is shown for illustrative purposes only. The graphs present the performance of Class A shares of each Fund. The performance of the other classes will vary based upon the difference in sales charges and fees assessed to shareholders of that class.
SunAmerica Income Funds
COMPARISONS: PORTFOLIOS vs. INDICES — (unaudited) (continued)
AIG U.S. Government Securities Fund
The AIG U.S. Government Securities Fund Class A shares returned -4.66% (before maximum sales charge) for the 12-month period ended March 31, 2021. Though posting negative absolute returns, the Fund outperformed its benchmark, the ICE BofAML U.S. Treasury Index*, which returned -5.11% during the same period.
During the early months of the annual period, U.S. Treasury yields were near multi-year lows, flattening‡ the yield curve, due to COVID-19-induced economic pressures. However, as the annual period progressed, the U.S. Treasury yield curve steepened significantly. Short-term yields remained rather range-bound near historical lows, anchored by strong demand for U.S. Treasuries as a “safe haven” and by the U.S. Federal Reserve (the “Fed”) not only keeping the targeted federal funds rate near zero but also indicating it would maintain these low rates for the foreseeable future. Intermediate- and long-term yields rose as economic conditions improved on additional U.S. fiscal stimulus and COVID-19 vaccine rollouts. Interpretation of the Fed’s policy shift as being more tolerant of higher inflation also caused a sell-off in intermediate- and longer-dated securities. (Remember, there is an inverse relationship between bond prices and yield movements, so that bond prices rise when yields decrease and vice versa.)
For the annual period overall, the yield on the three-month U.S. Treasury fell approximately eight basis points† to end the annual period at 0.03%, and the yield on the two-year U.S. Treasury declined approximately seven basis points to end the annual period at 0.16%. The yield on the bellwether 10-year U.S. Treasury rose approximately 104 basis points to end the annual period at 1.74%, while yields on the 30-year U.S. Treasury increased approximately 106 basis points to end the annual period at 2.41%. Meanwhile, mortgage-backed securities generated a rather flat return for the annual period but outperformed U.S. Treasuries.
Amid this backdrop, the Fund’s underweight to U.S. Treasuries compared to the ICE BofAML U.S. Treasury Index (the “benchmark index”) and its out-of-benchmark exposure to mortgage-backed securities contributed positively to its relative results. Issue selection within the Fund’s U.S. Treasury allocation added value as well. More specifically, the Fund’s holdings in each maturity segment, except two, boosted relative results due mainly to being underweight those segments versus the benchmark index. The Fund’s underweight positioning in the 0-1 year segment and in the seven-year to 10-year maturity segments detracted from its relative performance.
The Fund’s shorter duration in U.S. Treasuries compared to the benchmark index helped, given that interest rates generally rose during the annual period. The Fund’s yield curve positioning had a rather neutral effect on relative results during the annual period, as we maintained a slightly underweight but close-to-benchmark positioning across the maturity spectrum.
During the annual period, we made no significant changes to the Fund’s allocation in terms of either holdings and maturity weights, and market conditions did not prompt any notable buys or sells. At the end of the annual period, the Fund had approximately 79.9% of its total net assets invested in U.S. Treasuries, 19.9% in mortgage-backed securities and the remainder in cash and cash equivalents. As of March 31, 2021, the Fund had a slightly shorter duration than that of the benchmark index.
Past performance is no guarantee of future results.
U.S. Government guarantee applies only to the underlying securities of the Fund’s portfolio and not to the Fund shares. Interest rates and bond prices typically move inversely to each other; therefore, as with any bond fund, the value of your investment in this Fund may go up or down in response to changes in interest rates.
| * | The ICE BofAML U.S. Treasury Index tracks the performance of U.S. dollar denominated sovereign debt publicly issued by the U.S. government in its domestic market. Indices are not managed and an investor cannot invest directly into an index. |
| † | A basis point is 1/100th of a percentage point. |
| ‡ | A flattening yield curve is one wherein the differential in yields between shorter-term and longer-term maturities narrows; opposite of a steepening yield curve. |
Securities listed may or may not be a part of current Fund construction.
SunAmerica Income Funds
COMPARISONS: PORTFOLIOS vs. INDICES — (unaudited) (continued)
Over the past ten years, $10,000 invested in AIG U.S. Government Securities Fund Class A shares would have increased to $11,207. The same amount invested in securities mirroring the performance of the ICE BofA US Treasury Index would be valued at $13,385.
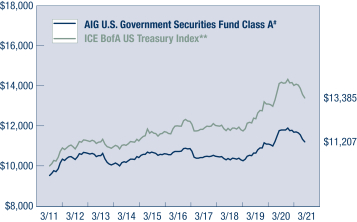
AIG U.S. Government Securities Fund
| | | | | | | | | | | | | | | | |
| | Class A@
| | | Class C
| |
| | Average
Annual
Return
| | | Cumulative
Return†
| | | Average
Annual
Return
| | | Cumulative
Return†
| |
1 Year Return | | | -9.20% | | | | -4.66% | | | | -6.33% | | | | -5.39% | |
5 Year Return | | | -0.10% | | | | 4.51% | | | | 0.19% | | | | 0.96% | |
10 Year Return | | | 1.15% | | | | 17.61% | | | | 0.97% | | | | 10.11% | |
Since Inception* | | | 3.68% | | | | 183.20% | | | | 2.80% | | | | 82.57% | |
| † | Cumulative returns do not include sales load. If sales load had been included, the return would be lower. |
| * | Inception Date - Class A: 10/1/93; Class C: 06/1/99. |
| # | | For the purposes of the graph, it has been assumed that the maximum sales charge of 4.75% of offering price was deducted from the initial $10,000 investment in the Fund. For purposes of the table, it has been assumed that the maximum sales charge with respect to the Class A shares, was deducted from the initial investment in the Fund and that the CDSCs with respect to the Class C shares has been deducted, as applicable. Effective September 30, 2020, the maximum sales charge with respect to Class A Shares was lowered to 3.75%. |
| @ | | As of the close of business on December 2, 2014, Class B shares of the Fund were no longer offered to new or existing shareholders, except that dividends and/or capital gain distributions received by a shareholder from the Fund continued to be automatically reinvested in additional Class B shares of the Fund, at the net asset value per share in effect on the payable date, unless the shareholder had elected to receive them in cash or automatically reinvest them in any retail fund distributed by AIG Capital Services, Inc. As of the close of business on January 27, 2015, all outstanding Class B shares of the Funds were converted to Class A shares. |
For the 12-month period ended March 31, 2021, the AIG U.S. Government Securities Fund Class A returned -9.20%, compared to -5.11% for the ICE BofA US Treasury Index. (The performance table and graph do not reflect the deduction of taxes that a shareholder would pay on fund distributions or the redemption of fund shares.)
Performance data quoted represents past performance and is no guarantee of future results. Maximum Sales Charge: Class A: 3.75%, Class C: 1.00% CDSC. The fund’s daily net asset values are not guaranteed and shares are not insured by the FDIC, the Federal Reserve Board or any other agency. The investment return and principal value of an investment will fluctuate so that an investor’s shares, when redeemed, may be higher or lower than the original cost. Current performance may be higher or lower than that shown. Performance as of the most recent month end is available at www.aig.com/funds.
| ** | The ICE BofA U.S. Treasury Index tracks the performance of U.S. dollar denominated sovereign debt publicly issued by the U.S. government in its domestic market. Indices are not managed and an investor cannot invest directly into an index. |
SunAmerica Income Funds
COMPARISONS: PORTFOLIOS vs. INDICES — (unaudited) (continued)
AIG Strategic Bond Fund
The AIG Strategic Bond Fund Class A shares returned 13.87% (before maximum sales charge) for the 12-month period ended March 31, 2021. The Fund outperformed its benchmark, the Bloomberg Barclays U.S. Aggregate Bond Index*, which returned 0.71% during the same annual period. The Fund also outperformed the LIBOR 3-Month Index*, a widely-recognized benchmark of interest rate performance, which returned 0.32% for the same annual period.
The Fund’s outperformance relative to its benchmark can be attributed to a combination of sector allocation, country selection and issue selection. Specifically, allocation positioning within the high yield corporate bond and emerging markets debt sectors helped relative results most, as these sectors significantly outperformed the Bloomberg Barclays U.S. Aggregate Bond Index during the annual period. Having an overweight allocation to and security selection among sovereign debt securities also contributed positively. In addition, having an underweight allocation to U.S. Treasuries, which underperformed the benchmark during the annual period, added value. From an industry perspective, an overweight allocation to communications and security selection within consumer cyclical and energy were the largest positive contributors. Security selection within the investment grade corporate bond, high yield corporate bond and emerging markets debt sectors also boosted the Fund’s relative results. While the Fund remained U.S.-centric, portions of the Fund were allocated to non-U.S. dollar denominated sovereign and emerging market bonds. Holdings in Angola and Egypt contributed most positively to relative results.
Only partially offsetting these positive contributors was the detracting effects of underweight allocations to investment grade corporate bonds and local authority bonds and having a position in cash, albeit a modest one, during an annual period when segments of the fixed income market posted double-digit percentage gains. Security selection among conventional 30-year mortgage-backed securities dampened results as well. From a country selection perspective, holdings in Mexico and Uruguay hurt the Fund’s relative results during the annual period.
Duration positioning contributed positively to the Fund’s performance during the annual period. The Fund maintained a shorter duration profile than that of the Bloomberg Barclays U.S. Aggregate Bond Index, which helped as U.S. Treasury yields across the intermediate and longer-maturity segments of the spectrum rose during the annual period. Importantly, though, the Fund’s duration stance was based more on decisions related to sector allocation than to an outright bet on the path or direction of interest rates. We maintained a preference within the Fund for leveraged finance sectors, such as high yield bonds and floating rate bank loans, as we felt their valuations were attractive. Both high yield bonds and bank loans carry a shorter duration when compared to the Bloomberg Barclays U.S. Aggregate Bond Index, so the weighted average duration of the Fund was comparably lower.
Among individual securities, positions in the sovereign debt issues of Angola and in the issues of energy company Hilcorp Energy I LP/Hilcorp Finance Co. contributed most positively to the Fund’s relative performance during the annual period. Positions in the issues of energy companies PBF Holding Co. LLC/PBF Finance Corp. and Hi-Crush, Inc. and communications company CSC Holdings LLC detracted most from the Fund’s relative results.
The Fund began the annual period with target allocations of 20% to investment grade corporate bonds, 30% to securitized products, 35% to high yield bonds and 15% to emerging markets debt. As market conditions, including macroeconomic, political, geopolitical and monetary policy factors, shifted, we adjusted target allocations accordingly throughout the annual period. For example, in May 2020, we reduced the Fund’s securitized products allocation and increased its allocation to emerging markets debt. Gains in investor confidence drove credit spreads tighter for most fixed income sectors during the first few weeks of May, though at a slower pace than in the prior month. Fueling the optimism was consistent monetary and fiscal support and anticipation of an imminent re-opening of economies as most developed market countries appeared to move past peak COVID-19 infections. In June 2020, we further reduced the Fund’s allocation to securitized products and increased its allocation to high yield bonds. Rising from notably low levels, improving economic data that suggested an imminent start of a recovery drove a sustained rebound in most fixed income sectors, even as markets remained highly dependent on the ongoing support of the U.S. Federal Reserve. In January 2021, we took profits in what we saw as some fully-valued investment grade corporate bonds and moved into shorter-term high quality government securities. Credit markets got off to a strong start in the month but ended on a more tentative note, with credit spreads trading roughly flat overall as investors weighed opposing market dynamics. The allocation shift, in our view, would enable us to take advantage of attractive new opportunities we felt were likely to crop up amid the increased volatility we were starting to see in the credit markets. In March 2021, we reduced the Fund’s investment grade corporate bond allocation and increased its allocation to emerging markets debt on
SunAmerica Income Funds
COMPARISONS: PORTFOLIOS vs. INDICES — (unaudited) (continued)
expectations that U.S. Treasury yields would continue to move higher. As of March 31, 2021, the Fund had target allocations of 15% to investment grade corporate bonds, 20% to securitized products, 40% to high yield bonds and 25% to emerging markets debt.
Past performance is no guarantee of future results.
Interest rates and bond prices typically move inversely to each other; therefore, as with any bond fund, the value of an investment in this Fund may go up or down in response to changes in interest rates. High-yield bonds tend to have lower interest rate risk than higher-quality bonds of similar maturity but carry greater credit and default risk. Investing internationally involves special risks, such as currency fluctuations and economic and political instability.
| * | The Bloomberg Barclays U.S. Aggregate Bond Index represents securities that are SEC-registered, taxable and dollar denominated. The index covers the U.S. investment-grade fixed-rate bond market, with index components for government and corporate securities, mortgage pass-through securities and asset-backed securities. The LIBOR 3-Month Index is a benchmark interest rate that some of the world’s leading banks charge each other for short-term loans. It serves as the first step to calculating interest rates on various loans throughout the world and is published each day in five currencies: the Swiss franc, the euro, the pound sterling, the Japanese yen, and the U.S. dollar. |
Securities listed may or may not be a part of current Fund construction.
SunAmerica Income Funds
COMPARISONS: PORTFOLIOS vs. INDICES — (unaudited) (continued)
Over the past ten years, $10,000 invested in AIG Strategic Bond Fund Class A shares would have increased to $14,182. The same amount invested in securities mirroring the performance of the Bloomberg Barclays U.S. Aggregate Bond Index and the LIBOR 3-Month Index would be valued at $14,025 and $10,918, respectively.
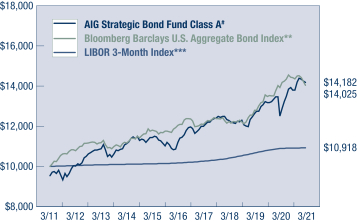
AIG Strategic Bond Fund
| | | | | | | | | | | | | | | | | | | | | | | | | | | | | | | | |
| | Class A
| | | Class B
| | | Class C
| | | Class W
| |
| | Average
Annual
Return
| | | Cumulative
Return†
| | | Average
Annual
Return
| | | Cumulative
Return†
| | | Average
Annual
Return
| | | Cumulative
Return†
| | | Average
Annual
Return
| | | Cumulative
Return†
| |
1 Year Return | | | 8.37% | | | | 13.87% | | | | 8.74% | | | | 12.74% | | | | 12.11% | | | | 13.11% | | | | 13.77% | | | | 13.77% | |
5 Year Return | | | 3.84% | | | | 26.65% | | | | 3.76% | | | | 22.25% | | | | 4.15% | | | | 22.52% | | | | 5.06% | | | | 27.99% | |
10 Year Return | | | 3.56% | | | | 48.76% | | | | 3.49% | | | | 40.94% | | | | 3.38% | | | | 39.40% | | | | N/A | | | | N/A | |
Since Inception* | | | 5.79% | | | | 391.05% | | | | 6.04% | | | | 387.36% | | | | 5.58% | | | | 332.65% | | | | 3.88% | | | | 26.49% | |
| † | Cumulative returns do not include sales load. If sales load had been included, the return would be lower. |
| * | Inception Date - Class A: 11/1/93; Class B: 04/1/94; Class C: 04/1/94; Class W: 01/29/15. |
| # | For the purposes of the graph, it has been assumed that the maximum sales charge of 4.75% of offering price was deducted from the initial $10,000 investment in the Fund. For purposes of the table, it has been assumed that the maximum sales charge with respect to the Class A shares, was deducted from the initial investment in the Fund and that the CDSCs with respect to the Class B and Class C shares have been deducted, as applicable. Effective September 30, 2020, the maximum sales charge with respect to Class A Shares was lowered to 3.75%. |
For the 12-month period ended March 31, 2021, the AIG Strategic Bond Fund Class A returned 8.37%, compared to 0.71% for the Bloomberg Barclays U.S. Aggregate Bond Index and 0.32% for the LIBOR 3-Month Index. (The performance table and graph do not reflect the deduction of taxes that a shareholder would pay on fund distributions or the redemption of fund shares.)
Performance data quoted represents past performance and is no guarantee of future results. Maximum Sales Charge: Class A: 3.75%, Class B: 4.00% Contingent Deferred Sales Charge (CDSC), Class C: 1.00% CDSC. Class B shares of the Fund convert automatically to Class A shares approximately eight years after purchase. The fund’s daily net asset values are not guaranteed and shares are not insured by the FDIC, the Federal Reserve Board or any other agency. The investment return and principal value of an investment will fluctuate so that an investor’s shares, when redeemed, may be higher or lower than the original cost. Current performance may be higher or lower than that shown. Performance as of the most recent month end is available at www.aig.com/funds.
| ** | The Bloomberg Barclays U.S. Aggregate Bond Index represents securities that are SEC-registered, taxable and dollar denominated. The index covers the U.S. investment-grade fixed-rate bond market, with index components for government and corporate securities, mortgage pass-through securities and asset-backed securities. |
| *** | The LIBOR 3-Month Index is a benchmark interest rate that some of the world’s leading banks charge each other for short-term loans. It serves as the first step to calculating interest rates on various loans throughout the world and is published each day in five currencies: the Swiss franc, the euro, the pound sterling, the Japanese yen, and the U.S. dollar. |
Indices are not managed and an investor cannot invest directly into an index.
SunAmerica Income Funds
COMPARISONS: PORTFOLIOS vs. INDICES — (unaudited) (continued)
AIG Flexible Credit Fund
The AIG Flexible Credit Fund Class A shares returned 25.13% (before maximum sales charge) for the 12-month period ended March 31, 2021. The Fund outperformed its benchmark, the Flexible Credit Blended Benchmark, comprised 50% of the Bloomberg Barclays U.S. High Yield 2% Issuer Capped Index and 50% of the S&P/LSTA Leveraged Loan Index*, which returned 22.19% during the same annual period. The Fund also outperformed the ICE BofAML USD 3-Month Dep OR CM Index*, a broad measure of market performance, which returned 0.64% for the same annual period.
The Fund actively invests in high yield bonds and floating rate loans and has the flexibility to allocate 0% to 100% of its portfolio to either sector of the leveraged finance market. During the annual period, most of the Fund’s outperformance of the Flexible Credit Blended Benchmark can be attributed to strong security selection across both high yield bonds and floating rate loans. The Fund particularly benefited from positions in issues that had been hard hit by the ripple effects of the COVID-19 pandemic early in the annual period. Prudently, we had sought to take advantage of attractive valuations in the second quarter of 2020 by aggressively buying issues that we believed were positioned to benefit from a re-opening of the economy as COVID-19 pandemic restrictions eased. Sector selection slightly detracted from performance, as the Fund’s exposure, albeit modest, to investment grade corporate bonds and cash, which are not components of the Flexible Credit Blended Benchmark, underperformed high yield bonds and floating rate loans during the annual period.
Security selection across most industries added value. Within the Fund’s floating rate loan allocation, issue selection in the transportation-automotive, consumer non-durables and forest product/containers industries contributed most positively to relative performance. Strong performance within the Fund’s high yield bond allocation was led by effective issue selection in the consumer cyclicals and transportation industries. Conversely, issue selection within the retail and food/tobacco industries detracted modestly within the floating rate loans sector. There were no significant detractors from an issue selection perspective within the high yield bond sector during the annual period.
Based on allocation positioning, having underweights to the financials and media/telecom-cable wireless video industries and an overweight to the consumer non-durables industry within the floating rate loan allocation helped most. However, these positive contributors were more than offset by the detracting effect of underweighted allocations in both the floating rate loan and high yield bond sectors to the energy industry. While we added to the Fund’s energy exposures throughout the annual period and eventually reached a neutral weighting, the purchases were made too slowly to keep up with the strong performance of the industry as oil prices rebounded.
Among individual securities, positions in the loans of commercial vehicle components manufacturer and supplier Accuride Corp. and rigid plastic and films manufacturer and distributor Klockner Pentaplast of America, Inc. and the bonds of hotel property real estate investment trust ESH Hospitality, Inc. contributed most positively to the Fund’s relative performance during the annual period. Positions in the loans of houseware products provider Libbey Glass LLC and the bonds of mining company Freeport-McMoRan, Inc. and sports marketing company Diamond Sports Group LLC detracted most from the Fund’s relative results.
The Fund began the annual period with approximately a 48% allocation to loans, approximately a 47% allocation to high yield bonds and approximately a 2% allocation to investment grade corporate bonds, with the remainder in cash and other sectors, such as structured securities, largely for liquidity purposes. We soon shifted to an approximately 57/43 allocation between high yield bonds and floating rate loans, mostly based on the interest rate environment. The significant drop in LIBOR* and our expectations for continued low interest rates favored high yield bonds, in our view, during the second quarter of 2020. The Fund maintained its overweight to high yield bonds through the third quarter of 2020 given the benign interest rate environment and what we saw as their attractive relative value. By the end of 2020, the Fund had an approximately 53/43 allocation between high yield bonds and floating rate loans, with the remainder in investment grade corporate bonds and cash. Based on relative valuations and rising interest rates, we
SunAmerica Income Funds
COMPARISONS: PORTFOLIOS vs. INDICES — (unaudited) (continued)
began migrating the Fund’s allocation more toward floating rate loans in the first quarter of 2021. As of March 31, 2021, the Fund had approximately a 48% allocation to high yield bonds, approximately a 50% allocation to floating rate loans and the remainder in investment grade corporate bonds and cash.
Past performance is no guarantee of future results.
Interest rates and bond prices typically move inversely to each other; therefore, as with any bond fund, the value of an investment in this Fund may go up or down in response to changes in interest rates. High-yield bonds tend to have lower interest-rate risk but may be subject to greater market fluctuations and risk of default or loss of income and principal than securities in higher rating categories. High-yield debt instruments carry a greater default risk, may be more volatile, less liquid, more difficult to value and more susceptible to adverse economic conditions or investor perceptions than other debt instruments. Investments in floating rate loans involve certain risks, including, among others risks of nonpayment of principal and interest; collateral impairment; non-diversification and borrower industry concentration; and lack of full liquidity.
| * | The Bloomberg Barclays U.S. High Yield 2% Issuer Capped Index is a component of the U.S. Corporate High-Yield Bond Index, which covers the universe of fixed-rate, non-investment grade corporate debt of issuers in non-emerging market countries. It is not market capitalization-weighted and each issuer is capped at 2% of the index. The S&P/LSTA Leveraged Loan Index (LLI) reflects the market-weighted performance of U.S. dollar-denominated institutional leveraged loan portfolios. The LLI is the only domestic leveraged loan index that utilizes real-time market weightings spreads and interest payments. The ICE BofAML US Dollar 3-Month Deposit Offered Rate Constant Maturity (USD 3-Mo Dep OR CM) Index tracks the performance of a synthetic asset paying LIBOR to a stated maturity. Indices are not managed and an investor cannot invest directly into an index. |
Securities listed may or may not be a part of current Fund construction.
SunAmerica Income Funds
COMPARISONS: PORTFOLIOS vs. INDICES — (unaudited) (continued)
Over the past ten years, $10,000 invested in AIG Flexible Credit Fund Class A shares would have increased to $15,240. The same amount invested in securities mirroring the performance of the Blended Benchmark (50% Bloomberg Barclays U.S. High-Yield 2% Issuer Capped Index/50% S&P/LSTA Leveraged Loan Index), the Bloomberg Barclays U.S. High-Yield 2% Issuer Capped Index, the S&P/LSTA Leveraged Loan Index and the ICE BofA USD 3-Mo Dep OR CM Index would be valued at $16,881, $18,724, $15,167, and $10,939, respectively.
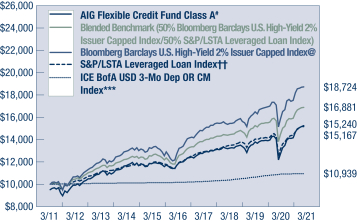
AIG Flexible Credit Fund
| | | | | | | | | | | | | | | | | | | | | | | | |
| | Class A##
| | | Class C
| | | Class W
| |
| | Average
Annual
Return
| | | Cumulative
Return†
| | | Average
Annual
Return
| | | Cumulative
Return†
| | | Average
Annual
Return
| | | Cumulative
Return†
| |
1 Year Return | | | 19.22% | | | | 25.13% | | | | 23.61% | | | | 24.61% | | | | 25.79% | | | | 25.79% | |
5 Year Return | | | 4.47% | | | | 30.50% | | | | 4.77% | | | | 26.21% | | | | 5.74% | | | | 32.22% | |
10 Year Return | | | 4.30% | | | | 60.22% | | | | 4.14% | | | | 50.07% | | | | N/A | | | | N/A | |
Since Inception* | | | 4.78% | | | | 199.16% | | | | 4.50% | | | | 147.91% | | | | 4.48% | | | | 32.93% | |
| † | | Cumulative returns do not include sales load. If sales load had been included, the return would be lower. |
| * | | Inception Date - Class A: 11/2/98; Class C: 08/21/00; Class W: 10/01/14. |
| # | | For the purposes of the graph, it has been assumed that the maximum sales charge of 4.75% of offering price was deducted from the initial $10,000 investment in the Fund. For purposes of the table, it has been assumed that the maximum sales charge with respect to the Class A shares, was deducted from the initial investment in the Fund and that the CDSCs with respect to the Class C shares has been deducted, as applicable. Effective September 30, 2020, the maximum sales charge with respect to Class A Shares was lowered to 3.75%. |
| ## | | As of the close of business on December 2, 2014, Class B shares of the Fund were no longer offered to new or existing shareholders, except that dividends and/or capital gain distributions received by a shareholder from the Fund continued to be automatically reinvested in additional Class B shares of the Fund, at the net asset value per share in effect on the payable date, unless the shareholder had elected to receive them in cash or automatically reinvest them in any retail fund distributed by AIG Capital Services, Inc. As of the close of business on January 27, 2015, all outstanding Class B shares of the Funds were converted to Class A shares. |
For the 12 month period ended March 31, 2021, the AIG Flexible Credit Fund Class A returned 19.22%, compared to 22.19% for the Blended Benchmark (50% Bloomberg Barclays U.S. High-Yield 2% Issuer Capped Index/50% S&P/LSTA Leveraged Loan Index), 23.65% for the Bloomberg Barclays U.S. High-Yield 2% Issuer Capped Index, 20.71% for the S&P/LSTA Leveraged Loan Index and 0.64% for the ICE BofA USD 3-Mo Dep OR CM Index. (The performance data and graph do not reflect the deduction of taxes that a shareholder would pay on Fund distributions or the redemption of Fund shares.)
Performance data quoted represents past performance and is no guarantee of future results. Maximum Sales Charge: Class A: 3.75%, Class C: 1.00% CDSC. The fund’s daily net asset values are not guaranteed and shares are not insured by the FDIC, the Federal Reserve Board or any other agency. The investment return and principal value of an investment will fluctuate so that an investor’s shares, when redeemed, may be higher or lower than the original cost. Current performance may be higher or lower than that shown. Performance as of the most recent month end is available at www.aig.com/funds.
| @ | | The Bloomberg Barclays U.S. High-Yield 2% Issuer Capped Index is a component of the U.S. Corporate High Yield Bond Index, which covers the universe of fixed-rate, non-investment grade corporate debt of issuers in non-emerging market countries. It is not market capitalization-weighted and each issuer is capped at 2% of the index. |
| †† | | The S&P/LSTA Leveraged Loan Index (LLI) reflects the market-weighted performance of U.S. dollar-denominated institutional leveraged loan portfolios. The LLI is the only domestic leveraged loan index that utilizes real-time market weightings spreads and interest payments. |
| *** | | The ICE BofA US Dollar 3-Month Deposit Offered Rate Constant Maturity (USD 3-Mo Dep OR CM) Index tracks the performance of a synthetic asset paying LIBOR to a stated maturity. |
Indices are not managed and an investor cannot invest directly into an index.
SunAmerica Income Funds
SUPPLEMENT TO THE PROSPECTUS
THE SUPPLEMENT IS NOT PART OF ANNUAL REPORT
SunAmerica Equity Funds
AIG International Dividend Strategy Fund
SunAmerica Income Funds
AIG Flexible Credit Fund
AIG Strategic Bond Fund
AIG U.S. Government Securities Fund
SunAmerica Senior Floating Rate Fund, Inc.
AIG Senior Floating Rate Fund
SunAmerica Series, Inc.
AIG Active Allocation Fund
AIG Focused Dividend Strategy Fund
AIG Multi-Asset Allocation Fund
AIG Select Dividend Growth Fund
AIG Strategic Value Fund
SunAmerica Specialty Series
AIG Focused Alpha Large-Cap Fund
AIG Focused Growth Fund
(each, a “Fund” and collectively, the “Funds”)
Supplement dated February 8, 2021
to the Summary Prospectus, Prospectus and
Statement of Additional Information of each Fund
SunAmerica Asset Management, LLC (“SunAmerica”), the Funds’ investment adviser, and Touchstone Advisors, Inc. (“Touchstone”) announced that they have entered into a definitive agreement for Touchstone to acquire certain assets related to SunAmerica’s retail mutual fund management business (the “transaction”).
Under the terms of the agreement, subject to Fund shareholder approval, twelve of the Funds are expected to be reorganized into either existing series or newly created series of Touchstone Strategic Trust or Touchstone Funds Group Trust (collectively, the “Touchstone Funds”) (the “Reorganizations”), and subsequently will be advised by Touchstone under its sub-advised mutual fund approach. On February 8, 2021, the Boards of Directors/Trustees of the Funds unanimously approved each of the proposed Reorganizations. The proposed Reorganizations are listed below.
| | |
AIG Fund
| | Acquiring Touchstone Fund
|
SunAmerica Equity Funds | | |
AIG International Dividend Strategy Fund | | Touchstone International Equity Fund, a series of Touchstone Strategic Trust |
| |
SunAmerica Income Funds | | |
AIG U.S. Government Securities Fund | | Touchstone Active Bond Fund, a series of Touchstone Funds Group Trust |
AIG Flexible Credit Fund AIG Strategic Bond Fund | | Touchstone Strategic Income Opportunities Fund, a series of Touchstone Strategic Trust |
| |
SunAmerica Senior Floating Rate Fund, Inc. | | |
AIG Senior Floating Rate Fund | | Touchstone Credit Opportunities Fund, a series of Touchstone Funds Group Trust |
SunAmerica Income Funds
SUPPLEMENT TO THE PROSPECTUS — (continued)
| | |
AIG Fund
| | Acquiring Touchstone Fund
|
SunAmerica Series, Inc. | | |
AIG Active Allocation Fund AIG Multi-Asset Allocation Fund | | Touchstone Balanced Fund, a series of Touchstone Strategic Trust |
AIG Strategic Value Fund | | Touchstone Value Fund, a series of Touchstone Strategic Trust |
AIG Focused Dividend Strategy Fund AIG Select Dividend Growth Fund | | Touchstone Dividend Equity Fund, a series of Touchstone Funds Group Trust |
| |
SunAmerica Specialty Series | | |
AIG Focused Alpha Large-Cap Fund | | Touchstone Large Cap Focused Fund, a series of Touchstone Strategic Trust |
AIG Focused Growth Fund | | Touchstone Sands Capital Select Growth Fund, a series of Touchstone Funds Group Trust |
The Reorganizations are subject to the completion of certain conditions, including approval by the shareholders of the applicable Fund. If all conditions are satisfied and approvals obtained, the transaction and proposed Reorganizations are expected to close in the third quarter of 2021.
The foregoing disclosure is not intended to solicit a proxy from any Fund shareholder. The solicitation of proxies to effect each Reorganization will only be made by a final, effective Registration Statement on Form N-14, which includes a definitive Proxy Statement/Prospectus, after that Registration Statement is declared effective by the Securities and Exchange Commission (the “SEC”). The Registration Statement on Form N-14 has yet to be filed with the SEC. After the Registration Statement on Form N-14 is filed with the SEC, it may be amended or withdrawn and the Proxy Statement/Prospectus will not be distributed to Fund shareholders unless and until the Registration Statement on Form N-14 is declared effective by the SEC.
Fund shareholders are urged to read the Proxy Statement/Prospectus and other documents filed with the SEC carefully and in their entirety when they become available because these documents will contain important information about the proposed Reorganizations. The Proxy Statement/Prospectus will contain information with respect to the investment objectives, risks, charges and expenses of the Touchstone Funds and other important information that Fund shareholders should carefully consider.
PLEASE RETAIN THIS SUPPLEMENT FOR FUTURE REFERENCE.

Harborside 5
185 Hudson Street, Suite 3300
Jersey City, NJ 07311
| | | | |
Trustees Richard W. Grant Peter A. Harbeck Dr. Judith L. Craven Stephen J. Gutman Eileen A. Kamerick Officers John T. Genoy, President Sharon French, Executive Vice President James Nichols, Vice President Christopher C. Joe, Chief Compliance Officer Gregory N. Bressler, Secretary Kathleen Fuentes, Chief Legal Officer and Assistant Secretary Gregory R. Kingston, Treasurer Donna McManus, Vice President and Assistant Treasurer Shawn Parry, Vice President and Assistant Treasurer Matthew J. Hackethal, Anti-Money Laundering Compliance Officer Investment Adviser SunAmerica Asset Management, LLC Harborside 5 185 Hudson Street, Suite 3300 Jersey City, NJ 07311 Distributor AIG Capital Services, Inc. Harborside 5 185 Hudson Street, Suite 3300 Jersey City, NJ 07311 Shareholder Servicing Agent AIG Fund Services, Inc. Harborside 5 185 Hudson Street, Suite 3300 Jersey City, NJ 07311 Custodian State Street Bank and Trust Company One Lincoln Street Boston, MA 02111 Transfer Agent DST Asset Manager Solutions, Inc. 303 W 11th Street Kansas City, MO 64105 | | VOTING PROXIES ON TRUST PORTFOLIO SECURITIES A description of the policies and procedures that the Trust uses to determine how to vote proxies relating to securities held in a Fund’s portfolio, which is available in the Trust’s Statement of Additional Information, may be obtained without charge upon request, by calling (800) 858-8850. The information is also available from the EDGAR database on the U.S. Securities and Exchange Commission’s website at http://www.sec.gov. DELIVERY OF SHAREHOLDER DOCUMENTS The Funds have adopted a policy that allows them to send only one copy of a Fund’s prospectus, proxy material, annual report and semi-annual report (the “shareholder documents”) to shareholders with multiple accounts residing at the same “household.” This practice is called householding and reduces Fund expenses, which benefits you and other shareholders. Unless the Funds receive instructions to the contrary, you will only receive one copy of the shareholder documents. The Funds will continue to household the shareholder documents indefinitely, until we are instructed otherwise. If you do not wish to participate in householding please contact Shareholder Services at (800) 858-8850 ext. 6010 or send a written request with your name, the name of your fund(s) and your account number(s) to AIG Funds, P.O. Box 219186, Kansas City MO, 64121-9186. We will resume individual mailings for your account within thirty (30) days of receipt of your request. | | DISCLOSURE OF QUARTERLY PORTFOLIO HOLDINGS The Trust is required to file its complete schedule of portfolio holdings with the U.S. Securities and Exchange Commission for the first and third quarters of each fiscal year on Form N-PORT. The Trust’s Forms N-PORT are available on the U.S. Securities and Exchange Commission’s website at http://www.sec.gov. PROXY VOTING RECORD ON SUNAMERICA INCOME FUNDS Information regarding how the Funds voted proxies relating to securities held in the Funds during the most recent twelve month period ended June 30 is available, once filed with the U.S. Securities and Exchange Commission, without charge, upon request, by calling (800) 858-8850 or on the U.S. Securities and Exchange Commission’s website at http://www.sec.gov. This report is submitted solely for the general information of shareholders of the Funds. Distribution of this report to persons other than shareholders of the Funds is authorized only in connection with a currently effective prospectus, setting forth details of the Funds, which must precede or accompany this report. |

Go Paperless!!
Did you know that you have the option to
receive your shareholder reports online?
By choosing this convenient service, you will no longer receive paper copies of Fund documents such as annual reports, semi-annual reports, prospectuses and proxy statements in the mail. Instead, you are provided with quick and easy access to this information via the Internet.
Why Choose Electronic Delivery?
It’s Quick — Fund documents will be received faster than via traditional mail.
It’s Convenient — Elimination of bulky documents from personal files.
It’s Cost Effective — Reduction of your Fund’s printing and mailing costs.
To sign up for electronic delivery, follow
these simple steps:
| | |
| |
| 1 | | Go to www.aig.com/funds |
| |
| 2 | | Click on the link to “Go Paperless!!” |
The email address you provide will be kept strictly confidential. Once your enrollment has been processed, you will begin receiving email notifications when anything you receive electronically is available online.
You can return to www.aig.com/funds at any time to change your email address, edit your preferences or to cancel this service if you choose to resume physical delivery of your Fund documents.
Please note - this option is only available to accounts opened through the Funds.
For information on receiving this report online, see inside back cover.
AIG Funds are advised by SunAmerica Asset Management, LLC (SAAMCo) and distributed by AIG Capital Services, Inc. (ACS), Member FINRA. Harborside 5, 185 Hudson Street, Suite 3300, Jersey City, NJ 07311, 800-858-8850. SAAMCo and ACS are members of American International Group, Inc. (AIG).
This fund report must be preceded by or accompanied by a prospectus.
Investors should carefully consider a Fund’s investment objectives, risks, charges and expenses before investing. The prospectus, containing this and other important information, can be obtained from your financial adviser, the AIG Funds Sales Desk at 800-858-8850, ext. 6003, or at aig.com/funds. Read the prospectus carefully before investing.
aig.com/funds
INANN - 3/21
The SunAmerica Income Funds (the “registrant”) has adopted a Code of Ethics applicable to its Principal Executive and Principal Accounting Officers pursuant to Section 406 of the Sarbanes-Oxley Act of 2002 (the “Code”). During the fiscal year ended March 31, 2021, there were no reportable waivers or implicit waivers to a provision of the Code that applies to the registrant’s Principal Executive and Principal Accounting Officers (the “Covered Officers”).
| Item 3. | Audit Committee Financial Expert. |
The registrant’s Board of Trustees has determined that Eileen A. Kamerick, a Trustee of the registrant, qualifies as an audit committee financial expert, as defined in Item 3(b) of Form N-CSR. Ms. Kamerick is considered to be “independent” for purposes of Item 3(a)(2) of Form N-CSR.
| Item 4. | Principal Accountant Fees and Services. |
(a)—(d) Aggregate fees billed to the registrant for the last two fiscal years for professional services rendered by the registrant’s principal accountant were as follows:
| | | | | | | | |
| | | 2020 | | | 2021 | |
(a) Audit Fees | | $ | 168,431 | | | $ | 170,116 | |
(b) Audit-Related Fees | | $ | 0 | | | $ | 0 | |
(c) Tax Fees | | $ | 54,850 | | | $ | 56,640 | |
(d) All Other Fees | | $ | 0 | | | $ | 0 | |
Audit Fees include amounts related to the audit of the registrant’s annual financial statements and services normally provided by the principal accountant in connection with statutory and regulatory filings. Tax Fees principally include tax compliance, tax advice, tax planning and preparation of tax returns. Aggregate fees billed to the investment adviser and Adviser Affiliates (as defined below in Item 4(e)) that are required to be pre-approved pursuant to paragraph (c)(7)(ii) of Rule 2-01 of Regulation S-X for the last two fiscal years for services rendered by the registrant’s principal accountant were as follows:
| | | | | | | | |
| | | 2020 | | | 2021 | |
(b) Audit-Related Fees | | $ | 0 | | | $ | 0 | |
(c) Tax Fees | | $ | 0 | | | $ | 0 | |
(d) All Other Fees | | $ | 0 | | | $ | 162,195 | |
| | (e) | (1) The registrant’s audit committee pre-approves all audit services provided by the registrant’s principal accountant for the registrant and all non-audit services provided by the registrant’s principal accountant for the registrant, its investment adviser and any entity controlling, controlled by, or under common control with the investment adviser (“Adviser Affiliates”) that provides ongoing services to the registrant, if the engagement by the investment adviser or Adviser Affiliates relates directly to the operations and financial reporting of the registrant. The audit committee has not presently established any pre-approval policies and procedures that permit the pre-approval of the above services other than by the full audit committee. Certain de minimis exceptions are allowed for non-audit services in accordance with Rule 2-01(c)(7)(i)(C) of Regulation S-X as set forth in the registrant’s audit committee charter. |
| | | (2) No services included in (b)-(d) above in connection with fees billed to the registrant or the investment adviser or Adviser Affiliates were approved pursuant to paragraph (c)(7)(i)(C) of Rule 2-01 of Regulation S-X. |
| | (g) | The aggregate fees billed for the most recent fiscal year and the preceding fiscal year by the registrant’s principal accountant for non-audit services rendered to the registrant, its investment adviser, and Adviser Affiliates that provides ongoing services to the registrant for 2020 and 2021 were $54,850 and $471,835 respectively. |
| | (h) | Non-audit services rendered to the registrant’s investment adviser and any Adviser Affiliates that provides ongoing services to the registrant that were not pre-approved pursuant to paragraph (c)(7)(ii) of Rule 2-01 of Regulation S-X were considered by the registrant’s audit committee as to whether they were compatible with maintaining the principal accountant’s independence. |
| Item 5. | Audit Committee of Listed Registrants. |
Not applicable.
Included in Item 1 to the Form.
| Item 7. | Disclosure of Proxy Voting Policies and Procedures for Closed-End Management Investment Companies. |
Not applicable.
| Item 8. | Portfolio Managers of Closed-End Management Investment Companies. |
Not applicable.
| Item 9. | Purchases of Equity Securities by Closed-End Management Investment Company and Affiliated Purchasers. |
Not applicable.
| Item 10. | Submission of Matters to a Vote of Security Holders. |
There were no material changes to the procedures by which shareholders may recommend nominees to the registrant’s Board of Trustees that were implemented after the registrant last provided disclosure in response to the requirements of Item 407(c)(2)(iv) of Regulation S-K (17 CFR 229.407) (as required by 22(b)(15)) of Schedule 14A (17 CFR 240.14a- 101), or this Item 10.
| Item 11. | Controls and Procedures. |
| | (a) | An evaluation was performed within 90 days of the filing of this report, under the supervision and with the participation of the registrant’s management, including the President and Treasurer, of the effectiveness of the design and operation of the registrant’s disclosure controls and procedures (as defined in Rule 30a-3(c) under the Investment Company Act of 1940 (17 CFR 270.30a-3(c))). Based on that evaluation, the registrant’s management, including the President and Treasurer, concluded that the registrant’s disclosure controls and procedures are effective. |
| | (b) | There was no change in the registrant’s internal control over financial reporting (as defined in Rule 30a-3(d) under the Investment Company Act of 1940 (17 CFR 270.30a-3(d))) that occurred during the registrant’s most recent fiscal half year that has materially affected, or is reasonably likely to materially affect, the registrant’s internal control over financial reporting. |
| Item 12. | Disclosure of Securities Lending Activities for Closed-End Management Investment Companies. |
Not applicable.
SIGNATURES
Pursuant to the requirements of the Securities Exchange Act of 1934 and the Investment Company Act of 1940, the registrant has duly caused this report to be signed on its behalf by the undersigned, thereunto duly authorized.
SunAmerica Income Funds
| | |
| By: | | /s/ John T. Genoy |
| | John T. Genoy |
| | President |
Date: June 8, 2021
Pursuant to the requirements of the Securities Exchange Act of 1934 and the Investment Company Act of 1940, this report has been signed below by the following persons on behalf of the registrant and in the capacities and on the dates indicated.
| | |
| By: | | /s/ John T. Genoy |
| | John T. Genoy |
| | President |
Date: June 8, 2021
| | |
| By: | | /s/ Gregory R. Kingston |
| | Gregory R. Kingston |
| | Treasurer |
Date: June 8, 2021