| UNITED STATES |
| SECURITIES AND EXCHANGE COMMISSION |
| Washington, D.C. 20549 |
| |
FORM N-CSR |
| |
CERTIFIED SHAREHOLDER REPORT OF REGISTERED |
MANAGEMENT INVESTMENT COMPANIES |
| |
| |
| |
| Investment Company Act File Number: 811-4521 |
|
| |
| T. Rowe Price State Tax-Free Income Trust |
|
| (Exact name of registrant as specified in charter) |
| |
| 100 East Pratt Street, Baltimore, MD 21202 |
|
| (Address of principal executive offices) |
| |
| David Oestreicher |
| 100 East Pratt Street, Baltimore, MD 21202 |
|
| (Name and address of agent for service) |
| |
| |
| Registrant’s telephone number, including area code: (410) 345-2000 |
| |
| |
| Date of fiscal year end: February 28 |
| |
| |
| Date of reporting period: February 28, 2011 |
Item 1: Report to Shareholders| Maryland Tax-Free Money Fund | February 28, 2011 |
The views and opinions in this report were current as of February 28, 2011. They are not guarantees of performance or investment results and should not be taken as investment advice. Investment decisions reflect a variety of factors, and the managers reserve the right to change their views about individual stocks, sectors, and the markets at any time. As a result, the views expressed should not be relied upon as a forecast of the fund’s future investment intent. The report is certified under the Sarbanes-Oxley Act, which requires mutual funds and other public companies to affirm that, to the best of their knowledge, the information in their financial reports is fairly and accurately stated in all material respects.
REPORTS ON THE WEB
Sign up for our E-mail Program, and you can begin to receive updated fund reports and prospectuses online rather than through the mail. Log in to your account at troweprice.com for more information.
Manager’s Letter
Fellow Shareholders
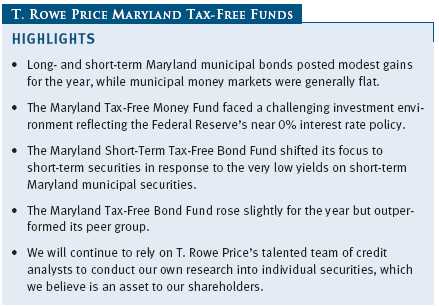
Maryland tax-free bonds produced mild gains in the 12-month period ended February 28, 2011, as strong returns in the first half of the reporting period were mostly offset by falling bond prices in the second half. Maryland money market issues continued to offer meager returns that reflected the Federal Reserve’s near 0% interest rate policy. Several factors pressured the Maryland municipal market in the last six months, including reduced investor demand for municipal securities as yields approached historic lows last summer, signs of economic improvement, bipartisan legislation to extend the Bush-era tax cuts, rising rates for longer-term U.S. Treasuries, and heavy issuance ahead of the expiration of the Build America Bond (BAB) program at the end of 2010. The absolute returns for the Maryland Tax-Free Funds were lackluster for the year. However, longer-term performance relative to their benchmarks remained favorable.
MARKET ENVIRONMENT
The U.S. economy is growing at a steady and sustainable pace, despite high national unemployment and a generally weak housing market. Exports and manufacturing activity remained strong, confidence among consumers and businesses increased, and fears of a double-dip recession waned, thanks in part to additional monetary and fiscal stimulus. In early November, the Federal Reserve initiated a second round of quantitative easing—so-called QE2—and is in the process of purchasing an additional $600 billion in Treasuries by June. In December, President Obama and Congress acted to extend the Bush-era tax cuts through the end of 2012, thus providing an additional boost to 2011 real gross domestic product growth.
Intermediate-term Treasury interest rates rose sharply over the last six months, reflecting expectations for stronger economic growth in 2011 and concerns about higher inflation stemming from food and energy price increases. In addition, the Fed signaled—contrary to expectations—that it would not make significant purchases of bonds maturing in 30 years. Longer-term municipal interest rates also rose significantly, tracking Treasury yields and reflecting heavier municipal supply and weaker demand, particularly in the last two months of 2010.
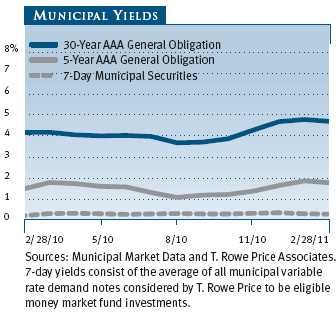
With 30-year municipal yields higher than 30-year Treasury yields, long-term tax-free securities are a very attractive alternative, particularly for investors in the highest tax brackets. As of February 28, 2011, the 4.69% yield offered by a 30-year tax-free municipal bond rated AAA was about 104% of the 4.50% pretax yield offered by a 30-year Treasury. An investor in the 28% federal tax bracket would need to invest in a taxable bond yielding about 6.51% in order to receive the same after-tax income. (To calculate a municipal bond’s taxable-equivalent yield, divide the municipal bond’s yield by the quantity of 1.00 minus your federal tax bracket expressed as a decimal—in this case, 1.00 – 0.28, or 0.72.)
MUNICIPAL MARKET NEWS
Municipal issuance in 2010 totaled $433 billion—an annual record—according to The Bond Buyer. New supply for most of the year reflected a steady pace of municipal borrowings for ongoing capital needs, although issuance increased significantly in the fourth quarter as municipalities rushed to take advantage of favorable market conditions and low interest rates. About 30% of the new supply in 2010 represented taxable municipal issuance under the BAB program, which reduced the supply of new tax-exempt securities. Because the BAB program was not extended beyond the end of 2010, several municipalities accelerated some of their 2011 borrowing into late 2010. New aggregate issuance thus far in 2011 has been muted, in part because of higher long-term municipal rates. Investor demand was strong for most of 2010, bolstered by concerns about higher taxes in 2011. However, cash flows into municipal bond funds turned negative in early November and led to weaker institutional demand.
Maryland continues to face fiscal difficulties and has been forced to raise taxes and fees and cut spending to close its budget deficit. Despite the increasing amount of negative press regarding its fiscal health, we do not see a near-term threat to the state’s ability to continue servicing its outstanding debts. However, we have longer-term concerns about potentially onerous future pension obligations and other retirement benefits. In any event, we continue to find attractive tax-free investment opportunities among a variety of sectors, many of which have solid credit profiles.
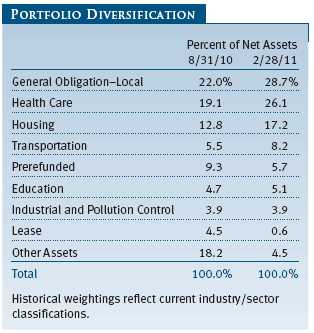
For the 12-month period, most municipal sectors produced mild gains as losses in the second half of our fiscal year offset strong gains in the first half. Over the last year, general obligations (GOs), particularly state-issued GOs, outperformed revenue bonds, although gains in both segments were not spectacular. Among revenue bonds, housing, solid waste, and lease revenue were among the top-performing segments. In contrast, industrial revenue issues produced slight negative returns, weighed down by tobacco bonds. While transportation- and health care-related bonds generally lagged, some lower-quality issues within those sectors did quite well.
In the last six months, virtually every major municipal bond sector produced negative returns, with GOs holding up somewhat better than revenue bonds. Among revenue bonds, tobacco bonds dragged down the industrial revenue sector. We are underweighting tobacco bonds because fundamentals are poor, and longer-term tobacco consumption trends do not appear to be especially positive for the bonds. However, we like other credits in the industrial revenue space. Transportation- and education-related bonds fared poorly, as did hospital revenue and life-care issues. We remain cautious on health care, in part because last year’s reform legislation will lead to tighter reimbursement policies and state budget cuts could affect Medicaid payments to providers. However, we believe the sector offers attractive investment opportunities with reasonable credit risks. Housing revenue bonds held up fairly well, and prerefunded and escrowed-to-maturity bonds, which are backed by Treasuries, declined the least.
MARYLAND MARKET NEWS
Maryland’s economic profile remains solid compared with other states. Wealth levels are favorable, with Maryland’s 2009 per capita personal income representing 123% of the national average and ranking fourth among all states. Maryland’s unemployment rate was 7.2% as of January 2011 (the latest available data), well below the 9.0% national unemployment rate at that time. Maryland’s employment picture was little changed over the past year, although job creation was a bit weaker than the national average.
While Maryland’s economic and demographic trends have been relatively good, its finances have not been immune to the national recession. As fiscal year 2010 unfolded, both income tax and sales tax receipts dropped below forecasts and Governor Martin O’Malley responded by reducing expenditures to bring the budget into balance. The state has also maintained a cushion in its rainy day fund—as of June 30, 2010, Maryland’s state reserve fund held $615 million, representing a solid 5% of general fund revenues expected for fiscal 2011.
In the current fiscal year, ending June 30, 2011, Maryland faced a budget shortfall of approximately $2 billion, which was larger than expected. The budget shortfall was resolved, predominantly through spending cuts. The state is right-sizing its budget for 2012 and expects its reserve fund will hold $682 million as of June 30, 2012. For the seven months ended January 2011, Maryland’s general fund receipts are 6.1% ahead of where they were last year at this time.
Maryland’s debt load is somewhat above the national average. According to Moody’s 2010 State Debt Medians, the state’s debt burden is in the upper-third when measured by debt per capita and only modestly better when measured on a debt to personal income basis. Debt service as a percentage of the budget is, nonetheless, very manageable at 3.4% in fiscal 2010. However, as of June 30, 2010, Maryland’s Retirement and Pension System (five plans) was only funded at 63% on an actuarial basis. Maryland faces fairly heavy unfunded liabilities for its pension and benefits plans, at $18 billion and $16 billion, respectively. Various modifications to benefits under these programs have been proposed to downsize these liabilities and improve funding.
Maryland has a long history of responsible stewardship and prudent financial management. The state’s general obligation bonds are rated Aaa, AAA, and AAA by Moody’s Investors Service, Standard & Poor’s, and Fitch, respectively, and each of the rating agencies carries a stable outlook.
PERFORMANCE AND PORTFOLIO STRATEGY REVIEW
Maryland Tax-Free Money Fund
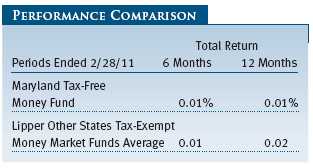
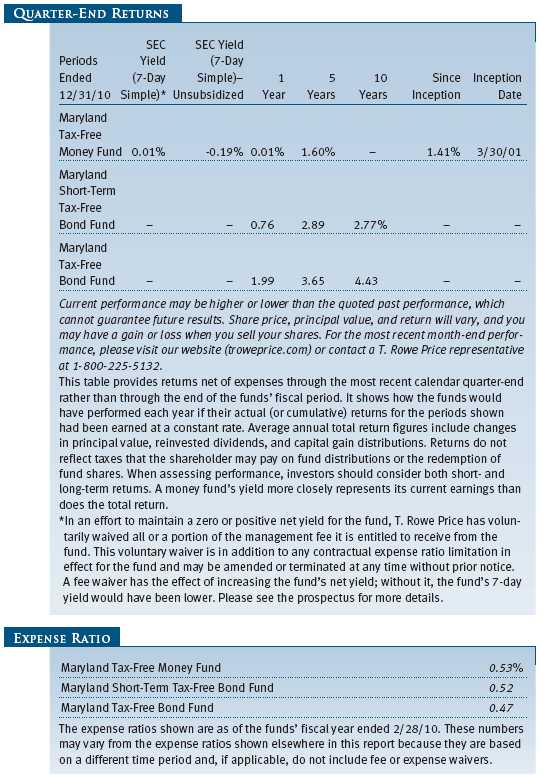
Your fund generated a 0.01% return for the 6- and 12-month periods ended February 28, 2011. These results were in line with the Lipper Other States Tax-Exempt Money Market Funds Average as returns for all money funds have remained near 0%. The Maryland Tax-Free Money Fund has performed in line with its competitors over the longer term. (Based on cumulative total return, Lipper ranked the Maryland Tax-Free Money Fund 10 of 33, 16 of 33, and 16 of 33 funds in the other states tax-exempt money market funds universe for the one-, three-, and five-year periods ended February 28, 2011, respectively. Past performance cannot guarantee future results.)
The Federal Reserve’s ongoing efforts to stimulate the economy also continue to compress all money market rates toward the central bank’s overnight target rate of 0.00% to 0.25%. Benchmark rates—such as the 90-day Treasury bill, which averaged 0.13% over the past six months, and the 90-day Libor, which averaged 0.30%—reflect the ongoing impact of the Fed’s extraordinary policy measures on the money markets.
As money market rates of all kinds drifted toward 0%, municipal rates have shown little of their typical differentiation from broader money market rates despite their tax advantage. In fact, municipal money market rates have tended to trade above taxable rates and have remained fairly steady over the past six months. Maryland’s overnight and seven-day rates have averaged about 0.24%, rates on 90-day municipal commercial paper have averaged about 0.35%, and one-year municipal notes have averaged 0.39%.
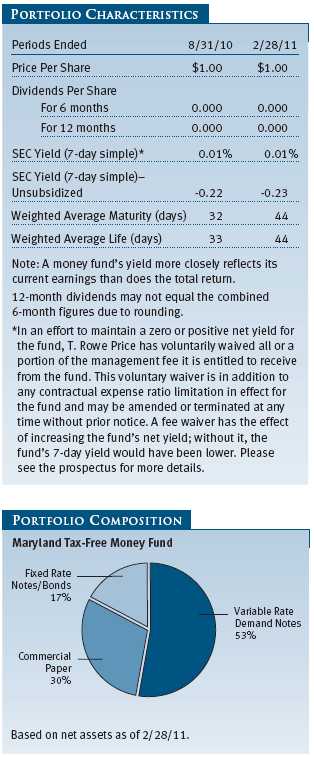
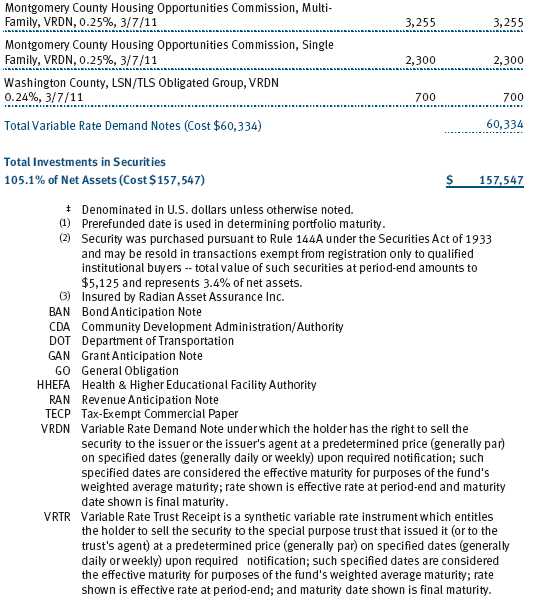
Given the relatively stable yield curve—in other words, the fairly steady relationship between shorter- and longer-term money market yields—and our expectation of little change in rates for the foreseeable future, we have continued to emphasize longer-term money market securities. Throughout the reporting period, we attempted to position the fund’s weighted average maturity near the longer end of our permissible range (50 to 55 days). Recently, however, we have had fewer opportunities to extend and that has left the fund with a shorter average maturity than our target, at 44 days. Our higher-than-normal allocation to longer-dated, fixed rate issues versus variable rate investments has gained us some small yield advantage.
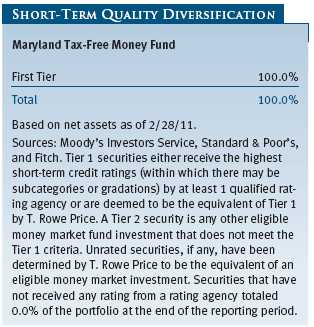
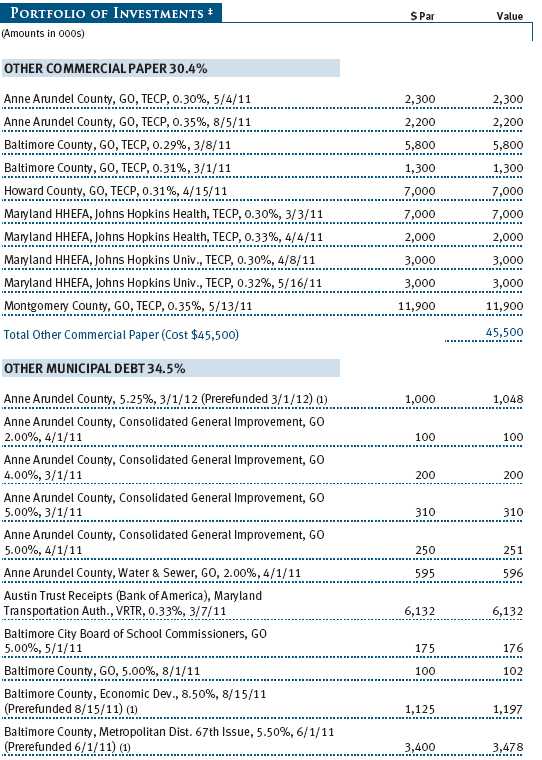
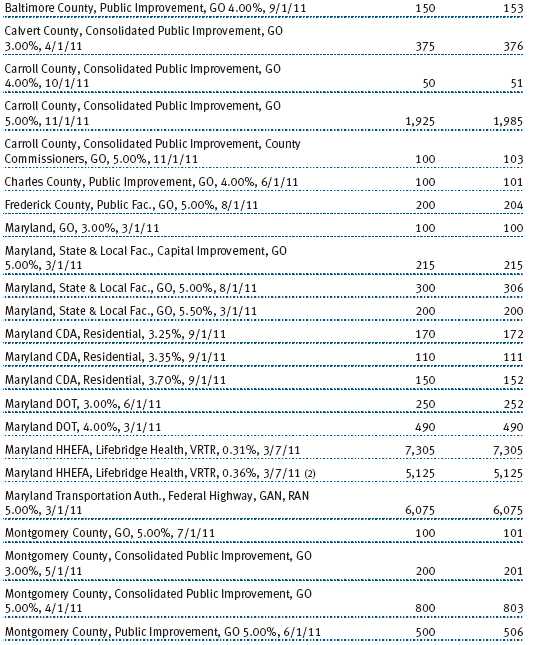
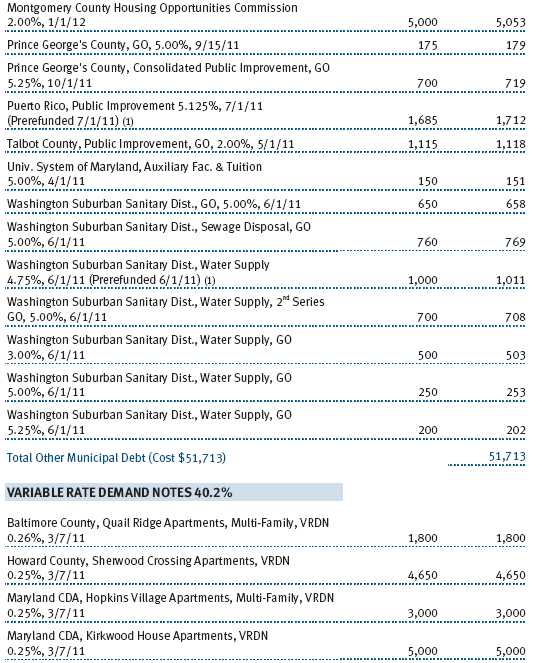
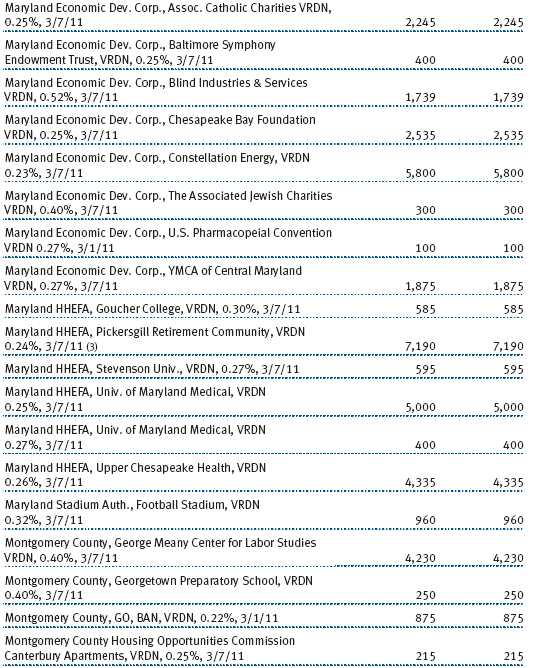
Our focus remains fixed on investing in only the highest-quality Maryland issuers, which represent minimal credit risk—especially given the broader backdrop of concerns for the municipal market. Nevertheless, Maryland continues to benefit from regional strength and prudent fiscal management. Our largest portfolio holdings at the end of the reporting period were from issuers including Howard County, Montgomery County, Johns Hopkins Health System, and the Maryland State Transportation Authority. (Please refer to the portfolio of investments for a complete list of holdings and the amount each represents in the portfolio.)
We expect most money market rates to remain unchanged through 2011, which will keep returns for municipal money market funds very low. A rebounding economy ultimately will improve the near-term financial prospects of many municipal issuers, but for now we are cautious. Thus, our investment posture is expected to remain relatively unchanged for the next three to six months.
Maryland Short-Term Tax-Free Bond Fund
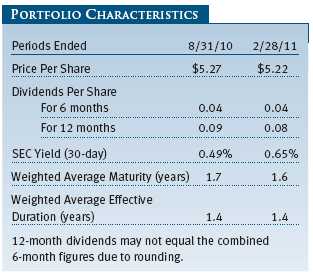
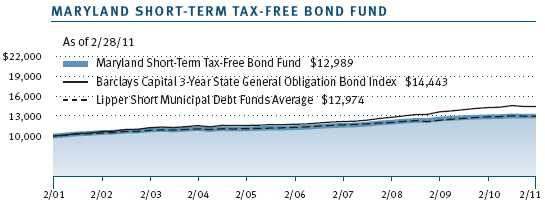
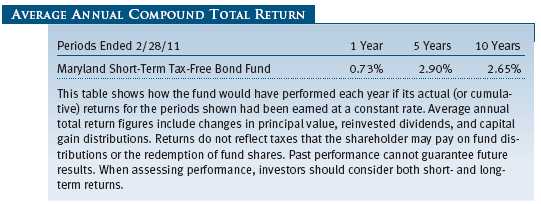
The fund returned -0.23% and 0.73% over the 6- and 12-month periods ended February 28, 2011, respectively. The Maryland Short-Term Tax-Free Bond Fund held up moderately better than the Lipper Short Municipal Debt Funds Average, which measures the performance of competing funds, in the last six months but trailed for the 12-month period. The fund’s net asset value has declined five cents over the last year to $5.22. However, as shown in the table below, dividends for the past 12 months totaled $0.08, providing a positive total return. In the recent six-month period, dividends per share remained stable and contributed $0.04.

Over the last several years, yields have fallen dramatically. Three-year Maryland general obligation bond yields fell from 3.5% in February 2007 to 1.5% in February 2009 and by almost another third again to 1.05% by February 2011 after bottoming near 0.40% six months ago. After keeping the fund’s duration—a measure of interest rate sensitivity—above average for most of the last three years to take advantage of falling rates, we shifted our preference to short-maturity securities and cash during the past six months, believing that further yield declines were unlikely. Although short-term interest rates may stay low for an extended period, this defensive stance reduces the portfolio’s sensitivity to an uptick in short-term municipal interest rates.
Our shorter-than-average portfolio positioning helped us a bit over the last six months but did not make up for the underperformance versus our peers in the prior six-month period.

Overall, the portfolio’s credit quality, as shown in the Quality Diversification chart, remained very high. AAA rated bonds accounted for 41% of assets, while our allocation to A and AA rated issues widened by three percentage points over the past six months to 49% of the fund. In aggregate, investment-grade holdings represent 97% of the portfolio. We believe that it will be difficult to exceed the peer group as long as the Federal Open Market Committee keeps overnight rates near zero. However, we believe we will make up considerable ground on our peer group once the Fed starts to raise rates. Six months ago, we believed the Fed would maintain its short-term rate policy for an extended period, and we continue to expect little change in the yield curve.
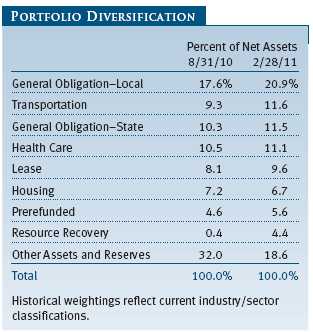
Over the past six months, the Maryland Short-Term Tax-Free Bond Fund’s sector allocations did not change materially. However, we significantly increased our allocation to holdings that mature in 2012 with cash and proceeds from bonds that matured. We now have about two-thirds of the portfolio invested in cash and bonds that mature in 2011 and 2012. The fund is well positioned to reinvest proceeds from maturing bonds into higher-yielding issues when rates start to move up, which we think will begin to happen later this year or early next year. Our plan is to mitigate our interest rate risk exposure by keeping duration and portfolio maturity relatively short until short-term rates adjust higher. Although our average portfolio maturity and duration are longer than a money fund, both are considerably more defensive than usual. However, given the current supply/demand imbalance, we don’t see a lot of value in Maryland’s short-term, high-quality bonds and believe that an uptick in interest rates would generate disappointing returns for our shareholders.
We believe the Maryland Short-Term Tax-Free Bond Fund is an attractive investment relative to a low-yielding money market fund. Our unwavering focus is on providing triple-tax-exempt (local, state, and federal) income for Maryland residents. We want to maintain our yield advantage, but we are unwilling to take on significant interest rate risk to get only a marginal amount of incremental income. Maryland is a AAA rated state with a long history of fiscal responsibility, and its short-term bonds typically yield less than municipal bonds issued by other states.
Maryland Tax-Free Bond Fund
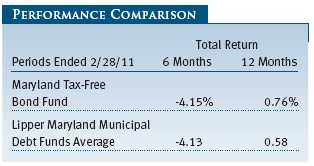
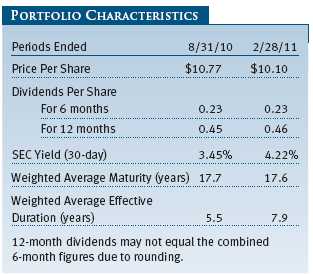
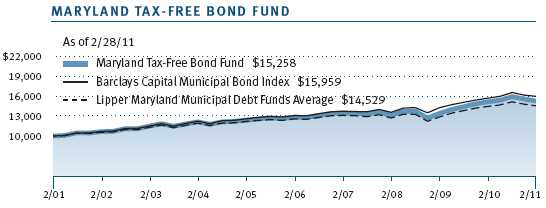
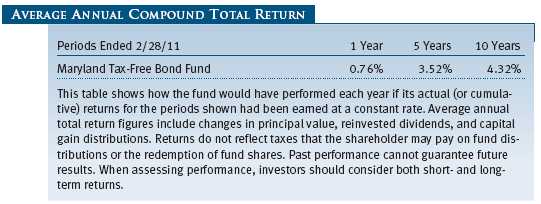
The Maryland Tax-Free Bond Fund returned -4.15% and 0.76% for the 6- and 12-month periods ended February 28, 2011, respectively. Both results were in line with the performance of our Lipper peer group average. The fund’s net asset value was $10.10 at the end of February, down $0.67 from six months earlier. Dividends per share over the last six months remained stable and contributed $0.23 to the fund’s total return.
Despite the recent weakness, we are pleased to report that your fund continued to compare favorably relative to its competitors over the longer term. Lipper ranked the fund in the top 14% of its Maryland municipal debt funds universe for the 10-year period ended February 28, 2011. (Based on cumulative total return, Lipper ranked the Maryland Tax-Free Bond Fund 14 of 35, 4 of 30, 7 of 26, and 3 of 21 funds in the Maryland municipal debt funds universe for the 1-, 3-, 5-, and 10-year periods ended February 28, 2011, respectively. Past performance cannot guarantee future results.)
Our emphasis on longer-maturity securities, which contributed to our negative returns for the last six months, is still the foundation of our long-term investment strategy. The municipal yield curve remains at historically steep levels—the difference between the yield on two-year and 30-year Maryland municipal securities stands at a record level—and we continue to see the best value in the longer end of the municipal market. Our efforts to mitigate the interest rate risk of these long holdings—by keeping weighted average maturity steady and maintaining a higher level of cash—was not enough to offset the negative effects of the sharp rise in interest rates in the fourth quarter of 2010. The good news is that yields and overall valuations are much improved from the historically low rates six months ago, and as stability returns to municipal interest rates, we believe our focus on yield will enhance returns.
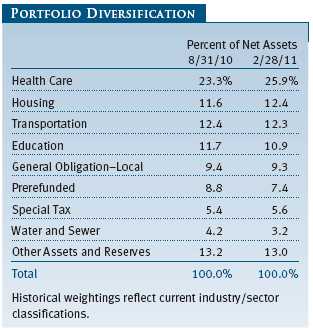
We increased our investment focus on lower-rated investment-grade (A and BBB rated) credits over the past six months—in particular, we added essential service revenue bonds, such as electric and transportation revenue bonds. Additionally, we increased our holdings in dedicated tax bonds as we were more comfortable with bondholder-dedicated revenue streams than general obligations. Some of the portfolio’s best performers came from these revenue sectors. We also continued to emphasize the health care sector, which remained our largest allocation at the end of the period. Despite general financial pressures and regulatory uncertainty, we believe the sector offers solid value, leading us to increase our allocation to hospitals measurably over the past year. This segment continues to provide a significant yield premium, which should contribute to favorable long-term returns. Maryland’s hospitals, with the state’s unique health care reimbursement system, generally exhibit greater financial stability than hospitals nationwide.
Our higher exposure to the housing revenue bond sector added to returns over the past year. We have continued to hold a significant allocation to the Maryland Community Development Administration’s single-family revenue bonds. This has long been a position in our portfolio as housing bonds generate relatively high levels of income for investors. While we are aware of the pressures within the housing industry, the state-run housing agency’s bonds are backed by a diversified pool of largely insured loans. Operations are profitable and excess assets support the bonds. We continue to follow the agency’s finances closely and, while they are more pressured than in the past, we are confident in the continued excess return potential of these investments. (Please refer to the fund’s portfolio of investments for a complete list of our holdings and the amount each represents in the portfolio.)
We continue to rely on our deep and talented research team, and we have kept our allocation to low-quality credits steady over the past year. Given the recent market adjustments, we selectively added to our positions in the A and BBB rated segments as we uncovered attractive investment opportunities. Overall, 92% of the portfolio is invested in credits rated BBB and higher. There may come a time when we will increase our low-quality holdings, although at this point we remain focused on higher-quality tiers. One lower-quality holding we sold in 2010 was a position in Chesapeake Hyatt revenue bonds (issued through the Maryland Economic Development Corporation). This holding proved disappointing as general economic weakness contributed to operating results that did not meet original expectations.
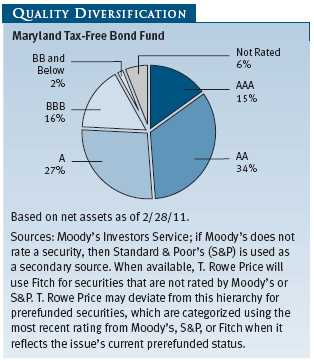
Overall, the portfolio’s average quality remains very high and reflects the general quality of the Maryland municipal bond market. While we are always in search of better yield, we also subject any new purchases to a rigorous credit screening. Furthermore, with nearly 100 distinct guarantors in the fund, it offers a high level of diversification for our shareholders. (Of course, diversification cannot assure a profit or protect against loss in a declining market.)
OUTLOOK
The last six months was a challenging period for the municipal bond market, but not because of defaults or credit-related events. In the late fall, municipal interest rates rose initially with Treasury rates on inflation worries and Federal Reserve activity. Municipal market weakness quickly accelerated as investors, with nagging credit fears and concerns about municipal market stability, redirected a significant amount of assets to other investment areas. We understand that many of you continue to have concerns about the stability of the market and the potential for widespread defaults. We do not agree with the dire predictions made in some media stories that there will be significant municipal defaults in the near term. As always, we will rely on our ongoing research and analysis to direct our investments to areas of the municipal market in which we see good long-term value.
Still, the current credit and economic environment for municipalities is the most challenging since the Great Depression and could remain so for some time. Ongoing economic sluggishness, the housing market downturn, and high unemployment have reduced the tax revenues collected by state and local governments, and municipal bond defaults, which have historically been rare, could increase moderately. Furthermore, long-term state and local government liabilities such as pension benefits and health care costs are a growing concern. Maintaining balanced budgets and addressing these long-term concerns require careful and dedicated work by state and local officials. Many issuers are trying to make the difficult but necessary fiscal decisions as they adjust to high unemployment, slow economic growth, lower tax revenues, and other tough conditions. These efforts will need to continue—with or without additional federal government assistance.
We continue to believe that municipal bonds constitute a high-quality market, with pockets of good investment opportunity for investors with a long-term focus. While shorter-term securities have unattractive absolute yields and could be vulnerable if shorter-term interest rates increase, longer-term and lower-rated investment-grade bond valuations have become more attractive in recent months and should stabilize as supply pressures abate. Some municipalities have canceled or delayed bond issuance due to the difficult market conditions. We expect demand for municipals to increase as taxable bond portfolios or other nontraditional investors decide to take advantage of higher municipal yields.
We continue to conduct our own thorough research and assign our own independent credit ratings before making investment decisions. T. Rowe Price’s strong credit research capabilities have been and should continue to be an asset for our investors. As always, we are on the lookout for attractively valued bonds issued by municipalities with good fundamentals—an investment strategy that has served our investors well in the past.
Thank you for investing with T. Rowe Price.
Respectfully submitted,

Joseph K. Lynagh
Chairman of the Investment Advisory Committee
Maryland Tax-Free Money Fund

Charles B. Hill
Chairman of the Investment Advisory Committee
Maryland Short-Term Tax-Free Bond Fund

Hugh D. McGuirk
Chairman of the Investment Advisory Committee
Maryland Tax-Free Bond Fund
March 16, 2011
The committee chairmen have day-to-day responsibility for managing the portfolios and work with committee members in developing and executing the funds’ investment programs.
RISKS OF FIXED INCOME INVESTING
Bonds are subject to interest rate risk (the decline in bond prices that usually accompanies a rise in interest rates) and credit risk (the chance that any fund holding could have its credit rating downgraded or that a bond issuer will default by failing to make timely payments of interest or principal), potentially reducing the fund’s income level and share price. The Maryland Tax-Free Funds are less diversified than those investing nationally. Some income may be subject to state and local taxes and the federal alternative minimum tax.
The money fund seeks to maintain a stable net asset value and provide an appropriate place for money between investments or during uncertain market conditions. An investment in the fund is not insured or guaranteed by the FDIC or any other government agency. Although the fund seeks to preserve the value of your investment at $1.00 per share, it is possible to lose money by investing in the fund.
GLOSSARY
Barclays Capital 3-Year State General Obligation Bond Index: A broadly diversified index of state-issued general obligation tax-exempt bonds with maturities between two and four years.
Barclays Capital Municipal Bond Index: A broadly diversified index of tax-exempt bonds.
Basis point: One one-hundredth of one percentage point, or 0.01%.
Duration: A measure of a bond fund’s sensitivity to changes in interest rates. For example, a fund with a duration of five years would fall about 5% in price in response to a one-percentage-point rise in interest rates, and vice versa.
Escrowed-to-maturity bond: A bond that has the funds necessary for repayment at maturity, or a call date, set aside in a separate or “escrow” account.
Federal funds rate: The interest rate charged on overnight loans of reserves by one financial institution to another in the United States. The Federal Reserve sets a target federal funds rate to affect the direction of interest rates.
General obligation debt: A government’s strongest pledge that obligates its full faith and credit, including, if necessary, its ability to raise taxes.
Investment grade: High-quality bonds as measured by one of the major credit rating agencies. For example, Standard & Poor’s designates the bonds in its top four categories (AAA to BBB) as investment grade.
Libor rate: The London Interbank Offered Rate, which is a benchmark for short-term taxable rates.
Lipper averages: The averages of available mutual fund performance returns for specified time periods in categories defined by Lipper.
Prerefunded bond: A bond that originally may have been issued as a general obligation or revenue bond but that is now secured by an escrow fund consisting entirely of direct U.S. government obligations that are sufficient for paying the bondholders.
Revenue (or revenue-backed) bond: A bond issued to fund specific projects, such as airports, bridges, hospitals, and toll roads, where a portion of the revenue generated is used to service the interest payments on the bond.
SEC yield (7-day simple): A method of calculating a money fund’s yield by annualizing the fund’s net investment income for the last seven days of each period divided by the fund’s net asset value at the end of the period. Yield will vary and is not guaranteed.
SEC yield (30-day): A method of calculating a fund’s yield that assumes all portfolio securities are held until maturity. Yield will vary and is not guaranteed.
Weighted average life: A measure of a fund’s credit quality risk. In general, the longer the average life, the greater the fund’s credit quality risk. The average life is the dollar-weighted average maturity of a portfolio’s individual securities without taking into account interest rate readjustment dates. Money funds must maintain a weighted average life of less than 120 days.
Weighted average maturity: A measure of a fund’s interest rate sensitivity. In general, the longer the average maturity, the greater the fund’s sensitivity to interest rate changes. The weighted average maturity may take into account the interest rate readjustment dates for certain securities. Money funds must maintain a weighted average maturity of less than 60 days.
Yield curve: A graphic depiction of the relationship between yields and maturity dates for a set of similar securities such as Treasuries or municipal securities. Securities with longer maturities usually have a higher yield. If short-term securities offer a higher yield, then the curve is said to be “inverted.” If short- and long-term bonds are offering equivalent yields, then the curve is said to be “flat.”
Performance and Expenses
This chart shows the value of a hypothetical $10,000 investment in the fund over the past 10 fiscal year periods or since inception (for funds lacking 10-year records). The result is compared with benchmarks, which may include a broad-based market index and a peer group average or index. Market indexes do not include expenses, which are deducted from fund returns as well as mutual fund averages and indexes.


This chart shows the value of a hypothetical $10,000 investment in the fund over the past 10 fiscal year periods or since inception (for funds lacking 10-year records). The result is compared with benchmarks, which may include a broad-based market index and a peer group average or index. Market indexes do not include expenses, which are deducted from fund returns as well as mutual fund averages and indexes.
This chart shows the value of a hypothetical $10,000 investment in the fund over the past 10 fiscal year periods or since inception (for funds lacking 10-year records). The result is compared with benchmarks, which may include a broad-based market index and a peer group average or index. Market indexes do not include expenses, which are deducted from fund returns as well as mutual fund averages and indexes.
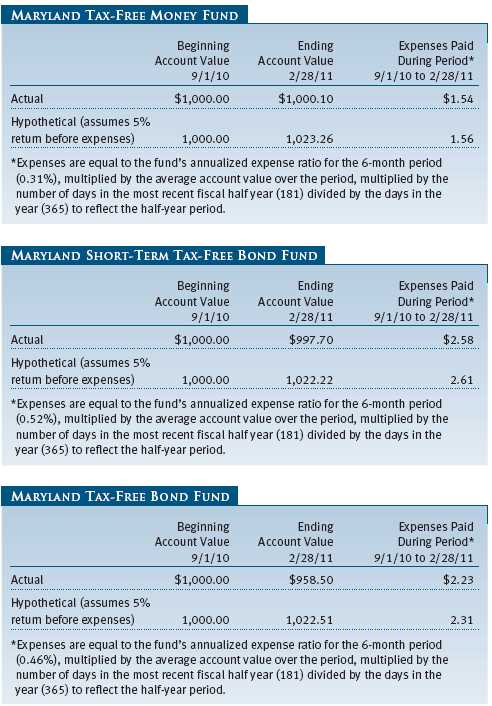
As a mutual fund shareholder, you may incur two types of costs: (1) transaction costs, such as redemption fees or sales loads, and (2) ongoing costs, including management fees, distribution and service (12b-1) fees, and other fund expenses. The following example is intended to help you understand your ongoing costs (in dollars) of investing in the fund and to compare these costs with the ongoing costs of investing in other mutual funds. The example is based on an investment of $1,000 invested at the beginning of the most recent six-month period and held for the entire period.
Actual Expenses
The first line of the following table (“Actual”) provides information about actual account values and expenses based on the fund’s actual returns. You may use the information in this line, together with your account balance, to estimate the expenses that you paid over the period. Simply divide your account value by $1,000 (for example, an $8,600 account value divided by $1,000 = 8.6), then multiply the result by the number in the first line under the heading “Expenses Paid During Period” to estimate the expenses you paid on your account during this period.
Hypothetical Example for Comparison Purposes
The information on the second line of the table (“Hypothetical”) is based on hypothetical account values and expenses derived from the fund’s actual expense ratio and an assumed 5% per year rate of return before expenses (not the fund’s actual return). You may compare the ongoing costs of investing in the fund with other funds by contrasting this 5% hypothetical example and the 5% hypothetical examples that appear in the shareholder reports of the other funds. The hypothetical account values and expenses may not be used to estimate the actual ending account balance or expenses you paid for the period.
Note: T. Rowe Price charges an annual small-account maintenance fee of $10, generally for accounts with less than $2,000 ($500 for UGMA/UTMA). The fee is waived for any investor whose T. Rowe Price mutual fund accounts total $25,000 or more, accounts employing automatic investing, and IRAs and other retirement plan accounts that utilize a prototype plan sponsored by T. Rowe Price (although a separate custodial or administrative fee may apply to such accounts). This fee is not included in the accompanying table. If you are subject to the fee, keep it in mind when you are estimating the ongoing expenses of investing in the fund and when comparing the expenses of this fund with other funds.
You should also be aware that the expenses shown in the table highlight only your ongoing costs and do not reflect any transaction costs, such as redemption fees or sales loads. Therefore, the second line of the table is useful in comparing ongoing costs only and will not help you determine the relative total costs of owning different funds. To the extent a fund charges transaction costs, however, the total cost of owning that fund is higher.
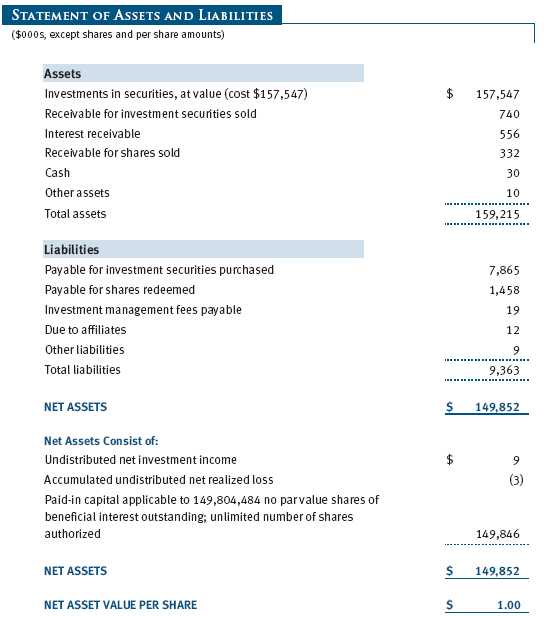
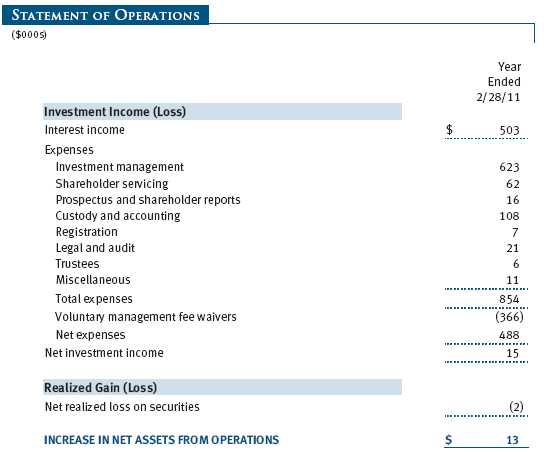
The accompanying notes are an integral part of these financial statements.
The accompanying notes are an integral part of these financial statements.
The accompanying notes are an integral part of these financial statements.
The accompanying notes are an integral part of these financial statements.
The accompanying notes are an integral part of these financial statements.
| NOTES TO FINANCIAL STATEMENTS |
T. Rowe Price State Tax-Free Income Trust (the trust), is registered under the Investment Company Act of 1940 (the 1940 Act). The Maryland Tax-Free Money Fund (the fund), a nondiversified, open-end management investment company, is one portfolio established by the trust. The fund commenced operations on March 30, 2001. The fund seeks to provide preservation of capital, liquidity, and, consistent with these objectives, the highest level of income exempt from federal and Maryland state and local income taxes.
NOTE 1 - SIGNIFICANT ACCOUNTING POLICIES
Basis of Preparation The accompanying financial statements were prepared in accordance with accounting principles generally accepted in the United States of America, which require the use of estimates made by management. Management believes that estimates and valuations are appropriate; however, actual results may differ from those estimates, and the valuations reflected in the accompanying financial statements may differ from the value ultimately realized upon sale or maturity.
Investment Transactions, Investment Income, and Distributions Income and expenses are recorded on the accrual basis. Premiums and discounts on debt securities are amortized for financial reporting purposes. Income tax-related interest and penalties, if incurred, would be recorded as income tax expense. Investment transactions are accounted for on the trade date. Realized gains and losses are reported on the identified cost basis. Distributions to shareholders are recorded on the ex-dividend date. Income distributions are declared daily and paid monthly.
Credits The fund earns credits on temporarily uninvested cash balances held at the custodian, which reduce the fund’s custody charges. Custody expense in the accompanying financial statements is presented before reduction for credits.
NOTE 2 - VALUATION
The fund values its investments and computes its net asset value per share each day that the New York Stock Exchange is open for business. In accordance with Rule 2a-7 under the 1940 Act, securities are valued at amortized cost, which approximates fair value. Securities for which amortized cost is deemed not to reflect fair value are stated at fair value as determined in good faith by the T. Rowe Price Valuation Committee, established by the fund’s Board of Trustees.
Various inputs are used to determine the value of the fund’s financial instruments. These inputs are summarized in the three broad levels listed below:
Level 1 – quoted prices in active markets for identical financial instruments
Level 2 – observable inputs other than Level 1 quoted prices (including, but not limited to, quoted prices for similar financial instruments, interest rates, prepayment speeds, and credit risk)
Level 3 – unobservable inputs
Observable inputs are those based on market data obtained from sources independent of the fund, and unobservable inputs reflect the fund’s own assumptions based on the best information available. The input levels are not necessarily an indication of the risk or liquidity associated with financial instruments at that level. For example, securities held by a money market fund are generally high quality and liquid; however, they are reflected as Level 2 because the inputs used to determine fair value are not quoted prices in an active market. On February 28, 2011, all of the fund’s financial instruments were classified as Level 2, based on the inputs used to determine their values.
NOTE 3 - OTHER INVESTMENT TRANSACTIONS
Consistent with its investment objective, the fund engages in the following practices to manage exposure to certain risks and/or to enhance performance. The investment objective, policies, program, and risk factors of the fund are described more fully in the fund’s prospectus and Statement of Additional Information.
Restricted Securities The fund may invest in securities that are subject to legal or contractual restrictions on resale. Prompt sale of such securities at an acceptable price may be difficult and may involve substantial delays and additional costs.
NOTE 4 - FEDERAL INCOME TAXES
No provision for federal income taxes is required since the fund intends to continue to qualify as a regulated investment company under Subchapter M of the Internal Revenue Code and distribute to shareholders all of its income and gains. Distributions determined in accordance with federal income tax regulations may differ in amount or character from net investment income and realized gains for financial reporting purposes. Financial reporting records are adjusted for permanent book/tax differences to reflect tax character but are not adjusted for temporary differences.
The fund files U.S. federal, state, and local tax returns as required. The fund’s tax returns are subject to examination by the relevant tax authorities until expiration of the applicable statute of limitations, which is generally three years after the filing of the tax return but which can be extended to six years in certain circumstances. Tax returns for open years have incorporated no uncertain tax positions that require a provision for income taxes.
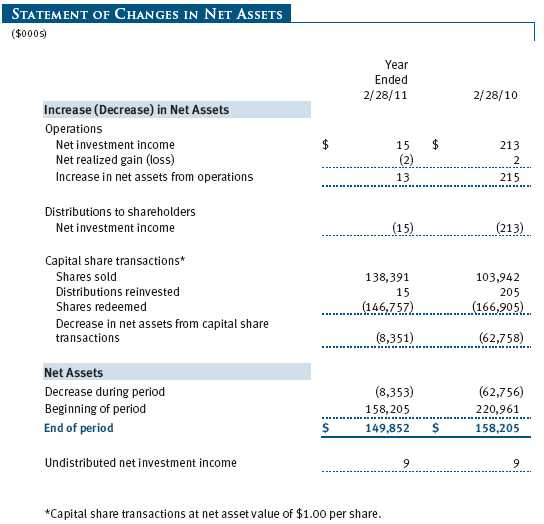
Distributions during the years ended February 28, 2011 and February 28, 2010, totaled $15,000 and $213,000, respectively, and were characterized as tax-exempt income for tax purposes. At February 28, 2011, the tax-basis cost of investments and components of net assets were as follows:
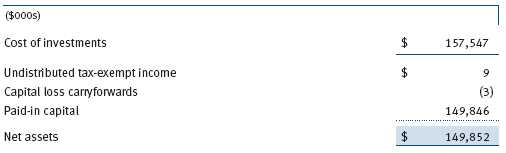
The fund intends to retain realized gains to the extent of available capital loss carryforwards. The fund’s unused capital loss carryforwards as of February 28, 2011, all expire in fiscal 2019.
NOTE 5 - RELATED PARTY TRANSACTIONS
The fund is managed by T. Rowe Price Associates, Inc. (Price Associates), a wholly owned subsidiary of T. Rowe Price Group, Inc. (Price Group). The investment management agreement between the fund and Price Associates provides for an annual investment management fee, which is computed daily and paid monthly. The fee consists of an individual fund fee, equal to 0.10% of the fund’s average daily net assets, and a group fee. The group fee rate is calculated based on the combined net assets of certain mutual funds sponsored by Price Associates (the group) applied to a graduated fee schedule, with rates ranging from 0.48% for the first $1 billion of assets to 0.285% for assets in excess of $220 billion. The fund’s group fee is determined by applying the group fee rate to the fund’s average daily net assets. At February 28, 2011, the effective annual group fee rate was 0.30%.
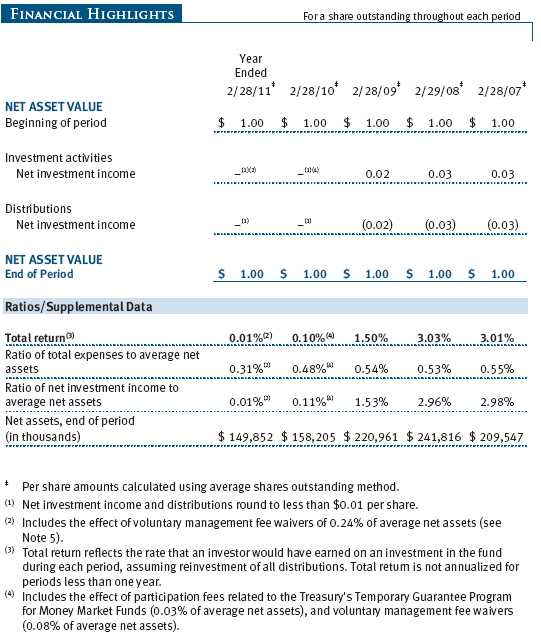
Price Associates may voluntarily waive all or a portion of its management fee to the extent necessary for the fund to maintain a zero or positive net yield. Any amounts waived under this voluntary agreement are not subject to repayment by the fund. Price Associates may amend or terminate this voluntary waiver at any time without prior notice. For the year ended February 28, 2011, the total management fees waived were $366,000.
In addition, the fund has entered into service agreements with Price Associates and two wholly owned subsidiaries of Price Associates (collectively, Price). Price Associates computes the daily share price and provides certain other administrative services to the fund. T. Rowe Price Services, Inc., provides shareholder and administrative services in its capacity as the fund’s transfer and dividend disbursing agent. T. Rowe Price Retirement Plan Services, Inc., provides subaccounting and recordkeeping services for certain retirement accounts invested in the fund. For the year ended February 28, 2011, expenses incurred pursuant to these service agreements were $87,000 for Price Associates; $44,000 for T. Rowe Price Services, Inc.; and less than $1,000 for T. Rowe Price Retirement Plan Services, Inc. The total amount payable at period-end pursuant to these service agreements is reflected as Due to Affiliates in the accompanying financial statements.
As of February 28, 2011, T. Rowe Price Group, Inc., and/or its wholly owned subsidiaries owned 14,730,902 shares of the fund, representing 10% of the fund’s net assets.
| REPORT OF INDEPENDENT REGISTERED PUBLIC ACCOUNTING FIRM |
To the Board of Trustees of T. Rowe Price State Tax-Free Income Trust and
Shareholders of Maryland Tax-Free Money Fund
In our opinion, the accompanying statement of assets and liabilities, including the portfolio of investments, and the related statements of operations and of changes in net assets and the financial highlights present fairly, in all material respects, the financial position of Maryland Tax-Free Money Fund (one of the portfolios comprising T. Rowe Price State Tax-Free Income Trust, hereafter referred to as the “Fund”) at February 28, 2011, the results of its operations for the year then ended, the changes in its net assets for each of the two years in the period then ended and the financial highlights for each of the five years in the period then ended, in conformity with accounting principles generally accepted in the United States of America. These financial statements and financial highlights (hereafter referred to as “financial statements”) are the responsibility of the Fund’s management; our responsibility is to express an opinion on these financial statements based on our audits. We conducted our audits of these financial statements in accordance with the standards of the Public Company Accounting Oversight Board (United States). Those standards require that we plan and perform the audit to obtain reasonable assurance about whether the financial statements are free of material misstatement. An audit includes examining, on a test basis, evidence supporting the amounts and disclosures in the financial statements, assessing the accounting principles used and significant estimates made by management, and evaluating the overall financial statement presentation. We believe that our audits, which included confirmation of securities at February 28, 2011 by correspondence with the custodian and brokers, provide a reasonable basis for our opinion.
PricewaterhouseCoopers LLP
Baltimore, Maryland
April 15, 2011
| TAX INFORMATION (UNAUDITED) FOR THE TAX YEAR ENDED 2/28/11 |
We are providing this information as required by the Internal Revenue Code. The amounts shown may differ from those elsewhere in this report because of differences between tax and financial reporting requirements.
The fund’s distributions to shareholders included $16,000 which qualified as exempt-interest dividends.
| INFORMATION ON PROXY VOTING POLICIES, PROCEDURES, AND RECORDS |
A description of the policies and procedures used by T. Rowe Price funds and portfolios to determine how to vote proxies relating to portfolio securities is available in each fund’s Statement of Additional Information, which you may request by calling 1-800-225-5132 or by accessing the SEC’s website, sec.gov. The description of our proxy voting policies and procedures is also available on our website, troweprice.com. To access it, click on the words “Our Company” at the top of our corporate homepage. Then, when the next page appears, click on the words “Proxy Voting Policies” on the left side of the page.
Each fund’s most recent annual proxy voting record is available on our website and through the SEC’s website. To access it through our website, follow the directions above, then click on the words “Proxy Voting Records” on the right side of the Proxy Voting Policies page.
| HOW TO OBTAIN QUARTERLY PORTFOLIO HOLDINGS |
The fund files a complete schedule of portfolio holdings with the Securities and Exchange Commission for the first and third quarters of each fiscal year on Form N-Q. The fund’s Form N-Q is available electronically on the SEC’s website (sec.gov); hard copies may be reviewed and copied at the SEC’s Public Reference Room, 450 Fifth St. N.W., Washington, DC 20549. For more information on the Public Reference Room, call 1-800-SEC-0330.
| ABOUT THE FUND’S TRUSTEES AND OFFICERS |
Your fund is overseen by a Board of Trustees (Board) that meets regularly to review a wide variety of matters affecting the fund, including performance, investment programs, compliance matters, advisory fees and expenses, service providers, and other business affairs. The Board elects the fund’s officers, who are listed in the final table. At least 75% of the Board’s members are independent of T. Rowe Price Associates, Inc. (T. Rowe Price), and T. Rowe Price International Ltd (T. Rowe Price International); “inside” or “interested” trustees are employees or officers of T. Rowe Price. The business address of each trustee and officer is 100 East Pratt Street, Baltimore, Maryland 21202. The Statement of Additional Information includes additional information about the fund trustees and is available without charge by calling a T. Rowe Price representative at 1-800-225-5132.
| Independent Trustees | |
| |
| Name | |
| (Year of Birth) | Principal Occupation(s) and Directorships of Public Companies and |
| Year Elected* | Other Investment Companies During the Past Five Years |
| | |
| William R. Brody | President and Trustee, Salk Institute for Biological Studies (2009 |
| (1944) | to present); Director, Novartis, Inc. (2009 to present); Director, IBM |
| 2009 | (2007 to present); President and Trustee, Johns Hopkins University |
| | (1996 to 2009); Chairman of Executive Committee and Trustee, |
| | Johns Hopkins Health System (1996 to 2009) |
| | |
| Jeremiah E. Casey | Retired |
| (1940) | |
| 2006 | |
| | |
| Anthony W. Deering | Chairman, Exeter Capital, LLC, a private investment firm (2004 |
| (1945) | to present); Director, Under Armour (2008 to present); Director, |
| 1986 | Vornado Real Estate Investment Trust (2004 to present); Director, |
| | Mercantile Bankshares (2002 to 2007); Member, Advisory Board, |
| | Deutsche Bank North America (2004 to present) |
| | |
| Donald W. Dick, Jr. | Principal, EuroCapital Partners, LLC, an acquisition and management |
| (1943) | advisory firm (1995 to present) |
| 2001 | |
| | |
| Karen N. Horn | Senior Managing Director, Brock Capital Group, an advisory and |
| (1943) | investment banking firm (2004 to present); Director, Eli Lilly and |
| 2003 | Company (1987 to present); Director, Simon Property Group (2004 |
| | to present); Director, Norfolk Southern (2008 to present); Director, |
| | Fannie Mae (2006 to 2008) |
| | |
| Theo C. Rodgers | President, A&R Development Corporation (1977 to present) |
| (1941) | |
| 2005 | |
| | |
| John G. Schreiber | Owner/President, Centaur Capital Partners, Inc., a real estate |
| (1946) | investment company (1991 to present); Cofounder and Partner, |
| 1992 | Blackstone Real Estate Advisors, L.P. (1992 to present); Director, |
| | General Growth Properties, Inc. (2010 to present) |
| | |
| Mark R. Tercek | President and Chief Executive Officer, The Nature Conservancy |
| (1957) | (2008 to present); Managing Director, The Goldman Sachs Group, |
| 2009 | Inc. (1984 to 2008) |
| |
| *Each independent trustee oversees 128 T. Rowe Price portfolios and serves until retirement, |
| resignation, or election of a successor. |
| Inside Trustees | |
| |
| Name | |
| (Year of Birth) | |
| Year Elected* | |
| [Number of T. Rowe Price | Principal Occupation(s) and Directorships of Public Companies and |
| Portfolios Overseen] | Other Investment Companies During the Past Five Years |
| | |
| Edward C. Bernard | Director and Vice President, T. Rowe Price; Vice Chairman of the |
| (1956) | Board, Director, and Vice President, T. Rowe Price Group, Inc.; |
| 2006 | Chairman of the Board, Director, and President, T. Rowe Price |
| [128] | Investment Services, Inc.; Chairman of the Board and Director, |
| | T. Rowe Price Retirement Plan Services, Inc., T. Rowe Price |
| | Savings Bank, and T. Rowe Price Services, Inc.; Director and |
| | Chief Executive Officer, T. Rowe Price International; Chief Executive |
| | Officer, Chairman of the Board, Director, and President, T. Rowe |
| | Price Trust Company; Chairman of the Board, all funds |
| | |
| Michael C. Gitlin | Director of Fixed Income, T. Rowe Price (2009 to present); Global |
| (1970) | Head of Trading, T. Rowe Price (2007 to 2009); Vice President, Price |
| 2010 | Hong Kong, Price Singapore, T. Rowe Price, T. Rowe Price Group, Inc., |
| [39] | and T. Rowe Price International; formerly Head of U.S. Equity Sales, |
| | Citigroup Global Markets (2005 to 2007) |
| |
| *Each inside trustee serves until retirement, resignation, or election of a successor. |
| Officers | |
| |
| Name (Year of Birth) | |
| Position Held With State Tax-Free Income Trust | Principal Occupation(s) |
| | |
| Jonathan M. Chirunga (1966) | Vice President, T. Rowe Price and T. Rowe Price |
| Vice President | Group, Inc. |
| | |
| M. Helena Condez (1962) | Vice President, T. Rowe Price |
| Assistant Vice President | |
| | |
| Patricia S. Deford (1957) | Vice President, T. Rowe Price and T. Rowe Price |
| Vice President | Group, Inc. |
| | |
| G. Richard Dent (1960) | Vice President, T. Rowe Price and T. Rowe Price |
| Vice President | Group, Inc. |
| | |
| Charles E. Emrich (1961) | Vice President, T. Rowe Price |
| Vice President | |
| | |
| Roger L. Fiery III, CPA (1959) | Vice President, Price Hong Kong, Price |
| Vice President | Singapore, T. Rowe Price, T. Rowe Price Group, |
| | Inc., T. Rowe Price International, and T. Rowe |
| | Price Trust Company |
| | |
| Kathryn A. Floyd (1982) | Vice President, T. Rowe Price and T. Rowe Price |
| Vice President | Group, Inc. |
| | |
| John R. Gilner (1961) | Chief Compliance Officer and Vice President, |
| Chief Compliance Officer | T. Rowe Price; Vice President, T. Rowe Price |
| | Group, Inc., and T. Rowe Price Investment |
| | Services, Inc. |
| | |
| Gregory S. Golczewski (1966) | Vice President, T. Rowe Price and T. Rowe Price |
| Vice President | Trust Company |
| | |
| Charles B. Hill, CFA (1961) | Vice President, T. Rowe Price and T. Rowe Price |
| Executive Vice President | Group, Inc. |
| | |
| Gregory K. Hinkle, CPA (1958) | Vice President, T. Rowe Price, T. Rowe Price |
| Treasurer | Group, Inc., and T. Rowe Price Trust Company; |
| | formerly Partner, PricewaterhouseCoopers LLP |
| | (to 2007) |
| | |
| Marcy M. Lash (1963) | Vice President, T. Rowe Price and T. Rowe Price |
| Vice President | Group, Inc. |
| | |
| Alan D. Levenson, Ph.D. (1958) | Vice President, T. Rowe Price and T. Rowe Price |
| Vice President | Group, Inc. |
| | |
| Patricia B. Lippert (1953) | Assistant Vice President, T. Rowe Price and |
| Secretary | T. Rowe Price Investment Services, Inc. |
| | |
| Joseph K. Lynagh, CFA (1958) | Vice President, T. Rowe Price, T. Rowe Price |
| Executive Vice President | Group, Inc., and T. Rowe Price Trust Company |
| | |
| Konstantine B. Mallas (1963) | Vice President, T. Rowe Price and T. Rowe Price |
| Executive Vice President | Group, Inc. |
| | |
| Hugh D. McGuirk, CFA (1960) | Vice President, T. Rowe Price and T. Rowe Price |
| President | Group, Inc. |
| | |
| Linda A. Murphy (1959) | Vice President, T. Rowe Price and T. Rowe Price |
| Vice President | Group, Inc. |
| | |
| David Oestreicher (1967) | Director and Vice President, T. Rowe Price |
| Vice President | Investment Services, Inc., T. Rowe Price |
| | Trust Company, and T. Rowe Price Services, |
| | Inc.; Vice President, Price Hong Kong, Price |
| | Singapore, T. Rowe Price, T. Rowe Price Group, |
| | Inc., T. Rowe Price International, and T. Rowe |
| | Price Retirement Plan Services, Inc. |
| | |
| Deborah D. Seidel (1962) | Vice President, T. Rowe Price, T. Rowe Price |
| Vice President | Group, Inc., and T. Rowe Price Investment |
| | Services, Inc.; Vice President and Assistant |
| | Treasurer, T. Rowe Price Services, Inc., and |
| | T. Rowe Price Retirement Plan Services, Inc. |
| | |
| Chen Shao (1980) | Employee, T. Rowe Price; formerly Junior |
| Assistant Vice President | Accountant, News America Corporation |
| | |
| Timothy G. Taylor, CFA (1975) | Vice President, T. Rowe Price |
| Vice President | |
| | |
| Julie L. Waples (1970) | Vice President, T. Rowe Price |
| Vice President | |
| |
| Unless otherwise noted, officers have been employees of T. Rowe Price or T. Rowe Price |
| International for at least 5 years. | |
Item 2. Code of Ethics.
The registrant has adopted a code of ethics, as defined in Item 2 of Form N-CSR, applicable to its principal executive officer, principal financial officer, principal accounting officer or controller, or persons performing similar functions. A copy of this code of ethics is filed as an exhibit to this Form N-CSR. No substantive amendments were approved or waivers were granted to this code of ethics during the period covered by this report.
Item 3. Audit Committee Financial Expert.
The registrant’s Board of Directors/Trustees has determined that Mr. Anthony W. Deering qualifies as an audit committee financial expert, as defined in Item 3 of Form N-CSR. Mr. Deering is considered independent for purposes of Item 3 of Form N-CSR.
Item 4. Principal Accountant Fees and Services.
(a) – (d) Aggregate fees billed to the registrant for the last two fiscal years for professional services rendered by the registrant’s principal accountant were as follows:
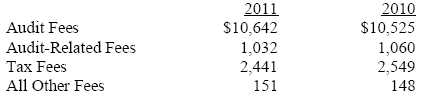
Audit fees include amounts related to the audit of the registrant’s annual financial statements and services normally provided by the accountant in connection with statutory and regulatory filings. Audit-related fees include amounts reasonably related to the performance of the audit of the registrant’s financial statements and specifically include the issuance of a report on internal controls and, if applicable, agreed-upon procedures related to fund acquisitions. Tax fees include amounts related to services for tax compliance, tax planning, and tax advice. The nature of these services specifically includes the review of distribution calculations and the preparation of Federal, state, and excise tax returns. All other fees include the registrant’s pro-rata share of amounts for agreed-upon procedures in conjunction with service contract approvals by the registrant’s Board of Directors/Trustees.
(e)(1) The registrant’s audit committee has adopted a policy whereby audit and non-audit services performed by the registrant’s principal accountant for the registrant, its investment adviser, and any entity controlling, controlled by, or under common control with the investment adviser that provides ongoing services to the registrant require pre-approval in advance at regularly scheduled audit committee meetings. If such a service is required between regularly scheduled audit committee meetings, pre-approval may be authorized by one audit committee member with ratification at the next scheduled audit committee meeting. Waiver of pre-approval for audit or non-audit services requiring fees of a de minimis amount is not permitted.
(2) No services included in (b) – (d) above were approved pursuant to paragraph (c)(7)(i)(C) of Rule 2-01 of Regulation S-X.
(f) Less than 50 percent of the hours expended on the principal accountant’s engagement to audit the registrant’s financial statements for the most recent fiscal year were attributed to work performed by persons other than the principal accountant’s full-time, permanent employees.
(g) The aggregate fees billed for the most recent fiscal year and the preceding fiscal year by the registrant’s principal accountant for non-audit services rendered to the registrant, its investment adviser, and any entity controlling, controlled by, or under common control with the investment adviser that provides ongoing services to the registrant were $1,583,000 and $1,879,000, respectively.
(h) All non-audit services rendered in (g) above were pre-approved by the registrant’s audit committee. Accordingly, these services were considered by the registrant’s audit committee in maintaining the principal accountant’s independence.
Item 5. Audit Committee of Listed Registrants.
Not applicable.
Item 6. Investments.
(a) Not applicable. The complete schedule of investments is included in Item 1 of this Form N-CSR.
(b) Not applicable.
Item 7. Disclosure of Proxy Voting Policies and Procedures for Closed-End Management Investment Companies.
Not applicable.
Item 8. Portfolio Managers of Closed-End Management Investment Companies.
Not applicable.
Item 9. Purchases of Equity Securities by Closed-End Management Investment Company and Affiliated Purchasers.
Not applicable.
Item 10. Submission of Matters to a Vote of Security Holders.
Not applicable.
Item 11. Controls and Procedures.
(a) The registrant’s principal executive officer and principal financial officer have evaluated the registrant’s disclosure controls and procedures within 90 days of this filing and have concluded that the registrant’s disclosure controls and procedures were effective, as of that date, in ensuring that information required to be disclosed by the registrant in this Form N-CSR was recorded, processed, summarized, and reported timely.
(b) The registrant’s principal executive officer and principal financial officer are aware of no change in the registrant’s internal control over financial reporting that occurred during the registrant’s second fiscal quarter covered by this report that has materially affected, or is reasonably likely to materially affect, the registrant’s internal control over financial reporting.
Item 12. Exhibits.
(a)(1) The registrant’s code of ethics pursuant to Item 2 of Form N-CSR is attached.
(2) Separate certifications by the registrant's principal executive officer and principal financial officer, pursuant to Section 302 of the Sarbanes-Oxley Act of 2002 and required by Rule 30a-2(a) under the Investment Company Act of 1940, are attached.
(3) Written solicitation to repurchase securities issued by closed-end companies: not applicable.
(b) A certification by the registrant's principal executive officer and principal financial officer, pursuant to Section 906 of the Sarbanes-Oxley Act of 2002 and required by Rule 30a-2(b) under the Investment Company Act of 1940, is attached.
| | |
SIGNATURES |
| |
| | Pursuant to the requirements of the Securities Exchange Act of 1934 and the Investment |
| Company Act of 1940, the registrant has duly caused this report to be signed on its behalf by the |
| undersigned, thereunto duly authorized. |
| |
| T. Rowe Price State Tax-Free Income Trust |
| |
| |
| |
| By | /s/ Edward C. Bernard |
| | Edward C. Bernard |
| | Principal Executive Officer |
| |
| Date | April 15, 2011 |
| |
| |
| |
| | Pursuant to the requirements of the Securities Exchange Act of 1934 and the Investment |
| Company Act of 1940, this report has been signed below by the following persons on behalf of |
| the registrant and in the capacities and on the dates indicated. |
| |
| |
| By | /s/ Edward C. Bernard |
| | Edward C. Bernard |
| | Principal Executive Officer |
| |
| Date | April 15, 2011 |
| |
| |
| |
| By | /s/ Gregory K. Hinkle |
| | Gregory K. Hinkle |
| | Principal Financial Officer |
| |
| Date | April 15, 2011 |