UNITED STATES
SECURITIES AND EXCHANGE COMMISSION
Washington, D.C. 20549
FORM N-CSR
CERTIFIED SHAREHOLDER REPORT OF REGISTERED
MANAGEMENT INVESTMENT COMPANIES
Investment Company Act File Number: 811-04521
| T. Rowe Price State Tax-Free Income Trust |
|
| (Exact name of registrant as specified in charter) |
| |
| 100 East Pratt Street, Baltimore, MD 21202 |
|
| (Address of principal executive offices) |
| |
| David Oestreicher |
| 100 East Pratt Street, Baltimore, MD 21202 |
|
| (Name and address of agent for service) |
Registrant’s telephone number, including area code: (410) 345-2000
Date of fiscal year end: February 28
Date of reporting period: February 28, 2014
Item 1. Report to Shareholders
| New York Tax-Free Bond Fund | February 28, 2014 |
The views and opinions in this report were current as of February 28, 2014. They are not guarantees of performance or investment results and should not be taken as investment advice. Investment decisions reflect a variety of factors, and the managers reserve the right to change their views about individual stocks, sectors, and the markets at any time. As a result, the views expressed should not be relied upon as a forecast of the fund’s future investment intent. The report is certified under the Sarbanes-Oxley Act, which requires mutual funds and other public companies to affirm that, to the best of their knowledge, the information in their financial reports is fairly and accurately stated in all material respects.
REPORTS ON THE WEB
Sign up for our E-mail Program, and you can begin to receive updated fund reports and prospectuses online rather than through the mail. Log in to your account at troweprice.com for more information.
Manager’s Letter
Fellow Shareholders
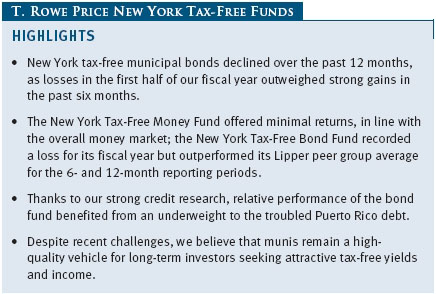
Tax-exempt bonds experienced a reprieve from heavy selling pressure, and new issuance volume declined in the past six months, allowing long-term interest rates to noticeably fall. New York tax-free municipal bonds benefited from this trend and posted good returns over the past six months, but 12-month returns were somewhat down due to losses incurred in the first half of our fiscal year. The New York Tax-Free Bond Fund outperformed its benchmark over the past six months, delivering a strong positive return; full-year absolute performance, though disappointing, also beat the benchmark and allowed the fund to build on its favorable relative performance. The New York Tax-Free Money Fund’s return was roughly flat due to the Federal Reserve’s highly accommodative monetary policy, which kept short-term interest rates near 0%.
MARKET ENVIRONMENT
Despite higher federal tax rates and spending cuts at the beginning of 2013, the U.S. economy grew at a moderate pace over the last 12 months. Gross domestic product expanded at a 4.1% annualized rate in the third quarter of 2013, the highest rate in about two years, and at a milder 2.4% rate in the fourth quarter, in part because of weaker-than-expected consumer spending. Still, steady job growth helped reduce the national unemployment rate to 6.7% in February. We anticipate that the U.S. economic recovery will strengthen in 2014, as last year’s fiscal policy headwinds subside and wage growth improves.
To support the recovery, the Federal Reserve purchased $45 billion in Treasuries and $40 billion in agency mortgage-backed securities every month in 2013 to suppress longer-term rates. In both January and February 2014, however, the Fed reduced the size of its monthly purchases by $10 billion. We anticipate that the Fed will announce similar reductions after future monetary policy meetings, with asset purchases likely to stop by the end of 2014. While Fed tapering may result in higher long-term interest rates, short-term rate increases seem unlikely until sometime in late 2015 or 2016.
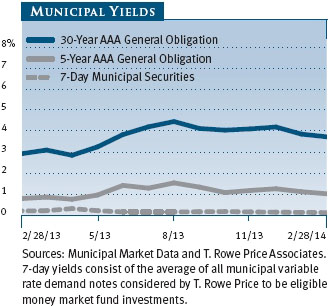
The Treasury and municipal yield curves steepened over the last year: Long-term yields increased as the taper approached, while short-term rates remained anchored by the Fed’s commitment to keep them low even after unemployment drops below 6.5%—assuming inflation remains contained. However, high-quality 30-year municipal yields rose more than the 30-year Treasury yield, which is unusual, and were slightly higher than the 30-year Treasury yield at the end of our reporting period. On a relative basis, this demonstrates the attractiveness of long-term tax-free bonds as an alternative for fixed income investors.
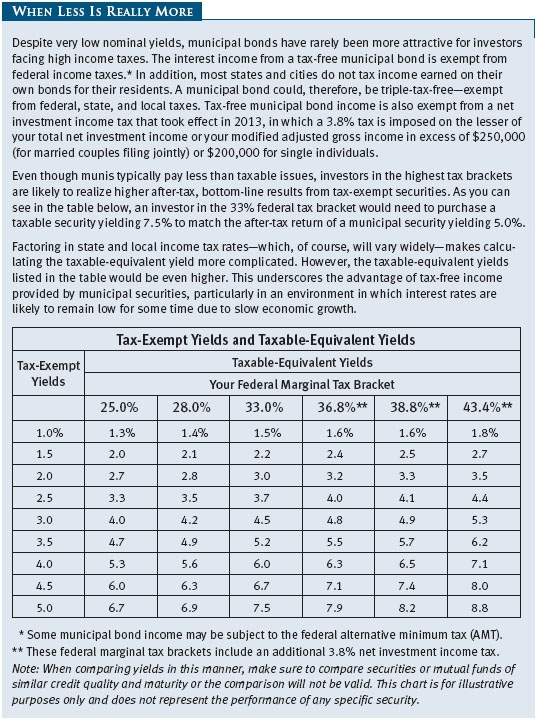
As of February 28, 2014, the 3.72% yield offered by a 30-year tax-free bond rated AAA was about 104% of the 3.58% pretax yield offered by a 30-year Treasury bond. An investor in the 28% federal tax bracket would need to invest in a taxable bond yielding about 5.17% to receive the same after-tax income. (To calculate a municipal bond’s taxable-equivalent yield, divide the municipal bond’s yield by the quantity of 1.00 minus your federal tax bracket expressed as a decimal—in this case, 1.00 – 0.28, or 0.72.)
MUNICIPAL MARKET NEWS
Full-year municipal issuance in 2013 totaled about $330 billion versus about $380 billion in 2012, according to The Bond Buyer, while issuance in the first two months of 2014 was lower than expected, at around $34 billion. Issuance since mid-2013 has been somewhat limited, as higher long-term interest rates discouraged municipalities from refinancing older debt. Outflows from the municipal market persisted throughout the second half of 2013, and rising rates and credit concerns in certain parts of the muni market restrained demand from individual investors during that period. These trends abated somewhat in the first two months of 2014, but a resumption of rising rates or cash flows out of municipal bond portfolios could weigh on the market.
Austerity-minded state and local government leaders remain conservative about adding to indebtedness, which we consider to be supportive of the municipal bond market. Indeed, most states have acted responsibly in the last few years by cutting spending and raising taxes and fees to close budget deficits. While state tax revenues are growing again, the increases have been slower and more uneven than in the past, and expense pressures continue. We believe that many states deserve high credit ratings and that state governments will be able to continue servicing their outstanding debts. However, we have longer-term concerns about some states’ willingness and ability to address sizable pension obligations and other retirement benefits.
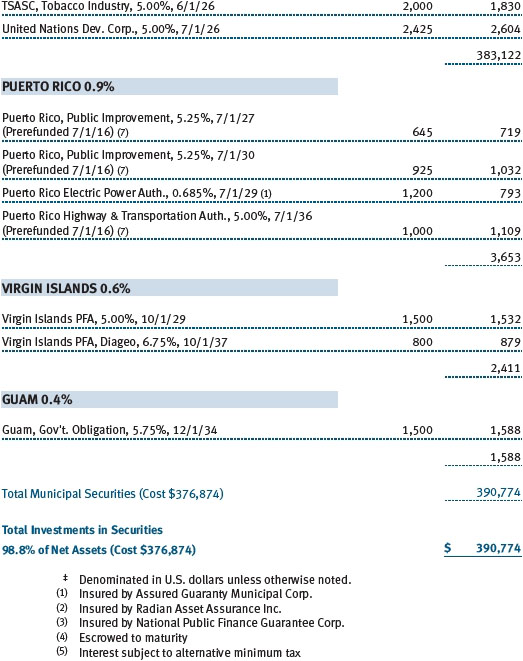
Detroit’s Chapter 9 bankruptcy case, while not an indicator of a systemic breakdown in municipal credit fundamentals, remains a concern for municipal investors. The judge in the case has ruled that the city is eligible for bankruptcy and that pension benefits—even though they are protected by the Michigan constitution—could be reduced through the federal bankruptcy process. The deteriorating fiscal situation in the Commonwealth of Puerto Rico—the three major credit rating agencies recently downgraded the territory’s debt to below investment grade—is still a risk to the broader muni market. Puerto Rico’s liabilities are large relative to the size of its economy, with close to $50 billion of municipal debt outstanding and over $70 billion of general indebtedness for the Commonwealth and its various governmental agencies. We continue to have very low exposure to Puerto Rico and would not be surprised if there are additional downgrades or if the Commonwealth seeks to restructure its debt in the next year or two. Puerto Rico’s $3.5 billion bond issuance in early March will provide some stability in the short run, but over the long term, the Commonwealth’s government will need to continue to make difficult decisions in order to improve its fiscal and economic profile.
In terms of sector performance, state and local general obligation bonds (GOs) were flat but held up better than revenue bonds over the last 12 months. We favor bonds backed by a dedicated revenue stream over GOs, with a bias toward transportation and utility bonds issued by these essential service providers. Among revenue bonds, special tax and power bonds were two of the worst performing sectors for the year due to weakness in Puerto Rican issues. Most remaining revenue segments were flat, but housing bonds outperformed with mild gains, helped by the residential real estate recovery.
NEW YORK MARKET NEWS
New York State general obligation debt is rated Aa2 by Moody’s Investors Service, while Standard & Poor’s and Fitch both rate the bonds AA. All three rating agencies maintain a positive outlook on the state’s GO rating.
New York’s employment growth exceeded that of the U.S. as a whole in 2013, although the statewide unemployment rate, at 7.1% in December 2013, was higher than the national rate (6.7% during the same period). Employment in New York City grew at a significantly higher rate in 2013 than in the U.S., but the city’s unemployment rate, at 8.1% in December 2013, continued to exceed state and national unemployment levels. The state’s 2012 per-capita personal income was 114% of the national average, ranking it fourth highest among the states. Still, we expect overall economic growth across the state to remain tepid.
The slowly recovering private sector has helped boost tax revenues and stabilize the state’s fiscal condition. Budgetary results for fiscal 2013 show a general fund balance of $1.6 billion, including $1.3 billion in “rainy day” reserves, which have been relatively stable for nearly a decade. The enacted budget for fiscal 2014 is balanced and consistent with the state’s financial plan laid out in 2013, including ongoing measures to control growth in school aid and Medicaid spending. The state expects to close fiscal 2014 with a $1.8 billion general fund balance.
According to Moody’s Investors Service 2013 State Debt Medians Report, New York is the second most heavily indebted state, with $62 billion of net tax-supported debt, ranking fifth among all states for debt per capita and sixth for debt as a percentage of personal income. Unlike many other states, however, New York’s pension funds are relatively well funded with an aggregate funded ratio of 89% as of April 1, 2013. New York’s other post-employment benefit (OPEB) liability is high at $67 billion and primarily reflects health benefits for retired state and State University of New York employees. This liability was completely unfunded as of fiscal year 2013. The majority of New York’s debt is appropriation-backed, which means that the legislature must approve debt service payments on these obligations annually, but it has no legal requirement to continue consenting to these expenses.
New York City continues to demonstrate solid fiscal management, making multiyear financial plans, and rolling forward budget surpluses from stronger years. Audited results for fiscal 2013 indicate that the city ended the year with a surplus of $6 billion (8.5% of revenues), which was rolled forward to help balance fiscal 2014 and fiscal 2015. Property taxes remain the city’s largest revenue source and act as a stabilizing factor given the city’s practice of phasing in tax assessments over five years. The magnitude of the city’s projected budget gaps between fiscal 2016 and fiscal 2018 declined from $5.5 billion as of June 2013 to $2.0 billion as of February 2014. Offsetting some of these strengths, the city’s long-term liabilities are quite high, and we see increased risk posed by potential retroactive pay associated with the city’s expired labor contracts. Per-capita debt was close to $4,900 in fiscal 2013. New York City’s pension plans were only 61% funded on an aggregate basis at the end of fiscal 2013. The net OPEB obligation was a substantial $93 billion at the end of fiscal 2013. This primarily reflects health benefits for retired city employees. Credit agency ratings for New York City are Aa2 from Moody’s, AA from S&P, and AA from Fitch, all with stable outlooks.
PORTFOLIO STRATEGIES
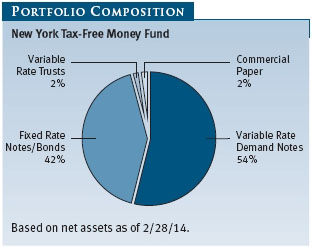
New York Tax-Free Money Fund
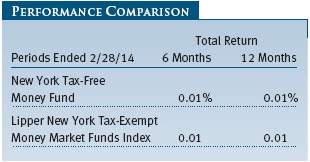
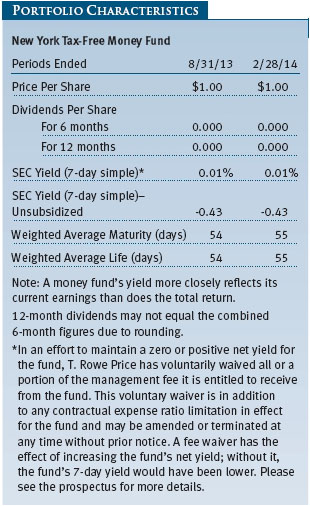
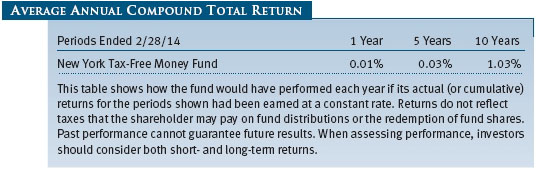
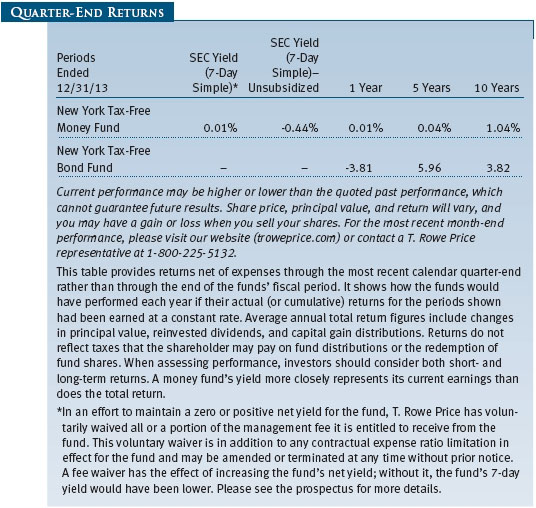
The New York Tax-Free Money Fund returned 0.01% for the 6- and 12-month periods ended February 28, 2014. The seven-day simple yield also remained very low and ended February at 0.01%. The fund’s long-term record relative to its competitors remained favorable. (Based on cumulative total return, Lipper ranked the New York Tax-Free Money Fund 11 of 51, 26 of 49, 34 of 48, and 19 of 36 New York tax-exempt money market funds for the 1-, 3-, 5-, and 10-year periods ended February 28, 2014, respectively. Past performance cannot guarantee future results.)
The Fed’s extraordinary regime of easy monetary policy, now more than five years old, has kept official short-term interest rates in the historically low range of 0.00% to 0.25%. And this zero interest rate policy continues to affect money fund investors most dramatically. While the Fed has begun to taper its monthly asset purchase program, money market rates remain immune from such changes in policy.
Over the past six months, yields in the municipal money market have moved lower. Rates range from two basis points (0.02%) for overnight maturities to 16 basis points (0.16%) for notes maturing in one year. The shape of the municipal money market yield curve changed little over the period, though rates have shifted lower by about two basis points across the curve.
The very low short-term rates continue to be driven by a supply/demand imbalance caused in part by the overall low level of interest rates. Low interest rates of the past few years have encouraged municipal issuers to borrow for longer periods to lock in favorable financing costs. In many cases, we have seen issuers refinance variable rate demand notes (VRDN) with much longer 10-, 20-, and even 30-year issues. This trend has resulted in a reduction of overall available supply in the short end of the yield curve. For example, in 2013, VRDN issuance declined 32%. The total amount of VRDNs outstanding fell about 39% since 2008 as new issue supply has not been sufficient to offset what was taken out of the market. Meanwhile, money market assets over the last year have remained somewhat stagnant—resulting in too much demand chasing too little supply.
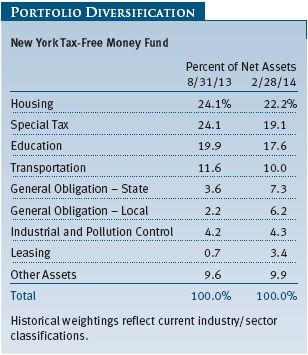
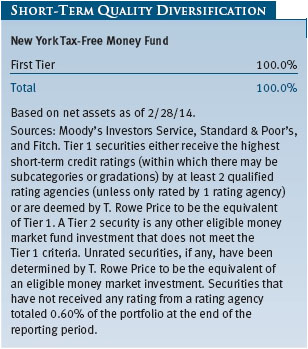
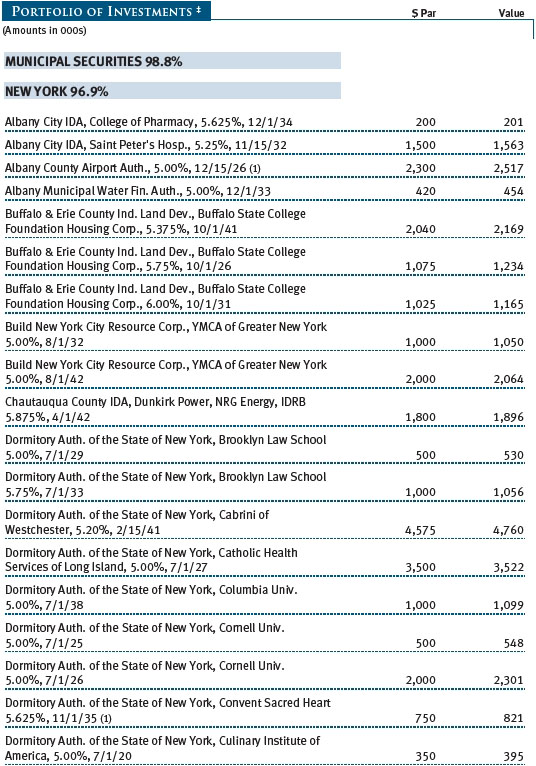
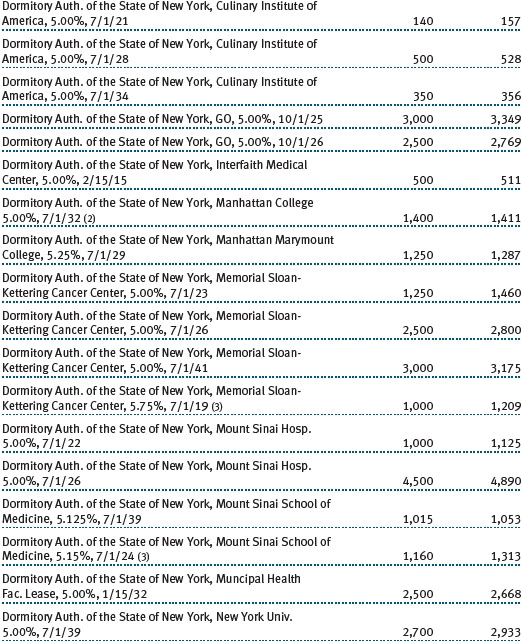
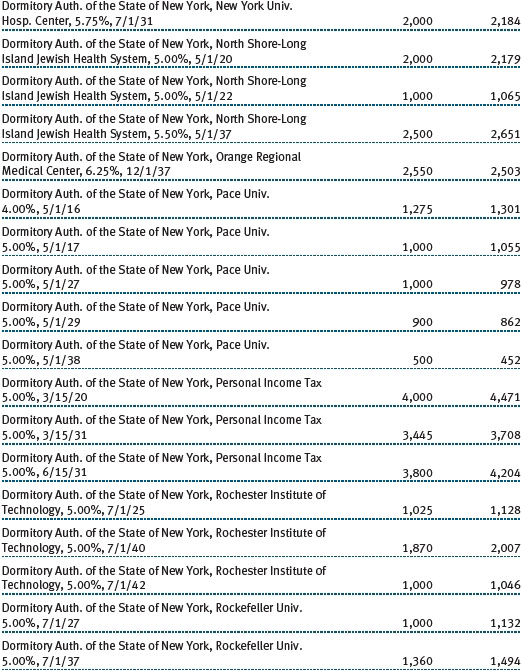
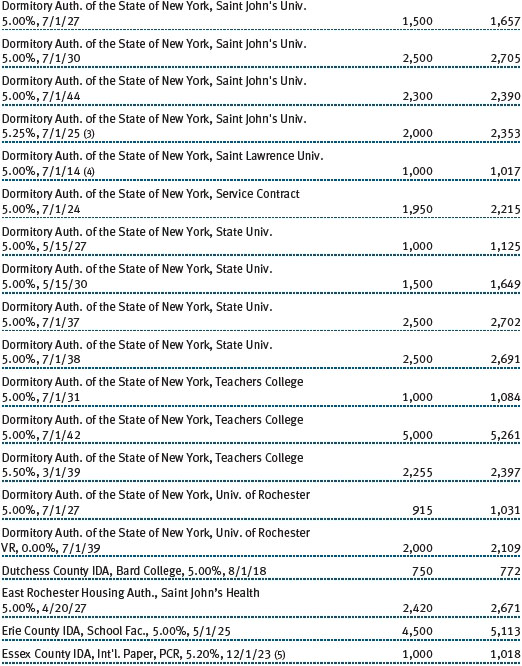
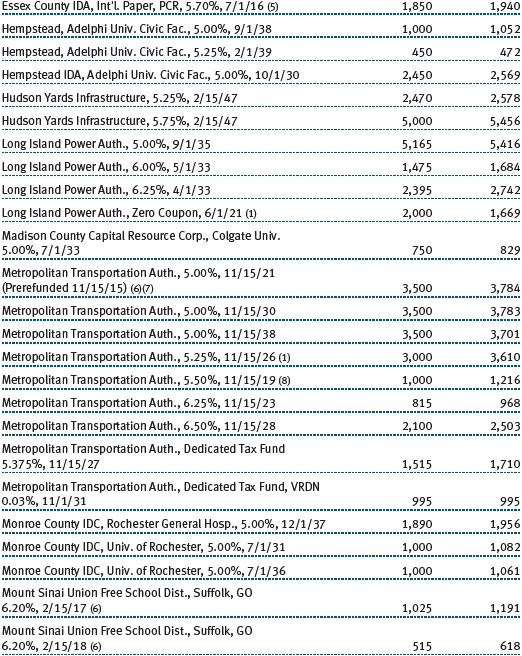
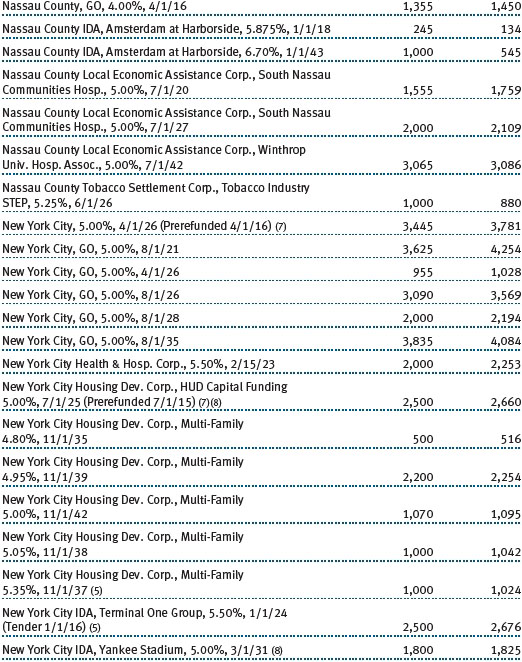
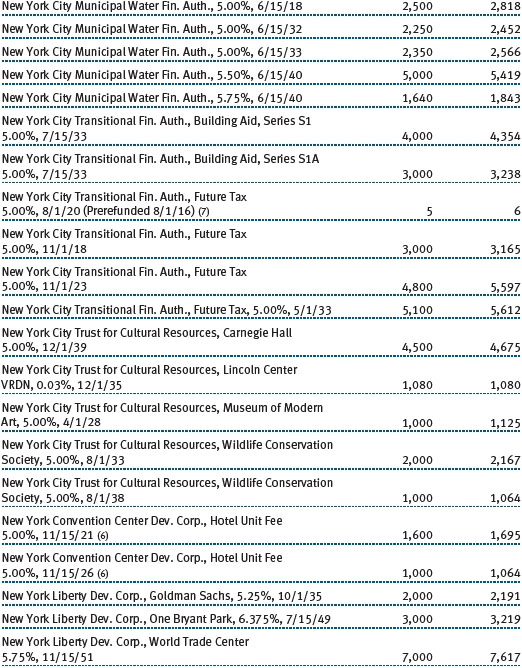
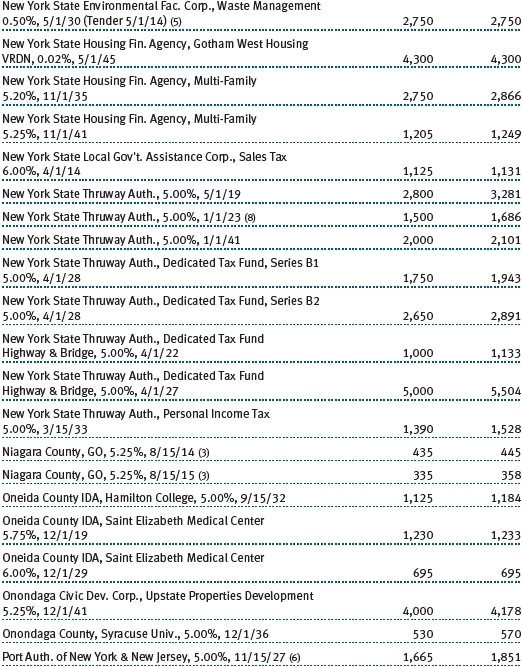
As always, credit quality plays a major role in the management of the fund. We favor guaranteed housing finance, debt backed by special tax revenue, higher education revenue, and transportation revenue debt. Some of the larger positions in the portfolio include New York City Housing, New York State Sales Tax Revenue, and Cornell University. We continue to favor prerefunded bonds (which are escrowed in U.S. Treasury debt) and prefer high-quality issuers able to provide self-liquidity. Where self-liquidity is not possible, we look to intermediaries such as Wells Fargo, Federal Home Loan Bank, and Federal National Mortgage Association to provide liquidity. (Please refer to the fund’s portfolio of investments for a complete list of our holdings and the amount each represents in the portfolio.)
While the Fed has started the process of removing its extraordinary monetary accommodations, yields in the money market are not expected to change significantly for quite some time. Our view is that the Fed will not begin actively increasing short-term interest rates until late 2015—at the earliest. Of course, Fed policy is subject to the ever-changing fortunes of the U.S. economy. But, given our outlook, we are comfortable maintaining a longer weighted average maturity range. Our current targeted WAM is 50 to 55 days. We remain committed to managing a high-quality, diversified portfolio. As always, our primary focus is on the liquidity and stability of principal, important to our shareholders.
New York Tax-Free Bond Fund
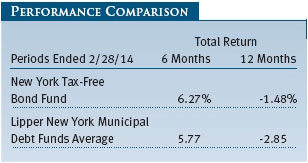
Your fund returned 6.27% and -1.48% for the 6- and 12-months period ended February 28, 2014, respectively, and outperformed its Lipper peer group average in both. The New York Tax-Free Bond Fund ranked in the top quintile for the past 1- and 10-year periods and compares favorably with its peers in other periods. (Based on cumulative total return, Lipper ranked the New York Tax-Free Bond Fund 19 of 98, 26 of 92, 31 of 81, and 14 of 71 among New York municipal debt funds for the 1-, 3-, 5-, and 10-year periods ended February 28, 2014, respectively. Past performance cannot guarantee future results.)
We have maintained our strategy of underweighting GO debt and overweighting revenue-backed bonds. New York State has been fiscally well managed. However, New York City faces budget challenges, due to pending contract renewals with numerous city employee unions. We continue to be highly selective in the local general obligation sector and believe the revenue sector offers better long-term total return potential.
In general, holdings with longer durations performed poorly over the past 12 months. Holdings that performed best, on the other hand, were mostly lower-quality, shorter-maturity bonds whose valuations were not dramatically affected by higher rates and whose higher yields cushioned principal losses. Although we decreased our exposure to the long-maturity end of the yield curve, we remain overweight to bonds with maturities of 15 years and longer. This reflects our conviction that the long-maturity end of the yield curve offers greater relative value. We have maintained an underweight to bonds maturing in three to 10 years where absolute yields are low and appear quite rich versus Treasuries with comparable maturities and taxable yields. While longer-term bonds carry greater interest rate risk, we believe shorter-maturity bonds may be prone to greater underperformance in the longer run.
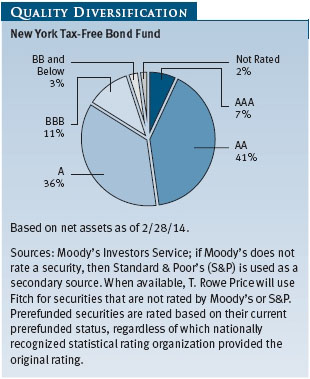
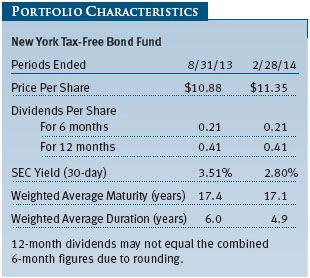
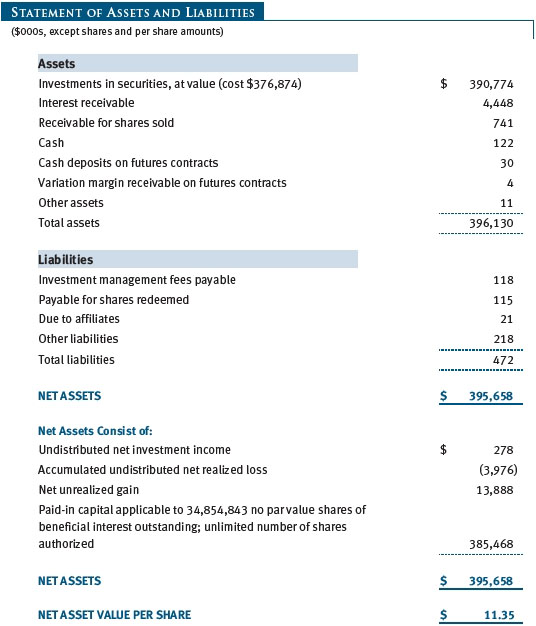
Over the past six months, we held the fund’s duration (a measure of the portfolio’s interest rate sensitivity) within a narrow range relative to the Barclays benchmark, reducing it to 4.9 years from 6.0 years. The fund’s weighted average maturity ended the period at 17.1 years, relatively unchanged since our August 31 report, but we have shortened it from one year ago. This reflects our outlook for higher rates as the U.S. economy gains traction and the Fed eventually begins raising rates to more normal levels. The fund remains a high-quality portfolio with 84% of holdings rated A or higher. Although the portfolio’s 30-day SEC yield declined with market rates to 2.80% at the end of February from 3.51% at the end of August 2013, its net asset value increased over the past six months to $11.35 per share from $10.80 per share.
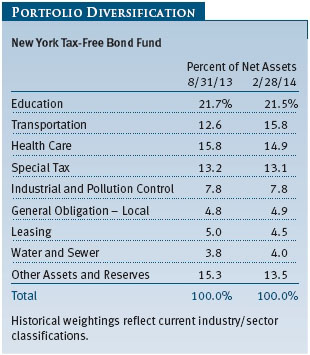
We shifted sector allocations slightly from a year ago. Education, which accounts for our largest sector allocation, was relatively unchanged. Since August, we increased exposure to the transportation sector by three percentage points. Recent purchases include the Port Authority of New York and New Jersey, and the New York State Thruway Authority. Health care is the third largest sector allocation and an overweight relative to our benchmark. Hospitals and life care issues offer compelling yields, and our strong credit research allows us to take advantage of the higher rates in these areas.
Shifts in the fund’s quality diversification were minimal since our last report. Our AA rated holdings increased by three percentage points over the past six months and continue to represent the largest portion of the portfolio. We continue to overweight A and BBB rated holdings relative to the index given our belief that they offer greater value than their higher-quality counterparts.
The fund’s negligible exposure to Puerto Rico as our fiscal year began was a boon to relative performance. Bonds from the Commonwealth are widely held because their income is tax exempt in all states and Puerto Rico-domiciled holdings significantly underperformed as the Commonwealth’s credit profile deteriorated. Aside from prerefunded securities, the fund holds only one position in Puerto Rico and the holding has the additional protection of bond insurance. Our strong research team guided us well once again.
OUTLOOK
The decline in municipal bond prices that we witnessed during 2013 has rattled some investors, but it does not represent a fundamental change in the nature, quality, or risk characteristics of the market. We continue to believe that it is a high-quality asset class, with good investment opportunities for those with a long-term focus. Municipals still offer investors attractive tax-free income—particularly those in the highest tax brackets—in what is still a very low interest rate environment. Long-term munis have attractive nominal and taxable-equivalent yields, but price declines are likely if market outflows resume and interest rates start rising sharply.
We have been concerned about the potential for rising rates for some time. Our interest rate strategy and economics teams regularly make forward-looking projections of rates and yield curves, and we incorporate these assessments in our investment strategies. Given the potential for rates to rise further, we will remain careful with any investment shift that might materially increase our portfolios’ interest rate sensitivity. However, we believe further rate increases will be more modest than what we have seen since the spring of 2013.
Irrespective of interest rate movements, the credit and economic environment for municipalities is starting to get better but could remain challenging. Modest economic growth and improving income and sales tax revenues are providing some support for state and local governments. Also, improvements in the health of the real estate market should translate into stabilizing property tax revenues for local governments.
State and local government liabilities, such as pension benefits and health care costs, are a growing long-term concern. While most municipal governments are maintaining balanced budgets, fewer municipalities have addressed these longer-term liabilities meaningfully. States will need to continue these efforts on their own, as a federal bailout of state and local governments without some losses to bondholders seems unlikely. As for Detroit, we continue to monitor the bankruptcy proceedings closely because there is the potential for adverse legal precedents to arise out of the case. Regarding Puerto Rico, our dedication to thorough, fundamental credit research has helped us minimize our exposure to this increasingly risky, yet significant, issuer of municipal bonds. Puerto Rico is working hard to turn its fiscal situation around, but significant challenges remain. Without a strong economic rebound, it seems likely that the territory will need to restructure its debt.
We believe T. Rowe Price’s strong credit research capabilities have been and will remain an asset for our investors. Even as interest rates return to more normal levels, municipal bonds will remain an important asset class, and we expect to continue finding good investment opportunities for long-term oriented, income-seeking investors. We continue to conduct thorough research and assign our own independent credit ratings before making investment decisions. As always, we are on the lookout for attractively valued bonds issued by municipalities with good long-term fundamentals—an investment strategy that we believe will continue to serve our long-term investors well.
Respectfully submitted,

Joseph K. Lynagh
Chairman of the Investment Advisory Committee
New York Tax-Free Money Fund
 Konstantine B. Mallas
Chairman of the Investment Advisory Committee
New York Tax-Free Bond FundMarch 14, 2014
The committee chairmen have day-to-day responsibility for managing the portfolios and work with committee members in developing and executing the funds’ investment programs.
Risks of Fixed Income Investing
Since money market funds are managed to maintain a constant $1.00 share price, there should be little risk of principal loss. However, there is no assurance the fund will avoid principal losses if fund holdings default or are downgraded or if interest rates rise sharply in an unusually short period. In addition, the fund’s yield will vary; it is not fixed for a specific period like the yield on a bank certificate of deposit. An investment in the fund is not insured or guaranteed by the Federal Deposit Insurance Corporation (FDIC) or any other government agency. Although a money market fund seeks to preserve the value of your investment at $1.00 per share, it is possible to lose money by investing in it. Bonds are subject to interest rate risk (the decline in bond prices that usually accompanies a rise in interest rates) and credit risk (the chance that any fund holding could have its credit rating downgraded or that a bond issuer will default by failing to make timely payments of interest or principal), potentially reducing the fund’s income level and share price.
Glossary
Barclays Municipal Bond Index: A broadly diversified index of tax-exempt bonds.
Basis point: One one-hundredth of one percentage point, or 0.01%.
Duration: A measure of a bond fund’s sensitivity to changes in interest rates. For example, a fund with a duration of five years would fall about 5% in price in response to a one-percentage-point rise in interest rates, and vice versa.
General obligation debt: A government’s strongest pledge that obligates its full faith and credit, including, if necessary, its ability to raise taxes.
Gross domestic product: The total market value of all goods and services produced in a country in a given year.
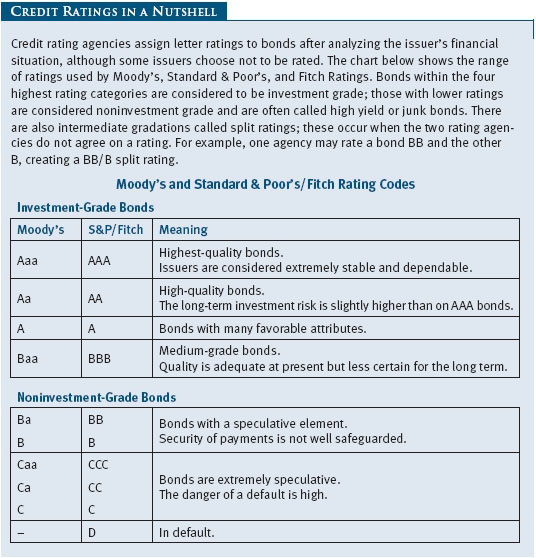
Investment grade: High-quality bonds as measured by one of the major credit rating agencies. For example, Standard & Poor’s designates the bonds in its top four categories (AAA to BBB) as investment grade.
Lipper averages: The averages of available mutual fund performance returns for specified time periods in categories defined by Lipper Inc.
Other post-employment benefits (OPEB): Benefits paid to an employee after retirement such as premiums for life and health insurance.
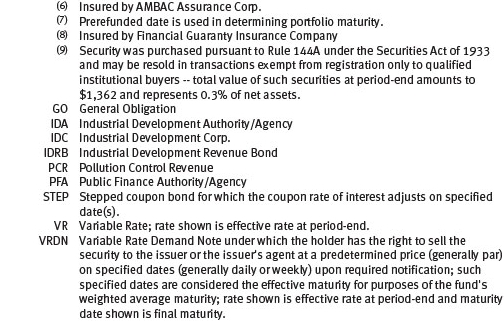
Prerefunded bond: A bond that originally may have been issued as a general obligation or revenue bond but that is now secured by an escrow fund consisting entirely of direct U.S. government obligations that are sufficient for paying the bondholders.
Revenue (or revenue-backed) bond: A bond issued to fund specific projects, such as airports, bridges, hospitals, and toll roads, where a portion of the revenue generated is used to service the interest payments on the bond.
SEC yield (7-day simple): A method of calculating a money fund’s yield by annualizing the fund’s net investment income for the last seven days of each period divided by the fund’s net asset value at the end of the period. Yield will vary and is not guaranteed.
SEC yield (30-day): A method of calculating a fund’s yield that assumes all securities are held until maturity. Yield will vary and is not guaranteed.
Self-liquidity: With regard to variable rate bonds, an issuer or intermediary agrees to buy back bonds with its own funds that have been surrendered, but not yet resold, without going through a third-party liquidity provider.
Variable rate demand note (VRDN): Generally, a debt security that requires the issued to redeem at the holder’s discretion on a specified date or dates prior to maturity. Upon redemption, the issuer pays par to the holder who loses future coupon payments that might otherwise be due. The VRDN might be especially attractive at times of rising rates, to protect against interest rate risk by redeeming at par value, and reinvesting proceeds in a new bond.
Weighted average life: A measure of a fund’s credit quality risk. In general, the longer the average life, the greater the fund’s credit quality risk. The average life is the dollar-weighted average maturity of a portfolio’s individual securities without taking into account interest rate readjustment dates. Money funds must maintain a weighted average life of less than 120 days.
Weighted average maturity (WAM): A measure of a fund’s interest rate sensitivity. In general, the longer the average maturity, the greater the fund’s sensitivity to interest rate changes. The weighted average maturity may take into account the interest rate readjustment dates for certain securities. Money funds must maintain a weighted average maturity of less than 60 days.
Yield curve: A graph depicting the relationship between yields and maturity dates for a set of similar securities. These curves are in constant flux. One of the key activities in managing any fixed income portfolio is to study the trends reflected by yield curves.
Performance and Expenses
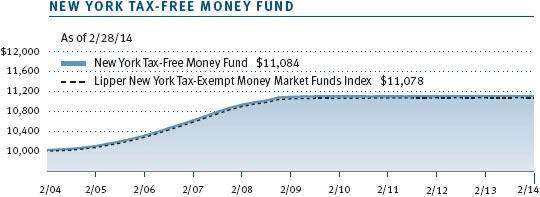
This chart shows the value of a hypothetical $10,000 investment in the fund over the past 10 fiscal year periods or since inception (for funds lacking 10-year records). The result is compared with benchmarks, which may include a broad-based market index and a peer group average or index. Market indexes do not include expenses, which are deducted from fund returns as well as mutual fund averages and indexes.
This chart shows the value of a hypothetical $10,000 investment in the fund over the past 10 fiscal year periods or since inception (for funds lacking 10-year records). The result is compared with benchmarks, which may include a broad-based market index and a peer group average or index. Market indexes do not include expenses, which are deducted from fund returns as well as mutual fund averages and indexes.


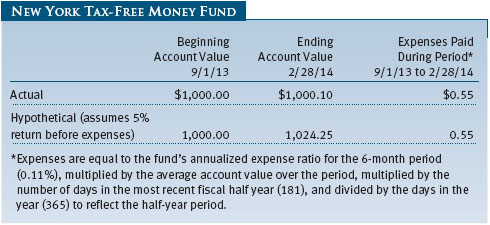
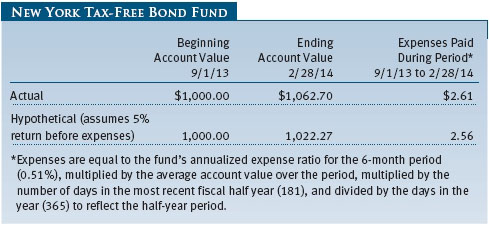
As a mutual fund shareholder, you may incur two types of costs: (1) transaction costs, such as redemption fees or sales loads, and (2) ongoing costs, including management fees, distribution and service (12b-1) fees, and other fund expenses. The following example is intended to help you understand your ongoing costs (in dollars) of investing in the fund and to compare these costs with the ongoing costs of investing in other mutual funds. The example is based on an investment of $1,000 invested at the beginning of the most recent six-month period and held for the entire period.
Actual Expenses
The first line of the following table (Actual) provides information about actual account values and expenses based on the fund’s actual returns. You may use the information on this line, together with your account balance, to estimate the expenses that you paid over the period. Simply divide your account value by $1,000 (for example, an $8,600 account value divided by $1,000 = 8.6), then multiply the result by the number on the first line under the heading “Expenses Paid During Period” to estimate the expenses you paid on your account during this period.
Hypothetical Example for Comparison Purposes
The information on the second line of the table (Hypothetical) is based on hypothetical account values and expenses derived from the fund’s actual expense ratio and an assumed 5% per year rate of return before expenses (not the fund’s actual return). You may compare the ongoing costs of investing in the fund with other funds by contrasting this 5% hypothetical example and the 5% hypothetical examples that appear in the shareholder reports of the other funds. The hypothetical account values and expenses may not be used to estimate the actual ending account balance or expenses you paid for the period.
Note: T. Rowe Price charges an annual account service fee of $20, generally for accounts with less than $10,000. The fee is waived for any investor whose T. Rowe Price mutual fund accounts total $50,000 or more; accounts electing to receive electronic delivery of account statements, transaction confirmations, prospectuses, and shareholder reports; or accounts of an investor who is a T. Rowe Price Preferred Services, Personal Services, or Enhanced Personal Services client (enrollment in these programs generally requires T. Rowe Price assets of at least $100,000). This fee is not included in the accompanying table. If you are subject to the fee, keep it in mind when you are estimating the ongoing expenses of investing in the fund and when comparing the expenses of this fund with other funds.
You should also be aware that the expenses shown in the table highlight only your ongoing costs and do not reflect any transaction costs, such as redemption fees or sales loads. Therefore, the second line of the table is useful in comparing ongoing costs only and will not help you determine the relative total costs of owning different funds. To the extent a fund charges transaction costs, however, the total cost of owning that fund is higher.
The accompanying notes are an integral part of these financial statements.

The accompanying notes are an integral part of these financial statements.
The accompanying notes are an integral part of these financial statements.
The accompanying notes are an integral part of these financial statements.

The accompanying notes are an integral part of these financial statements.
| Notes to Financial Statements |
T. Rowe Price State Tax-Free Income Trust (the trust), is registered under the Investment Company Act of 1940 (the 1940 Act). The New York Tax-Free Bond Fund (the fund) is a nondiversified, open-end management investment company established by the trust. The fund commenced operations on August 28, 1986. The fund seeks to provide, consistent with prudent portfolio management, the highest level of income exempt from federal, New York state, and New York City income taxes by investing primarily in investment-grade New York municipal bonds.
NOTE 1 - SIGNIFICANT ACCOUNTING POLICIES
Basis of Preparation The fund is an investment company and follows accounting and reporting guidance in the Financial Accounting Standards Board Accounting Standards Codification Topic 946 (ASC 946). The accompanying financial statements were prepared in accordance with accounting principles generally accepted in the United States of America (GAAP), including but not limited to ASC 946. GAAP requires the use of estimates made by management. Management believes that estimates and valuations are appropriate; however, actual results may differ from those estimates, and the valuations reflected in the accompanying financial statements may differ from the value ultimately realized upon sale or maturity.
Investment Transactions, Investment Income, and Distributions Income and expenses are recorded on the accrual basis. Premiums and discounts on debt securities are amortized for financial reporting purposes. Income tax-related interest and penalties, if incurred, would be recorded as income tax expense. Investment transactions are accounted for on the trade date. Realized gains and losses are reported on the identified cost basis. Distributions to shareholders are recorded on the ex-dividend date. Income distributions are declared daily and paid monthly. Capital gain distributions, if any, are generally declared and paid by the fund annually.
Credits The fund earns credits on temporarily uninvested cash balances held at the custodian, which reduce the fund’s custody charges. Custody expense in the accompanying financial statements is presented before reduction for credits.
New Accounting Guidance On March 1, 2013, the fund adopted new accounting guidance, issued by the Financial Accounting Standards Board, that requires an entity to disclose information about offsetting and related arrangements to enable users of its financial statements to understand the effect of those arrangements on its financial position. Adoption had no effect on the fund’s net assets or results of operations.
NOTE 2 - VALUATION
The fund’s financial instruments are valued, and its net asset value (NAV) per share is computed at the close of the New York Stock Exchange (NYSE), normally 4 p.m. ET, each day the NYSE is open for business.
Fair Value The fund’s financial instruments are reported at fair value, which GAAP defines as the price that would be received to sell an asset or paid to transfer a liability in an orderly transaction between market participants at the measurement date. The T. Rowe Price Valuation Committee (the Valuation Committee) has been established by the fund’s Board of Trustees (the Board) to ensure that financial instruments are appropriately priced at fair value in accordance with GAAP and the 1940 Act. Subject to oversight by the Board, the Valuation Committee develops and oversees pricing-related policies and procedures and approves all fair value determinations. Specifically, the Valuation Committee establishes procedures to value securities; determines pricing techniques, sources, and persons eligible to effect fair value pricing actions; oversees the selection, services, and performance of pricing vendors; oversees valuation-related business continuity practices; and provides guidance on internal controls and valuation-related matters. The Valuation Committee reports to the fund’s Board; is chaired by the fund’s treasurer; and has representation from legal, portfolio management and trading, operations, and risk management.
Various valuation techniques and inputs are used to determine the fair value of financial instruments. GAAP establishes the following fair value hierarchy that categorizes the inputs used to measure fair value:
Level 1 – quoted prices (unadjusted) in active markets for identical financial instruments that the fund can access at the reporting date
Level 2 – inputs other than Level 1 quoted prices that are observable, either directly or indirectly (including, but not limited to, quoted prices for similar financial instruments in active markets, quoted prices for identical or similar financial instruments in inactive markets, interest rates and yield curves, implied volatilities, and credit spreads)
Level 3 – unobservable inputs
Observable inputs are developed using market data, such as publicly available information about actual events or transactions, and reflect the assumptions that market participants would use to price the financial instrument. Unobservable inputs are those for which market data are not available and are developed using the best information available about the assumptions that market participants would use to price the financial instrument. GAAP requires valuation techniques to maximize the use of relevant observable inputs and minimize the use of unobservable inputs. When multiple inputs are used to derive fair value, the financial instrument is assigned to the level within the fair value hierarchy based on the lowest-level input that is significant to the fair value of the financial instrument. Input levels are not necessarily an indication of the risk or liquidity associated with financial instruments at that level but rather the degree of judgment used in determining those values.
Valuation Techniques Debt securities generally are traded in the over-the-counter (OTC) market. Securities with remaining maturities of one year or more at the time of acquisition are valued at prices furnished by dealers who make markets in such securities or by an independent pricing service, which considers the yield or price of bonds of comparable quality, coupon, maturity, and type, as well as prices quoted by dealers who make markets in such securities. Securities with remaining maturities of less than one year at the time of acquisition generally use amortized cost in local currency to approximate fair value. However, if amortized cost is deemed not to reflect fair value or the fund holds a significant amount of such securities with remaining maturities of more than 60 days, the securities are valued at prices furnished by dealers who make markets in such securities or by an independent pricing service. Generally, debt securities are categorized in Level 2 of the fair value hierarchy; however, to the extent the valuations include significant unobservable inputs, the securities would be categorized in Level 3.
Financial futures contracts are valued at closing settlement prices and are categorized in Level 1 of the fair value hierarchy. Assets and liabilities other than financial instruments, including short-term receivables and payables, are carried at cost, or estimated realizable value, if less, which approximates fair value.
Thinly traded financial instruments and those for which the above valuation procedures are inappropriate or are deemed not to reflect fair value are stated at fair value as determined in good faith by the Valuation Committee. The objective of any fair value pricing determination is to arrive at a price that could reasonably be expected from a current sale. Financial instruments fair valued by the Valuation Committee are primarily private placements, restricted securities, warrants, rights, and other securities that are not publicly traded.
Subject to oversight by the Board, the Valuation Committee regularly makes good faith judgments to establish and adjust the fair valuations of certain securities as events occur and circumstances warrant. For instance, in determining the fair value of troubled or thinly traded debt instruments, the Valuation Committee considers a variety of factors, which may include, but are not limited to, the issuer’s business prospects, its financial standing and performance, recent investment transactions in the issuer, strategic events affecting the company, market liquidity for the issuer, and general economic conditions and events. In consultation with the investment and pricing teams, the Valuation Committee will determine an appropriate valuation technique based on available information, which may include both observable and unobservable inputs. The Valuation Committee typically will afford greatest weight to actual prices in arm’s length transactions, to the extent they represent orderly transactions between market participants; transaction information can be reliably obtained; and prices are deemed representative of fair value. However, the Valuation Committee may also consider other valuation methods such as a discount or premium from market value of a similar, freely traded security of the same issuer; discounted cash flows; yield to maturity; or some combination. Fair value determinations are reviewed on a regular basis and updated as information becomes available, including actual purchase and sale transactions of the issue. Because any fair value determination involves a significant amount of judgment, there is a degree of subjectivity inherent in such pricing decisions, and fair value prices determined by the Valuation Committee could differ from those of other market participants. Depending on the relative significance of unobservable inputs, including the valuation technique(s) used, fair valued securities may be categorized in Level 2 or 3 of the fair value hierarchy.
Valuation Inputs The following table summarizes the fund’s financial instruments, based on the inputs used to determine their fair values on February 28, 2014:
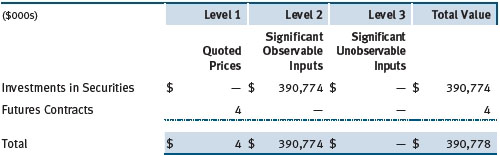
There were no material transfers between Levels 1 and 2 during the year.
NOTE 3 - DERIVATIVE INSTRUMENTS
During the year ended February 28, 2014, the fund invested in derivative instruments. As defined by GAAP, a derivative is a financial instrument whose value is derived from an underlying security price, foreign exchange rate, interest rate, index of prices or rates, or other variable; it requires little or no initial investment and permits or requires net settlement. The fund invests in derivatives only if the expected risks and rewards are consistent with its investment objectives, policies, and overall risk profile, as described in its prospectus and Statement of Additional Information. The fund may use derivatives for a variety of purposes, such as seeking to hedge against declines in principal value, increase yield, invest in an asset with greater efficiency and at a lower cost than is possible through direct investment, or to adjust portfolio duration and credit exposure. The risks associated with the use of derivatives are different from, and potentially much greater than, the risks associated with investing directly in the instruments on which the derivatives are based. The fund at all times maintains sufficient cash reserves, liquid assets, or other SEC-permitted asset types to cover its settlement obligations under open derivative contracts.
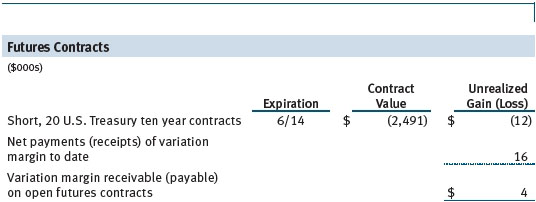
The fund values its derivatives at fair value, as described in Note 2, and recognizes changes in fair value currently in its results of operations. Accordingly, the fund does not follow hedge accounting, even for derivatives employed as economic hedges. Generally, the fund accounts for its derivatives on a gross basis. It does not offset the fair value of derivative liabilities against the fair value of derivative assets on its financial statements, nor does it offset the fair value of derivative instruments against the right to reclaim or obligation to return collateral. As of February 28, 2014, the fund held interest rate futures with cumulative unrealized loss of $12,000; the value reflected on the accompanying Statement of Assets and Liabilities is the related unsettled variation margin.
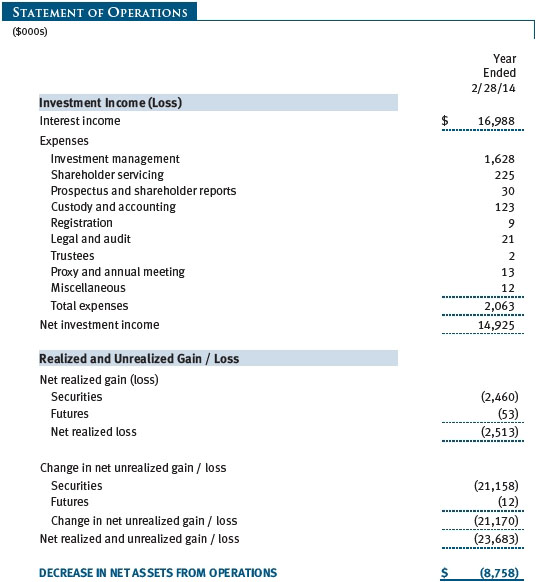
Additionally, during the year ended February 28, 2014, the fund recognized $53,000 of realized loss on Futures and a $(12,000) change in unrealized gain/loss on Futures related to its investments in interest rate derivatives; such amounts are included on the accompanying Statement of Operations.
Counterparty Risk and Collateral The fund invests in exchange-traded or centrally cleared derivative contracts, such as futures, exchange-traded options, and centrally cleared swaps. Counterparty risk on such derivatives is minimal because the clearinghouse provides protection against counterparty defaults. For futures and centrally cleared swaps, the fund is required to deposit collateral in an amount equal to a certain percentage of the contract value (margin requirement), and the margin requirement must be maintained over the life of the contract. Each clearing broker, in its sole discretion, may adjust the margin requirements applicable to the fund.
Collateral may be in the form of cash or debt securities issued by the U.S. government or related agencies. Cash and currencies posted by the fund are reflected as cash deposits in the accompanying financial statements and generally are restricted from withdrawal by the fund; securities posted by the fund are so noted in the accompanying Portfolio of Investments; both remain in the fund’s assets. As of February 28, 2014, cash of $34,000 had been posted by the fund for exchange-traded and/or centrally cleared derivatives.
Futures Contracts The fund is subject to interest rate risk in the normal course of pursuing its investment objectives and uses futures contracts to help manage such risk. The fund may enter into futures contracts to manage exposure to interest rate and yield curve movements, security prices, foreign currencies, credit quality, and mortgage prepayments; as an efficient means of adjusting exposure to all or part of a target market; to enhance income; as a cash management tool; or to adjust portfolio duration and credit exposure. A futures contract provides for the future sale by one party and purchase by another of a specified amount of a particular underlying financial instrument at an agreed-upon price, date, time, and place. The fund currently invests only in exchange-traded futures, which generally are standardized as to maturity date, underlying financial instrument, and other contract terms. Payments are made or received by the fund each day to settle daily fluctuations in the value of the contract (variation margin), which reflect changes in the value of the underlying financial instrument. Variation margin is recorded as unrealized gain or loss until the contract is closed. The value of a futures contract included in net assets is the amount of unsettled variation margin; net variation margin receivable is reflected as an asset and net variation margin payable is reflected as a liability on the accompanying Statement of Assets and Liabilities. Risks related to the use of futures contracts include possible illiquidity of the futures markets, contract prices that can be highly volatile and imperfectly correlated to movements in hedged security values and/or interest rates, and potential losses in excess of the fund’s initial investment. During the year ended February 28, 2014, the fund’s exposure to futures, based on underlying notional amounts, was generally less than 1% of net assets.
NOTE 4 - OTHER INVESTMENT TRANSACTIONS
Consistent with its investment objective, the fund engages in the following practices to manage exposure to certain risks and/or to enhance performance. The investment objective, policies, program, and risk factors of the fund are described more fully in the fund’s prospectus and Statement of Additional Information.
Restricted Securities The fund may invest in securities that are subject to legal or contractual restrictions on resale. Prompt sale of such securities at an acceptable price may be difficult and may involve substantial delays and additional costs.
Other Purchases and sales of portfolio securities other than short-term securities aggregated $38,075,000 and $87,156,000, respectively, for the year ended February 28, 2014.
NOTE 5 - FEDERAL INCOME TAXES
No provision for federal income taxes is required since the fund intends to continue to qualify as a regulated investment company under Subchapter M of the Internal Revenue Code and distribute to shareholders all of its income and gains. Distributions determined in accordance with federal income tax regulations may differ in amount or character from net investment income and realized gains for financial reporting purposes. Financial reporting records are adjusted for permanent book/tax differences to reflect tax character but are not adjusted for temporary differences.
The fund files U.S. federal, state, and local tax returns as required. The fund’s tax returns are subject to examination by the relevant tax authorities until expiration of the applicable statute of limitations, which is generally three years after the filing of the tax return but which can be extended to six years in certain circumstances. Tax returns for open years have incorporated no uncertain tax positions that require a provision for income taxes.
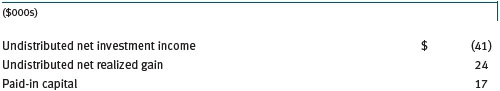
Reclassifications to paid-in capital relate primarily to a tax practice that treats a portion of the proceeds from each redemption of capital shares as a distribution of taxable net investment income or realized capital gain. Reclassifications between income and gain relate primarily to differences between book/tax amortization policies. For the year ended February 28, 2014, the following reclassifications were recorded to reflect tax character (there was no impact on results of operations or net assets):
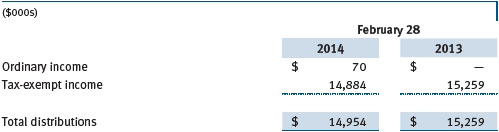
Distributions during the years ended February 28, 2014 and February 28, 2013, were characterized for tax purposes as follows:
At February 28, 2014, the tax-basis cost of investments and components of net assets were as follows:
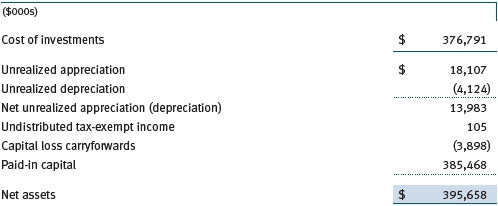
The fund intends to retain realized gains to the extent of available capital loss carryforwards. Because the fund is required to use capital loss carryforwards that do not expire before those with expiration dates, all or a portion of its capital loss carryforwards subject to expiration could ultimately go unused. The fund’s available capital loss carryforwards as of February 28, 2014, expire as follows: $996,000 in fiscal 2017, and $448,000 in fiscal 2018; $2,454,000 have no expiration.
NOTE 6 - RELATED PARTY TRANSACTIONS
The fund is managed by T. Rowe Price Associates, Inc. (Price Associates), a wholly owned subsidiary of T. Rowe Price Group, Inc. (Price Group). The investment management agreement between the fund and Price Associates provides for an annual investment management fee, which is computed daily and paid monthly. The fee consists of an individual fund fee, equal to 0.10% of the fund’s average daily net assets, and a group fee. The group fee rate is calculated based on the combined net assets of certain mutual funds sponsored by Price Associates (the group) applied to a graduated fee schedule, with rates ranging from 0.48% for the first $1 billion of assets to 0.275% for assets in excess of $400 billion. The fund’s group fee is determined by applying the group fee rate to the fund’s average daily net assets. At February 28, 2014, the effective annual group fee rate was 0.29%.
In addition, the fund has entered into service agreements with Price Associates and a wholly owned subsidiary of Price Associates (collectively, Price). Price Associates computes the daily share price and provides certain other administrative services to the fund. T. Rowe Price Services, Inc., provides shareholder and administrative services in its capacity as the fund’s transfer and dividend-disbursing agent. For the year ended February 28, 2014, expenses incurred pursuant to these service agreements were $91,000 for Price Associates and $105,000 for T. Rowe Price Services, Inc. The total amount payable at period-end pursuant to these service agreements is reflected as Due to Affiliates in the accompanying financial statements.
| Report of Independent Registered Public Accounting Firm |
To the Board of Trustees of T. Rowe Price State Tax-Free Income Trust and
Shareholders of New York Tax-Free Bond Fund
In our opinion, the accompanying statement of assets and liabilities, including the portfolio of investments, and the related statements of operations and of changes in net assets and the financial highlights present fairly, in all material respects, the financial position of New York Tax-Free Bond Fund (one of the portfolios comprising T. Rowe Price State Tax-Free Income Trust, hereafter referred to as the “Fund”) at February 28, 2014, and the results of its operations, the changes in its net assets and the financial highlights for each of the periods indicated therein, in conformity with accounting principles generally accepted in the United States of America. These financial statements and financial highlights (hereafter referred to as “financial statements”) are the responsibility of the Fund’s management; our responsibility is to express an opinion on these financial statements based on our audits. We conducted our audits of these financial statements in accordance with the standards of the Public Company Accounting Oversight Board (United States). Those standards require that we plan and perform the audit to obtain reasonable assurance about whether the financial statements are free of material misstatement. An audit includes examining, on a test basis, evidence supporting the amounts and disclosures in the financial statements, assessing the accounting principles used and significant estimates made by management, and evaluating the overall financial statement presentation. We believe that our audits, which included confirmation of securities at February 28, 2014 by correspondence with the custodian and brokers, provide a reasonable basis for our opinion.
PricewaterhouseCoopers LLP
Baltimore, Maryland
April 16, 2014
| Tax Information (Unaudited) for the Tax Year Ended 2/28/14 |
We are providing this information as required by the Internal Revenue Code. The amounts shown may differ from those elsewhere in this report because of differences between tax and financial reporting requirements.
The fund’s distributions to shareholders included:
- $87,000 from short-term capital gains.
- $15,092,000 which qualified as exempt-interest dividends.
| Information on Proxy Voting Policies, Procedures, and Records |
A description of the policies and procedures used by T. Rowe Price funds and portfolios to determine how to vote proxies relating to portfolio securities is available in each fund’s Statement of Additional Information. You may request this document by calling 1-800-225-5132 or by accessing the SEC’s website, sec.gov.
The description of our proxy voting policies and procedures is also available on our website, troweprice.com. To access it, click on the words “Social Responsibility” at the top of our corporate homepage. Next, click on the words “Conducting Business Responsibly” on the left side of the page that appears. Finally, click on the words “Proxy Voting Policies” on the left side of the page that appears.
Each fund’s most recent annual proxy voting record is available on our website and through the SEC’s website. To access it through our website, follow the above directions to reach the “Conducting Business Responsibly” page. Click on the words “Proxy Voting Records” on the left side of that page, and then click on the “View Proxy Voting Records” link at the bottom of the page that appears.
| How to Obtain Quarterly Portfolio Holdings |
The fund files a complete schedule of portfolio holdings with the Securities and Exchange Commission for the first and third quarters of each fiscal year on Form N-Q. The fund’s Form N-Q is available electronically on the SEC’s website (sec.gov); hard copies may be reviewed and copied at the SEC’s Public Reference Room, 100 F St. N.E., Washington, DC 20549. For more information on the Public Reference Room, call 1-800-SEC-0330.
| About the Fund’s Trustees and Officers |
Your fund is overseen by a Board of Trustees (Board) that meets regularly to review a wide variety of matters affecting or potentially affecting the fund, including performance, investment programs, compliance matters, advisory fees and expenses, service providers, and business and regulatory affairs. The Board elects the fund’s officers, who are listed in the final table. At least 75% of the Board’s members are independent of T. Rowe Price Associates, Inc. (T. Rowe Price), and its affiliates; “inside” or “interested” trustees are employees or officers of T. Rowe Price. The business address of each trustee and officer is 100 East Pratt Street, Baltimore, Maryland 21202. The Statement of Additional Information includes additional information about the fund trustees and is available without charge by calling a T. Rowe Price representative at 1-800-638-5660.
Independent Trustees
| Name | | |
| (Year of Birth) | | |
| Year Elected* | | |
| [Number of T. Rowe Price | | Principal Occupation(s) and Directorships of Public Companies and |
| Portfolios Overseen] | | Other Investment Companies During the Past Five Years |
| | | |
| William R. Brody | | President and Trustee, Salk Institute for Biological Studies (2009 |
| (1944) | | to present); Director, Novartis, Inc. (2009 to present); Director, IBM |
| 2009 | | (2007 to present); Director, BioMed Realty Trust (2013 to present) |
| [157] | | |
| | | |
| Anthony W. Deering | | Chairman, Exeter Capital, LLC, a private investment firm (2004 to |
| (1945) | | present); Director, Brixmor Real Estate Investment Trust (2012 to |
| 1986 | | present); Director and Member of the Advisory Board, Deutsche |
| [157] | | Bank North America (2004 to present); Director, Under Armour |
| | (2008 to present); Director, Vornado Real Estate Investment Trust |
| | (2004 to 2012) |
| | | |
| Donald W. Dick, Jr. | | Principal, EuroCapital Partners, LLC, an acquisition and management |
| (1943) | | advisory firm (1995 to present) |
| 2001 | | |
| [157] | | |
| | | |
| Bruce W. Duncan | | President, Chief Executive Officer, and Director, First Industrial Realty |
| (1951) | | Trust, owner and operator of industrial properties (2009 to present); |
| 2013 | | Chairman of the Board (2005 to present), Interim Chief Executive |
| [157] | | Officer (2007), and Director (1999 to present), Starwood Hotels & |
| | Resorts, a hotel and leisure company |
| | | |
| Robert J. Gerrard, Jr. | | Advisory Board Member, Pipeline Crisis/Winning Strategies (1997 |
| (1952) | | to present); Chairman of Compensation Committee and Director, |
| 2013 | | Syniverse Holdings, Inc. (2008 to 2011) |
| [157] | | |
| | | |
| Karen N. Horn | | Limited Partner and Senior Managing Director, Brock Capital |
| (1943) | | Group, an advisory and investment banking firm (2004 to present); |
| 2003 | | Director, Eli Lilly and Company (1987 to present); Director, Simon |
| [157] | | Property Group (2004 to present); Director, Norfolk Southern (2008 |
| | to present) |
| | | |
| Paul F. McBride | | Former Company Officer and Senior Vice President, Human |
| (1956) | | Resources and Corporate Initiatives (2004 to 2010) |
| 2013 | | |
| [157] | | |
| | | |
| Cecilia E. Rouse, Ph.D. | | Dean, Woodrow Wilson School (2012 to present); Professor and |
| (1963) | | Researcher, Princeton University (1992 to present); Director, MDRC, |
| 2013 | | a nonprofit education and social policy research organization |
| [157] | | (2011 to present); Member, National Academy of Education (2010 |
| | to present); Research Associate, National Bureau of Economic |
| | Research’s Labor Studies Program (2011 to present); Member, |
| | President’s Council of Economic Advisors (2009 to 2011); Chair |
| | of Committee on the Status of Minority Groups in the Economic |
| | Profession, American Economic Association (2012 to present) |
| | | |
| John G. Schreiber | | Owner/President, Centaur Capital Partners, Inc., a real estate |
| (1946) | | investment company (1991 to present); Cofounder and Partner, |
| 1992 | | Blackstone Real Estate Advisors, L.P. (1992 to present); Director, |
| [157] | | General Growth Properties, Inc. (2010 to present); Director, BXMT |
| | (formerly Capital Trust, Inc.), a real estate investment company |
| | (2012 to present); Director and Chairman of the Board, Brixmor |
| | Property Group, Inc. (2013 to present); Director, Hilton Worldwide |
| | (2013 to present) |
| | | |
| Mark R. Tercek | | President and Chief Executive Officer, The Nature Conservancy (2008 |
| (1957) | | to present); Managing Director, The Goldman Sachs Group, Inc. |
| 2009 | | (1984 to 2008) |
| [157] | | |
| |
| *Each independent trustee serves until retirement, resignation, or election of a successor. |
| | | |
| Inside Trustees | | |
| |
| Name | | |
| (Year of Birth) | | |
| Year Elected* | | |
| [Number of T. Rowe Price | | Principal Occupation(s) and Directorships of Public Companies and |
| Portfolios Overseen] | | Other Investment Companies During the Past Five Years |
| | | |
| Edward C. Bernard | | Director and Vice President, T. Rowe Price; Vice Chairman of the |
| (1956) | | Board, Director, and Vice President, T. Rowe Price Group, Inc.; |
| 2006 | | Chairman of the Board, Director, and President, T. Rowe Price |
| [157] | | Investment Services, Inc.; Chairman of the Board and Director, |
| | T. Rowe Price Retirement Plan Services, Inc., and T. Rowe Price |
| | Services, Inc.; Chairman of the Board, Chief Executive Officer, |
| | and Director, T. Rowe Price International; Chairman of the Board, |
| | Chief Executive Officer, Director, and President, T. Rowe Price Trust |
| | Company; Chairman of the Board, all funds |
| | | |
| Michael C. Gitlin | | Vice President, Price Hong Kong, Price Singapore, T. Rowe Price, |
| (1970) | | T. Rowe Price Group, Inc., and T. Rowe Price International |
| 2010 | | |
| [52] | | |
| |
| *Each inside trustee serves until retirement, resignation, or election of a successor. |
| Officers | | |
| |
| Name (Year of Birth) | | |
| Position Held With State Tax-Free Income Trust | | Principal Occupation(s) |
| | | |
| Austin Applegate (1974) | | Vice President, T. Rowe Price and T. Rowe Price |
| Vice President | | Group, Inc.; formerly Senior Municipal Credit |
| | Research Analyst, Barclays (to 2011) |
| | | |
| R. Lee Arnold, Jr., CFA, CPA (1970) | | Vice President, T. Rowe Price and T. Rowe Price |
| Vice President | | Group, Inc. |
| | | |
| M. Helena Condez (1962) | | Vice President, T. Rowe Price and T. Rowe Price |
| Vice President | | Group, Inc. |
| | | |
| Patricia S. Deford (1957) | | Vice President, T. Rowe Price and T. Rowe Price |
| Vice President | | Group, Inc. |
| | | |
| G. Richard Dent (1960) | | Vice President, T. Rowe Price and T. Rowe Price |
| Vice President | | Group, Inc. |
| | | |
| Charles E. Emrich (1961) | | Vice President, T. Rowe Price and T. Rowe Price |
| Vice President | | Group, Inc. |
| | | |
| Roger L. Fiery III, CPA (1959) | | Vice President, Price Hong Kong, Price |
| Vice President | | Singapore, T. Rowe Price, T. Rowe Price Group, |
| | Inc., T. Rowe Price International, and T. Rowe |
| | Price Trust Company |
| | | |
| John R. Gilner (1961) | | Chief Compliance Officer and Vice President, |
| Chief Compliance Officer | | T. Rowe Price; Vice President, T. Rowe Price |
| | Group, Inc., and T. Rowe Price Investment |
| | Services, Inc. |
| | | |
| Gregory S. Golczewski (1966) | | Vice President, T. Rowe Price and T. Rowe Price |
| Vice President | | Trust Company |
| | | |
| Charles B. Hill, CFA (1961) | | Vice President, T. Rowe Price and T. Rowe Price |
| Executive Vice President | | Group, Inc. |
| | | |
| Gregory K. Hinkle, CPA (1958) | | Vice President, T. Rowe Price, T. Rowe Price |
| Treasurer | | Group, Inc., and T. Rowe Price Trust Company |
| | | |
| Dylan Jones, CFA (1971) | | Vice President, T. Rowe Price and T. Rowe Price |
| Vice President | | Group, Inc. |
| | | |
| Marcy M. Lash (1963) | | Vice President, T. Rowe Price and T. Rowe Price |
| Vice President | | Group, Inc. |
| | | |
| Alan D. Levenson, Ph.D. (1958) | | Vice President, T. Rowe Price and T. Rowe Price |
| Vice President | | Group, Inc. |
| | | |
| Patricia B. Lippert (1953) | | Assistant Vice President, T. Rowe Price and |
| Secretary | | T. Rowe Price Investment Services, Inc. |
| | | |
| Joseph K. Lynagh, CFA (1958) | | Vice President, T. Rowe Price, T. Rowe Price |
| Executive Vice President | | Group, Inc., and T. Rowe Price Trust Company |
| | | |
| Konstantine B. Mallas (1963) | | Vice President, T. Rowe Price and T. Rowe Price |
| Executive Vice President | | Group, Inc. |
| | | |
| Hugh D. McGuirk, CFA (1960) | | Vice President, T. Rowe Price and T. Rowe Price |
| President | | Group, Inc. |
| | | |
| James M. Murphy, CFA (1967) | | Vice President, T. Rowe Price and T. Rowe Price |
| Vice President | | Group, Inc. |
| | | |
| Linda A. Murphy (1959) | | Vice President, T. Rowe Price and T. Rowe Price |
| Vice President | | Group, Inc. |
| | | |
| Alexander S. Obaza (1981) | | Vice President, T. Rowe Price, T. Rowe Price |
| Vice President | | Group, Inc., and T. Rowe Price Trust Company |
| | | |
| David Oestreicher (1967) | | Director, Vice President, and Secretary, T. Rowe |
| Vice President | | Price Investment Services, Inc., T. Rowe |
| | Price Retirement Plan Services, Inc., T. Rowe |
| | Price Services, Inc., and T. Rowe Price Trust |
| | Company; Chief Legal Officer, Vice President, |
| | and Secretary, T. Rowe Price Group, Inc.; Vice |
| | President and Secretary, T. Rowe Price and |
| | T. Rowe Price International; Vice President, |
| | Price Hong Kong and Price Singapore |
| | | |
| Deborah D. Seidel (1962) | | Vice President, T. Rowe Price, T. Rowe Price |
| Vice President | | Group, Inc., T. Rowe Price Investment Services, |
| | Inc., and T. Rowe Price Services, Inc. |
| | | |
| Michael K. Sewell (1982) | | Vice President, T. Rowe Price |
| Assistant Vice President | | |
| | | |
| Chen Shao (1980) | | Assistant Vice President, T. Rowe Price |
| Assistant Vice President | | |
| | | |
| Douglas D. Spratley, CFA (1969) | | Vice President, T. Rowe Price and T. Rowe Price |
| Vice President | | Group, Inc. |
| | | |
| Timothy G. Taylor, CFA (1975) | | Vice President, T. Rowe Price and T. Rowe Price |
| Vice President | | Group, Inc. |
| | | |
| Julie L. Waples (1970) | | Vice President, T. Rowe Price |
| Vice President | | |
| | | |
| Edward A. Wiese, CFA (1959) | | Director and Vice President, T. Rowe Price Trust |
| Vice President | | Company; Vice President, T. Rowe Price and |
| | T. Rowe Price Group, Inc. |
| |
| Unless otherwise noted, officers have been employees of T. Rowe Price or T. Rowe Price International for at least 5 years. |
Item 2. Code of Ethics.
The registrant has adopted a code of ethics, as defined in Item 2 of Form N-CSR, applicable to its principal executive officer, principal financial officer, principal accounting officer or controller, or persons performing similar functions. A copy of this code of ethics is filed as an exhibit to this Form N-CSR. No substantive amendments were approved or waivers were granted to this code of ethics during the period covered by this report.
Item 3. Audit Committee Financial Expert.
The registrant’s Board of Directors/Trustees has determined that Mr. Anthony W. Deering qualifies as an audit committee financial expert, as defined in Item 3 of Form N-CSR. Mr. Deering is considered independent for purposes of Item 3 of Form N-CSR.
Item 4. Principal Accountant Fees and Services.
(a) – (d) Aggregate fees billed for the last two fiscal years for professional services rendered to, or on behalf of, the registrant by the registrant’s principal accountant were as follows:
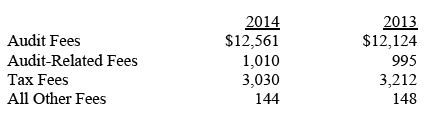
Audit fees include amounts related to the audit of the registrant’s annual financial statements and services normally provided by the accountant in connection with statutory and regulatory filings. Audit-related fees include amounts reasonably related to the performance of the audit of the registrant’s financial statements and specifically include the issuance of a report on internal controls and, if applicable, agreed-upon procedures related to fund acquisitions. Tax fees include amounts related to services for tax compliance, tax planning, and tax advice. The nature of these services specifically includes the review of distribution calculations and the preparation of Federal, state, and excise tax returns. All other fees include the registrant’s pro-rata share of amounts for agreed-upon procedures in conjunction with service contract approvals by the registrant’s Board of Directors/Trustees.
(e)(1) The registrant’s audit committee has adopted a policy whereby audit and non-audit services performed by the registrant’s principal accountant for the registrant, its investment adviser, and any entity controlling, controlled by, or under common control with the investment adviser that provides ongoing services to the registrant require pre-approval in advance at regularly scheduled audit committee meetings. If such a service is required between regularly scheduled audit committee meetings, pre-approval may be authorized by one audit committee member with ratification at the next scheduled audit committee meeting. Waiver of pre-approval for audit or non-audit services requiring fees of a de minimis amount is not permitted.
(2) No services included in (b) – (d) above were approved pursuant to paragraph (c)(7)(i)(C) of Rule 2-01 of Regulation S-X.
(f) Less than 50 percent of the hours expended on the principal accountant’s engagement to audit the registrant’s financial statements for the most recent fiscal year were attributed to work performed by persons other than the principal accountant’s full-time, permanent employees.
(g) The aggregate fees billed for the most recent fiscal year and the preceding fiscal year by the registrant’s principal accountant for non-audit services rendered to the registrant, its investment adviser, and any entity controlling, controlled by, or under common control with the investment adviser that provides ongoing services to the registrant were $1,862,000 and $1,651,000, respectively.
(h) All non-audit services rendered in (g) above were pre-approved by the registrant’s audit committee. Accordingly, these services were considered by the registrant’s audit committee in maintaining the principal accountant’s independence.
Item 5. Audit Committee of Listed Registrants.
Not applicable.
Item 6. Investments.
(a) Not applicable. The complete schedule of investments is included in Item 1 of this Form N-CSR.
(b) Not applicable.
Item 7. Disclosure of Proxy Voting Policies and Procedures for Closed-End Management Investment Companies.
Not applicable.
Item 8. Portfolio Managers of Closed-End Management Investment Companies.
Not applicable.
Item 9. Purchases of Equity Securities by Closed-End Management Investment Company and Affiliated Purchasers.
Not applicable.
Item 10. Submission of Matters to a Vote of Security Holders.
Not applicable.
Item 11. Controls and Procedures.
(a) The registrant’s principal executive officer and principal financial officer have evaluated the registrant’s disclosure controls and procedures within 90 days of this filing and have concluded that the registrant’s disclosure controls and procedures were effective, as of that date, in ensuring that information required to be disclosed by the registrant in this Form N-CSR was recorded, processed, summarized, and reported timely.
(b) The registrant’s principal executive officer and principal financial officer are aware of no change in the registrant’s internal control over financial reporting that occurred during the registrant’s second fiscal quarter covered by this report that has materially affected, or is reasonably likely to materially affect, the registrant’s internal control over financial reporting.
Item 12. Exhibits.
(a)(1) The registrant’s code of ethics pursuant to Item 2 of Form N-CSR is attached.
(2) Separate certifications by the registrant's principal executive officer and principal financial officer, pursuant to Section 302 of the Sarbanes-Oxley Act of 2002 and required by Rule 30a-2(a) under the Investment Company Act of 1940, are attached.
(3) Written solicitation to repurchase securities issued by closed-end companies: not applicable.
(b) A certification by the registrant's principal executive officer and principal financial officer, pursuant to Section 906 of the Sarbanes-Oxley Act of 2002 and required by Rule 30a-2(b) under the Investment Company Act of 1940, is attached.
SIGNATURES
Pursuant to the requirements of the Securities Exchange Act of 1934 and the Investment Company Act of 1940, the registrant has duly caused this report to be signed on its behalf by the undersigned, thereunto duly authorized.
T. Rowe Price State Tax-Free Income Trust
| By | /s/ Edward C. Bernard |
| | Edward C. Bernard |
| | Principal Executive Officer |
| | |
| Date April 16, 2014 | | |
Pursuant to the requirements of the Securities Exchange Act of 1934 and the Investment Company Act of 1940, this report has been signed below by the following persons on behalf of the registrant and in the capacities and on the dates indicated.
| By | /s/ Edward C. Bernard |
| | Edward C. Bernard |
| | Principal Executive Officer |
| | |
| Date April 16, 2014 | | |
| | |
| | |
| By | /s/ Gregory K. Hinkle |
| | Gregory K. Hinkle |
| | Principal Financial Officer |
| | |
| Date April 16, 2014 | | |