UNITED STATES
SECURITIES AND EXCHANGE COMMISSION
Washington, D.C. 20549
FORM N-CSR
CERTIFIED SHAREHOLDER REPORT OF REGISTERED
MANAGEMENT INVESTMENT COMPANIES
Investment Company Act File Number: 811-04521
| T. Rowe Price State Tax-Free Income Trust |
|
| (Exact name of registrant as specified in charter) |
| |
| 100 East Pratt Street, Baltimore, MD 21202 |
|
| (Address of principal executive offices) |
| |
| David Oestreicher |
| 100 East Pratt Street, Baltimore, MD 21202 |
|
| (Name and address of agent for service) |
Registrant’s telephone number, including area code: (410) 345-2000
Date of fiscal year end: February 28
Date of reporting period: February 28, 2017
Item 1. Report to Shareholders
| New York Tax-Free Bond Fund | February 28, 2017 |
The views and opinions in this report were current as of February 28, 2017. They are not guarantees of performance or investment results and should not be taken as investment advice. Investment decisions reflect a variety of factors, and the managers reserve the right to change their views about individual stocks, sectors, and the markets at any time. As a result, the views expressed should not be relied upon as a forecast of the fund’s future investment intent. The report is certified under the Sarbanes-Oxley Act, which requires mutual funds and other public companies to affirm that, to the best of their knowledge, the information in their financial reports is fairly and accurately stated in all material respects.
REPORTS ON THE WEB
Sign up for our Email Program, and you can begin to receive updated fund reports and prospectuses online rather than through the mail. Log in to your account at troweprice.com for more information.
Manager’s Letter
Fellow Shareholders
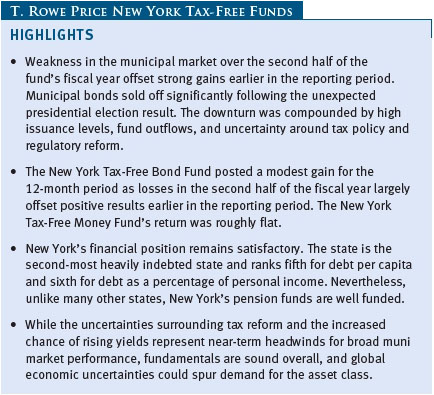
Tax-free municipal bonds were flat in our fiscal year ended February 28, 2017. In the first half of the period, municipal bonds posted strong returns as the asset class was supported by solid demand, manageable supply, and a flight-to-quality rally in late June stemming from the UK’s vote to leave the European Union. In the last six months of the reporting period, municipal and Treasury bonds sold off significantly following the unexpected result of November’s U.S. presidential election. Weakness in the municipal market was further compounded by high issuance levels, fund outflows, and uncertainty around tax policy and regulatory reform. New York debt generally performed in line with the broad national muni index. The New York Tax-Free Bond Fund posted a modest gain for the 12-month period, while the New York Tax-Free Money Fund’s return was roughly flat.
ECONOMY AND INTEREST RATES
Although U.S. economic growth was fairly lackluster in 2016 as a whole, the economy showed improvement in the second half of the calendar year. According to the Commerce Department’s most recent estimate, fourth-quarter gross domestic product grew at an annualized pace of 1.9%. We expect a growth rate of around 2% to persist in the near term. Although the pace of employment growth moderated in 2016 compared with the last few years, the labor market remains strong, and wage growth has picked up. Inflation remains below the Federal Reserve’s 2% objective, but headline inflation has been rising, in part because commodity prices have rebounded from early-2016 lows. Core inflation, which excludes food and energy costs, has also been creeping higher.
The Fed kept the fed funds target rate in the 0.25% to 0.50% range for most of 2016. After warning the financial markets for several months that the case for raising short-term rates had “strengthened,” Fed officials lifted the fed funds target rate in December to a range of 0.50% to 0.75%—an increase of 25 basis points—citing an improving labor market and rising inflation. Shortly after our reporting period ended, the Fed decided to raise the fed funds rate again on March 15, to a range of 0.75% to 1.00%. T. Rowe Price Chief U.S. Economist Alan Levenson believes that the Fed is likely to watch the effects of its most recent rate increase on the economy and financial markets for at least a few months before deciding whether to raise rates again. He believes that the Fed is likely to raise rates two more times in 2017.
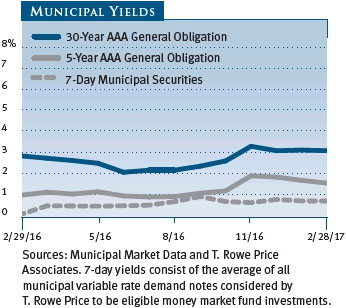
Longer-term Treasury and municipal yields fell through early summer but increased in the second half of 2016. They rose sharply in the last few months of 2016 in anticipation of a December Fed rate hike and potentially stimulative fiscal policies under the Trump administration that could lead to higher inflation and larger deficits. Long-term muni and Treasury yields stayed fairly close to their year-end 2016 levels in the first two months of 2017, as the probability for another rate hike in March increased.
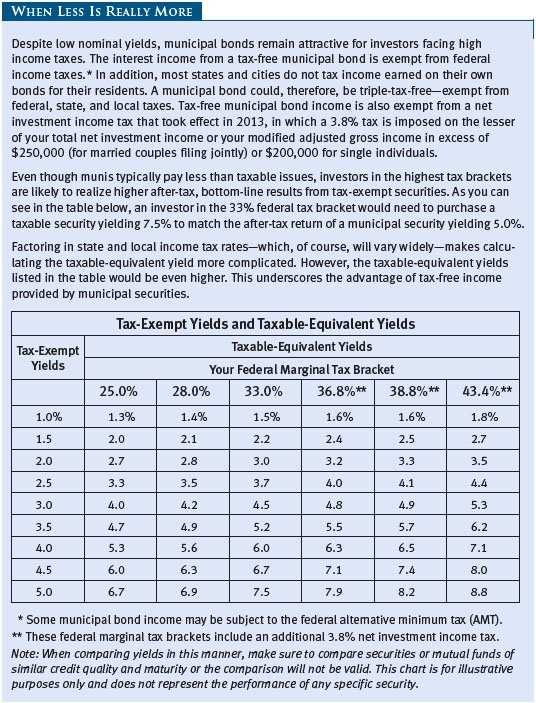
With high-quality 30-year municipal bond yields slightly higher than the 30-year U.S. Treasury bond yield at the end of February, munis offered relative value for many fixed income investors on an after-tax basis. As an illustration of their attractiveness, on February 28, 2017, the 3.05% yield offered by a 30-year tax-free general obligation (GO) bond rated AAA was about 103% of the 2.97% pretax yield offered by a 30-year Treasury bond. Including the 3.8% net investment income tax that took effect in 2013 as part of the Affordable Care Act, the top marginal federal tax rate currently stands at 43.4%. An investor in this tax bracket would need to invest in a taxable bond yielding about 5.39% to receive the same after-tax income as that generated by the municipal bond. (To calculate a municipal bond’s taxable-equivalent yield, divide the yield by the quantity of 1.00 minus your federal tax bracket expressed as a decimal—in this case, 1.00 – 0.434, or 0.566.)
MUNICIPAL MARKET NEWS
Total municipal bond issuance in 2016 was a record-setting $445 billion. Issuance had declined early in the year, but the pace of refunding deals quickened as issuers sought to take advantage of lower yields and refinance their older, higher cost debt ahead of both the U.S. election and a potential rate hike by the Fed. After 54 consecutive weeks of inflows to municipal bond funds, flows turned negative in mid-October, and sizable outflows continued through the end of 2016. Flows turned positive in the first two months of 2017.
Generally, fundamentals for municipal issuers remain solid, and most issuers in the $3.8 trillion municipal bond market have been fiscally responsible. State and local governments in general have been cautious about adding to indebtedness since the 2008 financial crisis, and a strengthening economy has helped tax revenues rebound. Over 60% of the market, as measured by the Bloomberg Barclays Municipal Bond Index, is AAA or AA rated.
Although the market is overwhelmingly high quality, many states and municipalities are grappling with underfunded pensions and other post-employment benefit (OPEB) obligations. New reporting rules from the Governmental Accounting Standards Board are bringing greater transparency to state and local governments’ pension funding gaps, long-term risks that investors often overlooked in the past. We believe the market will increasingly price in higher pension risks as the magnitude of unfunded liabilities becomes more conspicuous.
The results of the presidential election raised concerns about the impact that tax reform could have on the municipal bond asset class. Donald Trump campaigned on a promise to reduce the top individual marginal tax rate from 43.4% (including the additional 3.8% income tax that resulted from the Affordable Care Act) to 33%. Other proposals, including lower corporate tax rates and bank regulatory changes, could also impact demand for municipal bonds. While it is too early to tell which provisions will be included in a tax reform bill, Trump has indicated he will not eliminate the tax exemption of municipal bonds. We believe the attractiveness of the municipal asset class will endure, even at lower marginal tax rates. Another result of the November vote was the election of Ricardo Rosselló as governor of Puerto Rico, which is struggling to return to fiscal solvency after defaulting on more than $1 billion of its debt during the past 12 months. Rosselló is perceived as bondholder friendly by the market, and Puerto Rican bonds rallied following his win. However, after our reporting period ended, investors generally reacted unfavorably to a fiscal plan certified by the U.S. financial oversight board that prioritizes government services and pensions over payments to bondholders.
Performance was mixed across all the major segments of the muni market over the last year. Revenue bonds posted positive, but muted, returns and outperformed GO debt. We continue to favor bonds backed by a dedicated revenue stream over GOs, as we consider revenue bonds to be largely insulated from the pension funding concerns facing state and local governments. Across our municipal platform generally, we have an overweight to the higher-yielding health care and transportation revenue-backed sectors. Among revenue bonds, high yield tobacco bonds outpaced the broad muni index by a wide margin for the period, despite losing nearly 8% in the fourth quarter of 2016. Most remaining subsectors produced low positive returns, led by housing and industrial revenue/pollution control revenue. Education revenue bonds edged lower.
NEW YORK MARKET NEWS
The New York economy has advanced at a slightly slower pace than the national rate according to the most recent data. Total employment in the state in 2016 was over 9.4 million, but New York’s 1.1% employment growth lagged the 1.5% increase for the U.S. The state’s unemployment rate was 4.6% in January 2017, down from 4.9% a year earlier and in line with the national rate. Favorably, New York’s 2016 per capita income was 123% of the national average.
The state’s financial position remains satisfactory. For the fiscal year that ended March 31, 2016, the balance of the state’s general fund (the primary operating fund), on a cash basis and including the rainy day and other funds, was $8.9 billion, or a healthy 13.1% of expenses. Fiscal 2017 ends on March 31, 2017. Recent budgetary estimates suggest the general fund cash balance will fall 20% to $7.2 billion, or a still healthy 10.3% of expenses. This reflects expectations for New York State to dedicate a portion of the sizable bank settlement proceeds to support infrastructure investments.
Moody’s Investors Service rates New York State general obligation debt Aa1, while S&P and Fitch both rate the bonds AA+. All three agencies maintain a stable outlook on their respective ratings. New York City’s credit ratings are Aa2 from Moody’s, AA from S&P, and AA from Fitch—all with stable outlooks.
New York is the second-most heavily indebted state and ranks fifth for debt per capita at $3,021 and sixth for debt as a percentage of personal income at 5.4% according to Moody’s 2016 State Debt Medians Report. Nevertheless, unlike many other states, New York’s pension funds are well funded, with an aggregate funded ratio of 91% as of March 31, 2016. However, the Empire State’s aggregate OPEB liability is high at $78 billion and was completely unfunded. Most of New York’s debt is appropriation-backed, meaning that the legislature must approve debt service payments on these obligations annually and has no legal requirement to continue consenting to these expenses.
New York City continued to exhibit good fiscal management. In fiscal year 2016, general fund revenues once again exceeded expenses driven by strong growth in property taxes. The current budget and proposed fiscal year 2018 budget are both balanced.
PORTFOLIO REVIEW
New York Tax-Free Money Fund
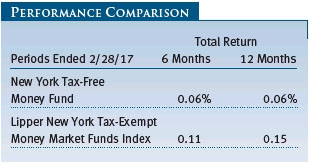
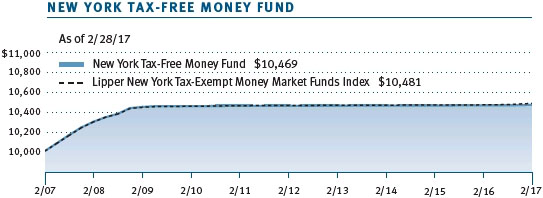
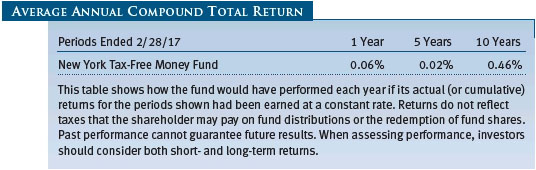
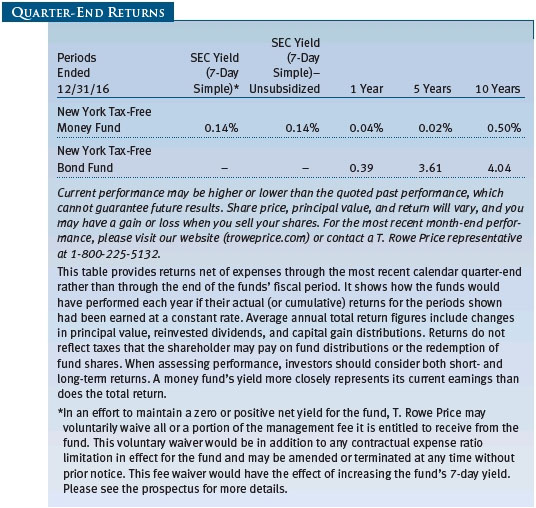
Your fund returned 0.06% for both the 6- and 12-month periods ended February 28, 2017, while the Lipper New York Tax-Exempt Money Market Funds Index returned 0.11% and 0.15% for the respective periods.
Money fund reform was completed in October 2016, leading to significant fund consolidation as well as asset movements. Tax-exempt money market assets under management dropped significantly during the period leading up to the reform deadline, falling by almost 50% to just over $127 billion. However, since October, almost $4 billion has returned to the asset class. The amount of assets that return going forward will be an important determinant of the overall level of yields the market offers.
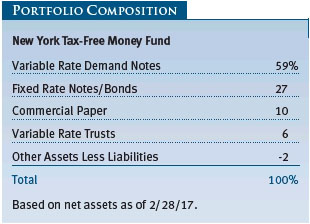
With money fund reform now behind us, money markets are back to focusing on the Fed and the timing of future rate increases. The impact of the Fed’s December 2016 rate increase on municipal money market rates was minimal. This was due in part to the continued uncertainty about when the next rate increase would occur as well as the supply/demand imbalances persisting in the shorter-maturity portion of our market. In particular, municipal variable rate demand notes (VRDNs) remain attractive alternatives for taxable money funds due to their comparable yields and other liquidity attributes. As shown in the Portfolio Composition chart, VRDNs, at 59%, made up the largest portion of the fund’s net assets at the end of the period.
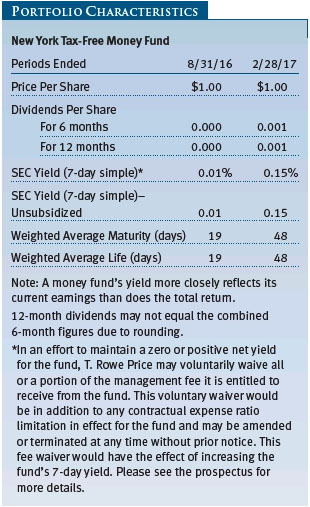
Overnight and seven-day yields finished the period at 0.56% and 0.65%, respectively, a marginal increase since our last report six months ago. Yields on one-year maturities did move higher in response to the Fed, increasing by 28 basis points to 0.80%. Uncertainty around the timing and pace of subsequent Fed moves has resulted in a drop in demand among many investors for longer-maturity securities. Thus, the money market yield curve steepened as the rates offered by shorter-term securities remained anchored while longer-maturity yields repriced higher.
The fund’s weighted average maturity and weighted average life finished the period slightly longer than they were a year earlier. In the first half of the fund’s fiscal year, in anticipation of money fund reform and expected large asset shifts within the industry, we took a defensive posture and shortened the fund’s maturity profile. With the reform process complete, we have moved the weighted average maturity longer over the past six months.
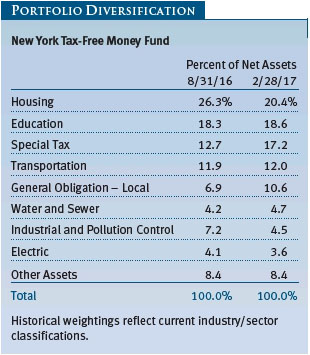
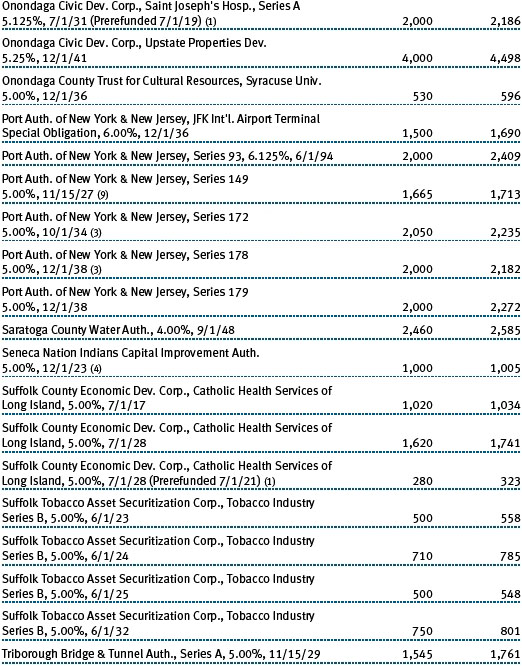
As always, credit quality continues to play a large role in the management of the fund. As a policy, we favor highly rated credits such as housing, education, and special tax revenue. Some prominent positions in the portfolio include the New York City Housing Authority, Syracuse University, and the New York City Transitional Finance Authority (TFA). (Please refer to the fund’s portfolio of investments for a complete list of holdings and the amount each represents in the portfolio.)
Recent economic data suggest a firming economy, though risks to that outlook remain. Still, it would not be unreasonable to expect two or three additional rate hikes by the Fed during the remainder of 2017, which will translate into higher yields for money fund investors. As always, we remain committed to managing a highly liquid, diversified portfolio focused on liquidity and stability of principal, which we deem of utmost importance to our valued shareholders.
New York Tax-Free Bond Fund
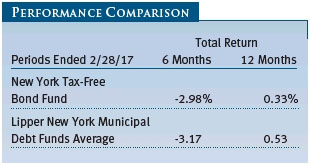
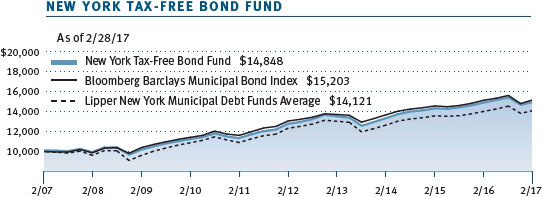
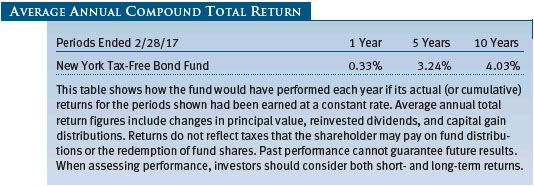
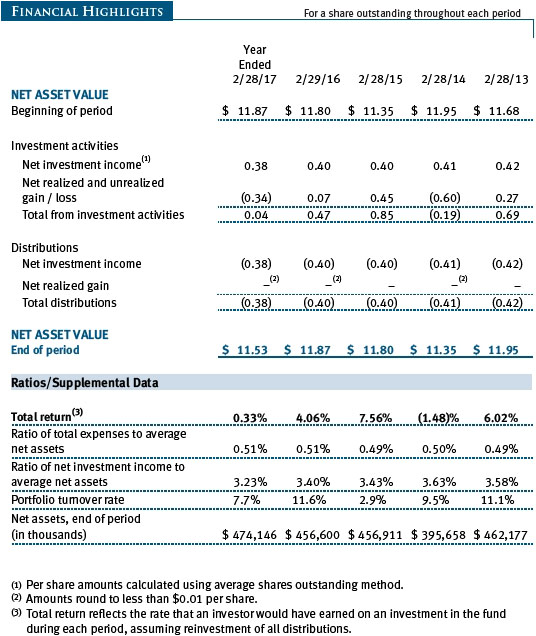
The New York Tax-Free Bond Fund returned 0.33% for the 12 months ended February 28, 2017, underperforming the 0.53% return of its Lipper peer group average but outpacing the broader national Bloomberg Barclays Municipal Bond Index. The fund lost ground in absolute terms over the second half of the fiscal year but held up better than its peer group. Relative to the Bloomberg Barclays benchmark, our overweight positioning on the long end of the yield curve helped our performance while security selection detracted from results. Our underweight in tobacco securitization bonds detracted relative to our New York peers.
Over a longer time horizon, the fund’s performance versus its peers is solid, placing it in the top quartile for the trailing 10-year period. (Based on cumulative total return, Lipper ranked the New York Tax-Free Bond Fund 38 of 96, 37 of 96, 22 of 85, and 11 of 66 New York municipal debt funds for the 1-, 3-, 5-, and 10-year periods ended February 28, 2017, respectively. Past performance cannot guarantee future results.)
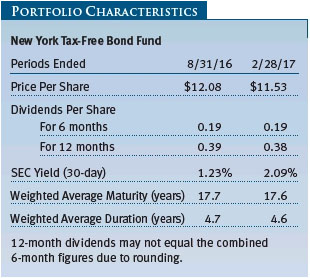
The fund’s weighted average maturity and duration were little changed over the past six months. Our duration ended the period modestly shorter than the benchmark and our peers. In terms of yield curve positioning, we maintained an overweight to bonds with maturities of 20 years and longer relative to the benchmark, and this positioning aided the portfolio as the yields of longer-maturity bonds rose less than shorter maturities. We believe our duration positioning provides some protection against a volatile rate environment, while our overweight in the long end of the curve offers the potential for higher income.
We continue to favor revenue bonds over GO debt in light of our long-held concerns that many municipalities will face challenges related to increased pension and health care liabilities. Education, transportation, and health care bonds—sectors where we can often find higher yields—represent just under half the portfolio’s net assets. Our overweight in industrial revenue bonds and underweight in water and sewer debt benefited the portfolio’s relative results during the period, although our overweight to education detracted.
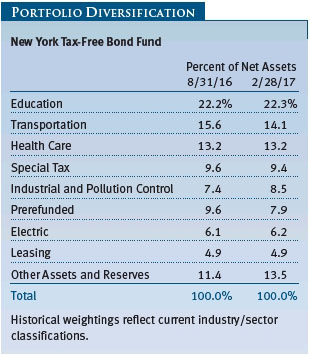
Although we sold some of our prerefunded bonds in the second half of our fiscal year, our allocation to the prerefunded sector rose over the past year as a number of our holdings were refinanced by their issuers and recategorized into this sector. Prerefunded bonds provide the fund with another source of liquidity in addition to cash, which we believe is appropriate within the rising rate environment, and leaves us well positioned to take advantage of the possibility of further interest rate increases.
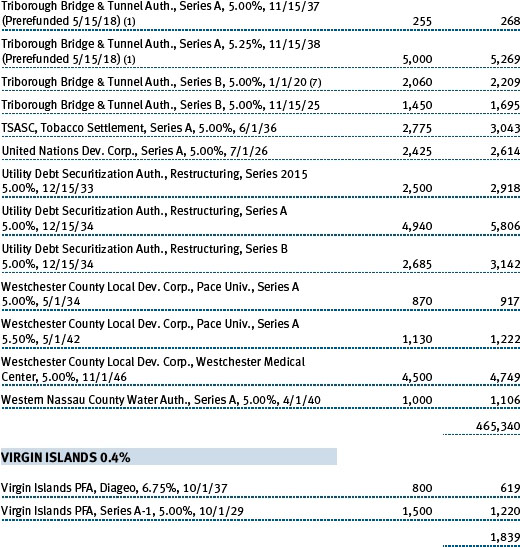
Security selection in special tax and power bonds detracted. In the special tax sector, our holdings in debt from the U.S. Virgin Islands hampered results as the territory’s credit rating was downgraded during the period amid increasing fiscal challenges. On the positive side, our health care holdings and some real estate-related bonds from New York City benefited the portfolio. During the period, we purchased tobacco bonds issued by TSASC and added to our holdings in bonds from the Dormitory Authority of the State of New York (The New School). (Please refer to the fund’s portfolio of investments for a complete list of holdings and the amount each represents in the portfolio.)
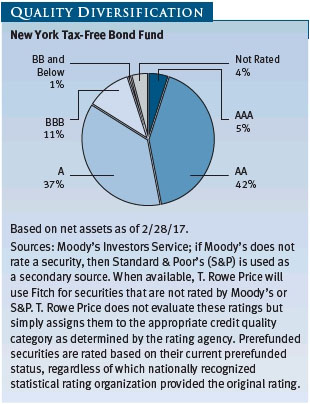
High-quality AAA and AA holdings make up just under half the portfolio. We continue to overweight A and BBB rated debt as we believe this is an area where our credit research team can find investment opportunities that offer incremental risk-adjusted yield. We maintained a modest exposure to below investment-grade and unrated bonds.
OUTLOOK
We believe that the municipal bond market remains a high-quality market that offers good opportunities for long-term investors seeking tax-free income. While the uncertainties surrounding tax reform and the increased chance of rising yields represent near-term headwinds for broad muni market performance, in our view, fundamentals are sound overall, and global economic uncertainties could spur demand for the asset class. As the Fed continues on the path to interest rate normalization, muni bond yields are likely to rise along with Treasury yields—although probably not to the same extent. While higher yields typically pressure bond prices, we expect any potential Fed rate increases to be gradual and modest, and believe we could remain in a relatively low-rate environment for some time. Moreover, munis should be less susceptible to slowly rising rates than Treasuries given their attractive tax-equivalent yields and the steady demand for tax-exempt income.
While we believe that many states deserve high credit ratings and will be able to continue servicing their debts, we have longer-term concerns about significant funding shortfalls for pensions and OPEB obligations in some jurisdictions. These funding gaps stem from investment losses during the 2008 financial crisis, insufficient plan contributions over time, and unrealistic return assumptions. Although few large plans are at risk of insolvency in the near term, the magnitude of unfunded liabilities is becoming more conspicuous in a few states.
Ultimately, we believe independent credit research is our greatest strength and will remain an asset for our investors as we navigate the current market environment. As always, we focus on finding attractively valued bonds issued by municipalities with good long-term fundamentals—an investment strategy that we believe will continue to serve our investors well.
Thank you for investing with T. Rowe Price.
Respectfully submitted,

Joseph K. Lynagh
Chairman of the Investment Advisory Committee
New York Tax-Free Money Fund

Konstantine B. Mallas
Chairman of the Investment Advisory Committee
New York Tax-Free Bond Fund
March 17, 2017
The committee chairmen have day-to-day responsibility for managing the portfolios and work with committee members in developing and executing the funds’ investment programs.
RISKS OF INVESTING IN MONEY MARKET SECURITIES
You could lose money by investing in the Fund. Although the Fund seeks to preserve the value of your investment at $1.00 per share, it cannot guarantee it will do so. The Fund may impose a fee upon the sale of your shares or may temporarily suspend your ability to sell shares if the Fund’s liquidity falls below required minimums because of market conditions or other factors. An investment in the Fund is not insured or guaranteed by the Federal Deposit Insurance Corporation or any other government agency. The Fund’s sponsor has no legal obligation to provide financial support to the Fund, and you should not expect that the sponsor will provide financial support to the Fund at any time.
RISKS OF INVESTING IN FIXED INCOME SECURITIES
Bonds are subject to interest rate risk (the decline in bond prices that usually accompanies a rise in interest rates) and credit risk (the chance that any fund holding could have its credit rating downgraded or that a bond issuer will default by failing to make timely payments of interest or principal), potentially reducing the fund’s income level and share price. The fund is less diversified than one investing nationally. Some income may be subject to state and local taxes and the federal alternative minimum tax.
GLOSSARY
Basis point: One one-hundredth of one percentage point, or 0.01%.
Bloomberg Barclays Municipal Bond Index: A broadly diversified index of tax-exempt bonds.
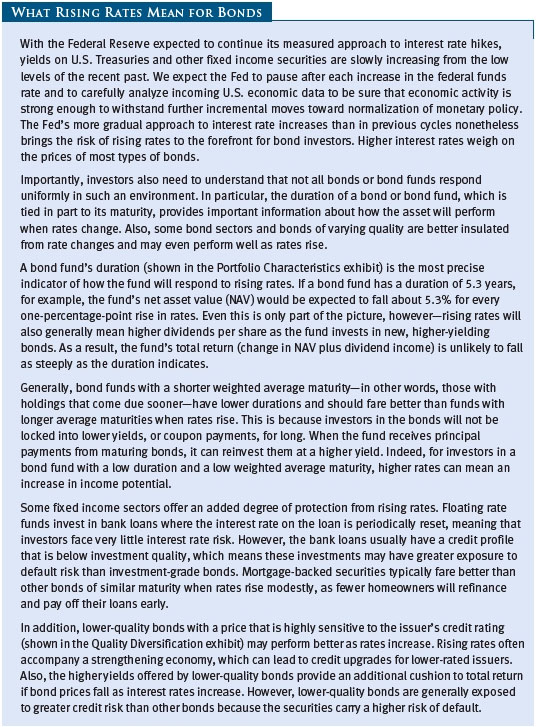
Duration: A measure of a bond fund’s sensitivity to changes in interest rates. For example, a fund with a duration of five years would fall about 5% in price in response to a one-percentage-point rise in interest rates, and vice versa.
Federal funds rate (or target rate): The interest rate charged on overnight loans of reserves by one financial institution to another in the United States. The Federal Reserve sets a target federal funds rate to affect the direction of interest rates.
General obligation (GO) debt: A government’s strongest pledge that obligates its full faith and credit, including, if necessary, its ability to raise taxes.
Gross domestic product (GDP): The total market value of all goods and services produced in a country in a given year.
Lipper averages: The averages of available mutual fund performance returns for specified time periods in categories defined by Lipper Inc.
Lipper indexes: Fund benchmarks that consist of a small number (10 to 30) of the largest mutual funds in a particular category as tracked by Lipper Inc.
Other post-employment benefits (OPEB): Benefits paid to an employee after retirement, such as premiums for life and health insurance.
Prerefunded bond: A bond that originally may have been issued as a general obligation or revenue bond but that is now secured by an escrow fund consisting entirely of direct U.S. government obligations that are sufficient for paying the bondholders.
Revenue (or revenue-backed) bond: A bond issued to fund specific projects, such as airports, bridges, hospitals, or toll roads, where a portion of the revenue generated is used to service the interest payments on the bonds.
SEC yield (7-day): A method of calculating a money fund’s yield by annualizing the fund’s net investment income for the last seven days of each period divided by the fund’s net asset value at the end of the period. Yield will vary and is not guaranteed.
SEC yield (30-day): A method of calculating a fund’s yield that assumes all portfolio securities are held until maturity. Yield will vary and is not guaranteed.
Variable rate demand note (VRDN): Generally, a debt security that requires the issuer to redeem at the holder’s discretion on a specified date or dates prior to maturity. Upon redemption, the issuer pays par to the holder who loses future coupon payments that might otherwise be due. The VRDN might be especially attractive at times of rising rates, to protect against interest rate risk by redeeming at par value and reinvesting proceeds in a new bond.
Weighted average life: A measure of a fund’s credit quality risk. In general, the longer the average life, the greater the fund’s credit quality risk. The average life is the dollar-weighted average maturity of a portfolio’s individual securities without taking into account interest rate readjustment dates. Money funds must maintain a weighted average life of less than 120 days.
Weighted average maturity: A measure of a fund’s interest rate sensitivity. In general, the longer the average maturity, the greater the fund’s sensitivity to interest rate changes. The weighted average maturity may take into account the interest rate readjustment dates for certain securities. Money funds must maintain a weighted average maturity of less than 60 days.
Yield curve: A graph depicting the relationship between yields and maturity dates for a set of similar securities. A security with a longer maturity usually has a higher yield. If a short-term security offers a higher yield, then the curve is said to be “inverted.” If short- and long-term bonds are offering equivalent yields, then the curve is said to be “flat.”
Note: Bloomberg Index Services Ltd. Copyright 2017, Bloomberg Index Services Ltd. Used with permission.
Performance and Expenses
This chart shows the value of a hypothetical $10,000 investment in the fund over the past 10 fiscal year periods or since inception (for funds lacking 10-year records). The result is compared with benchmarks, which may include a broad-based market index and a peer group average or index. Market indexes do not include expenses, which are deducted from fund returns as well as mutual fund averages and indexes.
This chart shows the value of a hypothetical $10,000 investment in the fund over the past 10 fiscal year periods or since inception (for funds lacking 10-year records). The result is compared with benchmarks, which may include a broad-based market index and a peer group average or index. Market indexes do not include expenses, which are deducted from fund returns as well as mutual fund averages and indexes.
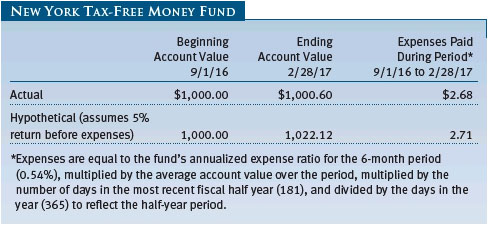
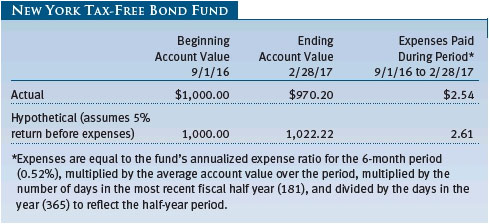
As a mutual fund shareholder, you may incur two types of costs: (1) transaction costs, such as redemption fees or sales loads, and (2) ongoing costs, including management fees, distribution and service (12b-1) fees, and other fund expenses. The following example is intended to help you understand your ongoing costs (in dollars) of investing in the fund and to compare these costs with the ongoing costs of investing in other mutual funds. The example is based on an investment of $1,000 invested at the beginning of the most recent six-month period and held for the entire period.
Actual Expenses
The first line of the following table (Actual) provides information about actual account values and expenses based on the fund’s actual returns. You may use the information on this line, together with your account balance, to estimate the expenses that you paid over the period. Simply divide your account value by $1,000 (for example, an $8,600 account value divided by $1,000 = 8.6), then multiply the result by the number on the first line under the heading “Expenses Paid During Period” to estimate the expenses you paid on your account during this period.
Hypothetical Example for Comparison Purposes
The information on the second line of the table (Hypothetical) is based on hypothetical account values and expenses derived from the fund’s actual expense ratio and an assumed 5% per year rate of return before expenses (not the fund’s actual return). You may compare the ongoing costs of investing in the fund with other funds by contrasting this 5% hypothetical example and the 5% hypothetical examples that appear in the shareholder reports of the other funds. The hypothetical account values and expenses may not be used to estimate the actual ending account balance or expenses you paid for the period.
Note: T. Rowe Price charges an annual account service fee of $20, generally for accounts with less than $10,000. The fee is waived for any investor whose T. Rowe Price mutual fund accounts total $50,000 or more; accounts electing to receive electronic delivery of account statements, transaction confirmations, prospectuses, and shareholder reports; or accounts of an investor who is a T. Rowe Price Preferred Services, Personal Services, or Enhanced Personal Services client (enrollment in these programs generally requires T. Rowe Price assets of at least $100,000). This fee is not included in the accompanying table. If you are subject to the fee, keep it in mind when you are estimating the ongoing expenses of investing in the fund and when comparing the expenses of this fund with other funds.
You should also be aware that the expenses shown in the table highlight only your ongoing costs and do not reflect any transaction costs, such as redemption fees or sales loads. Therefore, the second line of the table is useful in comparing ongoing costs only and will not help you determine the relative total costs of owning different funds. To the extent a fund charges transaction costs, however, the total cost of owning that fund is higher.
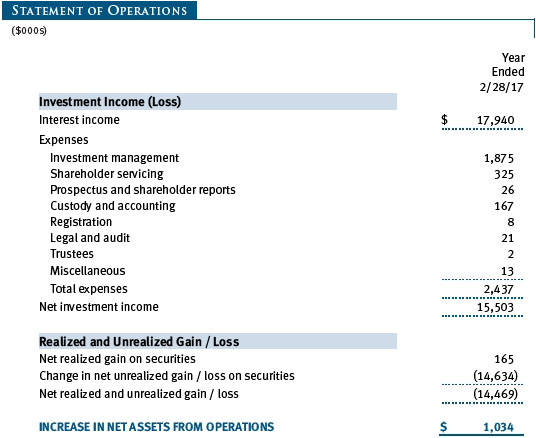
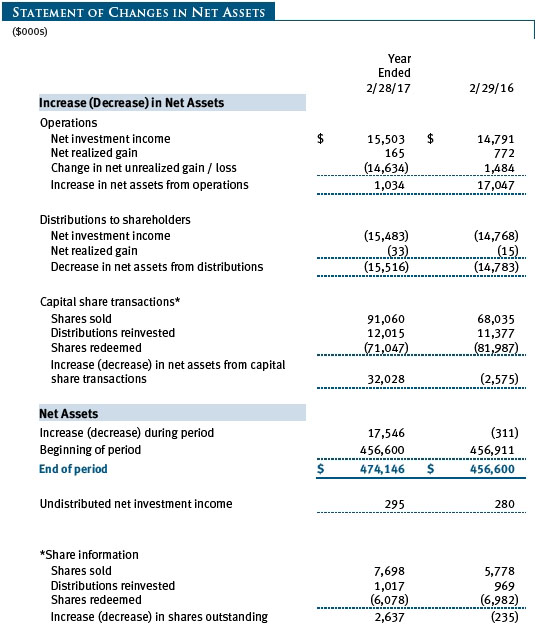
The accompanying notes are an integral part of these financial statements.
The accompanying notes are an integral part of these financial statements.
The accompanying notes are an integral part of these financial statements.
The accompanying notes are an integral part of these financial statements.
The accompanying notes are an integral part of these financial statements.
| Notes to Financial Statements |
T. Rowe Price State Tax-Free Income Trust (the trust), is registered under the Investment Company Act of 1940 (the 1940 Act). The T. Rowe Price New York Tax-Free Bond Fund (the fund) is a nondiversified, open-end management investment company established by the trust. The fund seeks to provide, consistent with prudent portfolio management, the highest level of income exempt from federal, New York state, and New York City income taxes by investing primarily in investment-grade New York municipal bonds.
NOTE 1 - SIGNIFICANT ACCOUNTING POLICIES
Basis of Preparation The fund is an investment company and follows accounting and reporting guidance in the Financial Accounting Standards Board (FASB) Accounting Standards Codification Topic 946 (ASC 946). The accompanying financial statements were prepared in accordance with accounting principles generally accepted in the United States of America (GAAP), including, but not limited to, ASC 946. GAAP requires the use of estimates made by management. Management believes that estimates and valuations are appropriate; however, actual results may differ from those estimates, and the valuations reflected in the accompanying financial statements may differ from the value ultimately realized upon sale or maturity.
Investment Transactions, Investment Income, and Distributions Income and expenses are recorded on the accrual basis. Premiums and discounts on debt securities are amortized for financial reporting purposes. Income tax-related interest and penalties, if incurred, would be recorded as income tax expense. Investment transactions are accounted for on the trade date. Realized gains and losses are reported on the identified cost basis. Income distributions are declared daily and paid monthly. Distributions to shareholders are recorded on the ex-dividend date. Capital gain distributions are generally declared and paid by the fund annually.
New Accounting Guidance In October 2016, the Securities and Exchange Commission (SEC) issued a new rule, Investment Company Report Modernization, which among other provisions, amends Regulation S-X to require standardized, enhanced disclosures, particularly related to derivatives, in investment company financial statements. Compliance with the guidance is effective for financial statements filed with the SEC on or after August 1, 2017. Adoption will have no effect on the fund’s net assets or results of operations.
NOTE 2 - VALUATION
The fund’s financial instruments are valued and its net asset value (NAV) per share is computed at the close of the New York Stock Exchange (NYSE), normally 4 p.m. ET, each day the NYSE is open for business. However, the NAV per share may be calculated at a time other than the normal close of the NYSE if trading on the NYSE is restricted, if the NYSE closes earlier, or as may be permitted by the SEC.
Fair Value The fund’s financial instruments are reported at fair value, which GAAP defines as the price that would be received to sell an asset or paid to transfer a liability in an orderly transaction between market participants at the measurement date. The T. Rowe Price Valuation Committee (the Valuation Committee) is an internal committee that has been delegated certain responsibilities by the fund’s Board of Trustees (the Board) to ensure that financial instruments are appropriately priced at fair value in accordance with GAAP and the 1940 Act. Subject to oversight by the Board, the Valuation Committee develops and oversees pricing-related policies and procedures and approves all fair value determinations. Specifically, the Valuation Committee establishes procedures to value securities; determines pricing techniques, sources, and persons eligible to effect fair value pricing actions; oversees the selection, services, and performance of pricing vendors; oversees valuation-related business continuity practices; and provides guidance on internal controls and valuation-related matters. The Valuation Committee reports to the Board and has representation from legal, portfolio management and trading, operations, risk management, and the fund’s treasurer.
Various valuation techniques and inputs are used to determine the fair value of financial instruments. GAAP establishes the following fair value hierarchy that categorizes the inputs used to measure fair value:
Level 1 – quoted prices (unadjusted) in active markets for identical financial instruments that the fund can access at the reporting date
Level 2 – inputs other than Level 1 quoted prices that are observable, either directly or indirectly (including, but not limited to, quoted prices for similar financial instruments in active markets, quoted prices for identical or similar financial instruments in inactive markets, interest rates and yield curves, implied volatilities, and credit spreads)
Level 3 – unobservable inputs
Observable inputs are developed using market data, such as publicly available information about actual events or transactions, and reflect the assumptions that market participants would use to price the financial instrument. Unobservable inputs are those for which market data are not available and are developed using the best information available about the assumptions that market participants would use to price the financial instrument. GAAP requires valuation techniques to maximize the use of relevant observable inputs and minimize the use of unobservable inputs. When multiple inputs are used to derive fair value, the financial instrument is assigned to the level within the fair value hierarchy based on the lowest-level input that is significant to the fair value of the financial instrument. Input levels are not necessarily an indication of the risk or liquidity associated with financial instruments at that level but rather the degree of judgment used in determining those values.
Valuation Techniques Debt securities generally are traded in the over-the-counter (OTC) market. Securities with remaining maturities of one year or more at the time of acquisition are valued at prices furnished by dealers who make markets in such securities or by an independent pricing service, which considers the yield or price of bonds of comparable quality, coupon, maturity, and type, as well as prices quoted by dealers who make markets in such securities. Securities with remaining maturities of less than one year at the time of acquisition generally use amortized cost in local currency to approximate fair value. However, if amortized cost is deemed not to reflect fair value or the fund holds a significant amount of such securities with remaining maturities of more than 60 days, the securities are valued at prices furnished by dealers who make markets in such securities or by an independent pricing service. Generally, debt securities are categorized in Level 2 of the fair value hierarchy; however, to the extent the valuations include significant unobservable inputs, the securities would be categorized in Level 3. Assets and liabilities other than financial instruments, including short-term receivables and payables, are carried at cost, or estimated realizable value, if less, which approximates fair value.
Thinly traded financial instruments and those for which the above valuation procedures are inappropriate or are deemed not to reflect fair value are stated at fair value as determined in good faith by the Valuation Committee. The objective of any fair value pricing determination is to arrive at a price that could reasonably be expected from a current sale. Financial instruments fair valued by the Valuation Committee are primarily private placements, restricted securities, warrants, rights, and other securities that are not publicly traded.
Subject to oversight by the Board, the Valuation Committee regularly makes good faith judgments to establish and adjust the fair valuations of certain securities as events occur and circumstances warrant. For instance, in determining the fair value of troubled or thinly traded debt instruments, the Valuation Committee considers a variety of factors, which may include, but are not limited to, the issuer’s business prospects, its financial standing and performance, recent investment transactions in the issuer, strategic events affecting the company, market liquidity for the issuer, and general economic conditions and events. In consultation with the investment and pricing teams, the Valuation Committee will determine an appropriate valuation technique based on available information, which may include both observable and unobservable inputs. The Valuation Committee typically will afford greatest weight to actual prices in arm’s length transactions, to the extent they represent orderly transactions between market participants, transaction information can be reliably obtained, and prices are deemed representative of fair value. However, the Valuation Committee may also consider other valuation methods such as a discount or premium from market value of a similar, freely traded security of the same issuer; discounted cash flows; yield to maturity; or some combination. Fair value determinations are reviewed on a regular basis and updated as information becomes available, including actual purchase and sale transactions of the issue. Because any fair value determination involves a significant amount of judgment, there is a degree of subjectivity inherent in such pricing decisions, and fair value prices determined by the Valuation Committee could differ from those of other market participants. Depending on the relative significance of unobservable inputs, including the valuation technique(s) used, fair valued securities may be categorized in Level 2 or 3 of the fair value hierarchy.
Valuation Inputs On February 28, 2017, all of the fund’s financial instruments were classified as Level 2, based on the inputs used to determine their fair values. There were no material transfers between Levels 1 and 2 during the year ended February 28, 2017.
NOTE 3 - OTHER INVESTMENT TRANSACTIONS
Consistent with its investment objective, the fund engages in the following practices to manage exposure to certain risks and/or to enhance performance. The investment objective, policies, program, and risk factors of the fund are described more fully in the fund’s prospectus and Statement of Additional Information.
Restricted Securities The fund may invest in securities that are subject to legal or contractual restrictions on resale. Prompt sale of such securities at an acceptable price may be difficult and may involve substantial delays and additional costs.
Other Purchases and sales of portfolio securities other than short-term securities aggregated $79,023,000 and $36,068,000, respectively, for the year ended February 28, 2017.
NOTE 4 - FEDERAL INCOME TAXES
No provision for federal income taxes is required since the fund intends to continue to qualify as a regulated investment company under Subchapter M of the Internal Revenue Code and distribute to shareholders all of its income and gains. Distributions determined in accordance with federal income tax regulations may differ in amount or character from net investment income and realized gains for financial reporting purposes. Financial reporting records are adjusted for permanent book/tax differences to reflect tax character but are not adjusted for temporary differences.
The fund files U.S. federal, state, and local tax returns as required. The fund’s tax returns are subject to examination by the relevant tax authorities until expiration of the applicable statute of limitations, which is generally three years after the filing of the tax return but which can be extended to six years in certain circumstances. Tax returns for open years have incorporated no uncertain tax positions that require a provision for income taxes.
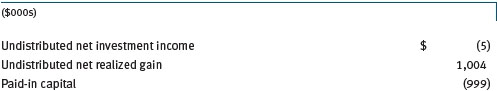
Reclassifications to paid-in capital relate primarily to expiring capital loss carryforwards. Reclassifications between income and gain relate primarily to differences between book/tax amortization policies. For the year ended February 28, 2017, the following reclassifications were recorded to reflect tax character (there was no impact on results of operations or net assets):
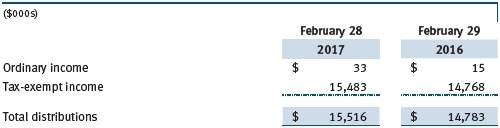
Distributions during the years ended February 28, 2017 and February 29, 2016, were characterized for tax purposes as follows:
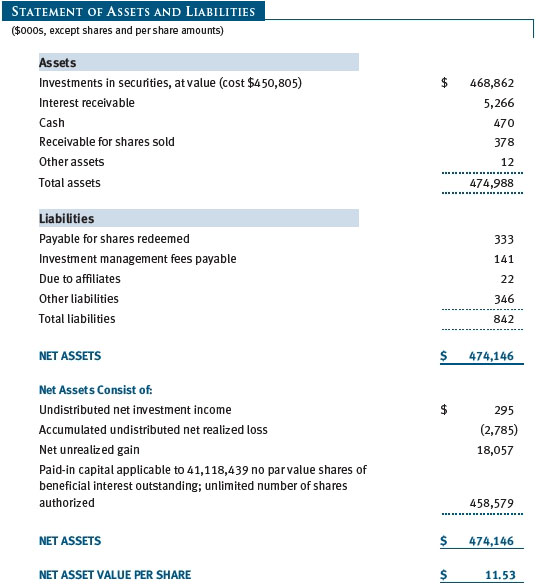
At February 28, 2017, the tax-basis cost of investments and components of net assets were as follows:
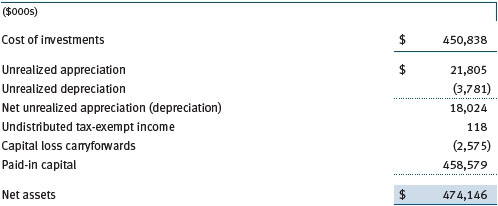
The fund intends to retain realized gains to the extent of available capital loss carryforwards. Because the fund is required to use capital loss carryforwards that do not expire before those with expiration dates, all or a portion of its capital loss carryforwards subject to expiration could ultimately go unused. During the year ended February 28, 2017, the fund utilized $151,000 of capital loss carryforwards. The fund’s available capital loss carryforwards as of February 28, 2017, expire as follows: $448,000 in fiscal 2018; $2,127,000 have no expiration.
NOTE 5 - RELATED PARTY TRANSACTIONS
The fund is managed by T. Rowe Price Associates, Inc. (Price Associates), a wholly owned subsidiary of T. Rowe Price Group, Inc. (Price Group). The investment management agreement between the fund and Price Associates provides for an annual investment management fee, which is computed daily and paid monthly. The fee consists of an individual fund fee, equal 0.10% of the fund’s average daily net assets, and a group fee. The group fee rate is calculated based on the combined net assets of certain mutual funds sponsored by Price Associates (the group) applied to a graduated fee schedule, with rates ranging from 0.48% for the first $1 billion of assets to 0.270% for assets in excess of $500 billion. The fund’s group fee is determined by applying the group fee rate to the fund’s average daily net assets. At February 28, 2017, the effective annual group fee rate was 0.29%.
In addition, the fund has entered into service agreements with Price Associates and a wholly owned subsidiary of Price Associates (collectively, Price). Price Associates provides certain accounting and administrative services to the fund. T. Rowe Price Services, Inc., provides shareholder and administrative services in its capacity as the fund’s transfer and dividend-disbursing agent. For the year ended February 28, 2017, expenses incurred pursuant to these service agreements were $74,000 for Price Associates and $123,000 for T. Rowe Price Services, Inc. The total amount payable at period-end pursuant to these service agreements is reflected as Due to Affiliates in the accompanying financial statements.
The fund may participate in securities purchase and sale transactions with other funds or accounts advised by Price Associates (cross trades), in accordance with procedures adopted by the fund’s Board and Securities and Exchange Commission rules, which require, among other things, that such purchase and sale cross trades be effected at the independent current market price of the security. Purchases and sales cross trades aggregated $2,790,000 and $6,300,000, respectively, with net realized gain of $0 for the year ended February 28, 2017.
| Report of Independent Registered Public Accounting Firm |
To the Board of Trustees of T. Rowe Price State Tax-Free Income Trust and
Shareholders of New York Tax-Free Bond Fund
In our opinion, the accompanying statement of assets and liabilities, including the portfolio of investments, and the related statements of operations and of changes in net assets and the financial highlights present fairly, in all material respects, the financial position of the New York Tax-Free Bond Fund (one of the portfolios comprising T. Rowe Price State Tax-Free Income Trust, hereafter referred to as the “Fund”) at February 28, 2017, the results of its operations for the year then ended, the changes in its net assets for each of the two years in the period then ended and the financial highlights for each of the five years in the period then ended, in conformity with accounting principles generally accepted in the United States of America. These financial statements and financial highlights (hereafter referred to as “financial statements”) are the responsibility of the Fund’s management. Our responsibility is to express an opinion on these financial statements based on our audits. We conducted our audits of these financial statements in accordance with the standards of the Public Company Accounting Oversight Board (United States). Those standards require that we plan and perform the audit to obtain reasonable assurance about whether the financial statements are free of material misstatement. An audit includes examining, on a test basis, evidence supporting the amounts and disclosures in the financial statements, assessing the accounting principles used and significant estimates made by management, and evaluating the overall financial statement presentation. We believe that our audits, which included confirmation of securities at February 28, 2017 by correspondence with the custodian, provide a reasonable basis for our opinion.
PricewaterhouseCoopers LLP
Baltimore, Maryland
April 19, 2017
| Tax Information (Unaudited) for the Tax Year Ended 2/28/17 |
We are providing this information as required by the Internal Revenue Code. The amounts shown may differ from those elsewhere in this report because of differences between tax and financial reporting requirements.
The fund’s distributions to shareholders included:
| ● | $33,000 from short-term capital gains
|
| ● | $15,524,000 which qualified as exempt-interest dividends |
| Information on Proxy Voting Policies, Procedures, and Records |
A description of the policies and procedures used by T. Rowe Price funds and portfolios to determine how to vote proxies relating to portfolio securities is available in each fund’s Statement of Additional Information. You may request this document by calling 1-800-225-5132 or by accessing the SEC’s website, sec.gov.
The description of our proxy voting policies and procedures is also available on our corporate website. To access it, please visit the following Web page:
https://www3.troweprice.com/usis/corporate/en/utility/policies.html
Scroll down to the section near the bottom of the page that says, “Proxy Voting Policies.” Click on the Proxy Voting Policies link in the shaded box.
Each fund’s most recent annual proxy voting record is available on our website and through the SEC’s website. To access it through T. Rowe Price, visit the website location shown above, and scroll down to the section near the bottom of the page that says, “Proxy Voting Records.” Click on the Proxy Voting Records link in the shaded box.
| How to Obtain Quarterly Portfolio Holdings |
The fund files a complete schedule of portfolio holdings with the Securities and Exchange Commission for the first and third quarters of each fiscal year on Form N-Q. The fund’s Form N-Q is available electronically on the SEC’s website (sec.gov); hard copies may be reviewed and copied at the SEC’s Public Reference Room, 100 F St. N.E., Washington, DC 20549. For more information on the Public Reference Room, call 1-800-SEC-0330.
| About the Fund’s Trustees and Officers |
Your fund is overseen by a Board of Trustees (Board) that meets regularly to review a wide variety of matters affecting or potentially affecting the fund, including performance, investment programs, compliance matters, advisory fees and expenses, service providers, and business and regulatory affairs. The Board elects the fund’s officers, who are listed in the final table. At least 75% of the Board’s members are independent of T. Rowe Price Associates, Inc. (T. Rowe Price), and its affiliates; “inside” or “interested” Trustees are employees or officers of T. Rowe Price. The business address of each director and officer is 100 East Pratt Street, Baltimore, Maryland 21202. The Statement of Additional Information includes additional information about the fund Trustees and is available without charge by calling a T. Rowe Price representative at 1-800-638-5660.
| Independent Trustees | | |
| |
| Name | | |
| (Year of Birth) | | |
| Year Elected* | | |
| [Number of T. Rowe Price | | Principal Occupation(s) and Directorships of Public Companies and |
| Portfolios Overseen] | | Other Investment Companies During the Past Five Years |
| | | |
| Anthony W. Deering | | Chairman, Exeter Capital, LLC, a private investment firm (2004 to |
| (1945) | | present); Director and Advisory Board Member, Deutsche Bank North |
| 1986 | | America (2004 to present); Director, Vornado Real Estate Investment |
| [187] | | Trust (2004 to 2012); Director, Under Armour (2008 to present); |
| | Director, Brixmor Real Estate Investment Trust (2012 to present) |
| | | |
| Bruce W. Duncan | | Chief Executive Officer and Director (2009 to December 2016), |
| (1951) | | Chairman of the Board (January 2016 to present), and President |
| 2013 | | (2009 to September 2016), First Industrial Realty Trust, an owner and |
| [187] | | operator of industrial properties; Chairman of the Board (2005 to |
| | September 2016) and Director (1999 to September 2016), Starwood |
| | Hotels & Resorts, a hotel and leisure company; Director, Boston |
| | Properties (May 2016 to present); Director, Marriott International, Inc. |
| | (September 2016 to present) |
| | | |
| Robert J. Gerrard, Jr. | | Advisory Board Member, Pipeline Crisis/Winning Strategies, a |
| (1952) | | collaborative working to improve opportunities for young African |
| 2013 | | Americans (1997 to present) |
| [187] | | |
| | | |
| Paul F. McBride | | Advisory Board Member, Vizzia Technologies (2015 to present) |
| (1956) | | |
| 2013 | | |
| [187] | | |
| | | |
| Cecilia E. Rouse, Ph.D. | | Dean, Woodrow Wilson School (2012 to present); Professor and |
| (1963) | | Researcher, Princeton University (1992 to present); Member of |
| 2013 | | National Academy of Education (2010 to present); Director, MDRC, |
| [187] | | a nonprofit education and social policy research organization (2011 |
| | to present); Research Associate of Labor Studies Program (2011 |
| | to 2015) and Board Member (2015 to present), National Bureau |
| | of Economic Research (2011 to present); Chair of Committee |
| | on the Status of Minority Groups in the Economic Profession |
| | (2012 to present); Vice President (2015 to present), American |
| | Economic Association |
| | | |
| John G. Schreiber | | Owner/President, Centaur Capital Partners, Inc., a real estate |
| (1946) | | investment company (1991 to present); Cofounder, Partner, and |
| 1992 | | Cochairman of the Investment Committee, Blackstone Real Estate |
| [187] | | Advisors, L.P. (1992 to 2015); Director, General Growth Properties, |
| | Inc. (2010 to 2013); Director, Blackstone Mortgage Trust, a real |
| | estate finance company (2012 to 2016); Director and Chairman of |
| | the Board, Brixmor Property Group, Inc. (2013 to present); Director, |
| | Hilton Worldwide (2013 to present); Director, Hudson Pacific |
| | Properties (2014 to 2016) |
| | | |
| Mark R. Tercek | | President and Chief Executive Officer, The Nature Conservancy (2008 |
| (1957) | | to present) |
| 2009 | | |
| [187] | | |
| |
| *Each independent trustee serves until retirement, resignation, or election of a successor. |
| Inside Trustees | | |
| |
| Name | | |
| (Year of Birth) | | |
| Year Elected* | | |
| [Number of T. Rowe Price | | Principal Occupation(s) and Directorships of Public Companies and |
| Portfolios Overseen] | | Other Investment Companies During the Past Five Years |
| | | |
| Edward C. Bernard | | Director and Vice President, T. Rowe Price; Vice Chairman of the |
| (1956) | | Board, Director, and Vice President, T. Rowe Price Group, Inc.; |
| 2006 | | Chairman of the Board, Director, and Vice President, T. Rowe Price |
| [187] | | Investment Services, Inc., and T. Rowe Price Services, Inc.; Chairman |
| | of the Board and Director, T. Rowe Price Retirement Plan Services, |
| | Inc.; Chairman of the Board, Chief Executive Officer, Director, and |
| | President, T. Rowe Price International and T. Rowe Price Trust |
| | Company; Chairman of the Board, all funds |
| | | |
| Edward A. Wiese, CFA | | Vice President, T. Rowe Price, T. Rowe Price Group, Inc., T. Rowe |
| (1959) | | Price International, and T. Rowe Price Trust Company; Vice President, |
| 2015 | | State Tax-Free Income Trust |
| [56] | | |
| |
| *Each inside trustee serves until retirement, resignation, or election of a successor. |
| Officers | | |
| |
| Name (Year of Birth) | | |
| Position Held With State Tax-Free Income Trust | | Principal Occupation(s) |
| | | |
| Austin Applegate (1974) | | Vice President, T. Rowe Price and T. Rowe Price |
| Vice President | | Group, Inc. |
| | | |
| R. Lee Arnold, Jr., CFA, CPA (1970) | | Vice President, T. Rowe Price and T. Rowe Price |
| Vice President | | Group, Inc. |
| | | |
| Darrell N. Braman (1963) | | Vice President, Price Hong Kong, Price |
| Vice President and Secretary | | Singapore, T. Rowe Price, T. Rowe Price Group, |
| | Inc., T. Rowe Price International, T. Rowe Price |
| | Investment Services, Inc., and T. Rowe Price |
| | Services, Inc. |
| | | |
| M. Helena Condez (1962) | | Vice President, T. Rowe Price and T. Rowe Price |
| Vice President | | Group, Inc. |
| | | |
| G. Richard Dent (1960) | | Vice President, T. Rowe Price and T. Rowe Price |
| Vice President | | Group, Inc. |
| | | |
| Charles E. Emrich (1961) | | Vice President, T. Rowe Price and T. Rowe Price |
| Vice President | | Group, Inc. |
| | | |
| Sarah J. Engle (1979) | | Vice President, T. Rowe Price and T. Rowe Price |
| Vice President | | Group, Inc. |
| | | |
| Stephanie A. Gentile, CFA (1956) | | Vice President, T. Rowe Price; formerly, Director, |
| Vice President | | Credit Suisse Securities (to 2014) |
| | | |
| John R. Gilner (1961) | | Chief Compliance Officer and Vice President, |
| Chief Compliance Officer | | T. Rowe Price; Vice President, T. Rowe Price |
| | Group, Inc., and T. Rowe Price Investment |
| | Services, Inc. |
| | | |
| Charles B. Hill, CFA (1961) | | Vice President, T. Rowe Price and T. Rowe Price |
| Executive Vice President | | Group, Inc. |
| | | |
| Dylan Jones, CFA (1971) | | Vice President, T. Rowe Price and T. Rowe Price |
| Vice President | | Group, Inc. |
| | | |
| Marianna Korpusova, CFA (1984) | | Vice President, T. Rowe Price and T. Rowe Price |
| Vice President | | Group, Inc.; formerly, student, The University of |
| | Chicago (to 2014) |
| | | |
| Paul J. Krug, CPA (1964) | | Vice President, T. Rowe Price, T. Rowe Price |
| Vice President | | Group, Inc., and T. Rowe Price Trust Company |
| | | |
| Marcy M. Lash (1963) | | Vice President, T. Rowe Price and T. Rowe Price |
| Vice President | | Group, Inc. |
| | | |
| Alan D. Levenson, Ph.D. (1958) | | Vice President, T. Rowe Price and T. Rowe Price |
| Vice President | | Group, Inc. |
| | | |
| Joseph K. Lynagh, CFA (1958) | | Vice President, T. Rowe Price, T. Rowe Price |
| Executive Vice President | | Group, Inc., and T. Rowe Price Trust Company |
| | | |
| James T. Lynch, CFA (1983) | | Vice President, T. Rowe Price |
| Vice President | | |
| | | |
| Konstantine B. Mallas (1963) | | Vice President, T. Rowe Price and T. Rowe Price |
| Executive Vice President | | Group, Inc. |
| | | |
| Catherine D. Mathews (1963) | | Vice President, T. Rowe Price, T. Rowe Price |
| Treasurer and Vice President | | Group, Inc., and T. Rowe Price Trust Company |
| | | |
| Hugh D. McGuirk, CFA (1960) | | Vice President, T. Rowe Price and T. Rowe Price |
| President | | Group, Inc. |
| | | |
| James M. Murphy, CFA (1967) | | Vice President, T. Rowe Price and T. Rowe Price |
| Vice President | | Group, Inc. |
| | | |
| Linda A. Murphy (1959) | | Vice President, T. Rowe Price and T. Rowe Price |
| Vice President | | Group, Inc. |
| | | |
| David Oestreicher (1967) | | Director, Vice President, and Secretary, T. Rowe |
| Vice President | | Price Investment Services, Inc., T. Rowe Price |
| | Retirement Plan Services, Inc., T. Rowe |
| | Price Services, Inc., and T. Rowe Price Trust |
| | Company; Chief Legal Officer, Vice President, |
| | and Secretary, T. Rowe Price Group, Inc.; Vice |
| | President and Secretary, T. Rowe Price and |
| | T. Rowe Price International; Vice President, |
| | Price Hong Kong and Price Singapore |
| | | |
| John W. Ratzesberger (1975) | | Vice President, T. Rowe Price, T. Rowe Price |
| Vice President | | Group, Inc., and T. Rowe Price Trust Company; |
| | formerly, North American Head of Listed |
| | Derivatives Operation, Morgan Stanley |
| | (to 2013) |
| | | |
| Shannon H. Rauser (1987) | | Employee, T. Rowe Price |
| Assistant Secretary | | |
| | | |
| Deborah D. Seidel (1962) | | Vice President, T. Rowe Price, T. Rowe Price |
| Vice President | | Group, Inc., T. Rowe Price Investment Services, |
| | Inc., and T. Rowe Price Services, Inc. |
| | | |
| Chen Shao (1980) | | Vice President, T. Rowe Price |
| Vice President | | |
| | | |
| Douglas D. Spratley, CFA (1969) | | Vice President, T. Rowe Price and T. Rowe Price |
| Vice President | | Group, Inc. |
| | | |
| Timothy G. Taylor, CFA (1975) | | Vice President, T. Rowe Price and T. Rowe Price |
| Vice President | | Group, Inc. |
| | | |
| Robert D. Thomas (1971) | | Vice President, T. Rowe Price Group, Inc., and |
| Vice President | | T. Rowe Price International |
| |
| Unless otherwise noted, officers have been employees of T. Rowe Price or T. Rowe Price International for at least 5 years. |
Item 2. Code of Ethics.
The registrant has adopted a code of ethics, as defined in Item 2 of Form N-CSR, applicable to its principal executive officer, principal financial officer, principal accounting officer or controller, or persons performing similar functions. A copy of this code of ethics is filed as an exhibit to this Form N-CSR. No substantive amendments were approved or waivers were granted to this code of ethics during the period covered by this report.
Item 3. Audit Committee Financial Expert.
The registrant’s Board of Directors/Trustees has determined that Mr. Bruce W. Duncan qualifies as an audit committee financial expert, as defined in Item 3 of Form N-CSR. Mr. Duncan is considered independent for purposes of Item 3 of Form N-CSR.
Item 4. Principal Accountant Fees and Services.
(a) – (d) Aggregate fees billed for the last two fiscal years for professional services rendered to, or on behalf of, the registrant by the registrant’s principal accountant were as follows:
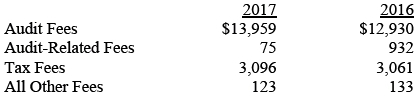
Audit fees include amounts related to the audit of the registrant’s annual financial statements and services normally provided by the accountant in connection with statutory and regulatory filings. Audit-related fees include amounts reasonably related to the performance of the audit of the registrant’s financial statements and specifically include the issuance of a report on internal controls and, if applicable, agreed-upon procedures related to fund acquisitions. Tax fees include amounts related to services for tax compliance, tax planning, and tax advice. The nature of these services specifically includes the review of distribution calculations and the preparation of Federal, state, and excise tax returns. All other fees include the registrant’s pro-rata share of amounts for agreed-upon procedures in conjunction with service contract approvals by the registrant’s Board of Directors/Trustees.
(e)(1) The registrant’s audit committee has adopted a policy whereby audit and non-audit services performed by the registrant’s principal accountant for the registrant, its investment adviser, and any entity controlling, controlled by, or under common control with the investment adviser that provides ongoing services to the registrant require pre-approval in advance at regularly scheduled audit committee meetings. If such a service is required between regularly scheduled audit committee meetings, pre-approval may be authorized by one audit committee member with ratification at the next scheduled audit committee meeting. Waiver of pre-approval for audit or non-audit services requiring fees of a de minimis amount is not permitted.
(2) No services included in (b) – (d) above were approved pursuant to paragraph (c)(7)(i)(C) of Rule 2-01 of Regulation S-X.
(f) Less than 50 percent of the hours expended on the principal accountant’s engagement to audit the registrant’s financial statements for the most recent fiscal year were attributed to work performed by persons other than the principal accountant’s full-time, permanent employees.
(g) The aggregate fees billed for the most recent fiscal year and the preceding fiscal year by the registrant’s principal accountant for non-audit services rendered to the registrant, its investment adviser, and any entity controlling, controlled by, or under common control with the investment adviser that provides ongoing services to the registrant were $1,840,000 and $2,042,000, respectively.
(h) All non-audit services rendered in (g) above were pre-approved by the registrant’s audit committee. Accordingly, these services were considered by the registrant’s audit committee in maintaining the principal accountant’s independence.
Item 5. Audit Committee of Listed Registrants.
Not applicable.
Item 6. Investments.
(a) Not applicable. The complete schedule of investments is included in Item 1 of this Form N-CSR.
(b) Not applicable.
Item 7. Disclosure of Proxy Voting Policies and Procedures for Closed-End Management Investment Companies.
Not applicable.
Item 8. Portfolio Managers of Closed-End Management Investment Companies.
Not applicable.
Item 9. Purchases of Equity Securities by Closed-End Management Investment Company and Affiliated Purchasers.
Not applicable.
Item 10. Submission of Matters to a Vote of Security Holders.
Not applicable.
Item 11. Controls and Procedures.
(a) The registrant’s principal executive officer and principal financial officer have evaluated the registrant’s disclosure controls and procedures within 90 days of this filing and have concluded that the registrant’s disclosure controls and procedures were effective, as of that date, in ensuring that information required to be disclosed by the registrant in this Form N-CSR was recorded, processed, summarized, and reported timely.
(b) The registrant’s principal executive officer and principal financial officer are aware of no change in the registrant’s internal control over financial reporting that occurred during the registrant’s second fiscal quarter covered by this report that has materially affected, or is reasonably likely to materially affect, the registrant’s internal control over financial reporting.
Item 12. Exhibits.
(a)(1) The registrant’s code of ethics pursuant to Item 2 of Form N-CSR is attached.
(2) Separate certifications by the registrant's principal executive officer and principal financial officer, pursuant to Section 302 of the Sarbanes-Oxley Act of 2002 and required by Rule 30a-2(a) under the Investment Company Act of 1940, are attached.
(3) Written solicitation to repurchase securities issued by closed-end companies: not applicable.
(b) A certification by the registrant's principal executive officer and principal financial officer, pursuant to Section 906 of the Sarbanes-Oxley Act of 2002 and required by Rule 30a-2(b) under the Investment Company Act of 1940, is attached.
SIGNATURES
Pursuant to the requirements of the Securities Exchange Act of 1934 and the Investment Company Act of 1940, the registrant has duly caused this report to be signed on its behalf by the undersigned, thereunto duly authorized.
T. Rowe Price State Tax-Free Income Trust
| By | /s/ Edward C. Bernard |
| | Edward C. Bernard |
| | Principal Executive Officer |
| | |
| Date April 19, 2017 | | |
Pursuant to the requirements of the Securities Exchange Act of 1934 and the Investment Company Act of 1940, this report has been signed below by the following persons on behalf of the registrant and in the capacities and on the dates indicated.
| By | /s/ Edward C. Bernard |
| | Edward C. Bernard |
| | Principal Executive Officer |
| | |
| Date April 19, 2017 | | |
| | |
| | |
| By | /s/ Catherine D. Mathews |
| | Catherine D. Mathews |
| | Principal Financial Officer |
| | |
| Date April 19, 2017 | | |