UNITED STATES
SECURITIES AND EXCHANGE COMMISSION
Washington, D.C. 20549
FORM N-CSR
CERTIFIED SHAREHOLDER REPORT OF REGISTERED
MANAGEMENT INVESTMENT COMPANIES
Investment Company Act File Number: 811-04521
| T. Rowe Price State Tax-Free Funds, Inc. |
|
| (Exact name of registrant as specified in charter) |
| |
| 100 East Pratt Street, Baltimore, MD 21202 |
|
| (Address of principal executive offices) |
| |
| David Oestreicher |
| 100 East Pratt Street, Baltimore, MD 21202 |
|
| (Name and address of agent for service) |
Registrant’s telephone number, including area code: (410) 345-2000
Date of fiscal year end: February 28
Date of reporting period: February 28, 2018
Reason for filing form N-CSR/A: Correction of typographical error
Item 1. Report to Shareholders
| Maryland Tax-Free Bond Fund | February 28, 2018 |
The views and opinions in this report were current as of February 28, 2018. They are not guarantees of performance or investment results and should not be taken as investment advice. Investment decisions reflect a variety of factors, and the managers reserve the right to change their views about individual stocks, sectors, and the markets at any time. As a result, the views expressed should not be relied upon as a forecast of the fund’s future investment intent. The report is certified under the Sarbanes-Oxley Act, which requires mutual funds and other public companies to affirm that, to the best of their knowledge, the information in their financial reports is fairly and accurately stated in all material respects.
REPORTS ON THE WEB
Sign up for our Email Program, and you can begin to receive updated fund reports and prospectuses online rather than through the mail. Log in to your account at troweprice.com for more information.
Manager’s Letter
Fellow Shareholders
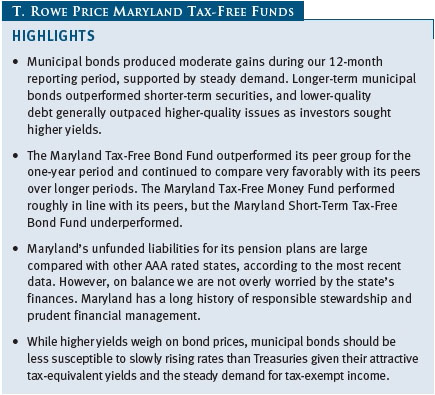
Tax-free municipal bonds produced moderate gains but outperformed taxable bonds as Treasury interest rates increased in the 12-month period ended February 28, 2018. The Bloomberg Barclays Municipal Bond Index returned 2.50% versus 0.51% for the Bloomberg Barclays U.S. Aggregate Bond Index. Throughout most of our fiscal year, municipal securities were supported by strong demand and limited issuance. However, there was a surge of new supply in late 2017, as municipalities accelerated issuance amid uncertainty surrounding tax reform and its possible impact on municipal bonds. The Maryland Tax-Free Funds all produced positive results for the 12-month period, but their performance relative to their peers varied. The Maryland Tax-Free Bond Fund outperformed, the Maryland Tax-Free Money Fund performed roughly in line with its peers, and the Maryland Short-Term Tax-Free Bond Fund underperformed.
ECONOMY AND INTEREST RATES
According to the most recent estimate, the U.S. economy expanded at a solid 2.5% annual rate in the fourth quarter of 2017, in line with the average over the first three quarters of the year. The U.S. labor market has been healthy, with the national unemployment rate holding at a 17-year low of 4.1% in the last few months. Inflation, while still low, is rising from its mid-2017 low and is likely to increase further in 2018 amid rising wages and expectations for stronger economic growth.
Citing the strengthening labor market and expectations that inflation would move higher over the medium term, the Federal Reserve raised short-term interest rates three times over the last year, lifting the federal funds target rate to a range of 1.25% to 1.50% by the end of February 2018. After our reporting period ended, the Fed raised rates again at its March 20–21 monetary policy meeting; the central bank is expectedto raise rates at least two more times in 2018. Additionally, in October 2017, the Fed began the process of slowly unwinding its $4.5 trillion balance sheet, a legacy of its massive purchases of Treasury bonds and mortgage-backed securities in the aftermath of the 2008 financial crisis, by slowing reinvestment of principal payments from its holdings.

In the closing months of our reporting period,the 10-year Treasury note yield climbed to a four-year high in anticipation of faster economic growth and higher inflation stemming from tax cuts, increased government spending, and stronger wage growth. Yields on short- and intermediate-term municipal securities also increased over the last year, as the Fed continued to gradually reverse its highly accommodative monetary policy. Long-term yields rose only slightly as the yields on 30-year municipal bonds rated AAA were virtually unchanged from 12 months ago. The result was a flatter municipal yield curve. At the end of February, high-quality 30-year muni yields were modestly lower than the 30-year Treasury yield but still offer relative value for many fixed income investors on an after-tax basis.
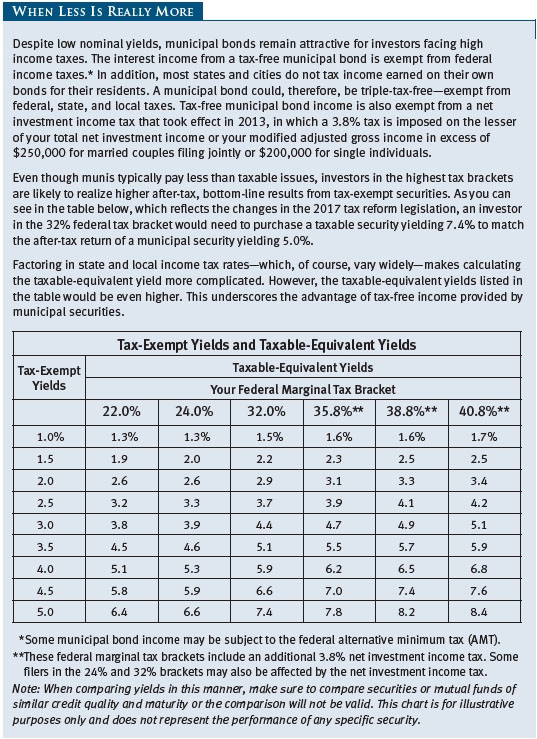
As an illustration of their relative attractiveness, on February 28, 2018, the 3.06% yield offered by a 30-year tax-free general obligation (GO) bond rated AAA was about 98% of the 3.13% pretax yield offered by a 30-year Treasury bond. Including the 3.8% net investment income tax that took effect in 2013 as part of the Affordable Care Act (ACA), the top marginal federal tax rate (after tax reform) stood at 40.8%. An investor in this tax bracket would need to invest in a taxable bond of similar credit quality and maturity yielding about 5.17% to receive the same after-tax income as that generated by the municipal bond. (To calculate a municipal bond’s taxable-equivalent yield, divide the yield by the quantity of 1.00 minus your federal tax bracket expressed as a decimal—in this case, 1.00–0.408, or 0.592.)
MUNICIPAL MARKET NEWS
According toThe Bond Buyer, total municipal bond issuance in 2017 was approximately $436 billion, about 3% lower than 2016’s record total. Supply spiked in the fourth quarter as issuers rushed to bring new deals ahead of any potential tax law changes, but mostly positive fund flows helped absorb the new supply. The quarter was marked by concerns that the new tax law would no longer allow the tax-exempt issuance of private activity bonds (PABs), which can be used to fund projects such as hospitals and airports. Ultimately, the new tax law eliminated advance refundings, which had allowed issuers to refinanceexisting debt with new bonds, but PAB issuers retained their ability to issue tax-exempt debt. Issuance in the first two months of 2018 was meager because municipalities had accelerated a substantial amount of planned 2018 issuance into late 2017.
Generally, fundamentals for municipal issuers remain solid, and most issuers in the $3.8 trillion municipal bond market have been fiscally responsible. State and local governments, in general, have been cautious about adding to indebtedness since the 2008–2009 financialcrisis, and a strengthening economy has helped tax revenues rebound. Over 60% of the market, as measured by the Bloomberg Barclays Municipal Bond Index, is AAA or AA rated.
Although the market is overwhelmingly high quality, many states and municipalities are grappling with underfunded pensions and other post-employment benefit (OPEB) obligations. New reporting rules from the Governmental Accounting Standards Board are bringing greater transparency to state and local governments’ pension funding gaps, long-term risks that investors often overlooked in the past.
Bonds from some troubled municipal issuers, such as Illinois and New Jersey, outperformed the broad municipal market over the last 12 months, as their higher yields attracted investors. In October, Illinois issued a total of $6 billion of new bonds to help pay a portion of the backlog of bills it ran up during its multiyear budget standoff that was finally resolved in July 2017. Illinois has the lowest credit rating of any state and was teetering on the verge of a downgrade to the below investment-grade category before passing a budget.
Puerto Rico’s debt remained under pressure, and its long path to recovery was derailed by the catastrophic damage caused by Hurricane Maria last September. Even before the storm, Puerto Rico was inbankruptcy as the financial oversight board had filed petitions with the U.S. District Court seeking help with what could amount to the largest restructuring of municipal debt in U.S. history.
Longer-term municipal bonds outperformed shorter-term securities over the year, and lower-quality debt generally outpaced higher-quality issues as investors sought higher yields. Most major segments of the municipal market generated positive returns. Revenue bonds outperformed general obligation debt, but prerefunded bonds were flat as rising short-term yields offset income. All subsectors of investment-grade revenue bonds produced positive returns, led by industrial/pollution control, hospital, and leasing revenue debt, while the special tax and power subsectors lagged the broader index. High yield tobacco debt outperformed other municipal segments, returning more than 7% during our fiscal year.
MARYLAND MARKET NEWS
Maryland’s economy remains strong compared with other states. Marylanders are relatively prosperous—per capita income represents 118% of the national average, ranking the state fifth in the U.S. Personal income growth in the state, at 2.7%, has slightly exceeded the overall U.S. growth rate of 2.6% for the 12 months ended September 30, 2017. The state’s unemployment rate declined from 4.4% to 4.1% over the past year and is in line with the 4.1% national unemployment rate. Maryland’s population growth rate over the past five years has slightly lagged that of the nation as a whole.
Revenue performance improved in fiscal 2017, with collections coming in 3.1% higher than in fiscal 2016. Revenues outperformed budget expectations by $88 million (0.9%). The outperformance came from both individual and corporate income taxes, with sales tax receipts lagging. For the first time in three years, Maryland had a net general fund deficit in fiscal 2017 of $438 million (1.5% of general fund revenue). Despite strong revenue growth, general fund expenses, particularly related to Medicaid, increased by 5.3% during the fiscal year.
The state has always maintained a good cushion in its rainy day fund—on June 30, 2017, Maryland’s revenue stabilization fund held $832 million, representing a solid 5.1% of general fund tax revenue. The state balanced its budget for fiscal 2018, and the budget was delivered on time. The December 2017 Board of Revenues updatedecreased fiscal 2018 revenue expectations by $103 million from the March revenue estimate. New figures suggest tax revenue will grow by 3.2% from fiscal 2017.
Maryland’s debt load is above the national average. According to Moody’s2017 State Debt Medians Report, the state’s debt burden, at $12.8 billion, is in the upper fourth when measured by debt per capita and only modestly better (top third) when measured by debt to personal income. Debt service as a percentage of the budget remained manageable at 4.9% in fiscal 2017 (the latest data available).
Unfavorably, Maryland’s pension system was only funded at 69% on an actuarial basis as of June 30, 2017. Maryland’s practice of not fully funding its actuarially required contributions has led to a rise in its unfunded pension liability. As a result, Maryland’s unfunded liabilities for its pension plans were $20 billion as of June 30, 2017—a significant rise from $10 billion as of June 30, 2008, and a large amount compared with other AAA rated states. Various modifications to benefits under these programs as well as higher employee contributions have been imposed to reduce liabilities and improve funding, and we are closely monitoring Maryland’s progress in this regard.
Pension issues aside, on balance we are not overly worried by Maryland’s finances. Maryland has a long history of responsible stewardship and prudent financial management. The state’s GO bonds are rated Aaa by Moody’s Investors Service and AAA by S&P and Fitch. All three rating agencies maintain stable outlooks.
PORTFOLIO REVIEW
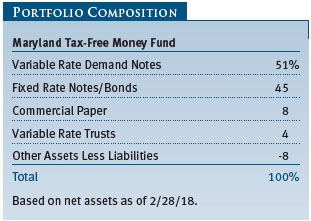
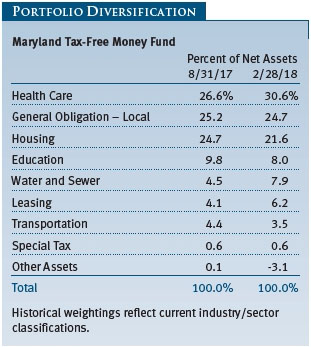
Maryland Tax-Free Money Fund
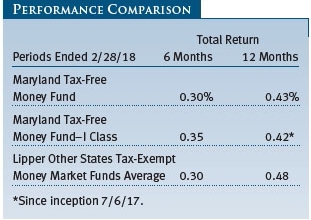
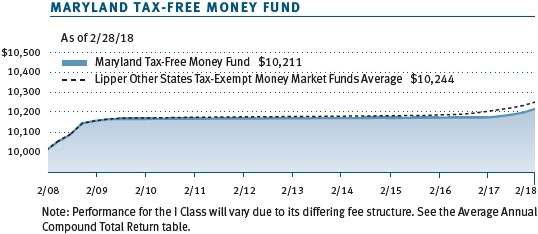
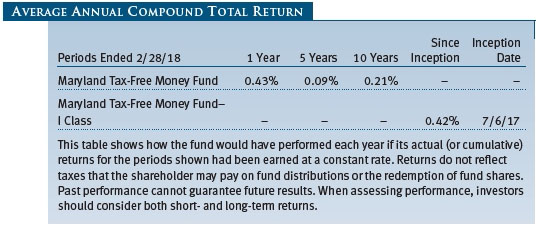
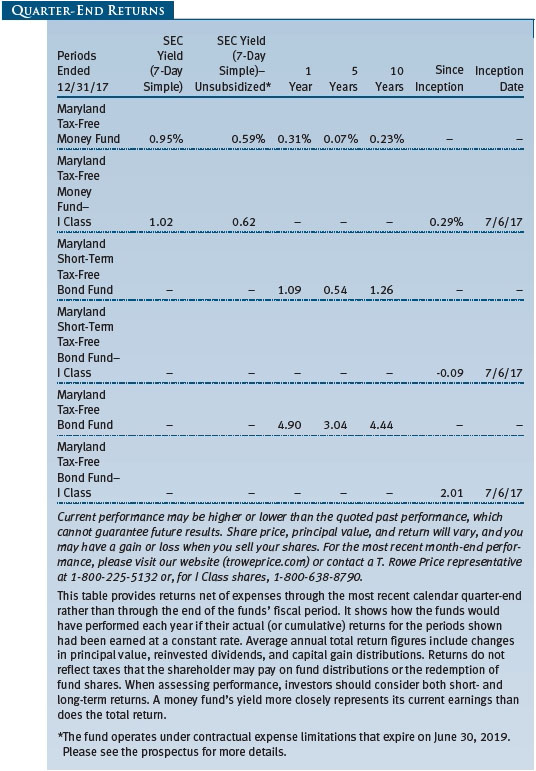
Your fund returned 0.30% and 0.43% for the 6- and 12-month periods ended February 28, 2018, respectively. Its peer group, represented by the Lipper Other States Tax-Exempt Money Market Funds Average, returned 0.30% and 0.48% for the respective periods. (Performance varies for the I Class shares, reflecting their different fee structure.)
With both tax reform and a federal debt ceiling resolution behind us, the market’s focus is once again on interest rates, market volatility, the economy, and, of course, the intentions of the Federal Reserve. Newleadership at the Fed and other membership changes bring some uncertainties as to the pace of expected rate increases as well as how far the Fed can tighten without bringing about an end to the current market cycle. Currently, the market is expecting three interest rate increases this year (including the one in March that occurred after our reporting period). The municipal money market—heavily influenced by the technical forces of supply and demand—has yet to fully reflect this broader sentiment in its pricing.
Our focus in the management of the fund brings together these two themes: We expect continued tightening by the Fed, while we acknowledge that the municipal money market often marches to the beat of a different drummer—in this case, the changing supply/demand framework. Further complicating the near-term outlook is thequestion of what impact, if any, tax reform will have on the municipal money market. Lower marginal rates suggest that, going forward, the relationship of tax-exempt rates to taxable rates must change. However, market and investor behaviors can take time to play out, and we have yet to see such changes occur. Thus, afteryears of central bank-induced rate and volatility suppression, rates are on the move and market volatility has returned.
Overall levels of short-term municipal rates have moved higher since our last report, though the impacts of Fed rate increases, Fed balancesheet normalization, and increased U.S. Treasury debt issuance have yet to be fully felt in the municipal money market. Factors limiting upside movement in municipal rates have included decreased supply, interest from nontraditional buyers of short-term municipal paper, and favorable tax relationships through much of 2017. We expect these factors to slowly dissipate in importance as we move through 2018.
Seven-day yields for Maryland securities have averaged 1.04% since our last report, comparedwith an average of 0.81% for the prior six months. Yields of one-year Maryland securities have increased more, rising from 0.91% to 1.37% over the second half of our fiscal year. Money market securities with longer maturities remain somewhat expensive compared with historicalaverages and do not fully reflect our expectations for multiple rate increases this year. We would expect an uptick in longer-dated supply to force a repricing to higher yields in the near future.
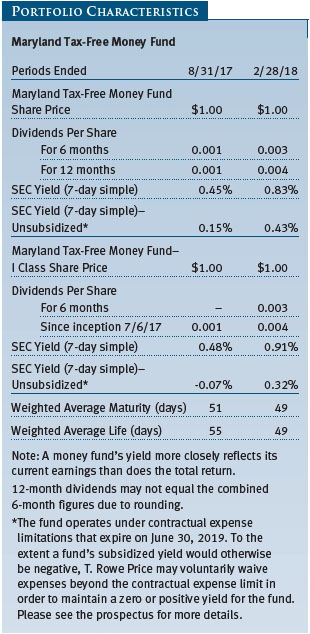
With our expectation of higher interest rates through 2018 and into 2019, our focus in managing the fund has been on building positions in the front end of the yield curve while we await price adjustments in the longer end of the curve. As shown in the Portfolio Characteristics table on page 7, the fund’s weighted average maturity and weighted average life shortened over the past six months. Increasing exposure to commercial paper with maturities of 60 to 90 days has allowed us to avoid what we deem as overly rich levels in longer maturities. Our strategy has worked well thus far, giving us the opportunity to quickly adjust as the yield curve rights itself.
Credit quality continues to play a significant part in asset selection. At the end of the period, we had higher exposures in hospital, housing, and education revenue bonds, as well as general obligation debt. Some prominent positions in the portfolio includeTrinity Health,Johns Hopkins University,Baltimore County, andThe University of Maryland Medical System. (Please refer to the fund’s portfolio of investments for a complete list of holdings and the amount each represents in the portfolio.)
Going forward, we expect a continuation of recent Fed policy. Barring some exogenous shock, at least three rate increases of 25 basis points each are likely in 2018. Our investing strategy and fund positioning will reflect that rising rate outlook.
Maryland Short-Term Tax-Free Bond Fund
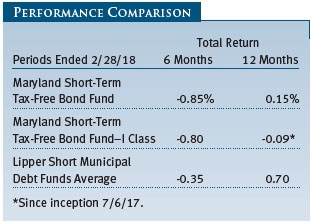
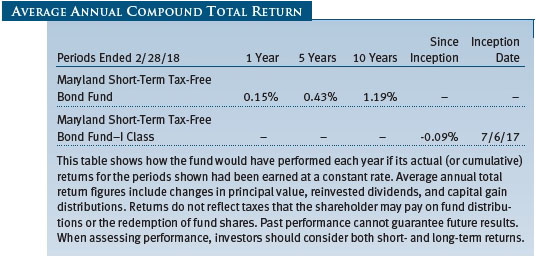
The Maryland Short-Term Tax-Free Bond Fund returned 0.15% for the 12-month period ended February 28, 2018, underperforming our peer group, the Lipper Short Municipal Debt Funds Average, whichreturned 0.70%, and the Bloomberg Barclays 1–3 Year Municipal Bond Index, which posted a return of 0.61%. Solid results in the first half of our fiscal year were offset by negative returns in the last six months of our annual reporting period. (Performance varies for the I Class shares, reflecting their different fee structure.)
Our longer average duration and our positioning in longer-maturity bonds were beneficial in the first half of our fiscal year as the yield curve flattened. However, this positioning worked against us later in the period as yields rose and the curve steepened. As shown in the Portfolio Characteristics table, the fund’s weighted average maturity and duration were unchanged over the last six months.

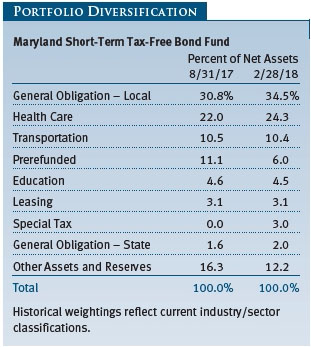
Our position in local GO bonds has increased since our last report six months ago. While our preference for revenue bonds over GOs remains intact, it has become challenging to findopportunities in revenue debt over the past couple of years in the short- to intermediate-term municipal market. Some of our notable purchases during the period in the local GO sector included bonds fromBaltimore CityandMontgomery County. (Please refer to the fund’s portfolio of investments for a complete list of holdings and the amount each represents in the portfolio.)
In the revenue sector, the fund’s largest allocations are to health care, transportation, and education. Our substantial overweight to health care bonds and our security selection within the sector contributed to relative performance over the one-year period. The defeat of efforts to repeal the Affordable Care Act provided reassurance for investors in the sector. We purchased health care bonds issued by MD Health and Higher Education Authority forMedstar Healthand forLifebridge Health.
The portfolio’s underweight to the prerefunded debt sector contributed to relative performance over the last 12 months as the high-quality but lower-yielding sector underperformed the broad municipal market. We reduced the portfolio’s allocation to prerefunded bonds over the past six months as the rising rate environment provided us with the opportunity to invest in securities that offered higher risk-adjusted yields.
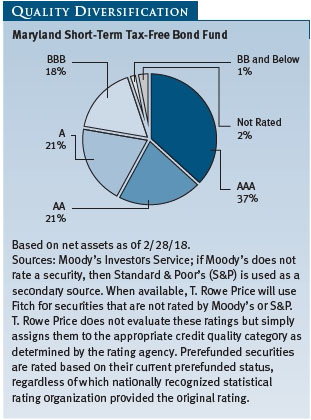
As shown in the Quality Diversification chart, investment-grade issues made up nearly all of the portfolio at the end of the period. Given our limited opportunities to buy lower-rated, higher-yielding short-term Maryland debt, the majority of the portfolio is allocated to AAA and AA rated bonds. However, during the 12-month period, that allocation ticked down modestly from 61% to 58% as we continued to look for attractive opportunities among lower-rated bonds.
Maryland Tax-Free Bond Fund
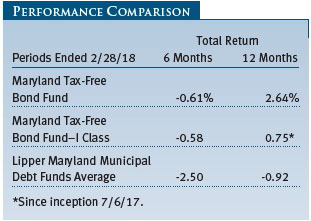
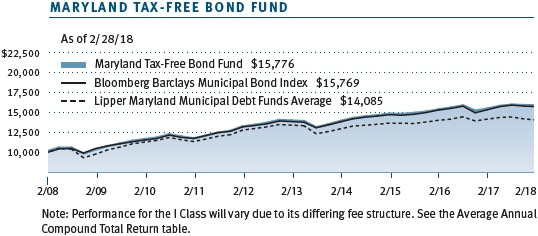
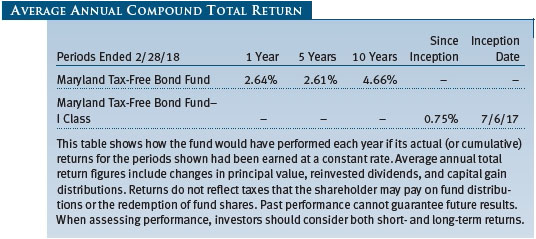
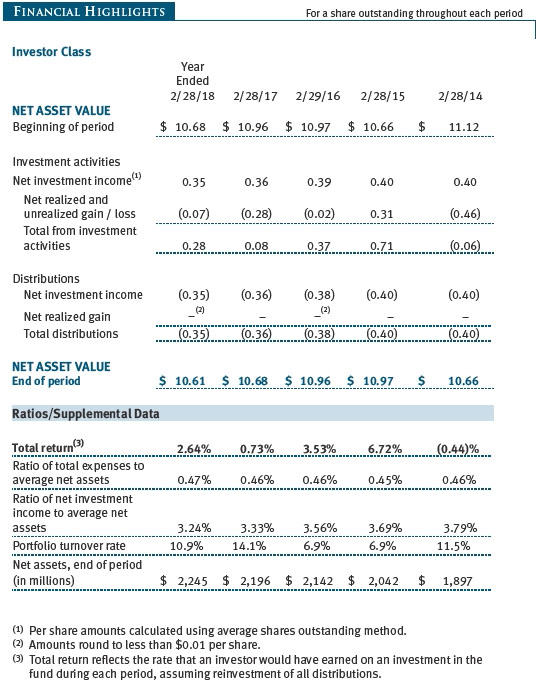
The Maryland Tax-Free Bond Fund returned 2.64% for the 12-month period ended February 28, 2018, outperforming the Lipper Maryland Municipal Debt Funds Average, which returned -0.92%. (Performancevaries for the I Class shares, reflecting their different fee structure.) The fund lost ground over the most recent six months but held up better than its peer group average. We outperformed our peers for both periods on the strength of the portfolio’s concentration in revenue bonds and our overall caution on interest rate risk.
Your fund continued to compare very favorably with its competitors over the long term. Lipper ranked the Maryland Tax-Free Bond Fund first among its peer group of Maryland municipal debt funds for the 5- and 10-year periods ended February 28, 2018, and in the top quintile of the peer group for the three-year period. Based on cumulative total returns, Lipper ranked the Maryland Tax-Free Bond Fund 3 of 26, 3 of 25, 1 of 24, and 1 of 19 funds in the Maryland municipal debt funds universe for the 1-, 3-, 5-, and 10-yearperiods ended February 28, 2018, respectively.(Past performance cannot guarantee future results.)
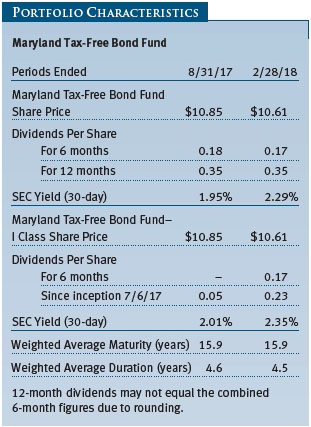
Our lingering concern about the risk of rising interest rates paid dividends in the second half of our fiscal year as rates rose. While our weighted average maturity stayed the same at 15.9 years, our duration fell a tick to 4.5 years, a conservative level compared with a representative sampling of our peers. We added to our longer-maturity holdings during the year but offset any increase in risk that came from owning these longer positions by maintaining a good concentration of securities on the front end of the yield curve, including a healthy store of high-quality, short-maturity prerefunded securities, which represented 16.6% of the portfolio at period-end. While we are not overly bearish on interest rates, we do believe that rates will move higher gradually over time. As such, we expect to maintain our mildly defensive interest rate posture.
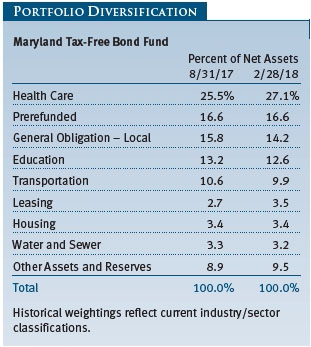
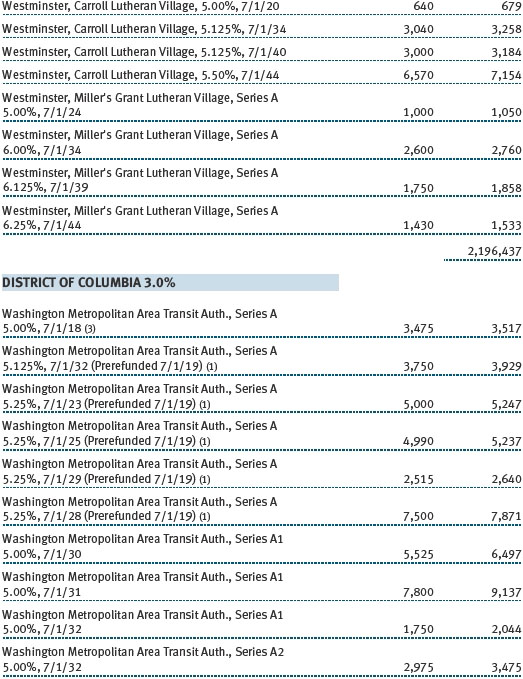
At the sector level, our revenue bond overweight and our concentration in health care bonds, which are both long-term strategic positions, enhanced our overall absolute and relative returns. The health care sector, including hospitals and retirement facilities, are excellent sources of above-average yield, and a number of health care securities were among our top-performing bonds for the year. Significant additions to our health care allocation includedCarroll Lutheran Village,Edenwald, andIngleside at King Farm. (Please refer to the fund’s portfolio of investments for a complete list of holdings and the amount each represents in the portfolio.)
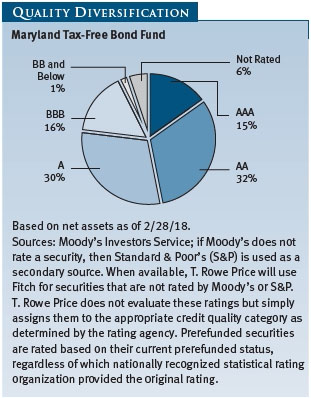
Our health care sector additions included securities from continuing care retirement facilities that came to market without published ratings. As with every security we purchase, we rate all new purchases internally and do not rely on the opinions of the rating agencies. As always, we strive to make sure that the yield on bonds we purchase is commensurate with the risk, and a part of our core strategy is to provide you the highest yield prudence allows. Even with these new additions to the portfolio, our overall credit quality weightings did not change significantly during the period as maturing bonds leaving the portfolio canceled out any additions.
OUTLOOK
We believe that the municipal bond market remains a high-quality market that offers good opportunities for long-term investors seeking tax-free income. While the uncertainty around the long-term impacts of tax reform and the increased chance of rising yields represent near-term headwinds for broad muni market performance, we believe fundamentals are sound overall, and global economic uncertainties could spur demand for the asset class. As the Fed continues on the path to interest rate normalization, muni bond yields are likely to rise along with Treasury yields—although probably not to the same extent. While higher yields pressure bond prices, munis should be less susceptible to slowly rising rates than Treasuries given their attractive tax-equivalent yields and the steady demand for tax-exempt income. We expect any potential Fed rate increases to be gradual and believe we could remain in a relatively low rate environment for some time.
While we believe that many states deserve high credit ratings and will be able to continue servicing their debts, we have longer-term concerns about significant funding shortfalls for pensions and OPEBobligations in some jurisdictions. These funding gaps stem from investment losses during the 2008–2009 financial crisis, insufficient plan contributions over time, and unrealistic return assumptions. Although few large plans are at risk of insolvency in the near term, the magnitude of unfunded liabilities is becoming more conspicuous in a few states.
Ultimately, we believe independent credit research is our greatest strength and will remain an asset for our investors as we navigate the current market environment. As always, we focus on finding attractively valued bonds issued by municipalities with good long-term fundamentals—an investment strategy that we believe will continue to serve our investors well.
Thank you for investing with T. Rowe Price.
Respectfully submitted,

Joseph K. Lynagh
Chairman of the Investment Advisory Committee
Maryland Tax-Free Money Fund

Charles B. Hill
Chairman of the Investment Advisory Committee
Maryland Short-Term Tax-Free Bond Fund

Hugh D. McGuirk
Chairman of the Investment Advisory Committee
Maryland Tax-Free Bond Fund
March 21, 2018
The committee chairmen have day-to-day responsibility for managing the portfolios and work with committee members in developing and executing the funds’ investment programs.
RISKS OF INVESTING IN MONEY MARKET SECURITIES
You could lose money by investing in the Fund. Although the Fund seeks to preserve the value of your investment at $1.00 per share, it cannot guarantee it will do so. The Fund may impose a fee upon the sale of your shares or may temporarily suspend your ability to sell shares if the Fund’s liquidity falls below required minimums because of market conditions or other factors. An investment in the Fund is not insured or guaranteed by the Federal Deposit Insurance Corporation or any other government agency. The Fund’s sponsor has no legal obligation to provide financial support to the Fund, and you should not expect that the sponsor will provide financial support to the Fund at any time.
RISKS OF INVESTING IN FIXED INCOME SECURITIES
Bonds are subject to interest rate risk (the decline in bond prices that usually accompanies a rise in interest rates) and credit risk (the chance that any fund holding could have its credit rating downgraded or that a bond issuer will default by failing to make timely payments of interest or principal), potentially reducing the fund’s income level and share price. The fund is less diversified than one investing nationally. Some income may be subject to state and local taxes and the federal alternative minimum tax.
GLOSSARY
Basis point:One one-hundredth of one percentage point, or 0.01%.
Bloomberg Barclays 1–3 Year Municipal Bond Index:A broadly diversified index of state-issued general obligation tax-exempt bonds with maturities of one to three years.
Bloomberg Barclays Municipal Bond Index:A broadly diversified index of tax-exempt bonds.
Bloomberg Barclays U.S. Aggregate Bond Index:An unmanaged index that tracks domestic investment-grade bonds, including corporate, government, and mortgage-backed securities.
Duration:A measure of a bond fund’s sensitivity to changes in interest rates. For example, a fund with a duration of five years would fall about 5% in price in response to a one-percentage-point rise in interest rates, and vice versa.
Federal funds rate (or target rate):The interest rate charged on overnight loans of reserves by one financial institution to another in the United States. The Federal Reserve sets a target federal funds rate to affect the direction of interest rates.
General obligation (GO) debt:A government’s strongest pledge that obligates its full faith and credit, including, if necessary, its ability to raise taxes.
Lipper averages:The averages of available mutual fund performance returns for specified time periods in categories defined by Lipper Inc.
Lipper indexes:Fund benchmarks that consist of a small number (10 to 30) of the largest mutual funds in a particular category as tracked by Lipper Inc.
Other post-employment benefits (OPEB):Benefits paid to an employee after retirement, such as premiums for life and health insurance.
Prerefunded bond:A bond that originally may have been issued as a general obligation or revenue bond but that is now secured by an escrow fund consisting entirely of direct U.S. government obligations that are sufficient for paying the bondholders.
Revenue (or revenue-backed) bond:A bond issued to fund specific projects, such as airports, bridges, hospitals, or toll roads, where a portion of the revenue generated is used to service the interest payments on the bonds.
SEC yield (7-day):A method of calculating a money fund’s yield by annualizing the fund’s net investment income for the last seven days of each period divided by the fund’s net asset value at the end of the period. Yield will vary and is not guaranteed.
SEC yield (30-day):A method of calculating a fund’s yield that assumes all portfolio securities are held until maturity. Yield will vary and is not guaranteed.
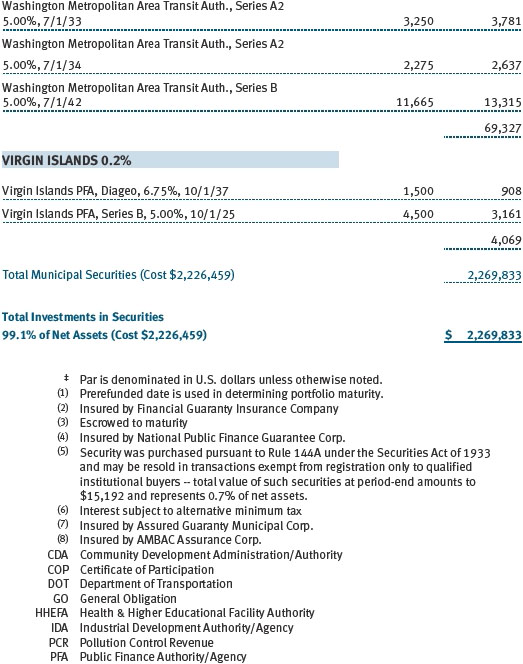
Variable rate demand note (VRDN):Generally, a debt security that requires the issuer to redeem at the holder’s discretion on a specified date or dates prior to maturity. Upon redemption, the issuer pays par to the holder, who loses future coupon payments that might otherwise be due. The VRDN might be especially attractive at times of rising rates, to protect against interest rate risk by redeeming at par value and reinvesting proceeds in a new bond.
Weighted average life:A measure of a fund’s credit quality risk. In general, the longer the average life, the greater the fund’s credit quality risk. The average life is the dollar-weighted average maturity of a portfolio’s individual securities without taking into account interest rate readjustment dates. Money funds must maintain a weighted average life of less than 120 days.
Weighted average maturity:A measure of a fund’s interest rate sensitivity. In general, the longer the average maturity, the greater the fund’s sensitivity to interest rate changes. The weighted average maturity may take into account the interest rate readjustment dates for certain securities. Money funds must maintain a weighted average maturity of less than 60 days.
Yield curve:A graph depicting the relationship between yields and maturity dates for a set of similar securities. A security with a longer maturity usually has a higher yield. If a short-term security offers a higher yield, then the curve is said to be “inverted.” If short-and long-term bonds are offering equivalent yields, then the curve is said to be “flat.”
Note: Bloomberg Index Services Ltd. Copyright 2018, Bloomberg Index Services Ltd. Used with permission.
Performance and Expenses
This chart shows the value of a hypothetical $10,000 investment in the fund over the past 10 fiscal year periods or since inception (for funds lacking 10-year records). The result is compared with benchmarks, which may include a broad-based market index and a peer group average or index. Market indexes do not include expenses, which are deducted from fund returns as well as mutual fund averages and indexes.
This chart shows the value of a hypothetical $10,000 investment in the fund over the past 10 fiscal year periods or since inception (for funds lacking 10-year records). The result is compared with benchmarks, which may include a broad-based market index and a peer group average or index. Market indexes do not include expenses, which are deducted from fund returns as well as mutual fund averages and indexes.
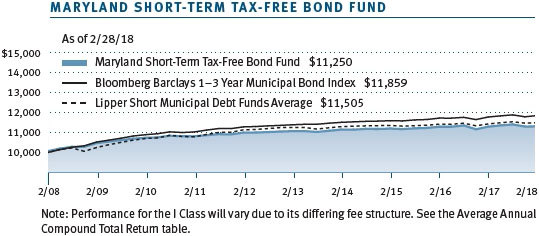
This chart shows the value of a hypothetical $10,000 investment in the fund over the past 10 fiscal year periods or since inception (for funds lacking 10-year records). The result is compared with benchmarks, which may include a broad-based market index and a peer group average or index. Market indexes do not include expenses, which are deducted from fund returns as well as mutual fund averages and indexes.
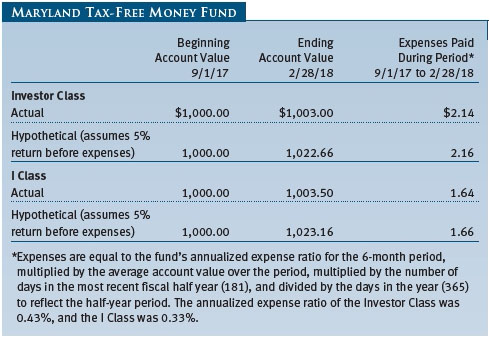
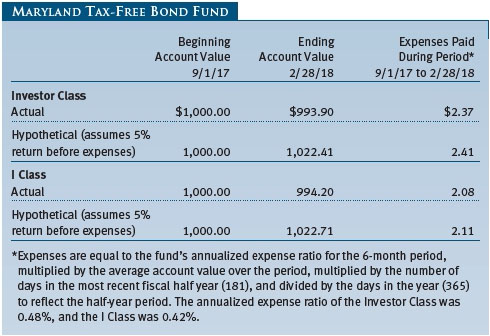
As a mutual fund shareholder, you may incur two types of costs: (1) transaction costs, such as redemption fees or sales loads, and (2) ongoing costs, including management fees, distribution and service (12b-1) fees, and other fund expenses. The following example is intended to help you understand your ongoing costs (in dollars) of investing in the fund and to compare these costs with the ongoing costs of investing in other mutual funds. The example is based on an investment of $1,000 invested at the beginning of the most recent six-month period and held for the entire period.
Please note that the fund has two share classes: The original share class (Investor Class) charges no distribution and service (12b-1) fee, and the I Class shares are also available to institutionally oriented clients and impose no 12b-1 or administrative fee payment. Each share class is presented separately in the table.
Actual Expenses
The first line of the following table (Actual) provides information about actual account values and expenses based on the fund’s actual returns. You may use the information on this line, together with your account balance, to estimate the expenses that you paid over the period. Simply divide your account value by $1,000 (for example, an $8,600 account value divided by $1,000 = 8.6), then multiply the result by the number on the first line under the heading “Expenses Paid During Period” to estimate the expenses you paid on your account during this period.
Hypothetical Example for Comparison Purposes
The information on the second line of the table (Hypothetical) is based on hypothetical account values and expenses derived from the fund’s actual expense ratio and an assumed 5% per year rate of return before expenses (not the fund’s actual return). You may compare the ongoing costs of investing in the fund with other funds by contrasting this 5% hypothetical example and the 5% hypothetical examples that appear in the shareholder reports of the other funds. The hypothetical account values and expenses may not be used to estimate the actual ending account balance or expenses you paid for the period.
Note:T. Rowe Price charges an annual account service fee of $20, generally for accounts with less than $10,000. The fee is waived for any investor whose T. Rowe Price mutual fund accounts total $50,000 or more; accounts electing to receive electronic delivery of account statements, transaction confirmations, prospectuses, and shareholder reports; or accounts of an investor who is a T. Rowe Price Personal Services or Enhanced Personal Services client (enrollment in these programs generally requires T. Rowe Price assets of at least $250,000). This fee is not included in the accompanying table. If you are subject to the fee, keep it in mind when you are estimating the ongoing expenses of investing in the fund and when comparing the expenses of this fund with other funds.
You should also be aware that the expenses shown in the table highlight only your ongoing costs and do not reflect any transaction costs, such as redemption fees or sales loads. Therefore, the second line of the table is useful in comparing ongoing costs only and will not help you determine the relative total costs of owning different funds. To the extent a fund charges transaction costs, however, the total cost of owning that fund is higher.

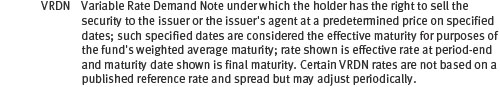
The accompanying notes are an integral part of these financial statements.
The accompanying notes are an integral part of these financial statements.


The accompanying notes are an integral part of these financial statements.
The accompanying notes are an integral part of these financial statements.
The accompanying notes are an integral part of these financial statements.
The accompanying notes are an integral part of these financial statements.
| Notes to Financial Statements |
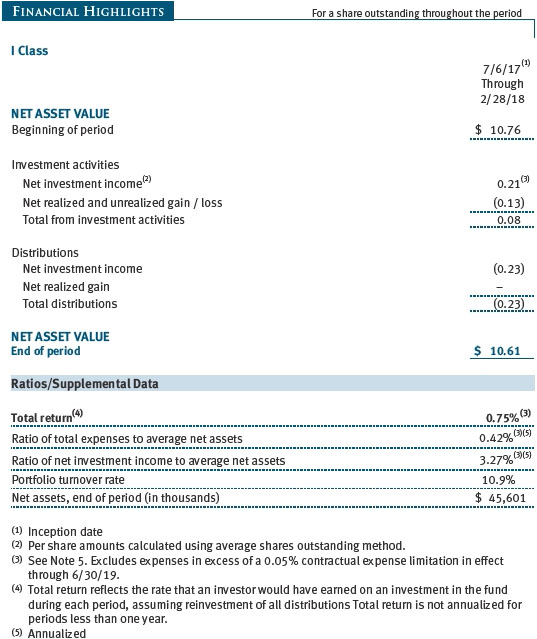
T. Rowe Price State Tax-Free Funds, Inc. (the corporation) is registered under the Investment Company Act of 1940 (the 1940 Act). The Maryland Tax-Free Bond Fund (the fund) is a nondiversified, open-end management investment company established by the corporation. The fund seeks to provide, consistent with prudent portfolio management, the highest level of income exempt from federal and Maryland state and local income taxes by investing primarily in investment-grade Maryland municipal bonds. The corporation, organized as a Maryland corporation, and the fund are the successors to the T. Rowe Price State Tax-Free Income Trust and its corresponding sub-trust pursuant to an agreement and plan of reorganization for a change in domicile, effective October 30, 2017. Prior to October 30, 2017, the corporation was organized as a Massachusetts business trust. The reorganization and redomiciliation had no effect on the fund’s investment objective and strategies or on the fund’s net assets. The fund has two classes of shares: the Maryland Tax-Free Bond Fund (Investor Class) and the Maryland Tax-Free Bond Fund–I Class (I Class). I Class shares generally are available only to investors meeting a $1,000,000 minimum investment or certain other criteria. Each class has exclusive voting rights on matters related solely to that class; separate voting rights on matters that relate to both classes; and, in all other respects, the same rights and obligations as the other class.
NOTE 1-SIGNIFICANT ACCOUNTINGPOLICIES
Basis ofPreparationThe fund is an investment company and follows accounting and reporting guidance in the Financial Accounting Standards Board (FASB)Accounting Standards CodificationTopic 946 (ASC 946). The accompanying financial statements were prepared in accordance with accounting principles generally accepted in the United States of America (GAAP), including, but not limited to, ASC 946. GAAP requires the use of estimates made by management. Management believes that estimates and valuations are appropriate; however, actual results may differ from those estimates, and the valuations reflected in the accompanying financial statements may differ from the value ultimately realized upon sale or maturity.
Investment Transactions, Investment Income, and DistributionsInvestment transactions are accounted for on the trade date basis. Income and expenses are recorded on the accrual basis. Realized gains and losses are reported on the identified cost basis. Premiums and discounts on debt securities are amortizedfor financial reporting purposes. Income tax-related interest and penalties, if incurred, are recorded as income tax expense. Income distributions are declared by each class daily and paid monthly. Distributions to shareholders are recorded on the ex-dividend date. A capital gain distribution may also be declared and paid by the fund annually.
Class AccountingShareholder servicing, prospectus, and shareholder report expenses incurred by each class are charged directly to the class to which they relate. Expenses common to both classes and investment income are allocated to the classes based upon the relative daily net assets of each class’s settled shares; realized and unrealized gains and losses are allocated based upon the relative daily net assets of each class’s outstanding shares. To the extent any expenses are waived or reimbursed in accordance with an expense limitation (see Note 5), the waiver or reimbursement is charged to the applicable class or allocated across the classes in the same manner as the related expense.
NewAccounting GuidanceIn March 2017, the FASB issued amended guidance to shorten the amortization period for certain callable debt securities held at a premium. The guidance is effective for fiscal years and interim periods beginning after December 15, 2018. Adoption will have no effect on the fund’s net assets or results of operations.
On August 1, 2017, the fund implemented amendments to Regulation S-X, issued by the Securities and Exchange Commission, which require standardized, enhanced disclosures, particularly related to derivatives, in investment company financial statements. Adoption had no effect on the fund’s net assets or results of operations.
IndemnificationIn the normal course of business, the fund may provide indemnification in connection with its officers and directors, service providers, and/or private company investments. The fund’s maximum exposure under these arrangements is unknown; however, the risk of material loss is currently considered to be remote.
NOTE 2-VALUATION
The fund’s financial instruments are valued and each class’s net asset value (NAV) per share is computed at the close of the New York Stock Exchange (NYSE), normally 4 p.m. ET, each day the NYSE is open for business. However, the NAV per share may be calculated at a time other than the normal close of the NYSE if trading on the NYSE is restricted, if the NYSE closes earlier, or as may be permitted by the SEC.
Fair ValueThe fund’s financial instruments are reported at fair value, which GAAP defines as the price that would be received to sell an asset or paid to transfer a liability in an orderly transaction between market participants at the measurement date. The T. Rowe Price Valuation Committee (the Valuation Committee) is an internal committee that has been delegated certain responsibilities by the fund’s Board of Directors (the Board) to ensure that financial instruments are appropriately priced at fair value in accordance with GAAP and the 1940 Act. Subject to oversight by the Board, the Valuation Committee develops and oversees pricing-related policies and procedures and approves all fair value determinations. Specifically, the Valuation Committee establishes procedures to value securities; determines pricing techniques, sources, and persons eligible to effect fair value pricing actions; oversees the selection, services, and performance of pricing vendors; oversees valuation-related business continuity practices; and provides guidance on internal controls and valuation-related matters. The Valuation Committee reports to the Board and has representation from legal, portfolio management and trading, operations, risk management, and the fund’s treasurer.
Various valuation techniques and inputs are used to determine the fair value of financial instruments. GAAP establishes the following fair value hierarchy that categorizes the inputs used to measure fair value:
Level 1 – quoted prices (unadjusted) in active markets for identical financial instruments that the fund can access at the reporting date
Level 2 – inputs other than Level 1 quoted prices that are observable, either directly or indirectly (including, but not limited to, quoted prices for similar financial instruments in active markets, quoted prices for identical or similar financial instruments in inactive markets, interest rates and yield curves, implied volatilities, and credit spreads)
Level 3 – unobservable inputs
Observable inputs are developed using market data, such as publicly available information about actual events or transactions, and reflect the assumptions that market participants would use to price the financial instrument. Unobservable inputs are those for which market data are not available and are developed using the best information available about the assumptions that market participants would use to price the financial instrument. GAAP requires valuation techniques to maximize the use of relevant observable inputs and minimize the use of unobservable inputs. When multiple inputs are used to derive fair value, the financial instrument is assigned to the level within the fairvalue hierarchy based on the lowest-level input that is significant to the fair value of the financial instrument. Input levels are not necessarily an indication of the risk or liquidity associated with financial instruments at that level but rather the degree of judgment used in determining those values.
Valuation TechniquesDebt securities generally are traded in the over-the-counter (OTC) market. Securities with remaining maturities of one year or more at the time of acquisition are valued at prices furnished by dealers who make markets in such securities or by an independent pricing service, which considers the yield or price of bonds of comparable quality, coupon, maturity, and type, as well as prices quoted by dealers who make markets in such securities. Securities with remaining maturities of less than one year at the time of acquisition generally use amortized cost in local currency to approximate fair value. However, if amortized cost is deemed not to reflect fair value or the fund holds a significant amount of such securities with remaining maturities of more than 60 days, the securities are valued at prices furnished by dealers who make markets in such securities or by an independent pricing service. Generally, debt securities are categorized in Level 2 of the fair value hierarchy; however, to the extent the valuations include significant unobservable inputs, the securities would be categorized in Level 3.
Assets and liabilities other than financial instruments, including short-term receivables and payables, are carried at cost, or estimated realizable value, if less, which approximates fair value.
Thinly traded financial instruments and those for which the above valuation procedures are inappropriate or are deemed not to reflect fair value are stated at fair value as determined in good faith by the Valuation Committee. The objective of any fair value pricing determination is to arrive at a price that could reasonably be expected from a current sale. Financial instruments fair valued by the Valuation Committee are primarily private placements, restricted securities, warrants, rights, and other securities that are not publicly traded.
Subject to oversight by the Board, the Valuation Committee regularly makes good faith judgments to establish and adjust the fair valuations of certain securities as events occur and circumstances warrant. For instance, in determining the fair value of troubled or thinly traded debt instruments, the Valuation Committee considers a variety of factors, which may include, but are not limited to, the issuer’s business prospects, its financial standing and performance, recent investment transactions in the issuer, strategic events affecting the company,market liquidity for the issuer, and general economic conditions and events. In consultation with the investment and pricing teams, the Valuation Committee will determine an appropriate valuation technique based on available information, which may include both observable and unobservable inputs. The Valuation Committee typically will afford greatest weight to actual prices in arm’s length transactions, to the extent they represent orderly transactions between market participants, transaction information can be reliably obtained, and prices are deemed representative of fair value. However, the Valuation Committee may also consider other valuation methods such as a discount or premium from market value of a similar, freely traded security of the same issuer; discounted cash flows; yield to maturity; or some combination. Fair value determinations are reviewed on a regular basis and updated as information becomes available, including actual purchase and sale transactions of the issue. Because any fair value determination involves a significant amount of judgment, there is a degree of subjectivity inherent in such pricing decisions, and fair value prices determined by the Valuation Committee could differ from those of other market participants. Depending on the relative significance of unobservable inputs, including the valuation technique(s) used, fair valued securities may be categorized in Level 2 or 3 of the fair value hierarchy.
Valuation InputsOn February 28, 2018, all of the fund’s financial instruments were classified as Level 2, based on the inputs used to determine their fair values. There were no material transfers between Levels 1 and 2 during the year ended February 28, 2018.
NOTE 3-OTHER INVESTMENT TRANSACTIONS
Consistent with its investment objective, the fund engages in the following practices to manage exposure to certain risks and/or to enhance performance. The investment objective, policies, program, and risk factors of the fund are described more fully in the fund’s prospectus and Statement of Additional Information.
Restricted SecuritiesThe fund may invest in securities that are subject to legal or contractual restrictions on resale. Prompt sale of such securities at an acceptable price may be difficult and may involve substantial delays and additional costs.
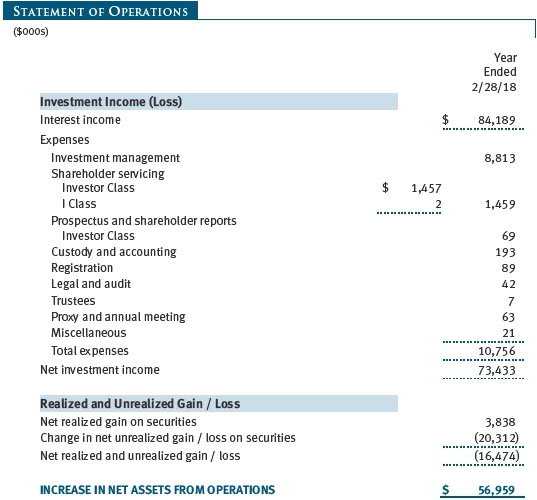
OtherPurchases and sales of portfolio securities other than short-term securities aggregated $366,459,000 and $243,913,000, respectively, for the year ended February 28, 2018.
NOTE 4-FEDERAL INCOME TAXES
No provision for federal income taxes is required since the fund intends to continue to qualify as a regulated investment company under Subchapter M of the Internal Revenue Code and distribute to shareholders all of its income and gains. Distributions determined in accordance with federal income tax regulations may differ in amount or character from net investment income and realized gains for financial reporting purposes. Financial reporting records are adjusted for permanent book/tax differences to reflect tax character but are not adjusted for temporary differences.
The fund files U.S. federal, state, and local tax returns as required. The fund’s tax returns are subject to examination by the relevant tax authorities until expiration of the applicable statute of limitations, which is generally three years after the filing of the tax return but which can be extended to six years in certain circumstances. Tax returns for open years have incorporated no uncertain tax positions that require a provision for income taxes.
Reclassifications to paid-in capital relate primarily to a tax practice that treats a portion of the proceeds from each redemption of capital shares as a distribution of taxable net investment income or realized capital gain. Reclassifications between income and gain relate primarily to the character of market discount at time of sale. For the year ended February 28, 2018, the following reclassifications were recorded to reflect tax character (there was no impact on results of operations or net assets):

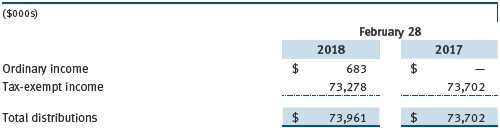
Distributions during the years ended February 28, 2018 and February 28, 2017,were characterized for tax purposes as follows:
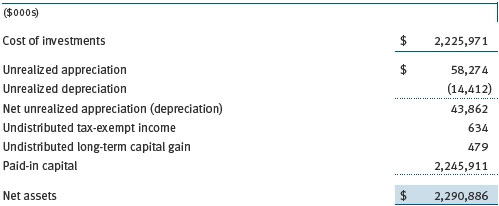
At February 28, 2018, the tax-basis cost of investments and components of net assets were as follows:
During the year ended February 28, 2018, the fund utilized $3,058,000 of capital loss carryforwards.
NOTE 5-RELATEDPARTY TRANSACTIONS
The fund is managed by T. Rowe Price Associates, Inc. (Price Associates), a wholly owned subsidiary of T. Rowe Price Group, Inc. (Price Group). The investment management agreement between the fund and Price Associates provides for an annual investment management fee, which is computed daily and paid monthly. The fee consists of an individual fund fee, equal to 0.10% of the fund’s average daily net assets, and a group fee. The group fee rate is calculated based on the combined net assets of certain mutual funds sponsored by Price Associates (the group) applied to a graduated fee schedule, with rates ranging from 0.48% for the first $1 billion of assets to 0.265% for assets in excess of $650 billion. The fund’s group fee is determined by applying the group fee rate to the fund’s average daily net assets. At February 28, 2018, the effective annual group fee rate was 0.29%.
The I Class is subject to an operating expense limitation (I Class limit) pursuant to which Price Associates is contractually required to pay all operating expenses of the I Class, excluding management fees, interest, expenses related to borrowings, taxes, brokerage, and other non-recurring expenses permitted by the investment management agreement, to the extent such operating expenses, on an annualized basis, exceed 0.05% of average net assets. Thisagreement will continue until June 30, 2019, and may be renewed, revised, or revoked only with approval of the fund’s Board. The I Class is required to repay Price Associates for expenses previously paid to the extent the class’s net assets grow or expenses decline sufficiently to allow repayment without causing the class’s operating expenses (after the repayment is taken into account) to exceed both: (1) the expense limitation in place at the time such amounts were paid; and (2) the class’s current expense limitation. However, no repayment will be made more than three years after the date of a payment or waiver. For the year ended February 28, 2018, the I Class operated below its expense limitation.
In addition, the fund has entered into service agreements with Price Associates and a wholly owned subsidiary of Price Associates, each an affiliate of the fund (collectively, Price). Price Associates provides certain accounting and administrative services to the fund. T. Rowe Price Services, Inc. provides shareholder and administrative services in its capacity as the fund’s transfer and dividend-disbursing agent. For the year ended February 28, 2018, expenses incurred pursuant to these service agreements were $85,000 for Price Associates and $423,000 for T. Rowe Price Services, Inc. The total amount payable at period-end pursuant to these service agreements is reflected as Due to Affiliates on the accompanying Statement of Assets and Liabilities.
As of February 28, 2018, T. Rowe Price Group, Inc., or its wholly owned subsidiaries owned 23,234 shares of the I Class, representing 1% of the I Class’s net assets.
The fund may participate in securities purchase and sale transactions with other funds or accounts advised by Price Associates (cross trades), in accordance with procedures adopted by the fund’s Board and Securities and Exchange Commission rules, which require, among other things, that such purchase and sale cross trades be effected at the independent current market price of the security. Purchases and sales cross trades aggregated $42,870,000 and $15,190,000, respectively, with net realized gain of $0 for the year ended February 28, 2018.
| Report of Independent Registered Public Accounting Firm |
To the Board of Directors of T. RowePrice State Tax-Free Funds, Inc. and
Shareholders of T. RowePrice Maryland Tax-Free Bond Fund
Opinion on the Financial Statements
We have audited the accompanying statement of assets and liabilities, including the portfolio of investments, of T. Rowe Price Maryland Tax-Free Bond Fund (one of the funds constituting T. Rowe Price State Tax-Free Funds, Inc., hereafter referred to as the “Fund”) as of February 28, 2018, the related statement of operations for the year ended February 28, 2018, the statement of changes in net assets for each of the two years in the period ended February 28, 2018, including the related notes, and the financial highlights for each of the periods indicated therein (collectively referred to as the “financial statements”). In our opinion, the financial statements present fairly, in all material respects, the financial position of the Fund as of February 28, 2018, the results of its operations for the year then ended, the changes in its net assets for each of the two years in the period ended February 28, 2018 and the financial highlights for each of the periods indicated therein, in conformity with accounting principles generally accepted in the United States of America.
Basis for Opinion
These financial statements are the responsibility of the Fund’s management. Our responsibility is to express an opinion on the Fund’s financial statements based on our audits. We are a public accounting firm registered with the Public Company Accounting Oversight Board (United States) (“PCAOB”) and are required to be independent with respect to the Fund in accordance with the U.S. federal securities laws and the applicable rules and regulations of the Securities and Exchange Commission and the PCAOB.
We conducted our audits of these financial statements in accordance with the standards of the PCAOB. Those standards require that we plan and perform the audit to obtain reasonable assurance about whether the financial statements are free of material misstatement, whether due to error or fraud.
Our audits included performing procedures to assess the risks of material misstatement of the financial statements, whether due to error or fraud, and performing procedures that respond to those risks. Such procedures included examining, on a test basis, evidence regarding the amounts and disclosures in the financial statements. Our audits also included evaluating the accounting principles used and significant estimates made by management, as well as evaluating the overall presentation of the financial statements. Our procedures included confirmation of securities owned as of February 28, 2018 by correspondence with the custodian and brokers; when replies were not received from brokers, we performed other auditing procedures. We believe that our audits provide a reasonable basis for our opinion.
PricewaterhouseCoopers LLP
Baltimore, Maryland
April 18, 2018
We have served as the auditor of one or more investment companies in the T. Rowe Price group of investment companies since 1973.
| Tax Information (Unaudited) for the Tax Year Ended 2/28/18 |
We are providing this information as required by the Internal Revenue Code. The amounts shown may differ from those elsewhere in this report because of differences between tax and financial reporting requirements.
The fund’s distributions to shareholders included:
| ● | $1,158,000 from short-term capital gains
|
| ● | $327,000 from long-term capital gains, subject to a long-term capital gains tax rate of not greater than 20%.
|
| ● | $73,443,000 which qualified as exempt-interest dividends. |
| Information on Proxy Voting Policies, Procedures, and Records |
A description of the policies and procedures used by T. Rowe Price funds and portfolios to determine how to vote proxies relating to portfolio securities is available in each fund’s Statement of Additional Information. You may request this document by calling 1-800-225-5132 or by accessing the SEC’s website, sec.gov.
The description of our proxy voting policies and procedures is also available on our corporate website. To access it, please visit the following Web page:
https://www3.troweprice.com/usis/corporate/en/utility/policies.html
Scroll down to the section near the bottom of the page that says, “Proxy Voting Policies.” Click on the Proxy Voting Policies link in the shaded box.
Each fund’s most recent annual proxy voting record is available on our website and through the SEC’s website. To access it through T. Rowe Price, visit the website location shown above, and scroll down to the section near the bottom of the page that says, “Proxy Voting Records.” Click on the Proxy Voting Records link in the shaded box.
| How to Obtain Quarterly Portfolio Holdings |
The fund files a complete schedule of portfolio holdings with the Securities and Exchange Commission for the first and third quarters of each fiscal year on Form N-Q. The fund’s Form N-Q is available electronically on the SEC’s website (sec.gov); hard copies may be reviewed and copied at the SEC’s Public Reference Room, 100 F St. N.E., Washington, DC 20549. For more information on the Public Reference Room, call 1-800-SEC-0330.
| About the Fund’s Directors and Officers |
Your fund is overseen by a Board of Directors (Board) that meets regularly to review a wide variety of matters affecting or potentially affecting the fund, including performance, investment programs, compliance matters, advisory fees and expenses, service providers, and business and regulatory affairs. The Board elects the fund’s officers, who are listed in the final table. At least 75% of the Board’s members are independent of T. Rowe Price Associates, Inc. (T. Rowe Price), and its affiliates; “inside” or “interested” directors are employees or officers of T. Rowe Price. The business address of each director and officer is 100 East Pratt Street, Baltimore, Maryland 21202. The Statement of Additional Information includes additional information about the fund directors and is available without charge by calling a T. Rowe Price representative at 1-800-638-5660.
| Independent Directors(a) |
| |
| Name | | |
| (Year of Birth) | | |
| Year Elected | | |
| [Number of T. RowePrice | | Principal Occupation(s) and Directorships ofPublic Companies and |
| Portfolios Overseen] | | Other Investment Companies During thePast Five Years |
| | | |
| Teresa Bryce Bazemore* | | President, Radian Guaranty (2008 to 2017); Member, Bazemore |
| (1959) | | Consulting LLC (2018 to present); Member, Chimera Investment |
| 2018 | | Corporation (2017 to present); Member, Federal Home Loan Bank of |
| [191] | | Pittsburgh (2017 to present) |
| | | |
| Ronald J. Daniels* | | President, The Johns Hopkins University(b)and Professor, Political |
| (1959) | | Science Department, The Johns Hopkins University (2009 to |
| 2018 | | present); Director, Lyndhurst Holdings (2015 to present) |
| [191] | | |
| | | |
| Anthony W. Deering** | | Chairman, Exeter Capital, LLC, a private investment firm (2004 to |
| (1945) | | 2017); Director and Advisory Board Member, Deutsche Bank North |
| 1986 | | America (2004 to 2017); Director, Vornado Real Estate Investment |
| [0] | | Trust (2004 to 2012); Director, Under Armour (2008 to 2017); |
| | Director, Brixmor Real Estate Investment Trust (2012 to 2017) |
| | | |
| Bruce W. Duncan | | Chief Executive Officer and Director (January 2009 to December |
| (1951) | | 2016), Chairman of the Board (January 2016 to present), and |
| 2013 | | President (January 2009 to September 2016), First Industrial Realty |
| [191] | | Trust, an owner and operator of industrial properties; Chairman |
| | of the Board (2005 to September 2016) and Director (1999 to |
| | September 2016), Starwood Hotels & Resorts, a hotel and leisure |
| | company; Director, Boston Properties (May 2016 to present); |
| | Director, Marriott International, Inc. (September 2016 to present) |
| | | |
| Robert J. Gerrard, Jr. | | Advisory Board Member, Pipeline Crisis/Winning Strategies, a |
| (1952) | | collaborative working to improve opportunities for young African |
| 2013 | | Americans (1997 to January 2016) |
| [191] | | |
| | | |
| Paul F. McBride | | Advisory Board Member, Vizzia Technologies (2015 to present) |
| (1956) | | |
| 2013 | | |
| [191] | | |
| | | |
| Cecilia E. Rouse, Ph.D. | | Dean, Woodrow Wilson School (2012 to present); Professor and |
| (1963) | | Researcher, Princeton University (1992 to present); Member of |
| 2013 | | National Academy of Education (2010 to present); Director, MDRC, |
| [191] | | a nonprofit education and social policy research organization |
| | (2011 to present); Research Associate of Labor Studies Program |
| | (2011 to 2015) and Board Member (2015 to present), National |
| | Bureau of Economic Research (2011 to present); Chair of Committee |
| | on the Status of Minority Groups in the Economic Profession |
| | (2012 to present); Vice President, American Economic Association |
| | (2015 to present) |
| | | |
| John G. Schreiber | | Owner/President, Centaur Capital Partners, Inc., a real estate |
| (1946) | | investment company (1991 to present); Cofounder, Partner, and |
| 1992 | | Cochairman of the Investment Committee, Blackstone Real Estate |
| [191] | | Advisors, L.P. (1992 to 2015); Director, General Growth Properties, |
| | Inc. (2010 to 2013); Director, Blackstone Mortgage Trust, a real |
| | estate finance company (2012 to 2016); Director and Chairman |
| | of the Board, Brixmor Property Group, Inc. (2013 to present); |
| | Director, Hilton Worldwide (2013 to present); Director, Hudson |
| | Pacific Properties (2014 to 2016); Director, Invitation Homes |
| | (2014 to present) |
| | | |
| Mark R. Tercek | | President and Chief Executive Officer, The Nature Conservancy |
| (1957) | | (2008 to present) |
| 2009 | | |
| [191] | | |
| |
| *Effective January 1, 2018, Ms. Bazemore and Mr. Daniels were elected as independent directors of the Price Funds. |
| **Mr. Deering served as an independent director of the Price Funds until November 17, 2017. |
| (a)All information about the independent directors was current as of December 31, 2017, except for the information provided for Ms. Bazemore and Mr. Daniels, which is current as of January 1, 2018. |
| (b)William J. Stromberg, President and CEO of T. Rowe Price Group, Inc., which is the parent company of the Price Funds’ investment adviser, has served on the Board of Trustees of The Johns Hopkins University since 2014 and is a member of The Johns Hopkins University Board’s Compensation Committee. |
| Inside Directors | | |
| |
| Name | | |
| (Year of Birth) | | |
| Year Elected* | | |
| [Number of T. RowePrice | | Principal Occupation(s) and Directorships ofPublic Companies and |
| Portfolios Overseen] | | Other Investment Companies During thePast Five Years |
| | | |
| Edward C. Bernard | | Director and Vice President, T. Rowe Price; Vice Chairman of the |
| (1956) | | Board, Director, and Vice President, T. Rowe Price Group, Inc.; |
| 2006 | | Chairman of the Board, Director, and Vice President, T. Rowe Price |
| [191] | | Investment Services, Inc., and T. Rowe Price Services, Inc.; Chairman |
| | of the Board and Director, T. Rowe Price Retirement Plan Services, |
| | Inc.; Chairman of the Board, Chief Executive Officer, Director, and |
| | President, T. Rowe Price International and T. Rowe Price Trust |
| | Company; Chairman of the Board, all funds |
| | | |
| Edward A. Wiese, CFA | | Vice President, T. Rowe Price, T. Rowe Price Group, Inc., T. Rowe |
| (1959) | | Price International, and T. Rowe Price Trust Company; Vice President, |
| 2015 | | State Tax-Free Income Trust |
| [56] | | |
| |
| *Each inside director serves until retirement, resignation, or election of a successor. |
| Officers | | |
| |
| Name (Year of Birth) | | |
| Position HeldWith State | | |
| Tax-Tax-Free Income Trust | | Principal Occupation(s) |
| | | |
| Austin Applegate (1974) | | Vice President, T. Rowe Price and T. Rowe Price |
| Vice President | | Group, Inc. |
| | | |
| R. Lee Arnold, Jr., CFA, CPA (1970) | | Vice President, T. Rowe Price and T. Rowe Price |
| Vice President | | Group, Inc. |
| | | |
| Darrell N. Braman (1963) | | Vice President, Price Hong Kong, Price |
| Vice President and Secretary | | Singapore, T. Rowe Price, T. Rowe Price Group, |
| | Inc., T. Rowe Price International, T. Rowe Price |
| | Investment Services, Inc., and T. Rowe Price |
| | Services, Inc. |
| | | |
| Steven G. Brooks, CFA (1954) | | Vice President, T. Rowe Price and T. Rowe Price |
| Vice President | | Group, Inc. |
| | | |
| M. Helena Condez (1962) | | Vice President, T. Rowe Price and T. Rowe Price |
| Vice President | | Group, Inc. |
| | | |
| G. Richard Dent (1960) | | Vice President, T. Rowe Price and T. Rowe Price |
| Vice President | | Group, Inc. |
| | | |
| Sarah J. Engle (1979) | | Vice President, T. Rowe Price and T. Rowe Price |
| Vice President | | Group, Inc. |
| | | |
| Stephanie A. Gentile, CFA (1956) | | Vice President, T. Rowe Price; formerly, Director, |
| Vice President | | Credit Suisse Securities (to 2014) |
| | | |
| John R. Gilner (1961) | | Chief Compliance Officer and Vice President, |
| Chief Compliance Officer | | T. Rowe Price; Vice President, T. Rowe Price |
| | Group, Inc., and T. Rowe Price Investment |
| | Services, Inc. |
| | | |
| Charles B. Hill, CFA (1961) | | Vice President, T. Rowe Price and T. Rowe Price |
| Executive Vice President | | Group, Inc. |
| | | |
| Dylan Jones, CFA (1971) | | Vice President, T. Rowe Price and T. Rowe Price |
| Vice President | | Group, Inc. |
| | | |
| Marianna Korpusova, CFA (1984) | | Vice President, T. Rowe Price and T. Rowe Price |
| Vice President | | Group, Inc.; formerly, student, The University of |
| | Chicago (to 2014) |
| | | |
| Paul J. Krug, CPA (1964) | | Vice President, T. Rowe Price, T. Rowe Price |
| Vice President | | Group, Inc., and T. Rowe Price Trust Company |
| | | |
| Marcy M. Lash (1963) | | Vice President, T. Rowe Price and T. Rowe Price |
| Vice President | | Group, Inc. |
| | | |
| Alan D. Levenson, Ph.D. (1958) | | Vice President, T. Rowe Price and T. Rowe Price |
| Vice President | | Group, Inc. |
| | | |
| Joseph K. Lynagh, CFA (1958) | | Vice President, T. Rowe Price, T. Rowe Price |
| Executive Vice President | | Group, Inc., and T. Rowe Price Trust Company |
| | | |
| James T. Lynch, CFA (1983) | | Vice President, T. Rowe Price |
| Vice President | | |
| | | |
| Konstantine B. Mallas (1963) | | Vice President, T. Rowe Price and T. Rowe Price |
| Executive Vice President | | Group, Inc. |
| | | |
| Catherine D. Mathews (1963) | | Vice President, T. Rowe Price, T. Rowe Price |
| Treasurer and Vice President | | Group, Inc., and T. Rowe Price Trust Company |
| | | |
| Hugh D. McGuirk, CFA (1960) | | Vice President, T. Rowe Price and T. Rowe Price |
| President | | Group, Inc. |
| | | |
| James M. Murphy, CFA (1967) | | Vice President, T. Rowe Price and T. Rowe Price |
| Vice President | | Group, Inc. |
| | | |
| Linda A. Murphy (1959) | | Vice President, T. Rowe Price and T. Rowe Price |
| Vice President | | Group, Inc. |
| | | |
| David Oestreicher (1967) | | Director and Vice President, T. Rowe Price |
| Vice President | | Investment Services, Inc., T. Rowe Price |
| | Retirement Plan Services, Inc., T. Rowe |
| | Price Services, Inc., and T. Rowe Price Trust |
| | Company; Chief Legal Officer and Vice |
| | President, T. Rowe Price Group, Inc.; Vice |
| | President, T. Rowe Price and T. Rowe Price |
| | International; Vice President, Price Hong Kong |
| | and Price Singapore |
| | | |
| John W. Ratzesberger (1975) | | Vice President, T. Rowe Price, T. Rowe Price |
| Vice President | | Group, Inc., and T. Rowe Price Trust Company; |
| | formerly, North American Head of Listed |
| | Derivatives Operation, Morgan Stanley |
| | (to 2013) |
| | | |
| Shannon H. Rauser (1987) | | Employee, T. Rowe Price |
| Assistant Secretary | | |
| | | |
| Chen Shao (1980) | | Vice President, T. Rowe Price and T. Rowe Price |
| Vice President | | Group, Inc. |
| | | |
| Douglas D. Spratley, CFA (1969) | | Vice President, T. Rowe Price and T. Rowe Price |
| Vice President | | Group, Inc. |
| | | |
| Timothy G. Taylor, CFA (1975) | | Vice President, T. Rowe Price and T. Rowe Price |
| Vice President | | Group, Inc. |
| | | |
| Robert D. Thomas (1971) | | Vice President, T. Rowe Price Group, Inc., and |
| Vice President | | T. Rowe Price International |
| | | |
| Megan Warren (1968) | | Vice President, T. Rowe Price, T. Rowe Price |
| Vice President | | Group, Inc., T. Rowe Price Retirement Plan |
| | Services, Inc., T. Rowe Price Services, Inc., |
| | and T. Rowe Price Trust Company; formerly, |
| | Executive Director, JP Morgan Chase (to 2017) |
| |
| Unless otherwise noted, officers have been employees of T. Rowe Price or T. Rowe Price International for at least 5 years. |
Item 2. Code of Ethics.
The registrant has adopted a code of ethics, as defined in Item 2 of Form N-CSR, applicable to its principal executive officer, principal financial officer, principal accounting officer or controller, or persons performing similar functions. A copy of this code of ethics is filed as an exhibit to this Form N-CSR. No substantive amendments were approved or waivers were granted to this code of ethics during the period covered by this report.
Item 3. Audit Committee Financial Expert.
The registrant’s Board of Directors/Trustees has determined that Mr. Bruce W. Duncan qualifies as an audit committee financial expert, as defined in Item 3 of Form N-CSR. Mr. Duncan is considered independent for purposes of Item 3 of Form N-CSR.
Item 4. Principal Accountant Fees and Services.
(a) – (d) Aggregate fees billed for the last two fiscal years for professional services rendered to, or on behalf of, the registrant by the registrant’s principal accountant were as follows:
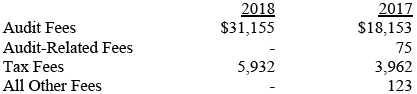
Audit fees include amounts related to the audit of the registrant’s annual financial statements and services normally provided by the accountant in connection with statutory and regulatory filings. Audit-related fees include amounts reasonably related to the performance of the audit of the registrant’s financial statements and specifically include the issuance of a report on internal controls and, if applicable, agreed-upon procedures related to fund acquisitions. Tax fees include amounts related to services for tax compliance, tax planning, and tax advice. The nature of these services specifically includes the review of distribution calculations and the preparation of Federal, state, and excise tax returns. All other fees include the registrant’s pro-rata share of amounts for agreed-upon procedures in conjunction with service contract approvals by the registrant’s Board of Directors/Trustees.
(e)(1) The registrant’s audit committee has adopted a policy whereby audit and non-audit services performed by the registrant’s principal accountant for the registrant, its investment adviser, and any entity controlling, controlled by, or under common control with the investment adviser that provides ongoing services to the registrant require pre-approval in advance at regularly scheduled audit committee meetings. If such a service is required between regularly scheduled audit committee meetings, pre-approval may be authorized by one audit committee member with ratification at the next scheduled audit committee meeting. Waiver of pre-approval for audit or non-audit services requiring fees of a de minimis amount is not permitted.
(2) No services included in (b) – (d) above were approved pursuant to paragraph (c)(7)(i)(C) of Rule 2-01 of Regulation S-X.
(f) Less than 50 percent of the hours expended on the principal accountant’s engagement to audit the registrant’s financial statements for the most recent fiscal year were attributed to work performed by persons other than the principal accountant’s full-time, permanent employees.
(g) The aggregate fees billed for the most recent fiscal year and the preceding fiscal year by the registrant’s principal accountant for non-audit services rendered to the registrant, its investment adviser, and any entity controlling, controlled by, or under common control with the investment adviser that provides ongoing services to the registrant were $2,160,000 and $1,840,000, respectively.
(h) All non-audit services rendered in (g) above were pre-approved by the registrant’s audit committee. Accordingly, these services were considered by the registrant’s audit committee in maintaining the principal accountant’s independence.
Item 5. Audit Committee of Listed Registrants.
Not applicable.
Item 6. Investments.
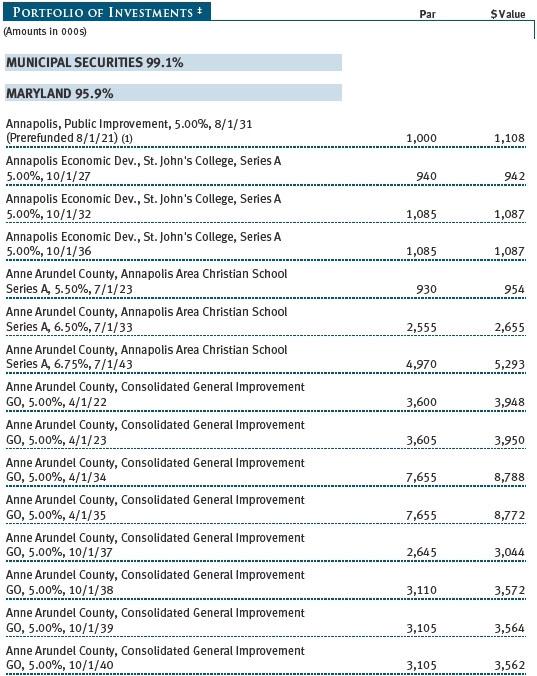
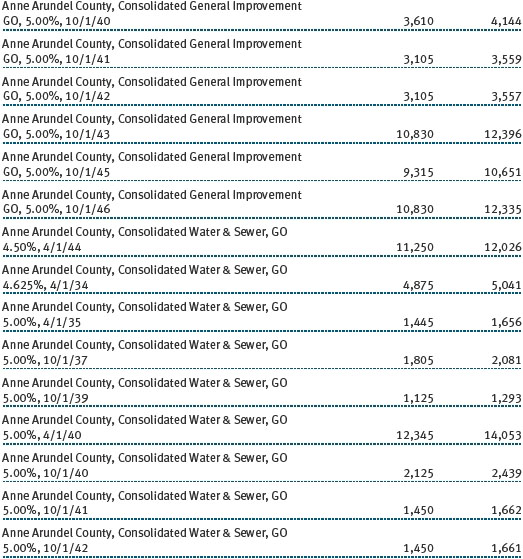
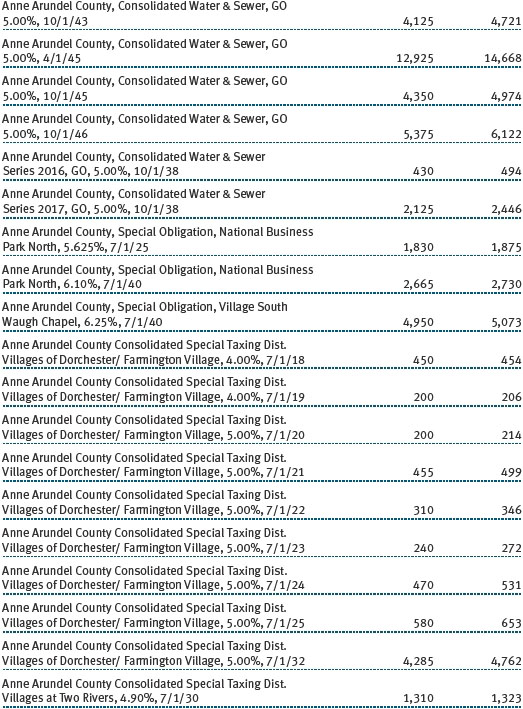
(a) Not applicable. The complete schedule of investments is included in Item 1 of this Form N-CSR.
(b) Not applicable.
Item 7. Disclosure of Proxy Voting Policies and Procedures for Closed-End Management Investment Companies.
Not applicable.
Item 8. Portfolio Managers of Closed-End Management Investment Companies.
Not applicable.
Item 9. Purchases of Equity Securities by Closed-End Management Investment Company and Affiliated Purchasers.
Not applicable.
Item 10. Submission of Matters to a Vote of Security Holders.
Not applicable.
Item 11. Controls and Procedures.
(a) The registrant’s principal executive officer and principal financial officer have evaluated the registrant’s disclosure controls and procedures within 90 days of this filing and have concluded that the registrant’s disclosure controls and procedures were effective, as of that date, in ensuring that information required to be disclosed by the registrant in this Form N-CSR was recorded, processed, summarized, and reported timely.
(b) The registrant’s principal executive officer and principal financial officer are aware of no change in the registrant’s internal control over financial reporting that occurred during the registrant’s second fiscal quarter covered by this report that has materially affected, or is reasonably likely to materially affect, the registrant’s internal control over financial reporting.
Item 12. Exhibits.
(a)(1) The registrant’s code of ethics pursuant to Item 2 of Form N-CSR is attached.
(2) Separate certifications by the registrant's principal executive officer and principal financial officer, pursuant to Section 302 of the Sarbanes-Oxley Act of 2002 and required by Rule 30a-2(a) under the Investment Company Act of 1940, are attached.
(3) Written solicitation to repurchase securities issued by closed-end companies: not applicable.
(b) A certification by the registrant's principal executive officer and principal financial officer, pursuant to Section 906 of the Sarbanes-Oxley Act of 2002 and required by Rule 30a-2(b) under the Investment Company Act of 1940, is attached.
SIGNATURES
Pursuant to the requirements of the Securities Exchange Act of 1934 and the Investment Company Act of 1940, the registrant has duly caused this report to be signed on its behalf by the undersigned, thereunto duly authorized.
T. Rowe Price State Tax-Free Funds, Inc.
| By | | /s/ David Oestreicher |
| | | David Oestreicher |
| | | Principal Executive Officer |
| |
| Date | | March 14, 2019 | | | | |
Pursuant to the requirements of the Securities Exchange Act of 1934 and the Investment Company Act of 1940, this report has been signed below by the following persons on behalf of the registrant and in the capacities and on the dates indicated.
| By | | /s/ David Oestreicher |
| | | David Oestreicher |
| | | Principal Executive Officer |
| |
| Date | | March 14, 2019 | | | | |
| |
| |
| By | | /s/ Catherine D. Mathews |
| | | Catherine D. Mathews |
| | | Principal Financial Officer |
| |
| Date | | March 14, 2019 | | | | |