UNITED STATES
SECURITIES AND EXCHANGE COMMISSION
Washington, D.C. 20549
FORM N-CSR
CERTIFIED SHAREHOLDER REPORT OF REGISTERED
MANAGEMENT INVESTMENT COMPANIES
Investment Company Act File Number: 811-04521
| T. Rowe Price State Tax-Free Funds, Inc. |
|
| (Exact name of registrant as specified in charter) |
| |
| 100 East Pratt Street, Baltimore, MD 21202 |
|
| (Address of principal executive offices) |
| |
| David Oestreicher |
| 100 East Pratt Street, Baltimore, MD 21202 |
|
| (Name and address of agent for service) |
Registrant’s telephone number, including area code: (410) 345-2000
Date of fiscal year end: February 28
Date of reporting period: February 28, 2019
Item 1. Report to Shareholders
| Maryland Short-Term Tax-Free Bond Fund | February 28, 2019 |
Beginning on January 1, 2021, as permitted by SEC regulations, paper copies of the T. Rowe Price funds’ annual and semiannual shareholder reports will no longer be mailed, unless you specifically request them. Instead, shareholder reports will be made available on the funds’ website (troweprice.com/prospectus), and you will be notified by mail with a website link to access the reports each time a report is posted to the site.
If you already elected to receive reports electronically, you will not be affected by this change and need not take any action. At any time, shareholders who invest directly in T. Rowe Price funds may generally elect to receive reports or other communications electronically by enrolling attroweprice.com/paperlessor, if you are a retirement plan sponsor or invest in the funds through a financial intermediary (such as an investment advisor, broker-dealer, insurance company, or bank), by contacting your representative or your financial intermediary.
You may elect to continue receiving paper copies of future shareholder reports free of charge. To do so, if you invest directly with T. Rowe Price, please call T. Rowe Price as follows: IRA, nonretirement account holders, and institutional investors,1-800-225-5132; small business retirement accounts,1-800-492-7670. If you are a retirement plan sponsor or invest in the T. Rowe Price funds through a financial intermediary, please contact your representative or financial intermediary or follow additional instructions if included with this document. Your election to receive paper copies of reports will apply to all funds held in your account with your financial intermediary or, if you invest directly in the T. Rowe Price funds, with T. Rowe Price. Your election can be changed at any time in the future.
| T. ROWE PRICE MARYLAND TAX-FREE FUNDS |
|
HIGHLIGHTS
| ■ | Tax-free municipal bond returns were positive in the 12-month period ended February 28, 2019, and munis generally outperformed taxable investment-grade bonds. |
| |
| ■ | The Maryland Tax-Free Bond Fund and Maryland Tax-Free Money Fund generated positive returns and performed in line with their peer groups for the period, while the Maryland Short-Term Tax-Free Bond Fund trailed its peer group average. |
| |
| ■ | Maryland has a long history of responsible stewardship and prudent financial management, but we are closely monitoring the state’s progress in reducing its unfunded pension liabilities. |
| |
| ■ | The muni market continues to assess the long-term impact of the tax reform law passed in December 2017, but we believe muni fundamentals are sound overall, and global economic uncertainties could spur demand for the asset class. |

Log in to your account attroweprice.comfor more information.
*Certain mutual fund accounts that are assessed an annual account service fee can also save money by switching to e-delivery.
CIO Market Commentary
Dear Shareholder
Financial markets delivered a wide variety of returns during your fund’s fiscal year ended February 28, 2019. Despite suffering a sharp downturn in late 2018, U.S. equity markets performed decently, and bonds offered positive returns after a rise in interest rates reversed late in the period. Overseas equity markets were considerably weaker, however, and returns for U.S. investors in both foreign bonds and equities were further reduced by a substantial decline in almost all currencies relative to the U.S. dollar.
A widening gap between U.S. economic prospects and those of other major economies was largely responsible for the relative strength of the U.S. dollar and asset prices. Signs emerged in the spring of 2018 that growth in Europe and China was slowing. Conversely, the U.S. economy picked up speed in the middle of the year, boosted by fiscal stimulus from the December 2017 tax cuts and increased federal spending.
U.S. corporate profit growth was especially robust, helping the major indexes rise to record highs. Technology shares led the advance, and Apple established a milestone in early August by becoming the first public company with a $1 trillion market capitalization. Soon after, the bull market that began in March 2009 became the longest-running one in modern history.
Bond yields rose for much of the past year as growth expectations increased and the Federal Reserve raised rates four more times, resulting in a generally unfavorable environment for fixed income investors (bond prices and yields move in opposite directions). Both equity and bond markets swooned when Fed Chair Jerome Powell told an interviewer on October 3 that interest rates were still “a long way” from a neutral level that would neither stimulate nor restrain the economy. Within days, the yield on the benchmark 10-year Treasury note hit its highest level since the summer of 2011.
Yields soon reversed course alongside the economic outlook, however. Retail sales slumped late in 2018, and the manufacturing sector appeared to slow. The housing and auto sectors, which are particularly sensitive to rising rates, showed the greatest weakness. Powell soon changed his tune on interest rates, stating in late November that rates were “just below” the neutral level.
Policy uncertainty took a further toll on investor confidence. The U.S.-China trade dispute intensified late in 2018 as the Trump administration threatened to raise the tariff rate on Chinese goods on January 1. In early December, the White House announced that it was delaying the tariff hike, but investors were soon dealt another blow by the federal government’s partial shutdown. Several major stock indexes fell into a bear market, and Treasury yields sank to their lowest levels in over a year.
The stark shift in growth expectations and the tightening of financial conditions resulted in an abrupt turn in monetary policy. In January, Powell and other Fed officials signaled that they were reevaluating their rate-hiking plans and removed any reference to further rate increases in their policy statement. Stocks shot higher in response, making for the best start to a year (through February) in nearly three decades. Whether the recent rebound in investor confidence is justified remains to be seen, but it does seem likely that the Fed will remain in “pause” mode for the next few months.
Municipal bonds outperformed Treasuries and the broader U.S. taxable investment-grade bond market for the 12-month period. Demand for munis was generally strong, and the supply of bonds shrank due to a steep drop in refundings, although issuance began to rebound in early 2019. The new tax law that became effective in 2018 eliminated the tax benefits of advance refundings, which had allowed issuers to refinance existing debt with new bonds. Strong demand for higher-yielding securities, such as Puerto Rico debt and high yield tobacco bonds, helped lower-quality munis outperform higher-quality debt. Progress on debt restructuring contributed to a rally in Puerto Rico bonds from distressed levels.
The past year has been another lesson in how complex and intertwined the global economy has become, with events quickly rippling across borders and asset classes. Please know that your fund’s manager is working with a large and talented team of analysts in seeking to avoid the pitfalls in this turbulent environment, while exploiting the opportunities that lie ahead.
Thank you for your continued confidence in T. Rowe Price.
Sincerely,

Robert Sharps
Group Chief Investment Officer
Management’s Discussion of Fund Performance
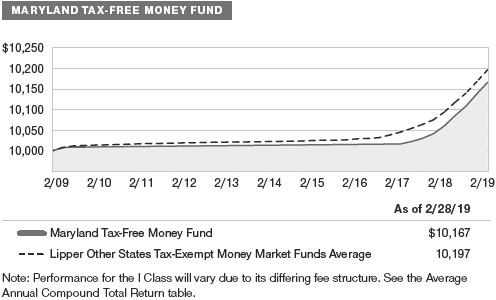
MARYLAND TAX-FREE MONEY FUND
INVESTMENT OBJECTIVE
The fund seeks to provide preservation of capital, liquidity, and, consistent with these objectives, the highest level of income exempt from federal and Maryland state and local income taxes.
FUND COMMENTARY
How did the fund perform in the past 12 months?
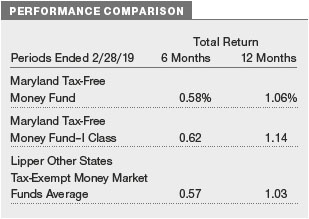
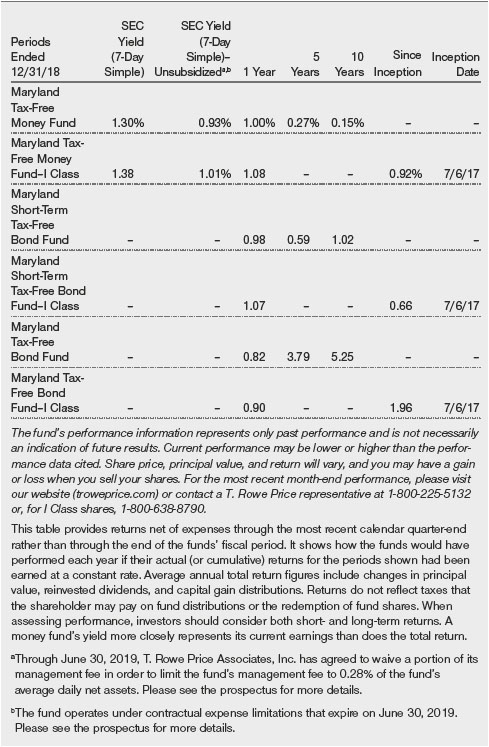
The Maryland Tax-Free Money Fund returned 1.06% in the 12 months ended February 28, 2019, while its peer group, the Lipper Other States Tax-Exempt Money Market Funds Average, returned 1.03%. (Returns for the I Class sharesvaried slightly, reflecting their different fee structure.Past performance cannot guarantee future results.)
What factors influenced the fund’s performance?
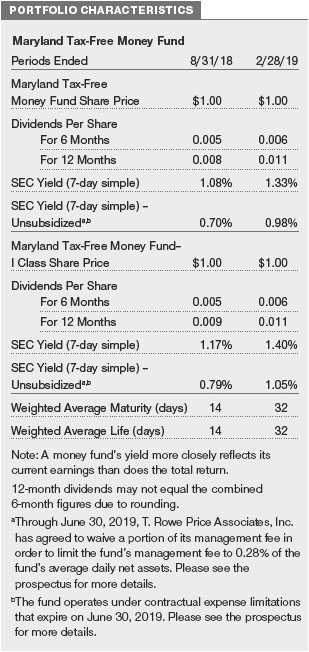
The Federal Reserve raised rates by a quarter percentage point four times during the reporting period, and the most recent hike, in December 2018, lifted the fed funds target rate to a range of 2.25% to 2.50%. Other short-term interest rates also generally rose, but yields at the long end of the money market yield curve declined as the Fed indicated in early 2019 that it may have reached the end of its tightening cycle. The SEC yield offered by the Maryland Tax-Free Money Fund increased from 0.83% to 1.33% during the 12-month period.
Besides the change in Fed policy, supply constraints and strong demand for tax-free securities held back increases in money market yields during the period. Maryland variable rate demand note (VRDN) yields averaged 1.57% since our last report six months ago, compared with a 1.37% average for the first half of the fund’s fiscal year. Longer rates decreased five basis points over the past six months, with one-year maturities trading at 1.72% at the end of the reporting period. (One hundred basis points equal one percentage point.)
How is the fund positioned?
VRDNs, at 66% of net assets, represented the portfolio’s largest position in absolute terms at the end of the period, and we are overweight these very short-maturity (one- to seven-day) securities compared with our peer group average. We also favor general market notes.
The fund’s weighted average maturity was slightly longer than its peer group at the end of the reporting period. However, our relative overweight to the front end of the money market yield curve provides the fund with the flexibility to respond to changes in interest rates or supply dynamics in the market.
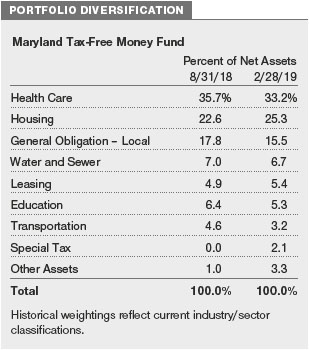
Credit quality continues to play a significant part in our security selection. At the end of the period, our largest sector allocations were to health care and housing revenue debt as well as local general obligation securities. Some prominent positions in the portfolio includedTrinity HealthandMontgomery County. (Please refer to the portfolio of investments for a complete list of holdings and the amount each represents in the portfolio.)
What is portfolio management’s outlook?
After four rate hikes in 2018, the Fed announced at its January monetary policy meeting that it would be “patient” in assessing future rate hikes, and we expect a pause in increases to the fed funds rate at least through the first half of 2019. We also believe supply and demand imbalances could continue to limit yield increases in the municipal money market.
As a result of these factors, we are pursuing a strategy that will allow the fund to quickly respond to a change in interest rate sentiment, an increase in issuance, or changing patterns of cash flows into or out of the muni money market. We believe the fund’s positioning in VRDNs and commercial paper is appropriate in this environment.
As always, we remain committed to managing a high-quality, diversified portfolio focused on liquidity and stability of principal, which we deem of utmost importance to our shareholders.
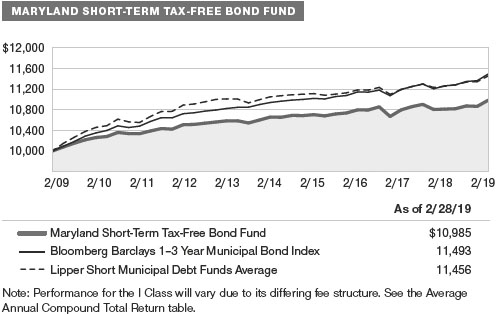
MARYLAND SHORT-TERM TAX-FREE BOND FUND
INVESTMENT OBJECTIVE
The fund seeks to provide the highest level of income exempt from federal and Maryland state and local income taxes consistent with modest fluctuation in principal value.
FUND COMMENTARY
How did the fund perform in the past 12 months?
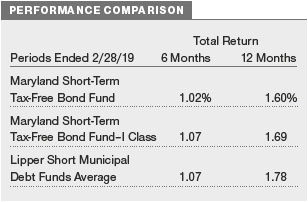
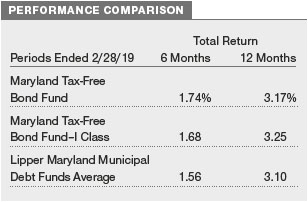
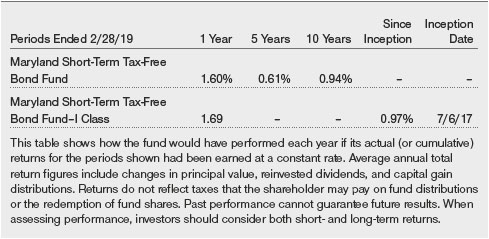
The Maryland Short-Term Tax-Free Bond Fund returned 1.60% for the 12 months ended February 28, 2019, underperforming the Lipper Short Municipal Debt Funds Average. (Returns for I Class shares varied slightly, reflecting their different fee structure.Past performance cannot guarantee future results.)
What factors influenced the fund’s performance?
Shorter-maturity municipal bonds produced positive returns for the 12-month period but underperformed the broader muni market as investors sought out higher-yielding, longer-maturity bonds. On a relative basis, the fund’s security selection in the health care sector detracted the most, while yield curve positioning was the primary contributor to results.
Our allocations on the yield curve were beneficial as yields declined; specifically, our out-of-benchmark allocation to five-year maturities added value as they outperformed securities with shorter maturities. As shown in the Portfolio Characteristics table on page 7, the fund’s weighted average maturity and duration slightly shortened over the last six months.
Our overweight in the revenue sector, particularly to the health care subsector, and underweight in prerefunded bonds also aided the fund’s results.
How is the fund positioned?
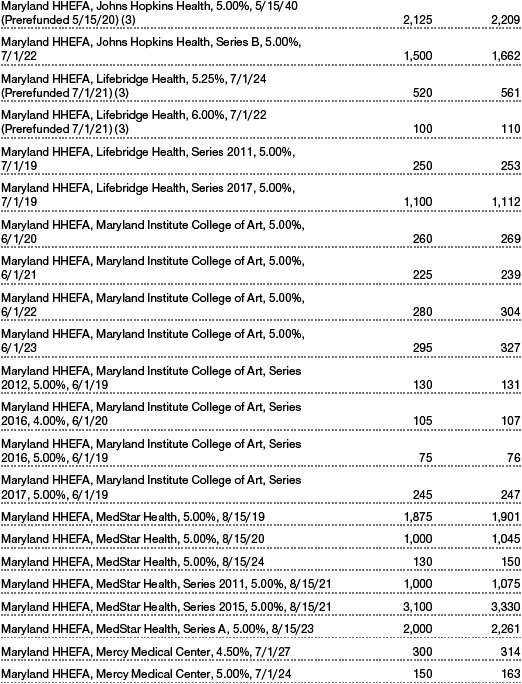
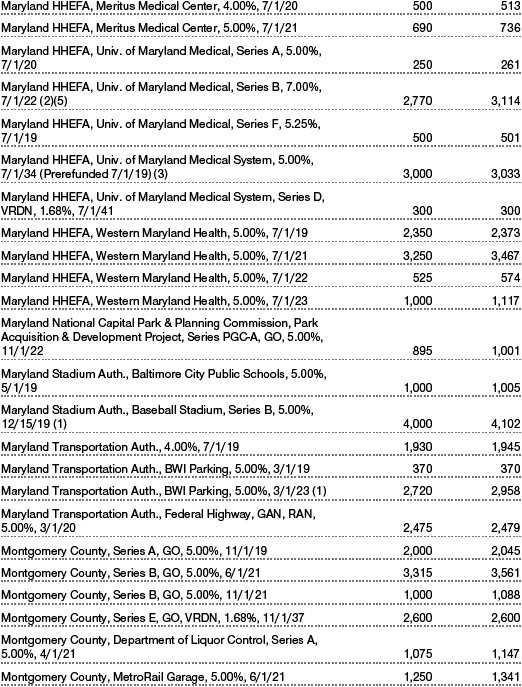
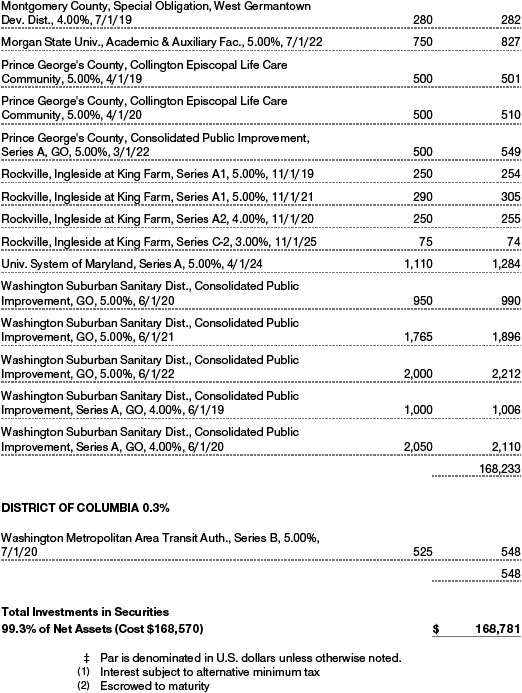
While our preference for revenue bonds over general obligations (GOs) remains intact, it has been challenging to find opportunities in revenue debt over the past couple of years in the short- to intermediate-term municipal market. As a result, local GO bonds continued to be one of the fund’s largest allocations at the sector level at the end of the period. However, we were pleased that we were able to reduce this position while increasing our allocation to higher-yielding revenue sectors such as health care, which represented our largest sector allocation at period-end, and transportation. Within health care, our most notable purchase was bonds forGaithersburg MD Economic Development for Asbury Obligated Group. (Please refer to the portfolio of investments for a complete list of holdings and the amount each represents in the portfolio.)
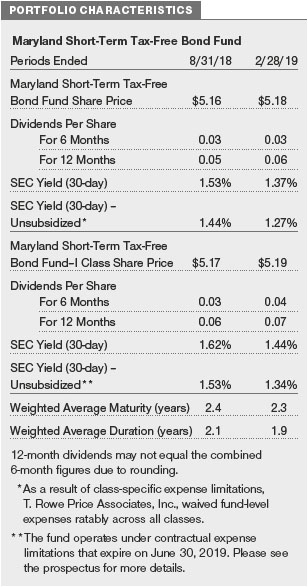
The portfolio’s allocation to prerefunded bonds increased from 7.2% to 9.7% over the most recent six months, but we continued to be underweight our benchmark. These bonds provide the fund with another source of liquidity in addition to cash that can be used to purchase higher-yielding securities when they become available, but we expect this position to decline over time as a result of the tax reform package passed at the end of 2017, which severely restricted the ability of issuers to create new prerefunded bonds in the tax-exempt market.
Nearly half the portfolio is allocated to AAA and AA rated bonds. However, during the second half of the fund’s fiscal year, that allocation decreased from 52% to 49% as we were able to redeploy assets among lower-rated bonds that offered the potential for more attractive risk-adjusted returns.
What is portfolio management’s outlook?
Despite some high-profile credit challenges, we believe that the municipal bond market overall remains a high-quality market that offers good opportunities for long-term investors seeking tax-free income. Although the market continues to assess the long-term impact of the Tax Cuts and Jobs Act passed in December 2017, tax reform has altered not only issuance patterns but also the economics of owning tax-free securities for some buyers, and, on balance, the law has been mildly negative for the municipal market. However, fundamentals for the asset class are generally sound, and global economic uncertainties could spur demand for munis.

Many are expecting higher rates in the coming year, though, in our view, uncertainty around the Fed’s interest rate moves in 2019 will likely leave muni and Treasury bond yields range-bound in the coming months. While rising yields pressure bond prices, munis should be less susceptible to rising rates than Treasuries given their attractive tax-equivalent yields and the steady demand for tax-exempt income.
While we believe that many states deserve high credit ratings and will be able to continue servicing their debts, we have longer-term concerns about significant funding shortfalls for pensions and other post-employment benefit obligations in some jurisdictions. Although few large plans are at risk of insolvency in the near term, the magnitude of unfunded liabilities is becoming more conspicuous in a few states.
Ultimately, we believe T. Rowe Price’s independent credit research is our greatest strength and will remain an asset for our investors as we navigate the current market environment. As always, we focus on finding attractively valued bonds issued by municipalities with good long-term fundamentals—an investment strategy that we believe will continue to serve our investors well.
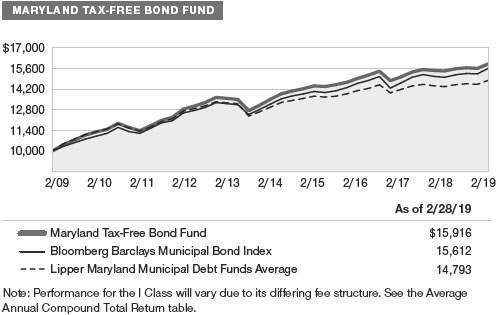
MARYLAND TAX-FREE BOND FUND
INVESTMENT OBJECTIVE
The fund seeks to provide, consistent with prudent portfolio management, the highest level of income exempt from federal and Maryland state and local income taxes by investing primarily in investment-grade Maryland municipal bonds.
FUND COMMENTARY
How did the fund perform in the past 12 months?
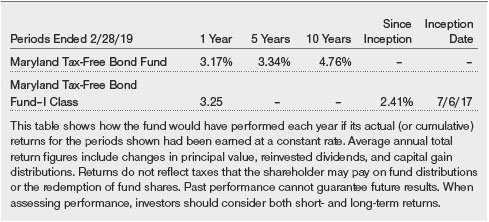
The Maryland Tax-Free Bond Fund returned 3.17% for the 12 months ended February 28, 2019, while the Lipper Maryland Municipal Debt Funds Average returned 3.10%. (Returns for I Class shares varied slightly, reflecting their different fee structure.Past performance cannot guarantee future results.)
What factors influenced the fund’s performance?
The overall environment for muni bonds was positive during the annual reporting period. The fund performed broadly in line with its peers for the past six and 12 months, and its results compared favorably for longer periods.
Positions in select A rated and other lower-quality bonds contributed to the fund’s results. Our best-performing bonds for the year were a small position inVirgin Islands debt, which recovered from depressed levels as the governor proposed steps to alleviate the U.S. territory’s fiscal troubles. (Income from U.S. territories such as the Virgin Islands and Puerto Rico is tax-free in all 50 states.) Lingering concerns about the finances of the U.S. Virgin Islands led us to reduce our position in the territory’s debt after its bonds reached our price target. Select longer-maturity hospital securities also boosted the fund’s returns. (Please refer to the fund’s portfolio of investments for a complete list of holdings and the amount each represents in the portfolio.)
On the negative side, our cautious view on interest rate risk left us with a higher concentration of high-quality, short-maturity bonds (under five years) as an offset to our longer (15 years and longer) holdings. This position detracted somewhat from relative returns as very short, high-quality bonds lagged as they were under pressure due to Federal Reserve rate hikes in 2018. In addition, widening credit spreads in the health care sector pressured returns in the most recent period. Longer term, we are confident our hospital and life care positions will be solid contributors for the portfolio.
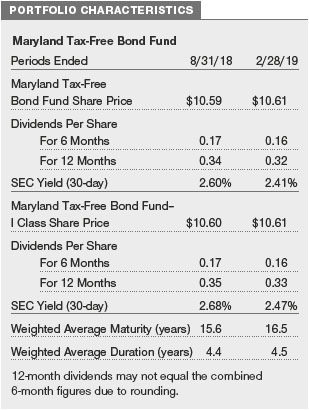
We moved the fund’s average maturity a bit longer later in the period as the Fed began to signal that it was near the end of its series of rate hikes. While we believe interest rates are still low generally, we are optimistic that rates may stay in a tight range in the near term and that the Fed’s next rate move may well be a rate cut. As such, we positioned the portfolio a bit less defensively. In the past six months, weighted average maturity, while still low, moved up about 0.9 years to 16.5 years while the fund’s weighted average duration (a measure of interest rate risk) ticked up to 4.5 years, which is also low by historical standards.
How is the fund positioned?
On a sector basis, we maintained our long-term emphasis on health care revenue bonds, including life care and hospitals. Health care, which provides a little extra yield compared with most other sectors, represented 28.1% of the fund’s assets at the end of the period. In life care, we started a new position in bonds fromBroadmead, which is located in Cockeysville, and added to our holdings ofAsbury Marylandin Gaithersburg.
While we still have lingering concerns about state and local governments’ ability to finance pensions and retiree health care benefits nationally, there are a number of strong local general obligation credits in Maryland that we added to during the reporting period, includingAnne Arundel CountyandBaltimore County. Some other notable additions included a couple of our old favorites in the transportation sector—bonds for thePurple Line Projectand theWashington DC Metropolitan Area Transportation Authority. While both have received their share of negative press, we are confident that these securities will be good performers for the portfolio over the long term.
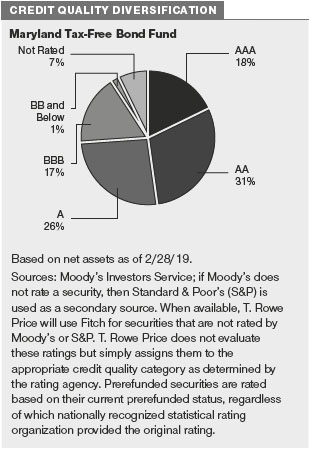
Prerefunded bonds still represented a decent concentration of the fund’s assets at the end of the period but dropped to 8.4% of the portfolio from 13.8% over the second half of the fund’s fiscal year. This number should continue to decline over time as a result of the tax reform package passed at the end of 2017, which severely restricted the ability of issuers to create new prerefunded bonds in the tax-exempt market. The fund remains a high-quality portfolio, with nearly a half of assets invested in AAA or AA securities.
Beginning in February 2019, for the first time in a decade, we began to purchase Puerto Rico-domiciled credits. As Puerto Rico continues to work its way through bankruptcy, we saw some value in the outstanding water and electric utility debt,PRASAandPREPA. Our PREPA purchases were defaulted bonds, but we are optimistic a deal with creditors and a potential public-private partnership to operate the utility will provide these securities with a boost from the significantly discounted value they now offer.
We expect to keep our allocation to Puerto Rico’s utilities at a modest level as the underlying Puerto Rico economy still faces momentous challenges. We have no plans at present to go beyond the utilities and to add Puerto Rico general obligation bonds.
Maryland’s credit rating was unchanged during the period. As of February 28, 2019, the state’s GO bonds were rated Aaa by Moody’s Investors Service and AAA by S&P Global Ratings and Fitch Ratings. All three rating agencies maintain stable outlooks. Maryland’s fiscal year 2018 surplus of $504 million was larger than expected.
Maryland has a long history of responsible stewardship and prudent financial management, but, unfavorably, Maryland’s pension system was only funded at 71% on an actuarial basis as of June 30, 2018. Maryland’s practice of not fully funding its actuarial required contributions has led to a rise in its unfunded pension liability. As a result, Maryland faces heavy unfunded liabilities for its pension plans compared with other AAA rated states, at $20 billion as of June 30, 2018—a significant rise from $10 billion as of June 30, 2008. Various modifications to benefits under these programs as well as higher employee contributions have been imposed to reduce liabilities and improve funding, and we are closely monitoring Maryland’s progress in this regard.
What is portfolio management’s outlook?
Despite some high-profile credit challenges, we believe that the municipal bond market overall remains a high-quality market that offers good opportunities for long-term investors seeking tax-free income. Although the market continues to assess the long-term impact of the Tax Cuts and Jobs Act passed in December 2017, tax reform has altered not only issuance patterns but also the economics of owning tax-free securities for some buyers, and, on balance, the law has been mildly negative for the municipal market. However, fundamentals for the asset class are generally sound, and global economic uncertainties could spur demand for munis.
Many are expecting higher rates in the coming year, though, in our view, uncertainty around the Fed’s interest rate moves in 2019 will likely leave muni and Treasury bond yields range-bound in the coming months. While rising yields pressure bond prices, munis should be less susceptible to rising rates than Treasuries given their attractive tax-equivalent yields and the steady demand for tax-exempt income.
While we believe that many states deserve high credit ratings and will be able to continue servicing their debts, we have longer-term concerns about significant funding shortfalls for pensions and other post-employment benefit obligations in some jurisdictions. Although few large plans are at risk of insolvency in the near term, the magnitude of unfunded liabilities is becoming more conspicuous in a few states.
Ultimately, we believe T. Rowe Price’s independent credit research is our greatest strength and will remain an asset for our investors as we navigate the current market environment. As always, we focus on finding attractively valued bonds issued by municipalities with good long-term fundamentals—an investment strategy that we believe will continue to serve our investors well.
The views expressed reflect the opinions of T. Rowe Price as of the date of this report and are subject to change based on changes in market, economic, or other conditions. These views are not intended to be a forecast of future events and are no guarantee of future results.
RISKS OF INVESTING IN A RETAIL MONEY MARKET FUND
You could lose money by investing in the Fund. Although the Fund seeks to preserve the value of your investment at $1.00 per share, it cannot guarantee it will do so. The Fund may impose a fee upon the sale of your shares or may temporarily suspend your ability to sell shares if the Fund’s liquidity falls below required minimums because of market conditions or other factors. An investment in the Fund is not insured or guaranteed by the Federal Deposit Insurance Corporation or any other government agency. The Fund’s sponsor has no legal obligation to provide financial support to the Fund, and you should not expect that the sponsor will provide financial support to the Fund at any time.
RISKS OF INVESTING IN FIXED INCOME SECURITIES
Bonds are subject to interest rate risk (the decline in bond prices that usually accompanies a rise in interest rates) and credit risk (the chance that any fund holding could have its credit rating downgraded or that a bond issuer will default by failing to make timely payments of interest or principal), potentially reducing the fund’s income level and share price. The fund is less diversified than one investing nationally. Some income may be subject to state and local taxes and the federal alternative minimum tax.
BENCHMARK INFORMATION
Note: Bloomberg Index Services Ltd. Copyright © 2019, Bloomberg Index Services Ltd. Used with permission.
GROWTH OF $10,000
This chart shows the value of a hypothetical $10,000 investment in the fund over the past 10 fiscal year periods or since inception (for funds lacking 10-year records). The result is compared with benchmarks, which include a broad-based market index and may also include a peer group average or index. Market indexes do not include expenses, which are deducted from fund returns as well as mutual fund averages and indexes.
AVERAGE ANNUAL COMPOUND TOTAL RETURN
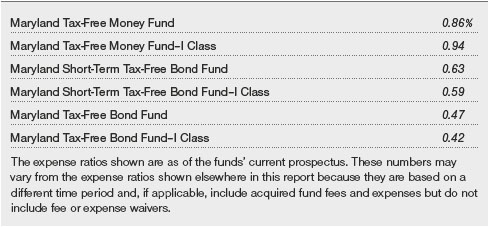
EXPENSE RATIOS
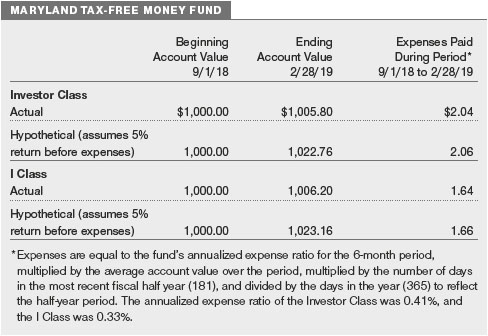
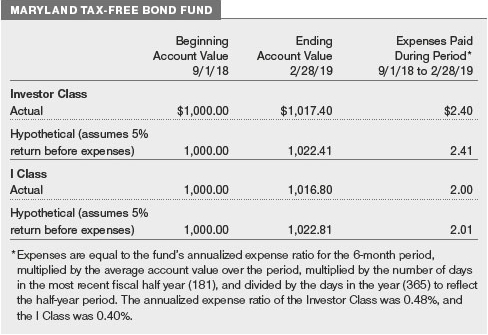
FUND EXPENSE EXAMPLE
As a mutual fund shareholder, you may incur two types of costs: (1) transaction costs, such as redemption fees or sales loads, and (2) ongoing costs, including management fees, distribution and service (12b-1) fees, and other fund expenses. The following example is intended to help you understand your ongoing costs (in dollars) of investing in the fund and to compare these costs with the ongoing costs of investing in other mutual funds. The example is based on an investment of $1,000 invested at the beginning of the most recent six-month period and held for the entire period.
Please note that the fund has two share classes: The original share class (Investor Class) charges no distribution and service (12b-1) fee, and the I Class shares are also available to institutionally oriented clients and impose no 12b-1 or administrative fee payment. Each share class is presented separately in the table.
Actual Expenses
The first line of the following table (Actual) provides information about actual account values and expenses based on the fund’s actual returns. You may use the information on this line, together with your account balance, to estimate the expenses that you paid over the period. Simply divide your account value by $1,000 (for example, an $8,600 account value divided by $1,000 = 8.6), then multiply the result by the number on the first line under the heading “Expenses Paid During Period” to estimate the expenses you paid on your account during this period.
Hypothetical Example for Comparison Purposes
The information on the second line of the table (Hypothetical) is based on hypothetical account values and expenses derived from the fund’s actual expense ratio and an assumed 5% per year rate of return before expenses (not the fund’s actual return). You may compare the ongoing costs of investing in the fund with other funds by contrasting this 5% hypothetical example and the 5% hypothetical examples that appear in the shareholder reports of the other funds. The hypothetical account values and expenses may not be used to estimate the actual ending account balance or expenses you paid for the period.
Note:T. Rowe Price charges an annual account service fee of $20, generally for accounts with less than $10,000. The fee is waived for any investor whose T. Rowe Price mutual fund accounts total $50,000 or more; accounts electing to receive electronic delivery of account statements, transaction confirmations, prospectuses, and shareholder reports; or accounts of an investor who is a T. Rowe Price Personal Services or Enhanced Personal Services client (enrollment in these programs generally requires T. Rowe Price assets of at least $250,000). This fee is not included in the accompanying table. If you are subject to the fee, keep it in mind when you are estimating the ongoing expenses of investing in the fund and when comparing the expenses of this fund with other funds.
You should also be aware that the expenses shown in the table highlight only your ongoing costs and do not reflect any transaction costs, such as redemption fees or sales loads. Therefore, the second line of the table is useful in comparing ongoing costs only and will not help you determine the relative total costs of owning different funds. To the extent a fund charges transaction costs, however, the total cost of owning that fund is higher.

QUARTER-END RETURNS
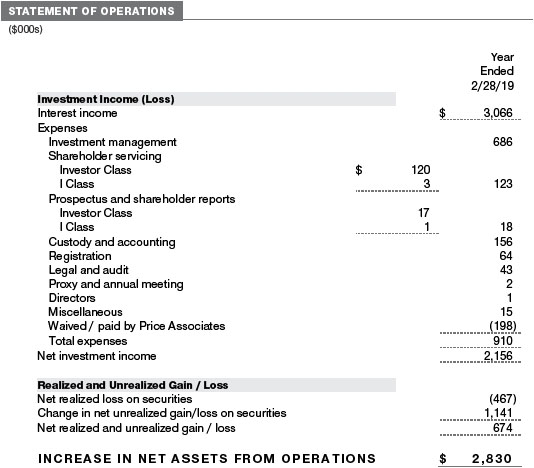
The accompanying notes are an integral part of these financial statements.
The accompanying notes are an integral part of these financial statements.


The accompanying notes are an integral part of these financial statements.
The accompanying notes are an integral part of these financial statements.
The accompanying notes are an integral part of these financial statements.
The accompanying notes are an integral part of these financial statements.
| NOTES TO FINANCIAL STATEMENTS |
T. Rowe Price State Tax-Free Funds, Inc. (the corporation) is registered under the Investment Company Act of 1940 (the 1940 Act). The Maryland Short-Term Tax-Free Bond Fund (the fund) is a nondiversified, open-end management investment company established by the corporation. The fund seeks to provide the highest level of income exempt from federal and Maryland state and local income taxes consistent with modest fluctuation in principal value. The fund has two classes of shares: the Maryland Short-Term Tax-Free Bond Fund (Investor Class) and the Maryland Short-Term Tax-Free Bond Fund–I Class (I Class). I Class shares generally are available only to investors meeting a $1,000,000 minimum investment, although the minimum is generally waived for certain client accounts. Each class has exclusive voting rights on matters related solely to that class; separate voting rights on matters that relate to both classes; and, in all other respects, the same rights and obligations as the other class.
NOTE 1 - SIGNIFICANT ACCOUNTING POLICIES
Basis of PreparationThe fund is an investment company and follows accounting and reporting guidance in the Financial Accounting Standards Board (FASB)Accounting Standards CodificationTopic 946 (ASC 946). The accompanying financial statements were prepared in accordance with accounting principles generally accepted in the United States of America (GAAP), including, but not limited to, ASC 946. GAAP requires the use of estimates made by management. Management believes that estimates and valuations are appropriate; however, actual results may differ from those estimates, and the valuations reflected in the accompanying financial statements may differ from the value ultimately realized upon sale or maturity. Certain ratios in the accompanying Financial Highlights have been included to conform to the current year presentation.
Investment Transactions, Investment Income, and DistributionsInvestment transactions are accounted for on the trade date basis. Income and expenses are recorded on the accrual basis. Realized gains and losses are reported on the identified cost basis. Premiums and discounts on debt securities are amortized for financial reporting purposes. Income tax-related interest and penalties, if incurred, are recorded as income tax expense. Distributions to shareholders are recorded on the ex-dividend date.Income distributions are declared by each class daily and paid monthly. A capital gain distribution may also be declared and paid by the fund annually.
Class AccountingShareholder servicing, prospectus, and shareholder report expenses incurred by each class are charged directly to the class to which they relate. Expenses common to both classes and investment income are allocated to the classes basedupon the relative daily net assets of each class’s settled shares; realized and unrealized gains and losses are allocated based upon the relative daily net assets of each class’s outstanding shares.
New Accounting GuidanceIn March 2017, the FASB issued amended guidance to shorten the amortization period for certain callable debt securities held at a premium. The guidance is effective for fiscal years and interim periods beginning after December 15, 2018. Adoption will have no effect on the fund’s net assets or results of operations.
IndemnificationIn the normal course of business, the fund may provide indemnification in connection with its officers and directors, service providers, and/or private company investments. The fund’s maximum exposure under these arrangements is unknown; however, the risk of material loss is currently considered to be remote.
NOTE 2 - VALUATION
The fund’s financial instruments are valued and each class’s net asset value (NAV) per share is computed at the close of the New York Stock Exchange (NYSE), normally 4 p.m. ET, each day the NYSE is open for business. However, the NAV per share may be calculated at a time other than the normal close of the NYSE if trading on the NYSE is restricted, if the NYSE closes earlier, or as may be permitted by the SEC.
Fair ValueThe fund’s financial instruments are reported at fair value, which GAAP defines as the price that would be received to sell an asset or paid to transfer a liability in an orderly transaction between market participants at the measurement date. The T. Rowe Price Valuation Committee (the Valuation Committee) is an internal committee that has been delegated certain responsibilities by the fund’s Board of Directors (the Board) to ensure that financial instruments are appropriately priced at fair value in accordance with GAAP and the 1940 Act. Subject to oversight by the Board, the Valuation Committee develops and oversees pricing-related policies and procedures and approves all fair value determinations. Specifically, the Valuation Committee establishes procedures to value securities; determines pricing techniques, sources, and persons eligible to effect fair value pricing actions; oversees the selection, services, and performance of pricing vendors; oversees valuation-related business continuity practices; and provides guidance on internal controls and valuation-related matters. The Valuation Committee reports to the Board and has representation from legal, portfolio management and trading, operations, risk management, and the fund’s treasurer.
Various valuation techniques and inputs are used to determine the fair value of financial instruments. GAAP establishes the following fair value hierarchy that categorizes the inputs used to measure fair value:
Level 1 – quoted prices (unadjusted) in active markets for identical financial instruments that the fund can access at the reporting date
Level 2 – inputs other than Level 1 quoted prices that are observable, either directly or indirectly (including, but not limited to, quoted prices for similar financial instruments in active markets, quoted prices for identical or similar financial instruments in inactive markets, interest rates and yield curves, implied volatilities, and credit spreads)
Level 3 – unobservable inputs
Observable inputs are developed using market data, such as publicly available information about actual events or transactions, and reflect the assumptions that market participants would use to price the financial instrument. Unobservable inputs are those for which market data are not available and are developed using the best information available about the assumptions that market participants would use to price the financial instrument. GAAP requires valuation techniques to maximize the use of relevant observable inputs and minimize the use of unobservable inputs. When multiple inputs are used to derive fair value, the financial instrument is assigned to the level within the fair value hierarchy based on the lowest-level input that is significant to the fair value of the financial instrument. Input levels are not necessarily an indication of the risk or liquidity associated with financial instruments at that level but rather the degree of judgment used in determining those values.
Valuation TechniquesDebt securities generally are traded in the over-the-counter (OTC) market and are valued at prices furnished by dealers who make markets in such securities or by an independent pricing service, which considers the yield or price of bonds of comparable quality, coupon, maturity, and type, as well as prices quoted by dealers who make markets in such securities. Generally, debt securities are categorized in Level 2 of the fair value hierarchy; however, to the extent the valuations include significant unobservable inputs, the securities would be categorized in Level 3.
Assets and liabilities other than financial instruments, including short-term receivables and payables, are carried at cost, or estimated realizable value, if less, which approximates fair value.
Thinly traded financial instruments and those for which the above valuation procedures are inappropriate or are deemed not to reflect fair value are stated at fair value as determined in good faith by the Valuation Committee. The objective of any fair valuepricing determination is to arrive at a price that could reasonably be expected from a current sale. Financial instruments fair valued by the Valuation Committee are primarily private placements, restricted securities, warrants, rights, and other securities that are not publicly traded.
Subject to oversight by the Board, the Valuation Committee regularly makes good faith judgments to establish and adjust the fair valuations of certain securities as events occur and circumstances warrant. For instance, in determining the fair value of troubled or thinly traded debt instruments, the Valuation Committee considers a variety of factors, which may include, but are not limited to, the issuer’s business prospects, its financial standing and performance, recent investment transactions in the issuer, strategic events affecting the company, market liquidity for the issuer, and general economic conditions and events. In consultation with the investment and pricing teams, the Valuation Committee will determine an appropriate valuation technique based on available information, which may include both observable and unobservable inputs. The Valuation Committee typically will afford greatest weight to actual prices in arm’s length transactions, to the extent they represent orderly transactions between market participants, transaction information can be reliably obtained, and prices are deemed representative of fair value. However, the Valuation Committee may also consider other valuation methods such as a discount or premium from market value of a similar, freely traded security of the same issuer; discounted cash flows; yield to maturity; or some combination. Fair value determinations are reviewed on a regular basis and updated as information becomes available, including actual purchase and sale transactions of the issue. Because any fair value determination involves a significant amount of judgment, there is a degree of subjectivity inherent in such pricing decisions, and fair value prices determined by the Valuation Committee could differ from those of other market participants. Depending on the relative significance of unobservable inputs, including the valuation technique(s) used, fair valued securities may be categorized in Level 2 or 3 of the fair value hierarchy.
Valuation InputsOn February 28, 2019, all of the fund’s financial instruments were classified as Level 2, based on the inputs used to determine their fair values.
NOTE 3 - OTHER INVESTMENT TRANSACTIONS
Purchases and sales of portfolio securities other than short-term securities aggregated $63,202,000 and $74,401,000, respectively, for the year ended February 28, 2019.
NOTE 4 - FEDERAL INCOME TAXES
No provision for federal income taxes is required since the fund intends to continue to qualify as a regulated investment company under Subchapter M of the Internal Revenue Code and distribute to shareholders all of its income and gains. Distributions determined in accordance with federal income tax regulations may differ in amount or character from net investment income and realized gains for financial reporting purposes.
The fund files U.S. federal, state, and local tax returns as required. The fund’s tax returns are subject to examination by the relevant tax authorities until expiration of the applicable statute of limitations, which is generally three years after the filing of the tax return but which can be extended to six years in certain circumstances. Tax returns for open years have incorporated no uncertain tax positions that require a provision for income taxes.
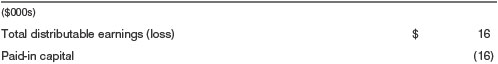
Financial reporting records are adjusted for permanent book/tax differences to reflect tax character but are not adjusted for temporary differences. The permanent book/tax adjustments have no impact on results of operations or net assets. For the year ended February 28, 2019, the following reclassification was recorded and relates primarily to expiring capital loss carryforwards:
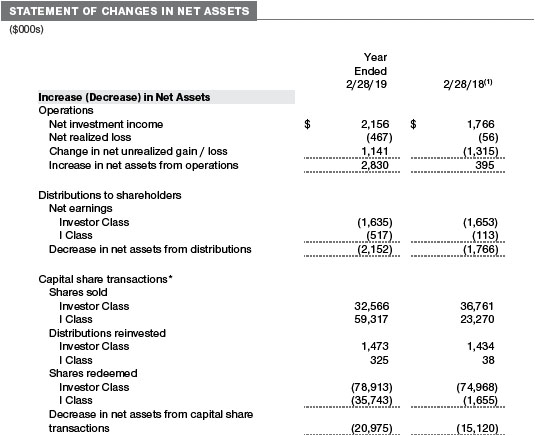
Distributions during the years ended February 28, 2019 and February 28, 2018, totaled $2,152,000 and $1,766,000, respectively, and were characterized as tax-exempt income for tax purposes. At February 28, 2019, the tax-basis cost of investments and components of net assets were as follows:
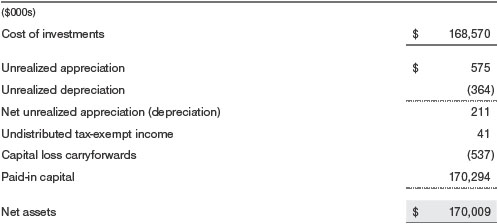
The fund intends to retain realized gains to the extent of available capital loss carryforwards. Net realized capital losses may be carried forward indefinitely to offset future realized capital gains.
NOTE 5 - RELATED PARTY TRANSACTIONS
The fund is managed by T. Rowe Price Associates, Inc. (Price Associates), a wholly owned subsidiary of T. Rowe Price Group, Inc. (Price Group). The investment management agreement between the fund and Price Associates provides for an annual investment management fee, which is computed daily and paid monthly. The fee consists of an individual fund fee, equal to 0.10% of the fund’s average daily net assets, and a group fee. The group fee rate is calculated based on the combined net assets of certain mutual funds sponsored by Price Associates (the group) applied to a graduated fee schedule, with rates ranging from 0.48% for the first $1 billion of assets to 0.265% for assets in excess of $650 billion. The fund’s group fee is determined by applying the group fee rate to the fund’s average daily net assets. At February 28, 2019, the effective annual group fee rate was 0.29%.
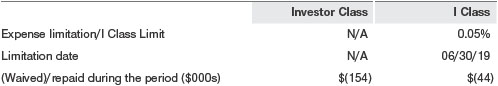
The I Class is subject to an operating expense limitation (I Class Limit) pursuant to which Price Associates is contractually required to pay all operating expenses of the I Class, excluding management fees, interest, expenses related to borrowings, taxes, brokerage, and other non-recurring expenses permitted by the investment management agreement, to the extent such operating expenses, on an annualized basis, exceed the I Class Limit. This agreement will continue through the limitation date indicated in the table below, and may be renewed, revised, or revoked only with approval of the fund’s Board. The I Class is required to repay Price Associates for expenses previously paid to the extent the class’s net assets grow or expenses decline sufficiently to allow repayment without causing the class’s operating expenses (after the repayment is taken into account) to exceed the lesser of: (1) the I Class Limit in place at the time such amounts were paid; or (2) the current I Class Limit. However, no repayment will be made more than three years after the date of a payment or waiver.
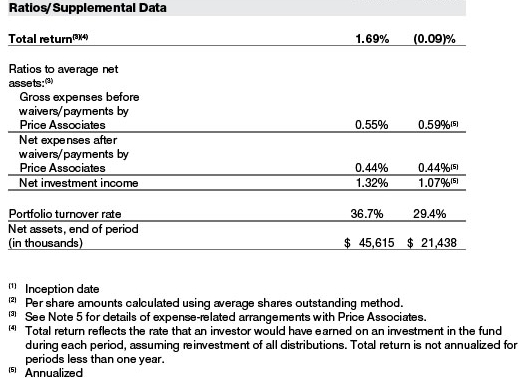
Pursuant to this agreement, expenses were waived/paid by and/or repaid to Price Associates during the year ended February 28, 2019 as indicated in the table below. Including this amount, expenses previously waived/paid by Price Associates in the amount of $364,000 remain subject to repayment by the fund at February 28, 2019. To the extent any expenses are waived or reimbursed in accordance with an expense limitation, the waiver or reimbursement is charged to the applicable class or allocated across the classes in the same manner as the related expense. Any repayment of expensespreviously waived/paid by Price Associates during the period, if any, would be included in the net investment income and expense ratios presented on the accompanying Financial Highlights.
In addition, the fund has entered into service agreements with Price Associates and a wholly owned subsidiary of Price Associates, each an affiliate of the fund (collectively, Price). Price Associates provides certain accounting and administrative services to the fund. T. Rowe Price Services, Inc. provides shareholder and administrative services in its capacity as the fund’s transfer and dividend-disbursing agent. For the year ended February 28, 2019, expenses incurred pursuant to these service agreements were $72,000 for Price Associates and $47,000 for T. Rowe Price Services, Inc. All amounts due to and due from Price, exclusive of investment management fees payable, are presented net on the accompanying Statement of Assets and Liabilities.
The fund may participate in securities purchase and sale transactions with other funds or accounts advised by Price Associates (cross trades), in accordance with procedures adopted by the fund’s Board and Securities and Exchange Commission rules, which require, among other things, that such purchase and sale cross trades be effected at the independent current market price of the security. During the year ended February 28, 2019, the aggregate value of purchases and sales cross trades with other funds or accounts advised by Price Associates was less than 1% of the fund’s net assets as of February 28, 2019.
REPORT OF INDEPENDENT REGISTERED PUBLIC ACCOUNTING FIRM
To the Board of Directors of T. Rowe Price State Tax-Free Funds, Inc. and
Shareholders of T. Rowe Price Maryland Short-Term Tax-Free Bond Fund
Opinion on the Financial Statements
We have audited the accompanying statement of assets and liabilities, including the portfolio of investments, of T. Rowe Price Maryland Short-Term Tax-Free Bond Fund (one of the funds constituting T. Rowe Price State Tax-Free Funds, Inc., hereafter referred to as the “Fund”) as of February 28, 2019, the related statement of operations for the year ended February 28, 2019, the statement of changes in net assets for each of the two years in the period ended February 28, 2019, including the related notes, and the financial highlights for each of the periods indicated therein (collectively referred to as the “financial statements”). In our opinion, the financial statements present fairly, in all material respects, the financial position of the Fund as of February 28, 2019, the results of its operations for the year then ended, the changes in its net assets for each of the two years in the period ended February 28, 2019 and the financial highlights for each of the periods indicated therein, in conformity with accounting principles generally accepted in the United States of America.
Basis for Opinion
These financial statements are the responsibility of the Fund’s management. Our responsibility is to express an opinion on the Fund’s financial statements based on our audits. We are a public accounting firm registered with the Public Company Accounting Oversight Board (United States) (PCAOB) and are required to be independent with respect to the Fund in accordance with the U.S. federal securities laws and the applicable rules and regulations of the Securities and Exchange Commission and the PCAOB.
We conducted our audits of these financial statements in accordance with the standards of the PCAOB. Those standards require that we plan and perform the audit to obtain reasonable assurance about whether the financial statements are free of material misstatement, whether due to error or fraud.
Our audits included performing procedures to assess the risks of material misstatement of the financial statements, whether due to error or fraud, and performing procedures that respond to those risks. Such procedures included examining, on a test basis, evidence regarding the amounts and disclosures in the financial statements. Our audits also included evaluating the accounting principles used and significant estimates made by management, as well as evaluating the overall presentation of the financial statements. Our procedures included confirmation of securities owned as of February 28, 2019 by correspondence with the custodian and brokers; when replies were not received from brokers, we performed other auditing procedures. We believe that our audits provide a reasonable basis for our opinion.
PricewaterhouseCoopers LLP
Baltimore, Maryland
April 18, 2019
We have served as the auditor of one or more investment companies in the T. Rowe Price group of investment companies since 1973.
TAX INFORMATION (UNAUDITED) FOR THE TAX YEAR ENDED 2/28/19
We are providing this information as required by the Internal Revenue Code. The amounts shown may differ from those elsewhere in this report because of differences between tax and financial reporting requirements.
The fund’s distributions to shareholders included $2,161,000 which qualified as exempt-interest dividends.
INFORMATION ON PROXY VOTING POLICIES, PROCEDURES, AND RECORDS
A description of the policies and procedures used by T. Rowe Price funds and portfolios to determine how to vote proxies relating to portfolio securities is available in each fund’s Statement of Additional Information. You may request this document by calling 1-800-225-5132 or by accessing the SEC’s website, sec.gov.
The description of our proxy voting policies and procedures is also available on our corporate website. To access it, please visit the following Web page:
https://www3.troweprice.com/usis/corporate/en/utility/policies.html
Scroll down to the section near the bottom of the page that says, “Proxy Voting Policies.” Click on the Proxy Voting Policies link in the shaded box.
Each fund’s most recent annual proxy voting record is available on our website and through the SEC’s website. To access it through T. Rowe Price, visit the website location shown above, and scroll down to the section near the bottom of the page that says, “Proxy Voting Records.” Click on the Proxy Voting Records link in the shaded box.
HOW TO OBTAIN QUARTERLY PORTFOLIO HOLDINGS
Effective for reporting periods on or after March 1, 2019, the fund files a complete schedule of portfolio holdings with the Securities and Exchange Commission (SEC) for the first and third quarters of each fiscal year as an exhibit to its reports on Form N-PORT. Prior to March 1, 2019, the fund filed a complete schedule of portfolio holdings with the SEC for the first and third quarters of each fiscal year on Form N-Q. The fund’s Forms N-PORT and N-Q are available electronically on the SEC’s website (sec.gov).
ABOUT THE FUND’S DIRECTORS AND OFFICERS
Your fund is overseen by a Board of Directors (Board) that meets regularly to review a wide variety of matters affecting or potentially affecting the fund, including performance, investment programs, compliance matters, advisory fees and expenses, service providers, and business and regulatory affairs. The Board elects the fund’s officers, who are listed in the final table. At least 75% of the Board’s members are independent of the Boards of T. Rowe Price Associates, Inc. (T. Rowe Price), and its affiliates; “inside” or “interested” directors are employees or officers of T. Rowe Price. The business address of each director and officer is 100 East Pratt Street, Baltimore, Maryland 21202. The Statement of Additional Information includes additional information about the fund directors and is available without charge by calling a T. Rowe Price representative at 1-800-638-5660.
| INDEPENDENT DIRECTORS(a) |
| |
Name
(Year of Birth)
Year Elected
[Number of T. Rowe Price
Portfolios Overseen] | | Principal Occupation(s) and Directorships of Public Companies and Other Investment Companies During the Past Five Years |
| | | |
Teresa Bryce Bazemore
(1959)
2018
[189] | | President, Radian Guaranty (2008 to 2017); Chief Executive Officer, Bazemore Consulting LLC (2018 to present); Director, Chimera Investment Corporation (2017 to present); Director, Federal Home Loan Bank of Pittsburgh (2017 to present) |
| | | |
Ronald J. Daniels
(1959)
2018
[189] | | President, The Johns Hopkins University(b)and Professor, Political Science Department, The Johns Hopkins University (2009 to present); Director, Lyndhurst Holdings (2015 to present) |
| | | |
Bruce W. Duncan
(1951)
2013
[189] | | Chief Executive Officer and Director (January 2009 to December 2016),Chairman of the Board (January 2016 to present), and President (January 2009 to September 2016), First Industrial Realty Trust, an owner and operator of industrial properties; Chairman of the Board (2005 to September 2016) and Director (1999 to September 2016), Starwood Hotels & Resorts, a hotel and leisure company; Member, Investment Company Institute Board of Governors (2017 to present); Member, Independent Directors Council Governing Board (2017 to present); Senior Advisor, KKR (November 2018 to present); Director, Boston Properties (May 2016 to present); Director, Marriott International, Inc. (September 2016 to present) |
| | | |
Robert J. Gerrard, Jr.
(1952)
2013
[189] | | Advisory Board Member, Pipeline Crisis/Winning Strategies, a collaborative working to improve opportunities for young African Americans (1997 to 2016); Chairman of the Board, all funds (July 2018 to present) |
| | | |
Paul F. McBride
(1956)
2013
[189] | | Advisory Board Member, Vizzia Technologies (2015 to present); Board Member, Dunbar Armored (2012 to 2018) |
| | | |
Cecilia E. Rouse, Ph.D.
(1963)
2013
[189] | | Dean, Woodrow Wilson School (2012 to present); Professor and Researcher, Princeton University (1992 to present); Director, MDRC, a nonprofit education and social policy research organization (2011 to present); Member, National Academy of Education (2010 to present); Research Associate of Labor Studies Program at the National Bureau of Economic Research (2011 to 2015); Board Member, National Bureau of Economic Research (2011 to present); Chair of Committee on the Status of Minority Groups in the Economic Profession of the American Economic Association (2012 to 2018); Vice President (2015 to 2016), Board Member, American Economic Association (2018 to present) |
| | | |
John G. Schreiber
(1946)
1992
[189] | | Owner/President, Centaur Capital Partners, Inc., a real estate investment company (1991 to present); Cofounder, Partner, and Cochairman of the Investment Committee, Blackstone Real Estate Advisors, L.P. (1992 to 2015); Director, Blackstone Mortgage Trust, a real estate finance company (2012 to 2016); Director and Chairman of the Board, Brixmor Property Group, Inc. (2013 to present); Director, Hilton Worldwide (2007 to present); Director, Hudson Pacific Properties (2014 to 2016); Director, Invitation Homes (2014 to 2017); Director, JMB Realty Corporation (1980 to present) |
| | | |
Mark R. Tercek(c)
(1957)
2009
[0] | | President and Chief Executive Officer, The Nature Conservancy (2008 to present) |
| |
| (a)All information about the independent directors was current as of February 19, 2019, unless otherwise indicated, except for the number of portfolios overseen, which is current as of the date of this report. |
| (b)William J. Stromberg, president and chief executive officer of T. Rowe Price Group, Inc., the parent company of the Price Funds’ investment advisor, has served on the Board of Trustees of Johns Hopkins University since 2014 and is a member of the Johns Hopkins University Board’s Compensation Committee. |
| (c)Effective February 15, 2019, Mr. Tercek resigned from his role as independent director of the Price Funds. |
| INSIDE DIRECTORS | | |
| |
Name
(Year of Birth)
Year Elected*
[Number of T. Rowe Price
Portfolios Overseen] | | Principal Occupation(s) and Directorships of Public Companies and Other Investment Companies During the Past Five Years |
| | | |
David Oestreicher
(1967)
2018
[189] | | Chief Legal Officer, Vice President, and Secretary, T. Rowe Price Group, Inc.; Director, Vice President, and Secretary, T. Rowe Price Investment Services, Inc., T. Rowe Price Retirement Plan Services, Inc., T. Rowe Price Services, Inc., and T. Rowe Price Trust Company; Vice President and Secretary, T. Rowe Price, T. Rowe Price Hong Kong (Price Hong Kong), and T. Rowe Price International; Vice President, T. Rowe Price Japan and T. Rowe Price Singapore (Price Singapore); Principal Executive Officer and Executive Vice President, all funds |
| | | |
Robert W. Sharps, CFA,
CPA**
(1971)
2019
[189] | | Director and Vice President, T. Rowe Price; Vice President, T. Rowe Price Group, Inc., and T. Rowe Price Trust Company |
| |
| *Each inside director serves until retirement, resignation, or election of a successor. |
| **Effective December 31, 2018, Edward A. Wiese resigned from his role as inside director of the domestic fixed income Price Funds. Mr. Sharps replaced Mr. Wiese as director of the domestic fixed income Price Funds effective January 1, 2019. |
| OFFICERS | | |
| | | |
Name (Year of Birth)
Position Held With State
Tax-Free Income Trust | | Principal Occupation(s) |
| | | |
Austin Applegate (1974)
Vice President | | Vice President, T. Rowe Price and T. Rowe Price Group, Inc. |
| | | |
R. Lee Arnold, Jr., CFA, CPA (1970)
Vice President | | Vice President, T. Rowe Price and T. Rowe Price Group, Inc. |
| | | |
Darrell N. Braman (1963)
Vice President and Secretary | | Vice President, Price Hong Kong, Price Singapore, T. Rowe Price, T. Rowe Price Group, Inc., and T. Rowe Price International; Assistant Vice President, T. Rowe Price Retirement Plan Services, Inc., and T. Rowe Price Services, Inc. |
| | | |
M. Helena Condez (1962)
Vice President | | Vice President, T. Rowe Price and T. Rowe Price Group, Inc. |
| | |
G. Richard Dent (1960)
Vice President | | Vice President, T. Rowe Price and T. Rowe Price Group, Inc. |
| | | |
Sarah J. Engle (1979)
Vice President | | Vice President, T. Rowe Price and T. Rowe Price Group, Inc. |
| | | |
Stephanie A. Gentile, CFA (1956)
Vice President | | Vice President, T. Rowe Price and T. Rowe Price Group, Inc. |
| | | |
John R. Gilner (1961)
Chief Compliance Officer | | Chief Compliance Officer and Vice President, T. Rowe Price; Vice President, T. Rowe Price Group, Inc., and T. Rowe Price Investment Services, Inc. |
| | | |
Gary J. Greb (1961)
Vice President | | Vice President, T. Rowe Price, T. Rowe Price International, and T. Rowe Price Trust Company |
| | | |
Charles B. Hill, CFA (1961)
Executive Vice President | | Vice President, T. Rowe Price and T. Rowe Price Group, Inc. |
| | | |
Dylan Jones, CFA (1971)
Vice President | | Vice President, T. Rowe Price and T. Rowe Price Group, Inc. |
| | | |
Marianna Korpusova, CFA (1984)
Vice President | | Vice President, T. Rowe Price and T. Rowe Price Group, Inc. |
| | | |
Paul J. Krug, CPA (1964)
Vice President | | Vice President, T. Rowe Price, T. Rowe Price Group, Inc., and T. Rowe Price Trust Company |
| | | |
Marcy M. Lash (1963)
Vice President | | Vice President, T. Rowe Price and T. Rowe Price Group, Inc. |
| | | |
Alan D. Levenson, Ph.D. (1958)
Vice President | | Vice President, T. Rowe Price and T. Rowe Price Group, Inc. |
| | | |
Joseph K. Lynagh, CFA (1958)
Executive Vice President | | Vice President, T. Rowe Price, T. Rowe Price Group, Inc., and T. Rowe Price Trust Company |
| | | |
James T. Lynch, CFA (1983)
Vice President | | Vice President, T. Rowe Price |
| | | |
Konstantine B. Mallas (1963)
Executive Vice President | | Vice President, T. Rowe Price and T. Rowe Price Group, Inc. |
| | | |
Catherine D. Mathews (1963)
Treasurer and Vice President | | Vice President, T. Rowe Price, T. Rowe Price Group, Inc., and T. Rowe Price Trust Company |
| | | |
Hugh D. McGuirk, CFA (1960)
President | | Vice President, T. Rowe Price and T. Rowe Price Group, Inc. |
| | | |
James M. Murphy, CFA (1967)
Vice President | | Vice President, T. Rowe Price and T. Rowe Price Group, Inc. |
| | | |
Linda A. Murphy (1959)
Vice President | | Vice President, T. Rowe Price and T. Rowe Price Group, Inc. |
| | | |
John W. Ratzesberger (1975)
Vice President | | Vice President, T. Rowe Price, T. Rowe Price Group, Inc., and T. Rowe Price Trust Company |
| | | |
Shannon H. Rauser (1987)
Assistant Secretary | | Assistant Vice President, T. Rowe Price |
| | | |
Chen Shao (1980)
Vice President | | Vice President, T. Rowe Price and T. Rowe Price Group, Inc. |
| | | |
Douglas D. Spratley, CFA (1969)
Vice President | | Vice President, T. Rowe Price and T. Rowe Price Group, Inc. |
| | |
Timothy G. Taylor, CFA (1975)
Vice President | | Vice President, T. Rowe Price and T. Rowe Price Group, Inc. |
| | | |
Robert D. Thomas (1971)
Vice President | | Vice President, T. Rowe Price Group, Inc., and T. Rowe Price International |
| | |
Megan Warren (1968)
Vice President | | Vice President, T. Rowe Price, T. Rowe Price Group, Inc., T. Rowe Price Retirement Plan Services, Inc., T. Rowe Price Services, Inc., and T. Rowe Price Trust Company; formerly, Executive Director, JPMorgan Chase (to 2017) |
| |
| Unless otherwise noted, officers have been employees of T. Rowe Price or T. Rowe Price International for at least 5 years. |
Item 2. Code of Ethics.
The registrant has adopted a code of ethics, as defined in Item 2 of Form N-CSR, applicable to its principal executive officer, principal financial officer, principal accounting officer or controller, or persons performing similar functions. A copy of this code of ethics is filed as an exhibit to this Form N-CSR. No substantive amendments were approved or waivers were granted to this code of ethics during the period covered by this report.
Item 3. Audit Committee Financial Expert.
The registrant’s Board of Directors/Trustees has determined that Mr. Bruce W. Duncan qualifies as an audit committee financial expert, as defined in Item 3 of Form N-CSR. Mr. Duncan is considered independent for purposes of Item 3 of Form N-CSR.
Item 4. Principal Accountant Fees and Services.
(a) – (d) Aggregate fees billed for the last two fiscal years for professional services rendered to, or on behalf of, the registrant by the registrant’s principal accountant were as follows:
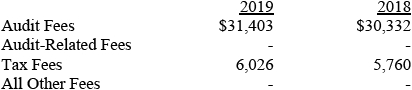
Audit fees include amounts related to the audit of the registrant’s annual financial statements and services normally provided by the accountant in connection with statutory and regulatory filings. Audit-related fees include amounts reasonably related to the performance of the audit of the registrant’s financial statements and specifically include the issuance of a report on internal controls and, if applicable, agreed-upon procedures related to fund acquisitions. Tax fees include amounts related to services for tax compliance, tax planning, and tax advice. The nature of these services specifically includes the review of distribution calculations and the preparation of Federal, state, and excise tax returns. All other fees include the registrant’s pro-rata share of amounts for agreed-upon procedures in conjunction with service contract approvals by the registrant’s Board of Directors/Trustees.
(e)(1) The registrant’s audit committee has adopted a policy whereby audit and non-audit services performed by the registrant’s principal accountant for the registrant, its investment adviser, and any entity controlling, controlled by, or under common control with the investment adviser that provides ongoing services to the registrant require pre-approval in advance at regularly scheduled audit committee meetings. If such a service is required between regularly scheduled audit committee meetings, pre-approval may be authorized by one audit committee member with ratification at the next scheduled audit committee meeting. Waiver of pre-approval for audit or non-audit services requiring fees of a de minimis amount is not permitted.
(2) No services included in (b) – (d) above were approved pursuant to paragraph (c)(7)(i)(C) of Rule 2-01 of Regulation S-X.
(f) Less than 50 percent of the hours expended on the principal accountant’s engagement to audit the registrant’s financial statements for the most recent fiscal year were attributed to work performed by persons other than the principal accountant’s full-time, permanent employees.
(g) The aggregate fees billed for the most recent fiscal year and the preceding fiscal year by the registrant’s principal accountant for non-audit services rendered to the registrant, its investment adviser, and any entity controlling, controlled by, or under common control with the investment adviser that provides ongoing services to the registrant were $2,391,000 and $2,160,000, respectively.
(h) All non-audit services rendered in (g) above were pre-approved by the registrant’s audit committee. Accordingly, these services were considered by the registrant’s audit committee in maintaining the principal accountant’s independence.
Item 5. Audit Committee of Listed Registrants.
Not applicable.
Item 6. Investments.
(a) Not applicable. The complete schedule of investments is included in Item 1 of this Form N-CSR.
(b) Not applicable.
Item 7. Disclosure of Proxy Voting Policies and Procedures for Closed-End Management Investment Companies.
Not applicable.
Item 8. Portfolio Managers of Closed-End Management Investment Companies.
Not applicable.
Item 9. Purchases of Equity Securities by Closed-End Management Investment Company and Affiliated Purchasers.
Not applicable.
Item 10. Submission of Matters to a Vote of Security Holders.
Not applicable.
Item 11. Controls and Procedures.
(a) The registrant’s principal executive officer and principal financial officer have evaluated the registrant’s disclosure controls and procedures within 90 days of this filing and have concluded that the registrant’s disclosure controls and procedures were effective, as of that date, in ensuring that information required to be disclosed by the registrant in this Form N-CSR was recorded, processed, summarized, and reported timely.
(b) During the period, the Price Funds’ accounting agent, The Bank of New York Mellon (BNYM), converted the fund’s books and records from a legacy fund accounting system / operating model to a BNYM fund accounting system / operating model.
Item 12. Disclosure of Securities Lending Activities for Closed-End Management Investment Companies.
Not applicable.
Item 13. Exhibits.
(a)(1) The registrant’s code of ethics pursuant to Item 2 of Form N-CSR is attached.
(2) Separate certifications by the registrant's principal executive officer and principal financial officer, pursuant to Section 302 of the Sarbanes-Oxley Act of 2002 and required by Rule 30a-2(a) under the Investment Company Act of 1940, are attached.
(3) Written solicitation to repurchase securities issued by closed-end companies: not applicable.
(b) A certification by the registrant’s principal executive officer and principal financial officer, pursuant to Section 906 of the Sarbanes-Oxley Act of 2002 and required by Rule 30a-2(b) under the Investment Company Act of 1940, is attached.
SIGNATURES
Pursuant to the requirements of the Securities Exchange Act of 1934 and the Investment Company Act of 1940, the registrant has duly caused this report to be signed on its behalf by the undersigned, thereunto duly authorized.
T. Rowe Price State Tax-Free Funds, Inc.
| By | | /s/ David Oestreicher |
| | | David Oestreicher |
| | | Principal Executive Officer |
| |
| Date | | April 18, 2019 | | | | |
Pursuant to the requirements of the Securities Exchange Act of 1934 and the Investment Company Act of 1940, this report has been signed below by the following persons on behalf of the registrant and in the capacities and on the dates indicated.
| By | | /s/ David Oestreicher |
| | | David Oestreicher |
| | | Principal Executive Officer |
| |
| Date | | April 18, 2019 | | | | |
| |
| |
| By | | /s/ Catherine D. Mathews |
| | | Catherine D. Mathews |
| | | Principal Financial Officer |
| |
| Date | | April 18, 2019 | | | | |