UNITED STATES
SECURITIES AND EXCHANGE COMMISSION
Washington, D.C. 20549
FORM N-CSR
CERTIFIED SHAREHOLDER REPORT OF REGISTERED
MANAGEMENT INVESTMENT COMPANIES
Investment Company Act file number 811-04707
Fidelity Advisor Series II
(Exact name of registrant as specified in charter)
245 Summer St., Boston, Massachusetts 02210
(Address of principal executive offices) (Zip code)
Margaret Carey, Secretary
245 Summer St.
Boston, Massachusetts 02210
(Name and address of agent for service)
Registrant's telephone number, including area code:
617-563-7000
| |
Date of fiscal year end: | August 31 |
|
|
Date of reporting period: | August 31, 2023 |
Item 1.
Reports to Stockholders
Fidelity Advisor® Limited Term Bond Fund
Annual Report
August 31, 2023
Includes Fidelity and Fidelity Advisor share classes
Contents
To view a fund's proxy voting guidelines and proxy voting record for the 12-month period ended June 30, visit http://www.fidelity.com/proxyvotingresults or visit the Securities and Exchange Commission's (SEC) web site at http://www.sec.gov.
You may also call 1-800-544-8544 if you're an individual investing directly with Fidelity, call 1-800-835-5092 if you're a plan sponsor or participant with Fidelity as your recordkeeper or call 1-877-208-0098 on institutional accounts or if you're an advisor or invest through one to request a free copy of the proxy voting guidelines.
Standard & Poor's, S&P and S&P 500 are registered service marks of The McGraw-Hill Companies, Inc. and have been licensed for use by Fidelity Distributors Corporation.
Other third-party marks appearing herein are the property of their respective owners.
All other marks appearing herein are registered or unregistered trademarks or service marks of FMR LLC or an affiliated company. © 2023 FMR LLC. All rights reserved.
This report and the financial statements contained herein are submitted for the general information of the shareholders of the Fund. This report is not authorized for distribution to prospective investors in the Fund unless preceded or accompanied by an effective prospectus.
A fund files its complete schedule of portfolio holdings with the SEC for the first and third quarters of each fiscal year on Form N-PORT. Forms N-PORT are available on the SEC's web site at http://www.sec.gov. A fund's Forms N-PORT may be reviewed and copied at the SEC's Public Reference Room in Washington, DC. Information regarding the operation of the SEC's Public Reference Room may be obtained by calling 1-800-SEC-0330.
For a complete list of a fund's portfolio holdings, view the most recent holdings listing, semiannual report, or annual report on Fidelity's web site at http://www.fidelity.com, http://www.institutional.fidelity.com, or http://www.401k.com, as applicable.
NOT FDIC INSURED •MAY LOSE VALUE •NO BANK GUARANTEE
Neither the Fund nor Fidelity Distributors Corporation is a bank.
Average annual total return reflects the change in the value of an investment, assuming reinvestment of distributions from dividend income and capital gains (the profits earned upon the sale of securities that have grown in value, if any) and assuming a constant rate of performance each year. The hypothetical investment and the average annual total returns do not reflect the deduction of taxes that a shareholder would pay on fund distributions or the redemption of fund shares. During periods of reimbursement by Fidelity, a fund's total return will be greater than it would be had the reimbursement not occurred. How a fund did yesterday is no guarantee of how it will do tomorrow.
| Average Annual Total Returns |
| | | | |
Periods ended August 31, 2023 | Past 1 year | Past 5 years | Past 10 years |
Class A (incl. 2.75% sales charge) | -0.75% | 0.54% | 1.01% |
Class M (incl. 2.75% sales charge) | -0.65% | 0.56% | 1.00% |
Class C (incl. contingent deferred sales charge) | 0.27% | 0.32% | 0.65% |
| Fidelity® Limited Term Bond Fund | 2.37% | 1.41% | 1.60% |
| Class I | 2.34% | 1.37% | 1.55% |
| Class Z | 2.45% | 1.49% | 1.62% |
Class C shares' contingent deferred sales charges included in the past one year, past five years and past ten years total return figures are 1%, 0% and 0%, respectively.
The initial offering of Class Z shares took place on October 2, 2018. Returns prior to October 2, 2018, are those of Class I.
Prior to October 30, 2013, the fund was named Fidelity Advisor® Intermediate Bond Fund, and the fund operated under certain different investment policies and compared its performance to a different index. The fund's historical performance may not represent its current investment policies.
The initial offering of Fidelity® Limited Term Bond Fund shares took place on November 1, 2013. Returns prior to November 1, 2013 are those of Class I.
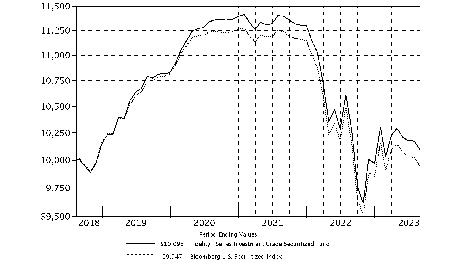
| $10,000 Over 10 Years |
| |
Let's say hypothetically that $10,000 was invested in Fidelity Advisor® Limited Term Bond Fund - Class A, a class of the fund, on August 31, 2013, and the current 2.75% sales charge was paid. The chart shows how the value of your investment would have changed, and also shows how the Bloomberg U.S. 1-5 Year Government/Credit Bond Index performed over the same period. |
|
|
Market Recap:
U.S. taxable investment-grade bonds returned -1.19% for the 12 months ending August 31, 2023, according to the Bloomberg U.S. Aggregate Bond Index. The first months of the period saw a continuation of the historic bond market downturn that began in early 2022, when the U.S. Federal Reserve began an aggressive series of interest rate hikes to combat persistent inflation. The actions helped push nominal and real U.S. bond yields to their highest levels in more than a decade. Bond prices, which move inversely to yields, fell sharply through October, and credit spreads widened, as investors demanded more yield for buying credit-sensitive assets. In November, the bond market staged a broad rally (+3.68%) when comments by Fed Chair Jerome Powell pointed to a slowdown in the size of future rate hikes. With the market anticipating the end of the hiking cycle by midyear, the index advanced 3.59% in the first four months of 2023, only to fall back in each of the four next months, as cooling but still-high inflation and a strong labor market suggested the Fed may need to keep raising rates for longer than anticipated. To date, the central bank has raised its benchmark rate 11 times, by a total of 5.25 percentage points. For the full 12 months, short-term bonds outperformed long-term issues, while lower-quality bonds bettered higher-quality debt, and risk assets like corporate bonds and asset-backed securities outpaced U.S. Treasuries. Meanwhile, U.S. mortgage-backed securities lagged in the rising-rate environment.
Comments from Co-Portfolio Managers Rob Galusza, Julian Potenza and David DeBiase:
For the fiscal year ending August 31, 2023, the fund's retail and advisor share classes (excluding sales charges, if applicable) posted gains ranging from 1.27% to 2.45%, net of fees, versus the 1.81% advance of the Fidelity Limited Term Composite Index and the 1.19% increase in the Bloomberg U.S. 1-5 Year Government/Credit Bond Index. During the 12 months, sector allocation and security selection both contributed to performance versus the Composite index. Non-Composite exposure to asset-backed securities, including collateralized loan obligations and car loan debt, added notable relative value. Picks among corporate bonds, especially in the banking and industrial segments, also meaningfully contributed, while an allocation to commercial mortgage-backed securities further helped. Conversely, due to the movement in interest rates this period, U.S. Treasury futures contracts notably detracted from the portfolio's relative result. At period end, corporate bonds made up about 68% of fund assets, up from roughly 61% a year ago and compared with the Composite average of about 66%. The portfolio's allocation to asset-backed securities ticked down from 13% to about 12% the past 12 months, and we decreased our exposure to U.S. Treasuries from 13% to roughly 7% of assets, versus an average weight of 19% for the Composite index.
The views expressed above reflect those of the portfolio manager(s) only through the end of the period as stated on the cover of this report and do not necessarily represent the views of Fidelity or any other person in the Fidelity organization. Any such views are subject to change at any time based upon market or other conditions and Fidelity disclaims any responsibility to update such views. These views may not be relied on as investment advice and, because investment decisions for a Fidelity fund are based on numerous factors, may not be relied on as an indication of trading intent on behalf of any Fidelity fund.
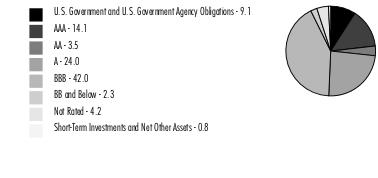
Quality Diversification (% of Fund's net assets) |
|
| |
| We have used ratings from Moody's Investors Service, Inc. Where Moody's® ratings are not available, we have used S&P® ratings. All ratings are as of the date indicated and do not reflect subsequent changes. |
Securities rated BB or below were rated investment grade at the time of acquisition.
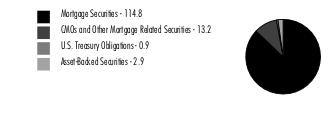
Asset Allocation (% of Fund's net assets) |
|
Futures - 12.7% |
|
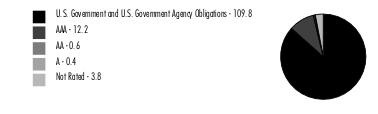
Geographic Diversification (% of Fund's net assets) |
|
* Includes Short-Term investments and Net Other Assets (Liabilities). Percentages are adjusted for the effect of derivatives, if applicable. |
| |
Showing Percentage of Net Assets
| Nonconvertible Bonds - 68.1% |
| | | Principal Amount (a) | Value ($) |
| COMMUNICATION SERVICES - 3.2% | | | |
| Diversified Telecommunication Services - 1.8% | | | |
| AT&T, Inc.: | | | |
| 0.9% 3/25/24 | | 5,000,000 | 4,862,703 |
| 1.65% 2/1/28 | | 12,588,000 | 10,762,907 |
| NTT Finance Corp.: | | | |
| 0.583% 3/1/24 (b) | | 4,260,000 | 4,150,428 |
| 1.162% 4/3/26 (b) | | 8,933,000 | 8,055,019 |
| 1.591% 4/3/28 (b) | | 10,000,000 | 8,576,165 |
| Verizon Communications, Inc.: | | | |
| 2.355% 3/15/32 | | 6,779,000 | 5,361,770 |
| 3% 3/22/27 | | 626,000 | 581,874 |
| | | | 42,350,866 |
| Media - 0.5% | | | |
| Comcast Corp. 3.95% 10/15/25 | | 2,610,000 | 2,542,147 |
| Discovery Communications LLC 3.625% 5/15/30 | | 1,664,000 | 1,461,458 |
| Magallanes, Inc.: | | | |
| 3.638% 3/15/25 | | 1,048,000 | 1,013,961 |
| 3.755% 3/15/27 | | 7,549,000 | 7,080,341 |
| | | | 12,097,907 |
| Wireless Telecommunication Services - 0.9% | | | |
| Rogers Communications, Inc. 2.95% 3/15/25 | | 5,568,000 | 5,314,945 |
| T-Mobile U.S.A., Inc.: | | | |
| 2.625% 4/15/26 | | 10,100,000 | 9,371,493 |
| 3.5% 4/15/25 | | 6,000,000 | 5,800,218 |
| | | | 20,486,656 |
TOTAL COMMUNICATION SERVICES | | | 74,935,429 |
| CONSUMER DISCRETIONARY - 4.6% | | | |
| Automobiles - 3.4% | | | |
| Daimler Finance North America LLC: | | | |
| 0.75% 3/1/24 (b) | | 17,889,000 | 17,452,563 |
| 1.45% 3/2/26 (b) | | 6,948,000 | 6,332,903 |
| General Motors Financial Co., Inc.: | | | |
| U.S. Secured Overnight Fin. Rate (SOFR) Index + 1.200% 6.5056% 11/17/23 (c)(d) | | 10,000,000 | 10,013,091 |
| 1.05% 3/8/24 | | 2,306,000 | 2,247,887 |
| 1.25% 1/8/26 | | 8,359,000 | 7,519,664 |
| 2.35% 2/26/27 | | 7,500,000 | 6,667,569 |
| 5.8% 6/23/28 | | 7,500,000 | 7,435,368 |
| 6% 1/9/28 | | 5,000,000 | 5,012,372 |
| Volkswagen Group of America Finance LLC: | | | |
| 1.25% 11/24/25 (b) | | 15,040,000 | 13,710,357 |
| 3.95% 6/6/25 (b) | | 3,270,000 | 3,173,871 |
| | | | 79,565,645 |
| Distributors - 0.2% | | | |
| Genuine Parts Co. 1.75% 2/1/25 | | 5,796,000 | 5,479,100 |
| Hotels, Restaurants & Leisure - 0.1% | | | |
| McDonald's Corp. 3.3% 7/1/25 | | 1,040,000 | 1,004,419 |
| Starbucks Corp. 3.8% 8/15/25 | | 2,340,000 | 2,275,545 |
| | | | 3,279,964 |
| Specialty Retail - 0.9% | | | |
| Advance Auto Parts, Inc. 5.95% 3/9/28 | | 6,525,000 | 6,452,522 |
| AutoZone, Inc.: | | | |
| 3.625% 4/15/25 | | 545,000 | 528,648 |
| 5.05% 7/15/26 | | 4,000,000 | 3,970,847 |
| Lowe's Companies, Inc.: | | | |
| 4.4% 9/8/25 | | 3,537,000 | 3,472,829 |
| 4.8% 4/1/26 | | 985,000 | 973,587 |
| Ross Stores, Inc. 0.875% 4/15/26 | | 7,357,000 | 6,570,495 |
| | | | 21,968,928 |
TOTAL CONSUMER DISCRETIONARY | | | 110,293,637 |
| CONSUMER STAPLES - 6.8% | | | |
| Beverages - 0.8% | | | |
| Dr. Pepper Snapple Group, Inc. 0.75% 3/15/24 | | 10,000,000 | 9,732,037 |
| Molson Coors Beverage Co. 3% 7/15/26 | | 10,575,000 | 9,908,741 |
| | | | 19,640,778 |
| Consumer Staples Distribution & Retail - 1.7% | | | |
| 7-Eleven, Inc.: | | | |
| 0.8% 2/10/24 (b) | | 7,321,000 | 7,155,038 |
| 0.95% 2/10/26 (b) | | 7,891,000 | 7,085,677 |
| 1.3% 2/10/28 (b) | | 3,614,000 | 3,058,443 |
| Dollar General Corp.: | | | |
| 4.25% 9/20/24 | | 4,000,000 | 3,937,079 |
| 4.625% 11/1/27 | | 4,000,000 | 3,895,937 |
| Dollar Tree, Inc. 4% 5/15/25 | | 6,000,000 | 5,820,919 |
| Mondelez International Holdings Netherlands BV 0.75% 9/24/24 (b) | | 9,342,000 | 8,863,113 |
| | | | 39,816,206 |
| Food Products - 1.8% | | | |
| JBS U.S.A. Lux SA / JBS Food Co. 2.5% 1/15/27 | | 5,515,000 | 4,957,406 |
| JDE Peet's BV: | | | |
| 0.8% 9/24/24 (b) | | 8,000,000 | 7,539,548 |
| 1.375% 1/15/27 (b) | | 10,440,000 | 9,067,085 |
| McCormick & Co., Inc. 0.9% 2/15/26 | | 15,000,000 | 13,501,265 |
| Mondelez International, Inc. 2.125% 3/17/24 | | 8,500,000 | 8,333,812 |
| | | | 43,399,116 |
| Tobacco - 2.5% | | | |
| Altria Group, Inc. 2.35% 5/6/25 | | 1,003,000 | 949,551 |
| BAT Capital Corp. 3.222% 8/15/24 | | 7,000,000 | 6,826,362 |
| BAT International Finance PLC: | | | |
| 1.668% 3/25/26 | | 15,000,000 | 13,583,800 |
| 3.95% 6/15/25 (b) | | 5,000,000 | 4,854,392 |
| 5.931% 2/2/29 | | 5,000,000 | 4,980,280 |
| Imperial Tobacco Finance PLC: | | | |
| 3.125% 7/26/24 (b) | | 8,250,000 | 8,029,344 |
| 4.25% 7/21/25 (b) | | 13,000,000 | 12,571,668 |
| Philip Morris International, Inc.: | | | |
| 0.875% 5/1/26 | | 4,502,000 | 4,030,879 |
| 1.5% 5/1/25 | | 3,501,000 | 3,285,546 |
| | | | 59,111,822 |
TOTAL CONSUMER STAPLES | | | 161,967,922 |
| ENERGY - 4.0% | | | |
| Energy Equipment & Services - 0.1% | | | |
| Baker Hughes Co. 2.061% 12/15/26 | | 1,781,000 | 1,610,949 |
| Oil, Gas & Consumable Fuels - 3.9% | | | |
| Canadian Natural Resources Ltd. 2.05% 7/15/25 | | 3,668,000 | 3,436,251 |
| ConocoPhillips Co. 2.4% 3/7/25 | | 387,000 | 370,921 |
| Enbridge, Inc.: | | | |
| 1.6% 10/4/26 | | 10,000,000 | 8,964,887 |
| 2.15% 2/16/24 | | 1,379,000 | 1,356,112 |
| 2.5% 2/14/25 | | 1,440,000 | 1,375,752 |
| Energy Transfer LP: | | | |
| 2.9% 5/15/25 | | 7,150,000 | 6,795,385 |
| 4.2% 9/15/23 | | 1,441,000 | 1,440,288 |
| 4.5% 4/15/24 | | 570,000 | 564,487 |
| Enterprise Products Operating LP 5.05% 1/10/26 | | 4,095,000 | 4,074,438 |
| Equinor ASA: | | | |
| 1.75% 1/22/26 | | 1,120,000 | 1,038,182 |
| 2.875% 4/6/25 | | 7,000,000 | 6,752,656 |
| Hess Corp. 4.3% 4/1/27 | | 4,500,000 | 4,329,013 |
| MPLX LP 1.75% 3/1/26 | | 15,044,000 | 13,701,765 |
| Occidental Petroleum Corp. 2.9% 8/15/24 | | 6,061,000 | 5,892,262 |
| Petroleos Mexicanos: | | | |
| 6.49% 1/23/27 | | 6,035,000 | 5,263,365 |
| 6.5% 3/13/27 | | 12,000,000 | 10,476,900 |
| Phillips 66 Co.: | | | |
| 1.3% 2/15/26 | | 6,892,000 | 6,256,194 |
| 3.85% 4/9/25 | | 7,000,000 | 6,811,121 |
| The Williams Companies, Inc. 5.4% 3/2/26 | | 1,334,000 | 1,331,876 |
| Valero Energy Corp. 2.85% 4/15/25 | | 2,437,000 | 2,327,574 |
| | | | 92,559,429 |
TOTAL ENERGY | | | 94,170,378 |
| FINANCIALS - 32.0% | | | |
| Banks - 17.3% | | | |
| ABN AMRO Bank NV 1.542% 6/16/27 (b)(c) | | 8,114,000 | 7,157,389 |
| Banco Santander SA 1.722% 9/14/27 (c) | | 5,000,000 | 4,394,819 |
| Bank of America Corp.: | | | |
| U.S. Secured Overnight Fin. Rate (SOFR) Index + 1.290% 5.08% 1/20/27 (c)(d) | | 7,000,000 | 6,907,985 |
| 1.197% 10/24/26 (c) | | 13,673,000 | 12,390,684 |
| 1.319% 6/19/26 (c) | | 16,000,000 | 14,724,159 |
| 1.734% 7/22/27 (c) | | 7,174,000 | 6,419,218 |
| 2.015% 2/13/26 (c) | | 11,000,000 | 10,372,070 |
| 4.2% 8/26/24 | | 5,750,000 | 5,647,616 |
| Barclays PLC: | | | |
| 1.007% 12/10/24 (c) | | 5,000,000 | 4,930,884 |
| 2.279% 11/24/27 (c) | | 5,000,000 | 4,440,189 |
| 2.852% 5/7/26 (c) | | 18,848,000 | 17,813,660 |
| 3.932% 5/7/25 (c) | | 4,000,000 | 3,941,523 |
| BNP Paribas SA: | | | |
| U.S. Secured Overnight Fin. Rate (SOFR) Index + 1.000% 1.323% 1/13/27 (b)(c)(d) | | 7,417,000 | 6,669,467 |
| 2.219% 6/9/26 (b)(c) | | 8,627,000 | 8,059,673 |
| BPCE SA: | | | |
| 1.652% 10/6/26 (b)(c) | | 20,000,000 | 18,179,033 |
| 2.045% 10/19/27 (b)(c) | | 6,865,000 | 6,079,204 |
| Capital One NA 2.28% 1/28/26 (c) | | 7,000,000 | 6,619,716 |
| Citigroup, Inc.: | | | |
| 0.981% 5/1/25 (c) | | 5,320,000 | 5,137,837 |
| 2.014% 1/25/26 (c) | | 7,350,000 | 6,953,281 |
| 3.106% 4/8/26 (c) | | 10,000,000 | 9,570,128 |
| 5.61% 9/29/26 (c) | | 4,000,000 | 3,981,740 |
| DNB Bank ASA: | | | |
| 1.535% 5/25/27 (b)(c) | | 4,643,000 | 4,119,750 |
| 1.605% 3/30/28 (b)(c) | | 9,570,000 | 8,305,428 |
| HSBC Holdings PLC: | | | |
| 1.589% 5/24/27 (c) | | 10,000,000 | 8,885,059 |
| 1.645% 4/18/26 (c) | | 6,567,000 | 6,116,890 |
| 3.803% 3/11/25 (c) | | 5,000,000 | 4,937,425 |
| 5.21% 8/11/28 (c) | | 4,327,000 | 4,222,294 |
| ING Groep NV 1.726% 4/1/27 (c) | | 4,192,000 | 3,769,686 |
| Intesa Sanpaolo SpA: | | | |
| 3.25% 9/23/24 (b) | | 14,000,000 | 13,514,458 |
| 5.71% 1/15/26 (b) | | 5,031,000 | 4,826,262 |
| JPMorgan Chase & Co.: | | | |
| 1.045% 11/19/26 (c) | | 15,000,000 | 13,524,340 |
| 1.47% 9/22/27 (c) | | 10,000,000 | 8,833,073 |
| 2.083% 4/22/26 (c) | | 25,219,000 | 23,720,597 |
| 2.956% 5/13/31 (c) | | 12,053,000 | 10,245,298 |
| Lloyds Banking Group PLC 2.438% 2/5/26 (c) | | 2,636,000 | 2,496,759 |
| Mitsubishi UFJ Financial Group, Inc.: | | | |
| 1.412% 7/17/25 | | 8,000,000 | 7,388,646 |
| 1.538% 7/20/27 (c) | | 10,000,000 | 8,914,889 |
| 1.64% 10/13/27 (c) | | 5,000,000 | 4,433,362 |
| Mizuho Financial Group, Inc.: | | | |
| 0.849% 9/8/24 (c) | | 7,495,000 | 7,492,418 |
| 1.234% 5/22/27 (c) | | 10,000,000 | 8,850,538 |
| NatWest Markets PLC 0.8% 8/12/24 (b) | | 5,141,000 | 4,905,408 |
| Rabobank Nederland 1.98% 12/15/27 (b)(c) | | 7,500,000 | 6,619,414 |
| Regions Financial Corp. 2.25% 5/18/25 | | 3,135,000 | 2,929,347 |
| Santander Holdings U.S.A., Inc.: | | | |
| 2.49% 1/6/28 (c) | | 2,768,000 | 2,426,942 |
| 3.45% 6/2/25 | | 5,700,000 | 5,438,648 |
| 5.807% 9/9/26 (c) | | 3,000,000 | 2,972,020 |
| Societe Generale: | | | |
| 1.488% 12/14/26 (b)(c) | | 7,870,000 | 7,052,183 |
| 1.792% 6/9/27 (b)(c) | | 6,750,000 | 5,987,649 |
| 2.625% 10/16/24 (b) | | 1,530,000 | 1,471,986 |
| 3.875% 3/28/24 (b) | | 6,015,000 | 5,930,169 |
| Sumitomo Mitsui Financial Group, Inc.: | | | |
| 1.402% 9/17/26 | | 10,000,000 | 8,848,598 |
| 1.474% 7/8/25 | | 10,000,000 | 9,258,108 |
| Wells Fargo & Co.: | | | |
| 2.164% 2/11/26 (c) | | 10,000,000 | 9,454,657 |
| 2.188% 4/30/26 (c) | | 5,000,000 | 4,702,083 |
| 4.3% 7/22/27 | | 7,000,000 | 6,703,103 |
| Westpac Banking Corp. 4.11% 7/24/34 (c) | | 1,710,000 | 1,498,070 |
| | | | 411,185,832 |
| Capital Markets - 5.8% | | | |
| Ares Capital Corp. 3.25% 7/15/25 | | 10,000,000 | 9,376,777 |
| Deutsche Bank AG 4.5% 4/1/25 | | 2,904,000 | 2,797,950 |
| Deutsche Bank AG New York Branch: | | | |
| 0.898% 5/28/24 | | 2,899,000 | 2,795,203 |
| 1.447% 4/1/25 (c) | | 6,811,000 | 6,597,338 |
| 2.129% 11/24/26 (c) | | 14,479,000 | 13,136,336 |
| 2.222% 9/18/24 (c) | | 22,621,000 | 22,585,562 |
| 2.311% 11/16/27 (c) | | 7,028,000 | 6,161,905 |
| Goldman Sachs Group, Inc.: | | | |
| 1.757% 1/24/25 (c) | | 5,000,000 | 4,907,250 |
| 2.64% 2/24/28 (c) | | 5,000,000 | 4,525,059 |
| Moody's Corp. 4.875% 2/15/24 | | 2,400,000 | 2,400,016 |
| Morgan Stanley: | | | |
| 0.79% 5/30/25 (c) | | 10,000,000 | 9,587,814 |
| 2.188% 4/28/26 (c) | | 5,000,000 | 4,712,241 |
| Nomura Holdings, Inc. 1.653% 7/14/26 | | 12,500,000 | 11,079,594 |
| S&P Global, Inc. 2.45% 3/1/27 | | 7,508,000 | 6,922,637 |
| State Street Corp. 2.901% 3/30/26 (c) | | 305,000 | 292,076 |
| UBS AG London Branch: | | | |
| 1.25% 6/1/26 (b) | | 8,000,000 | 7,182,787 |
| 1.375% 1/13/25 (b) | | 5,000,000 | 4,709,358 |
| UBS Group AG: | | | |
| 1.305% 2/2/27 (b)(c) | | 10,000,000 | 8,890,641 |
| 2.593% 9/11/25 (b)(c) | | 4,805,000 | 4,633,046 |
| 6.373% 7/15/26 (b)(c) | | 4,500,000 | 4,518,724 |
| | | | 137,812,314 |
| Consumer Finance - 3.6% | | | |
| AerCap Ireland Capital Ltd./AerCap Global Aviation Trust: | | | |
| 1.65% 10/29/24 | | 5,760,000 | 5,476,134 |
| 1.75% 1/30/26 | | 7,095,000 | 6,419,719 |
| 2.45% 10/29/26 | | 2,102,000 | 1,891,267 |
| 4.875% 1/16/24 | | 1,481,000 | 1,473,582 |
| Ally Financial, Inc. 5.125% 9/30/24 | | 9,760,000 | 9,609,461 |
| Capital One Financial Corp.: | | | |
| 1.343% 12/6/24 (c) | | 5,000,000 | 4,928,261 |
| 1.878% 11/2/27 (c) | | 7,000,000 | 6,136,516 |
| 5.468% 2/1/29 (c) | | 1,983,000 | 1,923,646 |
| Ford Motor Credit Co. LLC: | | | |
| 2.3% 2/10/25 | | 5,000,000 | 4,697,380 |
| 3.375% 11/13/25 | | 8,000,000 | 7,458,281 |
| 6.95% 6/10/26 | | 6,500,000 | 6,508,288 |
| Hyundai Capital America: | | | |
| 1% 9/17/24 (b) | | 9,737,000 | 9,255,381 |
| 5.8% 6/26/25 (b) | | 6,250,000 | 6,257,508 |
| John Deere Capital Corp. 3.4% 6/6/25 | | 5,076,000 | 4,919,951 |
| Synchrony Financial: | | | |
| 4.25% 8/15/24 | | 2,551,000 | 2,484,721 |
| 4.375% 3/19/24 | | 4,922,000 | 4,862,577 |
| | | | 84,302,673 |
| Financial Services - 2.7% | | | |
| AIG Global Funding 0.9% 9/22/25 (b) | | 7,000,000 | 6,351,734 |
| Athene Global Funding: | | | |
| 0.95% 1/8/24 (b) | | 8,877,000 | 8,707,393 |
| 1% 4/16/24 (b) | | 8,000,000 | 7,723,722 |
| 1.73% 10/2/26 (b) | | 5,000,000 | 4,352,009 |
| Blackstone Private Credit Fund 4.7% 3/24/25 | | 8,250,000 | 8,019,168 |
| Brixmor Operating Partnership LP 2.25% 4/1/28 | | 4,348,000 | 3,694,738 |
| Corebridge Financial, Inc.: | | | |
| 3.5% 4/4/25 | | 943,000 | 906,188 |
| 3.65% 4/5/27 | | 1,345,000 | 1,265,229 |
| GA Global Funding Trust 1.25% 12/8/23 (b) | | 9,500,000 | 9,373,260 |
| Jackson Financial, Inc.: | | | |
| 1.125% 11/22/23 | | 10,000,000 | 9,897,118 |
| 5.17% 6/8/27 | | 1,397,000 | 1,369,290 |
| PayPal Holdings, Inc. 1.65% 6/1/25 | | 2,097,000 | 1,964,522 |
| The Western Union Co. 2.85% 1/10/25 | | 1,242,000 | 1,190,084 |
| | | | 64,814,455 |
| Insurance - 2.6% | | | |
| American International Group, Inc. 2.5% 6/30/25 | | 3,334,000 | 3,155,885 |
| Empower Finance 2020 LP 1.357% 9/17/27 (b) | | 5,321,000 | 4,591,509 |
| Equitable Financial Life Global Funding: | | | |
| 1.4% 8/27/27 (b) | | 15,000,000 | 12,758,756 |
| 1.7% 11/12/26 (b) | | 5,000,000 | 4,383,019 |
| Great-West Lifeco U.S. Finance 2020 LP 0.904% 8/12/25 (b) | | 3,381,000 | 3,055,407 |
| Guardian Life Global Funding: | | | |
| 1.1% 6/23/25 (b) | | 7,850,000 | 7,221,293 |
| 1.4% 7/6/27 (b) | | 8,010,000 | 6,989,424 |
| Pacific Life Global Funding II 1.2% 6/24/25 (b) | | 4,494,000 | 4,160,248 |
| Pricoa Global Funding I 2.4% 9/23/24 (b) | | 6,476,000 | 6,237,932 |
| Protective Life Global Funding 3.218% 3/28/25 (b) | | 1,979,000 | 1,901,287 |
| RGA Global Funding 2% 11/30/26 (b) | | 3,680,000 | 3,274,350 |
| Willis Group North America, Inc. 4.5% 9/15/28 | | 5,000,000 | 4,765,648 |
| | | | 62,494,758 |
TOTAL FINANCIALS | | | 760,610,032 |
| HEALTH CARE - 3.4% | | | |
| Biotechnology - 0.3% | | | |
| Amgen, Inc. 5.15% 3/2/28 | | 6,578,000 | 6,571,130 |
| Health Care Equipment & Supplies - 0.3% | | | |
| Alcon Finance Corp. 2.75% 9/23/26 (b) | | 4,038,000 | 3,728,548 |
| Boston Scientific Corp. 1.9% 6/1/25 | | 5,000,000 | 4,696,626 |
| | | | 8,425,174 |
| Health Care Providers & Services - 0.7% | | | |
| Cigna Group 0.613% 3/15/24 | | 2,410,000 | 2,344,573 |
| CVS Health Corp. 5% 2/20/26 | | 8,000,000 | 7,938,459 |
| HCA Holdings, Inc. 3.125% 3/15/27 | | 7,100,000 | 6,525,123 |
| | | | 16,808,155 |
| Life Sciences Tools & Services - 0.8% | | | |
| Revvity, Inc. 0.85% 9/15/24 | | 10,160,000 | 9,630,798 |
| Thermo Fisher Scientific, Inc. 1.215% 10/18/24 | | 10,000,000 | 9,532,848 |
| | | | 19,163,646 |
| Pharmaceuticals - 1.3% | | | |
| Bayer U.S. Finance II LLC: | | | |
| 3.375% 7/15/24 (b) | | 5,000,000 | 4,890,506 |
| 4.25% 12/15/25 (b) | | 10,500,000 | 10,169,058 |
| Bayer U.S. Finance LLC 3.375% 10/8/24 (b) | | 7,000,000 | 6,810,707 |
| GSK Consumer Healthcare Capital 3.125% 3/24/25 | | 8,600,000 | 8,271,702 |
| Viatris, Inc. 1.65% 6/22/25 | | 480,000 | 444,142 |
| | | | 30,586,115 |
TOTAL HEALTH CARE | | | 81,554,220 |
| INDUSTRIALS - 4.8% | | | |
| Aerospace & Defense - 1.2% | | | |
| L3Harris Technologies, Inc. 5.4% 1/15/27 | | 6,000,000 | 6,014,575 |
| RTX Corp. 5% 2/27/26 | | 3,801,000 | 3,784,571 |
| The Boeing Co.: | | | |
| 1.95% 2/1/24 | | 10,390,000 | 10,215,487 |
| 3.2% 3/1/29 | | 7,200,000 | 6,470,060 |
| 4.875% 5/1/25 | | 3,000,000 | 2,958,525 |
| | | | 29,443,218 |
| Building Products - 0.0% | | | |
| Carrier Global Corp. 2.242% 2/15/25 | | 548,000 | 521,281 |
| Commercial Services & Supplies - 0.6% | | | |
| Republic Services, Inc. 0.875% 11/15/25 | | 15,000,000 | 13,592,780 |
| Ground Transportation - 0.1% | | | |
| Canadian Pacific Railway Co. 1.75% 12/2/26 | | 2,099,000 | 1,886,268 |
| Industrial Conglomerates - 0.2% | | | |
| Siemens Financieringsmaatschappij NV 1.2% 3/11/26 (b) | | 6,674,000 | 6,056,481 |
| Machinery - 1.2% | | | |
| Daimler Trucks Finance North America LLC: | | | |
| 1.625% 12/13/24 (b) | | 3,204,000 | 3,041,314 |
| 2% 12/14/26 (b) | | 5,000,000 | 4,494,781 |
| Otis Worldwide Corp. 2.056% 4/5/25 | | 7,000,000 | 6,632,979 |
| Parker Hannifin Corp.: | | | |
| 3.65% 6/15/24 | | 4,750,000 | 4,667,910 |
| 4.25% 9/15/27 | | 3,086,000 | 2,993,641 |
| Westinghouse Air Brake Tech Co. 4.4% 3/15/24 | | 5,900,000 | 5,836,453 |
| | | | 27,667,078 |
| Passenger Airlines - 0.5% | | | |
| American Airlines 2019-1 Class B Pass Through Trust equipment trust certificate 3.85% 8/15/29 | | 3,724,444 | 3,294,232 |
| Delta Air Lines, Inc. 2.9% 10/28/24 | | 5,500,000 | 5,326,610 |
| United Airlines 2019-2 Class B Pass Through Trust equipment trust certificate 3.5% 11/1/29 | | 2,688,063 | 2,427,241 |
| | | | 11,048,083 |
| Trading Companies & Distributors - 0.6% | | | |
| Air Lease Corp.: | | | |
| 0.7% 2/15/24 | | 3,555,000 | 3,469,163 |
| 0.8% 8/18/24 | | 4,323,000 | 4,111,783 |
| 2.2% 1/15/27 | | 3,565,000 | 3,185,674 |
| 4.25% 2/1/24 | | 2,597,000 | 2,576,553 |
| | | | 13,343,173 |
| Transportation Infrastructure - 0.4% | | | |
| Avolon Holdings Funding Ltd.: | | | |
| 2.875% 2/15/25 (b) | | 7,180,000 | 6,774,677 |
| 3.95% 7/1/24 (b) | | 955,000 | 931,530 |
| 5.5% 1/15/26 (b) | | 2,089,000 | 2,033,751 |
| | | | 9,739,958 |
TOTAL INDUSTRIALS | | | 113,298,320 |
| INFORMATION TECHNOLOGY - 2.4% | | | |
| Communications Equipment - 0.2% | | | |
| Bank of America NA 5.526% 8/18/26 | | 4,900,000 | 4,923,834 |
| Electronic Equipment, Instruments & Components - 0.4% | | | |
| Amphenol Corp. 3.2% 4/1/24 | | 896,000 | 882,964 |
| Dell International LLC/EMC Corp. 5.25% 2/1/28 | | 8,564,000 | 8,543,898 |
| | | | 9,426,862 |
| Semiconductors & Semiconductor Equipment - 1.0% | | | |
| Broadcom, Inc. 1.95% 2/15/28 (b) | | 15,000,000 | 13,008,191 |
| Microchip Technology, Inc. 0.983% 9/1/24 | | 5,060,000 | 4,818,862 |
| Micron Technology, Inc. 4.185% 2/15/27 | | 6,000,000 | 5,718,766 |
| | | | 23,545,819 |
| Software - 0.8% | | | |
| Oracle Corp.: | | | |
| 1.65% 3/25/26 | | 3,618,000 | 3,296,960 |
| 5.8% 11/10/25 | | 7,000,000 | 7,068,065 |
| VMware, Inc.: | | | |
| 1% 8/15/24 | | 6,564,000 | 6,273,357 |
| 1.4% 8/15/26 | | 2,882,000 | 2,555,508 |
| | | | 19,193,890 |
TOTAL INFORMATION TECHNOLOGY | | | 57,090,405 |
| MATERIALS - 1.0% | | | |
| Chemicals - 1.0% | | | |
| International Flavors & Fragrances, Inc. 1.23% 10/1/25 (b) | | 7,000,000 | 6,267,605 |
| LYB International Finance III LLC 1.25% 10/1/25 | | 6,185,000 | 5,641,031 |
| Nutrien Ltd.: | | | |
| 4.9% 3/27/28 | | 8,000,000 | 7,817,675 |
| 5.9% 11/7/24 | | 3,688,000 | 3,686,786 |
| | | | 23,413,097 |
| REAL ESTATE - 1.6% | | | |
| Equity Real Estate Investment Trusts (REITs) - 1.6% | | | |
| American Tower Corp. 1.3% 9/15/25 | | 2,406,000 | 2,206,745 |
| Boston Properties, Inc. 3.2% 1/15/25 | | 3,000,000 | 2,876,803 |
| Crown Castle International Corp. 1.35% 7/15/25 | | 566,000 | 522,446 |
| ERP Operating LP 3.375% 6/1/25 | | 3,000,000 | 2,893,850 |
| Healthcare Trust of America Holdings LP 3.5% 8/1/26 | | 621,000 | 579,720 |
| Kimco Realty Op LLC 3.3% 2/1/25 | | 5,500,000 | 5,297,444 |
| Kite Realty Group Trust 4% 3/15/25 | | 2,778,000 | 2,668,830 |
| Realty Income Corp. 2.2% 6/15/28 | | 456,000 | 395,751 |
| SITE Centers Corp. 4.25% 2/1/26 | | 1,865,000 | 1,746,135 |
| Spirit Realty LP 2.1% 3/15/28 | | 5,695,000 | 4,856,208 |
| Ventas Realty LP: | | | |
| 2.65% 1/15/25 | | 3,710,000 | 3,534,321 |
| 3% 1/15/30 | | 4,013,000 | 3,419,044 |
| 3.5% 4/15/24 | | 2,140,000 | 2,104,910 |
| Vornado Realty LP 2.15% 6/1/26 | | 1,017,000 | 879,078 |
| Welltower OP LLC 3.625% 3/15/24 | | 4,035,000 | 3,982,938 |
| | | | 37,964,223 |
| Real Estate Management & Development - 0.0% | | | |
| Brandywine Operating Partnership LP 4.1% 10/1/24 | | 372,000 | 355,176 |
TOTAL REAL ESTATE | | | 38,319,399 |
| UTILITIES - 4.3% | | | |
| Electric Utilities - 2.2% | | | |
| Cleco Corporate Holdings LLC 3.743% 5/1/26 | | 2,893,000 | 2,716,832 |
| Duke Energy Corp. 4.3% 3/15/28 | | 9,784,000 | 9,419,847 |
| Eversource Energy 5.45% 3/1/28 | | 9,000,000 | 9,030,192 |
| Exelon Corp. 2.75% 3/15/27 | | 681,000 | 625,031 |
| FirstEnergy Corp.: | | | |
| 1.6% 1/15/26 | | 606,000 | 550,275 |
| 2.05% 3/1/25 | | 3,271,000 | 3,054,641 |
| Florida Power & Light Co. 2.85% 4/1/25 | | 1,508,000 | 1,450,538 |
| Georgia Power Co. 4.65% 5/16/28 | | 3,465,000 | 3,378,980 |
| IPALCO Enterprises, Inc. 3.7% 9/1/24 | | 1,115,000 | 1,084,954 |
| Pennsylvania Electric Co. 5.15% 3/30/26 (b) | | 2,524,000 | 2,483,098 |
| Southern Co. 0.6% 2/26/24 | | 3,789,000 | 3,695,563 |
| Tampa Electric Co. 3.875% 7/12/24 | | 4,358,000 | 4,288,446 |
| Vistra Operations Co. LLC 5% 7/31/27 (b) | | 10,000,000 | 9,405,087 |
| | | | 51,183,484 |
| Gas Utilities - 0.0% | | | |
| Dominion Gas Holdings LLC 2.5% 11/15/24 | | 1,156,000 | 1,112,088 |
| Independent Power and Renewable Electricity Producers - 0.4% | | | |
| Emera U.S. Finance LP 0.833% 6/15/24 | | 4,654,000 | 4,431,177 |
| The AES Corp. 3.3% 7/15/25 (b) | | 4,133,000 | 3,929,944 |
| | | | 8,361,121 |
| Multi-Utilities - 1.7% | | | |
| Dominion Energy, Inc.: | | | |
| 1.45% 4/15/26 | | 8,000,000 | 7,216,853 |
| 3.071% 8/15/24 (c) | | 5,000,000 | 4,854,703 |
| DTE Energy Co. 4.22% 11/1/24 | | 8,200,000 | 8,042,665 |
| NiSource, Inc.: | | | |
| 0.95% 8/15/25 | | 2,873,000 | 2,633,538 |
| 2.95% 9/1/29 | | 3,000,000 | 2,639,843 |
| 5.25% 3/30/28 | | 6,140,000 | 6,114,265 |
| Sempra: | | | |
| 3.3% 4/1/25 | | 3,298,000 | 3,177,233 |
| 3.4% 2/1/28 | | 2,613,000 | 2,417,955 |
| WEC Energy Group, Inc.: | | | |
| CME Term SOFR 3 Month Index + 2.110% 7.7387% 5/15/67 (c)(d) | | 454,000 | 397,201 |
| 5% 9/27/25 | | 2,810,000 | 2,783,757 |
| | | | 40,278,013 |
TOTAL UTILITIES | | | 100,934,706 |
| TOTAL NONCONVERTIBLE BONDS (Cost $1,730,660,604) | | | 1,616,587,545 |
| | | | |
| U.S. Treasury Obligations - 8.2% |
| | | Principal Amount (a) | Value ($) |
| U.S. Treasury Notes: | | | |
| 4% 2/29/28 (e) | | 35,601,100 | 35,163,040 |
| 4.125% 10/31/27 (e) | | 119,972,200 | 118,852,145 |
| 4.5% 7/15/26 | | 40,943,900 | 40,870,329 |
| TOTAL U.S. TREASURY OBLIGATIONS (Cost $195,876,043) | | | 194,885,514 |
| | | | |
| U.S. Government Agency - Mortgage Securities - 0.2% |
| | | Principal Amount (a) | Value ($) |
| Fannie Mae - 0.2% | | | |
| 4.5% to 4.5% 3/1/35 to 9/1/49 | | 4,432,160 | 4,287,780 |
| 6.5% 7/1/32 to 8/1/36 | | 95,569 | 98,393 |
| 7% 8/1/28 to 6/1/33 | | 66,398 | 69,107 |
| 7.5% to 7.5% 11/1/26 to 2/1/28 | | 12,965 | 13,207 |
| 8.5% 9/1/25 | | 305 | 307 |
TOTAL FANNIE MAE | | | 4,468,794 |
| Freddie Mac - 0.0% | | | |
| 8.5% 2/1/27 to 8/1/27 | | 7,100 | 7,259 |
| Ginnie Mae - 0.0% | | | |
| 7% to 7% 7/15/28 to 11/15/28 | | 12,943 | 13,113 |
| 7.5% 2/15/28 to 10/15/28 | | 1,699 | 1,740 |
| 8% 6/15/24 | | 5 | 5 |
TOTAL GINNIE MAE | | | 14,858 |
| TOTAL U.S. GOVERNMENT AGENCY - MORTGAGE SECURITIES (Cost $4,935,814) | | | 4,490,911 |
| | | | |
| Asset-Backed Securities - 11.4% |
| | | Principal Amount (a) | Value ($) |
| AASET Trust: | | | |
| Series 2019-2 Class A, 3.376% 10/16/39 (b) | | 1,940,950 | 1,628,224 |
| Series 2021-1A Class A, 2.95% 11/16/41 (b) | | 2,604,632 | 2,294,733 |
| Series 2021-2A Class A, 2.798% 1/15/47 (b) | | 4,888,995 | 4,223,947 |
| Aimco: | | | |
| Series 2018-BA Class AR, CME Term SOFR 3 Month Index + 1.360% 6.6696% 1/15/32 (b)(c)(d) | | 5,545,000 | 5,527,578 |
| Series 2021-10A Class AR, CME Term SOFR 3 Month Index + 1.320% 6.6672% 7/22/32 (b)(c)(d) | | 10,230,000 | 10,177,571 |
| AIMCO CLO Ltd. Series 2022-12A Class AR, CME Term SOFR 3 Month Index + 1.170% 6.478% 1/17/32 (b)(c)(d) | | 5,000,000 | 4,967,185 |
| AmeriCredit Automobile Receivables Trust Series 2021-3 Class A3, 0.76% 8/18/26 | | 7,732,664 | 7,499,811 |
| Apollo Aviation Securitization Equity Trust Series 2020-1A Class A, 3.351% 1/16/40 (b) | | 638,363 | 535,593 |
| Bear Stearns Asset Backed Securities I Trust Series 2005-HE2 Class M2, CME Term SOFR 1 Month Index + 1.230% 6.5544% 2/25/35 (c)(d) | | 87,271 | 85,342 |
| Blackbird Capital Aircraft Series 2021-1A Class A, 2.443% 7/15/46 (b) | | 3,829,955 | 3,292,766 |
| Capital One Multi-Asset Execution Trust Series 2022-A2 Class A, 3.49% 5/15/27 | | 5,000,000 | 4,847,113 |
| Carvana Auto Receivables Trust Series 2021-P2 Class A3, 0.49% 3/10/26 | | 4,016,144 | 3,924,620 |
| Castlelake Aircraft Structured Trust Series 2021-1A Class A, 3.474% 1/15/46 (b) | | 3,240,825 | 2,989,758 |
| Cedar Funding Ltd.: | | | |
| Series 2021-10A Class AR, CME Term SOFR 3 Month Index + 1.360% 6.6878% 10/20/32 (b)(c)(d) | | 2,685,000 | 2,673,949 |
| Series 2021-14A Class A, CME Term SOFR 3 Month Index + 1.360% 6.6696% 7/15/33 (b)(c)(d) | | 11,007,000 | 10,935,080 |
| Cent CLO LP Series 2021-21A Class A1R3, CME Term SOFR 3 Month Index + 1.230% 6.589% 7/27/30 (b)(c)(d) | | 6,630,449 | 6,600,837 |
| CFMT LLC Series 2023 HB12 Class A, 4.25% 4/25/33 (b) | | 1,008,316 | 965,213 |
| Chase Issuance Trust Series 2022-A1 Class A, 3.97% 9/15/27 | | 7,135,000 | 6,958,845 |
| DB Master Finance LLC Series 2021-1A Class A2I, 2.045% 11/20/51 (b) | | 11,790,000 | 10,340,160 |
| Dell Equipment Finance Trust Series 2021-1 Class A3, 0.43% 5/22/26 (b) | | 616,011 | 613,926 |
| Dominos Pizza Master Issuer LLC Series 2016-1A Class A2II, 4.474% 10/25/45 (b) | | 1,865,000 | 1,786,176 |
| Donlen Fleet Lease Funding Series 2021-2 Class A2, 0.56% 12/11/34 (b) | | 1,769,041 | 1,734,170 |
| Eaton Vance CLO, Ltd. Series 2021-1A Class AR, CME Term SOFR 3 Month Index + 1.360% 6.6696% 4/15/31 (b)(c)(d) | | 9,586,000 | 9,528,235 |
| Enterprise Fleet Financing LLC: | | | |
| Series 2020-2 Class A2, 0.61% 7/20/26 (b) | | 1,167,758 | 1,153,037 |
| Series 2021-1 Class A2, 0.44% 12/21/26 (b) | | 893,059 | 878,345 |
| Series 2022-3 Class A2, 4.38% 7/20/29 (b) | | 1,161,730 | 1,139,513 |
| Series 2023-1 Class A2, 5.51% 1/22/29 (b) | | 4,867,000 | 4,837,750 |
| Ford Credit Auto Owner Trust Series 2020-2 Class A, 1.06% 4/15/33 (b) | | 14,774,000 | 13,449,653 |
| Ford Credit Floorplan Master Owner Trust Series 2023-1 Class A1, 4.92% 5/15/28 (b) | | 4,068,000 | 4,019,278 |
| GM Financial Automobile Leasing Series 2023-2 Class A3, 5.05% 7/20/26 | | 4,047,000 | 4,014,991 |
| GMF Floorplan Owner Revolving Trust Series 2020-2 Class A, 0.69% 10/15/25 (b) | | 7,860,000 | 7,810,123 |
| Horizon Aircraft Finance Ltd. Series 2019-1 Class A, 3.721% 7/15/39 (b) | | 990,359 | 843,914 |
| Madison Park Funding XXXII, Ltd. / Madison Park Funding XXXII LLC Series 2021-32A Class A1R, CME Term SOFR 3 Month Index + 1.260% 6.6072% 1/22/31 (b)(c)(d) | | 8,045,000 | 8,016,432 |
| Marlette Funding Trust: | | | |
| Series 2022-1A Class A, 1.36% 4/15/32 (b) | | 178,811 | 178,469 |
| Series 2022-2A Class A, 4.25% 8/15/32 (b) | | 1,689,195 | 1,680,256 |
| Metlife Securitization Trust Series 2019-1A Class A1A, 3.75% 4/25/58 (b) | | 320,835 | 306,520 |
| MMAF Equipment Finance LLC Series 2019-B Class A3, 2.01% 12/12/24 (b) | | 879,430 | 871,340 |
| Niagara Park CLO, Ltd. Series 2021-1A Class AR, CME Term SOFR 3 Month Index + 1.260% 6.5696% 7/17/32 (b)(c)(d) | | 10,020,000 | 9,945,171 |
| OneMain Direct Auto Receivables Trust Series 2021-1A Class A, 0.87% 7/14/28 (b) | | 9,803,000 | 9,300,986 |
| Palmer Square Loan Funding, Ltd. Series 2021-2A Class A1, CME Term SOFR 3 Month Index + 1.060% 6.4414% 5/20/29 (b)(c)(d) | | 5,384,172 | 5,361,430 |
| Palmer Square Loan Funding, Ltd. / Palmer Square Loan Funding LLC Series 2022-1A Class A1, CME Term SOFR 3 Month Index + 1.050% 6.358% 4/15/30 (b)(c)(d) | | 7,573,395 | 7,513,997 |
| Park Place Securities, Inc. Series 2005-WCH1 Class M4, CME Term SOFR 1 Month Index + 1.350% 6.6744% 1/25/36 (c)(d) | | 30,252 | 29,529 |
| Prpm 2021-5, LLC Series 2021-5 Class A1, 1.793% 6/25/26 (b)(c) | | 5,019,042 | 4,659,870 |
| Santander Drive Auto Receivables Trust Series 2022-5 Class A3, 4.11% 8/17/26 | | 4,905,000 | 4,869,146 |
| Sapphire Aviation Finance Series 2020-1A Class A, 3.228% 3/15/40 (b) | | 5,115,062 | 4,328,059 |
| SBA Tower Trust: | | | |
| Series 2019, 2.836% 1/15/50 (b) | | 2,797,000 | 2,668,455 |
| 1.884% 7/15/50 (b) | | 1,204,000 | 1,087,014 |
| SLAM Ltd. / SLAM LLC Series 2021-1A Class A, 2.434% 6/15/46 (b) | | 11,994,596 | 10,351,336 |
| Sofi Consumer Loan Program Series 2023-1S Class A, 5.81% 5/15/31 (b) | | 2,020,620 | 2,016,771 |
| Symphony CLO XXI, Ltd. Series 2021-21A Class AR, CME Term SOFR 3 Month Index + 1.320% 6.6296% 7/15/32 (b)(c)(d) | | 7,582,000 | 7,537,236 |
| TCI-Flatiron CLO Ltd. / LLC Series 2021-1A Class AR, CME Term SOFR 3 Month Index + 1.220% 6.5981% 11/18/30 (b)(c)(d) | | 8,226,497 | 8,195,787 |
| Terwin Mortgage Trust Series 2003-4HE Class A1, CME Term SOFR 1 Month Index + 0.970% 6.2894% 9/25/34 (c)(d) | | 1,693 | 1,614 |
| Toyota Auto Loan Extended Note Trust Series 2020-1A Class A, 1.35% 5/25/33 (b) | | 3,961,000 | 3,681,119 |
| Trapeza CDO XII Ltd./Trapeza CDO XII, Inc. Series 2007-12A Class B, CME Term SOFR 3 Month Index + 0.820% 6.0904% 4/6/42 (b)(c)(d)(f) | | 304,000 | 230,407 |
| Upstart Securitization Trust: | | | |
| Series 2021-3 Class A, 0.83% 7/20/31 (b) | | 314,773 | 313,223 |
| Series 2021-4 Class A, 0.84% 9/20/31 (b) | | 1,188,205 | 1,173,504 |
| Series 2021-5 Class A, 1.31% 11/20/31 (b) | | 1,849,015 | 1,817,410 |
| VCAT Asset Securitization, LLC: | | | |
| Series 2021-NPL1 Class A1, 2.2891% 12/26/50 (b) | | 922,018 | 892,015 |
| Series 2021-NPL2 Class A1, 2.115% 3/27/51 (b) | | 4,587,197 | 4,369,234 |
| Series 2021-NPL3 Class A1, 1.743% 5/25/51 (b)(c) | | 6,029,259 | 5,544,332 |
| Verizon Master Trust Series 2021-1: | | | |
| Class A, 0.5% 5/20/27 | | 7,466,000 | 7,184,254 |
| Class B, 0.69% 5/20/27 | | 8,000,000 | 7,694,353 |
| Voya CLO Ltd. Series 2021-1A Class A1R, CME Term SOFR 3 Month Index + 1.210% 6.5196% 4/17/30 (b)(c)(d) | | 7,415,500 | 7,382,085 |
| TOTAL ASSET-BACKED SECURITIES (Cost $282,910,898) | | | 271,478,790 |
| | | | |
| Collateralized Mortgage Obligations - 3.4% |
| | | Principal Amount (a) | Value ($) |
| Private Sponsor - 2.7% | | | |
| Ajax Mortgage Loan Trust sequential payer Series 2021-B Class A, 2.239% 6/25/66 (b)(c) | | 2,891,815 | 2,743,105 |
| Angel Oak Mortgage Trust Series 2021-8 Class A1, 1.82% 11/25/66 (b) | | 5,553,493 | 4,631,821 |
| Brass PLC Series 2021-10A Class A1, 0.669% 4/16/69 (b)(c) | | 819,855 | 784,039 |
| BRAVO Residential Funding Trust sequential payer Series 2020-RPL2 Class A1, 2% 5/25/59 (b) | | 3,516,956 | 3,129,736 |
| Cascade Funding Mortgage Trust: | | | |
| Series 2021-EBO1 Class A, 0.9849% 11/25/50 (b)(c) | | 1,496,706 | 1,381,738 |
| Series 2021-HB5 Class A, 0.8006% 2/25/31 (b) | | 998,757 | 972,797 |
| Series 2021-HB6 Class A, 0.8983% 6/25/36 (b) | | 1,481,239 | 1,432,458 |
| Series 2021-HB7 Class A, 1.1512% 10/27/31 (b) | | 1,950,142 | 1,855,519 |
| Cfmt 2022-Ebo2 sequential payer Series 2022-EBO2 Class A, 3.169% 7/25/54 (b) | | 715,186 | 703,234 |
| CSAIL Commercial Mortgage Trust Series 2015-C2 Class ASB, 3.2241% 6/15/57 | | 643,766 | 629,002 |
| Csmc 2021-Rpl9 Trust sequential payer Series 2021-RPL9 Class A1, 2.4364% 2/25/61 (b) | | 7,882,705 | 7,395,902 |
| CSMC Trust sequential payer Series 2020-RPL4 Class A1, 2% 1/25/60 (b) | | 969,640 | 829,047 |
| Finance of America HECM Buyout sequential payer Series 2022-HB1 Class A, 2.6948% 2/25/32 (b)(c) | | 3,459,079 | 3,257,510 |
| GCAT Trust sequential payer Series 2021-NQM7 Class A1, 1.915% 8/25/66 (b) | | 2,948,188 | 2,567,667 |
| Legacy Mortgage Asset Trust Series 2021-GS5 Class A1, 2.25% 7/25/67 (b)(c) | | 6,541,215 | 6,110,246 |
| New Residential Mortgage Loan Trust Series 2019-5A Class A1B, 3.5% 8/25/59 (b) | | 1,160,880 | 1,064,990 |
| New York Mortgage Trust sequential payer Series 2021-SP1 Class A1, 1.6696% 8/25/61 (b) | | 2,349,510 | 2,139,663 |
| Oceanview Mortgage Loan Trust sequential payer Series 2020-1 Class A1A, 1.7329% 5/28/50 (b) | | 2,320,546 | 2,076,212 |
| Oceanview Trust sequential payer Series 2021-1 Class A, 1.2187% 12/29/51 (b)(c) | | 841,310 | 825,700 |
| Ocwen Ln Investment Trust 2023-Hb1 Series 2023-HB1 Class A, 3% 6/25/36 (b) | | 444,459 | 418,994 |
| Preston Ridge Partners Mortgage Trust: | | | |
| sequential payer Series 2021-8 Class A1, 1.743% 9/25/26 (b)(c) | | 5,856,630 | 5,418,555 |
| Series 2021-2 Class A1, 2.115% 3/25/26 (b) | | 4,235,518 | 4,009,833 |
| Series 2021-RPL1 Class A1, 1.319% 7/25/51 (b) | | 971,812 | 855,515 |
| Series 2021-RPL2 Class A1, 1.455% 10/25/51 (b)(c) | | 1,296,994 | 1,133,716 |
| PRET LLC Series 2022-RN1 Class A1, 3.721% 7/25/51 (b) | | 4,064,590 | 3,849,587 |
| RMF Buyout Issuance Trust sequential payer: | | | |
| Series 2021-HB1 Class A, 1.2586% 11/25/31 (b) | | 1,786,523 | 1,705,504 |
| Series 2022-HB1 Class A, 4.272% 4/25/32 (b) | | 798,459 | 753,172 |
| Sequoia Mortgage Trust floater Series 2004-6 Class A3B, 6 month U.S. LIBOR + 0.880% 6.546% 7/20/34 (c)(d) | | 454 | 402 |
TOTAL PRIVATE SPONSOR | | | 62,675,664 |
| U.S. Government Agency - 0.7% | | | |
| Fannie Mae: | | | |
| planned amortization class: | | | |
Series 2015-28 Class P, 2.5% 5/25/45 | | 1,533,962 | 1,400,053 |
Series 2019-33 Class N, 3% 3/25/48 | | 5,513,287 | 5,090,507 |
| Series 2015-28 Class JE, 3% 5/25/45 | | 1,073,029 | 1,003,217 |
| Series 2018-3 Class LP, 3% 2/25/47 | | 4,099,161 | 3,748,416 |
| Series 2019-59 Class AB, 2.5% 10/25/39 | | 1,833,381 | 1,644,301 |
| Freddie Mac: | | | |
| planned amortization class Series 2019-4903 Class DA, 3% 10/25/48 | | 2,689,757 | 2,439,332 |
| sequential payer Series 4873 Class CA, 4% 7/15/47 | | 1,684,987 | 1,635,266 |
| Series 3949 Class MK, 4.5% 10/15/34 | | 42,504 | 41,699 |
| Series 4472 Class WL, 3% 5/15/45 | | 502,713 | 467,871 |
TOTAL U.S. GOVERNMENT AGENCY | | | 17,470,662 |
| TOTAL COLLATERALIZED MORTGAGE OBLIGATIONS (Cost $87,421,031) | | | 80,146,326 |
| | | | |
| Commercial Mortgage Securities - 7.2% |
| | | Principal Amount (a) | Value ($) |
| BAMLL Commercial Mortgage Securities Trust: | | | |
| floater Series 2022-DKLX Class A, CME Term SOFR 1 Month Index + 1.150% 6.461% 1/15/39 (b)(c)(d) | | 2,178,000 | 2,118,749 |
| sequential payer Series 2019-BPR Class ANM, 3.112% 11/5/32 (b) | | 1,767,000 | 1,609,481 |
| BANK Series 2021-BN33 Class XA, 1.1682% 5/15/64 (c)(g) | | 20,549,083 | 1,110,723 |
| Bank of America Commercial Mortgage Trust sequential payer Series 2015-UBS7 Class ASB, 3.429% 9/15/48 | | 4,892,982 | 4,749,222 |
| Benchmark Mortgage Trust: | | | |
| sequential payer Series 2018-B2 Class A2, 3.6623% 2/15/51 | | 1,307,733 | 1,304,230 |
| Series 2019-B14 Class XA, 0.8991% 12/15/62 (c)(g) | | 24,524,071 | 697,259 |
| Series 2020-B17 Class XA, 1.5369% 3/15/53 (c)(g) | | 49,308,147 | 2,649,563 |
| BLOX Trust floater sequential payer Series 2021-BLOX Class A, CME Term SOFR 1 Month Index + 0.860% 6.1755% 9/15/26 (b)(c)(d) | | 5,047,000 | 4,826,085 |
| BPR Trust floater Series 2022-OANA Class A, CME Term SOFR 1 Month Index + 1.890% 7.2085% 4/15/37 (b)(c)(d) | | 7,152,000 | 7,022,778 |
| BX Commercial Mortgage Trust floater: | | | |
| Series 2021-PAC Class A, CME Term SOFR 1 Month Index + 0.800% 6.1136% 10/15/36 (b)(c)(d) | | 4,501,000 | 4,396,505 |
| Series 2021-VINO Class A, CME Term SOFR 1 Month Index + 0.760% 6.0768% 5/15/38 (b)(c)(d) | | 3,023,314 | 2,964,465 |
| Series 2022-LP2 Class A, CME Term SOFR 1 Month Index + 1.010% 6.3234% 2/15/39 (b)(c)(d) | | 4,468,343 | 4,345,036 |
| Bx Commercial Mortgage Trust 2 floater sequential payer Series 2019-IMC Class A, CME Term SOFR 1 Month Index + 1.110% 6.4245% 4/15/34 (b)(c)(d) | | 614,000 | 611,597 |
| BX Trust: | | | |
| floater: | | | |
Series 2021-ACNT Class A, CME Term SOFR 1 Month Index + 0.960% 6.2745% 11/15/38 (b)(c)(d) | | 4,360,000 | 4,279,342 |
Series 2021-BXMF Class A, CME Term SOFR 1 Month Index + 0.750% 6.0604% 10/15/26 (b)(c)(d) | | 4,085,000 | 3,991,444 |
Series 2022-GPA Class A, CME Term SOFR 1 Month Index + 2.160% 7.4755% 8/15/39 (b)(c)(d) | | 1,624,000 | 1,623,998 |
| floater sequential payer: | | | |
Series 2019-XL Class A, CME Term SOFR 1 Month Index + 1.030% 6.345% 10/15/36 (b)(c)(d) | | 4,127,684 | 4,117,239 |
Series 2021-MFM1 Class A, CME Term SOFR 1 Month Index + 0.810% 6.1245% 1/15/34 (b)(c)(d) | | 1,898,915 | 1,869,086 |
Series 2021-SOAR Class A, CME Term SOFR 1 Month Index + 0.780% 6.0955% 6/15/38 (b)(c)(d) | | 4,031,134 | 3,952,681 |
| CF Hippolyta Issuer LLC sequential payer: | | | |
| Series 2020-1 Class A1, 1.69% 7/15/60 (b) | | 6,624,464 | 5,988,597 |
| Series 2021-1A Class A1, 1.53% 3/15/61 (b) | | 5,329,541 | 4,681,617 |
| CGDB Commercial Mortgage Trust floater Series 2019-MOB Class A, CME Term SOFR 1 Month Index + 1.060% 6.375% 11/15/36 (b)(c)(d) | | 1,313,000 | 1,290,688 |
| Citigroup Commercial Mortgage Trust sequential payer: | | | |
| Series 2014-GC21 Class AAB, 3.477% 5/10/47 | | 199,323 | 198,176 |
| Series 2016-GC36 Class AAB, 3.368% 2/10/49 | | 1,167,752 | 1,128,936 |
| COMM Mortgage Trust: | | | |
| sequential payer: | | | |
Series 2015-CR22 Class ASB, 3.144% 3/10/48 | | 585,747 | 573,159 |
Series 2015-CR23 Class ASB, 3.257% 5/10/48 | | 513,407 | 502,317 |
Series 2020-SBX Class A, 1.67% 1/10/38 (b) | | 8,241,000 | 7,133,820 |
| Series 2013-CR13 Class AM, 4.449% 11/10/46 | | 2,731,000 | 2,700,511 |
| Credit Suisse Mortgage Trust: | | | |
| floater Series 2019-ICE4 Class A, CME Term SOFR 1 Month Index + 1.020% 6.338% 5/15/36 (b)(c)(d) | | 4,987,591 | 4,981,878 |
| sequential payer Series 2020-NET Class A, 2.2569% 8/15/37 (b) | | 2,133,571 | 1,922,581 |
| Series 2018-SITE Class A, 4.284% 4/15/36 (b) | | 1,635,000 | 1,587,548 |
| CSAIL Commercial Mortgage Trust sequential payer Series 19-C15 Class A2, 3.4505% 3/15/52 | | 2,747,488 | 2,657,993 |
| ELP Commercial Mortgage Trust floater Series 2021-ELP Class A, CME Term SOFR 1 Month Index + 0.810% 6.1265% 11/15/38 (b)(c)(d) | | 6,073,000 | 5,943,456 |
| Extended Stay America Trust floater Series 2021-ESH Class A, CME Term SOFR 1 Month Index + 1.190% 6.5045% 7/15/38 (b)(c)(d) | | 1,997,368 | 1,978,120 |
| GS Mortgage Securities Trust: | | | |
| floater Series 2021-IP Class A, CME Term SOFR 1 Month Index + 1.060% 6.3755% 10/15/36 (b)(c)(d) | | 2,682,000 | 2,550,806 |
| sequential payer: | | | |
Series 2014-GC18 Class AAB, 3.648% 1/10/47 | | 13,547 | 13,522 |
Series 2014-GC20 Class AAB, 3.655% 4/10/47 | | 98,505 | 97,862 |
Series 2014-GC26 Class AAB, 3.365% 11/10/47 | | 738,271 | 724,979 |
Series 2015-GC28 Class AAB, 3.206% 2/10/48 | | 585,660 | 575,004 |
| Series 2011-GC5 Class A/S, 5.209% 8/10/44 (b)(c) | | 3,549,786 | 3,334,582 |
| Series 2013-GC13 Class A/S, 3.9838% 7/10/46 (b)(c) | | 6,631,757 | 6,306,748 |
| JPMBB Commercial Mortgage Securities Trust: | | | |
| sequential payer: | | | |
Series 2013-C17 Class ASB, 3.705% 1/15/47 | | 16,033 | 15,989 |
Series 2014-C22 Class A4, 3.8012% 9/15/47 | | 2,537,000 | 2,464,652 |
Series 2014-C25 Class ASB, 3.4074% 11/15/47 | | 409,542 | 402,809 |
| Series 2013-C17 Class A/S, 4.4584% 1/15/47 | | 6,642,000 | 6,411,357 |
| JPMCC Commercial Mortgage Securities Trust sequential payer Series 2016-JP4 Class A2, 2.9838% 12/15/49 | | 241,932 | 232,863 |
| JPMorgan Chase Commercial Mortgage Securities Trust: | | | |
| floater Series 2019-BKWD Class A, CME Term SOFR 1 Month Index + 1.360% 6.6755% 9/15/29 (b)(c)(d) | | 1,875,565 | 1,739,925 |
| Series 2013-C16 Class A/S, 4.5169% 12/15/46 | | 8,570,171 | 8,520,748 |
| Series 2018-WPT Class AFX, 4.2475% 7/5/33 (b) | | 2,708,000 | 2,448,521 |
| LIFE Mortgage Trust floater Series 2021-BMR Class A, CME Term SOFR 1 Month Index + 0.810% 6.1245% 3/15/38 (b)(c)(d) | | 3,997,740 | 3,917,388 |
| Merit floater Series 2021-STOR Class A, CME Term SOFR 1 Month Index + 0.810% 6.1255% 7/15/38 (b)(c)(d) | | 2,266,000 | 2,221,918 |
| Morgan Stanley BAML Trust: | | | |
| sequential payer: | | | |
Series 2013-C11 Class A4, 4.1477% 8/15/46 (c) | | 321,632 | 320,370 |
Series 2014-C15 Class ASB, 3.654% 4/15/47 | | 147,173 | 146,263 |
Series 2014-C19 Class ASB, 3.326% 12/15/47 | | 2,408,149 | 2,373,810 |
Series 2016-C28 Class A3, 3.272% 1/15/49 | | 1,470,759 | 1,381,248 |
| Series 2014-C17 Class ASB, 3.477% 8/15/47 | | 1,303,707 | 1,286,052 |
| Series 2015-C22 Class ASB, 3.04% 4/15/48 | | 307,964 | 300,837 |
| Morgan Stanley Capital I Trust: | | | |
| sequential payer Series 2019-MEAD Class A, 3.17% 11/10/36 (b) | | 3,837,000 | 3,509,992 |
| Series 2021-L6 Class XA, 1.328% 6/15/54 (c)(g) | | 7,031,215 | 405,314 |
| OPG Trust floater Series 2021-PORT Class A, CME Term SOFR 1 Month Index + 0.590% 5.9095% 10/15/36 (b)(c)(d) | | 6,751,645 | 6,577,953 |
| SREIT Trust floater Series 2021-MFP Class A, CME Term SOFR 1 Month Index + 0.840% 6.1558% 11/15/38 (b)(c)(d) | | 4,056,000 | 3,974,570 |
| Wells Fargo Commercial Mortgag Trust sequential payer Series 2015-NXS3 Class ASB, 3.371% 9/15/57 | | 445,057 | 428,984 |
| Wells Fargo Commercial Mortgage Trust sequential payer: | | | |
| Series 2015-C27 Class ASB, 3.278% 2/15/48 | | 881,672 | 859,523 |
| Series 2015-LC22 Class ASB, 3.571% 9/15/58 | | 2,466,254 | 2,396,224 |
| Series 2017-RC1 Class ASB, 3.453% 1/15/60 | | 2,418,681 | 2,313,987 |
| WF-RBS Commercial Mortgage Trust sequential payer Series 2014-C22 Class ASB, 3.464% 9/15/57 | | 1,061,659 | 1,041,155 |
| TOTAL COMMERCIAL MORTGAGE SECURITIES (Cost $181,216,606) | | | 170,804,835 |
| | | | |
| Municipal Securities - 0.2% |
| | | Principal Amount (a) | Value ($) |
| California Gen. Oblig. Series 2019, 2.4% 10/1/25 | | 4,420,000 | 4,177,995 |
| New York City Transitional Fin. Auth. Rev. Series 2017 E, 2.85% 2/1/24 | | 1,320,000 | 1,304,613 |
| TOTAL MUNICIPAL SECURITIES (Cost $5,756,039) | | | 5,482,608 |
| | | | |
| Foreign Government and Government Agency Obligations - 0.1% |
| | | Principal Amount (a) | Value ($) |
United Mexican States 3.25% 4/16/30 (Cost $3,512,173) | | 3,525,000 | 3,120,647 |
| | | | |
| Bank Notes - 0.4% |
| | | Principal Amount (a) | Value ($) |
| Citizens Bank NA 2.25% 4/28/25 | | 4,046,000 | 3,753,938 |
| First Citizens Bank & Trust Co. 2.969% 9/27/25 (c) | | 6,655,000 | 6,369,692 |
| TOTAL BANK NOTES (Cost $10,784,451) | | | 10,123,630 |
| | | | |
| Money Market Funds - 1.1% |
| | | Shares | Value ($) |
Fidelity Cash Central Fund 5.43% (h) (Cost $24,907,372) | | 24,902,391 | 24,907,372 |
| | | | |
| TOTAL INVESTMENT IN SECURITIES - 100.3% (Cost $2,527,981,031) | 2,382,028,178 |
NET OTHER ASSETS (LIABILITIES) - (0.3)% | (5,995,902) |
| NET ASSETS - 100.0% | 2,376,032,276 |
| | |
| Futures Contracts |
| | Number of contracts | Expiration Date | Notional Amount ($) | Value ($) | Unrealized Appreciation/ (Depreciation) ($) |
| Purchased | | | | | |
| | | | | | |
| Treasury Contracts | | | | | |
| CBOT 2-Year U.S. Treasury Note Contracts (United States) | 100 | Dec 2023 | 20,380,469 | 50,957 | 50,957 |
| CBOT 5-Year U.S. Treasury Note Contracts (United States) | 2,730 | Dec 2023 | 291,896,719 | 2,021,852 | 2,021,852 |
| | | | | | |
| TOTAL PURCHASED | | | | | 2,072,809 |
| | | | | | |
| Sold | | | | | |
| | | | | | |
| Treasury Contracts | | | | | |
| CBOT 10-Year U.S. Treasury Note Contracts (United States) | 88 | Dec 2023 | 9,770,750 | (97,602) | (97,602) |
| | | | | | |
| TOTAL FUTURES CONTRACTS | | | | | 1,975,207 |
| The notional amount of futures purchased as a percentage of Net Assets is 13.1% |
| The notional amount of futures sold as a percentage of Net Assets is 0.4% |
For the period, the average monthly notional amount at value for futures contracts in the aggregate was $304,382,397.
Legend
| (a) | Amount is stated in United States dollars unless otherwise noted. |
| (b) | Security exempt from registration under Rule 144A of the Securities Act of 1933. These securities may be resold in transactions exempt from registration, normally to qualified institutional buyers. At the end of the period, the value of these securities amounted to $865,341,779 or 36.4% of net assets. |
| (c) | Coupon rates for floating and adjustable rate securities reflect the rates in effect at period end. |
| (d) | Coupon is indexed to a floating interest rate which may be multiplied by a specified factor and/or subject to caps or floors. |
| (e) | Security or a portion of the security was pledged to cover margin requirements for futures contracts. At period end, the value of securities pledged amounted to $3,747,003. |
| (g) | Interest Only (IO) security represents the right to receive only monthly interest payments on an underlying pool of mortgages or assets. Principal shown is the outstanding par amount of the pool as of the end of the period. |
| (h) | Affiliated fund that is generally available only to investment companies and other accounts managed by Fidelity Investments. The rate quoted is the annualized seven-day yield of the fund at period end. A complete unaudited listing of the fund's holdings as of its most recent quarter end is available upon request. In addition, each Fidelity Central Fund's financial statements, which are not covered by the Fund's Report of Independent Registered Public Accounting Firm, are available on the SEC's website or upon request. |
Affiliated Central Funds
Fiscal year to date information regarding the Fund's investments in Fidelity Central Funds, including the ownership percentage, is presented below.
| Affiliate | Value, beginning of period ($) | Purchases ($) | Sales Proceeds ($) | Dividend Income ($) | Realized Gain (loss) ($) | Change in Unrealized appreciation (depreciation) ($) | Value, end of period ($) | % ownership, end of period |
| Fidelity Cash Central Fund 5.43% | 3,289,901 | 659,386,234 | 637,768,763 | 599,916 | - | - | 24,907,372 | 0.1% |
| Fidelity Securities Lending Cash Central Fund 5.44% | - | 177,786,362 | 177,786,362 | 13,128 | - | - | - | 0.0% |
| Fidelity Specialized High Income Central Fund | 37,677 | - | 37,281 | 104 | (7,205) | 6,809 | - | 0.0% |
| Total | 3,327,578 | 837,172,596 | 815,592,406 | 613,148 | (7,205) | 6,809 | 24,907,372 | |
| | | | | | | | | |
Amounts in the dividend income column in the above table include any capital gain distributions from underlying funds, which are presented in the corresponding line item in the Statement of Operations, if applicable.
Amounts in the dividend income column for Fidelity Securities Lending Cash Central Fund represents the income earned on investing cash collateral, less rebates paid to borrowers and any lending agent fees associated with the loan, plus any premium payments received for lending certain types of securities.
Amounts included in the purchases and sales proceeds columns may include in-kind transactions, if applicable.
Investment Valuation
The following is a summary of the inputs used, as of August 31, 2023, involving the Fund's assets and liabilities carried at fair value. The inputs or methodology used for valuing securities may not be an indication of the risk associated with investing in those securities. For more information on valuation inputs, and their aggregation into the levels used below, please refer to the Investment Valuation section in the accompanying Notes to Financial Statements.
| Valuation Inputs at Reporting Date: |
| Description | Total ($) | Level 1 ($) | Level 2 ($) | Level 3 ($) |
Investments in Securities: | | | | |
|
| Corporate Bonds | 1,616,587,545 | - | 1,616,587,545 | - |
|
| U.S. Government and Government Agency Obligations | 194,885,514 | - | 194,885,514 | - |
|
| U.S. Government Agency - Mortgage Securities | 4,490,911 | - | 4,490,911 | - |
|
| Asset-Backed Securities | 271,478,790 | - | 271,248,383 | 230,407 |
|
| Collateralized Mortgage Obligations | 80,146,326 | - | 80,146,326 | - |
|
| Commercial Mortgage Securities | 170,804,835 | - | 170,804,835 | - |
|
| Municipal Securities | 5,482,608 | - | 5,482,608 | - |
|
| Foreign Government and Government Agency Obligations | 3,120,647 | - | 3,120,647 | - |
|
| Bank Notes | 10,123,630 | - | 10,123,630 | - |
|
| Money Market Funds | 24,907,372 | 24,907,372 | - | - |
| Total Investments in Securities: | 2,382,028,178 | 24,907,372 | 2,356,890,399 | 230,407 |
Derivative Instruments: | | | | |
|
| Assets | | | | |
Futures Contracts | 2,072,809 | 2,072,809 | - | - |
| Total Assets | 2,072,809 | 2,072,809 | - | - |
|
| Liabilities | | | | |
Futures Contracts | (97,602) | (97,602) | - | - |
| Total Liabilities | (97,602) | (97,602) | - | - |
| Total Derivative Instruments: | 1,975,207 | 1,975,207 | - | - |
Value of Derivative Instruments
The following table is a summary of the Fund's value of derivative instruments by primary risk exposure as of August 31, 2023. For additional information on derivative instruments, please refer to the Derivative Instruments section in the accompanying Notes to Financial Statements.
Primary Risk Exposure / Derivative Type | Value |
| Asset ($) | Liability ($) |
| Interest Rate Risk | | |
Futures Contracts (a) | 2,072,809 | (97,602) |
| Total Interest Rate Risk | 2,072,809 | (97,602) |
| Total Value of Derivatives | 2,072,809 | (97,602) |
(a)Reflects gross cumulative appreciation (depreciation) on futures contracts as presented in the Schedule of Investments. In the Statement of Assets and Liabilities, the period end daily variation margin is included in receivable or payable for daily variation margin on futures contracts, and the net cumulative appreciation (depreciation) is included in Total accumulated earnings (loss).
| Statement of Assets and Liabilities |
| | | | August 31, 2023 |
| | | | | |
| Assets | | | | |
| Investment in securities, at value - See accompanying schedule: | | | | |
Unaffiliated issuers (cost $2,503,073,659) | $ | 2,357,120,806 | | |
Fidelity Central Funds (cost $24,907,372) | | 24,907,372 | | |
| | | | | |
| | | | | |
| Total Investment in Securities (cost $2,527,981,031) | | | $ | 2,382,028,178 |
| Receivable for fund shares sold | | | | 2,204,932 |
| Interest receivable | | | | 15,721,894 |
| Distributions receivable from Fidelity Central Funds | | | | 157,752 |
| Receivable for daily variation margin on futures contracts | | | | 307,651 |
| Receivable from investment adviser for expense reductions | | | | 28,195 |
| Other receivables | | | | 14 |
Total assets | | | | 2,400,448,616 |
| Liabilities | | | | |
| Payable to custodian bank | $ | 48,465 | | |
| Payable for investments purchased | | 19,964,063 | | |
| Payable for fund shares redeemed | | 2,665,701 | | |
| Distributions payable | | 957,270 | | |
| Accrued management fee | | 399,416 | | |
| Distribution and service plan fees payable | | 107,315 | | |
| Other affiliated payables | | 238,664 | | |
| Other payables and accrued expenses | | 35,446 | | |
| Total Liabilities | | | | 24,416,340 |
| Net Assets | | | $ | 2,376,032,276 |
| Net Assets consist of: | | | | |
| Paid in capital | | | $ | 2,605,991,181 |
| Total accumulated earnings (loss) | | | | (229,958,905) |
| Net Assets | | | $ | 2,376,032,276 |
| | | | | |
| Net Asset Value and Maximum Offering Price | | | | |
| Class A : | | | | |
Net Asset Value and redemption price per share ($313,202,476 ÷ 28,710,589 shares)(a) | | | $ | 10.91 |
| Maximum offering price per share (100/97.25 of $10.91) | | | $ | 11.22 |
| Class M : | | | | |
Net Asset Value and redemption price per share ($111,487,406 ÷ 10,213,713 shares)(a) | | | $ | 10.92 |
| Maximum offering price per share (100/97.25 of $10.92) | | | $ | 11.23 |
| Class C : | | | | |
Net Asset Value and offering price per share ($22,419,724 ÷ 2,059,945 shares)(a) | | | $ | 10.88 |
| Fidelity Limited Term Bond Fund : | | | | |
Net Asset Value, offering price and redemption price per share ($1,277,525,262 ÷ 116,807,430 shares) | | | $ | 10.94 |
| Class I : | | | | |
Net Asset Value, offering price and redemption price per share ($494,304,620 ÷ 45,186,905 shares) | | | $ | 10.94 |
| Class Z : | | | | |
Net Asset Value, offering price and redemption price per share ($157,092,788 ÷ 14,363,737 shares) | | | $ | 10.94 |
(a)Redemption price per share is equal to net asset value less any applicable contingent deferred sales charge. |
| Statement of Operations |
| | | | Year ended August 31, 2023 |
| Investment Income | | | | |
| Interest | | | $ | 70,752,681 |
| Income from Fidelity Central Funds (including $13,128 from security lending) | | | | 613,148 |
| Total Income | | | | 71,365,829 |
| Expenses | | | | |
| Management fee | $ | 6,867,578 | | |
| Transfer agent fees | | 3,102,557 | | |
| Distribution and service plan fees | | 1,376,909 | | |
| Fund wide operations fee | | 826,878 | | |
| Independent trustees' fees and expenses | | 9,847 | | |
| Miscellaneous | | 35,435 | | |
| Total expenses before reductions | | 12,219,204 | | |
| Expense reductions | | (163,564) | | |
| Total expenses after reductions | | | | 12,055,640 |
| Net Investment income (loss) | | | | 59,310,189 |
| Realized and Unrealized Gain (Loss) | | | | |
| Net realized gain (loss) on: | | | | |
| Investment Securities: | | | | |
| Unaffiliated issuers | | (43,803,866) | | |
| Fidelity Central Funds | | (7,205) | | |
| Futures contracts | | (19,017,036) | | |
| Total net realized gain (loss) | | | | (62,828,107) |
| Change in net unrealized appreciation (depreciation) on: | | | | |
| Investment Securities: | | | | |
| Unaffiliated issuers | | 55,090,537 | | |
| Fidelity Central Funds | | 6,809 | | |
| Futures contracts | | 3,665,450 | | |
| Total change in net unrealized appreciation (depreciation) | | | | 58,762,796 |
| Net gain (loss) | | | | (4,065,311) |
| Net increase (decrease) in net assets resulting from operations | | | $ | 55,244,878 |
| Statement of Changes in Net Assets |
| |
| | Year ended August 31, 2023 | | Year ended August 31, 2022 |
| Increase (Decrease) in Net Assets | | | | |
| Operations | | | | |
| Net investment income (loss) | $ | 59,310,189 | $ | 44,087,163 |
| Net realized gain (loss) | | (62,828,107) | | (27,625,177) |
| Change in net unrealized appreciation (depreciation) | | 58,762,796 | | (255,392,119) |
| Net increase (decrease) in net assets resulting from operations | | 55,244,878 | | (238,930,133) |
| Distributions to shareholders | | (57,642,540) | | (51,016,977) |
| | | | | |
| Share transactions - net increase (decrease) | | (601,859,644) | | (800,198,256) |
| Total increase (decrease) in net assets | | (604,257,306) | | (1,090,145,366) |
| | | | | |
| Net Assets | | | | |
| Beginning of period | | 2,980,289,582 | | 4,070,434,948 |
| End of period | $ | 2,376,032,276 | $ | 2,980,289,582 |
| | | | | |
| | | | | |
Financial Highlights
| Fidelity Advisor® Limited Term Bond Fund Class A |
| |
| Years ended August 31, | | 2023 | | 2022 | | 2021 | | 2020 | | 2019 |
Selected Per-Share Data | | | | | | | | | | |
| Net asset value, beginning of period | $ | 10.90 | $ | 11.83 | $ | 11.97 | $ | 11.67 | $ | 11.28 |
| Income from Investment Operations | | | | | | | | | | |
Net investment income (loss) A,B | | .217 | | .116 | | .132 | | .227 | | .252 |
| Net realized and unrealized gain (loss) | | .004 C | | (.910) | | (.085) | | .299 | | .386 |
| Total from investment operations | | .221 | | (.794) | | .047 | | .526 | | .638 |
| Distributions from net investment income | | (.211) | | (.112) | | (.129) | | (.226) | | (.248) |
| Distributions from net realized gain | | - | | (.024) | | (.058) | | - | | - |
| Total distributions | | (.211) | | (.136) | | (.187) | | (.226) | | (.248) |
| Net asset value, end of period | $ | 10.91 | $ | 10.90 | $ | 11.83 | $ | 11.97 | $ | 11.67 |
Total Return D,E | | 2.06% | | (6.75)% | | .40% | | 4.56% | | 5.73% |
Ratios to Average Net Assets B,F,G | | | | | | | | | | |
| Expenses before reductions | | .69% | | .75% | | .75% | | .75% | | .75% |
| Expenses net of fee waivers, if any | | .69% | | .75% | | .75% | | .75% | | .75% |
| Expenses net of all reductions | | .69% | | .75% | | .75% | | .75% | | .75% |
| Net investment income (loss) | | 2.00% | | 1.02% | | 1.11% | | 1.94% | | 2.21% |
| Supplemental Data | | | | | | | | | | |
| Net assets, end of period (000 omitted) | $ | 313,202 | $ | 365,178 | $ | 445,468 | $ | 368,675 | $ | 277,002 |
Portfolio turnover rate H | | 26% | | 29% | | 81% | | 54% | | 29% |
ACalculated based on average shares outstanding during the period.
BNet investment income (loss) is affected by the timing of the declaration of dividends by any underlying mutual funds or exchange-traded funds (ETFs). Net investment income (loss) of any mutual funds or ETFs is not included in the Fund's net investment income (loss) ratio.
CThe amount shown for a share outstanding does not correspond with the aggregate net gain (loss) on investments for the period due to the timing of sales and repurchases of shares in relation to fluctuating market values of the investments of the Fund.
DTotal returns would have been lower if certain expenses had not been reduced during the applicable periods shown.
ETotal returns do not include the effect of the sales charges.
FFees and expenses of any underlying mutual funds or exchange-traded funds (ETFs) are not included in the Fund's expense ratio. The Fund indirectly bears its proportionate share of these expenses. For additional expense information related to investments in Fidelity Central Funds, please refer to the "Investments in Fidelity Central Funds" note found in the Notes to Financial Statements section of the most recent Annual or Semi-Annual report.
GExpense ratios reflect operating expenses of the class. Expenses before reductions do not reflect amounts reimbursed, waived, or reduced through arrangements with the investment adviser, brokerage services, or other offset arrangements, if applicable, and do not represent the amount paid by the class during periods when reimbursements, waivers or reductions occur.
HAmount does not include the portfolio activity of any underlying mutual funds or exchange-traded funds (ETFs).
| Fidelity Advisor® Limited Term Bond Fund Class M |
| |
| Years ended August 31, | | 2023 | | 2022 | | 2021 | | 2020 | | 2019 |
Selected Per-Share Data | | | | | | | | | | |
| Net asset value, beginning of period | $ | 10.90 | $ | 11.83 | $ | 11.97 | $ | 11.68 | $ | 11.28 |
| Income from Investment Operations | | | | | | | | | | |
Net investment income (loss) A,B | | .217 | | .115 | | .132 | | .227 | | .251 |
| Net realized and unrealized gain (loss) | | .015 C | | (.909) | | (.085) | | .288 | | .396 |
| Total from investment operations | | .232 | | (.794) | | .047 | | .515 | | .647 |
| Distributions from net investment income | | (.212) | | (.112) | | (.129) | | (.225) | | (.247) |
| Distributions from net realized gain | | - | | (.024) | | (.058) | | - | | - |
| Total distributions | | (.212) | | (.136) | | (.187) | | (.225) | | (.247) |
| Net asset value, end of period | $ | 10.92 | $ | 10.90 | $ | 11.83 | $ | 11.97 | $ | 11.68 |
Total Return D,E | | 2.15% | | (6.75)% | | .40% | | 4.47% | | 5.81% |
Ratios to Average Net Assets B,F,G | | | | | | | | | | |
| Expenses before reductions | | .69% | | .75% | | .75% | | .76% | | .76% |
| Expenses net of fee waivers, if any | | .69% | | .75% | | .75% | | .76% | | .76% |
| Expenses net of all reductions | | .69% | | .75% | | .75% | | .76% | | .76% |
| Net investment income (loss) | | 2.00% | | 1.01% | | 1.11% | | 1.93% | | 2.21% |
| Supplemental Data | | | | | | | | | | |
| Net assets, end of period (000 omitted) | $ | 111,487 | $ | 118,756 | $ | 161,105 | $ | 167,201 | $ | 167,670 |
Portfolio turnover rate H | | 26% | | 29% | | 81% | | 54% | | 29% |
ACalculated based on average shares outstanding during the period.
BNet investment income (loss) is affected by the timing of the declaration of dividends by any underlying mutual funds or exchange-traded funds (ETFs). Net investment income (loss) of any mutual funds or ETFs is not included in the Fund's net investment income (loss) ratio.
CThe amount shown for a share outstanding does not correspond with the aggregate net gain (loss) on investments for the period due to the timing of sales and repurchases of shares in relation to fluctuating market values of the investments of the Fund.
DTotal returns would have been lower if certain expenses had not been reduced during the applicable periods shown.
ETotal returns do not include the effect of the sales charges.
FFees and expenses of any underlying mutual funds or exchange-traded funds (ETFs) are not included in the Fund's expense ratio. The Fund indirectly bears its proportionate share of these expenses. For additional expense information related to investments in Fidelity Central Funds, please refer to the "Investments in Fidelity Central Funds" note found in the Notes to Financial Statements section of the most recent Annual or Semi-Annual report.
GExpense ratios reflect operating expenses of the class. Expenses before reductions do not reflect amounts reimbursed, waived, or reduced through arrangements with the investment adviser, brokerage services, or other offset arrangements, if applicable, and do not represent the amount paid by the class during periods when reimbursements, waivers or reductions occur.
HAmount does not include the portfolio activity of any underlying mutual funds or exchange-traded funds (ETFs).
| Fidelity Advisor® Limited Term Bond Fund Class C |
| |
| Years ended August 31, | | 2023 | | 2022 | | 2021 | | 2020 | | 2019 |
Selected Per-Share Data | | | | | | | | | | |
| Net asset value, beginning of period | $ | 10.87 | $ | 11.80 | $ | 11.94 | $ | 11.65 | $ | 11.25 |
| Income from Investment Operations | | | | | | | | | | |
Net investment income (loss) A,B | | .132 | | .027 | | .039 | | .134 | | .162 |
| Net realized and unrealized gain (loss) | | .005 C | | (.908) | | (.084) | | .289 | | .396 |
| Total from investment operations | | .137 | | (.881) | | (.045) | | .423 | | .558 |
| Distributions from net investment income | | (.127) | | (.025) | | (.037) | | (.133) | | (.158) |
| Distributions from net realized gain | | - | | (.024) | | (.058) | | - | | - |
| Total distributions | | (.127) | | (.049) | | (.095) | | (.133) | | (.158) |
| Net asset value, end of period | $ | 10.88 | $ | 10.87 | $ | 11.80 | $ | 11.94 | $ | 11.65 |
Total Return D,E | | 1.27% | | (7.49)% | | (.38)% | | 3.66% | | 5.01% |
Ratios to Average Net Assets B,F,G | | | | | | | | | | |
| Expenses before reductions | | 1.48% | | 1.53% | | 1.53% | | 1.54% | | 1.54% |
| Expenses net of fee waivers, if any | | 1.48% | | 1.53% | | 1.53% | | 1.54% | | 1.54% |
| Expenses net of all reductions | | 1.48% | | 1.53% | | 1.53% | | 1.54% | | 1.54% |
| Net investment income (loss) | | 1.22% | | .24% | | .33% | | 1.15% | | 1.42% |
| Supplemental Data | | | | | | | | | | |
| Net assets, end of period (000 omitted) | $ | 22,420 | $ | 31,080 | $ | 45,658 | $ | 54,337 | $ | 47,710 |
Portfolio turnover rate H | | 26% | | 29% | | 81% | | 54% | | 29% |
ACalculated based on average shares outstanding during the period.
BNet investment income (loss) is affected by the timing of the declaration of dividends by any underlying mutual funds or exchange-traded funds (ETFs). Net investment income (loss) of any mutual funds or ETFs is not included in the Fund's net investment income (loss) ratio.
CThe amount shown for a share outstanding does not correspond with the aggregate net gain (loss) on investments for the period due to the timing of sales and repurchases of shares in relation to fluctuating market values of the investments of the Fund.
DTotal returns would have been lower if certain expenses had not been reduced during the applicable periods shown.
ETotal returns do not include the effect of the contingent deferred sales charge.
FFees and expenses of any underlying mutual funds or exchange-traded funds (ETFs) are not included in the Fund's expense ratio. The Fund indirectly bears its proportionate share of these expenses. For additional expense information related to investments in Fidelity Central Funds, please refer to the "Investments in Fidelity Central Funds" note found in the Notes to Financial Statements section of the most recent Annual or Semi-Annual report.
GExpense ratios reflect operating expenses of the class. Expenses before reductions do not reflect amounts reimbursed, waived, or reduced through arrangements with the investment adviser, brokerage services, or other offset arrangements, if applicable, and do not represent the amount paid by the class during periods when reimbursements, waivers or reductions occur.
HAmount does not include the portfolio activity of any underlying mutual funds or exchange-traded funds (ETFs).
| Fidelity® Limited Term Bond Fund |
| |
| Years ended August 31, | | 2023 | | 2022 | | 2021 | | 2020 | | 2019 |
Selected Per-Share Data | | | | | | | | | | |
| Net asset value, beginning of period | $ | 10.93 | $ | 11.86 | $ | 12.00 | $ | 11.70 | $ | 11.31 |
| Income from Investment Operations | | | | | | | | | | |
Net investment income (loss) A,B | | .251 | | .150 | | .168 | | .263 | | .287 |
| Net realized and unrealized gain (loss) | | .004 C | | (.909) | | (.085) | | .299 | | .386 |
| Total from investment operations | | .255 | | (.759) | | .083 | | .562 | | .673 |
| Distributions from net investment income | | (.245) | | (.147) | | (.165) | | (.262) | | (.283) |
| Distributions from net realized gain | | - | | (.024) | | (.058) | | - | | - |
| Total distributions | | (.245) | | (.171) | | (.223) | | (.262) | | (.283) |
| Net asset value, end of period | $ | 10.94 | $ | 10.93 | $ | 11.86 | $ | 12.00 | $ | 11.70 |
Total Return D | | 2.37% | | (6.45)% | | .70% | | 4.87% | | 6.04% |
Ratios to Average Net Assets B,E,F | | | | | | | | | | |
| Expenses before reductions | | .39% | | .45% | | .45% | | .45% | | .45% |
| Expenses net of fee waivers, if any | | .39% | | .45% | | .45% | | .45% | | .45% |
| Expenses net of all reductions | | .39% | | .45% | | .45% | | .45% | | .45% |
| Net investment income (loss) | | 2.30% | | 1.32% | | 1.41% | | 2.24% | | 2.52% |
| Supplemental Data | | | | | | | | | | |
| Net assets, end of period (000 omitted) | $ | 1,277,525 | $ | 1,593,604 | $ | 2,245,757 | $ | 2,078,737 | $ | 1,563,504 |
Portfolio turnover rate G | | 26% | | 29% | | 81% | | 54% | | 29% |
ACalculated based on average shares outstanding during the period.
BNet investment income (loss) is affected by the timing of the declaration of dividends by any underlying mutual funds or exchange-traded funds (ETFs). Net investment income (loss) of any mutual funds or ETFs is not included in the Fund's net investment income (loss) ratio.
CThe amount shown for a share outstanding does not correspond with the aggregate net gain (loss) on investments for the period due to the timing of sales and repurchases of shares in relation to fluctuating market values of the investments of the Fund.
DTotal returns would have been lower if certain expenses had not been reduced during the applicable periods shown.
EFees and expenses of any underlying mutual funds or exchange-traded funds (ETFs) are not included in the Fund's expense ratio. The Fund indirectly bears its proportionate share of these expenses. For additional expense information related to investments in Fidelity Central Funds, please refer to the "Investments in Fidelity Central Funds" note found in the Notes to Financial Statements section of the most recent Annual or Semi-Annual report.
FExpense ratios reflect operating expenses of the class. Expenses before reductions do not reflect amounts reimbursed, waived, or reduced through arrangements with the investment adviser, brokerage services, or other offset arrangements, if applicable, and do not represent the amount paid by the class during periods when reimbursements, waivers or reductions occur.
GAmount does not include the portfolio activity of any underlying mutual funds or exchange-traded funds (ETFs).
| Fidelity Advisor® Limited Term Bond Fund Class I |
| |
| Years ended August 31, | | 2023 | | 2022 | | 2021 | | 2020 | | 2019 |
Selected Per-Share Data | | | | | | | | | | |
| Net asset value, beginning of period | $ | 10.93 | $ | 11.86 | $ | 12.00 | $ | 11.70 | $ | 11.31 |
| Income from Investment Operations | | | | | | | | | | |
Net investment income (loss) A,B | | .247 | | .145 | | .162 | | .257 | | .282 |
| Net realized and unrealized gain (loss) | | .005 C | | (.910) | | (.084) | | .299 | | .386 |
| Total from investment operations | | .252 | | (.765) | | .078 | | .556 | | .668 |
| Distributions from net investment income | | (.242) | | (.141) | | (.160) | | (.256) | | (.278) |
| Distributions from net realized gain | | - | | (.024) | | (.058) | | - | | - |
| Total distributions | | (.242) | | (.165) | | (.218) | | (.256) | | (.278) |
| Net asset value, end of period | $ | 10.94 | $ | 10.93 | $ | 11.86 | $ | 12.00 | $ | 11.70 |
Total Return D | | 2.34% | | (6.49)% | | .66% | | 4.82% | | 5.99% |
Ratios to Average Net Assets B,E,F | | | | | | | | | | |
| Expenses before reductions | | .44% | | .50% | | .50% | | .50% | | .50% |
| Expenses net of fee waivers, if any | | .42% | | .50% | | .50% | | .50% | | .50% |
| Expenses net of all reductions | | .42% | | .50% | | .50% | | .50% | | .50% |
| Net investment income (loss) | | 2.27% | | 1.27% | | 1.36% | | 2.20% | | 2.47% |
| Supplemental Data | | | | | | | | | | |
| Net assets, end of period (000 omitted) | $ | 494,305 | $ | 656,342 | $ | 871,438 | $ | 765,760 | $ | 524,068 |
Portfolio turnover rate G | | 26% | | 29% | | 81% | | 54% | | 29% |
ACalculated based on average shares outstanding during the period.
BNet investment income (loss) is affected by the timing of the declaration of dividends by any underlying mutual funds or exchange-traded funds (ETFs). Net investment income (loss) of any mutual funds or ETFs is not included in the Fund's net investment income (loss) ratio.
CThe amount shown for a share outstanding does not correspond with the aggregate net gain (loss) on investments for the period due to the timing of sales and repurchases of shares in relation to fluctuating market values of the investments of the Fund.
DTotal returns would have been lower if certain expenses had not been reduced during the applicable periods shown.
EFees and expenses of any underlying mutual funds or exchange-traded funds (ETFs) are not included in the Fund's expense ratio. The Fund indirectly bears its proportionate share of these expenses. For additional expense information related to investments in Fidelity Central Funds, please refer to the "Investments in Fidelity Central Funds" note found in the Notes to Financial Statements section of the most recent Annual or Semi-Annual report.
FExpense ratios reflect operating expenses of the class. Expenses before reductions do not reflect amounts reimbursed, waived, or reduced through arrangements with the investment adviser, brokerage services, or other offset arrangements, if applicable, and do not represent the amount paid by the class during periods when reimbursements, waivers or reductions occur.
GAmount does not include the portfolio activity of any underlying mutual funds or exchange-traded funds (ETFs).
| Fidelity Advisor® Limited Term Bond Fund Class Z |
| |
| Years ended August 31, | | 2023 | | 2022 | | 2021 | | 2020 | | 2019 A |
Selected Per-Share Data | | | | | | | | | | |
| Net asset value, beginning of period | $ | 10.93 | $ | 11.86 | $ | 12.00 | $ | 11.70 | $ | 11.28 |
| Income from Investment Operations | | | | | | | | | | |
Net investment income (loss) B,C | | .259 | | .160 | | .179 | | .273 | | .273 |
| Net realized and unrealized gain (loss) | | .004 D | | (.909) | | (.085) | | .299 | | .415 |
| Total from investment operations | | .263 | | (.749) | | .094 | | .572 | | .688 |
| Distributions from net investment income | | (.253) | | (.157) | | (.176) | | (.272) | | (.268) |
| Distributions from net realized gain | | - | | (.024) | | (.058) | | - | | - |
| Total distributions | | (.253) | | (.181) | | (.234) | | (.272) | | (.268) |
| Net asset value, end of period | $ | 10.94 | $ | 10.93 | $ | 11.86 | $ | 12.00 | $ | 11.70 |
Total Return E,F | | 2.45% | | (6.36)% | | .79% | | 4.97% | | 6.18% |
Ratios to Average Net Assets C,G,H | | | | | | | | | | |
| Expenses before reductions | | .34% | | .40% | | .40% | | .40% | | .40% I |
| Expenses net of fee waivers, if any | | .32% | | .36% | | .36% | | .36% | | .36% I |
| Expenses net of all reductions | | .32% | | .36% | | .36% | | .36% | | .36% I |
| Net investment income (loss) | | 2.38% | | 1.41% | | 1.50% | | 2.33% | | 2.62% I |
| Supplemental Data | | | | | | | | | | |
| Net assets, end of period (000 omitted) | $ | 157,093 | $ | 215,329 | $ | 301,008 | $ | 217,972 | $ | 64,672 |
Portfolio turnover rate J | | 26% | | 29% | | 81% | | 54% | | 29% |
AFor the period October 2, 2018 (commencement of sale of shares) through August 31, 2019.
BCalculated based on average shares outstanding during the period.
CNet investment income (loss) is affected by the timing of the declaration of dividends by any underlying mutual funds or exchange-traded funds (ETFs). Net investment income (loss) of any mutual funds or ETFs is not included in the Fund's net investment income (loss) ratio.
DThe amount shown for a share outstanding does not correspond with the aggregate net gain (loss) on investments for the period due to the timing of sales and repurchases of shares in relation to fluctuating market values of the investments of the Fund.
ETotal returns would have been lower if certain expenses had not been reduced during the applicable periods shown.
FTotal returns for periods of less than one year are not annualized.
GFees and expenses of any underlying mutual funds or exchange-traded funds (ETFs) are not included in the Fund's expense ratio. The Fund indirectly bears its proportionate share of these expenses. For additional expense information related to investments in Fidelity Central Funds, please refer to the "Investments in Fidelity Central Funds" note found in the Notes to Financial Statements section of the most recent Annual or Semi-Annual report.
HExpense ratios reflect operating expenses of the class. Expenses before reductions do not reflect amounts reimbursed, waived, or reduced through arrangements with the investment adviser, brokerage services, or other offset arrangements, if applicable, and do not represent the amount paid by the class during periods when reimbursements, waivers or reductions occur.
IAnnualized.
JAmount does not include the portfolio activity of any underlying mutual funds or exchange-traded funds (ETFs).
For the period ended August 31, 2023
1. Organization.
Fidelity Advisor Limited Term Bond Fund (the Fund) is a fund of Fidelity Advisor Series II (the Trust) and is authorized to issue an unlimited number of shares. The Trust is registered under the Investment Company Act of 1940, as amended (the 1940 Act), as an open-end management investment company organized as a Massachusetts business trust. The Fund offers Class A, Class M, Class C, Fidelity Limited Term Bond Fund, Class I and Class Z shares, each of which has equal rights as to assets and voting privileges. Class A, Class M, Class C, Class I and Class Z are Fidelity Advisor classes. Each class has exclusive voting rights with respect to matters that affect that class. Class C shares will automatically convert to Class A shares after a holding period of eight years from the initial date of purchase, with certain exceptions.
2. Investments in Fidelity Central Funds.
Funds may invest in Fidelity Central Funds, which are open-end investment companies generally available only to other investment companies and accounts managed by the investment adviser and its affiliates. The Schedule of Investments lists any Fidelity Central Funds held as an investment as of period end, but does not include the underlying holdings of each Fidelity Central Fund. An investing fund indirectly bears its proportionate share of the expenses of the underlying Fidelity Central Funds.
Based on its investment objective, each Fidelity Central Fund may invest or participate in various investment vehicles or strategies that are similar to those of the investing fund. These strategies are consistent with the investment objectives of the investing fund and may involve certain economic risks which may cause a decline in value of each of the Fidelity Central Funds and thus a decline in the value of the investing fund.
| Fidelity Central Fund | Investment Manager | Investment Objective | Investment Practices | Expense RatioA |
| Fidelity Specialized High Income Central Fund | Fidelity Management & Research Company LLC (FMR) | Seeks a high level of current income by normally investing in income-producing debt securities, with an emphasis on lower-quality debt securities. | Loans & Direct Debt Instruments Restricted Securities | Less than .005% |
| Fidelity Money Market Central Funds | Fidelity Management & Research Company LLC (FMR) | Each fund seeks to obtain a high level of current income consistent with the preservation of capital and liquidity. | Short-term Investments | Less than .005% |
A Expenses expressed as a percentage of average net assets and are as of each underlying Central Fund's most recent annual or semi-annual shareholder report.
A complete unaudited list of holdings for each Fidelity Central Fund is available upon request or at the Securities and Exchange Commission website at www.sec.gov. In addition, the financial statements of the Fidelity Central Funds which contain the significant accounting policies (including investment valuation policies) of those funds, and are not covered by the Report of Independent Registered Public Accounting Firm, are available on the Securities and Exchange Commission website or upon request.
3. Significant Accounting Policies.
The Fund is an investment company and applies the accounting and reporting guidance of the Financial Accounting Standards Board (FASB) Accounting Standards Codification Topic 946 Financial Services - Investment Companies. The financial statements have been prepared in conformity with accounting principles generally accepted in the United States of America (GAAP), which require management to make certain estimates and assumptions at the date of the financial statements. Actual results could differ from those estimates. Subsequent events, if any, through the date that the financial statements were issued have been evaluated in the preparation of the financial statements. The Fund's Schedule of Investments lists any underlying mutual funds or exchange-traded funds (ETFs) but does not include the underlying holdings of these funds. The following summarizes the significant accounting policies of the Fund:
Investment Valuation. Investments are valued as of 4:00 p.m. Eastern time on the last calendar day of the period. The Board of Trustees (the Board) has designated the Fund's investment adviser as the valuation designee responsible for the fair valuation function and performing fair value determinations as needed. The investment adviser has established a Fair Value Committee (the Committee) to carry out the day-to-day fair valuation responsibilities and has adopted policies and procedures to govern the fair valuation process and the activities of the Committee. In accordance with these fair valuation policies and procedures, which have been approved by the Board, the Fund attempts to obtain prices from one or more third party pricing services or brokers to value its investments. When current market prices, quotations or currency exchange rates are not readily available or reliable, investments will be fair valued in good faith by the Committee, in accordance with the policies and procedures. Factors used in determining fair value vary by investment type and may include market or investment specific events, transaction data, estimated cash flows, and market observations of comparable investments. The frequency that the fair valuation procedures are used cannot be predicted and they may be utilized to a significant extent. The Committee manages the Fund's fair valuation practices and maintains the fair valuation policies and procedures. The Fund's investment adviser reports to the Board information regarding the fair valuation process and related material matters.
The Fund categorizes the inputs to valuation techniques used to value its investments into a disclosure hierarchy consisting of three levels as shown below:
Level 1 - unadjusted quoted prices in active markets for identical investments
Level 2 - other significant observable inputs (including quoted prices for similar investments, interest rates, prepayment speeds, etc.)
Level 3 - unobservable inputs (including the Fund's own assumptions based on the best information available)
Valuation techniques used to value the Fund's investments by major category are as follows:
Debt securities, including restricted securities, are valued based on evaluated prices received from third party pricing services or from brokers who make markets in such securities. Corporate bonds, bank notes, foreign government and government agency obligations, municipal securities and U.S. government and government agency obligations are valued by pricing services who utilize matrix pricing which considers yield or price of bonds of comparable quality, coupon, maturity and type or by broker-supplied prices. Asset backed securities, collateralized mortgage obligations, commercial mortgage securities and U.S. government agency mortgage securities are valued by pricing services who utilize matrix pricing which considers prepayment speed assumptions, attributes of the collateral, yield or price of bonds of comparable quality, coupon, maturity and type or by broker-supplied prices. When independent prices are unavailable or unreliable, debt securities may be valued utilizing pricing methodologies which consider similar factors that would be used by third party pricing services. Debt securities are generally categorized as Level 2 in the hierarchy but may be Level 3 depending on the circumstances.
Futures contracts are valued at the settlement price established each day by the board of trade or exchange on which they are traded and are categorized as Level 1 in the hierarchy. Investments in open-end mutual funds, including the Fidelity Central Funds, are valued at their closing net asset value (NAV) each business day and are categorized as Level 1 in the hierarchy.
Changes in valuation techniques may result in transfers in or out of an assigned level within the disclosure hierarchy. The aggregate value of investments by input level as of August 31, 2023 is included at the end of the Fund's Schedule of Investments.
Investment Transactions and Income. For financial reporting purposes, the Fund's investment holdings and NAV include trades executed through the end of the last business day of the period. The NAV per share for processing shareholder transactions is calculated as of the close of business of the New York Stock Exchange (NYSE), normally 4:00 p.m. Eastern time and includes trades executed through the end of the prior business day. Gains and losses on securities sold are determined on the basis of identified cost and include proceeds received from litigation. Income and capital gain distributions from Fidelity Central Funds, if any, are recorded on the ex-dividend date. Interest income is accrued as earned and includes coupon interest and amortization of premium and accretion of discount on debt securities as applicable. Debt obligations may be placed on non-accrual status and related interest income may be reduced by ceasing current accruals and writing off interest receivables when the collection of all or a portion of interest has become doubtful based on consistently applied procedures. A debt obligation is removed from non-accrual status when the issuer resumes interest payments or when collectability of interest is reasonably assured.
Class Allocations and Expenses. Investment income, realized and unrealized capital gains and losses, common expenses of a fund, and certain fund-level expense reductions, if any, are allocated daily on a pro-rata basis to each class based on the relative net assets of each class to the total net assets of a fund. Each class differs with respect to transfer agent and distribution and service plan fees incurred, as applicable. Certain expense reductions may also differ by class, if applicable. For the reporting period, the allocated portion of income and expenses to each class as a percent of its average net assets may vary due to the timing of recording these transactions in relation to fluctuating net assets of the classes. Expenses directly attributable to a fund are charged to that fund. Expenses attributable to more than one fund are allocated among the respective funds on the basis of relative net assets or other appropriate methods. Expenses included in the accompanying financial statements reflect the expenses of that fund and do not include any expenses associated with any underlying mutual funds or exchange-traded funds (ETFs). Although not included in a fund's expenses, a fund indirectly bears its proportionate share of these expenses through the net asset value of each underlying mutual fund or exchange-traded fund (ETF). Expense estimates are accrued in the period to which they relate and adjustments are made when actual amounts are known.
Income Tax Information and Distributions to Shareholders. Each year, the Fund intends to qualify as a regulated investment company under Subchapter M of the Internal Revenue Code, including distributing substantially all of its taxable income and realized gains. As a result, no provision for U.S. Federal income taxes is required. As of August 31, 2023, the Fund did not have any unrecognized tax benefits in the financial statements; nor is the Fund aware of any tax positions for which it is reasonably possible that the total amounts of unrecognized tax benefits will significantly change in the next twelve months. The Fund files a U.S. federal tax return, in addition to state and local tax returns as required. The Fund's federal income tax returns are subject to examination by the Internal Revenue Service (IRS) for a period of three fiscal years after they are filed. State and local tax returns may be subject to examination for an additional fiscal year depending on the jurisdiction.
Distributions are declared and recorded daily and paid monthly from net investment income. Distributions from realized gains, if any, are declared and recorded on the ex-dividend date. Income and capital gain distributions are declared separately for each class. Income and capital gain distributions are determined in accordance with income tax regulations, which may differ from GAAP.
Capital accounts within the financial statements are adjusted for permanent book-tax differences. These adjustments have no impact on net assets or the results of operations. Capital accounts are not adjusted for temporary book-tax differences which will reverse in a subsequent period.
Book-tax differences are primarily due to futures contracts, market discount, capital loss carryforwards and losses deferred due to wash sales.
As of period end, the cost and unrealized appreciation (depreciation) in securities, and derivatives if applicable, for federal income tax purposes were as follows:
| Gross unrealized appreciation | $816,826 |
| Gross unrealized depreciation | (145,653,865) |
| Net unrealized appreciation (depreciation) | $(144,837,039) |
| Tax Cost | $2,526,865,217 |
The tax-based components of distributable earnings as of period end were as follows:
| Undistributed ordinary income | $212,725 |
| Capital loss carryforward | $(85,334,588) |
| Net unrealized appreciation (depreciation) on securities and other investments | $(144,837,039) |
Capital loss carryforwards are only available to offset future capital gains of the Fund to the extent provided by regulations and may be limited. The capital loss carryforward information presented below, including any applicable limitation, is estimated as of fiscal period end and is subject to adjustment.
Short-term | $(26,460,661) |
Long-term | (58,873,927) |
| Total capital loss carryforward | $(85,334,588) |
The tax character of distributions paid was as follows:
| | August 31, 2023 | August 31, 2022 |
| Ordinary Income | $57,642,540 | $42,801,747 |
| Long-term Capital Gains | - | 8,215,230 |
| Total | $57,642,540 | $51,016,977 |
Restricted Securities (including Private Placements). Funds may invest in securities that are subject to legal or contractual restrictions on resale. These securities generally may be resold in transactions exempt from registration or to the public if the securities are registered. Disposal of these securities may involve time-consuming negotiations and expense, and prompt sale at an acceptable price may be difficult. Information regarding restricted securities held at period end is included at the end of the Schedule of Investments, if applicable.
4. Derivative Instruments.
Risk Exposures and the Use of Derivative Instruments. The Fund's investment objectives allow for various types of derivative instruments, including futures contracts. Derivatives are investments whose value is primarily derived from underlying assets, indices or reference rates and may be transacted on an exchange or over-the-counter (OTC). Derivatives may involve a future commitment to buy or sell a specified asset based on specified terms, to exchange future cash flows at periodic intervals based on a notional principal amount, or for one party to make one or more payments upon the occurrence of specified events in exchange for periodic payments from the other party.
Derivatives were used to increase returns and to manage exposure to certain risks as defined below. The success of any strategy involving derivatives depends on analysis of numerous economic factors, and if the strategies for investment do not work as intended, the objectives may not be achieved.
Derivatives were used to increase or decrease exposure to the following risk(s):
| | |
| Interest Rate Risk | Interest rate risk relates to the fluctuations in the value of interest-bearing securities due to changes in the prevailing levels of market interest rates. |
Funds are also exposed to additional risks from investing in derivatives, such as liquidity risk and counterparty credit risk. Liquidity risk is the risk that a fund will be unable to close out the derivative in the open market in a timely manner. Counterparty credit risk is the risk that the counterparty will not be able to fulfill its obligation to a fund. Counterparty credit risk related to exchange-traded contracts may be mitigated by the protection provided by the exchange on which they trade.
Investing in derivatives may involve greater risks than investing in the underlying assets directly and, to varying degrees, may involve risk of loss in excess of any initial investment and collateral received and amounts recognized in the Statement of Assets and Liabilities. In addition, there may be the risk that the change in value of the derivative contract does not correspond to the change in value of the underlying instrument.
Futures Contracts. A futures contract is an agreement between two parties to buy or sell a specified underlying instrument for a fixed price at a specified future date. Futures contracts were used to manage exposure to the bond market and fluctuations in interest rates.
Upon entering into a futures contract, a fund is required to deposit either cash or securities (initial margin) with a clearing broker in an amount equal to a certain percentage of the face value of the contract. Futures contracts are marked-to-market daily and subsequent daily payments are made or received by a fund depending on the daily fluctuations in the value of the futures contracts and are recorded as unrealized appreciation or (depreciation). This receivable and/or payable, if any, is included in daily variation margin on futures contracts in the Statement of Assets and Liabilities. Realized gain or (loss) is recorded upon the expiration or closing of a futures contract. The net realized gain (loss) and change in net unrealized appreciation (depreciation) on futures contracts during the period is presented in the Statement of Operations.
Any open futures contracts at period end are presented in the Schedule of Investments under the caption "Futures Contracts". The notional amount at value reflects each contract's exposure to the underlying instrument or index at period end, and is representative of volume of activity during the period unless an average notional amount is presented. Any securities deposited to meet initial margin requirements are identified in the Schedule of Investments. Any cash deposited to meet initial margin requirements is presented as segregated cash with brokers for derivative instruments in the Statement of Assets and Liabilities.
5. Purchases and Sales of Investments.
Purchases and sales of securities, other than short-term securities, U.S. government securities and in-kind transactions, as applicable, are noted in the table below.
| | Purchases ($) | Sales ($) |
| Fidelity Advisor Limited Term Bond Fund | 221,226,604 | 643,606,323 |
6. Fees and Other Transactions with Affiliates.
Management Fee. Fidelity Management & Research Company LLC (the investment adviser) and its affiliates provide the Fund with investment management related services for which the Fund pays a monthly management fee.
Effective April 1, 2023, the Fund pays a monthly management fee that is based on an annual rate of .20% of the Fund's average net assets. Under the management contract, the investment adviser pays all other fund-level expenses, except the compensation of the independent Trustees and certain other expenses such as proxy and shareholder meeting expenses.
Prior to April 1, 2023, the management fee was the sum of an individual fund fee rate that was based on an annual rate of .20% of the Fund's average net assets and an annualized group fee rate that averaged .10% during the period. The group fee rate was based upon the monthly average net assets of a group of registered investment companies with which the investment adviser has management contracts. The group fee rate decreased as assets under management increased and increased as assets under management decreased.
For the reporting period, the total annual management fee rate was .26% of the Fund's average net assets.
Distribution and Service Plan Fees. In accordance with Rule 12b-1 of the 1940 Act, the Fund has adopted separate Distribution and Service Plans for each class of shares. Certain classes pay Fidelity Distributors Company LLC (FDC), an affiliate of the investment adviser, separate Distribution and Service Fees, each of which is based on an annual percentage of each class' average net assets. In addition, FDC may pay financial intermediaries for selling shares of the Fund and providing shareholder support services. For the period, the Distribution and Service Fee rates, total fees and amounts retained by FDC were as follows:
| | Distribution Fee | Service Fee | Total Fees | Retained by FDC |
| Class A | -% | .25% | $830,418 | $58,862 |
| Class M | -% | .25% | 281,936 | 994 |
| Class C | .75% | .25% | 264,555 | 14,258 |
| | | | $1,376,909 | $74,114 |
Sales Load. FDC may receive a front-end sales charge of up to 2.75% for selling Class A shares and Class M shares, some of which is paid to financial intermediaries for selling shares of the Fund. Depending on the holding period, FDC may receive contingent deferred sales charges levied on Class A, Class M and Class C redemptions. The deferred sales charges are 1.00% for Class C shares, .75% or .50% for certain purchases of Class A shares and .25% for certain purchases of Class M shares.
For the period, sales charge amounts retained by FDC were as follows:
| | Retained by FDC |
| Class A | $17,475 |
| Class M | 1,453 |
Class C A | 209 |
| | $19,137 |
A When Class C shares are initially sold, FDC pays commissions from its own resources to financial intermediaries through which the sales are made.
Transfer Agent Fees. Fidelity Investments Institutional Operations Company LLC (FIIOC), an affiliate of the investment adviser, is the transfer, dividend disbursing and shareholder servicing agent for each class of the Fund. FIIOC receives account fees and asset-based fees that vary according to the account size and type of account of the shareholders of each respective class of the Fund, with the exception of Fidelity Limited Term Bond Fund and Class Z. FIIOC receives an asset-based fee of Fidelity Limited Term Bond Fund's and Class Z's average net assets. FIIOC pays for typesetting, printing and mailing of shareholder reports, except proxy statements. For the period, transfer agent fees for each class were as follows:
| | Amount | % of Class-Level Average Net Assets |
| Class A | $508,534 | .15 |
| Class M | 172,881 | .15 |
| Class C | 48,081 | .18 |
| Fidelity Limited Term Bond Fund | 1,410,321 | .10 |
| Class I | 872,996 | .15 |
| Class Z | 89,744 | .05 |
| | $3,102,557 | |
Fund Wide Operations Fee. For the period September 1, 2022 through March 31, 2023, pursuant to the Fund Wide Operations and Expense Agreement (FWOE), the investment adviser had agreed to provide for fund-level expenses (which may not include transfer agent, the compensation of the independent Trustees, interest, taxes or extraordinary expenses, as applicable) in return for a FWOE fee equal to .35% of fund-level average net assets less the total amount of the management fee. The FWOE paid by a fund is reduced by an amount equal to the fees and expenses paid to the independent Trustees. Effective April 1, 2023, the FWOE was terminated. For the period, the FWOE fees were equivalent to the following annual rate expressed as a percentage of average net assets:
| Fidelity Advisor Limited Term Bond Fund | .03% |
Interfund Trades. Funds may purchase from or sell securities to other Fidelity Funds under procedures adopted by the Board. The procedures have been designed to ensure these interfund trades are executed in accordance with Rule 17a-7 of the 1940 Act. Any interfund trades are included within the respective purchases and sales amounts shown in the Purchases and Sales of Investments note. During the period, there were no interfund trades.
7. Committed Line of Credit.
Certain Funds participate with other funds managed by the investment adviser or an affiliate in a $4.25 billion credit facility (the "line of credit") to be utilized for temporary or emergency purposes to fund shareholder redemptions or for other short-term liquidity purposes. The commitment fees on the pro-rata portion of the line of credit are borne by the investment adviser. During the period, there were no borrowings on this line of credit.
8. Security Lending.
Funds lend portfolio securities from time to time in order to earn additional income. Lending agents are used, including National Financial Services (NFS), an affiliate of the investment adviser. Pursuant to a securities lending agreement, NFS will receive a fee, which is capped at 9.9% of a fund's daily lending revenue, for its services as lending agent. A fund may lend securities to certain qualified borrowers, including NFS. On the settlement date of the loan, a fund receives collateral (in the form of U.S. Treasury obligations, letters of credit and/or cash) against the loaned securities and maintains collateral in an amount not less than 100% of the market value of the loaned securities during the period of the loan. The market value of the loaned securities is determined at the close of business of a fund and any additional required collateral is delivered to a fund on the next business day. A fund or borrower may terminate the loan at any time, and if the borrower defaults on its obligation to return the securities loaned because of insolvency or other reasons, a fund may apply collateral received from the borrower against the obligation. A fund may experience delays and costs in recovering the securities loaned. Any cash collateral received is invested in the Fidelity Securities Lending Cash Central Fund. Any loaned securities are identified as such in the Schedule of Investments, and the value of loaned securities and cash collateral at period end, as applicable, are presented in the Statement of Assets and Liabilities. Security lending income represents the income earned on investing cash collateral, less rebates paid to borrowers and any lending agent fees associated with the loan, plus any premium payments received for lending certain types of securities. Security lending income is presented in the Statement of Operations as a component of income from Fidelity Central Funds. Affiliated security lending activity, if any, was as follows:
| | Total Security Lending Fees Paid to NFS | Security Lending Income From Securities Loaned to NFS | Value of Securities Loaned to NFS at Period End |
| Fidelity Advisor Limited Term Bond Fund | $1,404 | $- | $- |
9. Expense Reductions.
The investment adviser contractually agreed to reimburse expenses of each class to the extent annual operating expenses exceeded certain levels of class-level average net assets as noted in the table below. This reimbursement will remain in place through December 31, 2024. Some expenses, for example the compensation of the independent Trustees, and certain other expenses such as interest expense, are excluded from this reimbursement.
The following classes were in reimbursement during the period:
| | Expense Limitations | Reimbursement |
| Class I | None/.30%A | $116,590 |
| Class Z | .36%/NoneA | 44,557 |
| | | $161,147 |
A Expense limitation effective April 1, 2023.
Through arrangements with the Fund's custodian and each class' transfer agent, credits realized as a result of certain uninvested cash balances were used to reduce the Fund's expenses. During the period, custodian credits reduced the Fund's expenses by $2,006. During the period, transfer agent credits reduced each class' expenses as noted in the table below.
| | Expense reduction |
| Class M | $411 |
10. Distributions to Shareholders.
Distributions to shareholders of each class were as follows:
| | Year ended August 31, 2023 | Year ended August 31, 2022 |
| Fidelity Advisor Limited Term Bond Fund | | |
| Distributions to shareholders | | |
| Class A | $6,440,434 | $4,862,271 |
| Class M | 2,195,885 | 1,691,983 |
| Class C | 305,237 | 169,292 |
| Fidelity Limited Term Bond Fund | 31,605,105 | 28,740,213 |
| Class I | 12,949,496 | 11,345,322 |
| Class Z | 4,146,383 | 4,207,896 |
Total | $57,642,540 | $51,016,977 |
11. Share Transactions.
Share transactions for each class were as follows and may contain in-kind transactions, automatic conversions between classes or exchanges between affiliated funds:
| | Shares | Shares | Dollars | Dollars |
| | Year ended August 31, 2023 | Year ended August 31, 2022 | Year ended August 31, 2023 | Year ended August 31, 2022 |
| Fidelity Advisor Limited Term Bond Fund | | | | |
| Class A | | | | |
| Shares sold | 12,476,809 | 20,799,385 | $135,307,742 | $236,988,448 |
| Reinvestment of distributions | 570,072 | 411,338 | 6,180,752 | 4,673,321 |
| Shares redeemed | (17,846,330) | (25,369,687) | (193,397,463) | (288,968,935) |
| Net increase (decrease) | (4,799,449) | (4,158,964) | $(51,908,969) | $(47,307,166) |
| Class M | | | | |
| Shares sold | 2,434,698 | 3,137,810 | $26,403,092 | $35,881,317 |
| Reinvestment of distributions | 194,867 | 138,833 | 2,114,773 | 1,579,114 |
| Shares redeemed | (3,306,910) | (6,000,676) | (35,804,127) | (68,315,514) |
| Net increase (decrease) | (677,345) | (2,724,033) | $(7,286,262) | $(30,855,083) |
| Class C | | | | |
| Shares sold | 340,134 | 664,269 | $3,665,612 | $7,511,156 |
| Reinvestment of distributions | 27,067 | 14,558 | 292,923 | 166,401 |
| Shares redeemed | (1,165,878) | (1,689,931) | (12,588,331) | (19,094,317) |
| Net increase (decrease) | (798,677) | (1,011,104) | $(8,629,796) | $(11,416,760) |
| Fidelity Limited Term Bond Fund | | | | |
| Shares sold | 12,998,512 | 19,307,948 | $140,430,844 | $220,670,239 |
| Reinvestment of distributions | 2,299,237 | 2,174,898 | 24,985,880 | 24,821,169 |
| Shares redeemed | (44,350,042) | (65,039,984) | (480,847,906) | (741,677,275) |
| Net increase (decrease) | (29,052,293) | (43,557,138) | $(315,431,182) | $(496,185,867) |
| Class I | | | | |
| Shares sold | 15,881,555 | 21,848,304 | $172,467,301 | $249,055,401 |
| Reinvestment of distributions | 1,063,942 | 914,162 | 11,563,285 | 10,418,013 |
| Shares redeemed | (31,820,863) | (36,186,716) | (345,211,280) | (410,046,502) |
| Net increase (decrease) | (14,875,366) | (13,424,250) | $(161,180,694) | $(150,573,088) |
| Class Z | | | | |
| Shares sold | 6,826,373 | 10,815,385 | $74,027,476 | $122,909,944 |
| Reinvestment of distributions | 295,698 | 249,958 | 3,212,873 | 2,847,181 |
| Shares redeemed | (12,467,552) | (16,745,070) | (134,663,090) | (189,617,417) |
| Net increase (decrease) | (5,345,481) | (5,679,727) | $(57,422,741) | $(63,860,292) |
12. Other.
A fund's organizational documents provide former and current trustees and officers with a limited indemnification against liabilities arising in connection with the performance of their duties to the fund. In the normal course of business, a fund may also enter into contracts that provide general indemnifications. A fund's maximum exposure under these arrangements is unknown as this would be dependent on future claims that may be made against a fund. The risk of material loss from such claims is considered remote.
13. Credit Risk.
The Fund invests a significant portion of its assets in structured securities of issuers backed by commercial and residential mortgage loans, credit card receivables and automotive loans. The value and related income of these securities is sensitive to changes in economic conditions, including delinquencies and/or defaults.
14. Risk and Uncertainties.
Many factors affect a fund's performance. Developments that disrupt global economies and financial markets, such as pandemics, epidemics, outbreaks of infectious diseases, war, terrorism, and environmental disasters, may significantly affect a fund's investment performance. The effects of these developments to a fund will be impacted by the types of securities in which a fund invests, the financial condition, industry, economic sector, and geographic location of an issuer, and a fund's level of investment in the securities of that issuer. Significant concentrations in security types, issuers, industries, sectors, and geographic locations may magnify the factors that affect a fund's performance.
To the Board of Trustees of Fidelity Advisor Series II and Shareholders of Fidelity Advisor Limited Term Bond Fund
Opinion on the Financial Statements
We have audited the accompanying statement of assets and liabilities, including the schedule of investments, of Fidelity Advisor Limited Term Bond Fund (one of the funds constituting Fidelity Advisor Series II, referred to hereafter as the "Fund") as of August 31, 2023, the related statement of operations for the year ended August 31, 2023, the statement of changes in net assets for each of the two years in the period ended August 31, 2023, including the related notes, and the financial highlights for each of the periods indicated therein (collectively referred to as the "financial statements"). In our opinion, the financial statements present fairly, in all material respects, the financial position of the Fund as of August 31, 2023, the results of its operations for the year then ended, the changes in its net assets for each of the two years in the period ended August 31, 2023 and the financial highlights for each of the periods indicated therein in conformity with accounting principles generally accepted in the United States of America.
Basis for Opinion
These financial statements are the responsibility of the Fund's management. Our responsibility is to express an opinion on the Fund's financial statements based on our audits. We are a public accounting firm registered with the Public Company Accounting Oversight Board (United States) (PCAOB) and are required to be independent with respect to the Fund in accordance with the U.S. federal securities laws and the applicable rules and regulations of the Securities and Exchange Commission and the PCAOB.
We conducted our audits of these financial statements in accordance with the standards of the PCAOB. Those standards require that we plan and perform the audit to obtain reasonable assurance about whether the financial statements are free of material misstatement, whether due to error or fraud.
Our audits included performing procedures to assess the risks of material misstatement of the financial statements, whether due to error or fraud, and performing procedures that respond to those risks. Such procedures included examining, on a test basis, evidence regarding the amounts and disclosures in the financial statements. Our audits also included evaluating the accounting principles used and significant estimates made by management, as well as evaluating the overall presentation of the financial statements. Our procedures included confirmation of securities owned as of August 31, 2023 by correspondence with the custodian and brokers; when replies were not received from brokers, we performed other auditing procedures. We believe that our audits provide a reasonable basis for our opinion.
/s/ PricewaterhouseCoopers LLP
Boston, Massachusetts
October 13, 2023
We have served as the auditor of one or more investment companies in the Fidelity group of funds since 1932.
The Trustees, Members of the Advisory Board (if any), and officers of the trust and fund, as applicable, are listed below. The Board of Trustees governs the fund and is responsible for protecting the interests of shareholders. The Trustees are experienced executives who meet periodically throughout the year to oversee the fund's activities, review contractual arrangements with companies that provide services to the fund, oversee management of the risks associated with such activities and contractual arrangements, and review the fund's performance. As of August 31, 2023, except for Laura M. Bishop, Robert W. Helm, Christine J. Thompson, and Carol J. Zierhoffer each of the Trustees oversees 313 funds. As of October 18, 2023, the date of their election as Trustee, Ms. Bishop, Mr. Helm, Ms. Thompson, and Ms. Zierhoffer each oversees 229 funds.
The Trustees hold office without limit in time except that (a) any Trustee may resign; (b) any Trustee may be removed by written instrument, signed by at least two-thirds of the number of Trustees prior to such removal; (c) any Trustee who requests to be retired or who has become incapacitated by illness or injury may be retired by written instrument signed by a majority of the other Trustees; and (d) any Trustee may be removed at any special meeting of shareholders by a two-thirds vote of the outstanding voting securities of the trust. Each Trustee who is not an interested person (as defined in the 1940 Act) of the trust and the fund is referred to herein as an Independent Trustee. Each Independent Trustee shall retire not later than the last day of the calendar year in which his or her 75th birthday occurs. The Independent Trustees may waive this mandatory retirement age policy with respect to individual Trustees. Officers and Advisory Board Members hold office without limit in time, except that any officer or Advisory Board Member may resign or may be removed by a vote of a majority of the Trustees at any regular meeting or any special meeting of the Trustees. Except as indicated, each individual has held the office shown or other offices in the same company for the past five years.
The fund's Statement of Additional Information (SAI) includes more information about the Trustees. To request a free copy, call Fidelity at 1-800-544-8544 if you're an individual investing directly with Fidelity, call 1-800-835-5092 if you're a plan sponsor or participant with Fidelity as your recordkeeper or call 1-877-208-0098 on institutional accounts or if you're an advisor or invest through one.
Experience, Skills, Attributes, and Qualifications of the Trustees. The Governance and Nominating Committee has adopted a statement of policy that describes the experience, qualifications, attributes, and skills that are necessary and desirable for potential Independent Trustee candidates (Statement of Policy). The Board believes that each Trustee satisfied at the time he or she was initially elected or appointed a Trustee, and continues to satisfy, the standards contemplated by the Statement of Policy. The Governance and Nominating Committee also engages professional search firms to help identify potential Independent Trustee candidates who have the experience, qualifications, attributes, and skills consistent with the Statement of Policy. From time to time, additional criteria based on the composition and skills of the current Independent Trustees, as well as experience or skills that may be appropriate in light of future changes to board composition, business conditions, and regulatory or other developments, have also been considered by the professional search firms and the Governance and Nominating Committee. In addition, the Board takes into account the Trustees' commitment and participation in Board and committee meetings, as well as their leadership of standing and ad hoc committees throughout their tenure.
In determining that a particular Trustee was and continues to be qualified to serve as a Trustee, the Board has considered a variety of criteria, none of which, in isolation, was controlling. The Board believes that, collectively, the Trustees have balanced and diverse experience, qualifications, attributes, and skills, which allow the Board to operate effectively in governing the fund and protecting the interests of shareholders. Information about the specific experience, skills, attributes, and qualifications of each Trustee, which in each case led to the Board's conclusion that the Trustee should serve (or continue to serve) as a trustee of the fund, is provided below.
Board Structure and Oversight Function. Abigail P. Johnson is an interested person and currently serves as Chairman. The Trustees have determined that an interested Chairman is appropriate and benefits shareholders because an interested Chairman has a personal and professional stake in the quality and continuity of services provided to the fund. Independent Trustees exercise their informed business judgment to appoint an individual of their choosing to serve as Chairman, regardless of whether the Trustee happens to be independent or a member of management. The Independent Trustees have determined that they can act independently and effectively without having an Independent Trustee serve as Chairman and that a key structural component for assuring that they are in a position to do so is for the Independent Trustees to constitute a substantial majority for the Board. The Independent Trustees also regularly meet in executive session. Michael E. Kenneally serves as Chairman of the Independent Trustees and as such (i) acts as a liaison between the Independent Trustees and management with respect to matters important to the Independent Trustees and (ii) with management prepares agendas for Board meetings.
Fidelity® funds are overseen by different Boards of Trustees. The fund's Board oversees Fidelity's investment-grade bond, money market, asset allocation and certain equity funds, and other Boards oversee Fidelity's alternative investment, high income and other equity funds. The asset allocation funds may invest in Fidelity® funds that are overseen by such other Boards. The use of separate Boards, each with its own committee structure, allows the Trustees of each group of Fidelity® funds to focus on the unique issues of the funds they oversee, including common research, investment, and operational issues. On occasion, the separate Boards establish joint committees to address issues of overlapping consequences for the Fidelity® funds overseen by each Board.
The Trustees operate using a system of committees to facilitate the timely and efficient consideration of all matters of importance to the Trustees, the fund, and fund shareholders and to facilitate compliance with legal and regulatory requirements and oversight of the fund's activities and associated risks. The Board, acting through its committees, has charged FMR and its affiliates with (i) identifying events or circumstances the occurrence of which could have demonstrably adverse effects on the fund's business and/or reputation; (ii) implementing processes and controls to lessen the possibility that such events or circumstances occur or to mitigate the effects of such events or circumstances if they do occur; and (iii) creating and maintaining a system designed to evaluate continuously business and market conditions in order to facilitate the identification and implementation processes described in (i) and (ii) above. Because the day-to-day operations and activities of the fund are carried out by or through FMR, its affiliates, and other service providers, the fund's exposure to risks is mitigated but not eliminated by the processes overseen by the Trustees. While each of the Board's committees has responsibility for overseeing different aspects of the fund's activities, oversight is exercised primarily through the Operations and Audit Committees. In addition, an ad hoc Board committee of Independent Trustees has worked with FMR to enhance the Board's oversight of investment and financial risks, legal and regulatory risks, technology risks, and operational risks, including the development of additional risk reporting to the Board. Appropriate personnel, including but not limited to the fund's Chief Compliance Officer (CCO), FMR's internal auditor, the independent accountants, the fund's Treasurer and portfolio management personnel, make periodic reports to the Board's committees, as appropriate, including an annual review of Fidelity's risk management program for the Fidelity® funds. The responsibilities of each standing committee, including their oversight responsibilities, are described further under "Standing Committees of the Trustees."
Interested Trustees*:
Correspondence intended for a Trustee who is an interested person may be sent to Fidelity Investments, 245 Summer Street, Boston, Massachusetts 02210.
Name, Year of Birth; Principal Occupations and Other Relevant Experience+
Abigail P. Johnson (1961)
Year of Election or Appointment: 2009
Trustee
Chairman of the Board of Trustees
Ms. Johnson also serves as Trustee of other Fidelity® funds. Ms. Johnson serves as Chairman (2016-present), Chief Executive Officer (2014-present), and Director (2007-present) of FMR LLC (diversified financial services company), President of Fidelity Financial Services (2012-present) and President of Personal, Workplace and Institutional Services (2005-present). Ms. Johnson is Chairman and Director of Fidelity Management & Research Company LLC (investment adviser firm, 2011-present). Previously, Ms. Johnson served as Chairman and Director of FMR Co., Inc. (investment adviser firm, 2011-2019), Vice Chairman (2007-2016) and President (2013-2016) of FMR LLC, President and a Director of Fidelity Management & Research Company (2001-2005), a Trustee of other investment companies advised by Fidelity Management & Research Company, Fidelity Investments Money Management, Inc. (investment adviser firm), and FMR Co., Inc. (2001-2005), Senior Vice President of the Fidelity® funds (2001-2005), and managed a number of Fidelity® funds. Ms. Abigail P. Johnson and Mr. Arthur E. Johnson are not related.
Jennifer Toolin McAuliffe (1959)
Year of Election or Appointment: 2016
Trustee
Ms. McAuliffe also serves as Trustee of other Fidelity® funds and as Trustee of Fidelity Charitable (2020-present). Previously, Ms. McAuliffe served as Co-Head of Fixed Income of Fidelity Investments Limited (now known as FIL Limited (FIL)) (diversified financial services company), Director of Research for FIL's credit and quantitative teams in London, Hong Kong and Tokyo and Director of Research for taxable and municipal bonds at Fidelity Investments Money Management, Inc. Ms. McAuliffe previously served as a member of the Advisory Board of certain Fidelity® funds (2016). Ms. McAuliffe was previously a lawyer at Ropes & Gray LLP and an international banker at Chemical Bank NA (now JPMorgan Chase & Co.). Ms. McAuliffe also currently serves as director or trustee of several not-for-profit entities.
Christine J. Thompson (1958)
Year of Election or Appointment: 2023
Trustee
Ms. Thompson also serves as a Trustee of other Fidelity® funds. Ms. Thompson serves as Leader of Advanced Technologies for Investment Management at Fidelity Investments (2018-present). Previously, Ms. Thompson served as Chief Investment Officer in the Bond group at Fidelity Management & Research Company (2010-2018) and held various other roles including Director of municipal bond portfolio managers and Portfolio Manager of certain Fidelity® funds.
* Determined to be an "Interested Trustee" by virtue of, among other things, his or her affiliation with the trust or various entities under common control with FMR.
+ The information includes the Trustee's principal occupation during the last five years and other information relating to the experience, attributes, and skills relevant to the Trustee's qualifications to serve as a Trustee, which led to the conclusion that the Trustee should serve as a Trustee for the fund.
Independent Trustees:
Correspondence intended for an Independent Trustee may be sent to Fidelity Investments, P.O. Box 55235, Boston, Massachusetts 02205-5235.
Name, Year of Birth; Principal Occupations and Other Relevant Experience+
Elizabeth S. Acton (1951)
Year of Election or Appointment: 2016
Trustee
Ms. Acton also serves as Trustee of other Fidelity® funds. Prior to her retirement, Ms. Acton served as Executive Vice President, Finance (2011-2012), Executive Vice President, Chief Financial Officer (2002-2011) and Treasurer (2004-2005) of Comerica Incorporated (financial services). Prior to joining Comerica, Ms. Acton held a variety of positions at Ford Motor Company (1983-2002), including Vice President and Treasurer (2000-2002) and Executive Vice President and Chief Financial Officer of Ford Motor Credit Company (1998-2000). Ms. Acton currently serves as a member of the Board and Audit and Finance Committees of Beazer Homes USA, Inc. (homebuilding, 2012-present). Ms. Acton previously served as a member of the Advisory Board of certain Fidelity® funds (2013-2016).
Laura M. Bishop (1961)
Year of Election or Appointment: 2023
Trustee
Ms. Bishop also serves as Trustee or Member of the Advisory Board of other Fidelity® funds. Prior to her retirement, Ms. Bishop held a variety of positions at United Services Automobile Association (2001-2020), including Executive Vice President and Chief Financial Officer (2014-2020) and Senior Vice President and Deputy Chief Financial Officer (2012-2014). Ms. Bishop currently serves as a member of the Audit Committee and Compensation and Personnel Committee (2021-present) of the Board of Directors of Korn Ferry (global organizational consulting). Previously, Ms. Bishop served as a Member of the Advisory Board of certain Fidelity® funds (2022-2023).
Ann E. Dunwoody (1953)
Year of Election or Appointment: 2018
Trustee
General Dunwoody also serves as Trustee of other Fidelity® funds. General Dunwoody (United States Army, Retired) was the first woman in U.S. military history to achieve the rank of four-star general and prior to her retirement in 2012 held a variety of positions within the U.S. Army, including Commanding General, U.S. Army Material Command (2008-2012). General Dunwoody currently serves as a member of the Board, Chair of Nomination Committee and a member of the Corporate Governance Committee of Kforce Inc. (professional staffing services, 2016-present) and a member of the Board of Automattic Inc. (software engineering, 2018-present). Previously, General Dunwoody served as President of First to Four LLC (leadership and mentoring services, 2012-2022), a member of the Advisory Board and Nominating and Corporate Governance Committee of L3 Technologies, Inc. (communication, electronic, sensor and aerospace systems, 2013-2019) and a member of the Board and Audit and Sustainability and Corporate Responsibility Committees of Republic Services, Inc. (waste collection, disposal and recycling, 2013-2016). General Dunwoody also serves on several boards for non-profit organizations, including as a member of the Board, Chair of the Nomination and Governance Committee and a member of the Audit Committee of the Noble Reach Foundation (formerly Logistics Management Institute) (consulting non-profit, 2012-present) and a member of the Board of ThanksUSA (military family education non-profit, 2014-present). Previously, General Dunwoody served as a member of the Board of Florida Institute of Technology (2015-2022) and a member of the Council of Trustees for the Association of the United States Army (advocacy non-profit, 2013-2021). General Dunwoody previously served as a member of the Advisory Board of certain Fidelity® funds (2018).
John Engler (1948)
Year of Election or Appointment: 2016
Trustee
Mr. Engler also serves as Trustee of other Fidelity® funds. Previously, Mr. Engler served as Governor of Michigan (1991-2003), President of the Business Roundtable (2011-2017) and interim President of Michigan State University (2018-2019). Previously, Mr. Engler served as a member of the Board of Stride, Inc. (formerly K12 Inc.) (technology-based education company, 2012-2022), a member of the Board of Universal Forest Products (manufacturer and distributor of wood and wood-alternative products, 2003-2019) and Trustee of The Munder Funds (2003-2014). Mr. Engler previously served as a member of the Advisory Board of certain Fidelity® funds (2014-2016).
Robert F. Gartland (1951)
Year of Election or Appointment: 2010
Trustee
Mr. Gartland also serves as Trustee of other Fidelity® funds. Prior to his retirement, Mr. Gartland held a variety of positions at Morgan Stanley (financial services, 1979-2007), including Managing Director (1987-2007) and Chase Manhattan Bank (1975-1978). Mr. Gartland previously served as Chairman and an investor in Gartland & Mellina Group Corp. (consulting, 2009-2019), as a member of the Board of National Securities Clearing Corporation (1993-1996) and as Chairman of TradeWeb (2003-2004).
Robert W. Helm (1957)
Year of Election or Appointment: 2023
Trustee
Mr. Helm also serves as Trustee or Member of the Advisory Board of other Fidelity® funds. Mr. Helm was formerly Deputy Chairman (2003-2020), partner (1991-2020) and an associate (1984-1991) of Dechert LLP (formerly Dechert Price & Rhoads). Mr. Helm currently serves on boards and committees of several not-for-profit organizations, including as a Trustee and member of the Executive Committee of the Baltimore Council on Foreign Affairs, a member of the Board of Directors of the St. Vincent de Paul Society of Baltimore and a member of the Life Guard Society of Mt. Vernon. Previously, Mr. Helm served as a Member of the Advisory Board of certain Fidelity® funds (2021-2023).
Arthur E. Johnson (1947)
Year of Election or Appointment: 2008
Trustee
Mr. Johnson also serves as Trustee of other Fidelity® funds. Prior to his retirement, Mr. Johnson served as Senior Vice President of Corporate Strategic Development of Lockheed Martin Corporation (defense contractor, 1999-2009). Mr. Johnson currently serves as a member of the Board of Booz Allen Hamilton (management consulting, 2011-present). Mr. Johnson previously served as a member of the Board of Eaton Corporation plc (diversified power management, 2009-2019) and a member of the Board of AGL Resources, Inc. (holding company, 2002-2016). Mr. Johnson previously served as Chairman (2018-2021) and Vice Chairman (2015-2018) of the Independent Trustees of certain Fidelity® funds. Mr. Arthur E. Johnson is not related to Ms. Abigail P. Johnson.
Michael E. Kenneally (1954)
Year of Election or Appointment: 2009
Trustee
Chairman of the Independent Trustees
Mr. Kenneally also serves as Trustee of other Fidelity® funds and was Vice Chairman (2018-2021) of the Independent Trustees of certain Fidelity® funds. Prior to retirement in 2005, he was Chairman and Global Chief Executive Officer of Credit Suisse Asset Management, the worldwide fund management and institutional investment business of Credit Suisse Group. Previously, Mr. Kenneally was an Executive Vice President and the Chief Investment Officer for Bank of America. In this role, he was responsible for the investment management, strategy and products delivered to the bank's institutional, high-net-worth and retail clients. Earlier, Mr. Kenneally directed the organization's equity and quantitative research groups. He began his career as a research analyst and then spent more than a dozen years as a portfolio manager for endowments, pension plans and mutual funds. He earned the Chartered Financial Analyst (CFA) designation in 1991.
Mark A. Murray (1954)
Year of Election or Appointment: 2016
Trustee
Mr. Murray also serves as Trustee of other Fidelity® funds. Previously, Mr. Murray served as Co-Chief Executive Officer (2013-2016), President (2006-2013) and Vice Chairman (2013-2020) of Meijer, Inc. Mr. Murray serves as a member of the Board (2009-present) and Public Policy and Responsibility Committee (2009-present) and Chair of the Nuclear Review Committee (2019-present) of DTE Energy Company (diversified energy company). Mr. Murray previously served as a member of the Board of Spectrum Health (not-for-profit health system, 2015-2019) and as a member of the Board and Audit Committee and Chairman of the Nominating and Corporate Governance Committee of Universal Forest Products, Inc. (manufacturer and distributor of wood and wood-alternative products, 2004-2016). Mr. Murray also serves as a member of the Board of many community and professional organizations. Mr. Murray previously served as a member of the Advisory Board of certain Fidelity® funds (2016).
Carol J. Zierhoffer (1960)
Year of Election or Appointment: 2023
Trustee
Ms. Zierhoffer also serves as Trustee or Member of the Advisory Board of other Fidelity® funds. Prior to her retirement, Ms. Zierhoffer held a variety of positions at Bechtel Corporation (engineering company, 2013-2019), including Principal Vice President and Chief Information Officer (2013-2016) and Senior Vice President and Chief Information Officer (2016-2019). Ms. Zierhoffer currently serves as a member of the Board of Directors, Audit Committee and Compensation Committee of Allscripts Healthcare Solutions, Inc. (healthcare technology, 2020-present) and as a member of the Board of Directors, Audit and Finance Committee and Nominating and Governance Committee of Atlas Air Worldwide Holdings, Inc. (aviation operating services, 2021-present). Previously, Ms. Zierhoffer served as a member of the Board of Directors and Audit Committee and as the founding Chair of the Information Technology Committee of MedAssets, Inc. (healthcare technology, 2013-2016), and as a Member of the Advisory Board of certain Fidelity® funds (2023).
+ The information includes the Trustee's principal occupation during the last five years and other information relating to the experience, attributes, and skills relevant to the Trustee's qualifications to serve as a Trustee, which led to the conclusion that the Trustee should serve as a Trustee for the fund.
Advisory Board Members and Officers:
Correspondence intended for a Member of the Advisory Board (if any) may be sent to Fidelity Investments, P.O. Box 55235, Boston, Massachusetts 02205-5235. Correspondence intended for an officer may be sent to Fidelity Investments, 245 Summer Street, Boston, Massachusetts 02210. Officers appear below in alphabetical order.
Name, Year of Birth; Principal Occupation
Heather Bonner (1977)
Year of Election or Appointment: 2023
Assistant Treasurer
Ms. Bonner also serves as an officer of other funds. Ms. Bonner serves as Senior Vice President (2022-present), and is an employee of Fidelity Investments. Ms. Bonner serves as Assistant Treasurer of Fidelity CRET Trustee LLC (2022-present). Prior to joining Fidelity, Ms. Bonner served as Managing Director at AQR Capital Management (2013-2022) and was the Treasurer and Principal Financial Officer of the AQR Funds (2013-2022).
Craig S. Brown (1977)
Year of Election or Appointment: 2019
Assistant Treasurer
Mr. Brown also serves as an officer of other funds. Mr. Brown serves as Assistant Treasurer of FIMM, LLC (2021-present) and is an employee of Fidelity Investments (2013-present). Previously, Mr. Brown served as Assistant Treasurer of certain Fidelity® funds (2019-2022).
John J. Burke III (1964)
Year of Election or Appointment: 2018
Chief Financial Officer
Mr. Burke also serves as Chief Financial Officer of other funds. Mr. Burke serves as Head of Investment Operations for Fidelity Fund and Investment Operations (2018-present) and is an employee of Fidelity Investments (1998-present). Previously Mr. Burke served as head of Asset Management Investment Operations (2012-2018).
Margaret Carey (1973)
Year of Election or Appointment: 2023
Secretary and Chief Legal Officer (CLO)
Ms. Carey also serves as an officer of other funds and as CLO of certain other Fidelity entities. She is a Senior Vice President and Deputy General Counsel of FMR LLC (diversified financial services company, 2019-present), and is an employee of Fidelity Investments.
David J. Carter (1973)
Year of Election or Appointment: 2020
Assistant Secretary
Mr. Carter also serves as Assistant Secretary of other funds. Mr. Carter serves as Senior Vice President, Deputy General Counsel (2022-present) and is an employee of Fidelity Investments (2005-present).
Jonathan Davis (1968)
Year of Election or Appointment: 2010
Assistant Treasurer
Mr. Davis also serves as an officer of other funds. Mr. Davis serves as Vice President Assistant Treasurer and is an employee of Fidelity Investments. Mr. Davis serves as Assistant Treasurer of certain Fidelity entities.
Laura M. Del Prato (1964)
Year of Election or Appointment: 2018
President and Treasurer
Ms. Del Prato also serves as an officer of other funds. Ms. Del Prato serves as Assistant Treasurer of FIMM, LLC (2021-present) and is an employee of Fidelity Investments (2017-present). Previously, Ms. Del Prato served as President and Treasurer of The North Carolina Capital Management Trust: Cash Portfolio and Term Portfolio (2018-2020). Prior to joining Fidelity Investments, Ms. Del Prato served as a Managing Director and Treasurer of the JPMorgan Mutual Funds (2014-2017). Prior to JPMorgan, Ms. Del Prato served as a partner at Cohen Fund Audit Services (accounting firm, 2012-2013) and KPMG LLP (accounting firm, 2004-2012).
Robin Foley (1964)
Year of Election or Appointment: 2023
Vice President
Ms. Foley also serves as Vice President of other funds. Ms. Foley serves as Head of Fidelity's Fixed Income division (2023-present) and is an employee of Fidelity Investments. Previously, Ms. Foley served as Chief Investment Officer of Bonds (2017-2023).
Christopher M. Gouveia (1973)
Year of Election or Appointment: 2023
Chief Compliance Officer
Mr. Gouveia also serves as Chief Compliance Officer of other funds. Mr. Gouveia serves as Senior Vice President of Asset Management Compliance for Fidelity Investments and is an employee of Fidelity Investments. Previously, Mr. Gouveia served as Chief Compliance Officer of the North Carolina Capital Management Trust (2016-2019).
Colm A. Hogan (1973)
Year of Election or Appointment: 2016
Assistant Treasurer
Mr. Hogan also serves as an officer of other funds. Mr. Hogan serves as Assistant Treasurer of FIMM, LLC (2021-present) and FMR Capital, Inc. (2017-present) and is an employee of Fidelity Investments (2005-present). Previously, Mr. Hogan served as Deputy Treasurer of certain Fidelity® funds (2016-2020) and Assistant Treasurer of certain Fidelity® funds (2016-2018).
Chris Maher (1972)
Year of Election or Appointment: 2013
Assistant Treasurer
Mr. Maher also serves as an officer of other funds. Mr. Maher serves as Assistant Treasurer of FIMM, LLC (2021-present) and FMR Capital, Inc. (2017-present), and is an employee of Fidelity Investments (2008-present). Previously, Mr. Maher served as Assistant Treasurer of certain funds (2013-2020); Vice President of Asset Management Compliance (2013), Vice President of the Program Management Group of FMR (investment adviser firm, 2010-2013), and Vice President of Valuation Oversight (2008-2010).
Brett Segaloff (1972)
Year of Election or Appointment: 2021
Anti-Money Laundering (AML) Officer
Mr. Segaloff also serves as an AML Officer of other funds and other related entities. He is Director, Anti-Money Laundering (2007-present) of FMR LLC (diversified financial services company) and is an employee of Fidelity Investments (1996-present).
Stacie M. Smith (1974)
Year of Election or Appointment: 2013
Assistant Treasurer
Ms. Smith also serves as an officer of other funds. Ms. Smith serves as Assistant Treasurer of certain Fidelity entities, is an employee of Fidelity Investments, and has served in other fund officer roles.
Jim Wegmann (1979)
Year of Election or Appointment: 2021
Deputy Treasurer
Mr. Wegmann also serves as an officer of other funds. Mr. Wegmann serves as Assistant Treasurer of FIMM, LLC (2021-present) and is an employee of Fidelity Investments (2011-present). Previously, Mr. Wegmann served as Assistant Treasurer of certain Fidelity® funds (2019-2021).
As a shareholder, you incur two types of costs: (1) transaction costs, which may include sales charges (loads) on purchase payments or redemption proceeds, as applicable and (2) ongoing costs, which generally include management fees, distribution and/or service (12b-1) fees and other Fund expenses. This Example is intended to help you understand your ongoing costs (in dollars) of investing in a fund and to compare these costs with the ongoing costs of investing in other mutual funds.
| The Example is based on an investment of $1,000 invested at the beginning of the period and held for the entire period (March 1, 2023 to August 31, 2023). |
Actual Expenses
The first line of the accompanying table provides information about actual account values and actual expenses. You may use the information in this line, together with the amount you invested, to estimate the expenses that you paid over the period. Simply divide your account value by $1,000.00 (for example, an $8,600 account value divided by $1,000.00 = 8.6), then multiply the result by the number in the first line for a class/Fund under the heading entitled "Expenses Paid During Period" to estimate the expenses you paid on your account during this period. If any fund is a shareholder of any underlying mutual funds or exchange-traded funds (ETFs) (the Underlying Funds), such fund indirectly bears its proportional share of the expenses of the Underlying Funds in addition to the direct expenses incurred presented in the table. These fees and expenses are not included in the annualized expense ratio used to calculate the expense estimate in the table below.
Hypothetical Example for Comparison Purposes
The second line of the accompanying table provides information about hypothetical account values and hypothetical expenses based on the actual expense ratio and an assumed rate of return of 5% per year before expenses, which is not the actual return. The hypothetical account values and expenses may not be used to estimate the actual ending account balance or expenses you paid for the period. You may use this information to compare the ongoing costs of investing in the Fund and other funds. To do so, compare this 5% hypothetical example with the 5% hypothetical examples that appear in the shareholder reports of the other funds. If any fund is a shareholder of any Underlying Funds, such fund indirectly bears its proportional share of the expenses of the Underlying Funds in addition to the direct expenses as presented in the table. These fees and expenses are not included in the annualized expense ratio used to calculate the expense estimate in the table below.
Please note that the expenses shown in the table are meant to highlight your ongoing costs only and do not reflect any transaction costs. Therefore, the second line of the table is useful in comparing ongoing costs only, and will not help you determine the relative total costs of owning different funds. In addition, if these transactional costs were included, your costs would have been higher.
| | | | | Annualized Expense Ratio- A | | Beginning Account Value March 1, 2023 | | Ending Account Value August 31, 2023 | | Expenses Paid During Period- C March 1, 2023 to August 31, 2023 |
| Fidelity Advisor® Limited Term Bond Fund | | | | | | | | | | |
| Class A | | | | .63% | | | | | | |
| Actual | | | | | | $ 1,000 | | $ 1,021.00 | | $ 3.21 |
Hypothetical-B | | | | | | $ 1,000 | | $ 1,022.03 | | $ 3.21 |
| Class M | | | | .63% | | | | | | |
| Actual | | | | | | $ 1,000 | | $ 1,021.00 | | $ 3.21 |
Hypothetical-B | | | | | | $ 1,000 | | $ 1,022.03 | | $ 3.21 |
| Class C | | | | 1.40% | | | | | | |
| Actual | | | | | | $ 1,000 | | $ 1,016.10 | | $ 7.11 |
Hypothetical-B | | | | | | $ 1,000 | | $ 1,018.15 | | $ 7.12 |
| Fidelity® Limited Term Bond Fund | | | | .33% | | | | | | |
| Actual | | | | | | $ 1,000 | | $ 1,022.50 | | $ 1.68 |
Hypothetical-B | | | | | | $ 1,000 | | $ 1,023.54 | | $ 1.68 |
Class I ** | | | | .33% | | | | | | |
| Actual | | | | | | $ 1,000 | | $ 1,022.50 | | $ 1.68 |
Hypothetical-B | | | | | | $ 1,000 | | $ 1,023.54 | | $ 1.68 |
| Class Z | | | | .27% | | | | | | |
| Actual | | | | | | $ 1,000 | | $ 1,022.80 | | $ 1.38 |
Hypothetical-B | | | | | | $ 1,000 | | $ 1,023.84 | | $ 1.38 |
| |
A Annualized expense ratio reflects expenses net of applicable fee waivers.
B 5% return per year before expenses
C Expenses are equal to the annualized expense ratio, multiplied by the average account value over the period, multiplied by 184/ 365 (to reflect the one-half year period). The fees and expenses of any Underlying Funds are not included in each annualized expense ratio.
** If fees and changes to the expense contract and/or expense cap, effective April 1, 2023, had been in effect during the entire current period, the restated annualized expense ratio and the expenses paid in the actual and hypothetical examples above would have been as shown in table below:
| | | | | Annualized Expense Ratio- A | | Expenses Paid |
| Fidelity Advisor® Limited Term Bond Fund | | | | | | |
| Class I | | | | .30% | | |
| Actual | | | | | | $ 1.53 |
Hypothetical- B | | | | | | $ 1.53 |
| | | | | | | |
| A Annualized expense ratio reflects expenses net of applicable fee waivers. | | | | | | |
| B 5% return per year before expenses | | | | | | |
The dividend and capital gains distributions for the fund(s) are available on Fidelity.com or Institutional.Fidelity.com.
A total of 11.50% of the dividends distributed during the fiscal year was derived from interest on U.S. Government securities which is generally exempt from state income tax.
The fund designates $34,095,896 of distributions paid in the calendar year 2022 as qualifying to be taxed as interest-related dividends for nonresident alien shareholders.
The fund designates $57,642,539 of distributions paid during the fiscal year ended 2023 as qualifying to be taxed as section 163(j) interest dividends.
The fund will notify shareholders in January 2024 of amounts for use in preparing 2023 income tax returns.
Board Approval of Investment Advisory Contracts and Management Fees
Fidelity Advisor Limited Term Bond Fund
At its March 2023 meeting, the Board of Trustees, including the Independent Trustees (together, the Board), voted to approve an amended and restated management contract with Fidelity Management & Research Company LLC (FMR) for the fund (the Amended Contract) that will charge a flat management fee covering fund-level expenses of 20 basis points. As a result, the Amended Contract will decrease the management fee paid by the fund by approximately 10 basis points, effective April 1, 2023. The Board, assisted by the advice of fund counsel and Independent Trustees' counsel, considered a broad range of information.
Nature, Extent, and Quality of Services Provided. The Board previously received and considered materials relating to the nature, extent and quality of services provided by FMR to the fund, including the resources dedicated to investment management and support services, shareholder and administrative services, the benefits to shareholders of investment in a large fund family and the investment performance of the fund in connection with the annual renewal of the fund's current management contract (Current Management Contract). At its September 2022 meeting, the Board concluded that the nature, extent and quality of the services to be provided to the fund under the Current Management Contract should continue to benefit the fund's shareholders. In connection with its approval of the Amended Contract at its March 2023 meeting, the Board noted that such approval would not change the fund's portfolio managers, the investment processes, the level or nature of services provided, the resources and personnel allocated or trading and compliance operations. The Board concluded that the nature, extent, and quality of services to be provided to the fund under the Amended Contract will continue to benefit the fund's shareholders.
Competitiveness of Management Fee and Total Expense Ratio. The Board considered that it received and reviewed information regarding the fund's management fee rate and total expense ratio compared to "mapped groups" of competitive funds and classes at the current management fee and expense levels in connection with the annual renewal of the Current Management Contract. Based on its review, the Board concluded at its September 2022 meeting that the fund's current management fee and the total expense ratio of each class of the fund are fair and reasonable in light of the services that the fund and its shareholders receive and the other factors considered.
In reviewing the Amended Contract, the Board considered the fund's proposed management fee rate out of which FMR will pay all "fund-level" expenses, with certain limited exceptions, and the projected total expense ratio of each class of the fund. The Board considered that the Amended Contract will decrease the management fee paid by the fund by approximately 10 basis points, based on the average group assets for December 2022. The Board noted that the fund's proposed management fee rate is lower than the median fee rate of funds with similar Lipper investment objective categories and comparable investment mandates, regardless of whether their management fee structures are comparable. The Board also considered that the projected total net expense ratio of each class of the fund is below the median of those funds and classes used by the Board for management fee comparisons that have a similar sales load structure.
The Board also noted that, in conjunction with the approval of the lower management fee rate under the Amended Contract, FMR has contractually agreed to reimburse Class I of the fund to the extent that total operating expenses (with certain exceptions), as a percentage of its average net assets exceed 30 basis points through December 31, 2024.
Based on its review, the Board concluded that the management fee and the projected total expense ratio of each class of the fund continue to be fair and reasonable in light of the services that the fund receives and the other factors considered.
Costs of the Services and Profitability. The Board considered that it previously reviewed information regarding the revenues earned, the expenses incurred by Fidelity in providing services to the fund and the level of Fidelity's profitability. At its September 2022 meeting, the Board concluded that it was satisfied that the profitability of Fidelity in connection with the operation of the fund was not excessive. Because the Board was approving an arrangement under which the management fees were being reduced, the Board did not consider Fidelity's costs of services, revenues, or profitability to be significant factors in its decision to approve the Amended Contract.
Economies of Scale. The Board considered that it previously received and reviewed information regarding whether there have been economies of scale in respect of the management of the Fidelity funds, whether the Fidelity funds (including the fund) have appropriately benefited from any such economies of scale, and whether there is potential for realization of any further economies of scale and that it concluded, at its September 2022 meeting, that economies of scale, if any, are being appropriately shared between fund shareholders and Fidelity. In connection with the approval of the fund's Amended Contract, the Board did not consider economies of scale because the proposed fee arrangement lowers the fund's management fee and FMR will contractually limit Class I expenses. The Board will continue to review economies of scale in connection with its consideration of future renewals of the Amended Contract.
Based on its evaluation of all of the conclusions noted above, and after considering all factors it believed relevant, the Board ultimately concluded that the advisory fee structure is fair and reasonable, and that the fund's Amended Contract should be approved.
1.539398.126
LTB-ANN-1023
Fidelity Advisor® Mortgage Securities Fund
Annual Report
August 31, 2023
Includes Fidelity and Fidelity Advisor share classes
Contents
To view a fund's proxy voting guidelines and proxy voting record for the 12-month period ended June 30, visit http://www.fidelity.com/proxyvotingresults or visit the Securities and Exchange Commission's (SEC) web site at http://www.sec.gov.
You may also call 1-800-544-8544 if you're an individual investing directly with Fidelity, call 1-800-835-5092 if you're a plan sponsor or participant with Fidelity as your recordkeeper or call 1-877-208-0098 on institutional accounts or if you're an advisor or invest through one to request a free copy of the proxy voting guidelines.
Standard & Poor's, S&P and S&P 500 are registered service marks of The McGraw-Hill Companies, Inc. and have been licensed for use by Fidelity Distributors Corporation.
Other third-party marks appearing herein are the property of their respective owners.
All other marks appearing herein are registered or unregistered trademarks or service marks of FMR LLC or an affiliated company. © 2023 FMR LLC. All rights reserved.
This report and the financial statements contained herein are submitted for the general information of the shareholders of the Fund. This report is not authorized for distribution to prospective investors in the Fund unless preceded or accompanied by an effective prospectus.
A fund files its complete schedule of portfolio holdings with the SEC for the first and third quarters of each fiscal year on Form N-PORT. Forms N-PORT are available on the SEC's web site at http://www.sec.gov. A fund's Forms N-PORT may be reviewed and copied at the SEC's Public Reference Room in Washington, DC. Information regarding the operation of the SEC's Public Reference Room may be obtained by calling 1-800-SEC-0330.
For a complete list of a fund's portfolio holdings, view the most recent holdings listing, semiannual report, or annual report on Fidelity's web site at http://www.fidelity.com, http://www.institutional.fidelity.com, or http://www.401k.com, as applicable.
NOT FDIC INSURED •MAY LOSE VALUE •NO BANK GUARANTEE
Neither the Fund nor Fidelity Distributors Corporation is a bank.
Average annual total return reflects the change in the value of an investment, assuming reinvestment of distributions from dividend income and capital gains (the profits earned upon the sale of securities that have grown in value, if any) and assuming a constant rate of performance each year. The hypothetical investment and the average annual total returns do not reflect the deduction of taxes that a shareholder would pay on fund distributions or the redemption of fund shares. During periods of reimbursement by Fidelity, a fund's total return will be greater than it would be had the reimbursement not occurred. How a fund did yesterday is no guarantee of how it will do tomorrow.
| Average Annual Total Returns |
| | | | |
Periods ended August 31, 2023 | Past 1 year | Past 5 years | Past 10 years |
Class A (incl. 4.00% sales charge) | -6.76% | -1.46% | 0.31% |
Class M (incl. 4.00% sales charge) | -6.74% | -1.46% | 0.30% |
Class C (incl. contingent deferred sales charge) | -4.55% | -1.41% | 0.12% |
| Fidelity® Mortgage Securities Fund | -2.61% | -0.30% | 1.07% |
| Class I | -2.70% | -0.35% | 1.01% |
| Class Z | -2.44% | -0.19% | 1.10% |
Class C shares' contingent deferred sales charges included in the past one year, past five years and past ten years total return figures are 1%, 0% and 0%, respectively.
The initial offering of Class Z shares took place on October 2, 2018. Returns prior to October 2, 2018, are those of Class I.
| $10,000 Over 10 Years |
| |
Let's say hypothetically that $10,000 was invested in Fidelity Advisor® Mortgage Securities Fund - Class A, a class of the fund, on August 31, 2013, and the current 4.00% sales charge was paid. The chart shows how the value of your investment would have changed, and also shows how the Bloomberg U.S. MBS Index performed over the same period. |
|
|
Market Recap:
U.S. taxable investment-grade bonds returned -1.19% for the 12 months ending August 31, 2023, according to the Bloomberg U.S. Aggregate Bond Index. The first months of the period saw a continuation of the historic bond market downturn that began in early 2022, when the U.S. Federal Reserve began an aggressive series of interest rate hikes to combat persistent inflation. The actions helped push nominal and real U.S. bond yields to their highest levels in more than a decade. Bond prices, which move inversely to yields, fell sharply through October, and credit spreads widened, as investors demanded more yield for buying credit-sensitive assets. In November, the bond market staged a broad rally (+3.68%) when comments by Fed Chair Jerome Powell pointed to a slowdown in the size of future rate hikes. With the market anticipating the end of the hiking cycle by midyear, the index advanced 3.59% in the first four months of 2023, only to fall back in each of the four next months, as cooling but still-high inflation and a strong labor market suggested the Fed may need to keep raising rates for longer than anticipated. To date, the central bank has raised its benchmark rate 11 times, by a total of 5.25 percentage points. For the full 12 months, short-term bonds outperformed long-term issues, while lower-quality bonds bettered higher-quality debt, and risk assets like corporate bonds and asset-backed securities outpaced U.S. Treasuries. Meanwhile, U.S. mortgage-backed securities lagged in the rising-rate environment.
Comments from Co-Portfolio Managers Sean Corcoran and Franco Castagliuolo:
For the fiscal year, the fund's share classes (excluding sales charges, if applicable) returned roughly -4% to -2%, net of fees, versus -2.10% for the benchmark, the Bloomberg US MBS Index. In managing the fund the past 12 months, we attempted to exploit market inefficiencies and identify attractively valued securities, in accordance with our longer-term strategy. The fund's interest rate positioning detracted from performance versus the benchmark for the 12 months. Specifically, the fund had more sensitivity to interest rates, as measured by its modestly longer duration, than the benchmark this period, which hurt because interest rates rose. A modest overweight in securities backed by the Government National Mortgage Association slightly hurt the fund's relative result, given that these securities outpaced the benchmark. In contrast, the fund's performance versus the benchmark was boosted by holdings in securities made up of 15-year mortgages, an area in which we built an overweight late in the reporting period, when we identified attractively priced securities. It also helped to underweight non-agency securities, meaning those issued by private financial institutions, which lagged the benchmark this period.
The views expressed above reflect those of the portfolio manager(s) only through the end of the period as stated on the cover of this report and do not necessarily represent the views of Fidelity or any other person in the Fidelity organization. Any such views are subject to change at any time based upon market or other conditions and Fidelity disclaims any responsibility to update such views. These views may not be relied on as investment advice and, because investment decisions for a Fidelity fund are based on numerous factors, may not be relied on as an indication of trading intent on behalf of any Fidelity fund.
| Coupon Distribution (% of Fund's Investments) |
| |
| Zero coupon bonds | 0.0 | |
| 0.01 - 0.99% | 0.3 | |
| 1 - 1.99% | 5.8 | |
| 2 - 2.99% | 39.7 | |
| 3 - 3.99% | 19.6 | |
| 4 - 4.99% | 10.7 | |
| 5 - 5.99% | 12.3 | |
| 6 - 6.99% | 2.8 | |
| 7 - 7.99% | 0.7 | |
| 8 - 8.99% | 0.0 | |
| 9 - 9.99% | 0.0 | |
| Coupon distribution shows the range of stated interest rates on the fund's investments, excluding short-term investments. |
Asset Allocation (% of Fund's net assets) |
|
Short-Term Investments and Net Other Assets (Liabilities) - (31.8)% |
Futures and Swaps - 12.9% |
Percentages in the above tables are adjusted for the effect of TBA Sale Commitments. |
|
Showing Percentage of Net Assets
| U.S. Government and Government Agency Obligations - 0.9% |
| | | Principal Amount (a) (000s) | Value ($) (000s) |
| U.S. Treasury Obligations - 0.9% | | | |
| U.S. Treasury Bonds: | | | |
| 3.625% 2/15/53 | | 108 | 97 |
| 3.625% 5/15/53 | | 4,370 | 3,941 |
| U.S. Treasury Notes: | | | |
| 4% 6/30/28 | | 410 | 405 |
| 4.375% 10/31/24 | | 273 | 270 |
| | | | |
| TOTAL U.S. GOVERNMENT AND GOVERNMENT AGENCY OBLIGATIONS (Cost $4,821) | | | 4,713 |
| | | | |
| U.S. Government Agency - Mortgage Securities - 114.8% |
| | | Principal Amount (a) (000s) | Value ($) (000s) |
| Fannie Mae - 45.7% | | | |
| 12 month U.S. LIBOR + 1.440% 3.945% 4/1/37 (b)(c) | | 8 | 8 |
| 12 month U.S. LIBOR + 1.460% 3.846% 1/1/35 (b)(c) | | 7 | 7 |
| 12 month U.S. LIBOR + 1.530% 3.94% 3/1/36 (b)(c) | | 8 | 8 |
| 12 month U.S. LIBOR + 1.550% 5.803% 6/1/36 (b)(c) | | 1 | 2 |
| 12 month U.S. LIBOR + 1.630% 4.911% 11/1/36 (b)(c) | | 2 | 2 |
| 12 month U.S. LIBOR + 1.640% 5.18% 5/1/36 (b)(c) | | 3 | 3 |
| 12 month U.S. LIBOR + 1.710% 5.856% 8/1/35 (b)(c) | | 17 | 17 |
| 12 month U.S. LIBOR + 1.730% 4.021% 3/1/40 (b)(c) | | 7 | 7 |
| 12 month U.S. LIBOR + 1.750% 4.454% 7/1/35 (b)(c) | | 2 | 2 |
| 12 month U.S. LIBOR + 1.750% 4.579% 8/1/41 (b)(c) | | 8 | 8 |
| 12 month U.S. LIBOR + 1.800% 4.055% 1/1/42 (b)(c) | | 14 | 15 |
| 12 month U.S. LIBOR + 1.800% 4.505% 12/1/40 (b)(c) | | 193 | 196 |
| 12 month U.S. LIBOR + 1.810% 4.304% 2/1/42 (b)(c) | | 8 | 8 |
| REFINITIV USD IBOR CONSUMER CA + 1.740% 5.467% 5/1/36 (b)(c) | | 2 | 3 |
| U.S. TREASURY 1 YEAR INDEX + 2.200% 4.583% 3/1/35 (b)(c) | | 2 | 2 |
| U.S. TREASURY 1 YEAR INDEX + 2.270% 4.395% 6/1/36 (b)(c) | | 12 | 12 |
| U.S. TREASURY 1 YEAR INDEX + 2.280% 4.404% 10/1/33 (b)(c) | | 3 | 3 |
| 1.5% 11/1/35 to 7/1/51 (d) | | 26,030 | 20,339 |
| 2% 2/1/28 to 3/1/52 | | 67,162 | 55,721 |
| 2.5% 1/1/28 to 1/1/52 | | 67,929 | 58,294 |
| 3% 2/1/31 to 2/1/52 (e)(f) | | 37,518 | 33,252 |
| 3.5% 9/1/33 to 3/1/52 | | 9,778 | 8,936 |
| 4% 3/1/39 to 8/1/52 | | 8,680 | 8,123 |
| 4.5% 5/1/25 to 11/1/52 | | 12,405 | 11,887 |
| 5% 3/1/33 to 12/1/52 | | 14,753 | 14,405 |
| 5.279% 8/1/41 (b) | | 95 | 95 |
| 5.5% 10/1/52 to 8/1/53 | | 8,722 | 8,654 |
| 6% 11/1/52 to 6/1/53 | | 5,711 | 5,756 |
| 6.5% 12/1/23 to 5/1/38 | | 60 | 61 |
| 6.688% 2/1/39 (b) | | 40 | 40 |
| 7% to 7% 7/1/26 to 5/1/30 | | 57 | 58 |
| 7.5% to 7.5% 8/1/25 to 9/1/32 | | 71 | 74 |
| 8% 12/1/29 to 3/1/37 | | 5 | 6 |
| 9% 10/1/30 | | 17 | 18 |
TOTAL FANNIE MAE | | | 226,022 |
| Freddie Mac - 28.9% | | | |
| 12 month U.S. LIBOR + 1.500% 3.824% 3/1/36 (b)(c) | | 21 | 21 |
| 12 month U.S. LIBOR + 1.750% 4% 12/1/40 (b)(c) | | 64 | 65 |
| 12 month U.S. LIBOR + 1.750% 4% 9/1/41 (b)(c) | | 25 | 25 |
| 12 month U.S. LIBOR + 1.900% 4.936% 10/1/42 (b)(c) | | 10 | 10 |
| 12 month U.S. LIBOR + 1.960% 5.711% 6/1/33 (b)(c) | | 17 | 17 |
| 12 month U.S. LIBOR + 2.040% 6.256% 7/1/36 (b)(c) | | 11 | 11 |
| 12 month U.S. LIBOR + 2.200% 4.45% 12/1/36 (b)(c) | | 23 | 24 |
| REFINITIV USD IBOR CONSUMER CA + 2.020% 7.385% 6/1/37 (b)(c) | | 57 | 58 |
| REFINITIV USD IBOR CONSUMER CA + 2.680% 7.524% 10/1/35 (b)(c) | | 1 | 1 |
| U.S. TREASURY 1 YEAR INDEX + 2.230% 5.356% 5/1/34 (b)(c) | | 0 | 0 |
| 1.5% 7/1/35 to 6/1/51 | | 12,448 | 9,748 |
| 2% 3/1/36 to 4/1/52 | | 39,676 | 32,278 |
| 2.5% 1/1/28 to 12/1/51 | | 29,694 | 25,550 |
| 3% 12/1/30 to 3/1/52 | | 11,748 | 10,473 |
| 3.5% 3/1/32 to 4/1/52 (d)(e)(f) | | 23,584 | 21,506 |
| 4% 1/1/36 to 10/1/52 | | 15,145 | 14,240 |
| 4% 4/1/48 | | 5 | 4 |
| 4.5% 7/1/25 to 12/1/48 | | 2,877 | 2,792 |
| 5% 7/1/33 to 1/1/53 | | 7,643 | 7,465 |
| 5.5% 10/1/52 to 8/1/53 (d) | | 13,344 | 13,281 |
| 6% 3/1/24 to 7/1/53 | | 3,095 | 3,138 |
| 6.5% 1/1/24 to 1/1/53 | | 1,678 | 1,709 |
| 7% 3/1/26 to 9/1/36 | | 90 | 92 |
| 7.5% 1/1/27 to 7/1/34 | | 158 | 165 |
TOTAL FREDDIE MAC | | | 142,673 |
| Ginnie Mae - 27.0% | | | |
| 3% 6/15/42 to 4/15/45 | | 871 | 782 |
| 3.5% 9/20/40 to 7/20/46 | | 2,707 | 2,499 |
| 4% 7/20/33 to 5/20/49 | | 7,772 | 7,390 |
| 4.5% 8/15/33 to 9/20/46 | | 2,666 | 2,596 |
| 5% 5/15/39 to 4/20/48 | | 753 | 749 |
| 5.5% 12/15/38 to 9/15/39 | | 68 | 69 |
| 6.5% 10/15/34 to 7/15/36 | | 26 | 26 |
| 7% to 7% 1/15/26 to 4/20/32 | | 76 | 78 |
| 7.5% to 7.5% 10/15/23 to 12/15/29 | | 16 | 17 |
| 8% 4/15/24 to 10/15/25 | | 3 | 4 |
| 8.5% 11/15/27 to 10/15/28 | | 5 | 5 |
| 2% 11/20/50 to 4/20/51 | | 14,724 | 12,187 |
| 2% 9/1/53 (g) | | 6,750 | 5,569 |
| 2% 9/1/53 (g) | | 8,900 | 7,343 |
| 2% 9/1/53 (g) | | 950 | 784 |
| 2% 9/1/53 (g) | | 1,300 | 1,073 |
| 2% 9/1/53 (g) | | 2,100 | 1,733 |
| 2% 9/1/53 (g) | | 1,950 | 1,609 |
| 2% 10/1/53 (g) | | 700 | 578 |
| 2% 10/1/53 (g) | | 8,650 | 7,144 |
| 2.5% 6/20/51 to 12/20/51 | | 6,489 | 5,531 |
| 2.5% 9/1/53 (g) | | 4,450 | 3,788 |
| 2.5% 9/1/53 (g) | | 4,500 | 3,830 |
| 2.5% 9/1/53 (g) | | 4,600 | 3,915 |
| 2.5% 9/1/53 (g) | | 3,600 | 3,064 |
| 2.5% 9/1/53 (g) | | 2,475 | 2,107 |
| 2.5% 10/1/53 (g) | | 2,150 | 1,829 |
| 3% 9/1/53 (g) | | 7,150 | 6,287 |
| 3% 9/1/53 (g) | | 4,750 | 4,177 |
| 3% 9/1/53 (g) | | 4,850 | 4,265 |
| 3% 9/1/53 (g) | | 1,800 | 1,583 |
| 3% 9/1/53 (g) | | 250 | 220 |
| 3% 10/1/53 (g) | | 6,900 | 6,071 |
| 3.5% 9/1/53 (g) | | 2,800 | 2,542 |
| 3.5% 9/1/53 (g) | | 150 | 136 |
| 3.5% 9/1/53 (g) | | 800 | 726 |
| 3.5% 9/1/53 (g) | | 2,150 | 1,952 |
| 3.5% 9/1/53 (g) | | 1,650 | 1,498 |
| 3.5% 9/1/53 (g) | | 1,700 | 1,544 |
| 3.5% 9/1/53 (g) | | 1,700 | 1,544 |
| 3.5% 10/1/53 (g) | | 1,450 | 1,317 |
| 4% 9/1/53 (g) | | 700 | 652 |
| 4% 9/1/53 (g) | | 500 | 466 |
| 4.5% 9/1/53 (g) | | 5,100 | 4,860 |
| 4.5% 9/1/53 (g) | | 1,900 | 1,811 |
| 5% 9/1/53 (g) | | 6,150 | 5,985 |
| 5% 9/1/53 (g) | | 550 | 535 |
| 5.5% 9/1/53 (g) | | 4,500 | 4,456 |
| 5.5% 9/1/53 (g) | | 4,400 | 4,357 |
TOTAL GINNIE MAE | | | 133,283 |
| Uniform Mortgage Backed Securities - 13.2% | | | |
| 1.5% 9/1/53 (g) | | 2,650 | 1,998 |
| 1.5% 9/1/53 (g) | | 2,200 | 1,659 |
| 2% 9/1/53 (g) | | 3,850 | 3,065 |
| 2% 9/1/53 (g) | | 2,550 | 2,030 |
| 2% 9/1/53 (g) | | 6,350 | 5,055 |
| 2% 9/1/53 (g) | | 600 | 478 |
| 2% 9/1/53 (g) | | 150 | 119 |
| 2% 9/1/53 (g) | | 3,725 | 2,965 |
| 2% 9/1/53 (g) | | 2,650 | 2,110 |
| 2% 9/1/53 (g) | | 1,675 | 1,333 |
| 2% 9/1/53 (g) | | 1,250 | 995 |
| 2% 9/1/53 (g) | | 675 | 537 |
| 2% 9/1/53 (g) | | 475 | 378 |
| 2% 9/1/53 (g) | | 1,900 | 1,513 |
| 2% 9/1/53 (g) | | 3,650 | 2,906 |
| 2% 9/1/53 (g) | | 800 | 637 |
| 2% 10/1/53 (g) | | 5,900 | 4,703 |
| 2% 10/1/53 (g) | | 2,350 | 1,873 |
| 2% 10/1/53 (g) | | 2,350 | 1,873 |
| 2% 10/1/53 (g) | | 3,550 | 2,830 |
| 2.5% 9/1/53 (g) | | 2,600 | 2,155 |
| 2.5% 9/1/53 (g) | | 1,800 | 1,492 |
| 2.5% 9/1/53 (g) | | 1,050 | 870 |
| 3% 9/1/53 (g) | | 1,500 | 1,292 |
| 3% 9/1/53 (g) | | 2,975 | 2,563 |
| 3% 9/1/53 (g) | | 475 | 409 |
| 3.5% 9/1/53 (g) | | 1,300 | 1,162 |
| 4% 9/1/53 (g) | | 3,300 | 3,046 |
| 5% 9/1/38 (g) | | 1,350 | 1,333 |
| 5% 9/1/53 (g) | | 650 | 630 |
| 5% 9/1/53 (g) | | 2,500 | 2,424 |
| 5.5% 9/1/53 (g) | | 3,850 | 3,803 |
| 5.5% 9/1/53 (g) | | 1,700 | 1,679 |
| 5.5% 9/1/53 (g) | | 550 | 543 |
| 5.5% 9/1/53 (g) | | 1,900 | 1,877 |
| 5.5% 9/1/53 (g) | | 900 | 889 |
TOTAL UNIFORM MORTGAGE BACKED SECURITIES | | | 65,224 |
| TOTAL U.S. GOVERNMENT AGENCY - MORTGAGE SECURITIES (Cost $613,243) | | | 567,202 |
| | | | |
| Asset-Backed Securities - 2.9% |
| | | Principal Amount (a) (000s) | Value ($) (000s) |
| American Express Credit Account Master Trust Series 2023-1 Class A, 4.87% 5/15/28 | | 741 | 737 |
| Bank of America Credit Card Master Trust Series 2023-A1 Class A1, 4.79% 5/15/28 | | 537 | 532 |
| Capital One Multi-Asset Execution Trust Series 2023-A1 Class A, 4.42% 5/15/28 | | 1,570 | 1,542 |
| Carmax Auto Owner Trust Series 2023 2 Class A2A, 5.5% 6/15/26 | | 2,836 | 2,828 |
| CFMT LLC Series 2023 HB12 Class A, 4.25% 4/25/33 (h) | | 220 | 211 |
| Citi Mortgage Loan Trust Series 2007-1 Class 1A, CME Term SOFR 1 Month Index + 1.460% 6.7794% 10/25/37 (b)(c)(h) | | 70 | 70 |
| Discover Card Execution Note Trust Series 2023-A2 Class A, 4.93% 6/15/28 | | 1,100 | 1,094 |
| Dllaa 2023-1A Series 2023-1A: | | | |
| Class A2, 5.93% 7/20/26 (h) | | 140 | 140 |
| Class A3, 5.64% 2/22/28 (h) | | 106 | 106 |
| Ford Credit Floorplan Master Owner Trust Series 2023-1 Class A1, 4.92% 5/15/28 (h) | | 760 | 751 |
| GM Financial Automobile Leasing Series 2023-2 Class A2A, 5.44% 10/20/25 | | 154 | 154 |
| Gm Financial Consumer Automobile Re Series 2023-3 Class A3, 5.45% 6/16/28 | | 224 | 225 |
| Gm Financial Leasing Trust 202 Series 2023-3 Class A3, 5.38% 11/20/26 | | 103 | 103 |
| GSAMP Trust Series 2004-AR1 Class B4, 5.5% 6/25/34 (h) | | 11 | 8 |
| Honda Auto Receivables Series 2023-2 Class A3, 4.93% 11/15/27 | | 249 | 247 |
| Honda Auto Receivables 2023-3 Series 2023-3 Class A3, 5.41% 2/18/28 | | 600 | 601 |
| Hyundai Auto Lease Securitizat Series 2023-B Class A2A, 5.47% 9/15/25 (h) | | 362 | 361 |
| Store Master Funding Series 2021-1A Class A1, 2.12% 6/20/51 (h) | | 1,002 | 835 |
| Tesla Auto Lease Trust 23-A Series 2023-A Class A3, 5.89% 6/22/26 (h) | | 257 | 256 |
| Toyota Lease Owner Trust Series 2023 A: | | | |
| Class A2, 5.3% 8/20/25 (h) | | 335 | 333 |
| Class A3, 4.93% 4/20/26 (h) | | 279 | 276 |
| Vcat 2021-Npl5 LLC Series 2021-NPL5 Class A1, 1.8677% 8/25/51 (b)(h) | | 426 | 405 |
| Verizon Master Trust: | | | |
| Series 2021-1 Class A, 0.5% 5/20/27 | | 962 | 926 |
| Series 2023 2 Class A, 4.89% 4/13/28 | | 810 | 802 |
| World Omni Auto Receivables Trust: | | | |
| Series 2023 B: | | | |
Class A2A, 5.25% 11/16/26 | | 161 | 160 |
Class A3, 4.66% 5/15/28 | | 295 | 291 |
| Series 2023-C Class A3, 5.15% 11/15/28 | | 127 | 127 |
| World Omni Automobile Lease Series 2023-A Class A2A, 5.47% 11/17/25 | | 296 | 295 |
| TOTAL ASSET-BACKED SECURITIES (Cost $14,662) | | | 14,416 |
| | | | |
| Collateralized Mortgage Obligations - 6.2% |
| | | Principal Amount (a) (000s) | Value ($) (000s) |
| Private Sponsor - 1.2% | | | |
| Ajax Mortgage Loan Trust sequential payer: | | | |
| Series 2021-C Class A, 2.115% 1/25/61 (h) | | 246 | 230 |
| Series 2021-E Class A1, 1.74% 12/25/60 (h) | | 1,903 | 1,585 |
| Brass PLC Series 2021-10A Class A1, 0.669% 4/16/69 (b)(h) | | 147 | 141 |
| Cascade Funding Mortgage Trust Series 2021-HB5 Class A, 0.8006% 2/25/31 (h) | | 167 | 163 |
| Citigroup Mortgage Loan Trust sequential payer Series 2014-8 Class 2A1, 3.45% 6/27/37 (b)(h) | | 41 | 40 |
| CSMC: | | | |
| floater Series 2015-1R Class 6A1, 1 month U.S. LIBOR + 0.280% 4.2795% 5/27/37 (b)(c)(h) | | 140 | 134 |
| Series 2014-3R Class 2A1, 1 month U.S. LIBOR + 0.700% 0% 5/27/37 (b)(c)(h)(i) | | 72 | 0 |
| MFA Trust sequential payer Series 2022-RPL1 Class A1, 3.3% 8/25/61 (h) | | 1,047 | 946 |
| New York Mortgage Trust sequential payer Series 2021-SP1 Class A1, 1.6696% 8/25/61 (h) | | 360 | 328 |
| NYMT Loan Trust sequential payer Series 2021-CP1 Class A1, 2.0424% 7/25/61 (h) | | 1,043 | 926 |
| Oceanview Trust sequential payer Series 2021-1 Class A, 1.2187% 12/29/51 (b)(h) | | 120 | 118 |
| Ocwen Ln Investment Trust 2023-Hb1 Series 2023-HB1 Class A, 3% 6/25/36 (h) | | 97 | 92 |
| Preston Ridge Partners Mortgage Trust Series 2021-RPL1 Class A1, 1.319% 7/25/51 (h) | | 149 | 131 |
| RMF Buyout Issuance Trust: | | | |
| sequential payer Series 2021-HB1 Class A, 1.2586% 11/25/31 (h) | | 254 | 243 |
| Series 2020-HB1 Class A1, 1.7188% 10/25/50 (h) | | 385 | 354 |
| Thornburg Mortgage Securities Trust floater Series 2003-4 Class A1, CME Term SOFR 1 Month Index + 0.750% 6.0694% 9/25/43 (b)(c) | | 302 | 283 |
| Wells Fargo Mortgage Backed Securities Trust Series 2003-I Class A1, 6.0727% 9/25/33 (b) | | 33 | 32 |
TOTAL PRIVATE SPONSOR | | | 5,746 |
| U.S. Government Agency - 5.0% | | | |
| Fannie Mae: | | | |
| floater Series 2003-118 Class S, 7.980% - U.S. 30-Day Avg. Secured Overnight Fin. Rate (SOFR) Index 2.6979% 12/25/33 (b)(j)(k) | | 31 | 4 |
| planned amortization class: | | | |
Series 1999-17 Class PG, 6% 4/25/29 | | 32 | 32 |
Series 1999-32 Class PL, 6% 7/25/29 | | 39 | 39 |
Series 1999-33 Class PK, 6% 7/25/29 | | 29 | 29 |
Series 2001-52 Class YZ, 6.5% 10/25/31 | | 5 | 5 |
Series 2005-39 Class TE, 5% 5/25/35 | | 68 | 68 |
Series 2005-73 Class SA, 17.500% x U.S. 30-Day Avg. Secured Overnight Fin. Rate (SOFR) Index 3.5046% 8/25/35 (b)(c)(k) | | 2 | 2 |
Series 2012-149: | | | |
Class DA, 1.75% 1/25/43 | | 33 | 30 |
Class GA, 1.75% 6/25/42 | | 36 | 32 |
Series 2021-69 Class JK, 1.5% 10/25/51 | | 268 | 215 |
| sequential payer: | | | |
Series 2001-20 Class Z, 6% 5/25/31 | | 35 | 36 |
Series 2001-31 Class ZC, 6.5% 7/25/31 | | 14 | 14 |
Series 2002-16 Class ZD, 6.5% 4/25/32 | | 8 | 8 |
Series 2002-74 Class SV, 7.430% - U.S. 30-Day Avg. Secured Overnight Fin. Rate (SOFR) Index 2.1479% 11/25/32 (b)(j)(k) | | 8 | 0 |
Series 2012-67 Class AI, 4.5% 7/25/27 (j) | | 11 | 0 |
Series 2020-101 Class BA, 1.5% 9/25/45 | | 473 | 395 |
Series 2020-43 Class MA, 2% 1/25/45 | | 316 | 277 |
Series 2020-49 Class JA, 2% 8/25/44 | | 174 | 154 |
Series 2020-80 Class BA, 1.5% 3/25/45 | | 633 | 531 |
Series 2021-68 Class A, 2% 7/25/49 | | 343 | 275 |
Series 2021-85 Class L, 2.5% 8/25/48 | | 188 | 162 |
Series 2021-96 Class HA, 2.5% 2/25/50 | | 309 | 269 |
Series 2022-1 Class KA, 3% 5/25/48 | | 322 | 286 |
Series 2022-13 Class JA, 3% 5/25/48 | | 303 | 270 |
Series 2022-3 Class N, 2% 10/25/47 | | 2,613 | 2,184 |
Series 2022-30 Class E, 4.5% 7/25/48 | | 921 | 885 |
Series 2022-4 Class B, 2.5% 5/25/49 | | 226 | 194 |
Series 2022-49 Class TC, 4% 12/25/48 | | 298 | 284 |
Series 2022-7 Class A, 3% 5/25/48 | | 458 | 408 |
| Series 06-116 Class SG, 6.520% - U.S. 30-Day Avg. Secured Overnight Fin. Rate (SOFR) Index 1.2379% 12/25/36 (b)(j)(k) | | 19 | 2 |
| Series 07-40 Class SE, 6.320% - U.S. 30-Day Avg. Secured Overnight Fin. Rate (SOFR) Index 1.0379% 5/25/37 (b)(j)(k) | | 11 | 1 |
| Series 1993-165 Class SH, 19.800% x U.S. 30-Day Avg. Secured Overnight Fin. Rate (SOFR) Index 4.5198% 9/25/23 (b)(c)(k) | | 0 | 0 |
| Series 2003-21 Class SK, 7.980% - U.S. 30-Day Avg. Secured Overnight Fin. Rate (SOFR) Index 2.6979% 3/25/33 (b)(j)(k) | | 8 | 1 |
| Series 2005-79 Class ZC, 5.9% 9/25/35 | | 64 | 64 |
| Series 2007-57 Class SA, 40.600% x U.S. 30-Day Avg. Secured Overnight Fin. Rate (SOFR) Index 8.2076% 6/25/37 (b)(c)(k) | | 37 | 43 |
| Series 2007-66 Class SB, 38.910% x U.S. 30-Day Avg. Secured Overnight Fin. Rate (SOFR) Index 7.1876% 7/25/37 (b)(c)(k) | | 8 | 8 |
| Series 2008-12 Class SG, 6.230% - U.S. 30-Day Avg. Secured Overnight Fin. Rate (SOFR) Index 0.9479% 3/25/38 (b)(j)(k) | | 55 | 5 |
| Series 2010-135: | | | |
Class LS, 5.930% - U.S. 30-Day Avg. Secured Overnight Fin. Rate (SOFR) Index 0.6479% 12/25/40 (b)(j)(k) | | 56 | 3 |
Class ZA, 4.5% 12/25/40 | | 22 | 22 |
| Series 2010-139 Class NI, 4.5% 2/25/40 (j) | | 11 | 0 |
| Series 2010-150 Class ZC, 4.75% 1/25/41 | | 240 | 234 |
| Series 2010-95 Class ZC, 5% 9/25/40 | | 524 | 518 |
| Series 2011-4 Class PZ, 5% 2/25/41 | | 80 | 76 |
| Series 2011-67 Class AI, 4% 7/25/26 (j) | | 4 | 0 |
| Series 2012-100 Class WI, 3% 9/25/27 (j) | | 90 | 3 |
| Series 2012-14 Class JS, 6.530% - U.S. 30-Day Avg. Secured Overnight Fin. Rate (SOFR) Index 1.2479% 12/25/30 (b)(j)(k) | | 4 | 0 |
| Series 2012-9 Class SH, 6.430% - U.S. 30-Day Avg. Secured Overnight Fin. Rate (SOFR) Index 1.1479% 6/25/41 (b)(j)(k) | | 8 | 0 |
| Series 2013-133 Class IB, 3% 4/25/32 (j) | | 30 | 1 |
| Series 2013-134 Class SA, 5.930% - U.S. 30-Day Avg. Secured Overnight Fin. Rate (SOFR) Index 0.6479% 1/25/44 (b)(j)(k) | | 34 | 3 |
| Series 2013-51 Class GI, 3% 10/25/32 (j) | | 39 | 2 |
| Series 2013-N1 Class A, 6.600% - U.S. 30-Day Avg. Secured Overnight Fin. Rate (SOFR) Index 1.3179% 6/25/35 (b)(j)(k) | | 59 | 4 |
| Series 2015-42 Class IL, 6% 6/25/45 (j) | | 217 | 37 |
| Series 2015-70 Class JC, 3% 10/25/45 | | 282 | 263 |
| Series 2017-30 Class AI, 5.5% 5/25/47 (j) | | 130 | 22 |
| Series 2020-45 Class JL, 3% 7/25/40 | | 21 | 19 |
| Series 2021-59 Class H, 2% 6/25/48 | | 195 | 159 |
| Series 2021-66: | | | |
Class DA, 2% 1/25/48 | | 210 | 172 |
Class DM, 2% 1/25/48 | | 223 | 183 |
| Fannie Mae Stripped Mortgage-Backed Securities: | | | |
| Series 348 Class 14, 6.5% 8/25/34 (b)(j) | | 16 | 3 |
| Series 351: | | | |
Class 12, 5.5% 4/25/34 (b)(j) | | 10 | 2 |
Class 13, 6% 3/25/34 (j) | | 15 | 3 |
| Series 359 Class 19, 6% 7/25/35 (b)(j) | | 9 | 2 |
| Series 384 Class 6, 5% 7/25/37 (j) | | 29 | 5 |
| Freddie Mac: | | | |
| planned amortization class: | | | |
Series 2017-4676 Class VD, 4% 8/15/37 | | 43 | 43 |
Series 2017-4746 Class PA, 4% 2/15/47 | | 110 | 104 |
Series 2021-5141 Class JM, 1.5% 4/25/51 | | 196 | 157 |
Series 2021-5148: | | | |
Class AD, 1.5% 10/25/51 | | 264 | 212 |
Class PC, 1.5% 10/25/51 | | 264 | 210 |
Series 2095 Class PE, 6% 11/15/28 | | 39 | 40 |
Series 2104 Class PG, 6% 12/15/28 | | 13 | 13 |
Series 2121 Class MG, 6% 2/15/29 | | 17 | 17 |
Series 2154 Class PT, 6% 5/15/29 | | 31 | 31 |
Series 2162 Class PH, 6% 6/15/29 | | 4 | 4 |
Series 2520 Class BE, 6% 11/15/32 | | 32 | 33 |
Series 2693 Class MD, 5.5% 10/15/33 | | 459 | 457 |
Series 2802 Class OB, 6% 5/15/34 | | 56 | 57 |
Series 3002 Class NE, 5% 7/15/35 | | 43 | 42 |
Series 3189 Class PD, 6% 7/15/36 | | 39 | 40 |
Series 3415 Class PC, 5% 12/15/37 | | 15 | 15 |
Series 3806 Class UP, 4.5% 2/15/41 | | 87 | 84 |
Series 3832 Class PE, 5% 3/15/41 | | 177 | 176 |
Series 4135 Class AB, 1.75% 6/15/42 | | 27 | 24 |
| sequential payer: | | | |
Series 2015-4492 Class LB, 4% 3/15/44 | | 30 | 29 |
Series 2015-4506 Class LB, 4% 4/15/44 | | 53 | 52 |
Series 2015-4522 Class LB, 4% 6/15/44 | | 38 | 37 |
Series 2015-4535 Class LB, 4% 8/15/44 | | 38 | 38 |
Series 2016-4636 Class AE, 4% 7/15/42 | | 68 | 67 |
Series 2017-4646 Class LA, 4% 9/15/45 | | 89 | 87 |
Series 2017-4661 Class AC, 4% 4/15/43 | | 49 | 48 |
Series 2020-4993 Class LA, 2% 8/25/44 | | 303 | 268 |
Series 2020-5018: | | | |
Class LC, 3% 10/25/40 | | 138 | 125 |
Class LY, 3% 10/25/40 | | 105 | 94 |
Series 2020-5058 Class BE, 3% 11/25/50 | | 586 | 503 |
Series 2021-5175 Class CB, 2.5% 4/25/50 | | 1,106 | 947 |
Series 2021-5180 Class KA, 2.5% 10/25/47 | | 223 | 196 |
Series 2022-5189: | | | |
Class DA, 2.5% 5/25/49 | | 247 | 211 |
Class TP, 2.5% 5/25/49 | | 241 | 208 |
Series 2022-5190: | | | |
Class BA, 2.5% 11/25/47 | | 234 | 203 |
Class CA, 2.5% 5/25/49 | | 202 | 172 |
Series 2022-5191 Class CA, 2.5% 4/25/50 | | 263 | 226 |
Series 2022-5197: | | | |
Class A, 2.5% 6/25/49 | | 202 | 174 |
Class DA, 2.5% 11/25/47 | | 178 | 154 |
Series 2022-5198 Class BA, 2.5% 11/25/47 | | 871 | 762 |
Series 2022-5202: | | | |
Class AG, 3% 1/25/49 | | 153 | 136 |
Class LB, 2.5% 10/25/47 | | 190 | 164 |
Series 2022-5248 Class A, 4% 4/15/48 | | 841 | 805 |
Series 2114 Class ZM, 6% 1/15/29 | | 5 | 6 |
Series 2135 Class JE, 6% 3/15/29 | | 16 | 17 |
Series 2274 Class ZM, 6.5% 1/15/31 | | 13 | 13 |
Series 2281 Class ZB, 6% 3/15/30 | | 8 | 8 |
Series 2357 Class ZB, 6.5% 9/15/31 | | 27 | 27 |
Series 2502 Class ZC, 6% 9/15/32 | | 25 | 25 |
Series 3871 Class KB, 5.5% 6/15/41 | | 171 | 175 |
| Series 06-3115 Class SM, 6.480% - U.S. 30-Day Avg. Secured Overnight Fin. Rate (SOFR) Index 1.297% 2/15/36 (b)(j)(k) | | 15 | 1 |
| Series 1658 Class GZ, 7% 1/15/24 | | 2 | 2 |
| Series 2013-4281 Class AI, 4% 12/15/28 (j) | | 15 | 0 |
| Series 2017-4683 Class LM, 3% 5/15/47 | | 253 | 236 |
| Series 2020-5041 Class LB, 3% 11/25/40 | | 235 | 212 |
| Series 2021-5083 Class VA, 1% 8/15/38 | | 1,164 | 1,075 |
| Series 2021-5176 Class AG, 2% 1/25/47 | | 840 | 716 |
| Series 2021-5182 Class A, 2.5% 10/25/48 | | 1,446 | 1,241 |
| Series 2380 Class SY, 8.080% - U.S. 30-Day Avg. Secured Overnight Fin. Rate (SOFR) Index 2.897% 11/15/31 (b)(j)(k) | | 43 | 1 |
| Series 2587 Class IM, 6.5% 3/15/33 (j) | | 13 | 2 |
| Series 2933 Class ZM, 5.75% 2/15/35 | | 150 | 152 |
| Series 2935 Class ZK, 5.5% 2/15/35 | | 162 | 164 |
| Series 2947 Class XZ, 6% 3/15/35 | | 82 | 84 |
| Series 2996 Class ZD, 5.5% 6/15/35 | | 101 | 102 |
| Series 3237 Class C, 5.5% 11/15/36 | | 133 | 133 |
| Series 3244 Class SG, 6.540% - U.S. 30-Day Avg. Secured Overnight Fin. Rate (SOFR) Index 1.357% 11/15/36 (b)(j)(k) | | 47 | 4 |
| Series 3287 Class SD, 6.630% - U.S. 30-Day Avg. Secured Overnight Fin. Rate (SOFR) Index 1.447% 3/15/37 (b)(j)(k) | | 67 | 6 |
| Series 3297 Class BI, 6.640% - U.S. 30-Day Avg. Secured Overnight Fin. Rate (SOFR) Index 1.457% 4/15/37 (b)(j)(k) | | 93 | 10 |
| Series 3336 Class LI, 6.460% - U.S. 30-Day Avg. Secured Overnight Fin. Rate (SOFR) Index 1.277% 6/15/37 (b)(j)(k) | | 36 | 4 |
| Series 3949 Class MK, 4.5% 10/15/34 | | 30 | 30 |
| Series 4055 Class BI, 3.5% 5/15/31 (j) | | 26 | 0 |
| Series 4149 Class IO, 3% 1/15/33 (j) | | 22 | 2 |
| Series 4314 Class AI, 5% 3/15/34 (j) | | 7 | 0 |
| Series 4427 Class LI, 3.5% 2/15/34 (j) | | 102 | 6 |
| Series 4471 Class PA 4% 12/15/40 | | 139 | 134 |
| target amortization class Series 2017-4692 Class KB, 4% 10/15/46 | | 227 | 216 |
| Freddie Mac Manufactured Housing participation certificates guaranteed planned amortization class Series 2043 Class CJ, 6.5% 4/15/28 | | 15 | 15 |
| Freddie Mac Multi-family Structured pass-thru certificates: | | | |
| planned amortization class Series 20XX-5165 Class PC, 1.5% 11/25/51 | | 337 | 271 |
| sequential payer Series 2021-5159 Class GC, 2% 11/25/47 | | 179 | 153 |
| Series 4386 Class AZ, 4.5% 11/15/40 | | 372 | 357 |
| Ginnie Mae guaranteed REMIC pass-thru certificates: | | | |
| floater: | | | |
Series 2007-37 Class TS, 6.570% - CME Term SOFR 1 Month Index 1.2629% 6/16/37 (b)(j)(k) | | 23 | 2 |
Series 2010-H17 Class FA, CME Term SOFR 1 Month Index + 0.440% 5.76% 7/20/60 (b)(c)(l) | | 56 | 56 |
Series 2010-H18 Class AF, CME Term SOFR 1 Month Index + 0.410% 5.5553% 9/20/60 (b)(c)(l) | | 60 | 60 |
Series 2010-H19 Class FG, CME Term SOFR 1 Month Index + 0.410% 5.5553% 8/20/60 (b)(c)(l) | | 47 | 46 |
Series 2011-H13 Class FA, CME Term SOFR 1 Month Index + 0.610% 5.7553% 4/20/61 (b)(c)(l) | | 17 | 17 |
Series 2012-H21 Class DF, CME Term SOFR 1 Month Index + 0.760% 4.8711% 5/20/61 (b)(c)(l) | | 2 | 2 |
Series 2019-11 Class F, CME Term SOFR 1 Month Index + 0.510% 5.8285% 1/20/49 (b)(c) | | 87 | 86 |
Series 2019-128 Class FH, CME Term SOFR 1 Month Index + 0.610% 5.9285% 10/20/49 (b)(c) | | 139 | 134 |
Series 2019-23 Class NF, CME Term SOFR 1 Month Index + 0.560% 5.8785% 2/20/49 (b)(c) | | 274 | 268 |
| planned amortization class: | | | |
Series 2010-158 Class MS, 9.770% - CME Term SOFR 1 Month Index 0% 12/20/40 (b)(k) | | 198 | 155 |
Series 2011-136 Class WI, 4.5% 5/20/40 (j) | | 8 | 1 |
Series 2016-69 Class WA, 3% 2/20/46 | | 112 | 102 |
Series 2017-134 Class BA, 2.5% 11/20/46 | | 42 | 37 |
| sequential payer: | | | |
Series 2004-24 Class ZM, 5% 4/20/34 | | 67 | 65 |
Series 2010-160 Class DY, 4% 12/20/40 | | 368 | 352 |
Series 2010-170 Class B, 4% 12/20/40 | | 81 | 78 |
Series 2017-139 Class BA, 3% 9/20/47 | | 449 | 401 |
| Series 2004-32 Class GS, 6.380% - CME Term SOFR 1 Month Index 1.0729% 5/16/34 (b)(j)(k) | | 42 | 3 |
| Series 2004-73 Class AL, 7.080% - CME Term SOFR 1 Month Index 1.7729% 8/17/34 (b)(j)(k) | | 14 | 1 |
| Series 2011-52 Class HI, 7% 4/16/41 (j) | | 158 | 24 |
| Series 2012-76 Class GS, 6.580% - CME Term SOFR 1 Month Index 1.2729% 6/16/42 (b)(j)(k) | | 78 | 7 |
| Series 2013-149 Class MA, 2.5% 5/20/40 | | 258 | 245 |
| Series 2015-H13 Class HA, 2.5% 8/20/64 (l) | | 5 | 5 |
| Series 2017-H06 Class FA, U.S. TREASURY 1 YEAR INDEX + 0.350% 5.7% 8/20/66 (b)(c)(l) | | 537 | 535 |
TOTAL U.S. GOVERNMENT AGENCY | | | 24,695 |
| TOTAL COLLATERALIZED MORTGAGE OBLIGATIONS (Cost $32,066) | | | 30,441 |
| | | | |
| Commercial Mortgage Securities - 7.0% |
| | | Principal Amount (a) (000s) | Value ($) (000s) |
| BAMLL Commercial Mortgage Securities Trust: | | | |
| sequential payer Series 2019-BPR Class ANM, 3.112% 11/5/32 (h) | | 266 | 242 |
| Series 2019-BPR Class BNM, 3.465% 11/5/32 (h) | | 118 | 96 |
| BANK: | | | |
| sequential payer Series 2017-BNK9 Class A4, 3.538% 11/15/54 | | 1,013 | 931 |
| Series 2020-BN25 Class XB, 0.532% 1/15/63 (b)(j) | | 7,140 | 167 |
| Series 2021-BN33 Class XA, 1.1682% 5/15/64 (b)(j) | | 4,958 | 268 |
| BANK Trust sequential payer Series 2017-BNK5 Class A5, 3.39% 6/15/60 | | 1,519 | 1,400 |
| Benchmark Mortgage Trust Series 2019-B14 Class XA, 0.8991% 12/15/62 (b)(j) | | 13,160 | 374 |
| BFLD Trust floater sequential payer Series 2020-OBRK Class A, CME Term SOFR 1 Month Index + 2.160% 7.4745% 11/15/28 (b)(c)(h) | | 279 | 278 |
| BLOX Trust floater sequential payer Series 2021-BLOX Class A, CME Term SOFR 1 Month Index + 0.860% 6.1755% 9/15/26 (b)(c)(h) | | 772 | 738 |
| Bmo 2023-5C1 Mtg Trust sequential payer Series 2023-5C1 Class A3, 6.534% 8/15/56 | | 500 | 515 |
| BPR Trust floater Series 2022-OANA Class A, CME Term SOFR 1 Month Index + 1.890% 7.2085% 4/15/37 (b)(c)(h) | | 1,066 | 1,047 |
| BX Trust: | | | |
| floater Series 2021-BXMF Class A, CME Term SOFR 1 Month Index + 0.750% 6.0604% 10/15/26 (b)(c)(h) | | 1,000 | 977 |
| floater sequential payer Series 2019-XL Class A, CME Term SOFR 1 Month Index + 1.030% 6.345% 10/15/36 (b)(c)(h) | | 361 | 360 |
| CGDB Commercial Mortgage Trust floater Series 2019-MOB: | | | |
| Class A, CME Term SOFR 1 Month Index + 1.060% 6.375% 11/15/36 (b)(c)(h) | | 197 | 194 |
| Class B, CME Term SOFR 1 Month Index + 1.360% 6.675% 11/15/36 (b)(c)(h) | | 253 | 246 |
| Citigroup Commercial Mortgage Trust: | | | |
| sequential payer Series 2016-P4 Class A4, 2.902% 7/10/49 | | 3,644 | 3,341 |
| Series 2015-GC33 Class XA, 1.0226% 9/10/58 (b)(j) | | 7,844 | 112 |
| Series 2016-P6 Class XA, 0.6977% 12/10/49 (b)(j) | | 6,343 | 91 |
| Series 2019-GC41 Class XA, 1.1682% 8/10/56 (b)(j) | | 5,144 | 206 |
| COMM Mortgage Trust: | | | |
| Series 2014-CR20 Class XA, 1.0744% 11/10/47 (b)(j) | | 1,790 | 11 |
| Series 2014-LC17 Class XA, 0.8075% 10/10/47 (b)(j) | | 5,309 | 24 |
| Series 2014-UBS6 Class XA, 0.9784% 12/10/47 (b)(j) | | 4,296 | 29 |
| Credit Suisse Mortgage Trust Series 2018-SITE Class A, 4.284% 4/15/36 (h) | | 340 | 330 |
| Extended Stay America Trust floater Series 2021-ESH Class A, CME Term SOFR 1 Month Index + 1.190% 6.5045% 7/15/38 (b)(c)(h) | | 448 | 443 |
| Freddie Mac: | | | |
| sequential payer: | | | |
Series 2015-K049 Class A2, 3.01% 7/25/25 | | 54 | 52 |
Series 2015-K051 Class A2, 3.308% 9/25/25 | | 86 | 83 |
Series 2020-K117 Class A2, 1.406% 8/25/30 | | 900 | 720 |
Series 2021-K126 Class A2, 2.074% 1/25/31 | | 608 | 505 |
Series 2021-K127 Class A2, 2.108% 1/25/31 | | 962 | 801 |
Series 2022-150 Class A2, 3.71% 9/25/32 | | 101 | 93 |
Series 2022-K144 Class A2, 2.45% 4/25/32 | | 700 | 584 |
Series 2022-K750 Class A2, 3% 9/25/29 | | 1,500 | 1,362 |
Series 2023-154 Class A2, 4.35% 1/25/33 | | 340 | 328 |
Series 2023-155 Class A2, 4.25% 4/25/33 | | 230 | 220 |
Series 2023-158 Class A2, 4.05% 7/25/33 | | 700 | 659 |
Series 2023-K-153 Class A2, 3.82% 12/25/32 | | 410 | 380 |
Series 2023-K751 Class A2, 4.412% 3/25/30 | | 400 | 390 |
| Series 2022 K748 Class A2, 2.26% 1/25/29 | | 1,704 | 1,500 |
| Series K086 Class A2, 3.859% 11/25/28 | | 1,105 | 1,058 |
| GS Mortgage Securities Trust: | | | |
| floater: | | | |
Series 2018-3PCK Class A, CME Term SOFR 1 Month Index + 2.060% 7.3745% 9/15/31 (b)(c)(h) | | 1,808 | 1,783 |
Series 2018-HART Class A, CME Term SOFR 1 Month Index + 1.140% 6.463% 10/15/31 (b)(c)(h) | | 245 | 226 |
Series 2021-IP Class A, CME Term SOFR 1 Month Index + 1.060% 6.3755% 10/15/36 (b)(c)(h) | | 526 | 500 |
| sequential payer: | | | |
Series 2015-GC30 Class A4, 3.382% 5/10/50 | | 5,000 | 4,758 |
Series 2018-GS10 Class A5, 4.155% 7/10/51 | | 200 | 185 |
Series 2018-GS9 Class A4, 3.992% 3/10/51 | | 1,063 | 987 |
| Series 2014-GC20 Class XA, 1.167% 4/10/47 (b)(j) | | 1,491 | 2 |
| Series 2015-GC34 Class XA, 1.3558% 10/10/48 (b)(j) | | 3,788 | 75 |
| Intown Mortgage Trust floater sequential payer Series 2022-STAY Class A, CME Term SOFR 1 Month Index + 2.480% 7.7986% 8/15/39 (b)(c)(h) | | 838 | 838 |
| JPMBB Commercial Mortgage Securities Trust Series 2014-C19 Class XA, 0.7157% 4/15/47 (b)(j) | | 1,023 | 2 |
| JPMorgan Chase Commercial Mortgage Securities Trust Series 2018-WPT: | | | |
| Class AFX, 4.2475% 7/5/33 (h) | | 455 | 412 |
| Class XAFX, 1.2948% 7/5/33 (b)(h)(j) | | 3,909 | 77 |
| Merit floater Series 2021-STOR Class A, CME Term SOFR 1 Month Index + 0.810% 6.1255% 7/15/38 (b)(c)(h) | | 341 | 334 |
| Morgan Stanley BAML Trust Series 2015-C25 Class XA, 1.1795% 10/15/48 (b)(j) | | 4,514 | 62 |
| Morgan Stanley Capital I Trust: | | | |
| floater Series 2018-BOP Class A, CME Term SOFR 1 Month Index + 0.890% 6.208% 8/15/33 (b)(c)(h) | | 723 | 608 |
| sequential payer Series 2019-MEAD Class A, 3.17% 11/10/36 (h) | | 577 | 528 |
| Series 2019-MEAD Class B, 3.283% 11/10/36 (b)(h) | | 84 | 74 |
| Series 2021-L6 Class XA, 1.328% 6/15/54 (b)(j) | | 1,098 | 63 |
| Sfs Auto Receivables Securitiz sequential payer Series 2023-1A Class A2A, 5.89% 3/22/27 (h) | | 202 | 202 |
| SREIT Trust floater Series 2021-MFP: | | | |
| Class A, CME Term SOFR 1 Month Index + 0.840% 6.1558% 11/15/38 (b)(c)(h) | | 576 | 565 |
| Class B, CME Term SOFR 1 Month Index + 1.190% 6.5048% 11/15/38 (b)(c)(h) | | 330 | 324 |
| UBS Commercial Mortgage Trust Series 2017-C7 Class XA, 1.1548% 12/15/50 (b)(j) | | 5,691 | 182 |
| Wells Fargo Commercial Mortgage Trust: | | | |
| floater Series 2021-FCMT Class A, CME Term SOFR 1 Month Index + 1.310% 6.6255% 5/15/31 (b)(c)(h) | | 468 | 448 |
| Series 2015-C31 Class XA, 1.1045% 11/15/48 (b)(j) | | 3,952 | 62 |
| Series 2017-C42 Class XA, 1.0056% 12/15/50 (b)(j) | | 7,575 | 225 |
| Series 2018-C46 Class XA, 1.0822% 8/15/51 (b)(j) | | 3,883 | 94 |
| WF-RBS Commercial Mortgage Trust: | | | |
| Series 2014-C24 Class XA, 0.9821% 11/15/47 (b)(j) | | 2,955 | 18 |
| Series 2014-LC14 Class XA, 1.3973% 3/15/47 (b)(j) | | 2,486 | 1 |
| TOTAL COMMERCIAL MORTGAGE SECURITIES (Cost $36,005) | | | 34,790 |
| | | | |
| Money Market Funds - 1.9% |
| | | Shares | Value ($) (000s) |
Fidelity Cash Central Fund 5.43% (m) (Cost $9,169) | | 9,167,010 | 9,169 |
| | | | |
| TOTAL INVESTMENT IN SECURITIES - 133.7% (Cost $709,966) | 660,731 |
NET OTHER ASSETS (LIABILITIES) - (33.7)% | (166,541) |
| NET ASSETS - 100.0% | 494,190 |
| | |
| TBA Sale Commitments |
| | Principal Amount (a) (000s) | Value ($) (000s) |
| Ginnie Mae | | |
| 2% 9/1/53 | (1,900) | (1,567) |
| 2% 9/1/53 | (700) | (578) |
| 2% 9/1/53 | (8,650) | (7,136) |
| 2% 9/1/53 | (900) | (743) |
| 2.5% 9/1/53 | (2,150) | (1,830) |
| 3% 9/1/53 | (6,900) | (6,067) |
| 3.5% 9/1/53 | (1,450) | (1,317) |
| | | |
| TOTAL GINNIE MAE | | (19,238) |
| | | |
| Uniform Mortgage Backed Securities | | |
| 1.5% 9/1/53 | (1,800) | (1,357) |
| 1.5% 9/1/53 | (3,050) | (2,299) |
| 2% 9/1/53 | (200) | (159) |
| 2% 9/1/53 | (1,900) | (1,513) |
| 2% 9/1/53 | (5,900) | (4,697) |
| 2% 9/1/53 | (2,350) | (1,871) |
| 2% 9/1/53 | (2,350) | (1,871) |
| 2% 9/1/53 | (3,650) | (2,906) |
| 2% 9/1/53 | (3,550) | (2,826) |
| 2.5% 9/1/53 | (350) | (290) |
| 2.5% 9/1/53 | (600) | (497) |
| 2.5% 9/1/53 | (1,000) | (829) |
| 2.5% 9/1/53 | (500) | (414) |
| 2.5% 9/1/53 | (1,100) | (912) |
| 3% 9/1/53 | (200) | (172) |
| 4% 9/1/53 | (400) | (369) |
| 4% 9/1/53 | (200) | (185) |
| 4% 9/1/53 | (1,000) | (923) |
| 5% 9/1/38 | (450) | (444) |
| 5% 9/1/53 | (650) | (630) |
| 5% 9/1/53 | (400) | (388) |
| | | |
| TOTAL UNIFORM MORTGAGE BACKED SECURITIES | | (25,552) |
| | | |
TOTAL TBA SALE COMMITMENTS (Proceeds $44,346) | | (44,790) |
| Futures Contracts |
| | Number of contracts | Expiration Date | Notional Amount ($) (000s) | Value ($) (000s) | Unrealized Appreciation/ (Depreciation) ($) (000s) |
| Purchased | | | | | |
| | | | | | |
| Treasury Contracts | | | | | |
| CBOT 2-Year U.S. Treasury Note Contracts (United States) | 63 | Dec 2023 | 12,838 | 31 | 31 |
| | | | | | |
| Sold | | | | | |
| | | | | | |
| Treasury Contracts | | | | | |
| CBOT 10-Year U.S. Treasury Note Contracts (United States) | 375 | Dec 2023 | 41,636 | (415) | (415) |
| CBOT 5-Year U.S. Treasury Note Contracts (United States) | 200 | Dec 2023 | 21,384 | (146) | (146) |
| CBOT Long Term U.S. Treasury Bond Contracts (United States) | 27 | Dec 2023 | 3,286 | (47) | (47) |
| | | | | | |
| TOTAL SOLD | | | | | (608) |
| | | | | | |
| TOTAL FUTURES CONTRACTS | | | | | (577) |
| The notional amount of futures purchased as a percentage of Net Assets is 2.6% |
| The notional amount of futures sold as a percentage of Net Assets is 13.4% |
For the period, the average monthly notional amount at value for futures contracts in the aggregate was $111,884,232.
| Credit Default Swaps |
| Underlying Reference | Rating(1) | Maturity Date | Clearinghouse / Counterparty | Fixed Payment Received/ (Paid) | Payment Frequency | Notional Amount (000s)(2)(3) | Value ($) (000s)(1) | Upfront Premium Received/ (Paid) ($) (000s) | Unrealized Appreciation/ (Depreciation) ($) (000s) |
| Buy Protection | | | | | | | | | | |
| CMBX N.A. AAA Index Series 13 | | Dec 2072 | Citigroup Global Markets Ltd. | (0.5%) | Monthly | | 1,620 | 29 | (18) | 11 |
| CMBX N.A. AAA Index Series 13 | | Dec 2072 | Merrill Lynch Capital Services, Inc. | (0.5%) | Monthly | | 720 | 12 | (12) | 0 |
| CMBX N.A. AAA Index Series 13 | | Dec 2072 | Morgan Stanley Capital Services LLC | (0.5%) | Monthly | | 760 | 13 | (12) | 1 |
| CMBX N.A. BBB- Index Series 13 | | Dec 2072 | Goldman Sachs & Co. LLC | (3%) | Monthly | | 660 | 176 | (178) | (2) |
| CMBX N.A. BBB- Index Series 16 | | Apr 2065 | Citigroup Global Markets Ltd. | (3%) | Monthly | | 350 | 84 | (87) | (3) |
| CMBX N.A. BBB- Index Series 16 | | Apr 2065 | Citigroup Global Markets Ltd. | (3%) | Monthly | | 660 | 160 | (164) | (4) |
| CMBX N.A. BBB- Index Series 16 | | Apr 2065 | Citigroup Global Markets Ltd. | (3%) | Monthly | | 550 | 132 | (147) | (15) |
| CMBX N.A. BBB- Index Series 16 | | Apr 2065 | Citigroup Global Markets Ltd. | (3%) | Monthly | | 130 | 31 | (38) | (7) |
| CMBX N.A. BBB- Index Series 16 | | Apr 2065 | Goldman Sachs & Co. LLC | (3%) | Monthly | | 80 | 19 | (21) | (2) |
| CMBX N.A. BBB- Index Series 16 | | Apr 2065 | Goldman Sachs & Co. LLC | (3%) | Monthly | | 550 | 132 | (162) | (30) |
| CMBX N.A. BBB- Index Series 16 | | Apr 2065 | Morgan Stanley Capital Services LLC | (3%) | Monthly | | 470 | 113 | (121) | (8) |
| | | | | | | | | | | |
| TOTAL BUY PROTECTION | | | | | | | | 901 | (960) | (59) |
| Sell Protection | | | | | | | | | | |
| CMBX N.A. AAA Index Series 13 | NR | Dec 2072 | Morgan Stanley Capital Services LLC | 0.5% | Monthly | | 3,100 | (53) | 73 | 20 |
| CMBX N.A. AAA Index Series 15 | NR | Nov 2064 | Goldman Sachs & Co. LLC | 0.5% | Monthly | | 570 | (16) | 15 | (1) |
| CMBX N.A. AAA Index Series 15 | NR | Nov 2064 | Goldman Sachs & Co. LLC | 0.5% | Monthly | | 1,240 | (35) | 34 | (1) |
| | | | | | | | | | | |
| TOTAL SELL PROTECTION | | | | | | | | (104) | 122 | 18 |
| TOTAL CREDIT DEFAULT SWAPS | | | | | | | | 797 | (838) | (41) |
(1)Ratings are presented for credit default swaps in which the Fund has sold protection on the underlying referenced debt. Ratings for an underlying index represent a weighted average of the ratings of all securities included in the index. The credit rating or value can be measures of the current payment/performance risk. Ratings are from Moody's Investors Service, Inc. Where Moody's® ratings are not available, S&P® ratings are disclosed and are indicated as such. All ratings are as of the report date and do not reflect subsequent changes.
(2)The notional amount of each credit default swap where the Fund has sold protection approximates the maximum potential amount of future payments that the Fund could be required to make if a credit event were to occur.
(3)Notional amount is stated in U.S. Dollars unless otherwise noted.
| Interest Rate Swaps |
| Payment Received | Payment Frequency | Payment Paid | Payment Frequency | Clearinghouse / Counterparty(1) | Maturity Date | Notional Amount (000s)(2) | Value ($) (000s) | Upfront Premium Received/ (Paid) ($) (000s)(3) | Unrealized Appreciation/ (Depreciation) ($) (000s) |
| 3.75% | Annual | U.S. Secured Overnight Fin. Rate (SOFR) Index(4) | Annual | LCH | Sep 2028 | | 10,577 | (192) | 0 | (192) |
| 3.5% | Annual | U.S. Secured Overnight Fin. Rate (SOFR) Index(4) | Annual | LCH | Sep 2030 | | 730 | (14) | 0 | (14) |
| 3.25% | Annual | U.S. Secured Overnight Fin. Rate (SOFR) Index(4) | Annual | LCH | Sep 2053 | | 660 | (40) | 0 | (40) |
| TOTAL INTEREST RATE SWAPS | | | | | | | | (246) | 0 | (246) |
(1)Swaps with LCH Clearnet Group (LCH) are centrally cleared over-the-counter (OTC) swaps.
(2)Notional amount is stated in U.S. Dollars unless otherwise noted.
(3)Any premiums for centrally cleared over-the-counter (OTC) swaps are recorded periodically throughout the term of the swap to variation margin and included in unrealized appreciation (depreciation).
(4)Represents floating rate.
Any values shown as $0 in the Schedule of Investments may reflect amounts less than $500.
Legend
| (a) | Amount is stated in United States dollars unless otherwise noted. |
| (b) | Coupon rates for floating and adjustable rate securities reflect the rates in effect at period end. |
| (c) | Coupon is indexed to a floating interest rate which may be multiplied by a specified factor and/or subject to caps or floors. |
| (d) | Security or a portion of the security has been segregated as collateral for mortgage-backed or asset-backed securities purchased on a delayed delivery or when-issued basis. At period end, the value of securities pledged amounted to $1,292,000. |
| (e) | Security or a portion of the security was pledged to cover margin requirements for futures contracts. At period end, the value of securities pledged amounted to $1,210,000. |
| (f) | Security or a portion of the security was pledged to cover margin requirements for centrally cleared OTC swaps. At period end, the value of securities pledged amounted to $444,000. |
| (g) | Security or a portion of the security purchased on a delayed delivery or when-issued basis. |
| (h) | Security exempt from registration under Rule 144A of the Securities Act of 1933. These securities may be resold in transactions exempt from registration, normally to qualified institutional buyers. At the end of the period, the value of these securities amounted to $21,053,000 or 4.3% of net assets. |
| (j) | Interest Only (IO) security represents the right to receive only monthly interest payments on an underlying pool of mortgages or assets. Principal shown is the outstanding par amount of the pool as of the end of the period. |
| (k) | Coupon is inversely indexed to a floating interest rate multiplied by a specified factor. The price may be considerably more volatile than the price of a comparable fixed rate security. |
| (l) | Represents an investment in an underlying pool of reverse mortgages which typically do not require regular principal and interest payments as repayment is deferred until a maturity event. |
| (m) | Affiliated fund that is generally available only to investment companies and other accounts managed by Fidelity Investments. The rate quoted is the annualized seven-day yield of the fund at period end. A complete unaudited listing of the fund's holdings as of its most recent quarter end is available upon request. In addition, each Fidelity Central Fund's financial statements, which are not covered by the Fund's Report of Independent Registered Public Accounting Firm, are available on the SEC's website or upon request. |
Affiliated Central Funds
Fiscal year to date information regarding the Fund's investments in Fidelity Central Funds, including the ownership percentage, is presented below.
| Affiliate (Amounts in thousands) | Value, beginning of period ($) | Purchases ($) | Sales Proceeds ($) | Dividend Income ($) | Realized Gain (loss) ($) | Change in Unrealized appreciation (depreciation) ($) | Value, end of period ($) | % ownership, end of period |
| Fidelity Cash Central Fund 5.43% | 230,252 | 666,185 | 887,268 | 6,793 | - | - | 9,169 | 0.0% |
| Fidelity Securities Lending Cash Central Fund 5.44% | 3,840 | 74,829 | 78,669 | 8 | - | - | - | 0.0% |
| Total | 234,092 | 741,014 | 965,937 | 6,801 | - | - | 9,169 | |
| | | | | | | | | |
Amounts in the dividend income column in the above table include any capital gain distributions from underlying funds, which are presented in the corresponding line item in the Statement of Operations, if applicable.
Amounts in the dividend income column for Fidelity Securities Lending Cash Central Fund represents the income earned on investing cash collateral, less rebates paid to borrowers and any lending agent fees associated with the loan, plus any premium payments received for lending certain types of securities.
Amounts included in the purchases and sales proceeds columns may include in-kind transactions, if applicable.
Investment Valuation
The following is a summary of the inputs used, as of August 31, 2023, involving the Fund's assets and liabilities carried at fair value. The inputs or methodology used for valuing securities may not be an indication of the risk associated with investing in those securities. For more information on valuation inputs, and their aggregation into the levels used below, please refer to the Investment Valuation section in the accompanying Notes to Financial Statements.
| Valuation Inputs at Reporting Date: |
Description (Amounts in thousands) | Total ($) | Level 1 ($) | Level 2 ($) | Level 3 ($) |
Investments in Securities: | | | | |
|
| U.S. Government and Government Agency Obligations | 4,713 | - | 4,713 | - |
|
| U.S. Government Agency - Mortgage Securities | 567,202 | - | 567,202 | - |
|
| Asset-Backed Securities | 14,416 | - | 14,416 | - |
|
| Collateralized Mortgage Obligations | 30,441 | - | 30,441 | - |
|
| Commercial Mortgage Securities | 34,790 | - | 34,790 | - |
|
| Money Market Funds | 9,169 | 9,169 | - | - |
| Total Investments in Securities: | 660,731 | 9,169 | 651,562 | - |
Derivative Instruments: | | | | |
|
| Assets | | | | |
Futures Contracts | 31 | 31 | - | - |
Swaps | 901 | - | 901 | - |
| Total Assets | 932 | 31 | 901 | - |
|
| Liabilities | | | | |
Futures Contracts | (608) | (608) | - | - |
Swaps | (350) | - | (350) | - |
| Total Liabilities | (958) | (608) | (350) | - |
| Total Derivative Instruments: | (26) | (577) | 551 | - |
Other Financial Instruments: | | | | |
|
| TBA Sale Commitments | (44,790) | - | (44,790) | - |
| Total Other Financial Instruments: | (44,790) | - | (44,790) | - |
Value of Derivative Instruments
The following table is a summary of the Fund's value of derivative instruments by primary risk exposure as of August 31, 2023. For additional information on derivative instruments, please refer to the Derivative Instruments section in the accompanying Notes to Financial Statements.
Primary Risk Exposure / Derivative Type | Value |
| (Amounts in thousands) | Asset ($) | Liability ($) |
| Credit Risk | | |
Swaps (a) | 901 | (104) |
| Total Credit Risk | 901 | (104) |
| Interest Rate Risk | | |
Futures Contracts (b) | 31 | (608) |
Swaps (c) | 0 | (246) |
| Total Interest Rate Risk | 31 | (854) |
| Total Value of Derivatives | 932 | (958) |
(a)For bi-lateral over-the-counter (OTC) swaps, reflects gross value which is presented in the Statement of Assets and Liabilities in the bi-lateral OTC swaps, at value line-items.
(b)Reflects gross cumulative appreciation (depreciation) on futures contracts as presented in the Schedule of Investments. In the Statement of Assets and Liabilities, the period end daily variation margin is included in receivable or payable for daily variation margin on futures contracts, and the net cumulative appreciation (depreciation) is included in Total accumulated earnings (loss).
(c)For centrally cleared over-the-counter (OTC) swaps, reflects gross cumulative appreciation (depreciation) as presented in the Schedule of Investments. In the Statement of Assets and Liabilities, the period end daily variation margin for centrally cleared OTC swaps is included in receivable or payable for daily variation margin on centrally cleared OTC swaps, and the net cumulative appreciation (depreciation) for centrally cleared OTC swaps is included in Total accumulated earnings (loss).
| Statement of Assets and Liabilities |
| Amounts in thousands (except per-share amounts) | | | | August 31, 2023 |
| | | | | |
| Assets | | | | |
| Investment in securities, at value - See accompanying schedule: | | | | |
Unaffiliated issuers (cost $700,797) | $ | 651,562 | | |
Fidelity Central Funds (cost $9,169) | | 9,169 | | |
| | | | | |
| | | | | |
| Total Investment in Securities (cost $709,966) | | | $ | 660,731 |
| Receivable for investments sold | | | | 1 |
| Receivable for TBA sale commitments | | | | 44,346 |
| Receivable for fund shares sold | | | | 727 |
| Interest receivable | | | | 1,465 |
| Distributions receivable from Fidelity Central Funds | | | | 45 |
| Receivable for daily variation margin on centrally cleared OTC swaps | | | | 22 |
| Bi-lateral OTC swaps, at value | | | | 901 |
| Receivable from investment adviser for expense reductions | | | | 2 |
Total assets | | | | 708,240 |
| Liabilities | | | | |
| Payable for investments purchased | | | | |
Regular delivery | $ | 927 | | |
Delayed delivery | | 166,877 | | |
| TBA sale commitments, at value | | 44,790 | | |
| Payable for fund shares redeemed | | 656 | | |
| Distributions payable | | 395 | | |
| Bi-lateral OTC swaps, at value | | 104 | | |
| Accrued management fee | | 123 | | |
| Distribution and service plan fees payable | | 7 | | |
| Payable for daily variation margin on futures contracts | | 106 | | |
| Other affiliated payables | | 65 | | |
| Total Liabilities | | | | 214,050 |
| Net Assets | | | $ | 494,190 |
| Net Assets consist of: | | | | |
| Paid in capital | | | $ | 609,841 |
| Total accumulated earnings (loss) | | | | (115,651) |
| Net Assets | | | $ | 494,190 |
| | | | | |
| Net Asset Value and Maximum Offering Price | | | | |
| Class A : | | | | |
Net Asset Value and redemption price per share ($20,480 ÷ 2,129 shares)(a) | | | $ | 9.62 |
| Maximum offering price per share (100/96.00 of $9.62) | | | $ | 10.02 |
| Class M : | | | | |
Net Asset Value and redemption price per share ($7,808 ÷ 810 shares)(a) | | | $ | 9.64 |
| Maximum offering price per share (100/96.00 of $9.64) | | | $ | 10.04 |
| Class C : | | | | |
Net Asset Value and offering price per share ($1,831 ÷ 192 shares)(a) | | | $ | 9.54 |
| Fidelity Mortgage Securities Fund : | | | | |
Net Asset Value, offering price and redemption price per share ($357,995 ÷ 37,055 shares) | | | $ | 9.66 |
| Class I : | | | | |
Net Asset Value, offering price and redemption price per share ($20,030 ÷ 2,081 shares)(b) | | | $ | 9.62 |
| Class Z : | | | | |
Net Asset Value, offering price and redemption price per share ($86,046 ÷ 8,929 shares) | | | $ | 9.64 |
(a)Redemption price per share is equal to net asset value less any applicable contingent deferred sales charge. |
(b)Corresponding Net Asset Value does not calculate due to rounding of fractional net assets and/or shares. |
| Statement of Operations |
| Amounts in thousands | | | | Year ended August 31, 2023 |
| Investment Income | | | | |
| Interest | | | $ | 26,629 |
| Income from Fidelity Central Funds (including $8 from security lending) | | | | 6,801 |
| Total Income | | | | 33,430 |
| Expenses | | | | |
| Management fee | $ | 2,815 | | |
| Transfer agent fees | | 942 | | |
| Distribution and service plan fees | | 102 | | |
| Fund wide operations fee | | 493 | | |
| Independent trustees' fees and expenses | | 3 | | |
| Total expenses before reductions | | 4,355 | | |
| Expense reductions | | (57) | | |
| Total expenses after reductions | | | | 4,298 |
| Net Investment income (loss) | | | | 29,132 |
| Realized and Unrealized Gain (Loss) | | | | |
| Net realized gain (loss) on: | | | | |
| Investment Securities: | | | | |
| Unaffiliated issuers | | (43,312) | | |
| Redemptions in-kind | | (48,662) | | |
| Futures contracts | | 6,631 | | |
| Swaps | | (229) | | |
| Total net realized gain (loss) | | | | (85,572) |
| Change in net unrealized appreciation (depreciation) on: | | | | |
| Investment Securities: | | | | |
| Unaffiliated issuers | | 36,167 | | |
| Futures contracts | | (1,648) | | |
| Swaps | | (385) | | |
| TBA Sale commitments | | (2,759) | | |
| Total change in net unrealized appreciation (depreciation) | | | | 31,375 |
| Net gain (loss) | | | | (54,197) |
| Net increase (decrease) in net assets resulting from operations | | | $ | (25,065) |
| Statement of Changes in Net Assets |
| |
| Amount in thousands | | Year ended August 31, 2023 | | Year ended August 31, 2022 |
| Increase (Decrease) in Net Assets | | | | |
| Operations | | | | |
| Net investment income (loss) | $ | 29,132 | $ | 11,323 |
| Net realized gain (loss) | | (85,572) | | (25,428) |
| Change in net unrealized appreciation (depreciation) | | 31,375 | | (94,478) |
| Net increase (decrease) in net assets resulting from operations | | (25,065) | | (108,583) |
| Distributions to shareholders | | (28,042) | | (15,796) |
| | | | | |
| Share transactions - net increase (decrease) | | (453,695) | | (103,817) |
| Total increase (decrease) in net assets | | (506,802) | | (228,196) |
| | | | | |
| Net Assets | | | | |
| Beginning of period | | 1,000,992 | | 1,229,188 |
| End of period | $ | 494,190 | $ | 1,000,992 |
| | | | | |
| | | | | |
Financial Highlights
| Fidelity Advisor® Mortgage Securities Fund Class A |
| |
| Years ended August 31, | | 2023 | | 2022 | | 2021 | | 2020 | | 2019 |
Selected Per-Share Data | | | | | | | | | | |
| Net asset value, beginning of period | $ | 10.17 | $ | 11.49 | $ | 11.66 | $ | 11.37 | $ | 10.89 |
| Income from Investment Operations | | | | | | | | | | |
Net investment income (loss) A,B | | .268 | | .083 | | (.002) | | .174 | | .257 |
| Net realized and unrealized gain (loss) | | (.559) | | (1.272) | | (.029) | | .330 | | .465 |
| Total from investment operations | | (.291) | | (1.189) | | (.031) | | .504 | | .722 |
| Distributions from net investment income | | (.259) | | (.094) | | (.028) C | | (.214) | | (.242) |
| Distributions from net realized gain | | - | | (.037) | | (.111) C | | - | | - |
| Total distributions | | (.259) | | (.131) | | (.139) | | (.214) | | (.242) |
| Net asset value, end of period | $ | 9.62 | $ | 10.17 | $ | 11.49 | $ | 11.66 | $ | 11.37 |
Total Return D,E | | (2.88)% | | (10.42)% | | (.27)% | | 4.49% | | 6.73% |
Ratios to Average Net Assets B,F,G | | | | | | | | | | |
| Expenses before reductions | | .80% | | .79% | | .78% | | .79% | | .80% |
| Expenses net of fee waivers, if any | | .80% | | .79% | | .78% | | .79% | | .80% |
| Expenses net of all reductions | | .80% | | .79% | | .78% | | .79% | | .80% |
| Net investment income (loss) | | 2.73% | | .76% | | (.01)% | | 1.51% | | 2.33% |
| Supplemental Data | | | | | | | | | | |
| Net assets, end of period (in millions) | $ | 20 | $ | 27 | $ | 33 | $ | 29 | $ | 29 |
Portfolio turnover rate H | | 865% I | | 662% | | 1032% | | 741% I | | 680% I |
ACalculated based on average shares outstanding during the period.
BNet investment income (loss) is affected by the timing of the declaration of dividends by any underlying mutual funds or exchange-traded funds (ETFs). Net investment income (loss) of any mutual funds or ETFs is not included in the Fund's net investment income (loss) ratio.
CThe amount shown reflects reclassifications related to book to tax differences that were made in the year shown.
DTotal returns would have been lower if certain expenses had not been reduced during the applicable periods shown.
ETotal returns do not include the effect of the sales charges.
FFees and expenses of any underlying mutual funds or exchange-traded funds (ETFs) are not included in the Fund's expense ratio. The Fund indirectly bears its proportionate share of these expenses.
GExpense ratios reflect operating expenses of the class. Expenses before reductions do not reflect amounts reimbursed, waived, or reduced through arrangements with the investment adviser, brokerage services, or other offset arrangements, if applicable, and do not represent the amount paid by the class during periods when reimbursements, waivers or reductions occur.
HAmount does not include the portfolio activity of any underlying mutual funds or exchange-traded funds (ETFs).
IPortfolio turnover rate excludes securities received or delivered in-kind.
| Fidelity Advisor® Mortgage Securities Fund Class M |
| |
| Years ended August 31, | | 2023 | | 2022 | | 2021 | | 2020 | | 2019 |
Selected Per-Share Data | | | | | | | | | | |
| Net asset value, beginning of period | $ | 10.19 | $ | 11.52 | $ | 11.68 | $ | 11.40 | $ | 10.91 |
| Income from Investment Operations | | | | | | | | | | |
Net investment income (loss) A,B | | .270 | | .082 | | (.003) | | .173 | | .257 |
| Net realized and unrealized gain (loss) | | (.559) | | (1.281) | | (.018) | | .321 | | .475 |
| Total from investment operations | | (.289) | | (1.199) | | (.021) | | .494 | | .732 |
| Distributions from net investment income | | (.261) | | (.094) | | (.028) C | | (.214) | | (.242) |
| Distributions from net realized gain | | - | | (.037) | | (.111) C | | - | | - |
| Total distributions | | (.261) | | (.131) | | (.139) | | (.214) | | (.242) |
| Net asset value, end of period | $ | 9.64 | $ | 10.19 | $ | 11.52 | $ | 11.68 | $ | 11.40 |
Total Return D,E | | (2.85)% | | (10.48)% | | (.18)% | | 4.38% | | 6.80% |
Ratios to Average Net Assets B,F,G | | | | | | | | | | |
| Expenses before reductions | | .79% | | .79% | | .79% | | .80% | | .81% |
| Expenses net of fee waivers, if any | | .79% | | .79% | | .79% | | .80% | | .81% |
| Expenses net of all reductions | | .79% | | .79% | | .79% | | .80% | | .81% |
| Net investment income (loss) | | 2.75% | | .76% | | (.02)% | | 1.51% | | 2.33% |
| Supplemental Data | | | | | | | | | | |
| Net assets, end of period (in millions) | $ | 8 | $ | 10 | $ | 12 | $ | 14 | $ | 15 |
Portfolio turnover rate H | | 865% I | | 662% | | 1032% | | 741% I | | 680% I |
ACalculated based on average shares outstanding during the period.
BNet investment income (loss) is affected by the timing of the declaration of dividends by any underlying mutual funds or exchange-traded funds (ETFs). Net investment income (loss) of any mutual funds or ETFs is not included in the Fund's net investment income (loss) ratio.
CThe amount shown reflects reclassifications related to book to tax differences that were made in the year shown.
DTotal returns would have been lower if certain expenses had not been reduced during the applicable periods shown.
ETotal returns do not include the effect of the sales charges.
FFees and expenses of any underlying mutual funds or exchange-traded funds (ETFs) are not included in the Fund's expense ratio. The Fund indirectly bears its proportionate share of these expenses.
GExpense ratios reflect operating expenses of the class. Expenses before reductions do not reflect amounts reimbursed, waived, or reduced through arrangements with the investment adviser, brokerage services, or other offset arrangements, if applicable, and do not represent the amount paid by the class during periods when reimbursements, waivers or reductions occur.
HAmount does not include the portfolio activity of any underlying mutual funds or exchange-traded funds (ETFs).
IPortfolio turnover rate excludes securities received or delivered in-kind.
| Fidelity Advisor® Mortgage Securities Fund Class C |
| |
| Years ended August 31, | | 2023 | | 2022 | | 2021 | | 2020 | | 2019 |
Selected Per-Share Data | | | | | | | | | | |
| Net asset value, beginning of period | $ | 10.08 | $ | 11.42 | $ | 11.64 | $ | 11.36 | $ | 10.87 |
| Income from Investment Operations | | | | | | | | | | |
Net investment income (loss) A,B | | .188 | | (.005) | | (.092) | | .084 | | .177 |
| Net realized and unrealized gain (loss) | | (.549) | | (1.270) | | (.018) | | .320 | | .473 |
| Total from investment operations | | (.361) | | (1.275) | | (.110) | | .404 | | .650 |
| Distributions from net investment income | | (.179) | | (.028) | | (.007) C | | (.124) | | (.160) |
| Distributions from net realized gain | | - | | (.037) | | (.103) C | | - | | - |
| Total distributions | | (.179) | | (.065) | | (.110) | | (.124) | | (.160) |
| Net asset value, end of period | $ | 9.54 | $ | 10.08 | $ | 11.42 | $ | 11.64 | $ | 11.36 |
Total Return D,E | | (3.60)% | | (11.21)% | | (.95)% | | 3.59% | | 6.04% |
Ratios to Average Net Assets B,F,G | | | | | | | | | | |
| Expenses before reductions | | 1.60% | | 1.60% | | 1.56% | | 1.58% | | 1.54% |
| Expenses net of fee waivers, if any | | 1.60% | | 1.60% | | 1.56% | | 1.58% | | 1.54% |
| Expenses net of all reductions | | 1.60% | | 1.60% | | 1.56% | | 1.58% | | 1.54% |
| Net investment income (loss) | | 1.93% | | (.05)% | | (.80)% | | .73% | | 1.61% |
| Supplemental Data | | | | | | | | | | |
| Net assets, end of period (in millions) | $ | 2 | $ | 3 | $ | 4 | $ | 6 | $ | 5 |
Portfolio turnover rate H | | 865% I | | 662% | | 1032% | | 741% I | | 680% I |
ACalculated based on average shares outstanding during the period.
BNet investment income (loss) is affected by the timing of the declaration of dividends by any underlying mutual funds or exchange-traded funds (ETFs). Net investment income (loss) of any mutual funds or ETFs is not included in the Fund's net investment income (loss) ratio.
CThe amount shown reflects reclassifications related to book to tax differences that were made in the year shown.
DTotal returns would have been lower if certain expenses had not been reduced during the applicable periods shown.
ETotal returns do not include the effect of the contingent deferred sales charge.
FFees and expenses of any underlying mutual funds or exchange-traded funds (ETFs) are not included in the Fund's expense ratio. The Fund indirectly bears its proportionate share of these expenses.
GExpense ratios reflect operating expenses of the class. Expenses before reductions do not reflect amounts reimbursed, waived, or reduced through arrangements with the investment adviser, brokerage services, or other offset arrangements, if applicable, and do not represent the amount paid by the class during periods when reimbursements, waivers or reductions occur.
HAmount does not include the portfolio activity of any underlying mutual funds or exchange-traded funds (ETFs).
IPortfolio turnover rate excludes securities received or delivered in-kind.
| Fidelity® Mortgage Securities Fund |
| |
| Years ended August 31, | | 2023 | | 2022 | | 2021 | | 2020 | | 2019 |
Selected Per-Share Data | | | | | | | | | | |
| Net asset value, beginning of period | $ | 10.22 | $ | 11.54 | $ | 11.69 | $ | 11.40 | $ | 10.91 |
| Income from Investment Operations | | | | | | | | | | |
Net investment income (loss) A,B | | .306 | | .120 | | .037 | | .214 | | .298 |
| Net realized and unrealized gain (loss) | | (.572) | | (1.275) | | (.025) | | .331 | | .474 |
| Total from investment operations | | (.266) | | (1.155) | | .012 | | .545 | | .772 |
| Distributions from net investment income | | (.294) | | (.128) | | (.042) C | | (.255) | | (.282) |
| Distributions from net realized gain | | - | | (.037) | | (.120) C | | - | | - |
| Total distributions | | (.294) | | (.165) | | (.162) | | (.255) | | (.282) |
| Net asset value, end of period | $ | 9.66 | $ | 10.22 | $ | 11.54 | $ | 11.69 | $ | 11.40 |
Total Return D | | (2.61)% | | (10.09)% | | .10% | | 4.84% | | 7.19% |
Ratios to Average Net Assets B,E,F | | | | | | | | | | |
| Expenses before reductions | | .45% | | .45% | | .45% | | .45% | | .45% |
| Expenses net of fee waivers, if any | | .45% | | .45% | | .45% | | .45% | | .45% |
| Expenses net of all reductions | | .45% | | .45% | | .45% | | .45% | | .45% |
| Net investment income (loss) | | 3.08% | | 1.10% | | .32% | | 1.86% | | 2.69% |
| Supplemental Data | | | | | | | | | | |
| Net assets, end of period (in millions) | $ | 358 | $ | 837 | $ | 1,003 | $ | 819 | $ | 696 |
Portfolio turnover rate G | | 865% H | | 662% | | 1032% | | 741% H | | 680% H |
ACalculated based on average shares outstanding during the period.
BNet investment income (loss) is affected by the timing of the declaration of dividends by any underlying mutual funds or exchange-traded funds (ETFs). Net investment income (loss) of any mutual funds or ETFs is not included in the Fund's net investment income (loss) ratio.
CThe amount shown reflects reclassifications related to book to tax differences that were made in the year shown.
DTotal returns would have been lower if certain expenses had not been reduced during the applicable periods shown.
EFees and expenses of any underlying mutual funds or exchange-traded funds (ETFs) are not included in the Fund's expense ratio. The Fund indirectly bears its proportionate share of these expenses.
FExpense ratios reflect operating expenses of the class. Expenses before reductions do not reflect amounts reimbursed, waived, or reduced through arrangements with the investment adviser, brokerage services, or other offset arrangements, if applicable, and do not represent the amount paid by the class during periods when reimbursements, waivers or reductions occur.
GAmount does not include the portfolio activity of any underlying mutual funds or exchange-traded funds (ETFs).
HPortfolio turnover rate excludes securities received or delivered in-kind.
| Fidelity Advisor® Mortgage Securities Fund Class I |
| |
| Years ended August 31, | | 2023 | | 2022 | | 2021 | | 2020 | | 2019 |
Selected Per-Share Data | | | | | | | | | | |
| Net asset value, beginning of period | $ | 10.18 | $ | 11.50 | $ | 11.64 | $ | 11.36 | $ | 10.87 |
| Income from Investment Operations | | | | | | | | | | |
Net investment income (loss) A,B | | .297 | | .113 | | .030 | | .211 | | .292 |
| Net realized and unrealized gain (loss) | | (.570) | | (1.274) | | (.012) | | .319 | | .475 |
| Total from investment operations | | (.273) | | (1.161) | | .018 | | .530 | | .767 |
| Distributions from net investment income | | (.287) | | (.122) | | (.040) C | | (.250) | | (.277) |
| Distributions from net realized gain | | - | | (.037) | | (.118) C | | - | | - |
| Total distributions | | (.287) | | (.159) | | (.158) | | (.250) | | (.277) |
| Net asset value, end of period | $ | 9.62 | $ | 10.18 | $ | 11.50 | $ | 11.64 | $ | 11.36 |
Total Return D | | (2.70)% | | (10.17)% | | .16% | | 4.72% | | 7.17% |
Ratios to Average Net Assets B,E,F | | | | | | | | | | |
| Expenses before reductions | | .52% | | .51% | | .51% | | .49% | | .49% |
| Expenses net of fee waivers, if any | | .52% | | .51% | | .51% | | .49% | | .49% |
| Expenses net of all reductions | | .52% | | .51% | | .51% | | .48% | | .49% |
| Net investment income (loss) | | 3.01% | | 1.04% | | .26% | | 1.82% | | 2.65% |
| Supplemental Data | | | | | | | | | | |
| Net assets, end of period (in millions) | $ | 20 | $ | 38 | $ | 51 | $ | 23 | $ | 47 |
Portfolio turnover rate G | | 865% H | | 662% | | 1032% | | 741% H | | 680% H |
ACalculated based on average shares outstanding during the period.
BNet investment income (loss) is affected by the timing of the declaration of dividends by any underlying mutual funds or exchange-traded funds (ETFs). Net investment income (loss) of any mutual funds or ETFs is not included in the Fund's net investment income (loss) ratio.
CThe amount shown reflects reclassifications related to book to tax differences that were made in the year shown.
DTotal returns would have been lower if certain expenses had not been reduced during the applicable periods shown.
EFees and expenses of any underlying mutual funds or exchange-traded funds (ETFs) are not included in the Fund's expense ratio. The Fund indirectly bears its proportionate share of these expenses.
FExpense ratios reflect operating expenses of the class. Expenses before reductions do not reflect amounts reimbursed, waived, or reduced through arrangements with the investment adviser, brokerage services, or other offset arrangements, if applicable, and do not represent the amount paid by the class during periods when reimbursements, waivers or reductions occur.
GAmount does not include the portfolio activity of any underlying mutual funds or exchange-traded funds (ETFs).
HPortfolio turnover rate excludes securities received or delivered in-kind.
| Fidelity Advisor® Mortgage Securities Fund Class Z |
| |
| Years ended August 31, | | 2023 | | 2022 | | 2021 | | 2020 | | 2019 A |
Selected Per-Share Data | | | | | | | | | | |
| Net asset value, beginning of period | $ | 10.19 | $ | 11.51 | $ | 11.65 | $ | 11.37 | $ | 10.80 |
| Income from Investment Operations | | | | | | | | | | |
Net investment income (loss) B,C | | .315 | | .130 | | .047 | | .225 | | .245 |
| Net realized and unrealized gain (loss) | | (.563) | | (1.275) | | (.018) | | .319 | | .589 |
| Total from investment operations | | (.248) | | (1.145) | | .029 | | .544 | | .834 |
| Distributions from net investment income | | (.302) | | (.138) | | (.046) D | | (.264) | | (.264) |
| Distributions from net realized gain | | - | | (.037) | | (.123) D | | - | | - |
| Total distributions | | (.302) | | (.175) | | (.169) | | (.264) | | (.264) |
| Net asset value, end of period | $ | 9.64 | $ | 10.19 | $ | 11.51 | $ | 11.65 | $ | 11.37 |
Total Return E,F | | (2.44)% | | (10.03)% | | .25% | | 4.85% | | 7.82% |
Ratios to Average Net Assets C,G,H | | | | | | | | | | |
| Expenses before reductions | | .40% | | .40% | | .40% | | .40% | | .39% I |
| Expenses net of fee waivers, if any | | .36% | | .36% | | .36% | | .36% | | .36% I |
| Expenses net of all reductions | | .36% | | .36% | | .36% | | .36% | | .36% I |
| Net investment income (loss) | | 3.17% | | 1.19% | | .41% | | 1.95% | | 2.76% I |
| Supplemental Data | | | | | | | | | | |
| Net assets, end of period (in millions) | $ | 86 | $ | 86 | $ | 127 | $ | 52 | $ | 105 |
Portfolio turnover rate J | | 865% K | | 662% | | 1032% | | 741% K | | 680% K |
AFor the period October 2, 2018 (commencement of sale of shares) through August 31, 2019.
BCalculated based on average shares outstanding during the period.
CNet investment income (loss) is affected by the timing of the declaration of dividends by any underlying mutual funds or exchange-traded funds (ETFs). Net investment income (loss) of any mutual funds or ETFs is not included in the Fund's net investment income (loss) ratio.
DThe amount shown reflects reclassifications related to book to tax differences that were made in the year shown.
ETotal returns for periods of less than one year are not annualized.
FTotal returns would have been lower if certain expenses had not been reduced during the applicable periods shown.
GFees and expenses of any underlying mutual funds or exchange-traded funds (ETFs) are not included in the Fund's expense ratio. The Fund indirectly bears its proportionate share of these expenses.
HExpense ratios reflect operating expenses of the class. Expenses before reductions do not reflect amounts reimbursed, waived, or reduced through arrangements with the investment adviser, brokerage services, or other offset arrangements, if applicable, and do not represent the amount paid by the class during periods when reimbursements, waivers or reductions occur.
IAnnualized.
JAmount does not include the portfolio activity of any underlying mutual funds or exchange-traded funds (ETFs).
KPortfolio turnover rate excludes securities received or delivered in-kind.
For the period ended August 31, 2023
(Amounts in thousands except percentages)
1. Organization.
Fidelity Advisor Mortgage Securities Fund (the Fund) is a fund of Fidelity Advisor Series II (the Trust) and is authorized to issue an unlimited number of shares. The Trust is registered under the Investment Company Act of 1940, as amended (the 1940 Act), as an open-end management investment company organized as a Massachusetts business trust. The Fund offers Class A, Class M, Class C, Fidelity Mortgage Securities Fund, Class I and Class Z shares, each of which has equal rights as to assets and voting privileges. Class A, Class M, Class C, Class I and Class Z are Fidelity Advisor classes. Each class has exclusive voting rights with respect to matters that affect that class. Class C shares will automatically convert to Class A shares after a holding period of eight years from the initial date of purchase, with certain exceptions.
2. Investments in Fidelity Central Funds.
Funds may invest in Fidelity Central Funds, which are open-end investment companies generally available only to other investment companies and accounts managed by the investment adviser and its affiliates. The Schedule of Investments lists any Fidelity Central Funds held as an investment as of period end, but does not include the underlying holdings of each Fidelity Central Fund. An investing fund indirectly bears its proportionate share of the expenses of the underlying Fidelity Central Funds.
Based on its investment objective, each Fidelity Central Fund may invest or participate in various investment vehicles or strategies that are similar to those of the investing fund. These strategies are consistent with the investment objectives of the investing fund and may involve certain economic risks which may cause a decline in value of each of the Fidelity Central Funds and thus a decline in the value of the investing fund.
| Fidelity Central Fund | Investment Manager | Investment Objective | Investment Practices | Expense RatioA |
| Fidelity Money Market Central Funds | Fidelity Management & Research Company LLC (FMR) | Each fund seeks to obtain a high level of current income consistent with the preservation of capital and liquidity. | Short-term Investments | Less than .005% |
A Expenses expressed as a percentage of average net assets and are as of each underlying Central Fund's most recent annual or semi-annual shareholder report.
A complete unaudited list of holdings for each Fidelity Central Fund is available upon request or at the Securities and Exchange Commission website at www.sec.gov. In addition, the financial statements of the Fidelity Central Funds which contain the significant accounting policies (including investment valuation policies) of those funds, and are not covered by the Report of Independent Registered Public Accounting Firm, are available on the Securities and Exchange Commission website or upon request.
3. Significant Accounting Policies.
The Fund is an investment company and applies the accounting and reporting guidance of the Financial Accounting Standards Board (FASB) Accounting Standards Codification Topic 946 Financial Services - Investment Companies. The financial statements have been prepared in conformity with accounting principles generally accepted in the United States of America (GAAP), which require management to make certain estimates and assumptions at the date of the financial statements. Actual results could differ from those estimates. Subsequent events, if any, through the date that the financial statements were issued have been evaluated in the preparation of the financial statements. The Fund's Schedule of Investments lists any underlying mutual funds or exchange-traded funds (ETFs) but does not include the underlying holdings of these funds. The following summarizes the significant accounting policies of the Fund:
Investment Valuation. Investments are valued as of 4:00 p.m. Eastern time on the last calendar day of the period. The Board of Trustees (the Board) has designated the Fund's investment adviser as the valuation designee responsible for the fair valuation function and performing fair value determinations as needed. The investment adviser has established a Fair Value Committee (the Committee) to carry out the day-to-day fair valuation responsibilities and has adopted policies and procedures to govern the fair valuation process and the activities of the Committee. In accordance with these fair valuation policies and procedures, which have been approved by the Board, the Fund attempts to obtain prices from one or more third party pricing services or brokers to value its investments. When current market prices, quotations or currency exchange rates are not readily available or reliable, investments will be fair valued in good faith by the Committee, in accordance with the policies and procedures. Factors used in determining fair value vary by investment type and may include market or investment specific events, transaction data, estimated cash flows, and market observations of comparable investments. The frequency that the fair valuation procedures are used cannot be predicted and they may be utilized to a significant extent. The Committee manages the Fund's fair valuation practices and maintains the fair valuation policies and procedures. The Fund's investment adviser reports to the Board information regarding the fair valuation process and related material matters.
The Fund categorizes the inputs to valuation techniques used to value its investments into a disclosure hierarchy consisting of three levels as shown below:
Level 1 - unadjusted quoted prices in active markets for identical investments
Level 2 - other significant observable inputs (including quoted prices for similar investments, interest rates, prepayment speeds, etc.)
Level 3 - unobservable inputs (including the Fund's own assumptions based on the best information available)
Valuation techniques used to value the Fund's investments by major category are as follows:
Debt securities, including restricted securities, are valued based on evaluated prices received from third party pricing services or from brokers who make markets in such securities. U.S. government and government agency obligations are valued by pricing services who utilize matrix pricing which considers yield or price of bonds of comparable quality, coupon, maturity and type or by broker-supplied prices. Asset backed securities, collateralized mortgage obligations, commercial mortgage securities and U.S. government agency mortgage securities are valued by pricing services who utilize matrix pricing which considers prepayment speed assumptions, attributes of the collateral, yield or price of bonds of comparable quality, coupon, maturity and type or by broker-supplied prices. Brokers which make markets in asset backed securities, collateralized mortgage obligations and commercial mortgage securities may also consider such factors as the structure of the issue, cash flow assumptions, the value of underlying assets as well as any guarantees. Swaps are marked-to-market daily based on valuations from third party pricing services, registered derivatives clearing organizations (clearinghouses) or broker-supplied valuations. These pricing sources may utilize inputs such as interest rate curves, credit spread curves, default possibilities and recovery rates. When independent prices are unavailable or unreliable, debt securities and swaps may be valued utilizing pricing methodologies which consider similar factors that would be used by third party pricing services. Debt securities and swaps are generally categorized as Level 2 in the hierarchy but may be Level 3 depending on the circumstances.
Futures contracts are valued at the settlement price established each day by the board of trade or exchange on which they are traded and are categorized as Level 1 in the hierarchy. Investments in open-end mutual funds, including the Fidelity Central Funds, are valued at their closing net asset value (NAV) each business day and are categorized as Level 1 in the hierarchy.
Changes in valuation techniques may result in transfers in or out of an assigned level within the disclosure hierarchy. The aggregate value of investments by input level as of August 31, 2023 is included at the end of the Fund's Schedule of Investments.
Investment Transactions and Income. For financial reporting purposes, the Fund's investment holdings and NAV include trades executed through the end of the last business day of the period. The NAV per share for processing shareholder transactions is calculated as of the close of business of the New York Stock Exchange (NYSE), normally 4:00 p.m. Eastern time and includes trades executed through the end of the prior business day. Gains and losses on securities sold are determined on the basis of identified cost. Income and capital gain distributions from Fidelity Central Funds, if any, are recorded on the ex-dividend date. Interest income is accrued as earned and includes coupon interest and amortization of premium and accretion of discount on debt securities as applicable.
Class Allocations and Expenses. Investment income, realized and unrealized capital gains and losses, common expenses of a fund, and certain fund-level expense reductions, if any, are allocated daily on a pro-rata basis to each class based on the relative net assets of each class to the total net assets of a fund. Each class differs with respect to transfer agent and distribution and service plan fees incurred, as applicable. Certain expense reductions may also differ by class, if applicable. For the reporting period, the allocated portion of income and expenses to each class as a percent of its average net assets may vary due to the timing of recording these transactions in relation to fluctuating net assets of the classes. Expenses directly attributable to a fund are charged to that fund. Expenses attributable to more than one fund are allocated among the respective funds on the basis of relative net assets or other appropriate methods. Expenses included in the accompanying financial statements reflect the expenses of that fund and do not include any expenses associated with any underlying mutual funds or exchange-traded funds (ETFs). Although not included in a fund's expenses, a fund indirectly bears its proportionate share of these expenses through the net asset value of each underlying mutual fund or exchange-traded fund (ETF). Expense estimates are accrued in the period to which they relate and adjustments are made when actual amounts are known.
Income Tax Information and Distributions to Shareholders. Each year, the Fund intends to qualify as a regulated investment company under Subchapter M of the Internal Revenue Code, including distributing substantially all of its taxable income and realized gains. As a result, no provision for U.S. Federal income taxes is required. As of August 31, 2023, the Fund did not have any unrecognized tax benefits in the financial statements; nor is the Fund aware of any tax positions for which it is reasonably possible that the total amounts of unrecognized tax benefits will significantly change in the next twelve months. The Fund files a U.S. federal tax return, in addition to state and local tax returns as required. The Fund's federal income tax returns are subject to examination by the Internal Revenue Service (IRS) for a period of three fiscal years after they are filed. State and local tax returns may be subject to examination for an additional fiscal year depending on the jurisdiction.
Distributions are declared and recorded daily and paid monthly from net investment income. Distributions from realized gains, if any, are declared and recorded on the ex-dividend date. Income and capital gain distributions are declared separately for each class. Income and capital gain distributions are determined in accordance with income tax regulations, which may differ from GAAP.
Capital accounts within the financial statements are adjusted for permanent book-tax differences. These adjustments have no impact on net assets or the results of operations. Capital accounts are not adjusted for temporary book-tax differences which will reverse in a subsequent period.
Book-tax differences are primarily due to futures contracts, market discount, swaps, capital loss carryforwards and losses deferred due to wash sales.
As of period end, the cost and unrealized appreciation (depreciation) in securities, and derivatives if applicable, for federal income tax purposes were as follows:
| Gross unrealized appreciation | $973 |
| Gross unrealized depreciation | (54,924) |
| Net unrealized appreciation (depreciation) | $(53,951) |
| Tax Cost | $714,826 |
The tax-based components of distributable earnings as of period end were as follows:
| Undistributed ordinary income | $1,063 |
| Capital loss carryforward | $(62,762) |
| Net unrealized appreciation (depreciation) on securities and other investments | $(53,951) |
Capital loss carryforwards are only available to offset future capital gains of the Fund to the extent provided by regulations and may be limited. The capital loss carryforward information presented below, including any applicable limitation, is estimated as of fiscal period end and is subject to adjustment.
Short-term | $(53,154) |
Long-term | (9,608) |
| Total capital loss carryforward | $(62,762) |
The tax character of distributions paid was as follows:
| | August 31, 2023 | August 31, 2022 |
| Ordinary Income | $28,042 | $ 12,402 |
| Long-term Capital Gains | - | 3,394 |
| Total | $28,042 | $ 15,796 |
Delayed Delivery Transactions and When-Issued Securities. During the period, certain Funds transacted in securities on a delayed delivery or when-issued basis. Payment and delivery may take place after the customary settlement period for that security. The price of the underlying securities and the date when the securities will be delivered and paid for are fixed at the time the transaction is negotiated. Securities purchased on a delayed delivery or when-issued basis are identified as such in the Schedule of Investments. Compensation for interest forgone in the purchase of a delayed delivery or when-issued debt security may be received. With respect to purchase commitments, each applicable Fund identifies securities as segregated in its records with a value at least equal to the amount of the commitment. Payables and receivables associated with the purchases and sales of delayed delivery securities having the same coupon, settlement date and broker are offset. Delayed delivery or when-issued securities that have been purchased from and sold to different brokers are reflected as both payables and receivables in the Statement of Assets and Liabilities under the caption "Delayed delivery", as applicable. Losses may arise due to changes in the value of the underlying securities or if the counterparty does not perform under the contract's terms, or if the issuer does not issue the securities due to political, economic, or other factors.
To-Be-Announced (TBA) Securities and Mortgage Dollar Rolls. TBA securities involve buying or selling mortgage-backed securities (MBS) on a forward commitment basis. A TBA transaction typically does not designate the actual security to be delivered and only includes an approximate principal amount; however delivered securities must meet specified terms defined by industry guidelines, including issuer, rate and current principal amount outstanding on underlying mortgage pools. Funds may enter into a TBA transaction with the intent to take possession of or deliver the underlying MBS, or a fund may elect to extend the settlement by entering into either a mortgage or reverse mortgage dollar roll. Mortgage dollar rolls are transactions where a fund sells TBA securities and simultaneously agrees to repurchase MBS on a later date at a lower price and with the same counterparty. Reverse mortgage dollar rolls involve the purchase and simultaneous agreement to sell TBA securities on a later date at a lower price. Transactions in mortgage dollar rolls and reverse mortgage dollar rolls are accounted for as purchases and sales and may result in an increase to a fund's portfolio turnover rate.
Purchases and sales of TBA securities involve risks similar to those discussed above for delayed delivery and when-issued securities. Also, if the counterparty in a mortgage dollar roll or a reverse mortgage dollar roll transaction files for bankruptcy or becomes insolvent, a fund's right to repurchase or sell securities may be limited. Additionally, when a fund sells TBA securities without already owning or having the right to obtain the deliverable securities (an uncovered forward commitment to sell), it incurs a risk of loss because it could have to purchase the securities at a price that is higher than the price at which it sold them. A fund may be unable to purchase the deliverable securities if the corresponding market is illiquid.
TBA securities subject to a forward commitment to sell at period end are included at the end of the Schedule of Investments under the caption "TBA Sale Commitments." The proceeds and value of these commitments are reflected in the Statement of Assets and Liabilities as "Receivable for TBA sale commitments" and "TBA sale commitments, at value," respectively.
Restricted Securities (including Private Placements). Funds may invest in securities that are subject to legal or contractual restrictions on resale. These securities generally may be resold in transactions exempt from registration or to the public if the securities are registered. Disposal of these securities may involve time-consuming negotiations and expense, and prompt sale at an acceptable price may be difficult. Information regarding restricted securities held at period end is included at the end of the Schedule of Investments, if applicable.
4. Derivative Instruments.
Risk Exposures and the Use of Derivative Instruments. The Fund's investment objectives allow for various types of derivative instruments, including futures contracts and swaps. Derivatives are investments whose value is primarily derived from underlying assets, indices or reference rates and may be transacted on an exchange or over-the-counter (OTC). Derivatives may involve a future commitment to buy or sell a specified asset based on specified terms, to exchange future cash flows at periodic intervals based on a notional principal amount, or for one party to make one or more payments upon the occurrence of specified events in exchange for periodic payments from the other party.
Derivatives were used to increase returns, to gain exposure to certain types of assets and to manage exposure to certain risks as defined below. The success of any strategy involving derivatives depends on analysis of numerous economic factors, and if the strategies for investment do not work as intended, the objectives may not be achieved.
Derivatives were used to increase or decrease exposure to the following risk(s):
| | |
| Credit Risk | Credit risk relates to the ability of the issuer of a financial instrument to make further principal or interest payments on an obligation or commitment that it has to a fund. |
| Interest Rate Risk | Interest rate risk relates to the fluctuations in the value of interest-bearing securities due to changes in the prevailing levels of market interest rates. |
Funds are also exposed to additional risks from investing in derivatives, such as liquidity risk and counterparty credit risk. Liquidity risk is the risk that a fund will be unable to close out the derivative in the open market in a timely manner. Counterparty credit risk is the risk that the counterparty will not be able to fulfill its obligation to a fund. Derivative counterparty credit risk is managed through formal evaluation of the creditworthiness of all potential counterparties. On certain OTC derivatives such as bi-lateral swaps, a fund attempts to reduce its exposure to counterparty credit risk by entering into an International Swaps and Derivatives Association, Inc. (ISDA) Master Agreement with each of its counterparties. The ISDA Master Agreement gives a fund the right to terminate all transactions traded under such agreement upon the deterioration in the credit quality of the counterparty beyond specified levels. The ISDA Master Agreement gives each party the right, upon an event of default by the other party or a termination of the agreement, to close out all transactions traded under such agreement and to net amounts owed under each transaction to one net payable by one party to the other. To mitigate counterparty credit risk on bi-lateral OTC derivatives, a fund receives collateral in the form of cash or securities once net unrealized appreciation on outstanding derivative contracts under an ISDA Master Agreement exceeds certain applicable thresholds, subject to certain minimum transfer provisions. The collateral received is held in segregated accounts with the custodian bank in accordance with the collateral agreements entered into between a fund, the counterparty and the custodian bank. A fund could experience delays and costs in gaining access to the collateral even though it is held by the custodian bank. The maximum risk of loss to a fund from counterparty credit risk related to bi-lateral OTC derivatives is generally the aggregate unrealized appreciation and unpaid counterparty payments in excess of any collateral pledged by the counterparty to a fund. A fund may be required to pledge collateral for the benefit of the counterparties on bi-lateral OTC derivatives in an amount not less than each counterparty's unrealized appreciation on outstanding derivative contracts, subject to certain minimum transfer provisions, and any such pledged collateral is identified in the Schedule of Investments. Exchange-traded contracts are not covered by the ISDA Master Agreement; however counterparty credit risk related to these contracts may be mitigated by the protection provided by the exchange on which they trade. Counterparty credit risk related to centrally cleared OTC swaps may be mitigated by the protection provided by the clearinghouse.
Investing in derivatives may involve greater risks than investing in the underlying assets directly and, to varying degrees, may involve risk of loss in excess of any initial investment and collateral received and amounts recognized in the Statement of Assets and Liabilities. In addition, there may be the risk that the change in value of the derivative contract does not correspond to the change in value of the underlying instrument.
Net Realized Gain (Loss) and Change in Net Unrealized Appreciation (Depreciation) on Derivatives. The table below, which reflects the impacts of derivatives on the financial performance, summarizes the net realized gain (loss) and change in net unrealized appreciation (depreciation) for derivatives during the period as presented in the Statement of Operations.
| Primary Risk Exposure / Derivative Type | Net Realized Gain (Loss)($) | Change in Net Unrealized Appreciation (Depreciation)($) |
| Fidelity Advisor Mortgage Securities Fund | | |
| Credit Risk | | |
| Swaps | $481 | $(280) |
| Total Credit Risk | 481 | (280) |
| Interest Rate Risk | | |
| Futures Contracts | 6,631 | (1,648) |
| Swaps | (710) | (105) |
| Total Interest Rate Risk | 5,921 | (1,753) |
| Totals | $6,402 | $(2,033) |
If there are any open positions at period end, a summary of the value of derivatives by primary risk exposure is included at the end of the Schedule of Investments.
Futures Contracts. A futures contract is an agreement between two parties to buy or sell a specified underlying instrument for a fixed price at a specified future date. Futures contracts were used to manage exposure to the bond market and fluctuations in interest rates.
Upon entering into a futures contract, a fund is required to deposit either cash or securities (initial margin) with a clearing broker in an amount equal to a certain percentage of the face value of the contract. Futures contracts are marked-to-market daily and subsequent daily payments are made or received by a fund depending on the daily fluctuations in the value of the futures contracts and are recorded as unrealized appreciation or (depreciation). This receivable and/or payable, if any, is included in daily variation margin on futures contracts in the Statement of Assets and Liabilities. Realized gain or (loss) is recorded upon the expiration or closing of a futures contract. The net realized gain (loss) and change in net unrealized appreciation (depreciation) on futures contracts during the period is presented in the Statement of Operations.
Any open futures contracts at period end are presented in the Schedule of Investments under the caption "Futures Contracts". The notional amount at value reflects each contract's exposure to the underlying instrument or index at period end, and is representative of volume of activity during the period unless an average notional amount is presented. Any securities deposited to meet initial margin requirements are identified in the Schedule of Investments. Any cash deposited to meet initial margin requirements is presented as segregated cash with brokers for derivative instruments in the Statement of Assets and Liabilities.
Swaps. A swap is a contract between two parties to exchange future cash flows at periodic intervals based on a notional principal amount. A bi-lateral OTC swap is a transaction between a fund and a dealer counterparty where cash flows are exchanged between the two parties for the life of the swap. A centrally cleared OTC swap is a transaction executed between a fund and a dealer counterparty, then cleared by a futures commission merchant (FCM) through a clearinghouse. Once cleared, the clearinghouse serves as a central counterparty, with whom a fund exchanges cash flows for the life of the transaction, similar to transactions in futures contracts.
Bi-lateral OTC swaps are marked-to-market daily and changes in value are reflected in the Statement of Assets and Liabilities in the bi-lateral OTC swaps at value line items. Any upfront premiums paid or received upon entering a bi-lateral OTC swap to compensate for differences between stated terms of the swap and prevailing market conditions (e.g. credit spreads, interest rates or other factors) are recorded in total accumulated earnings (loss) in the Statement of Assets and Liabilities and amortized to realized gain or (loss) ratably over the term of the swap. Any unamortized upfront premiums are presented in the Schedule of Investments.
Centrally cleared OTC swaps require a fund to deposit either cash or securities (initial margin) with the FCM, at the instruction of and for the benefit of the clearinghouse. Any securities deposited to meet initial margin requirements are identified in the Schedule of Investments. Any cash deposited to meet initial margin requirements is presented in segregated cash with brokers for derivative instruments in the Statement of Assets and Liabilities. Centrally cleared OTC swaps are marked-to-market daily and subsequent payments (variation margin) are made or received depending on the daily fluctuations in the value of the swaps and are recorded as unrealized appreciation or (depreciation). These daily payments, if any, are included in receivable or payable for daily variation margin on centrally cleared OTC swaps in the Statement of Assets and Liabilities. Any premiums for centrally cleared OTC swaps are recorded periodically throughout the term of the swap to variation margin and included in total accumulated earnings (loss) in the Statement of Assets and Liabilities. Any premiums are recognized as realized gain (loss) upon termination or maturity of the swap.
For both bi-lateral and centrally cleared OTC swaps, payments are exchanged at specified intervals, accrued daily commencing with the effective date of the contract and recorded as realized gain or (loss). Some swaps may be terminated prior to the effective date and realize a gain or loss upon termination. The net realized gain (loss) and change in net unrealized appreciation (depreciation) on swaps during the period is presented in the Statement of Operations.
Any open swaps at period end are included in the Schedule of Investments under the caption "Swaps", and are representative of volume of activity during the period unless an average notional amount is presented.
Credit Default Swaps. Credit default swaps enable a fund to buy or sell protection against specified credit events on a single-name issuer or a traded credit index. Under the terms of a credit default swap the buyer of protection (buyer) receives credit protection in exchange for making periodic payments to the seller of protection (seller) based on a fixed percentage applied to a notional principal amount. In return for these payments, the seller will be required to make a payment upon the occurrence of one or more specified credit events. A fund enters into credit default swaps as a seller to gain credit exposure to an issuer and/or as a buyer to obtain a measure of protection against defaults of an issuer. Periodic payments are made over the life of the contract by the buyer provided that no credit event occurs.
For credit default swaps on most corporate and sovereign issuers, credit events include bankruptcy, failure to pay or repudiation/moratorium. For credit default swaps on corporate or sovereign issuers, the obligation that may be put to the seller is not limited to the specific reference obligation described in the Schedule of Investments. For credit default swaps on asset-backed securities, a credit event may be triggered by events such as failure to pay principal, maturity extension, rating downgrade or write-down. For credit default swaps on asset-backed securities, the reference obligation described represents the security that may be put to the seller. For credit default swaps on a traded credit index, a specified credit event may affect all or individual underlying securities included in the index.
As a seller, if an underlying credit event occurs, a fund will pay a net settlement amount of cash equal to the notional amount of the swap less the recovery value of the reference obligation or underlying securities comprising an index. Only in the event of the industry's inability to value the underlying asset will a fund be required to take delivery of the reference obligation or underlying securities comprising an index and pay an amount equal to the notional amount of the swap.
As a buyer, if an underlying credit event occurs, a fund will receive a net settlement amount of cash equal to the notional amount of the swap less the recovery value of the reference obligation or underlying securities comprising an index. Only in the event of the industry's inability to value the underlying asset will a fund be required to deliver the reference obligation or underlying securities comprising an index in exchange for payment of an amount equal to the notional amount of the swap.
Typically, the value of each credit default swap and credit rating disclosed for each reference obligation in the Schedule of Investments, where a fund is the seller, can be used as measures of the current payment/performance risk of the swap. As the value of the swap changes as a positive or negative percentage of the total notional amount, the payment/performance risk may decrease or increase, respectively. In addition to these measures, the investment adviser monitors a variety of factors including cash flow assumptions, market activity and market sentiment as part of its ongoing process of assessing payment/performance risk.
Interest Rate Swaps. Interest rate swaps are agreements between counterparties to exchange cash flows, one based on a fixed rate, and the other on a floating rate. A fund enters into interest rate swaps to manage its exposure to interest rate changes. Changes in interest rates can have an effect on both the value of bond holdings as well as the amount of interest income earned. In general, the value of bonds can fall when interest rates rise and can rise when interest rates fall.
5. Purchases and Sales of Investments.
Purchases and sales of securities, other than short-term securities, U.S. government securities and in-kind transactions, as applicable, are noted in the table below.
| | Purchases ($) | Sales ($) |
| Fidelity Advisor Mortgage Securities Fund | 5,746,472 | 5,905,297 |
Unaffiliated Redemptions In-Kind. Shares that were redeemed in-kind for investments, including accrued interest and cash, if any, are shown in the table below. The net realized gain or loss on investments delivered through in-kind redemptions is included in the "Net realized gain (loss) on: Redemptions in-kind" line in the accompanying Statement of Operations. The amount of the in-kind redemptions is included in share transactions in the accompanying Statement of Changes in Net Assets. There was no gain or loss for federal income tax purposes.
| | Shares | Total net realized gain or loss ($) | Total Proceeds ($) | Participating classes |
| Fidelity Advisor Mortgage Securities Fund | 55,765 | (48,662) | 543,713 | Fidelity Mortgage Securities Fund |
6. Fees and Other Transactions with Affiliates.
Management Fee. Fidelity Management & Research Company LLC (the investment adviser) and its affiliates provide the Fund with investment management related services for which the Fund pays a monthly management fee. The management fee is the sum of an individual fund fee rate that is based on an annual rate of .20% of the Fund's average net assets and an annualized group fee rate that averaged .10% during the period. The group fee rate is based upon the monthly average net assets of a group of registered investment companies with which the investment adviser has management contracts. The group fee rate decreases as assets under management increase and increases as assets under management decrease. For the reporting period, the total annual management fee rate was .30% of the Fund's average net assets.
Distribution and Service Plan Fees. In accordance with Rule 12b-1 of the 1940 Act, the Fund has adopted separate Distribution and Service Plans for each class of shares. Certain classes pay Fidelity Distributors Company LLC (FDC), an affiliate of the investment adviser, separate Distribution and Service Fees, each of which is based on an annual percentage of each class' average net assets. In addition, FDC may pay financial intermediaries for selling shares of the Fund and providing shareholder support services. For the period, the Distribution and Service Fee rates, total fees and amounts retained by FDC were as follows:
| | Distribution Fee | Service Fee | Total Fees | Retained by FDC |
| Class A | - % | .25% | $58 | $2 |
| Class M | - % | .25% | 22 | - A |
| Class C | .75% | .25% | 22 | 2 |
| | | | $102 | $4 |
A In the amount of less than five hundred dollars.
Sales Load. FDC may receive a front-end sales charge of up to 4.00% for selling Class A shares and Class M shares, some of which is paid to financial intermediaries for selling shares of the Fund. Depending on the holding period, FDC may receive contingent deferred sales charges levied on Class A, Class M and Class C redemptions. The deferred sales charges are 1.00% for Class C shares, .75% for certain purchases of Class A shares and .25% for certain purchases of Class M shares.
For the period, sales charge amounts retained by FDC were as follows:
| | Retained by FDC |
| Class A | $2 |
| Class M | - B |
Class C A | - B |
| | $2 |
A When Class C shares are initially sold, FDC pays commissions from its own resources to financial intermediaries through which the sales are made.
B In the amount of less than five hundred dollars.
Transfer Agent Fees. Fidelity Investments Institutional Operations Company LLC (FIIOC), an affiliate of the investment adviser, is the transfer, dividend disbursing and shareholder servicing agent for each class of the Fund. FIIOC receives account fees and asset-based fees that vary according to the account size and type of account of the shareholders of each respective class of the Fund, with the exception of Fidelity Mortgage Securities Fund and Class Z. FIIOC receives an asset-based fee of Fidelity Mortgage Securities Fund's and Class Z's average net assets. FIIOC pays for typesetting, printing and mailing of shareholder reports, except proxy statements. For the period, transfer agent fees for each class were as follows:
| | Amount | % of Class-Level Average Net Assets |
| Class A | $46 | .20 |
| Class M | 17 | .19 |
| Class C | 6 | .25 |
| Fidelity Mortgage Securities Fund | 750 | .10 |
| Class I | 59 | .17 |
| Class Z | 64 | .05 |
| | $942 | |
Fund Wide Operations Fee. Pursuant to the Fund Wide Operations and Expense Agreement (FWOE), the investment adviser has agreed to provide for fund-level expenses (which may not include transfer agent, the compensation of the independent Trustees, interest, taxes or extraordinary expenses, as applicable) in return for a FWOE fee equal to .35% of fund-level average net assets less the total amount of the management fee. The FWOE paid by a fund is reduced by an amount equal to the fees and expenses paid to the independent Trustees. For the period, the FWOE fees were equivalent to the following annual rate expressed as a percentage of average net assets:
| Fidelity Advisor Mortgage Securities Fund | .05% |
Interfund Trades. Funds may purchase from or sell securities to other Fidelity Funds under procedures adopted by the Board. The procedures have been designed to ensure these interfund trades are executed in accordance with Rule 17a-7 of the 1940 Act. Any interfund trades are included within the respective purchases and sales amounts shown in the Purchases and Sales of Investments note. During the period, there were no interfund trades.
7. Committed Line of Credit.
Certain Funds participate with other funds managed by the investment adviser or an affiliate in a $4.25 billion credit facility (the "line of credit") to be utilized for temporary or emergency purposes to fund shareholder redemptions or for other short-term liquidity purposes. The commitment fees on the pro-rata portion of the line of credit are borne by the investment adviser. During the period, there were no borrowings on this line of credit.
8. Security Lending.
Funds lend portfolio securities from time to time in order to earn additional income. Lending agents are used, including National Financial Services (NFS), an affiliate of the investment adviser. Pursuant to a securities lending agreement, NFS will receive a fee, which is capped at 9.9% of a fund's daily lending revenue, for its services as lending agent. A fund may lend securities to certain qualified borrowers, including NFS. On the settlement date of the loan, a fund receives collateral (in the form of U.S. Treasury obligations, letters of credit and/or cash) against the loaned securities and maintains collateral in an amount not less than 100% of the market value of the loaned securities during the period of the loan. The market value of the loaned securities is determined at the close of business of a fund and any additional required collateral is delivered to a fund on the next business day. A fund or borrower may terminate the loan at any time, and if the borrower defaults on its obligation to return the securities loaned because of insolvency or other reasons, a fund may apply collateral received from the borrower against the obligation. A fund may experience delays and costs in recovering the securities loaned. Any cash collateral received is invested in the Fidelity Securities Lending Cash Central Fund. Any loaned securities are identified as such in the Schedule of Investments, and the value of loaned securities and cash collateral at period end, as applicable, are presented in the Statement of Assets and Liabilities. Security lending income represents the income earned on investing cash collateral, less rebates paid to borrowers and any lending agent fees associated with the loan, plus any premium payments received for lending certain types of securities. Security lending income is presented in the Statement of Operations as a component of income from Fidelity Central Funds. Affiliated security lending activity, if any, was as follows:
| | Total Security Lending Fees Paid to NFS | Security Lending Income From Securities Loaned to NFS | Value of Securities Loaned to NFS at Period End |
| Fidelity Advisor Mortgage Securities Fund | $1 | $ - | $- |
9. Expense Reductions.
The investment adviser contractually agreed to reimburse expenses of each class to the extent annual operating expenses exceeded certain levels of class-level average net assets as noted in the table below. This reimbursement will remain in place through December 31, 2024. Some expenses, for example the compensation of the independent Trustees, and certain other expenses such as interest expense, are excluded from this reimbursement.
The following classes were in reimbursement during the period:
| | Expense Limitations | Reimbursement |
| Class Z | .36% | $51 |
Through arrangements with the Fund's custodian and each class' transfer agent, credits realized as a result of certain uninvested cash balances were used to reduce the Fund's expenses. During the period, custodian credits reduced the Fund's expenses by $6. During the period, transfer agent credits reduced each class' expenses as noted in the table below.
| | Transfer Agent Credits |
| Class M | |
| | $- A |
A In the amount of less than five hundred dollars.
10. Distributions to Shareholders.
Distributions to shareholders of each class were as follows:
| | Year ended August 31, 2023 | Year ended August 31, 2022 |
| Fidelity Advisor Mortgage Securities Fund | | |
| Distributions to shareholders | | |
| Class A | $596 | $363 |
| Class M | 234 | 133 |
| Class C | 41 | 20 |
| Fidelity Mortgage Securities Fund | 22,200 | 13,387 |
| Class I | 977 | 570 |
| Class Z | 3,994 | 1,323 |
Total | $28,042 | $15,796 |
11. Share Transactions.
Share transactions for each class were as follows and may contain in-kind transactions, automatic conversions between classes or exchanges between affiliated funds:
| | Shares | Shares | Dollars | Dollars |
| | Year ended August 31, 2023 | Year ended August 31, 2022 | Year ended August 31, 2023 | Year ended August 31, 2022 |
| Fidelity Advisor Mortgage Securities Fund | | | | |
| Class A | | | | |
| Shares sold | 145 | 222 | $1,430 | $2,386 |
| Reinvestment of distributions | 57 | 31 | 556 | 339 |
| Shares redeemed | (745) | (490) | (7,333) | (5,331) |
| Net increase (decrease) | (543) | (237) | $(5,347) | $(2,606) |
| Class M | | | | |
| Shares sold | 55 | 48 | $527 | $534 |
| Reinvestment of distributions | 23 | 12 | 228 | 131 |
| Shares redeemed | (255) | (121) | (2,476) | (1,327) |
| Net increase (decrease) | (177) | (61) | $(1,721) | $(662) |
| Class C | | | | |
| Shares sold | 24 | 51 | $234 | $543 |
| Reinvestment of distributions | 4 | 2 | 40 | 20 |
| Shares redeemed | (102) | (111) | (995) | (1,195) |
| Net increase (decrease) | (74) | (58) | $(721) | $(632) |
| Fidelity Mortgage Securities Fund | | | | |
| Shares sold | 62,353 | 48,456 | $605,892 | $520,157 |
| Reinvestment of distributions | 1,836 | 1,053 | 18,073 | 11,485 |
| Shares redeemed | (109,036) | (54,483) | (1,058,431) | (592,911) |
| Net increase (decrease) | (44,847) | (4,974) | $(434,466) | $(61,269) |
| Class I | | | | |
| Shares sold | 2,608 | 2,273 | $25,870 | $24,549 |
| Reinvestment of distributions | 97 | 50 | 948 | 542 |
| Shares redeemed | (4,383) | (2,974) | (43,404) | (32,907) |
| Net increase (decrease) | (1,678) | (651) | $(16,586) | $(7,816) |
| Class Z | | | | |
| Shares sold | 14,073 | 6,013 | $140,015 | $65,115 |
| Reinvestment of distributions | 382 | 109 | 3,758 | 1,187 |
| Shares redeemed | (13,966) | (8,695) | (138,627) | (97,134) |
| Net increase (decrease) | 489 | (2,573) | $5,146 | $(30,832) |
12. Other.
A fund's organizational documents provide former and current trustees and officers with a limited indemnification against liabilities arising in connection with the performance of their duties to the fund. In the normal course of business, a fund may also enter into contracts that provide general indemnifications. A fund's maximum exposure under these arrangements is unknown as this would be dependent on future claims that may be made against a fund. The risk of material loss from such claims is considered remote.
13. Credit Risk.
The Fund invests a significant portion of its assets in structured securities of issuers backed by commercial and residential mortgage loans, credit card receivables and automotive loans. The value and related income of these securities is sensitive to changes in economic conditions, including delinquencies and/or defaults.
14. Risk and Uncertainties.
Many factors affect a fund's performance. Developments that disrupt global economies and financial markets, such as pandemics, epidemics, outbreaks of infectious diseases, war, terrorism, and environmental disasters, may significantly affect a fund's investment performance. The effects of these developments to a fund will be impacted by the types of securities in which a fund invests, the financial condition, industry, economic sector, and geographic location of an issuer, and a fund's level of investment in the securities of that issuer. Significant concentrations in security types, issuers, industries, sectors, and geographic locations may magnify the factors that affect a fund's performance.
To the Board of Trustees of Fidelity Advisor Series II and Shareholders of Fidelity Advisor Mortgage Securities Fund
Opinion on the Financial Statements
We have audited the accompanying statement of assets and liabilities, including the schedule of investments, of Fidelity Advisor Mortgage Securities Fund (one of the funds constituting Fidelity Advisor Series II, referred to hereafter as the "Fund") as of August 31, 2023, the related statement of operations for the year ended August 31, 2023, the statement of changes in net assets for each of the two years in the period ended August 31, 2023, including the related notes, and the financial highlights for each of the periods indicated therein (collectively referred to as the "financial statements"). In our opinion, the financial statements present fairly, in all material respects, the financial position of the Fund as of August 31, 2023, the results of its operations for the year then ended, the changes in its net assets for each of the two years in the period ended August 31, 2023 and the financial highlights for each of the periods indicated therein in conformity with accounting principles generally accepted in the United States of America.
Basis for Opinion
These financial statements are the responsibility of the Fund's management. Our responsibility is to express an opinion on the Fund's financial statements based on our audits. We are a public accounting firm registered with the Public Company Accounting Oversight Board (United States) (PCAOB) and are required to be independent with respect to the Fund in accordance with the U.S. federal securities laws and the applicable rules and regulations of the Securities and Exchange Commission and the PCAOB.
We conducted our audits of these financial statements in accordance with the standards of the PCAOB. Those standards require that we plan and perform the audit to obtain reasonable assurance about whether the financial statements are free of material misstatement, whether due to error or fraud.
Our audits included performing procedures to assess the risks of material misstatement of the financial statements, whether due to error or fraud, and performing procedures that respond to those risks. Such procedures included examining, on a test basis, evidence regarding the amounts and disclosures in the financial statements. Our audits also included evaluating the accounting principles used and significant estimates made by management, as well as evaluating the overall presentation of the financial statements. Our procedures included confirmation of securities owned as of August 31, 2023 by correspondence with the custodian and brokers; when replies were not received from brokers, we performed other auditing procedures. We believe that our audits provide a reasonable basis for our opinion.
/s/ PricewaterhouseCoopers LLP
Boston, Massachusetts
October 12, 2023
We have served as the auditor of one or more investment companies in the Fidelity group of funds since 1932.
The Trustees, Members of the Advisory Board (if any), and officers of the trust and fund, as applicable, are listed below. The Board of Trustees governs the fund and is responsible for protecting the interests of shareholders. The Trustees are experienced executives who meet periodically throughout the year to oversee the fund's activities, review contractual arrangements with companies that provide services to the fund, oversee management of the risks associated with such activities and contractual arrangements, and review the fund's performance. As of August 31, 2023, except for Laura M. Bishop, Robert W. Helm, Christine J. Thompson, and Carol J. Zierhoffer each of the Trustees oversees 313 funds. As of October 18, 2023, the date of their election as Trustee, Ms. Bishop, Mr. Helm, Ms. Thompson, and Ms. Zierhoffer each oversees 229 funds.
The Trustees hold office without limit in time except that (a) any Trustee may resign; (b) any Trustee may be removed by written instrument, signed by at least two-thirds of the number of Trustees prior to such removal; (c) any Trustee who requests to be retired or who has become incapacitated by illness or injury may be retired by written instrument signed by a majority of the other Trustees; and (d) any Trustee may be removed at any special meeting of shareholders by a two-thirds vote of the outstanding voting securities of the trust. Each Trustee who is not an interested person (as defined in the 1940 Act) of the trust and the fund is referred to herein as an Independent Trustee. Each Independent Trustee shall retire not later than the last day of the calendar year in which his or her 75th birthday occurs. The Independent Trustees may waive this mandatory retirement age policy with respect to individual Trustees. Officers and Advisory Board Members hold office without limit in time, except that any officer or Advisory Board Member may resign or may be removed by a vote of a majority of the Trustees at any regular meeting or any special meeting of the Trustees. Except as indicated, each individual has held the office shown or other offices in the same company for the past five years.
The fund's Statement of Additional Information (SAI) includes more information about the Trustees. To request a free copy, call Fidelity at 1-800-544-8544 if you're an individual investing directly with Fidelity, call 1-800-835-5092 if you're a plan sponsor or participant with Fidelity as your recordkeeper or call 1-877-208-0098 on institutional accounts or if you're an advisor or invest through one.
Experience, Skills, Attributes, and Qualifications of the Trustees. The Governance and Nominating Committee has adopted a statement of policy that describes the experience, qualifications, attributes, and skills that are necessary and desirable for potential Independent Trustee candidates (Statement of Policy). The Board believes that each Trustee satisfied at the time he or she was initially elected or appointed a Trustee, and continues to satisfy, the standards contemplated by the Statement of Policy. The Governance and Nominating Committee also engages professional search firms to help identify potential Independent Trustee candidates who have the experience, qualifications, attributes, and skills consistent with the Statement of Policy. From time to time, additional criteria based on the composition and skills of the current Independent Trustees, as well as experience or skills that may be appropriate in light of future changes to board composition, business conditions, and regulatory or other developments, have also been considered by the professional search firms and the Governance and Nominating Committee. In addition, the Board takes into account the Trustees' commitment and participation in Board and committee meetings, as well as their leadership of standing and ad hoc committees throughout their tenure.
In determining that a particular Trustee was and continues to be qualified to serve as a Trustee, the Board has considered a variety of criteria, none of which, in isolation, was controlling. The Board believes that, collectively, the Trustees have balanced and diverse experience, qualifications, attributes, and skills, which allow the Board to operate effectively in governing the fund and protecting the interests of shareholders. Information about the specific experience, skills, attributes, and qualifications of each Trustee, which in each case led to the Board's conclusion that the Trustee should serve (or continue to serve) as a trustee of the fund, is provided below.
Board Structure and Oversight Function. Abigail P. Johnson is an interested person and currently serves as Chairman. The Trustees have determined that an interested Chairman is appropriate and benefits shareholders because an interested Chairman has a personal and professional stake in the quality and continuity of services provided to the fund. Independent Trustees exercise their informed business judgment to appoint an individual of their choosing to serve as Chairman, regardless of whether the Trustee happens to be independent or a member of management. The Independent Trustees have determined that they can act independently and effectively without having an Independent Trustee serve as Chairman and that a key structural component for assuring that they are in a position to do so is for the Independent Trustees to constitute a substantial majority for the Board. The Independent Trustees also regularly meet in executive session. Michael E. Kenneally serves as Chairman of the Independent Trustees and as such (i) acts as a liaison between the Independent Trustees and management with respect to matters important to the Independent Trustees and (ii) with management prepares agendas for Board meetings.
Fidelity® funds are overseen by different Boards of Trustees. The fund's Board oversees Fidelity's investment-grade bond, money market, asset allocation and certain equity funds, and other Boards oversee Fidelity's alternative investment, high income and other equity funds. The asset allocation funds may invest in Fidelity® funds that are overseen by such other Boards. The use of separate Boards, each with its own committee structure, allows the Trustees of each group of Fidelity® funds to focus on the unique issues of the funds they oversee, including common research, investment, and operational issues. On occasion, the separate Boards establish joint committees to address issues of overlapping consequences for the Fidelity® funds overseen by each Board.
The Trustees operate using a system of committees to facilitate the timely and efficient consideration of all matters of importance to the Trustees, the fund, and fund shareholders and to facilitate compliance with legal and regulatory requirements and oversight of the fund's activities and associated risks. The Board, acting through its committees, has charged FMR and its affiliates with (i) identifying events or circumstances the occurrence of which could have demonstrably adverse effects on the fund's business and/or reputation; (ii) implementing processes and controls to lessen the possibility that such events or circumstances occur or to mitigate the effects of such events or circumstances if they do occur; and (iii) creating and maintaining a system designed to evaluate continuously business and market conditions in order to facilitate the identification and implementation processes described in (i) and (ii) above. Because the day-to-day operations and activities of the fund are carried out by or through FMR, its affiliates, and other service providers, the fund's exposure to risks is mitigated but not eliminated by the processes overseen by the Trustees. While each of the Board's committees has responsibility for overseeing different aspects of the fund's activities, oversight is exercised primarily through the Operations and Audit Committees. In addition, an ad hoc Board committee of Independent Trustees has worked with FMR to enhance the Board's oversight of investment and financial risks, legal and regulatory risks, technology risks, and operational risks, including the development of additional risk reporting to the Board. Appropriate personnel, including but not limited to the fund's Chief Compliance Officer (CCO), FMR's internal auditor, the independent accountants, the fund's Treasurer and portfolio management personnel, make periodic reports to the Board's committees, as appropriate, including an annual review of Fidelity's risk management program for the Fidelity® funds. The responsibilities of each standing committee, including their oversight responsibilities, are described further under "Standing Committees of the Trustees."
Interested Trustees*:
Correspondence intended for a Trustee who is an interested person may be sent to Fidelity Investments, 245 Summer Street, Boston, Massachusetts 02210.
Name, Year of Birth; Principal Occupations and Other Relevant Experience+
Abigail P. Johnson (1961)
Year of Election or Appointment: 2009
Trustee
Chairman of the Board of Trustees
Ms. Johnson also serves as Trustee of other Fidelity® funds. Ms. Johnson serves as Chairman (2016-present), Chief Executive Officer (2014-present), and Director (2007-present) of FMR LLC (diversified financial services company), President of Fidelity Financial Services (2012-present) and President of Personal, Workplace and Institutional Services (2005-present). Ms. Johnson is Chairman and Director of Fidelity Management & Research Company LLC (investment adviser firm, 2011-present). Previously, Ms. Johnson served as Chairman and Director of FMR Co., Inc. (investment adviser firm, 2011-2019), Vice Chairman (2007-2016) and President (2013-2016) of FMR LLC, President and a Director of Fidelity Management & Research Company (2001-2005), a Trustee of other investment companies advised by Fidelity Management & Research Company, Fidelity Investments Money Management, Inc. (investment adviser firm), and FMR Co., Inc. (2001-2005), Senior Vice President of the Fidelity® funds (2001-2005), and managed a number of Fidelity® funds. Ms. Abigail P. Johnson and Mr. Arthur E. Johnson are not related.
Jennifer Toolin McAuliffe (1959)
Year of Election or Appointment: 2016
Trustee
Ms. McAuliffe also serves as Trustee of other Fidelity® funds and as Trustee of Fidelity Charitable (2020-present). Previously, Ms. McAuliffe served as Co-Head of Fixed Income of Fidelity Investments Limited (now known as FIL Limited (FIL)) (diversified financial services company), Director of Research for FIL's credit and quantitative teams in London, Hong Kong and Tokyo and Director of Research for taxable and municipal bonds at Fidelity Investments Money Management, Inc. Ms. McAuliffe previously served as a member of the Advisory Board of certain Fidelity® funds (2016). Ms. McAuliffe was previously a lawyer at Ropes & Gray LLP and an international banker at Chemical Bank NA (now JPMorgan Chase & Co.). Ms. McAuliffe also currently serves as director or trustee of several not-for-profit entities.
Christine J. Thompson (1958)
Year of Election or Appointment: 2023
Trustee
Ms. Thompson also serves as a Trustee of other Fidelity® funds. Ms. Thompson serves as Leader of Advanced Technologies for Investment Management at Fidelity Investments (2018-present). Previously, Ms. Thompson served as Chief Investment Officer in the Bond group at Fidelity Management & Research Company (2010-2018) and held various other roles including Director of municipal bond portfolio managers and Portfolio Manager of certain Fidelity® funds.
* Determined to be an "Interested Trustee" by virtue of, among other things, his or her affiliation with the trust or various entities under common control with FMR.
+ The information includes the Trustee's principal occupation during the last five years and other information relating to the experience, attributes, and skills relevant to the Trustee's qualifications to serve as a Trustee, which led to the conclusion that the Trustee should serve as a Trustee for the fund.
Independent Trustees:
Correspondence intended for an Independent Trustee may be sent to Fidelity Investments, P.O. Box 55235, Boston, Massachusetts 02205-5235.
Name, Year of Birth; Principal Occupations and Other Relevant Experience+
Elizabeth S. Acton (1951)
Year of Election or Appointment: 2016
Trustee
Ms. Acton also serves as Trustee of other Fidelity® funds. Prior to her retirement, Ms. Acton served as Executive Vice President, Finance (2011-2012), Executive Vice President, Chief Financial Officer (2002-2011) and Treasurer (2004-2005) of Comerica Incorporated (financial services). Prior to joining Comerica, Ms. Acton held a variety of positions at Ford Motor Company (1983-2002), including Vice President and Treasurer (2000-2002) and Executive Vice President and Chief Financial Officer of Ford Motor Credit Company (1998-2000). Ms. Acton currently serves as a member of the Board and Audit and Finance Committees of Beazer Homes USA, Inc. (homebuilding, 2012-present). Ms. Acton previously served as a member of the Advisory Board of certain Fidelity® funds (2013-2016).
Laura M. Bishop (1961)
Year of Election or Appointment: 2023
Trustee
Ms. Bishop also serves as Trustee or Member of the Advisory Board of other Fidelity® funds. Prior to her retirement, Ms. Bishop held a variety of positions at United Services Automobile Association (2001-2020), including Executive Vice President and Chief Financial Officer (2014-2020) and Senior Vice President and Deputy Chief Financial Officer (2012-2014). Ms. Bishop currently serves as a member of the Audit Committee and Compensation and Personnel Committee (2021-present) of the Board of Directors of Korn Ferry (global organizational consulting). Previously, Ms. Bishop served as a Member of the Advisory Board of certain Fidelity® funds (2022-2023).
Ann E. Dunwoody (1953)
Year of Election or Appointment: 2018
Trustee
General Dunwoody also serves as Trustee of other Fidelity® funds. General Dunwoody (United States Army, Retired) was the first woman in U.S. military history to achieve the rank of four-star general and prior to her retirement in 2012 held a variety of positions within the U.S. Army, including Commanding General, U.S. Army Material Command (2008-2012). General Dunwoody currently serves as a member of the Board, Chair of Nomination Committee and a member of the Corporate Governance Committee of Kforce Inc. (professional staffing services, 2016-present) and a member of the Board of Automattic Inc. (software engineering, 2018-present). Previously, General Dunwoody served as President of First to Four LLC (leadership and mentoring services, 2012-2022), a member of the Advisory Board and Nominating and Corporate Governance Committee of L3 Technologies, Inc. (communication, electronic, sensor and aerospace systems, 2013-2019) and a member of the Board and Audit and Sustainability and Corporate Responsibility Committees of Republic Services, Inc. (waste collection, disposal and recycling, 2013-2016). General Dunwoody also serves on several boards for non-profit organizations, including as a member of the Board, Chair of the Nomination and Governance Committee and a member of the Audit Committee of the Noble Reach Foundation (formerly Logistics Management Institute) (consulting non-profit, 2012-present) and a member of the Board of ThanksUSA (military family education non-profit, 2014-present). Previously, General Dunwoody served as a member of the Board of Florida Institute of Technology (2015-2022) and a member of the Council of Trustees for the Association of the United States Army (advocacy non-profit, 2013-2021). General Dunwoody previously served as a member of the Advisory Board of certain Fidelity® funds (2018).
John Engler (1948)
Year of Election or Appointment: 2016
Trustee
Mr. Engler also serves as Trustee of other Fidelity® funds. Previously, Mr. Engler served as Governor of Michigan (1991-2003), President of the Business Roundtable (2011-2017) and interim President of Michigan State University (2018-2019). Previously, Mr. Engler served as a member of the Board of Stride, Inc. (formerly K12 Inc.) (technology-based education company, 2012-2022), a member of the Board of Universal Forest Products (manufacturer and distributor of wood and wood-alternative products, 2003-2019) and Trustee of The Munder Funds (2003-2014). Mr. Engler previously served as a member of the Advisory Board of certain Fidelity® funds (2014-2016).
Robert F. Gartland (1951)
Year of Election or Appointment: 2010
Trustee
Mr. Gartland also serves as Trustee of other Fidelity® funds. Prior to his retirement, Mr. Gartland held a variety of positions at Morgan Stanley (financial services, 1979-2007), including Managing Director (1987-2007) and Chase Manhattan Bank (1975-1978). Mr. Gartland previously served as Chairman and an investor in Gartland & Mellina Group Corp. (consulting, 2009-2019), as a member of the Board of National Securities Clearing Corporation (1993-1996) and as Chairman of TradeWeb (2003-2004).
Robert W. Helm (1957)
Year of Election or Appointment: 2023
Trustee
Mr. Helm also serves as Trustee or Member of the Advisory Board of other Fidelity® funds. Mr. Helm was formerly Deputy Chairman (2003-2020), partner (1991-2020) and an associate (1984-1991) of Dechert LLP (formerly Dechert Price & Rhoads). Mr. Helm currently serves on boards and committees of several not-for-profit organizations, including as a Trustee and member of the Executive Committee of the Baltimore Council on Foreign Affairs, a member of the Board of Directors of the St. Vincent de Paul Society of Baltimore and a member of the Life Guard Society of Mt. Vernon. Previously, Mr. Helm served as a Member of the Advisory Board of certain Fidelity® funds (2021-2023).
Arthur E. Johnson (1947)
Year of Election or Appointment: 2008
Trustee
Mr. Johnson also serves as Trustee of other Fidelity® funds. Prior to his retirement, Mr. Johnson served as Senior Vice President of Corporate Strategic Development of Lockheed Martin Corporation (defense contractor, 1999-2009). Mr. Johnson currently serves as a member of the Board of Booz Allen Hamilton (management consulting, 2011-present). Mr. Johnson previously served as a member of the Board of Eaton Corporation plc (diversified power management, 2009-2019) and a member of the Board of AGL Resources, Inc. (holding company, 2002-2016). Mr. Johnson previously served as Chairman (2018-2021) and Vice Chairman (2015-2018) of the Independent Trustees of certain Fidelity® funds. Mr. Arthur E. Johnson is not related to Ms. Abigail P. Johnson.
Michael E. Kenneally (1954)
Year of Election or Appointment: 2009
Trustee
Chairman of the Independent Trustees
Mr. Kenneally also serves as Trustee of other Fidelity® funds and was Vice Chairman (2018-2021) of the Independent Trustees of certain Fidelity® funds. Prior to retirement in 2005, he was Chairman and Global Chief Executive Officer of Credit Suisse Asset Management, the worldwide fund management and institutional investment business of Credit Suisse Group. Previously, Mr. Kenneally was an Executive Vice President and the Chief Investment Officer for Bank of America. In this role, he was responsible for the investment management, strategy and products delivered to the bank's institutional, high-net-worth and retail clients. Earlier, Mr. Kenneally directed the organization's equity and quantitative research groups. He began his career as a research analyst and then spent more than a dozen years as a portfolio manager for endowments, pension plans and mutual funds. He earned the Chartered Financial Analyst (CFA) designation in 1991.
Mark A. Murray (1954)
Year of Election or Appointment: 2016
Trustee
Mr. Murray also serves as Trustee of other Fidelity® funds. Previously, Mr. Murray served as Co-Chief Executive Officer (2013-2016), President (2006-2013) and Vice Chairman (2013-2020) of Meijer, Inc. Mr. Murray serves as a member of the Board (2009-present) and Public Policy and Responsibility Committee (2009-present) and Chair of the Nuclear Review Committee (2019-present) of DTE Energy Company (diversified energy company). Mr. Murray previously served as a member of the Board of Spectrum Health (not-for-profit health system, 2015-2019) and as a member of the Board and Audit Committee and Chairman of the Nominating and Corporate Governance Committee of Universal Forest Products, Inc. (manufacturer and distributor of wood and wood-alternative products, 2004-2016). Mr. Murray also serves as a member of the Board of many community and professional organizations. Mr. Murray previously served as a member of the Advisory Board of certain Fidelity® funds (2016).
Carol J. Zierhoffer (1960)
Year of Election or Appointment: 2023
Trustee
Ms. Zierhoffer also serves as Trustee or Member of the Advisory Board of other Fidelity® funds. Prior to her retirement, Ms. Zierhoffer held a variety of positions at Bechtel Corporation (engineering company, 2013-2019), including Principal Vice President and Chief Information Officer (2013-2016) and Senior Vice President and Chief Information Officer (2016-2019). Ms. Zierhoffer currently serves as a member of the Board of Directors, Audit Committee and Compensation Committee of Allscripts Healthcare Solutions, Inc. (healthcare technology, 2020-present) and as a member of the Board of Directors, Audit and Finance Committee and Nominating and Governance Committee of Atlas Air Worldwide Holdings, Inc. (aviation operating services, 2021-present). Previously, Ms. Zierhoffer served as a member of the Board of Directors and Audit Committee and as the founding Chair of the Information Technology Committee of MedAssets, Inc. (healthcare technology, 2013-2016), and as a Member of the Advisory Board of certain Fidelity® funds (2023).
+ The information includes the Trustee's principal occupation during the last five years and other information relating to the experience, attributes, and skills relevant to the Trustee's qualifications to serve as a Trustee, which led to the conclusion that the Trustee should serve as a Trustee for the fund.
Advisory Board Members and Officers:
Correspondence intended for a Member of the Advisory Board (if any) may be sent to Fidelity Investments, P.O. Box 55235, Boston, Massachusetts 02205-5235. Correspondence intended for an officer may be sent to Fidelity Investments, 245 Summer Street, Boston, Massachusetts 02210. Officers appear below in alphabetical order.
Name, Year of Birth; Principal Occupation
Heather Bonner (1977)
Year of Election or Appointment: 2023
Assistant Treasurer
Ms. Bonner also serves as an officer of other funds. Ms. Bonner serves as Senior Vice President (2022-present), and is an employee of Fidelity Investments. Ms. Bonner serves as Assistant Treasurer of Fidelity CRET Trustee LLC (2022-present). Prior to joining Fidelity, Ms. Bonner served as Managing Director at AQR Capital Management (2013-2022) and was the Treasurer and Principal Financial Officer of the AQR Funds (2013-2022).
Craig S. Brown (1977)
Year of Election or Appointment: 2019
Assistant Treasurer
Mr. Brown also serves as an officer of other funds. Mr. Brown serves as Assistant Treasurer of FIMM, LLC (2021-present) and is an employee of Fidelity Investments (2013-present). Previously, Mr. Brown served as Assistant Treasurer of certain Fidelity® funds (2019-2022).
John J. Burke III (1964)
Year of Election or Appointment: 2018
Chief Financial Officer
Mr. Burke also serves as Chief Financial Officer of other funds. Mr. Burke serves as Head of Investment Operations for Fidelity Fund and Investment Operations (2018-present) and is an employee of Fidelity Investments (1998-present). Previously Mr. Burke served as head of Asset Management Investment Operations (2012-2018).
Margaret Carey (1973)
Year of Election or Appointment: 2023
Secretary and Chief Legal Officer (CLO)
Ms. Carey also serves as an officer of other funds and as CLO of certain other Fidelity entities. She is a Senior Vice President and Deputy General Counsel of FMR LLC (diversified financial services company, 2019-present), and is an employee of Fidelity Investments.
David J. Carter (1973)
Year of Election or Appointment: 2020
Assistant Secretary
Mr. Carter also serves as Assistant Secretary of other funds. Mr. Carter serves as Senior Vice President, Deputy General Counsel (2022-present) and is an employee of Fidelity Investments (2005-present).
Jonathan Davis (1968)
Year of Election or Appointment: 2010
Assistant Treasurer
Mr. Davis also serves as an officer of other funds. Mr. Davis serves as Vice President Assistant Treasurer and is an employee of Fidelity Investments. Mr. Davis serves as Assistant Treasurer of certain Fidelity entities.
Laura M. Del Prato (1964)
Year of Election or Appointment: 2018
President and Treasurer
Ms. Del Prato also serves as an officer of other funds. Ms. Del Prato serves as Assistant Treasurer of FIMM, LLC (2021-present) and is an employee of Fidelity Investments (2017-present). Previously, Ms. Del Prato served as President and Treasurer of The North Carolina Capital Management Trust: Cash Portfolio and Term Portfolio (2018-2020). Prior to joining Fidelity Investments, Ms. Del Prato served as a Managing Director and Treasurer of the JPMorgan Mutual Funds (2014-2017). Prior to JPMorgan, Ms. Del Prato served as a partner at Cohen Fund Audit Services (accounting firm, 2012-2013) and KPMG LLP (accounting firm, 2004-2012).
Robin Foley (1964)
Year of Election or Appointment: 2023
Vice President
Ms. Foley also serves as Vice President of other funds. Ms. Foley serves as Head of Fidelity's Fixed Income division (2023-present) and is an employee of Fidelity Investments. Previously, Ms. Foley served as Chief Investment Officer of Bonds (2017-2023).
Christopher M. Gouveia (1973)
Year of Election or Appointment: 2023
Chief Compliance Officer
Mr. Gouveia also serves as Chief Compliance Officer of other funds. Mr. Gouveia serves as Senior Vice President of Asset Management Compliance for Fidelity Investments and is an employee of Fidelity Investments. Previously, Mr. Gouveia served as Chief Compliance Officer of the North Carolina Capital Management Trust (2016-2019).
Colm A. Hogan (1973)
Year of Election or Appointment: 2016
Assistant Treasurer
Mr. Hogan also serves as an officer of other funds. Mr. Hogan serves as Assistant Treasurer of FIMM, LLC (2021-present) and FMR Capital, Inc. (2017-present) and is an employee of Fidelity Investments (2005-present). Previously, Mr. Hogan served as Deputy Treasurer of certain Fidelity® funds (2016-2020) and Assistant Treasurer of certain Fidelity® funds (2016-2018).
Chris Maher (1972)
Year of Election or Appointment: 2013
Assistant Treasurer
Mr. Maher also serves as an officer of other funds. Mr. Maher serves as Assistant Treasurer of FIMM, LLC (2021-present) and FMR Capital, Inc. (2017-present), and is an employee of Fidelity Investments (2008-present). Previously, Mr. Maher served as Assistant Treasurer of certain funds (2013-2020); Vice President of Asset Management Compliance (2013), Vice President of the Program Management Group of FMR (investment adviser firm, 2010-2013), and Vice President of Valuation Oversight (2008-2010).
Brett Segaloff (1972)
Year of Election or Appointment: 2021
Anti-Money Laundering (AML) Officer
Mr. Segaloff also serves as an AML Officer of other funds and other related entities. He is Director, Anti-Money Laundering (2007-present) of FMR LLC (diversified financial services company) and is an employee of Fidelity Investments (1996-present).
Stacie M. Smith (1974)
Year of Election or Appointment: 2013
Assistant Treasurer
Ms. Smith also serves as an officer of other funds. Ms. Smith serves as Assistant Treasurer of certain Fidelity entities, is an employee of Fidelity Investments, and has served in other fund officer roles.
Jim Wegmann (1979)
Year of Election or Appointment: 2021
Deputy Treasurer
Mr. Wegmann also serves as an officer of other funds. Mr. Wegmann serves as Assistant Treasurer of FIMM, LLC (2021-present) and is an employee of Fidelity Investments (2011-present). Previously, Mr. Wegmann served as Assistant Treasurer of certain Fidelity® funds (2019-2021).
As a shareholder, you incur two types of costs: (1) transaction costs, which may include sales charges (loads) on purchase payments or redemption proceeds, as applicable and (2) ongoing costs, which generally include management fees, distribution and/or service (12b-1) fees and other Fund expenses. This Example is intended to help you understand your ongoing costs (in dollars) of investing in a fund and to compare these costs with the ongoing costs of investing in other mutual funds.
| The Example is based on an investment of $1,000 invested at the beginning of the period and held for the entire period (March 1, 2023 to August 31, 2023). |
Actual Expenses
The first line of the accompanying table provides information about actual account values and actual expenses. You may use the information in this line, together with the amount you invested, to estimate the expenses that you paid over the period. Simply divide your account value by $1,000.00 (for example, an $8,600 account value divided by $1,000.00 = 8.6), then multiply the result by the number in the first line for a class/Fund under the heading entitled "Expenses Paid During Period" to estimate the expenses you paid on your account during this period. If any fund is a shareholder of any underlying mutual funds or exchange-traded funds (ETFs) (the Underlying Funds), such fund indirectly bears its proportional share of the expenses of the Underlying Funds in addition to the direct expenses incurred presented in the table. These fees and expenses are not included in the annualized expense ratio used to calculate the expense estimate in the table below.
Hypothetical Example for Comparison Purposes
The second line of the accompanying table provides information about hypothetical account values and hypothetical expenses based on the actual expense ratio and an assumed rate of return of 5% per year before expenses, which is not the actual return. The hypothetical account values and expenses may not be used to estimate the actual ending account balance or expenses you paid for the period. You may use this information to compare the ongoing costs of investing in the Fund and other funds. To do so, compare this 5% hypothetical example with the 5% hypothetical examples that appear in the shareholder reports of the other funds. If any fund is a shareholder of any Underlying Funds, such fund indirectly bears its proportional share of the expenses of the Underlying Funds in addition to the direct expenses as presented in the table. These fees and expenses are not included in the annualized expense ratio used to calculate the expense estimate in the table below.
Please note that the expenses shown in the table are meant to highlight your ongoing costs only and do not reflect any transaction costs. Therefore, the second line of the table is useful in comparing ongoing costs only, and will not help you determine the relative total costs of owning different funds. In addition, if these transactional costs were included, your costs would have been higher.
| | | | | Annualized Expense Ratio- A | | Beginning Account Value March 1, 2023 | | Ending Account Value August 31, 2023 | | Expenses Paid During Period- C March 1, 2023 to August 31, 2023 |
| Fidelity Advisor® Mortgage Securities Fund | | | | | | | | | | |
| Class A | | | | .80% | | | | | | |
| Actual | | | | | | $ 1,000 | | $ 1,000.00 | | $ 4.03 |
Hypothetical-B | | | | | | $ 1,000 | | $ 1,021.17 | | $ 4.08 |
| Class M | | | | .79% | | | | | | |
| Actual | | | | | | $ 1,000 | | $ 1,000.10 | | $ 3.98 |
Hypothetical-B | | | | | | $ 1,000 | | $ 1,021.22 | | $ 4.02 |
| Class C | | | | 1.59% | | | | | | |
| Actual | | | | | | $ 1,000 | | $ 997.00 | | $ 8.00 |
Hypothetical-B | | | | | | $ 1,000 | | $ 1,017.19 | | $ 8.08 |
| Fidelity® Mortgage Securities Fund | | | | .44% | | | | | | |
| Actual | | | | | | $ 1,000 | | $ 1,001.80 | | $ 2.22 |
Hypothetical-B | | | | | | $ 1,000 | | $ 1,022.99 | | $ 2.24 |
| Class I | | | | .51% | | | | | | |
| Actual | | | | | | $ 1,000 | | $ 1,001.50 | | $ 2.57 |
Hypothetical-B | | | | | | $ 1,000 | | $ 1,022.63 | | $ 2.60 |
| Class Z | | | | .36% | | | | | | |
| Actual | | | | | | $ 1,000 | | $ 1,003.30 | | $ 1.82 |
Hypothetical-B | | | | | | $ 1,000 | | $ 1,023.39 | | $ 1.84 |
| |
A Annualized expense ratio reflects expenses net of applicable fee waivers.
B 5% return per year before expenses
C Expenses are equal to the annualized expense ratio, multiplied by the average account value over the period, multiplied by 184/ 365 (to reflect the one-half year period). The fees and expenses of any Underlying Funds are not included in each annualized expense ratio.
The dividend and capital gains distributions for the fund(s) are available on Fidelity.com or Institutional.Fidelity.com.
A total of 2.92% of the dividends distributed during the fiscal year was derived from interest on U.S. Government securities which is generally exempt from state income tax.
The fund designates $18,272,759 of distributions paid in the calendar year 2022 as qualifying to be taxed as interest-related dividends for nonresident alien shareholders.
The fund designates $28,041,663 of distributions paid during the fiscal year ended 2023 as qualifying to be taxed as section 163(j) interest dividends.
The fund will notify shareholders in January 2024 of amounts for use in preparing 2023 income tax returns.
1.704047.126
AMOR-ANN-1023
Fidelity® Series Investment Grade Securitized Fund
Annual Report
August 31, 2023
Contents
To view a fund's proxy voting guidelines and proxy voting record for the 12-month period ended June 30, visit http://www.fidelity.com/proxyvotingresults or visit the Securities and Exchange Commission's (SEC) web site at http://www.sec.gov.
You may also call 1-800-544-8544 to request a free copy of the proxy voting guidelines.
Standard & Poor's, S&P and S&P 500 are registered service marks of The McGraw-Hill Companies, Inc. and have been licensed for use by Fidelity Distributors Corporation.
Other third-party marks appearing herein are the property of their respective owners.
All other marks appearing herein are registered or unregistered trademarks or service marks of FMR LLC or an affiliated company. © 2023 FMR LLC. All rights reserved.
This report and the financial statements contained herein are submitted for the general information of the shareholders of the Fund. This report is not authorized for distribution to prospective investors in the Fund unless preceded or accompanied by an effective prospectus.
A fund files its complete schedule of portfolio holdings with the SEC for the first and third quarters of each fiscal year on Form N-PORT. Forms N-PORT are available on the SEC's web site at http://www.sec.gov. A fund's Forms N-PORT may be reviewed and copied at the SEC's Public Reference Room in Washington, DC. Information regarding the operation of the SEC's Public Reference Room may be obtained by calling 1-800-SEC-0330.
For a complete list of a fund's portfolio holdings, view the most recent holdings listing, semiannual report, or annual report on Fidelity's web site at http://www.fidelity.com, http://www.institutional.fidelity.com, or http://www.401k.com, as applicable.
NOT FDIC INSURED •MAY LOSE VALUE •NO BANK GUARANTEE
Neither the Fund nor Fidelity Distributors Corporation is a bank.
Average annual total return reflects the change in the value of an investment, assuming reinvestment of distributions from dividend income and capital gains (the profits earned upon the sale of securities that have grown in value, if any) and assuming a constant rate of performance each year. The hypothetical investment and the average annual total returns do not reflect the deduction of taxes that a shareholder would pay on fund distributions or the redemption of fund shares. During periods of reimbursement by Fidelity, a fund's total return will be greater than it would be had the reimbursement not occurred. How a fund did yesterday is no guarantee of how it will do tomorrow.
| Average Annual Total Returns |
| | | | |
Periods ended August 31, 2023 | Past 1 year | Past 5 years | Life of Fund A |
| Fidelity® Series Investment Grade Securitized Fund | -1.73% | 0.17% | 0.18% |
A From August 17, 2018
| $10,000 Over Life of Fund |
| |
Let's say hypothetically that $10,000 was invested in Fidelity® Series Investment Grade Securitized Fund, on August 17, 2018, when the fund started. The chart shows how the value of your investment would have changed, and also shows how the Bloomberg U.S. Securitized Index performed over the same period. |
|
|
Market Recap:
U.S. taxable investment-grade bonds returned -1.19% for the 12 months ending August 31, 2023, according to the Bloomberg U.S. Aggregate Bond Index. The first months of the period saw a continuation of the historic bond market downturn that began in early 2022, when the U.S. Federal Reserve began an aggressive series of interest rate hikes to combat persistent inflation. The actions helped push nominal and real U.S. bond yields to their highest levels in more than a decade. Bond prices, which move inversely to yields, fell sharply through October, and credit spreads widened, as investors demanded more yield for buying credit-sensitive assets. In November, the bond market staged a broad rally (+3.68%) when comments by Fed Chair Jerome Powell pointed to a slowdown in the size of future rate hikes. With the market anticipating the end of the hiking cycle by midyear, the index advanced 3.59% in the first four months of 2023, only to fall back in each of the four next months, as cooling but still-high inflation and a strong labor market suggested the Fed may need to keep raising rates for longer than anticipated. To date, the central bank has raised its benchmark rate 11 times, by a total of 5.25 percentage points. For the full 12 months, short-term bonds outperformed long-term issues, while lower-quality bonds bettered higher-quality debt, and risk assets like corporate bonds and asset-backed securities outpaced U.S. Treasuries. Meanwhile, U.S. mortgage-backed securities lagged in the rising-rate environment.
Comments from Co-Portfolio Managers Sean Corcoran and Franco Castagliuolo:
For the fiscal year, the fund returned -1.73% versus -1.96% for the benchmark, the Bloomberg U.S. Securitized Index. In managing the fund the past 12 months, we attempted to exploit market inefficiencies and identify attractively valued securities, in accordance with our longer-term strategy. The fund's performance versus the benchmark this period was boosted by non-benchmark exposure to non-agency single-asset commercial mortgage-backed securities, which are securitizations of single loans, typically collateralized by one, generally large property. It also helped to hold a non-benchmark position in non-agency residential mortgage-backed securities, which are pools of residential mortgage loans issued by private financial institutions. Elsewhere, overweights in certain government-agency backed securities contributed to relative performance. Examples include larger-than-benchmark exposure to higher-coupon (5.5% and higher) conventional mortgages and lower-coupon (2% and less) 15-year mortgages, two areas in which we built overweights late in the reporting period when we identified attractively price securities. In contrast, the fund's interest rate positioning detracted from relative performance for the 12 months. The fund had more sensitivity, as measured by its modestly longer duration, than the benchmark this period, which hurt because interest rates rose.
The views expressed above reflect those of the portfolio manager(s) only through the end of the period as stated on the cover of this report and do not necessarily represent the views of Fidelity or any other person in the Fidelity organization. Any such views are subject to change at any time based upon market or other conditions and Fidelity disclaims any responsibility to update such views. These views may not be relied on as investment advice and, because investment decisions for a Fidelity fund are based on numerous factors, may not be relied on as an indication of trading intent on behalf of any Fidelity fund.
Quality Diversification (% of Fund's net assets) |
|
Short-Term Investments and Net Other Assets (Liabilities) - (26.8)%* |
|
| |
| We have used ratings from Moody's Investors Service, Inc. Where Moody's® ratings are not available, we have used S&P® ratings. All ratings are as of the date indicated and do not reflect subsequent changes. |
Asset Allocation (% of Fund's net assets) |
|
Short-Term Investments and Net Other Assets (Liabilities) - (26.8)% |
Futures and Swaps - 11.4% |
Percentages in the above tables are adjusted for the effect of TBA Sale Commitments. |
|
Showing Percentage of Net Assets
| U.S. Treasury Obligations - 2.9% |
| | | Principal Amount (a) | Value ($) |
| U.S. Treasury Bonds: | | | |
| 3.625% 2/15/53 | | 3,390,000 | 3,054,178 |
| 3.625% 5/15/53 | | 3,610,000 | 3,255,769 |
| 4.125% 8/15/53 | | 230,000 | 226,909 |
| U.S. Treasury Notes: | | | |
| 4.375% 10/31/24 | | 1,205,000 | 1,192,526 |
| 4.625% 2/28/25 | | 2,600,000 | 2,582,023 |
| 4.625% 3/15/26 | | 4,740,000 | 4,736,482 |
| TOTAL U.S. TREASURY OBLIGATIONS (Cost $15,498,097) | | | 15,047,887 |
| | | | |
| U.S. Government Agency - Mortgage Securities - 105.4% |
| | | Principal Amount (a) | Value ($) |
| Fannie Mae - 39.7% | | | |
| 1.5% 11/1/35 to 6/1/51 (b) | | 10,480,626 | 8,574,319 |
| 2% 2/1/28 to 3/1/52 | | 56,797,760 | 47,289,584 |
| 2.5% 1/1/28 to 1/1/52 | | 62,390,947 | 53,571,750 |
| 3% 2/1/31 to 2/1/52 (c)(d) | | 34,597,537 | 30,330,935 |
| 3.5% 7/1/34 to 4/1/52 (c) | | 14,133,592 | 12,831,154 |
| 4% 3/1/46 to 5/1/52 | | 7,672,270 | 7,158,019 |
| 4.5% 5/1/39 to 11/1/52 | | 16,725,595 | 16,005,671 |
| 5% 7/1/52 to 4/1/53 (b) | | 11,306,209 | 11,028,178 |
| 5.5% 9/1/52 to 8/1/53 | | 14,946,571 | 14,804,975 |
| 6% 11/1/52 to 6/1/53 | | 4,628,431 | 4,666,443 |
TOTAL FANNIE MAE | | | 206,261,028 |
| Freddie Mac - 24.6% | | | |
| 1.5% 7/1/35 to 6/1/51 | | 21,630,769 | 16,623,686 |
| 2% 5/1/36 to 4/1/52 | | 39,394,468 | 32,331,049 |
| 2.5% 1/1/28 to 12/1/51 | | 27,752,480 | 23,669,756 |
| 3% 12/1/30 to 3/1/52 | | 10,767,085 | 9,540,750 |
| 3.5% 11/1/33 to 5/1/52 | | 8,345,147 | 7,567,011 |
| 4% 5/1/38 to 10/1/52 (d) | | 7,754,756 | 7,251,210 |
| 4.5% 10/1/39 to 7/1/52 | | 5,337,023 | 5,151,560 |
| 5% 9/1/52 to 8/1/53 | | 9,982,476 | 9,723,667 |
| 5.5% 10/1/52 to 8/1/53 (b) | | 11,612,809 | 11,536,397 |
| 6% 3/1/53 to 7/1/53 | | 3,113,409 | 3,159,398 |
| 6.5% 1/1/53 | | 1,261,858 | 1,283,055 |
TOTAL FREDDIE MAC | | | 127,837,539 |
| Ginnie Mae - 23.3% | | | |
| 2% 11/20/50 to 4/20/51 | | 11,030,109 | 9,129,979 |
| 2% 9/1/53 (e) | | 6,200,000 | 5,115,002 |
| 2% 9/1/53 (e) | | 8,150,000 | 6,723,753 |
| 2% 9/1/53 (e) | | 1,400,000 | 1,155,001 |
| 2% 9/1/53 (e) | | 1,950,000 | 1,608,751 |
| 2% 9/1/53 (e) | | 3,100,000 | 2,557,501 |
| 2% 9/1/53 (e) | | 2,850,000 | 2,351,251 |
| 2% 10/1/53 (e) | | 800,000 | 660,688 |
| 2% 10/1/53 (e) | | 10,200,000 | 8,423,769 |
| 2.5% 8/20/47 to 9/20/51 | | 4,234,759 | 3,609,950 |
| 2.5% 9/1/53 (e) | | 4,600,000 | 3,915,399 |
| 2.5% 9/1/53 (e) | | 4,600,000 | 3,915,399 |
| 2.5% 9/1/53 (e) | | 4,750,000 | 4,043,075 |
| 2.5% 9/1/53 (e) | | 3,700,000 | 3,149,342 |
| 2.5% 9/1/53 (e) | | 2,500,000 | 2,127,934 |
| 2.5% 10/1/53 (e) | | 2,200,000 | 1,874,387 |
| 3% 2/20/50 | | 231,669 | 203,354 |
| 3% 9/1/53 (e) | | 7,250,000 | 6,374,879 |
| 3% 9/1/53 (e) | | 4,850,000 | 4,264,574 |
| 3% 9/1/53 (e) | | 5,000,000 | 4,396,469 |
| 3% 9/1/53 (e) | | 1,825,000 | 1,604,711 |
| 3% 9/1/53 (e) | | 250,000 | 219,823 |
| 3% 10/1/53 (e) | | 7,050,000 | 6,203,152 |
| 3.5% 9/20/40 to 12/20/49 | | 354,443 | 328,245 |
| 3.5% 9/1/53 (e) | | 2,450,000 | 2,224,489 |
| 3.5% 9/1/53 (e) | | 150,000 | 136,193 |
| 3.5% 9/1/53 (e) | | 725,000 | 658,267 |
| 3.5% 9/1/53 (e) | | 1,900,000 | 1,725,114 |
| 3.5% 9/1/53 (e) | | 1,450,000 | 1,316,534 |
| 3.5% 9/1/53 (e) | | 1,500,000 | 1,361,932 |
| 3.5% 9/1/53 (e) | | 2,200,000 | 1,997,500 |
| 3.5% 9/1/53 (e) | | 1,475,000 | 1,339,233 |
| 3.5% 10/1/53 (e) | | 1,600,000 | 1,453,040 |
| 4% 10/20/40 to 5/20/49 | | 2,633,200 | 2,499,297 |
| 4% 9/1/53 (e) | | 2,650,000 | 2,469,506 |
| 4% 9/1/53 (e) | | 2,050,000 | 1,910,372 |
| 4.5% 9/1/53 (e) | | 5,050,000 | 4,812,563 |
| 4.5% 9/1/53 (e) | | 1,850,000 | 1,763,018 |
| 5% 4/20/48 to 6/20/48 | | 490,151 | 486,634 |
| 5% 9/1/53 (e) | | 4,750,000 | 4,622,214 |
| 5% 9/1/53 (e) | | 450,000 | 437,894 |
| 5.5% 9/1/53 (e) | | 3,150,000 | 3,118,992 |
| 5.5% 9/1/53 (e) | | 3,150,000 | 3,118,992 |
TOTAL GINNIE MAE | | | 121,408,172 |
| Uniform Mortgage Backed Securities - 17.8% | | | |
| 2% 9/1/53 (e) | | 5,150,000 | 4,099,732 |
| 2% 9/1/53 (e) | | 3,400,000 | 2,706,619 |
| 2% 9/1/53 (e) | | 8,500,000 | 6,766,548 |
| 2% 9/1/53 (e) | | 800,000 | 636,852 |
| 2% 9/1/53 (e) | | 2,300,000 | 1,830,948 |
| 2% 9/1/53 (e) | | 4,675,000 | 3,721,602 |
| 2% 9/1/53 (e) | | 3,300,000 | 2,627,013 |
| 2% 9/1/53 (e) | | 2,100,000 | 1,671,735 |
| 2% 9/1/53 (e) | | 1,600,000 | 1,273,703 |
| 2% 9/1/53 (e) | | 850,000 | 676,655 |
| 2% 9/1/53 (e) | | 600,000 | 477,639 |
| 2% 9/1/53 (e) | | 5,200,000 | 4,139,535 |
| 2% 10/1/53 (e) | | 8,250,000 | 6,576,878 |
| 2% 10/1/53 (e) | | 3,300,000 | 2,630,751 |
| 2% 10/1/53 (e) | | 3,300,000 | 2,630,751 |
| 2% 10/1/53 (e) | | 4,950,000 | 3,946,127 |
| 2.5% 9/1/53 (e) | | 2,800,000 | 2,320,609 |
| 2.5% 9/1/53 (e) | | 1,950,000 | 1,616,139 |
| 2.5% 9/1/53 (e) | | 1,150,000 | 953,107 |
| 2.5% 9/1/53 (e) | | 625,000 | 517,993 |
| 2.5% 9/1/53 (e) | | 900,000 | 745,910 |
| 3% 9/1/53 (e) | | 450,000 | 387,686 |
| 3% 9/1/53 (e) | | 900,000 | 775,371 |
| 3% 9/1/53 (e) | | 150,000 | 129,229 |
| 3% 9/1/53 (e) | | 800,000 | 689,219 |
| 3.5% 9/1/53 (e) | | 8,650,000 | 7,729,248 |
| 3.5% 9/1/53 (e) | | 1,700,000 | 1,519,043 |
| 4% 9/1/53 (e) | | 2,550,000 | 2,353,969 |
| 4% 9/1/53 (e) | | 1,425,000 | 1,315,453 |
| 4% 9/1/53 (e) | | 1,125,000 | 1,038,516 |
| 4% 9/1/53 (e) | | 3,400,000 | 3,138,625 |
| 4.5% 9/1/53 (e) | | 300,000 | 284,484 |
| 5% 9/1/38 (e) | | 2,700,000 | 2,666,883 |
| 5% 9/1/38 (e) | | 2,800,000 | 2,765,656 |
| 5% 9/1/53 (e) | | 5,250,000 | 5,090,654 |
| 5.5% 9/1/53 (e) | | 2,550,000 | 2,518,922 |
| 5.5% 9/1/53 (e) | | 1,100,000 | 1,086,594 |
| 5.5% 9/1/53 (e) | | 4,700,000 | 4,642,719 |
| 5.5% 9/1/53 (e) | | 2,000,000 | 1,975,625 |
TOTAL UNIFORM MORTGAGE BACKED SECURITIES | | | 92,674,742 |
| TOTAL U.S. GOVERNMENT AGENCY - MORTGAGE SECURITIES (Cost $585,590,432) | | | 548,181,481 |
| | | | |
| Asset-Backed Securities - 4.4% |
| | | Principal Amount (a) | Value ($) |
| American Express Credit Account Master Trust Series 2023-1 Class A, 4.87% 5/15/28 | | 679,000 | 675,074 |
| Bank of America Credit Card Master Trust Series 2023-A1 Class A1, 4.79% 5/15/28 | | 492,000 | 487,833 |
| Capital One Multi-Asset Execution Trust: | | | |
| Series 2019-A3 Class A3, 2.06% 8/15/28 | | 1,330,000 | 1,220,979 |
| Series 2023-A1 Class A, 4.42% 5/15/28 | | 1,400,000 | 1,374,860 |
| Carmax Auto Owner Trust Series 2023 2 Class A2A, 5.5% 6/15/26 | | 3,400,000 | 3,390,739 |
| CFMT LLC Series 2023 HB12 Class A, 4.25% 4/25/33 (f) | | 191,761 | 183,564 |
| CNH Equipment Trust Series 2023 A Class A2, 5.34% 9/15/26 | | 660,000 | 657,134 |
| Discover Card Execution Note Trust: | | | |
| Series 2022-A4, Class A, 5.03% 10/15/27 | | 2,100,000 | 2,090,820 |
| Series 2023-A2 Class A, 4.93% 6/15/28 | | 1,000,000 | 994,365 |
| Dllaa 2023-1A Series 2023-1A: | | | |
| Class A2, 5.93% 7/20/26 (f) | | 134,000 | 134,108 |
| Class A3, 5.64% 2/22/28 (f) | | 102,000 | 102,412 |
| Ford Credit Auto Owner Trust Series 2020-2 Class A, 1.06% 4/15/33 (f) | | 2,750,000 | 2,503,489 |
| Ford Credit Floorplan Master Owner Trust Series 2023-1 Class A1, 4.92% 5/15/28 (f) | | 789,000 | 779,550 |
| GM Financial Automobile Leasing Series 2023-2 Class A2A, 5.44% 10/20/25 | | 135,000 | 134,588 |
| GM Financial Consumer Automobile Re Series 2023 2 Class A3, 4.47% 2/16/28 | | 313,000 | 307,705 |
| Gm Financial Consumer Automobile Re Series 2023-3 Class A3, 5.45% 6/16/28 | | 214,000 | 215,144 |
| Gm Financial Leasing Trust 202 Series 2023-3 Class A3, 5.38% 11/20/26 | | 106,000 | 105,947 |
| GMF Floorplan Owner Revolving Trust Series 2023-1 Class A1, 5.34% 6/15/28 (f) | | 1,126,000 | 1,124,556 |
| Honda Auto Receivables Series 2023-2 Class A3, 4.93% 11/15/27 | | 219,000 | 217,494 |
| Honda Auto Receivables 2023-3 Series 2023-3 Class A3, 5.41% 2/18/28 | | 600,000 | 601,438 |
| Hyundai Auto Lease Securitizat Series 2023-B Class A2A, 5.47% 9/15/25 (f) | | 318,000 | 317,129 |
| Marlette Funding Trust Series 2022-1A Class A, 1.36% 4/15/32 (f) | | 22,057 | 22,015 |
| Marlette Funding Trust 2023-3 Series 2023-3A Class A, 6.49% 9/15/33 (f) | | 296,000 | 295,863 |
| Store Master Funding Series 2021-1A Class A1, 2.12% 6/20/51 (f) | | 791,333 | 659,927 |
| Tesla Auto Lease Trust 23-A Series 2023-A Class A3, 5.89% 6/22/26 (f) | | 247,000 | 246,363 |
| Toyota Lease Owner Trust Series 2023 A: | | | |
| Class A2, 5.3% 8/20/25 (f) | | 291,000 | 289,685 |
| Class A3, 4.93% 4/20/26 (f) | | 242,000 | 239,494 |
| Upstart Securitization Trust: | | | |
| Series 2021-3 Class A, 0.83% 7/20/31 (f) | | 32,731 | 32,570 |
| Series 2021-4 Class A, 0.84% 9/20/31 (f) | | 127,232 | 125,657 |
| Series 2021-5 Class A, 1.31% 11/20/31 (f) | | 227,045 | 223,165 |
| 3.12% 3/20/32 (f) | | 417,007 | 410,540 |
| Vcat 2021-Npl5 LLC Series 2021-NPL5 Class A1, 1.8677% 8/25/51 (f)(g) | | 425,664 | 405,109 |
| Verizon Master Trust: | | | |
| Series 2021-1 Class A, 0.5% 5/20/27 | | 800,000 | 769,810 |
| Series 2023 2 Class A, 4.89% 4/13/28 | | 700,000 | 693,224 |
| World Omni Auto Receivables Trust: | | | |
| Series 2023 B: | | | |
Class A2A, 5.25% 11/16/26 | | 140,000 | 139,324 |
Class A3, 4.66% 5/15/28 | | 256,000 | 252,392 |
| Series 2023-C Class A3, 5.15% 11/15/28 | | 130,000 | 129,788 |
| World Omni Automobile Lease Series 2023-A Class A2A, 5.47% 11/17/25 | | 260,000 | 259,103 |
| TOTAL ASSET-BACKED SECURITIES (Cost $23,014,445) | | | 22,812,957 |
| | | | |
| Collateralized Mortgage Obligations - 7.4% |
| | | Principal Amount (a) | Value ($) |
| Private Sponsor - 2.1% | | | |
| Ajax Mortgage Loan Trust sequential payer: | | | |
| Series 2021-C Class A, 2.115% 1/25/61 (f) | | 168,270 | 157,317 |
| Series 2021-E Class A1, 1.74% 12/25/60 (f) | | 1,326,417 | 1,104,406 |
| Binom Securitization Trust 202 Series 2022-RPL1 Class A1, 3% 2/25/61 (f) | | 329,618 | 294,605 |
| Brass PLC Series 2021-10A Class A1, 0.669% 4/16/69 (f)(g) | | 74,532 | 71,276 |
| BRAVO Residential Funding Trust sequential payer Series 2022-RPL1 Class A1, 2.75% 9/25/61 (f) | | 1,022,863 | 900,000 |
| Cascade Funding Mortgage Trust: | | | |
| Series 2021-EBO1 Class A, 0.9849% 11/25/50 (f)(g) | | 157,830 | 145,707 |
| Series 2021-HB5 Class A, 0.8006% 2/25/31 (f) | | 53,798 | 52,400 |
| Series 2021-HB7 Class A, 1.1512% 10/27/31 (f) | | 207,191 | 197,138 |
| Cfmt 2022-Ebo2 sequential payer Series 2022-EBO2 Class A, 3.169% 7/25/54 (f) | | 97,556 | 95,926 |
| CFMT 2022-Hb8 LLC sequential payer Series 2022-HB8 Class A, 3.75% 4/25/25 (f) | | 1,961,009 | 1,921,235 |
| Finance of America HECM Buyout sequential payer Series 2022-HB1 Class A, 2.6948% 2/25/32 (f)(g) | | 574,207 | 540,747 |
| MFA Trust sequential payer Series 2022-RPL1 Class A1, 3.3% 8/25/61 (f) | | 909,281 | 822,340 |
| New Residential Mortgage Loan Trust Series 2020-1A Class A1B, 3.5% 10/25/59 (f) | | 50,763 | 46,074 |
| New York Mortgage Trust sequential payer Series 2021-SP1 Class A1, 1.6696% 8/25/61 (f) | | 245,774 | 223,823 |
| NYMT Loan Trust sequential payer Series 2021-CP1 Class A1, 2.0424% 7/25/61 (f) | | 1,423,073 | 1,263,898 |
| Oceanview Trust sequential payer Series 2021-1 Class A, 1.2187% 12/29/51 (f)(g) | | 93,889 | 92,147 |
| Ocwen Ln Investment Trust 2023-Hb1 Series 2023-HB1 Class A, 3% 6/25/36 (f) | | 89,298 | 84,181 |
| Preston Ridge Partners Mortgage Trust: | | | |
| Series 2021-2 Class A1, 2.115% 3/25/26 (f) | | 210,163 | 198,965 |
| Series 2021-RPL1 Class A1, 1.319% 7/25/51 (f) | | 101,487 | 89,342 |
| Series 2021-RPL2 Class A1, 1.455% 10/25/51 (f)(g) | | 135,363 | 118,322 |
| RMF Buyout Issuance Trust: | | | |
| sequential payer: | | | |
Series 2021-HB1 Class A, 1.2586% 11/25/31 (f) | | 198,437 | 189,438 |
Series 2022-HB1 Class A, 4.272% 4/25/32 (f) | | 108,654 | 102,491 |
| Series 2020-HB1 Class A1, 1.7188% 10/25/50 (f) | | 271,611 | 249,737 |
| Towd Point Mortgage Trust sequential payer: | | | |
| Series 2021-1 Class A1, 2.25% 11/25/61 (f)(g) | | 2,135,416 | 1,908,763 |
| Series 2022-K147 Class A2, 3.75% 7/25/62 (f) | | 435,819 | 397,320 |
TOTAL PRIVATE SPONSOR | | | 11,267,598 |
| U.S. Government Agency - 5.3% | | | |
| Fannie Mae: | | | |
| planned amortization class Series 2021-69 Class JK, 1.5% 10/25/51 | | 294,935 | 236,510 |
| sequential payer: | | | |
Series 2020-101 Class BA, 1.5% 9/25/45 | | 473,175 | 395,035 |
Series 2020-43 Class MA, 2% 1/25/45 | | 406,450 | 355,946 |
Series 2020-49 Class JA, 2% 8/25/44 | | 254,330 | 225,837 |
Series 2020-80 Class BA, 1.5% 3/25/45 | | 633,354 | 531,444 |
Series 2021-68 Class A, 2% 7/25/49 | | 502,825 | 403,266 |
Series 2021-85 Class L, 2.5% 8/25/48 | | 274,848 | 237,096 |
Series 2021-95: | | | |
Class 0, 2.5% 9/25/48 | | 565,879 | 485,944 |
Class BA, 2.5% 6/25/49 | | 847,221 | 728,504 |
Series 2021-96 Class HA, 2.5% 2/25/50 | | 453,371 | 393,559 |
Series 2022-1 Class KA, 3% 5/25/48 | | 279,704 | 248,658 |
Series 2022-11 Class B, 3% 6/25/49 | | 319,567 | 286,745 |
Series 2022-13: | | | |
Class HA, 3% 8/25/46 | | 323,323 | 295,061 |
Class JA, 3% 5/25/48 | | 302,605 | 270,104 |
Series 2022-3: | | | |
Class D, 2% 2/25/48 | | 797,143 | 683,480 |
Class N, 2% 10/25/47 | | 2,238,820 | 1,871,928 |
Series 2022-30 Class E, 4.5% 7/25/48 | | 807,344 | 775,876 |
Series 2022-4 Class B, 2.5% 5/25/49 | | 331,125 | 284,257 |
Series 2022-49 Class TC, 4% 12/25/48 | | 258,317 | 246,756 |
Series 2022-7: | | | |
Class A, 3% 5/25/48 | | 398,332 | 354,161 |
Class E, 2.5% 11/25/47 | | 841,065 | 736,618 |
Series 2022-9 Class BA, 3% 5/25/48 | | 243,400 | 217,011 |
| Series 2013-44 Class DJ, 1.85% 5/25/33 | | 94,466 | 84,325 |
| Series 2020-45 Class JL, 3% 7/25/40 | | 24,720 | 22,257 |
| Series 2021-59 Class H, 2% 6/25/48 | | 285,110 | 232,418 |
| Series 2021-66: | | | |
Class DA, 2% 1/25/48 | | 307,995 | 251,894 |
Class DM, 2% 1/25/48 | | 327,310 | 267,691 |
| Freddie Mac: | | | |
| planned amortization class: | | | |
Series 2021-5141 Class JM, 1.5% 4/25/51 | | 215,762 | 172,718 |
Series 2021-5148: | | | |
Class AD, 1.5% 10/25/51 | | 290,784 | 233,702 |
Class PC, 1.5% 10/25/51 | | 290,712 | 231,116 |
| sequential payer: | | | |
Series 2020-4993 Class LA, 2% 8/25/44 | | 389,491 | 344,107 |
Series 2020-5018: | | | |
Class LC, 3% 10/25/40 | | 166,114 | 149,579 |
Class LY, 3% 10/25/40 | | 125,869 | 113,363 |
Series 2021-5175 Class CB, 2.5% 4/25/50 | | 1,620,132 | 1,387,416 |
Series 2021-5180 Class KA, 2.5% 10/25/47 | | 327,164 | 286,819 |
Series 2022-5189: | | | |
Class DA, 2.5% 5/25/49 | | 221,286 | 189,205 |
Class TP, 2.5% 5/25/49 | | 240,975 | 208,302 |
Series 2022-5190: | | | |
Class BA, 2.5% 11/25/47 | | 203,705 | 175,952 |
Class CA, 2.5% 5/25/49 | | 201,529 | 172,177 |
Series 2022-5191 Class CA, 2.5% 4/25/50 | | 385,162 | 330,411 |
Series 2022-5197: | | | |
Class A, 2.5% 6/25/49 | | 201,529 | 174,154 |
Class DA, 2.5% 11/25/47 | | 154,713 | 133,668 |
Series 2022-5198 Class BA, 2.5% 11/25/47 | | 764,158 | 668,460 |
Series 2022-5201 Class EB, 3% 2/25/48 | | 4,250,722 | 3,842,314 |
Series 2022-5202: | | | |
Class AG, 3% 1/25/49 | | 153,253 | 136,495 |
Class LB, 2.5% 10/25/47 | | 165,182 | 142,366 |
Class UA, 3% 4/25/50 | | 349,650 | 310,029 |
| Series 2020-5041 Class LB, 3% 11/25/40 | | 282,360 | 254,188 |
| Series 2021-5083 Class VA, 1% 8/15/38 | | 1,011,604 | 934,319 |
| Series 2021-5176 Class AG, 2% 1/25/47 | | 1,230,361 | 1,048,550 |
| Series 2021-5182 Class A, 2.5% 10/25/48 | | 2,119,274 | 1,818,258 |
| Series 2022-5210 Class AB, 3% 1/25/42 | | 449,273 | 406,603 |
| Series 2022-5214 Class CB, 3.25% 4/25/52 | | 1,134,457 | 1,032,115 |
| Series 2022-5236 Class P, 5% 4/25/48 | | 372,598 | 366,162 |
| Series 2022-5266 Class CD, 4.5% 10/25/44 | | 224,107 | 217,299 |
| Freddie Mac Multi-family Structured pass-thru certificates: | | | |
| planned amortization class Series 20XX-5165 Class PC, 1.5% 11/25/51 | | 370,184 | 298,625 |
| sequential payer Series 2021-5159 Class GC, 2% 11/25/47 | | 262,723 | 224,638 |
| Ginnie Mae guaranteed REMIC pass-thru certificates: | | | |
| floater Series 2019-23 Class NF, CME Term SOFR 1 Month Index + 0.560% 5.8785% 2/20/49 (g)(h) | | 95,644 | 93,259 |
| planned amortization class Series 2016-69 Class WA, 3% 2/20/46 | | 21,554 | 19,559 |
| sequential payer: | | | |
Series 2017-139 Class BA, 3% 9/20/47 | | 129,245 | 115,359 |
Series 2018-H12 Class HA, 3.25% 8/20/68 (i) | | 46,494 | 44,287 |
TOTAL U.S. GOVERNMENT AGENCY | | | 27,397,955 |
| TOTAL COLLATERALIZED MORTGAGE OBLIGATIONS (Cost $40,102,371) | | | 38,665,553 |
| | | | |
| Commercial Mortgage Securities - 15.9% |
| | | Principal Amount (a) | Value ($) |
| BAMLL Commercial Mortgage Securities Trust: | | | |
| floater Series 2022-DKLX: | | | |
Class A, CME Term SOFR 1 Month Index + 1.150% 6.461% 1/15/39 (f)(g)(h) | | 275,000 | 267,519 |
Class B, CME Term SOFR 1 Month Index + 1.550% 6.861% 1/15/39 (f)(g)(h) | | 100,000 | 96,751 |
| sequential payer Series 2019-BPR: | | | |
Class AMP, 3.287% 11/5/32 (f) | | 600,000 | 553,706 |
Class ANM, 3.112% 11/5/32 (f) | | 100,000 | 91,086 |
| BANK: | | | |
| sequential payer: | | | |
Series 2017-BNK9 Class A4, 3.538% 11/15/54 | | 1,059,000 | 973,632 |
Series 2018-BN10: | | | |
| Class A4, 3.428% 2/15/61 | | 233,271 | 214,508 |
| Class A5, 3.688% 2/15/61 | | 1,900,000 | 1,755,720 |
Series 2018-BN14 Class ASB, 4.185% 9/15/60 | | 316,000 | 305,130 |
Series 2023-5YR1: | | | |
| Class A2, 5.779% 4/15/56 | | 400,000 | 399,082 |
| Class A3, 6.26% 4/15/56 | | 1,400,000 | 1,422,343 |
| Series 2020-BN25 Class XB, 0.532% 1/15/63 (g)(j) | | 2,000,000 | 46,705 |
| Series 2021-BN33 Class XA, 1.1682% 5/15/64 (g)(j) | | 3,012,181 | 162,815 |
| BANK Trust sequential payer Series 2017-BNK5 Class A5, 3.39% 6/15/60 | | 600,000 | 553,064 |
| Benchmark 2023-V3 Mtg Trust sequential payer Series 2023-V3 Class A3, 6.3629% 7/15/56 | | 400,000 | 409,963 |
| Benchmark Mortgage Trust: | | | |
| sequential payer: | | | |
Series 2018-B1 Class ASB, 3.602% 1/15/51 | | 352,465 | 334,372 |
Series 2018-B2 Class ASB, 3.7802% 2/15/51 | | 327,653 | 311,721 |
Series 2019-B10 Class A4, 3.717% 3/15/62 | | 29,000 | 26,259 |
| Series 2019-B12 Class XA, 1.1616% 8/15/52 (g)(j) | | 928,647 | 33,842 |
| Series 2019-B14 Class XA, 0.8991% 12/15/62 (g)(j) | | 9,651,072 | 274,395 |
| Series 2020-B17 Class XA, 1.5369% 3/15/53 (g)(j) | | 2,090,636 | 112,340 |
| Series 2020-B18 Class XA, 1.912% 7/15/53 (g)(j) | | 1,477,917 | 103,078 |
| BFLD Trust floater sequential payer Series 2020-OBRK Class A, CME Term SOFR 1 Month Index + 2.160% 7.4745% 11/15/28 (f)(g)(h) | | 94,000 | 93,729 |
| BLOX Trust floater sequential payer Series 2021-BLOX Class A, CME Term SOFR 1 Month Index + 0.860% 6.1755% 9/15/26 (f)(g)(h) | | 531,000 | 507,757 |
| Bmo 2023-5C1 Mtg Trust sequential payer Series 2023-5C1 Class A3, 6.534% 8/15/56 | | 500,000 | 514,617 |
| BPR Trust floater Series 2022-OANA: | | | |
| Class A, CME Term SOFR 1 Month Index + 1.890% 7.2085% 4/15/37 (f)(g)(h) | | 1,680,000 | 1,649,646 |
| Class B, CME Term SOFR 1 Month Index + 2.440% 7.7575% 4/15/37 (f)(g)(h) | | 54,000 | 52,612 |
| BX Commercial Mortgage Trust: | | | |
| floater: | | | |
Series 2021-PAC Class A, CME Term SOFR 1 Month Index + 0.800% 6.1136% 10/15/36 (f)(g)(h) | | 475,000 | 463,972 |
Series 2021-VINO Class A, CME Term SOFR 1 Month Index + 0.760% 6.0768% 5/15/38 (f)(g)(h) | | 302,331 | 296,447 |
| floater sequential payer Series 2019-CALM Class A, CME Term SOFR 1 Month Index + 0.990% 6.3005% 11/15/32 (f)(g)(h) | | 6,073 | 6,036 |
| Bx Commercial Mortgage Trust 2 floater sequential payer Series 2019-IMC Class A, CME Term SOFR 1 Month Index + 1.110% 6.4245% 4/15/34 (f)(g)(h) | | 119,000 | 118,534 |
| BX Trust: | | | |
| floater: | | | |
Series 2019-XL: | | | |
| Class B, CME Term SOFR 1 Month Index + 1.190% 6.505% 10/15/36 (f)(g)(h) | | 680,000 | 675,699 |
| Class D, CME Term SOFR 1 Month Index + 1.560% 6.875% 10/15/36 (f)(g)(h) | | 170,000 | 168,495 |
Series 2022-GPA Class A, CME Term SOFR 1 Month Index + 2.160% 7.4755% 8/15/39 (f)(g)(h) | | 232,000 | 232,000 |
Series 2022-IND Class A, CME Term SOFR 1 Month Index + 1.490% 6.8015% 4/15/37 (f)(g)(h) | | 423,528 | 421,536 |
| floater sequential payer: | | | |
Series 2019-XL Class A, CME Term SOFR 1 Month Index + 1.030% 6.345% 10/15/36 (f)(g)(h) | | 3,865,047 | 3,855,266 |
Series 2021-MFM1 Class A, CME Term SOFR 1 Month Index + 0.810% 6.1245% 1/15/34 (f)(g)(h) | | 100,371 | 98,795 |
| CAMB Commercial Mortgage Trust floater Series 2019-LIFE Class A, CME Term SOFR 1 Month Index + 1.180% 6.4955% 12/15/37 (f)(g)(h) | | 652,000 | 648,702 |
| CD Commercial Mortgage Trust sequential payer Series 2017-CD6 Class ASB, 3.332% 11/13/50 | | 1,611,470 | 1,527,705 |
| CFCRE Commercial Mortgage Trust sequential payer: | | | |
| Series 2016-C7 Class A2, 3.5853% 12/10/54 | | 439,884 | 412,583 |
| Series 2017-C8 Class A3, 3.3048% 6/15/50 | | 694,202 | 642,238 |
| CGDB Commercial Mortgage Trust floater Series 2019-MOB: | | | |
| Class A, CME Term SOFR 1 Month Index + 1.060% 6.375% 11/15/36 (f)(g)(h) | | 100,000 | 98,301 |
| Class B, CME Term SOFR 1 Month Index + 1.360% 6.675% 11/15/36 (f)(g)(h) | | 100,000 | 97,329 |
| Citigroup Commercial Mortgage Trust: | | | |
| sequential payer: | | | |
Series 2014-GC21 Class AAB, 3.477% 5/10/47 | | 61,277 | 60,924 |
Series 2017-P7 Class AAB, 3.509% 4/14/50 | | 280,176 | 266,217 |
| Series 2013-GC17 Class A/S, 4.544% 11/10/46 | | 500,000 | 495,963 |
| Series 2015-GC33 Class AAB, 3.522% 9/10/58 | | 123,181 | 119,116 |
| Series 2019-GC41 Class XA, 1.1682% 8/10/56 (g)(j) | | 4,519,019 | 180,734 |
| COMM Mortgage Trust sequential payer: | | | |
| Series 2015 LC19 Class A3, 2.922% 2/10/48 | | 398,980 | 385,685 |
| Series 2016-COR1 Class ASB, 2.972% 10/10/49 | | 446,759 | 425,063 |
| Credit Suisse Mortgage Trust: | | | |
| floater Series 2019-ICE4: | | | |
Class A, CME Term SOFR 1 Month Index + 1.020% 6.338% 5/15/36 (f)(g)(h) | | 2,483,821 | 2,480,975 |
Class C, CME Term SOFR 1 Month Index + 1.470% 6.788% 5/15/36 (f)(g)(h) | | 486,789 | 483,377 |
| Series 2018-SITE Class A, 4.284% 4/15/36 (f) | | 100,000 | 97,098 |
| CSAIL Commercial Mortgage Trust sequential payer: | | | |
| Series 2015-C4 Class A3, 3.5438% 11/15/48 | | 992,991 | 955,164 |
| Series 2016-C7 Class ASB, 3.3143% 11/15/49 | | 498,979 | 480,013 |
| DBJPM Mortgage Trust sequential payer Series 2017-C6 Class ASB, 3.121% 6/10/50 | | 528,731 | 502,075 |
| ELP Commercial Mortgage Trust floater Series 2021-ELP: | | | |
| Class A, CME Term SOFR 1 Month Index + 0.810% 6.1265% 11/15/38 (f)(g)(h) | | 950,000 | 929,735 |
| Class B, CME Term SOFR 1 Month Index + 1.230% 6.5457% 11/15/38 (f)(g)(h) | | 662,000 | 647,048 |
| Extended Stay America Trust floater Series 2021-ESH Class A, CME Term SOFR 1 Month Index + 1.190% 6.5045% 7/15/38 (f)(g)(h) | | 635,570 | 629,445 |
| Freddie Mac: | | | |
| sequential payer: | | | |
Series 2015-K049 Class A2, 3.01% 7/25/25 | | 43,000 | 41,263 |
Series 2015-K051 Class A2, 3.308% 9/25/25 | | 68,000 | 65,449 |
Series 2016-K054 Class A2, 2.745% 1/25/26 | | 1,151,194 | 1,090,210 |
Series 2020-K117 Class A2, 1.406% 8/25/30 | | 900,000 | 720,387 |
Series 2021-K126 Class A2, 2.074% 1/25/31 | | 800,000 | 665,054 |
Series 2021-K127 Class A2, 2.108% 1/25/31 | | 1,600,000 | 1,331,830 |
Series 2021-K136 Class A2, 2.127% 11/25/31 | | 200,000 | 163,878 |
Series 2022-150 Class A2, 3.71% 9/25/32 | | 1,300,000 | 1,195,377 |
Series 2022-K140 Class A2, 2.25% 1/25/32 | | 285,000 | 234,841 |
Series 2022-K141 Class A2, 2.25% 2/25/32 | | 454,000 | 374,157 |
Series 2022-K142 Class A2, 2.4% 3/25/32 | | 2,159,000 | 1,798,012 |
Series 2022-K143 Class A2, 2.35% 3/25/32 | | 200,000 | 165,777 |
Series 2022-K144 Class A2, 2.45% 4/25/32 | | 2,928,000 | 2,444,094 |
Series 2022-K145 Class A2, 2.58% 5/25/32 | | 100,000 | 84,205 |
Series 2022-K146 Class A2, 2.92% 6/25/32 | | 969,000 | 838,496 |
Series 2022-K147 Class A2, 3% 6/25/32 | | 1,208,000 | 1,051,683 |
Series 2022-K747 Class A2, 2.05% 11/25/28 | | 1,000,000 | 874,444 |
Series 2022-K750 Class A2, 3% 9/25/29 | | 4,110,000 | 3,731,512 |
Series 2023-K751 Class A2, 4.412% 3/25/30 | | 1,260,000 | 1,229,100 |
| Series 2017-K727 Class A2, 2.946% 7/25/24 | | 797,798 | 780,391 |
| Series 2021-K134 Class A2, 2.243% 10/25/31 | | 2,530,000 | 2,095,090 |
| Series 2022 K748 Class A2, 2.26% 1/25/29 | | 1,425,000 | 1,254,132 |
| Series K047 Class A2, 3.329% 5/25/25 | | 1,873,908 | 1,811,845 |
| Series K063 Class A2, 3.43% 1/25/27 | | 700,000 | 666,520 |
| Series K086 Class A2, 3.859% 11/25/28 | | 2,277,000 | 2,180,695 |
| Freddie Mac Multi-family Structured pass-thru certificates: | | | |
| sequential payer Series 2015 K045 Class A2, 3.023% 1/25/25 | | 1,134,580 | 1,096,814 |
| Series K044 Class A2, 2.811% 1/25/25 | | 1,143,632 | 1,103,144 |
| GS Mortgage Securities Trust: | | | |
| floater: | | | |
Series 2018-3PCK Class A, CME Term SOFR 1 Month Index + 2.060% 7.3745% 9/15/31 (f)(g)(h) | | 675,680 | 666,418 |
Series 2018-HART Class A, CME Term SOFR 1 Month Index + 1.140% 6.463% 10/15/31 (f)(g)(h) | | 1,207,275 | 1,110,693 |
Series 2021-IP Class A, CME Term SOFR 1 Month Index + 1.060% 6.3755% 10/15/36 (f)(g)(h) | | 963,000 | 915,894 |
| sequential payer: | | | |
Series 2016-GC34 Class AAB, 3.278% 10/10/48 | | 30,982 | 30,031 |
Series 2017-GS6 Class A2, 3.164% 5/10/50 | | 190,518 | 175,797 |
Series 2018-GS10 Class A5, 4.155% 7/10/51 | | 200,000 | 184,537 |
Series 2018-GS9 Class A4, 3.992% 3/10/51 | | 300,000 | 278,351 |
| Series 2011-GC5 Class A/S, 5.209% 8/10/44 (f)(g) | | 743,998 | 698,894 |
| Series 2013-GC13 Class A/S, 3.9838% 7/10/46 (f)(g) | | 95,333 | 90,661 |
| Intown Mortgage Trust floater sequential payer Series 2022-STAY Class A, CME Term SOFR 1 Month Index + 2.480% 7.7986% 8/15/39 (f)(g)(h) | | 1,857,000 | 1,858,161 |
| J.P. Morgan Chase Commercial Mortgage Securities Trust floater Series 2012-NLP Class A, CME Term SOFR 1 Month Index + 0.590% 5.907% 4/15/37 (f)(g)(h) | | 976,280 | 908,891 |
| JPMBB Commercial Mortgage Securities Trust sequential payer: | | | |
| Series 2014-C21 Class A4, 3.4927% 8/15/47 | | 290,320 | 285,828 |
| Series 2014-C22 Class ASB, 3.5036% 9/15/47 | | 49,587 | 48,973 |
| JPMDB Commercial Mortgage Securities Trust sequential payer: | | | |
| Series 2017-C5 Class ASB, 3.4919% 3/15/50 | | 293,915 | 279,638 |
| Series 2018-C8 Class ASB, 4.145% 6/15/51 | | 966,206 | 919,815 |
| JPMorgan Chase Commercial Mortgage Securities Trust: | | | |
| sequential payer Series 2020-NNN Class AFX, 2.8123% 1/16/37 (f) | | 670,000 | 607,662 |
| Series 2013-C16 Class A/S, 4.5169% 12/15/46 | | 37,000 | 36,787 |
| Series 2013-LC11 Class A/S, 3.216% 4/15/46 | | 150,054 | 141,049 |
| Series 2018-WPT Class AFX, 4.2475% 7/5/33 (f) | | 59,000 | 53,347 |
| Life Financial Services Trust floater Series 2022-BMR2 Class B, CME Term SOFR 1 Month Index + 1.790% 7.1044% 5/15/39 (f)(g)(h) | | 400,000 | 391,350 |
| Morgan Stanley BAML Trust sequential payer: | | | |
| Series 2014-C19 Class ASB, 3.326% 12/15/47 | | 363,672 | 358,486 |
| Series 2016-C28 Class A3, 3.272% 1/15/49 | | 75,875 | 71,257 |
| Series 2016-C30 Class ASB, 2.729% 9/15/49 | | 533,713 | 510,410 |
| Morgan Stanley Capital I Trust: | | | |
| floater sequential payer Series 2019-NUGS Class A, CME Term SOFR 1 Month Index + 1.060% 6.3755% 12/15/36 (f)(g)(h) | | 1,000,000 | 825,000 |
| sequential payer: | | | |
Series 2017-H1 Class A4, 3.259% 6/15/50 | | 700,000 | 641,775 |
Series 2017-HR2: | | | |
| Class A3, 3.33% 12/15/50 | | 297,342 | 271,494 |
| Class A4, 3.587% 12/15/50 | | 340,000 | 310,498 |
Series 2019-L2 Class A3, 3.806% 3/15/52 | | 500,000 | 459,352 |
Series 2019-MEAD Class A, 3.17% 11/10/36 (f) | | 279,000 | 255,222 |
| Series 2018-H4 Class A4, 4.31% 12/15/51 | | 600,000 | 560,084 |
| Series 2019-MEAD Class B, 3.283% 11/10/36 (f)(g) | | 26,000 | 22,921 |
| Series 2021-L6 Class XA, 1.328% 6/15/54 (g)(j) | | 981,602 | 56,584 |
| MSCCG Trust floater Series 2018-SELF Class A, CME Term SOFR 1 Month Index + 0.940% 6.258% 10/15/37 (f)(g)(h) | | 267,764 | 266,494 |
| Natixis Commercial Mortgage Securities Trust sequential payer Series 2020-2PAC Class A, 2.966% 12/15/38 (f) | | 790,017 | 736,689 |
| OPG Trust floater Series 2021-PORT Class A, CME Term SOFR 1 Month Index + 0.590% 5.9095% 10/15/36 (f)(g)(h) | | 599,258 | 583,842 |
| RLGH Trust floater Series 2021-TROT Class A, CME Term SOFR 1 Month Index + 0.910% 6.2255% 4/15/36 (f)(g)(h) | | 1,900,000 | 1,846,318 |
| Sfs Auto Receivables Securitiz sequential payer Series 2023-1A Class A2A, 5.89% 3/22/27 (f) | | 185,000 | 184,881 |
| SREIT Trust floater: | | | |
| Series 2021-FLWR Class A, CME Term SOFR 1 Month Index + 0.690% 6.001% 7/15/36 (f)(g)(h) | | 212,000 | 207,209 |
| Series 2021-MFP: | | | |
Class A, CME Term SOFR 1 Month Index + 0.840% 6.1558% 11/15/38 (f)(g)(h) | | 151,000 | 147,968 |
Class B, CME Term SOFR 1 Month Index + 1.190% 6.5048% 11/15/38 (f)(g)(h) | | 226,000 | 221,714 |
| UBS Commercial Mortgage Trust sequential payer: | | | |
| Series 2017-C1 Class ASB, 3.462% 11/15/50 | | 84,645 | 80,140 |
| Series 2017-C3 Class ASB, 3.215% 8/15/50 | | 1,124,753 | 1,070,373 |
| Series 2018-C12 Class ASB, 4.1945% 8/15/51 | | 1,749,998 | 1,694,359 |
| VLS Commercial Mortgage Trust Series 2020-LAB Class X, 0.5162% 10/10/42 (f)(g)(j) | | 1,600,000 | 39,343 |
| Wells Fargo Commercial Mortgage Trust: | | | |
| floater Series 2021-FCMT Class A, CME Term SOFR 1 Month Index + 1.310% 6.6255% 5/15/31 (f)(g)(h) | | 845,000 | 808,770 |
| sequential payer Series 2014-LC16 Class A5, 3.817% 8/15/50 | | 1,100,000 | 1,073,914 |
| Series 2018-C46 Class XA, 1.0822% 8/15/51 (g)(j) | | 906,699 | 21,939 |
| Series 2019-C54 Class XA, 0.9519% 12/15/52 (g)(j) | | 5,884,772 | 228,773 |
| WF-RBS Commercial Mortgage Trust Series 2013-C16 Class A/S, 4.668% 9/15/46 (g) | | 315,866 | 312,702 |
| TOTAL COMMERCIAL MORTGAGE SECURITIES (Cost $85,468,424) | | | 82,808,350 |
| | | | |
| Money Market Funds - 2.5% |
| | | Shares | Value ($) |
Fidelity Cash Central Fund 5.43% (k) (Cost $12,836,862) | | 12,834,295 | 12,836,862 |
| | | | |
| Purchased Swaptions - 0.2% |
| | Expiration Date | Notional Amount (a) | Value ($) |
| Put Options - 0.1% | | | | |
| Option on an interest rate swap with JPMorgan Chase Bank N.A. to pay annually a fixed rate of 2.8625% and receive annually a floating rate based on the U.S. Secured Overnight Fin. Rate (SOFR) Index, expiring April 2033 | 4/05/28 | | 1,400,000 | 72,776 |
| Option on an interest rate swap with JPMorgan Chase Bank N.A. to pay annually a fixed rate of 3.07% and receive annually a floating rate based on the U.S. Secured Overnight Fin. Rate (SOFR) Index, expiring April 2033 | 4/21/28 | | 2,900,000 | 138,846 |
| Option on an interest rate swap with JPMorgan Chase Bank N.A. to pay annually a fixed rate of 3.2575% and receive annually a floating rate based on the U.S. Secured Overnight Fin. Rate (SOFR) Index, expiring June 2033 | 6/08/28 | | 2,900,000 | 128,548 |
| Option on an interest rate swap with JPMorgan Chase Bank N.A. to pay annually a fixed rate of 3.305% and receive annually a floating rate based on the U.S. Secured Overnight Fin. Rate (SOFR) Index, expiring May 2033 | 5/22/28 | | 2,800,000 | 121,897 |
| | | | | |
| TOTAL PUT OPTIONS | | | | 462,067 |
| Call Options - 0.1% | | | | |
| Option on an interest rate swap with JPMorgan Chase Bank N.A. to receive annually a fixed rate of 2.8625% and pay annually a floating rate based on the U.S. Secured Overnight Fin. Rate (SOFR) Index, expiring April 2033 | 4/05/28 | | 1,400,000 | 40,936 |
| Option on an interest rate swap with JPMorgan Chase Bank N.A. to receive annually a fixed rate of 3.07% and pay annually a floating rate based on the U.S. Secured Overnight Fin. Rate (SOFR) Index, expiring April 2033 | 4/21/28 | | 2,900,000 | 95,849 |
| Option on an interest rate swap with JPMorgan Chase Bank N.A. to receive annually a fixed rate of 3.2575% and pay annually a floating rate based on the U.S. Secured Overnight Fin. Rate (SOFR) Index, expiring June 2033 | 6/08/28 | | 2,900,000 | 105,783 |
| Option on an interest rate swap with JPMorgan Chase Bank N.A. to receive annually a fixed rate of 3.305% and pay annually a floating rate based on the U.S. Secured Overnight Fin. Rate (SOFR) Index, expiring May 2033 | 5/22/28 | | 2,800,000 | 105,144 |
| | | | | |
| TOTAL CALL OPTIONS | | | | 347,712 |
TOTAL PURCHASED SWAPTIONS (Cost $812,162) | | | | 809,779 |
| TOTAL INVESTMENT IN SECURITIES - 138.7% (Cost $763,322,793) | 721,162,869 |
NET OTHER ASSETS (LIABILITIES) - (38.7)% | (201,187,681) |
| NET ASSETS - 100.0% | 519,975,188 |
| | |
| TBA Sale Commitments |
| | Principal Amount (a) | Value ($) |
| Ginnie Mae | | |
| 2% 9/1/53 | (800,000) | (660,000) |
| 2% 9/1/53 | (10,200,000) | (8,415,005) |
| 2.5% 9/1/53 | (2,200,000) | (1,872,582) |
| 3% 9/1/53 | (7,050,000) | (6,199,021) |
| 3.5% 9/1/53 | (1,600,000) | (1,452,727) |
| | | |
| TOTAL GINNIE MAE | | (18,599,335) |
| | | |
| Uniform Mortgage Backed Securities | | |
| 2% 9/1/53 | (200,000) | (159,213) |
| 2% 9/1/53 | (8,250,000) | (6,567,532) |
| 2% 9/1/53 | (3,300,000) | (2,627,013) |
| 2% 9/1/53 | (3,300,000) | (2,627,013) |
| 2% 9/1/53 | (5,200,000) | (4,139,535) |
| 2% 9/1/53 | (4,950,000) | (3,940,519) |
| 2.5% 9/1/53 | (700,000) | (580,152) |
| 2.5% 9/1/53 | (900,000) | (745,910) |
| 2.5% 9/1/53 | (1,100,000) | (911,668) |
| 3% 9/1/53 | (200,000) | (172,305) |
| 4% 9/1/53 | (300,000) | (276,938) |
| 4.5% 9/1/53 | (200,000) | (189,656) |
| 4.5% 9/1/53 | (3,500,000) | (3,318,984) |
| 5% 9/1/53 | (1,100,000) | (1,066,613) |
| 5% 9/1/53 | (400,000) | (387,859) |
| 5% 9/1/53 | (2,800,000) | (2,715,016) |
| | | |
| TOTAL UNIFORM MORTGAGE BACKED SECURITIES | | (30,425,926) |
| | | |
TOTAL TBA SALE COMMITMENTS (Proceeds $48,557,631) | | (49,025,261) |
| Futures Contracts |
| | Number of contracts | Expiration Date | Notional Amount ($) | Value ($) | Unrealized Appreciation/ (Depreciation) ($) |
| Purchased | | | | | |
| | | | | | |
| Treasury Contracts | | | | | |
| CBOT 2-Year U.S. Treasury Note Contracts (United States) | 73 | Dec 2023 | 14,877,742 | 43,200 | 43,200 |
| CBOT Ultra Long Term U.S. Treasury Bond Contracts (United States) | 4 | Dec 2023 | 517,875 | 8,085 | 8,085 |
| | | | | | |
| TOTAL PURCHASED | | | | | 51,285 |
| | | | | | |
| Sold | | | | | |
| | | | | | |
| Treasury Contracts | | | | | |
| CBOT 10-Year U.S. Treasury Note Contracts (United States) | 198 | Dec 2023 | 21,984,188 | (217,237) | (217,237) |
| CBOT 5-Year U.S. Treasury Note Contracts (United States) | 349 | Dec 2023 | 37,315,734 | (257,959) | (257,959) |
| CBOT Long Term U.S. Treasury Bond Contracts (United States) | 80 | Dec 2023 | 9,735,000 | (138,928) | (138,928) |
| | | | | | |
| TOTAL SOLD | | | | | (614,124) |
| | | | | | |
| TOTAL FUTURES CONTRACTS | | | | | (562,839) |
| The notional amount of futures purchased as a percentage of Net Assets is 3.0% |
| The notional amount of futures sold as a percentage of Net Assets is 13.3% |
For the period, the average monthly notional amount at value for futures contracts in the aggregate was $57,554,408.
| Credit Default Swaps |
| Underlying Reference | Rating(1) | Maturity Date | Clearinghouse / Counterparty | Fixed Payment Received/ (Paid) | Payment Frequency | Notional Amount(2)(3) | Value ($)(1) | Upfront Premium Received/ (Paid) ($) | Unrealized Appreciation/ (Depreciation) ($) |
| Buy Protection | | | | | | | | | | |
| CMBX N.A. AAA Index Series 13 | | Dec 2072 | Citigroup Global Markets Ltd. | (0.5%) | Monthly | | 20,000 | 347 | (60) | 287 |
| CMBX N.A. AAA Index Series 13 | | Dec 2072 | Citigroup Global Markets Ltd. | (0.5%) | Monthly | | 350,000 | 6,081 | (3,186) | 2,895 |
| CMBX N.A. AAA Index Series 13 | | Dec 2072 | Citigroup Global Markets Ltd. | (0.5%) | Monthly | | 1,020,000 | 17,721 | (11,123) | 6,598 |
| CMBX N.A. AAA Index Series 13 | | Dec 2072 | Morgan Stanley Capital Services LLC | (0.5%) | Monthly | | 1,300,000 | 22,586 | (8,801) | 13,785 |
| CMBX N.A. AAA Index Series 13 | | Dec 2072 | Morgan Stanley Capital Services LLC | (0.5%) | Monthly | | 1,410,000 | 24,497 | (9,935) | 14,562 |
| CMBX N.A. BBB Index Series 16 | | Apr 2065 | JPMorgan Securities LLC | (3%) | Monthly | | 140,000 | 33,674 | (40,287) | (6,613) |
| CMBX N.A. BBB- Index Series 16 | | Apr 2065 | Citigroup Global Markets Ltd. | (3%) | Monthly | | 80,000 | 19,242 | (21,441) | (2,199) |
| CMBX N.A. BBB- Index Series 16 | | Apr 2065 | Citigroup Global Markets Ltd. | (3%) | Monthly | | 170,000 | 40,890 | (52,196) | (11,306) |
| CMBX N.A. BBB- Index Series 16 | | Apr 2065 | Goldman Sachs & Co. LLC | (3%) | Monthly | | 160,000 | 38,485 | (42,859) | (4,374) |
| CMBX N.A. BBB- Index Series 16 | | Apr 2065 | JPMorgan Securities LLC | (3%) | Monthly | | 160,000 | 38,485 | (46,600) | (8,115) |
| CMBX N.A. BBB- Index Series 16 | | Apr 2065 | JPMorgan Securities LLC | (3%) | Monthly | | 170,000 | 40,890 | (48,503) | (7,613) |
| CMBX N.A. BBB- Index Series 16 | | Apr 2065 | JPMorgan Securities LLC | (3%) | Monthly | | 110,000 | 26,458 | (29,610) | (3,152) |
| CMBX N.A. BBB- Index Series 16 | | Apr 2065 | Morgan Stanley Capital Services LLC | (3%) | Monthly | | 210,000 | 50,511 | (54,112) | (3,601) |
| CMBX N.A. BBB- Index Series 16 | | Apr 2065 | Morgan Stanley Capital Services LLC | (3%) | Monthly | | 320,000 | 76,969 | (80,995) | (4,026) |
| | | | | | | | | | | |
| TOTAL BUY PROTECTION | | | | | | | | 436,836 | (449,708) | (12,872) |
| Sell Protection | | | | | | | | | | |
| CMBX N.A. AAA Index Series 13 | NR | Dec 2072 | Morgan Stanley Capital Services LLC | 0.5% | Monthly | | 2,040,000 | (35,443) | 46,945 | 11,502 |
| CMBX N.A. AAA Index Series 13 | NR | Dec 2072 | Morgan Stanley Capital Services LLC | 0.5% | Monthly | | 2,060,000 | (35,790) | 48,752 | 12,962 |
| CMBX N.A. AAA Index Series 15 | NR | Nov 2064 | Goldman Sachs & Co. LLC | 0.5% | Monthly | | 520,000 | (14,389) | 13,620 | (769) |
| CMBX N.A. AAA Index Series 15 | NR | Nov 2064 | Goldman Sachs & Co. LLC | 0.5% | Monthly | | 1,070,000 | (29,608) | 29,107 | (501) |
| | | | | | | | | | | |
| TOTAL SELL PROTECTION | | | | | | | | (115,230) | 138,424 | 23,194 |
| TOTAL CREDIT DEFAULT SWAPS | | | | | | | | 321,606 | (311,284) | 10,322 |
(1)Ratings are presented for credit default swaps in which the Fund has sold protection on the underlying referenced debt. Ratings for an underlying index represent a weighted average of the ratings of all securities included in the index. The credit rating or value can be measures of the current payment/performance risk. Ratings are from Moody's Investors Service, Inc. Where Moody's® ratings are not available, S&P® ratings are disclosed and are indicated as such. All ratings are as of the report date and do not reflect subsequent changes.
(2)The notional amount of each credit default swap where the Fund has sold protection approximates the maximum potential amount of future payments that the Fund could be required to make if a credit event were to occur.
(3)Notional amount is stated in U.S. Dollars unless otherwise noted.
| Interest Rate Swaps |
| Payment Received | Payment Frequency | Payment Paid | Payment Frequency | Clearinghouse / Counterparty(1) | Maturity Date | Notional Amount(2) | Value ($) | Upfront Premium Received/ (Paid) ($)(3) | Unrealized Appreciation/ (Depreciation) ($) |
| 3.75% | Annual | U.S. Secured Overnight Fin. Rate (SOFR) Index(4) | Annual | LCH | Sep 2028 | | 5,252,000 | (96,108) | 0 | (96,108) |
| 3.5% | Annual | U.S. Secured Overnight Fin. Rate (SOFR) Index(4) | Annual | LCH | Sep 2030 | | 653,000 | (12,238) | 0 | (12,238) |
| TOTAL INTEREST RATE SWAPS | | | | | | | | (108,346) | 0 | (108,346) |
(1)Swaps with LCH Clearnet Group (LCH) are centrally cleared over-the-counter (OTC) swaps.
(2)Notional amount is stated in U.S. Dollars unless otherwise noted.
(3)Any premiums for centrally cleared over-the-counter (OTC) swaps are recorded periodically throughout the term of the swap to variation margin and included in unrealized appreciation (depreciation).
(4)Represents floating rate.
Legend
| (a) | Amount is stated in United States dollars unless otherwise noted. |
| (b) | Security or a portion of the security has been segregated as collateral for mortgage-backed or asset-backed securities purchased on a delayed delivery or when-issued basis. At period end, the value of securities pledged amounted to $1,591,804. |
| (c) | Security or a portion of the security was pledged to cover margin requirements for futures contracts. At period end, the value of securities pledged amounted to $1,244,266. |
| (d) | Security or a portion of the security was pledged to cover margin requirements for centrally cleared OTC swaps. At period end, the value of securities pledged amounted to $221,261. |
| (e) | Security or a portion of the security purchased on a delayed delivery or when-issued basis. |
| (f) | Security exempt from registration under Rule 144A of the Securities Act of 1933. These securities may be resold in transactions exempt from registration, normally to qualified institutional buyers. At the end of the period, the value of these securities amounted to $48,572,732 or 9.3% of net assets. |
| (g) | Coupon rates for floating and adjustable rate securities reflect the rates in effect at period end. |
| (h) | Coupon is indexed to a floating interest rate which may be multiplied by a specified factor and/or subject to caps or floors. |
| (i) | Represents an investment in an underlying pool of reverse mortgages which typically do not require regular principal and interest payments as repayment is deferred until a maturity event. |
| (j) | Interest Only (IO) security represents the right to receive only monthly interest payments on an underlying pool of mortgages or assets. Principal shown is the outstanding par amount of the pool as of the end of the period. |
| (k) | Affiliated fund that is generally available only to investment companies and other accounts managed by Fidelity Investments. The rate quoted is the annualized seven-day yield of the fund at period end. A complete unaudited listing of the fund's holdings as of its most recent quarter end is available upon request. In addition, each Fidelity Central Fund's financial statements, which are not covered by the Fund's Report of Independent Registered Public Accounting Firm, are available on the SEC's website or upon request. |
Affiliated Central Funds
Fiscal year to date information regarding the Fund's investments in Fidelity Central Funds, including the ownership percentage, is presented below.
| Affiliate | Value, beginning of period ($) | Purchases ($) | Sales Proceeds ($) | Dividend Income ($) | Realized Gain (loss) ($) | Change in Unrealized appreciation (depreciation) ($) | Value, end of period ($) | % ownership, end of period |
| Fidelity Cash Central Fund 5.43% | 49,966,507 | 308,740,948 | 345,870,593 | 2,341,736 | - | - | 12,836,862 | 0.0% |
| Total | 49,966,507 | 308,740,948 | 345,870,593 | 2,341,736 | - | - | 12,836,862 | |
| | | | | | | | | |
Amounts in the dividend income column in the above table include any capital gain distributions from underlying funds, which are presented in the corresponding line item in the Statement of Operations, if applicable.
Amounts included in the purchases and sales proceeds columns may include in-kind transactions, if applicable.
Investment Valuation
The following is a summary of the inputs used, as of August 31, 2023, involving the Fund's assets and liabilities carried at fair value. The inputs or methodology used for valuing securities may not be an indication of the risk associated with investing in those securities. For more information on valuation inputs, and their aggregation into the levels used below, please refer to the Investment Valuation section in the accompanying Notes to Financial Statements.
| Valuation Inputs at Reporting Date: |
| Description | Total ($) | Level 1 ($) | Level 2 ($) | Level 3 ($) |
Investments in Securities: | | | | |
|
| U.S. Government and Government Agency Obligations | 15,047,887 | - | 15,047,887 | - |
|
| U.S. Government Agency - Mortgage Securities | 548,181,481 | - | 548,181,481 | - |
|
| Asset-Backed Securities | 22,812,957 | - | 22,812,957 | - |
|
| Collateralized Mortgage Obligations | 38,665,553 | - | 38,665,553 | - |
|
| Commercial Mortgage Securities | 82,808,350 | - | 82,808,350 | - |
|
| Money Market Funds | 12,836,862 | 12,836,862 | - | - |
|
| Purchased Swaptions | 809,779 | - | 809,779 | - |
| Total Investments in Securities: | 721,162,869 | 12,836,862 | 708,326,007 | - |
Derivative Instruments: | | | | |
|
| Assets | | | | |
Futures Contracts | 51,285 | 51,285 | - | - |
Swaps | 436,836 | - | 436,836 | - |
| Total Assets | 488,121 | 51,285 | 436,836 | - |
|
| Liabilities | | | | |
Futures Contracts | (614,124) | (614,124) | - | - |
Swaps | (223,576) | - | (223,576) | - |
| Total Liabilities | (837,700) | (614,124) | (223,576) | - |
| Total Derivative Instruments: | (349,579) | (562,839) | 213,260 | - |
Other Financial Instruments: | | | | |
|
| TBA Sale Commitments | (49,025,261) | - | (49,025,261) | - |
| Total Other Financial Instruments: | (49,025,261) | - | (49,025,261) | - |
Value of Derivative Instruments
The following table is a summary of the Fund's value of derivative instruments by primary risk exposure as of August 31, 2023. For additional information on derivative instruments, please refer to the Derivative Instruments section in the accompanying Notes to Financial Statements.
Primary Risk Exposure / Derivative Type | Value |
| Asset ($) | Liability ($) |
| Credit Risk | | |
Swaps (a) | 436,836 | (115,230) |
| Total Credit Risk | 436,836 | (115,230) |
| Interest Rate Risk | | |
Futures Contracts (b) | 51,285 | (614,124) |
Purchased Swaptions (c) | 809,779 | 0 |
Swaps (d) | 0 | (108,346) |
| Total Interest Rate Risk | 861,064 | (722,470) |
| Total Value of Derivatives | 1,297,900 | (837,700) |
(a)For bi-lateral over-the-counter (OTC) swaps, reflects gross value which is presented in the Statement of Assets and Liabilities in the bi-lateral OTC swaps, at value line-items.
(b)Reflects gross cumulative appreciation (depreciation) on futures contracts as presented in the Schedule of Investments. In the Statement of Assets and Liabilities, the period end daily variation margin is included in receivable or payable for daily variation margin on futures contracts, and the net cumulative appreciation (depreciation) is included in Total accumulated earnings (loss).
(c)Gross value is included in the Statement of Assets and Liabilities in the investments in securities, at value line-item.
(d)For centrally cleared over-the-counter (OTC) swaps, reflects gross cumulative appreciation (depreciation) as presented in the Schedule of Investments. In the Statement of Assets and Liabilities, the period end daily variation margin for centrally cleared OTC swaps is included in receivable or payable for daily variation margin on centrally cleared OTC swaps, and the net cumulative appreciation (depreciation) for centrally cleared OTC swaps is included in Total accumulated earnings (loss).
| Statement of Assets and Liabilities |
| | | | August 31, 2023 |
| | | | | |
| Assets | | | | |
| Investment in securities, at value - See accompanying schedule: | | | | |
Unaffiliated issuers (cost $750,485,931) | $ | 708,326,007 | | |
Fidelity Central Funds (cost $12,836,862) | | 12,836,862 | | |
| | | | | |
| | | | | |
| Total Investment in Securities (cost $763,322,793) | | | $ | 721,162,869 |
| Receivable for investments sold | | | | 5,809 |
| Receivable for TBA sale commitments | | | | 48,557,631 |
| Receivable for fund shares sold | | | | 617,679 |
| Interest receivable | | | | 1,555,736 |
| Distributions receivable from Fidelity Central Funds | | | | 62,599 |
| Receivable for daily variation margin on centrally cleared OTC swaps | | | | 10,296 |
| Bi-lateral OTC swaps, at value | | | | 436,836 |
| Receivable from investment adviser for expense reductions | | | | 1,336 |
Total assets | | | | 772,410,791 |
| Liabilities | | | | |
| Payable for investments purchased | | | | |
Regular delivery | $ | 1,869,739 | | |
Delayed delivery | | 198,217,381 | | |
| TBA sale commitments, at value | | 49,025,261 | | |
| Payable for fund shares redeemed | | 3,085,437 | | |
| Bi-lateral OTC swaps, at value | | 115,230 | | |
| Payable for daily variation margin on futures contracts | | 112,763 | | |
| Other payables and accrued expenses | | 9,792 | | |
| Total Liabilities | | | | 252,435,603 |
| Net Assets | | | $ | 519,975,188 |
| Net Assets consist of: | | | | |
| Paid in capital | | | $ | 595,456,438 |
| Total accumulated earnings (loss) | | | | (75,481,250) |
| Net Assets | | | $ | 519,975,188 |
Net Asset Value, offering price and redemption price per share ($519,975,188 ÷ 59,291,641 shares) | | | $ | 8.77 |
| Statement of Operations |
| | | | Year ended August 31, 2023 |
| Investment Income | | | | |
| Interest | | | $ | 14,297,971 |
| Income from Fidelity Central Funds | | | | 2,341,736 |
| Total Income | | | | 16,639,707 |
| Expenses | | | | |
| Custodian fees and expenses | $ | 30,249 | | |
| Independent trustees' fees and expenses | | 1,631 | | |
| Miscellaneous | | 24 | | |
| Total expenses before reductions | | 31,904 | | |
| Expense reductions | | (19,294) | | |
| Total expenses after reductions | | | | 12,610 |
| Net Investment income (loss) | | | | 16,627,097 |
| Realized and Unrealized Gain (Loss) | | | | |
| Net realized gain (loss) on: | | | | |
| Investment Securities: | | | | |
| Unaffiliated issuers | | (19,360,232) | | |
| Futures contracts | | 3,973,724 | | |
| Swaps | | (346,487) | | |
| Total net realized gain (loss) | | | | (15,732,995) |
| Change in net unrealized appreciation (depreciation) on: | | | | |
| Investment Securities: | | | | |
| Unaffiliated issuers | | (5,722,753) | | |
| Futures contracts | | (1,080,405) | | |
| Swaps | | (47,144) | | |
| TBA Sale commitments | | (1,517,251) | | |
| Total change in net unrealized appreciation (depreciation) | | | | (8,367,553) |
| Net gain (loss) | | | | (24,100,548) |
| Net increase (decrease) in net assets resulting from operations | | | $ | (7,473,451) |
| Statement of Changes in Net Assets |
| |
| | Year ended August 31, 2023 | | Year ended August 31, 2022 |
| Increase (Decrease) in Net Assets | | | | |
| Operations | | | | |
| Net investment income (loss) | $ | 16,627,097 | $ | 6,342,466 |
| Net realized gain (loss) | | (15,732,995) | | (16,122,597) |
| Change in net unrealized appreciation (depreciation) | | (8,367,553) | | (36,333,269) |
| Net increase (decrease) in net assets resulting from operations | | (7,473,451) | | (46,113,400) |
| Distributions to shareholders | | (16,412,169) | | (6,633,281) |
| | | | | |
| Share transactions | | | | |
| Proceeds from sales of shares | | 175,006,969 | | 169,736,792 |
| Reinvestment of distributions | | 16,375,010 | | 6,633,001 |
| Cost of shares redeemed | | (72,830,101) | | (124,972,737) |
| | | | | |
Net increase (decrease) in net assets resulting from share transactions | | 118,551,878 | | 51,397,056 |
| Total increase (decrease) in net assets | | 94,666,258 | | (1,349,625) |
| | | | | |
| Net Assets | | | | |
| Beginning of period | | 425,308,930 | | 426,658,555 |
| End of period | $ | 519,975,188 | $ | 425,308,930 |
| | | | | |
| Other Information | | | | |
| Shares | | | | |
| Sold | | 19,614,350 | | 17,246,732 |
| Issued in reinvestment of distributions | | 1,837,995 | | 682,834 |
| Redeemed | | (8,173,220) | | (12,916,200) |
| Net increase (decrease) | | 13,279,125 | | 5,013,366 |
| | | | | |
Financial Highlights
| Fidelity® Series Investment Grade Securitized Fund |
| |
| Years ended August 31, | | 2023 | | 2022 | | 2021 | | 2020 | | 2019 |
Selected Per-Share Data | | | | | | | | | | |
| Net asset value, beginning of period | $ | 9.24 | $ | 10.41 | $ | 10.68 | $ | 10.45 | $ | 10.00 |
| Income from Investment Operations | | | | | | | | | | |
Net investment income (loss) A,B | | .317 | | .142 | | .056 | | .209 | | .293 |
| Net realized and unrealized gain (loss) | | (.477) | | (1.165) | | (.023) | | .330 | | .475 |
| Total from investment operations | | (.160) | | (1.023) | | .033 | | .539 | | .768 |
| Distributions from net investment income | | (.310) | | (.147) | | (.083) C | | (.219) | | (.318) |
| Distributions from net realized gain | | - | | - | | (.220) C | | (.090) | | - |
| Total distributions | | (.310) | | (.147) | | (.303) | | (.309) | | (.318) |
| Net asset value, end of period | $ | 8.77 | $ | 9.24 | $ | 10.41 | $ | 10.68 | $ | 10.45 |
Total Return D | | (1.73)% | | (9.89)% | | .32% | | 5.28% | | 7.83% |
Ratios to Average Net Assets B,E,F | | | | | | | | | | |
| Expenses before reductions | | .01% | | .01% | | .01% | | .01% | | .02% |
| Expenses net of fee waivers, if any | | -% G | | -% G | | -% G | | .01% | | .01% |
| Expenses net of all reductions | | -% G | | -% G | | -% G | | .01% | | .01% |
| Net investment income (loss) | | 3.56% | | 1.45% | | .54% | | 2.00% | | 2.92% |
| Supplemental Data | | | | | | | | | | |
| Net assets, end of period (000 omitted) | $ | 519,975 | $ | 425,309 | $ | 426,659 | $ | 188,284 | $ | 108,442 |
Portfolio turnover rate H | | 735% | | 761% | | 1091% | | 1014% | | 1434% |
ACalculated based on average shares outstanding during the period.
BNet investment income (loss) is affected by the timing of the declaration of dividends by any underlying mutual funds or exchange-traded funds (ETFs). Net investment income (loss) of any mutual funds or ETFs is not included in the Fund's net investment income (loss) ratio.
CThe amount shown reflects reclassifications related to book to tax differences that were made in the year shown.
DTotal returns would have been lower if certain expenses had not been reduced during the applicable periods shown.
EExpense ratios reflect operating expenses of the class. Expenses before reductions do not reflect amounts reimbursed, waived, or reduced through arrangements with the investment adviser, brokerage services, or other offset arrangements, if applicable, and do not represent the amount paid by the class during periods when reimbursements, waivers or reductions occur.
FFees and expenses of any underlying mutual funds or exchange-traded funds (ETFs) are not included in the Fund's expense ratio. The Fund indirectly bears its proportionate share of these expenses. For additional expense information related to investments in Fidelity Central Funds, please refer to the "Investments in Fidelity Central Funds" note found in the Notes to Financial Statements section of the most recent Annual or Semi-Annual report.
GAmount represents less than .005%.
HAmount does not include the portfolio activity of any underlying mutual funds or exchange-traded funds (ETFs).
For the period ended August 31, 2023
1. Organization.
Fidelity Series Investment Grade Securitized Fund (the Fund) is a fund of Fidelity Advisor Series II (the Trust) and is authorized to issue an unlimited number of shares. Shares are offered only to certain other Fidelity funds, Fidelity managed 529 plans, and Fidelity managed collective investment trusts. The Trust is registered under the Investment Company Act of 1940, as amended (the 1940 Act), as an open-end management investment company organized as a Massachusetts business trust.
2. Investments in Fidelity Central Funds.
Funds may invest in Fidelity Central Funds, which are open-end investment companies generally available only to other investment companies and accounts managed by the investment adviser and its affiliates. The Schedule of Investments lists any Fidelity Central Funds held as an investment as of period end, but does not include the underlying holdings of each Fidelity Central Fund. An investing fund indirectly bears its proportionate share of the expenses of the underlying Fidelity Central Funds.
Based on its investment objective, each Fidelity Central Fund may invest or participate in various investment vehicles or strategies that are similar to those of the investing fund. These strategies are consistent with the investment objectives of the investing fund and may involve certain economic risks which may cause a decline in value of each of the Fidelity Central Funds and thus a decline in the value of the investing fund.
| Fidelity Central Fund | Investment Manager | Investment Objective | Investment Practices | Expense RatioA |
| Fidelity Money Market Central Funds | Fidelity Management & Research Company LLC (FMR) | Each fund seeks to obtain a high level of current income consistent with the preservation of capital and liquidity. | Short-term Investments | Less than .005% |
A Expenses expressed as a percentage of average net assets and are as of each underlying Central Fund's most recent annual or semi-annual shareholder report.
A complete unaudited list of holdings for each Fidelity Central Fund is available upon request or at the Securities and Exchange Commission website at www.sec.gov. In addition, the financial statements of the Fidelity Central Funds which contain the significant accounting policies (including investment valuation policies) of those funds, and are not covered by the Report of Independent Registered Public Accounting Firm, are available on the Securities and Exchange Commission website or upon request.
3. Significant Accounting Policies.
The Fund is an investment company and applies the accounting and reporting guidance of the Financial Accounting Standards Board (FASB) Accounting Standards Codification Topic 946 Financial Services - Investment Companies. The financial statements have been prepared in conformity with accounting principles generally accepted in the United States of America (GAAP), which require management to make certain estimates and assumptions at the date of the financial statements. Actual results could differ from those estimates. Subsequent events, if any, through the date that the financial statements were issued have been evaluated in the preparation of the financial statements. The Fund's Schedule of Investments lists any underlying mutual funds or exchange-traded funds (ETFs) but does not include the underlying holdings of these funds. The following summarizes the significant accounting policies of the Fund:
Investment Valuation. Investments are valued as of 4:00 p.m. Eastern time on the last calendar day of the period. The Board of Trustees (the Board) has designated the Fund's investment adviser as the valuation designee responsible for the fair valuation function and performing fair value determinations as needed. The investment adviser has established a Fair Value Committee (the Committee) to carry out the day-to-day fair valuation responsibilities and has adopted policies and procedures to govern the fair valuation process and the activities of the Committee. In accordance with these fair valuation policies and procedures, which have been approved by the Board, the Fund attempts to obtain prices from one or more third party pricing services or brokers to value its investments. When current market prices, quotations or currency exchange rates are not readily available or reliable, investments will be fair valued in good faith by the Committee, in accordance with the policies and procedures. Factors used in determining fair value vary by investment type and may include market or investment specific events, transaction data, estimated cash flows, and market observations of comparable investments. The frequency that the fair valuation procedures are used cannot be predicted and they may be utilized to a significant extent. The Committee manages the Fund's fair valuation practices and maintains the fair valuation policies and procedures. The Fund's investment adviser reports to the Board information regarding the fair valuation process and related material matters.
The Fund categorizes the inputs to valuation techniques used to value its investments into a disclosure hierarchy consisting of three levels as shown below:
Level 1 - unadjusted quoted prices in active markets for identical investments
Level 2 - other significant observable inputs (including quoted prices for similar investments, interest rates, prepayment speeds, etc.)
Level 3 - unobservable inputs (including the Fund's own assumptions based on the best information available)
Valuation techniques used to value the Fund's investments by major category are as follows:
Debt securities, including restricted securities, are valued based on evaluated prices received from third party pricing services or from brokers who make markets in such securities. U.S. government and government agency obligations are valued by pricing services who utilize matrix pricing which considers yield or price of bonds of comparable quality, coupon, maturity and type or by broker-supplied prices. Asset backed securities, collateralized mortgage obligations, commercial mortgage securities and U.S. government agency mortgage securities are valued by pricing services who utilize matrix pricing which considers prepayment speed assumptions, attributes of the collateral, yield or price of bonds of comparable quality, coupon, maturity and type or by broker-supplied prices. Swaps are marked-to-market daily based on valuations from third party pricing services, registered derivatives clearing organizations (clearinghouses) or broker-supplied valuations. These pricing sources may utilize inputs such as interest rate curves, credit spread curves, default possibilities and recovery rates. When independent prices are unavailable or unreliable, debt securities and swaps may be valued utilizing pricing methodologies which consider similar factors that would be used by third party pricing services. Debt securities and swaps are generally categorized as Level 2 in the hierarchy but may be Level 3 depending on the circumstances.
Futures contracts are valued at the settlement price established each day by the board of trade or exchange on which they are traded and are categorized as Level 1 in the hierarchy. Investments in open-end mutual funds, including the Fidelity Central Funds, are valued at their closing net asset value (NAV) each business day and are categorized as Level 1 in the hierarchy.
Changes in valuation techniques may result in transfers in or out of an assigned level within the disclosure hierarchy. The aggregate value of investments by input level as of August 31, 2023 is included at the end of the Fund's Schedule of Investments.
Investment Transactions and Income. For financial reporting purposes, the Fund's investment holdings and NAV include trades executed through the end of the last business day of the period. The NAV per share for processing shareholder transactions is calculated as of the close of business of the New York Stock Exchange (NYSE), normally 4:00 p.m. Eastern time and includes trades executed through the end of the prior business day. Gains and losses on securities sold are determined on the basis of identified cost. Income and capital gain distributions from Fidelity Central Funds, if any, are recorded on the ex-dividend date. Interest income is accrued as earned and includes coupon interest and amortization of premium and accretion of discount on debt securities as applicable.
Expenses. Expenses directly attributable to a fund are charged to that fund. Expenses attributable to more than one fund are allocated among the respective funds on the basis of relative net assets or other appropriate methods. Expenses included in the accompanying financial statements reflect the expenses of that fund and do not include any expenses associated with any underlying mutual funds or exchange-traded funds. Although not included in a fund's expenses, a fund indirectly bears its proportionate share of these expenses through the net asset value of each underlying mutual fund or exchange-traded fund. Expense estimates are accrued in the period to which they relate and adjustments are made when actual amounts are known.
Income Tax Information and Distributions to Shareholders. Each year, the Fund intends to qualify as a regulated investment company under Subchapter M of the Internal Revenue Code, including distributing substantially all of its taxable income and realized gains. As a result, no provision for U.S. Federal income taxes is required. As of August 31, 2023, the Fund did not have any unrecognized tax benefits in the financial statements; nor is the Fund aware of any tax positions for which it is reasonably possible that the total amounts of unrecognized tax benefits will significantly change in the next twelve months. The Fund files a U.S. federal tax return, in addition to state and local tax returns as required. The Fund's federal income tax returns are subject to examination by the Internal Revenue Service (IRS) for a period of three fiscal years after they are filed. State and local tax returns may be subject to examination for an additional fiscal year depending on the jurisdiction.
Distributions are declared and recorded daily and paid monthly from net investment income. Distributions from realized gains, if any, are declared and recorded on the ex-dividend date. Income and capital gain distributions are determined in accordance with income tax regulations, which may differ from GAAP.
Capital accounts within the financial statements are adjusted for permanent book-tax differences. These adjustments have no impact on net assets or the results of operations. Capital accounts are not adjusted for temporary book-tax differences which will reverse in a subsequent period.
Book-tax differences are primarily due to swaps, futures transactions, capital loss carryforwards and losses deferred due to wash sales.
As of period end, the cost and unrealized appreciation (depreciation) in securities, and derivatives if applicable, for federal income tax purposes were as follows:
| Gross unrealized appreciation | $1,145,961 |
| Gross unrealized depreciation | (44,602,632) |
| Net unrealized appreciation (depreciation) | $(43,456,671) |
| Tax Cost | $764,383,409 |
The tax-based components of distributable earnings as of period end were as follows:
| Undistributed ordinary income | $208,645 |
| Capital loss carryforward | $(32,233,224) |
| Net unrealized appreciation (depreciation) on securities and other investments | $(43,456,671) |
Capital loss carryforwards are only available to offset future capital gains of the Fund to the extent provided by regulations and may be limited. The capital loss carryforward information presented below, including any applicable limitation, is estimated as of fiscal period end and is subject to adjustment.
Short-term | $(27,384,913) |
Long-term | (4,848,311) |
| Total capital loss carryforward | $(32,233,224) |
The tax character of distributions paid was as follows:
| | August 31, 2023 | August 31, 2022 |
| Ordinary Income | $16,412,169 | $6,633,281 |
| Total | $16,412,169 | $6,633,281 |
Delayed Delivery Transactions and When-Issued Securities. During the period, certain Funds transacted in securities on a delayed delivery or when-issued basis. Payment and delivery may take place after the customary settlement period for that security. The price of the underlying securities and the date when the securities will be delivered and paid for are fixed at the time the transaction is negotiated. Securities purchased on a delayed delivery or when-issued basis are identified as such in the Schedule of Investments. Compensation for interest forgone in the purchase of a delayed delivery or when-issued debt security may be received. With respect to purchase commitments, each applicable Fund identifies securities as segregated in its records with a value at least equal to the amount of the commitment. Payables and receivables associated with the purchases and sales of delayed delivery securities having the same coupon, settlement date and broker are offset. Delayed delivery or when-issued securities that have been purchased from and sold to different brokers are reflected as both payables and receivables in the Statement of Assets and Liabilities under the caption "Delayed delivery", as applicable. Losses may arise due to changes in the value of the underlying securities or if the counterparty does not perform under the contract's terms, or if the issuer does not issue the securities due to political, economic, or other factors.
To-Be-Announced (TBA) Securities and Mortgage Dollar Rolls. TBA securities involve buying or selling mortgage-backed securities (MBS) on a forward commitment basis. A TBA transaction typically does not designate the actual security to be delivered and only includes an approximate principal amount; however delivered securities must meet specified terms defined by industry guidelines, including issuer, rate and current principal amount outstanding on underlying mortgage pools. Funds may enter into a TBA transaction with the intent to take possession of or deliver the underlying MBS, or a fund may elect to extend the settlement by entering into either a mortgage or reverse mortgage dollar roll. Mortgage dollar rolls are transactions where a fund sells TBA securities and simultaneously agrees to repurchase MBS on a later date at a lower price and with the same counterparty. Reverse mortgage dollar rolls involve the purchase and simultaneous agreement to sell TBA securities on a later date at a lower price. Transactions in mortgage dollar rolls and reverse mortgage dollar rolls are accounted for as purchases and sales and may result in an increase to a fund's portfolio turnover rate.
Purchases and sales of TBA securities involve risks similar to those discussed above for delayed delivery and when-issued securities. Also, if the counterparty in a mortgage dollar roll or a reverse mortgage dollar roll transaction files for bankruptcy or becomes insolvent, a fund's right to repurchase or sell securities may be limited. Additionally, when a fund sells TBA securities without already owning or having the right to obtain the deliverable securities (an uncovered forward commitment to sell), it incurs a risk of loss because it could have to purchase the securities at a price that is higher than the price at which it sold them. A fund may be unable to purchase the deliverable securities if the corresponding market is illiquid.
TBA securities subject to a forward commitment to sell at period end are included at the end of the Schedule of Investments under the caption "TBA Sale Commitments." The proceeds and value of these commitments are reflected in the Statement of Assets and Liabilities as "Receivable for TBA sale commitments" and "TBA sale commitments, at value," respectively.
Restricted Securities (including Private Placements). Funds may invest in securities that are subject to legal or contractual restrictions on resale. These securities generally may be resold in transactions exempt from registration or to the public if the securities are registered. Disposal of these securities may involve time-consuming negotiations and expense, and prompt sale at an acceptable price may be difficult. Information regarding restricted securities held at period end is included at the end of the Schedule of Investments, if applicable.
4. Derivative Instruments.
Risk Exposures and the Use of Derivative Instruments. The Fund's investment objectives allow for various types of derivative instruments, including futures contracts, swaps and options. Derivatives are investments whose value is primarily derived from underlying assets, indices or reference rates and may be transacted on an exchange or over-the-counter (OTC). Derivatives may involve a future commitment to buy or sell a specified asset based on specified terms, to exchange future cash flows at periodic intervals based on a notional principal amount, or for one party to make one or more payments upon the occurrence of specified events in exchange for periodic payments from the other party.
Derivatives were used to increase returns, to gain exposure to certain types of assets and to manage exposure to certain risks as defined below. The success of any strategy involving derivatives depends on analysis of numerous economic factors, and if the strategies for investment do not work as intended, the objectives may not be achieved.
Derivatives were used to increase or decrease exposure to the following risk(s):
| | |
| Credit Risk | Credit risk relates to the ability of the issuer of a financial instrument to make further principal or interest payments on an obligation or commitment that it has to a fund. |
| Interest Rate Risk | Interest rate risk relates to the fluctuations in the value of interest-bearing securities due to changes in the prevailing levels of market interest rates. |
Funds are also exposed to additional risks from investing in derivatives, such as liquidity risk and counterparty credit risk. Liquidity risk is the risk that a fund will be unable to close out the derivative in the open market in a timely manner. Counterparty credit risk is the risk that the counterparty will not be able to fulfill its obligation to a fund. Derivative counterparty credit risk is managed through formal evaluation of the creditworthiness of all potential counterparties. On certain OTC derivatives such as options and bi-lateral swaps, a fund attempts to reduce its exposure to counterparty credit risk by entering into an International Swaps and Derivatives Association, Inc. (ISDA) Master Agreement with each of its counterparties. The ISDA Master Agreement gives a fund the right to terminate all transactions traded under such agreement upon the deterioration in the credit quality of the counterparty beyond specified levels. The ISDA Master Agreement gives each party the right, upon an event of default by the other party or a termination of the agreement, to close out all transactions traded under such agreement and to net amounts owed under each transaction to one net payable by one party to the other. To mitigate counterparty credit risk on bi-lateral OTC derivatives, a fund receives collateral in the form of cash or securities once net unrealized appreciation on outstanding derivative contracts under an ISDA Master Agreement exceeds certain applicable thresholds, subject to certain minimum transfer provisions. The collateral received is held in segregated accounts with the custodian bank in accordance with the collateral agreements entered into between a fund, the counterparty and the custodian bank. A fund could experience delays and costs in gaining access to the collateral even though it is held by the custodian bank. The maximum risk of loss to a fund from counterparty credit risk related to bi-lateral OTC derivatives is generally the aggregate unrealized appreciation and unpaid counterparty payments in excess of any collateral pledged by the counterparty to a fund. A fund may be required to pledge collateral for the benefit of the counterparties on bi-lateral OTC derivatives in an amount not less than each counterparty's unrealized appreciation on outstanding derivative contracts, subject to certain minimum transfer provisions, and any such pledged collateral is identified in the Schedule of Investments. Exchange-traded contracts are not covered by the ISDA Master Agreement; however counterparty credit risk related to these contracts may be mitigated by the protection provided by the exchange on which they trade. Counterparty credit risk related to centrally cleared OTC swaps may be mitigated by the protection provided by the clearinghouse.
Investing in derivatives may involve greater risks than investing in the underlying assets directly and, to varying degrees, may involve risk of loss in excess of any initial investment and collateral received and amounts recognized in the Statement of Assets and Liabilities. In addition, there may be the risk that the change in value of the derivative contract does not correspond to the change in value of the underlying instrument.
Net Realized Gain (Loss) and Change in Net Unrealized Appreciation (Depreciation) on Derivatives. The table below, which reflects the impacts of derivatives on the financial performance, summarizes the net realized gain (loss) and change in net unrealized appreciation (depreciation) for derivatives during the period as presented in the Statement of Operations.
| Primary Risk Exposure / Derivative Type | Net Realized Gain (Loss) ($) | Change in Net Unrealized Appreciation (Depreciation) ($) |
| Fidelity Series Investment Grade Securitized Fund | | |
| Credit Risk | | |
| Swaps | 126,451 | (43,167) |
| Total Credit Risk | 126,451 | (43,167) |
| Interest Rate Risk | | |
| Futures Contracts | 3,973,724 | (1,080,405) |
| Purchased Options | - | (2,383) |
| Swaps | (472,938) | (3,977) |
| Total Interest Rate Risk | 3,500,786 | (1,086,765) |
| Totals | 3,627,237 | (1,129,932) |
If there are any open positions at period end, a summary of the value of derivatives by primary risk exposure is included at the end of the Schedule of Investments.
Futures Contracts. A futures contract is an agreement between two parties to buy or sell a specified underlying instrument for a fixed price at a specified future date. Futures contracts were used to manage exposure to the bond market and fluctuations in interest rates.
Upon entering into a futures contract, a fund is required to deposit either cash or securities (initial margin) with a clearing broker in an amount equal to a certain percentage of the face value of the contract. Futures contracts are marked-to-market daily and subsequent daily payments are made or received by a fund depending on the daily fluctuations in the value of the futures contracts and are recorded as unrealized appreciation or (depreciation). This receivable and/or payable, if any, is included in daily variation margin on futures contracts in the Statement of Assets and Liabilities. Realized gain or (loss) is recorded upon the expiration or closing of a futures contract. The net realized gain (loss) and change in net unrealized appreciation (depreciation) on futures contracts during the period is presented in the Statement of Operations.
Any open futures contracts at period end are presented in the Schedule of Investments under the caption "Futures Contracts". The notional amount at value reflects each contract's exposure to the underlying instrument or index at period end, and is representative of volume of activity during the period unless an average notional amount is presented. Any securities deposited to meet initial margin requirements are identified in the Schedule of Investments. Any cash deposited to meet initial margin requirements is presented as segregated cash with brokers for derivative instruments in the Statement of Assets and Liabilities.
Options. Options give the purchaser the right, but not the obligation, to buy (call) or sell (put) an underlying security or financial instrument at an agreed exercise or strike price between or on certain dates. Options obligate the seller (writer) to buy (put) or sell (call) an underlying instrument at the exercise or strike price or cash settle an underlying derivative instrument if the holder exercises the option on or before the expiration date. OTC options, such as swaptions, which are options where the underlying instrument is a swap, were used to manage exposure to fluctuations in interest rates.
Upon entering into an options contract, a fund will pay or receive a premium. Premiums paid on purchased options are reflected as cost of investments and premiums received on written options are reflected as a liability on the Statement of Assets and Liabilities. Certain options may be purchased or written with premiums to be paid or received on a future date. Options are valued daily and any unrealized appreciation (depreciation) is reflected in total accumulated earnings (loss) in the Statement of Assets and Liabilities. When an option is exercised, the cost or proceeds of the underlying instrument purchased or sold is adjusted by the amount of the premium. When an option is closed, a gain or loss is realized depending on whether the proceeds or amount paid for the closing sale transaction is greater or less than the premium received or paid. When an option expires, gains and losses are realized to the extent of premiums received and paid, respectively. The net realized and unrealized gains (losses) on purchased options are included in the Statement of Operations in net realized gain (loss) and change in net unrealized appreciation (depreciation) on investment securities. The net realized gain (loss) and change in net unrealized appreciation (depreciation) on written options are presented in the Statement of Operations.
Any open options at period end are presented in the Schedule of Investments under the captions "Purchased Options," "Purchased Swaptions," "Written Options" and "Written Swaptions," as applicable, and are representative of volume of activity during the period unless an average notional amount is presented.
Writing puts and buying calls tend to increase exposure to the underlying instrument while buying puts and writing calls tend to decrease exposure to the underlying instrument. For purchased options, risk of loss is limited to the premium paid, and for written options, risk of loss is the change in value in excess of the premium received.
Swaps. A swap is a contract between two parties to exchange future cash flows at periodic intervals based on a notional principal amount. A bi-lateral OTC swap is a transaction between a fund and a dealer counterparty where cash flows are exchanged between the two parties for the life of the swap. A centrally cleared OTC swap is a transaction executed between a fund and a dealer counterparty, then cleared by a futures commission merchant (FCM) through a clearinghouse. Once cleared, the clearinghouse serves as a central counterparty, with whom a fund exchanges cash flows for the life of the transaction, similar to transactions in futures contracts.
Bi-lateral OTC swaps are marked-to-market daily and changes in value are reflected in the Statement of Assets and Liabilities in the bi-lateral OTC swaps at value line items. Any upfront premiums paid or received upon entering a bi-lateral OTC swap to compensate for differences between stated terms of the swap and prevailing market conditions (e.g. credit spreads, interest rates or other factors) are recorded in total accumulated earnings (loss) in the Statement of Assets and Liabilities and amortized to realized gain or (loss) ratably over the term of the swap. Any unamortized upfront premiums are presented in the Schedule of Investments.
Centrally cleared OTC swaps require a fund to deposit either cash or securities (initial margin) with the FCM, at the instruction of and for the benefit of the clearinghouse. Any securities deposited to meet initial margin requirements are identified in the Schedule of Investments. Any cash deposited to meet initial margin requirements is presented in segregated cash with brokers for derivative instruments in the Statement of Assets and Liabilities. Centrally cleared OTC swaps are marked-to-market daily and subsequent payments (variation margin) are made or received depending on the daily fluctuations in the value of the swaps and are recorded as unrealized appreciation or (depreciation). These daily payments, if any, are included in receivable or payable for daily variation margin on centrally cleared OTC swaps in the Statement of Assets and Liabilities. Any premiums for centrally cleared OTC swaps are recorded periodically throughout the term of the swap to variation margin and included in total accumulated earnings (loss) in the Statement of Assets and Liabilities. Any premiums are recognized as realized gain (loss) upon termination or maturity of the swap.
For both bi-lateral and centrally cleared OTC swaps, payments are exchanged at specified intervals, accrued daily commencing with the effective date of the contract and recorded as realized gain or (loss). Some swaps may be terminated prior to the effective date and realize a gain or loss upon termination. The net realized gain (loss) and change in net unrealized appreciation (depreciation) on swaps during the period is presented in the Statement of Operations.
Any open swaps at period end are included in the Schedule of Investments under the caption "Swaps", and are representative of volume of activity during the period unless an average notional amount is presented.
Credit Default Swaps. Credit default swaps enable a fund to buy or sell protection against specified credit events on a single-name issuer or a traded credit index. Under the terms of a credit default swap the buyer of protection (buyer) receives credit protection in exchange for making periodic payments to the seller of protection (seller) based on a fixed percentage applied to a notional principal amount. In return for these payments, the seller will be required to make a payment upon the occurrence of one or more specified credit events. A fund enters into credit default swaps as a seller to gain credit exposure to an issuer and/or as a buyer to obtain a measure of protection against defaults of an issuer. Periodic payments are made over the life of the contract by the buyer provided that no credit event occurs.
For credit default swaps on most corporate and sovereign issuers, credit events include bankruptcy, failure to pay or repudiation/moratorium. For credit default swaps on corporate or sovereign issuers, the obligation that may be put to the seller is not limited to the specific reference obligation described in the Schedule of Investments. For credit default swaps on asset-backed securities, a credit event may be triggered by events such as failure to pay principal, maturity extension, rating downgrade or write-down. For credit default swaps on asset-backed securities, the reference obligation described represents the security that may be put to the seller. For credit default swaps on a traded credit index, a specified credit event may affect all or individual underlying securities included in the index.
As a seller, if an underlying credit event occurs, a fund will pay a net settlement amount of cash equal to the notional amount of the swap less the recovery value of the reference obligation or underlying securities comprising an index. Only in the event of the industry's inability to value the underlying asset will a fund be required to take delivery of the reference obligation or underlying securities comprising an index and pay an amount equal to the notional amount of the swap.
As a buyer, if an underlying credit event occurs, a fund will receive a net settlement amount of cash equal to the notional amount of the swap less the recovery value of the reference obligation or underlying securities comprising an index. Only in the event of the industry's inability to value the underlying asset will a fund be required to deliver the reference obligation or underlying securities comprising an index in exchange for payment of an amount equal to the notional amount of the swap.
Typically, the value of each credit default swap and credit rating disclosed for each reference obligation in the Schedule of Investments, where a fund is the seller, can be used as measures of the current payment/performance risk of the swap. As the value of the swap changes as a positive or negative percentage of the total notional amount, the payment/performance risk may decrease or increase, respectively. In addition to these measures, the investment adviser monitors a variety of factors including cash flow assumptions, market activity and market sentiment as part of its ongoing process of assessing payment/performance risk.
Interest Rate Swaps. Interest rate swaps are agreements between counterparties to exchange cash flows, one based on a fixed rate, and the other on a floating rate. A fund enters into interest rate swaps to manage its exposure to interest rate changes. Changes in interest rates can have an effect on both the value of bond holdings as well as the amount of interest income earned. In general, the value of bonds can fall when interest rates rise and can rise when interest rates fall.
5. Purchases and Sales of Investments.
Purchases and sales of securities, other than short-term securities, U.S. government securities and in-kind transactions, as applicable, are noted in the table below.
| | Purchases ($) | Sales ($) |
| Fidelity Series Investment Grade Securitized Fund | 2,651,309,639 | 2,660,297,358 |
6. Fees and Other Transactions with Affiliates.
Management Fee. Fidelity Management & Research Company LLC (the investment adviser) and its affiliates provide the Fund with investment management related services for which the Fund does not pay a management fee. Under the management contract, the investment adviser or an affiliate pays all ordinary operating expenses of the Fund, except custody fees, fees and expenses of the independent Trustees, and certain miscellaneous expenses such as proxy and shareholder meeting expenses.
Interfund Trades. Funds may purchase from or sell securities to other Fidelity Funds under procedures adopted by the Board. The procedures have been designed to ensure these interfund trades are executed in accordance with Rule 17a-7 of the 1940 Act. Any interfund trades are included within the respective purchases and sales amounts shown in the Purchases and Sales of Investments note. During the period, there were no interfund trades.
7. Committed Line of Credit.
Certain Funds participate with other funds managed by the investment adviser or an affiliate in a $4.25 billion credit facility (the "line of credit") to be utilized for temporary or emergency purposes to fund shareholder redemptions or for other short-term liquidity purposes. The commitment fees on the pro-rata portion of the line of credit are borne by the investment adviser. During the period, there were no borrowings on this line of credit.
8. Expense Reductions.
The investment adviser contractually agreed to reimburse the Fund to the extent annual operating expenses exceeded .003% of average net assets. This reimbursement will remain in place through December 31, 2026. Some expenses, for example the compensation of the independent Trustees, and certain other expenses such as interest expense, are excluded from this reimbursement. During the period this reimbursement reduced the Fund's expenses by $16,243.
Through arrangements with the Fund's custodian, credits realized as a result of certain uninvested cash balances were used to reduce the Fund's expenses by $3,051.
9. Other.
A fund's organizational documents provide former and current trustees and officers with a limited indemnification against liabilities arising in connection with the performance of their duties to the fund. In the normal course of business, a fund may also enter into contracts that provide general indemnifications. A fund's maximum exposure under these arrangements is unknown as this would be dependent on future claims that may be made against a fund. The risk of material loss from such claims is considered remote.
At the end of the period, mutual funds and accounts managed by the investment adviser or its affiliates were the owners of record of all of the outstanding shares of the Fund.
10. Risk and Uncertainties.
Many factors affect a fund's performance. Developments that disrupt global economies and financial markets, such as pandemics, epidemics, outbreaks of infectious diseases, war, terrorism, and environmental disasters, may significantly affect a fund's investment performance. The effects of these developments to a fund will be impacted by the types of securities in which a fund invests, the financial condition, industry, economic sector, and geographic location of an issuer, and a fund's level of investment in the securities of that issuer. Significant concentrations in security types, issuers, industries, sectors, and geographic locations may magnify the factors that affect a fund's performance.
To the Board of Trustees of Fidelity Advisor Series II and the Shareholders of Fidelity Series Investment Grade Securitized Fund:
Opinion on the Financial Statements and Financial Highlights
We have audited the accompanying statement of assets and liabilities of Fidelity Series Investment Grade Securitized Fund (the "Fund"), a fund of Fidelity Advisor Series II, including the schedule of investments, as of August 31, 2023, the related statement of operations for the year then ended, the statement of changes in net assets for each of the two years in the period then ended, the financial highlights for each of the five years in the period then ended, and the related notes. In our opinion, the financial statements and financial highlights present fairly, in all material respects, the financial position of the Fund as of August 31, 2023, and the results of its operations for the year then ended, the changes in its net assets for each of the two years in the period then ended, and the financial highlights for each of the five years in the period then ended in conformity with accounting principles generally accepted in the United States of America.
Basis for Opinion
These financial statements and financial highlights are the responsibility of the Fund's management. Our responsibility is to express an opinion on the Fund's financial statements and financial highlights based on our audits. We are a public accounting firm registered with the Public Company Accounting Oversight Board (United States) (PCAOB) and are required to be independent with respect to the Fund in accordance with the U.S. federal securities laws and the applicable rules and regulations of the Securities and Exchange Commission and the PCAOB.
We conducted our audits in accordance with the standards of the PCAOB. Those standards require that we plan and perform the audit to obtain reasonable assurance about whether the financial statements and financial highlights are free of material misstatement, whether due to error or fraud. The Fund is not required to have, nor were we engaged to perform, an audit of its internal control over financial reporting. As part of our audits we are required to obtain an understanding of internal control over financial reporting but not for the purpose of expressing an opinion on the effectiveness of the Fund's internal control over financial reporting. Accordingly, we express no such opinion.
Our audits included performing procedures to assess the risks of material misstatement of the financial statements and financial highlights, whether due to error or fraud, and performing procedures that respond to those risks. Such procedures included examining, on a test basis, evidence regarding the amounts and disclosures in the financial statements and financial highlights. Our audits also included evaluating the accounting principles used and significant estimates made by management, as well as evaluating the overall presentation of the financial statements and financial highlights. Our procedures included confirmation of securities owned as of August 31, 2023, by correspondence with the custodian and brokers; when replies were not received from brokers, we performed other auditing procedures. We believe that our audits provide a reasonable basis for our opinion.
/s/ Deloitte & Touche LLP
Boston, Massachusetts
October 16, 2023
We have served as the auditor of one or more of the Fidelity investment companies since 1999.
The Trustees, Members of the Advisory Board (if any), and officers of the trust and fund, as applicable, are listed below. The Board of Trustees governs the fund and is responsible for protecting the interests of shareholders. The Trustees are experienced executives who meet periodically throughout the year to oversee the fund's activities, review contractual arrangements with companies that provide services to the fund, oversee management of the risks associated with such activities and contractual arrangements, and review the fund's performance. As of August 31, 2023, except for Laura M. Bishop, Robert W. Helm, Christine J. Thompson, and Carol J. Zierhoffer each of the Trustees oversees 313 funds. As of October 18, 2023, the date of their election as Trustee, Ms. Bishop, Mr. Helm, Ms. Thompson, and Ms. Zierhoffer each oversees 229 funds.
The Trustees hold office without limit in time except that (a) any Trustee may resign; (b) any Trustee may be removed by written instrument, signed by at least two-thirds of the number of Trustees prior to such removal; (c) any Trustee who requests to be retired or who has become incapacitated by illness or injury may be retired by written instrument signed by a majority of the other Trustees; and (d) any Trustee may be removed at any special meeting of shareholders by a two-thirds vote of the outstanding voting securities of the trust. Each Trustee who is not an interested person (as defined in the 1940 Act) of the trust and the fund is referred to herein as an Independent Trustee. Each Independent Trustee shall retire not later than the last day of the calendar year in which his or her 75th birthday occurs. The Independent Trustees may waive this mandatory retirement age policy with respect to individual Trustees. Officers and Advisory Board Members hold office without limit in time, except that any officer or Advisory Board Member may resign or may be removed by a vote of a majority of the Trustees at any regular meeting or any special meeting of the Trustees. Except as indicated, each individual has held the office shown or other offices in the same company for the past five years.
The fund's Statement of Additional Information (SAI) includes more information about the Trustees. To request a free copy, call Fidelity at 1-800-544-8544.
Experience, Skills, Attributes, and Qualifications of the Trustees. The Governance and Nominating Committee has adopted a statement of policy that describes the experience, qualifications, attributes, and skills that are necessary and desirable for potential Independent Trustee candidates (Statement of Policy). The Board believes that each Trustee satisfied at the time he or she was initially elected or appointed a Trustee, and continues to satisfy, the standards contemplated by the Statement of Policy. The Governance and Nominating Committee also engages professional search firms to help identify potential Independent Trustee candidates who have the experience, qualifications, attributes, and skills consistent with the Statement of Policy. From time to time, additional criteria based on the composition and skills of the current Independent Trustees, as well as experience or skills that may be appropriate in light of future changes to board composition, business conditions, and regulatory or other developments, have also been considered by the professional search firms and the Governance and Nominating Committee. In addition, the Board takes into account the Trustees' commitment and participation in Board and committee meetings, as well as their leadership of standing and ad hoc committees throughout their tenure.
In determining that a particular Trustee was and continues to be qualified to serve as a Trustee, the Board has considered a variety of criteria, none of which, in isolation, was controlling. The Board believes that, collectively, the Trustees have balanced and diverse experience, qualifications, attributes, and skills, which allow the Board to operate effectively in governing the fund and protecting the interests of shareholders. Information about the specific experience, skills, attributes, and qualifications of each Trustee, which in each case led to the Board's conclusion that the Trustee should serve (or continue to serve) as a trustee of the fund, is provided below.
Board Structure and Oversight Function. Abigail P. Johnson is an interested person and currently serves as Chairman. The Trustees have determined that an interested Chairman is appropriate and benefits shareholders because an interested Chairman has a personal and professional stake in the quality and continuity of services provided to the fund. Independent Trustees exercise their informed business judgment to appoint an individual of their choosing to serve as Chairman, regardless of whether the Trustee happens to be independent or a member of management. The Independent Trustees have determined that they can act independently and effectively without having an Independent Trustee serve as Chairman and that a key structural component for assuring that they are in a position to do so is for the Independent Trustees to constitute a substantial majority for the Board. The Independent Trustees also regularly meet in executive session. Michael E. Kenneally serves as Chairman of the Independent Trustees and as such (i) acts as a liaison between the Independent Trustees and management with respect to matters important to the Independent Trustees and (ii) with management prepares agendas for Board meetings.
Fidelity® funds are overseen by different Boards of Trustees. The fund's Board oversees Fidelity's investment-grade bond, money market, asset allocation and certain equity funds, and other Boards oversee Fidelity's alternative investment, high income and other equity funds. The asset allocation funds may invest in Fidelity® funds that are overseen by such other Boards. The use of separate Boards, each with its own committee structure, allows the Trustees of each group of Fidelity® funds to focus on the unique issues of the funds they oversee, including common research, investment, and operational issues. On occasion, the separate Boards establish joint committees to address issues of overlapping consequences for the Fidelity® funds overseen by each Board.
The Trustees operate using a system of committees to facilitate the timely and efficient consideration of all matters of importance to the Trustees, the fund, and fund shareholders and to facilitate compliance with legal and regulatory requirements and oversight of the fund's activities and associated risks. The Board, acting through its committees, has charged FMR and its affiliates with (i) identifying events or circumstances the occurrence of which could have demonstrably adverse effects on the fund's business and/or reputation; (ii) implementing processes and controls to lessen the possibility that such events or circumstances occur or to mitigate the effects of such events or circumstances if they do occur; and (iii) creating and maintaining a system designed to evaluate continuously business and market conditions in order to facilitate the identification and implementation processes described in (i) and (ii) above. Because the day-to-day operations and activities of the fund are carried out by or through FMR, its affiliates, and other service providers, the fund's exposure to risks is mitigated but not eliminated by the processes overseen by the Trustees. While each of the Board's committees has responsibility for overseeing different aspects of the fund's activities, oversight is exercised primarily through the Operations and Audit Committees. In addition, an ad hoc Board committee of Independent Trustees has worked with FMR to enhance the Board's oversight of investment and financial risks, legal and regulatory risks, technology risks, and operational risks, including the development of additional risk reporting to the Board. Appropriate personnel, including but not limited to the fund's Chief Compliance Officer (CCO), FMR's internal auditor, the independent accountants, the fund's Treasurer and portfolio management personnel, make periodic reports to the Board's committees, as appropriate, including an annual review of Fidelity's risk management program for the Fidelity® funds. The responsibilities of each standing committee, including their oversight responsibilities, are described further under "Standing Committees of the Trustees."
Interested Trustees*:
Correspondence intended for a Trustee who is an interested person may be sent to Fidelity Investments, 245 Summer Street, Boston, Massachusetts 02210.
Name, Year of Birth; Principal Occupations and Other Relevant Experience+
Abigail P. Johnson (1961)
Year of Election or Appointment: 2009
Trustee
Chairman of the Board of Trustees
Ms. Johnson also serves as Trustee of other Fidelity® funds. Ms. Johnson serves as Chairman (2016-present), Chief Executive Officer (2014-present), and Director (2007-present) of FMR LLC (diversified financial services company), President of Fidelity Financial Services (2012-present) and President of Personal, Workplace and Institutional Services (2005-present). Ms. Johnson is Chairman and Director of Fidelity Management & Research Company LLC (investment adviser firm, 2011-present). Previously, Ms. Johnson served as Chairman and Director of FMR Co., Inc. (investment adviser firm, 2011-2019), Vice Chairman (2007-2016) and President (2013-2016) of FMR LLC, President and a Director of Fidelity Management & Research Company (2001-2005), a Trustee of other investment companies advised by Fidelity Management & Research Company, Fidelity Investments Money Management, Inc. (investment adviser firm), and FMR Co., Inc. (2001-2005), Senior Vice President of the Fidelity® funds (2001-2005), and managed a number of Fidelity® funds. Ms. Abigail P. Johnson and Mr. Arthur E. Johnson are not related.
Jennifer Toolin McAuliffe (1959)
Year of Election or Appointment: 2016
Trustee
Ms. McAuliffe also serves as Trustee of other Fidelity® funds and as Trustee of Fidelity Charitable (2020-present). Previously, Ms. McAuliffe served as Co-Head of Fixed Income of Fidelity Investments Limited (now known as FIL Limited (FIL)) (diversified financial services company), Director of Research for FIL's credit and quantitative teams in London, Hong Kong and Tokyo and Director of Research for taxable and municipal bonds at Fidelity Investments Money Management, Inc. Ms. McAuliffe previously served as a member of the Advisory Board of certain Fidelity® funds (2016). Ms. McAuliffe was previously a lawyer at Ropes & Gray LLP and an international banker at Chemical Bank NA (now JPMorgan Chase & Co.). Ms. McAuliffe also currently serves as director or trustee of several not-for-profit entities.
Christine J. Thompson (1958)
Year of Election or Appointment: 2023
Trustee
Ms. Thompson also serves as a Trustee of other Fidelity® funds. Ms. Thompson serves as Leader of Advanced Technologies for Investment Management at Fidelity Investments (2018-present). Previously, Ms. Thompson served as Chief Investment Officer in the Bond group at Fidelity Management & Research Company (2010-2018) and held various other roles including Director of municipal bond portfolio managers and Portfolio Manager of certain Fidelity® funds.
* Determined to be an "Interested Trustee" by virtue of, among other things, his or her affiliation with the trust or various entities under common control with FMR.
+ The information includes the Trustee's principal occupation during the last five years and other information relating to the experience, attributes, and skills relevant to the Trustee's qualifications to serve as a Trustee, which led to the conclusion that the Trustee should serve as a Trustee for the fund.
Independent Trustees:
Correspondence intended for an Independent Trustee may be sent to Fidelity Investments, P.O. Box 55235, Boston, Massachusetts 02205-5235.
Name, Year of Birth; Principal Occupations and Other Relevant Experience+
Elizabeth S. Acton (1951)
Year of Election or Appointment: 2016
Trustee
Ms. Acton also serves as Trustee of other Fidelity® funds. Prior to her retirement, Ms. Acton served as Executive Vice President, Finance (2011-2012), Executive Vice President, Chief Financial Officer (2002-2011) and Treasurer (2004-2005) of Comerica Incorporated (financial services). Prior to joining Comerica, Ms. Acton held a variety of positions at Ford Motor Company (1983-2002), including Vice President and Treasurer (2000-2002) and Executive Vice President and Chief Financial Officer of Ford Motor Credit Company (1998-2000). Ms. Acton currently serves as a member of the Board and Audit and Finance Committees of Beazer Homes USA, Inc. (homebuilding, 2012-present). Ms. Acton previously served as a member of the Advisory Board of certain Fidelity® funds (2013-2016).
Laura M. Bishop (1961)
Year of Election or Appointment: 2023
Trustee
Ms. Bishop also serves as Trustee or Member of the Advisory Board of other Fidelity® funds. Prior to her retirement, Ms. Bishop held a variety of positions at United Services Automobile Association (2001-2020), including Executive Vice President and Chief Financial Officer (2014-2020) and Senior Vice President and Deputy Chief Financial Officer (2012-2014). Ms. Bishop currently serves as a member of the Audit Committee and Compensation and Personnel Committee (2021-present) of the Board of Directors of Korn Ferry (global organizational consulting). Previously, Ms. Bishop served as a Member of the Advisory Board of certain Fidelity® funds (2022-2023).
Ann E. Dunwoody (1953)
Year of Election or Appointment: 2018
Trustee
General Dunwoody also serves as Trustee of other Fidelity® funds. General Dunwoody (United States Army, Retired) was the first woman in U.S. military history to achieve the rank of four-star general and prior to her retirement in 2012 held a variety of positions within the U.S. Army, including Commanding General, U.S. Army Material Command (2008-2012). General Dunwoody currently serves as a member of the Board, Chair of Nomination Committee and a member of the Corporate Governance Committee of Kforce Inc. (professional staffing services, 2016-present) and a member of the Board of Automattic Inc. (software engineering, 2018-present). Previously, General Dunwoody served as President of First to Four LLC (leadership and mentoring services, 2012-2022), a member of the Advisory Board and Nominating and Corporate Governance Committee of L3 Technologies, Inc. (communication, electronic, sensor and aerospace systems, 2013-2019) and a member of the Board and Audit and Sustainability and Corporate Responsibility Committees of Republic Services, Inc. (waste collection, disposal and recycling, 2013-2016). General Dunwoody also serves on several boards for non-profit organizations, including as a member of the Board, Chair of the Nomination and Governance Committee and a member of the Audit Committee of the Noble Reach Foundation (formerly Logistics Management Institute) (consulting non-profit, 2012-present) and a member of the Board of ThanksUSA (military family education non-profit, 2014-present). Previously, General Dunwoody served as a member of the Board of Florida Institute of Technology (2015-2022) and a member of the Council of Trustees for the Association of the United States Army (advocacy non-profit, 2013-2021). General Dunwoody previously served as a member of the Advisory Board of certain Fidelity® funds (2018).
John Engler (1948)
Year of Election or Appointment: 2016
Trustee
Mr. Engler also serves as Trustee of other Fidelity® funds. Previously, Mr. Engler served as Governor of Michigan (1991-2003), President of the Business Roundtable (2011-2017) and interim President of Michigan State University (2018-2019). Previously, Mr. Engler served as a member of the Board of Stride, Inc. (formerly K12 Inc.) (technology-based education company, 2012-2022), a member of the Board of Universal Forest Products (manufacturer and distributor of wood and wood-alternative products, 2003-2019) and Trustee of The Munder Funds (2003-2014). Mr. Engler previously served as a member of the Advisory Board of certain Fidelity® funds (2014-2016).
Robert F. Gartland (1951)
Year of Election or Appointment: 2010
Trustee
Mr. Gartland also serves as Trustee of other Fidelity® funds. Prior to his retirement, Mr. Gartland held a variety of positions at Morgan Stanley (financial services, 1979-2007), including Managing Director (1987-2007) and Chase Manhattan Bank (1975-1978). Mr. Gartland previously served as Chairman and an investor in Gartland & Mellina Group Corp. (consulting, 2009-2019), as a member of the Board of National Securities Clearing Corporation (1993-1996) and as Chairman of TradeWeb (2003-2004).
Robert W. Helm (1957)
Year of Election or Appointment: 2023
Trustee
Mr. Helm also serves as Trustee or Member of the Advisory Board of other Fidelity® funds. Mr. Helm was formerly Deputy Chairman (2003-2020), partner (1991-2020) and an associate (1984-1991) of Dechert LLP (formerly Dechert Price & Rhoads). Mr. Helm currently serves on boards and committees of several not-for-profit organizations, including as a Trustee and member of the Executive Committee of the Baltimore Council on Foreign Affairs, a member of the Board of Directors of the St. Vincent de Paul Society of Baltimore and a member of the Life Guard Society of Mt. Vernon. Previously, Mr. Helm served as a Member of the Advisory Board of certain Fidelity® funds (2021-2023).
Arthur E. Johnson (1947)
Year of Election or Appointment: 2008
Trustee
Mr. Johnson also serves as Trustee of other Fidelity® funds. Prior to his retirement, Mr. Johnson served as Senior Vice President of Corporate Strategic Development of Lockheed Martin Corporation (defense contractor, 1999-2009). Mr. Johnson currently serves as a member of the Board of Booz Allen Hamilton (management consulting, 2011-present). Mr. Johnson previously served as a member of the Board of Eaton Corporation plc (diversified power management, 2009-2019) and a member of the Board of AGL Resources, Inc. (holding company, 2002-2016). Mr. Johnson previously served as Chairman (2018-2021) and Vice Chairman (2015-2018) of the Independent Trustees of certain Fidelity® funds. Mr. Arthur E. Johnson is not related to Ms. Abigail P. Johnson.
Michael E. Kenneally (1954)
Year of Election or Appointment: 2009
Trustee
Chairman of the Independent Trustees
Mr. Kenneally also serves as Trustee of other Fidelity® funds and was Vice Chairman (2018-2021) of the Independent Trustees of certain Fidelity® funds. Prior to retirement in 2005, he was Chairman and Global Chief Executive Officer of Credit Suisse Asset Management, the worldwide fund management and institutional investment business of Credit Suisse Group. Previously, Mr. Kenneally was an Executive Vice President and the Chief Investment Officer for Bank of America. In this role, he was responsible for the investment management, strategy and products delivered to the bank's institutional, high-net-worth and retail clients. Earlier, Mr. Kenneally directed the organization's equity and quantitative research groups. He began his career as a research analyst and then spent more than a dozen years as a portfolio manager for endowments, pension plans and mutual funds. He earned the Chartered Financial Analyst (CFA) designation in 1991.
Mark A. Murray (1954)
Year of Election or Appointment: 2016
Trustee
Mr. Murray also serves as Trustee of other Fidelity® funds. Previously, Mr. Murray served as Co-Chief Executive Officer (2013-2016), President (2006-2013) and Vice Chairman (2013-2020) of Meijer, Inc. Mr. Murray serves as a member of the Board (2009-present) and Public Policy and Responsibility Committee (2009-present) and Chair of the Nuclear Review Committee (2019-present) of DTE Energy Company (diversified energy company). Mr. Murray previously served as a member of the Board of Spectrum Health (not-for-profit health system, 2015-2019) and as a member of the Board and Audit Committee and Chairman of the Nominating and Corporate Governance Committee of Universal Forest Products, Inc. (manufacturer and distributor of wood and wood-alternative products, 2004-2016). Mr. Murray also serves as a member of the Board of many community and professional organizations. Mr. Murray previously served as a member of the Advisory Board of certain Fidelity® funds (2016).
Carol J. Zierhoffer (1960)
Year of Election or Appointment: 2023
Trustee
Ms. Zierhoffer also serves as Trustee or Member of the Advisory Board of other Fidelity® funds. Prior to her retirement, Ms. Zierhoffer held a variety of positions at Bechtel Corporation (engineering company, 2013-2019), including Principal Vice President and Chief Information Officer (2013-2016) and Senior Vice President and Chief Information Officer (2016-2019). Ms. Zierhoffer currently serves as a member of the Board of Directors, Audit Committee and Compensation Committee of Allscripts Healthcare Solutions, Inc. (healthcare technology, 2020-present) and as a member of the Board of Directors, Audit and Finance Committee and Nominating and Governance Committee of Atlas Air Worldwide Holdings, Inc. (aviation operating services, 2021-present). Previously, Ms. Zierhoffer served as a member of the Board of Directors and Audit Committee and as the founding Chair of the Information Technology Committee of MedAssets, Inc. (healthcare technology, 2013-2016), and as a Member of the Advisory Board of certain Fidelity® funds (2023).
+ The information includes the Trustee's principal occupation during the last five years and other information relating to the experience, attributes, and skills relevant to the Trustee's qualifications to serve as a Trustee, which led to the conclusion that the Trustee should serve as a Trustee for the fund.
Advisory Board Members and Officers:
Correspondence intended for a Member of the Advisory Board (if any) may be sent to Fidelity Investments, P.O. Box 55235, Boston, Massachusetts 02205-5235. Correspondence intended for an officer may be sent to Fidelity Investments, 245 Summer Street, Boston, Massachusetts 02210. Officers appear below in alphabetical order.
Name, Year of Birth; Principal Occupation
Heather Bonner (1977)
Year of Election or Appointment: 2023
Assistant Treasurer
Ms. Bonner also serves as an officer of other funds. Ms. Bonner serves as Senior Vice President (2022-present), and is an employee of Fidelity Investments. Ms. Bonner serves as Assistant Treasurer of Fidelity CRET Trustee LLC (2022-present). Prior to joining Fidelity, Ms. Bonner served as Managing Director at AQR Capital Management (2013-2022) and was the Treasurer and Principal Financial Officer of the AQR Funds (2013-2022).
Craig S. Brown (1977)
Year of Election or Appointment: 2019
Assistant Treasurer
Mr. Brown also serves as an officer of other funds. Mr. Brown serves as Assistant Treasurer of FIMM, LLC (2021-present) and is an employee of Fidelity Investments (2013-present). Previously, Mr. Brown served as Assistant Treasurer of certain Fidelity® funds (2019-2022).
John J. Burke III (1964)
Year of Election or Appointment: 2018
Chief Financial Officer
Mr. Burke also serves as Chief Financial Officer of other funds. Mr. Burke serves as Head of Investment Operations for Fidelity Fund and Investment Operations (2018-present) and is an employee of Fidelity Investments (1998-present). Previously Mr. Burke served as head of Asset Management Investment Operations (2012-2018).
Margaret Carey (1973)
Year of Election or Appointment: 2023
Secretary and Chief Legal Officer (CLO)
Ms. Carey also serves as an officer of other funds and as CLO of certain other Fidelity entities. She is a Senior Vice President and Deputy General Counsel of FMR LLC (diversified financial services company, 2019-present), and is an employee of Fidelity Investments.
David J. Carter (1973)
Year of Election or Appointment: 2020
Assistant Secretary
Mr. Carter also serves as Assistant Secretary of other funds. Mr. Carter serves as Senior Vice President, Deputy General Counsel (2022-present) and is an employee of Fidelity Investments (2005-present).
Jonathan Davis (1968)
Year of Election or Appointment: 2010
Assistant Treasurer
Mr. Davis also serves as an officer of other funds. Mr. Davis serves as Vice President Assistant Treasurer and is an employee of Fidelity Investments. Mr. Davis serves as Assistant Treasurer of certain Fidelity entities.
Laura M. Del Prato (1964)
Year of Election or Appointment: 2018
President and Treasurer
Ms. Del Prato also serves as an officer of other funds. Ms. Del Prato serves as Assistant Treasurer of FIMM, LLC (2021-present) and is an employee of Fidelity Investments (2017-present). Previously, Ms. Del Prato served as President and Treasurer of The North Carolina Capital Management Trust: Cash Portfolio and Term Portfolio (2018-2020). Prior to joining Fidelity Investments, Ms. Del Prato served as a Managing Director and Treasurer of the JPMorgan Mutual Funds (2014-2017). Prior to JPMorgan, Ms. Del Prato served as a partner at Cohen Fund Audit Services (accounting firm, 2012-2013) and KPMG LLP (accounting firm, 2004-2012).
Robin Foley (1964)
Year of Election or Appointment: 2023
Vice President
Ms. Foley also serves as Vice President of other funds. Ms. Foley serves as Head of Fidelity's Fixed Income division (2023-present) and is an employee of Fidelity Investments. Previously, Ms. Foley served as Chief Investment Officer of Bonds (2017-2023).
Christopher M. Gouveia (1973)
Year of Election or Appointment: 2023
Chief Compliance Officer
Mr. Gouveia also serves as Chief Compliance Officer of other funds. Mr. Gouveia serves as Senior Vice President of Asset Management Compliance for Fidelity Investments and is an employee of Fidelity Investments. Previously, Mr. Gouveia served as Chief Compliance Officer of the North Carolina Capital Management Trust (2016-2019).
Colm A. Hogan (1973)
Year of Election or Appointment: 2016
Assistant Treasurer
Mr. Hogan also serves as an officer of other funds. Mr. Hogan serves as Assistant Treasurer of FIMM, LLC (2021-present) and FMR Capital, Inc. (2017-present) and is an employee of Fidelity Investments (2005-present). Previously, Mr. Hogan served as Deputy Treasurer of certain Fidelity® funds (2016-2020) and Assistant Treasurer of certain Fidelity® funds (2016-2018).
Chris Maher (1972)
Year of Election or Appointment: 2013
Assistant Treasurer
Mr. Maher also serves as an officer of other funds. Mr. Maher serves as Assistant Treasurer of FIMM, LLC (2021-present) and FMR Capital, Inc. (2017-present), and is an employee of Fidelity Investments (2008-present). Previously, Mr. Maher served as Assistant Treasurer of certain funds (2013-2020); Vice President of Asset Management Compliance (2013), Vice President of the Program Management Group of FMR (investment adviser firm, 2010-2013), and Vice President of Valuation Oversight (2008-2010).
Brett Segaloff (1972)
Year of Election or Appointment: 2021
Anti-Money Laundering (AML) Officer
Mr. Segaloff also serves as an AML Officer of other funds and other related entities. He is Director, Anti-Money Laundering (2007-present) of FMR LLC (diversified financial services company) and is an employee of Fidelity Investments (1996-present).
Stacie M. Smith (1974)
Year of Election or Appointment: 2013
Assistant Treasurer
Ms. Smith also serves as an officer of other funds. Ms. Smith serves as Assistant Treasurer of certain Fidelity entities, is an employee of Fidelity Investments, and has served in other fund officer roles.
Jim Wegmann (1979)
Year of Election or Appointment: 2021
Deputy Treasurer
Mr. Wegmann also serves as an officer of other funds. Mr. Wegmann serves as Assistant Treasurer of FIMM, LLC (2021-present) and is an employee of Fidelity Investments (2011-present). Previously, Mr. Wegmann served as Assistant Treasurer of certain Fidelity® funds (2019-2021).
As a shareholder, you incur two types of costs: (1) transaction costs, which may include sales charges (loads) on purchase payments or redemption proceeds, as applicable and (2) ongoing costs, which generally include management fees, distribution and/or service (12b-1) fees and other Fund expenses. This Example is intended to help you understand your ongoing costs (in dollars) of investing in a fund and to compare these costs with the ongoing costs of investing in other mutual funds.
| The Example is based on an investment of $1,000 invested at the beginning of the period and held for the entire period (March 1, 2023 to August 31, 2023). |
Actual Expenses
The first line of the accompanying table provides information about actual account values and actual expenses. You may use the information in this line, together with the amount you invested, to estimate the expenses that you paid over the period. Simply divide your account value by $1,000.00 (for example, an $8,600 account value divided by $1,000.00 = 8.6), then multiply the result by the number in the first line for a class/Fund under the heading entitled "Expenses Paid During Period" to estimate the expenses you paid on your account during this period. If any fund is a shareholder of any underlying mutual funds or exchange-traded funds (ETFs) (the Underlying Funds), such fund indirectly bears its proportional share of the expenses of the Underlying Funds in addition to the direct expenses incurred presented in the table. These fees and expenses are not included in the annualized expense ratio used to calculate the expense estimate in the table below.
Hypothetical Example for Comparison Purposes
The second line of the accompanying table provides information about hypothetical account values and hypothetical expenses based on the actual expense ratio and an assumed rate of return of 5% per year before expenses, which is not the actual return. The hypothetical account values and expenses may not be used to estimate the actual ending account balance or expenses you paid for the period. You may use this information to compare the ongoing costs of investing in the Fund and other funds. To do so, compare this 5% hypothetical example with the 5% hypothetical examples that appear in the shareholder reports of the other funds. If any fund is a shareholder of any Underlying Funds, such fund indirectly bears its proportional share of the expenses of the Underlying Funds in addition to the direct expenses as presented in the table. These fees and expenses are not included in the annualized expense ratio used to calculate the expense estimate in the table below.
Please note that the expenses shown in the table are meant to highlight your ongoing costs only and do not reflect any transaction costs. Therefore, the second line of the table is useful in comparing ongoing costs only, and will not help you determine the relative total costs of owning different funds. In addition, if these transactional costs were included, your costs would have been higher.
| | | | | Annualized Expense Ratio- A | | Beginning Account Value March 1, 2023 | | Ending Account Value August 31, 2023 | | Expenses Paid During Period- C March 1, 2023 to August 31, 2023 |
| | | | | | | | | | |
| Fidelity® Series Investment Grade Securitized Fund | | | | -%-D | | | | | | |
| Actual | | | | | | $ 1,000 | | $ 1,006.40 | | $-E |
Hypothetical-B | | | | | | $ 1,000 | | $ 1,025.21 | | $-E |
| |
A Annualized expense ratio reflects expenses net of applicable fee waivers.
B 5% return per year before expenses
C Expenses are equal to the annualized expense ratio, multiplied by the average account value over the period, multiplied by 184/ 365 (to reflect the one-half year period). The fees and expenses of any Underlying Funds are not included in each annualized expense ratio.
D Amount represents less than .005%.
E Amount represents less than $.005.
The dividend and capital gains distributions for the fund(s) are available on Fidelity.com or Institutional.Fidelity.com.
A total of 2.83% of the dividends distributed during the fiscal year was derived from interest on U.S. Government securities which is generally exempt from state income tax.
The fund designates $16,412,169 of distributions paid during the fiscal year ended 2023 as qualifying to be taxed as section 163(j) interest dividends.
The fund will notify shareholders in January 2024 of amounts for use in preparing 2023 income tax returns.
1.9891237.105
IGS-ANN-1023
Item 2.
Code of Ethics
As of the end of the period, August 31, 2023, Fidelity Advisor Series II (the trust) has adopted a code of ethics, as defined in Item 2 of Form N-CSR, that applies to its President and Treasurer and its Chief Financial Officer. A copy of the code of ethics is filed as an exhibit to this Form N-CSR.
Item 3.
Audit Committee Financial Expert
The Board of Trustees of the trust has determined that Elizabeth S. Acton is an audit committee financial expert, as defined in Item 3 of Form N-CSR. Ms. Acton is independent for purposes of Item 3 of Form N-CSR.
Item 4.
Principal Accountant Fees and Services
Fees and Services
The following table presents fees billed by Deloitte & Touche LLP, the member firms of Deloitte Touche Tohmatsu, and their respective affiliates (collectively, “Deloitte Entities”) in each of the last two fiscal years for services rendered to Fidelity Series Investment Grade Securitized Fund (the “Fund”):
Services Billed by Deloitte Entities
August 31, 2023 FeesA
| | | | |
| Audit Fees | Audit-Related Fees | Tax Fees | All Other Fees |
Fidelity Series Investment Grade Securitized Fund | $80,300 | $- | $11,300 | $1,900 |
| | | | |
| Audit Fees | Audit-Related Fees | Tax Fees | All Other Fees |
Fidelity Series Investment Grade Securitized Fund | $79,800 | $- | $11,100 | $1,800 |
A Amounts may reflect rounding.
The following table presents fees billed by PricewaterhouseCoopers LLP (“PwC”) in each of the last two fiscal years for services rendered to Fidelity Advisor Limited Term Bond Fund and Fidelity Advisor Mortgage Securities Fund (the “Funds”):
Services Billed by PwC
August 31, 2023 FeesA
| | | | |
| Audit Fees | Audit-Related Fees | Tax Fees | All Other Fees |
Fidelity Advisor Limited Term Bond Fund | $92,500 | $7,500 | $11,400 | $3,200 |
Fidelity Advisor Mortgage Securities Fund | $93,700 | $7,800 | $14,100 | $3,300 |
| | | | |
| Audit Fees | Audit-Related Fees | Tax Fees | All Other Fees |
Fidelity Advisor Limited Term Bond Fund | $88,100 | $7,300 | $10,900 | $3,200 |
Fidelity Advisor Mortgage Securities Fund | $89,300 | $7,600 | $13,500 | $3,300 |
A Amounts may reflect rounding.
The following table(s) present(s) fees billed by Deloitte Entities and PwC that were required to be approved by the Audit Committee for services that relate directly to the operations and financial reporting of the Fund(s) and that are rendered on behalf of Fidelity Management & Research Company LLC ("FMR") and entities controlling, controlled by, or under common control with FMR (not including any sub-adviser whose role is primarily portfolio management and is subcontracted with or overseen by another investment adviser) that provide ongoing services to the Fund(s) (“Fund Service Providers”):
Services Billed by Deloitte Entities
| | | |
| August 31, 2023A | August 31, 2022A |
|
Audit-Related Fees | $- | $- |
|
Tax Fees | $- | $- |
|
All Other Fees | $- | $- |
|
A Amounts may reflect rounding.
Services Billed by PwC
| | |
| August 31, 2023A | August 31, 2022A |
Audit-Related Fees | $8,284,200 | $7,914,600 |
Tax Fees | $1,000 | $353,200 |
All Other Fees | $- | $- |
A Amounts may reflect rounding.
“Audit-Related Fees” represent fees billed for assurance and related services that are reasonably related to the performance of the fund audit or the review of the fund's financial statements and that are not reported under Audit Fees.
“Tax Fees” represent fees billed for tax compliance, tax advice or tax planning that relate directly to the operations and financial reporting of the fund.
“All Other Fees” represent fees billed for services provided to the fund or Fund Service Provider, a significant portion of which are assurance related, that relate directly to the operations and financial reporting of the fund, excluding those services that are reported under Audit Fees, Audit-Related Fees or Tax Fees.
Assurance services must be performed by an independent public accountant.
* * *
The aggregate non-audit fees billed by Deloitte Entities and PwC for services rendered to the Fund(s), FMR (not including any sub-adviser whose role is primarily portfolio management and is subcontracted with or overseen by another investment adviser), and any Fund Service Provider for each of the last two fiscal years of the Fund(s) are as follows:
| | |
Billed By | August 31, 2023A | August 31, 2022A |
Deloitte Entities | $255,800 | $470,500 |
PwC | $13,635,100 | $13,281,000 |
A Amounts may reflect rounding.
The trust's Audit Committee has considered non-audit services that were not pre-approved that were provided by Deloitte Entities and PwC to Fund Service Providers to be compatible with maintaining the independence of Deloitte Entities and PwC in its(their) audit of the Fund(s), taking into account representations from Deloitte Entities and PwC, in accordance with Public Company Accounting Oversight Board rules, regarding its independence from the Fund(s) and its(their) related entities and FMR’s review of the appropriateness and permissibility under applicable law of such non-audit services prior to their provision to the Fund(s) Service Providers.
Audit Committee Pre-Approval Policies and Procedures
The trust’s Audit Committee must pre-approve all audit and non-audit services provided by a fund’s independent registered public accounting firm relating to the operations or financial reporting of the fund. Prior to the commencement of any audit or non-audit services to a fund, the Audit Committee reviews the services to determine whether they are appropriate and permissible under applicable law.
The Audit Committee has adopted policies and procedures to, among other purposes, provide a framework for the Committee’s consideration of non-audit services by the audit firms that audit the Fidelity funds. The policies and procedures require that any non-audit service provided by a fund audit firm to a Fidelity fund and any non-audit service provided by a fund auditor to a Fund Service Provider that relates directly to the
operations and financial reporting of a Fidelity fund (“Covered Service”) are subject to approval by the Audit Committee before such service is provided.
All Covered Services must be approved in advance of provision of the service either: (i) by formal resolution of the Audit Committee, or (ii) by oral or written approval of the service by the Chair of the Audit Committee (or if the Chair is unavailable, such other member of the Audit Committee as may be designated by the Chair to act in the Chair’s absence). The approval contemplated by (ii) above is permitted where the Treasurer determines that action on such an engagement is necessary before the next meeting of the Audit Committee.
Non-audit services provided by a fund audit firm to a Fund Service Provider that do not relate directly to the operations and financial reporting of a Fidelity fund are reported to the Audit Committee periodically.
Non-Audit Services Approved Pursuant to Rule 2-01(c)(7)(i)(C) and (ii) of Regulation S-X (“De Minimis Exception”)
There were no non-audit services approved or required to be approved by the Audit Committee pursuant to the De Minimis Exception during the Fund’s(s’) last two fiscal years relating to services provided to (i) the Fund(s) or (ii) any Fund Service Provider that relate directly to the operations and financial reporting of the Fund(s).
The Registrant has not retained, for the preparation of the audit report on the financial statements included in the Form N-CSR, a registered public accounting firm that has a branch or office that is located in a foreign jurisdiction and that the Public Company Accounting Oversight Board (the “PCAOB”) has determined that the PCAOB is unable to inspect or investigate completely because of a position taken by an authority in the foreign jurisdiction.
The Registrant is not a “foreign issuer,” as defined in 17 CFR 240.3b-4.
Item 5.
Audit Committee of Listed Registrants
Not applicable.
Item 6.
Investments
(a)
Not applicable.
(b)
Not applicable.
Item 7.
Disclosure of Proxy Voting Policies and Procedures for Closed-End Management Investment Companies
Not applicable.
Item 8.
Portfolio Managers of Closed-End Management Investment Companies
Not applicable.
Item 9.
Purchase of Equity Securities by Closed-End Management Investment Company and Affiliated Purchasers
Not applicable.
Item 10.
Submission of Matters to a Vote of Security Holders
There were no material changes to the procedures by which shareholders may recommend nominees to the trust’s Board of Trustees.
Item 11.
Controls and Procedures
(a)(i) The President and Treasurer and the Chief Financial Officer have concluded that the trust’s disclosure controls and procedures (as defined in Rule 30a-3(c) under the Investment Company Act) provide reasonable assurances that material information relating to the trust is made known to them by the appropriate persons, based on their evaluation of these controls and procedures as of a date within 90 days of the filing date of this report.
(a)(ii) There was no change in the trust’s internal control over financial reporting (as defined in Rule 30a-3(d) under the Investment Company Act) that occurred during the period covered by this report that has materially affected, or is reasonably likely to materially affect, the trust’s internal control over financial reporting.
Item 12.
Disclosure of Securities Lending Activities for Closed-End Management
Investment Companies
Not applicable.
Item 13.
Exhibits
SIGNATURES
Pursuant to the requirements of the Securities Exchange Act of 1934 and the Investment Company Act of 1940, the registrant has duly caused this report to be signed on its behalf by the undersigned, thereunto duly authorized.
Fidelity Advisor Series II
| |
By: | /s/Laura M. Del Prato |
| Laura M. Del Prato |
| President and Treasurer |
|
|
Date: | October 23, 2023 |
Pursuant to the requirements of the Securities Exchange Act of 1934 and the Investment Company Act of 1940, this report has been signed below by the following persons on behalf of the registrant and in the capacities and on the dates indicated.
| |
By: | /s/Laura M. Del Prato |
| Laura M. Del Prato |
| President and Treasurer |
|
|
Date: | October 23, 2023 |
| |
By: | /s/John J. Burke III |
| John J. Burke III |
| Chief Financial Officer |
|
|
Date: | October 23, 2023 |