UNITED STATES
SECURITIES AND EXCHANGE COMMISSION
Washington, D.C. 20549
FORM N-CSR
CERTIFIED SHAREHOLDER REPORT OF REGISTERED
MANAGEMENT INVESTMENT COMPANIES
Investment Company Act file number 811-04707
Fidelity Advisor Series II
(Exact name of registrant as specified in charter)
245 Summer St., Boston, MA 02210
(Address of principal executive offices) (Zip code)
Margaret Carey, Secretary
245 Summer St.
Boston, Massachusetts 02210
(Name and address of agent for service)
Registrant's telephone number, including area code:
617-563-7000
| |
Date of fiscal year end: | December 31 |
|
|
Date of reporting period: | June 30, 2024 |
Item 1.
Reports to Stockholders
| |
| | SEMI-ANNUAL SHAREHOLDER REPORT | AS OF JUNE 30, 2024 | |
| | Fidelity Advisor® Strategic Income Fund Fidelity Advisor® Strategic Income Fund Class Z : FIWDX |
| | | |
This semi-annual shareholder report contains information about Fidelity Advisor® Strategic Income Fund for the period January 1, 2024 to June 30, 2024. You can find additional information about the Fund at fundresearch.fidelity.com/prospectus/sec. You can also request this information by contacting us at 1-877-208-0098 or by sending an e-mail to fidfunddocuments@fidelity.com.
What were your Fund costs for the last six months?(based on hypothetical $10,000 investment)
| | Costs of a $10,000 investment | Costs paid as a percentage of a $10,000 investment | |
| Class Z | $ 30 | 0.61% | |
Key Fund Statistics (as of June 30, 2024)
KEY FACTS | | |
| Fund Size | $13,585,628,993 | |
| Number of Holdings | 1,050 | |
| Portfolio Turnover | 87% | |
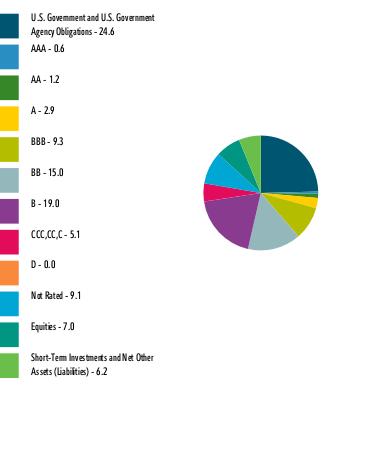
What did the Fund invest in?
(as of June 30, 2024)
| U.S. Government and U.S. Government Agency Obligations | 24.6 |
| AAA | 0.6 |
| AA | 1.2 |
| A | 2.9 |
| BBB | 9.3 |
| BB | 15.0 |
| B | 19.0 |
| CCC,CC,C | 5.1 |
| D | 0.0 |
| Not Rated | 9.1 |
| Equities | 7.0 |
| Short-Term Investments and Net Other Assets (Liabilities) | 6.2 |
QUALITY DIVERSIFICATION (% of Fund's net assets) |
|
| |
| We have used ratings from Moody's Investors Service, Inc. Where Moody's® ratings are not available, we have used S&P® ratings. All ratings are as of the date indicated and do not reflect subsequent changes. |
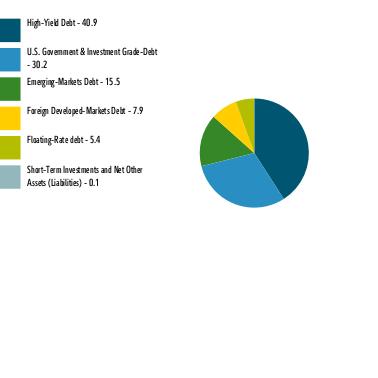
| High-Yield Debt | 40.9 |
| U.S. Government & Investment Grade-Debt | 30.2 |
| Emerging-Markets Debt | 15.5 |
| Foreign Developed-Markets Debt | 7.9 |
| Floating-Rate debt | 5.4 |
| Short-Term Investments and Net Other Assets (Liabilities) | 0.1 |
ASSET ALLOCATION (% of Fund's net assets) |
|
|
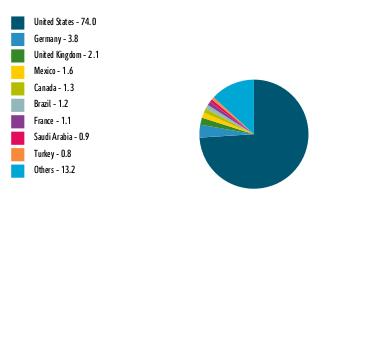
| United States | 74.0 |
| Germany | 3.8 |
| United Kingdom | 2.1 |
| Mexico | 1.6 |
| Canada | 1.3 |
| Brazil | 1.2 |
| France | 1.1 |
| Saudi Arabia | 0.9 |
| Turkey | 0.8 |
| Others | 13.2 |
GEOGRAPHIC DIVERSIFICATION (% of Fund's net assets) |
|
| |
|
TOP HOLDINGS (% of Fund's net assets) | | |
| US Treasury Notes | 17.2 | |
| US Treasury Bonds | 6.1 | |
| Freddie Mac Multifamily Structured Pass Through Certificates | 2.7 | |
| German Federal Republic | 2.6 | |
| Freddie Mac Gold Pool | 1.0 | |
| TransDigm Inc | 1.0 | |
| Fannie Mae Guaranteed REMICS | 0.8 | |
| Republic of Turkiye/The | 0.7 | |
| Bank of America Corp | 0.7 | |
| Fannie Mae Mortgage pass-thru certificates | 0.6 | |
| | 33.4 | |
| |
| Fidelity, the Fidelity Investments Logo and all other Fidelity trademarks or service marks used herein are trademarks or service marks of FMR LLC. Any third-party marks that are used herein are trademarks or service marks of their respective owners. © 2024 FMR LLC. All rights reserved. |
| | For additional information about the Fund; including its prospectus, financial information, holdings and proxy information, scan the QR code or visit fundresearch.fidelity.com/prospectus/sec 1.9916027.100 3286-TSRS-0824 |
| |
| | SEMI-ANNUAL SHAREHOLDER REPORT | AS OF JUNE 30, 2024 | |
| | Fidelity Advisor® Strategic Income Fund Fidelity Advisor® Strategic Income Fund Class C : FSRCX |
| | | |
This semi-annual shareholder report contains information about Fidelity Advisor® Strategic Income Fund for the period January 1, 2024 to June 30, 2024. You can find additional information about the Fund at fundresearch.fidelity.com/prospectus/sec. You can also request this information by contacting us at 1-877-208-0098 or by sending an e-mail to fidfunddocuments@fidelity.com.
What were your Fund costs for the last six months?(based on hypothetical $10,000 investment)
| | Costs of a $10,000 investment | Costs paid as a percentage of a $10,000 investment | |
| Class C | $ 86 | 1.71% | |
Key Fund Statistics (as of June 30, 2024)
KEY FACTS | | |
| Fund Size | $13,585,628,993 | |
| Number of Holdings | 1,050 | |
| Portfolio Turnover | 87% | |
What did the Fund invest in?
(as of June 30, 2024)
| U.S. Government and U.S. Government Agency Obligations | 24.6 |
| AAA | 0.6 |
| AA | 1.2 |
| A | 2.9 |
| BBB | 9.3 |
| BB | 15.0 |
| B | 19.0 |
| CCC,CC,C | 5.1 |
| D | 0.0 |
| Not Rated | 9.1 |
| Equities | 7.0 |
| Short-Term Investments and Net Other Assets (Liabilities) | 6.2 |
QUALITY DIVERSIFICATION (% of Fund's net assets) |
|
| |
| We have used ratings from Moody's Investors Service, Inc. Where Moody's® ratings are not available, we have used S&P® ratings. All ratings are as of the date indicated and do not reflect subsequent changes. |
| High-Yield Debt | 40.9 |
| U.S. Government & Investment Grade-Debt | 30.2 |
| Emerging-Markets Debt | 15.5 |
| Foreign Developed-Markets Debt | 7.9 |
| Floating-Rate debt | 5.4 |
| Short-Term Investments and Net Other Assets (Liabilities) | 0.1 |
ASSET ALLOCATION (% of Fund's net assets) |
|
|
| United States | 74.0 |
| Germany | 3.8 |
| United Kingdom | 2.1 |
| Mexico | 1.6 |
| Canada | 1.3 |
| Brazil | 1.2 |
| France | 1.1 |
| Saudi Arabia | 0.9 |
| Turkey | 0.8 |
| Others | 13.2 |
GEOGRAPHIC DIVERSIFICATION (% of Fund's net assets) |
|
| |
|
TOP HOLDINGS (% of Fund's net assets) | | |
| US Treasury Notes | 17.2 | |
| US Treasury Bonds | 6.1 | |
| Freddie Mac Multifamily Structured Pass Through Certificates | 2.7 | |
| German Federal Republic | 2.6 | |
| Freddie Mac Gold Pool | 1.0 | |
| TransDigm Inc | 1.0 | |
| Fannie Mae Guaranteed REMICS | 0.8 | |
| Republic of Turkiye/The | 0.7 | |
| Bank of America Corp | 0.7 | |
| Fannie Mae Mortgage pass-thru certificates | 0.6 | |
| | 33.4 | |
| |
| Fidelity, the Fidelity Investments Logo and all other Fidelity trademarks or service marks used herein are trademarks or service marks of FMR LLC. Any third-party marks that are used herein are trademarks or service marks of their respective owners. © 2024 FMR LLC. All rights reserved. |
| | For additional information about the Fund; including its prospectus, financial information, holdings and proxy information, scan the QR code or visit fundresearch.fidelity.com/prospectus/sec 1.9916028.100 523-TSRS-0824 |
| |
| | SEMI-ANNUAL SHAREHOLDER REPORT | AS OF JUNE 30, 2024 | |
| | Fidelity Advisor® Strategic Income Fund Fidelity Advisor® Strategic Income Fund Class I : FSRIX |
| | | |
This semi-annual shareholder report contains information about Fidelity Advisor® Strategic Income Fund for the period January 1, 2024 to June 30, 2024. You can find additional information about the Fund at fundresearch.fidelity.com/prospectus/sec. You can also request this information by contacting us at 1-877-208-0098 or by sending an e-mail to fidfunddocuments@fidelity.com.
What were your Fund costs for the last six months?(based on hypothetical $10,000 investment)
| | Costs of a $10,000 investment | Costs paid as a percentage of a $10,000 investment | |
| Class I | $ 36 | 0.71% | |
Key Fund Statistics (as of June 30, 2024)
KEY FACTS | | |
| Fund Size | $13,585,628,993 | |
| Number of Holdings | 1,050 | |
| Portfolio Turnover | 87% | |
What did the Fund invest in?
(as of June 30, 2024)
| U.S. Government and U.S. Government Agency Obligations | 24.6 |
| AAA | 0.6 |
| AA | 1.2 |
| A | 2.9 |
| BBB | 9.3 |
| BB | 15.0 |
| B | 19.0 |
| CCC,CC,C | 5.1 |
| D | 0.0 |
| Not Rated | 9.1 |
| Equities | 7.0 |
| Short-Term Investments and Net Other Assets (Liabilities) | 6.2 |
QUALITY DIVERSIFICATION (% of Fund's net assets) |
|
| |
| We have used ratings from Moody's Investors Service, Inc. Where Moody's® ratings are not available, we have used S&P® ratings. All ratings are as of the date indicated and do not reflect subsequent changes. |
| High-Yield Debt | 40.9 |
| U.S. Government & Investment Grade-Debt | 30.2 |
| Emerging-Markets Debt | 15.5 |
| Foreign Developed-Markets Debt | 7.9 |
| Floating-Rate debt | 5.4 |
| Short-Term Investments and Net Other Assets (Liabilities) | 0.1 |
ASSET ALLOCATION (% of Fund's net assets) |
|
|
| United States | 74.0 |
| Germany | 3.8 |
| United Kingdom | 2.1 |
| Mexico | 1.6 |
| Canada | 1.3 |
| Brazil | 1.2 |
| France | 1.1 |
| Saudi Arabia | 0.9 |
| Turkey | 0.8 |
| Others | 13.2 |
GEOGRAPHIC DIVERSIFICATION (% of Fund's net assets) |
|
| |
|
TOP HOLDINGS (% of Fund's net assets) | | |
| US Treasury Notes | 17.2 | |
| US Treasury Bonds | 6.1 | |
| Freddie Mac Multifamily Structured Pass Through Certificates | 2.7 | |
| German Federal Republic | 2.6 | |
| Freddie Mac Gold Pool | 1.0 | |
| TransDigm Inc | 1.0 | |
| Fannie Mae Guaranteed REMICS | 0.8 | |
| Republic of Turkiye/The | 0.7 | |
| Bank of America Corp | 0.7 | |
| Fannie Mae Mortgage pass-thru certificates | 0.6 | |
| | 33.4 | |
| |
| Fidelity, the Fidelity Investments Logo and all other Fidelity trademarks or service marks used herein are trademarks or service marks of FMR LLC. Any third-party marks that are used herein are trademarks or service marks of their respective owners. © 2024 FMR LLC. All rights reserved. |
| | For additional information about the Fund; including its prospectus, financial information, holdings and proxy information, scan the QR code or visit fundresearch.fidelity.com/prospectus/sec 1.9916030.100 648-TSRS-0824 |
| |
| | SEMI-ANNUAL SHAREHOLDER REPORT | AS OF JUNE 30, 2024 | |
| | Fidelity Advisor® Strategic Income Fund Fidelity Advisor® Strategic Income Fund Class A : FSTAX |
| | | |
This semi-annual shareholder report contains information about Fidelity Advisor® Strategic Income Fund for the period January 1, 2024 to June 30, 2024. You can find additional information about the Fund at fundresearch.fidelity.com/prospectus/sec. You can also request this information by contacting us at 1-877-208-0098 or by sending an e-mail to fidfunddocuments@fidelity.com.
What were your Fund costs for the last six months?(based on hypothetical $10,000 investment)
| | Costs of a $10,000 investment | Costs paid as a percentage of a $10,000 investment | |
| Class A | $ 48 | 0.95% | |
Key Fund Statistics (as of June 30, 2024)
KEY FACTS | | |
| Fund Size | $13,585,628,993 | |
| Number of Holdings | 1,050 | |
| Portfolio Turnover | 87% | |
What did the Fund invest in?
(as of June 30, 2024)
| U.S. Government and U.S. Government Agency Obligations | 24.6 |
| AAA | 0.6 |
| AA | 1.2 |
| A | 2.9 |
| BBB | 9.3 |
| BB | 15.0 |
| B | 19.0 |
| CCC,CC,C | 5.1 |
| D | 0.0 |
| Not Rated | 9.1 |
| Equities | 7.0 |
| Short-Term Investments and Net Other Assets (Liabilities) | 6.2 |
QUALITY DIVERSIFICATION (% of Fund's net assets) |
|
| |
| We have used ratings from Moody's Investors Service, Inc. Where Moody's® ratings are not available, we have used S&P® ratings. All ratings are as of the date indicated and do not reflect subsequent changes. |
| High-Yield Debt | 40.9 |
| U.S. Government & Investment Grade-Debt | 30.2 |
| Emerging-Markets Debt | 15.5 |
| Foreign Developed-Markets Debt | 7.9 |
| Floating-Rate debt | 5.4 |
| Short-Term Investments and Net Other Assets (Liabilities) | 0.1 |
ASSET ALLOCATION (% of Fund's net assets) |
|
|
| United States | 74.0 |
| Germany | 3.8 |
| United Kingdom | 2.1 |
| Mexico | 1.6 |
| Canada | 1.3 |
| Brazil | 1.2 |
| France | 1.1 |
| Saudi Arabia | 0.9 |
| Turkey | 0.8 |
| Others | 13.2 |
GEOGRAPHIC DIVERSIFICATION (% of Fund's net assets) |
|
| |
|
TOP HOLDINGS (% of Fund's net assets) | | |
| US Treasury Notes | 17.2 | |
| US Treasury Bonds | 6.1 | |
| Freddie Mac Multifamily Structured Pass Through Certificates | 2.7 | |
| German Federal Republic | 2.6 | |
| Freddie Mac Gold Pool | 1.0 | |
| TransDigm Inc | 1.0 | |
| Fannie Mae Guaranteed REMICS | 0.8 | |
| Republic of Turkiye/The | 0.7 | |
| Bank of America Corp | 0.7 | |
| Fannie Mae Mortgage pass-thru certificates | 0.6 | |
| | 33.4 | |
| |
| Fidelity, the Fidelity Investments Logo and all other Fidelity trademarks or service marks used herein are trademarks or service marks of FMR LLC. Any third-party marks that are used herein are trademarks or service marks of their respective owners. © 2024 FMR LLC. All rights reserved. |
| | For additional information about the Fund; including its prospectus, financial information, holdings and proxy information, scan the QR code or visit fundresearch.fidelity.com/prospectus/sec 1.9916025.100 260-TSRS-0824 |
| |
| | SEMI-ANNUAL SHAREHOLDER REPORT | AS OF JUNE 30, 2024 | |
| | Fidelity Advisor® Strategic Income Fund Fidelity® Strategic Income Fund : FADMX |
| | | |
This semi-annual shareholder report contains information about Fidelity Advisor® Strategic Income Fund for the period January 1, 2024 to June 30, 2024. You can find additional information about the Fund at fundresearch.fidelity.com/prospectus/sec. You can also request this information by contacting us at 1-800-544-8544 or by sending an e-mail to fidfunddocuments@fidelity.com.
What were your Fund costs for the last six months?(based on hypothetical $10,000 investment)
| | Costs of a $10,000 investment | Costs paid as a percentage of a $10,000 investment | |
| Fidelity® Strategic Income Fund | $ 33 | 0.66% | |
Key Fund Statistics (as of June 30, 2024)
KEY FACTS | | |
| Fund Size | $13,585,628,993 | |
| Number of Holdings | 1,050 | |
| Portfolio Turnover | 87% | |
What did the Fund invest in?
(as of June 30, 2024)
| U.S. Government and U.S. Government Agency Obligations | 24.6 |
| AAA | 0.6 |
| AA | 1.2 |
| A | 2.9 |
| BBB | 9.3 |
| BB | 15.0 |
| B | 19.0 |
| CCC,CC,C | 5.1 |
| D | 0.0 |
| Not Rated | 9.1 |
| Equities | 7.0 |
| Short-Term Investments and Net Other Assets (Liabilities) | 6.2 |
QUALITY DIVERSIFICATION (% of Fund's net assets) |
|
| |
| We have used ratings from Moody's Investors Service, Inc. Where Moody's® ratings are not available, we have used S&P® ratings. All ratings are as of the date indicated and do not reflect subsequent changes. |
| High-Yield Debt | 40.9 |
| U.S. Government & Investment Grade-Debt | 30.2 |
| Emerging-Markets Debt | 15.5 |
| Foreign Developed-Markets Debt | 7.9 |
| Floating-Rate debt | 5.4 |
| Short-Term Investments and Net Other Assets (Liabilities) | 0.1 |
ASSET ALLOCATION (% of Fund's net assets) |
|
|
| United States | 74.0 |
| Germany | 3.8 |
| United Kingdom | 2.1 |
| Mexico | 1.6 |
| Canada | 1.3 |
| Brazil | 1.2 |
| France | 1.1 |
| Saudi Arabia | 0.9 |
| Turkey | 0.8 |
| Others | 13.2 |
GEOGRAPHIC DIVERSIFICATION (% of Fund's net assets) |
|
| |
|
TOP HOLDINGS (% of Fund's net assets) | | |
| US Treasury Notes | 17.2 | |
| US Treasury Bonds | 6.1 | |
| Freddie Mac Multifamily Structured Pass Through Certificates | 2.7 | |
| German Federal Republic | 2.6 | |
| Freddie Mac Gold Pool | 1.0 | |
| TransDigm Inc | 1.0 | |
| Fannie Mae Guaranteed REMICS | 0.8 | |
| Republic of Turkiye/The | 0.7 | |
| Bank of America Corp | 0.7 | |
| Fannie Mae Mortgage pass-thru certificates | 0.6 | |
| | 33.4 | |
| |
| Fidelity, the Fidelity Investments Logo and all other Fidelity trademarks or service marks used herein are trademarks or service marks of FMR LLC. Any third-party marks that are used herein are trademarks or service marks of their respective owners. © 2024 FMR LLC. All rights reserved. |
| | For additional information about the Fund; including its prospectus, financial information, holdings and proxy information, scan the QR code or visit fundresearch.fidelity.com/prospectus/sec 1.9916026.100 3082-TSRS-0824 |
| |
| | SEMI-ANNUAL SHAREHOLDER REPORT | AS OF JUNE 30, 2024 | |
| | Fidelity Advisor® Strategic Income Fund Fidelity Advisor® Strategic Income Fund Class M : FSIAX |
| | | |
This semi-annual shareholder report contains information about Fidelity Advisor® Strategic Income Fund for the period January 1, 2024 to June 30, 2024. You can find additional information about the Fund at fundresearch.fidelity.com/prospectus/sec. You can also request this information by contacting us at 1-877-208-0098 or by sending an e-mail to fidfunddocuments@fidelity.com.
What were your Fund costs for the last six months?(based on hypothetical $10,000 investment)
| | Costs of a $10,000 investment | Costs paid as a percentage of a $10,000 investment | |
| Class M | $ 48 | 0.95% | |
Key Fund Statistics (as of June 30, 2024)
KEY FACTS | | |
| Fund Size | $13,585,628,993 | |
| Number of Holdings | 1,050 | |
| Portfolio Turnover | 87% | |
What did the Fund invest in?
(as of June 30, 2024)
| U.S. Government and U.S. Government Agency Obligations | 24.6 |
| AAA | 0.6 |
| AA | 1.2 |
| A | 2.9 |
| BBB | 9.3 |
| BB | 15.0 |
| B | 19.0 |
| CCC,CC,C | 5.1 |
| D | 0.0 |
| Not Rated | 9.1 |
| Equities | 7.0 |
| Short-Term Investments and Net Other Assets (Liabilities) | 6.2 |
QUALITY DIVERSIFICATION (% of Fund's net assets) |
|
| |
| We have used ratings from Moody's Investors Service, Inc. Where Moody's® ratings are not available, we have used S&P® ratings. All ratings are as of the date indicated and do not reflect subsequent changes. |
| High-Yield Debt | 40.9 |
| U.S. Government & Investment Grade-Debt | 30.2 |
| Emerging-Markets Debt | 15.5 |
| Foreign Developed-Markets Debt | 7.9 |
| Floating-Rate debt | 5.4 |
| Short-Term Investments and Net Other Assets (Liabilities) | 0.1 |
ASSET ALLOCATION (% of Fund's net assets) |
|
|
| United States | 74.0 |
| Germany | 3.8 |
| United Kingdom | 2.1 |
| Mexico | 1.6 |
| Canada | 1.3 |
| Brazil | 1.2 |
| France | 1.1 |
| Saudi Arabia | 0.9 |
| Turkey | 0.8 |
| Others | 13.2 |
GEOGRAPHIC DIVERSIFICATION (% of Fund's net assets) |
|
| |
|
TOP HOLDINGS (% of Fund's net assets) | | |
| US Treasury Notes | 17.2 | |
| US Treasury Bonds | 6.1 | |
| Freddie Mac Multifamily Structured Pass Through Certificates | 2.7 | |
| German Federal Republic | 2.6 | |
| Freddie Mac Gold Pool | 1.0 | |
| TransDigm Inc | 1.0 | |
| Fannie Mae Guaranteed REMICS | 0.8 | |
| Republic of Turkiye/The | 0.7 | |
| Bank of America Corp | 0.7 | |
| Fannie Mae Mortgage pass-thru certificates | 0.6 | |
| | 33.4 | |
| |
| Fidelity, the Fidelity Investments Logo and all other Fidelity trademarks or service marks used herein are trademarks or service marks of FMR LLC. Any third-party marks that are used herein are trademarks or service marks of their respective owners. © 2024 FMR LLC. All rights reserved. |
| | For additional information about the Fund; including its prospectus, financial information, holdings and proxy information, scan the QR code or visit fundresearch.fidelity.com/prospectus/sec 1.9916029.100 638-TSRS-0824 |
Item 2.
Code of Ethics
Not applicable.
Item 3.
Audit Committee Financial Expert
Not applicable.
Item 4.
Principal Accountant Fees and Services
Not applicable.
Item 5.
Audit Committee of Listed Registrants
Not applicable.
Item 6.
Investments
(a)
Not applicable.
(b)
Not applicable
Item 7.
Financial Statements and Financial Highlights for Open-End Management Investment Companies
Fidelity Advisor® Strategic Income Fund
Semi-Annual Report
June 30, 2024
Includes Fidelity and Fidelity Advisor share classes
Contents
To view a fund's proxy voting guidelines and proxy voting record for the 12-month period ended June 30, visit http://www.fidelity.com/proxyvotingresults or visit the Securities and Exchange Commission's (SEC) web site at http://www.sec.gov.
You may also call 1-800-544-8544 if you're an individual investing directly with Fidelity, call 1-800-835-5092 if you're a plan sponsor or participant with Fidelity as your recordkeeper or call 1-877-208-0098 on institutional accounts or if you're an advisor or invest through one to request a free copy of the proxy voting guidelines.
Standard & Poor's, S&P and S&P 500 are registered service marks of The McGraw-Hill Companies, Inc. and have been licensed for use by Fidelity Distributors Corporation.
Other third-party marks appearing herein are the property of their respective owners.
All other marks appearing herein are registered or unregistered trademarks or service marks of FMR LLC or an affiliated company. © 2024 FMR LLC. All rights reserved.
This report and the financial statements contained herein are submitted for the general information of the shareholders of the Fund. This report is not authorized for distribution to prospective investors in the Fund unless preceded or accompanied by an effective prospectus.
A fund files its complete schedule of portfolio holdings with the SEC for the first and third quarters of each fiscal year on Form N-PORT. Forms N-PORT are available on the SEC's web site at http://www.sec.gov. A fund's Forms N-PORT may be reviewed and copied at the SEC's Public Reference Room in Washington, DC. Information regarding the operation of the SEC's Public Reference Room may be obtained by calling 1-800-SEC-0330.
For a complete list of a fund's portfolio holdings, view the most recent holdings listing, semiannual report, or annual report on Fidelity's web site at http://www.fidelity.com, http://www.institutional.fidelity.com, or http://www.401k.com, as applicable.
NOT FDIC INSURED •MAY LOSE VALUE •NO BANK GUARANTEE
Neither the Fund nor Fidelity Distributors Corporation is a bank.
Item 7: Financial Statements and Financial Highlights for Open-End Management Investment Companies (Semi-Annual Report)
Fidelity Advisor® Strategic Income Fund
Schedule of Investments June 30, 2024 (Unaudited)
Showing Percentage of Net Assets
| Corporate Bonds - 28.5% |
| | | Principal Amount (a) (000s) | Value ($) (000s) |
| Convertible Bonds - 0.5% | | | |
| COMMUNICATION SERVICES - 0.2% | | | |
| Media - 0.2% | | | |
| DISH Network Corp.: | | | |
| 0% 12/15/25 | | 16,561 | 12,174 |
| 3.375% 8/15/26 | | 24,978 | 15,490 |
| | | | 27,664 |
| CONSUMER DISCRETIONARY - 0.1% | | | |
| Hotels, Restaurants & Leisure - 0.1% | | | |
| New Cotai LLC 5% 2/24/27 (b) | | 2,824 | 6,099 |
| | | | |
| FINANCIALS - 0.0% | | | |
| Capital Markets - 0.0% | | | |
| Coinbase Global, Inc. 0.25% 4/1/30 (c) | | 3,680 | 3,544 |
| | | | |
| INFORMATION TECHNOLOGY - 0.2% | | | |
| Semiconductors & Semiconductor Equipment - 0.2% | | | |
| Wolfspeed, Inc. 1.875% 12/1/29 | | 51,247 | 28,237 |
| | | | |
| TOTAL CONVERTIBLE BONDS | | | 65,544 |
| Nonconvertible Bonds - 28.0% | | | |
| COMMUNICATION SERVICES - 1.8% | | | |
| Diversified Telecommunication Services - 0.7% | | | |
| Altice France SA: | | | |
| 5.125% 1/15/29(c) | | 1,265 | 825 |
| 5.125% 7/15/29(c) | | 39,385 | 25,900 |
| 5.5% 1/15/28(c) | | 9,830 | 6,732 |
| 5.5% 10/15/29(c) | | 29,470 | 19,423 |
| Frontier Communications Holdings LLC: | | | |
| 5% 5/1/28(c) | | 11,730 | 11,051 |
| 5.875% 10/15/27(c) | | 6,300 | 6,151 |
| Qwest Corp. 7.25% 9/15/25 | | 955 | 929 |
| Sable International Finance Ltd. 5.75% 9/7/27 (c) | | 13,364 | 12,875 |
| Telenet Finance Luxembourg Notes SARL 5.5% 3/1/28 (c) | | 9,200 | 8,694 |
| | | | 92,580 |
| Entertainment - 0.0% | | | |
| Roblox Corp. 3.875% 5/1/30 (c) | | 4,175 | 3,709 |
| | | | |
| Media - 0.9% | | | |
| Altice Financing SA: | | | |
| 5% 1/15/28(c) | | 8,025 | 6,102 |
| 5.75% 8/15/29(c) | | 11,895 | 8,636 |
| DISH DBS Corp. 5.75% 12/1/28 (c) | | 6,925 | 4,801 |
| DISH Network Corp. 11.75% 11/15/27 (c) | | 27,490 | 26,954 |
| Gannett Holdings LLC 6% 11/1/26 (c) | | 4,000 | 3,819 |
| LCPR Senior Secured Financing DAC: | | | |
| 5.125% 7/15/29(c) | | 7,310 | 6,062 |
| 6.75% 10/15/27(c) | | 6,107 | 5,720 |
| Scripps Escrow II, Inc. 3.875% 1/15/29 (c) | | 1,655 | 1,153 |
| Sirius XM Radio, Inc.: | | | |
| 3.875% 9/1/31(c) | | 5,645 | 4,608 |
| 4% 7/15/28(c) | | 4,890 | 4,417 |
| 5% 8/1/27(c) | | 4,610 | 4,413 |
| Univision Communications, Inc.: | | | |
| 4.5% 5/1/29(c) | | 5,760 | 4,841 |
| 7.375% 6/30/30(c) | | 18,475 | 17,185 |
| 8.5% 7/31/31(c) | | 3,900 | 3,788 |
| Videotron Ltd. 5.125% 4/15/27 (c) | | 7,325 | 7,212 |
| VZ Secured Financing BV 5% 1/15/32 (c) | | 11,130 | 9,490 |
| Ziggo BV 4.875% 1/15/30 (c) | | 4,805 | 4,272 |
| | | | 123,473 |
| Wireless Telecommunication Services - 0.2% | | | |
| C&W Senior Finance Ltd. 6.875% 9/15/27 (c) | | 18,890 | 18,124 |
| Millicom International Cellular SA 4.5% 4/27/31 (c) | | 1,040 | 893 |
| VMED O2 UK Financing I PLC 4.75% 7/15/31 (c) | | 9,930 | 8,375 |
| | | | 27,392 |
TOTAL COMMUNICATION SERVICES | | | 247,154 |
| | | | |
| CONSUMER DISCRETIONARY - 3.4% | | | |
| Automobile Components - 0.3% | | | |
| Adient Global Holdings Ltd. 7% 4/15/28 (c) | | 2,805 | 2,871 |
| Clarios Global LP / Clarios U.S. Finance Co. 6.75% 5/15/28 (c) | | 5,595 | 5,662 |
| Dana, Inc. 4.5% 2/15/32 | | 4,150 | 3,564 |
| Hertz Corp.: | | | |
| 4.625% 12/1/26(c) | | 2,800 | 2,031 |
| 5% 12/1/29(c) | | 3,460 | 2,125 |
| 5.5%(b)(c)(d) | | 6,540 | 213 |
| 6%(b)(c)(d) | | 5,785 | 521 |
| 6.25%(b)(d) | | 6,775 | 220 |
| 7.125%(b)(c)(d) | | 6,315 | 568 |
| 12.625% 7/15/29(c) | | 1,245 | 1,287 |
| Macquarie AirFinance Holdings: | | | |
| 6.4% 3/26/29(c) | | 1,805 | 1,836 |
| 6.5% 3/26/31(c) | | 2,760 | 2,838 |
| 8.125% 3/30/29(c) | | 4,100 | 4,334 |
| Nesco Holdings II, Inc. 5.5% 4/15/29 (c) | | 7,155 | 6,627 |
| Tenneco, Inc. 8% 11/17/28 (c) | | 8,245 | 7,506 |
| | | | 42,203 |
| Automobiles - 0.0% | | | |
| McLaren Finance PLC 7.5% 8/1/26 (c) | | 3,860 | 3,355 |
| | | | |
| Broadline Retail - 0.0% | | | |
| Angi Group LLC 3.875% 8/15/28 (c) | | 3,385 | 2,909 |
| | | | |
| Distributors - 0.0% | | | |
| Windsor Holdings III, LLC 8.5% 6/15/30 (c) | | 2,790 | 2,912 |
| | | | |
| Diversified Consumer Services - 0.2% | | | |
| Adtalem Global Education, Inc. 5.5% 3/1/28 (c) | | 4,235 | 4,074 |
| GEMS MENASA Cayman Ltd./GEMS Education Delaware LLC 7.125% 7/31/26 (c) | | 5,300 | 5,267 |
| Service Corp. International 4% 5/15/31 | | 5,750 | 5,121 |
| TKC Holdings, Inc. 6.875% 5/15/28 (c) | | 9,328 | 9,044 |
| WASH Multifamily Acquisition, Inc. 5.75% 4/15/26 (c) | | 4,750 | 4,644 |
| | | | 28,150 |
| Hotels, Restaurants & Leisure - 2.0% | | | |
| 1011778 BC Unlimited Liability Co./New Red Finance, Inc.: | | | |
| 3.875% 1/15/28(c) | | 5,685 | 5,325 |
| 4% 10/15/30(c) | | 23,490 | 20,678 |
| 4.375% 1/15/28(c) | | 6,265 | 5,909 |
| Bloomin Brands, Inc. / OSI Restaurant Partners LLC 5.125% 4/15/29 (c) | | 2,720 | 2,449 |
| Boyd Gaming Corp. 4.75% 6/15/31 (c) | | 7,140 | 6,471 |
| Carnival Corp.: | | | |
| 4% 8/1/28(c) | | 26,560 | 24,943 |
| 7% 8/15/29(c) | | 2,830 | 2,934 |
| 7.625% 3/1/26(c) | | 10,595 | 10,700 |
| Carnival Holdings (Bermuda) Ltd. 10.375% 5/1/28 (c) | | 8,655 | 9,370 |
| Churchill Downs, Inc.: | | | |
| 5.75% 4/1/30(c) | | 6,975 | 6,775 |
| 6.75% 5/1/31(c) | | 5,595 | 5,625 |
| Fertitta Entertainment LLC / Fertitta Entertainment Finance Co., Inc.: | | | |
| 4.625% 1/15/29(c) | | 11,750 | 10,700 |
| 6.75% 1/15/30(c) | | 15,885 | 13,950 |
| Garden SpinCo Corp. 8.625% 7/20/30 (c) | | 2,545 | 2,748 |
| Hilton Domestic Operating Co., Inc.: | | | |
| 3.75% 5/1/29(c) | | 3,350 | 3,072 |
| 4% 5/1/31(c) | | 5,020 | 4,493 |
| 4.875% 1/15/30 | | 11,025 | 10,582 |
| Hilton Worldwide Finance LLC/Hilton Worldwide Finance Corp. 4.875% 4/1/27 | | 5,210 | 5,119 |
| Jacobs Entertainment, Inc. 6.75% 2/15/29 (c) | | 3,955 | 3,668 |
| Light & Wonder International, Inc. 7.5% 9/1/31 (c) | | 2,745 | 2,836 |
| McDonald's Corp. 4.25% 3/7/35 (Reg. S) | EUR | 7,433 | 8,216 |
| Merlin Entertainments PLC 5.75% 6/15/26 (c) | | 4,580 | 4,512 |
| MGM Resorts International 4.75% 10/15/28 | | 6,740 | 6,417 |
| NCL Corp. Ltd. 5.875% 2/15/27 (c) | | 5,580 | 5,507 |
| Ontario Gaming GTA LP / OTG Co. issuer, Inc. 8% 8/1/30 (c) | | 5,640 | 5,788 |
| Papa John's International, Inc. 3.875% 9/15/29 (c) | | 2,555 | 2,261 |
| Premier Entertainment Sub LLC: | | | |
| 5.625% 9/1/29(c) | | 5,095 | 3,664 |
| 5.875% 9/1/31(c) | | 1,015 | 690 |
| Royal Caribbean Cruises Ltd.: | | | |
| 5.375% 7/15/27(c) | | 4,165 | 4,101 |
| 6.25% 3/15/32(c) | | 5,295 | 5,339 |
| 7.25% 1/15/30(c) | | 2,810 | 2,910 |
| 8.25% 1/15/29(c) | | 12,500 | 13,198 |
| 9.25% 1/15/29(c) | | 16,510 | 17,625 |
| SeaWorld Parks & Entertainment, Inc. 5.25% 8/15/29 (c) | | 5,630 | 5,320 |
| Station Casinos LLC 4.625% 12/1/31 (c) | | 4,155 | 3,703 |
| Studio City Finance Ltd. 5% 1/15/29 (c) | | 3,255 | 2,865 |
| Voc Escrow Ltd. 5% 2/15/28 (c) | | 10,470 | 10,149 |
| Yum! Brands, Inc. 4.625% 1/31/32 | | 5,905 | 5,431 |
| | | | 266,043 |
| Household Durables - 0.3% | | | |
| Ashton Woods U.S.A. LLC/Ashton Woods Finance Co. 4.625% 4/1/30 (c) | | 4,105 | 3,669 |
| Brookfield Residential Properties, Inc./Brookfield Residential U.S. Corp. 4.875% 2/15/30 (c) | | 4,370 | 3,909 |
| Century Communities, Inc. 3.875% 8/15/29 (c) | | 4,225 | 3,767 |
| LGI Homes, Inc. 8.75% 12/15/28 (c) | | 2,680 | 2,791 |
| Tempur Sealy International, Inc.: | | | |
| 3.875% 10/15/31(c) | | 7,360 | 6,152 |
| 4% 4/15/29(c) | | 7,905 | 7,129 |
| TopBuild Corp. 3.625% 3/15/29 (c) | | 3,030 | 2,719 |
| TRI Pointe Homes, Inc. 5.7% 6/15/28 | | 8,715 | 8,547 |
| | | | 38,683 |
| Specialty Retail - 0.5% | | | |
| Arko Corp. 5.125% 11/15/29 (c) | | 4,190 | 3,648 |
| Asbury Automotive Group, Inc.: | | | |
| 4.5% 3/1/28 | | 1,987 | 1,883 |
| 4.625% 11/15/29(c) | | 4,555 | 4,210 |
| 4.75% 3/1/30 | | 1,980 | 1,835 |
| 5% 2/15/32(c) | | 4,915 | 4,453 |
| Bath & Body Works, Inc.: | | | |
| 6.625% 10/1/30(c) | | 6,650 | 6,671 |
| 6.75% 7/1/36 | | 8,920 | 8,881 |
| 7.5% 6/15/29 | | 5,030 | 5,181 |
| Carvana Co.: | | | |
| 12% 12/1/28 pay-in-kind(c)(e) | | 1,848 | 1,987 |
| 13% 6/1/30 pay-in-kind(c)(e) | | 2,785 | 3,048 |
| 14% 6/1/31 pay-in-kind(c)(e) | | 3,309 | 3,722 |
| LBM Acquisition LLC 6.25% 1/15/29 (c) | | 8,415 | 7,438 |
| LCM Investments Holdings 8.25% 8/1/31 (c) | | 3,345 | 3,490 |
| PetSmart, Inc. / PetSmart Finance Corp.: | | | |
| 4.75% 2/15/28(c) | | 5,700 | 5,295 |
| 7.75% 2/15/29(c) | | 4,135 | 4,027 |
| Wand NewCo 3, Inc. 7.625% 1/30/32 (c) | | 5,325 | 5,500 |
| | | | 71,269 |
| Textiles, Apparel & Luxury Goods - 0.1% | | | |
| Crocs, Inc.: | | | |
| 4.125% 8/15/31(c) | | 2,820 | 2,455 |
| 4.25% 3/15/29(c) | | 4,325 | 3,942 |
| Kontoor Brands, Inc. 4.125% 11/15/29 (c) | | 2,420 | 2,191 |
| | | | 8,588 |
TOTAL CONSUMER DISCRETIONARY | | | 464,112 |
| | | | |
| CONSUMER STAPLES - 1.1% | | | |
| Beverages - 0.1% | | | |
| Anheuser-Busch InBev SA NV 3.95% 3/22/44 (Reg. S) | EUR | 11,708 | 12,315 |
| Triton Water Holdings, Inc. 6.25% 4/1/29 (c) | | 3,135 | 3,024 |
| | | | 15,339 |
| Consumer Staples Distribution & Retail - 0.5% | | | |
| Albertsons Companies LLC/Safeway, Inc./New Albertson's, Inc./Albertson's LLC: | | | |
| 3.5% 3/15/29(c) | | 5,285 | 4,754 |
| 4.625% 1/15/27(c) | | 13,797 | 13,327 |
| 4.875% 2/15/30(c) | | 23,423 | 22,135 |
| C&S Group Enterprises LLC 5% 12/15/28 (c) | | 5,155 | 3,710 |
| KeHE Distributor / Nextwave 9% 2/15/29 (c) | | 9,625 | 9,865 |
| Performance Food Group, Inc.: | | | |
| 4.25% 8/1/29(c) | | 3,955 | 3,601 |
| 5.5% 10/15/27(c) | | 5,345 | 5,228 |
| U.S. Foods, Inc. 7.25% 1/15/32 (c) | | 2,735 | 2,838 |
| United Natural Foods, Inc. 6.75% 10/15/28 (c) | | 4,680 | 4,225 |
| | | | 69,683 |
| Food Products - 0.4% | | | |
| Chobani LLC/Finance Corp., Inc. 4.625% 11/15/28 (c) | | 3,790 | 3,579 |
| Darling Ingredients, Inc. 6% 6/15/30 (c) | | 6,615 | 6,504 |
| Fiesta Purchaser, Inc. 7.875% 3/1/31 (c) | | 5,015 | 5,182 |
| Lamb Weston Holdings, Inc.: | | | |
| 4.125% 1/31/30(c) | | 5,575 | 5,063 |
| 4.375% 1/31/32(c) | | 2,790 | 2,488 |
| Post Holdings, Inc.: | | | |
| 4.5% 9/15/31(c) | | 12,110 | 10,855 |
| 4.625% 4/15/30(c) | | 6,415 | 5,895 |
| 5.5% 12/15/29(c) | | 11,940 | 11,521 |
| Simmons Foods, Inc. 4.625% 3/1/29 (c) | | 4,295 | 3,777 |
| | | | 54,864 |
| Household Products - 0.0% | | | |
| Kronos Acquisition Holdings, Inc. 8.25% 6/30/31 (c)(f) | | 5,190 | 5,195 |
| Spectrum Brands Holdings, Inc. 3.875% 3/15/31 (c) | | 1,025 | 857 |
| | | | 6,052 |
| Personal Care Products - 0.1% | | | |
| BellRing Brands, Inc. 7% 3/15/30 (c) | | 6,925 | 7,097 |
| | | | |
TOTAL CONSUMER STAPLES | | | 153,035 |
| | | | |
| ENERGY - 4.0% | | | |
| Energy Equipment & Services - 0.6% | | | |
| Borr IHC Ltd. / Borr Finance Ltd.: | | | |
| 10% 11/15/28(c) | | 3,926 | 4,088 |
| 10.375% 11/15/30(c) | | 1,327 | 1,383 |
| Diamond Foreign Asset Co. / Diamond Finance, LLC 8.5% 10/1/30 (c) | | 2,735 | 2,871 |
| Jonah Energy Parent LLC 12% 11/5/25 (b)(g) | | 4,056 | 4,385 |
| Nabors Industries Ltd. 7.5% 1/15/28 (c) | | 5,660 | 5,401 |
| Nabors Industries, Inc. 9.125% 1/31/30 (c) | | 5,390 | 5,584 |
| Noble Finance II LLC 8% 4/15/30 (c) | | 2,805 | 2,919 |
| NuStar Logistics LP 6% 6/1/26 | | 7,285 | 7,274 |
| Seadrill Finance Ltd. 8.375% 8/1/30 (c) | | 5,560 | 5,811 |
| Transocean Titan Finance Ltd. 8.375% 2/1/28 (c) | | 5,815 | 6,002 |
| Transocean, Inc.: | | | |
| 8% 2/1/27(c) | | 3,591 | 3,579 |
| 8.25% 5/15/29(c) | | 1,955 | 1,963 |
| 8.5% 5/15/31(c) | | 1,955 | 1,956 |
| 8.75% 2/15/30(c) | | 10,062 | 10,564 |
| Valaris Ltd. 8.375% 4/30/30 (c) | | 2,745 | 2,842 |
| Vallourec SA 7.5% 4/15/32 (c) | | 5,325 | 5,511 |
| Viridien 8.75% 4/1/27 (c) | | 5,895 | 5,618 |
| | | | 77,751 |
| Oil, Gas & Consumable Fuels - 3.4% | | | |
| Antero Midstream Partners LP/Antero Midstream Finance Corp.: | | | |
| 5.375% 6/15/29(c) | | 4,305 | 4,173 |
| 5.75% 1/15/28(c) | | 10,640 | 10,460 |
| BP Capital Markets BV 4.323% 5/12/35 (Reg. S) | EUR | 21,714 | 24,042 |
| Chesapeake Energy Corp.: | | | |
| 5.875% 2/1/29(c) | | 3,115 | 3,084 |
| 6.75% 4/15/29(c) | | 4,415 | 4,423 |
| 7%(b)(d) | | 3,985 | 0 |
| 8%(b)(d) | | 1,240 | 0 |
| 8%(b)(d) | | 1,955 | 0 |
| Citgo Petroleum Corp.: | | | |
| 6.375% 6/15/26(c) | | 4,665 | 4,639 |
| 7% 6/15/25(c) | | 13,580 | 13,576 |
| 8.375% 1/15/29(c) | | 12,030 | 12,399 |
| Civitas Resources, Inc. 8.625% 11/1/30 (c) | | 5,415 | 5,806 |
| CNX Midstream Partners LP 4.75% 4/15/30 (c) | | 2,970 | 2,676 |
| CNX Resources Corp.: | | | |
| 6% 1/15/29(c) | | 3,200 | 3,131 |
| 7.375% 1/15/31(c) | | 2,885 | 2,950 |
| Comstock Resources, Inc.: | | | |
| 5.875% 1/15/30(c) | | 15,170 | 14,116 |
| 6.75% 3/1/29(c) | | 8,110 | 7,860 |
| CQP Holdco LP / BIP-V Chinook Holdco LLC: | | | |
| 5.5% 6/15/31(c) | | 12,715 | 12,053 |
| 7.5% 12/15/33(c) | | 7,110 | 7,375 |
| CrownRock LP/CrownRock Finance, Inc. 5% 5/1/29 (c) | | 2,450 | 2,430 |
| CVR Energy, Inc.: | | | |
| 5.75% 2/15/28(c) | | 24,505 | 22,723 |
| 8.5% 1/15/29(c) | | 18,735 | 18,812 |
| DT Midstream, Inc.: | | | |
| 4.125% 6/15/29(c) | | 4,285 | 3,959 |
| 4.375% 6/15/31(c) | | 4,285 | 3,903 |
| EG Global Finance PLC 12% 11/30/28 (c) | | 41,430 | 44,110 |
| Endeavor Energy Resources LP/EER Finance, Inc. 5.75% 1/30/28 (c) | | 10,149 | 10,244 |
| Energy Transfer LP 5.5% 6/1/27 | | 12,065 | 12,101 |
| EnLink Midstream LLC 6.5% 9/1/30 (c) | | 8,635 | 8,838 |
| Global Partners LP/GLP Finance Corp. 8.25% 1/15/32 (c) | | 3,315 | 3,407 |
| Gran Tierra Energy, Inc. 9.5% 10/15/29 (c) | | 3,310 | 3,159 |
| Hess Midstream Operations LP: | | | |
| 4.25% 2/15/30(c) | | 4,590 | 4,213 |
| 5.125% 6/15/28(c) | | 6,600 | 6,390 |
| 5.5% 10/15/30(c) | | 2,775 | 2,682 |
| 5.625% 2/15/26(c) | | 9,140 | 9,071 |
| HF Sinclair Corp.: | | | |
| 5% 2/1/28(c) | | 4,350 | 4,214 |
| 6.375% 4/15/27(c) | | 2,780 | 2,786 |
| Hilcorp Energy I LP/Hilcorp Finance Co. 6.25% 11/1/28 (c) | | 7,130 | 7,042 |
| Howard Midstream Energy Partners LLC 8.875% 7/15/28 (c) | | 6,965 | 7,370 |
| Kinetik Holdings LP 5.875% 6/15/30 (c) | | 4,180 | 4,119 |
| MEG Energy Corp. 7.125% 2/1/27 (c) | | 2,520 | 2,555 |
| Mesquite Energy, Inc. 7.25% (b)(c)(d) | | 12,834 | 0 |
| Murphy Oil U.S.A., Inc.: | | | |
| 4.75% 9/15/29 | | 4,155 | 3,936 |
| 5.625% 5/1/27 | | 3,665 | 3,623 |
| NGPL PipeCo LLC 4.875% 8/15/27 (c) | | 1,800 | 1,760 |
| Northern Oil & Gas, Inc.: | | | |
| 8.125% 3/1/28(c) | | 2,715 | 2,746 |
| 8.75% 6/15/31(c) | | 5,510 | 5,782 |
| Occidental Petroleum Corp. 7.2% 3/15/29 | | 2,440 | 2,589 |
| Parkland Corp.: | | | |
| 4.5% 10/1/29(c) | | 4,420 | 4,046 |
| 4.625% 5/1/30(c) | | 5,540 | 5,053 |
| PBF Holding Co. LLC/PBF Finance Corp.: | | | |
| 6% 2/15/28 | | 15,760 | 15,366 |
| 7.875% 9/15/30(c) | | 8,145 | 8,338 |
| Permian Resources Operating LLC 5.875% 7/1/29 (c) | | 4,055 | 3,999 |
| Sitio Royalties OP / Sitio Finance Corp. 7.875% 11/1/28 (c) | | 6,775 | 7,005 |
| SM Energy Co.: | | | |
| 5.625% 6/1/25 | | 4,400 | 4,381 |
| 6.625% 1/15/27 | | 12,830 | 12,779 |
| 6.75% 9/15/26 | | 3,175 | 3,176 |
| Southwestern Energy Co.: | | | |
| 5.375% 3/15/30 | | 5,630 | 5,439 |
| 5.7% 1/23/25(h) | | 149 | 149 |
| Sunoco LP/Sunoco Finance Corp.: | | | |
| 4.5% 5/15/29 | | 5,515 | 5,158 |
| 4.5% 4/30/30 | | 5,550 | 5,134 |
| 7% 9/15/28(c) | | 2,735 | 2,803 |
| Tallgrass Energy Partners LP / Tallgrass Energy Finance Corp.: | | | |
| 5.5% 1/15/28(c) | | 280 | 268 |
| 6% 3/1/27(c) | | 2,815 | 2,774 |
| 6% 9/1/31(c) | | 5,355 | 5,005 |
| Talos Production, Inc.: | | | |
| 9% 2/1/29(c) | | 2,345 | 2,461 |
| 9.375% 2/1/31(c) | | 2,660 | 2,808 |
| Targa Resources Partners LP/Targa Resources Partners Finance Corp. 4.875% 2/1/31 | | 6,345 | 6,055 |
| Teine Energy Ltd. 6.875% 4/15/29 (c) | | 4,420 | 4,325 |
| Unit Corp. 0% 12/1/29 (b) | | 1,660 | 0 |
| Venture Global Calcasieu Pass LLC: | | | |
| 3.875% 8/15/29(c) | | 3,525 | 3,210 |
| 4.125% 8/15/31(c) | | 3,525 | 3,163 |
| 6.25% 1/15/30(c) | | 11,160 | 11,326 |
| | | | 461,548 |
TOTAL ENERGY | | | 539,299 |
| | | | |
| FINANCIALS - 4.4% | | | |
| Banks - 0.8% | | | |
| AIB Group PLC 2.875% 5/30/31 (Reg. S) (e) | EUR | 5,810 | 6,032 |
| Banco Santander SA 5.75% 8/23/33 (Reg. S) (e) | EUR | 17,100 | 19,098 |
| Bank of Ireland Group PLC 6.75% 3/1/33 (Reg. S) (e) | EUR | 3,700 | 4,249 |
| Banque Federative du Credit Mutuel SA 3.75% 2/3/34 (Reg. S) | EUR | 3,400 | 3,620 |
| Barclays PLC: | | | |
| 4.506% 1/31/33 (Reg. S)(e) | EUR | 17,677 | 19,292 |
| 5.262% 1/29/34 (Reg. S)(e) | EUR | 10,548 | 12,067 |
| Commerzbank AG: | | | |
| 4.625% 1/17/31 (Reg. S)(e) | EUR | 5,600 | 6,113 |
| 6.5% 12/6/32 (Reg. S)(e) | EUR | 2,700 | 3,052 |
| 6.75% 10/5/33 (Reg. S)(e) | EUR | 5,400 | 6,221 |
| HSBC Holdings PLC Eur Swap Annual 5Y Index + 3.300% 6.364% 11/16/32 (Reg. S) (e)(i) | EUR | 10,572 | 12,004 |
| NatWest Group PLC 5.763% 2/28/34 (Reg. S) (e) | EUR | 17,280 | 19,345 |
| | | | 111,093 |
| Capital Markets - 0.8% | | | |
| AssuredPartners, Inc.: | | | |
| 5.625% 1/15/29(c) | | 4,720 | 4,415 |
| 7.5% 2/15/32(c) | | 2,650 | 2,660 |
| Broadstreet Partners, Inc. 5.875% 4/15/29 (c) | | 7,265 | 6,779 |
| Coinbase Global, Inc.: | | | |
| 3.375% 10/1/28(c) | | 13,780 | 11,814 |
| 3.625% 10/1/31(c) | | 8,370 | 6,711 |
| Deutsche Bank AG 4% 6/24/32 (Reg. S) (e) | EUR | 37,300 | 38,956 |
| Hightower Holding LLC 6.75% 4/15/29 (c) | | 2,870 | 2,685 |
| Jane Street Group LLC/JSG Finance, Inc. 4.5% 11/15/29 (c) | | 3,985 | 3,738 |
| MSCI, Inc. 4% 11/15/29 (c) | | 1,920 | 1,794 |
| UBS Group AG: | | | |
| 4.125% 6/9/33 (Reg. S)(e) | EUR | 7,926 | 8,563 |
| 4.75% 3/17/32 (Reg. S)(e) | EUR | 12,713 | 14,231 |
| | | | 102,346 |
| Consumer Finance - 0.9% | | | |
| Ally Financial, Inc.: | | | |
| 8% 11/1/31 | | 16,761 | 18,474 |
| 8% 11/1/31 | | 51,348 | 56,667 |
| OneMain Finance Corp.: | | | |
| 4% 9/15/30 | | 3,340 | 2,867 |
| 5.375% 11/15/29 | | 5,560 | 5,214 |
| 6.625% 1/15/28 | | 4,415 | 4,431 |
| 7.125% 3/15/26 | | 32,900 | 33,431 |
| 7.875% 3/15/30 | | 2,675 | 2,758 |
| | | | 123,842 |
| Financial Services - 0.5% | | | |
| Block, Inc. 3.5% 6/1/31 | | 5,745 | 4,956 |
| Compass Group Diversified Holdings LLC 5% 1/15/32 (c) | | 2,765 | 2,502 |
| CRH SMW Finance DAC 4.25% 7/11/35 (Reg. S) | EUR | 16,057 | 17,543 |
| Icahn Enterprises LP/Icahn Enterprises Finance Corp.: | | | |
| 4.375% 2/1/29 | | 6,375 | 5,451 |
| 5.25% 5/15/27 | | 18,665 | 17,522 |
| 6.25% 5/15/26 | | 9,630 | 9,554 |
| James Hardie International Finance Ltd. 5% 1/15/28 (c) | | 5,270 | 5,084 |
| MGIC Investment Corp. 5.25% 8/15/28 | | 4,725 | 4,600 |
| NCR Atleos Corp. 9.5% 4/1/29 (c) | | 4,090 | 4,420 |
| | | | 71,632 |
| Insurance - 1.4% | | | |
| Acrisure LLC / Acrisure Finance, Inc.: | | | |
| 6% 8/1/29(c) | | 4,230 | 3,903 |
| 7.5% 11/6/30(c) | | 2,605 | 2,607 |
| 8.25% 2/1/29(c) | | 12,510 | 12,571 |
| Alliant Holdings Intermediate LLC/Alliant Holdings Co.-Issuer: | | | |
| 4.25% 10/15/27(c) | | 6,740 | 6,311 |
| 5.875% 11/1/29(c) | | 4,180 | 3,911 |
| 6.75% 10/15/27(c) | | 19,655 | 19,387 |
| 6.75% 4/15/28(c) | | 16,406 | 16,432 |
| 7% 1/15/31(c) | | 4,590 | 4,637 |
| AmWINS Group, Inc. 4.875% 6/30/29 (c) | | 4,105 | 3,819 |
| ASR Nederland NV 7% 12/7/43 (Reg. S) (e) | EUR | 27,852 | 33,665 |
| GTCR AP Finance, Inc. 8% 5/15/27 (c) | | 2,715 | 2,721 |
| HUB International Ltd.: | | | |
| 5.625% 12/1/29(c) | | 16,470 | 15,576 |
| 7.25% 6/15/30(c) | | 17,925 | 18,375 |
| 7.375% 1/31/32(c) | | 6,655 | 6,749 |
| MAPFRE SA 2.875% 4/13/30 (Reg. S) | EUR | 12,900 | 12,809 |
| NN Group NV 6% 11/3/43 (Reg. S) (e) | EUR | 11,341 | 13,112 |
| Panther Escrow Issuer LLC 7.125% 6/1/31 (c) | | 9,115 | 9,219 |
| Sampo Oyj 2.5% 9/3/52 (Reg. S) (e) | EUR | 2,579 | 2,377 |
| USI, Inc. 7.5% 1/15/32 (c) | | 3,540 | 3,595 |
| | | | 191,776 |
TOTAL FINANCIALS | | | 600,689 |
| | | | |
| HEALTH CARE - 1.6% | | | |
| Biotechnology - 0.0% | | | |
| Grifols SA 4.75% 10/15/28 (c) | | 2,795 | 2,412 |
| | | | |
| Health Care Equipment & Supplies - 0.1% | | | |
| Avantor Funding, Inc. 3.875% 11/1/29 (c) | | 2,790 | 2,537 |
| Bausch + Lomb Corp. 8.375% 10/1/28 (c) | | 5,470 | 5,600 |
| Hologic, Inc. 4.625% 2/1/28 (c) | | 2,505 | 2,397 |
| | | | 10,534 |
| Health Care Providers & Services - 0.9% | | | |
| 180 Medical, Inc. 3.875% 10/15/29 (c) | | 2,995 | 2,711 |
| Cano Health, Inc. 6.25% 10/1/28 (c)(d) | | 1,865 | 2 |
| CHS/Community Health Systems, Inc.: | | | |
| 4.75% 2/15/31(c) | | 11,430 | 8,987 |
| 5.25% 5/15/30(c) | | 8,305 | 6,847 |
| 6% 1/15/29(c) | | 4,940 | 4,360 |
| 6.125% 4/1/30(c) | | 10,425 | 7,295 |
| 10.875% 1/15/32(c) | | 8,565 | 8,914 |
| DaVita, Inc.: | | | |
| 3.75% 2/15/31(c) | | 2,075 | 1,770 |
| 4.625% 6/1/30(c) | | 15,850 | 14,323 |
| HealthEquity, Inc. 4.5% 10/1/29 (c) | | 2,950 | 2,757 |
| ModivCare Escrow Issuer, Inc. 5% 10/1/29 (c) | | 3,250 | 2,290 |
| Molina Healthcare, Inc.: | | | |
| 3.875% 11/15/30(c) | | 6,345 | 5,641 |
| 3.875% 5/15/32(c) | | 5,560 | 4,818 |
| 4.375% 6/15/28(c) | | 4,690 | 4,414 |
| Tenet Healthcare Corp.: | | | |
| 5.125% 11/1/27 | | 10,955 | 10,721 |
| 6.125% 6/15/30 | | 13,945 | 13,847 |
| 6.25% 2/1/27 | | 20,050 | 20,037 |
| 6.75% 5/15/31 | | 2,715 | 2,756 |
| | | | 122,490 |
| Health Care Technology - 0.0% | | | |
| IQVIA, Inc. 5% 5/15/27 (c) | | 5,660 | 5,522 |
| | | | |
| Life Sciences Tools & Services - 0.1% | | | |
| Charles River Laboratories International, Inc.: | | | |
| 4% 3/15/31(c) | | 6,035 | 5,383 |
| 4.25% 5/1/28(c) | | 2,045 | 1,930 |
| | | | 7,313 |
| Pharmaceuticals - 0.5% | | | |
| Bausch Health Companies, Inc.: | | | |
| 4.875% 6/1/28(c) | | 7,635 | 5,714 |
| 5.75% 8/15/27(c) | | 8,145 | 6,465 |
| 6.125% 2/1/27(c) | | 14,026 | 11,677 |
| 11% 9/30/28(c) | | 2,275 | 2,025 |
| Bayer AG: | | | |
| 5.375% 3/25/82 (Reg. S)(e) | EUR | 3,300 | 3,362 |
| 6.625% 9/25/83 (Reg. S)(e) | EUR | 1,700 | 1,840 |
| 7% 9/25/83 (Reg. S)(e) | EUR | 10,100 | 11,157 |
| Organon & Co. / Organon Foreign Debt Co-Issuer BV: | | | |
| 4.125% 4/30/28(c) | | 10,200 | 9,473 |
| 5.125% 4/30/31(c) | | 8,890 | 7,985 |
| Teva Pharmaceutical Finance Netherlands III BV: | | | |
| 4.75% 5/9/27 | | 2,775 | 2,674 |
| 5.125% 5/9/29 | | 2,775 | 2,669 |
| 7.875% 9/15/29 | | 2,805 | 3,014 |
| | | | 68,055 |
TOTAL HEALTH CARE | | | 216,326 |
| | | | |
| INDUSTRIALS - 4.5% | | | |
| Aerospace & Defense - 1.2% | | | |
| Bombardier, Inc.: | | | |
| 6% 2/15/28(c) | | 2,815 | 2,783 |
| 7.125% 6/15/26(c) | | 1,458 | 1,479 |
| 7.25% 7/1/31(c) | | 2,610 | 2,680 |
| 7.875% 4/15/27(c) | | 6,429 | 6,445 |
| 8.75% 11/15/30(c) | | 4,055 | 4,383 |
| BWX Technologies, Inc. 4.125% 6/30/28 (c) | | 6,400 | 5,974 |
| Moog, Inc. 4.25% 12/15/27 (c) | | 2,025 | 1,917 |
| Rolls-Royce PLC 5.75% 10/15/27 (c) | | 6,560 | 6,590 |
| TransDigm, Inc.: | | | |
| 4.625% 1/15/29 | | 9,290 | 8,668 |
| 5.5% 11/15/27 | | 68,140 | 66,862 |
| 6.375% 3/1/29(c) | | 8,150 | 8,191 |
| 6.625% 3/1/32(c) | | 2,650 | 2,677 |
| 6.75% 8/15/28(c) | | 12,760 | 12,888 |
| 6.875% 12/15/30(c) | | 21,975 | 22,433 |
| 7.125% 12/1/31(c) | | 5,390 | 5,554 |
| Triumph Group, Inc. 9% 3/15/28 (c) | | 3,376 | 3,539 |
| VistaJet Malta Finance PLC / XO Management Holding, Inc. 9.5% 6/1/28 (c) | | 4,205 | 3,686 |
| | | | 166,749 |
| Air Freight & Logistics - 0.1% | | | |
| Rand Parent LLC 8.5% 2/15/30 (c) | | 6,985 | 7,072 |
| | | | |
| Building Products - 0.2% | | | |
| Advanced Drain Systems, Inc.: | | | |
| 5% 9/30/27(c) | | 1,400 | 1,369 |
| 6.375% 6/15/30(c) | | 2,780 | 2,790 |
| Carrier Global Corp. 4.5% 11/29/32 | EUR | 10,150 | 11,363 |
| MITER Brands Acquisition Holdco, Inc. / MIWD Borrower LLC 6.75% 4/1/32 (c) | | 3,920 | 3,948 |
| MIWD Holdco II LLC / MIWD Finance Corp. 5.5% 2/1/30 (c) | | 1,865 | 1,721 |
| Shea Homes Ltd. Partnership/Corp. 4.75% 4/1/29 | | 4,830 | 4,492 |
| | | | 25,683 |
| Commercial Services & Supplies - 1.1% | | | |
| Artera Services LLC 8.5% 2/15/31 (c) | | 11,060 | 11,386 |
| Atlas Luxco 4 SARL / Allied Universal Holdco LLC / Allied Universal Finance Corp.: | | | |
| 4.625% 6/1/28(c) | | 5,414 | 4,938 |
| 4.625% 6/1/28(c) | | 3,736 | 3,404 |
| Brand Industrial Services, Inc. 10.375% 8/1/30 (c) | | 20,835 | 22,516 |
| Clean Harbors, Inc. 6.375% 2/1/31 (c) | | 2,350 | 2,356 |
| CoreCivic, Inc. 8.25% 4/15/29 | | 14,760 | 15,257 |
| Covanta Holding Corp.: | | | |
| 4.875% 12/1/29(c) | | 9,642 | 8,801 |
| 5% 9/1/30 | | 8,005 | 7,235 |
| GFL Environmental, Inc.: | | | |
| 4% 8/1/28(c) | | 4,200 | 3,904 |
| 4.75% 6/15/29(c) | | 5,705 | 5,384 |
| 6.75% 1/15/31(c) | | 3,980 | 4,060 |
| Madison IAQ LLC: | | | |
| 4.125% 6/30/28(c) | | 5,345 | 4,985 |
| 5.875% 6/30/29(c) | | 4,265 | 3,968 |
| Neptune BidCo U.S., Inc. 9.29% 4/15/29 (c) | | 22,560 | 21,658 |
| OpenLane, Inc. 5.125% 6/1/25 (c) | | 6,210 | 6,119 |
| The Brink's Co. 4.625% 10/15/27 (c) | | 7,200 | 6,896 |
| The GEO Group, Inc.: | | | |
| 8.625% 4/15/29(c) | | 9,115 | 9,336 |
| 10.25% 4/15/31(c) | | 6,505 | 6,806 |
| Williams Scotsman, Inc. 7.375% 10/1/31 (c) | | 2,735 | 2,815 |
| | | | 151,824 |
| Construction & Engineering - 0.4% | | | |
| AECOM 5.125% 3/15/27 | | 7,490 | 7,360 |
| Arcosa, Inc. 4.375% 4/15/29 (c) | | 4,130 | 3,835 |
| Bouygues SA 5.375% 6/30/42 (Reg. S) | EUR | 18,400 | 22,207 |
| Pike Corp.: | | | |
| 5.5% 9/1/28(c) | | 18,325 | 17,583 |
| 8.625% 1/31/31(c) | | 6,710 | 7,108 |
| | | | 58,093 |
| Electrical Equipment - 0.1% | | | |
| Sensata Technologies BV 4% 4/15/29 (c) | | 5,910 | 5,426 |
| | | | |
| Ground Transportation - 0.7% | | | |
| Uber Technologies, Inc.: | | | |
| 4.5% 8/15/29(c) | | 12,675 | 12,077 |
| 6.25% 1/15/28(c) | | 5,520 | 5,526 |
| 7.5% 9/15/27(c) | | 31,625 | 32,245 |
| 8% 11/1/26(c) | | 29,170 | 29,423 |
| XPO, Inc.: | | | |
| 6.25% 6/1/28(c) | | 2,790 | 2,798 |
| 7.125% 2/1/32(c) | | 4,015 | 4,115 |
| | | | 86,184 |
| Machinery - 0.1% | | | |
| Allison Transmission, Inc. 5.875% 6/1/29 (c) | | 4,830 | 4,764 |
| ATS Corp. 4.125% 12/15/28 (c) | | 4,630 | 4,219 |
| Chart Industries, Inc. 7.5% 1/1/30 (c) | | 7,420 | 7,668 |
| | | | 16,651 |
| Marine Transportation - 0.0% | | | |
| Seaspan Corp. 5.5% 8/1/29 (c) | | 4,240 | 3,784 |
| | | | |
| Passenger Airlines - 0.5% | | | |
| Air Canada 3.875% 8/15/26 (c) | | 4,230 | 4,024 |
| Allegiant Travel Co. 7.25% 8/15/27 (c) | | 4,365 | 4,154 |
| American Airlines, Inc.: | | | |
| 7.25% 2/15/28(c) | | 9,260 | 9,266 |
| 8.5% 5/15/29(c) | | 8,875 | 9,221 |
| American Airlines, Inc. / AAdvantage Loyalty IP Ltd. 5.75% 4/20/29 (c) | | 13,870 | 13,494 |
| Spirit Loyalty Cayman Ltd. / Spirit IP Cayman Ltd.: | | | |
| 8% 9/20/25(c) | | 4,670 | 3,409 |
| 8% 9/20/25(c) | | 1,420 | 1,037 |
| United Airlines, Inc.: | | | |
| 4.375% 4/15/26(c) | | 14,560 | 14,065 |
| 4.625% 4/15/29(c) | | 8,725 | 8,126 |
| | | | 66,796 |
| Professional Services - 0.0% | | | |
| TriNet Group, Inc. 3.5% 3/1/29 (c) | | 4,545 | 4,045 |
| | | | |
| Trading Companies & Distributors - 0.1% | | | |
| Fortress Transportation & Infrastructure Investors LLC 7.875% 12/1/30 (c) | | 4,040 | 4,226 |
| Foundation Building Materials, Inc. 6% 3/1/29 (c) | | 3,110 | 2,760 |
| H&E Equipment Services, Inc. 3.875% 12/15/28 (c) | | 10,040 | 9,059 |
| | | | 16,045 |
TOTAL INDUSTRIALS | | | 608,352 |
| | | | |
| INFORMATION TECHNOLOGY - 1.5% | | | |
| Electronic Equipment, Instruments & Components - 0.1% | | | |
| Coherent Corp. 5% 12/15/29 (c) | | 4,370 | 4,136 |
| CPI CG, Inc. 10% 7/15/29 (c)(f) | | 2,595 | 2,692 |
| TTM Technologies, Inc. 4% 3/1/29 (c) | | 4,540 | 4,166 |
| | | | 10,994 |
| IT Services - 0.2% | | | |
| Acuris Finance U.S. 5% 5/1/28 (c) | | 4,315 | 3,832 |
| ASGN, Inc. 4.625% 5/15/28 (c) | | 5,670 | 5,347 |
| CA Magnum Holdings 5.375% 10/31/26 (c) | | 2,230 | 2,133 |
| Camelot Finance SA 4.5% 11/1/26 (c) | | 6,365 | 6,153 |
| Go Daddy Operating Co. LLC / GD Finance Co., Inc.: | | | |
| 3.5% 3/1/29(c) | | 6,060 | 5,473 |
| 5.25% 12/1/27(c) | | 5,665 | 5,547 |
| Unisys Corp. 6.875% 11/1/27 (c) | | 3,685 | 3,234 |
| | | | 31,719 |
| Semiconductors & Semiconductor Equipment - 0.1% | | | |
| ON Semiconductor Corp. 3.875% 9/1/28 (c) | | 6,765 | 6,243 |
| Synaptics, Inc. 4% 6/15/29 (c) | | 3,500 | 3,171 |
| | | | 9,414 |
| Software - 1.0% | | | |
| Clarivate Science Holdings Corp.: | | | |
| 3.875% 7/1/28(c) | | 5,025 | 4,667 |
| 4.875% 7/1/29(c) | | 4,755 | 4,413 |
| Cloud Software Group, Inc. 6.5% 3/31/29 (c) | | 46,745 | 44,890 |
| Elastic NV 4.125% 7/15/29 (c) | | 11,340 | 10,354 |
| Fair Isaac Corp. 4% 6/15/28 (c) | | 6,420 | 6,005 |
| Gen Digital, Inc. 5% 4/15/25 (c) | | 6,360 | 6,316 |
| ION Trading Technologies Ltd.: | | | |
| 5.75% 5/15/28(c) | | 5,780 | 5,282 |
| 9.5% 5/30/29(c) | | 3,900 | 3,976 |
| MicroStrategy, Inc. 6.125% 6/15/28 (c) | | 9,960 | 9,654 |
| NCR Voyix Corp.: | | | |
| 5% 10/1/28(c) | | 3,385 | 3,196 |
| 5.25% 10/1/30(c) | | 13,370 | 12,220 |
| Open Text Corp. 6.9% 12/1/27 (c) | | 5,000 | 5,189 |
| Open Text Holdings, Inc.: | | | |
| 4.125% 2/15/30(c) | | 3,220 | 2,904 |
| 4.125% 12/1/31(c) | | 2,490 | 2,189 |
| PTC, Inc.: | | | |
| 3.625% 2/15/25(c) | | 3,755 | 3,709 |
| 4% 2/15/28(c) | | 3,715 | 3,497 |
| UKG, Inc. 6.875% 2/1/31 (c) | | 3,980 | 4,030 |
| Veritas U.S., Inc./Veritas Bermuda Ltd. 7.5% 9/1/25 (c) | | 8,925 | 7,718 |
| | | | 140,209 |
| Technology Hardware, Storage & Peripherals - 0.1% | | | |
| Seagate HDD Cayman: | | | |
| 8.25% 12/15/29 | | 9,200 | 9,867 |
| 8.5% 7/15/31 | | 5,975 | 6,435 |
| | | | 16,302 |
TOTAL INFORMATION TECHNOLOGY | | | 208,638 |
| | | | |
| MATERIALS - 2.3% | | | |
| Chemicals - 0.7% | | | |
| Air Products & Chemicals, Inc. 4% 3/3/35 | EUR | 8,899 | 9,674 |
| BASF AG 4.25% 3/8/32 (Reg. S) | EUR | 13,500 | 15,013 |
| Consolidated Energy Finance SA 12% 2/15/31 (c) | | 4,240 | 4,373 |
| Ingevity Corp. 3.875% 11/1/28 (c) | | 6,715 | 6,093 |
| LSB Industries, Inc. 6.25% 10/15/28 (c) | | 9,723 | 9,377 |
| NOVA Chemicals Corp. 8.5% 11/15/28 (c) | | 3,635 | 3,857 |
| Olympus Water U.S. Holding Corp.: | | | |
| 4.25% 10/1/28(c) | | 7,070 | 6,431 |
| 7.125% 10/1/27(c) | | 3,445 | 3,458 |
| 9.75% 11/15/28(c) | | 13,941 | 14,749 |
| SCIH Salt Holdings, Inc. 4.875% 5/1/28 (c) | | 3,770 | 3,503 |
| SCIL IV LLC / SCIL U.S.A. Holdings LLC 5.375% 11/1/26 (c) | | 6,435 | 6,222 |
| The Scotts Miracle-Gro Co. 4% 4/1/31 | | 5,930 | 5,116 |
| W.R. Grace Holding LLC: | | | |
| 5.625% 8/15/29(c) | | 7,105 | 6,549 |
| 7.375% 3/1/31(c) | | 2,810 | 2,848 |
| | | | 97,263 |
| Construction Materials - 0.2% | | | |
| Smyrna Ready Mix Concrete LLC 8.875% 11/15/31 (c) | | 10,810 | 11,469 |
| Summit Materials LLC/Summit Materials Finance Corp.: | | | |
| 5.25% 1/15/29(c) | | 6,525 | 6,285 |
| 7.25% 1/15/31(c) | | 4,060 | 4,197 |
| | | | 21,951 |
| Containers & Packaging - 0.6% | | | |
| Ardagh Metal Packaging Finance U.S.A. LLC/Ardagh Metal Packaging Finance PLC: | | | |
| 3.25% 9/1/28(c) | | 3,025 | 2,658 |
| 4% 9/1/29(c) | | 6,050 | 5,120 |
| 6% 6/15/27(c) | | 2,785 | 2,737 |
| Cascades, Inc.: | | | |
| 5.125% 1/15/26(c) | | 3,310 | 3,259 |
| 5.375% 1/15/28(c) | | 3,310 | 3,186 |
| Clydesdale Acquisition Holdings, Inc. 8.75% 4/15/30 (c) | | 21,190 | 20,738 |
| Crown Cork & Seal, Inc.: | | | |
| 7.375% 12/15/26 | | 16,535 | 17,084 |
| 7.5% 12/15/96 | | 7,695 | 8,176 |
| Graham Packaging Co., Inc. 7.125% 8/15/28 (c) | | 3,720 | 3,514 |
| Graphic Packaging International, Inc. 3.75% 2/1/30 (c) | | 3,585 | 3,200 |
| Intelligent Packaging Ltd. Finco, Inc. 6% 9/15/28 (c) | | 2,570 | 2,485 |
| Mauser Packaging Solutions Holding Co. 7.875% 4/15/27 (c) | | 5,635 | 5,748 |
| Sealed Air Corp./Sealed Air Corp. U.S. 6.125% 2/1/28 (c) | | 2,815 | 2,808 |
| Trident TPI Holdings, Inc. 12.75% 12/31/28 (c) | | 2,765 | 3,020 |
| | | | 83,733 |
| Metals & Mining - 0.8% | | | |
| Alcoa Nederland Holding BV: | | | |
| 4.125% 3/31/29(c) | | 7,735 | 7,174 |
| 6.125% 5/15/28(c) | | 2,110 | 2,101 |
| 7.125% 3/15/31(c) | | 2,135 | 2,194 |
| Algoma Steel SCA 0% 12/31/24 (b) | | 1,518 | 0 |
| Arsenal AIC Parent LLC 8% 10/1/30 (c) | | 3,285 | 3,447 |
| ATI, Inc.: | | | |
| 4.875% 10/1/29 | | 2,795 | 2,613 |
| 5.125% 10/1/31 | | 2,480 | 2,292 |
| 7.25% 8/15/30 | | 2,745 | 2,834 |
| Cleveland-Cliffs, Inc.: | | | |
| 4.625% 3/1/29(c) | | 4,615 | 4,367 |
| 4.875% 3/1/31(c) | | 4,615 | 4,069 |
| 6.75% 4/15/30(c) | | 9,035 | 8,939 |
| Compass Minerals International, Inc. 6.75% 12/1/27 (c) | | 9,315 | 8,902 |
| Eldorado Gold Corp. 6.25% 9/1/29 (c) | | 4,225 | 4,032 |
| ERO Copper Corp. 6.5% 2/15/30 (c) | | 4,180 | 4,033 |
| First Quantum Minerals Ltd.: | | | |
| 8.625% 6/1/31(c) | | 7,775 | 7,728 |
| 9.375% 3/1/29(c) | | 6,235 | 6,515 |
| FMG Resources August 2006 Pty Ltd.: | | | |
| 4.375% 4/1/31(c) | | 4,420 | 3,950 |
| 4.5% 9/15/27(c) | | 5,450 | 5,208 |
| HudBay Minerals, Inc. 4.5% 4/1/26 (c) | | 3,600 | 3,522 |
| Kaiser Aluminum Corp. 4.625% 3/1/28 (c) | | 6,615 | 6,189 |
| Mineral Resources Ltd.: | | | |
| 8% 11/1/27(c) | | 2,785 | 2,849 |
| 8.125% 5/1/27(c) | | 11,025 | 11,111 |
| 8.5% 5/1/30(c) | | 2,065 | 2,138 |
| 9.25% 10/1/28(c) | | 4,830 | 5,069 |
| Murray Energy Corp.: | | | |
| 11.25%(b)(c)(d) | | 5,925 | 0 |
| 12% pay-in-kind(b)(c)(d)(e) | | 6,364 | 0 |
| Roller Bearing Co. of America, Inc. 4.375% 10/15/29 (c) | | 2,015 | 1,854 |
| | | | 113,130 |
TOTAL MATERIALS | | | 316,077 |
| | | | |
| REAL ESTATE - 1.3% | | | |
| Equity Real Estate Investment Trusts (REITs) - 1.1% | | | |
| Iron Mountain Information Management Services, Inc. 5% 7/15/32 (c) | | 4,190 | 3,827 |
| Iron Mountain, Inc.: | | | |
| 4.875% 9/15/29(c) | | 14,590 | 13,749 |
| 5% 7/15/28(c) | | 6,370 | 6,102 |
| 5.25% 7/15/30(c) | | 5,915 | 5,622 |
| 5.625% 7/15/32(c) | | 5,915 | 5,617 |
| MPT Operating Partnership LP/MPT Finance Corp.: | | | |
| 3.5% 3/15/31 | | 6,700 | 4,366 |
| 4.625% 8/1/29 | | 10,950 | 7,948 |
| 5% 10/15/27 | | 21,010 | 17,352 |
| Prologis International Funding II SA: | | | |
| 3.125% 6/1/31 (Reg. S) | EUR | 22,000 | 22,250 |
| 4.625% 2/21/35 (Reg. S) | EUR | 8,863 | 9,763 |
| SBA Communications Corp. 3.875% 2/15/27 | | 9,720 | 9,263 |
| Uniti Group LP/Uniti Fiber Holdings, Inc./CSL Capital LLC 6% 1/15/30 (c) | | 3,390 | 2,050 |
| Uniti Group LP/Uniti Group Finance, Inc./CSL Capital LLC: | | | |
| 4.75% 4/15/28(c) | | 9,350 | 7,645 |
| 6.5% 2/15/29(c) | | 5,660 | 3,609 |
| 10.5% 2/15/28(c) | | 1,075 | 1,053 |
| VICI Properties LP / VICI Note Co.: | | | |
| 3.875% 2/15/29(c) | | 6,695 | 6,188 |
| 4.25% 12/1/26(c) | | 12,650 | 12,200 |
| 4.625% 12/1/29(c) | | 7,220 | 6,833 |
| | | | 145,437 |
| Real Estate Management & Development - 0.2% | | | |
| Greystar Real Estate Partners 7.75% 9/1/30 (c) | | 2,435 | 2,564 |
| SELP Finance SARL: | | | |
| 0.875% 5/27/29 (Reg. S) | EUR | 5,520 | 5,078 |
| 3.75% 8/10/27 (Reg. S) | EUR | 10,184 | 10,854 |
| Taylor Morrison Communities, Inc./Monarch Communities, Inc.: | | | |
| 5.125% 8/1/30(c) | | 6,480 | 6,205 |
| 5.875% 6/15/27(c) | | 5,610 | 5,585 |
| Weekley Homes LLC/Weekley Finance Corp. 4.875% 9/15/28 (c) | | 3,045 | 2,820 |
| | | | 33,106 |
TOTAL REAL ESTATE | | | 178,543 |
| | | | |
| UTILITIES - 2.1% | | | |
| Electric Utilities - 1.3% | | | |
| Clearway Energy Operating LLC: | | | |
| 3.75% 1/15/32(c) | | 2,795 | 2,376 |
| 4.75% 3/15/28(c) | | 4,055 | 3,875 |
| Electricite de France SA: | | | |
| 4.625% 1/25/43 (Reg. S) | EUR | 13,200 | 13,986 |
| 4.75% 6/17/44 (Reg. S) | EUR | 9,900 | 10,605 |
| EnBW International Finance BV 4.3% 5/23/34 (Reg. S) | EUR | 16,104 | 17,822 |
| Energias de Portugal SA: | | | |
| 1.875% 3/14/82 (Reg. S)(e) | EUR | 5,600 | 5,203 |
| 5.943% 4/23/83 (Reg. S)(e) | EUR | 900 | 1,004 |
| NextEra Energy Partners LP 7.25% 1/15/29 (c) | | 2,675 | 2,743 |
| NRG Energy, Inc.: | | | |
| 3.375% 2/15/29(c) | | 3,080 | 2,740 |
| 3.625% 2/15/31(c) | | 6,110 | 5,240 |
| 3.875% 2/15/32(c) | | 582 | 500 |
| 5.75% 1/15/28 | | 19,350 | 19,199 |
| ORSTED A/S 5.25% 12/8/22 (Reg. S) (e) | EUR | 5,900 | 6,405 |
| Pacific Gas & Electric Co.: | | | |
| 3.95% 12/1/47 | | 2,711 | 1,941 |
| 4% 12/1/46 | | 8,299 | 5,961 |
| 4.3% 3/15/45 | | 3,690 | 2,836 |
| PG&E Corp.: | | | |
| 5% 7/1/28 | | 13,615 | 13,100 |
| 5.25% 7/1/30 | | 5,150 | 4,918 |
| Vistra Operations Co. LLC: | | | |
| 4.375% 5/1/29(c) | | 11,110 | 10,345 |
| 5% 7/31/27(c) | | 13,800 | 13,349 |
| 5.5% 9/1/26(c) | | 9,975 | 9,837 |
| 5.625% 2/15/27(c) | | 17,455 | 17,162 |
| 7.75% 10/15/31(c) | | 5,470 | 5,696 |
| | | | 176,843 |
| Gas Utilities - 0.3% | | | |
| Southern Natural Gas Co. LLC: | | | |
| 7.35% 2/15/31 | | 14,890 | 15,868 |
| 8% 3/1/32 | | 9,400 | 10,674 |
| Suburban Propane Partners LP/Suburban Energy Finance Corp. 5% 6/1/31 (c) | | 5,750 | 5,178 |
| | | | 31,720 |
| Independent Power and Renewable Electricity Producers - 0.2% | | | |
| Atlantica Sustainable Infrastructure PLC 4.125% 6/15/28 (c) | | 3,735 | 3,655 |
| RWE AG 4.125% 2/13/35 (Reg. S) | EUR | 9,787 | 10,644 |
| Sunnova Energy Corp.: | | | |
| 5.875% 9/1/26(c) | | 1,350 | 1,050 |
| 11.75% 10/1/28(c) | | 8,050 | 5,756 |
| | | | 21,105 |
| Multi-Utilities - 0.2% | | | |
| E.ON SE 4.125% 3/25/44 (Reg. S) | EUR | 7,017 | 7,425 |
| Engie SA 4.25% 3/6/44 (Reg. S) | EUR | 9,500 | 9,875 |
| National Grid PLC 4.275% 1/16/35 (Reg. S) | EUR | 13,049 | 14,171 |
| | | | 31,471 |
| Water Utilities - 0.1% | | | |
| Suez SACA 2.375% 5/24/30 (Reg. S) | EUR | 16,800 | 16,568 |
| | | | |
TOTAL UTILITIES | | | 277,707 |
| | | | |
| TOTAL NONCONVERTIBLE BONDS | | | 3,809,932 |
| TOTAL CORPORATE BONDS (Cost $3,969,633) | | | 3,875,476 |
| | | | |
| U.S. Government and Government Agency Obligations - 22.7% |
| | | Principal Amount (a) (000s) | Value ($) (000s) |
| U.S. Government Agency Obligations - 0.0% | | | |
| Tennessee Valley Authority: | | | |
| 5.25% 9/15/39 | | 2,106 | 2,183 |
| 5.375% 4/1/56 | | 3,503 | 3,668 |
TOTAL U.S. GOVERNMENT AGENCY OBLIGATIONS | | | 5,851 |
| U.S. Treasury Obligations - 22.6% | | | |
| U.S. Treasury Bills, yield at date of purchase 5.32% to 5.33% 7/25/24 to 8/1/24 (j) | | 11,430 | 11,381 |
| U.S. Treasury Bonds: | | | |
| 2% 8/15/51 | | 136,164 | 81,794 |
| 2.25% 2/15/52 | | 115,400 | 73,513 |
| 2.5% 2/15/45 | | 216,056 | 154,117 |
| 3% 5/15/45 | | 20,100 | 15,623 |
| 3% 2/15/49 | | 128,820 | 97,576 |
| 3.625% 2/15/53 | | 105,566 | 89,805 |
| 3.625% 5/15/53 | | 11,450 | 9,744 |
| 4.125% 8/15/53 | | 56,659 | 52,761 |
| 4.25% 2/15/54 | | 54,910 | 52,285 |
| 4.375% 8/15/43 | | 56,431 | 54,469 |
| 4.75% 2/15/37 | | 74,200 | 77,011 |
| 5.25% 2/15/29 | | 5,406 | 5,618 |
| U.S. Treasury Notes: | | | |
| 0.375% 12/31/25 | | 158,357 | 148,095 |
| 0.375% 1/31/26 | | 13,900 | 12,955 |
| 0.625% 7/31/26 | | 24,000 | 22,078 |
| 0.75% 3/31/26 | | 46,052 | 42,947 |
| 0.75% 8/31/26 | | 139,549 | 128,341 |
| 1% 7/31/28 | | 49,141 | 42,924 |
| 1.125% 10/31/26 | | 17,300 | 15,965 |
| 1.125% 8/31/28 | | 339,517 | 297,457 |
| 1.25% 12/31/26 | | 33,922 | 31,271 |
| 1.25% 9/30/28 | | 38,280 | 33,639 |
| 1.375% 10/31/28 | | 8,911 | 7,858 |
| 1.5% 1/31/27 | | 40,989 | 37,934 |
| 1.5% 11/30/28 | | 6,930 | 6,133 |
| 1.625% 9/30/26 | | 3,093 | 2,895 |
| 1.75% 1/31/29 | | 41,434 | 36,944 |
| 1.875% 2/28/27 | | 242,560 | 226,282 |
| 2.125% 5/15/25 | | 12,033 | 11,721 |
| 2.375% 3/31/29 | | 7,500 | 6,861 |
| 2.5% 2/28/26 | | 38,997 | 37,544 |
| 2.5% 3/31/27 | | 7,200 | 6,825 |
| 2.625% 5/31/27 | | 90 | 85 |
| 2.625% 7/31/29 | | 23,875 | 22,000 |
| 2.75% 7/31/27 | | 5,670 | 5,384 |
| 2.75% 5/31/29 | | 18,541 | 17,224 |
| 2.75% 8/15/32 | | 83,642 | 74,432 |
| 2.875% 5/15/32 | | 30,472 | 27,455 |
| 3.125% 11/15/28 | | 28,930 | 27,471 |
| 3.125% 8/31/29 | | 3,948 | 3,723 |
| 3.375% 5/15/33 | | 7,260 | 6,728 |
| 3.5% 1/31/28 | | 20,540 | 19,893 |
| 3.5% 2/15/33 | | 49,310 | 46,217 |
| 3.625% 5/15/26 | | 35,540 | 34,810 |
| 3.625% 3/31/28 | | 34,500 | 33,530 |
| 3.625% 3/31/30 | | 21,930 | 21,114 |
| 3.75% 5/31/30 | | 12,660 | 12,260 |
| 3.875% 11/30/27 | | 14,110 | 13,842 |
| 3.875% 12/31/27 | | 51,100 | 50,122 |
| 3.875% 8/15/33 | | 16,114 | 15,502 |
| 4% 1/15/27 | | 61,280 | 60,390 |
| 4% 10/31/29 | | 19,300 | 18,974 |
| 4% 7/31/30 | | 23,420 | 22,974 |
| 4% 1/31/31 | | 6,420 | 6,291 |
| 4.125% 2/15/27 | | 129,860 | 128,369 |
| 4.125% 10/31/27 | | 8,800 | 8,701 |
| 4.125% 7/31/28 | | 15,000 | 14,841 |
| 4.125% 8/31/30 | | 31,870 | 31,464 |
| 4.125% 3/31/31 | | 27,900 | 27,533 |
| 4.125% 11/15/32 | | 27,677 | 27,211 |
| 4.25% 12/31/25 | | 52,462 | 51,954 |
| 4.25% 3/15/27 | | 89,660 | 88,942 |
| 4.25% 2/28/31 | | 35,790 | 35,579 |
| 4.375% 11/30/28 | | 32,510 | 32,505 |
| 4.375% 11/30/30 | | 24,163 | 24,183 |
| 4.5% 3/31/26 | | 33,798 | 33,621 |
| 4.625% 3/15/26 | | 10,990 | 10,952 |
| 4.625% 11/15/26 | | 32,750 | 32,735 |
| 4.625% 9/30/28 | | 21,630 | 21,813 |
| 4.875% 10/31/30 | | 25,780 | 26,508 |
TOTAL U.S. TREASURY OBLIGATIONS | | | 3,069,698 |
| Other Government Related - 0.1% | | | |
| Private Export Funding Corp. Secured 1.75% 11/15/24 | | 11,520 | 11,353 |
| TOTAL U.S. GOVERNMENT AND GOVERNMENT AGENCY OBLIGATIONS (Cost $3,418,373) | | | 3,086,902 |
| | | | |
| U.S. Government Agency - Mortgage Securities - 3.5% |
| | | Principal Amount (a) (000s) | Value ($) (000s) |
| Fannie Mae - 0.9% | | | |
| 1.5% 11/1/40 to 11/1/41 | | 37,125 | 30,146 |
| 2% 2/1/28 to 12/1/41 (k) | | 40,889 | 34,458 |
| 2.5% 1/1/30 to 5/1/42 | | 18,579 | 16,612 |
| 3% 11/1/34 to 2/1/52 | | 15,658 | 14,199 |
| 3.5% 9/1/33 to 3/1/52 | | 3,212 | 3,026 |
| 5% 5/1/52 to 12/1/52 (l) | | 14,690 | 14,370 |
| 6% 6/1/53 to 3/1/54 | | 8,997 | 9,114 |
| 6.5% 3/1/54 | | 698 | 711 |
TOTAL FANNIE MAE | | | 122,636 |
| Freddie Mac - 1.0% | | | |
| 1.5% 12/1/40 to 4/1/41 | | 10,285 | 8,363 |
| 2% 6/1/35 to 7/1/41 | | 27,694 | 23,816 |
| 2.5% 1/1/30 to 2/1/42 (k)(m) | | 58,216 | 51,203 |
| 3% 9/1/34 | | 3,064 | 2,867 |
| 3.5% 5/1/51 to 3/1/52 (j)(l) | | 26,388 | 23,543 |
| 5% 5/1/52 to 12/1/52 (j)(l) | | 11,741 | 11,478 |
| 5.5% 9/1/52 | | 6,273 | 6,237 |
| 6% 9/1/53 to 11/1/53 | | 529 | 533 |
| 6.5% 10/1/53 | | 7,288 | 7,517 |
TOTAL FREDDIE MAC | | | 135,557 |
| Ginnie Mae - 0.5% | | | |
| Ginnie Mae: | | | |
| 2% 8/1/54 (f) | | 2,050 | 1,661 |
| 2% 8/1/54 (f) | | 12,450 | 10,090 |
| 2% 10/20/50 to 2/20/51 | | 8,862 | 7,181 |
| 2% 7/1/54 (f) | | 12,650 | 10,243 |
| 2% 7/1/54 (f) | | 15,700 | 12,713 |
| 2% 7/1/54 (f) | | 5,025 | 4,069 |
| 2% 7/1/54 (f) | | 1,550 | 1,255 |
| 2% 7/1/54 (f) | | 8,275 | 6,701 |
| 2.5% 8/20/51 to 12/20/51 | | 12,267 | 10,171 |
TOTAL GINNIE MAE | | | 64,084 |
| Uniform Mortgage Backed Securities - 1.1% | | | |
| 2% 7/1/54 (f) | | 14,800 | 11,575 |
| 2% 7/1/54 (f) | | 14,800 | 11,575 |
| 2.5% 7/1/54 (f) | | 30,700 | 25,073 |
| 2.5% 7/1/54 (f) | | 30,675 | 25,053 |
| 5% 7/1/54 (f) | | 24,400 | 23,581 |
| 5.5% 7/1/54 (f) | | 55,000 | 54,246 |
| 6% 7/1/54 (f) | | 200 | 201 |
| 6% 7/1/54 (f) | | 50 | 50 |
| 6% 7/1/54 (f) | | 75 | 75 |
TOTAL UNIFORM MORTGAGE BACKED SECURITIES | | | 151,429 |
| TOTAL U.S. GOVERNMENT AGENCY - MORTGAGE SECURITIES (Cost $488,061) | | | 473,706 |
| | | | |
| Collateralized Mortgage Obligations - 1.3% |
| | | Principal Amount (a) (000s) | Value ($) (000s) |
| U.S. Government Agency - 1.3% | | | |
| Fannie Mae: | | | |
| planned amortization class: | | | |
Series 2021-65 Class MA, 2% 8/25/51 | | 7,289 | 6,222 |
Series 2022-2 Class TH, 2.5% 2/25/52 | | 1,164 | 1,034 |
| sequential payer: | | | |
Series 2020-101 Class BA, 1.5% 9/25/45 | | 3,090 | 2,620 |
Series 2020-49 Class JA, 2% 8/25/44 | | 1,092 | 985 |
Series 2020-51 Class BA, 2% 6/25/46 | | 4,407 | 3,756 |
Series 2020-67 Class KZ, 3.25% 9/25/40 | | 1,890 | 1,708 |
Series 2020-75 Class HA, 1.5% 12/25/44 | | 11,954 | 10,322 |
Series 2021-68 Class A, 2% 7/25/49 | | 2,299 | 1,787 |
Series 2021-85 Class L, 2.5% 8/25/48 | | 1,254 | 1,079 |
Series 2021-96 Class HA, 2.5% 2/25/50 | | 2,014 | 1,731 |
Series 2022-1 Class KA, 3% 5/25/48 | | 2,000 | 1,786 |
Series 2022-13 Class MA, 3% 5/25/44 | | 8,409 | 7,792 |
Series 2022-3: | | | |
Class G, 2% 11/25/47 | | 8,434 | 7,237 |
Class N, 2% 10/25/47 | | 16,135 | 13,843 |
Series 2022-4 Class B, 2.5% 5/25/49 | | 1,470 | 1,267 |
Series 2022-49 Class TE, 4.5% 12/25/48 | | 14,995 | 14,402 |
Series 2022-5: | | | |
Class 0, 2.5% 6/25/48 | | 2,052 | 1,792 |
Class BA, 2.5% 12/25/49 | | 2,160 | 1,824 |
Series 2022-65 Class GA, 5% 4/25/46 | | 15,211 | 14,687 |
Series 2022-7 Class A, 3% 5/25/48 | | 2,850 | 2,545 |
| Series 2020-45 Class JL, 3% 7/25/40 | | 310 | 277 |
| Series 2021-59 Class H, 2% 6/25/48 | | 1,295 | 1,035 |
| Series 2021-66: | | | |
Class DA, 2% 1/25/48 | | 1,388 | 1,114 |
Class DM, 2% 1/25/48 | | 1,475 | 1,184 |
| Freddie Mac: | | | |
| planned amortization class: | | | |
Series 2021-5122 Class TE, 1.5% 6/25/51 | | 4,650 | 3,757 |
Series 2022-5213 Class JM, 3.5% 9/25/51 | | 7,064 | 6,646 |
Series 2022-5214 Class CG, 3.5% 4/25/52 | | 2,358 | 2,187 |
Series 2022-5220 Class PK, 3.5% 1/25/51 | | 3,176 | 2,924 |
Series 2022-5224 Class DQ, 3.75% 8/25/44 | | 4,002 | 3,771 |
| sequential payer: | | | |
Series 2020-5018: | | | |
Class LC, 3% 10/25/40 | | 2,092 | 1,868 |
Class LT, 3.25% 10/25/40 | | 1,943 | 1,772 |
Class LY, 3% 10/25/40 | | 1,590 | 1,420 |
Series 2021-5175 Class CB, 2.5% 4/25/50 | | 7,271 | 6,232 |
Series 2021-5180 Class KA, 2.5% 10/25/47 | | 1,445 | 1,273 |
Series 2022-5189 Class DA, 2.5% 5/25/49 | | 1,532 | 1,301 |
Series 2022-5190 Class BA, 2.5% 11/25/47 | | 1,478 | 1,301 |
Series 2022-5191 Class CA, 2.5% 4/25/50 | | 1,701 | 1,449 |
Series 2022-5197 Class DA, 2.5% 11/25/47 | | 1,122 | 989 |
Series 2022-5198 Class BA, 2.5% 11/25/47 | | 5,475 | 4,838 |
Series 2022-5200 Class LA, 3% 10/25/48 | | 2,835 | 2,541 |
Series 2022-5202 Class LB, 2.5% 10/25/47 | | 1,202 | 1,050 |
| Series 2020-5041 Class LB, 3% 11/25/40 | | 3,565 | 3,186 |
| Series 2021-5083 Class VA, 1% 8/15/38 | | 14,110 | 13,161 |
| Series 2021-5176 Class AG, 2% 1/25/47 | | 5,448 | 4,639 |
| Series 2021-5182 Class A, 2.5% 10/25/48 | | 9,458 | 8,153 |
| Freddie Mac Multi-family Structured pass-thru certificates sequential payer Series 2021-5159 Class GC, 2% 11/25/47 | | 1,158 | 997 |
| | | | |
| TOTAL COLLATERALIZED MORTGAGE OBLIGATIONS (Cost $177,727) | | | 177,484 |
| | | | |
| Commercial Mortgage Securities - 2.9% |
| | | Principal Amount (a) (000s) | Value ($) (000s) |
| Fannie Mae Series 2022-66, Class KA, 5% 10/25/52 | | 2,846 | 2,801 |
| Freddie Mac: | | | |
| floater Series 2024-K523 Class A/S, U.S. 30-Day Avg. Secured Overnight Fin. Rate (SOFR) Index + 0.550% 5.8743% 5/25/29 (e)(i) | | 21,200 | 21,200 |
| sequential payer: | | | |
Series 2015-K043 Class A2, 3.062% 12/25/24 | | 14,753 | 14,569 |
Series 2015-K049 Class A2, 3.01% 7/25/25 | | 5,413 | 5,285 |
Series 2015-K050 Class A2, 3.334% 8/25/25 (e) | | 13,656 | 13,360 |
Series 2015-K051 Class A2, 3.308% 9/25/25 | | 20,226 | 19,757 |
Series 2015-KPLB Class A, 2.77% 5/25/25 | | 11,355 | 11,073 |
Series 2016-K052 Class A2, 3.151% 11/25/25 | | 26,167 | 25,466 |
Series 2016-K055 Class A2, 2.673% 3/25/26 | | 19,600 | 18,828 |
Series 2017-K066 Class A2, 3.117% 6/25/27 | | 2,710 | 2,579 |
Series 2017-K729 Class A2, 3.136% 10/25/24 | | 8,535 | 8,459 |
Series 2018-K731 Class A2, 3.6% 2/25/25 | | 3,038 | 3,000 |
Series 2018-K732 Class A2, 3.7% 5/25/25 | | 15,808 | 15,574 |
Series 2018-K733 Class A2, 3.75% 8/25/25 | | 17,609 | 17,285 |
Series 2019-K735 Class A2, 2.862% 5/25/26 | | 12,733 | 12,240 |
Series 2019-K736 Class A2, 2.282% 7/25/26 | | 8,700 | 8,271 |
Series 2022-K747 Class A2, 2.05% 11/25/28 | | 4,800 | 4,280 |
Series K058 Class A2, 2.653% 8/25/26 | | 12,500 | 11,906 |
Series K073 Class A2, 3.35% 1/25/28 | | 2,900 | 2,759 |
| Series 2016-K059 Class A2, 3.12% 9/25/26 (e) | | 2,500 | 2,403 |
| Series 2017-K727 Class A2, 2.946% 7/25/24 | | 7,522 | 7,493 |
| Series K047 Class A2, 3.329% 5/25/25 | | 12,896 | 12,663 |
| Series K053 Class A2, 2.995% 12/25/25 | | 35,493 | 34,419 |
| Series K056 Class A2, 2.525% 5/25/26 | | 48,300 | 46,154 |
| Series K063 Class A2, 3.43% 1/25/27 | | 1,800 | 1,735 |
| Series K734 Class A2, 3.208% 2/25/26 | | 8,300 | 8,064 |
| Freddie Mac Multi-family Structured pass-thru certificates: | | | |
| sequential payer Series 2015 K045 Class A2, 3.023% 1/25/25 | | 3,310 | 3,259 |
| Series K044 Class A2, 2.811% 1/25/25 | | 21,397 | 21,073 |
| FREMF 2015-KPLB Mortgage Trust Series 2015-KPLB Class B, 2.5% 5/25/25 (c) | | 39,000 | 37,743 |
| TOTAL COMMERCIAL MORTGAGE SECURITIES (Cost $394,830) | | | 393,698 |
| | | | |
| Foreign Government and Government Agency Obligations - 3.6% |
| | | Principal Amount (a) (000s) | Value ($) (000s) |
| Australian Commonwealth: | | | |
| 1.75% 11/21/32 (Reg. S) | AUD | 15,000 | 8,237 |
| 1.75% 6/21/51 (Reg. S) | AUD | 81,080 | 29,926 |
| Canadian Government 1.25% 3/1/27 | CAD | 30,000 | 20,580 |
| German Federal Republic: | | | |
| 1.8% 8/15/53(Reg. S) | EUR | 23,070 | 20,393 |
| 2.2% 12/12/24(Reg. S) | EUR | 66,340 | 70,686 |
| 2.4% 10/19/28(Reg. S) | EUR | 25,900 | 27,627 |
| 2.6% 8/15/33(Reg. S) | EUR | 217,350 | 235,365 |
| United Kingdom, Great Britain and Northern Ireland 3.25% 1/31/33(Reg. S) | GBP | 59,800 | 70,842 |
| TOTAL FOREIGN GOVERNMENT AND GOVERNMENT AGENCY OBLIGATIONS (Cost $502,230) | | | 483,656 |
| | | | |
| Common Stocks - 6.8% |
| | | Shares | Value ($) (000s) |
| COMMUNICATION SERVICES - 0.5% | | | |
| Interactive Media & Services - 0.4% | | | |
| Alphabet, Inc. Class A | | 42,600 | 7,760 |
| Meta Platforms, Inc. Class A | | 81,300 | 40,993 |
| Pinterest, Inc. Class A (n) | | 199,300 | 8,783 |
| | | | 57,536 |
| Media - 0.1% | | | |
| EchoStar Corp. Class A (n) | | 338,100 | 6,022 |
| iHeartMedia, Inc. (n) | | 26 | 0 |
| | | | 6,022 |
TOTAL COMMUNICATION SERVICES | | | 63,558 |
| CONSUMER DISCRETIONARY - 1.0% | | | |
| Automobile Components - 0.0% | | | |
| UC Holdings, Inc. (b)(n) | | 560,355 | 459 |
| Automobiles - 0.1% | | | |
| BYD Co. Ltd. (H Shares) | | 522,500 | 15,518 |
| Broadline Retail - 0.1% | | | |
| Amazon.com, Inc. (n) | | 95,100 | 18,378 |
| Hotels, Restaurants & Leisure - 0.3% | | | |
| Airbnb, Inc. Class A (n) | | 58,500 | 8,870 |
| Booking Holdings, Inc. | | 2,200 | 8,715 |
| Boyd Gaming Corp. | | 123,800 | 6,821 |
| Domino's Pizza, Inc. | | 9,900 | 5,112 |
| New Cotai LLC/New Cotai Capital Corp. (b)(g)(n) | | 2,242,893 | 1,660 |
| Studio City International Holdings Ltd.: | | | |
| ADR (c)(n) | | 121,177 | 709 |
| (NYSE) ADR (n) | | 133,400 | 780 |
| | | | 32,667 |
| Household Durables - 0.1% | | | |
| TopBuild Corp. (n) | | 39,500 | 15,218 |
| Specialty Retail - 0.2% | | | |
| Dick's Sporting Goods, Inc. | | 50,200 | 10,785 |
| Lowe's Companies, Inc. | | 27,200 | 5,997 |
| Williams-Sonoma, Inc. | | 24,000 | 6,777 |
| | | | 23,559 |
| Textiles, Apparel & Luxury Goods - 0.2% | | | |
| Crocs, Inc. (n) | | 108,700 | 15,864 |
| LVMH Moet Hennessy Louis Vuitton SE | | 4,400 | 3,378 |
| Tapestry, Inc. | | 91,100 | 3,898 |
| | | | 23,140 |
TOTAL CONSUMER DISCRETIONARY | | | 128,939 |
| CONSUMER STAPLES - 0.1% | | | |
| Beverages - 0.0% | | | |
| Celsius Holdings, Inc. (n) | | 104,700 | 5,977 |
| Consumer Staples Distribution & Retail - 0.1% | | | |
| Southeastern Grocers, Inc. rights (b)(n) | | 584,047 | 642 |
| U.S. Foods Holding Corp. (n) | | 119,700 | 6,342 |
| | | | 6,984 |
| Personal Care Products - 0.0% | | | |
| elf Beauty, Inc. (n) | | 30,000 | 6,322 |
TOTAL CONSUMER STAPLES | | | 19,283 |
| ENERGY - 0.5% | | | |
| Energy Equipment & Services - 0.1% | | | |
| Forbes Energy Services Ltd. (b)(n) | | 135,187 | 0 |
| Superior Energy Services, Inc. Class A (b) | | 66,115 | 4,518 |
| | | | 4,518 |
| Oil, Gas & Consumable Fuels - 0.4% | | | |
| Antero Resources Corp. (n) | | 127,900 | 4,173 |
| California Resources Corp. warrants 10/27/24 (n) | | 34,633 | 618 |
| Canvas Energy, Inc.: | | | |
| Series A warrants 10/1/24 (b)(n) | | 289 | 0 |
| Series B warrants 10/1/25 (b)(n) | | 289 | 0 |
| Cheniere Energy, Inc. | | 75,400 | 13,182 |
| EP Energy Corp. (b)(n) | | 611,545 | 832 |
| Mesquite Energy, Inc. (b)(n) | | 185,122 | 15,439 |
| Permian Resource Corp. Class A | | 1,422,000 | 22,965 |
| Unit Corp. | | 28,630 | 1,045 |
| | | | 58,254 |
TOTAL ENERGY | | | 62,772 |
| FINANCIALS - 1.0% | | | |
| Capital Markets - 0.2% | | | |
| Ares Management Corp. Class A, | | 41,400 | 5,518 |
| Blue Owl Capital, Inc. Class A | | 313,500 | 5,565 |
| Coinbase Global, Inc. (n) | | 41,400 | 9,200 |
| Moody's Corp. | | 14,800 | 6,230 |
| | | | 26,513 |
| Consumer Finance - 0.1% | | | |
| OneMain Holdings, Inc. | | 299,100 | 14,503 |
| Financial Services - 0.5% | | | |
| Apollo Global Management, Inc. | | 189,500 | 22,374 |
| Block, Inc. Class A (n) | | 92,100 | 5,940 |
| Carnelian Point Holdings LP warrants (b)(n) | | 544 | 2 |
| Fiserv, Inc. (n) | | 54,100 | 8,063 |
| MasterCard, Inc. Class A | | 27,600 | 12,176 |
| Visa, Inc. Class A | | 82,700 | 21,706 |
| | | | 70,261 |
| Insurance - 0.2% | | | |
| Arthur J. Gallagher & Co. | | 81,300 | 21,082 |
TOTAL FINANCIALS | | | 132,359 |
| HEALTH CARE - 0.0% | | | |
| Health Care Providers & Services - 0.0% | | | |
| Tenet Healthcare Corp. (n) | | 36,700 | 4,882 |
| INDUSTRIALS - 1.0% | | | |
| Aerospace & Defense - 0.1% | | | |
| TransDigm Group, Inc. | | 4,900 | 6,260 |
| Building Products - 0.2% | | | |
| Builders FirstSource, Inc. (n) | | 31,700 | 4,388 |
| Carlisle Companies, Inc. | | 26,500 | 10,738 |
| Fortune Brands Innovations, Inc. | | 106,400 | 6,910 |
| Trane Technologies PLC | | 33,500 | 11,019 |
| | | | 33,055 |
| Construction & Engineering - 0.2% | | | |
| Comfort Systems U.S.A., Inc. | | 35,500 | 10,796 |
| EMCOR Group, Inc. | | 17,800 | 6,498 |
| Willscot Mobile Mini Holdings (n) | | 267,000 | 10,050 |
| | | | 27,344 |
| Electrical Equipment - 0.4% | | | |
| Eaton Corp. PLC | | 60,500 | 18,970 |
| Nextracker, Inc. Class A (n) | | 177,900 | 8,340 |
| nVent Electric PLC | | 114,000 | 8,734 |
| Vertiv Holdings Co. | | 187,600 | 16,241 |
| | | | 52,285 |
| Machinery - 0.1% | | | |
| Deere & Co. | | 6,700 | 2,503 |
| Parker Hannifin Corp. | | 20,300 | 10,268 |
| | | | 12,771 |
| Passenger Airlines - 0.0% | | | |
| Air Canada (n) | | 800 | 10 |
| Delta Air Lines, Inc. | | 48,600 | 2,306 |
| | | | 2,316 |
| Trading Companies & Distributors - 0.0% | | | |
| Core & Main, Inc. (n) | | 101,000 | 4,943 |
| Penhall Acquisition Co. (b) | | 15,403 | 0 |
| | | | 4,943 |
| Transportation Infrastructure - 0.0% | | | |
| Tricer Holdco SCA: | | | |
| Class A1 (b)(g)(n) | | 403,760 | 0 |
| Class A2 (b)(g)(n) | | 403,760 | 0 |
| Class A3 (b)(g)(n) | | 403,760 | 0 |
| Class A4 (b)(g)(n) | | 403,760 | 0 |
| Class A5 (b)(g)(n) | | 403,760 | 0 |
| Class A6 (b)(g)(n) | | 403,760 | 0 |
| Class A7 (b)(g)(n) | | 403,760 | 0 |
| Class A8 (b)(g)(n) | | 403,760 | 0 |
| Class A9 (b)(g)(n) | | 403,760 | 0 |
| | | | 0 |
TOTAL INDUSTRIALS | | | 138,974 |
| INFORMATION TECHNOLOGY - 2.0% | | | |
| Communications Equipment - 0.1% | | | |
| Arista Networks, Inc. (n) | | 34,200 | 11,986 |
| IT Services - 0.0% | | | |
| Accenture PLC Class A | | 16,700 | 5,067 |
| GTT Communications, Inc. (b)(n) | | 51,638 | 1,647 |
| | | | 6,714 |
| Semiconductors & Semiconductor Equipment - 1.2% | | | |
| ASML Holding NV (depository receipt) | | 8,500 | 8,693 |
| KLA Corp. | | 18,700 | 15,418 |
| Lam Research Corp. | | 16,400 | 17,464 |
| Marvell Technology, Inc. | | 86,600 | 6,053 |
| Micron Technology, Inc. | | 48,900 | 6,432 |
| NVIDIA Corp. | | 626,000 | 77,336 |
| NXP Semiconductors NV | | 19,800 | 5,328 |
| ON Semiconductor Corp. (n) | | 247,091 | 16,938 |
| Taiwan Semiconductor Manufacturing Co. Ltd. sponsored ADR | | 39,900 | 6,935 |
| | | | 160,597 |
| Software - 0.6% | | | |
| Adobe, Inc. (n) | | 28,564 | 15,868 |
| Autodesk, Inc. (n) | | 21,700 | 5,370 |
| Gen Digital, Inc. | | 197,900 | 4,944 |
| Microsoft Corp. | | 60,500 | 27,040 |
| Oracle Corp. | | 73,000 | 10,308 |
| Palo Alto Networks, Inc. (n) | | 18,800 | 6,373 |
| Salesforce, Inc. | | 37,200 | 9,564 |
| UiPath, Inc. Class A (n) | | 293,700 | 3,724 |
| | | | 83,191 |
| Technology Hardware, Storage & Peripherals - 0.1% | | | |
| Dell Technologies, Inc. | | 54,700 | 7,544 |
TOTAL INFORMATION TECHNOLOGY | | | 270,032 |
| MATERIALS - 0.3% | | | |
| Chemicals - 0.1% | | | |
| Olin Corp. | | 149,500 | 7,049 |
| The Chemours Co. LLC | | 293,779 | 6,631 |
| Westlake Corp. | | 20,100 | 2,911 |
| | | | 16,591 |
| Construction Materials - 0.1% | | | |
| Eagle Materials, Inc. | | 48,600 | 10,569 |
| Martin Marietta Materials, Inc. | | 10,000 | 5,418 |
| | | | 15,987 |
| Containers & Packaging - 0.1% | | | |
| Graphic Packaging Holding Co. | | 332,500 | 8,715 |
| Metals & Mining - 0.0% | | | |
| Algoma Steel SCA (b)(n) | | 151,792 | 0 |
| Elah Holdings, Inc. (n)(o) | | 517 | 19 |
| | | | 19 |
TOTAL MATERIALS | | | 41,312 |
| UTILITIES - 0.4% | | | |
| Electric Utilities - 0.2% | | | |
| Constellation Energy Corp. | | 120,700 | 24,173 |
| PG&E Corp. | | 475,968 | 8,310 |
| Portland General Electric Co. | | 13,962 | 604 |
| | | | 33,087 |
| Independent Power and Renewable Electricity Producers - 0.2% | | | |
| PureWest Energy (b)(n) | | 10,774 | 2 |
| Vistra Corp. | | 287,300 | 24,702 |
| | | | 24,704 |
TOTAL UTILITIES | | | 57,791 |
| TOTAL COMMON STOCKS (Cost $687,188) | | | 919,902 |
| | | | |
| Nonconvertible Preferred Stocks - 0.0% |
| | | Shares | Value ($) (000s) |
| INDUSTRIALS - 0.0% | | | |
| Transportation Infrastructure - 0.0% | | | |
Tricer Holdco SCA (b)(g)(n) (Cost $6,908) | | 193,792,711 | 2 |
| | | | |
| Bank Loan Obligations - 3.8% |
| | | Principal Amount (a) (000s) | Value ($) (000s) |
| COMMUNICATION SERVICES - 0.1% | | | |
| Diversified Telecommunication Services - 0.1% | | | |
| Aventiv Technologies LLC: | | | |
| 1LN, term loan: | | | |
| CME Term SOFR 1 Month Index + 7.500% 13.0962% 7/31/25 (e)(i)(p) | | 111 | 112 |
| CME Term SOFR 3 Month Index + 5.090% 10.6862% 7/31/25 (e)(i)(p) | | 4,210 | 3,417 |
| Tranche FLSO 1LN, term loan CME Term SOFR 1 Month Index + 7.500% 7/31/25 (b)(i)(p)(q) | | 254 | 254 |
| Connect U.S. Finco LLC Tranche B 1LN, term loan CME Term SOFR 1 Month Index + 4.500% 9.8439% 9/13/29 (e)(i)(p) | | 5,247 | 4,937 |
| Gtt Remainco LLC 1LN, term loan CME Term SOFR 1 Month Index + 7.000% 12.4439% 12/30/27 (e)(i)(p) | | 2,833 | 2,634 |
| | | | 11,354 |
| Media - 0.0% | | | |
| Diamond Sports Group LLC 1LN, term loan CME Term SOFR 1 Month Index + 8.000% 15.4292% 8/24/26 (e)(i)(p) | | 1,594 | 1,487 |
| Univision Communications, Inc.: | | | |
| 1LN, term loan CME Term SOFR 3 Month Index + 4.250% 9.5846% 6/24/29 (e)(i)(p) | | 348 | 347 |
| Tranche B 1LN, term loan CME Term SOFR 1 Month Index + 3.250% 8.7084% 1/31/29 (e)(i)(p) | | 3,499 | 3,412 |
| | | | 5,246 |
TOTAL COMMUNICATION SERVICES | | | 16,600 |
| CONSUMER DISCRETIONARY - 0.7% | | | |
| Automobile Components - 0.0% | | | |
| Clarios Global LP Tranche B 1LN, term loan CME Term SOFR 1 Month Index + 3.250% 8.3439% 5/6/30 (e)(i)(p) | | 1,247 | 1,248 |
| Broadline Retail - 0.0% | | | |
| Great Outdoors Group LLC Tranche B 1LN, term loan CME Term SOFR 1 Month Index + 3.750% 9.2084% 3/5/28 (e)(i)(p) | | 1,318 | 1,316 |
| Diversified Consumer Services - 0.2% | | | |
| Sotheby's Tranche B 1LN, term loan CME Term SOFR 1 Month Index + 4.500% 10.0902% 1/15/27 (e)(i)(p) | | 2,398 | 2,194 |
| Spin Holdco, Inc. Tranche B 1LN, term loan CME Term SOFR 3 Month Index + 4.000% 9.6001% 3/4/28 (e)(i)(p) | | 8,180 | 6,932 |
| TKC Holdings, Inc. 1LN, term loan CME Term SOFR 1 Month Index + 5.500% 11.109% 5/14/28 (e)(i)(p) | | 11,534 | 11,503 |
| | | | 20,629 |
| Hotels, Restaurants & Leisure - 0.2% | | | |
| Carnival Corp. Tranche B 1LN, term loan CME Term SOFR 1 Month Index + 2.750% 8.0939% 10/18/28 (e)(i)(p) | | 5,519 | 5,525 |
| Fertitta Entertainment LLC NV Tranche B 1LN, term loan CME Term SOFR 1 Month Index + 4.000% 9.0808% 1/27/29 (e)(i)(p) | | 13,044 | 13,052 |
| Light & Wonder International, Inc. Tranche B 1LN, term loan CME Term SOFR 1 Month Index + 2.750% 8.0805% 4/16/29 (e)(i)(p) | | 1,079 | 1,078 |
| Ontario Gaming GTA LP Tranche B 1LN, term loan CME Term SOFR 1 Month Index + 4.250% 9.5846% 8/1/30 (e)(i)(p) | | 2,701 | 2,711 |
| | | | 22,366 |
| Specialty Retail - 0.3% | | | |
| LBM Acquisition LLC Tranche B 1LN, term loan CME Term SOFR 1 Month Index + 3.750% 9.1775% 6/6/31 (e)(i)(p) | | 45,390 | 44,583 |
| Wand NewCo 3, Inc. Tranche B 1LN, term loan CME Term SOFR 1 Month Index + 3.750% 9.0939% 1/20/31 (e)(i)(p) | | 980 | 986 |
| | | | 45,569 |
TOTAL CONSUMER DISCRETIONARY | | | 91,128 |
| CONSUMER STAPLES - 0.0% | | | |
| Beverages - 0.0% | | | |
| Naked Juice LLC 1LN, term loan CME Term SOFR 1 Month Index + 3.250% 8.6846% 1/24/29 (e)(i)(p) | | 1,019 | 944 |
| Food Products - 0.0% | | | |
| Fiesta Purchaser, Inc. Tranche B 1LN, term loan CME Term SOFR 1 Month Index + 4.000% 9.3439% 2/12/31 (e)(i)(p) | | 940 | 946 |
TOTAL CONSUMER STAPLES | | | 1,890 |
| ENERGY - 0.1% | | | |
| Energy Equipment & Services - 0.0% | | | |
| Forbes Energy Services LLC Tranche B, term loan 0% (b)(d)(e)(p) | | 1,267 | 0 |
| Oil, Gas & Consumable Fuels - 0.1% | | | |
| EG America LLC Tranche BC 1LN, term loan CME Term SOFR 1 Month Index + 5.500% 11.0716% 2/7/28 (e)(i)(p) | | 20,337 | 20,040 |
| Mesquite Energy, Inc.: | | | |
| 1LN, term loan 3 month U.S. LIBOR + 8.000% 0% (b)(d)(i)(p) | | 3,423 | 0 |
| term loan 0% (b)(d)(e)(p) | | 1,476 | 0 |
| | | | 20,040 |
TOTAL ENERGY | | | 20,040 |
| FINANCIALS - 0.3% | | | |
| Capital Markets - 0.1% | | | |
| Citadel Securities LP Tranche B 1LN, term loan CME Term SOFR 1 Month Index + 2.250% 7.5939% 7/29/30 (e)(i)(p) | | 5,202 | 5,216 |
| Insurance - 0.2% | | | |
| Acrisure LLC: | | | |
| Tranche B 1LN, term loan CME Term SOFR 1 Month Index + 3.500% 8.9437% 2/15/27 (e)(i)(p) | | 8,122 | 8,110 |
| Tranche B6 1LN, term loan CME Term SOFR 1 Month Index + 3.250% 8.5936% 11/6/30 (e)(i)(p) | | 3,317 | 3,311 |
| Alliant Holdings Intermediate LLC Tranche B6 1LN, term loan CME Term SOFR 1 Month Index + 3.500% 8.8387% 11/6/30 (e)(i)(p) | | 5,178 | 5,189 |
| HUB International Ltd. Tranche B 1LN, term loan CME Term SOFR 1 Month Index + 3.250% 8.5746% 6/20/30 (e)(i)(p) | | 2,095 | 2,098 |
| Truist Insurance Holdings LLC: | | | |
| 2L, term loan CME Term SOFR 1 Month Index + 4.750% 10.0859% 3/8/32 (e)(i)(p) | | 11,040 | 11,238 |
| Tranche B 1LN, term loan CME Term SOFR 1 Month Index + 3.250% 8.5846% 5/6/31 (e)(i)(p) | | 2,105 | 2,107 |
| | | | 32,053 |
TOTAL FINANCIALS | | | 37,269 |
| HEALTH CARE - 0.4% | | | |
| Health Care Equipment & Supplies - 0.1% | | | |
| Medline Borrower LP Tranche B 1LN, term loan CME Term SOFR 1 Month Index + 2.750% 8.0939% 10/23/28 (e)(i)(p) | | 10,003 | 10,017 |
| Health Care Providers & Services - 0.1% | | | |
| Gainwell Acquisition Corp. Tranche B 1LN, term loan CME Term SOFR 3 Month Index + 4.000% 9.4346% 10/1/27 (e)(i)(p) | | 9,554 | 9,239 |
| Phoenix Newco, Inc. Tranche B 1LN, term loan CME Term SOFR 1 Month Index + 3.250% 8.7084% 11/15/28 (e)(i)(p) | | 3,260 | 3,265 |
| | | | 12,504 |
| Health Care Technology - 0.2% | | | |
| Athenahealth Group, Inc. Tranche B 1LN, term loan CME Term SOFR 1 Month Index + 3.500% 8.5939% 2/15/29 (e)(i)(p) | | 13,423 | 13,364 |
| Cotiviti, Inc. Tranche B 1LN, term loan CME Term SOFR 1 Month Index + 3.250% 8.5792% 5/1/31 (e)(i)(p) | | 15,716 | 15,617 |
| | | | 28,981 |
TOTAL HEALTH CARE | | | 51,502 |
| INDUSTRIALS - 0.5% | | | |
| Building Products - 0.1% | | | |
| Hunter Douglas, Inc. Tranche B 1LN, term loan CME Term SOFR 3 Month Index + 3.500% 8.8359% 2/25/29 (e)(i)(p) | | 10,378 | 10,278 |
| MIWD Holdco II LLC Tranche B2, term loan CME Term SOFR 1 Month Index + 3.500% 8.8439% 3/28/31 (e)(i)(p) | | 335 | 337 |
| | | | 10,615 |
| Commercial Services & Supplies - 0.3% | | | |
| ABG Intermediate Holdings 2 LLC Tranche B1 LN, term loan CME Term SOFR 1 Month Index + 3.500% 8.9292% 12/21/28 (e)(i)(p) | | 8,294 | 8,294 |
| Artera Services LLC Tranche B 1LN, term loan CME Term SOFR 1 Month Index + 4.500% 9.8346% 2/10/31 (e)(i)(p) | | 2,768 | 2,778 |
| Bifm California Buyer, Inc. Tranche 1LN, term loan CME Term SOFR 1 Month Index + 4.250% 9.5939% 5/31/28 (e)(i)(p) | | 633 | 636 |
| Brand Industrial Services, Inc. Tranche B 1LN, term loan CME Term SOFR 1 Month Index + 4.500% 9.8268% 8/1/30 (e)(i)(p) | | 14,021 | 14,060 |
| Madison IAQ LLC Tranche B 1LN, term loan CME Term SOFR 1 Month Index + 3.250% 8.0936% 6/21/28 (e)(i)(p) | | 1,381 | 1,381 |
| Neptune BidCo U.S., Inc. Tranche B 1LN, term loan CME Term SOFR 1 Month Index + 5.000% 10.4059% 4/11/29 (e)(i)(p) | | 7,306 | 6,865 |
| Sabert Corp. Tranche B 1LN, term loan CME Term SOFR 1 Month Index + 3.750% 9.1952% 12/16/26 (e)(i)(p) | | 2,938 | 2,947 |
| The GEO Group, Inc. Tranche B 1LN, term loan CME Term SOFR 1 Month Index + 5.250% 10.5939% 4/14/29 (e)(i)(p) | | 1,995 | 2,032 |
| | | | 38,993 |
| Machinery - 0.0% | | | |
| Chart Industries, Inc. Tranche B 1LN, term loan CME Term SOFR 1 Month Index + 3.250% 8.6775% 3/17/30 (e)(i)(p) | | 743 | 744 |
| STS Operating, Inc. 1LN, term loan CME Term SOFR 1 Month Index + 4.000% 9.4439% 3/25/31 (e)(i)(p) | | 2,633 | 2,638 |
| | | | 3,382 |
| Passenger Airlines - 0.0% | | | |
| SkyMiles IP Ltd. Tranche B 1LN, term loan CME Term SOFR 3 Month Index + 3.750% 9.0746% 10/20/27 (e)(i)(p) | | 899 | 920 |
| United Airlines, Inc. Tranche 1LN, term loan CME Term SOFR 1 Month Index + 2.750% 8.0936% 2/24/31 (e)(i)(p) | | 1,192 | 1,193 |
| | | | 2,113 |
| Professional Services - 0.1% | | | |
| Galaxy U.S. Opco, Inc. 1LN, term loan CME Term SOFR 1 Month Index + 4.750% 10.0795% 4/29/29 (e)(i)(p) | | 10,568 | 8,534 |
TOTAL INDUSTRIALS | | | 63,637 |
| INFORMATION TECHNOLOGY - 1.2% | | | |
| Electronic Equipment, Instruments & Components - 0.0% | | | |
| DG Investment Intermediate Holdings, Inc. Tranche B 1LN, term loan CME Term SOFR 1 Month Index + 3.750% 9.1937% 3/31/28 (e)(i)(p) | | 970 | 966 |
| IT Services - 0.0% | | | |
| Acuris Finance U.S., Inc. 1LN, term loan CME Term SOFR 3 Month Index + 4.000% 9.4846% 2/16/28 (e)(i)(p) | | 603 | 602 |
| GTT Communications, Inc. 1LN, term loan CME Term SOFR 3 Month Index + 9.000% 14.4346% 6/30/28 (e)(i)(p) | | 2,335 | 1,693 |
| | | | 2,295 |
| Software - 1.2% | | | |
| Applied Systems, Inc.: | | | |
| Tranche 2LN, term loan CME Term SOFR 1 Month Index + 5.250% 10.5594% 2/23/32 (e)(i)(p) | | 95 | 98 |
| Tranche B 1LN, term loan CME Term SOFR 1 Month Index + 3.500% 8.8346% 2/24/31 (e)(i)(p) | | 5,170 | 5,205 |
| Boxer Parent Co., Inc. Tranche B 1LN, term loan CME Term SOFR 1 Month Index + 4.250% 9.3439% 12/29/28 (e)(i)(p) | | 18,617 | 18,634 |
| ConnectWise LLC Tranche B 1LN, term loan CME Term SOFR 1 Month Index + 3.500% 9.0962% 9/30/28 (e)(i)(p) | | 7,982 | 7,912 |
| McAfee Corp. Tranche B 1LN, term loan CME Term SOFR 1 Month Index + 3.250% 8.5792% 3/1/29 (e)(i)(p) | | 14,061 | 14,029 |
| MH Sub I LLC Tranche B 1LN, term loan CME Term SOFR 1 Month Index + 4.250% 9.5939% 5/3/28 (e)(i)(p) | | 8,327 | 8,313 |
| Modena Buyer LLC 1LN, term loan CME Term SOFR 1 Month Index + 4.500% 4/21/31 (i)(p)(q) | | 12,720 | 12,398 |
| Polaris Newco LLC Tranche B 1LN, term loan CME Term SOFR 1 Month Index + 4.000% 9.5911% 6/2/28 (e)(i)(p) | | 3,097 | 3,094 |
| Project Alpha Intermediate Holding, Inc. Tranche B 1LN, term loan CME Term SOFR 1 Month Index + 3.750% 9.072% 10/28/30 (e)(i)(p) | | 5,430 | 5,442 |
| Proofpoint, Inc. Tranche B 1LN, term loan CME Term SOFR 1 Month Index + 3.000% 8.3439% 8/31/28 (e)(i)(p) | | 35,165 | 35,178 |
| RealPage, Inc. Tranche B 1LN, term loan CME Term SOFR 1 Month Index + 3.000% 8.4584% 4/22/28 (e)(i)(p) | | 3,027 | 2,939 |
| UKG, Inc. Tranche B 1LN, term loan CME Term SOFR 1 Month Index + 3.500% 8.5763% 2/10/31 (e)(i)(p) | | 31,294 | 31,395 |
| Veritas U.S., Inc. Tranche B 1LN, term loan CME Term SOFR 1 Month Index + 5.000% 10.4584% 9/1/25 (e)(i)(p) | | 4,570 | 3,964 |
| VS Buyer LLC Tranche B 1LN, term loan CME Term SOFR 1 Month Index + 3.250% 8.5808% 4/14/31 (e)(i)(p) | | 16,065 | 16,085 |
| | | | 164,686 |
TOTAL INFORMATION TECHNOLOGY | | | 167,947 |
| MATERIALS - 0.5% | | | |
| Chemicals - 0.2% | | | |
| Consolidated Energy Finance SA Tranche B 1LN, term loan CME Term SOFR 1 Month Index + 4.500% 9.8439% 11/15/30 (e)(i)(p) | | 5,287 | 5,136 |
| Discovery Purchaser Corp. 1LN, term loan CME Term SOFR 3 Month Index + 4.370% 9.6813% 10/4/29 (e)(i)(p) | | 19,211 | 19,161 |
| Olympus Water U.S. Holding Corp. Tranche B 1LN, term loan CME Term SOFR 3 Month Index + 3.750% 9.321% 11/9/28 (e)(i)(p) | | 1,672 | 1,673 |
| W.R. Grace Holding LLC Tranche B 1LN, term loan CME Term SOFR 3 Month Index + 3.750% 8.5939% 9/22/28 (e)(i)(p) | | 6,631 | 6,652 |
| | | | 32,622 |
| Containers & Packaging - 0.3% | | | |
| Clydesdale Acquisition Holdings, Inc. 1LN, term loan CME Term SOFR 1 Month Index + 3.670% 9.1189% 4/13/29 (e)(i)(p) | | 32,080 | 32,130 |
| Kloeckner Pentaplast of America, Inc. Tranche B 1LN, term loan CME Term SOFR 6 Month Index + 4.750% 10.2675% 2/9/26 (e)(i)(p) | | 774 | 722 |
| | | | 32,852 |
| Metals & Mining - 0.0% | | | |
| Arsenal AIC Parent LLC Tranche B 1LN, term loan CME Term SOFR 1 Month Index + 3.750% 9.0939% 8/19/30 (e)(i)(p) | | 759 | 763 |
TOTAL MATERIALS | | | 66,237 |
| UTILITIES - 0.0% | | | |
| Independent Power and Renewable Electricity Producers - 0.0% | | | |
| Talen Energy Supply LLC: | | | |
| Tranche TLB-EXIT 1LN, term loan CME Term SOFR 1 Month Index + 4.500% 8.8267% 5/17/30 (e)(i)(p) | | 241 | 243 |
| Tranche TLC-EXIT 1LN, term loan CME Term SOFR 1 Month Index + 4.500% 8.8267% 5/17/30 (e)(i)(p) | | 158 | 160 |
| | | | 403 |
| TOTAL BANK LOAN OBLIGATIONS (Cost $521,129) | | | 516,653 |
| | | | |
| Fixed-Income Funds - 21.0% |
| | | Shares | Value ($) (000s) |
| Fidelity Emerging Markets Debt Central Fund (r) | | 265,795,075 | 2,110,413 |
| Fidelity Floating Rate Central Fund (r) | | 7,599,679 | 744,541 |
| TOTAL FIXED-INCOME FUNDS (Cost $3,222,398) | | | 2,854,954 |
| | | | |
| Preferred Securities - 2.3% |
| | | Principal Amount (a) (000s) | Value ($) (000s) |
| COMMUNICATION SERVICES - 0.0% | | | |
| Diversified Telecommunication Services - 0.0% | | | |
| Orange SA 5.375% (Reg. S) (e)(s) | EUR | 6,100 | 6,833 |
| CONSUMER DISCRETIONARY - 0.2% | | | |
| Automobiles - 0.2% | | | |
| Volkswagen International Finance NV: | | | |
| 4.375% (Reg. S) (e)(s) | EUR | 20,600 | 20,549 |
| 7.875% (Reg. S) (e)(s) | EUR | 2,800 | 3,581 |
| | | | 24,130 |
| ENERGY - 0.2% | | | |
| Oil, Gas & Consumable Fuels - 0.2% | | | |
| Energy Transfer LP: | | | |
| 6.625% (e)(s) | | 17,100 | 17,021 |
| 7.125% (e)(s) | | 11,723 | 11,719 |
| Summit Midstream Partners LP 3 month U.S. LIBOR + 7.430% 13.0308% (d)(e)(i)(s) | | 1,711 | 2,122 |
| | | | 30,862 |
| FINANCIALS - 1.8% | | | |
| Banks - 1.6% | | | |
| Bank of America Corp.: | | | |
| 5.875% (e)(s) | | 60,475 | 61,186 |
| 6.25% (e)(s) | | 18,480 | 18,774 |
| Citigroup, Inc.: | | | |
| CME Term SOFR 3 Month Index + 3.420% 9.007% (e)(i)(s) | | 4,120 | 4,157 |
| 5% (e)(s) | | 36,455 | 36,769 |
| Citigroup, Inc. 4.7% (e)(s) | | 8,755 | 8,730 |
| JPMorgan Chase & Co.: | | | |
| 4% (e)(s) | | 19,100 | 18,756 |
| 4.6% (e)(s) | | 13,385 | 13,454 |
| 5% (e)(s) | | 18,675 | 19,007 |
| Wells Fargo & Co. 5.875% (e)(s) | | 36,775 | 36,690 |
| | | | 217,523 |
| Capital Markets - 0.2% | | | |
| Goldman Sachs Group, Inc. CME Term SOFR 3 Month Index + 3.130% 8.4612% (e)(i)(s) | | 29,914 | 30,333 |
| Financial Services - 0.0% | | | |
| OEC Finance Ltd. 7.5% pay-in-kind (c)(s) | | 26 | 2 |
TOTAL FINANCIALS | | | 247,858 |
| UTILITIES - 0.1% | | | |
| Electric Utilities - 0.1% | | | |
| Enel SpA 6.625% (Reg. S) (e)(s) | EUR | 5,957 | 7,284 |
| TOTAL PREFERRED SECURITIES (Cost $314,245) | | | 316,967 |
| | | | |
| Money Market Funds - 4.6% |
| | | Shares | Value ($) (000s) |
| Fidelity Cash Central Fund 5.38% (t) | | 630,507,779 | 630,634 |
| Fidelity Securities Lending Cash Central Fund 5.38% (t)(u) | | 7,799 | 8 |
| TOTAL MONEY MARKET FUNDS (Cost $630,606) | | | 630,642 |
| | | | |
| Purchased Swaptions - 0.1% |
| | Expiration Date | Notional Amount (a) (000s) | Value ($) (000s) |
| Put Options - 0.1% | | | | |
| Option on an interest rate swap with Citibank N.A. to receive annually a floating rate based on the U.S. Secured Overnight Fin. Rate (SOFR) Index and pay a fixed rate of 3.694%, expiring December 2033. | 12/12/28 | | 63,500 | 2,624 |
| Option on an interest rate swap with Goldman Sachs Bank U.S.A. to pay annually a fixed rate of 3.3525% and receive annually a floating rate based on the U.S. Secured Overnight Fin. Rate (SOFR) Index, expiring February 2035. | 2/03/25 | | 19,700 | 1,026 |
| | | | | |
| TOTAL PUT OPTIONS | | | | 3,650 |
| Call Options - 0.0% | | | | |
| Option on an interest rate swap with Citibank N.A. to receive annually a fixed rate of 3.694% and pay a floating rate based on the U.S. Secured Overnight Fin. Rate (SOFR) Index, expiring December 2033. | 12/12/28 | | 63,500 | 2,397 |
| Option on an interest rate swap with Goldman Sachs Bank U.S.A. to receive annually a fixed rate of 3.3525% and pay annually a floating rate based on the U.S. Secured Overnight Fin. Rate (SOFR) Index, expiring February 2035. | 2/03/25 | | 19,700 | 234 |
| | | | | |
| TOTAL CALL OPTIONS | | | | 2,631 |
TOTAL PURCHASED SWAPTIONS (Cost $6,566) | | | | 6,281 |
| TOTAL INVESTMENT IN SECURITIES - 101.1% (Cost $14,339,894) | 13,736,323 |
NET OTHER ASSETS (LIABILITIES) - (1.1)% | (150,694) |
| NET ASSETS - 100.0% | 13,585,629 |
| | |
| TBA Sale Commitments |
| | Principal Amount (a) (000s) | Value ($) (000s) |
| Ginnie Mae | | |
| Ginnie Mae 2.5% 7/1/54 | (12,700) | (10,681) |
| 2% 7/1/54 | (14,800) | (11,985) |
| 2% 7/1/54 | (2,050) | (1,660) |
| 2% 7/1/54 | (12,450) | (10,081) |
| 2% 7/1/54 | (450) | (364) |
| | | |
| TOTAL GINNIE MAE | | (34,771) |
| | | |
| Uniform Mortgage Backed Securities | | |
| 2% 7/1/54 | (13,400) | (10,480) |
| 2% 7/1/54 | (14,800) | (11,575) |
| 2% 7/1/54 | (14,800) | (11,575) |
| 2.5% 7/1/54 | (30,675) | (25,053) |
| 2.5% 7/1/54 | (30,675) | (25,053) |
| 5% 7/1/54 | (24,400) | (23,581) |
| 5% 8/1/54 | (24,400) | (23,588) |
| 5.5% 7/1/54 | (55,000) | (54,246) |
| 5.5% 8/1/54 | (55,000) | (54,250) |
| 6% 7/1/54 | (325) | (326) |
| Uniform Mortgage Backed Securities 2.5% 8/1/54 | (30,700) | (25,096) |
| | | |
| TOTAL UNIFORM MORTGAGE BACKED SECURITIES | | (264,823) |
| | | |
TOTAL TBA SALE COMMITMENTS (Proceeds $300,897) | | (299,594) |
| Futures Contracts |
| | Number of contracts | Expiration Date | Notional Amount ($) (000s) | Value ($) (000s) | Unrealized Appreciation/ (Depreciation) ($) (000s) |
| Purchased | | | | | |
| | | | | | |
| Bond Index Contracts | | | | | |
| Eurex Euro-Bund Contracts (Germany) | 779 | Sep 2024 | 109,807 | 1,348 | 1,348 |
| | | | | | |
| Treasury Contracts | | | | | |
| CBOT 10-Year U.S. Treasury Note Contracts (United States) | 9,771 | Sep 2024 | 1,074,657 | 6,270 | 6,270 |
| CBOT 2-Year U.S. Treasury Note Contracts (United States) | 2,009 | Sep 2024 | 410,275 | 669 | 669 |
| CBOT Long Term U.S. Treasury Bond Contracts (United States) | 272 | Sep 2024 | 32,181 | 244 | 244 |
| CBOT Ultra Long Term U.S. Treasury Bond Contracts (United States) | 33 | Sep 2024 | 4,136 | 27 | 27 |
| | | | | | |
| TOTAL TREASURY CONTRACTS | | | | | 7,210 |
| | | | | | |
| TOTAL PURCHASED | | | | | 8,558 |
| | | | | | |
| Sold | | | | | |
| | | | | | |
| Bond Index Contracts | | | | | |
| Eurex Euro-BTP Contracts (Germany) | 860 | Sep 2024 | 106,184 | 951 | 951 |
| | | | | | |
| Treasury Contracts | | | | | |
| CBOT 5-Year U.S. Treasury Note Contracts (United States) | 157 | Sep 2024 | 16,733 | (105) | (105) |
| | | | | | |
| TOTAL SOLD | | | | | 846 |
| | | | | | |
| TOTAL FUTURES CONTRACTS | | | | | 9,404 |
| The notional amount of futures purchased as a percentage of Net Assets is 11.9% |
| The notional amount of futures sold as a percentage of Net Assets is 0.9% |
For the period, the average monthly notional amount at value for futures contracts in the aggregate was $1,812,893,000.
| Forward Foreign Currency Contracts |
Currency Purchased
(000s) | Currency Sold (000s) | Counterparty | Settlement Date | Unrealized Appreciation/ (Depreciation) ($) (000s) |
| | | | | | | |
| USD | 1,060 | EUR | 989 | State Street Bank and Trust Co | 7/01/24 | 1 |
| EUR | 4,370 | USD | 4,691 | HSBC Bank | 7/19/24 | (7) |
| USD | 39,637 | AUD | 59,881 | Bank of America, N.A. | 7/19/24 | (329) |
| USD | 20,056 | CAD | 27,566 | State Street Bank and Trust Co | 7/19/24 | (102) |
| USD | 3,014 | EUR | 2,810 | Citibank, N. A. | 7/19/24 | 3 |
| USD | 5,998 | EUR | 5,605 | Royal Bank of Canada | 7/19/24 | (10) |
| USD | 2,895 | EUR | 2,698 | Royal Bank of Canada | 7/19/24 | 3 |
| USD | 925,039 | EUR | 865,107 | State Street Bank and Trust Co | 7/19/24 | (2,213) |
| USD | 73,058 | GBP | 57,420 | Brown Brothers Harriman & Co | 7/19/24 | 466 |
| | | | | | | |
| TOTAL FORWARD FOREIGN CURRENCY CONTRACTS | | (2,188) |
| Unrealized Appreciation | | | 473 |
| Unrealized Depreciation | | | (2,661) |
For the period, the average contract value for forward foreign currency contracts was $1,093,949,000. Contract value represents contract amount in United States dollars plus or minus unrealized appreciation or depreciation, respectively.
| Interest Rate Swaps |
| Payment Received | Payment Frequency | Payment Paid | Payment Frequency | Clearinghouse / Counterparty(1) | Maturity Date | Notional Amount (000s)(2) | Value ($) (000s) | Upfront Premium Received/ (Paid) ($) (000s)(3) | Unrealized Appreciation/ (Depreciation) ($) (000s) |
| 3.75% | Annual | U.S. Secured Overnight Fin. Rate (SOFR) Index(4) | Annual | LCH | Sep 2026 | | 13,755 | (6) | 0 | (6) |
U.S. Secured Overnight Fin. Rate (SOFR) Index(4) | Annual | 3.5% | Annual | LCH | Sep 2027 | | 285,483 | 929 | 0 | 929 |
U.S. Secured Overnight Fin. Rate (SOFR) Index(4) | Annual | 3.5% | Annual | LCH | Sep 2031 | | 79,108 | 726 | 0 | 726 |
| 3.75% | Annual | U.S. Secured Overnight Fin. Rate (SOFR) Index(4) | Annual | LCH | Sep 2034 | | 5,116 | (64) | 0 | (64) |
U.S. Secured Overnight Fin. Rate (SOFR) Index(4) | Annual | 3.75% | Annual | LCH | Sep 2044 | | 4,489 | 94 | 0 | 94 |
| TOTAL INTEREST RATE SWAPS | | | | | | | | 1,679 | 0 | 1,679 |
(1)Swaps with LCH Clearnet Group (LCH) are centrally cleared swaps.
(2)Notional amount is stated in U.S. Dollars unless otherwise noted.
(3)Any premiums for centrally cleared swaps are recorded periodically throughout the term of the swap to variation margin and included in unrealized appreciation (depreciation).
(4)Represents floating rate.
Currency Abbreviations
| AUD | - | Australian dollar |
| CAD | - | Canadian dollar |
| EUR | - | European Monetary Unit |
| GBP | - | British pound sterling |
| USD | - | U.S. dollar |
Any values shown as $0 in the Schedule of Investments may reflect amounts less than $500.
Legend
| (a) | Amount is stated in United States dollars unless otherwise noted. |
| (c) | Security exempt from registration under Rule 144A of the Securities Act of 1933. These securities may be resold in transactions exempt from registration, normally to qualified institutional buyers. At the end of the period, the value of these securities amounted to $2,664,124,000 or 19.6% of net assets. |
| (d) | Non-income producing - Security is in default. |
| (e) | Coupon rates for floating and adjustable rate securities reflect the rates in effect at period end. |
| (f) | Security or a portion of the security purchased on a delayed delivery or when-issued basis. |
| (g) | Restricted securities (including private placements) - Investment in securities not registered under the Securities Act of 1933 (excluding 144A issues). At the end of the period, the value of restricted securities (excluding 144A issues) amounted to $6,047,000 or 0.0% of net assets. |
| (h) | Security initially issued at one coupon which converts to a higher coupon at a specified date. The rate shown is the rate at period end. |
| (i) | Coupon is indexed to a floating interest rate which may be multiplied by a specified factor and/or subject to caps or floors. |
| (j) | Security or a portion of the security was pledged to cover margin requirements for futures contracts. At period end, the value of securities pledged amounted to $24,205,000. |
| (k) | Security or a portion of the security has been segregated as collateral for mortgage-backed or asset-backed securities purchased on a delayed delivery or when-issued basis. At period end, the value of securities pledged amounted to $1,209,000. |
| (l) | Security or a portion of the security was pledged to cover margin requirements for centrally cleared swaps. At period end, the value of securities pledged amounted to $9,541,000. |
| (m) | Security or a portion of the security has been segregated as collateral for open options. At period end, the value of securities pledged amounted to $269,000. |
| (o) | Security or a portion of the security is on loan at period end. |
| (p) | Remaining maturities of bank loan obligations may be less than the stated maturities shown as a result of contractual or optional prepayments by the borrower. Such prepayments cannot be predicted with certainty. |
| (q) | The coupon rate will be determined upon settlement of the loan after period end. |
| (r) | Affiliated fund that is generally available only to investment companies and other accounts managed by Fidelity Investments. A complete unaudited schedule of portfolio holdings for each Fidelity Central Fund is filed with the SEC for the first and third quarters of each fiscal year on Form N-PORT and is available upon request or at the SEC's website at www.sec.gov. An unaudited holdings listing for the Fund, which presents direct holdings as well as the pro-rata share of securities and other investments held indirectly through its investment in underlying non-money market Fidelity Central Funds, is available at fidelity.com and/or institutional.fidelity.com, as applicable. In addition, each Fidelity Central Fund's financial statements are available on the SEC's website or upon request. |
| (s) | Security is perpetual in nature with no stated maturity date. |
| (t) | Affiliated fund that is generally available only to investment companies and other accounts managed by Fidelity Investments. The rate quoted is the annualized seven-day yield of the fund at period end. A complete unaudited listing of the fund's holdings as of its most recent quarter end is available upon request. In addition, each Fidelity Central Fund's financial statements are available on the SEC's website or upon request. |
| (u) | Investment made with cash collateral received from securities on loan. |
| Additional information on each restricted holding is as follows: |
| Security | Acquisition Date | Acquisition Cost ($) (000s) |
| Jonah Energy Parent LLC 12% 11/5/25 | 5/05/23 | 3,974 |
| | | |
| New Cotai LLC/New Cotai Capital Corp. | 9/11/20 | 11,111 |
| | | |
| Tricer Holdco SCA | 10/16/09 - 12/30/17 | 6,909 |
| | | |
| Tricer Holdco SCA Class A1 | 10/16/09 - 10/29/09 | 1,097 |
| | | |
| Tricer Holdco SCA Class A2 | 10/16/09 - 10/29/09 | 1,097 |
| | | |
| Tricer Holdco SCA Class A3 | 10/16/09 - 10/29/09 | 1,097 |
| | | |
| Tricer Holdco SCA Class A4 | 10/16/09 - 10/29/09 | 1,097 |
| | | |
| Tricer Holdco SCA Class A5 | 10/16/09 - 10/29/09 | 1,097 |
| | | |
| Tricer Holdco SCA Class A6 | 10/16/09 - 10/29/09 | 1,097 |
| | | |
| Tricer Holdco SCA Class A7 | 10/16/09 - 10/29/09 | 1,097 |
| | | |
| Tricer Holdco SCA Class A8 | 10/16/09 - 10/29/09 | 1,097 |
| | | |
| Tricer Holdco SCA Class A9 | 10/16/09 - 10/29/09 | 1,100 |
| | | |
Affiliated Central Funds
Fiscal year to date information regarding the Fund's investments in Fidelity Central Funds, including the ownership percentage, is presented below.
| Affiliate (Amounts in thousands) | Value, beginning of period ($) | Purchases ($) | Sales Proceeds ($) | Dividend Income ($) | Realized Gain (loss) ($) | Change in Unrealized appreciation (depreciation) ($) | Value, end of period ($) | % ownership, end of period |
| Fidelity Cash Central Fund 5.38% | 288,239 | 1,732,659 | 1,390,265 | 8,030 | 3 | (2) | 630,634 | 1.2% |
| Fidelity Emerging Markets Debt Central Fund | 2,017,290 | 108,069 | 33,000 | 58,719 | (1,084) | 19,138 | 2,110,413 | 99.7% |
| Fidelity Floating Rate Central Fund | 703,674 | 55,138 | 10,000 | 34,135 | 51 | (4,322) | 744,541 | 49.3% |
| Fidelity Securities Lending Cash Central Fund 5.38% | - | 430,573 | 430,565 | 8 | - | - | 8 | 0.0% |
| Total | 3,009,203 | 2,326,439 | 1,863,830 | 100,892 | (1,030) | 14,814 | 3,485,596 | |
| | | | | | | | | |
Amounts in the dividend income column in the above table include any capital gain distributions from underlying funds, which are presented in the corresponding line item in the Statement of Operations, if applicable.
Amounts in the dividend income column for Fidelity Securities Lending Cash Central Fund represents the income earned on investing cash collateral, less rebates paid to borrowers and any lending agent fees associated with the loan, plus any premium payments received for lending certain types of securities.
Amounts included in the purchases and sales proceeds columns may include in-kind transactions, if applicable.
Investment Valuation
The following is a summary of the inputs used, as of June 30, 2024, involving the Fund's assets and liabilities carried at fair value. The inputs or methodology used for valuing securities may not be an indication of the risk associated with investing in those securities. For more information on valuation inputs, and their aggregation into the levels used below, please refer to the Investment Valuation section in the accompanying Notes to Financial Statements.
| Valuation Inputs at Reporting Date: |
Description (Amounts in thousands) | Total ($) | Level 1 ($) | Level 2 ($) | Level 3 ($) |
Investments in Securities: | | | | |
|
| Equities: | | | | |
Communication Services | 63,558 | 63,558 | - | - |
Consumer Discretionary | 128,939 | 107,924 | 18,896 | 2,119 |
Consumer Staples | 19,283 | 18,641 | - | 642 |
Energy | 62,772 | 41,983 | - | 20,789 |
Financials | 132,359 | 132,357 | - | 2 |
Health Care | 4,882 | 4,882 | - | - |
Industrials | 138,976 | 138,974 | - | 2 |
Information Technology | 270,032 | 268,385 | - | 1,647 |
Materials | 41,312 | 41,312 | - | - |
Utilities | 57,791 | 57,789 | - | 2 |
|
| Corporate Bonds | 3,875,476 | - | 3,863,470 | 12,006 |
|
| U.S. Government and Government Agency Obligations | 3,086,902 | - | 3,086,902 | - |
|
| U.S. Government Agency - Mortgage Securities | 473,706 | - | 473,706 | - |
|
| Collateralized Mortgage Obligations | 177,484 | - | 177,484 | - |
|
| Commercial Mortgage Securities | 393,698 | - | 393,698 | - |
|
| Foreign Government and Government Agency Obligations | 483,656 | - | 483,656 | - |
|
| Bank Loan Obligations | 516,653 | - | 516,399 | 254 |
|
| Fixed-Income Funds | 2,854,954 | 2,854,954 | - | - |
|
| Preferred Securities | 316,967 | - | 316,967 | - |
|
| Money Market Funds | 630,642 | 630,642 | - | - |
|
| Purchased Swaptions | 6,281 | - | 6,281 | - |
| Total Investments in Securities: | 13,736,323 | 4,361,401 | 9,337,459 | 37,463 |
Derivative Instruments: Assets | | | | |
Futures Contracts | 9,509 | 9,509 | - | - |
Forward Foreign Currency Contracts | 473 | - | 473 | - |
Swaps | 1,749 | - | 1,749 | - |
| Total Assets | 11,731 | 9,509 | 2,222 | - |
| Liabilities | | | | |
Futures Contracts | (105) | (105) | - | - |
Forward Foreign Currency Contracts | (2,661) | - | (2,661) | - |
Swaps | (70) | - | (70) | - |
| Total Liabilities | (2,836) | (105) | (2,731) | - |
| Total Derivative Instruments: | 8,895 | 9,404 | (509) | - |
Other Financial Instruments: | | | | |
TBA Sale Commitments | (299,594) | - | (299,594) | - |
| Total Other Financial Instruments: | (299,594) | - | (299,594) | - |
Value of Derivative Instruments
The following table is a summary of the Fund's value of derivative instruments by primary risk exposure as of June 30, 2024. For additional information on derivative instruments, please refer to the Derivative Instruments section in the accompanying Notes to Financial Statements.
Primary Risk Exposure / Derivative Type | Value |
| (Amounts in thousands) | Asset ($) | Liability ($) |
| Foreign Exchange Risk | | |
Forward Foreign Currency Contracts (a) | 473 | (2,661) |
| Total Foreign Exchange Risk | 473 | (2,661) |
| Interest Rate Risk | | |
Futures Contracts (b) | 9,509 | (105) |
Purchased Swaptions (c) | 6,281 | 0 |
Swaps (d) | 1,749 | (70) |
| Total Interest Rate Risk | 17,539 | (175) |
| Total Value of Derivatives | 18,012 | (2,836) |
(a)Gross value is presented in the Statement of Assets and Liabilities in the unrealized appreciation/depreciation on forward foreign currency contracts line-items.
(b)Reflects gross cumulative appreciation (depreciation) on futures contracts as presented in the Schedule of Investments. In the Statement of Assets and Liabilities, the period end daily variation margin is included in receivable or payable for daily variation margin on futures contracts, and the net cumulative appreciation (depreciation) is included in Total accumulated earnings (loss).
(c)Gross value is presented in the Statement of Assets and Liabilities in the Investments in Securities at value line-item.
(d)For centrally cleared swaps, reflects gross cumulative appreciation (depreciation) as presented in the Schedule of Investments. In the Statement of Assets and Liabilities, the period end daily variation margin for centrally cleared swaps is included in receivable or payable for daily variation margin on centrally cleared swaps, and the net cumulative appreciation (depreciation) for centrally cleared swaps is included in Total accumulated earnings (loss).
Financial Statements (Unaudited)
| Statement of Assets and Liabilities |
| Amounts in thousands (except per-share amounts) | | | | June 30, 2024 (Unaudited) |
| | | | | |
| Assets | | | | |
| Investment in securities, at value (including securities loaned of $7) - See accompanying schedule: | | | | |
Unaffiliated issuers (cost $10,486,890) | $ | 10,250,727 | | |
Fidelity Central Funds (cost $3,853,004) | | 3,485,596 | | |
| | | | | |
| | | | | |
| Total Investment in Securities (cost $14,339,894) | | | $ | 13,736,323 |
| Segregated cash with brokers for derivative instruments | | | | 1,979 |
| Cash | | | | 17,039 |
| Foreign currency held at value (cost $19) | | | | 19 |
| Receivable for investments sold | | | | 4,255 |
| Receivable for TBA sale commitments | | | | 300,897 |
| Unrealized appreciation on forward foreign currency contracts | | | | 473 |
| Receivable for fund shares sold | | | | 8,935 |
| Dividends receivable | | | | 1,260 |
| Interest receivable | | | | 113,783 |
| Distributions receivable from Fidelity Central Funds | | | | 2,217 |
| Receivable for daily variation margin on centrally cleared swaps | | | | 340 |
| Other receivables | | | | 127 |
Total assets | | | | 14,187,647 |
| Liabilities | | | | |
| Payable for investments purchased | | | | |
Regular delivery | $ | 60,597 | | |
Delayed delivery | | 207,096 | | |
| TBA sale commitments, at value | | 299,594 | | |
| Unrealized depreciation on forward foreign currency contracts | | 2,661 | | |
| Payable for fund shares redeemed | | 16,386 | | |
| Distributions payable | | 4,161 | | |
| Accrued management fee | | 7,531 | | |
| Distribution and service plan fees payable | | 607 | | |
| Payable for daily variation margin on futures contracts | | 3,146 | | |
| Other payables and accrued expenses | | 231 | | |
| Collateral on securities loaned | | 8 | | |
| Total liabilities | | | | 602,018 |
| Net Assets | | | $ | 13,585,629 |
| Net Assets consist of: | | | | |
| Paid in capital | | | $ | 14,682,502 |
| Total accumulated earnings (loss) | | | | (1,096,873) |
| Net Assets | | | $ | 13,585,629 |
| | | | | |
| Net Asset Value and Maximum Offering Price | | | | |
| Class A : | | | | |
Net Asset Value and redemption price per share ($1,609,402 ÷ 142,667 shares)(a) | | | $ | 11.28 |
| Maximum offering price per share (100/96.00 of $11.28) | | | $ | 11.75 |
| Class M : | | | | |
Net Asset Value and redemption price per share ($608,135 ÷ 53,938 shares)(a) | | | $ | 11.27 |
| Maximum offering price per share (100/96.00 of $11.27) | | | $ | 11.74 |
| Class C : | | | | |
Net Asset Value and offering price per share ($171,757 ÷ 15,269 shares)(a) | | | $ | 11.25 |
| Fidelity Strategic Income Fund : | | | | |
Net Asset Value, offering price and redemption price per share ($5,291,265 ÷ 462,306 shares) | | | $ | 11.45 |
| Class I : | | | | |
Net Asset Value, offering price and redemption price per share ($4,781,705 ÷ 417,742 shares) | | | $ | 11.45 |
| Class Z : | | | | |
Net Asset Value, offering price and redemption price per share ($1,123,365 ÷ 98,095 shares) | | | $ | 11.45 |
(a)Redemption price per share is equal to net asset value less any applicable contingent deferred sales charge. |
| Statement of Operations |
| Amounts in thousands | | | | Six months ended June 30, 2024 (Unaudited) |
| Investment Income | | | | |
| Dividends | | | $ | 23,331 |
| Interest | | | | 232,297 |
| Income from Fidelity Central Funds (including $8 from security lending) | | | | 100,892 |
| Total income | | | | 356,520 |
| Expenses | | | | |
| Management fee | $ | 41,848 | | |
| Transfer agent fees | | 2,821 | | |
| Distribution and service plan fees | | 3,654 | | |
| Accounting fees | | 274 | | |
| Custodian fees and expenses | | 22 | | |
| Independent trustees' fees and expenses | | 18 | | |
| Registration fees | | 205 | | |
| Audit | | 62 | | |
| Legal | | 38 | | |
| Miscellaneous | | 80 | | |
| Total expenses before reductions | | 49,022 | | |
| Expense reductions | | (338) | | |
| Total expenses after reductions | | | | 48,684 |
| Net Investment income (loss) | | | | 307,836 |
| Realized and Unrealized Gain (Loss) | | | | |
| Net realized gain (loss) on: | | | | |
| Investment Securities: | | | | |
| Unaffiliated issuers | | 28,312 | | |
| Fidelity Central Funds | | (1,030) | | |
| Forward foreign currency contracts | | 26,890 | | |
| Foreign currency transactions | | (215) | | |
| Futures contracts | | (16,525) | | |
| Swaps | | 4,953 | | |
| Total net realized gain (loss) | | | | 42,385 |
| Change in net unrealized appreciation (depreciation) on: | | | | |
| Investment Securities: | | | | |
| Unaffiliated issuers | | (29,288) | | |
| Fidelity Central Funds | | 14,814 | | |
| Forward foreign currency contracts | | 10,392 | | |
| Assets and liabilities in foreign currencies | | (514) | | |
| Futures contracts | | (26,716) | | |
| Swaps | | 8,009 | | |
| TBA Sale commitments | | 5,216 | | |
| Total change in net unrealized appreciation (depreciation) | | | | (18,087) |
| Net gain (loss) | | | | 24,298 |
| Net increase (decrease) in net assets resulting from operations | | | $ | 332,134 |
| Statement of Changes in Net Assets |
| |
| Amount in thousands | | Six months ended June 30, 2024 (Unaudited) | | Year ended December 31, 2023 |
| Increase (Decrease) in Net Assets | | | | |
| Operations | | | | |
| Net investment income (loss) | $ | 307,836 | $ | 570,209 |
| Net realized gain (loss) | | 42,385 | | (336,674) |
| Change in net unrealized appreciation (depreciation) | | (18,087) | | 933,015 |
| Net increase (decrease) in net assets resulting from operations | | 332,134 | | 1,166,550 |
| Distributions to shareholders | | (280,015) | | (566,783) |
| | | | | |
| Share transactions - net increase (decrease) | | 241,790 | | (142,156) |
| Total increase (decrease) in net assets | | 293,909 | | 457,611 |
| | | | | |
| Net Assets | | | | |
| Beginning of period | | 13,291,720 | | 12,834,109 |
| End of period | $ | 13,585,629 | $ | 13,291,720 |
| | | | | |
| | | | | |
Financial Highlights
Fidelity Advisor® Strategic Income Fund Class A |
| |
| | Six months ended (Unaudited) June 30, 2024 | | Years ended December 31, 2023 | | 2022 | | 2021 | | 2020 | | 2019 |
Selected Per-Share Data | | | | | | | | | | | | |
| Net asset value, beginning of period | $ | 11.24 | $ | 10.73 | $ | 12.51 | $ | 12.61 | $ | 12.29 | $ | 11.56 |
| Income from Investment Operations | | | | | | | | | | | | |
Net investment income (loss) A,B | | .246 | | .456 | | .359 | | .303 | | .367 | | .412 |
| Net realized and unrealized gain (loss) | | .016 | | .507 | | (1.764) | | .143 | | .497 | | .818 |
| Total from investment operations | | .262 | | .963 | | (1.405) | | .446 | | .864 | | 1.230 |
| Distributions from net investment income | | (.222) | | (.453) | | (.361) | | (.305) | | (.386) | | (.390) |
| Distributions from net realized gain | | - | | - | | (.014) | | (.241) | | (.158) | | (.110) |
| Total distributions | | (.222) | | (.453) | | (.375) | | (.546) | | (.544) | | (.500) |
| Net asset value, end of period | $ | 11.28 | $ | 11.24 | $ | 10.73 | $ | 12.51 | $ | 12.61 | $ | 12.29 |
Total Return C,D,E | | | | 9.19% | | (11.29)% | | 3.58% | | 7.19% | | 10.74% |
Ratios to Average Net Assets B,F,G | | | | | | | | | | | | |
| Expenses before reductions | | .96% H | | .97% | | .98% | | .97% | | .97% | | .98% |
| Expenses net of fee waivers, if any | | | | .97% | | .97% | | .96% | | .97% | | .97% |
| Expenses net of all reductions | | .95% H | | .97% | | .97% | | .96% | | .97% | | .97% |
| Net investment income (loss) | | 4.41% H | | 4.19% | | 3.18% | | 2.39% | | 3.02% | | 3.38% |
| Supplemental Data | | | | | | | | | | | | |
| Net assets, end of period (in millions) | $ | 1,609 | $ | 1,619 | $ | 1,637 | $ | 2,072 | $ | 1,904 | $ | 1,918 |
Portfolio turnover rate I | | | | 72% | | 69% | | 94% | | 96% | | 138% J |
ACalculated based on average shares outstanding during the period.
BNet investment income (loss) is affected by the timing of the declaration of dividends by any underlying mutual funds or exchange-traded funds (ETFs). Net investment income (loss) of any mutual funds or ETFs is not included in the Fund's net investment income (loss) ratio.
CTotal returns for periods of less than one year are not annualized.
DTotal returns would have been lower if certain expenses had not been reduced during the applicable periods shown.
ETotal returns do not include the effect of the sales charges.
FFees and expenses of any underlying mutual funds or exchange-traded funds (ETFs) are not included in the Fund's expense ratio. The Fund indirectly bears its proportionate share of these expenses. For additional expense information related to investments in Fidelity Central Funds, please refer to the "Investments in Fidelity Central Funds" note found in the Notes to Financial Statements section of the most recent Annual or Semi-Annual report.
GExpense ratios reflect operating expenses of the class. Expenses before reductions do not reflect amounts reimbursed, waived, or reduced through arrangements with the investment adviser, brokerage services, or other offset arrangements, if applicable, and do not represent the amount paid by the class during periods when reimbursements, waivers or reductions occur.
HAnnualized.
IAmount does not include the portfolio activity of any underlying mutual funds or exchange-traded funds (ETFs).
JPortfolio turnover rate excludes securities received or delivered in-kind.
Fidelity Advisor® Strategic Income Fund Class M |
| |
| | Six months ended (Unaudited) June 30, 2024 | | Years ended December 31, 2023 | | 2022 | | 2021 | | 2020 | | 2019 |
Selected Per-Share Data | | | | | | | | | | | | |
| Net asset value, beginning of period | $ | 11.23 | $ | 10.72 | $ | 12.51 | $ | 12.61 | $ | 12.28 | $ | 11.55 |
| Income from Investment Operations | | | | | | | | | | | | |
Net investment income (loss) A,B | | .246 | | .457 | | .360 | | .304 | | .368 | | .412 |
| Net realized and unrealized gain (loss) | | .016 | | .507 | | (1.774) | | .142 | | .506 | | .818 |
| Total from investment operations | | .262 | | .964 | | (1.414) | | .446 | | .874 | | 1.230 |
| Distributions from net investment income | | (.222) | | (.454) | | (.362) | | (.305) | | (.386) | | (.390) |
| Distributions from net realized gain | | - | | - | | (.014) | | (.241) | | (.158) | | (.110) |
| Total distributions | | (.222) | | (.454) | | (.376) | | (.546) | | (.544) | | (.500) |
| Net asset value, end of period | $ | 11.27 | $ | 11.23 | $ | 10.72 | $ | 12.51 | $ | 12.61 | $ | 12.28 |
Total Return C,D,E | | | | 9.20% | | (11.37)% | | 3.59% | | 7.29% | | 10.75% |
Ratios to Average Net Assets B,F,G | | | | | | | | | | | | |
| Expenses before reductions | | .95% H | | .97% | | .97% | | .96% | | .96% | | .97% |
| Expenses net of fee waivers, if any | | | | .96% | | .97% | | .96% | | .96% | | .97% |
| Expenses net of all reductions | | .95% H | | .96% | | .97% | | .96% | | .96% | | .97% |
| Net investment income (loss) | | 4.41% H | | 4.20% | | 3.19% | | 2.39% | | 3.03% | | 3.39% |
| Supplemental Data | | | | | | | | | | | | |
| Net assets, end of period (in millions) | $ | 608 | $ | 616 | $ | 630 | $ | 797 | $ | 792 | $ | 806 |
Portfolio turnover rate I | | | | 72% | | 69% | | 94% | | 96% | | 138% J |
ACalculated based on average shares outstanding during the period.
BNet investment income (loss) is affected by the timing of the declaration of dividends by any underlying mutual funds or exchange-traded funds (ETFs). Net investment income (loss) of any mutual funds or ETFs is not included in the Fund's net investment income (loss) ratio.
CTotal returns for periods of less than one year are not annualized.
DTotal returns would have been lower if certain expenses had not been reduced during the applicable periods shown.
ETotal returns do not include the effect of the sales charges.
FFees and expenses of any underlying mutual funds or exchange-traded funds (ETFs) are not included in the Fund's expense ratio. The Fund indirectly bears its proportionate share of these expenses. For additional expense information related to investments in Fidelity Central Funds, please refer to the "Investments in Fidelity Central Funds" note found in the Notes to Financial Statements section of the most recent Annual or Semi-Annual report.
GExpense ratios reflect operating expenses of the class. Expenses before reductions do not reflect amounts reimbursed, waived, or reduced through arrangements with the investment adviser, brokerage services, or other offset arrangements, if applicable, and do not represent the amount paid by the class during periods when reimbursements, waivers or reductions occur.
HAnnualized.
IAmount does not include the portfolio activity of any underlying mutual funds or exchange-traded funds (ETFs).
JPortfolio turnover rate excludes securities received or delivered in-kind.
Fidelity Advisor® Strategic Income Fund Class C |
| |
| | Six months ended (Unaudited) June 30, 2024 | | Years ended December 31, 2023 | | 2022 | | 2021 | | 2020 | | 2019 |
Selected Per-Share Data | | | | | | | | | | | | |
| Net asset value, beginning of period | $ | 11.21 | $ | 10.70 | $ | 12.48 | $ | 12.58 | $ | 12.26 | $ | 11.53 |
| Income from Investment Operations | | | | | | | | | | | | |
Net investment income (loss) A,B | | .203 | | .373 | | .275 | | .208 | | .276 | | .320 |
| Net realized and unrealized gain (loss) | | .017 | | .507 | | (1.765) | | .142 | | .496 | | .818 |
| Total from investment operations | | .220 | | .880 | | (1.490) | | .350 | | .772 | | 1.138 |
| Distributions from net investment income | | (.180) | | (.370) | | (.276) | | (.209) | | (.294) | | (.298) |
| Distributions from net realized gain | | - | | - | | (.014) | | (.241) | | (.158) | | (.110) |
| Total distributions | | (.180) | | (.370) | | (.290) | | (.450) | | (.452) | | (.408) |
| Net asset value, end of period | $ | 11.25 | $ | 11.21 | $ | 10.70 | $ | 12.48 | $ | 12.58 | $ | 12.26 |
Total Return C,D,E | | | | 8.39% | | (11.99)% | | 2.81% | | 6.41% | | 9.94% |
Ratios to Average Net Assets B,F,G | | | | | | | | | | | | |
| Expenses before reductions | | 1.71% H | | 1.73% | | 1.73% | | 1.72% | | 1.72% | | 1.72% |
| Expenses net of fee waivers, if any | | | | 1.73% | | 1.73% | | 1.72% | | 1.72% | | 1.72% |
| Expenses net of all reductions | | 1.71% H | | 1.73% | | 1.73% | | 1.72% | | 1.72% | | 1.72% |
| Net investment income (loss) | | 3.66% H | | 3.43% | | 2.43% | | 1.64% | | 2.27% | | 2.63% |
| Supplemental Data | | | | | | | | | | | | |
| Net assets, end of period (in millions) | $ | 172 | $ | 184 | $ | 222 | $ | 354 | $ | 572 | $ | 678 |
Portfolio turnover rate I | | | | 72% | | 69% | | 94% | | 96% | | 138% J |
ACalculated based on average shares outstanding during the period.
BNet investment income (loss) is affected by the timing of the declaration of dividends by any underlying mutual funds or exchange-traded funds (ETFs). Net investment income (loss) of any mutual funds or ETFs is not included in the Fund's net investment income (loss) ratio.
CTotal returns for periods of less than one year are not annualized.
DTotal returns would have been lower if certain expenses had not been reduced during the applicable periods shown.
ETotal returns do not include the effect of the contingent deferred sales charge.
FFees and expenses of any underlying mutual funds or exchange-traded funds (ETFs) are not included in the Fund's expense ratio. The Fund indirectly bears its proportionate share of these expenses. For additional expense information related to investments in Fidelity Central Funds, please refer to the "Investments in Fidelity Central Funds" note found in the Notes to Financial Statements section of the most recent Annual or Semi-Annual report.
GExpense ratios reflect operating expenses of the class. Expenses before reductions do not reflect amounts reimbursed, waived, or reduced through arrangements with the investment adviser, brokerage services, or other offset arrangements, if applicable, and do not represent the amount paid by the class during periods when reimbursements, waivers or reductions occur.
HAnnualized.
IAmount does not include the portfolio activity of any underlying mutual funds or exchange-traded funds (ETFs).
JPortfolio turnover rate excludes securities received or delivered in-kind.
Fidelity® Strategic Income Fund |
| |
| | Six months ended (Unaudited) June 30, 2024 | | Years ended December 31, 2023 | | 2022 | | 2021 | | 2020 | | 2019 |
Selected Per-Share Data | | | | | | | | | | | | |
| Net asset value, beginning of period | $ | 11.40 | $ | 10.88 | $ | 12.70 | $ | 12.79 | $ | 12.46 | $ | 11.72 |
| Income from Investment Operations | | | | | | | | | | | | |
Net investment income (loss) A,B | | .266 | | .495 | | .399 | | .346 | | .410 | | .454 |
| Net realized and unrealized gain (loss) | | .026 | | .517 | | (1.805) | | .153 | | .504 | | .827 |
| Total from investment operations | | .292 | | 1.012 | | (1.406) | | .499 | | .914 | | 1.281 |
| Distributions from net investment income | | (.242) | | (.492) | | (.400) | | (.348) | | (.426) | | (.431) |
| Distributions from net realized gain | | - | | - | | (.014) | | (.241) | | (.158) | | (.110) |
| Total distributions | | (.242) | | (.492) | | (.414) | | (.589) | | (.584) | | (.541) |
| Net asset value, end of period | $ | 11.45 | $ | 11.40 | $ | 10.88 | $ | 12.70 | $ | 12.79 | $ | 12.46 |
Total Return C,D | | | | 9.54% | | (11.14)% | | 3.96% | | 7.53% | | 11.04% |
Ratios to Average Net Assets B,E,F | | | | | | | | | | | | |
| Expenses before reductions | | .66% G | | .68% | | .68% | | .66% | | .67% | | .68% |
| Expenses net of fee waivers, if any | | | | .67% | | .68% | | .66% | | .67% | | .68% |
| Expenses net of all reductions | | .66% G | | .67% | | .68% | | .66% | | .67% | | .68% |
| Net investment income (loss) | | 4.71% G | | 4.49% | | 3.48% | | 2.69% | | 3.32% | | 3.68% |
| Supplemental Data | | | | | | | | | | | | |
| Net assets, end of period (in millions) | $ | 5,291 | $ | 5,417 | $ | 5,457 | $ | 7,245 | $ | 6,823 | $ | 8,139 |
Portfolio turnover rate H | | | | 72% | | 69% | | 94% | | 96% | | 138% I |
ACalculated based on average shares outstanding during the period.
BNet investment income (loss) is affected by the timing of the declaration of dividends by any underlying mutual funds or exchange-traded funds (ETFs). Net investment income (loss) of any mutual funds or ETFs is not included in the Fund's net investment income (loss) ratio.
CTotal returns for periods of less than one year are not annualized.
DTotal returns would have been lower if certain expenses had not been reduced during the applicable periods shown.
EFees and expenses of any underlying mutual funds or exchange-traded funds (ETFs) are not included in the Fund's expense ratio. The Fund indirectly bears its proportionate share of these expenses. For additional expense information related to investments in Fidelity Central Funds, please refer to the "Investments in Fidelity Central Funds" note found in the Notes to Financial Statements section of the most recent Annual or Semi-Annual report.
FExpense ratios reflect operating expenses of the class. Expenses before reductions do not reflect amounts reimbursed, waived, or reduced through arrangements with the investment adviser, brokerage services, or other offset arrangements, if applicable, and do not represent the amount paid by the class during periods when reimbursements, waivers or reductions occur.
GAnnualized.
HAmount does not include the portfolio activity of any underlying mutual funds or exchange-traded funds (ETFs).
IPortfolio turnover rate excludes securities received or delivered in-kind.
Fidelity Advisor® Strategic Income Fund Class I |
| |
| | Six months ended (Unaudited) June 30, 2024 | | Years ended December 31, 2023 | | 2022 | | 2021 | | 2020 | | 2019 |
Selected Per-Share Data | | | | | | | | | | | | |
| Net asset value, beginning of period | $ | 11.40 | $ | 10.88 | $ | 12.70 | $ | 12.79 | $ | 12.46 | $ | 11.72 |
| Income from Investment Operations | | | | | | | | | | | | |
Net investment income (loss) A,B | | .263 | | .490 | | .394 | | .340 | | .404 | | .449 |
| Net realized and unrealized gain (loss) | | .027 | | .518 | | (1.805) | | .153 | | .505 | | .827 |
| Total from investment operations | | .290 | | 1.008 | | (1.411) | | .493 | | .909 | | 1.276 |
| Distributions from net investment income | | (.240) | | (.488) | | (.395) | | (.342) | | (.421) | | (.426) |
| Distributions from net realized gain | | - | | - | | (.014) | | (.241) | | (.158) | | (.110) |
| Total distributions | | (.240) | | (.488) | | (.409) | | (.583) | | (.579) | | (.536) |
| Net asset value, end of period | $ | 11.45 | $ | 11.40 | $ | 10.88 | $ | 12.70 | $ | 12.79 | $ | 12.46 |
Total Return C,D | | | | 9.49% | | (11.18)% | | 3.91% | | 7.48% | | 11.00% |
Ratios to Average Net Assets B,E,F | | | | | | | | | | | | |
| Expenses before reductions | | .71% G | | .72% | | .72% | | .71% | | .71% | | .72% |
| Expenses net of fee waivers, if any | | | | .72% | | .72% | | .71% | | .71% | | .72% |
| Expenses net of all reductions | | .71% G | | .72% | | .72% | | .71% | | .71% | | .72% |
| Net investment income (loss) | | 4.66% G | | 4.44% | | 3.44% | | 2.64% | | 3.28% | | 3.64% |
| Supplemental Data | | | | | | | | | | | | |
| Net assets, end of period (in millions) | $ | 4,782 | $ | 4,401 | $ | 3,986 | $ | 5,460 | $ | 4,890 | $ | 4,899 |
Portfolio turnover rate H | | | | 72% | | 69% | | 94% | | 96% | | 138% I |
ACalculated based on average shares outstanding during the period.
BNet investment income (loss) is affected by the timing of the declaration of dividends by any underlying mutual funds or exchange-traded funds (ETFs). Net investment income (loss) of any mutual funds or ETFs is not included in the Fund's net investment income (loss) ratio.
CTotal returns for periods of less than one year are not annualized.
DTotal returns would have been lower if certain expenses had not been reduced during the applicable periods shown.
EFees and expenses of any underlying mutual funds or exchange-traded funds (ETFs) are not included in the Fund's expense ratio. The Fund indirectly bears its proportionate share of these expenses. For additional expense information related to investments in Fidelity Central Funds, please refer to the "Investments in Fidelity Central Funds" note found in the Notes to Financial Statements section of the most recent Annual or Semi-Annual report.
FExpense ratios reflect operating expenses of the class. Expenses before reductions do not reflect amounts reimbursed, waived, or reduced through arrangements with the investment adviser, brokerage services, or other offset arrangements, if applicable, and do not represent the amount paid by the class during periods when reimbursements, waivers or reductions occur.
GAnnualized.
HAmount does not include the portfolio activity of any underlying mutual funds or exchange-traded funds (ETFs).
IPortfolio turnover rate excludes securities received or delivered in-kind.
Fidelity Advisor® Strategic Income Fund Class Z |
| |
| | Six months ended (Unaudited) June 30, 2024 | | Years ended December 31, 2023 | | 2022 | | 2021 | | 2020 | | 2019 |
Selected Per-Share Data | | | | | | | | | | | | |
| Net asset value, beginning of period | $ | 11.41 | $ | 10.89 | $ | 12.70 | $ | 12.80 | $ | 12.47 | $ | 11.72 |
| Income from Investment Operations | | | | | | | | | | | | |
Net investment income (loss) A,B | | .269 | | .502 | | .405 | | .352 | | .417 | | .461 |
| Net realized and unrealized gain (loss) | | .017 | | .517 | | (1.794) | | .143 | | .504 | | .837 |
| Total from investment operations | | .286 | | 1.019 | | (1.389) | | .495 | | .921 | | 1.298 |
| Distributions from net investment income | | (.246) | | (.499) | | (.407) | | (.354) | | (.433) | | (.438) |
| Distributions from net realized gain | | - | | - | | (.014) | | (.241) | | (.158) | | (.110) |
| Total distributions | | (.246) | | (.499) | | (.421) | | (.595) | | (.591) | | (.548) |
| Net asset value, end of period | $ | 11.45 | $ | 11.41 | $ | 10.89 | $ | 12.70 | $ | 12.80 | $ | 12.47 |
Total Return C,D | | | | 9.60% | | (11.00)% | | 3.92% | | 7.59% | | 11.19% |
Ratios to Average Net Assets B,E,F | | | | | | | | | | | | |
| Expenses before reductions | | .61% G | | .62% | | .62% | | .61% | | .61% | | .62% |
| Expenses net of fee waivers, if any | | | | .61% | | .62% | | .61% | | .61% | | .62% |
| Expenses net of all reductions | | .60% G | | .61% | | .62% | | .61% | | .61% | | .62% |
| Net investment income (loss) | | 4.76% G | | 4.55% | | 3.54% | | 2.74% | | 3.38% | | 3.74% |
| Supplemental Data | | | | | | | | | | | | |
| Net assets, end of period (in millions) | $ | 1,123 | $ | 1,054 | $ | 902 | $ | 1,058 | $ | 662 | $ | 587 |
Portfolio turnover rate H | | | | 72% | | 69% | | 94% | | 96% | | 138% I |
ACalculated based on average shares outstanding during the period.
BNet investment income (loss) is affected by the timing of the declaration of dividends by any underlying mutual funds or exchange-traded funds (ETFs). Net investment income (loss) of any mutual funds or ETFs is not included in the Fund's net investment income (loss) ratio.
CTotal returns for periods of less than one year are not annualized.
DTotal returns would have been lower if certain expenses had not been reduced during the applicable periods shown.
EFees and expenses of any underlying mutual funds or exchange-traded funds (ETFs) are not included in the Fund's expense ratio. The Fund indirectly bears its proportionate share of these expenses. For additional expense information related to investments in Fidelity Central Funds, please refer to the "Investments in Fidelity Central Funds" note found in the Notes to Financial Statements section of the most recent Annual or Semi-Annual report.
FExpense ratios reflect operating expenses of the class. Expenses before reductions do not reflect amounts reimbursed, waived, or reduced through arrangements with the investment adviser, brokerage services, or other offset arrangements, if applicable, and do not represent the amount paid by the class during periods when reimbursements, waivers or reductions occur.
GAnnualized.
HAmount does not include the portfolio activity of any underlying mutual funds or exchange-traded funds (ETFs).
IPortfolio turnover rate excludes securities received or delivered in-kind.
Notes to Financial Statements
(Unaudited)For the period ended June 30, 2024
(Amounts in thousands except percentages)
1. Organization.
Fidelity Advisor Strategic Income Fund (the Fund) is a fund of Fidelity Advisor Series II (the Trust) and is authorized to issue an unlimited number of shares. The Trust is registered under the Investment Company Act of 1940, as amended (the 1940 Act), as an open-end management investment company organized as a Massachusetts business trust. The Fund offers Class A, Class M, Class C, Fidelity Strategic Income Fund, Class I and Class Z shares, each of which has equal rights as to assets and voting privileges. Class A, Class M, Class C, Class I and Class Z are Fidelity Advisor classes. Each class has exclusive voting rights with respect to matters that affect that class. Class C shares will automatically convert to Class A shares after a holding period of eight years from the initial date of purchase, with certain exceptions. The Fund's investments in emerging markets can be subject to social, economic, regulatory, and political uncertainties and can be extremely volatile.
2. Investments in Fidelity Central Funds.
Funds may invest in Fidelity Central Funds, which are open-end investment companies generally available only to other investment companies and accounts managed by the investment adviser and its affiliates. The Schedule of Investments lists any Fidelity Central Funds held as an investment as of period end, but does not include the underlying holdings of each Fidelity Central Fund. An investing fund indirectly bears its proportionate share of the expenses of the underlying Fidelity Central Funds.
Based on its investment objective, each Fidelity Central Fund may invest or participate in various investment vehicles or strategies that are similar to those of the investing fund. These strategies are consistent with the investment objectives of the investing fund and may involve certain economic risks which may cause a decline in value of each of the Fidelity Central Funds and thus a decline in the value of the investing fund.
| Fidelity Central Fund | Investment Manager | Investment Objective | Investment Practices | Expense RatioA |
| Fidelity Emerging Markets Debt Central Fund | Fidelity Management & Research Company LLC (FMR) | Seeks high total return by normally investing in debt securities of issuers in emerging markets and other debt investments that are tied economically to emerging markets. | Delayed Delivery & When Issued Securities Foreign Securities Futures Restricted Securities | .02% |
| Fidelity Floating Rate Central Fund | Fidelity Management & Research Company LLC (FMR) | Seeks a high level of income by normally investing in floating rate loans and other floating rate securities. | Loans & Direct Debt Instruments Restricted Securities | .01% |
| Fidelity Money Market Central Funds | Fidelity Management & Research Company LLC (FMR) | Each fund seeks to obtain a high level of current income consistent with the preservation of capital and liquidity. | Short-term Investments | Less than .005% |
A Expenses expressed as a percentage of average net assets and are as of each underlying Central Fund's most recent annual or semi-annual shareholder report.
An unaudited holdings listing for the investing fund, which presents direct holdings as well as the pro-rata share of any securities and other investments held indirectly through its investment in underlying non-money market Fidelity Central Funds, is available at fidelity.com and/or institutional.fidelity.com, as applicable. A complete unaudited list of holdings for each Fidelity Central Fund is available upon request or at the Securities and Exchange Commission website at www.sec.gov. In addition, the financial statements of the Fidelity Central Funds which contain the significant accounting policies (including investment valuation policies) of those funds, and are not covered by the Report of Independent Registered Public Accounting Firm, are available on the Securities and Exchange Commission website or upon request.
3.Significant Accounting Policies.
The Fund is an investment company and applies the accounting and reporting guidance of the Financial Accounting Standards Board (FASB) Accounting Standards Codification Topic 946 Financial Services - Investment Companies. The financial statements have been prepared in conformity with accounting principles generally accepted in the United States of America (GAAP), which require management to make certain estimates and assumptions at the date of the financial statements. Actual results could differ from those estimates. Subsequent events, if any, through the date that the financial statements were issued have been evaluated in the preparation of the financial statements. The Fund's Schedule of Investments lists any underlying mutual funds or exchange-traded funds (ETFs) but does not include the underlying holdings of these funds. The following summarizes the significant accounting policies of the Fund:
Investment Valuation. Investments are valued as of 4:00 p.m. Eastern time on the last calendar day of the period. The Board of Trustees (the Board) has designated the Fund's investment adviser as the valuation designee responsible for the fair valuation function and performing fair value determinations as needed. The investment adviser has established a Fair Value Committee (the Committee) to carry out the day-to-day fair valuation responsibilities and has adopted policies and procedures to govern the fair valuation process and the activities of the Committee. In accordance with these fair valuation policies and procedures, which have been approved by the Board, the Fund attempts to obtain prices from one or more third party pricing services or brokers to value its investments. When current market prices, quotations or currency exchange rates are not readily available or reliable, investments will be fair valued in good faith by the Committee, in accordance with the policies and procedures. Factors used in determining fair value vary by investment type and may include market or investment specific events, transaction data, estimated cash flows, and market observations of comparable investments. The frequency that the fair valuation procedures are used cannot be predicted and they may be utilized to a significant extent. The Committee manages the Fund's fair valuation practices and maintains the fair valuation policies and procedures. The Fund's investment adviser reports to the Board information regarding the fair valuation process and related material matters.
The Fund categorizes the inputs to valuation techniques used to value its investments into a disclosure hierarchy consisting of three levels as shown below:
Level 1 - unadjusted quoted prices in active markets for identical investments
Level 2 - other significant observable inputs (including quoted prices for similar investments, interest rates, prepayment speeds, etc.)
Level 3 - unobservable inputs (including the Fund's own assumptions based on the best information available)
Valuation techniques used to value the Fund's investments by major category are as follows:
Debt securities, including restricted securities, are valued based on evaluated prices received from third party pricing services or from brokers who make markets in such securities. Corporate bonds, bank loan obligations, foreign government and government agency obligations, preferred securities and U.S. government and government agency obligations are valued by pricing services who utilize matrix pricing which considers yield or price of bonds of comparable quality, coupon, maturity and type or by broker-supplied prices. Collateralized mortgage obligations, commercial mortgage securities and U.S. government agency mortgage securities, are valued by pricing services who utilize matrix pricing which considers prepayment speed assumptions, attributes of the collateral, yield or price of bonds of comparable quality, coupon, maturity and type or by broker-supplied prices. Swaps are marked-to-market daily based on valuations from third party pricing services, registered derivatives clearing organizations (clearinghouses) or broker-supplied valuations. These pricing sources may utilize inputs such as interest rate curves, credit spread curves, default possibilities and recovery rates. When independent prices are unavailable or unreliable, debt securities and swaps may be valued utilizing pricing methodologies which consider similar factors that would be used by third party pricing services. For foreign debt securities, when significant market or security specific events arise, valuations may be determined in good faith in accordance with procedures adopted by the Board. Debt securities and swaps are generally categorized as Level 2 in the hierarchy but may be Level 3 depending on the circumstances. The Fund invests a significant portion of its assets in below investment grade securities. The value of these securities can be more volatile due to changes in the credit quality of the issuer and is sensitive to changes in economic, market and regulatory conditions.
Equity securities, including restricted securities, for which market quotations are readily available, are valued at the last reported sale price or official closing price as reported by a third party pricing service on the primary market or exchange on which they are traded and are categorized as Level 1 in the hierarchy. In the event there were no sales during the day or closing prices are not available, securities are valued at the last quoted bid price or may be valued using the last available price and are generally categorized as Level 2 in the hierarchy. For foreign equity securities, when market or security specific events arise, comparisons to the valuation of American Depositary Receipts (ADRs), futures contracts, Exchange-Traded Funds (ETFs) and certain indexes as well as quoted prices for similar securities may be used and would be categorized as Level 2 in the hierarchy. For equity securities, including restricted securities, where observable inputs are limited, assumptions about market activity and risk are used and these securities may be categorized as Level 3 in the hierarchy.
The U.S. dollar value of forward foreign currency contracts is determined using currency exchange rates supplied by a pricing service and are categorized as Level 2 in the hierarchy. Futures contracts are valued at the settlement price established each day by the board of trade or exchange on which they are traded and are categorized as Level 1 in the hierarchy. Options traded over-the-counter are valued using service or broker-supplied valuations and are categorized as Level 2 in the hierarchy. Investments in open-end mutual funds, including the Fidelity Central Funds, are valued at their closing net asset value (NAV) each business day and are categorized as Level 1 in the hierarchy.
Changes in valuation techniques may result in transfers in or out of an assigned level within the disclosure hierarchy. The aggregate value of investments by input level as of June 30, 2024 is included at the end of the Fund's Schedule of Investments.
Foreign Currency. Foreign-denominated assets, including investment securities, and liabilities are translated into U.S. dollars at the exchange rates at period end. Purchases and sales of investment securities, income and dividends received, and expenses denominated in foreign currencies are translated into U.S. dollars at the exchange rate in effect on the transaction date.
The effects of exchange rate fluctuations on investments are included with the net realized and unrealized gain (loss) on investment securities. Other foreign currency transactions resulting in realized and unrealized gain (loss) are disclosed separately.
Realized gains and losses on foreign currency transactions arise from the disposition of foreign currency, realized changes in the value of foreign currency between the trade and settlement dates on security transactions, and the difference between the amounts of dividends, interest and foreign withholding taxes recorded on transaction date and the U.S. dollar equivalent of the amounts actually received or paid. Unrealized gains and losses on assets and liabilities in foreign currencies arise from changes in the value of foreign currency, and from assets and liabilities denominated in foreign currencies, other than investments, which are held at period end.
Investment Transactions and Income. For financial reporting purposes, the Fund's investment holdings and NAV include trades executed through the end of the last business day of the period. The NAV per share for processing shareholder transactions is calculated as of the close of business of the New York Stock Exchange (NYSE), normally 4:00 p.m. Eastern time and includes trades executed through the end of the prior business day. Gains and losses on securities sold are determined on the basis of identified cost. Commissions paid to certain brokers with whom the investment adviser, or its affiliates, places trades on behalf of a fund include an amount in addition to trade execution, which may be rebated back to a fund. Any such rebates are included in net realized gain (loss) on investments in the Statement of Operations. Dividend income is recorded on the ex-dividend date, except for certain dividends from foreign securities where the ex-dividend date may have passed, which are recorded as soon as the Fund is informed of the ex-dividend date. Non-cash dividends included in dividend income, if any, are recorded at the fair market value of the securities received. Income and capital gain distributions from Fidelity Central Funds, if any, are recorded on the ex-dividend date. Certain distributions received by the Fund represent a return of capital or capital gain. The Fund determines the components of these distributions subsequent to the ex-dividend date, based upon receipt of tax filings or other correspondence relating to the underlying investment. These distributions are recorded as a reduction of cost of investments and/or as a realized gain. Interest income is accrued as earned and includes coupon interest and amortization of premium and accretion of discount on debt securities as applicable. Paid in Kind (PIK) income is recorded at the fair market value of the securities received. Investment income is recorded net of foreign taxes withheld where recovery of such taxes is uncertain. Debt obligations may be placed on non-accrual status and related interest income may be reduced by ceasing current accruals and writing off interest receivables when the collection of all or a portion of interest has become doubtful based on consistently applied procedures. A debt obligation is removed from non-accrual status when the issuer resumes interest payments or when collectability of interest is reasonably assured. Funds may file withholding tax reclaims in certain jurisdictions to recover a portion of amounts previously withheld. Any withholding tax reclaims income is included in the Statement of Operations in dividends. Any receivables for withholding tax reclaims are included in the Statement of Assets and Liabilities in dividends receivable.
Class Allocations and Expenses. Investment income, realized and unrealized capital gains and losses, common expenses of a fund, and certain fund-level expense reductions, if any, are allocated daily on a pro-rata basis to each class based on the relative net assets of each class to the total net assets of a fund. Each class differs with respect to transfer agent and distribution and service plan fees incurred, as applicable. Certain expense reductions may also differ by class, if applicable. For the reporting period, the allocated portion of income and expenses to each class as a percent of its average net assets may vary due to the timing of recording these transactions in relation to fluctuating net assets of the classes. Expenses directly attributable to a fund are charged to that fund. Expenses attributable to more than one fund are allocated among the respective funds on the basis of relative net assets or other appropriate methods. Expenses included in the accompanying financial statements reflect the expenses of that fund and do not include any expenses associated with any underlying mutual funds or exchange-traded funds (ETFs). Although not included in a fund's expenses, a fund indirectly bears its proportionate share of these expenses through the net asset value of each underlying mutual fund or exchange-traded fund (ETF). Expense estimates are accrued in the period to which they relate and adjustments are made when actual amounts are known.
Deferred Trustee Compensation. Under a Deferred Compensation Plan (the Plan) for certain Funds, certain independent Trustees have elected to defer receipt of a portion of their annual compensation. Deferred amounts are invested in affiliated mutual funds, are marked-to-market and remain in a fund until distributed in accordance with the Plan. The investment of deferred amounts and the offsetting payable to the Trustees presented below are included in the accompanying Statement of Assets and Liabilities in other receivables and other payables and accrued expenses, as applicable.
| Fidelity Advisor Strategic Income Fund | $125 |
Income Tax Information and Distributions to Shareholders. Each year, the Fund intends to qualify as a regulated investment company under Subchapter M of the Internal Revenue Code, including distributing substantially all of its taxable income and realized gains. As a result, no provision for U.S. Federal income taxes is required. The Fund files a U.S. federal tax return, in addition to state and local tax returns as required. The Fund's federal income tax returns are subject to examination by the Internal Revenue Service (IRS) for a period of three fiscal years after they are filed. State and local tax returns may be subject to examination for an additional fiscal year depending on the jurisdiction. Foreign taxes are provided for based on the Fund's understanding of the tax rules and rates that exist in the foreign markets in which it invests.
Distributions are declared and recorded daily and paid monthly from net investment income. Distributions from realized gains, if any, are declared and recorded on the ex-dividend date. Income and capital gain distributions are declared separately for each class. Income and capital gain distributions are determined in accordance with income tax regulations, which may differ from GAAP.
Capital accounts within the financial statements are adjusted for permanent book-tax differences. These adjustments have no impact on net assets or the results of operations. Capital accounts are not adjusted for temporary book-tax differences which will reverse in a subsequent period.
Book-tax differences are primarily due to futures contracts, foreign currency transactions, market discount, swap agreements, partnerships, capital loss carryforwards and losses deferred due to futures contracts and wash sales.
As of period end, the cost and unrealized appreciation (depreciation) in securities, and derivatives if applicable, for federal income tax purposes were as follows:
| Gross unrealized appreciation | $480,165 |
| Gross unrealized depreciation | (1,058,163) |
| Net unrealized appreciation (depreciation) | $(577,998) |
| Tax cost | $14,324,518 |
Capital loss carryforwards are only available to offset future capital gains of the Fund to the extent provided by regulations and may be limited. The capital loss carryforward information presented below, including any applicable limitation, is estimated as of prior fiscal period end and is subject to adjustment.
Short-term | $(241,468) |
Long-term | (222,948) |
| Total capital loss carryforward | $(464,416) |
Delayed Delivery Transactions and When-Issued Securities. During the period, certain Funds transacted in securities on a delayed delivery or when-issued basis. Payment and delivery may take place after the customary settlement period for that security. The price of the underlying securities and the date when the securities will be delivered and paid for are fixed at the time the transaction is negotiated. Securities purchased on a delayed delivery or when-issued basis are identified as such in the Schedule of Investments. Compensation for interest forgone in the purchase of a delayed delivery or when-issued debt security may be received. With respect to purchase commitments, each applicable Fund identifies securities as segregated in its records with a value at least equal to the amount of the commitment. Payables and receivables associated with the purchases and sales of delayed delivery securities having the same coupon, settlement date and broker are offset. Delayed delivery or when-issued securities that have been purchased from and sold to different brokers are reflected as both payables and receivables in the Statement of Assets and Liabilities under the caption "Delayed delivery", as applicable. Losses may arise due to changes in the value of the underlying securities or if the counterparty does not perform under the contract's terms, or if the issuer does not issue the securities due to political, economic, or other factors.
To-Be-Announced (TBA) Securities and Mortgage Dollar Rolls. TBA securities involve buying or selling mortgage-backed securities (MBS) on a forward commitment basis. A TBA transaction typically does not designate the actual security to be delivered and only includes an approximate principal amount; however delivered securities must meet specified terms defined by industry guidelines, including issuer, rate and current principal amount outstanding on underlying mortgage pools. Funds may enter into a TBA transaction with the intent to take possession of or deliver the underlying MBS, or a fund may elect to extend the settlement by entering into either a mortgage or reverse mortgage dollar roll. Mortgage dollar rolls are transactions where a fund sells TBA securities and simultaneously agrees to repurchase MBS on a later date at a lower price and with the same counterparty. Reverse mortgage dollar rolls involve the purchase and simultaneous agreement to sell TBA securities on a later date at a lower price. Transactions in mortgage dollar rolls and reverse mortgage dollar rolls are accounted for as purchases and sales and may result in an increase to a fund's portfolio turnover rate.
Purchases and sales of TBA securities involve risks similar to those discussed above for delayed delivery and when-issued securities. Also, if the counterparty in a mortgage dollar roll or a reverse mortgage dollar roll transaction files for bankruptcy or becomes insolvent, a fund's right to repurchase or sell securities may be limited. Additionally, when a fund sells TBA securities without already owning or having the right to obtain the deliverable securities (an uncovered forward commitment to sell), it incurs a risk of loss because it could have to purchase the securities at a price that is higher than the price at which it sold them. A fund may be unable to purchase the deliverable securities if the corresponding market is illiquid.
TBA securities subject to a forward commitment to sell at period end are included at the end of the Schedule of Investments under the caption "TBA Sale Commitments." The value of these commitments and proceeds to be received at contractual settlement date are reflected in the Statement of Assets and Liabilities as "TBA sale commitments, at value" and "Receivable for TBA sale commitments," respectively. If the TBA sale commitment is closed through the acquisition of an offsetting TBA purchase commitment, a fund realizes a gain or loss. If a fund delivers securities under the commitment, a fund realizes a gain or loss from the sale of the securities based upon the price established at the date the commitment was entered into.
Restricted Securities (including Private Placements). Funds may invest in securities that are subject to legal or contractual restrictions on resale. These securities generally may be resold in transactions exempt from registration or to the public if the securities are registered. Disposal of these securities may involve time-consuming negotiations and expense, and prompt sale at an acceptable price may be difficult. Information regarding restricted securities held at period end is included at the end of the Schedule of Investments, if applicable.
Loans and Other Direct Debt Instruments. Direct debt instruments are interests in amounts owed to lenders by corporate or other borrowers. These instruments may be in the form of loans, trade claims or other receivables and may include standby financing commitments such as revolving credit facilities that obligate a fund to supply additional cash to the borrower on demand. Loans may be acquired through assignment, participation, or may be made directly to a borrower. Such instruments are presented in the Bank Loan Obligations section in the Schedule of Investments. Certain funds may also invest in unfunded loan commitments, which are contractual obligations for future funding. Information regarding unfunded commitments is included at the end of the Schedule of Investments, if applicable.
4. Derivative Instruments.
Risk Exposures and the Use of Derivative Instruments. The Fund's investment objectives allow for various types of derivative instruments, including futures contracts, forward foreign currency contracts, options and swaps. Derivatives are investments whose value is primarily derived from underlying assets, indices or reference rates and may be transacted on an exchange or over-the-counter (OTC). Derivatives may involve a future commitment to buy or sell a specified asset based on specified terms, to exchange future cash flows at periodic intervals based on a notional principal amount, or for one party to make one or more payments upon the occurrence of specified events in exchange for periodic payments from the other party.
Derivatives were used to increase returns, to gain exposure to certain types of assets, to facilitate transactions in foreign-denominated securities and to manage exposure to certain risks as defined below. The success of any strategy involving derivatives depends on analysis of numerous economic factors, and if the strategies for investment do not work as intended, the objectives may not be achieved.
Derivatives were used to increase or decrease exposure to the following risk(s):
| Foreign Exchange Risk | Foreign exchange rate risk relates to fluctuations in the value of an asset or liability due to changes in currency exchange rates. |
| Interest Rate Risk | Interest rate risk relates to the fluctuations in the value of interest-bearing securities due to changes in the prevailing levels of market interest rates. |
Funds are also exposed to additional risks from investing in derivatives, such as liquidity risk and counterparty credit risk. Liquidity risk is the risk that a fund will be unable to close out the derivative in the open market in a timely manner. Counterparty credit risk is the risk that the counterparty will not be able to fulfill its obligation to a fund. Derivative counterparty credit risk is managed through formal evaluation of the creditworthiness of all potential counterparties. On certain OTC derivatives such as forward foreign currency contracts and options, a fund attempts to reduce its exposure to counterparty credit risk by entering into an International Swaps and Derivatives Association, Inc. (ISDA) Master Agreement with each of its counterparties. The ISDA Master Agreement gives a fund the right to terminate all transactions traded under such agreement upon the deterioration in the credit quality of the counterparty beyond specified levels. The ISDA Master Agreement gives each party the right, upon an event of default by the other party or a termination of the agreement, to close out all transactions traded under such agreement and to net amounts owed under each transaction to one net payable by one party to the other. To mitigate counterparty credit risk on bi-lateral OTC derivatives, a fund receives collateral in the form of cash or securities once net unrealized appreciation on outstanding derivative contracts under an ISDA Master Agreement exceeds certain applicable thresholds, subject to certain minimum transfer provisions. The collateral received is held in segregated accounts with the custodian bank in accordance with the collateral agreements entered into between a fund, the counterparty and the custodian bank. A fund could experience delays and costs in gaining access to the collateral even though it is held by the custodian bank. The maximum risk of loss to a fund from counterparty credit risk related to bi-lateral OTC derivatives is generally the aggregate unrealized appreciation and unpaid counterparty payments in excess of any collateral pledged by the counterparty to a fund. A fund may be required to pledge collateral for the benefit of the counterparties on bi-lateral OTC derivatives in an amount not less than each counterparty's unrealized appreciation on outstanding derivative contracts, subject to certain minimum transfer provisions, and any such pledged collateral is identified in the Schedule of Investments. Exchange-traded contracts are not covered by the ISDA Master Agreement; however counterparty credit risk related to these contracts may be mitigated by the protection provided by the exchange on which they trade. Counterparty credit risk related to centrally cleared swaps may be mitigated by the protection provided by the clearinghouse.
Investing in derivatives may involve greater risks than investing in the underlying assets directly and, to varying degrees, may involve risk of loss in excess of any initial investment and collateral received and amounts recognized in the Statement of Assets and Liabilities. In addition, there may be the risk that the change in value of the derivative contract does not correspond to the change in value of the underlying instrument.
Net Realized Gain (Loss) and Change in Net Unrealized Appreciation (Depreciation) on Derivatives. The table below, which reflects the impacts of derivatives on the financial performance, summarizes the net realized gain (loss) and change in net unrealized appreciation (depreciation) for derivatives during the period as presented in the Statement of Operations.
| Primary Risk Exposure / Derivative Type | Net Realized Gain (Loss)($) | Change in Net Unrealized Appreciation (Depreciation)($) |
| Fidelity Advisor Strategic Income Fund | | |
| Foreign Exchange Risk | | |
| Forward Foreign Currency Contracts | 26,890 | 10,392 |
| Total Foreign Exchange Risk | 26,890 | 10,392 |
| Interest Rate Risk | | |
| Futures Contracts | (16,525) | (26,716) |
| Purchased Options | - | (407) |
| Swaps | 4,953 | 8,009 |
| Total Interest Rate Risk | (11,572) | (19,114) |
| Totals | 15,318 | (8,722) |
If there are any open positions at period end, a summary of the value of derivatives by primary risk exposure is included at the end of the Schedule of Investments.
Forward Foreign Currency Contracts. Forward foreign currency contracts represent obligations to purchase or sell foreign currency on a specified future date at a price fixed at the time the contracts are entered into. Forward foreign currency contracts were used to facilitate transactions in foreign-denominated securities and to manage exposure to certain foreign currencies.
Forward foreign currency contracts are valued daily and fluctuations in exchange rates on open contracts are recorded as unrealized appreciation or (depreciation) and reflected in total accumulated earnings (loss) in the Statement of Assets and Liabilities. When the contract is closed, a gain or loss is realized equal to the difference between the closing value and the value at the time it was opened. Non-deliverable forward foreign currency exchange contracts are settled with the counterparty in cash without the delivery of foreign currency. The net realized gain (loss) and change in net unrealized appreciation (depreciation) on forward foreign currency contracts during the period is presented in the Statement of Operations.
Any open forward foreign currency contracts at period end are presented in the Schedule of Investments under the caption "Forward Foreign Currency Contracts." The contract amount and unrealized appreciation (depreciation) reflects each contract's exposure to the underlying currency at period end, and is representative of volume of activity during the period unless an average contract value is presented.
Futures Contracts. A futures contract is an agreement between two parties to buy or sell a specified underlying instrument for a fixed price at a specified future date. Futures contracts were used to manage exposure to the bond market and fluctuations in interest rates.
Upon entering into a futures contract, a fund is required to deposit either cash or securities (initial margin) with a clearing broker in an amount equal to a certain percentage of the face value of the contract. Futures contracts are marked-to-market daily and subsequent daily payments are made or received by a fund depending on the daily fluctuations in the value of the futures contracts and are recorded as unrealized appreciation or (depreciation). This receivable and/or payable, if any, is included in daily variation margin on futures contracts in the Statement of Assets and Liabilities. Realized gain or (loss) is recorded upon the expiration or closing of a futures contract. The net realized gain (loss) and change in net unrealized appreciation (depreciation) on futures contracts during the period is presented in the Statement of Operations.
Any open futures contracts at period end are presented in the Schedule of Investments under the caption "Futures Contracts". The notional amount at value reflects each contract's exposure to the underlying instrument or index at period end, and is representative of volume of activity during the period unless an average notional amount is presented. Any securities deposited to meet initial margin requirements are identified in the Schedule of Investments. Any cash deposited to meet initial margin requirements is presented as segregated cash with brokers for derivative instruments in the Statement of Assets and Liabilities.
Options. Options give the purchaser the right, but not the obligation, to buy (call) or sell (put) an underlying security or financial instrument at an agreed exercise or strike price between or on certain dates. Options obligate the seller (writer) to buy (put) or sell (call) an underlying instrument at the exercise or strike price or cash settle an underlying derivative instrument if the holder exercises the option on or before the expiration date. OTC options, such as swaptions, which are options where the underlying instrument is a swap, were used to manage exposure to fluctuations in interest rates.
Upon entering into an options contract, a fund will pay or receive a premium. Premiums paid on purchased options are reflected as cost of investments and premiums received on written options are reflected as a liability on the Statement of Assets and Liabilities. Certain options may be purchased or written with premiums to be paid or received on a future date. Options are valued daily and any unrealized appreciation (depreciation) is reflected in total accumulated earnings (loss) in the Statement of Assets and Liabilities. When an option is exercised, the cost or proceeds of the underlying instrument purchased or sold is adjusted by the amount of the premium. When an option is closed, a gain or loss is realized depending on whether the proceeds or amount paid for the closing sale transaction is greater or less than the premium received or paid. When an option expires, gains and losses are realized to the extent of premiums received and paid, respectively. The net realized and unrealized gains (losses) on purchased options are included in the Statement of Operations in net realized gain (loss) and change in net unrealized appreciation (depreciation) on investment securities. The net realized gain (loss) and change in net unrealized appreciation (depreciation) on written options are presented in the Statement of Operations.
Any open options at period end are presented in the Schedule of Investments under the captions "Purchased Options," "Purchased Swaptions," "Written Options" and "Written Swaptions," as applicable, and are representative of volume of activity during the period unless an average notional amount is presented.
Writing puts and buying calls tend to increase exposure to the underlying instrument while buying puts and writing calls tend to decrease exposure to the underlying instrument. For purchased options, risk of loss is limited to the premium paid, and for written options, risk of loss is the change in value in excess of the premium received.
Swaps. A swap is a contract between two parties to exchange future cash flows at periodic intervals based on a notional principal amount. A centrally cleared swap is a transaction executed between a fund and a dealer counterparty, then cleared by a futures commission merchant (FCM) through a clearinghouse. Once cleared, the clearinghouse serves as a central counterparty, with whom a fund exchanges cash flows for the life of the transaction, similar to transactions in futures contracts.
Centrally cleared swaps require a fund to deposit either cash or securities (initial margin) with the FCM, at the instruction of and for the benefit of the clearinghouse. Any securities deposited to meet initial margin requirements are identified in the Schedule of Investments. Any cash deposited to meet initial margin requirements is presented in segregated cash with brokers for derivative instruments in the Statement of Assets and Liabilities. Centrally cleared swaps are marked-to-market daily and subsequent payments (variation margin) are made or received depending on the daily fluctuations in the value of the swaps and are recorded as unrealized appreciation or (depreciation). These daily payments, if any, are included in receivable or payable for daily variation margin on centrally cleared swaps in the Statement of Assets and Liabilities. Any premiums for centrally cleared swaps are recorded periodically throughout the term of the swap to variation margin and included in total accumulated earnings (loss) in the Statement of Assets and Liabilities. Any premiums are recognized as realized gain (loss) upon termination or maturity of the swap.
Payments are exchanged at specified intervals, accrued daily commencing with the effective date of the contract and recorded as realized gain or (loss). Some swaps may be terminated prior to the effective date and realize a gain or loss upon termination. The net realized gain (loss) and change in net unrealized appreciation (depreciation) on swaps during the period is presented in the Statement of Operations.
Any open swaps at period end are included in the Schedule of Investments under the caption "Swaps", and are representative of volume of activity during the period unless an average notional amount is presented.
Interest Rate Swaps. Interest rate swaps are agreements between counterparties to exchange cash flows, one based on a fixed rate, and the other on a floating rate. A fund enters into interest rate swaps to manage its exposure to interest rate changes. Changes in interest rates can have an effect on both the value of bond holdings as well as the amount of interest income earned. In general, the value of bonds can fall when interest rates rise and can rise when interest rates fall.
5. Purchases and Sales of Investments.
Purchases and sales of securities, other than short-term securities, U.S. government securities and in-kind transactions, as applicable, are noted in the table below.
| | Purchases ($) | Sales ($) |
| Fidelity Advisor Strategic Income Fund | 3,657,249 | 3,899,944 |
6. Fees and Other Transactions with Affiliates.
Management Fee. Fidelity Management & Research Company LLC (the investment adviser) and its affiliates provide the Fund with investment management related services for which the Fund pays a monthly management fee.
Effective March 1, 2024, the Fund's management contract was amended to incorporate administrative services previously covered under separate services agreements (Transfer Agent and Accounting agreements). The amended contract incorporates a management fee rate that may vary by class. The investment adviser or an affiliate pays certain expenses of managing and operating the Fund out of each class's management fee. Each class of the Fund pays a management fee to the investment adviser. The management fee is calculated and paid to the investment adviser every month. When determining a class's management fee, a mandate rate is calculated based on the monthly average net assets of a group of funds advised by FMR within a designated asset class. A discount rate is subtracted from the mandate rate once the Fund's monthly average net assets reach a certain level. The mandate rate and discount rate may vary by class. The annual management fee rate for a class of shares of the Fund is the lesser of (1) the class's mandate rate reduced by the class's discount rate (if applicable) or (2) the amount set forth in the following table.
| | Maximum Management Fee Rate % |
| Class A | .70 |
| Class M | .69 |
| Class C | .70 |
| Fidelity Strategic Income Fund | .65 |
| Class I | .69 |
| Class Z | .59 |
One-twelfth of the management fee rate for a class is applied to the average net assets of the class for the month, giving a dollar amount which is the management fee for the class for that month. A different management fee rate may be applicable to each class of the Fund. The difference between classes is the result of separate arrangements for class-level services and/or waivers of certain expenses. It is not the result of any difference in advisory or custodial fees or other expenses related to the management of the Fund's assets, which do not vary by class. For the portion of the reporting period on or after March 1, 2024, the total annualized management fee rates were as follows:
| | Total Management Fee Rate % |
| Class A | .69 |
| Class M | .69 |
| Class C | .69 |
| Fidelity Strategic Income Fund | .65 |
| Class I | .69 |
| Class Z | .59 |
Prior to March 1, 2024, the management fee was the sum of an individual fund fee rate that was based on an annual rate of .45% of the Fund's average net assets and an annualized group fee rate that averaged .10% during the period. The group fee rate was based upon the monthly average net assets of a group of registered investment companies with which the investment adviser has management contracts. The group fee rate decreased as assets under management increased and increased as assets under management decreased. For the portion of the reporting period prior to March 1, 2024, the total annualized management fee rate was .55%.
Effective March 1, 2024, the Fund's sub-advisory agreements with FMR Investment Management (UK) Limited, Fidelity Management & Research (Hong Kong) Limited, and Fidelity Management & Research (Japan) Limited were amended to provide that the investment adviser pays each sub-adviser monthly fees equal to 110% of the sub-adviser's costs for providing sub-advisory services.
Effective March 1, 2024, the Fund's sub-advisory agreement with FIL Investment Advisors (FIA) was amended to provide that the investment adviser pays FIA monthly fees at an annual rate of 0.30% with respect to the average daily net assets of the Fund managed by FIA. FIA in turn pays FIA(UK).
Distribution and Service Plan Fees. In accordance with Rule 12b-1 of the 1940 Act, the Fund has adopted separate Distribution and Service Plans for each class of shares. Certain classes pay Fidelity Distributors Company LLC (FDC), an affiliate of the investment adviser, separate Distribution and Service Fees, each of which is based on an annual percentage of each class' average net assets. In addition, FDC may pay financial intermediaries for selling shares of the Fund and providing shareholder support services. For the period, the Distribution and Service Fee rates, total fees and amounts retained by FDC were as follows:
| | Distribution Fee | Service Fee | Total Fees ($) | Retained by FDC ($) |
| Class A | - % | .25% | 2,007 | 53 |
| Class M | - % | .25% | 761 | 9 |
| Class C | .75% | .25% | 886 | 97 |
| | | | 3,654 | 159 |
Sales Load. FDC may receive a front-end sales charge of up to 4.00% for selling Class A shares and Class M shares, some of which is paid to financial intermediaries for selling shares of the Fund. Depending on the holding period, FDC may receive contingent deferred sales charges levied on Class A, Class M and Class C redemptions. The deferred sales charges are 1.00% for Class C shares, 1.00% for certain purchases of Class A shares and .25% for certain purchases of Class M shares.
For the period, sales charge amounts retained by FDC were as follows:
| | Retained by FDC ($) |
| Class A | 49 |
| Class M | 7 |
Class C A | 1 |
| | 57 |
A When Class C shares are initially sold, FDC pays commissions from its own resources to financial intermediaries through which the sales are made.
Transfer Agent Fees. Fidelity Investments Institutional Operations Company LLC (FIIOC), an affiliate of the investment adviser, is the transfer, dividend disbursing and shareholder servicing agent for each class of the Fund. Effective March 1, 2024, the Fund's management contract was amended to incorporate transfer agent services and associated fees previously covered under a separate services agreement. FIIOC pays for typesetting, printing and mailing of shareholder reports, except proxy statements.
During the period January 1, 2024 through February 29, 2024, the transfer agent fees for each class were a fixed annual rate of class-level average net assets as follows:
| | Amount ($) | % of Class-Level Average Net Assets | |
| Class A | 419 | .1564 | |
| Class M | 151 | .1486 | |
| Class C | 49 | .1638 | |
| Fidelity Strategic Income Fund | 972 | .1089 | |
| Class I | 1,143 | .1539 | |
| Class Z | 87 | .0500 | |
| | 2,821 | |
| | | | |
Accounting Fees. Fidelity Service Company, Inc. (FSC), an affiliate of the investment adviser, maintains the Fund's accounting records. Effective March 1, 2024, the Fund's management contract was amended to incorporate accounting services and associated fees previously covered under a separate services agreement.
During the period January 1, 2024 through February 29, 2024, the accounting fees were a fixed annual rate of average net assets as follows:
| | % of Average Net Assets |
| Fidelity Advisor Strategic Income Fund | .0124 |
Brokerage Commissions. A portion of portfolio transactions were placed with brokerage firms which are affiliates of the investment adviser. Brokerage commissions are included in net realized gain (loss) and change in net unrealized appreciation (depreciation) in the Statement of Operations. The commissions paid to these affiliated firms were as follows:
| | Amount ($) |
| Fidelity Advisor Strategic Income Fund | 2 |
Interfund Trades. Funds may purchase from or sell securities to other Fidelity Funds under procedures adopted by the Board. The procedures have been designed to ensure these interfund trades are executed in accordance with Rule 17a-7 of the 1940 Act. Any interfund trades are included within the respective purchases and sales amounts shown in the Purchases and Sales of Investments note. Interfund trades during the period are noted in the table below.
| | Purchases ($) | Sales ($) | Realized Gain (Loss)($) |
| Fidelity Advisor Strategic Income Fund | 16,990 | 11,722 | 1,423 |
7. Committed Line of Credit.
Certain Funds participate with other funds managed by the investment adviser or an affiliate in a $4.25 billion credit facility (the "line of credit") to be utilized for temporary or emergency purposes to fund shareholder redemptions or for other short-term liquidity purposes. The participating funds have agreed to pay commitment fees on their pro-rata portion of the line of credit, which are reflected in Miscellaneous expenses on the Statement of Operations, and are listed below. During the period, there were no borrowings on this line of credit.
| | Amount ($) |
| Fidelity Advisor Strategic Income Fund | 12 |
8. Security Lending.
Funds lend portfolio securities from time to time in order to earn additional income. Lending agents are used, including National Financial Services (NFS), an affiliate of the investment adviser. Pursuant to a securities lending agreement, NFS will receive a fee, which is capped at 9.9% of a fund's daily lending revenue, for its services as lending agent. A fund may lend securities to certain qualified borrowers, including NFS. On the settlement date of the loan, a fund receives collateral (in the form of U.S. Treasury obligations, letters of credit and/or cash) against the loaned securities and maintains collateral in an amount not less than 100% of the market value of the loaned securities during the period of the loan. The market value of the loaned securities is determined at the close of business of a fund and any additional required collateral is delivered to a fund on the next business day. A fund or borrower may terminate the loan at any time, and if the borrower defaults on its obligation to return the securities loaned because of insolvency or other reasons, a fund may apply collateral received from the borrower against the obligation. A fund may experience delays and costs in recovering the securities loaned. Any cash collateral received is invested in the Fidelity Securities Lending Cash Central Fund. Any loaned securities are identified as such in the Schedule of Investments, and the value of loaned securities and cash collateral at period end, as applicable, are presented in the Statement of Assets and Liabilities. Security lending income represents the income earned on investing cash collateral, less rebates paid to borrowers and any lending agent fees associated with the loan, plus any premium payments received for lending certain types of securities. Security lending income is presented in the Statement of Operations as a component of income from Fidelity Central Funds. Affiliated security lending activity, if any, was as follows:
| | Total Security Lending Fees Paid to NFS ($) | Security Lending Income From Securities Loaned to NFS ($) | Value of Securities Loaned to NFS at Period End ($) |
| Fidelity Advisor Strategic Income Fund | 1 | - | - |
9. Expense Reductions.
Through arrangements with the Fund's custodian, credits realized as a result of certain uninvested cash balances were used to reduce the Fund's expenses. During the period, custodian credits reduced the Fund's expenses by $26.
In addition, during the period the investment adviser or an affiliate reimbursed and/or waived a portion of fund-level operating expenses in the amount of $312.
10. Distributions to Shareholders.
Distributions to shareholders of each class were as follows:
| | Six months ended June 30, 2024 | Year ended December 31, 2023 |
| Fidelity Advisor Strategic Income Fund | | |
| Distributions to shareholders | | |
| Class A | $31,868 | $67,298 |
| Class M | 12,080 | 25,593 |
| Class C | 2,849 | 6,777 |
| Fidelity Strategic Income Fund | 112,788 | 240,046 |
| Class I | 97,158 | 183,592 |
| Class Z | 23,272 | 43,477 |
Total | $280,015 | $566,783 |
11. Share Transactions.
Share transactions for each class were as follows and may contain in-kind transactions, automatic conversions between classes or exchanges between affiliated funds:
| | Shares | Shares | Dollars | Dollars |
| | Six months ended June 30, 2024 | Year ended December 31, 2023 | Six months ended June 30, 2024 | Year ended December 31, 2023 |
| Fidelity Advisor Strategic Income Fund | | | | |
| Class A | | | | |
| Shares sold | 9,243 | 15,738 | $103,574 | $171,190 |
| Reinvestment of distributions | 2,718 | 5,894 | 30,476 | 64,318 |
| Shares redeemed | (13,333) | (30,202) | (149,395) | (328,277) |
| Net increase (decrease) | (1,372) | (8,570) | $(15,345) | $(92,769) |
| Class M | | | | |
| Shares sold | 3,001 | 5,068 | $33,638 | $55,110 |
| Reinvestment of distributions | 1,056 | 2,296 | 11,830 | 25,043 |
| Shares redeemed | (4,986) | (11,236) | (55,826) | (122,103) |
| Net increase (decrease) | (929) | (3,872) | $(10,358) | $(41,950) |
| Class C | | | | |
| Shares sold | 1,448 | 1,887 | $16,179 | $20,525 |
| Reinvestment of distributions | 248 | 605 | 2,774 | 6,584 |
| Shares redeemed | (2,865) | (6,830) | (32,001) | (74,051) |
| Net increase (decrease) | (1,169) | (4,338) | $(13,048) | $(46,942) |
| Fidelity Strategic Income Fund | | | | |
| Shares sold | 32,561 | 55,288 | $370,166 | $611,273 |
| Reinvestment of distributions | 8,695 | 19,106 | 98,908 | 211,514 |
| Shares redeemed | (54,081) | (100,696) | (614,014) | (1,110,551) |
| Net increase (decrease) | (12,825) | (26,302) | $(144,940) | $(287,764) |
| Class I | | | | |
| Shares sold | 73,461 | 119,335 | $834,981 | $1,318,952 |
| Reinvestment of distributions | 8,147 | 15,754 | 92,719 | 174,425 |
| Shares redeemed | (49,866) | (115,366) | (567,044) | (1,272,517) |
| Net increase (decrease) | 31,742 | 19,723 | $360,656 | $220,860 |
| Class Z | | | | |
| Shares sold | 16,630 | 36,757 | $189,113 | $406,571 |
| Reinvestment of distributions | 1,627 | 3,150 | 18,523 | 34,900 |
| Shares redeemed | (12,563) | (30,338) | (142,811) | (335,062) |
| Net increase (decrease) | 5,694 | 9,569 | $64,825 | $106,409 |
12. Other.
A fund's organizational documents provide former and current trustees and officers with a limited indemnification against liabilities arising in connection with the performance of their duties to the fund. In the normal course of business, a fund may also enter into contracts that provide general indemnifications. A fund's maximum exposure under these arrangements is unknown as this would be dependent on future claims that may be made against a fund. The risk of material loss from such claims is considered remote.
13. Credit Risk.
The Fund's relatively large investment in countries with limited or developing capital markets may involve greater risks than investments in more developed markets and the prices of such investments may be volatile. The yields of emerging market debt obligations reflect, among other things, perceived credit risk. The consequences of political, social or economic changes in these markets may have disruptive effects on the market prices of the Fund's investments and the income they generate, as well as the Fund's ability to repatriate such amounts.
14. Risk and Uncertainties.
Many factors affect a fund's performance. Developments that disrupt global economies and financial markets, such as pandemics, epidemics, outbreaks of infectious diseases, war, terrorism, and environmental disasters, may significantly affect a fund's investment performance. The effects of these developments to a fund will be impacted by the types of securities in which a fund invests, the financial condition, industry, economic sector, and geographic location of an issuer, and a fund's level of investment in the securities of that issuer. Significant concentrations in security types, issuers, industries, sectors, and geographic locations may magnify the factors that affect a fund's performance.
Item 8: Changes in and Disagreements with Accountants for Open-End Management Investment Companies
Note: This is not applicable for any fund included in this document.
Item 9: Proxy Disclosures for Open-End Management Investment Companies
Note: This is not applicable for any fund included in this document.
Item 10: Remuneration Paid to Directors, Officers, and others of Open-End Management Investment Companies
Note: This information is disclosed as part of the financial statements for each Fund as part of Item 7: Financial Statements and Financial Highlights for Open-End Management Investment companies.
Item 11: Statement Regarding Basis for Approval of Investment Advisory Contract
Board Approval of Investment Advisory Contracts
Fidelity Advisor Strategic Income Fund
At its January 2024 meeting, the Board of Trustees, including the Independent Trustees (together, the Board), approved an amended and restated management contract with Fidelity Management & Research Company LLC (FMR) (the Management Contract), and amended and restated sub-advisory agreements (the Sub-Advisory Contracts, and together with the Management Contract, the Advisory Contracts) for the fund, including the fund's sub-advisory agreements with FMR Investment Management (UK) Limited (FMR UK), Fidelity Management & Research (Hong Kong) Limited (FMR H.K.), Fidelity Management & Research (Japan) Limited (FMR Japan), and FIL Investment Advisors (FIL). The Advisory Contracts will be effective March 1, 2024. The Board will consider the annual renewal of the fund's Advisory Contracts in September 2024, following its review of additional materials provided by FMR.
Management Contract. The Board approved the Management Contract, which implements a new fee structure combining the management fee, transfer agent fee (TA Fee), and pricing and bookkeeping fee (P&B Fee) of the fund and each class into a single class-level fee based on tiered schedules and subject to a maximum class-level rate (the Unified Fee). In exchange for the Unified Fee, the fund will receive investment advisory, management, administrative, transfer agent, pricing and bookkeeping services under a single agreement - the Management Contract.
In its consideration of the Management Contract over several meetings, the Board received, reviewed and discussed a comprehensive set of analyses regarding the Unified Fee including (i) the legal framework, (ii) design goals for the Unified Fee, (iii) calculation methodology for the Unified Fee and illustrative examples, (iv) annual and cumulative projected impacts under various scenarios, both in the aggregate and at the fund/class level, (v) explanations of schedules, rate levers and maximum rates and (vi) shareholder benefits and projected savings.
The Board considered that the maximum Unified Fee for each class of the fund would be no higher than the sum of (i) the lowest contractual management fee under the fund's existing management contract, which is the individual fund fee, if any, plus the lowest contractual marginal group fee rate and (ii) the TA and P&B Fee rates, which are fixed fee rates since December 1, 2023 (together, the "Unified Fee Cap"). The Board noted that, as a result of this Unified Fee Cap, the Unified Fee would be no greater than the fees previously authorized to be charged for the same services. The Board noted that certain expenses such as third-party expenses, Rule 12b-1 fees, and certain other miscellaneous expenses would be outside the scope of the Unified Fee and the calculation of such fees would not change as a result of the Unified Fee. The Board considered that, under the Management Contract, a different management fee rate will be applicable to each class of the fund. The Board noted that Fidelity has represented that the difference in expenses between classes is based on differences in class-specific expenses and not due to any difference in advisory or third-party custodial fees or other expenses related to the management of the fund's assets.
The Board considered that implementation of the Unified Fee, which includes the Unified Fee Cap, would cause all funds subject to a Unified Fee, including the fund, to experience an immediate reduction on contractual fee rates for services provided under the current management contracts. The Board considered that some funds would not experience lower fees as a result of existing fee caps. The Board further considered that, in addition to the contractual fee savings, the Unified Fee offers funds and their shareholders greater protection from future rate increases for services previously offered under separate agreements that are now covered by the Management Contract because such rate increases would require shareholder, as well as Board, approval.
Sub-Advisory Contracts. In connection with the Unified Fee changes, the Board considered the Sub-Advisory Contracts, which changed the arrangements for fees paid by FMR to the sub-advisers under the agreements. The Board noted that the agreements with FMR UK, FMR H.K., and FMR Japan were amended to provide that FMR will compensate each sub-adviser at a fee equal to 110% of the sub-adviser's costs incurred in providing services under the agreement. The Board further noted that the agreement with FIL was amended to provide that FMR will compensate FIL at a flat fee rate of 0.30% of the net assets sub-advised by it. The Board considered that, under the Sub-Advisory Contracts, FMR, and not the fund, will continue to pay the sub-advisory fees to each applicable sub-adviser.
The Board considered that the approval of the fund's Advisory Contracts will not result in any changes in the investment process or strategies employed in the management of the fund's assets or the day-to-day management of the fund or the persons primarily responsible for such management. Further, the Board considered that the Management Contract would not change the obligations and services of FMR and its affiliates on behalf of the fund, and, in particular, there would be no change in the nature and level of advisory, management, administration, transfer agent, and pricing and bookkeeping services provided to the fund by FMR and its affiliates.
In connection with its consideration of future renewals of the fund's Advisory Contracts, the Board will consider: (i) the nature, extent and quality of services provided to the funds, including shareholder and administrative services and investment performance; (ii) the competitiveness of the management fee and total expenses for the fund; (iii) the costs of the services and profitability, including the revenues earned and the expenses incurred in conducting the business of developing, marketing, distributing, managing, administering, and servicing the fund and its shareholders, to the extent applicable; and (iv) whether there have been economies of scale in respect of the Fidelity funds, whether the Fidelity funds (including the fund) have appropriately benefited from any such economies of scale, and whether there is the potential for realization of any further economies.
Based on its evaluation of all of the conclusions noted above, and after considering all factors it believed relevant, the Board concluded that the fund's management fee structure is fair and reasonable, and that the fund's Advisory Contracts should be approved.
1.705747.126
SI-SANN-0824
Item 8.
Changes in and Disagreements with Accountants for Open-End Management Investment Companies
See Item 7.
Item 9.
Proxy Disclosures for Open-End Management Investment Companies
See Item 7.
Item 10.
Remuneration Paid to Directors, Officers, and Others of Open-End Management Investment Companies
See Item 7.
Item 11.
Statement Regarding Basis for Approval of Investment Advisory Contract
See Item 7.
Item 12.
Disclosure of Proxy Voting Policies and Procedures for Closed-End Management Investment Companies
Not applicable.
Item 13.
Portfolio Managers of Closed-End Management Investment Companies
Not applicable.
Item 14.
Purchases of Equity Securities by Closed-End Management Investment Company and Affiliated Purchasers
Not applicable.
Item 15.
Submission of Matters to a Vote of Security Holders
There were no material changes to the procedures by which shareholders may recommend nominees to the Fidelity Advisor Series II’s Board of Trustees.
Item 16.
Controls and Procedures
(a)(i) The President and Treasurer and the Chief Financial Officer have concluded that the Fidelity Advisor Series II’s (the “Trust”) disclosure controls and procedures (as defined in Rule 30a-3(c) under the Investment Company Act) provide reasonable assurances that material information relating to the Trust is made known to them by the appropriate persons, based on their evaluation of these controls and procedures as of a date within 90 days of the filing date of this report.
(a)(ii) There was no change in the Trust’s internal control over financial reporting (as defined in Rule 30a-3(d) under the Investment Company Act) that occurred during the period covered by this report that has materially affected, or is reasonably likely to materially affect, the Trust’s internal control over financial reporting.
Item 17.
Disclosure of Securities Lending Activities for Closed-End Management Investment Companies
Not applicable.
Item 18.
Recovery of Erroneously Awarded Compensation
(a)
Not applicable.
(b)
Not applicable.
Item 19.
Exhibits
SIGNATURES
Pursuant to the requirements of the Securities Exchange Act of 1934 and the Investment Company Act of 1940, the registrant has duly caused this report to be signed on its behalf by the undersigned, thereunto duly authorized.
Fidelity Advisor Series II
|
By: | /s/Laura M. Del Prato |
| Laura M. Del Prato |
| President and Treasurer (Principal Executive Officer) |
|
|
Date: | August 22, 2024 |
Pursuant to the requirements of the Securities Exchange Act of 1934 and the Investment Company Act of 1940, this report has been signed below by the following persons on behalf of the registrant and in the capacities and on the dates indicated.
|
By: | /s/Laura M. Del Prato |
| Laura M. Del Prato |
| President and Treasurer (Principal Executive Officer) |
|
|
Date: | August 22, 2024 |
|
By: | /s/John J. Burke III |
| John J. Burke III |
| Chief Financial Officer (Principal Financial Officer) |
|
|
Date: | August 22, 2024 |