UNITED STATES
SECURITIES AND EXCHANGE COMMISSION
Washington, D.C. 20549
FORM N-CSR
CERTIFIED SHAREHOLDER REPORT OF REGISTERED
MANAGEMENT INVESTMENT COMPANIES
Investment Company Act file number 811-4707
Fidelity Advisor Series II
(Exact name of registrant as specified in charter)
245 Summer St., Boston, Massachusetts 02210
(Address of principal executive offices) (Zip code)
Marc Bryant, Secretary
245 Summer St.
Boston, Massachusetts 02210
(Name and address of agent for service)
Registrant's telephone number, including area code:
617-563-7000
Date of fiscal year end: | October 31 |
|
|
Date of reporting period: | October 31, 2015 |
Item 1.
Reports to Stockholders
Fidelity Advisor® Municipal Income Fund Class I (formerly Institutional Class) Annual Report October 31, 2015 |
 |
Contents
Board Approval of Investment Advisory Contracts and Management Fees |
To view a fund's proxy voting guidelines and proxy voting record for the 12-month period ended June 30, visit http://www.fidelity.com/proxyvotingresults or visit the Securities and Exchange Commission's (SEC) web site at http://www.sec.gov.
You may also call 1-877-208-0098 to request a free copy of the proxy voting guidelines.
Standard & Poor's, S&P and S&P 500 are registered service marks of The McGraw-Hill Companies, Inc. and have been licensed for use by Fidelity Distributors Corporation.
Other third-party marks appearing herein are the property of their respective owners.
All other marks appearing herein are registered or unregistered trademarks or service marks of FMR LLC or an affiliated company. ©2015 FMR LLC. All rights reserved.
This report and the financial statements contained herein are submitted for the general information of the shareholders of the Fund. This report is not authorized for distribution to prospective investors in the Fund unless preceded or accompanied by an effective prospectus.
A fund files its complete schedule of portfolio holdings with the SEC for the first and third quarters of each fiscal year on Form N-Q. Forms N-Q are available on the SEC’s web site at http://www.sec.gov. A fund's Forms N-Q may be reviewed and copied at the SEC’s Public Reference Room in Washington, DC. Information regarding the operation of the SEC's Public Reference Room may be obtained by calling 1-800-SEC-0330.
For a complete list of a fund's portfolio holdings, view the most recent holdings listing, semiannual report, or annual report on Fidelity's web site at http://www.fidelity.com, http://www.advisor.fidelity.com, or http://www.401k.com, as applicable.
NOT FDIC INSURED •MAY LOSE VALUE •NO BANK GUARANTEE
Neither the Fund nor Fidelity Distributors Corporation is a bank.
Performance: The Bottom Line
Average annual total return reflects the change in the value of an investment, assuming reinvestment of distributions from dividend income and capital gains (the profits earned upon the sale of securities that have grown in value, if any) and assuming a constant rate of performance each year.
The hypothetical investment and the average annual total returns do not reflect the deduction of taxes that a shareholder would pay on fund distributions or the redemption of fund shares.
During periods of reimbursement by Fidelity, a fund’s total return will be greater than it would be had the reimbursement not occurred.
How a fund did yesterday is no guarantee of how it will do tomorrow.
Average Annual Total Returns
| For the periods ended October 31, 2015 | Past 1 year | Past 5 years | Past 10 years |
| Class I | 3.03% | 4.74% | 4.72% |
$10,000 Over 10 Years
Let's say hypothetically that $10,000 was invested in Fidelity Advisor® Municipal Income Fund - Class I on October 31, 2005.
The chart shows how the value of your investment would have changed, and also shows how the Barclays® Municipal Bond Index performed over the same period.
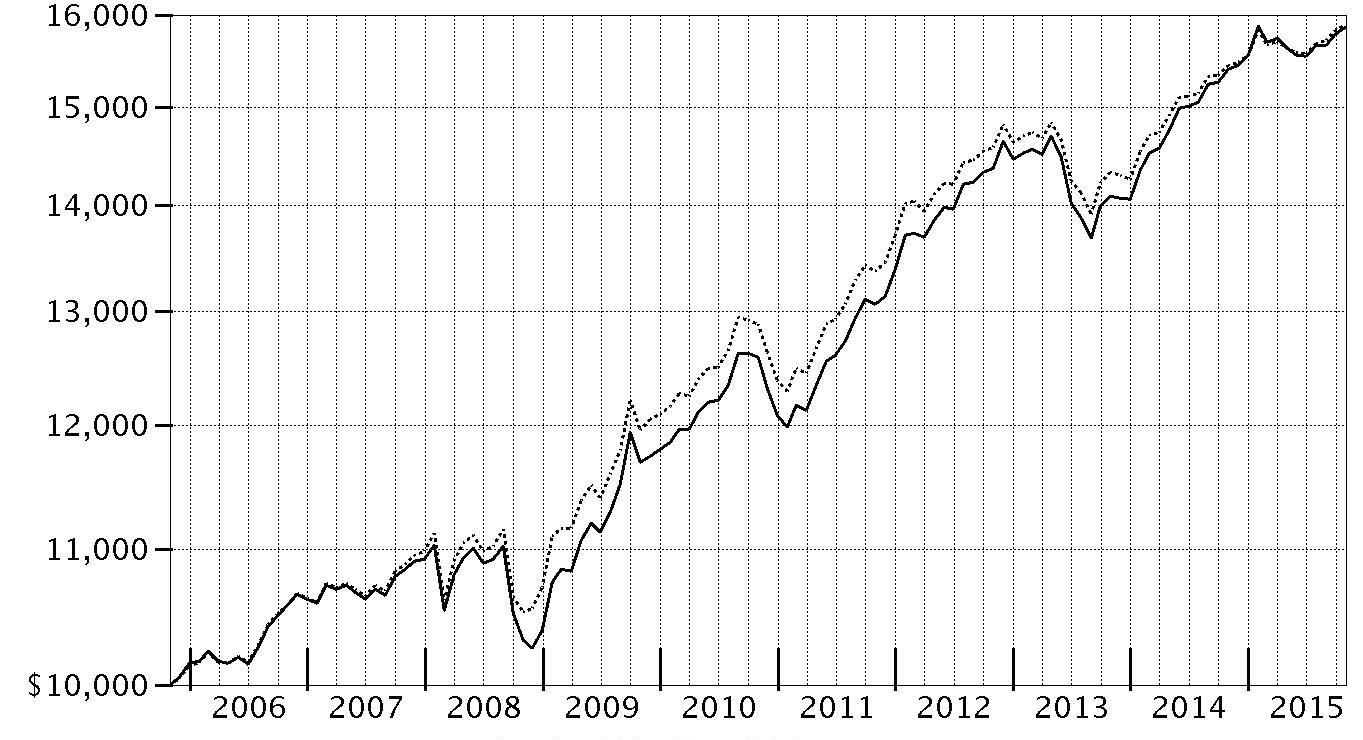
| Period Ending Values | ||
| $15,867 | Fidelity Advisor® Municipal Income Fund - Class I | |
| $15,891 | Barclays® Municipal Bond Index | |
Management's Discussion of Fund Performance
Market Recap: Tax-exempt municipal bonds posted a moderate gain for the 12 months ending October 31, 2015, driven by improving credit fundamentals and continued demand for high-quality, tax-exempt income, despite increased supply due to refinancing activity. The Barclays® Municipal Bond Index advanced 2.87%. Performance was strong early in the period, when many issuers exercised a level of fiscal conservatism, limiting supply. The muni market faced a difficult stretch between April and June, when the focus of the market shifted to the budget difficulties of a handful of high-profile issuers, including New Jersey, Illinois and Chicago. A common theme of unfunded pension liabilities for these issuers overshadowed a generally stable credit environment for state and local governments more broadly. But the market recouped those losses over the final four months as supply moderated. The tax advantages of munis continued to appeal to investors, in light of higher federal income-tax rates for top earners, as well as the 3.8% Medicare tax on non-municipal investment income, that took effect in 2013. At period end, investors continued to watch the flow of economic data, which the U.S. Federal Reserve has stated will help it determine the timing of any policy interest-rate increase.Comments from Jamie Pagliocco, Lead Portfolio Manager: For the year, the fund’s share classes (excluding sales charges, if applicable) trailed the 3.13% return of the Barclays® 3+ Year Municipal Bond Index. We continued to base our investment decisions on longer-term objectives, seeking attractive tax-exempt income and competitive risk-adjusted returns, including both price appreciation and income, over time. The fund’s larger weightings in bonds appropriated by the state of New Jersey, as well as bonds backed by the city of Chicago and related entities, were the primary drag on relative performance. New Jersey state-appropriated bonds underperformed amid worries about its budget challenges and unfunded pension liabilities. Debt backed by Chicago and closely related credits also performed poorly, as pension reform became more difficult, and one major credit-rating agency assigned the city a below-investment-grade rating. In contrast, the fund’s larger exposure to bonds that were advance refunded during the period was a plus, as such refinancings typically result in price gains for bondholders, because the bonds’ durations shorten and their credit quality jumps. Our decision to overweight health care bonds also was a plus. These securities turned in above-average performance, primarily due to investors seeking the relatively high yields these bonds offered.The views expressed above reflect those of the portfolio manager(s) only through the end of the period as stated on the cover of this report and do not necessarily represent the views of Fidelity or any other person in the Fidelity organization. Any such views are subject to change at any time based upon market or other conditions and Fidelity disclaims any responsibility to update such views. These views may not be relied on as investment advice and, because investment decisions for a Fidelity fund are based on numerous factors, may not be relied on as an indication of trading intent on behalf of any Fidelity fund.
Investment Summary (Unaudited)
Top Five States as of October 31, 2015
| % of fund's net assets | % of fund's net assets 6 months ago | |
| Illinois | 19.9 | 20.6 |
| California | 15.2 | 15.7 |
| Florida | 11.1 | 9.9 |
| New York | 8.7 | 7.8 |
| Texas | 7.7 | 8.6 |
Top Five Sectors as of October 31, 2015
| % of fund's net assets | % of fund's net assets 6 months ago | |
| General Obligations | 34.2 | 33.8 |
| Health Care | 17.7 | 19.3 |
| Transportation | 13.7 | 11.8 |
| Electric Utilities | 9.4 | 10.0 |
| Escrowed/Pre-Refunded | 8.2 | 7.7 |
Weighted Average Maturity as of October 31, 2015
| 6 months ago | ||
| Years | 6.1 | 5.9 |
This is a weighted average of all the maturities of the securities held in a fund. Weighted Average Maturity (WAM) can be used as a measure of sensitivity to interest rate changes and market changes. Generally, the longer the maturity, the greater the sensitivity to such changes. WAM is based on the dollar-weighted average length of time until principal payments must be paid. Depending on the types of securities held in a fund, certain maturity shortening devices (e.g., demand features, interest rate resets, and call options) may be taken into account when calculating the WAM.
Duration as of October 31, 2015
| 6 months ago | ||
| Years | 6.8 | 6.5 |
Duration is a measure of a security's price sensitivity to changes in interest rates. Duration differs from maturity in that it considers a security's interest payments in addition to the amount of time until the security reaches maturity, and also takes into account certain maturity shortening features (e.g., demand features, interest rate resets, and call options) when applicable. Securities with longer durations generally tend to be more sensitive to interest rate changes than securities with shorter durations. A fund with a longer average duration generally can be expected to be more sensitive to interest rate changes than a fund with a shorter average duration.
Quality Diversification (% of fund's net assets)
| As of October 31, 2015 | ||
| AAA | 3.9% | |
| AA,A | 80.6% | |
| BBB | 9.8% | |
| BB and Below | 1.5% | |
| Not Rated | 3.1% | |
| Short-Term Investments and Net Other Assets | 1.1% | |

| As of April 30, 2015 | ||
| AAA | 4.6% | |
| AA,A | 82.0% | |
| BBB | 8.9% | |
| BB and Below | 0.4% | |
| Not Rated | 4.3% | |
| Short-Term Investments and Net Other Assets* | (0.2)% | |

* Short-Term Investments and Net Other Assets (Liabilities) are not included in the pie chart
We have used ratings from Moody's Investors Service, Inc. Where Moody's® ratings are not available, we have used S&P® ratings. All ratings are as of the date indicated and do not reflect subsequent changes.
Investments October 31, 2015
Showing Percentage of Net Assets
| Municipal Bonds - 98.7% | |||
| Principal Amount | Value | ||
| Alabama - 0.2% | |||
| Birmingham Gen. Oblig. Series 2013 A, 0% 3/1/43 (a) | 600,000 | 606,858 | |
| Univ. of Alabama at Birmingham Hosp. Rev. Series 2008 A, 5.75% 9/1/22 | 1,000,000 | 1,124,800 | |
| TOTAL ALABAMA | 1,731,658 | ||
| Arizona - 1.8% | |||
| Arizona Ctfs. of Prtn. Series 2010 A: | |||
| 5% 10/1/18 (FSA Insured) | $1,000,000 | $1,113,150 | |
| 5.25% 10/1/20 (FSA Insured) | 1,600,000 | 1,837,424 | |
| 5.25% 10/1/21 (FSA Insured) | 850,000 | 975,775 | |
| 5.25% 10/1/26 (FSA Insured) | 500,000 | 570,705 | |
| 5.25% 10/1/28 (FSA Insured) | 1,600,000 | 1,817,120 | |
| Arizona Health Facilities Auth. Rev. (Banner Health Sys. Proj.) Series 2008 D, 5.5% 1/1/38 | 2,300,000 | 2,467,141 | |
| Arizona State Lottery Rev. Series 2010 A, 5% 7/1/21 (FSA Insured) | 1,200,000 | 1,375,464 | |
| Glendale Gen. Oblig. Series 2015, 4% 7/1/20 (FSA Insured) | 400,000 | 440,276 | |
| Maricopa County Poll. Cont. Rev. (Southern California Edison Co. Proj.) Series 2000 A, 5% 6/1/35 | 700,000 | 775,838 | |
| McAllister Academic Village LLC Rev. (Arizona State Univ. Hassayampa Academic Village Proj.) Series 2008, 5.25% 7/1/39 | 1,000,000 | 1,090,230 | |
| Phoenix Civic Impt. Corp. District Rev. (Plaza Expansion Proj.) Series 2005 B, 5.5% 7/1/38 (Nat'l. Pub. Fin. Guarantee Corp. Insured) | 1,620,000 | 2,044,375 | |
| Pima County Swr. Sys. Rev. Series 2012 A, 5% 7/1/26 | 500,000 | 586,255 | |
| Salt River Proj. Agricultural Impt. & Pwr. District Elec. Sys. Rev. Series 2009 A, 5% 1/1/26 | 110,000 | 123,279 | |
| Salt Verde Finl. Corp. Sr. Gas Rev.: | |||
| Series 2007, 5.5% 12/1/29 | 1,000,000 | 1,200,960 | |
| 5.25% 12/1/22 | 1,500,000 | 1,738,530 | |
| Scottsdale Indl. Dev. Auth. Hosp. Rev. (Scottsdale Healthcare Proj.) Series 2006 C, 5% 9/1/35 (FSA Insured) | 205,000 | 225,896 | |
| TOTAL ARIZONA | 18,382,418 | ||
| California - 15.2% | |||
| Bay Area Toll Auth. San Francisco Bay Toll Bridge Rev. Series 2009 F1, 5.625% 4/1/44 (Pre-Refunded to 4/1/19 @ 100) | 1,600,000 | 1,854,352 | |
| California Edl. Facilities Auth. Rev. Series U6, 5% 5/1/45 | 3,400,000 | 4,415,580 | |
| California Gen. Oblig.: | |||
| Bonds 3%, tender 12/1/19 (b) | 3,800,000 | 4,059,312 | |
| Series 2007, 5.625% 5/1/20 | 20,000 | 20,080 | |
| 5% 11/1/24 | 2,400,000 | 2,604,264 | |
| 5% 9/1/27 (Pre-Refunded to 9/1/16 @ 100) | 655,000 | 680,899 | |
| 5% 9/1/31 (Pre-Refunded to 9/1/16 @ 100) | 1,500,000 | 1,559,310 | |
| 5% 9/1/32 (Pre-Refunded to 9/1/16 @ 100) | 1,600,000 | 1,663,264 | |
| 5% 9/1/33 (Pre-Refunded to 9/1/33 @ 100) | 1,495,000 | 1,540,343 | |
| 5% 9/1/35 (Pre-Refunded to 9/1/35 @ 100) | 270,000 | 277,916 | |
| 5.25% 12/1/33 | 20,000 | 20,071 | |
| 5.25% 4/1/35 | 2,200,000 | 2,522,476 | |
| 5.25% 3/1/38 | 3,900,000 | 4,250,649 | |
| 5.25% 11/1/40 | 700,000 | 815,892 | |
| 5.5% 8/1/27 | 2,100,000 | 2,366,490 | |
| 5.5% 8/1/29 | 2,800,000 | 3,152,044 | |
| 5.5% 8/1/30 | 2,000,000 | 2,249,140 | |
| 5.5% 3/1/40 | 1,000,000 | 1,159,140 | |
| 5.6% 3/1/36 | 400,000 | 467,688 | |
| 6% 3/1/33 | 4,250,000 | 5,103,230 | |
| 6% 4/1/38 | 5,300,000 | 6,166,338 | |
| 6% 11/1/39 | 11,700,000 | 13,917,735 | |
| 6.5% 4/1/33 | 3,850,000 | 4,574,917 | |
| California Health Facilities Fing. Auth. Rev.: | |||
| (Catholic Healthcare West Proj.) Series 2009 E, 5.625% 7/1/25 | 2,000,000 | 2,298,740 | |
| (Kaiser Permanente Health Sys. Proj.) Series 2006 A, 5.25% 4/1/39 | 1,025,000 | 1,041,841 | |
| (Providence Health and Svcs. Proj.): | |||
| Series C, 6.5% 10/1/38 (Pre-Refunded to 10/1/18 @ 100) | 25,000 | 29,104 | |
| 6.5% 10/1/38 (Pre-Refunded to 10/1/18 @ 100) | 1,375,000 | 1,602,879 | |
| (St. Joseph Health Sys. Proj.) Series 2009 A, 5.75% 7/1/39 | 1,280,000 | 1,445,094 | |
| (Stanford Hosp. & Clinics Proj.) Series 2010 B, 5.75% 11/15/31 | 2,500,000 | 2,939,975 | |
| California Pub. Works Board Lease Rev.: | |||
| (Coalinga State Hosp. Proj.) Series 2013 E, 5% 6/1/26 | 2,400,000 | 2,846,256 | |
| (Dept. of Forestry & Fire Protection Proj.) Series 2007 E: | |||
| 5% 11/1/19 | 1,600,000 | 1,733,184 | |
| 5% 11/1/21 | 1,760,000 | 1,906,502 | |
| (Office of Emergency Svcs. Proj.) Series 2007 A, 5% 3/1/22 | 1,000,000 | 1,056,880 | |
| (Porterville Developmental Ctr. Hsg. Expansion and Recreation Complex Proj.) Series 2009 C, 6.25% 4/1/34 | 1,700,000 | 1,992,060 | |
| (Richmond Lab., Phase III Office Bldg. Proj.) Series B, 5.25% 11/1/25 (XL Cap. Assurance, Inc. Insured) | 2,585,000 | 2,594,952 | |
| (Univ. Proj.) Series 2011 B, 5.25% 10/1/27 | 3,500,000 | 4,145,855 | |
| (Various Cap. Proj.) Series 2012 G, 5% 11/1/24 | 650,000 | 775,242 | |
| (Various Cap. Projs.) Series 2012 A, 5% 4/1/24 | 3,190,000 | 3,775,493 | |
| Series 2009 G1, 5.75% 10/1/30 | 600,000 | 699,918 | |
| Series 2009 I: | |||
| 6.125% 11/1/29 | 400,000 | 475,008 | |
| 6.375% 11/1/34 | 1,000,000 | 1,203,280 | |
| Series 2010 A, 5.75% 3/1/30 | 1,000,000 | 1,169,070 | |
| California State Univ. Rev. Series 2009 A, 6% 11/1/40 | 3,400,000 | 3,924,858 | |
| California Statewide Cmntys. Dev. Auth. Rev. (St. Joseph Health Sys. Proj.) Series 2007 C, 5.75% 7/1/47 (FGIC Insured) | 1,000,000 | 1,096,860 | |
| Clovis Pub. Fing. Auth. Wastewtr. Rev. Series 2005, 5% 8/1/35 (Nat'l. Pub. Fin. Guarantee Corp. Insured) | 1,300,000 | 1,303,367 | |
| Long Beach Unified School District Series A, 5.5% 8/1/29 | 1,000,000 | 1,155,660 | |
| Los Angeles Muni. Impt. Corp. Lease Rev. Series 2012 C, 5% 3/1/25 | 1,455,000 | 1,684,046 | |
| Los Angeles Wastewtr. Sys. Rev. Series 2009 A: | |||
| 5.75% 6/1/34 | 890,000 | 1,024,532 | |
| 5.75% 6/1/34 (Pre-Refunded to 6/1/19 @ 100) | 1,110,000 | 1,300,254 | |
| Madera County Ctfs. of Prtn. (Children's Hosp. Central California Proj.) Series 2010, 5.375% 3/15/36 | 1,000,000 | 1,109,390 | |
| Monterey County Pub. Impt. Corp. Ctfs. of Prtn. Series 2007, 5% 8/1/19 (AMBAC Insured) | 1,000,000 | 1,067,260 | |
| Oakland Gen. Oblig. Series 2012, 5% 1/15/24 | 2,500,000 | 2,887,100 | |
| Oakland Unified School District Alameda County: | |||
| Series 2009 A, 6.25% 8/1/18 | 1,815,000 | 2,057,212 | |
| Series 2015 A, 5% 8/1/29 (FSA Insured) | 1,395,000 | 1,612,522 | |
| Poway Unified School District: | |||
| (District #2007-1 School Facilities Proj.) Series 2008 A, 0% 8/1/32 | 1,000,000 | 516,970 | |
| Series B, 0% 8/1/39 | 3,700,000 | 1,331,963 | |
| Poway Unified School District Pub. Fing. 5% 9/1/24 | 1,000,000 | 1,127,560 | |
| Sacramento City Fing. Auth. Rev. Series A, 0% 12/1/26 (FGIC Insured) | 800,000 | 540,624 | |
| Sacramento Muni. Util. District Elec. Rev. Series 2012 Y, 5% 8/15/28 | 2,200,000 | 2,625,722 | |
| San Bernardino County Ctfs. of Prtn. (Arrowhead Proj.) Series 2009 A, 5.25% 8/1/26 | 1,000,000 | 1,121,570 | |
| San Diego Convention Ctr. Expansion Series 2012 A, 5% 4/15/24 | 2,200,000 | 2,564,034 | |
| San Diego Unified School District: | |||
| Series 2008 C, 0% 7/1/39 | 4,700,000 | 1,733,783 | |
| Series 2008 E: | |||
| 0% 7/1/47 (a) | 1,300,000 | 662,688 | |
| 0% 7/1/49 | 4,600,000 | 1,020,786 | |
| San Francisco City & County Arpts. Commission Int'l. Arpt. Rev. Series 2014 A, 5% 5/1/44 (c) | 2,200,000 | 2,413,510 | |
| San Leandro Unified School District Series 2006 B, 6.25% 8/1/33 (Pre-Refunded to 8/1/18 @ 100) | 1,100,000 | 1,264,505 | |
| San Marcos Unified School District Series 2010 B, 0% 8/1/47 | 11,900,000 | 2,885,393 | |
| Santa Monica-Malibu Unified School District Series 1999, 0% 8/1/20 (Nat'l. Pub. Fin. Guarantee Corp. Insured) | 1,000,000 | 926,780 | |
| Sonoma County Jr. College District Rev. Series 2002, 5% 8/1/28 (FSA Insured) | 90,000 | 90,288 | |
| Sweetwater Union High School District Series 2008 A, 5.625% 8/1/47 (FSA Insured) | 6,300,000 | 6,816,537 | |
| Union Elementary School District Series A, 0% 9/1/20 (Nat'l. Pub. Fin. Guarantee Corp. Insured) | 1,000,000 | 921,570 | |
| Univ. of California Revs. Series O: | |||
| 5.25% 5/15/39 | 420,000 | 473,495 | |
| 5.25% 5/15/39 (Pre-Refunded to 5/15/19 @ 100) | 80,000 | 91,976 | |
| Washington Township Health Care District Gen. Oblig. Series 2013 B, 5.5% 8/1/38 | 1,000,000 | 1,160,060 | |
| Washington Township Health Care District Rev. Series 2010 A, 5.25% 7/1/30 | 1,100,000 | 1,171,324 | |
| West Contra Costa Unified School District: | |||
| (Election of 2005 Proj.) Series B, 5.625% 8/1/35 (Berkshire Hathaway Assurance Corp. Insured) | 700,000 | 783,685 | |
| Series 2012, 5% 8/1/26 | 2,000,000 | 2,340,820 | |
| TOTAL CALIFORNIA | 153,981,167 | ||
| Colorado - 0.7% | |||
| Colorado Health Facilities Auth. Retirement Hsg. Rev. (Liberty Heights Proj.): | |||
| Series B, 0% 7/15/20 (Escrowed to Maturity) | 1,200,000 | 1,119,180 | |
| 0% 7/15/22 (Escrowed to Maturity) | 1,385,000 | 1,208,163 | |
| Colorado Health Facilities Auth. Rev. (Valley View Hosp. Proj.) Series 2008, 5.75% 5/15/36 | 2,000,000 | 2,184,680 | |
| E-470 Pub. Hwy. Auth. Rev.: | |||
| Series 2000 B, 0% 9/1/20 (Nat'l. Pub. Fin. Guarantee Corp. Insured) | 1,500,000 | 1,353,585 | |
| Series 2010 C, 5.25% 9/1/25 | 1,000,000 | 1,116,040 | |
| TOTAL COLORADO | 6,981,648 | ||
| Connecticut - 0.3% | |||
| Eastern Connecticut Resources Recovery Auth. Solid Waste Rev. (Wheelabrator Lisbon Proj.) Series A, 5.5% 1/1/20 (c) | 3,350,000 | 3,398,006 | |
| District Of Columbia - 1.1% | |||
| District of Columbia Hosp. Rev. (Sibley Memorial Hosp. Proj.) Series 2009, 6.375% 10/1/39 (Pre-Refunded to 10/1/19 @ 100) | 1,860,000 | 2,244,629 | |
| District of Columbia Rev. Series B, 4.75% 6/1/32 | 500,000 | 538,685 | |
| Metropolitan Washington Arpts. Auth. Dulles Toll Road Rev. Series 2009 B: | |||
| 0% 10/1/28 (Assured Guaranty Corp. Insured) | 2,000,000 | 1,219,400 | |
| 0% 10/1/32 (Assured Guaranty Corp. Insured) | 5,080,000 | 2,515,616 | |
| 0% 10/1/33 (Assured Guaranty Corp. Insured) | 5,000,000 | 2,354,450 | |
| Washington D.C. Metropolitan Transit Auth. Rev. Series 2009 A, 5.25% 7/1/29 | 1,750,000 | 1,970,063 | |
| TOTAL DISTRICT OF COLUMBIA | 10,842,843 | ||
| Florida - 11.1% | |||
| Brevard County School Board Ctfs. of Prtn. Series 2015 C, 5% 7/1/26 | 750,000 | 885,278 | |
| Broward County Arpt. Sys. Rev. Series A: | |||
| 5% 10/1/28 (c)(d) | 500,000 | 576,585 | |
| 5% 10/1/31 (c)(d) | 1,000,000 | 1,133,220 | |
| Broward County School Board Ctfs. of Prtn.: | |||
| Series 2012 A, 5% 7/1/24 | 4,400,000 | 5,135,328 | |
| Series 2015 A: | |||
| 5% 7/1/24 | 325,000 | 389,574 | |
| 5% 7/1/26 | 1,200,000 | 1,432,104 | |
| 5% 7/1/27 | 1,000,000 | 1,181,300 | |
| Series 2015 B, 5% 7/1/24 | 815,000 | 976,932 | |
| Broward County Wtr. & Swr. Util. Rev. Series 2009 A, 5.25% 10/1/34 (Pre-Refunded to 10/1/18 @ 100) | 1,500,000 | 1,692,420 | |
| Citizens Property Ins. Corp.: | |||
| Series 2010 A1, 5% 6/1/17 (FSA Insured) | 1,000,000 | 1,068,700 | |
| Series 2011 A1, 5% 6/1/20 | 1,000,000 | 1,155,140 | |
| Series 2012 A1, 5% 6/1/21 | 1,500,000 | 1,759,590 | |
| Collier County Indl. Dev. Auth. Healthcare Facilities Rev. (NCH Healthcare Sys. Proj.) Series 2011, 6.25% 10/1/39 | 2,560,000 | 2,989,133 | |
| Duval County School Board Ctfs. of Prtn. Series 2015 B, 5% 7/1/28 | 2,060,000 | 2,397,531 | |
| Florida Board of Ed. Pub. Ed. Cap. Outlay: | |||
| Series 2006 C, 5% 6/1/29 | 800,000 | 860,376 | |
| Series A, 5.5% 6/1/38 | 400,000 | 444,112 | |
| Florida Dev. Fin. Corp. Healthcare Facility Rev. 6% 2/1/33 | 1,000,000 | 1,134,090 | |
| Florida Mid-Bay Bridge Auth. Rev.: | |||
| Series 2015 A, 5% 10/1/35 | 1,000,000 | 1,094,820 | |
| Series 2015 C, 5% 10/1/40 | 1,000,000 | 1,075,180 | |
| Florida Muni. Pwr. Agcy. Rev.: | |||
| (St. Lucie Proj.) Series 2012 A, 5% 10/1/26 | 600,000 | 701,664 | |
| Series 2009 A, 6.25% 10/1/31 | 500,000 | 591,910 | |
| Halifax Hosp. Med. Ctr. Rev.: | |||
| 4% 6/1/27 | 205,000 | 212,259 | |
| 5% 6/1/24 | 275,000 | 316,531 | |
| 5% 6/1/26 | 250,000 | 286,410 | |
| 5% 6/1/46 | 425,000 | 453,292 | |
| Highlands County Health Facilities Auth. Rev. (Adventist Health Sys./Sunbelt, Inc. Prog.): | |||
| Series 2005 B, 5% 11/15/30 (Pre-Refunded to 11/15/15 @ 100) | 70,000 | 70,104 | |
| Series 2008 B, 6% 11/15/37 | 2,000,000 | 2,301,600 | |
| Hillsborough County Indl. Dev.: | |||
| (Gen. Hosp. Proj.) Series 2006, 5% 10/1/36 | 1,015,000 | 1,044,953 | |
| (H Lee Moffitt Cancer Ctr. Proj.) Series A, 5% 7/1/19 | 2,230,000 | 2,382,041 | |
| (Tampa Gen. Hosp. Proj.) Series 2006, 5.25% 10/1/41 | 900,000 | 927,837 | |
| Hillsborough County Indl. Dev. Auth. Indl. Dev. Rev. (Health Facilities/Univ. Cmnty. Hosp. Proj.) Series 2008 B, 8% 8/15/32 (Pre-Refunded to 8/15/19 @ 101) | 1,000,000 | 1,263,540 | |
| Jacksonville Sales Tax Rev. Series 2012, 5% 10/1/25 | 1,000,000 | 1,171,530 | |
| Lake County School Board Ctfs. of Prtn. Series 2014 A, 5% 6/1/30 (FSA Insured) | 600,000 | 678,018 | |
| Lee County Arpt. Rev. Series 2011 A, 5.375% 10/1/32 (c) | 1,050,000 | 1,194,533 | |
| Miami-Dade County Aviation Rev.: | |||
| Series 2010 A: | |||
| 5.375% 10/1/41 | 1,500,000 | 1,695,045 | |
| 5.5% 10/1/30 | 1,000,000 | 1,167,930 | |
| Series 2012 A: | |||
| 5% 10/1/21 (c) | 1,900,000 | 2,216,122 | |
| 5% 10/1/22 (c) | 1,000,000 | 1,175,720 | |
| 5% 10/1/31 (c) | 1,500,000 | 1,647,585 | |
| Series 2014 A: | |||
| 5% 10/1/28 (c) | 1,000,000 | 1,142,700 | |
| 5% 10/1/36 (c) | 3,000,000 | 3,272,160 | |
| 5% 10/1/37 | 1,825,000 | 2,044,767 | |
| Series 2015 A, 5% 10/1/35 (c) | 1,500,000 | 1,647,990 | |
| Miami-Dade County Cap. Asset Acquisition Series 2012 A, 5% 10/1/23 | 750,000 | 893,423 | |
| Miami-Dade County Expressway Auth.: | |||
| Series 2014 A, 5% 7/1/44 | 500,000 | 546,980 | |
| Series 2014 B, 5% 7/1/28 | 1,000,000 | 1,155,600 | |
| Miami-Dade County School Board Ctfs. of Prtn.: | |||
| Series 2008 A, 5% 8/1/21 (AMBAC Insured) | 2,000,000 | 2,202,060 | |
| Series 2015 A: | |||
| 5% 5/1/27 (FSA Insured) | 780,000 | 914,355 | |
| 5% 5/1/29 | 4,075,000 | 4,628,467 | |
| Series 2015 B: | |||
| 5% 5/1/27 | 4,650,000 | 5,375,819 | |
| 5% 5/1/28 | 2,530,000 | 2,900,240 | |
| Series 2016 A, 5% 5/1/30 (d) | 3,620,000 | 4,080,573 | |
| Series 2016 B, 5% 8/1/26 (d) | 1,595,000 | 1,861,604 | |
| Miami-Dade County Transit Sales Surtax Rev. Series 2012, 5% 7/1/42 | 300,000 | 332,139 | |
| Miami-Dade County Wtr. & Swr. Rev. Series 2008 A, 5.25% 10/1/22 (FSA Insured) | 4,000,000 | 4,881,000 | |
| North Brevard County Hosp. District Rev.: | |||
| 5.75% 10/1/38 | 600,000 | 657,366 | |
| 5.75% 10/1/38 (Pre-Refunded to 10/1/18 @ 100) | 1,500,000 | 1,711,620 | |
| Orange County Health Facilities Auth.: | |||
| (Orlando Health, Inc.) Series 2009, 5.125% 10/1/26 | 1,005,000 | 1,130,143 | |
| Series 2012 A, 5% 10/1/42 | 2,350,000 | 2,459,957 | |
| Series 2012 B, 5% 10/1/42 | 1,000,000 | 1,046,790 | |
| Orange County School Board Ctfs. of Prtn. Series 2015 C, 5% 8/1/30 | 1,500,000 | 1,748,970 | |
| Orlando & Orange County Expressway Auth. Rev. Series 2012, 5% 7/1/23 | 500,000 | 598,575 | |
| Palm Beach County Health Facilities Auth. Hosp. Rev. Series 2014, 5% 12/1/31 | 500,000 | 554,790 | |
| Palm Beach County School Board Ctfs. of Prtn.: | |||
| Series 2014 B: | |||
| 5% 8/1/22 | 2,000,000 | 2,373,820 | |
| 5% 8/1/25 | 800,000 | 964,264 | |
| Series 2015 D: | |||
| 5% 8/1/28 | 680,000 | 797,252 | |
| 5% 8/1/29 | 2,330,000 | 2,706,062 | |
| 5% 8/1/30 | 2,405,000 | 2,764,740 | |
| 5% 8/1/31 | 2,415,000 | 2,758,848 | |
| South Lake County Hosp. District (South Lake Hosp., Inc.) Series 2009 A, 6% 4/1/29 | 1,400,000 | 1,569,330 | |
| Tallahassee Health Facilities Rev. Series 2015 A: | |||
| 4% 12/1/35 | 600,000 | 587,004 | |
| 5% 12/1/40 | 300,000 | 324,405 | |
| Tampa Tax Allocation (H. Lee Moffitt Cancer Ctr. Proj.) Series 2012 A, 5% 9/1/25 | 410,000 | 475,887 | |
| Volusia County School Board Ctfs. of Prtn. (Master Lease Prog.) Series 2014 B, 5% 8/1/26 | 340,000 | 399,935 | |
| TOTAL FLORIDA | 112,389,672 | ||
| Georgia - 3.0% | |||
| Atlanta Wtr. & Wastewtr. Rev.: | |||
| Series 2009 A: | |||
| 6% 11/1/25 (Pre-Refunded to 11/1/19 @ 100) | 3,000,000 | 3,589,440 | |
| 6.25% 11/1/39 (Pre-Refunded to 11/1/19 @ 100) | 3,500,000 | 4,221,840 | |
| 5% 11/1/28 | 1,000,000 | 1,187,760 | |
| Burke County Indl. Dev. Auth. Poll. Cont. Rev. Bonds (Oglethorpe Pwr. Corp. Vogtle Proj.) Series 2013 A, 2.4%, tender 4/1/20 (b) | 1,400,000 | 1,431,850 | |
| Colquitt County Dev. Auth. Rev.: | |||
| Series A, 0% 12/1/21 (Escrowed to Maturity) | 1,100,000 | 999,702 | |
| Series C, 0% 12/1/21 (Escrowed to Maturity) | 1,800,000 | 1,635,876 | |
| DeKalb County Hosp. Auth. Rev. (DeKalb Med. Ctr., Inc. Proj.) Series 2010: | |||
| 6% 9/1/30 | 1,400,000 | 1,542,310 | |
| 6.125% 9/1/40 | 1,605,000 | 1,741,473 | |
| Georgia Muni. Elec. Auth. Pwr. Rev.: | |||
| Series C, 5% 1/1/22 | 1,400,000 | 1,651,958 | |
| Series GG, 5% 1/1/23 | 800,000 | 958,128 | |
| Main Street Natural Gas, Inc. Georgia Gas Proj. Rev. Series A, 5.5% 9/15/21 | 930,000 | 1,090,127 | |
| Metropolitan Atlanta Rapid Transit Auth. Sales Tax Rev. Third Series 2009 A, 5.25% 7/1/36 | 2,500,000 | 2,827,700 | |
| Private Colleges & Univs. Auth. Rev.: | |||
| (The Savannah College of Art and Design Projs.) Series 2014, 5% 4/1/44 | 1,300,000 | 1,397,773 | |
| (The Savannah College of Arts and Design Projs.) Series 2014, 5% 4/1/30 | 800,000 | 894,144 | |
| Richmond County Hosp. Auth. (Univ. Health Svcs., Inc. Proj.) Series 2009, 5.5% 1/1/36 | 2,600,000 | 2,863,666 | |
| Washington Wilkes Payroll Dev. Auth. Rev. Series C, 0% 12/1/21 (Escrowed to Maturity) | 2,310,000 | 2,086,762 | |
| TOTAL GEORGIA | 30,120,509 | ||
| Idaho - 0.6% | |||
| Idaho Bond Bank Auth. Rev. Series 2008 C, 5.625% 9/15/26 (Pre-Refunded to 9/15/18 @ 100) | 1,415,000 | 1,608,770 | |
| Idaho Health Facilities Auth. Rev.: | |||
| (St. Luke's Health Sys. Proj.) Series 2008 A, 6.75% 11/1/37 | 1,200,000 | 1,363,224 | |
| (Trinity Health Group Proj.) 2008 B, 6.25% 12/1/33 (Pre-Refunded to 12/1/18 @ 100) | 400,000 | 465,152 | |
| Series 2015 ID, 5.5% 12/1/26 | 1,540,000 | 1,917,839 | |
| 5% 12/1/24 | 1,000,000 | 1,211,780 | |
| TOTAL IDAHO | 6,566,765 | ||
| Illinois - 19.9% | |||
| Chicago Board of Ed.: | |||
| Series 1999 A: | |||
| 0% 12/1/16 (Nat'l. Pub. Fin. Guarantee Corp. Insured) | 1,300,000 | 1,259,050 | |
| 0% 12/1/18 (Nat'l. Pub. Fin. Guarantee Corp. Insured) | 1,000,000 | 895,010 | |
| Series 2008 C: | |||
| 5.25% 12/1/23 | 360,000 | 352,343 | |
| 5.25% 12/1/24 | 245,000 | 238,444 | |
| Series 2009 D, 4% 12/1/16 (Assured Guaranty Corp. Insured) | 235,000 | 240,022 | |
| Series 2010 F, 5% 12/1/20 | 195,000 | 192,588 | |
| Series 2011 A: | |||
| 5% 12/1/41 | 1,355,000 | 1,171,059 | |
| 5.25% 12/1/41 | 905,000 | 808,409 | |
| Series 2012 A, 5% 12/1/42 | 525,000 | 452,629 | |
| Chicago Gen. Oblig.: | |||
| (City Colleges Proj.): | |||
| Series 1999, 0% 1/1/16 (Nat'l. Pub. Fin. Guarantee Corp. Insured) | 6,125,000 | 6,099,091 | |
| 0% 1/1/24 (Nat'l. Pub. Fin. Guarantee Corp. Insured) | 6,110,000 | 4,103,354 | |
| Series 2008 A, 5.25% 1/1/21 | 1,160,000 | 1,179,302 | |
| Series 2009 A, 5% 1/1/22 | 305,000 | 308,056 | |
| Series 2012 A: | |||
| 5% 1/1/33 | 875,000 | 873,941 | |
| 5% 1/1/34 | 455,000 | 453,894 | |
| Series 2012 C, 5% 1/1/23 | 770,000 | 778,894 | |
| Series A, 5% 1/1/42 (AMBAC Insured) | 15,000 | 14,615 | |
| 5% 1/1/34 | 2,000,000 | 1,995,140 | |
| 5% 1/1/35 | 1,650,000 | 1,643,846 | |
| Chicago Midway Arpt. Rev. Series 2014 A, 5% 1/1/28 (c) | 4,200,000 | 4,606,056 | |
| Chicago O'Hare Int'l. Arpt. Rev.: | |||
| Series 2005 A, 5.25% 1/1/23 (Nat'l. Pub. Fin. Guarantee Corp. Insured) | 1,000,000 | 1,008,120 | |
| Series 2006 B, 5% 1/1/26 (Nat'l. Pub. Fin. Guarantee Corp. Insured) (c) | 1,405,000 | 1,467,705 | |
| Series 2011 C, 6.5% 1/1/41 | 2,335,000 | 2,785,538 | |
| Series 2013 D, 5% 1/1/27 | 2,200,000 | 2,496,626 | |
| Chicago Park District Gen. Oblig.: | |||
| Series 2010 C, 5.25% 1/1/37 | 1,300,000 | 1,393,145 | |
| Series 2013 A: | |||
| 5.5% 1/1/33 | 500,000 | 556,525 | |
| 5.75% 1/1/38 | 1,000,000 | 1,135,640 | |
| Series 2014 C, 5% 1/1/25 | 1,740,000 | 1,949,983 | |
| Chicago Transit Auth. Series 2014, 5.25% 12/1/49 | 5,000,000 | 5,357,500 | |
| Cmnty. College District #525 Gen. Oblig.: | |||
| 5.75% 6/1/28 | 625,000 | 697,225 | |
| 5.75% 6/1/28 (Pre-Refunded to 6/1/18 @ 100) | 375,000 | 421,905 | |
| Cook County Forest Preservation District Series 2012 C, 5% 12/15/21 | 1,000,000 | 1,130,600 | |
| Cook County Gen. Oblig.: | |||
| Series 2006 B, 5% 11/15/18 (Nat'l. Pub. Fin. Guarantee Corp. Insured) | 1,000,000 | 1,061,040 | |
| Series 2010 A, 5.25% 11/15/33 | 3,250,000 | 3,404,765 | |
| Series 2012 C: | |||
| 5% 11/15/24 | 1,700,000 | 1,851,062 | |
| 5% 11/15/25 (FSA Insured) | 2,600,000 | 2,837,796 | |
| Grundy, Kendall & Will County Cmnty. High School District #111 Gen. Oblig. Series 2006, 5.5% 5/1/23 | 985,000 | 1,006,975 | |
| Illinois Fin. Auth. Hosp. Rev. (KishHealth Sys. Proj.) Series 2008, 5.75% 10/1/35 | 1,600,000 | 1,772,976 | |
| Illinois Fin. Auth. Rev.: | |||
| (Advocate Health Care Proj.) Series 2008 D, 6.5% 11/1/38 (Pre-Refunded to 11/1/18 @ 100) | 1,000,000 | 1,163,960 | |
| (Central DuPage Health Proj.) Series 2009 B, 5.375% 11/1/39 | 1,200,000 | 1,338,504 | |
| (Children's Memorial Hosp. Proj.) Series 2008 A, 5.25% 8/15/33 (Assured Guaranty Corp. Insured) | 1,300,000 | 1,410,370 | |
| (Edward Hosp. Obligated Group Proj.) Series 2008 A, 5.5% 2/1/40 (AMBAC Insured) | 1,485,000 | 1,593,583 | |
| (Newman Foundation Proj.) 5% 2/1/32 (Radian Asset Assurance, Inc. Insured) | 1,700,000 | 1,721,726 | |
| (Northwest Cmnty. Hosp. Proj.) Series 2008 A, 5.5% 7/1/38 | 1,930,000 | 2,098,219 | |
| (Northwestern Memorial Hosp. Proj.) Series 2009 A, 6% 8/15/39 | 2,310,000 | 2,647,468 | |
| (Palos Cmnty. Hosp. Proj.) Series 2010 C: | |||
| 5.375% 5/15/25 | 5,000,000 | 5,781,400 | |
| 5.375% 5/15/30 | 1,110,000 | 1,259,117 | |
| (Provena Health Proj.) Series 2010 A, 6% 5/1/28 | 2,700,000 | 3,100,383 | |
| (Rush Univ. Med. Ctr. Proj.): | |||
| Series 2009 C, 6.625% 11/1/39 (Pre-Refunded to 5/1/19 @ 100) | 1,500,000 | 1,787,100 | |
| Series 2009 D, 6.625% 11/1/39 (Pre-Refunded to 5/1/19 @ 100) | 1,445,000 | 1,721,573 | |
| Series B, 5.25% 11/1/35 (Pre-Refunded to 11/1/18 @ 100) | 2,905,000 | 3,274,429 | |
| (Silver Cross Hosp. and Med. Ctr. Proj.) Series 2008 A, 5.5% 8/15/30 | 350,000 | 376,653 | |
| (Southern Illinois Healthcare Enterprises, Inc. Proj.) Series 2005, 5.25% 3/1/30 | 1,100,000 | 1,228,986 | |
| Series 2008 A: | |||
| 5.625% 1/1/37 | 5,115,000 | 5,449,726 | |
| 6.25% 2/1/33 (AMBAC Insured) | 150,000 | 164,352 | |
| Series 2009 A, 7.25% 11/1/38 (Pre-Refunded to 11/1/18 @ 100) | 1,330,000 | 1,577,433 | |
| Series 2009: | |||
| 6.875% 8/15/38 (Pre-Refunded to 8/15/19 @ 100) | 80,000 | 96,994 | |
| 7% 8/15/44 (Pre-Refunded to 8/15/19 @ 100) | 2,850,000 | 3,468,564 | |
| Series 2010 A: | |||
| 5.5% 8/15/24 | 545,000 | 607,909 | |
| 5.75% 8/15/29 | 360,000 | 398,711 | |
| Series 2012 A: | |||
| 5% 5/15/20 | 500,000 | 569,075 | |
| 5% 5/15/23 | 300,000 | 346,296 | |
| Series 2012: | |||
| 4% 9/1/32 | 1,315,000 | 1,260,428 | |
| 5% 9/1/32 | 1,900,000 | 2,050,062 | |
| 5% 9/1/38 | 2,300,000 | 2,453,042 | |
| 5% 11/15/43 | 820,000 | 870,332 | |
| Series 2013: | |||
| 5% 11/15/24 | 500,000 | 577,690 | |
| 5% 11/15/27 | 100,000 | 112,659 | |
| 5% 5/15/43 | 1,700,000 | 1,746,648 | |
| 5% 11/15/21 | 600,000 | 702,522 | |
| 5% 8/15/35 | 1,035,000 | 1,129,423 | |
| 5% 8/15/44 | 5,600,000 | 6,012,664 | |
| Illinois Gen. Oblig.: | |||
| Series 2006: | |||
| 5% 1/1/19 | 1,000,000 | 1,074,800 | |
| 5.5% 1/1/31 | 1,000,000 | 1,112,460 | |
| Series 2010: | |||
| 5% 1/1/21 (FSA Insured) | 500,000 | 541,040 | |
| 5% 1/1/23 (FSA Insured) | 1,300,000 | 1,386,723 | |
| Series 2012 A, 5% 1/1/33 | 800,000 | 823,864 | |
| Series 2012: | |||
| 5% 8/1/19 | 465,000 | 503,665 | |
| 5% 8/1/21 | 400,000 | 438,792 | |
| 5% 3/1/23 | 1,000,000 | 1,084,990 | |
| 5% 8/1/23 | 700,000 | 765,660 | |
| 5% 3/1/36 | 1,000,000 | 1,026,090 | |
| Series 2013 A, 5% 4/1/35 | 300,000 | 308,967 | |
| Series 2013, 5% 1/1/22 | 2,175,000 | 2,305,326 | |
| Series 2014: | |||
| 5% 2/1/22 | 1,000,000 | 1,094,550 | |
| 5% 5/1/32 | 500,000 | 521,425 | |
| 5.25% 2/1/29 | 1,600,000 | 1,714,768 | |
| Illinois Health Facilities Auth. Rev. (Delnor-Cmnty. Hosp. Proj.): | |||
| Series 2002 D, 5.25% 5/15/32 (FSA Insured) | 2,000,000 | 2,162,700 | |
| 5.25% 5/15/32 (FSA Insured) | 360,000 | 389,286 | |
| Illinois Muni. Elec. Agcy. Pwr. Supply Series 2015 A, 5% 2/1/26 | 17,545,000 | 20,798,882 | |
| Illinois Toll Hwy. Auth. Toll Hwy. Rev. Series 2015 A, 5% 1/1/40 | 2,300,000 | 2,548,745 | |
| Joliet School District #86 Gen. Oblig. Series 2002, 0% 11/1/19 (FSA Insured) | 2,000,000 | 1,819,760 | |
| Kane, McHenry, Cook & DeKalb Counties Unit School District #300: | |||
| 0% 12/1/17 (AMBAC Insured) | 905,000 | 879,723 | |
| 0% 12/1/17 (Escrowed to Maturity) | 95,000 | 93,246 | |
| 6.5% 1/1/20 (AMBAC Insured) | 385,000 | 461,623 | |
| 6.5% 1/1/20 (Escrowed to Maturity) | 650,000 | 790,498 | |
| 6.5% 1/1/20 (Escrowed to Maturity) | 65,000 | 79,050 | |
| Lake County Cmnty. Consolidated School District #73 Gen. Oblig. 0% 12/1/16 (Nat'l. Pub. Fin. Guarantee Corp. Insured) | 765,000 | 756,111 | |
| Lake County Cmnty. High School District #117, Antioch Series 2000 B, 0% 12/1/20 (Nat'l. Pub. Fin. Guarantee Corp. Insured) | 1,805,000 | 1,595,963 | |
| McHenry & Kane Counties Cmnty. Consolidated School District #158 Series 2004, 0% 1/1/24 (FSA Insured) | 800,000 | 612,032 | |
| Metropolitan Pier & Exposition: | |||
| (McCormick Place Expansion Proj.): | |||
| Series 1994 A, 0% 6/15/19 (Nat'l. Pub. Fin. Guarantee Corp. Insured) | 3,710,000 | 3,455,012 | |
| Series 1996 A, 0% 6/15/23 (Nat'l. Pub. Fin. Guarantee Corp. Insured) | 1,000,000 | 776,500 | |
| Series 2002 A: | |||
| 0% 12/15/30 (Nat'l. Pub. Fin. Guarantee Corp. Insured) | 5,900,000 | 3,074,254 | |
| 0% 6/15/36 (Nat'l. Pub. Fin. Guarantee Corp. Insured) | 1,080,000 | 391,792 | |
| Series 2010 B1: | |||
| 0% 6/15/43 (FSA Insured) | 5,310,000 | 1,332,438 | |
| 0% 6/15/44 (FSA Insured) | 4,700,000 | 1,118,647 | |
| 0% 6/15/45 (FSA Insured) | 2,600,000 | 586,846 | |
| 0% 6/15/47 (FSA Insured) | 2,040,000 | 413,855 | |
| Series 2012 B, 0% 12/15/51 | 2,900,000 | 391,732 | |
| Series A: | |||
| 0% 6/15/22 (Nat'l. Pub. Fin. Guarantee Corp. Insured) | 1,265,000 | 1,036,162 | |
| 0% 12/15/24 (Nat'l. Pub. Fin. Guarantee Corp. Insured) | 3,090,000 | 2,230,208 | |
| 0% 6/15/16 | 1,615,000 | 1,604,260 | |
| 0% 6/15/16 (Escrowed to Maturity) | 265,000 | 264,465 | |
| Quincy Hosp. Rev. Series 2007, 5% 11/15/18 | 1,000,000 | 1,081,890 | |
| Univ. of Illinois Board of Trustees Ctfs. of Prtn. Series 2009 A, 5% 10/1/18 | 425,000 | 459,833 | |
| Univ. of Illinois Rev.: | |||
| (Auxiliary Facilities Sys. Proj.): | |||
| Series 1999 A, 0% 4/1/20 (Nat'l. Pub. Fin. Guarantee Corp. Insured) | 1,600,000 | 1,435,888 | |
| Series 2009 A, 5.75% 4/1/38 (Pre-Refunded to 4/1/19 @ 100) | 2,940,000 | 3,408,930 | |
| Series 2010 A: | |||
| 5% 4/1/25 | 1,000,000 | 1,130,480 | |
| 5.25% 4/1/30 | 1,000,000 | 1,139,640 | |
| Series 2013: | |||
| 6% 10/1/42 | 900,000 | 1,036,107 | |
| 6.25% 10/1/38 | 900,000 | 1,023,669 | |
| Will County Cmnty. Unit School District #365-U: | |||
| 0% 11/1/16 (FSA Insured) | 825,000 | 816,717 | |
| 0% 11/1/19 (Escrowed to Maturity) | 790,000 | 751,069 | |
| 0% 11/1/19 (FSA Insured) | 5,085,000 | 4,717,151 | |
| TOTAL ILLINOIS | 201,467,154 | ||
| Indiana - 3.0% | |||
| Hobart Bldg. Corp. Series 2006, 6.5% 1/15/29 (Nat'l. Pub. Fin. Guarantee Corp. Insured) | 3,700,000 | 4,478,295 | |
| Indiana Fin. Auth. Health Sys. Rev. (Sisters of Saint Francis Health Svcs., Inc. Obligated Group Proj.) Series 2009 A, 5.25% 11/1/39 | 1,000,000 | 1,108,670 | |
| Indiana Fin. Auth. Rev.: | |||
| (Trinity Health Cr. Group Proj.) Series 2009 A, 5.25% 12/1/38 | 2,000,000 | 2,215,880 | |
| Series 2012: | |||
| 5% 3/1/30 | 675,000 | 746,078 | |
| 5% 3/1/41 | 1,290,000 | 1,382,983 | |
| Series 2015 A, 5.25% 2/1/32 | 1,040,000 | 1,219,078 | |
| Indiana Fin. Auth. Wastewtr. Util. Rev. (CWA Auth. Proj.): | |||
| Series 2012 A, 5% 10/1/24 | 400,000 | 473,380 | |
| Series 2015 A: | |||
| 5% 10/1/28 | 1,000,000 | 1,170,650 | |
| 5% 10/1/45 | 4,340,000 | 4,809,892 | |
| Indiana Trans. Fin. Auth. Hwy. Rev. Series 1993 A, 0% 6/1/17 (AMBAC Insured) | 1,000,000 | 985,650 | |
| Jasper County Indl. Poll. Ctl. Rev. (Northern Indiana Pub. Svc. Co. Proj.) Series 1988 C, 5.6% 11/1/16 (Nat'l. Pub. Fin. Guarantee Corp. Insured) | 1,000,000 | 1,045,070 | |
| Lake Central Multi-District School Bldg. Corp. Series 2012 B, 5% 7/15/26 | 4,900,000 | 5,684,637 | |
| North Adams Cmnty. Schools Renovation Bldg. Corp. 0% 1/15/17 (FSA Insured) | 1,230,000 | 1,217,282 | |
| Purdue Univ. Rev. (Student Facilities Sys. Proj.) Series 2009 B, 5% 7/1/28 | 660,000 | 749,239 | |
| Univ. of Southern Indiana Rev. Series J, 5.75% 10/1/28 (Assured Guaranty Corp. Insured) | 2,695,000 | 3,143,798 | |
| TOTAL INDIANA | 30,430,582 | ||
| Iowa - 0.1% | |||
| Iowa Fin. Auth. Health Facilities Rev. Series 2008 A, 5.625% 8/15/37 (Assured Guaranty Corp. Insured) | 1,200,000 | 1,350,132 | |
| Kansas - 0.6% | |||
| Kansas Dev. Fin. Agcy. (Adventist Health Sys./Sunbelt Obligated Group Proj.) Series 2009 C, 5.75% 11/15/38 | 1,900,000 | 2,165,867 | |
| Kansas Dev. Fin. Auth. Health Facilities Rev. (Hays Med. Ctr. Proj.) Series 2005 L, 5.25% 11/15/15 | 335,000 | 335,590 | |
| Overland Park Sales Tax Spl. Oblig. Rev. Series 2012, 4.375% 12/15/23 | 870,000 | 806,046 | |
| Wichita Hosp. Facilities Rev. (Via Christi Health Sys., Inc. Proj.) Series 2009 X, 4% 11/15/18 (Escrowed to Maturity) | 300,000 | 327,459 | |
| Wyandotte County/Kansas City Unified Govt. Util. Sys. Rev. Series 2012 A, 5% 9/1/26 | 1,950,000 | 2,240,882 | |
| TOTAL KANSAS | 5,875,844 | ||
| Kentucky - 0.8% | |||
| Kentucky Econ. Dev. Fin. Auth. Hosp. Rev.: | |||
| (St. Elizabeth Med. Ctr., Inc. Proj.) Series 2009 A, 5.5% 5/1/39 | 1,000,000 | 1,113,180 | |
| Series 2010 A, 6% 6/1/30 | 315,000 | 356,460 | |
| Series 2015 A: | |||
| 4.5% 6/1/46 | 520,000 | 517,842 | |
| 5.25% 6/1/50 | 3,165,000 | 3,340,341 | |
| Kentucky Econ. Dev. Fin. Auth. Rev. (Ashland Hosp. Corp. d/b/a King's Daughters Med. Ctr. Proj.) Series 2010 A, 5% 2/1/30 | 1,000,000 | 1,063,060 | |
| Louisville & Jefferson County Series 2013 A: | |||
| 5.5% 10/1/33 | 500,000 | 571,515 | |
| 5.75% 10/1/38 | 1,355,000 | 1,559,944 | |
| TOTAL KENTUCKY | 8,522,342 | ||
| Louisiana - 1.0% | |||
| Louisiana Citizens Property Ins. Corp. Assessment Rev. Series 2015, 5% 6/1/20 | 1,250,000 | 1,435,563 | |
| Louisiana Pub. Facilities Auth. Hosp. Rev. (Franciscan Missionaries of Our Lady Health Sys. Proj.) Series 2009, 6.75% 7/1/39 (Pre-Refunded to 7/1/19 @ 100) | 400,000 | 481,292 | |
| New Orleans Aviation Board Rev.: | |||
| (North Term. Proj.) Series 2015 B, 5% 1/1/30 (c) | 1,000,000 | 1,114,130 | |
| Series 2007 A, 5.25% 1/1/19 (FSA Insured) (c) | 1,570,000 | 1,683,778 | |
| New Orleans Gen. Oblig.: | |||
| Series 2005, 5.25% 12/1/23 (Nat'l. Pub. Fin. Guarantee Corp. Insured) | 1,000,000 | 1,003,610 | |
| Series 2012, 5% 12/1/23 | 2,250,000 | 2,628,540 | |
| Tobacco Settlement Fing. Corp. Series 2013 A, 5% 5/15/23 | 1,200,000 | 1,384,272 | |
| TOTAL LOUISIANA | 9,731,185 | ||
| Maine - 0.2% | |||
| Maine Health & Higher Ed. Facilities Auth. Rev. Series 2008 D, 5.75% 7/1/38 | 1,100,000 | 1,216,501 | |
| Maine Tpk. Auth. Tpk. Rev. Series 2015, 5% 7/1/38 | 670,000 | 761,140 | |
| TOTAL MAINE | 1,977,641 | ||
| Maryland - 0.6% | |||
| Baltimore Proj. Rev. (Wtr. Projs.) Series 2009 A: | |||
| 5.375% 7/1/34 | 315,000 | 359,859 | |
| 5.375% 7/1/34 (Pre-Refunded to 7/1/19 @ 100) | 185,000 | 213,856 | |
| Maryland Health & Higher Edl. Facilities Auth. Rev.: | |||
| (Doctors Cmnty. Hosp. Proj.) Series 2010, 5.75% 7/1/38 | 1,010,000 | 1,070,721 | |
| (Univ. of Maryland Med. Sys. Proj.): | |||
| Series 2008 F, 5.25% 7/1/21 | 1,000,000 | 1,104,800 | |
| Series 2010, 5.125% 7/1/39 | 900,000 | 976,815 | |
| (Upper Chesapeake Hosp. Proj.) Series 2008 C, 5.5% 1/1/18 (Escrowed to Maturity) | 375,000 | 395,258 | |
| Series 2010, 5.625% 7/1/30 | 500,000 | 535,070 | |
| Series 2015, 5% 7/1/40 | 1,000,000 | 1,076,090 | |
| TOTAL MARYLAND | 5,732,469 | ||
| Massachusetts - 0.5% | |||
| Massachusetts Dev. Fin. Agcy. Rev.: | |||
| (Boston Univ. Proj.) Series U4, 5.7% 10/1/40 | 1,400,000 | 1,605,716 | |
| Series 2011 I, 6.75% 1/1/36 | 1,000,000 | 1,154,150 | |
| Series 2015 D, 5% 7/1/44 | 890,000 | 957,720 | |
| Massachusetts Health & Edl. Facilities Auth. Rev. (CareGroup, Inc. Proj.) Series 2008 E1, 5.125% 7/1/33 | 1,000,000 | 1,073,220 | |
| TOTAL MASSACHUSETTS | 4,790,806 | ||
| Michigan - 2.4% | |||
| Detroit Swr. Disp. Rev.: | |||
| Series 2001 E, 5.75% 7/1/31 (Berkshire Hathaway Assurance Corp. Insured) (FGIC Insured) | 500,000 | 548,565 | |
| Series 2006 B, 5% 7/1/36 (Nat'l. Pub. Fin. Guarantee Corp. Insured) | 2,800,000 | 2,815,512 | |
| Detroit Wtr. Supply Sys. Rev. Series 2006 B, 7% 7/1/36 (FSA Insured) | 1,000,000 | 1,129,780 | |
| Lansing Board of Wtr. & Lt. Util. Rev. 5.5% 7/1/41 | 500,000 | 584,420 | |
| Lapeer Cmnty. Schools 5.25% 5/1/26 (FSA Insured) | 1,100,000 | 1,210,462 | |
| Michigan Bldg. Auth. Rev. (Facilities Prog.) Series 2015 I, 5% 4/15/30 | 5,000,000 | 5,831,050 | |
| Michigan Fin. Auth. Rev.: | |||
| Series 2012 A: | |||
| 4.125% 6/1/32 (Pre-Refunded to 6/1/22 @ 100) | 1,150,000 | 1,326,640 | |
| 5% 6/1/21 (Escrowed to Maturity) | 350,000 | 416,308 | |
| 5% 6/1/27 (Pre-Refunded to 6/1/22 @ 100) | 500,000 | 603,955 | |
| 5% 6/1/39 (Pre-Refunded to 6/1/22 @ 100) | 1,100,000 | 1,328,701 | |
| Series 2012, 5% 11/15/42 | 2,175,000 | 2,341,627 | |
| Michigan Hosp. Fin. Auth. Rev.: | |||
| (McLaren Health Care Corp. Proj.) Series 2008 A, 5.75% 5/15/38 (Pre-Refunded to 5/15/18 @ 100) | 1,000,000 | 1,121,880 | |
| Series 2008 A1: | |||
| 6.5% 12/1/33 | 515,000 | 588,748 | |
| 6.5% 12/1/33 (Pre-Refunded to 12/1/18 @ 100) | 1,985,000 | 2,323,343 | |
| Royal Oak Hosp. Fin. Auth. Hosp. Rev. (William Beaumont Hosp. Proj.) Series 2009 V, 8.25% 9/1/39 (Pre-Refunded to 9/1/18 @ 100) | 600,000 | 722,166 | |
| Willow Run Cmnty. Schools County of Washtenaw 5% 5/1/20 (FSA Insured) | 1,000,000 | 1,003,370 | |
| TOTAL MICHIGAN | 23,896,527 | ||
| Minnesota - 0.6% | |||
| Duluth Independent School District #709 Ctfs. of Prtn. Series 2009 B, 4% 3/1/20 | 1,620,000 | 1,669,815 | |
| Minneapolis Health Care Sys. Rev.: | |||
| 6.5% 11/15/38 | 845,000 | 943,316 | |
| 6.5% 11/15/38 (Pre-Refunded to 11/15/18 @ 100) | 155,000 | 180,232 | |
| Minnesota Gen. Oblig. 5% 8/1/22 (Pre-Refunded to 8/1/17 @ 100) | 25,000 | 26,903 | |
| Rochester Hsg. & Healthcare Rev. (Madonna Towers Proj.) Series A, 5.875% 11/1/28 | 1,100,000 | 1,118,865 | |
| St. Louis Park Health Care Facilities Rev. (Park Nicollet Health Svcs. Proj.) Series 2009, 5.75% 7/1/39 (Pre-Refunded to 7/1/19 @ 100) | 1,600,000 | 1,871,056 | |
| TOTAL MINNESOTA | 5,810,187 | ||
| Missouri - 0.3% | |||
| Missouri Health & Edl. Facilities Auth. Edl. Facilities Rev. Series 2015 B: | |||
| 3.125% 2/1/27 | 200,000 | 196,728 | |
| 3.25% 2/1/28 | 200,000 | 196,616 | |
| 4% 2/1/40 | 100,000 | 98,634 | |
| 5% 2/1/29 | 1,240,000 | 1,402,192 | |
| 5% 2/1/36 | 400,000 | 437,732 | |
| 5% 2/1/45 | 600,000 | 649,488 | |
| TOTAL MISSOURI | 2,981,390 | ||
| Nebraska - 0.3% | |||
| Central Plains Energy Proj. Rev. (Nebraska Gas Proj.) Series 2007 B, 0.717% 12/1/17 (b) | 1,100,000 | 1,086,470 | |
| Douglas County Hosp. Auth. #2 Health Facilities Rev. 6% 8/15/24 | 740,000 | 805,261 | |
| Nebraska Pub. Pwr. District Rev. Series 2012 C, 5% 1/1/26 | 1,225,000 | 1,324,960 | |
| TOTAL NEBRASKA | 3,216,691 | ||
| Nevada - 0.1% | |||
| Clark County Wtr. Reclamation District Series 2009 A, 5.25% 7/1/29 (Berkshire Hathaway Assurance Corp. Insured) | 1,000,000 | 1,140,660 | |
| New Hampshire - 0.4% | |||
| New Hampshire Bus. Fin. Auth. Rev. Series 2009 A, 6.125% 10/1/39 | 1,830,000 | 2,026,542 | |
| New Hampshire Health & Ed. Facilities Auth. Rev.: | |||
| Series 2007 A, 5% 10/1/37 | 1,100,000 | 1,161,259 | |
| Series 2012: | |||
| 4% 7/1/32 | 400,000 | 393,764 | |
| 5% 7/1/27 | 500,000 | 544,800 | |
| TOTAL NEW HAMPSHIRE | 4,126,365 | ||
| New Jersey - 2.8% | |||
| New Jersey Ctfs. of Prtn. Series 2009 A, 5.25% 6/15/28 | 1,000,000 | 1,069,400 | |
| New Jersey Econ. Dev. Auth. Rev.: | |||
| Series 2009 AA, 5.5% 12/15/29 | 1,000,000 | 1,082,490 | |
| Series 2013 NN, 5% 3/1/27 | 11,810,000 | 12,422,585 | |
| Series 2013: | |||
| 5% 3/1/23 | 2,200,000 | 2,373,140 | |
| 5% 3/1/24 | 3,000,000 | 3,212,310 | |
| 5% 3/1/25 | 300,000 | 318,870 | |
| 6% 12/15/34 (Pre-Refunded to 12/15/34 @ 100) | 25,000 | 27,883 | |
| New Jersey Health Care Facilities Fing. Auth. Rev. Series 2008, 6.625% 7/1/38 | 1,700,000 | 1,878,738 | |
| New Jersey Trans. Trust Fund Auth.: | |||
| Series 2005 B, 5.25% 12/15/22 (AMBAC Insured) | 400,000 | 445,596 | |
| Series 2014 AA, 5% 6/15/23 | 5,250,000 | 5,677,350 | |
| TOTAL NEW JERSEY | 28,508,362 | ||
| New Mexico - 0.2% | |||
| New Mexico Edl. Assistance Foundation Series 2010 A1, 5% 12/1/19 | 2,000,000 | 2,294,480 | |
| New York - 8.7% | |||
| Hudson Yards Infrastructure Corp. New York Rev. Series 2012 A, 5.75% 2/15/47 | 2,700,000 | 3,071,277 | |
| Metropolitan Trans. Auth. Svc. Contract Rev. Series 7, 5.625% 7/1/16 (Escrowed to Maturity) | 75,000 | 75,293 | |
| New York City Gen. Oblig.: | |||
| Series 2007 D1, 5.125% 12/1/22 | 990,000 | 1,081,377 | |
| Series 2008 A1, 5.25% 8/15/27 | 1,500,000 | 1,669,110 | |
| Series 2009 I1, 5.625% 4/1/29 | 600,000 | 689,052 | |
| Series 2012 A1, 5% 8/1/24 | 1,300,000 | 1,533,701 | |
| Series 2012 E, 5% 8/1/24 | 5,000,000 | 5,879,100 | |
| Series 2012 G1, 5% 4/1/25 | 2,500,000 | 2,942,375 | |
| New York City Indl. Dev. Agcy. Civic Facility Rev. (Polytechnic Univ. NY Proj.) 5.25% 11/1/27 (ACA Finl. Guaranty Corp. Insured) | 600,000 | 653,778 | |
| New York City Muni. Wtr. Fin. Auth. Wtr. & Swr. Sys. Rev.: | |||
| Series 2009 A, 5.75% 6/15/40 | 2,300,000 | 2,577,334 | |
| Series 2009 CC, 5% 6/15/34 | 2,100,000 | 2,297,883 | |
| Series 2009 FF 2, 5.5% 6/15/40 | 3,000,000 | 3,433,080 | |
| Series 2011 EE, 5.375% 6/15/43 | 4,000,000 | 4,691,280 | |
| Series 2013 CC, 5% 6/15/47 | 4,000,000 | 4,440,160 | |
| New York City Transitional Fin. Auth. Bldg. Aid Rev.: | |||
| Series 2009 S1, 5.5% 7/15/31 | 1,000,000 | 1,121,720 | |
| Series 2009 S3: | |||
| 5.25% 1/15/34 | 2,500,000 | 2,791,550 | |
| 5.25% 1/15/39 | 1,000,000 | 1,109,660 | |
| Series 2009 S4: | |||
| 5.5% 1/15/39 | 850,000 | 963,433 | |
| 5.75% 1/15/39 | 1,600,000 | 1,826,016 | |
| Series 2015 S1, 5% 7/15/43 | 5,000,000 | 5,597,700 | |
| Series 2015 S2, 5% 7/15/35 | 1,770,000 | 2,024,207 | |
| New York Dorm. Auth. Personal Income Tax Rev.: | |||
| (Ed. Proj.) Series 2008 B, 5.75% 3/15/36 | 3,400,000 | 3,904,832 | |
| 5% 2/15/34 | 1,100,000 | 1,225,015 | |
| New York Dorm. Auth. Revs. (New York Univ. Hosp. Ctr. Proj.) Series 2007 B, 5.25% 7/1/24 (Pre-Refunded to 7/1/17 @ 100) | 95,000 | 101,194 | |
| New York Metropolitan Trans. Auth. Dedicated Tax Fund Rev.: | |||
| Series 2009 A, 5.5% 11/15/39 | 5,000,000 | 5,628,400 | |
| Series 2009 B, 5% 11/15/34 | 1,200,000 | 1,362,660 | |
| New York Metropolitan Trans. Auth. Rev.: | |||
| Series 2003 B, 5.25% 11/15/19 (Nat'l. Pub. Fin. Guarantee Corp. Insured) | 1,900,000 | 2,201,074 | |
| Series 2008 A, 5.25% 11/15/36 | 3,700,000 | 3,983,420 | |
| Series 2008 C, 6.5% 11/15/28 | 1,000,000 | 1,166,390 | |
| Series 2010 D, 5.25% 11/15/40 | 1,400,000 | 1,596,560 | |
| Series 2012 D, 5% 11/15/25 | 4,600,000 | 5,451,138 | |
| Series 2015 D1, 5% 11/15/29 | 5,000,000 | 5,865,350 | |
| Rockland County Gen. Oblig. Series 2014 A, 4% 3/1/23 (FSA Insured) | 1,125,000 | 1,234,913 | |
| Tobacco Settlement Fing. Corp. Series 2013 B: | |||
| 5% 6/1/20 | 1,900,000 | 1,951,813 | |
| 5% 6/1/21 | 800,000 | 821,728 | |
| Triborough Bridge & Tunnel Auth. Revs. Series 2015 A, 5.25% 11/15/45 | 1,000,000 | 1,162,780 | |
| TOTAL NEW YORK | 88,126,353 | ||
| North Carolina - 0.8% | |||
| Nash Health Care Sys. Health Care Facilities Rev.: | |||
| Series 2012, 5% 11/1/41 | 800,000 | 860,008 | |
| 5% 11/1/30 (FSA Insured) | 1,275,000 | 1,405,866 | |
| North Carolina Eastern Muni. Pwr. Agcy. Pwr. Sys. Rev. Series 2009 B, 5% 1/1/26 (Pre-Refunded to 1/1/19 @ 100) | 2,200,000 | 2,485,362 | |
| North Carolina Med. Care Commission Health Care Facilities Rev. (Rex Healthcare Proj.) Series 2010 A, 5% 7/1/30 | 1,600,000 | 1,795,024 | |
| North Carolina Muni. Pwr. Agcy. #1 Catawba Elec. Rev. Series 2009 A, 5% 1/1/30 | 1,000,000 | 1,104,940 | |
| TOTAL NORTH CAROLINA | 7,651,200 | ||
| North Dakota - 0.5% | |||
| Cass County Health Care Facilities Rev. (Essentia Health Obligated Group Proj.) Series 2008, 5.125% 2/15/37 (Assured Guaranty Corp. Insured) | 750,000 | 801,713 | |
| McLean County Solid Waste Facilities Rev. (Great River Energy Projects) Series 2010 B, 5.15% 7/1/40 | 2,300,000 | 2,509,208 | |
| Ward County Health Care Facility Rev. (Trinity Med. Ctr. Proj.) 5.125% 7/1/17 | 1,210,000 | 1,236,100 | |
| TOTAL NORTH DAKOTA | 4,547,021 | ||
| Ohio - 1.4% | |||
| American Muni. Pwr., Inc. Rev. (Prairie State Energy Campus Proj.) Series 2015, 5% 2/15/28 | 2,000,000 | 2,316,700 | |
| Buckeye Tobacco Settlement Fing. Auth. Series 2007 A1: | |||
| 5% 6/1/16 | 800,000 | 819,656 | |
| 5% 6/1/17 | 925,000 | 982,970 | |
| Hamilton County Convention Facilities Auth. Rev. Series 2014, 5% 12/1/26 | 670,000 | 768,550 | |
| Lake County Hosp. Facilities Rev.: | |||
| Series 2015, 5% 8/15/29 | 400,000 | 451,076 | |
| 5.75% 8/15/38 | 165,000 | 181,319 | |
| 5.75% 8/15/38 (Pre-Refunded to 8/15/18 @ 100) | 835,000 | 947,683 | |
| Lucas County Hosp. Rev. (ProMedica Healthcare Oblig. Group Proj.) Series 2011 A, 6.5% 11/15/37 | 1,200,000 | 1,466,388 | |
| Muskingum County Hosp. Facilities (Genesis Healthcare Sys. Obligated Group Proj.) Series 2013, 5% 2/15/48 | 2,000,000 | 2,022,480 | |
| Ohio Air Quality Dev. Auth. Rev. Series 2009 C, 5.625% 6/1/18 | 400,000 | 426,436 | |
| Ohio Tpk. Commission Tpk. Rev. (Infastructure Proj.) Series 2005 A, 0% 2/15/42 | 2,600,000 | 824,122 | |
| Ohio Wtr. Dev. Auth. Poll. Cont. Facilities Rev. Bonds (FirstEnergy Corp. Proj.) Series 2009 A, 5.875%, tender 6/1/16 (b) | 1,500,000 | 1,537,320 | |
| Ross County Hosp. Facilities Rev. (Adena Health Sys. Proj.) Series 2008, 5.75% 12/1/35 | 1,400,000 | 1,557,570 | |
| TOTAL OHIO | 14,302,270 | ||
| Oklahoma - 1.0% | |||
| Oklahoma City Pub. Property Auth. Hotel Tax Rev. Series 2015: | |||
| 5% 10/1/29 | 700,000 | 805,609 | |
| 5% 10/1/39 | 150,000 | 165,524 | |
| Oklahoma Dev. Fin. Auth. Health Sys. Rev. (Integris Baptist Med. Ctr. Proj.) Series C, 5.5% 8/15/22 (Pre-Refunded to 8/15/18 @ 100) | 2,865,000 | 3,231,978 | |
| Oklahoma Dev. Fin. Auth. Rev.: | |||
| (Saint John Health Sys. Proj.) Series 2012, 5% 2/15/42 | 1,775,000 | 1,932,212 | |
| Series 2012, 5% 2/15/21 | 400,000 | 466,828 | |
| Oklahoma Pwr. Auth. Pwr. Supply Sys. Rev. Series 2014 A, 5% 1/1/38 | 1,295,000 | 1,456,823 | |
| Tulsa County Indl. Auth. Health Care Rev. 5% 12/15/18 | 1,500,000 | 1,578,855 | |
| TOTAL OKLAHOMA | 9,637,829 | ||
| Oregon - 0.1% | |||
| Yamhill County School District #029J Newberg 5.5% 6/15/19 (Nat'l. Pub. Fin. Guarantee Corp. Insured) | 1,000,000 | 1,158,550 | |
| Pennsylvania - 1.7% | |||
| Allegheny County Hosp. Dev. Auth. Rev. (Univ. of Pittsburgh Med. Ctr. Proj.) Series 2009 A, 5.625% 8/15/39 | 1,100,000 | 1,234,211 | |
| Centre County Hosp. Auth. Rev. (Mount Nittany Med. Ctr. Proj.) Series 2011, 7% 11/15/46 | 500,000 | 581,700 | |
| Mifflin County School District Series 2007, 7.75% 9/1/30 (XL Cap. Assurance, Inc. Insured) | 400,000 | 443,368 | |
| Monroeville Fin. Auth. UPMC Rev. Series 2012, 5% 2/15/27 | 800,000 | 970,064 | |
| Montgomery County Higher Ed. & Health Auth. Hosp. Rev. (Abington Memorial Hosp. Proj.) Series 2012 A, 5% 6/1/24 | 600,000 | 693,564 | |
| Montgomery County Higher Ed. & Health Auth. Rev. Series 2014 A, 5% 10/1/25 | 1,045,000 | 1,160,671 | |
| Pennsylvania Gen. Oblig.: | |||
| Series 2015 1, 5% 3/15/29 | 2,780,000 | 3,221,019 | |
| Series 2015, 5% 3/15/33 | 850,000 | 966,289 | |
| Pennsylvania Tpk. Commission Tpk. Rev. Series 2009 D, 5.5% 12/1/41 | 2,400,000 | 2,714,040 | |
| Philadelphia Gas Works Rev. (1998 Gen. Ordinance Proj.) Ninth Series, 5.25% 8/1/40 | 800,000 | 880,456 | |
| Westmoreland County Muni. Auth. Muni. Svc. Rev. Series A, 0% 8/15/21 (Nat'l. Pub. Fin. Guarantee Corp. Insured) | 5,000,000 | 4,326,150 | |
| TOTAL PENNSYLVANIA | 17,191,532 | ||
| South Carolina - 4.6% | |||
| Greenwood Fifty School Facilities Installment 5% 12/1/21 (Assured Guaranty Corp. Insured) | 1,000,000 | 1,086,040 | |
| Scago Edl. Facilities Corp. for Colleton School District (School District of Colleton County Proj.) Series 2015, 5% 12/1/26 | 1,400,000 | 1,625,176 | |
| South Carolina Jobs-Econ. Dev. Auth. Econ. Dev. Rev. Series 2013, 5% 11/1/27 | 1,400,000 | 1,578,234 | |
| South Carolina Jobs-Econ. Dev. Auth. Health Facilities Rev. (Bishop Gadsden Proj.) Series 2007, 5% 4/1/16 | 1,000,000 | 1,009,850 | |
| South Carolina Pub. Svc. Auth. Rev.: | |||
| (Santee Cooper Proj.) Series 2009 B, 5.25% 1/1/39 | 5,000,000 | 5,530,450 | |
| Series 2012 B, 5% 12/1/20 | 2,500,000 | 2,928,675 | |
| Series 2013 E, 5.5% 12/1/53 | 6,100,000 | 6,756,970 | |
| Series 2014 A: | |||
| 5% 12/1/49 | 3,640,000 | 3,893,744 | |
| 5.5% 12/1/54 | 2,500,000 | 2,783,300 | |
| Series 2014 C, 5% 12/1/46 | 700,000 | 760,025 | |
| Series 2015 A, 5% 12/1/50 | 7,245,000 | 7,840,394 | |
| Series 2015 C, 5% 12/1/19 | 8,000,000 | 9,188,160 | |
| Univ. of South Carolina Athletic Facilities Rev. Series 2008 A, 5.5% 5/1/38 | 995,000 | 1,101,793 | |
| TOTAL SOUTH CAROLINA | 46,082,811 | ||
| Tennessee - 0.8% | |||
| Clarksville Natural Gas Acquisition Corp. Gas Rev. Series 2006: | |||
| 5% 12/15/15 | 1,500,000 | 1,506,795 | |
| 5% 12/15/16 | 1,500,000 | 1,568,160 | |
| Jackson Hosp. Rev.: | |||
| 5.75% 4/1/41 | 270,000 | 293,352 | |
| 5.75% 4/1/41 (Pre-Refunded to 4/1/18 @ 100) | 730,000 | 812,855 | |
| Knox County Health Edl. & Hsg. Facilities Board Rev. (Univ. Health Sys. Proj.) Series 2007, 5% 4/1/16 | 1,805,000 | 1,831,263 | |
| Memphis-Shelby County Arpt. Auth. Arpt. Rev. Series 2010 B, 5.75% 7/1/24 (c) | 1,600,000 | 1,856,288 | |
| Sullivan County Health, Ed. and Hsg. Board (Wellmont Health Sys. Proj.) Series 2006 C, 5.25% 9/1/36 | 400,000 | 411,608 | |
| TOTAL TENNESSEE | 8,280,321 | ||
| Texas - 7.7% | |||
| Austin Arpt. Sys. Rev. Series 2014: | |||
| 5% 11/15/28 (c) | 500,000 | 574,750 | |
| 5% 11/15/39 (c) | 1,700,000 | 1,865,597 | |
| 5% 11/15/44 (c) | 2,690,000 | 2,934,763 | |
| Austin Cmnty. College District Pub. Facilities Lease Rev. (Round Rock Campus Proj.) Series 2008, 5.5% 8/1/20 (Pre-Refunded to 8/1/18 @ 100) | 1,000,000 | 1,127,770 | |
| Comal Independent School District 5.25% 2/1/23 | 35,000 | 38,330 | |
| Corpus Christi Util. Sys. Rev.: | |||
| 5% 7/15/23 | 1,600,000 | 1,878,608 | |
| 5.25% 7/15/18 (FSA Insured) | 1,000,000 | 1,076,800 | |
| Dallas Fort Worth Int'l. Arpt. Rev.: | |||
| Series 2009 A, 5% 11/1/24 | 1,000,000 | 1,045,380 | |
| Series 2012 D, 5% 11/1/42 (c) | 400,000 | 424,624 | |
| Series 2012 H, 5% 11/1/42 (c) | 1,000,000 | 1,061,560 | |
| Dallas Independent School District Series 2008, 6.375% 2/15/34 (Pre-Refunded to 2/15/18 @ 100) | 300,000 | 338,667 | |
| Frisco Independent School District Series 2008 A, 6% 8/15/33 | 1,200,000 | 1,361,268 | |
| Grand Parkway Trans. Corp. Series 2013 B: | |||
| 5% 4/1/53 | 220,000 | 238,975 | |
| 5.25% 10/1/51 | 8,500,000 | 9,469,850 | |
| 5.5% 4/1/53 | 1,000,000 | 1,091,590 | |
| Harris County Gen. Oblig.: | |||
| (Road Proj.) Series 2008 B, 5.25% 8/15/47 | 8,000,000 | 8,645,360 | |
| Series 2002, 0% 8/15/24 (Nat'l. Pub. Fin. Guarantee Corp. Insured) | 1,000,000 | 791,550 | |
| Houston Arpt. Sys. Rev.: | |||
| Series 2011 A, 5% 7/1/24 (c) | 1,250,000 | 1,421,663 | |
| Series 2012 A, 5% 7/1/23 (c) | 600,000 | 690,666 | |
| Lewisville Independent School District 0% 8/15/19 | 2,340,000 | 2,239,029 | |
| Love Field Arpt. Modernization Rev. Series 2015: | |||
| 5% 11/1/26 (c) | 1,000,000 | 1,188,670 | |
| 5% 11/1/28 (c) | 1,325,000 | 1,546,090 | |
| Mansfield Independent School District 5.5% 2/15/17 | 25,000 | 25,098 | |
| North Texas Tollway Auth. Rev.: | |||
| Series 2008 I, 6.2% 1/1/42 (Assured Guaranty Corp. Insured) | 1,100,000 | 1,346,411 | |
| Series 2009 A, 6.25% 1/1/39 | 1,800,000 | 2,066,346 | |
| Series 2011 A: | |||
| 5.5% 9/1/41 | 2,300,000 | 2,700,384 | |
| 6% 9/1/41 | 1,200,000 | 1,458,228 | |
| Series 2011 D, 5% 9/1/28 | 2,300,000 | 2,696,888 | |
| Series 2014 A, 5% 1/1/25 | 1,000,000 | 1,182,630 | |
| Series 2015 B, 5% 1/1/40 | 2,000,000 | 2,180,480 | |
| 6% 1/1/24 | 230,000 | 253,292 | |
| San Antonio Arpt. Sys. Rev. 5.25% 7/1/18 (FSA Insured) (c) | 2,505,000 | 2,671,908 | |
| San Antonio Elec. & Gas Sys. Rev.: | |||
| Series 2008, 5% 2/1/24 | 1,000,000 | 1,091,710 | |
| Series 2012, 5.25% 2/1/25 | 800,000 | 1,002,256 | |
| Tarrant County Cultural Ed. Facilities Fin. Corp. Hosp. Rev.: | |||
| (Hendrick Med. Ctr. Proj.) Series 2009 B, 5.25% 9/1/28 (Assured Guaranty Corp. Insured) | 1,235,000 | 1,386,905 | |
| (Scott & White Healthcare Proj.) Series 2013 A, 4% 8/15/43 | 500,000 | 504,645 | |
| 5.75% 11/15/24 (Pre-Refunded to 11/15/18 @ 100) | 480,000 | 548,203 | |
| 5.75% 11/15/24 (Pre-Refunded to 11/15/18 @ 100) | 620,000 | 708,096 | |
| Texas Gen. Oblig.: | |||
| 5% 4/1/25 (Pre-Refunded to 4/1/18 @ 100) | 75,000 | 82,650 | |
| 5% 4/1/25 (Pre-Refunded to 4/1/18 @ 100) | 725,000 | 798,950 | |
| Texas Muni. Pwr. Agcy. Rev. 0% 9/1/16 (Nat'l. Pub. Fin. Guarantee Corp. Insured) (Pre-Refunded to 9/1/16 @ 100) | 1,800,000 | 1,782,324 | |
| Texas Private Activity Bond Surface Trans. Corp.: | |||
| (LBJ Infrastructure Group LLC IH-635 Managed Lanes Proj.) Series 2010, 7% 6/30/40 | 1,200,000 | 1,419,072 | |
| Series 2013, 6.75% 6/30/43 (c) | 2,400,000 | 2,924,208 | |
| Texas Trans. Commission State Hwy. Fund Rev. Series 2007, 5% 4/1/26 (Pre-Refunded to 4/1/17 @ 100) | 810,000 | 861,087 | |
| Texas Wtr. Dev. Board Rev. Series 2008 B, 5.25% 7/15/23 | 1,600,000 | 1,725,152 | |
| Univ. of Texas Board of Regents Sys. Rev.: | |||
| Series 2007 F, 4.75% 8/15/27 (Pre-Refunded to 2/15/17 @ 100) | 410,000 | 432,484 | |
| 4.75% 8/15/27 | 590,000 | 618,928 | |
| Waller Independent School District: | |||
| 5.5% 2/15/28 | 1,670,000 | 1,829,452 | |
| 5.5% 2/15/37 | 2,100,000 | 2,277,702 | |
| TOTAL TEXAS | 77,627,049 | ||
| Utah - 0.2% | |||
| Utah Associated Muni. Pwr. Sys. Rev. (Payson Pwr. Proj.) 5% 9/1/20 | 850,000 | 984,088 | |
| Utah Transit Auth. Sales Tax Rev. Series 2008 A, 5.25% 6/15/38 (Pre-Refunded to 6/15/18 @ 100) | 1,200,000 | 1,338,516 | |
| TOTAL UTAH | 2,322,604 | ||
| Vermont - 0.3% | |||
| Vermont Edl. & Health Bldg. Fin. Agcy. Rev. (Fletcher Allen Health Care Proj.) Series 2004 B, 5.5% 12/1/28 (FSA Insured) | 2,600,000 | 2,851,316 | |
| Virginia - 0.4% | |||
| Fredericksburg Econ. Dev. Auth. Rev. Series 2014, 5% 6/15/30 | 1,250,000 | 1,391,300 | |
| Univ. of Virginia Gen. Rev. Series 2015 A, 5% 4/1/45 | 1,000,000 | 1,157,530 | |
| Virginia College Bldg. Auth. Edl. Facilities Rev. Series 2015 A, 5% 1/1/40 | 500,000 | 568,385 | |
| Winchester Econ. Dev. Auth. Series 2015, 5% 1/1/44 | 1,000,000 | 1,104,740 | |
| TOTAL VIRGINIA | 4,221,955 | ||
| Washington - 1.9% | |||
| Chelan County Pub. Util. District #1 Columbia River-Rock Island Hydro-Elec. Sys. Rev. Series 1997 A, 0% 6/1/17 (Nat'l. Pub. Fin. Guarantee Corp. Insured) | 1,000,000 | 988,280 | |
| Kent Spl. Events Ctr. Pub. Facilities District Rev. Series 2008, 5.25% 12/1/32 (FSA Insured) | 2,000,000 | 2,189,260 | |
| King County Swr. Rev. Series 2009, 5.25% 1/1/42 | 1,000,000 | 1,116,220 | |
| Port of Seattle Spl. Facility Rev. Series 2013, 5% 6/1/24 (c) | 560,000 | 657,322 | |
| Spokane Pub. Facilities District Hotel/Motel Tax & Sales/Use Tax Rev. Series 2013 B, 5% 12/1/27 | 1,500,000 | 1,712,805 | |
| Washington Gen. Oblig.: | |||
| Series R 97A, 0% 7/1/19 (Escrowed to Maturity) | 1,200,000 | 1,151,952 | |
| Series S5, 0% 1/1/18 (Nat'l. Pub. Fin. Guarantee Corp. Insured) | 2,230,000 | 2,185,779 | |
| Washington Health Care Facilities Auth. Rev.: | |||
| (Catholic Health Initiatives Proj.) Series 2008 D, 6.375% 10/1/36 | 3,000,000 | 3,383,490 | |
| (MultiCare Health Sys. Proj.) Series 2008 B, 6% 8/15/39 (Pre-Refunded to 8/15/19 @ 100) | 1,000,000 | 1,180,130 | |
| (Overlake Hosp. Med. Ctr.) Series 2010, 5.7% 7/1/38 | 2,270,000 | 2,596,063 | |
| (Seattle Children's Hosp. Proj.) Series 2009, 5.625% 10/1/38 (Pre-Refunded to 10/1/19 @ 100) | 1,400,000 | 1,640,506 | |
| Series 2015, 5% 1/1/27 | 700,000 | 803,950 | |
| TOTAL WASHINGTON | 19,605,757 | ||
| West Virginia - 0.2% | |||
| West Virginia Hosp. Fin. Auth. Hosp. Rev. (West Virginia United Health Sys. Proj.) Series 2008 E, 5.625% 6/1/35 | 1,000,000 | 1,108,520 | |
| West Virginia Univ. Revs. (West Virginia Univ. Projs.) Series 2014 A, 5% 10/1/44 | 1,100,000 | 1,223,530 | |
| TOTAL WEST VIRGINIA | 2,332,050 | ||
| Wisconsin - 0.4% | |||
| Wisconsin Health & Edl. Facilities Series 2014, 4% 5/1/33 | 510,000 | 494,986 | |
| Wisconsin Health & Edl. Facilities Auth. Rev.: | |||
| (Agnesian HealthCare, Inc. Proj.): | |||
| Series 2010: | |||
| 5.5% 7/1/40 | 500,000 | 562,040 | |
| 5.75% 7/1/30 | 500,000 | 575,295 | |
| Series 2013 B, 5% 7/1/36 | 925,000 | 1,001,303 | |
| (Marshfield Clinic Proj.) Series A, 5.375% 2/15/34 | 1,000,000 | 1,010,830 | |
| Series 2012: | |||
| 5% 6/1/27 | 300,000 | 341,889 | |
| 5% 6/1/39 | 490,000 | 525,383 | |
| TOTAL WISCONSIN | 4,511,726 | ||
| Wyoming - 0.2% | |||
| Campbell County Solid Waste Facilities Rev. (Basin Elec. Pwr. Coop. - Dry Fork Station Facilities Proj.) Series 2009 A, 5.75% 7/15/39 | 1,700,000 | 1,956,870 | |
| TOTAL MUNICIPAL BONDS | |||
| (Cost $932,505,929) | 998,654,717 | ||
| Municipal Notes - 0.2% | |||
| Kentucky - 0.2% | |||
| Kentucky Pub. Trans. BAN Series 2013 A, 5% 7/1/17 | |||
| (Cost $1,570,166) | 1,500,000 | 1,597,125 | |
| TOTAL INVESTMENT PORTFOLIO - 98.9% | |||
| (Cost $934,076,095) | 1,000,251,842 | ||
| NET OTHER ASSETS (LIABILITIES) - 1.1% | 11,378,678 | ||
| NET ASSETS - 100% | $1,011,630,520 |
Security Type Abbreviations
BAN – BOND ANTICIPATION NOTE
Legend
(a) Security initially issued in zero coupon form which converts to coupon form at a specified rate and date. The rate shown is the rate at period end.
(b) Coupon rates for floating and adjustable rate securities reflect the rates in effect at period end.
(c) Private activity obligations whose interest is subject to the federal alternative minimum tax for individuals.
(d) Security or a portion of the security purchased on a delayed delivery or when-issued basis.
Investment Valuation
All investments are categorized as Level 2 under the Fair Value Hierarchy. The inputs or methodology used for valuing securities may not be an indication of the risk associated with investing in those securities. For more information on valuation inputs please refer to the Investment Valuation section in the accompanying Notes to Financial Statements.
Other Information
The distribution of municipal securities by revenue source, as a percentage of total Net Assets, is as follows (Unaudited):
| General Obligations | 34.2% |
| Health Care | 17.7% |
| Transportation | 13.7% |
| Electric Utilities | 9.4% |
| Escrowed/Pre-Refunded | 8.2% |
| Special Tax | 5.8% |
| Others* (Individually Less Than 5%) | 11.0% |
| 100.0% |
* Includes net other assets
See accompanying notes which are an integral part of the financial statements.
Financial Statements
Statement of Assets and Liabilities
| October 31, 2015 | ||
| Assets | ||
| Investment in securities, at value — See accompanying schedule: Unaffiliated issuers (cost $934,076,095) | $1,000,251,842 | |
| Cash | 6,666,041 | |
| Receivable for investments sold | 2,723,146 | |
| Receivable for fund shares sold | 1,292,497 | |
| Interest receivable | 12,422,677 | |
| Prepaid expenses | 2,774 | |
| Other receivables | 1,796 | |
| Total assets | 1,023,360,773 | |
| Liabilities | ||
| Payable for investments purchased | ||
| Regular delivery | $1,375,950 | |
| Delayed delivery | 7,475,101 | |
| Payable for fund shares redeemed | 1,699,170 | |
| Distributions payable | 463,797 | |
| Accrued management fee | 309,555 | |
| Distribution and service plan fees payable | 212,766 | |
| Other affiliated payables | 147,949 | |
| Other payables and accrued expenses | 45,965 | |
| Total liabilities | 11,730,253 | |
| Net Assets | $1,011,630,520 | |
| Net Assets consist of: | ||
| Paid in capital | $937,516,837 | |
| Undistributed net investment income | 644,423 | |
| Accumulated undistributed net realized gain (loss) on investments | 7,293,513 | |
| Net unrealized appreciation (depreciation) on investments | 66,175,747 | |
| Net Assets | $1,011,630,520 | |
| Calculation of Maximum Offering Price | ||
| Class A: | ||
| Net Asset Value and redemption price per share ($374,081,429 ÷ 27,777,090 shares) | $13.47 | |
| Maximum offering price per share (100/96.00 of $13.47) | $14.03 | |
| Class T: | ||
| Net Asset Value and redemption price per share ($170,263,080 ÷ 12,604,729 shares) | $13.51 | |
| Maximum offering price per share (100/96.00 of $13.51) | $14.07 | |
| Class B: | ||
| Net Asset Value and offering price per share ($3,237,263 ÷ 241,155 shares)(a) | $13.42 | |
| Class C: | ||
| Net Asset Value and offering price per share ($117,527,834 ÷ 8,705,948 shares)(a) | $13.50 | |
| Class I: | ||
| Net Asset Value, offering price and redemption price per share ($346,520,914 ÷ 25,867,417 shares) | $13.40 |
(a) Redemption price per share is equal to net asset value less any applicable contingent deferred sales charge.
See accompanying notes which are an integral part of the financial statements.
Statement of Operations
| Year ended October 31, 2015 | ||
| Investment Income | ||
| Interest | $40,032,596 | |
| Expenses | ||
| Management fee | $3,563,630 | |
| Transfer agent fees | 1,562,236 | |
| Distribution and service plan fees | 2,562,910 | |
| Accounting fees and expenses | 205,698 | |
| Custodian fees and expenses | 14,913 | |
| Independent trustees' compensation | 4,165 | |
| Registration fees | 94,404 | |
| Audit | 52,761 | |
| Legal | 10,556 | |
| Miscellaneous | 6,006 | |
| Total expenses before reductions | 8,077,279 | |
| Expense reductions | (108,712) | 7,968,567 |
| Net investment income (loss) | 32,064,029 | |
| Realized and Unrealized Gain (Loss) | ||
| Net realized gain (loss) on: | ||
| Investment securities: | ||
| Unaffiliated issuers | 8,081,131 | |
| Total net realized gain (loss) | 8,081,131 | |
| Change in net unrealized appreciation (depreciation) on investment securities | (14,056,180) | |
| Net gain (loss) | (5,975,049) | |
| Net increase (decrease) in net assets resulting from operations | $26,088,980 |
See accompanying notes which are an integral part of the financial statements.
Statement of Changes in Net Assets
| Year ended October 31, 2015 | Year ended October 31, 2014 | |
| Increase (Decrease) in Net Assets | ||
| Operations | ||
| Net investment income (loss) | $32,064,029 | $32,476,757 |
| Net realized gain (loss) | 8,081,131 | 3,220,004 |
| Change in net unrealized appreciation (depreciation) | (14,056,180) | 44,401,983 |
| Net increase (decrease) in net assets resulting from operations | 26,088,980 | 80,098,744 |
| Distributions to shareholders from net investment income | (32,013,498) | (32,459,524) |
| Distributions to shareholders from net realized gain | (3,075,920) | (6,709,660) |
| Total distributions | (35,089,418) | (39,169,184) |
| Share transactions - net increase (decrease) | 55,427,860 | (39,024,324) |
| Total increase (decrease) in net assets | 46,427,422 | 1,905,236 |
| Net Assets | ||
| Beginning of period | 965,203,098 | 963,297,862 |
| End of period (including undistributed net investment income of $644,423 and undistributed net investment income of $462,330, respectively) | $1,011,630,520 | $965,203,098 |
See accompanying notes which are an integral part of the financial statements.
Financial Highlights — Fidelity Advisor Municipal Income Fund Class A
| Years ended October 31, | 2015 | 2014 | 2013 | 2012 | 2011 |
| Selected Per–Share Data | |||||
| Net asset value, beginning of period | $13.59 | $13.00 | $13.74 | $12.95 | $12.99 |
| Income from Investment Operations | |||||
| Net investment income (loss)A | .438 | .462 | .453 | .460 | .479 |
| Net realized and unrealized gain (loss) | (.076) | .682 | (.738) | .789 | (.041) |
| Total from investment operations | .362 | 1.144 | (.285) | 1.249 | .438 |
| Distributions from net investment income | (.439) | (.461) | (.451) | (.457) | (.478) |
| Distributions from net realized gain | (.043) | (.093) | (.004) | (.002) | – |
| Total distributions | (.482) | (.554) | (.455) | (.459) | (.478) |
| Net asset value, end of period | $13.47 | $13.59 | $13.00 | $13.74 | $12.95 |
| Total ReturnB,C | 2.71% | 9.02% | (2.12)% | 9.77% | 3.53% |
| Ratios to Average Net AssetsD,E | |||||
| Expenses before reductions | .81% | .79% | .77% | .77% | .77% |
| Expenses net of fee waivers, if any | .80% | .79% | .77% | .77% | .77% |
| Expenses net of all reductions | .80% | .79% | .77% | .77% | .77% |
| Net investment income (loss) | 3.25% | 3.49% | 3.36% | 3.42% | 3.80% |
| Supplemental Data | |||||
| Net assets, end of period (000 omitted) | $374,081 | $325,539 | $335,492 | $430,231 | $368,789 |
| Portfolio turnover rateF | 14% | 10% | 12% | 6% | 8% |
A Calculated based on average shares outstanding during the period.
B Total returns would have been lower if certain expenses had not been reduced during the applicable periods shown.
C Total returns do not include the effect of the sales charges.
D Fees and expenses of any underlying Fidelity Central Funds are not included in the Fund's expense ratio. The Fund indirectly bears its proportionate share of the expenses of any underlying Fidelity Central Funds.
E Expense ratios reflect operating expenses of the class. Expenses before reductions do not reflect amounts reimbursed by the investment adviser or reductions from brokerage service arrangements or reductions from other expense offset arrangements and do not represent the amount paid by the class during periods when reimbursements or reductions occur. Expenses net of fee waivers reflect expenses after reimbursement by the investment adviser but prior to reductions from brokerage service arrangements or other expense offset arrangements. Expenses net of all reductions represent the net expenses paid by the class.
F Amount does not include the portfolio activity of any underlying Fidelity Central Funds.
See accompanying notes which are an integral part of the financial statements.
Financial Highlights — Fidelity Advisor Municipal Income Fund Class T
| Years ended October 31, | 2015 | 2014 | 2013 | 2012 | 2011 |
| Selected Per–Share Data | |||||
| Net asset value, beginning of period | $13.63 | $13.03 | $13.77 | $12.99 | $13.02 |
| Income from Investment Operations | |||||
| Net investment income (loss)A | .443 | .466 | .454 | .462 | .481 |
| Net realized and unrealized gain (loss) | (.079) | .691 | (.739) | .778 | (.032) |
| Total from investment operations | .364 | 1.157 | (.285) | 1.240 | .449 |
| Distributions from net investment income | (.441) | (.464) | (.451) | (.458) | (.479) |
| Distributions from net realized gain | (.043) | (.093) | (.004) | (.002) | – |
| Total distributions | (.484) | (.557) | (.455) | (.460) | (.479) |
| Net asset value, end of period | $13.51 | $13.63 | $13.03 | $13.77 | $12.99 |
| Total ReturnB,C | 2.72% | 9.10% | (2.12)% | 9.67% | 3.61% |
| Ratios to Average Net AssetsD,E | |||||
| Expenses before reductions | .79% | .78% | .77% | .76% | .76% |
| Expenses net of fee waivers, if any | .79% | .78% | .77% | .76% | .76% |
| Expenses net of all reductions | .79% | .78% | .77% | .76% | .76% |
| Net investment income (loss) | 3.26% | 3.51% | 3.37% | 3.42% | 3.80% |
| Supplemental Data | |||||
| Net assets, end of period (000 omitted) | $170,263 | $204,607 | $207,208 | $247,622 | $225,908 |
| Portfolio turnover rateF | 14% | 10% | 12% | 6% | 8% |
A Calculated based on average shares outstanding during the period.
B Total returns would have been lower if certain expenses had not been reduced during the applicable periods shown.
C Total returns do not include the effect of the sales charges.
D Fees and expenses of any underlying Fidelity Central Funds are not included in the Fund's expense ratio. The Fund indirectly bears its proportionate share of the expenses of any underlying Fidelity Central Funds.
E Expense ratios reflect operating expenses of the class. Expenses before reductions do not reflect amounts reimbursed by the investment adviser or reductions from brokerage service arrangements or reductions from other expense offset arrangements and do not represent the amount paid by the class during periods when reimbursements or reductions occur. Expenses net of fee waivers reflect expenses after reimbursement by the investment adviser but prior to reductions from brokerage service arrangements or other expense offset arrangements. Expenses net of all reductions represent the net expenses paid by the class.
F Amount does not include the portfolio activity of any underlying Fidelity Central Funds.
See accompanying notes which are an integral part of the financial statements.
Financial Highlights — Fidelity Advisor Municipal Income Fund Class B
| Years ended October 31, | 2015 | 2014 | 2013 | 2012 | 2011 |
| Selected Per–Share Data | |||||
| Net asset value, beginning of period | $13.54 | $12.96 | $13.69 | $12.92 | $12.96 |
| Income from Investment Operations | |||||
| Net investment income (loss)A | .361 | .375 | .361 | .367 | .393 |
| Net realized and unrealized gain (loss) | (.079) | .673 | (.727) | .772 | (.040) |
| Total from investment operations | .282 | 1.048 | (.366) | 1.139 | .353 |
| Distributions from net investment income | (.359) | (.375) | (.360) | (.367) | (.393) |
| Distributions from net realized gain | (.043) | (.093) | (.004) | (.002) | – |
| Total distributions | (.402) | (.468) | (.364) | (.369) | (.393) |
| Net asset value, end of period | $13.42 | $13.54 | $12.96 | $13.69 | $12.92 |
| Total ReturnB,C | 2.11% | 8.26% | (2.72)% | 8.90% | 2.85% |
| Ratios to Average Net AssetsD,E | |||||
| Expenses before reductions | 1.39% | 1.45% | 1.45% | 1.45% | 1.46% |
| Expenses net of fee waivers, if any | 1.39% | 1.45% | 1.45% | 1.45% | 1.45% |
| Expenses net of all reductions | 1.39% | 1.45% | 1.45% | 1.45% | 1.45% |
| Net investment income (loss) | 2.67% | 2.84% | 2.68% | 2.74% | 3.12% |
| Supplemental Data | |||||
| Net assets, end of period (000 omitted) | $3,237 | $4,932 | $6,951 | $11,187 | $12,983 |
| Portfolio turnover rateF | 14% | 10% | 12% | 6% | 8% |
A Calculated based on average shares outstanding during the period.
B Total returns would have been lower if certain expenses had not been reduced during the applicable periods shown.
C Total returns do not include the effect of the contingent deferred sales charge.
D Fees and expenses of any underlying Fidelity Central Funds are not included in the Fund's expense ratio. The Fund indirectly bears its proportionate share of the expenses of any underlying Fidelity Central Funds.
E Expense ratios reflect operating expenses of the class. Expenses before reductions do not reflect amounts reimbursed by the investment adviser or reductions from brokerage service arrangements or reductions from other expense offset arrangements and do not represent the amount paid by the class during periods when reimbursements or reductions occur. Expenses net of fee waivers reflect expenses after reimbursement by the investment adviser but prior to reductions from brokerage service arrangements or other expense offset arrangements. Expenses net of all reductions represent the net expenses paid by the class.
F Amount does not include the portfolio activity of any underlying Fidelity Central Funds.
See accompanying notes which are an integral part of the financial statements.
Financial Highlights — Fidelity Advisor Municipal Income Fund Class C
| Years ended October 31, | 2015 | 2014 | 2013 | 2012 | 2011 |
| Selected Per–Share Data | |||||
| Net asset value, beginning of period | $13.62 | $13.03 | $13.77 | $12.98 | $13.02 |
| Income from Investment Operations | |||||
| Net investment income (loss)A | .339 | .363 | .351 | .358 | .383 |
| Net realized and unrealized gain (loss) | (.078) | .681 | (.739) | .788 | (.042) |
| Total from investment operations | .261 | 1.044 | (.388) | 1.146 | .341 |
| Distributions from net investment income | (.338) | (.361) | (.348) | (.354) | (.381) |
| Distributions from net realized gain | (.043) | (.093) | (.004) | (.002) | – |
| Total distributions | (.381) | (.454) | (.352) | (.356) | (.381) |
| Net asset value, end of period | $13.50 | $13.62 | $13.03 | $13.77 | $12.98 |
| Total ReturnB,C | 1.94% | 8.19% | (2.86)% | 8.92% | 2.74% |
| Ratios to Average Net AssetsD,E | |||||
| Expenses before reductions | 1.56% | 1.55% | 1.54% | 1.54% | 1.54% |
| Expenses net of fee waivers, if any | 1.55% | 1.55% | 1.54% | 1.54% | 1.54% |
| Expenses net of all reductions | 1.55% | 1.55% | 1.54% | 1.53% | 1.54% |
| Net investment income (loss) | 2.50% | 2.74% | 2.60% | 2.65% | 3.03% |
| Supplemental Data | |||||
| Net assets, end of period (000 omitted) | $117,528 | $118,088 | $123,530 | $155,834 | $130,949 |
| Portfolio turnover rateF | 14% | 10% | 12% | 6% | 8% |
A Calculated based on average shares outstanding during the period.
B Total returns would have been lower if certain expenses had not been reduced during the applicable periods shown.
C Total returns do not include the effect of the contingent deferred sales charge.
D Fees and expenses of any underlying Fidelity Central Funds are not included in the Fund's expense ratio. The Fund indirectly bears its proportionate share of the expenses of any underlying Fidelity Central Funds.
E Expense ratios reflect operating expenses of the class. Expenses before reductions do not reflect amounts reimbursed by the investment adviser or reductions from brokerage service arrangements or reductions from other expense offset arrangements and do not represent the amount paid by the class during periods when reimbursements or reductions occur. Expenses net of fee waivers reflect expenses after reimbursement by the investment adviser but prior to reductions from brokerage service arrangements or other expense offset arrangements. Expenses net of all reductions represent the net expenses paid by the class.
F Amount does not include the portfolio activity of any underlying Fidelity Central Funds.
See accompanying notes which are an integral part of the financial statements.
Financial Highlights — Fidelity Advisor Municipal Income Fund Class I
| Years ended October 31, | 2015 | 2014 | 2013 | 2012 | 2011 |
| Selected Per–Share Data | |||||
| Net asset value, beginning of period | $13.51 | $12.93 | $13.67 | $12.89 | $12.93 |
| Income from Investment Operations | |||||
| Net investment income (loss)A | .470 | .493 | .481 | .490 | .505 |
| Net realized and unrealized gain (loss) | (.067) | .674 | (.735) | .782 | (.039) |
| Total from investment operations | .403 | 1.167 | (.254) | 1.272 | .466 |
| Distributions from net investment income | (.470) | (.494) | (.482) | (.490) | (.506) |
| Distributions from net realized gain | (.043) | (.093) | (.004) | (.002) | – |
| Total distributions | (.513) | (.587) | (.486) | (.492) | (.506) |
| Net asset value, end of period | $13.40 | $13.51 | $12.93 | $13.67 | $12.89 |
| Total ReturnB | 3.03% | 9.27% | (1.90)% | 10.00% | 3.79% |
| Ratios to Average Net AssetsC,D | |||||
| Expenses before reductions | .57% | .54% | .54% | .53% | .54% |
| Expenses net of fee waivers, if any | .55% | .54% | .54% | .53% | .54% |
| Expenses net of all reductions | .55% | .54% | .54% | .53% | .54% |
| Net investment income (loss) | 3.50% | 3.75% | 3.60% | 3.66% | 4.02% |
| Supplemental Data | |||||
| Net assets, end of period (000 omitted) | $346,521 | $312,038 | $290,117 | $362,588 | $305,538 |
| Portfolio turnover rateE | 14% | 10% | 12% | 6% | 8% |
A Calculated based on average shares outstanding during the period.
B Total returns would have been lower if certain expenses had not been reduced during the applicable periods shown.
C Fees and expenses of any underlying Fidelity Central Funds are not included in the Fund's expense ratio. The Fund indirectly bears its proportionate share of the expenses of any underlying Fidelity Central Funds.
D Expense ratios reflect operating expenses of the class. Expenses before reductions do not reflect amounts reimbursed by the investment adviser or reductions from brokerage service arrangements or reductions from other expense offset arrangements and do not represent the amount paid by the class during periods when reimbursements or reductions occur. Expenses net of fee waivers reflect expenses after reimbursement by the investment adviser but prior to reductions from brokerage service arrangements or other expense offset arrangements. Expenses net of all reductions represent the net expenses paid by the class.
E Amount does not include the portfolio activity of any underlying Fidelity Central Funds.
See accompanying notes which are an integral part of the financial statements.
Notes to Financial Statements
For the period ended October 31, 2015
1. Organization.
Fidelity Advisor Municipal Income Fund (the Fund) is a fund of Fidelity Advisor Series II (the Trust) and is authorized to issue an unlimited number of shares. The Trust is registered under the Investment Company Act of 1940, as amended (the 1940 Act), as an open-end management investment company organized as a Massachusetts business trust. The Fund offers Class A, Class T, Class C and Class I (formerly Institutional Class) shares, each of which, along with Class B shares, has equal rights as to assets and voting privileges. Class B shares are closed to new accounts and additional purchases, except for exchanges and reinvestments. Each class has exclusive voting rights with respect to matters that affect that class. Class B shares will automatically convert to Class A shares after a holding period of seven years from the initial date of purchase.
2. Significant Accounting Policies.
The financial statements have been prepared in conformity with accounting principles generally accepted in the United States of America (GAAP), which require management to make certain estimates and assumptions at the date of the financial statements. Actual results could differ from those estimates. Subsequent events, if any, through the date that the financial statements were issued have been evaluated in the preparation of the financial statements. The following summarizes the significant accounting policies of the Fund:
Investment Valuation. Investments are valued as of 4:00 p.m. Eastern time on the last calendar day of the period. The Board of Trustees (the Board) has delegated the day to day responsibility for the valuation of the Fund's investments to the Fidelity Management & Research Company (FMR) Fair Value Committee (the Committee). In accordance with valuation policies and procedures approved by the Board, the Fund attempts to obtain prices from one or more third party pricing vendors or brokers to value its investments. When current market prices, quotations or currency exchange rates are not readily available or reliable, investments will be fair valued in good faith by the Committee, in accordance with procedures adopted by the Board. Factors used in determining fair value vary by investment type and may include market or investment specific events, changes in interest rates and credit quality. The frequency with which these procedures are used cannot be predicted and they may be utilized to a significant extent. The Committee oversees the Fund's valuation policies and procedures and reports to the Board on the Committee's activities and fair value determinations. The Board monitors the appropriateness of the procedures used in valuing the Fund's investments and ratifies the fair value determinations of the Committee.
The Fund categorizes the inputs to valuation techniques used to value its investments into a disclosure hierarchy consisting of three levels as shown below:
- Level 1 – quoted prices in active markets for identical investments
- Level 2 – other significant observable inputs (including quoted prices for similar investments, interest rates, prepayment speeds, etc.)
- Level 3 – unobservable inputs (including the Fund's own assumptions based on the best information available)
Valuation techniques used to value the Fund's investments by major category are as follows:
Debt securities, including restricted securities, are valued based on evaluated prices received from third party pricing vendors or from brokers who make markets in such securities. Municipal securities are valued by pricing vendors who utilize matrix pricing which considers yield or price of bonds of comparable quality, coupon, maturity and type or by broker-supplied prices. When independent prices are unavailable or unreliable, debt securities may be valued utilizing pricing methodologies which consider similar factors that would be used by third party pricing vendors. Debt securities are generally categorized as Level 2 in the hierarchy but may be Level 3 depending on the circumstances.
Changes in valuation techniques may result in transfers in or out of an assigned level within the disclosure hierarchy.
Investment Transactions and Income. For financial reporting purposes, the Fund's investment holdings and net asset value (NAV) include trades executed through the end of the last business day of the period. The NAV per share for processing shareholder transactions is calculated as of the close of business of the New York Stock Exchange (NYSE), normally 4:00 p.m. Eastern time and includes trades executed through the end of the prior business day. Gains and losses on securities sold are determined on the basis of identified cost. Interest income is accrued as earned and includes coupon interest and amortization of premium and accretion of discount on debt securities as applicable. Debt obligations may be placed on non-accrual status and related interest income may be reduced by ceasing current accruals and writing off interest receivables when the collection of all or a portion of interest has become doubtful based on consistently applied procedures. A debt obligation is removed from non-accrual status when the issuer resumes interest payments or when collectability of interest is reasonably assured.
Class Allocations and Expenses. Investment income, realized and unrealized capital gains and losses, common expenses of the Fund, and certain fund-level expense reductions, if any, are allocated daily on a pro-rata basis to each class based on the relative net assets of each class to the total net assets of the Fund. Each class differs with respect to transfer agent and distribution and service plan fees incurred. Certain expense reductions may also differ by class. For the reporting period, the allocated portion of income and expenses to each class as a percent of its average net assets may vary due to the timing of recording these transactions in relation to fluctuating net assets of the classes. Expenses directly attributable to a fund are charged to that fund. Expenses attributable to more than one fund are allocated among the respective funds on the basis of relative net assets or other appropriate methods. Expense estimates are accrued in the period to which they relate and adjustments are made when actual amounts are known.
Income Tax Information and Distributions to Shareholders. Each year, the Fund intends to qualify as a regulated investment company under Subchapter M of the Internal Revenue Code, including distributing substantially all of its taxable income and realized gains. As a result, no provision for U.S. Federal income taxes is required. As of October 31, 2015, the Fund did not have any unrecognized tax benefits in the financial statements; nor is the Fund aware of any tax positions for which it is reasonably possible that the total amounts of unrecognized tax benefits will significantly change in the next twelve months. The Fund files a U.S. federal tax return, in addition to state and local tax returns as required. The Fund's federal income tax returns are subject to examination by the Internal Revenue Service (IRS) for a period of three fiscal years after they are filed. State and local tax returns may be subject to examination for an additional fiscal year depending on the jurisdiction.
Dividends are declared and recorded daily and paid monthly from net investment income. Distributions from realized gains, if any, are declared and recorded on the ex-dividend date. Income dividends and capital gain distributions are declared separately for each class. Income and capital gain distributions are determined in accordance with income tax regulations, which may differ from GAAP. In addition, the Fund claimed a portion of the payment made to redeeming shareholders as a distribution for income tax purposes.
Capital accounts within the financial statements are adjusted for permanent book-tax differences. These adjustments have no impact on net assets or the results of operations. Capital accounts are not adjusted for temporary book-tax differences which will reverse in a subsequent period.
Book-tax differences are primarily due to market discount and deferred trustees compensation.
The Fund purchases municipal securities whose interest, in the opinion of the issuer, is free from federal income tax. There is no assurance that the IRS will agree with this opinion. In the event the IRS determines that the issuer does not comply with relevant tax requirements, interest payments from a security could become federally taxable, possibly retroactively to the date the security was issued.
The federal tax cost of investment securities and unrealized appreciation (depreciation) as of period end were as follows:
| Gross unrealized appreciation | $69,997,220 |
| Gross unrealized depreciation | (3,335,385) |
| Net unrealized appreciation (depreciation) on securities | $66,661,835 |
| Tax Cost | $933,590,007 |
The tax-based components of distributable earnings as of period end were as follows:
| Undistributed tax-exempt income | $158,903 |
| Undistributed long-term capital gain | $7,293,513 |
| Net unrealized appreciation (depreciation) on securities and other investments | $66,661,835 |
The tax character of distributions paid was as follows:
| October 31, 2015 | October 31, 2014 | |
| Tax-exempt Income | $32,013,498 | $32,459,524 |
| Long-term Capital Gains | 3,075,920 | 6,709,660 |
| Total | $35,089,418 | $ 39,169,184 |
Delayed Delivery Transactions and When-Issued Securities. During the period, the Fund transacted in securities on a delayed delivery or when-issued basis. Payment and delivery may take place after the customary settlement period for that security. The price of the underlying securities and the date when the securities will be delivered and paid for are fixed at the time the transaction is negotiated. The securities purchased on a delayed delivery or when-issued basis are identified as such in the Fund's Schedule of Investments. The Fund may receive compensation for interest forgone in the purchase of a delayed delivery or when-issued security. With respect to purchase commitments, the Fund identifies securities as segregated in its records with a value at least equal to the amount of the commitment. Losses may arise due to changes in the value of the underlying securities or if the counterparty does not perform under the contract's terms, or if the issuer does not issue the securities due to political, economic, or other factors.
3. Purchases and Sales of Investments.
Purchases and sales of securities, other than short-term securities, aggregated $196,399,761 and $140,889,319, respectively.
4. Fees and Other Transactions with Affiliates.
Management Fee. Fidelity Management & Research Company (the investment adviser) and its affiliates provide the Fund with investment management related services for which the Fund pays a monthly management fee. The management fee is the sum of an individual fund fee rate that is based on an annual rate of .25% of the Fund's average net assets and an annualized group fee rate that averaged .11% during the period. The group fee rate is based upon the average net assets of all the mutual funds advised by the investment adviser, including any mutual funds previously advised by the investment adviser that are currently advised by Fidelity SelectCo, LLC, an affiliate of the investment adviser. The group fee rate decreases as assets under management increase and increases as assets under management decrease. For the reporting period, the total annual management fee rate was .36% of the Fund's average net assets.
Distribution and Service Plan Fees. In accordance with Rule 12b-1 of the 1940 Act, the Fund has adopted separate Distribution and Service Plans for each class of shares. Certain classes pay Fidelity Distributors Corporation (FDC), an affiliate of the investment adviser, separate Distribution and Service Fees, each of which is based on an annual percentage of each class' average net assets. In addition, FDC may pay financial intermediaries for selling shares of the Fund and providing shareholder support services. For the period, the Distribution and Service Fee rates, total fees and amounts retained by FDC were as follows:
| Distribution Fee | Service Fee | Total Fees | Retained by FDC | |
| Class A | -% | .25% | $863,554 | $24,593 |
| Class T | -% | .25% | 479,967 | 132 |
| Class B | .65% | .25% | 36,853 | 26,616 |
| Class C | .75% | .25% | 1,182,536 | 128,141 |
| $2,562,910 | $179,482 |
Sales Load. FDC may receive a front-end sales charge of up to 4.00% for selling Class A shares and Class T shares, some of which is paid to financial intermediaries for selling shares of the Fund. Depending on the holding period, FDC may receive contingent deferred sales charges levied on Class A, Class T, Class B, and Class C redemptions. The deferred sales charges range from 5.00% to 1.00% for Class B shares, 1.00% for Class C shares, .75% for certain purchases of Class A shares and .25% for certain purchases of Class T shares.
For the period, sales charge amounts retained by FDC were as follows:
| Retained by FDC | |
| Class A | $27,918 |
| Class T | 6,425 |
| Class B(a) | 3,911 |
| Class C(a) | 17,753 |
| $56,007 |
(a) When Class B and Class C shares are initially sold, FDC pays commissions from its own resources to financial intermediaries through which the sales are made.
Transfer Agent Fees. Pursuant to the transfer agent contract approved by the Board of Trustees effective May 1, 2015, Fidelity Investments Institutional Operations Company, Inc. (FIIOC), an affiliate of the investment adviser, is the transfer, dividend disbursing and shareholder servicing agent for the Fund. FIIOC receives account fees and asset-based fees that vary according to the account size and type of account of the shareholders of the respective classes of the Fund. FIIOC pays for typesetting, printing and mailing of shareholder reports, except proxy statements. For the period, transfer agent fees for each class were as follows:
| Amount | % of Class-Level Average Net Assets | |
| Class A | $556,400 | .16 |
| Class T | 265,419 | .14 |
| Class B | 3,514 | .09 |
| Class C | 190,717 | .16 |
| Class I | 546,186 | .17 |
| $1,562,236 |
Prior to May 1, 2015, Citibank, N.A. was the transfer, dividend disbursing and shareholder servicing agent for the Fund. Prior to May 8, 2015, Citibank, N.A. was the custodian for the Fund.
Accounting Fees. Fidelity Service Company, Inc. (FSC), an affiliate of the investment adviser, maintains the Fund's accounting records. The fee is based on the level of average net assets for each month.
5. Committed Line of Credit.
The Fund participates with other funds managed by the investment adviser or an affiliate in a $4.25 billion credit facility (the "line of credit") to be utilized for temporary or emergency purposes to fund shareholder redemptions or for other short-term liquidity purposes. The Fund has agreed to pay commitment fees on its pro-rata portion of the line of credit, which amounted to $1,419 and is reflected in Miscellaneous expenses on the Statement of Operations. During the period, the Fund did not borrow on this line of credit.
6. Expense Reductions.
The investment adviser voluntarily agreed to reimburse each class to the extent annual operating expenses exceeded certain levels of average net assets as noted in the table below. Some expenses, for example interest expense, including commitment fees, are excluded from this reimbursement.
The following classes were in reimbursement during the period:
| Expense Limitations | Reimbursement | |
| Class A | .80% | $36,749 |
| Class C | 1.55% | 13,600 |
| Class I | .55% | 52,199 |
| $102,548 |
In addition, through arrangements with the Fund's custodian, credits realized as a result of certain uninvested cash balances were used to reduce the Fund's expenses. During the period, these credits reduced the Fund's custody expenses by $3,949.
In addition, during the period the investment adviser reimbursed and/or waived a portion of fund-level operating expenses in the amount of $2,215.
7. Distributions to Shareholders.
Distributions to shareholders of each class were as follows:
| Years ended October 31, | 2015 | 2014 |
| From net investment income | ||
| Class A | $11,209,786 | $11,330,075 |
| Class T | 6,254,506 | 7,089,994 |
| Class B | 109,257 | 167,211 |
| Class C | 2,952,064 | 3,190,951 |
| Class I | 11,487,885 | 10,681,293 |
| Total | $32,013,498 | $32,459,524 |
| From net realized gain | ||
| Class A | $1,040,888 | $2,345,937 |
| Class T | 645,322 | 1,463,693 |
| Class B | 15,321 | 48,806 |
| Class C | 375,706 | 862,580 |
| Class I | 998,683 | 1,988,644 |
| Total | $3,075,920 | $6,709,660 |
8. Share Transactions.
Share transactions for each class were as follows and may contain automatic conversions between classes or exchanges between funds:
| Shares | Shares | Dollars | Dollars | |
| Years ended October 31, | 2015 | 2014 | 2015 | 2014 |
| Class A | ||||
| Shares sold | 7,321,054 | 3,505,545 | $98,457,911 | $46,452,566 |
| Reinvestment of distributions | 799,176 | 826,195 | 10,802,339 | 10,887,594 |
| Shares redeemed | (4,304,331) | (6,185,804) | (58,024,074) | (81,584,528) |
| Net increase (decrease) | 3,815,899 | (1,854,064) | $51,236,176 | $(24,244,368) |
| Class T | ||||
| Shares sold | 962,158 | 1,002,254 | $13,077,839 | $13,321,199 |
| Reinvestment of distributions | 428,699 | 517,415 | 5,816,600 | 6,831,091 |
| Shares redeemed | (3,800,963) | (2,402,910) | (51,056,487) | (31,723,275) |
| Net increase (decrease) | (2,410,106) | (883,241) | $(32,162,048) | $(11,570,985) |
| Class B | ||||
| Shares sold | 6,377 | 3,673 | $85,790 | $48,057 |
| Reinvestment of distributions | 6,565 | 10,760 | 88,546 | 140,754 |
| Shares redeemed | (135,960) | (186,742) | (1,833,365) | (2,454,298) |
| Net increase (decrease) | (123,018) | (172,309) | $(1,659,029) | $(2,265,487) |
| Class C | ||||
| Shares sold | 1,517,186 | 1,231,173 | $20,585,033 | $16,418,632 |
| Reinvestment of distributions | 198,543 | 228,050 | 2,691,008 | 3,005,267 |
| Shares redeemed | (1,680,675) | (2,271,570) | (22,745,447) | (29,957,134) |
| Net increase (decrease) | 35,054 | (812,347) | $530,594 | $(10,533,235) |
| Class I | ||||
| Shares sold | 8,159,687 | 8,701,375 | $109,757,534 | $114,634,619 |
| Reinvestment of distributions | 715,538 | 633,458 | 9,622,256 | 8,301,472 |
| Shares redeemed | (6,096,917) | (8,683,609) | (81,897,623) | (113,346,340) |
| Net increase (decrease) | 2,778,308 | 651,224 | $37,482,167 | $9,589,751 |
9. Other.
The Fund's organizational documents provide former and current trustees and officers with a limited indemnification against liabilities arising in connection with the performance of their duties to the Fund. In the normal course of business, the Fund may also enter into contracts that provide general indemnifications. The Fund's maximum exposure under these arrangements is unknown as this would be dependent on future claims that may be made against the Fund. The risk of material loss from such claims is considered remote.
Report of Independent Registered Public Accounting Firm
To the Trustees of Fidelity Advisor Series II and Shareholders of Fidelity Advisor® Municipal Income Fund:
In our opinion, the accompanying statement of assets and liabilities, including the schedule of investments, and the related statements of operations and of changes in net assets and the financial highlights present fairly, in all material respects, the financial position of Fidelity Advisor® Municipal Income Fund (a fund of Fidelity Advisor Series II) at October 31, 2015, the results of its operations for the year then ended, the changes in its net assets for each of the two years in the period then ended and the financial highlights for each of the five years in the period then ended, in conformity with accounting principles generally accepted in the United States of America. These financial statements and financial highlights (hereafter referred to as “financial statements”) are the responsibility of the Fidelity Advisor® Municipal Income Fund’s management. Our responsibility is to express an opinion on these financial statements based on our audits. We conducted our audits of these financial statements in accordance with the standards of the Public Company Accounting Oversight Board (United States). Those standards require that we plan and perform the audit to obtain reasonable assurance about whether the financial statements are free of material misstatement. An audit includes examining, on a test basis, evidence supporting the amounts and disclosures in the financial statements, assessing the accounting principles used and significant estimates made by management, and evaluating the overall financial statement presentation. We believe that our audits, which included confirmation of securities at October 31, 2015 by correspondence with the custodian and brokers, provide a reasonable basis for our opinion.
PricewaterhouseCoopers LLP
Boston, Massachusetts
December 17, 2015
Trustees and Officers
The Trustees, Members of the Advisory Board (if any), and officers of the trust and fund, as applicable, are listed below. The Board of Trustees governs the fund and is responsible for protecting the interests of shareholders. The Trustees are experienced executives who meet periodically throughout the year to oversee the fund's activities, review contractual arrangements with companies that provide services to the fund, oversee management of the risks associated with such activities and contractual arrangements, and review the fund's performance. Each of the trustees oversees 234 funds.
The Trustees hold office without limit in time except that (a) any Trustee may resign; (b) any Trustee may be removed by written instrument, signed by at least two-thirds of the number of Trustees prior to such removal; (c) any Trustee who requests to be retired or who has become incapacitated by illness or injury may be retired by written instrument signed by a majority of the other Trustees; and (d) any Trustee may be removed at any special meeting of shareholders by a two-thirds vote of the outstanding voting securities of the trust. Each Trustee who is not an interested person (as defined in the 1940 Act) of the trust and the fund is referred to herein as an Independent Trustee. Each Independent Trustee shall retire not later than the last day of the month in which his or her 75th birthday occurs. The Independent Trustees may waive this mandatory retirement age policy with respect to individual Trustees. Officers and Advisory Board Members hold office without limit in time, except that any officer or Advisory Board Member may resign or may be removed by a vote of a majority of the Trustees at any regular meeting or any special meeting of the Trustees. Except as indicated, each individual has held the office shown or other offices in the same company for the past five years.
The fund’s Statement of Additional Information (SAI) includes more information about the Trustees. To request a free copy, call Fidelity at 1-877-208-0098.
Experience, Skills, Attributes, and Qualifications of the Trustees. The Governance and Nominating Committee has adopted a statement of policy that describes the experience, qualifications, attributes, and skills that are necessary and desirable for potential Independent Trustee candidates (Statement of Policy). The Board believes that each Trustee satisfied at the time he or she was initially elected or appointed a Trustee, and continues to satisfy, the standards contemplated by the Statement of Policy. The Governance and Nominating Committee also engages professional search firms to help identify potential Independent Trustee candidates who have the experience, qualifications, attributes, and skills consistent with the Statement of Policy. From time to time, additional criteria based on the composition and skills of the current Independent Trustees, as well as experience or skills that may be appropriate in light of future changes to board composition, business conditions, and regulatory or other developments, have also been considered by the professional search firms and the Governance and Nominating Committee. In addition, the Board takes into account the Trustees' commitment and participation in Board and committee meetings, as well as their leadership of standing and ad hoc committees throughout their tenure.
In determining that a particular Trustee was and continues to be qualified to serve as a Trustee, the Board has considered a variety of criteria, none of which, in isolation, was controlling. The Board believes that, collectively, the Trustees have balanced and diverse experience, qualifications, attributes, and skills, which allow the Board to operate effectively in governing the fund and protecting the interests of shareholders. Information about the specific experience, skills, attributes, and qualifications of each Trustee, which in each case led to the Board's conclusion that the Trustee should serve (or continue to serve) as a trustee of the fund, is provided below.
Board Structure and Oversight Function. Abigail P. Johnson is an interested person and currently serves as Chairman. The Trustees have determined that an interested Chairman is appropriate and benefits shareholders because an interested Chairman has a personal and professional stake in the quality and continuity of services provided to the fund. Independent Trustees exercise their informed business judgment to appoint an individual of their choosing to serve as Chairman, regardless of whether the Trustee happens to be independent or a member of management. The Independent Trustees have determined that they can act independently and effectively without having an Independent Trustee serve as Chairman and that a key structural component for assuring that they are in a position to do so is for the Independent Trustees to constitute a substantial majority for the Board. The Independent Trustees also regularly meet in executive session. Marie L. Knowles serves as Chairman of the Independent Trustees and as such (i) acts as a liaison between the Independent Trustees and management with respect to matters important to the Independent Trustees and (ii) with management prepares agendas for Board meetings.
Fidelity® funds are overseen by different Boards of Trustees. The fund's Board oversees Fidelity's investment-grade bond, money market, asset allocation and certain equity funds, and other Boards oversee Fidelity's high income, sector and other equity funds. The asset allocation funds may invest in Fidelity® funds that are overseen by such other Boards. The use of separate Boards, each with its own committee structure, allows the Trustees of each group of Fidelity® funds to focus on the unique issues of the funds they oversee, including common research, investment, and operational issues. On occasion, the separate Boards establish joint committees to address issues of overlapping consequences for the Fidelity® funds overseen by each Board.
The Trustees operate using a system of committees to facilitate the timely and efficient consideration of all matters of importance to the Trustees, the fund, and fund shareholders and to facilitate compliance with legal and regulatory requirements and oversight of the fund's activities and associated risks. The Board, acting through its committees, has charged FMR and its affiliates with (i) identifying events or circumstances the occurrence of which could have demonstrably adverse effects on the fund's business and/or reputation; (ii) implementing processes and controls to lessen the possibility that such events or circumstances occur or to mitigate the effects of such events or circumstances if they do occur; and (iii) creating and maintaining a system designed to evaluate continuously business and market conditions in order to facilitate the identification and implementation processes described in (i) and (ii) above. Because the day-to-day operations and activities of the fund are carried out by or through FMR, its affiliates, and other service providers, the fund's exposure to risks is mitigated but not eliminated by the processes overseen by the Trustees. While each of the Board's committees has responsibility for overseeing different aspects of the fund's activities, oversight is exercised primarily through the Operations and Audit Committees. In addition, an ad hoc Board committee of Independent Trustees has worked with FMR to enhance the Board's oversight of investment and financial risks, legal and regulatory risks, technology risks, and operational risks, including the development of additional risk reporting to the Board. Appropriate personnel, including but not limited to the fund's Chief Compliance Officer (CCO), FMR's internal auditor, the independent accountants, the fund's Treasurer and portfolio management personnel, make periodic reports to the Board's committees, as appropriate, including an annual review of Fidelity's risk management program for the Fidelity® funds. The responsibilities of each standing committee, including their oversight responsibilities, are described further under "Standing Committees of the Trustees."
Interested Trustees*:
Correspondence intended for a Trustee who is an interested person may be sent to Fidelity Investments, 245 Summer Street, Boston, Massachusetts 02210.
Name, Year of Birth; Principal Occupations and Other Relevant Experience+
Abigail P. Johnson (1961)
Year of Election or Appointment: 2009
Trustee
Chairman of the Board of Trustees
Ms. Johnson also serves as Trustee of other Fidelity® funds. Ms. Johnson serves as President (2013-present) and Chief Executive Officer (2014-present) of FMR LLC (diversified financial services company), President of Fidelity Financial Services (2012-present) and President of Personal, Workplace and Institutional Services (2005-present). Ms. Johnson is Chairman and Director of FMR Co., Inc. (investment adviser firm, 2011-present), Chairman and Director of FMR (investment adviser firm, 2011-present), and the Vice Chairman and Director (2007-present) of FMR LLC. Previously, Ms. Johnson served as President and a Director of FMR (2001-2005), a Trustee of other investment companies advised by FMR, Fidelity Investments Money Management, Inc. (investment adviser firm), and FMR Co., Inc. (2001-2005), Senior Vice President of the Fidelity® funds (2001-2005), and managed a number of Fidelity® funds. Ms. Abigail P. Johnson and Mr. Arthur E. Johnson are not related.
* Determined to be an “Interested Trustee” by virtue of, among other things, his or her affiliation with the trust or various entities under common control with FMR.
+ The information includes the Trustee's principal occupation during the last five years and other information relating to the experience, attributes, and skills relevant to the Trustee's qualifications to serve as a Trustee, which led to the conclusion that the Trustee should serve as a Trustee for the fund.
Independent Trustees:
Correspondence intended for an Independent Trustee may be sent to Fidelity Investments, P.O. Box 55235, Boston, Massachusetts 02205-5235.
Name, Year of Birth; Principal Occupations and Other Relevant Experience+
Albert R. Gamper, Jr. (1942)
Year of Election or Appointment: 2006
Trustee
Mr. Gamper also serves as Trustee of other Fidelity® funds. Prior to his retirement in December 2004, Mr. Gamper served as Chairman of the Board of CIT Group Inc. (commercial finance). During his tenure with CIT Group Inc. Mr. Gamper served in numerous senior management positions, including Chairman (1987-1989; 1999-2001; 2002-2004), Chief Executive Officer (1987-2004), and President (2002-2003). Mr. Gamper currently serves as a member of the Board of Directors of Public Service Enterprise Group (utilities, 2000-present), and Member of the Board of Trustees of Barnabas Health Care System (1997-present). Previously, Mr. Gamper served as Chairman (2012-2015) and Vice Chairman (2011-2012) of the Independent Trustees of certain Fidelity® funds and as Chairman of the Board of Governors, Rutgers University (2004-2007).
Robert F. Gartland (1951)
Year of Election or Appointment: 2010
Trustee
Mr. Gartland also serves as Trustee of other Fidelity® funds. Mr. Gartland is Chairman and an investor in Gartland and Mellina Group Corp. (consulting, 2009-present). Previously, Mr. Gartland served as a partner and investor of Vietnam Partners LLC (investments and consulting, 2008-2011). Prior to his retirement, Mr. Gartland held a variety of positions at Morgan Stanley (financial services, 1979-2007) including Managing Director (1987-2007).
Arthur E. Johnson (1947)
Year of Election or Appointment: 2008
Trustee
Vice Chairman of the Independent Trustees
Mr. Johnson also serves as Trustee of other Fidelity® funds. Mr. Johnson serves as a member of the Board of Directors of Eaton Corporation plc (diversified power management, 2009-present), AGL Resources, Inc. (holding company, 2002-present) and Booz Allen Hamilton (management consulting, 2011-present). Prior to his retirement, Mr. Johnson served as Senior Vice President of Corporate Strategic Development of Lockheed Martin Corporation (defense contractor, 1999-2009). He previously served on the Board of Directors of IKON Office Solutions, Inc. (1999-2008) and Delta Airlines (2005-2007). Mr. Arthur E. Johnson is not related to Ms. Abigail P. Johnson.
Michael E. Kenneally (1954)
Year of Election or Appointment: 2009
Trustee
Mr. Kenneally also serves as Trustee of other Fidelity® funds. Prior to his retirement, Mr. Kenneally served as Chairman and Global Chief Executive Officer of Credit Suisse Asset Management. Before joining Credit Suisse, he was an Executive Vice President and Chief Investment Officer for Bank of America Corporation. Earlier roles at Bank of America included Director of Research, Senior Portfolio Manager and Research Analyst, and Mr. Kenneally was awarded the Chartered Financial Analyst (CFA) designation in 1991.
James H. Keyes (1940)
Year of Election or Appointment: 2007
Trustee
Mr. Keyes also serves as Trustee of other Fidelity® funds. Mr. Keyes serves as a member of the Board and Non-Executive Chairman of Navistar International Corporation (manufacture and sale of trucks, buses, and diesel engines, since 2002). Previously, Mr. Keyes served as a member of the Board of Pitney Bowes, Inc. (integrated mail, messaging, and document management solutions, 1998-2013). Prior to his retirement, Mr. Keyes served as Chairman (1993-2002) and Chief Executive Officer (1988-2002) of Johnson Controls (automotive, building, and energy) and as a member of the Board of LSI Logic Corporation (semiconductor technologies, 1984-2008).
Marie L. Knowles (1946)
Year of Election or Appointment: 2001
Trustee
Chairman of the Independent Trustees
Ms. Knowles also serves as Trustee of other Fidelity® funds. Prior to Ms. Knowles' retirement in June 2000, she served as Executive Vice President and Chief Financial Officer of Atlantic Richfield Company (ARCO) (diversified energy, 1996-2000). From 1993 to 1996, she was a Senior Vice President of ARCO and President of ARCO Transportation Company. She served as a Director of ARCO from 1996 to 1998. Ms. Knowles currently serves as a Director and Chairman of the Audit Committee of McKesson Corporation (healthcare service, since 2002). Ms. Knowles is a member of the Board of the Catalina Island Conservancy and of the Santa Catalina Island Company (2009-present). She also serves as a member of the Advisory Board for the School of Engineering of the University of Southern California. Previously, Ms. Knowles served as a Director of Phelps Dodge Corporation (copper mining and manufacturing, 1994-2007), URS Corporation (engineering and construction, 2000-2003) and America West (airline, 1999-2002). Ms. Knowles previously served as Vice Chairman of the Independent Trustees of certain Fidelity® funds (2012-2015).
+ The information includes the Trustee's principal occupation during the last five years and other information relating to the experience, attributes, and skills relevant to the Trustee's qualifications to serve as a Trustee, which led to the conclusion that the Trustee should serve as a Trustee for the fund.
Advisory Board Members and Officers:
Correspondence intended for a Member of the Advisory Board may be sent to Fidelity Investments, P.O. Box 55235, Boston, Massachusetts 02205-5235. Correspondence intended for an officer may be sent to Fidelity Investments, 245 Summer Street, Boston, Massachusetts 02210. Officers appear below in alphabetical order.
Name, Year of Birth; Principal Occupation
Elizabeth S. Acton (1951)
Year of Election or Appointment: 2013
Member of the Advisory Board
Ms. Acton also serves as Trustee or Member of the Advisory Board of other Fidelity® funds. Prior to her retirement in April 2012, Ms. Acton was Executive Vice President, Finance (2011-2012), Executive Vice President, Chief Financial Officer (2002-2011), and Treasurer (2004-2005) of Comerica Incorporated (financial services). Prior to joining Comerica, Ms. Acton held a variety of positions at Ford Motor Company (1983-2002), including Vice President and Treasurer (2000-2002) and Executive Vice President and Chief Financial Officer of Ford Motor Credit Company (1998-2000). Ms. Acton currently serves as a member of the Board of Directors and Audit and Finance Committees of Beazer Homes USA, Inc. (homebuilding, 2012-present).
John Engler (1948)
Year of Election or Appointment: 2014
Member of the Advisory Board
Mr. Engler also serves as Trustee or Member of the Advisory Board of other Fidelity® funds. He serves as president of the Business Roundtable (2011-present), and on the board of directors/trustees for Universal Forest Products (manufacturer and distributor of wood and wood-alternative products, 2003-present), K12 Inc. (technology-based education company, 2012-present), and the Annie E. Casey Foundation (2004-present). Previously, Mr. Engler served as a trustee of The Munder Funds (2003-2014), president and CEO of the National Association of Manufacturers (2004-2011) and as governor of Michigan (1991-2003). He is a past chairman of the National Governors Association.
Geoffrey A. von Kuhn (1951)
Year of Election or Appointment: 2015
Member of the Advisory Board
Mr. von Kuhn also serves as Trustee or Member of the Advisory Board of other Fidelity funds. Mr. von Kuhn is Chief Administrative Officer for FMR LLC (diversified financial services company, 2013-present), a Director of Pembroke Real Estate, Inc. (2009-present), and a Director of Discovery Natural Resources LLC (2012-present). Previously, Mr. von Kuhn was a managing director of Crosby Group (private wealth management company, 2007-2013), a member of the management committee and senior executive in the Wealth Management Group of AmSouth Bank (2001-2006), and head of the U.S. private bank at Citigroup (2000-2001).
Elizabeth Paige Baumann (1968)
Year of Election or Appointment: 2012
Anti-Money Laundering (AML) Officer
Ms. Baumann also serves as AML Officer of other funds. She is Chief AML Officer of FMR LLC (diversified financial services company, 2012-present) and is an employee of Fidelity Investments. Previously, Ms. Baumann served as Vice President and Deputy Anti-Money Laundering Officer (2007-2012).
Marc R. Bryant (1966)
Year of Election or Appointment: 2015
Secretary and Chief Legal Officer (CLO)
Mr. Bryant also serves as Secretary and CLO of other funds. Mr. Bryant serves as CLO, Secretary, and Senior Vice President of Fidelity Management & Research Company (investment adviser firm, 2015-present) and FMR Co., Inc. (investment adviser firm, 2015-present); Secretary of Fidelity SelectCo, LLC (investment adviser firm, 2015-present) and Fidelity Investments Money Management, Inc. (investment adviser firm, 2015-present); and CLO of Fidelity Management & Research (Hong Kong) Limited (investment adviser firm, 2015-present). He is Senior Vice President and Deputy General Counsel of FMR LLC (diversified financial services company). Previously, Mr. Bryant served as Secretary and Chief Legal Officer of Fidelity Rutland Square Trust II (2010-2014) and Assistant Secretary of Fidelity's Fixed Income and Asset Allocation Funds (2013-2015). Prior to joining Fidelity Investments, Mr. Bryant served as a Senior Vice President and the Head of Global Retail Legal for AllianceBernstein L.P. (2006-2010), and as the General Counsel for ProFund Advisors LLC (2001-2006).
Jonathan Davis (1968)
Year of Election or Appointment: 2010
Assistant Treasurer
Mr. Davis also serves as Assistant Treasurer of other funds, and is an employee of Fidelity Investments. Previously, Mr. Davis served as Vice President and Associate General Counsel of FMR LLC (diversified financial services company, 2003-2010).
Adrien E. Deberghes (1967)
Year of Election or Appointment: 2010
Assistant Treasurer
Mr. Deberghes also serves as an officer of other funds. He is an employee of Fidelity Investments (2008-present). Prior to joining Fidelity Investments, Mr. Deberghes was Senior Vice President of Mutual Fund Administration at State Street Corporation (2007-2008), Senior Director of Mutual Fund Administration at Investors Bank & Trust (2005-2007), and Director of Finance for Dunkin' Brands (2000-2005).
Stephanie J. Dorsey (1969)
Year of Election or Appointment: 2013
President and Treasurer
Ms. Dorsey also serves as an officer of other funds. She is an employee of Fidelity Investments (2008-present) and has served in other fund officer roles. Prior to joining Fidelity Investments, Ms. Dorsey served as Treasurer (2004-2008) of the JPMorgan Mutual Funds and Vice President (2004-2008) of JPMorgan Chase Bank.
Howard J. Galligan III (1966)
Year of Election or Appointment: 2014
Chief Financial Officer
Mr. Galligan also serves as Chief Financial Officer of other funds. Mr. Galligan serves as President of Fidelity Pricing and Cash Management Services (FPCMS) (2014-present) and as a Director of Strategic Advisers, Inc. (investment adviser firm, 2008-present). Previously, Mr. Galligan served as Chief Administrative Officer of Asset Management (2011-2014) and Chief Operating Officer and Senior Vice President of Investment Support for Strategic Advisers, Inc. (2003-2011).
Scott C. Goebel (1968)
Year of Election or Appointment: 2015
Vice President
Mr. Goebel serves as Vice President of other funds and is an employee of Fidelity Investments (2001-present). Previously, Mr. Goebel served as Secretary of Fidelity SelectCo, LLC (investment adviser firm, 2013-2015), Fidelity Investments Money Management, Inc. (FIMM) (investment adviser firm, 2010-2015), and Fidelity Research and Analysis Company (FRAC) (investment adviser firm, 2010-2015); General Counsel, Secretary, and Senior Vice President of Fidelity Management & Research Company (investment adviser firm, 2008-2015) and FMR Co., Inc. (investment adviser firm, 2008-2015); Assistant Secretary of Fidelity Management & Research (Japan) Limited (investment adviser firm, 2008-2015) and FMR Investment Management (U.K.) Limited (investment adviser firm, 2008-2015); Chief Legal Officer (CLO) of Fidelity Management & Research (Hong Kong) Limited (investment adviser firm, 2008-2015); Secretary and CLO of certain Fidelity® funds (2008-2015); Assistant Secretary of FIMM (2008-2010), FRAC (2008-2010), and certain funds (2007-2008); and as Vice President and Secretary of Fidelity Distributors Corporation (FDC) (2005-2007).
Chris Maher (1972)
Year of Election or Appointment: 2013
Assistant Treasurer
Mr. Maher serves as Assistant Treasurer of other funds. Mr. Maher is Vice President of Valuation Oversight and is an employee of Fidelity Investments. Previously, Mr. Maher served as Vice President of Asset Management Compliance (2013), Vice President of the Program Management Group of FMR (investment adviser firm, 2010-2013), and Vice President of Valuation Oversight (2008-2010).
Jason P. Pogorelec (1975)
Year of Election or Appointment: 2015
Assistant Secretary
Mr. Pogorelec also serves as Assistant Secretary of other funds. Mr. Pogorelec serves as Vice President, Associate General Counsel (2010-present) and is an employee of Fidelity Investments (2006-present).
Nancy D. Prior (1967)
Year of Election or Appointment: 2014
Vice President
Ms. Prior also serves as Vice President of other funds. Ms. Prior serves as a Director of Fidelity Investments Money Management, Inc. (FIMM) (investment adviser firm, 2014-present), President, Fixed Income (2014-present), Vice Chairman of FIAM LLC (investment adviser firm, 2014-present), and is an employee of Fidelity Investments (2002-present). Previously, Ms. Prior served as Vice President of Fidelity's Money Market Funds (2012-2014), President, Money Market and Short Duration Bond of FMR (investment adviser firm, 2013-2014), President, Money Market Group of FMR (2011-2014), Managing Director of Research (2009-2011), Senior Vice President and Deputy General Counsel (2007-2009), and Assistant Secretary of other Fidelity® funds (2008-2009).
Kenneth B. Robins (1969)
Year of Election or Appointment: 2009
Assistant Treasurer
Mr. Robins also serves as an officer of other funds. Mr. Robins serves as Executive Vice President of Fidelity Investments Money Management, Inc. (FIMM) (investment adviser firm, 2013-present) and is an employee of Fidelity Investments (2004-present). Previously, Mr. Robins served in other fund officer roles.
Stacie M. Smith (1974)
Year of Election or Appointment: 2013
Assistant Treasurer
Ms. Smith also serves as an officer of other funds. She is an employee of Fidelity Investments (2009-present) and has served in other fund officer roles. Prior to joining Fidelity Investments, Ms. Smith served as Senior Audit Manager of Ernst & Young LLP (1996-2009).
Renee Stagnone (1975)
Year of Election or Appointment: 2013
Deputy Treasurer
Ms. Stagnone also serves as Deputy Treasurer of other funds. Ms. Stagnone is an employee of Fidelity Investments (1997-present).
Christine J. Thompson (1958)
Year of Election or Appointment: 2015
Vice President of Fidelity's Bond Funds
Ms. Thompson also serves as Vice President of other funds. Ms. Thompson also serves as Chief Investment Officer of FMR's Bond Group (2010-present) and is an employee of Fidelity Investments (1985-present). Previously, Ms. Thompson served as Vice President of Fidelity's Bond Funds (2010-2012).
Michael H. Whitaker (1967)
Year of Election or Appointment: 2008
Chief Compliance Officer
Mr. Whitaker also serves as Chief Compliance Officer of other funds. Mr. Whitaker also serves as Compliance Officer of FMR Co., Inc. (investment adviser firm, 2014-present), FMR (investment adviser firm, 2014-present), and Fidelity Investments Money Management, Inc. (investment adviser firm, 2014-present) and is an employee of Fidelity Investments (2007-present). Prior to joining Fidelity Investments, Mr. Whitaker worked at MFS Investment Management where he served as Senior Vice President and Chief Compliance Officer (2004-2006), and Assistant General Counsel.
Joseph F. Zambello (1957)
Year of Election or Appointment: 2011
Deputy Treasurer
Mr. Zambello also serves as Deputy Treasurer of other funds. Mr. Zambello is an employee of Fidelity Investments (1991-present). Previously, Mr. Zambello served as Vice President of the Program Management Group of FMR (investment adviser firm, 2009-2011) and Vice President of the Transfer Agent Oversight Group (2005-2009).
Shareholder Expense Example
As a shareholder of the Fund, you incur two types of costs: (1) transaction costs, including sales charges (loads) on purchase payments or redemption proceeds, and (2) ongoing costs, including management fees, distribution and/or service (12b-1) fees and other Fund expenses. This Example is intended to help you understand your ongoing costs (in dollars) of investing in the Fund and to compare these costs with the ongoing costs of investing in other mutual funds.
The Example is based on an investment of $1,000 invested at the beginning of the period and held for the entire period (May 1, 2015 to October 31, 2015).
Actual Expenses
The first line of the accompanying table for each class of the Fund provides information about actual account values and actual expenses. You may use the information in this line, together with the amount you invested, to estimate the expenses that you paid over the period. Simply divide your account value by $1,000.00 (for example, an $8,600 account value divided by $1,000.00 = 8.6), then multiply the result by the number in the first line for a class of the Fund under the heading entitled "Expenses Paid During Period" to estimate the expenses you paid on your account during this period.
Hypothetical Example for Comparison Purposes
The second line of the accompanying table for each class of the Fund provides information about hypothetical account values and hypothetical expenses based on a Class' actual expense ratio and an assumed rate of return of 5% per year before expenses, which is not the Class' actual return. The hypothetical account values and expenses may not be used to estimate the actual ending account balance or expenses you paid for the period. You may use this information to compare the ongoing costs of investing in the Fund and other funds. To do so, compare this 5% hypothetical example with the 5% hypothetical examples that appear in the shareholder reports of the other funds.
Please note that the expenses shown in the table are meant to highlight your ongoing costs only and do not reflect any transaction costs. Therefore, the second line of the table is useful in comparing ongoing costs only, and will not help you determine the relative total costs of owning different funds. In addition, if these transactional costs were included, your costs would have been higher.
| Annualized Expense Ratio-A | Beginning Account Value May 1, 2015 | Ending Account Value October 31, 2015 | Expenses Paid During Period-B May 1, 2015 to October 31, 2015 | |
| Class A | .80% | |||
| Actual | $1,000.00 | $1,013.30 | $4.06 | |
| Hypothetical-C | $1,000.00 | $1,021.17 | $4.08 | |
| Class T | .78% | |||
| Actual | $1,000.00 | $1,013.40 | $3.96 | |
| Hypothetical-C | $1,000.00 | $1,021.27 | $3.97 | |
| Class B | 1.36% | |||
| Actual | $1,000.00 | $1,009.70 | $6.89 | |
| Hypothetical-C | $1,000.00 | $1,018.35 | $6.92 | |
| Class C | 1.55% | |||
| Actual | $1,000.00 | $1,008.80 | $7.85 | |
| Hypothetical-C | $1,000.00 | $1,017.39 | $7.88 | |
| Class I | .55% | |||
| Actual | $1,000.00 | $1,014.60 | $2.79 | |
| Hypothetical-C | $1,000.00 | $1,022.43 | $2.80 |
A Annualized expense ratio reflects expenses net of applicable fee waivers.
B Expenses are equal to each Class' annualized expense ratio, multiplied by the average account value over the period, multiplied by 184/365 (to reflect the one-half year period).
C 5% return per year before expenses
Distributions (Unaudited)
The Board of Trustees of Fidelity Advisor Municipal Income Fund voted to pay to shareholders of record at the opening of business on record date, the following distributions per share derived from capital gains realized from sales of portfolio securities, and dividends derived from net investment income:
| Pay Date | Record Date | Dividends | Capital Gains | |
| Class I | 12/07/15 | 12/04/15 | $0.000 | $0.098 |
The fund hereby designates as a capital gain dividend with respect to the taxable year ended October 31, 2015, $8,087,225, or, if subsequently determined to be different, the net capital gain of such year.
During fiscal year ended 2015, 100% of the fund's income dividends was free from federal income tax, and 4.22% of the fund's income dividends was subject to the federal alternative minimum tax.
The fund will notify shareholders in January 2016 of amounts for use in preparing 2015 income tax returns.
Board Approval of Investment Advisory Contracts and Management Fees
Fidelity Advisor Municipal Income Fund
Each year, the Board of Trustees, including the Independent Trustees (together, the Board), votes on the renewal of the management contract with Fidelity Management & Research Company (FMR) and the sub-advisory agreements (together, the Advisory Contracts) for the fund. The Board, assisted by the advice of fund counsel and Independent Trustees' counsel, requests and considers a broad range of information relevant to the renewal of the Advisory Contracts throughout the year.
The Board meets regularly and, at each of its meetings, covers an extensive agenda of topics and materials and considers factors that are relevant to its annual consideration of the renewal of the fund's Advisory Contracts, including the services and support provided to the fund and its shareholders. The Board has established four standing committees (Committees) — Operations, Audit, Fair Valuation, and Governance and Nominating — each composed of and chaired by Independent Trustees with varying backgrounds, to which the Board has assigned specific subject matter responsibilities in order to enhance effective decision-making by the Board. The Operations Committee, of which all of the Independent Trustees are members, meets regularly throughout the year and considers, among other matters, information specifically related to the annual consideration of the renewal of the fund's Advisory Contracts. The Board, acting directly and through its Committees, requests and receives information concerning the annual consideration of the renewal of the fund's Advisory Contracts. The Board also meets as needed to consider matters specifically related to the Board's annual consideration of the renewal of the Advisory Contracts. Members of the Board may also meet with trustees of other Fidelity funds through ad hoc joint committees to discuss certain matters relevant to all of the Fidelity funds.
At its September 2015 meeting, the Board unanimously determined to renew the fund's Advisory Contracts. In reaching its determination, the Board considered all factors it believed relevant, including (i) the nature, extent, and quality of the services to be provided to the fund and its shareholders (including the investment performance of the fund); (ii) the competitiveness of the fund's management fee and total expense ratio relative to peer funds; (iii) the total costs of the services to be provided by and the profits to be realized by Fidelity from its relationship with the fund; and (iv) the extent to which (if any) economies of scale exist and would be realized as the fund grows, and whether any economies of scale are appropriately shared with fund shareholders.
In considering whether to renew the Advisory Contracts for the fund, the Board reached a determination, with the assistance of fund counsel and Independent Trustees' counsel and through the exercise of its business judgment, that the renewal of the Advisory Contracts was in the best interests of the fund and its shareholders and that the compensation payable under the Advisory Contracts was fair and reasonable. The Board's decision to renew the Advisory Contracts was not based on any single factor, but rather was based on a comprehensive consideration of all the information provided to the Board at its meetings throughout the year. The Board, in reaching its determination to renew the Advisory Contracts, was aware that shareholders of the fund have a broad range of investment choices available to them, including a wide choice among funds offered by Fidelity's competitors, and that the fund's shareholders, who have the opportunity to review and weigh the disclosure provided by the fund in its prospectus and other public disclosures, have chosen to invest in this fund, which is part of the Fidelity family of funds.
Nature, Extent, and Quality of Services Provided. The Board considered Fidelity's staffing as it relates to the fund, including the backgrounds of investment personnel of Fidelity, and also considered the fund's investment objective, strategies, and related investment philosophy. The Independent Trustees also had discussions with senior management of Fidelity's investment operations and investment groups. The Board considered the structure of the portfolio manager compensation program and whether this structure provides appropriate incentives to act in the best interests of the fund. Additionally, the Board considered the portfolio managers' investments, if any, in the funds that they manage.Resources Dedicated to Investment Management and Support Services. The Board reviewed the general qualifications and capabilities of Fidelity's investment staff, including its size, education, experience, and resources, as well as Fidelity's approach to recruiting, training, managing, and compensating investment personnel. The Board noted that Fidelity has continued to increase the resources devoted to non-U.S. offices, including expansion of Fidelity's global investment organization. The Board also noted that Fidelity's analysts have extensive resources, tools and capabilities that allow them to conduct sophisticated quantitative and fundamental analysis, as well as credit analysis of issuers, counterparties and guarantors. Further, the Board considered that Fidelity's investment professionals have sufficient access to global information and data so as to provide competitive investment results over time, and that those professionals also have access to sophisticated tools that permit them to assess portfolio construction and risk and performance attribution characteristics continuously, as well as to transmit new information and research conclusions rapidly around the world. Additionally, in its deliberations, the Board considered Fidelity's trading, risk management, compliance, and technology and operations capabilities and resources, which are integral parts of the investment management process.Shareholder and Administrative Services. The Board considered (i) the nature, extent, quality, and cost of advisory, administrative, and shareholder services performed by FMR, the sub-advisers (together with FMR, the Investment Advisers), and their affiliates under the Advisory Contracts and under separate agreements covering transfer agency and pricing and bookkeeping services for the fund; (ii) the nature and extent of the supervision of third party service providers, principally custodians, subcustodians, and pricing vendors; and (iii) the resources devoted to, and the record of compliance with, the fund's compliance policies and procedures.The Board noted that the growth of fund assets over time across the complex allows Fidelity to reinvest in the development of services designed to enhance the value or convenience of the Fidelity funds as investment vehicles. These services include 24-hour access to account information and market information through telephone representatives and over the Internet, investor education materials and asset allocation tools, and the expanded availability of Fidelity Investor Centers.Investment in a Large Fund Family. The Board considered the benefits to shareholders of investing in a Fidelity fund, including the benefits of investing in a fund that is part of a large family of funds offering a variety of investment disciplines and providing a large variety of mutual fund investor services. The Board noted that Fidelity had taken, or had made recommendations that resulted in the Fidelity funds taking, a number of actions over the previous year that benefited particular funds, including (i) continuing to dedicate additional resources to investment research and to the support of the senior management team that oversees asset management; (ii) continuing efforts to enhance Fidelity's global research capabilities; (iii) launching new funds and making other enhancements to meet client needs; (iv) reducing management fees and total expenses for certain index funds and diversified international funds; (v) continuing to launch dedicated lower cost underlying funds to meet portfolio construction needs related to expanding underlying fund options for Fidelity funds of funds, specifically for the Freedom Fund product lines; (vi) rationalizing product lines and gaining increased efficiencies through fund mergers; (vii) launching active fixed-income exchange-traded funds; (viii) continuing to develop, acquire and implement systems and technology to improve services to the funds and shareholders, strengthen information security, and increase efficiency; (ix) implementing investment enhancements to further strengthen Fidelity's target date product line to increase investors' probability of success in achieving their goals; (x) modifying the eligibility criteria for certain share classes to accommodate roll-over assets from employer-sponsored retirement plans; (xi) launching a new Class W of the Freedom Index Funds to attract and retain Fidelity record-kept retirement plan assets; and (xii) implementing changes to Fidelity's money market product line in response to recent money market regulatory reforms.Investment Performance. The Board considered whether the fund has operated in accordance with its investment objective, as well as its record of compliance with its investment restrictions and its performance history.The Board took into account discussions with representatives of the Investment Advisers about fund investment performance that occur at Board meetings throughout the year. In this regard the Board noted that as part of regularly scheduled fund reviews and other reports to the Board on fund performance, the Board considers annualized return information for the fund for different time periods, measured against a securities market index ("benchmark index") and a peer group of funds with similar objectives ("peer group"), if any. In its evaluation of fund investment performance at meetings throughout the year, the Board gave particular attention to information indicating underperformance of certain Fidelity funds for specific time periods and discussed with the Investment Advisers the reasons for such underperformance.In addition to reviewing absolute and relative fund performance, the Independent Trustees periodically consider the appropriateness of fund performance metrics in evaluating the results achieved. In general, the Independent Trustees believe that fund performance should be evaluated based on gross performance (before fees and expenses but after transaction costs) compared to appropriate benchmark indices, over appropriate time periods that may include full market cycles, and on net performance (after fees and expenses) compared to peer groups, as applicable, over the same periods, taking into account relevant factors including the following: general market conditions; expectations for interest rate levels and credit conditions; issuer-specific information including credit quality; the potential for incremental return versus the fund's benchmark index weighed against the risks involved in obtaining that incremental return, including the risk of diminished or negative total returns; and fund cash flows and other factors. Depending on the circumstances, the Independent Trustees may be satisfied with a fund's performance notwithstanding that it lags its benchmark index or peer group for certain periods.The Independent Trustees recognize that shareholders evaluate performance on a net basis over their own holding periods, for which one-, three-, and five-year periods are often used as a proxy. For this reason, the performance information reviewed by the Board also included net cumulative calendar year total return information for the fund and an appropriate benchmark index and peer group for the most recent one-, three-, and five-year periods.Based on its review, the Board concluded that the nature, extent, and quality of services provided to the fund under the Advisory Contracts should benefit the shareholders of the fund.Competitiveness of Management Fee and Total Expense Ratio. The Board considered the fund's management fee and total expense ratio compared to "mapped groups" of competitive funds and classes created for the purpose of facilitating the Trustees' competitive analysis of management fees and total expenses. Fidelity creates "mapped groups" by combining similar Lipper investment objective categories that have comparable investment mandates. Combining Lipper investment objective categories aids the Board's management fee and total expense ratio comparisons by broadening the competitive group used for comparison.Management Fee. The Board considered two proprietary management fee comparisons for the 12-month periods shown in basis points (BP) in the chart below. The group of Lipper funds used by the Board for management fee comparisons is referred to below as the "Total Mapped Group" and, for the reasons explained above, is broader than the Lipper peer group used by the Board for performance comparisons. The Total Mapped Group comparison focuses on a fund's standing in terms of gross management fees before expense reimbursements or caps relative to the total universe of funds with comparable investment mandates, regardless of whether their management fee structures also are comparable. Funds with comparable investment mandates offer exposure to similar types of securities. Funds with comparable management fee structures have similar management fee contractual arrangements (e.g., flat rate charged for advisory services, all-inclusive fee rate, etc.). "TMG %" represents the percentage of funds in the Total Mapped Group that had management fees that were lower than the fund's. For example, a hypothetical TMG % of 20% would mean that 80% of the funds in the Total Mapped Group had higher, and 20% had lower, management fees than the fund. The fund's actual TMG %s and the number of funds in the Total Mapped Group are in the chart below. The "Asset-Size Peer Group" (ASPG) comparison focuses on a fund's standing relative to a subset of non-Fidelity funds within the Total Mapped Group that are similar in size and management fee structure. For example, if a fund is in the first quartile of the ASPG, the fund's management fee ranks in the least expensive or lowest 25% of funds in the ASPG. The ASPG represents at least 15% of the funds in the Total Mapped Group with comparable asset size and management fee structures, subject to a minimum of 50 funds (or all funds in the Total Mapped Group if fewer than 50). Additional information, such as the ASPG quartile in which the fund's management fee rate ranked, is also included in the chart and considered by the Board.Fidelity Advisor Municipal Income Fund
![]()
HIMI-ANN-1215
1.538417.118
Fidelity Advisor® Municipal Income Fund Class A, Class T, Class B and Class C Annual Report October 31, 2015 |
|
Contents
Board Approval of Investment Advisory Contracts and Management Fees |
To view a fund's proxy voting guidelines and proxy voting record for the 12-month period ended June 30, visit http://www.fidelity.com/proxyvotingresults or visit the Securities and Exchange Commission's (SEC) web site at http://www.sec.gov.
You may also call 1-877-208-0098 to request a free copy of the proxy voting guidelines.
Standard & Poor's, S&P and S&P 500 are registered service marks of The McGraw-Hill Companies, Inc. and have been licensed for use by Fidelity Distributors Corporation.
Other third-party marks appearing herein are the property of their respective owners.
All other marks appearing herein are registered or unregistered trademarks or service marks of FMR LLC or an affiliated company. ©2015 FMR LLC. All rights reserved.
This report and the financial statements contained herein are submitted for the general information of the shareholders of the Fund. This report is not authorized for distribution to prospective investors in the Fund unless preceded or accompanied by an effective prospectus.
A fund files its complete schedule of portfolio holdings with the SEC for the first and third quarters of each fiscal year on Form N-Q. Forms N-Q are available on the SEC’s web site at http://www.sec.gov. A fund's Forms N-Q may be reviewed and copied at the SEC’s Public Reference Room in Washington, DC. Information regarding the operation of the SEC's Public Reference Room may be obtained by calling 1-800-SEC-0330.
For a complete list of a fund's portfolio holdings, view the most recent holdings listing, semiannual report, or annual report on Fidelity's web site at http://www.fidelity.com, http://www.advisor.fidelity.com, or http://www.401k.com, as applicable.
NOT FDIC INSURED •MAY LOSE VALUE •NO BANK GUARANTEE
Neither the Fund nor Fidelity Distributors Corporation is a bank.
Performance: The Bottom Line
Average annual total return reflects the change in the value of an investment, assuming reinvestment of distributions from dividend income and capital gains (the profits earned upon the sale of securities that have grown in value, if any) and assuming a constant rate of performance each year.
The hypothetical investment and the average annual total returns do not reflect the deduction of taxes that a shareholder would pay on fund distributions or the redemption of fund shares.
During periods of reimbursement by Fidelity, a fund’s total return will be greater than it would be had the reimbursement not occurred.
How a fund did yesterday is no guarantee of how it will do tomorrow.
Returns reflect the conversion of Class B shares to Class A shares after a maximum of seven years.
Average Annual Total Returns
| For the periods ended October 31, 2015 | Past 1 year | Past 5 years | Past 10 years |
| Class A (incl. 4.00% sales charge) | (1.40)% | 3.64% | 4.06% |
| Class T (incl. 4.00% sales charge) | (1.39)% | 3.65% | 4.05% |
| Class B (incl. contingent deferred sales charge) | (2.85)% | 3.45% | 3.98% |
| Class C (incl. contingent deferred sales charge) | 0.95% | 3.69% | 3.69% |
Class B shares' contingent deferred sales charges included in the past one year, past five years and past ten years total return figures are 5%, 2% and 0%, respectively.
Class C shares' contingent deferred sales charges included in the past one year, past five years and past ten years total return figures are 1%, 0% and 0%, respectively.
$10,000 Over 10 Years
Let's say hypothetically that $10,000 was invested in Fidelity Advisor® Municipal Income Fund - Class A on October 31, 2005, and the current 4.00% sales charge was paid.
The chart shows how the value of your investment would have changed, and also shows how the Barclays® Municipal Bond Index performed over the same period.
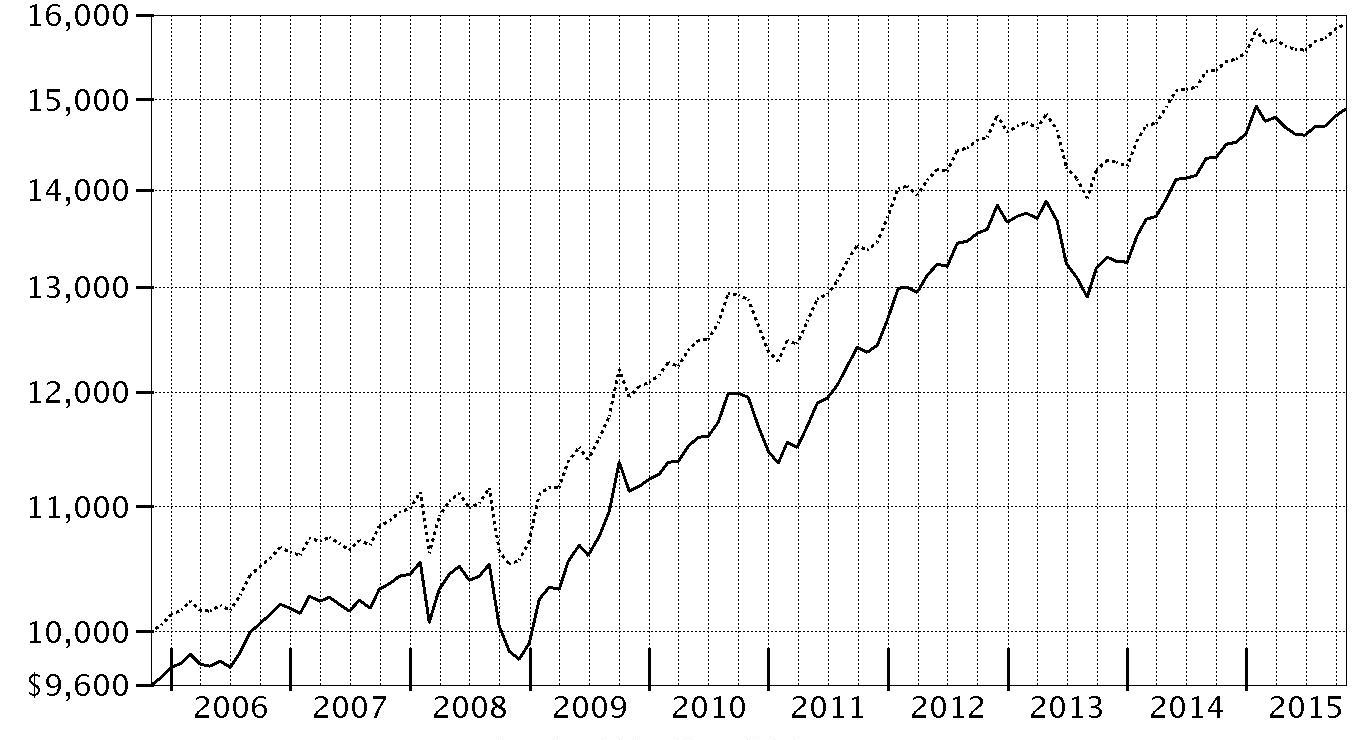
| Period Ending Values | ||
| $14,888 | Fidelity Advisor® Municipal Income Fund - Class A | |
| $15,891 | Barclays® Municipal Bond Index | |
Management's Discussion of Fund Performance
Market Recap: Tax-exempt municipal bonds posted a moderate gain for the 12 months ending October 31, 2015, driven by improving credit fundamentals and continued demand for high-quality, tax-exempt income, despite increased supply due to refinancing activity. The Barclays® Municipal Bond Index advanced 2.87%. Performance was strong early in the period, when many issuers exercised a level of fiscal conservatism, limiting supply. The muni market faced a difficult stretch between April and June, when the focus of the market shifted to the budget difficulties of a handful of high-profile issuers, including New Jersey, Illinois and Chicago. A common theme of unfunded pension liabilities for these issuers overshadowed a generally stable credit environment for state and local governments more broadly. But the market recouped those losses over the final four months as supply moderated. The tax advantages of munis continued to appeal to investors, in light of higher federal income-tax rates for top earners, as well as the 3.8% Medicare tax on non-municipal investment income, that took effect in 2013. At period end, investors continued to watch the flow of economic data, which the U.S. Federal Reserve has stated will help it determine the timing of any policy interest-rate increase.Comments from Jamie Pagliocco, Lead Portfolio Manager: For the year, the fund’s share classes (excluding sales charges, if applicable) trailed the 3.13% return of the Barclays® 3+ Year Municipal Bond Index. We continued to base our investment decisions on longer-term objectives, seeking attractive tax-exempt income and competitive risk-adjusted returns, including both price appreciation and income, over time. The fund’s larger weightings in bonds appropriated by the state of New Jersey, as well as bonds backed by the city of Chicago and related entities, were the primary drag on relative performance. New Jersey state-appropriated bonds underperformed amid worries about its budget challenges and unfunded pension liabilities. Debt backed by Chicago and closely related credits also performed poorly, as pension reform became more difficult, and one major credit-rating agency assigned the city a below-investment-grade rating. In contrast, the fund’s larger exposure to bonds that were advance refunded during the period was a plus, as such refinancings typically result in price gains for bondholders, because the bonds’ durations shorten and their credit quality jumps. Our decision to overweight health care bonds also was a plus. These securities turned in above-average performance, primarily due to investors seeking the relatively high yields these bonds offered.The views expressed above reflect those of the portfolio manager(s) only through the end of the period as stated on the cover of this report and do not necessarily represent the views of Fidelity or any other person in the Fidelity organization. Any such views are subject to change at any time based upon market or other conditions and Fidelity disclaims any responsibility to update such views. These views may not be relied on as investment advice and, because investment decisions for a Fidelity fund are based on numerous factors, may not be relied on as an indication of trading intent on behalf of any Fidelity fund.
Investment Summary (Unaudited)
Top Five States as of October 31, 2015
| % of fund's net assets | % of fund's net assets 6 months ago | |
| Illinois | 19.9 | 20.6 |
| California | 15.2 | 15.7 |
| Florida | 11.1 | 9.9 |
| New York | 8.7 | 7.8 |
| Texas | 7.7 | 8.6 |
Top Five Sectors as of October 31, 2015
| % of fund's net assets | % of fund's net assets 6 months ago | |
| General Obligations | 34.2 | 33.8 |
| Health Care | 17.7 | 19.3 |
| Transportation | 13.7 | 11.8 |
| Electric Utilities | 9.4 | 10.0 |
| Escrowed/Pre-Refunded | 8.2 | 7.7 |
Weighted Average Maturity as of October 31, 2015
| 6 months ago | ||
| Years | 6.1 | 5.9 |
This is a weighted average of all the maturities of the securities held in a fund. Weighted Average Maturity (WAM) can be used as a measure of sensitivity to interest rate changes and market changes. Generally, the longer the maturity, the greater the sensitivity to such changes. WAM is based on the dollar-weighted average length of time until principal payments must be paid. Depending on the types of securities held in a fund, certain maturity shortening devices (e.g., demand features, interest rate resets, and call options) may be taken into account when calculating the WAM.
Duration as of October 31, 2015
| 6 months ago | ||
| Years | 6.8 | 6.5 |
Duration is a measure of a security's price sensitivity to changes in interest rates. Duration differs from maturity in that it considers a security's interest payments in addition to the amount of time until the security reaches maturity, and also takes into account certain maturity shortening features (e.g., demand features, interest rate resets, and call options) when applicable. Securities with longer durations generally tend to be more sensitive to interest rate changes than securities with shorter durations. A fund with a longer average duration generally can be expected to be more sensitive to interest rate changes than a fund with a shorter average duration.
Quality Diversification (% of fund's net assets)
| As of October 31, 2015 | ||
| AAA | 3.9% | |
| AA,A | 80.6% | |
| BBB | 9.8% | |
| BB and Below | 1.5% | |
| Not Rated | 3.1% | |
| Short-Term Investments and Net Other Assets | 1.1% | |

| As of April 30, 2015 | ||
| AAA | 4.6% | |
| AA,A | 82.0% | |
| BBB | 8.9% | |
| BB and Below | 0.4% | |
| Not Rated | 4.3% | |
| Short-Term Investments and Net Other Assets* | (0.2)% | |

* Short-Term Investments and Net Other Assets (Liabilities) are not included in the pie chart
We have used ratings from Moody's Investors Service, Inc. Where Moody's® ratings are not available, we have used S&P® ratings. All ratings are as of the date indicated and do not reflect subsequent changes.
Investments October 31, 2015
Showing Percentage of Net Assets
| Municipal Bonds - 98.7% | |||
| Principal Amount | Value | ||
| Alabama - 0.2% | |||
| Birmingham Gen. Oblig. Series 2013 A, 0% 3/1/43 (a) | 600,000 | 606,858 | |
| Univ. of Alabama at Birmingham Hosp. Rev. Series 2008 A, 5.75% 9/1/22 | 1,000,000 | 1,124,800 | |
| TOTAL ALABAMA | 1,731,658 | ||
| Arizona - 1.8% | |||
| Arizona Ctfs. of Prtn. Series 2010 A: | |||
| 5% 10/1/18 (FSA Insured) | $1,000,000 | $1,113,150 | |
| 5.25% 10/1/20 (FSA Insured) | 1,600,000 | 1,837,424 | |
| 5.25% 10/1/21 (FSA Insured) | 850,000 | 975,775 | |
| 5.25% 10/1/26 (FSA Insured) | 500,000 | 570,705 | |
| 5.25% 10/1/28 (FSA Insured) | 1,600,000 | 1,817,120 | |
| Arizona Health Facilities Auth. Rev. (Banner Health Sys. Proj.) Series 2008 D, 5.5% 1/1/38 | 2,300,000 | 2,467,141 | |
| Arizona State Lottery Rev. Series 2010 A, 5% 7/1/21 (FSA Insured) | 1,200,000 | 1,375,464 | |
| Glendale Gen. Oblig. Series 2015, 4% 7/1/20 (FSA Insured) | 400,000 | 440,276 | |
| Maricopa County Poll. Cont. Rev. (Southern California Edison Co. Proj.) Series 2000 A, 5% 6/1/35 | 700,000 | 775,838 | |
| McAllister Academic Village LLC Rev. (Arizona State Univ. Hassayampa Academic Village Proj.) Series 2008, 5.25% 7/1/39 | 1,000,000 | 1,090,230 | |
| Phoenix Civic Impt. Corp. District Rev. (Plaza Expansion Proj.) Series 2005 B, 5.5% 7/1/38 (Nat'l. Pub. Fin. Guarantee Corp. Insured) | 1,620,000 | 2,044,375 | |
| Pima County Swr. Sys. Rev. Series 2012 A, 5% 7/1/26 | 500,000 | 586,255 | |
| Salt River Proj. Agricultural Impt. & Pwr. District Elec. Sys. Rev. Series 2009 A, 5% 1/1/26 | 110,000 | 123,279 | |
| Salt Verde Finl. Corp. Sr. Gas Rev.: | |||
| Series 2007, 5.5% 12/1/29 | 1,000,000 | 1,200,960 | |
| 5.25% 12/1/22 | 1,500,000 | 1,738,530 | |
| Scottsdale Indl. Dev. Auth. Hosp. Rev. (Scottsdale Healthcare Proj.) Series 2006 C, 5% 9/1/35 (FSA Insured) | 205,000 | 225,896 | |
| TOTAL ARIZONA | 18,382,418 | ||
| California - 15.2% | |||
| Bay Area Toll Auth. San Francisco Bay Toll Bridge Rev. Series 2009 F1, 5.625% 4/1/44 (Pre-Refunded to 4/1/19 @ 100) | 1,600,000 | 1,854,352 | |
| California Edl. Facilities Auth. Rev. Series U6, 5% 5/1/45 | 3,400,000 | 4,415,580 | |
| California Gen. Oblig.: | |||
| Bonds 3%, tender 12/1/19 (b) | 3,800,000 | 4,059,312 | |
| Series 2007, 5.625% 5/1/20 | 20,000 | 20,080 | |
| 5% 11/1/24 | 2,400,000 | 2,604,264 | |
| 5% 9/1/27 (Pre-Refunded to 9/1/16 @ 100) | 655,000 | 680,899 | |
| 5% 9/1/31 (Pre-Refunded to 9/1/16 @ 100) | 1,500,000 | 1,559,310 | |
| 5% 9/1/32 (Pre-Refunded to 9/1/16 @ 100) | 1,600,000 | 1,663,264 | |
| 5% 9/1/33 (Pre-Refunded to 9/1/33 @ 100) | 1,495,000 | 1,540,343 | |
| 5% 9/1/35 (Pre-Refunded to 9/1/35 @ 100) | 270,000 | 277,916 | |
| 5.25% 12/1/33 | 20,000 | 20,071 | |
| 5.25% 4/1/35 | 2,200,000 | 2,522,476 | |
| 5.25% 3/1/38 | 3,900,000 | 4,250,649 | |
| 5.25% 11/1/40 | 700,000 | 815,892 | |
| 5.5% 8/1/27 | 2,100,000 | 2,366,490 | |
| 5.5% 8/1/29 | 2,800,000 | 3,152,044 | |
| 5.5% 8/1/30 | 2,000,000 | 2,249,140 | |
| 5.5% 3/1/40 | 1,000,000 | 1,159,140 | |
| 5.6% 3/1/36 | 400,000 | 467,688 | |
| 6% 3/1/33 | 4,250,000 | 5,103,230 | |
| 6% 4/1/38 | 5,300,000 | 6,166,338 | |
| 6% 11/1/39 | 11,700,000 | 13,917,735 | |
| 6.5% 4/1/33 | 3,850,000 | 4,574,917 | |
| California Health Facilities Fing. Auth. Rev.: | |||
| (Catholic Healthcare West Proj.) Series 2009 E, 5.625% 7/1/25 | 2,000,000 | 2,298,740 | |
| (Kaiser Permanente Health Sys. Proj.) Series 2006 A, 5.25% 4/1/39 | 1,025,000 | 1,041,841 | |
| (Providence Health and Svcs. Proj.): | |||
| Series C, 6.5% 10/1/38 (Pre-Refunded to 10/1/18 @ 100) | 25,000 | 29,104 | |
| 6.5% 10/1/38 (Pre-Refunded to 10/1/18 @ 100) | 1,375,000 | 1,602,879 | |
| (St. Joseph Health Sys. Proj.) Series 2009 A, 5.75% 7/1/39 | 1,280,000 | 1,445,094 | |
| (Stanford Hosp. & Clinics Proj.) Series 2010 B, 5.75% 11/15/31 | 2,500,000 | 2,939,975 | |
| California Pub. Works Board Lease Rev.: | |||
| (Coalinga State Hosp. Proj.) Series 2013 E, 5% 6/1/26 | 2,400,000 | 2,846,256 | |
| (Dept. of Forestry & Fire Protection Proj.) Series 2007 E: | |||
| 5% 11/1/19 | 1,600,000 | 1,733,184 | |
| 5% 11/1/21 | 1,760,000 | 1,906,502 | |
| (Office of Emergency Svcs. Proj.) Series 2007 A, 5% 3/1/22 | 1,000,000 | 1,056,880 | |
| (Porterville Developmental Ctr. Hsg. Expansion and Recreation Complex Proj.) Series 2009 C, 6.25% 4/1/34 | 1,700,000 | 1,992,060 | |
| (Richmond Lab., Phase III Office Bldg. Proj.) Series B, 5.25% 11/1/25 (XL Cap. Assurance, Inc. Insured) | 2,585,000 | 2,594,952 | |
| (Univ. Proj.) Series 2011 B, 5.25% 10/1/27 | 3,500,000 | 4,145,855 | |
| (Various Cap. Proj.) Series 2012 G, 5% 11/1/24 | 650,000 | 775,242 | |
| (Various Cap. Projs.) Series 2012 A, 5% 4/1/24 | 3,190,000 | 3,775,493 | |
| Series 2009 G1, 5.75% 10/1/30 | 600,000 | 699,918 | |
| Series 2009 I: | |||
| 6.125% 11/1/29 | 400,000 | 475,008 | |
| 6.375% 11/1/34 | 1,000,000 | 1,203,280 | |
| Series 2010 A, 5.75% 3/1/30 | 1,000,000 | 1,169,070 | |
| California State Univ. Rev. Series 2009 A, 6% 11/1/40 | 3,400,000 | 3,924,858 | |
| California Statewide Cmntys. Dev. Auth. Rev. (St. Joseph Health Sys. Proj.) Series 2007 C, 5.75% 7/1/47 (FGIC Insured) | 1,000,000 | 1,096,860 | |
| Clovis Pub. Fing. Auth. Wastewtr. Rev. Series 2005, 5% 8/1/35 (Nat'l. Pub. Fin. Guarantee Corp. Insured) | 1,300,000 | 1,303,367 | |
| Long Beach Unified School District Series A, 5.5% 8/1/29 | 1,000,000 | 1,155,660 | |
| Los Angeles Muni. Impt. Corp. Lease Rev. Series 2012 C, 5% 3/1/25 | 1,455,000 | 1,684,046 | |
| Los Angeles Wastewtr. Sys. Rev. Series 2009 A: | |||
| 5.75% 6/1/34 | 890,000 | 1,024,532 | |
| 5.75% 6/1/34 (Pre-Refunded to 6/1/19 @ 100) | 1,110,000 | 1,300,254 | |
| Madera County Ctfs. of Prtn. (Children's Hosp. Central California Proj.) Series 2010, 5.375% 3/15/36 | 1,000,000 | 1,109,390 | |
| Monterey County Pub. Impt. Corp. Ctfs. of Prtn. Series 2007, 5% 8/1/19 (AMBAC Insured) | 1,000,000 | 1,067,260 | |
| Oakland Gen. Oblig. Series 2012, 5% 1/15/24 | 2,500,000 | 2,887,100 | |
| Oakland Unified School District Alameda County: | |||
| Series 2009 A, 6.25% 8/1/18 | 1,815,000 | 2,057,212 | |
| Series 2015 A, 5% 8/1/29 (FSA Insured) | 1,395,000 | 1,612,522 | |
| Poway Unified School District: | |||
| (District #2007-1 School Facilities Proj.) Series 2008 A, 0% 8/1/32 | 1,000,000 | 516,970 | |
| Series B, 0% 8/1/39 | 3,700,000 | 1,331,963 | |
| Poway Unified School District Pub. Fing. 5% 9/1/24 | 1,000,000 | 1,127,560 | |
| Sacramento City Fing. Auth. Rev. Series A, 0% 12/1/26 (FGIC Insured) | 800,000 | 540,624 | |
| Sacramento Muni. Util. District Elec. Rev. Series 2012 Y, 5% 8/15/28 | 2,200,000 | 2,625,722 | |
| San Bernardino County Ctfs. of Prtn. (Arrowhead Proj.) Series 2009 A, 5.25% 8/1/26 | 1,000,000 | 1,121,570 | |
| San Diego Convention Ctr. Expansion Series 2012 A, 5% 4/15/24 | 2,200,000 | 2,564,034 | |
| San Diego Unified School District: | |||
| Series 2008 C, 0% 7/1/39 | 4,700,000 | 1,733,783 | |
| Series 2008 E: | |||
| 0% 7/1/47 (a) | 1,300,000 | 662,688 | |
| 0% 7/1/49 | 4,600,000 | 1,020,786 | |
| San Francisco City & County Arpts. Commission Int'l. Arpt. Rev. Series 2014 A, 5% 5/1/44 (c) | 2,200,000 | 2,413,510 | |
| San Leandro Unified School District Series 2006 B, 6.25% 8/1/33 (Pre-Refunded to 8/1/18 @ 100) | 1,100,000 | 1,264,505 | |
| San Marcos Unified School District Series 2010 B, 0% 8/1/47 | 11,900,000 | 2,885,393 | |
| Santa Monica-Malibu Unified School District Series 1999, 0% 8/1/20 (Nat'l. Pub. Fin. Guarantee Corp. Insured) | 1,000,000 | 926,780 | |
| Sonoma County Jr. College District Rev. Series 2002, 5% 8/1/28 (FSA Insured) | 90,000 | 90,288 | |
| Sweetwater Union High School District Series 2008 A, 5.625% 8/1/47 (FSA Insured) | 6,300,000 | 6,816,537 | |
| Union Elementary School District Series A, 0% 9/1/20 (Nat'l. Pub. Fin. Guarantee Corp. Insured) | 1,000,000 | 921,570 | |
| Univ. of California Revs. Series O: | |||
| 5.25% 5/15/39 | 420,000 | 473,495 | |
| 5.25% 5/15/39 (Pre-Refunded to 5/15/19 @ 100) | 80,000 | 91,976 | |
| Washington Township Health Care District Gen. Oblig. Series 2013 B, 5.5% 8/1/38 | 1,000,000 | 1,160,060 | |
| Washington Township Health Care District Rev. Series 2010 A, 5.25% 7/1/30 | 1,100,000 | 1,171,324 | |
| West Contra Costa Unified School District: | |||
| (Election of 2005 Proj.) Series B, 5.625% 8/1/35 (Berkshire Hathaway Assurance Corp. Insured) | 700,000 | 783,685 | |
| Series 2012, 5% 8/1/26 | 2,000,000 | 2,340,820 | |
| TOTAL CALIFORNIA | 153,981,167 | ||
| Colorado - 0.7% | |||
| Colorado Health Facilities Auth. Retirement Hsg. Rev. (Liberty Heights Proj.): | |||
| Series B, 0% 7/15/20 (Escrowed to Maturity) | 1,200,000 | 1,119,180 | |
| 0% 7/15/22 (Escrowed to Maturity) | 1,385,000 | 1,208,163 | |
| Colorado Health Facilities Auth. Rev. (Valley View Hosp. Proj.) Series 2008, 5.75% 5/15/36 | 2,000,000 | 2,184,680 | |
| E-470 Pub. Hwy. Auth. Rev.: | |||
| Series 2000 B, 0% 9/1/20 (Nat'l. Pub. Fin. Guarantee Corp. Insured) | 1,500,000 | 1,353,585 | |
| Series 2010 C, 5.25% 9/1/25 | 1,000,000 | 1,116,040 | |
| TOTAL COLORADO | 6,981,648 | ||
| Connecticut - 0.3% | |||
| Eastern Connecticut Resources Recovery Auth. Solid Waste Rev. (Wheelabrator Lisbon Proj.) Series A, 5.5% 1/1/20 (c) | 3,350,000 | 3,398,006 | |
| District Of Columbia - 1.1% | |||
| District of Columbia Hosp. Rev. (Sibley Memorial Hosp. Proj.) Series 2009, 6.375% 10/1/39 (Pre-Refunded to 10/1/19 @ 100) | 1,860,000 | 2,244,629 | |
| District of Columbia Rev. Series B, 4.75% 6/1/32 | 500,000 | 538,685 | |
| Metropolitan Washington Arpts. Auth. Dulles Toll Road Rev. Series 2009 B: | |||
| 0% 10/1/28 (Assured Guaranty Corp. Insured) | 2,000,000 | 1,219,400 | |
| 0% 10/1/32 (Assured Guaranty Corp. Insured) | 5,080,000 | 2,515,616 | |
| 0% 10/1/33 (Assured Guaranty Corp. Insured) | 5,000,000 | 2,354,450 | |
| Washington D.C. Metropolitan Transit Auth. Rev. Series 2009 A, 5.25% 7/1/29 | 1,750,000 | 1,970,063 | |
| TOTAL DISTRICT OF COLUMBIA | 10,842,843 | ||
| Florida - 11.1% | |||
| Brevard County School Board Ctfs. of Prtn. Series 2015 C, 5% 7/1/26 | 750,000 | 885,278 | |
| Broward County Arpt. Sys. Rev. Series A: | |||
| 5% 10/1/28 (c)(d) | 500,000 | 576,585 | |
| 5% 10/1/31 (c)(d) | 1,000,000 | 1,133,220 | |
| Broward County School Board Ctfs. of Prtn.: | |||
| Series 2012 A, 5% 7/1/24 | 4,400,000 | 5,135,328 | |
| Series 2015 A: | |||
| 5% 7/1/24 | 325,000 | 389,574 | |
| 5% 7/1/26 | 1,200,000 | 1,432,104 | |
| 5% 7/1/27 | 1,000,000 | 1,181,300 | |
| Series 2015 B, 5% 7/1/24 | 815,000 | 976,932 | |
| Broward County Wtr. & Swr. Util. Rev. Series 2009 A, 5.25% 10/1/34 (Pre-Refunded to 10/1/18 @ 100) | 1,500,000 | 1,692,420 | |
| Citizens Property Ins. Corp.: | |||
| Series 2010 A1, 5% 6/1/17 (FSA Insured) | 1,000,000 | 1,068,700 | |
| Series 2011 A1, 5% 6/1/20 | 1,000,000 | 1,155,140 | |
| Series 2012 A1, 5% 6/1/21 | 1,500,000 | 1,759,590 | |
| Collier County Indl. Dev. Auth. Healthcare Facilities Rev. (NCH Healthcare Sys. Proj.) Series 2011, 6.25% 10/1/39 | 2,560,000 | 2,989,133 | |
| Duval County School Board Ctfs. of Prtn. Series 2015 B, 5% 7/1/28 | 2,060,000 | 2,397,531 | |
| Florida Board of Ed. Pub. Ed. Cap. Outlay: | |||
| Series 2006 C, 5% 6/1/29 | 800,000 | 860,376 | |
| Series A, 5.5% 6/1/38 | 400,000 | 444,112 | |
| Florida Dev. Fin. Corp. Healthcare Facility Rev. 6% 2/1/33 | 1,000,000 | 1,134,090 | |
| Florida Mid-Bay Bridge Auth. Rev.: | |||
| Series 2015 A, 5% 10/1/35 | 1,000,000 | 1,094,820 | |
| Series 2015 C, 5% 10/1/40 | 1,000,000 | 1,075,180 | |
| Florida Muni. Pwr. Agcy. Rev.: | |||
| (St. Lucie Proj.) Series 2012 A, 5% 10/1/26 | 600,000 | 701,664 | |
| Series 2009 A, 6.25% 10/1/31 | 500,000 | 591,910 | |
| Halifax Hosp. Med. Ctr. Rev.: | |||
| 4% 6/1/27 | 205,000 | 212,259 | |
| 5% 6/1/24 | 275,000 | 316,531 | |
| 5% 6/1/26 | 250,000 | 286,410 | |
| 5% 6/1/46 | 425,000 | 453,292 | |
| Highlands County Health Facilities Auth. Rev. (Adventist Health Sys./Sunbelt, Inc. Prog.): | |||
| Series 2005 B, 5% 11/15/30 (Pre-Refunded to 11/15/15 @ 100) | 70,000 | 70,104 | |
| Series 2008 B, 6% 11/15/37 | 2,000,000 | 2,301,600 | |
| Hillsborough County Indl. Dev.: | |||
| (Gen. Hosp. Proj.) Series 2006, 5% 10/1/36 | 1,015,000 | 1,044,953 | |
| (H Lee Moffitt Cancer Ctr. Proj.) Series A, 5% 7/1/19 | 2,230,000 | 2,382,041 | |
| (Tampa Gen. Hosp. Proj.) Series 2006, 5.25% 10/1/41 | 900,000 | 927,837 | |
| Hillsborough County Indl. Dev. Auth. Indl. Dev. Rev. (Health Facilities/Univ. Cmnty. Hosp. Proj.) Series 2008 B, 8% 8/15/32 (Pre-Refunded to 8/15/19 @ 101) | 1,000,000 | 1,263,540 | |
| Jacksonville Sales Tax Rev. Series 2012, 5% 10/1/25 | 1,000,000 | 1,171,530 | |
| Lake County School Board Ctfs. of Prtn. Series 2014 A, 5% 6/1/30 (FSA Insured) | 600,000 | 678,018 | |
| Lee County Arpt. Rev. Series 2011 A, 5.375% 10/1/32 (c) | 1,050,000 | 1,194,533 | |
| Miami-Dade County Aviation Rev.: | |||
| Series 2010 A: | |||
| 5.375% 10/1/41 | 1,500,000 | 1,695,045 | |
| 5.5% 10/1/30 | 1,000,000 | 1,167,930 | |
| Series 2012 A: | |||
| 5% 10/1/21 (c) | 1,900,000 | 2,216,122 | |
| 5% 10/1/22 (c) | 1,000,000 | 1,175,720 | |
| 5% 10/1/31 (c) | 1,500,000 | 1,647,585 | |
| Series 2014 A: | |||
| 5% 10/1/28 (c) | 1,000,000 | 1,142,700 | |
| 5% 10/1/36 (c) | 3,000,000 | 3,272,160 | |
| 5% 10/1/37 | 1,825,000 | 2,044,767 | |
| Series 2015 A, 5% 10/1/35 (c) | 1,500,000 | 1,647,990 | |
| Miami-Dade County Cap. Asset Acquisition Series 2012 A, 5% 10/1/23 | 750,000 | 893,423 | |
| Miami-Dade County Expressway Auth.: | |||
| Series 2014 A, 5% 7/1/44 | 500,000 | 546,980 | |
| Series 2014 B, 5% 7/1/28 | 1,000,000 | 1,155,600 | |
| Miami-Dade County School Board Ctfs. of Prtn.: | |||
| Series 2008 A, 5% 8/1/21 (AMBAC Insured) | 2,000,000 | 2,202,060 | |
| Series 2015 A: | |||
| 5% 5/1/27 (FSA Insured) | 780,000 | 914,355 | |
| 5% 5/1/29 | 4,075,000 | 4,628,467 | |
| Series 2015 B: | |||
| 5% 5/1/27 | 4,650,000 | 5,375,819 | |
| 5% 5/1/28 | 2,530,000 | 2,900,240 | |
| Series 2016 A, 5% 5/1/30 (d) | 3,620,000 | 4,080,573 | |
| Series 2016 B, 5% 8/1/26 (d) | 1,595,000 | 1,861,604 | |
| Miami-Dade County Transit Sales Surtax Rev. Series 2012, 5% 7/1/42 | 300,000 | 332,139 | |
| Miami-Dade County Wtr. & Swr. Rev. Series 2008 A, 5.25% 10/1/22 (FSA Insured) | 4,000,000 | 4,881,000 | |
| North Brevard County Hosp. District Rev.: | |||
| 5.75% 10/1/38 | 600,000 | 657,366 | |
| 5.75% 10/1/38 (Pre-Refunded to 10/1/18 @ 100) | 1,500,000 | 1,711,620 | |
| Orange County Health Facilities Auth.: | |||
| (Orlando Health, Inc.) Series 2009, 5.125% 10/1/26 | 1,005,000 | 1,130,143 | |
| Series 2012 A, 5% 10/1/42 | 2,350,000 | 2,459,957 | |
| Series 2012 B, 5% 10/1/42 | 1,000,000 | 1,046,790 | |
| Orange County School Board Ctfs. of Prtn. Series 2015 C, 5% 8/1/30 | 1,500,000 | 1,748,970 | |
| Orlando & Orange County Expressway Auth. Rev. Series 2012, 5% 7/1/23 | 500,000 | 598,575 | |
| Palm Beach County Health Facilities Auth. Hosp. Rev. Series 2014, 5% 12/1/31 | 500,000 | 554,790 | |
| Palm Beach County School Board Ctfs. of Prtn.: | |||
| Series 2014 B: | |||
| 5% 8/1/22 | 2,000,000 | 2,373,820 | |
| 5% 8/1/25 | 800,000 | 964,264 | |
| Series 2015 D: | |||
| 5% 8/1/28 | 680,000 | 797,252 | |
| 5% 8/1/29 | 2,330,000 | 2,706,062 | |
| 5% 8/1/30 | 2,405,000 | 2,764,740 | |
| 5% 8/1/31 | 2,415,000 | 2,758,848 | |
| South Lake County Hosp. District (South Lake Hosp., Inc.) Series 2009 A, 6% 4/1/29 | 1,400,000 | 1,569,330 | |
| Tallahassee Health Facilities Rev. Series 2015 A: | |||
| 4% 12/1/35 | 600,000 | 587,004 | |
| 5% 12/1/40 | 300,000 | 324,405 | |
| Tampa Tax Allocation (H. Lee Moffitt Cancer Ctr. Proj.) Series 2012 A, 5% 9/1/25 | 410,000 | 475,887 | |
| Volusia County School Board Ctfs. of Prtn. (Master Lease Prog.) Series 2014 B, 5% 8/1/26 | 340,000 | 399,935 | |
| TOTAL FLORIDA | 112,389,672 | ||
| Georgia - 3.0% | |||
| Atlanta Wtr. & Wastewtr. Rev.: | |||
| Series 2009 A: | |||
| 6% 11/1/25 (Pre-Refunded to 11/1/19 @ 100) | 3,000,000 | 3,589,440 | |
| 6.25% 11/1/39 (Pre-Refunded to 11/1/19 @ 100) | 3,500,000 | 4,221,840 | |
| 5% 11/1/28 | 1,000,000 | 1,187,760 | |
| Burke County Indl. Dev. Auth. Poll. Cont. Rev. Bonds (Oglethorpe Pwr. Corp. Vogtle Proj.) Series 2013 A, 2.4%, tender 4/1/20 (b) | 1,400,000 | 1,431,850 | |
| Colquitt County Dev. Auth. Rev.: | |||
| Series A, 0% 12/1/21 (Escrowed to Maturity) | 1,100,000 | 999,702 | |
| Series C, 0% 12/1/21 (Escrowed to Maturity) | 1,800,000 | 1,635,876 | |
| DeKalb County Hosp. Auth. Rev. (DeKalb Med. Ctr., Inc. Proj.) Series 2010: | |||
| 6% 9/1/30 | 1,400,000 | 1,542,310 | |
| 6.125% 9/1/40 | 1,605,000 | 1,741,473 | |
| Georgia Muni. Elec. Auth. Pwr. Rev.: | |||
| Series C, 5% 1/1/22 | 1,400,000 | 1,651,958 | |
| Series GG, 5% 1/1/23 | 800,000 | 958,128 | |
| Main Street Natural Gas, Inc. Georgia Gas Proj. Rev. Series A, 5.5% 9/15/21 | 930,000 | 1,090,127 | |
| Metropolitan Atlanta Rapid Transit Auth. Sales Tax Rev. Third Series 2009 A, 5.25% 7/1/36 | 2,500,000 | 2,827,700 | |
| Private Colleges & Univs. Auth. Rev.: | |||
| (The Savannah College of Art and Design Projs.) Series 2014, 5% 4/1/44 | 1,300,000 | 1,397,773 | |
| (The Savannah College of Arts and Design Projs.) Series 2014, 5% 4/1/30 | 800,000 | 894,144 | |
| Richmond County Hosp. Auth. (Univ. Health Svcs., Inc. Proj.) Series 2009, 5.5% 1/1/36 | 2,600,000 | 2,863,666 | |
| Washington Wilkes Payroll Dev. Auth. Rev. Series C, 0% 12/1/21 (Escrowed to Maturity) | 2,310,000 | 2,086,762 | |
| TOTAL GEORGIA | 30,120,509 | ||
| Idaho - 0.6% | |||
| Idaho Bond Bank Auth. Rev. Series 2008 C, 5.625% 9/15/26 (Pre-Refunded to 9/15/18 @ 100) | 1,415,000 | 1,608,770 | |
| Idaho Health Facilities Auth. Rev.: | |||
| (St. Luke's Health Sys. Proj.) Series 2008 A, 6.75% 11/1/37 | 1,200,000 | 1,363,224 | |
| (Trinity Health Group Proj.) 2008 B, 6.25% 12/1/33 (Pre-Refunded to 12/1/18 @ 100) | 400,000 | 465,152 | |
| Series 2015 ID, 5.5% 12/1/26 | 1,540,000 | 1,917,839 | |
| 5% 12/1/24 | 1,000,000 | 1,211,780 | |
| TOTAL IDAHO | 6,566,765 | ||
| Illinois - 19.9% | |||
| Chicago Board of Ed.: | |||
| Series 1999 A: | |||
| 0% 12/1/16 (Nat'l. Pub. Fin. Guarantee Corp. Insured) | 1,300,000 | 1,259,050 | |
| 0% 12/1/18 (Nat'l. Pub. Fin. Guarantee Corp. Insured) | 1,000,000 | 895,010 | |
| Series 2008 C: | |||
| 5.25% 12/1/23 | 360,000 | 352,343 | |
| 5.25% 12/1/24 | 245,000 | 238,444 | |
| Series 2009 D, 4% 12/1/16 (Assured Guaranty Corp. Insured) | 235,000 | 240,022 | |
| Series 2010 F, 5% 12/1/20 | 195,000 | 192,588 | |
| Series 2011 A: | |||
| 5% 12/1/41 | 1,355,000 | 1,171,059 | |
| 5.25% 12/1/41 | 905,000 | 808,409 | |
| Series 2012 A, 5% 12/1/42 | 525,000 | 452,629 | |
| Chicago Gen. Oblig.: | |||
| (City Colleges Proj.): | |||
| Series 1999, 0% 1/1/16 (Nat'l. Pub. Fin. Guarantee Corp. Insured) | 6,125,000 | 6,099,091 | |
| 0% 1/1/24 (Nat'l. Pub. Fin. Guarantee Corp. Insured) | 6,110,000 | 4,103,354 | |
| Series 2008 A, 5.25% 1/1/21 | 1,160,000 | 1,179,302 | |
| Series 2009 A, 5% 1/1/22 | 305,000 | 308,056 | |
| Series 2012 A: | |||
| 5% 1/1/33 | 875,000 | 873,941 | |
| 5% 1/1/34 | 455,000 | 453,894 | |
| Series 2012 C, 5% 1/1/23 | 770,000 | 778,894 | |
| Series A, 5% 1/1/42 (AMBAC Insured) | 15,000 | 14,615 | |
| 5% 1/1/34 | 2,000,000 | 1,995,140 | |
| 5% 1/1/35 | 1,650,000 | 1,643,846 | |
| Chicago Midway Arpt. Rev. Series 2014 A, 5% 1/1/28 (c) | 4,200,000 | 4,606,056 | |
| Chicago O'Hare Int'l. Arpt. Rev.: | |||
| Series 2005 A, 5.25% 1/1/23 (Nat'l. Pub. Fin. Guarantee Corp. Insured) | 1,000,000 | 1,008,120 | |
| Series 2006 B, 5% 1/1/26 (Nat'l. Pub. Fin. Guarantee Corp. Insured) (c) | 1,405,000 | 1,467,705 | |
| Series 2011 C, 6.5% 1/1/41 | 2,335,000 | 2,785,538 | |
| Series 2013 D, 5% 1/1/27 | 2,200,000 | 2,496,626 | |
| Chicago Park District Gen. Oblig.: | |||
| Series 2010 C, 5.25% 1/1/37 | 1,300,000 | 1,393,145 | |
| Series 2013 A: | |||
| 5.5% 1/1/33 | 500,000 | 556,525 | |
| 5.75% 1/1/38 | 1,000,000 | 1,135,640 | |
| Series 2014 C, 5% 1/1/25 | 1,740,000 | 1,949,983 | |
| Chicago Transit Auth. Series 2014, 5.25% 12/1/49 | 5,000,000 | 5,357,500 | |
| Cmnty. College District #525 Gen. Oblig.: | |||
| 5.75% 6/1/28 | 625,000 | 697,225 | |
| 5.75% 6/1/28 (Pre-Refunded to 6/1/18 @ 100) | 375,000 | 421,905 | |
| Cook County Forest Preservation District Series 2012 C, 5% 12/15/21 | 1,000,000 | 1,130,600 | |
| Cook County Gen. Oblig.: | |||
| Series 2006 B, 5% 11/15/18 (Nat'l. Pub. Fin. Guarantee Corp. Insured) | 1,000,000 | 1,061,040 | |
| Series 2010 A, 5.25% 11/15/33 | 3,250,000 | 3,404,765 | |
| Series 2012 C: | |||
| 5% 11/15/24 | 1,700,000 | 1,851,062 | |
| 5% 11/15/25 (FSA Insured) | 2,600,000 | 2,837,796 | |
| Grundy, Kendall & Will County Cmnty. High School District #111 Gen. Oblig. Series 2006, 5.5% 5/1/23 | 985,000 | 1,006,975 | |
| Illinois Fin. Auth. Hosp. Rev. (KishHealth Sys. Proj.) Series 2008, 5.75% 10/1/35 | 1,600,000 | 1,772,976 | |
| Illinois Fin. Auth. Rev.: | |||
| (Advocate Health Care Proj.) Series 2008 D, 6.5% 11/1/38 (Pre-Refunded to 11/1/18 @ 100) | 1,000,000 | 1,163,960 | |
| (Central DuPage Health Proj.) Series 2009 B, 5.375% 11/1/39 | 1,200,000 | 1,338,504 | |
| (Children's Memorial Hosp. Proj.) Series 2008 A, 5.25% 8/15/33 (Assured Guaranty Corp. Insured) | 1,300,000 | 1,410,370 | |
| (Edward Hosp. Obligated Group Proj.) Series 2008 A, 5.5% 2/1/40 (AMBAC Insured) | 1,485,000 | 1,593,583 | |
| (Newman Foundation Proj.) 5% 2/1/32 (Radian Asset Assurance, Inc. Insured) | 1,700,000 | 1,721,726 | |
| (Northwest Cmnty. Hosp. Proj.) Series 2008 A, 5.5% 7/1/38 | 1,930,000 | 2,098,219 | |
| (Northwestern Memorial Hosp. Proj.) Series 2009 A, 6% 8/15/39 | 2,310,000 | 2,647,468 | |
| (Palos Cmnty. Hosp. Proj.) Series 2010 C: | |||
| 5.375% 5/15/25 | 5,000,000 | 5,781,400 | |
| 5.375% 5/15/30 | 1,110,000 | 1,259,117 | |
| (Provena Health Proj.) Series 2010 A, 6% 5/1/28 | 2,700,000 | 3,100,383 | |
| (Rush Univ. Med. Ctr. Proj.): | |||
| Series 2009 C, 6.625% 11/1/39 (Pre-Refunded to 5/1/19 @ 100) | 1,500,000 | 1,787,100 | |
| Series 2009 D, 6.625% 11/1/39 (Pre-Refunded to 5/1/19 @ 100) | 1,445,000 | 1,721,573 | |
| Series B, 5.25% 11/1/35 (Pre-Refunded to 11/1/18 @ 100) | 2,905,000 | 3,274,429 | |
| (Silver Cross Hosp. and Med. Ctr. Proj.) Series 2008 A, 5.5% 8/15/30 | 350,000 | 376,653 | |
| (Southern Illinois Healthcare Enterprises, Inc. Proj.) Series 2005, 5.25% 3/1/30 | 1,100,000 | 1,228,986 | |
| Series 2008 A: | |||
| 5.625% 1/1/37 | 5,115,000 | 5,449,726 | |
| 6.25% 2/1/33 (AMBAC Insured) | 150,000 | 164,352 | |
| Series 2009 A, 7.25% 11/1/38 (Pre-Refunded to 11/1/18 @ 100) | 1,330,000 | 1,577,433 | |
| Series 2009: | |||
| 6.875% 8/15/38 (Pre-Refunded to 8/15/19 @ 100) | 80,000 | 96,994 | |
| 7% 8/15/44 (Pre-Refunded to 8/15/19 @ 100) | 2,850,000 | 3,468,564 | |
| Series 2010 A: | |||
| 5.5% 8/15/24 | 545,000 | 607,909 | |
| 5.75% 8/15/29 | 360,000 | 398,711 | |
| Series 2012 A: | |||
| 5% 5/15/20 | 500,000 | 569,075 | |
| 5% 5/15/23 | 300,000 | 346,296 | |
| Series 2012: | |||
| 4% 9/1/32 | 1,315,000 | 1,260,428 | |
| 5% 9/1/32 | 1,900,000 | 2,050,062 | |
| 5% 9/1/38 | 2,300,000 | 2,453,042 | |
| 5% 11/15/43 | 820,000 | 870,332 | |
| Series 2013: | |||
| 5% 11/15/24 | 500,000 | 577,690 | |
| 5% 11/15/27 | 100,000 | 112,659 | |
| 5% 5/15/43 | 1,700,000 | 1,746,648 | |
| 5% 11/15/21 | 600,000 | 702,522 | |
| 5% 8/15/35 | 1,035,000 | 1,129,423 | |
| 5% 8/15/44 | 5,600,000 | 6,012,664 | |
| Illinois Gen. Oblig.: | |||
| Series 2006: | |||
| 5% 1/1/19 | 1,000,000 | 1,074,800 | |
| 5.5% 1/1/31 | 1,000,000 | 1,112,460 | |
| Series 2010: | |||
| 5% 1/1/21 (FSA Insured) | 500,000 | 541,040 | |
| 5% 1/1/23 (FSA Insured) | 1,300,000 | 1,386,723 | |
| Series 2012 A, 5% 1/1/33 | 800,000 | 823,864 | |
| Series 2012: | |||
| 5% 8/1/19 | 465,000 | 503,665 | |
| 5% 8/1/21 | 400,000 | 438,792 | |
| 5% 3/1/23 | 1,000,000 | 1,084,990 | |
| 5% 8/1/23 | 700,000 | 765,660 | |
| 5% 3/1/36 | 1,000,000 | 1,026,090 | |
| Series 2013 A, 5% 4/1/35 | 300,000 | 308,967 | |
| Series 2013, 5% 1/1/22 | 2,175,000 | 2,305,326 | |
| Series 2014: | |||
| 5% 2/1/22 | 1,000,000 | 1,094,550 | |
| 5% 5/1/32 | 500,000 | 521,425 | |
| 5.25% 2/1/29 | 1,600,000 | 1,714,768 | |
| Illinois Health Facilities Auth. Rev. (Delnor-Cmnty. Hosp. Proj.): | |||
| Series 2002 D, 5.25% 5/15/32 (FSA Insured) | 2,000,000 | 2,162,700 | |
| 5.25% 5/15/32 (FSA Insured) | 360,000 | 389,286 | |
| Illinois Muni. Elec. Agcy. Pwr. Supply Series 2015 A, 5% 2/1/26 | 17,545,000 | 20,798,882 | |
| Illinois Toll Hwy. Auth. Toll Hwy. Rev. Series 2015 A, 5% 1/1/40 | 2,300,000 | 2,548,745 | |
| Joliet School District #86 Gen. Oblig. Series 2002, 0% 11/1/19 (FSA Insured) | 2,000,000 | 1,819,760 | |
| Kane, McHenry, Cook & DeKalb Counties Unit School District #300: | |||
| 0% 12/1/17 (AMBAC Insured) | 905,000 | 879,723 | |
| 0% 12/1/17 (Escrowed to Maturity) | 95,000 | 93,246 | |
| 6.5% 1/1/20 (AMBAC Insured) | 385,000 | 461,623 | |
| 6.5% 1/1/20 (Escrowed to Maturity) | 650,000 | 790,498 | |
| 6.5% 1/1/20 (Escrowed to Maturity) | 65,000 | 79,050 | |
| Lake County Cmnty. Consolidated School District #73 Gen. Oblig. 0% 12/1/16 (Nat'l. Pub. Fin. Guarantee Corp. Insured) | 765,000 | 756,111 | |
| Lake County Cmnty. High School District #117, Antioch Series 2000 B, 0% 12/1/20 (Nat'l. Pub. Fin. Guarantee Corp. Insured) | 1,805,000 | 1,595,963 | |
| McHenry & Kane Counties Cmnty. Consolidated School District #158 Series 2004, 0% 1/1/24 (FSA Insured) | 800,000 | 612,032 | |
| Metropolitan Pier & Exposition: | |||
| (McCormick Place Expansion Proj.): | |||
| Series 1994 A, 0% 6/15/19 (Nat'l. Pub. Fin. Guarantee Corp. Insured) | 3,710,000 | 3,455,012 | |
| Series 1996 A, 0% 6/15/23 (Nat'l. Pub. Fin. Guarantee Corp. Insured) | 1,000,000 | 776,500 | |
| Series 2002 A: | |||
| 0% 12/15/30 (Nat'l. Pub. Fin. Guarantee Corp. Insured) | 5,900,000 | 3,074,254 | |
| 0% 6/15/36 (Nat'l. Pub. Fin. Guarantee Corp. Insured) | 1,080,000 | 391,792 | |
| Series 2010 B1: | |||
| 0% 6/15/43 (FSA Insured) | 5,310,000 | 1,332,438 | |
| 0% 6/15/44 (FSA Insured) | 4,700,000 | 1,118,647 | |
| 0% 6/15/45 (FSA Insured) | 2,600,000 | 586,846 | |
| 0% 6/15/47 (FSA Insured) | 2,040,000 | 413,855 | |
| Series 2012 B, 0% 12/15/51 | 2,900,000 | 391,732 | |
| Series A: | |||
| 0% 6/15/22 (Nat'l. Pub. Fin. Guarantee Corp. Insured) | 1,265,000 | 1,036,162 | |
| 0% 12/15/24 (Nat'l. Pub. Fin. Guarantee Corp. Insured) | 3,090,000 | 2,230,208 | |
| 0% 6/15/16 | 1,615,000 | 1,604,260 | |
| 0% 6/15/16 (Escrowed to Maturity) | 265,000 | 264,465 | |
| Quincy Hosp. Rev. Series 2007, 5% 11/15/18 | 1,000,000 | 1,081,890 | |
| Univ. of Illinois Board of Trustees Ctfs. of Prtn. Series 2009 A, 5% 10/1/18 | 425,000 | 459,833 | |
| Univ. of Illinois Rev.: | |||
| (Auxiliary Facilities Sys. Proj.): | |||
| Series 1999 A, 0% 4/1/20 (Nat'l. Pub. Fin. Guarantee Corp. Insured) | 1,600,000 | 1,435,888 | |
| Series 2009 A, 5.75% 4/1/38 (Pre-Refunded to 4/1/19 @ 100) | 2,940,000 | 3,408,930 | |
| Series 2010 A: | |||
| 5% 4/1/25 | 1,000,000 | 1,130,480 | |
| 5.25% 4/1/30 | 1,000,000 | 1,139,640 | |
| Series 2013: | |||
| 6% 10/1/42 | 900,000 | 1,036,107 | |
| 6.25% 10/1/38 | 900,000 | 1,023,669 | |
| Will County Cmnty. Unit School District #365-U: | |||
| 0% 11/1/16 (FSA Insured) | 825,000 | 816,717 | |
| 0% 11/1/19 (Escrowed to Maturity) | 790,000 | 751,069 | |
| 0% 11/1/19 (FSA Insured) | 5,085,000 | 4,717,151 | |
| TOTAL ILLINOIS | 201,467,154 | ||
| Indiana - 3.0% | |||
| Hobart Bldg. Corp. Series 2006, 6.5% 1/15/29 (Nat'l. Pub. Fin. Guarantee Corp. Insured) | 3,700,000 | 4,478,295 | |
| Indiana Fin. Auth. Health Sys. Rev. (Sisters of Saint Francis Health Svcs., Inc. Obligated Group Proj.) Series 2009 A, 5.25% 11/1/39 | 1,000,000 | 1,108,670 | |
| Indiana Fin. Auth. Rev.: | |||
| (Trinity Health Cr. Group Proj.) Series 2009 A, 5.25% 12/1/38 | 2,000,000 | 2,215,880 | |
| Series 2012: | |||
| 5% 3/1/30 | 675,000 | 746,078 | |
| 5% 3/1/41 | 1,290,000 | 1,382,983 | |
| Series 2015 A, 5.25% 2/1/32 | 1,040,000 | 1,219,078 | |
| Indiana Fin. Auth. Wastewtr. Util. Rev. (CWA Auth. Proj.): | |||
| Series 2012 A, 5% 10/1/24 | 400,000 | 473,380 | |
| Series 2015 A: | |||
| 5% 10/1/28 | 1,000,000 | 1,170,650 | |
| 5% 10/1/45 | 4,340,000 | 4,809,892 | |
| Indiana Trans. Fin. Auth. Hwy. Rev. Series 1993 A, 0% 6/1/17 (AMBAC Insured) | 1,000,000 | 985,650 | |
| Jasper County Indl. Poll. Ctl. Rev. (Northern Indiana Pub. Svc. Co. Proj.) Series 1988 C, 5.6% 11/1/16 (Nat'l. Pub. Fin. Guarantee Corp. Insured) | 1,000,000 | 1,045,070 | |
| Lake Central Multi-District School Bldg. Corp. Series 2012 B, 5% 7/15/26 | 4,900,000 | 5,684,637 | |
| North Adams Cmnty. Schools Renovation Bldg. Corp. 0% 1/15/17 (FSA Insured) | 1,230,000 | 1,217,282 | |
| Purdue Univ. Rev. (Student Facilities Sys. Proj.) Series 2009 B, 5% 7/1/28 | 660,000 | 749,239 | |
| Univ. of Southern Indiana Rev. Series J, 5.75% 10/1/28 (Assured Guaranty Corp. Insured) | 2,695,000 | 3,143,798 | |
| TOTAL INDIANA | 30,430,582 | ||
| Iowa - 0.1% | |||
| Iowa Fin. Auth. Health Facilities Rev. Series 2008 A, 5.625% 8/15/37 (Assured Guaranty Corp. Insured) | 1,200,000 | 1,350,132 | |
| Kansas - 0.6% | |||
| Kansas Dev. Fin. Agcy. (Adventist Health Sys./Sunbelt Obligated Group Proj.) Series 2009 C, 5.75% 11/15/38 | 1,900,000 | 2,165,867 | |
| Kansas Dev. Fin. Auth. Health Facilities Rev. (Hays Med. Ctr. Proj.) Series 2005 L, 5.25% 11/15/15 | 335,000 | 335,590 | |
| Overland Park Sales Tax Spl. Oblig. Rev. Series 2012, 4.375% 12/15/23 | 870,000 | 806,046 | |
| Wichita Hosp. Facilities Rev. (Via Christi Health Sys., Inc. Proj.) Series 2009 X, 4% 11/15/18 (Escrowed to Maturity) | 300,000 | 327,459 | |
| Wyandotte County/Kansas City Unified Govt. Util. Sys. Rev. Series 2012 A, 5% 9/1/26 | 1,950,000 | 2,240,882 | |
| TOTAL KANSAS | 5,875,844 | ||
| Kentucky - 0.8% | |||
| Kentucky Econ. Dev. Fin. Auth. Hosp. Rev.: | |||
| (St. Elizabeth Med. Ctr., Inc. Proj.) Series 2009 A, 5.5% 5/1/39 | 1,000,000 | 1,113,180 | |
| Series 2010 A, 6% 6/1/30 | 315,000 | 356,460 | |
| Series 2015 A: | |||
| 4.5% 6/1/46 | 520,000 | 517,842 | |
| 5.25% 6/1/50 | 3,165,000 | 3,340,341 | |
| Kentucky Econ. Dev. Fin. Auth. Rev. (Ashland Hosp. Corp. d/b/a King's Daughters Med. Ctr. Proj.) Series 2010 A, 5% 2/1/30 | 1,000,000 | 1,063,060 | |
| Louisville & Jefferson County Series 2013 A: | |||
| 5.5% 10/1/33 | 500,000 | 571,515 | |
| 5.75% 10/1/38 | 1,355,000 | 1,559,944 | |
| TOTAL KENTUCKY | 8,522,342 | ||
| Louisiana - 1.0% | |||
| Louisiana Citizens Property Ins. Corp. Assessment Rev. Series 2015, 5% 6/1/20 | 1,250,000 | 1,435,563 | |
| Louisiana Pub. Facilities Auth. Hosp. Rev. (Franciscan Missionaries of Our Lady Health Sys. Proj.) Series 2009, 6.75% 7/1/39 (Pre-Refunded to 7/1/19 @ 100) | 400,000 | 481,292 | |
| New Orleans Aviation Board Rev.: | |||
| (North Term. Proj.) Series 2015 B, 5% 1/1/30 (c) | 1,000,000 | 1,114,130 | |
| Series 2007 A, 5.25% 1/1/19 (FSA Insured) (c) | 1,570,000 | 1,683,778 | |
| New Orleans Gen. Oblig.: | |||
| Series 2005, 5.25% 12/1/23 (Nat'l. Pub. Fin. Guarantee Corp. Insured) | 1,000,000 | 1,003,610 | |
| Series 2012, 5% 12/1/23 | 2,250,000 | 2,628,540 | |
| Tobacco Settlement Fing. Corp. Series 2013 A, 5% 5/15/23 | 1,200,000 | 1,384,272 | |
| TOTAL LOUISIANA | 9,731,185 | ||
| Maine - 0.2% | |||
| Maine Health & Higher Ed. Facilities Auth. Rev. Series 2008 D, 5.75% 7/1/38 | 1,100,000 | 1,216,501 | |
| Maine Tpk. Auth. Tpk. Rev. Series 2015, 5% 7/1/38 | 670,000 | 761,140 | |
| TOTAL MAINE | 1,977,641 | ||
| Maryland - 0.6% | |||
| Baltimore Proj. Rev. (Wtr. Projs.) Series 2009 A: | |||
| 5.375% 7/1/34 | 315,000 | 359,859 | |
| 5.375% 7/1/34 (Pre-Refunded to 7/1/19 @ 100) | 185,000 | 213,856 | |
| Maryland Health & Higher Edl. Facilities Auth. Rev.: | |||
| (Doctors Cmnty. Hosp. Proj.) Series 2010, 5.75% 7/1/38 | 1,010,000 | 1,070,721 | |
| (Univ. of Maryland Med. Sys. Proj.): | |||
| Series 2008 F, 5.25% 7/1/21 | 1,000,000 | 1,104,800 | |
| Series 2010, 5.125% 7/1/39 | 900,000 | 976,815 | |
| (Upper Chesapeake Hosp. Proj.) Series 2008 C, 5.5% 1/1/18 (Escrowed to Maturity) | 375,000 | 395,258 | |
| Series 2010, 5.625% 7/1/30 | 500,000 | 535,070 | |
| Series 2015, 5% 7/1/40 | 1,000,000 | 1,076,090 | |
| TOTAL MARYLAND | 5,732,469 | ||
| Massachusetts - 0.5% | |||
| Massachusetts Dev. Fin. Agcy. Rev.: | |||
| (Boston Univ. Proj.) Series U4, 5.7% 10/1/40 | 1,400,000 | 1,605,716 | |
| Series 2011 I, 6.75% 1/1/36 | 1,000,000 | 1,154,150 | |
| Series 2015 D, 5% 7/1/44 | 890,000 | 957,720 | |
| Massachusetts Health & Edl. Facilities Auth. Rev. (CareGroup, Inc. Proj.) Series 2008 E1, 5.125% 7/1/33 | 1,000,000 | 1,073,220 | |
| TOTAL MASSACHUSETTS | 4,790,806 | ||
| Michigan - 2.4% | |||
| Detroit Swr. Disp. Rev.: | |||
| Series 2001 E, 5.75% 7/1/31 (Berkshire Hathaway Assurance Corp. Insured) (FGIC Insured) | 500,000 | 548,565 | |
| Series 2006 B, 5% 7/1/36 (Nat'l. Pub. Fin. Guarantee Corp. Insured) | 2,800,000 | 2,815,512 | |
| Detroit Wtr. Supply Sys. Rev. Series 2006 B, 7% 7/1/36 (FSA Insured) | 1,000,000 | 1,129,780 | |
| Lansing Board of Wtr. & Lt. Util. Rev. 5.5% 7/1/41 | 500,000 | 584,420 | |
| Lapeer Cmnty. Schools 5.25% 5/1/26 (FSA Insured) | 1,100,000 | 1,210,462 | |
| Michigan Bldg. Auth. Rev. (Facilities Prog.) Series 2015 I, 5% 4/15/30 | 5,000,000 | 5,831,050 | |
| Michigan Fin. Auth. Rev.: | |||
| Series 2012 A: | |||
| 4.125% 6/1/32 (Pre-Refunded to 6/1/22 @ 100) | 1,150,000 | 1,326,640 | |
| 5% 6/1/21 (Escrowed to Maturity) | 350,000 | 416,308 | |
| 5% 6/1/27 (Pre-Refunded to 6/1/22 @ 100) | 500,000 | 603,955 | |
| 5% 6/1/39 (Pre-Refunded to 6/1/22 @ 100) | 1,100,000 | 1,328,701 | |
| Series 2012, 5% 11/15/42 | 2,175,000 | 2,341,627 | |
| Michigan Hosp. Fin. Auth. Rev.: | |||
| (McLaren Health Care Corp. Proj.) Series 2008 A, 5.75% 5/15/38 (Pre-Refunded to 5/15/18 @ 100) | 1,000,000 | 1,121,880 | |
| Series 2008 A1: | |||
| 6.5% 12/1/33 | 515,000 | 588,748 | |
| 6.5% 12/1/33 (Pre-Refunded to 12/1/18 @ 100) | 1,985,000 | 2,323,343 | |
| Royal Oak Hosp. Fin. Auth. Hosp. Rev. (William Beaumont Hosp. Proj.) Series 2009 V, 8.25% 9/1/39 (Pre-Refunded to 9/1/18 @ 100) | 600,000 | 722,166 | |
| Willow Run Cmnty. Schools County of Washtenaw 5% 5/1/20 (FSA Insured) | 1,000,000 | 1,003,370 | |
| TOTAL MICHIGAN | 23,896,527 | ||
| Minnesota - 0.6% | |||
| Duluth Independent School District #709 Ctfs. of Prtn. Series 2009 B, 4% 3/1/20 | 1,620,000 | 1,669,815 | |
| Minneapolis Health Care Sys. Rev.: | |||
| 6.5% 11/15/38 | 845,000 | 943,316 | |
| 6.5% 11/15/38 (Pre-Refunded to 11/15/18 @ 100) | 155,000 | 180,232 | |
| Minnesota Gen. Oblig. 5% 8/1/22 (Pre-Refunded to 8/1/17 @ 100) | 25,000 | 26,903 | |
| Rochester Hsg. & Healthcare Rev. (Madonna Towers Proj.) Series A, 5.875% 11/1/28 | 1,100,000 | 1,118,865 | |
| St. Louis Park Health Care Facilities Rev. (Park Nicollet Health Svcs. Proj.) Series 2009, 5.75% 7/1/39 (Pre-Refunded to 7/1/19 @ 100) | 1,600,000 | 1,871,056 | |
| TOTAL MINNESOTA | 5,810,187 | ||
| Missouri - 0.3% | |||
| Missouri Health & Edl. Facilities Auth. Edl. Facilities Rev. Series 2015 B: | |||
| 3.125% 2/1/27 | 200,000 | 196,728 | |
| 3.25% 2/1/28 | 200,000 | 196,616 | |
| 4% 2/1/40 | 100,000 | 98,634 | |
| 5% 2/1/29 | 1,240,000 | 1,402,192 | |
| 5% 2/1/36 | 400,000 | 437,732 | |
| 5% 2/1/45 | 600,000 | 649,488 | |
| TOTAL MISSOURI | 2,981,390 | ||
| Nebraska - 0.3% | |||
| Central Plains Energy Proj. Rev. (Nebraska Gas Proj.) Series 2007 B, 0.717% 12/1/17 (b) | 1,100,000 | 1,086,470 | |
| Douglas County Hosp. Auth. #2 Health Facilities Rev. 6% 8/15/24 | 740,000 | 805,261 | |
| Nebraska Pub. Pwr. District Rev. Series 2012 C, 5% 1/1/26 | 1,225,000 | 1,324,960 | |
| TOTAL NEBRASKA | 3,216,691 | ||
| Nevada - 0.1% | |||
| Clark County Wtr. Reclamation District Series 2009 A, 5.25% 7/1/29 (Berkshire Hathaway Assurance Corp. Insured) | 1,000,000 | 1,140,660 | |
| New Hampshire - 0.4% | |||
| New Hampshire Bus. Fin. Auth. Rev. Series 2009 A, 6.125% 10/1/39 | 1,830,000 | 2,026,542 | |
| New Hampshire Health & Ed. Facilities Auth. Rev.: | |||
| Series 2007 A, 5% 10/1/37 | 1,100,000 | 1,161,259 | |
| Series 2012: | |||
| 4% 7/1/32 | 400,000 | 393,764 | |
| 5% 7/1/27 | 500,000 | 544,800 | |
| TOTAL NEW HAMPSHIRE | 4,126,365 | ||
| New Jersey - 2.8% | |||
| New Jersey Ctfs. of Prtn. Series 2009 A, 5.25% 6/15/28 | 1,000,000 | 1,069,400 | |
| New Jersey Econ. Dev. Auth. Rev.: | |||
| Series 2009 AA, 5.5% 12/15/29 | 1,000,000 | 1,082,490 | |
| Series 2013 NN, 5% 3/1/27 | 11,810,000 | 12,422,585 | |
| Series 2013: | |||
| 5% 3/1/23 | 2,200,000 | 2,373,140 | |
| 5% 3/1/24 | 3,000,000 | 3,212,310 | |
| 5% 3/1/25 | 300,000 | 318,870 | |
| 6% 12/15/34 (Pre-Refunded to 12/15/34 @ 100) | 25,000 | 27,883 | |
| New Jersey Health Care Facilities Fing. Auth. Rev. Series 2008, 6.625% 7/1/38 | 1,700,000 | 1,878,738 | |
| New Jersey Trans. Trust Fund Auth.: | |||
| Series 2005 B, 5.25% 12/15/22 (AMBAC Insured) | 400,000 | 445,596 | |
| Series 2014 AA, 5% 6/15/23 | 5,250,000 | 5,677,350 | |
| TOTAL NEW JERSEY | 28,508,362 | ||
| New Mexico - 0.2% | |||
| New Mexico Edl. Assistance Foundation Series 2010 A1, 5% 12/1/19 | 2,000,000 | 2,294,480 | |
| New York - 8.7% | |||
| Hudson Yards Infrastructure Corp. New York Rev. Series 2012 A, 5.75% 2/15/47 | 2,700,000 | 3,071,277 | |
| Metropolitan Trans. Auth. Svc. Contract Rev. Series 7, 5.625% 7/1/16 (Escrowed to Maturity) | 75,000 | 75,293 | |
| New York City Gen. Oblig.: | |||
| Series 2007 D1, 5.125% 12/1/22 | 990,000 | 1,081,377 | |
| Series 2008 A1, 5.25% 8/15/27 | 1,500,000 | 1,669,110 | |
| Series 2009 I1, 5.625% 4/1/29 | 600,000 | 689,052 | |
| Series 2012 A1, 5% 8/1/24 | 1,300,000 | 1,533,701 | |
| Series 2012 E, 5% 8/1/24 | 5,000,000 | 5,879,100 | |
| Series 2012 G1, 5% 4/1/25 | 2,500,000 | 2,942,375 | |
| New York City Indl. Dev. Agcy. Civic Facility Rev. (Polytechnic Univ. NY Proj.) 5.25% 11/1/27 (ACA Finl. Guaranty Corp. Insured) | 600,000 | 653,778 | |
| New York City Muni. Wtr. Fin. Auth. Wtr. & Swr. Sys. Rev.: | |||
| Series 2009 A, 5.75% 6/15/40 | 2,300,000 | 2,577,334 | |
| Series 2009 CC, 5% 6/15/34 | 2,100,000 | 2,297,883 | |
| Series 2009 FF 2, 5.5% 6/15/40 | 3,000,000 | 3,433,080 | |
| Series 2011 EE, 5.375% 6/15/43 | 4,000,000 | 4,691,280 | |
| Series 2013 CC, 5% 6/15/47 | 4,000,000 | 4,440,160 | |
| New York City Transitional Fin. Auth. Bldg. Aid Rev.: | |||
| Series 2009 S1, 5.5% 7/15/31 | 1,000,000 | 1,121,720 | |
| Series 2009 S3: | |||
| 5.25% 1/15/34 | 2,500,000 | 2,791,550 | |
| 5.25% 1/15/39 | 1,000,000 | 1,109,660 | |
| Series 2009 S4: | |||
| 5.5% 1/15/39 | 850,000 | 963,433 | |
| 5.75% 1/15/39 | 1,600,000 | 1,826,016 | |
| Series 2015 S1, 5% 7/15/43 | 5,000,000 | 5,597,700 | |
| Series 2015 S2, 5% 7/15/35 | 1,770,000 | 2,024,207 | |
| New York Dorm. Auth. Personal Income Tax Rev.: | |||
| (Ed. Proj.) Series 2008 B, 5.75% 3/15/36 | 3,400,000 | 3,904,832 | |
| 5% 2/15/34 | 1,100,000 | 1,225,015 | |
| New York Dorm. Auth. Revs. (New York Univ. Hosp. Ctr. Proj.) Series 2007 B, 5.25% 7/1/24 (Pre-Refunded to 7/1/17 @ 100) | 95,000 | 101,194 | |
| New York Metropolitan Trans. Auth. Dedicated Tax Fund Rev.: | |||
| Series 2009 A, 5.5% 11/15/39 | 5,000,000 | 5,628,400 | |
| Series 2009 B, 5% 11/15/34 | 1,200,000 | 1,362,660 | |
| New York Metropolitan Trans. Auth. Rev.: | |||
| Series 2003 B, 5.25% 11/15/19 (Nat'l. Pub. Fin. Guarantee Corp. Insured) | 1,900,000 | 2,201,074 | |
| Series 2008 A, 5.25% 11/15/36 | 3,700,000 | 3,983,420 | |
| Series 2008 C, 6.5% 11/15/28 | 1,000,000 | 1,166,390 | |
| Series 2010 D, 5.25% 11/15/40 | 1,400,000 | 1,596,560 | |
| Series 2012 D, 5% 11/15/25 | 4,600,000 | 5,451,138 | |
| Series 2015 D1, 5% 11/15/29 | 5,000,000 | 5,865,350 | |
| Rockland County Gen. Oblig. Series 2014 A, 4% 3/1/23 (FSA Insured) | 1,125,000 | 1,234,913 | |
| Tobacco Settlement Fing. Corp. Series 2013 B: | |||
| 5% 6/1/20 | 1,900,000 | 1,951,813 | |
| 5% 6/1/21 | 800,000 | 821,728 | |
| Triborough Bridge & Tunnel Auth. Revs. Series 2015 A, 5.25% 11/15/45 | 1,000,000 | 1,162,780 | |
| TOTAL NEW YORK | 88,126,353 | ||
| North Carolina - 0.8% | |||
| Nash Health Care Sys. Health Care Facilities Rev.: | |||
| Series 2012, 5% 11/1/41 | 800,000 | 860,008 | |
| 5% 11/1/30 (FSA Insured) | 1,275,000 | 1,405,866 | |
| North Carolina Eastern Muni. Pwr. Agcy. Pwr. Sys. Rev. Series 2009 B, 5% 1/1/26 (Pre-Refunded to 1/1/19 @ 100) | 2,200,000 | 2,485,362 | |
| North Carolina Med. Care Commission Health Care Facilities Rev. (Rex Healthcare Proj.) Series 2010 A, 5% 7/1/30 | 1,600,000 | 1,795,024 | |
| North Carolina Muni. Pwr. Agcy. #1 Catawba Elec. Rev. Series 2009 A, 5% 1/1/30 | 1,000,000 | 1,104,940 | |
| TOTAL NORTH CAROLINA | 7,651,200 | ||
| North Dakota - 0.5% | |||
| Cass County Health Care Facilities Rev. (Essentia Health Obligated Group Proj.) Series 2008, 5.125% 2/15/37 (Assured Guaranty Corp. Insured) | 750,000 | 801,713 | |
| McLean County Solid Waste Facilities Rev. (Great River Energy Projects) Series 2010 B, 5.15% 7/1/40 | 2,300,000 | 2,509,208 | |
| Ward County Health Care Facility Rev. (Trinity Med. Ctr. Proj.) 5.125% 7/1/17 | 1,210,000 | 1,236,100 | |
| TOTAL NORTH DAKOTA | 4,547,021 | ||
| Ohio - 1.4% | |||
| American Muni. Pwr., Inc. Rev. (Prairie State Energy Campus Proj.) Series 2015, 5% 2/15/28 | 2,000,000 | 2,316,700 | |
| Buckeye Tobacco Settlement Fing. Auth. Series 2007 A1: | |||
| 5% 6/1/16 | 800,000 | 819,656 | |
| 5% 6/1/17 | 925,000 | 982,970 | |
| Hamilton County Convention Facilities Auth. Rev. Series 2014, 5% 12/1/26 | 670,000 | 768,550 | |
| Lake County Hosp. Facilities Rev.: | |||
| Series 2015, 5% 8/15/29 | 400,000 | 451,076 | |
| 5.75% 8/15/38 | 165,000 | 181,319 | |
| 5.75% 8/15/38 (Pre-Refunded to 8/15/18 @ 100) | 835,000 | 947,683 | |
| Lucas County Hosp. Rev. (ProMedica Healthcare Oblig. Group Proj.) Series 2011 A, 6.5% 11/15/37 | 1,200,000 | 1,466,388 | |
| Muskingum County Hosp. Facilities (Genesis Healthcare Sys. Obligated Group Proj.) Series 2013, 5% 2/15/48 | 2,000,000 | 2,022,480 | |
| Ohio Air Quality Dev. Auth. Rev. Series 2009 C, 5.625% 6/1/18 | 400,000 | 426,436 | |
| Ohio Tpk. Commission Tpk. Rev. (Infastructure Proj.) Series 2005 A, 0% 2/15/42 | 2,600,000 | 824,122 | |
| Ohio Wtr. Dev. Auth. Poll. Cont. Facilities Rev. Bonds (FirstEnergy Corp. Proj.) Series 2009 A, 5.875%, tender 6/1/16 (b) | 1,500,000 | 1,537,320 | |
| Ross County Hosp. Facilities Rev. (Adena Health Sys. Proj.) Series 2008, 5.75% 12/1/35 | 1,400,000 | 1,557,570 | |
| TOTAL OHIO | 14,302,270 | ||
| Oklahoma - 1.0% | |||
| Oklahoma City Pub. Property Auth. Hotel Tax Rev. Series 2015: | |||
| 5% 10/1/29 | 700,000 | 805,609 | |
| 5% 10/1/39 | 150,000 | 165,524 | |
| Oklahoma Dev. Fin. Auth. Health Sys. Rev. (Integris Baptist Med. Ctr. Proj.) Series C, 5.5% 8/15/22 (Pre-Refunded to 8/15/18 @ 100) | 2,865,000 | 3,231,978 | |
| Oklahoma Dev. Fin. Auth. Rev.: | |||
| (Saint John Health Sys. Proj.) Series 2012, 5% 2/15/42 | 1,775,000 | 1,932,212 | |
| Series 2012, 5% 2/15/21 | 400,000 | 466,828 | |
| Oklahoma Pwr. Auth. Pwr. Supply Sys. Rev. Series 2014 A, 5% 1/1/38 | 1,295,000 | 1,456,823 | |
| Tulsa County Indl. Auth. Health Care Rev. 5% 12/15/18 | 1,500,000 | 1,578,855 | |
| TOTAL OKLAHOMA | 9,637,829 | ||
| Oregon - 0.1% | |||
| Yamhill County School District #029J Newberg 5.5% 6/15/19 (Nat'l. Pub. Fin. Guarantee Corp. Insured) | 1,000,000 | 1,158,550 | |
| Pennsylvania - 1.7% | |||
| Allegheny County Hosp. Dev. Auth. Rev. (Univ. of Pittsburgh Med. Ctr. Proj.) Series 2009 A, 5.625% 8/15/39 | 1,100,000 | 1,234,211 | |
| Centre County Hosp. Auth. Rev. (Mount Nittany Med. Ctr. Proj.) Series 2011, 7% 11/15/46 | 500,000 | 581,700 | |
| Mifflin County School District Series 2007, 7.75% 9/1/30 (XL Cap. Assurance, Inc. Insured) | 400,000 | 443,368 | |
| Monroeville Fin. Auth. UPMC Rev. Series 2012, 5% 2/15/27 | 800,000 | 970,064 | |
| Montgomery County Higher Ed. & Health Auth. Hosp. Rev. (Abington Memorial Hosp. Proj.) Series 2012 A, 5% 6/1/24 | 600,000 | 693,564 | |
| Montgomery County Higher Ed. & Health Auth. Rev. Series 2014 A, 5% 10/1/25 | 1,045,000 | 1,160,671 | |
| Pennsylvania Gen. Oblig.: | |||
| Series 2015 1, 5% 3/15/29 | 2,780,000 | 3,221,019 | |
| Series 2015, 5% 3/15/33 | 850,000 | 966,289 | |
| Pennsylvania Tpk. Commission Tpk. Rev. Series 2009 D, 5.5% 12/1/41 | 2,400,000 | 2,714,040 | |
| Philadelphia Gas Works Rev. (1998 Gen. Ordinance Proj.) Ninth Series, 5.25% 8/1/40 | 800,000 | 880,456 | |
| Westmoreland County Muni. Auth. Muni. Svc. Rev. Series A, 0% 8/15/21 (Nat'l. Pub. Fin. Guarantee Corp. Insured) | 5,000,000 | 4,326,150 | |
| TOTAL PENNSYLVANIA | 17,191,532 | ||
| South Carolina - 4.6% | |||
| Greenwood Fifty School Facilities Installment 5% 12/1/21 (Assured Guaranty Corp. Insured) | 1,000,000 | 1,086,040 | |
| Scago Edl. Facilities Corp. for Colleton School District (School District of Colleton County Proj.) Series 2015, 5% 12/1/26 | 1,400,000 | 1,625,176 | |
| South Carolina Jobs-Econ. Dev. Auth. Econ. Dev. Rev. Series 2013, 5% 11/1/27 | 1,400,000 | 1,578,234 | |
| South Carolina Jobs-Econ. Dev. Auth. Health Facilities Rev. (Bishop Gadsden Proj.) Series 2007, 5% 4/1/16 | 1,000,000 | 1,009,850 | |
| South Carolina Pub. Svc. Auth. Rev.: | |||
| (Santee Cooper Proj.) Series 2009 B, 5.25% 1/1/39 | 5,000,000 | 5,530,450 | |
| Series 2012 B, 5% 12/1/20 | 2,500,000 | 2,928,675 | |
| Series 2013 E, 5.5% 12/1/53 | 6,100,000 | 6,756,970 | |
| Series 2014 A: | |||
| 5% 12/1/49 | 3,640,000 | 3,893,744 | |
| 5.5% 12/1/54 | 2,500,000 | 2,783,300 | |
| Series 2014 C, 5% 12/1/46 | 700,000 | 760,025 | |
| Series 2015 A, 5% 12/1/50 | 7,245,000 | 7,840,394 | |
| Series 2015 C, 5% 12/1/19 | 8,000,000 | 9,188,160 | |
| Univ. of South Carolina Athletic Facilities Rev. Series 2008 A, 5.5% 5/1/38 | 995,000 | 1,101,793 | |
| TOTAL SOUTH CAROLINA | 46,082,811 | ||
| Tennessee - 0.8% | |||
| Clarksville Natural Gas Acquisition Corp. Gas Rev. Series 2006: | |||
| 5% 12/15/15 | 1,500,000 | 1,506,795 | |
| 5% 12/15/16 | 1,500,000 | 1,568,160 | |
| Jackson Hosp. Rev.: | |||
| 5.75% 4/1/41 | 270,000 | 293,352 | |
| 5.75% 4/1/41 (Pre-Refunded to 4/1/18 @ 100) | 730,000 | 812,855 | |
| Knox County Health Edl. & Hsg. Facilities Board Rev. (Univ. Health Sys. Proj.) Series 2007, 5% 4/1/16 | 1,805,000 | 1,831,263 | |
| Memphis-Shelby County Arpt. Auth. Arpt. Rev. Series 2010 B, 5.75% 7/1/24 (c) | 1,600,000 | 1,856,288 | |
| Sullivan County Health, Ed. and Hsg. Board (Wellmont Health Sys. Proj.) Series 2006 C, 5.25% 9/1/36 | 400,000 | 411,608 | |
| TOTAL TENNESSEE | 8,280,321 | ||
| Texas - 7.7% | |||
| Austin Arpt. Sys. Rev. Series 2014: | |||
| 5% 11/15/28 (c) | 500,000 | 574,750 | |
| 5% 11/15/39 (c) | 1,700,000 | 1,865,597 | |
| 5% 11/15/44 (c) | 2,690,000 | 2,934,763 | |
| Austin Cmnty. College District Pub. Facilities Lease Rev. (Round Rock Campus Proj.) Series 2008, 5.5% 8/1/20 (Pre-Refunded to 8/1/18 @ 100) | 1,000,000 | 1,127,770 | |
| Comal Independent School District 5.25% 2/1/23 | 35,000 | 38,330 | |
| Corpus Christi Util. Sys. Rev.: | |||
| 5% 7/15/23 | 1,600,000 | 1,878,608 | |
| 5.25% 7/15/18 (FSA Insured) | 1,000,000 | 1,076,800 | |
| Dallas Fort Worth Int'l. Arpt. Rev.: | |||
| Series 2009 A, 5% 11/1/24 | 1,000,000 | 1,045,380 | |
| Series 2012 D, 5% 11/1/42 (c) | 400,000 | 424,624 | |
| Series 2012 H, 5% 11/1/42 (c) | 1,000,000 | 1,061,560 | |
| Dallas Independent School District Series 2008, 6.375% 2/15/34 (Pre-Refunded to 2/15/18 @ 100) | 300,000 | 338,667 | |
| Frisco Independent School District Series 2008 A, 6% 8/15/33 | 1,200,000 | 1,361,268 | |
| Grand Parkway Trans. Corp. Series 2013 B: | |||
| 5% 4/1/53 | 220,000 | 238,975 | |
| 5.25% 10/1/51 | 8,500,000 | 9,469,850 | |
| 5.5% 4/1/53 | 1,000,000 | 1,091,590 | |
| Harris County Gen. Oblig.: | |||
| (Road Proj.) Series 2008 B, 5.25% 8/15/47 | 8,000,000 | 8,645,360 | |
| Series 2002, 0% 8/15/24 (Nat'l. Pub. Fin. Guarantee Corp. Insured) | 1,000,000 | 791,550 | |
| Houston Arpt. Sys. Rev.: | |||
| Series 2011 A, 5% 7/1/24 (c) | 1,250,000 | 1,421,663 | |
| Series 2012 A, 5% 7/1/23 (c) | 600,000 | 690,666 | |
| Lewisville Independent School District 0% 8/15/19 | 2,340,000 | 2,239,029 | |
| Love Field Arpt. Modernization Rev. Series 2015: | |||
| 5% 11/1/26 (c) | 1,000,000 | 1,188,670 | |
| 5% 11/1/28 (c) | 1,325,000 | 1,546,090 | |
| Mansfield Independent School District 5.5% 2/15/17 | 25,000 | 25,098 | |
| North Texas Tollway Auth. Rev.: | |||
| Series 2008 I, 6.2% 1/1/42 (Assured Guaranty Corp. Insured) | 1,100,000 | 1,346,411 | |
| Series 2009 A, 6.25% 1/1/39 | 1,800,000 | 2,066,346 | |
| Series 2011 A: | |||
| 5.5% 9/1/41 | 2,300,000 | 2,700,384 | |
| 6% 9/1/41 | 1,200,000 | 1,458,228 | |
| Series 2011 D, 5% 9/1/28 | 2,300,000 | 2,696,888 | |
| Series 2014 A, 5% 1/1/25 | 1,000,000 | 1,182,630 | |
| Series 2015 B, 5% 1/1/40 | 2,000,000 | 2,180,480 | |
| 6% 1/1/24 | 230,000 | 253,292 | |
| San Antonio Arpt. Sys. Rev. 5.25% 7/1/18 (FSA Insured) (c) | 2,505,000 | 2,671,908 | |
| San Antonio Elec. & Gas Sys. Rev.: | |||
| Series 2008, 5% 2/1/24 | 1,000,000 | 1,091,710 | |
| Series 2012, 5.25% 2/1/25 | 800,000 | 1,002,256 | |
| Tarrant County Cultural Ed. Facilities Fin. Corp. Hosp. Rev.: | |||
| (Hendrick Med. Ctr. Proj.) Series 2009 B, 5.25% 9/1/28 (Assured Guaranty Corp. Insured) | 1,235,000 | 1,386,905 | |
| (Scott & White Healthcare Proj.) Series 2013 A, 4% 8/15/43 | 500,000 | 504,645 | |
| 5.75% 11/15/24 (Pre-Refunded to 11/15/18 @ 100) | 480,000 | 548,203 | |
| 5.75% 11/15/24 (Pre-Refunded to 11/15/18 @ 100) | 620,000 | 708,096 | |
| Texas Gen. Oblig.: | |||
| 5% 4/1/25 (Pre-Refunded to 4/1/18 @ 100) | 75,000 | 82,650 | |
| 5% 4/1/25 (Pre-Refunded to 4/1/18 @ 100) | 725,000 | 798,950 | |
| Texas Muni. Pwr. Agcy. Rev. 0% 9/1/16 (Nat'l. Pub. Fin. Guarantee Corp. Insured) (Pre-Refunded to 9/1/16 @ 100) | 1,800,000 | 1,782,324 | |
| Texas Private Activity Bond Surface Trans. Corp.: | |||
| (LBJ Infrastructure Group LLC IH-635 Managed Lanes Proj.) Series 2010, 7% 6/30/40 | 1,200,000 | 1,419,072 | |
| Series 2013, 6.75% 6/30/43 (c) | 2,400,000 | 2,924,208 | |
| Texas Trans. Commission State Hwy. Fund Rev. Series 2007, 5% 4/1/26 (Pre-Refunded to 4/1/17 @ 100) | 810,000 | 861,087 | |
| Texas Wtr. Dev. Board Rev. Series 2008 B, 5.25% 7/15/23 | 1,600,000 | 1,725,152 | |
| Univ. of Texas Board of Regents Sys. Rev.: | |||
| Series 2007 F, 4.75% 8/15/27 (Pre-Refunded to 2/15/17 @ 100) | 410,000 | 432,484 | |
| 4.75% 8/15/27 | 590,000 | 618,928 | |
| Waller Independent School District: | |||
| 5.5% 2/15/28 | 1,670,000 | 1,829,452 | |
| 5.5% 2/15/37 | 2,100,000 | 2,277,702 | |
| TOTAL TEXAS | 77,627,049 | ||
| Utah - 0.2% | |||
| Utah Associated Muni. Pwr. Sys. Rev. (Payson Pwr. Proj.) 5% 9/1/20 | 850,000 | 984,088 | |
| Utah Transit Auth. Sales Tax Rev. Series 2008 A, 5.25% 6/15/38 (Pre-Refunded to 6/15/18 @ 100) | 1,200,000 | 1,338,516 | |
| TOTAL UTAH | 2,322,604 | ||
| Vermont - 0.3% | |||
| Vermont Edl. & Health Bldg. Fin. Agcy. Rev. (Fletcher Allen Health Care Proj.) Series 2004 B, 5.5% 12/1/28 (FSA Insured) | 2,600,000 | 2,851,316 | |
| Virginia - 0.4% | |||
| Fredericksburg Econ. Dev. Auth. Rev. Series 2014, 5% 6/15/30 | 1,250,000 | 1,391,300 | |
| Univ. of Virginia Gen. Rev. Series 2015 A, 5% 4/1/45 | 1,000,000 | 1,157,530 | |
| Virginia College Bldg. Auth. Edl. Facilities Rev. Series 2015 A, 5% 1/1/40 | 500,000 | 568,385 | |
| Winchester Econ. Dev. Auth. Series 2015, 5% 1/1/44 | 1,000,000 | 1,104,740 | |
| TOTAL VIRGINIA | 4,221,955 | ||
| Washington - 1.9% | |||
| Chelan County Pub. Util. District #1 Columbia River-Rock Island Hydro-Elec. Sys. Rev. Series 1997 A, 0% 6/1/17 (Nat'l. Pub. Fin. Guarantee Corp. Insured) | 1,000,000 | 988,280 | |
| Kent Spl. Events Ctr. Pub. Facilities District Rev. Series 2008, 5.25% 12/1/32 (FSA Insured) | 2,000,000 | 2,189,260 | |
| King County Swr. Rev. Series 2009, 5.25% 1/1/42 | 1,000,000 | 1,116,220 | |
| Port of Seattle Spl. Facility Rev. Series 2013, 5% 6/1/24 (c) | 560,000 | 657,322 | |
| Spokane Pub. Facilities District Hotel/Motel Tax & Sales/Use Tax Rev. Series 2013 B, 5% 12/1/27 | 1,500,000 | 1,712,805 | |
| Washington Gen. Oblig.: | |||
| Series R 97A, 0% 7/1/19 (Escrowed to Maturity) | 1,200,000 | 1,151,952 | |
| Series S5, 0% 1/1/18 (Nat'l. Pub. Fin. Guarantee Corp. Insured) | 2,230,000 | 2,185,779 | |
| Washington Health Care Facilities Auth. Rev.: | |||
| (Catholic Health Initiatives Proj.) Series 2008 D, 6.375% 10/1/36 | 3,000,000 | 3,383,490 | |
| (MultiCare Health Sys. Proj.) Series 2008 B, 6% 8/15/39 (Pre-Refunded to 8/15/19 @ 100) | 1,000,000 | 1,180,130 | |
| (Overlake Hosp. Med. Ctr.) Series 2010, 5.7% 7/1/38 | 2,270,000 | 2,596,063 | |
| (Seattle Children's Hosp. Proj.) Series 2009, 5.625% 10/1/38 (Pre-Refunded to 10/1/19 @ 100) | 1,400,000 | 1,640,506 | |
| Series 2015, 5% 1/1/27 | 700,000 | 803,950 | |
| TOTAL WASHINGTON | 19,605,757 | ||
| West Virginia - 0.2% | |||
| West Virginia Hosp. Fin. Auth. Hosp. Rev. (West Virginia United Health Sys. Proj.) Series 2008 E, 5.625% 6/1/35 | 1,000,000 | 1,108,520 | |
| West Virginia Univ. Revs. (West Virginia Univ. Projs.) Series 2014 A, 5% 10/1/44 | 1,100,000 | 1,223,530 | |
| TOTAL WEST VIRGINIA | 2,332,050 | ||
| Wisconsin - 0.4% | |||
| Wisconsin Health & Edl. Facilities Series 2014, 4% 5/1/33 | 510,000 | 494,986 | |
| Wisconsin Health & Edl. Facilities Auth. Rev.: | |||
| (Agnesian HealthCare, Inc. Proj.): | |||
| Series 2010: | |||
| 5.5% 7/1/40 | 500,000 | 562,040 | |
| 5.75% 7/1/30 | 500,000 | 575,295 | |
| Series 2013 B, 5% 7/1/36 | 925,000 | 1,001,303 | |
| (Marshfield Clinic Proj.) Series A, 5.375% 2/15/34 | 1,000,000 | 1,010,830 | |
| Series 2012: | |||
| 5% 6/1/27 | 300,000 | 341,889 | |
| 5% 6/1/39 | 490,000 | 525,383 | |
| TOTAL WISCONSIN | 4,511,726 | ||
| Wyoming - 0.2% | |||
| Campbell County Solid Waste Facilities Rev. (Basin Elec. Pwr. Coop. - Dry Fork Station Facilities Proj.) Series 2009 A, 5.75% 7/15/39 | 1,700,000 | 1,956,870 | |
| TOTAL MUNICIPAL BONDS | |||
| (Cost $932,505,929) | 998,654,717 | ||
| Municipal Notes - 0.2% | |||
| Kentucky - 0.2% | |||
| Kentucky Pub. Trans. BAN Series 2013 A, 5% 7/1/17 | |||
| (Cost $1,570,166) | 1,500,000 | 1,597,125 | |
| TOTAL INVESTMENT PORTFOLIO - 98.9% | |||
| (Cost $934,076,095) | 1,000,251,842 | ||
| NET OTHER ASSETS (LIABILITIES) - 1.1% | 11,378,678 | ||
| NET ASSETS - 100% | $1,011,630,520 |
Security Type Abbreviations
BAN – BOND ANTICIPATION NOTE
Legend
(a) Security initially issued in zero coupon form which converts to coupon form at a specified rate and date. The rate shown is the rate at period end.
(b) Coupon rates for floating and adjustable rate securities reflect the rates in effect at period end.
(c) Private activity obligations whose interest is subject to the federal alternative minimum tax for individuals.
(d) Security or a portion of the security purchased on a delayed delivery or when-issued basis.
Investment Valuation
All investments are categorized as Level 2 under the Fair Value Hierarchy. The inputs or methodology used for valuing securities may not be an indication of the risk associated with investing in those securities. For more information on valuation inputs please refer to the Investment Valuation section in the accompanying Notes to Financial Statements.
Other Information
The distribution of municipal securities by revenue source, as a percentage of total Net Assets, is as follows (Unaudited):
| General Obligations | 34.2% |
| Health Care | 17.7% |
| Transportation | 13.7% |
| Electric Utilities | 9.4% |
| Escrowed/Pre-Refunded | 8.2% |
| Special Tax | 5.8% |
| Others* (Individually Less Than 5%) | 11.0% |
| 100.0% |
* Includes net other assets
See accompanying notes which are an integral part of the financial statements.
Financial Statements
Statement of Assets and Liabilities
| October 31, 2015 | ||
| Assets | ||
| Investment in securities, at value — See accompanying schedule: Unaffiliated issuers (cost $934,076,095) | $1,000,251,842 | |
| Cash | 6,666,041 | |
| Receivable for investments sold | 2,723,146 | |
| Receivable for fund shares sold | 1,292,497 | |
| Interest receivable | 12,422,677 | |
| Prepaid expenses | 2,774 | |
| Other receivables | 1,796 | |
| Total assets | 1,023,360,773 | |
| Liabilities | ||
| Payable for investments purchased | ||
| Regular delivery | $1,375,950 | |
| Delayed delivery | 7,475,101 | |
| Payable for fund shares redeemed | 1,699,170 | |
| Distributions payable | 463,797 | |
| Accrued management fee | 309,555 | |
| Distribution and service plan fees payable | 212,766 | |
| Other affiliated payables | 147,949 | |
| Other payables and accrued expenses | 45,965 | |
| Total liabilities | 11,730,253 | |
| Net Assets | $1,011,630,520 | |
| Net Assets consist of: | ||
| Paid in capital | $937,516,837 | |
| Undistributed net investment income | 644,423 | |
| Accumulated undistributed net realized gain (loss) on investments | 7,293,513 | |
| Net unrealized appreciation (depreciation) on investments | 66,175,747 | |
| Net Assets | $1,011,630,520 | |
| Calculation of Maximum Offering Price | ||
| Class A: | ||
| Net Asset Value and redemption price per share ($374,081,429 ÷ 27,777,090 shares) | $13.47 | |
| Maximum offering price per share (100/96.00 of $13.47) | $14.03 | |
| Class T: | ||
| Net Asset Value and redemption price per share ($170,263,080 ÷ 12,604,729 shares) | $13.51 | |
| Maximum offering price per share (100/96.00 of $13.51) | $14.07 | |
| Class B: | ||
| Net Asset Value and offering price per share ($3,237,263 ÷ 241,155 shares)(a) | $13.42 | |
| Class C: | ||
| Net Asset Value and offering price per share ($117,527,834 ÷ 8,705,948 shares)(a) | $13.50 | |
| Class I: | ||
| Net Asset Value, offering price and redemption price per share ($346,520,914 ÷ 25,867,417 shares) | $13.40 |
(a) Redemption price per share is equal to net asset value less any applicable contingent deferred sales charge.
See accompanying notes which are an integral part of the financial statements.
Statement of Operations
| Year ended October 31, 2015 | ||
| Investment Income | ||
| Interest | $40,032,596 | |
| Expenses | ||
| Management fee | $3,563,630 | |
| Transfer agent fees | 1,562,236 | |
| Distribution and service plan fees | 2,562,910 | |
| Accounting fees and expenses | 205,698 | |
| Custodian fees and expenses | 14,913 | |
| Independent trustees' compensation | 4,165 | |
| Registration fees | 94,404 | |
| Audit | 52,761 | |
| Legal | 10,556 | |
| Miscellaneous | 6,006 | |
| Total expenses before reductions | 8,077,279 | |
| Expense reductions | (108,712) | 7,968,567 |
| Net investment income (loss) | 32,064,029 | |
| Realized and Unrealized Gain (Loss) | ||
| Net realized gain (loss) on: | ||
| Investment securities: | ||
| Unaffiliated issuers | 8,081,131 | |
| Total net realized gain (loss) | 8,081,131 | |
| Change in net unrealized appreciation (depreciation) on investment securities | (14,056,180) | |
| Net gain (loss) | (5,975,049) | |
| Net increase (decrease) in net assets resulting from operations | $26,088,980 |
See accompanying notes which are an integral part of the financial statements.
Statement of Changes in Net Assets
| Year ended October 31, 2015 | Year ended October 31, 2014 | |
| Increase (Decrease) in Net Assets | ||
| Operations | ||
| Net investment income (loss) | $32,064,029 | $32,476,757 |
| Net realized gain (loss) | 8,081,131 | 3,220,004 |
| Change in net unrealized appreciation (depreciation) | (14,056,180) | 44,401,983 |
| Net increase (decrease) in net assets resulting from operations | 26,088,980 | 80,098,744 |
| Distributions to shareholders from net investment income | (32,013,498) | (32,459,524) |
| Distributions to shareholders from net realized gain | (3,075,920) | (6,709,660) |
| Total distributions | (35,089,418) | (39,169,184) |
| Share transactions - net increase (decrease) | 55,427,860 | (39,024,324) |
| Total increase (decrease) in net assets | 46,427,422 | 1,905,236 |
| Net Assets | ||
| Beginning of period | 965,203,098 | 963,297,862 |
| End of period (including undistributed net investment income of $644,423 and undistributed net investment income of $462,330, respectively) | $1,011,630,520 | $965,203,098 |
See accompanying notes which are an integral part of the financial statements.
Financial Highlights — Fidelity Advisor Municipal Income Fund Class A
| Years ended October 31, | 2015 | 2014 | 2013 | 2012 | 2011 |
| Selected Per–Share Data | |||||
| Net asset value, beginning of period | $13.59 | $13.00 | $13.74 | $12.95 | $12.99 |
| Income from Investment Operations | |||||
| Net investment income (loss)A | .438 | .462 | .453 | .460 | .479 |
| Net realized and unrealized gain (loss) | (.076) | .682 | (.738) | .789 | (.041) |
| Total from investment operations | .362 | 1.144 | (.285) | 1.249 | .438 |
| Distributions from net investment income | (.439) | (.461) | (.451) | (.457) | (.478) |
| Distributions from net realized gain | (.043) | (.093) | (.004) | (.002) | – |
| Total distributions | (.482) | (.554) | (.455) | (.459) | (.478) |
| Net asset value, end of period | $13.47 | $13.59 | $13.00 | $13.74 | $12.95 |
| Total ReturnB,C | 2.71% | 9.02% | (2.12)% | 9.77% | 3.53% |
| Ratios to Average Net AssetsD,E | |||||
| Expenses before reductions | .81% | .79% | .77% | .77% | .77% |
| Expenses net of fee waivers, if any | .80% | .79% | .77% | .77% | .77% |
| Expenses net of all reductions | .80% | .79% | .77% | .77% | .77% |
| Net investment income (loss) | 3.25% | 3.49% | 3.36% | 3.42% | 3.80% |
| Supplemental Data | |||||
| Net assets, end of period (000 omitted) | $374,081 | $325,539 | $335,492 | $430,231 | $368,789 |
| Portfolio turnover rateF | 14% | 10% | 12% | 6% | 8% |
A Calculated based on average shares outstanding during the period.
B Total returns would have been lower if certain expenses had not been reduced during the applicable periods shown.
C Total returns do not include the effect of the sales charges.
D Fees and expenses of any underlying Fidelity Central Funds are not included in the Fund's expense ratio. The Fund indirectly bears its proportionate share of the expenses of any underlying Fidelity Central Funds.
E Expense ratios reflect operating expenses of the class. Expenses before reductions do not reflect amounts reimbursed by the investment adviser or reductions from brokerage service arrangements or reductions from other expense offset arrangements and do not represent the amount paid by the class during periods when reimbursements or reductions occur. Expenses net of fee waivers reflect expenses after reimbursement by the investment adviser but prior to reductions from brokerage service arrangements or other expense offset arrangements. Expenses net of all reductions represent the net expenses paid by the class.
F Amount does not include the portfolio activity of any underlying Fidelity Central Funds.
See accompanying notes which are an integral part of the financial statements.
Financial Highlights — Fidelity Advisor Municipal Income Fund Class T
| Years ended October 31, | 2015 | 2014 | 2013 | 2012 | 2011 |
| Selected Per–Share Data | |||||
| Net asset value, beginning of period | $13.63 | $13.03 | $13.77 | $12.99 | $13.02 |
| Income from Investment Operations | |||||
| Net investment income (loss)A | .443 | .466 | .454 | .462 | .481 |
| Net realized and unrealized gain (loss) | (.079) | .691 | (.739) | .778 | (.032) |
| Total from investment operations | .364 | 1.157 | (.285) | 1.240 | .449 |
| Distributions from net investment income | (.441) | (.464) | (.451) | (.458) | (.479) |
| Distributions from net realized gain | (.043) | (.093) | (.004) | (.002) | – |
| Total distributions | (.484) | (.557) | (.455) | (.460) | (.479) |
| Net asset value, end of period | $13.51 | $13.63 | $13.03 | $13.77 | $12.99 |
| Total ReturnB,C | 2.72% | 9.10% | (2.12)% | 9.67% | 3.61% |
| Ratios to Average Net AssetsD,E | |||||
| Expenses before reductions | .79% | .78% | .77% | .76% | .76% |
| Expenses net of fee waivers, if any | .79% | .78% | .77% | .76% | .76% |
| Expenses net of all reductions | .79% | .78% | .77% | .76% | .76% |
| Net investment income (loss) | 3.26% | 3.51% | 3.37% | 3.42% | 3.80% |
| Supplemental Data | |||||
| Net assets, end of period (000 omitted) | $170,263 | $204,607 | $207,208 | $247,622 | $225,908 |
| Portfolio turnover rateF | 14% | 10% | 12% | 6% | 8% |
A Calculated based on average shares outstanding during the period.
B Total returns would have been lower if certain expenses had not been reduced during the applicable periods shown.
C Total returns do not include the effect of the sales charges.
D Fees and expenses of any underlying Fidelity Central Funds are not included in the Fund's expense ratio. The Fund indirectly bears its proportionate share of the expenses of any underlying Fidelity Central Funds.
E Expense ratios reflect operating expenses of the class. Expenses before reductions do not reflect amounts reimbursed by the investment adviser or reductions from brokerage service arrangements or reductions from other expense offset arrangements and do not represent the amount paid by the class during periods when reimbursements or reductions occur. Expenses net of fee waivers reflect expenses after reimbursement by the investment adviser but prior to reductions from brokerage service arrangements or other expense offset arrangements. Expenses net of all reductions represent the net expenses paid by the class.
F Amount does not include the portfolio activity of any underlying Fidelity Central Funds.
See accompanying notes which are an integral part of the financial statements.
Financial Highlights — Fidelity Advisor Municipal Income Fund Class B
| Years ended October 31, | 2015 | 2014 | 2013 | 2012 | 2011 |
| Selected Per–Share Data | |||||
| Net asset value, beginning of period | $13.54 | $12.96 | $13.69 | $12.92 | $12.96 |
| Income from Investment Operations | |||||
| Net investment income (loss)A | .361 | .375 | .361 | .367 | .393 |
| Net realized and unrealized gain (loss) | (.079) | .673 | (.727) | .772 | (.040) |
| Total from investment operations | .282 | 1.048 | (.366) | 1.139 | .353 |
| Distributions from net investment income | (.359) | (.375) | (.360) | (.367) | (.393) |
| Distributions from net realized gain | (.043) | (.093) | (.004) | (.002) | – |
| Total distributions | (.402) | (.468) | (.364) | (.369) | (.393) |
| Net asset value, end of period | $13.42 | $13.54 | $12.96 | $13.69 | $12.92 |
| Total ReturnB,C | 2.11% | 8.26% | (2.72)% | 8.90% | 2.85% |
| Ratios to Average Net AssetsD,E | |||||
| Expenses before reductions | 1.39% | 1.45% | 1.45% | 1.45% | 1.46% |
| Expenses net of fee waivers, if any | 1.39% | 1.45% | 1.45% | 1.45% | 1.45% |
| Expenses net of all reductions | 1.39% | 1.45% | 1.45% | 1.45% | 1.45% |
| Net investment income (loss) | 2.67% | 2.84% | 2.68% | 2.74% | 3.12% |
| Supplemental Data | |||||
| Net assets, end of period (000 omitted) | $3,237 | $4,932 | $6,951 | $11,187 | $12,983 |
| Portfolio turnover rateF | 14% | 10% | 12% | 6% | 8% |
A Calculated based on average shares outstanding during the period.
B Total returns would have been lower if certain expenses had not been reduced during the applicable periods shown.
C Total returns do not include the effect of the contingent deferred sales charge.
D Fees and expenses of any underlying Fidelity Central Funds are not included in the Fund's expense ratio. The Fund indirectly bears its proportionate share of the expenses of any underlying Fidelity Central Funds.
E Expense ratios reflect operating expenses of the class. Expenses before reductions do not reflect amounts reimbursed by the investment adviser or reductions from brokerage service arrangements or reductions from other expense offset arrangements and do not represent the amount paid by the class during periods when reimbursements or reductions occur. Expenses net of fee waivers reflect expenses after reimbursement by the investment adviser but prior to reductions from brokerage service arrangements or other expense offset arrangements. Expenses net of all reductions represent the net expenses paid by the class.
F Amount does not include the portfolio activity of any underlying Fidelity Central Funds.
See accompanying notes which are an integral part of the financial statements.
Financial Highlights — Fidelity Advisor Municipal Income Fund Class C
| Years ended October 31, | 2015 | 2014 | 2013 | 2012 | 2011 |
| Selected Per–Share Data | |||||
| Net asset value, beginning of period | $13.62 | $13.03 | $13.77 | $12.98 | $13.02 |
| Income from Investment Operations | |||||
| Net investment income (loss)A | .339 | .363 | .351 | .358 | .383 |
| Net realized and unrealized gain (loss) | (.078) | .681 | (.739) | .788 | (.042) |
| Total from investment operations | .261 | 1.044 | (.388) | 1.146 | .341 |
| Distributions from net investment income | (.338) | (.361) | (.348) | (.354) | (.381) |
| Distributions from net realized gain | (.043) | (.093) | (.004) | (.002) | – |
| Total distributions | (.381) | (.454) | (.352) | (.356) | (.381) |
| Net asset value, end of period | $13.50 | $13.62 | $13.03 | $13.77 | $12.98 |
| Total ReturnB,C | 1.94% | 8.19% | (2.86)% | 8.92% | 2.74% |
| Ratios to Average Net AssetsD,E | |||||
| Expenses before reductions | 1.56% | 1.55% | 1.54% | 1.54% | 1.54% |
| Expenses net of fee waivers, if any | 1.55% | 1.55% | 1.54% | 1.54% | 1.54% |
| Expenses net of all reductions | 1.55% | 1.55% | 1.54% | 1.53% | 1.54% |
| Net investment income (loss) | 2.50% | 2.74% | 2.60% | 2.65% | 3.03% |
| Supplemental Data | |||||
| Net assets, end of period (000 omitted) | $117,528 | $118,088 | $123,530 | $155,834 | $130,949 |
| Portfolio turnover rateF | 14% | 10% | 12% | 6% | 8% |
A Calculated based on average shares outstanding during the period.
B Total returns would have been lower if certain expenses had not been reduced during the applicable periods shown.
C Total returns do not include the effect of the contingent deferred sales charge.
D Fees and expenses of any underlying Fidelity Central Funds are not included in the Fund's expense ratio. The Fund indirectly bears its proportionate share of the expenses of any underlying Fidelity Central Funds.
E Expense ratios reflect operating expenses of the class. Expenses before reductions do not reflect amounts reimbursed by the investment adviser or reductions from brokerage service arrangements or reductions from other expense offset arrangements and do not represent the amount paid by the class during periods when reimbursements or reductions occur. Expenses net of fee waivers reflect expenses after reimbursement by the investment adviser but prior to reductions from brokerage service arrangements or other expense offset arrangements. Expenses net of all reductions represent the net expenses paid by the class.
F Amount does not include the portfolio activity of any underlying Fidelity Central Funds.
See accompanying notes which are an integral part of the financial statements.
Financial Highlights — Fidelity Advisor Municipal Income Fund Class I
| Years ended October 31, | 2015 | 2014 | 2013 | 2012 | 2011 |
| Selected Per–Share Data | |||||
| Net asset value, beginning of period | $13.51 | $12.93 | $13.67 | $12.89 | $12.93 |
| Income from Investment Operations | |||||
| Net investment income (loss)A | .470 | .493 | .481 | .490 | .505 |
| Net realized and unrealized gain (loss) | (.067) | .674 | (.735) | .782 | (.039) |
| Total from investment operations | .403 | 1.167 | (.254) | 1.272 | .466 |
| Distributions from net investment income | (.470) | (.494) | (.482) | (.490) | (.506) |
| Distributions from net realized gain | (.043) | (.093) | (.004) | (.002) | – |
| Total distributions | (.513) | (.587) | (.486) | (.492) | (.506) |
| Net asset value, end of period | $13.40 | $13.51 | $12.93 | $13.67 | $12.89 |
| Total ReturnB | 3.03% | 9.27% | (1.90)% | 10.00% | 3.79% |
| Ratios to Average Net AssetsC,D | |||||
| Expenses before reductions | .57% | .54% | .54% | .53% | .54% |
| Expenses net of fee waivers, if any | .55% | .54% | .54% | .53% | .54% |
| Expenses net of all reductions | .55% | .54% | .54% | .53% | .54% |
| Net investment income (loss) | 3.50% | 3.75% | 3.60% | 3.66% | 4.02% |
| Supplemental Data | |||||
| Net assets, end of period (000 omitted) | $346,521 | $312,038 | $290,117 | $362,588 | $305,538 |
| Portfolio turnover rateE | 14% | 10% | 12% | 6% | 8% |
A Calculated based on average shares outstanding during the period.
B Total returns would have been lower if certain expenses had not been reduced during the applicable periods shown.
C Fees and expenses of any underlying Fidelity Central Funds are not included in the Fund's expense ratio. The Fund indirectly bears its proportionate share of the expenses of any underlying Fidelity Central Funds.
D Expense ratios reflect operating expenses of the class. Expenses before reductions do not reflect amounts reimbursed by the investment adviser or reductions from brokerage service arrangements or reductions from other expense offset arrangements and do not represent the amount paid by the class during periods when reimbursements or reductions occur. Expenses net of fee waivers reflect expenses after reimbursement by the investment adviser but prior to reductions from brokerage service arrangements or other expense offset arrangements. Expenses net of all reductions represent the net expenses paid by the class.
E Amount does not include the portfolio activity of any underlying Fidelity Central Funds.
See accompanying notes which are an integral part of the financial statements.
Notes to Financial Statements
For the period ended October 31, 2015
1. Organization.
Fidelity Advisor Municipal Income Fund (the Fund) is a fund of Fidelity Advisor Series II (the Trust) and is authorized to issue an unlimited number of shares. The Trust is registered under the Investment Company Act of 1940, as amended (the 1940 Act), as an open-end management investment company organized as a Massachusetts business trust. The Fund offers Class A, Class T, Class C and Class I (formerly Institutional Class) shares, each of which, along with Class B shares, has equal rights as to assets and voting privileges. Class B shares are closed to new accounts and additional purchases, except for exchanges and reinvestments. Each class has exclusive voting rights with respect to matters that affect that class. Class B shares will automatically convert to Class A shares after a holding period of seven years from the initial date of purchase.
2. Significant Accounting Policies.
The financial statements have been prepared in conformity with accounting principles generally accepted in the United States of America (GAAP), which require management to make certain estimates and assumptions at the date of the financial statements. Actual results could differ from those estimates. Subsequent events, if any, through the date that the financial statements were issued have been evaluated in the preparation of the financial statements. The following summarizes the significant accounting policies of the Fund:
Investment Valuation. Investments are valued as of 4:00 p.m. Eastern time on the last calendar day of the period. The Board of Trustees (the Board) has delegated the day to day responsibility for the valuation of the Fund's investments to the Fidelity Management & Research Company (FMR) Fair Value Committee (the Committee). In accordance with valuation policies and procedures approved by the Board, the Fund attempts to obtain prices from one or more third party pricing vendors or brokers to value its investments. When current market prices, quotations or currency exchange rates are not readily available or reliable, investments will be fair valued in good faith by the Committee, in accordance with procedures adopted by the Board. Factors used in determining fair value vary by investment type and may include market or investment specific events, changes in interest rates and credit quality. The frequency with which these procedures are used cannot be predicted and they may be utilized to a significant extent. The Committee oversees the Fund's valuation policies and procedures and reports to the Board on the Committee's activities and fair value determinations. The Board monitors the appropriateness of the procedures used in valuing the Fund's investments and ratifies the fair value determinations of the Committee.
The Fund categorizes the inputs to valuation techniques used to value its investments into a disclosure hierarchy consisting of three levels as shown below:
- Level 1 – quoted prices in active markets for identical investments
- Level 2 – other significant observable inputs (including quoted prices for similar investments, interest rates, prepayment speeds, etc.)
- Level 3 – unobservable inputs (including the Fund's own assumptions based on the best information available)
Valuation techniques used to value the Fund's investments by major category are as follows:
Debt securities, including restricted securities, are valued based on evaluated prices received from third party pricing vendors or from brokers who make markets in such securities. Municipal securities are valued by pricing vendors who utilize matrix pricing which considers yield or price of bonds of comparable quality, coupon, maturity and type or by broker-supplied prices. When independent prices are unavailable or unreliable, debt securities may be valued utilizing pricing methodologies which consider similar factors that would be used by third party pricing vendors. Debt securities are generally categorized as Level 2 in the hierarchy but may be Level 3 depending on the circumstances.
Changes in valuation techniques may result in transfers in or out of an assigned level within the disclosure hierarchy.
Investment Transactions and Income. For financial reporting purposes, the Fund's investment holdings and net asset value (NAV) include trades executed through the end of the last business day of the period. The NAV per share for processing shareholder transactions is calculated as of the close of business of the New York Stock Exchange (NYSE), normally 4:00 p.m. Eastern time and includes trades executed through the end of the prior business day. Gains and losses on securities sold are determined on the basis of identified cost. Interest income is accrued as earned and includes coupon interest and amortization of premium and accretion of discount on debt securities as applicable. Debt obligations may be placed on non-accrual status and related interest income may be reduced by ceasing current accruals and writing off interest receivables when the collection of all or a portion of interest has become doubtful based on consistently applied procedures. A debt obligation is removed from non-accrual status when the issuer resumes interest payments or when collectability of interest is reasonably assured.
Class Allocations and Expenses. Investment income, realized and unrealized capital gains and losses, common expenses of the Fund, and certain fund-level expense reductions, if any, are allocated daily on a pro-rata basis to each class based on the relative net assets of each class to the total net assets of the Fund. Each class differs with respect to transfer agent and distribution and service plan fees incurred. Certain expense reductions may also differ by class. For the reporting period, the allocated portion of income and expenses to each class as a percent of its average net assets may vary due to the timing of recording these transactions in relation to fluctuating net assets of the classes. Expenses directly attributable to a fund are charged to that fund. Expenses attributable to more than one fund are allocated among the respective funds on the basis of relative net assets or other appropriate methods. Expense estimates are accrued in the period to which they relate and adjustments are made when actual amounts are known.
Income Tax Information and Distributions to Shareholders. Each year, the Fund intends to qualify as a regulated investment company under Subchapter M of the Internal Revenue Code, including distributing substantially all of its taxable income and realized gains. As a result, no provision for U.S. Federal income taxes is required. As of October 31, 2015, the Fund did not have any unrecognized tax benefits in the financial statements; nor is the Fund aware of any tax positions for which it is reasonably possible that the total amounts of unrecognized tax benefits will significantly change in the next twelve months. The Fund files a U.S. federal tax return, in addition to state and local tax returns as required. The Fund's federal income tax returns are subject to examination by the Internal Revenue Service (IRS) for a period of three fiscal years after they are filed. State and local tax returns may be subject to examination for an additional fiscal year depending on the jurisdiction.
Dividends are declared and recorded daily and paid monthly from net investment income. Distributions from realized gains, if any, are declared and recorded on the ex-dividend date. Income dividends and capital gain distributions are declared separately for each class. Income and capital gain distributions are determined in accordance with income tax regulations, which may differ from GAAP. In addition, the Fund claimed a portion of the payment made to redeeming shareholders as a distribution for income tax purposes.
Capital accounts within the financial statements are adjusted for permanent book-tax differences. These adjustments have no impact on net assets or the results of operations. Capital accounts are not adjusted for temporary book-tax differences which will reverse in a subsequent period.
Book-tax differences are primarily due to market discount and deferred trustees compensation.
The Fund purchases municipal securities whose interest, in the opinion of the issuer, is free from federal income tax. There is no assurance that the IRS will agree with this opinion. In the event the IRS determines that the issuer does not comply with relevant tax requirements, interest payments from a security could become federally taxable, possibly retroactively to the date the security was issued.
The federal tax cost of investment securities and unrealized appreciation (depreciation) as of period end were as follows:
| Gross unrealized appreciation | $69,997,220 |
| Gross unrealized depreciation | (3,335,385) |
| Net unrealized appreciation (depreciation) on securities | $66,661,835 |
| Tax Cost | $933,590,007 |
The tax-based components of distributable earnings as of period end were as follows:
| Undistributed tax-exempt income | $158,903 |
| Undistributed long-term capital gain | $7,293,513 |
| Net unrealized appreciation (depreciation) on securities and other investments | $66,661,835 |
The tax character of distributions paid was as follows:
| October 31, 2015 | October 31, 2014 | |
| Tax-exempt Income | $32,013,498 | $32,459,524 |
| Long-term Capital Gains | 3,075,920 | 6,709,660 |
| Total | $35,089,418 | $ 39,169,184 |
Delayed Delivery Transactions and When-Issued Securities. During the period, the Fund transacted in securities on a delayed delivery or when-issued basis. Payment and delivery may take place after the customary settlement period for that security. The price of the underlying securities and the date when the securities will be delivered and paid for are fixed at the time the transaction is negotiated. The securities purchased on a delayed delivery or when-issued basis are identified as such in the Fund's Schedule of Investments. The Fund may receive compensation for interest forgone in the purchase of a delayed delivery or when-issued security. With respect to purchase commitments, the Fund identifies securities as segregated in its records with a value at least equal to the amount of the commitment. Losses may arise due to changes in the value of the underlying securities or if the counterparty does not perform under the contract's terms, or if the issuer does not issue the securities due to political, economic, or other factors.
3. Purchases and Sales of Investments.
Purchases and sales of securities, other than short-term securities, aggregated $196,399,761 and $140,889,319, respectively.
4. Fees and Other Transactions with Affiliates.
Management Fee. Fidelity Management & Research Company (the investment adviser) and its affiliates provide the Fund with investment management related services for which the Fund pays a monthly management fee. The management fee is the sum of an individual fund fee rate that is based on an annual rate of .25% of the Fund's average net assets and an annualized group fee rate that averaged .11% during the period. The group fee rate is based upon the average net assets of all the mutual funds advised by the investment adviser, including any mutual funds previously advised by the investment adviser that are currently advised by Fidelity SelectCo, LLC, an affiliate of the investment adviser. The group fee rate decreases as assets under management increase and increases as assets under management decrease. For the reporting period, the total annual management fee rate was .36% of the Fund's average net assets.
Distribution and Service Plan Fees. In accordance with Rule 12b-1 of the 1940 Act, the Fund has adopted separate Distribution and Service Plans for each class of shares. Certain classes pay Fidelity Distributors Corporation (FDC), an affiliate of the investment adviser, separate Distribution and Service Fees, each of which is based on an annual percentage of each class' average net assets. In addition, FDC may pay financial intermediaries for selling shares of the Fund and providing shareholder support services. For the period, the Distribution and Service Fee rates, total fees and amounts retained by FDC were as follows:
| Distribution Fee | Service Fee | Total Fees | Retained by FDC | |
| Class A | -% | .25% | $863,554 | $24,593 |
| Class T | -% | .25% | 479,967 | 132 |
| Class B | .65% | .25% | 36,853 | 26,616 |
| Class C | .75% | .25% | 1,182,536 | 128,141 |
| $2,562,910 | $179,482 |
Sales Load. FDC may receive a front-end sales charge of up to 4.00% for selling Class A shares and Class T shares, some of which is paid to financial intermediaries for selling shares of the Fund. Depending on the holding period, FDC may receive contingent deferred sales charges levied on Class A, Class T, Class B, and Class C redemptions. The deferred sales charges range from 5.00% to 1.00% for Class B shares, 1.00% for Class C shares, .75% for certain purchases of Class A shares and .25% for certain purchases of Class T shares.
For the period, sales charge amounts retained by FDC were as follows:
| Retained by FDC | |
| Class A | $27,918 |
| Class T | 6,425 |
| Class B(a) | 3,911 |
| Class C(a) | 17,753 |
| $56,007 |
(a) When Class B and Class C shares are initially sold, FDC pays commissions from its own resources to financial intermediaries through which the sales are made.
Transfer Agent Fees. Pursuant to the transfer agent contract approved by the Board of Trustees effective May 1, 2015, Fidelity Investments Institutional Operations Company, Inc. (FIIOC), an affiliate of the investment adviser, is the transfer, dividend disbursing and shareholder servicing agent for the Fund. FIIOC receives account fees and asset-based fees that vary according to the account size and type of account of the shareholders of the respective classes of the Fund. FIIOC pays for typesetting, printing and mailing of shareholder reports, except proxy statements. For the period, transfer agent fees for each class were as follows:
| Amount | % of Class-Level Average Net Assets | |
| Class A | $556,400 | .16 |
| Class T | 265,419 | .14 |
| Class B | 3,514 | .09 |
| Class C | 190,717 | .16 |
| Class I | 546,186 | .17 |
| $1,562,236 |
Prior to May 1, 2015, Citibank, N.A. was the transfer, dividend disbursing and shareholder servicing agent for the Fund. Prior to May 8, 2015, Citibank, N.A. was the custodian for the Fund.
Accounting Fees. Fidelity Service Company, Inc. (FSC), an affiliate of the investment adviser, maintains the Fund's accounting records. The fee is based on the level of average net assets for each month.
5. Committed Line of Credit.
The Fund participates with other funds managed by the investment adviser or an affiliate in a $4.25 billion credit facility (the "line of credit") to be utilized for temporary or emergency purposes to fund shareholder redemptions or for other short-term liquidity purposes. The Fund has agreed to pay commitment fees on its pro-rata portion of the line of credit, which amounted to $1,419 and is reflected in Miscellaneous expenses on the Statement of Operations. During the period, the Fund did not borrow on this line of credit.
6. Expense Reductions.
The investment adviser voluntarily agreed to reimburse each class to the extent annual operating expenses exceeded certain levels of average net assets as noted in the table below. Some expenses, for example interest expense, including commitment fees, are excluded from this reimbursement.
The following classes were in reimbursement during the period:
| Expense Limitations | Reimbursement | |
| Class A | .80% | $36,749 |
| Class C | 1.55% | 13,600 |
| Class I | .55% | 52,199 |
| $102,548 |
In addition, through arrangements with the Fund's custodian, credits realized as a result of certain uninvested cash balances were used to reduce the Fund's expenses. During the period, these credits reduced the Fund's custody expenses by $3,949.
In addition, during the period the investment adviser reimbursed and/or waived a portion of fund-level operating expenses in the amount of $2,215.
7. Distributions to Shareholders.
Distributions to shareholders of each class were as follows:
| Years ended October 31, | 2015 | 2014 |
| From net investment income | ||
| Class A | $11,209,786 | $11,330,075 |
| Class T | 6,254,506 | 7,089,994 |
| Class B | 109,257 | 167,211 |
| Class C | 2,952,064 | 3,190,951 |
| Class I | 11,487,885 | 10,681,293 |
| Total | $32,013,498 | $32,459,524 |
| From net realized gain | ||
| Class A | $1,040,888 | $2,345,937 |
| Class T | 645,322 | 1,463,693 |
| Class B | 15,321 | 48,806 |
| Class C | 375,706 | 862,580 |
| Class I | 998,683 | 1,988,644 |
| Total | $3,075,920 | $6,709,660 |
8. Share Transactions.
Share transactions for each class were as follows and may contain automatic conversions between classes or exchanges between funds:
| Shares | Shares | Dollars | Dollars | |
| Years ended October 31, | 2015 | 2014 | 2015 | 2014 |
| Class A | ||||
| Shares sold | 7,321,054 | 3,505,545 | $98,457,911 | $46,452,566 |
| Reinvestment of distributions | 799,176 | 826,195 | 10,802,339 | 10,887,594 |
| Shares redeemed | (4,304,331) | (6,185,804) | (58,024,074) | (81,584,528) |
| Net increase (decrease) | 3,815,899 | (1,854,064) | $51,236,176 | $(24,244,368) |
| Class T | ||||
| Shares sold | 962,158 | 1,002,254 | $13,077,839 | $13,321,199 |
| Reinvestment of distributions | 428,699 | 517,415 | 5,816,600 | 6,831,091 |
| Shares redeemed | (3,800,963) | (2,402,910) | (51,056,487) | (31,723,275) |
| Net increase (decrease) | (2,410,106) | (883,241) | $(32,162,048) | $(11,570,985) |
| Class B | ||||
| Shares sold | 6,377 | 3,673 | $85,790 | $48,057 |
| Reinvestment of distributions | 6,565 | 10,760 | 88,546 | 140,754 |
| Shares redeemed | (135,960) | (186,742) | (1,833,365) | (2,454,298) |
| Net increase (decrease) | (123,018) | (172,309) | $(1,659,029) | $(2,265,487) |
| Class C | ||||
| Shares sold | 1,517,186 | 1,231,173 | $20,585,033 | $16,418,632 |
| Reinvestment of distributions | 198,543 | 228,050 | 2,691,008 | 3,005,267 |
| Shares redeemed | (1,680,675) | (2,271,570) | (22,745,447) | (29,957,134) |
| Net increase (decrease) | 35,054 | (812,347) | $530,594 | $(10,533,235) |
| Class I | ||||
| Shares sold | 8,159,687 | 8,701,375 | $109,757,534 | $114,634,619 |
| Reinvestment of distributions | 715,538 | 633,458 | 9,622,256 | 8,301,472 |
| Shares redeemed | (6,096,917) | (8,683,609) | (81,897,623) | (113,346,340) |
| Net increase (decrease) | 2,778,308 | 651,224 | $37,482,167 | $9,589,751 |
9. Other.
The Fund's organizational documents provide former and current trustees and officers with a limited indemnification against liabilities arising in connection with the performance of their duties to the Fund. In the normal course of business, the Fund may also enter into contracts that provide general indemnifications. The Fund's maximum exposure under these arrangements is unknown as this would be dependent on future claims that may be made against the Fund. The risk of material loss from such claims is considered remote.
Report of Independent Registered Public Accounting Firm
To the Trustees of Fidelity Advisor Series II and Shareholders of Fidelity Advisor® Municipal Income Fund:
In our opinion, the accompanying statement of assets and liabilities, including the schedule of investments, and the related statements of operations and of changes in net assets and the financial highlights present fairly, in all material respects, the financial position of Fidelity Advisor® Municipal Income Fund (a fund of Fidelity Advisor Series II) at October 31, 2015, the results of its operations for the year then ended, the changes in its net assets for each of the two years in the period then ended and the financial highlights for each of the five years in the period then ended, in conformity with accounting principles generally accepted in the United States of America. These financial statements and financial highlights (hereafter referred to as “financial statements”) are the responsibility of the Fidelity Advisor® Municipal Income Fund’s management. Our responsibility is to express an opinion on these financial statements based on our audits. We conducted our audits of these financial statements in accordance with the standards of the Public Company Accounting Oversight Board (United States). Those standards require that we plan and perform the audit to obtain reasonable assurance about whether the financial statements are free of material misstatement. An audit includes examining, on a test basis, evidence supporting the amounts and disclosures in the financial statements, assessing the accounting principles used and significant estimates made by management, and evaluating the overall financial statement presentation. We believe that our audits, which included confirmation of securities at October 31, 2015 by correspondence with the custodian and brokers, provide a reasonable basis for our opinion.
PricewaterhouseCoopers LLP
Boston, Massachusetts
December 17, 2015
Trustees and Officers
The Trustees, Members of the Advisory Board (if any), and officers of the trust and fund, as applicable, are listed below. The Board of Trustees governs the fund and is responsible for protecting the interests of shareholders. The Trustees are experienced executives who meet periodically throughout the year to oversee the fund's activities, review contractual arrangements with companies that provide services to the fund, oversee management of the risks associated with such activities and contractual arrangements, and review the fund's performance. Each of the trustees oversees 234 funds.
The Trustees hold office without limit in time except that (a) any Trustee may resign; (b) any Trustee may be removed by written instrument, signed by at least two-thirds of the number of Trustees prior to such removal; (c) any Trustee who requests to be retired or who has become incapacitated by illness or injury may be retired by written instrument signed by a majority of the other Trustees; and (d) any Trustee may be removed at any special meeting of shareholders by a two-thirds vote of the outstanding voting securities of the trust. Each Trustee who is not an interested person (as defined in the 1940 Act) of the trust and the fund is referred to herein as an Independent Trustee. Each Independent Trustee shall retire not later than the last day of the month in which his or her 75th birthday occurs. The Independent Trustees may waive this mandatory retirement age policy with respect to individual Trustees. Officers and Advisory Board Members hold office without limit in time, except that any officer or Advisory Board Member may resign or may be removed by a vote of a majority of the Trustees at any regular meeting or any special meeting of the Trustees. Except as indicated, each individual has held the office shown or other offices in the same company for the past five years.
The fund’s Statement of Additional Information (SAI) includes more information about the Trustees. To request a free copy, call Fidelity at 1-877-208-0098.
Experience, Skills, Attributes, and Qualifications of the Trustees. The Governance and Nominating Committee has adopted a statement of policy that describes the experience, qualifications, attributes, and skills that are necessary and desirable for potential Independent Trustee candidates (Statement of Policy). The Board believes that each Trustee satisfied at the time he or she was initially elected or appointed a Trustee, and continues to satisfy, the standards contemplated by the Statement of Policy. The Governance and Nominating Committee also engages professional search firms to help identify potential Independent Trustee candidates who have the experience, qualifications, attributes, and skills consistent with the Statement of Policy. From time to time, additional criteria based on the composition and skills of the current Independent Trustees, as well as experience or skills that may be appropriate in light of future changes to board composition, business conditions, and regulatory or other developments, have also been considered by the professional search firms and the Governance and Nominating Committee. In addition, the Board takes into account the Trustees' commitment and participation in Board and committee meetings, as well as their leadership of standing and ad hoc committees throughout their tenure.
In determining that a particular Trustee was and continues to be qualified to serve as a Trustee, the Board has considered a variety of criteria, none of which, in isolation, was controlling. The Board believes that, collectively, the Trustees have balanced and diverse experience, qualifications, attributes, and skills, which allow the Board to operate effectively in governing the fund and protecting the interests of shareholders. Information about the specific experience, skills, attributes, and qualifications of each Trustee, which in each case led to the Board's conclusion that the Trustee should serve (or continue to serve) as a trustee of the fund, is provided below.
Board Structure and Oversight Function. Abigail P. Johnson is an interested person and currently serves as Chairman. The Trustees have determined that an interested Chairman is appropriate and benefits shareholders because an interested Chairman has a personal and professional stake in the quality and continuity of services provided to the fund. Independent Trustees exercise their informed business judgment to appoint an individual of their choosing to serve as Chairman, regardless of whether the Trustee happens to be independent or a member of management. The Independent Trustees have determined that they can act independently and effectively without having an Independent Trustee serve as Chairman and that a key structural component for assuring that they are in a position to do so is for the Independent Trustees to constitute a substantial majority for the Board. The Independent Trustees also regularly meet in executive session. Marie L. Knowles serves as Chairman of the Independent Trustees and as such (i) acts as a liaison between the Independent Trustees and management with respect to matters important to the Independent Trustees and (ii) with management prepares agendas for Board meetings.
Fidelity® funds are overseen by different Boards of Trustees. The fund's Board oversees Fidelity's investment-grade bond, money market, asset allocation and certain equity funds, and other Boards oversee Fidelity's high income, sector and other equity funds. The asset allocation funds may invest in Fidelity® funds that are overseen by such other Boards. The use of separate Boards, each with its own committee structure, allows the Trustees of each group of Fidelity® funds to focus on the unique issues of the funds they oversee, including common research, investment, and operational issues. On occasion, the separate Boards establish joint committees to address issues of overlapping consequences for the Fidelity® funds overseen by each Board.
The Trustees operate using a system of committees to facilitate the timely and efficient consideration of all matters of importance to the Trustees, the fund, and fund shareholders and to facilitate compliance with legal and regulatory requirements and oversight of the fund's activities and associated risks. The Board, acting through its committees, has charged FMR and its affiliates with (i) identifying events or circumstances the occurrence of which could have demonstrably adverse effects on the fund's business and/or reputation; (ii) implementing processes and controls to lessen the possibility that such events or circumstances occur or to mitigate the effects of such events or circumstances if they do occur; and (iii) creating and maintaining a system designed to evaluate continuously business and market conditions in order to facilitate the identification and implementation processes described in (i) and (ii) above. Because the day-to-day operations and activities of the fund are carried out by or through FMR, its affiliates, and other service providers, the fund's exposure to risks is mitigated but not eliminated by the processes overseen by the Trustees. While each of the Board's committees has responsibility for overseeing different aspects of the fund's activities, oversight is exercised primarily through the Operations and Audit Committees. In addition, an ad hoc Board committee of Independent Trustees has worked with FMR to enhance the Board's oversight of investment and financial risks, legal and regulatory risks, technology risks, and operational risks, including the development of additional risk reporting to the Board. Appropriate personnel, including but not limited to the fund's Chief Compliance Officer (CCO), FMR's internal auditor, the independent accountants, the fund's Treasurer and portfolio management personnel, make periodic reports to the Board's committees, as appropriate, including an annual review of Fidelity's risk management program for the Fidelity® funds. The responsibilities of each standing committee, including their oversight responsibilities, are described further under "Standing Committees of the Trustees."
Interested Trustees*:
Correspondence intended for a Trustee who is an interested person may be sent to Fidelity Investments, 245 Summer Street, Boston, Massachusetts 02210.
Name, Year of Birth; Principal Occupations and Other Relevant Experience+
Abigail P. Johnson (1961)
Year of Election or Appointment: 2009
Trustee
Chairman of the Board of Trustees
Ms. Johnson also serves as Trustee of other Fidelity® funds. Ms. Johnson serves as President (2013-present) and Chief Executive Officer (2014-present) of FMR LLC (diversified financial services company), President of Fidelity Financial Services (2012-present) and President of Personal, Workplace and Institutional Services (2005-present). Ms. Johnson is Chairman and Director of FMR Co., Inc. (investment adviser firm, 2011-present), Chairman and Director of FMR (investment adviser firm, 2011-present), and the Vice Chairman and Director (2007-present) of FMR LLC. Previously, Ms. Johnson served as President and a Director of FMR (2001-2005), a Trustee of other investment companies advised by FMR, Fidelity Investments Money Management, Inc. (investment adviser firm), and FMR Co., Inc. (2001-2005), Senior Vice President of the Fidelity® funds (2001-2005), and managed a number of Fidelity® funds. Ms. Abigail P. Johnson and Mr. Arthur E. Johnson are not related.
* Determined to be an “Interested Trustee” by virtue of, among other things, his or her affiliation with the trust or various entities under common control with FMR.
+ The information includes the Trustee's principal occupation during the last five years and other information relating to the experience, attributes, and skills relevant to the Trustee's qualifications to serve as a Trustee, which led to the conclusion that the Trustee should serve as a Trustee for the fund.
Independent Trustees:
Correspondence intended for an Independent Trustee may be sent to Fidelity Investments, P.O. Box 55235, Boston, Massachusetts 02205-5235.
Name, Year of Birth; Principal Occupations and Other Relevant Experience+
Albert R. Gamper, Jr. (1942)
Year of Election or Appointment: 2006
Trustee
Mr. Gamper also serves as Trustee of other Fidelity® funds. Prior to his retirement in December 2004, Mr. Gamper served as Chairman of the Board of CIT Group Inc. (commercial finance). During his tenure with CIT Group Inc. Mr. Gamper served in numerous senior management positions, including Chairman (1987-1989; 1999-2001; 2002-2004), Chief Executive Officer (1987-2004), and President (2002-2003). Mr. Gamper currently serves as a member of the Board of Directors of Public Service Enterprise Group (utilities, 2000-present), and Member of the Board of Trustees of Barnabas Health Care System (1997-present). Previously, Mr. Gamper served as Chairman (2012-2015) and Vice Chairman (2011-2012) of the Independent Trustees of certain Fidelity® funds and as Chairman of the Board of Governors, Rutgers University (2004-2007).
Robert F. Gartland (1951)
Year of Election or Appointment: 2010
Trustee
Mr. Gartland also serves as Trustee of other Fidelity® funds. Mr. Gartland is Chairman and an investor in Gartland and Mellina Group Corp. (consulting, 2009-present). Previously, Mr. Gartland served as a partner and investor of Vietnam Partners LLC (investments and consulting, 2008-2011). Prior to his retirement, Mr. Gartland held a variety of positions at Morgan Stanley (financial services, 1979-2007) including Managing Director (1987-2007).
Arthur E. Johnson (1947)
Year of Election or Appointment: 2008
Trustee
Vice Chairman of the Independent Trustees
Mr. Johnson also serves as Trustee of other Fidelity® funds. Mr. Johnson serves as a member of the Board of Directors of Eaton Corporation plc (diversified power management, 2009-present), AGL Resources, Inc. (holding company, 2002-present) and Booz Allen Hamilton (management consulting, 2011-present). Prior to his retirement, Mr. Johnson served as Senior Vice President of Corporate Strategic Development of Lockheed Martin Corporation (defense contractor, 1999-2009). He previously served on the Board of Directors of IKON Office Solutions, Inc. (1999-2008) and Delta Airlines (2005-2007). Mr. Arthur E. Johnson is not related to Ms. Abigail P. Johnson.
Michael E. Kenneally (1954)
Year of Election or Appointment: 2009
Trustee
Mr. Kenneally also serves as Trustee of other Fidelity® funds. Prior to his retirement, Mr. Kenneally served as Chairman and Global Chief Executive Officer of Credit Suisse Asset Management. Before joining Credit Suisse, he was an Executive Vice President and Chief Investment Officer for Bank of America Corporation. Earlier roles at Bank of America included Director of Research, Senior Portfolio Manager and Research Analyst, and Mr. Kenneally was awarded the Chartered Financial Analyst (CFA) designation in 1991.
James H. Keyes (1940)
Year of Election or Appointment: 2007
Trustee
Mr. Keyes also serves as Trustee of other Fidelity® funds. Mr. Keyes serves as a member of the Board and Non-Executive Chairman of Navistar International Corporation (manufacture and sale of trucks, buses, and diesel engines, since 2002). Previously, Mr. Keyes served as a member of the Board of Pitney Bowes, Inc. (integrated mail, messaging, and document management solutions, 1998-2013). Prior to his retirement, Mr. Keyes served as Chairman (1993-2002) and Chief Executive Officer (1988-2002) of Johnson Controls (automotive, building, and energy) and as a member of the Board of LSI Logic Corporation (semiconductor technologies, 1984-2008).
Marie L. Knowles (1946)
Year of Election or Appointment: 2001
Trustee
Chairman of the Independent Trustees
Ms. Knowles also serves as Trustee of other Fidelity® funds. Prior to Ms. Knowles' retirement in June 2000, she served as Executive Vice President and Chief Financial Officer of Atlantic Richfield Company (ARCO) (diversified energy, 1996-2000). From 1993 to 1996, she was a Senior Vice President of ARCO and President of ARCO Transportation Company. She served as a Director of ARCO from 1996 to 1998. Ms. Knowles currently serves as a Director and Chairman of the Audit Committee of McKesson Corporation (healthcare service, since 2002). Ms. Knowles is a member of the Board of the Catalina Island Conservancy and of the Santa Catalina Island Company (2009-present). She also serves as a member of the Advisory Board for the School of Engineering of the University of Southern California. Previously, Ms. Knowles served as a Director of Phelps Dodge Corporation (copper mining and manufacturing, 1994-2007), URS Corporation (engineering and construction, 2000-2003) and America West (airline, 1999-2002). Ms. Knowles previously served as Vice Chairman of the Independent Trustees of certain Fidelity® funds (2012-2015).
+ The information includes the Trustee's principal occupation during the last five years and other information relating to the experience, attributes, and skills relevant to the Trustee's qualifications to serve as a Trustee, which led to the conclusion that the Trustee should serve as a Trustee for the fund.
Advisory Board Members and Officers:
Correspondence intended for a Member of the Advisory Board may be sent to Fidelity Investments, P.O. Box 55235, Boston, Massachusetts 02205-5235. Correspondence intended for an officer may be sent to Fidelity Investments, 245 Summer Street, Boston, Massachusetts 02210. Officers appear below in alphabetical order.
Name, Year of Birth; Principal Occupation
Elizabeth S. Acton (1951)
Year of Election or Appointment: 2013
Member of the Advisory Board
Ms. Acton also serves as Trustee or Member of the Advisory Board of other Fidelity® funds. Prior to her retirement in April 2012, Ms. Acton was Executive Vice President, Finance (2011-2012), Executive Vice President, Chief Financial Officer (2002-2011), and Treasurer (2004-2005) of Comerica Incorporated (financial services). Prior to joining Comerica, Ms. Acton held a variety of positions at Ford Motor Company (1983-2002), including Vice President and Treasurer (2000-2002) and Executive Vice President and Chief Financial Officer of Ford Motor Credit Company (1998-2000). Ms. Acton currently serves as a member of the Board of Directors and Audit and Finance Committees of Beazer Homes USA, Inc. (homebuilding, 2012-present).
John Engler (1948)
Year of Election or Appointment: 2014
Member of the Advisory Board
Mr. Engler also serves as Trustee or Member of the Advisory Board of other Fidelity® funds. He serves as president of the Business Roundtable (2011-present), and on the board of directors/trustees for Universal Forest Products (manufacturer and distributor of wood and wood-alternative products, 2003-present), K12 Inc. (technology-based education company, 2012-present), and the Annie E. Casey Foundation (2004-present). Previously, Mr. Engler served as a trustee of The Munder Funds (2003-2014), president and CEO of the National Association of Manufacturers (2004-2011) and as governor of Michigan (1991-2003). He is a past chairman of the National Governors Association.
Geoffrey A. von Kuhn (1951)
Year of Election or Appointment: 2015
Member of the Advisory Board
Mr. von Kuhn also serves as Trustee or Member of the Advisory Board of other Fidelity funds. Mr. von Kuhn is Chief Administrative Officer for FMR LLC (diversified financial services company, 2013-present), a Director of Pembroke Real Estate, Inc. (2009-present), and a Director of Discovery Natural Resources LLC (2012-present). Previously, Mr. von Kuhn was a managing director of Crosby Group (private wealth management company, 2007-2013), a member of the management committee and senior executive in the Wealth Management Group of AmSouth Bank (2001-2006), and head of the U.S. private bank at Citigroup (2000-2001).
Elizabeth Paige Baumann (1968)
Year of Election or Appointment: 2012
Anti-Money Laundering (AML) Officer
Ms. Baumann also serves as AML Officer of other funds. She is Chief AML Officer of FMR LLC (diversified financial services company, 2012-present) and is an employee of Fidelity Investments. Previously, Ms. Baumann served as Vice President and Deputy Anti-Money Laundering Officer (2007-2012).
Marc R. Bryant (1966)
Year of Election or Appointment: 2015
Secretary and Chief Legal Officer (CLO)
Mr. Bryant also serves as Secretary and CLO of other funds. Mr. Bryant serves as CLO, Secretary, and Senior Vice President of Fidelity Management & Research Company (investment adviser firm, 2015-present) and FMR Co., Inc. (investment adviser firm, 2015-present); Secretary of Fidelity SelectCo, LLC (investment adviser firm, 2015-present) and Fidelity Investments Money Management, Inc. (investment adviser firm, 2015-present); and CLO of Fidelity Management & Research (Hong Kong) Limited (investment adviser firm, 2015-present). He is Senior Vice President and Deputy General Counsel of FMR LLC (diversified financial services company). Previously, Mr. Bryant served as Secretary and Chief Legal Officer of Fidelity Rutland Square Trust II (2010-2014) and Assistant Secretary of Fidelity's Fixed Income and Asset Allocation Funds (2013-2015). Prior to joining Fidelity Investments, Mr. Bryant served as a Senior Vice President and the Head of Global Retail Legal for AllianceBernstein L.P. (2006-2010), and as the General Counsel for ProFund Advisors LLC (2001-2006).
Jonathan Davis (1968)
Year of Election or Appointment: 2010
Assistant Treasurer
Mr. Davis also serves as Assistant Treasurer of other funds, and is an employee of Fidelity Investments. Previously, Mr. Davis served as Vice President and Associate General Counsel of FMR LLC (diversified financial services company, 2003-2010).
Adrien E. Deberghes (1967)
Year of Election or Appointment: 2010
Assistant Treasurer
Mr. Deberghes also serves as an officer of other funds. He is an employee of Fidelity Investments (2008-present). Prior to joining Fidelity Investments, Mr. Deberghes was Senior Vice President of Mutual Fund Administration at State Street Corporation (2007-2008), Senior Director of Mutual Fund Administration at Investors Bank & Trust (2005-2007), and Director of Finance for Dunkin' Brands (2000-2005).
Stephanie J. Dorsey (1969)
Year of Election or Appointment: 2013
President and Treasurer
Ms. Dorsey also serves as an officer of other funds. She is an employee of Fidelity Investments (2008-present) and has served in other fund officer roles. Prior to joining Fidelity Investments, Ms. Dorsey served as Treasurer (2004-2008) of the JPMorgan Mutual Funds and Vice President (2004-2008) of JPMorgan Chase Bank.
Howard J. Galligan III (1966)
Year of Election or Appointment: 2014
Chief Financial Officer
Mr. Galligan also serves as Chief Financial Officer of other funds. Mr. Galligan serves as President of Fidelity Pricing and Cash Management Services (FPCMS) (2014-present) and as a Director of Strategic Advisers, Inc. (investment adviser firm, 2008-present). Previously, Mr. Galligan served as Chief Administrative Officer of Asset Management (2011-2014) and Chief Operating Officer and Senior Vice President of Investment Support for Strategic Advisers, Inc. (2003-2011).
Scott C. Goebel (1968)
Year of Election or Appointment: 2015
Vice President
Mr. Goebel serves as Vice President of other funds and is an employee of Fidelity Investments (2001-present). Previously, Mr. Goebel served as Secretary of Fidelity SelectCo, LLC (investment adviser firm, 2013-2015), Fidelity Investments Money Management, Inc. (FIMM) (investment adviser firm, 2010-2015), and Fidelity Research and Analysis Company (FRAC) (investment adviser firm, 2010-2015); General Counsel, Secretary, and Senior Vice President of Fidelity Management & Research Company (investment adviser firm, 2008-2015) and FMR Co., Inc. (investment adviser firm, 2008-2015); Assistant Secretary of Fidelity Management & Research (Japan) Limited (investment adviser firm, 2008-2015) and FMR Investment Management (U.K.) Limited (investment adviser firm, 2008-2015); Chief Legal Officer (CLO) of Fidelity Management & Research (Hong Kong) Limited (investment adviser firm, 2008-2015); Secretary and CLO of certain Fidelity® funds (2008-2015); Assistant Secretary of FIMM (2008-2010), FRAC (2008-2010), and certain funds (2007-2008); and as Vice President and Secretary of Fidelity Distributors Corporation (FDC) (2005-2007).
Chris Maher (1972)
Year of Election or Appointment: 2013
Assistant Treasurer
Mr. Maher serves as Assistant Treasurer of other funds. Mr. Maher is Vice President of Valuation Oversight and is an employee of Fidelity Investments. Previously, Mr. Maher served as Vice President of Asset Management Compliance (2013), Vice President of the Program Management Group of FMR (investment adviser firm, 2010-2013), and Vice President of Valuation Oversight (2008-2010).
Jason P. Pogorelec (1975)
Year of Election or Appointment: 2015
Assistant Secretary
Mr. Pogorelec also serves as Assistant Secretary of other funds. Mr. Pogorelec serves as Vice President, Associate General Counsel (2010-present) and is an employee of Fidelity Investments (2006-present).
Nancy D. Prior (1967)
Year of Election or Appointment: 2014
Vice President
Ms. Prior also serves as Vice President of other funds. Ms. Prior serves as a Director of Fidelity Investments Money Management, Inc. (FIMM) (investment adviser firm, 2014-present), President, Fixed Income (2014-present), Vice Chairman of FIAM LLC (investment adviser firm, 2014-present), and is an employee of Fidelity Investments (2002-present). Previously, Ms. Prior served as Vice President of Fidelity's Money Market Funds (2012-2014), President, Money Market and Short Duration Bond of FMR (investment adviser firm, 2013-2014), President, Money Market Group of FMR (2011-2014), Managing Director of Research (2009-2011), Senior Vice President and Deputy General Counsel (2007-2009), and Assistant Secretary of other Fidelity® funds (2008-2009).
Kenneth B. Robins (1969)
Year of Election or Appointment: 2009
Assistant Treasurer
Mr. Robins also serves as an officer of other funds. Mr. Robins serves as Executive Vice President of Fidelity Investments Money Management, Inc. (FIMM) (investment adviser firm, 2013-present) and is an employee of Fidelity Investments (2004-present). Previously, Mr. Robins served in other fund officer roles.
Stacie M. Smith (1974)
Year of Election or Appointment: 2013
Assistant Treasurer
Ms. Smith also serves as an officer of other funds. She is an employee of Fidelity Investments (2009-present) and has served in other fund officer roles. Prior to joining Fidelity Investments, Ms. Smith served as Senior Audit Manager of Ernst & Young LLP (1996-2009).
Renee Stagnone (1975)
Year of Election or Appointment: 2013
Deputy Treasurer
Ms. Stagnone also serves as Deputy Treasurer of other funds. Ms. Stagnone is an employee of Fidelity Investments (1997-present).
Christine J. Thompson (1958)
Year of Election or Appointment: 2015
Vice President of Fidelity's Bond Funds
Ms. Thompson also serves as Vice President of other funds. Ms. Thompson also serves as Chief Investment Officer of FMR's Bond Group (2010-present) and is an employee of Fidelity Investments (1985-present). Previously, Ms. Thompson served as Vice President of Fidelity's Bond Funds (2010-2012).
Michael H. Whitaker (1967)
Year of Election or Appointment: 2008
Chief Compliance Officer
Mr. Whitaker also serves as Chief Compliance Officer of other funds. Mr. Whitaker also serves as Compliance Officer of FMR Co., Inc. (investment adviser firm, 2014-present), FMR (investment adviser firm, 2014-present), and Fidelity Investments Money Management, Inc. (investment adviser firm, 2014-present) and is an employee of Fidelity Investments (2007-present). Prior to joining Fidelity Investments, Mr. Whitaker worked at MFS Investment Management where he served as Senior Vice President and Chief Compliance Officer (2004-2006), and Assistant General Counsel.
Joseph F. Zambello (1957)
Year of Election or Appointment: 2011
Deputy Treasurer
Mr. Zambello also serves as Deputy Treasurer of other funds. Mr. Zambello is an employee of Fidelity Investments (1991-present). Previously, Mr. Zambello served as Vice President of the Program Management Group of FMR (investment adviser firm, 2009-2011) and Vice President of the Transfer Agent Oversight Group (2005-2009).
Shareholder Expense Example
As a shareholder of the Fund, you incur two types of costs: (1) transaction costs, including sales charges (loads) on purchase payments or redemption proceeds, and (2) ongoing costs, including management fees, distribution and/or service (12b-1) fees and other Fund expenses. This Example is intended to help you understand your ongoing costs (in dollars) of investing in the Fund and to compare these costs with the ongoing costs of investing in other mutual funds.
The Example is based on an investment of $1,000 invested at the beginning of the period and held for the entire period (May 1, 2015 to October 31, 2015).
Actual Expenses
The first line of the accompanying table for each class of the Fund provides information about actual account values and actual expenses. You may use the information in this line, together with the amount you invested, to estimate the expenses that you paid over the period. Simply divide your account value by $1,000.00 (for example, an $8,600 account value divided by $1,000.00 = 8.6), then multiply the result by the number in the first line for a class of the Fund under the heading entitled "Expenses Paid During Period" to estimate the expenses you paid on your account during this period.
Hypothetical Example for Comparison Purposes
The second line of the accompanying table for each class of the Fund provides information about hypothetical account values and hypothetical expenses based on a Class' actual expense ratio and an assumed rate of return of 5% per year before expenses, which is not the Class' actual return. The hypothetical account values and expenses may not be used to estimate the actual ending account balance or expenses you paid for the period. You may use this information to compare the ongoing costs of investing in the Fund and other funds. To do so, compare this 5% hypothetical example with the 5% hypothetical examples that appear in the shareholder reports of the other funds.
Please note that the expenses shown in the table are meant to highlight your ongoing costs only and do not reflect any transaction costs. Therefore, the second line of the table is useful in comparing ongoing costs only, and will not help you determine the relative total costs of owning different funds. In addition, if these transactional costs were included, your costs would have been higher.
| Annualized Expense Ratio-A | Beginning Account Value May 1, 2015 | Ending Account Value October 31, 2015 | Expenses Paid During Period-B May 1, 2015 to October 31, 2015 | |
| Class A | .80% | |||
| Actual | $1,000.00 | $1,013.30 | $4.06 | |
| Hypothetical-C | $1,000.00 | $1,021.17 | $4.08 | |
| Class T | .78% | |||
| Actual | $1,000.00 | $1,013.40 | $3.96 | |
| Hypothetical-C | $1,000.00 | $1,021.27 | $3.97 | |
| Class B | 1.36% | |||
| Actual | $1,000.00 | $1,009.70 | $6.89 | |
| Hypothetical-C | $1,000.00 | $1,018.35 | $6.92 | |
| Class C | 1.55% | |||
| Actual | $1,000.00 | $1,008.80 | $7.85 | |
| Hypothetical-C | $1,000.00 | $1,017.39 | $7.88 | |
| Class I | .55% | |||
| Actual | $1,000.00 | $1,014.60 | $2.79 | |
| Hypothetical-C | $1,000.00 | $1,022.43 | $2.80 |
A Annualized expense ratio reflects expenses net of applicable fee waivers.
B Expenses are equal to each Class' annualized expense ratio, multiplied by the average account value over the period, multiplied by 184/365 (to reflect the one-half year period).
C 5% return per year before expenses
Distributions (Unaudited)
The Board of Trustees of Fidelity Advisor Municipal Income Fund voted to pay to shareholders of record at the opening of business on record date, the following distributions per share derived from capital gains realized from sales of portfolio securities, and dividends derived from net investment income:
| Pay Date | Record Date | Dividends | Capital Gains | |
| Class A | 12/07/15 | 12/04/15 | $0.000 | $0.098 |
| Class T | 12/07/15 | 12/04/15 | $0.000 | $0.098 |
| Class B | 12/07/15 | 12/04/15 | $0.000 | $0.098 |
| Class C | 12/07/15 | 12/04/15 | $0.000 | $0.098 |
The fund hereby designates as a capital gain dividend with respect to the taxable year ended October 31, 2015, $8,087,225, or, if subsequently determined to be different, the net capital gain of such year.
During fiscal year ended 2015, 100% of the fund's income dividends was free from federal income tax, and 4.22% of the fund's income dividends was subject to the federal alternative minimum tax.
The fund will notify shareholders in January 2016 of amounts for use in preparing 2015 income tax returns.
Board Approval of Investment Advisory Contracts and Management Fees
Fidelity Advisor Municipal Income Fund
Each year, the Board of Trustees, including the Independent Trustees (together, the Board), votes on the renewal of the management contract with Fidelity Management & Research Company (FMR) and the sub-advisory agreements (together, the Advisory Contracts) for the fund. The Board, assisted by the advice of fund counsel and Independent Trustees' counsel, requests and considers a broad range of information relevant to the renewal of the Advisory Contracts throughout the year.
The Board meets regularly and, at each of its meetings, covers an extensive agenda of topics and materials and considers factors that are relevant to its annual consideration of the renewal of the fund's Advisory Contracts, including the services and support provided to the fund and its shareholders. The Board has established four standing committees (Committees) — Operations, Audit, Fair Valuation, and Governance and Nominating — each composed of and chaired by Independent Trustees with varying backgrounds, to which the Board has assigned specific subject matter responsibilities in order to enhance effective decision-making by the Board. The Operations Committee, of which all of the Independent Trustees are members, meets regularly throughout the year and considers, among other matters, information specifically related to the annual consideration of the renewal of the fund's Advisory Contracts. The Board, acting directly and through its Committees, requests and receives information concerning the annual consideration of the renewal of the fund's Advisory Contracts. The Board also meets as needed to consider matters specifically related to the Board's annual consideration of the renewal of the Advisory Contracts. Members of the Board may also meet with trustees of other Fidelity funds through ad hoc joint committees to discuss certain matters relevant to all of the Fidelity funds.
At its September 2015 meeting, the Board unanimously determined to renew the fund's Advisory Contracts. In reaching its determination, the Board considered all factors it believed relevant, including (i) the nature, extent, and quality of the services to be provided to the fund and its shareholders (including the investment performance of the fund); (ii) the competitiveness of the fund's management fee and total expense ratio relative to peer funds; (iii) the total costs of the services to be provided by and the profits to be realized by Fidelity from its relationship with the fund; and (iv) the extent to which (if any) economies of scale exist and would be realized as the fund grows, and whether any economies of scale are appropriately shared with fund shareholders.
In considering whether to renew the Advisory Contracts for the fund, the Board reached a determination, with the assistance of fund counsel and Independent Trustees' counsel and through the exercise of its business judgment, that the renewal of the Advisory Contracts was in the best interests of the fund and its shareholders and that the compensation payable under the Advisory Contracts was fair and reasonable. The Board's decision to renew the Advisory Contracts was not based on any single factor, but rather was based on a comprehensive consideration of all the information provided to the Board at its meetings throughout the year. The Board, in reaching its determination to renew the Advisory Contracts, was aware that shareholders of the fund have a broad range of investment choices available to them, including a wide choice among funds offered by Fidelity's competitors, and that the fund's shareholders, who have the opportunity to review and weigh the disclosure provided by the fund in its prospectus and other public disclosures, have chosen to invest in this fund, which is part of the Fidelity family of funds.
Nature, Extent, and Quality of Services Provided. The Board considered Fidelity's staffing as it relates to the fund, including the backgrounds of investment personnel of Fidelity, and also considered the fund's investment objective, strategies, and related investment philosophy. The Independent Trustees also had discussions with senior management of Fidelity's investment operations and investment groups. The Board considered the structure of the portfolio manager compensation program and whether this structure provides appropriate incentives to act in the best interests of the fund. Additionally, the Board considered the portfolio managers' investments, if any, in the funds that they manage.Resources Dedicated to Investment Management and Support Services. The Board reviewed the general qualifications and capabilities of Fidelity's investment staff, including its size, education, experience, and resources, as well as Fidelity's approach to recruiting, training, managing, and compensating investment personnel. The Board noted that Fidelity has continued to increase the resources devoted to non-U.S. offices, including expansion of Fidelity's global investment organization. The Board also noted that Fidelity's analysts have extensive resources, tools and capabilities that allow them to conduct sophisticated quantitative and fundamental analysis, as well as credit analysis of issuers, counterparties and guarantors. Further, the Board considered that Fidelity's investment professionals have sufficient access to global information and data so as to provide competitive investment results over time, and that those professionals also have access to sophisticated tools that permit them to assess portfolio construction and risk and performance attribution characteristics continuously, as well as to transmit new information and research conclusions rapidly around the world. Additionally, in its deliberations, the Board considered Fidelity's trading, risk management, compliance, and technology and operations capabilities and resources, which are integral parts of the investment management process.Shareholder and Administrative Services. The Board considered (i) the nature, extent, quality, and cost of advisory, administrative, and shareholder services performed by FMR, the sub-advisers (together with FMR, the Investment Advisers), and their affiliates under the Advisory Contracts and under separate agreements covering transfer agency and pricing and bookkeeping services for the fund; (ii) the nature and extent of the supervision of third party service providers, principally custodians, subcustodians, and pricing vendors; and (iii) the resources devoted to, and the record of compliance with, the fund's compliance policies and procedures.The Board noted that the growth of fund assets over time across the complex allows Fidelity to reinvest in the development of services designed to enhance the value or convenience of the Fidelity funds as investment vehicles. These services include 24-hour access to account information and market information through telephone representatives and over the Internet, investor education materials and asset allocation tools, and the expanded availability of Fidelity Investor Centers.Investment in a Large Fund Family. The Board considered the benefits to shareholders of investing in a Fidelity fund, including the benefits of investing in a fund that is part of a large family of funds offering a variety of investment disciplines and providing a large variety of mutual fund investor services. The Board noted that Fidelity had taken, or had made recommendations that resulted in the Fidelity funds taking, a number of actions over the previous year that benefited particular funds, including (i) continuing to dedicate additional resources to investment research and to the support of the senior management team that oversees asset management; (ii) continuing efforts to enhance Fidelity's global research capabilities; (iii) launching new funds and making other enhancements to meet client needs; (iv) reducing management fees and total expenses for certain index funds and diversified international funds; (v) continuing to launch dedicated lower cost underlying funds to meet portfolio construction needs related to expanding underlying fund options for Fidelity funds of funds, specifically for the Freedom Fund product lines; (vi) rationalizing product lines and gaining increased efficiencies through fund mergers; (vii) launching active fixed-income exchange-traded funds; (viii) continuing to develop, acquire and implement systems and technology to improve services to the funds and shareholders, strengthen information security, and increase efficiency; (ix) implementing investment enhancements to further strengthen Fidelity's target date product line to increase investors' probability of success in achieving their goals; (x) modifying the eligibility criteria for certain share classes to accommodate roll-over assets from employer-sponsored retirement plans; (xi) launching a new Class W of the Freedom Index Funds to attract and retain Fidelity record-kept retirement plan assets; and (xii) implementing changes to Fidelity's money market product line in response to recent money market regulatory reforms.Investment Performance. The Board considered whether the fund has operated in accordance with its investment objective, as well as its record of compliance with its investment restrictions and its performance history.The Board took into account discussions with representatives of the Investment Advisers about fund investment performance that occur at Board meetings throughout the year. In this regard the Board noted that as part of regularly scheduled fund reviews and other reports to the Board on fund performance, the Board considers annualized return information for the fund for different time periods, measured against a securities market index ("benchmark index") and a peer group of funds with similar objectives ("peer group"), if any. In its evaluation of fund investment performance at meetings throughout the year, the Board gave particular attention to information indicating underperformance of certain Fidelity funds for specific time periods and discussed with the Investment Advisers the reasons for such underperformance.In addition to reviewing absolute and relative fund performance, the Independent Trustees periodically consider the appropriateness of fund performance metrics in evaluating the results achieved. In general, the Independent Trustees believe that fund performance should be evaluated based on gross performance (before fees and expenses but after transaction costs) compared to appropriate benchmark indices, over appropriate time periods that may include full market cycles, and on net performance (after fees and expenses) compared to peer groups, as applicable, over the same periods, taking into account relevant factors including the following: general market conditions; expectations for interest rate levels and credit conditions; issuer-specific information including credit quality; the potential for incremental return versus the fund's benchmark index weighed against the risks involved in obtaining that incremental return, including the risk of diminished or negative total returns; and fund cash flows and other factors. Depending on the circumstances, the Independent Trustees may be satisfied with a fund's performance notwithstanding that it lags its benchmark index or peer group for certain periods.The Independent Trustees recognize that shareholders evaluate performance on a net basis over their own holding periods, for which one-, three-, and five-year periods are often used as a proxy. For this reason, the performance information reviewed by the Board also included net cumulative calendar year total return information for the fund and an appropriate benchmark index and peer group for the most recent one-, three-, and five-year periods.Based on its review, the Board concluded that the nature, extent, and quality of services provided to the fund under the Advisory Contracts should benefit the shareholders of the fund.Competitiveness of Management Fee and Total Expense Ratio. The Board considered the fund's management fee and total expense ratio compared to "mapped groups" of competitive funds and classes created for the purpose of facilitating the Trustees' competitive analysis of management fees and total expenses. Fidelity creates "mapped groups" by combining similar Lipper investment objective categories that have comparable investment mandates. Combining Lipper investment objective categories aids the Board's management fee and total expense ratio comparisons by broadening the competitive group used for comparison.Management Fee. The Board considered two proprietary management fee comparisons for the 12-month periods shown in basis points (BP) in the chart below. The group of Lipper funds used by the Board for management fee comparisons is referred to below as the "Total Mapped Group" and, for the reasons explained above, is broader than the Lipper peer group used by the Board for performance comparisons. The Total Mapped Group comparison focuses on a fund's standing in terms of gross management fees before expense reimbursements or caps relative to the total universe of funds with comparable investment mandates, regardless of whether their management fee structures also are comparable. Funds with comparable investment mandates offer exposure to similar types of securities. Funds with comparable management fee structures have similar management fee contractual arrangements (e.g., flat rate charged for advisory services, all-inclusive fee rate, etc.). "TMG %" represents the percentage of funds in the Total Mapped Group that had management fees that were lower than the fund's. For example, a hypothetical TMG % of 20% would mean that 80% of the funds in the Total Mapped Group had higher, and 20% had lower, management fees than the fund. The fund's actual TMG %s and the number of funds in the Total Mapped Group are in the chart below. The "Asset-Size Peer Group" (ASPG) comparison focuses on a fund's standing relative to a subset of non-Fidelity funds within the Total Mapped Group that are similar in size and management fee structure. For example, if a fund is in the first quartile of the ASPG, the fund's management fee ranks in the least expensive or lowest 25% of funds in the ASPG. The ASPG represents at least 15% of the funds in the Total Mapped Group with comparable asset size and management fee structures, subject to a minimum of 50 funds (or all funds in the Total Mapped Group if fewer than 50). Additional information, such as the ASPG quartile in which the fund's management fee rate ranked, is also included in the chart and considered by the Board.Fidelity Advisor Municipal Income Fund
![]()
HIM-ANN-1215
1.538412.118
Item 2.
Code of Ethics
As of the end of the period, October 31, 2015 Fidelity Advisor Series II (the trust) has adopted a code of ethics, as defined in Item 2 of Form N-CSR, that applies to its President and Treasurer and its Chief Financial Officer. A copy of the code of ethics is filed as an exhibit to this Form N-CSR.
Item 3.
Audit Committee Financial Expert
The Board of Trustees of the trust has determined that James H. Keyes is an audit committee financial expert, as defined in Item 3 of Form N-CSR. Mr. Keyes is independent for purposes of Item 3 of Form N-CSR.
Item 4.
Principal Accountant Fees and Services
Fees and Services
The following table presents fees billed by PricewaterhouseCoopers LLP (“PwC”) in each of the last two fiscal years for services rendered to Fidelity Advisor Municipal Income Fund (the “Fund”):
Services Billed by PwC
October 31, 2015 FeesA
| Audit Fees | Audit-Related Fees | Tax Fees | All Other Fees |
Fidelity Advisor Municipal Income Fund | $49,000 | $- | $2,300 | $1,900 |
October 31, 2014 FeesA
| Audit Fees | Audit-Related Fees | Tax Fees | All Other Fees |
Fidelity Advisor Municipal Income Fund | $47,000 | $- | $2,400 | $2,000 |
A Amounts may reflect rounding.
The following table presents fees billed by PwC that were required to be approved by the Audit Committee for services that relate directly to the operations and financial reporting of the Fund and that are rendered on behalf of Fidelity Management & Research Company (“FMR”) and entities controlling, controlled by, or under common control with FMR (not including any sub-adviser whose role is primarily portfolio management and is subcontracted with or overseen by another investment adviser) that provide ongoing services to the Fund (“Fund Service Providers”):
Services Billed by PwC
| October 31, 2015A | October 31, 2014A |
Audit-Related Fees | $3,465,000 | $4,430,000 |
Tax Fees | $- | $- |
All Other Fees | $- | $- |
A Amounts may reflect rounding.
“Audit-Related Fees” represent fees billed for assurance and related services that are reasonably related to the performance of the fund audit or the review of the fund's financial statements and that are not reported under Audit Fees.
“Tax Fees” represent fees billed for tax compliance, tax advice or tax planning that relate directly to the operations and financial reporting of the fund.
“All Other Fees” represent fees billed for services provided to the fund or Fund Service Provider, a significant portion of which are assurance related, that relate directly to the operations and financial reporting of the fund, excluding those services that are reported under Audit Fees, Audit-Related Fees or Tax Fees.
Assurance services must be performed by an independent public accountant.
* * *
The aggregate non-audit fees billed by PwC for services rendered to the Fund, FMR (not including any sub-adviser whose role is primarily portfolio management and is subcontracted with or overseen by another investment adviser), and any Fund Service Provider for each of the last two fiscal years of the Fund are as follows:
Billed By | October 31, 2015 A | October 31, 2014 A | |
PwC | $4,770,000 | $5,645,000 | |
A Amounts may reflect rounding.
The trust's Audit Committee has considered non-audit services that were not pre-approved that were provided by PwC to Fund Service Providers to be compatible with maintaining the independence of PwC in its audit of the Fund, taking into account representations from PwC, in accordance with Public Company Accounting Oversight Board rules, regarding its independence from the Fund and its related entities and FMR’s review of the appropriateness and permissibility under applicable law of such non-audit services prior to their provision to the Fund Service Providers.
Audit Committee Pre-Approval Policies and Procedures
The trust’s Audit Committee must pre-approve all audit and non-audit services provided by a fund’s independent registered public accounting firm relating to the operations or financial reporting of the fund. Prior to the commencement of any audit or non-audit services to a fund, the Audit Committee reviews the services to determine whether they are appropriate and permissible under applicable law.
The Audit Committee has adopted policies and procedures to, among other purposes, provide a framework for the Committee’s consideration of non-audit services by the audit
firms that audit the Fidelity funds. The policies and procedures require that any non-audit service provided by a fund audit firm to a Fidelity fund and any non-audit service provided by a fund auditor to a Fund Service Provider that relates directly to the operations and financial reporting of a Fidelity fund (“Covered Service”) are subject to approval by the Audit Committee before such service is provided.
All Covered Services must be approved in advance of provision of the service either: (i) by formal resolution of the Audit Committee, or (ii) by oral or written approval of the service by the Chair of the Audit Committee (or if the Chair is unavailable, such other member of the Audit Committee as may be designated by the Chair to act in the Chair’s absence). The approval contemplated by (ii) above is permitted where the Treasurer determines that action on such an engagement is necessary before the next meeting of the Audit Committee.
Non-audit services provided by a fund audit firm to a Fund Service Provider that do not relate directly to the operations and financial reporting of a Fidelity fund are reported to the Audit Committee on a periodic basis.
Non-Audit Services Approved Pursuant to Rule 2-01(c)(7)(i)(C) and (ii) of Regulation S-X (“De Minimis Exception”)
There were no non-audit services approved or required to be approved by the Audit Committee pursuant to the De Minimis Exception during the Fund’s last two fiscal years relating to services provided to (i) the Fund or (ii) any Fund Service Provider that relate directly to the operations and financial reporting of the Fund.
Item 5.
Audit Committee of Listed Registrants
Not applicable.
Item 6.
Investments
(a)
Not applicable.
(b)
Not applicable
Item 7.
Disclosure of Proxy Voting Policies and Procedures for Closed-End Management Investment Companies
Not applicable.
Item 8.
Portfolio Managers of Closed-End Management Investment Companies
Not applicable.
Item 9.
Purchase of Equity Securities by Closed-End Management Investment Company and Affiliated Purchasers
Not applicable.
Item 10.
Submission of Matters to a Vote of Security Holders
There were no material changes to the procedures by which shareholders may recommend nominees to the trust’s Board of Trustees.
Item 11.
Controls and Procedures
(a)(i) The President and Treasurer and the Chief Financial Officer have concluded that the trust’s disclosure controls and procedures (as defined in Rule 30a-3(c) under the Investment Company Act) provide reasonable assurances that material information relating to the trust is made known to them by the appropriate persons, based on their evaluation of these controls and procedures as of a date within 90 days of the filing date of this report.
(a)(ii) There was no change in the trust’s internal control over financial reporting (as defined in Rule 30a-3(d) under the Investment Company Act) that occurred during the second fiscal quarter of the period covered by this report that has materially affected, or is reasonably likely to materially affect, the trust’s internal control over financial reporting.
Item 12.
Exhibits
(a) | (1) | Code of Ethics pursuant to Item 2 of Form N-CSR is filed and attached hereto as EX-99.CODE ETH. |
(a) | (2) | Certification pursuant to Rule 30a-2(a) under the Investment Company Act of 1940 (17 CFR 270.30a-2(a)) is filed and attached hereto as Exhibit 99.CERT. |
(a) | (3) | Not applicable. |
(b) |
| Certification pursuant to Rule 30a-2(b) under the Investment Company Act of 1940 (17 CFR 270.30a-2(b)) is furnished and attached hereto as Exhibit 99.906CERT. |
SIGNATURES
Pursuant to the requirements of the Securities Exchange Act of 1934 and the Investment Company Act of 1940, the registrant has duly caused this report to be signed on its behalf by the undersigned, thereunto duly authorized.
Fidelity Advisor Series II
By: | /s/ Stephanie J. Dorsey |
| Stephanie J. Dorsey |
| President and Treasurer |
|
|
Date: | December 28, 2015 |
Pursuant to the requirements of the Securities Exchange Act of 1934 and the Investment Company Act of 1940, this report has been signed below by the following persons on behalf of the registrant and in the capacities and on the dates indicated.
By: | /s/Stephanie J. Dorsey |
| Stephanie J. Dorsey |
| President and Treasurer |
|
|
Date: | December 28, 2015 |
By: | /s/Howard J. Galligan III |
| Howard J. Galligan III |
| Chief Financial Officer |
|
|
Date: | December 28, 2015 |