UNITED STATES
SECURITIES AND EXCHANGE COMMISSION
Washington, D.C. 20549
FORM N-CSR
CERTIFIED SHAREHOLDER REPORT OF REGISTERED
MANAGEMENT INVESTMENT COMPANIES
Investment Company Act file number 811-4707
Fidelity Advisor Series II
(Exact name of registrant as specified in charter)
245 Summer St., Boston, MA 02210
(Address of principal executive offices) (Zip code)
Marc Bryant, Secretary
245 Summer St.
Boston, Massachusetts 02210
(Name and address of agent for service)
Registrant's telephone number, including area code:
617-563-7000
| |
Date of fiscal year end: | August 31 |
|
|
Date of reporting period: | February 29, 2016 |
Item 1.
Reports to Stockholders
Fidelity Advisor® Limited Term Bond Fund
Class A, Class T, Class B and Class C
Semi-Annual Report February 29, 2016 |
 |
Contents
To view a fund's proxy voting guidelines and proxy voting record for the 12-month period ended June 30, visit http://www.fidelity.com/proxyvotingresults or visit the Securities and Exchange Commission's (SEC) web site at http://www.sec.gov.
You may also call 1-877-208-0098 to request a free copy of the proxy voting guidelines.
Standard & Poor's, S&P and S&P 500 are registered service marks of The McGraw-Hill Companies, Inc. and have been licensed for use by Fidelity Distributors Corporation.
Other third-party marks appearing herein are the property of their respective owners.
All other marks appearing herein are registered or unregistered trademarks or service marks of FMR LLC or an affiliated company. © 2016 FMR LLC. All rights reserved.
This report and the financial statements contained herein are submitted for the general information of the shareholders of the Fund. This report is not authorized for distribution to prospective investors in the Fund unless preceded or accompanied by an effective prospectus.
A fund files its complete schedule of portfolio holdings with the SEC for the first and third quarters of each fiscal year on Form N-Q. Forms N-Q are available on the SEC’s web site at http://www.sec.gov. A fund's Forms N-Q may be reviewed and copied at the SEC’s Public Reference Room in Washington, DC. Information regarding the operation of the SEC's Public Reference Room may be obtained by calling 1-800-SEC-0330.
For a complete list of a fund's portfolio holdings, view the most recent holdings listing, semiannual report, or annual report on Fidelity's web site at http://www.fidelity.com, http://www.advisor.fidelity.com, or http://www.401k.com, as applicable.
NOT FDIC INSURED •MAY LOSE VALUE •NO BANK GUARANTEE
Neither the Fund nor Fidelity Distributors Corporation is a bank.
Investment Summary (Unaudited)
The information in the following tables is based on the combined investments of the Fund and its pro-rata share of the investments of Fidelity's Fixed-Income Central Funds.
Quality Diversification (% of fund's net assets)
| As of February 29, 2016 |
| | U.S. Government and U.S. Government Agency Obligations | 10.0% |
| | AAA | 14.5% |
| | AA | 3.6% |
| | A | 26.3% |
| | BBB | 38.5% |
| | BB and Below | 6.6% |
| | Not Rated | 0.3% |
| | Short-Term Investments and Net Other Assets | 0.2% |
| As of August 31, 2015 |
| | U.S. Government and U.S. Government Agency Obligations | 7.9% |
| | AAA | 16.1% |
| | AA | 4.3% |
| | A | 27.8% |
| | BBB | 37.0% |
| | BB and Below | 4.7% |
| | Not Rated | 0.1% |
| | Short-Term Investments and Net Other Assets | 2.1% |

We have used ratings from Moody's Investors Service, Inc. Where Moody's® ratings are not available, we have used S&P® ratings. All ratings are as of the date indicated and do not reflect subsequent changes.
Weighted Average Maturity as of February 29, 2016
| | | 6 months ago |
| Years | 2.7 | 2.9 |
This is a weighted average of all the maturities of the securities held in a fund. Weighted Average Maturity (WAM) can be used as a measure of sensitivity to interest rate changes and market changes. Generally, the longer the maturity, the greater the sensitivity to such changes. WAM is based on the dollar-weighted average length of time until principal payments must be paid. Depending on the types of securities held in a fund, certain maturity shortening devices (e.g., demand features, interest rate resets, and call options) may be taken into account when calculating the WAM.
Duration as of February 29, 2016
| | | 6 months ago |
| Years | 2.6 | 2.7 |
Duration is a measure of a security's price sensitivity to changes in interest rates. Duration differs from maturity in that it considers a security's interest payments in addition to the amount of time until the security reaches maturity, and also takes into account certain maturity shortening features (e.g., demand features, interest rate resets, and call options) when applicable. Securities with longer durations generally tend to be more sensitive to interest rate changes than securities with shorter durations. A fund with a longer average duration generally can be expected to be more sensitive to interest rate changes than a fund with a shorter average duration.
Asset Allocation (% of fund's net assets)
| As of February 29, 2016*,** |
| | Corporate Bonds | 70.3% |
| | U.S. Government and U.S. Government Agency Obligations | 10.0% |
| | Asset-Backed Securities | 8.4% |
| | CMOs and Other Mortgage Related Securities | 7.7% |
| | Municipal Bonds | 0.8% |
| | Other Investments | 2.6% |
| | Short-Term Investments and Net Other Assets (Liabilities) | 0.2% |

* Foreign investments - 15.5%
** Futures and Swaps - 0.0%
| As of August 31, 2015*,** |
| | Corporate Bonds | 68.9% |
| | U.S. Government and U.S. Government Agency Obligations | 7.9% |
| | Asset-Backed Securities | 9.4% |
| | CMOs and Other Mortgage Related Securities | 8.5% |
| | Municipal Bonds | 0.4% |
| | Other Investments | 2.8% |
| | Short-Term Investments and Net Other Assets (Liabilities) | 2.1% |

* Foreign investments - 15.6%
** Futures and Swaps - 0.0%
An unaudited holdings listing for the Fund, which presents direct holdings as well as the pro-rata share of any securities and other investments held indirectly through its investment in underlying non-money market Fidelity Central Funds, is available at fidelity.com and/or advisor.fidelity.com, as applicable.
Percentages shown as 0.0% may reflect amounts less than 0.05%.
Investments February 29, 2016 (Unaudited)
Showing Percentage of Net Assets
| Nonconvertible Bonds - 69.7% | | | |
| | | Principal Amount | Value |
| CONSUMER DISCRETIONARY - 6.9% | | | |
| Automobiles - 2.3% | | | |
| American Honda Finance Corp.: | | | |
| 1.2% 7/14/17 | | $5,000,000 | $4,989,465 |
| 1.7% 2/22/19 | | 1,918,000 | 1,920,835 |
| 2.125% 10/10/18 | | 500,000 | 505,172 |
| Daimler Finance North America LLC: | | | |
| 1.375% 8/1/17 (a) | | 2,000,000 | 1,987,328 |
| 1.45% 8/1/16 (a) | | 1,461,000 | 1,461,260 |
| 1.65% 5/18/18 (a) | | 3,000,000 | 2,962,203 |
| 2.25% 3/2/20 (a) | | 3,020,000 | 2,975,839 |
| 2.375% 8/1/18 (a) | | 1,000,000 | 1,005,376 |
| General Motors Financial Co., Inc.: | | | |
| 2.4% 4/10/18 | | 3,000,000 | 2,947,344 |
| 3% 9/25/17 | | 3,000,000 | 3,002,646 |
| 3.15% 1/15/20 | | 5,000,000 | 4,885,795 |
| 3.2% 7/13/20 | | 5,000,000 | 4,833,350 |
| 4.2% 3/1/21 | | 3,000,000 | 3,004,503 |
| Volkswagen Group of America Finance LLC: | | | |
| 1.25% 5/23/17 (a) | | 1,000,000 | 982,470 |
| 2.4% 5/22/20 (a) | | 3,098,000 | 2,937,582 |
| Volkswagen International Finance NV: | | | |
| 1.6% 11/20/17 (a) | | 620,000 | 607,431 |
| 2.125% 11/20/18 (a) | | 1,500,000 | 1,451,678 |
| 2.375% 3/22/17 (a) | | 600,000 | 599,731 |
| | | | 43,060,008 |
| Diversified Consumer Services - 0.0% | | | |
| Ingersoll-Rand Global Holding Co. Ltd. 6.875% 8/15/18 | | 1,020,000 | 1,126,623 |
| Hotels, Restaurants & Leisure - 0.3% | | | |
| McDonald's Corp.: | | | |
| 2.1% 12/7/18 | | 742,000 | 751,582 |
| 2.2% 5/26/20 | | 5,000,000 | 5,046,465 |
| 2.75% 12/9/20 | | 345,000 | 355,023 |
| | | | 6,153,070 |
| Household Durables - 0.4% | | | |
| D.R. Horton, Inc.: | | | |
| 3.75% 3/1/19 | | 2,000,000 | 2,035,000 |
| 4% 2/15/20 | | 3,000,000 | 3,052,500 |
| Toll Brothers Finance Corp. 4% 12/31/18 | | 2,500,000 | 2,556,250 |
| | | | 7,643,750 |
| Media - 3.9% | | | |
| 21st Century Fox America, Inc. 6.9% 3/1/19 | | 750,000 | 851,442 |
| British Sky Broadcasting Group PLC 2.625% 9/16/19 (a) | | 3,000,000 | 3,011,283 |
| CBS Corp. 2.3% 8/15/19 | | 1,500,000 | 1,507,266 |
| Charter Communications Operating LLC/Charter Communications Operating Capital Corp. 3.579% 7/23/20 (a) | | 10,000,000 | 10,024,900 |
| Comcast Corp.: | | | |
| 5.7% 5/15/18 | | 42,000 | 45,824 |
| 6.3% 11/15/17 | | 6,000,000 | 6,491,640 |
| COX Communications, Inc. 6.25% 6/1/18 (a) | | 4,000,000 | 4,283,500 |
| DIRECTV Holdings LLC/DIRECTV Financing, Inc.: | | | |
| 2.4% 3/15/17 | | 2,700,000 | 2,726,544 |
| 5.875% 10/1/19 | | 5,034,000 | 5,631,294 |
| Discovery Communications LLC 5.05% 6/1/20 | | 322,000 | 337,086 |
| NBCUniversal Enterprise, Inc. 1.974% 4/15/19 (a) | | 3,000,000 | 3,018,849 |
| Thomson Reuters Corp.: | | | |
| 0.875% 5/23/16 | | 278,000 | 277,708 |
| 1.65% 9/29/17 | | 5,050,000 | 5,028,633 |
| Time Warner Cable, Inc.: | | | |
| 5.85% 5/1/17 | | 4,996,000 | 5,187,806 |
| 6.75% 7/1/18 | | 1,141,000 | 1,243,342 |
| 8.25% 4/1/19 | | 500,000 | 571,677 |
| Time Warner, Inc.: | | | |
| 2.1% 6/1/19 | | 2,000,000 | 1,982,546 |
| 6.875% 6/15/18 | | 5,095,000 | 5,642,483 |
| Viacom, Inc.: | | | |
| 2.2% 4/1/19 | | 6,000,000 | 5,887,974 |
| 3.5% 4/1/17 | | 455,000 | 459,508 |
| 6.125% 10/5/17 | | 3,179,000 | 3,337,079 |
| Walt Disney Co. 1.85% 5/30/19 | | 6,000,000 | 6,110,034 |
| | | | 73,658,418 |
|
| TOTAL CONSUMER DISCRETIONARY | | | 131,641,869 |
|
| CONSUMER STAPLES - 6.1% | | | |
| Beverages - 1.1% | | | |
| Anheuser-Busch InBev Finance, Inc.: | | | |
| 1.9% 2/1/19 | | 5,000,000 | 5,047,390 |
| 2.15% 2/1/19 | | 1,500,000 | 1,521,384 |
| 2.65% 2/1/21 | | 3,890,000 | 3,959,207 |
| 3.3% 2/1/23 | | 4,190,000 | 4,307,245 |
| Heineken NV 1.4% 10/1/17 (a) | | 321,000 | 320,893 |
| PepsiCo, Inc. 7.9% 11/1/18 | | 815,000 | 948,238 |
| SABMiller Holdings, Inc.: | | | |
| 2.2% 8/1/18 (a) | | 2,310,000 | 2,322,703 |
| 2.45% 1/15/17 (a) | | 1,280,000 | 1,290,098 |
| | | | 19,717,158 |
| Food & Staples Retailing - 1.1% | | | |
| CVS Health Corp.: | | | |
| 1.9% 7/20/18 | | 1,549,000 | 1,555,249 |
| 2.25% 12/5/18 | | 8,376,000 | 8,462,742 |
| 2.25% 8/12/19 | | 5,000,000 | 5,058,430 |
| 2.8% 7/20/20 | | 1,496,000 | 1,531,983 |
| Kroger Co. 1.1496% 10/17/16 (b) | | 5,000,000 | 5,002,120 |
| | | | 21,610,524 |
| Food Products - 1.8% | | | |
| Cargill, Inc. 6% 11/27/17 (a) | | 106,000 | 113,511 |
| ConAgra Foods, Inc. 1.9% 1/25/18 | | 2,222,000 | 2,220,116 |
| General Mills, Inc.: | | | |
| 1.4% 10/20/17 | | 3,000,000 | 3,000,747 |
| 2.2% 10/21/19 | | 2,000,000 | 2,020,428 |
| 5.7% 2/15/17 | | 5,000,000 | 5,216,580 |
| Kraft Foods Group, Inc.: | | | |
| 2.25% 6/5/17 | | 610,000 | 614,731 |
| 5.375% 2/10/20 | | 5,000,000 | 5,533,035 |
| The J.M. Smucker Co.: | | | |
| 1.75% 3/15/18 | | 5,874,000 | 5,855,291 |
| 2.5% 3/15/20 | | 1,964,000 | 1,980,482 |
| Tyson Foods, Inc. 2.65% 8/15/19 | | 7,000,000 | 7,094,591 |
| William Wrigley Jr. Co. 2% 10/20/17 (a) | | 428,000 | 429,018 |
| | | | 34,078,530 |
| Tobacco - 2.1% | | | |
| Altria Group, Inc. 2.625% 1/14/20 | | 5,000,000 | 5,093,715 |
| BAT International Finance PLC: | | | |
| 1.85% 6/15/18 (a) | | 7,000,000 | 7,028,826 |
| 2.75% 6/15/20 (a) | | 3,160,000 | 3,227,204 |
| Imperial Tobacco Finance PLC: | | | |
| 2.05% 2/11/18 (a) | | 1,906,000 | 1,904,205 |
| 2.05% 7/20/18 (a) | | 2,866,000 | 2,852,217 |
| 2.95% 7/21/20 (a) | | 3,000,000 | 3,042,849 |
| Philip Morris International, Inc.: | | | |
| 1.25% 8/11/17 | | 2,907,000 | 2,913,686 |
| 1.875% 1/15/19 | | 2,641,000 | 2,672,975 |
| 2.15% 2/25/21 | | 3,088,000 | 3,069,932 |
| Reynolds American, Inc.: | | | |
| 2.3% 6/12/18 | | 5,704,000 | 5,764,970 |
| 3.25% 6/12/20 | | 1,162,000 | 1,208,456 |
| 4% 6/12/22 | | 1,077,000 | 1,162,732 |
| 6.75% 6/15/17 | | 513,000 | 550,695 |
| | | | 40,492,462 |
|
| TOTAL CONSUMER STAPLES | | | 115,898,674 |
|
| ENERGY - 6.4% | | | |
| Energy Equipment & Services - 1.2% | | | |
| DCP Midstream LLC 5.35% 3/15/20 (a) | | 6,738,000 | 5,074,105 |
| El Paso Pipeline Partners Operating Co. LLC 6.5% 4/1/20 | | 768,000 | 775,116 |
| Halliburton Co. 2.7% 11/15/20 | | 10,247,000 | 10,100,007 |
| Nabors Industries, Inc. 2.35% 9/15/16 | | 257,000 | 254,406 |
| National Oilwell Varco, Inc. 1.35% 12/1/17 | | 620,000 | 601,065 |
| Noble Holding International Ltd.: | | | |
| 2.5% 3/15/17 | | 2,062,000 | 1,972,447 |
| 4% 3/16/18 | | 102,000 | 81,600 |
| Petrofac Ltd. 3.4% 10/10/18 (a) | | 1,000,000 | 848,196 |
| Transocean, Inc. 3% 10/15/17 (b) | | 3,500,000 | 3,150,000 |
| | | | 22,856,942 |
| Oil, Gas & Consumable Fuels - 5.2% | | | |
| Anadarko Petroleum Corp.: | | | |
| 5.95% 9/15/16 | | 45,000 | 45,258 |
| 6.375% 9/15/17 | | 555,000 | 563,897 |
| BG Energy Capital PLC 2.875% 10/15/16 (a) | | 620,000 | 623,156 |
| BP Capital Markets PLC: | | | |
| 1.375% 5/10/18 | | 5,000,000 | 4,900,130 |
| 2.248% 11/1/16 | | 620,000 | 623,230 |
| 2.521% 1/15/20 | | 4,688,000 | 4,602,936 |
| Canadian Natural Resources Ltd. 1.75% 1/15/18 | | 415,000 | 379,270 |
| Cenovus Energy, Inc. 5.7% 10/15/19 | | 297,000 | 262,092 |
| Chevron Corp. 1.961% 3/3/20 | | 4,000,000 | 3,945,772 |
| Columbia Pipeline Group, Inc.: | | | |
| 2.45% 6/1/18 (a) | | 2,107,000 | 2,021,527 |
| 3.3% 6/1/20 (a) | | 1,439,000 | 1,347,461 |
| ConocoPhillips Co.: | | | |
| 1.5% 5/15/18 | | 4,373,000 | 4,174,816 |
| 2.2% 5/15/20 | | 1,962,000 | 1,813,934 |
| DCP Midstream Operating LP: | | | |
| 2.5% 12/1/17 | | 292,000 | 266,520 |
| 2.7% 4/1/19 | | 821,000 | 673,348 |
| Devon Energy Corp. 2.25% 12/15/18 | | 3,484,000 | 3,036,045 |
| El Paso Natural Gas Co. 5.95% 4/15/17 | | 21,000 | 21,247 |
| Enable Midstream Partners LP 2.4% 5/15/19 | | 174,000 | 134,048 |
| Enbridge, Inc. 0.8662% 6/2/17 (b) | | 2,613,000 | 2,497,215 |
| Encana Corp. 6.5% 5/15/19 | | 5,000,000 | 4,106,895 |
| EnLink Midstream Partners LP 2.7% 4/1/19 | | 785,000 | 612,715 |
| Enterprise Products Operating LP: | | | |
| 1.65% 5/7/18 | | 3,631,000 | 3,508,058 |
| 2.55% 10/15/19 | | 178,000 | 172,265 |
| Exxon Mobil Corp.: | | | |
| 2.25% 3/1/21 | | 3,780,000 | 3,780,000 |
| 2.75% 3/1/23 | | 2,954,000 | 2,954,000 |
| Gulfstream Natural Gas System LLC 6.95% 6/1/16 (a) | | 20,000 | 20,233 |
| Kinder Morgan Energy Partners LP 2.65% 2/1/19 | | 1,737,000 | 1,624,635 |
| Kinder Morgan, Inc.: | | | |
| 2% 12/1/17 | | 393,000 | 375,315 |
| 3.05% 12/1/19 | | 3,758,000 | 3,469,198 |
| Marathon Petroleum Corp.: | | | |
| 2.7% 12/14/18 | | 436,000 | 422,271 |
| 3.5% 3/1/16 | | 875,000 | 875,000 |
| Petro-Canada 6.05% 5/15/18 | | 3,326,000 | 3,402,714 |
| Petrobras Global Finance BV 3.25% 3/17/17 | | 3,500,000 | 3,391,500 |
| Petrobras International Finance Co. Ltd. 5.875% 3/1/18 | | 3,000,000 | 2,814,150 |
| Petroleos Mexicanos: | | | |
| 3.125% 1/23/19 | | 77,000 | 74,866 |
| 3.5% 7/18/18 | | 5,000,000 | 4,962,500 |
| 3.5% 7/23/20 (a) | | 1,355,000 | 1,277,088 |
| 5.5% 2/4/19 (a) | | 2,000,000 | 2,068,000 |
| 6.375% 2/4/21 (a) | | 2,000,000 | 2,079,500 |
| Phillips 66 Co. 2.95% 5/1/17 | | 1,260,000 | 1,275,823 |
| Plains All American Pipeline LP/PAA Finance Corp.: | | | |
| 2.6% 12/15/19 | | 3,000,000 | 2,662,155 |
| 5.75% 1/15/20 | | 962,000 | 927,449 |
| Schlumberger Investment SA 1.25% 8/1/17 (a) | | 1,000,000 | 982,971 |
| Shell International Finance BV 2.125% 5/11/20 | | 2,287,000 | 2,227,234 |
| Southwestern Energy Co.: | | | |
| 3.3% 1/23/18 | | 2,476,000 | 1,782,720 |
| 4.05% 1/23/20 | | 864,000 | 557,280 |
| Spectra Energy Capital, LLC 5.65% 3/1/20 | | 28,000 | 27,963 |
| Spectra Energy Partners, LP 2.95% 9/25/18 | | 90,000 | 88,608 |
| Suncor Energy, Inc. 6.1% 6/1/18 | | 944,000 | 968,638 |
| Total Capital International SA 2.125% 1/10/19 | | 2,000,000 | 1,994,442 |
| TransCanada PipeLines Ltd.: | | | |
| 1.4111% 1/12/18 (b) | | 2,500,000 | 2,454,215 |
| 1.625% 11/9/17 | | 3,000,000 | 2,947,137 |
| 1.875% 1/12/18 | | 3,000,000 | 2,942,763 |
| 3.125% 1/15/19 | | 1,693,000 | 1,703,783 |
| Transcontinental Gas Pipe Line Corp. 6.4% 4/15/16 | | 394,000 | 394,288 |
| Western Gas Partners LP: | | | |
| 2.6% 8/15/18 | | 1,257,000 | 1,098,480 |
| 5.375% 6/1/21 | | 600,000 | 512,543 |
| | | | 99,471,297 |
|
| TOTAL ENERGY | | | 122,328,239 |
|
| FINANCIALS - 33.4% | | | |
| Banks - 16.2% | | | |
| ABN AMRO Bank NV 2.5% 10/30/18 (a) | | 4,000,000 | 4,036,288 |
| Australia & New Zealand Banking Group Ltd.: | | | |
| 1.45% 5/15/18 | | 570,000 | 566,226 |
| 2.25% 6/13/19 | | 2,000,000 | 2,008,374 |
| Banco Nacional de Desenvolvimento Economico e Social: | | | |
| 3.375% 9/26/16 (a) | | 520,000 | 518,700 |
| 4% 4/14/19 (a) | | 2,575,000 | 2,369,000 |
| 6.369% 6/16/18(a) | | 962,000 | 967,291 |
| Bank of America Corp.: | | | |
| 1.7% 8/25/17 | | 4,428,000 | 4,406,537 |
| 2% 1/11/18 | | 11,200,000 | 11,160,733 |
| 2.25% 4/21/20 | | 6,000,000 | 5,880,714 |
| 2.6% 1/15/19 | | 7,495,000 | 7,530,421 |
| 2.65% 4/1/19 | | 7,100,000 | 7,136,210 |
| 5.75% 12/1/17 | | 1,150,000 | 1,219,627 |
| Bank of Nova Scotia 2.8% 7/21/21 | | 2,000,000 | 2,037,454 |
| Bank of Tokyo-Mitsubishi UFJ Ltd.: | | | |
| 1.65% 2/26/18 (a) | | 590,000 | 587,812 |
| 2.3% 3/5/20 (a) | | 3,000,000 | 2,979,918 |
| 2.35% 9/8/19 (a) | | 3,050,000 | 3,070,072 |
| 2.7% 9/9/18 (a) | | 500,000 | 507,476 |
| Barclays PLC: | | | |
| 2% 3/16/18 | | 5,000,000 | 4,902,945 |
| 2.75% 11/8/19 | | 2,831,000 | 2,779,985 |
| 2.875% 6/8/20 | | 3,000,000 | 2,875,242 |
| 3.25% 1/12/21 | | 2,046,000 | 1,972,520 |
| BNP Paribas 2.375% 9/14/17 | | 6,000,000 | 6,057,180 |
| BNP Paribas SA 2.375% 5/21/20 | | 3,000,000 | 2,963,892 |
| BPCE SA: | | | |
| 1.625% 2/10/17 | | 450,000 | 449,508 |
| 2.5% 7/15/19 | | 2,000,000 | 2,012,936 |
| Capital One NA: | | | |
| 2.35% 8/17/18 | | 500,000 | 497,679 |
| 2.4% 9/5/19 | | 2,000,000 | 1,973,672 |
| CIT Group, Inc. 3.875% 2/19/19 | | 5,090,000 | 5,064,550 |
| Citigroup, Inc.: | | | |
| 0.747% 6/9/16 (b) | | 3,000,000 | 2,995,281 |
| 1.55% 8/14/17 | | 2,000,000 | 1,989,300 |
| 1.7% 4/27/18 | | 1,500,000 | 1,484,054 |
| 1.75% 5/1/18 | | 2,870,000 | 2,841,601 |
| 1.85% 11/24/17 | | 3,000,000 | 2,990,352 |
| 2.15% 7/30/18 | | 2,000,000 | 1,992,866 |
| 2.4% 2/18/20 | | 4,000,000 | 3,964,536 |
| 2.5% 9/26/18 | | 1,500,000 | 1,509,650 |
| 2.5% 7/29/19 | | 2,000,000 | 2,004,824 |
| 2.55% 4/8/19 | | 3,000,000 | 3,009,075 |
| 2.65% 10/26/20 | | 3,000,000 | 2,995,935 |
| 4.4% 6/10/25 | | 2,604,000 | 2,596,412 |
| Citizens Bank NA: | | | |
| 2.3% 12/3/18 | | 1,384,000 | 1,385,749 |
| 2.45% 12/4/19 | | 3,000,000 | 2,976,399 |
| Comerica, Inc. 2.125% 5/23/19 | | 345,000 | 339,321 |
| Commonwealth Bank of Australia: | | | |
| 2.25% 3/13/19 | | 750,000 | 755,015 |
| 2.3% 9/6/19 | | 2,000,000 | 2,013,424 |
| Cooperatieve Centrale Raiffeisen-Boerenleenbank BA 1.7% 3/19/18 | | 2,000,000 | 1,997,872 |
| Credit Agricole SA 2.75% 6/10/20 (a) | | 8,000,000 | 8,052,856 |
| Credit Suisse AG 6% 2/15/18 | | 3,680,000 | 3,896,012 |
| Credit Suisse New York Branch: | | | |
| 1.75% 1/29/18 | | 2,000,000 | 1,987,596 |
| 2.3% 5/28/19 | | 5,750,000 | 5,703,437 |
| 3% 10/29/21 | | 1,500,000 | 1,501,599 |
| Discover Bank: | | | |
| 2% 2/21/18 | | 5,920,000 | 5,848,623 |
| 2.6% 11/13/18 | | 2,000,000 | 1,997,984 |
| Fifth Third Bancorp: | | | |
| 2.3% 3/1/19 | | 279,000 | 279,360 |
| 2.875% 7/27/20 | | 3,200,000 | 3,225,056 |
| 4.5% 6/1/18 | | 3,024,000 | 3,182,355 |
| 5.45% 1/15/17 | | 291,000 | 300,530 |
| Fifth Third Bank 2.375% 4/25/19 | | 1,000,000 | 1,004,531 |
| First Horizon National Corp. 3.5% 12/15/20 | | 3,000,000 | 2,978,658 |
| HBOS PLC 6.75% 5/21/18 (a) | | 509,000 | 547,333 |
| HSBC Bank PLC 1.5% 5/15/18 (a) | | 1,570,000 | 1,560,379 |
| HSBC U.S.A., Inc.: | | | |
| 2.375% 11/13/19 | | 3,000,000 | 2,968,404 |
| 2.625% 9/24/18 | | 262,000 | 263,510 |
| Huntington Bancshares, Inc. 7% 12/15/20 | | 180,000 | 213,584 |
| Huntington National Bank 2.2% 4/1/19 | | 1,000,000 | 991,448 |
| ING Bank NV 1.8% 3/16/18 (a) | | 3,000,000 | 2,994,819 |
| Intesa Sanpaolo SpA 2.375% 1/13/17 | | 10,750,000 | 10,784,121 |
| JPMorgan Chase & Co.: | | | |
| 1.35% 2/15/17 | | 2,500,000 | 2,500,718 |
| 1.625% 5/15/18 | | 4,500,000 | 4,477,964 |
| 2% 8/15/17 | | 4,500,000 | 4,520,547 |
| 2.2% 10/22/19 | | 10,058,000 | 10,052,247 |
| 2.25% 1/23/20 | | 3,000,000 | 2,993,340 |
| 2.35% 1/28/19 | | 1,942,000 | 1,961,261 |
| 2.55% 10/29/20 | | 3,000,000 | 3,006,915 |
| 2.75% 6/23/20 | | 3,000,000 | 3,032,724 |
| KeyCorp. 2.3% 12/13/18 | | 2,000,000 | 2,000,810 |
| La Caisse Centrale 1.75% 1/29/18 (a) | | 4,000,000 | 3,971,088 |
| Lloyds Bank PLC 1.75% 3/16/18 | | 3,000,000 | 2,985,951 |
| Manufacturers & Traders Trust Co. 2.1% 2/6/20 | | 3,000,000 | 2,958,391 |
| Mitsubishi UFJ Financial Group, Inc. 2.95% 3/1/21 | | 4,000,000 | 4,035,252 |
| Mizuho Bank Ltd.: | | | |
| 1.55% 10/17/17 (a) | | 1,940,000 | 1,928,211 |
| 1.8% 3/26/18 (a) | | 1,500,000 | 1,492,547 |
| 2.45% 4/16/19 (a) | | 1,400,000 | 1,409,345 |
| 2.65% 9/25/19 (a) | | 2,000,000 | 2,027,798 |
| MUFG Americas Holdings Corp. 2.25% 2/10/20 | | 1,241,000 | 1,225,025 |
| Nordea Bank AB 2.375% 4/4/19 (a) | | 1,000,000 | 1,007,280 |
| PNC Bank NA: | | | |
| 1.5% 2/23/18 | | 2,100,000 | 2,094,303 |
| 1.8% 11/5/18 | | 2,000,000 | 1,999,910 |
| 2.4% 10/18/19 | | 3,000,000 | 3,041,841 |
| Regions Financial Corp.: | | | |
| 2% 5/15/18 | | 5,330,000 | 5,282,739 |
| 3.2% 2/8/21 | | 4,000,000 | 3,980,616 |
| Royal Bank of Canada: | | | |
| 1.5% 1/16/18 | | 2,720,000 | 2,716,176 |
| 4.65% 1/27/26 | | 2,144,000 | 2,162,595 |
| Royal Bank of Scotland Group PLC 1.5431% 3/31/17 (b) | | 8,715,000 | 8,687,260 |
| Sumitomo Mitsui Banking Corp.: | | | |
| 1.8% 7/18/17 | | 940,000 | 941,262 |
| 2.25% 7/11/19 | | 3,500,000 | 3,502,478 |
| 2.45% 1/10/19 | | 590,000 | 595,455 |
| 2.45% 1/16/20 | | 3,000,000 | 3,001,353 |
| 2.65% 7/23/20 | | 3,000,000 | 3,029,907 |
| SunTrust Banks, Inc.: | | | |
| 2.35% 11/1/18 | | 924,000 | 926,272 |
| 2.5% 5/1/19 | | 550,000 | 552,672 |
| 3% 3/3/21 | | 2,828,000 | 2,821,863 |
| 3.5% 1/20/17 | | 1,378,000 | 1,401,239 |
| Svenska Handelsbanken AB 1.625% 3/21/18 | | 2,000,000 | 1,994,100 |
| The Toronto-Dominion Bank: | | | |
| 2.25% 11/5/19 | | 2,000,000 | 2,022,318 |
| 2.625% 9/10/18 | | 1,200,000 | 1,223,944 |
| Wells Fargo & Co.: | | | |
| 1.5% 1/16/18 | | 1,300,000 | 1,297,769 |
| 2.15% 1/15/19 | | 5,500,000 | 5,538,621 |
| 2.6% 7/22/20 | | 3,000,000 | 3,034,137 |
| | | | 308,093,067 |
| Capital Markets - 4.5% | | | |
| Deutsche Bank AG London Branch: | | | |
| 1.4% 2/13/17 | | 1,000,000 | 993,530 |
| 2.5% 2/13/19 | | 2,250,000 | 2,201,945 |
| Goldman Sachs Group, Inc.: | | | |
| 1.312% 12/15/17 (b) | | 3,000,000 | 2,986,422 |
| 2.375% 1/22/18 | | 8,850,000 | 8,903,658 |
| 2.625% 1/31/19 | | 13,000,000 | 13,098,852 |
| 5.95% 1/18/18 | | 1,693,000 | 1,805,222 |
| 6.15% 4/1/18 | | 402,000 | 433,292 |
| Lazard Group LLC: | | | |
| 4.25% 11/14/20 | | 543,000 | 557,173 |
| 6.85% 6/15/17 | | 125,000 | 131,425 |
| Legg Mason, Inc. 2.7% 7/15/19 | | 2,000,000 | 2,027,170 |
| Merrill Lynch & Co., Inc.: | | | |
| 6.4% 8/28/17 | | 40,000 | 42,433 |
| 6.875% 4/25/18 | | 726,000 | 792,950 |
| Morgan Stanley: | | | |
| 1.875% 1/5/18 | | 2,000,000 | 1,995,018 |
| 2.125% 4/25/18 | | 3,580,000 | 3,578,965 |
| 2.375% 7/23/19 | | 9,660,000 | 9,638,941 |
| 2.5% 1/24/19 | | 1,750,000 | 1,759,051 |
| 2.65% 1/27/20 | | 11,000,000 | 10,983,522 |
| 4.75% 3/22/17 | | 2,000,000 | 2,065,596 |
| 4.875% 11/1/22 | | 2,000,000 | 2,108,646 |
| 5.5% 1/26/20 | | 2,000,000 | 2,197,642 |
| 5.625% 9/23/19 | | 112,000 | 122,919 |
| 5.95% 12/28/17 | | 383,000 | 408,970 |
| 7.3% 5/13/19 | | 603,000 | 689,615 |
| UBS AG Stamford Branch: | | | |
| 1.3031% 3/26/18 (b) | | 3,000,000 | 2,992,602 |
| 1.375% 6/1/17 | | 5,675,000 | 5,660,688 |
| 1.375% 8/14/17 | | 6,700,000 | 6,674,969 |
| | | | 84,851,216 |
| Consumer Finance - 4.4% | | | |
| Ally Financial, Inc.: | | | |
| 3.25% 2/13/18 | | 3,000,000 | 2,970,000 |
| 3.25% 11/5/18 | | 3,000,000 | 2,947,500 |
| American Express Co. 1.55% 5/22/18 | | 3,000,000 | 2,968,890 |
| American Express Credit Corp. 2.125% 3/18/19 | | 5,520,000 | 5,521,932 |
| American Honda Finance Corp. 1.5% 9/11/17 (a) | | 620,000 | 620,854 |
| Capital One Financial Corp. 2.45% 4/24/19 | | 5,450,000 | 5,449,995 |
| Discover Financial Services 6.45% 6/12/17 | | 3,381,000 | 3,545,655 |
| Ford Motor Credit Co. LLC: | | | |
| 1.461% 3/27/17 | | 2,000,000 | 1,986,500 |
| 1.684% 9/8/17 | | 1,000,000 | 985,346 |
| 2.145% 1/9/18 | | 2,500,000 | 2,487,068 |
| 2.24% 6/15/18 | | 6,000,000 | 5,913,252 |
| 2.597% 11/4/19 | | 5,000,000 | 4,926,150 |
| 2.875% 10/1/18 | | 2,500,000 | 2,501,283 |
| 3% 6/12/17 | | 4,500,000 | 4,537,733 |
| 3.157% 8/4/20 | | 3,000,000 | 2,987,739 |
| General Electric Capital Corp. 2.2% 1/9/20 | | 2,577,000 | 2,628,682 |
| Hyundai Capital America: | | | |
| 1.45% 2/6/17 (a) | | 632,000 | 629,895 |
| 2% 3/19/18 (a) | | 1,891,000 | 1,882,540 |
| 2.125% 10/2/17 (a) | | 2,437,000 | 2,438,972 |
| 2.55% 2/6/19 (a) | | 4,759,000 | 4,773,653 |
| 2.6% 3/19/20 (a) | | 2,000,000 | 2,001,038 |
| 2.875% 8/9/18 (a) | | 2,606,000 | 2,625,584 |
| John Deere Capital Corp. 1.6% 7/13/18 | | 590,000 | 590,660 |
| Synchrony Financial: | | | |
| 1.875% 8/15/17 | | 173,000 | 171,112 |
| 2.6% 1/15/19 | | 3,000,000 | 2,975,190 |
| 2.7% 2/3/20 | | 2,500,000 | 2,450,305 |
| 3% 8/15/19 | | 3,000,000 | 3,004,803 |
| Toyota Motor Credit Corp.: | | | |
| 1.55% 7/13/18 | | 5,000,000 | 5,000,930 |
| 2% 10/24/18 | | 2,500,000 | 2,526,355 |
| | | | 84,049,616 |
| Diversified Financial Services - 1.4% | | | |
| AIG Global Funding 1.65% 12/15/17 (a) | | 2,000,000 | 1,995,132 |
| Berkshire Hathaway Finance Corp. 1.6% 5/15/17 | | 620,000 | 624,668 |
| Brixmor Operating Partnership LP 3.875% 8/15/22 | | 1,161,000 | 1,079,701 |
| GE Capital International Funding Co. 2.342% 11/15/20 (a) | | 11,630,000 | 11,747,835 |
| IntercontinentalExchange, Inc.: | | | |
| 2.5% 10/15/18 | | 347,000 | 351,491 |
| 2.75% 12/1/20 | | 619,000 | 629,216 |
| McGraw Hill Financial, Inc. 2.5% 8/15/18 | | 1,049,000 | 1,054,303 |
| Moody's Corp. 2.75% 7/15/19 | | 8,000,000 | 8,153,616 |
| | | | 25,635,962 |
| Insurance - 3.9% | | | |
| ACE INA Holdings, Inc. 2.3% 11/3/20 | | 1,173,000 | 1,179,925 |
| AFLAC, Inc. 2.4% 3/16/20 | | 6,000,000 | 6,061,296 |
| AIA Group Ltd. 2.25% 3/11/19 (a) | | 3,529,000 | 3,531,064 |
| American International Group, Inc.: | | | |
| 2.3% 7/16/19 | | 5,304,000 | 5,260,921 |
| 3.3% 3/1/21 | | 987,000 | 997,892 |
| 4.875% 6/1/22 | | 1,484,000 | 1,583,444 |
| 5.85% 1/16/18 | | 1,910,000 | 2,036,614 |
| Aon Corp.: | | | |
| 3.125% 5/27/16 | | 2,000,000 | 2,009,400 |
| 5% 9/30/20 | | 2,178,000 | 2,402,872 |
| Aon PLC 2.8% 3/15/21 | | 7,000,000 | 7,050,967 |
| Assurant, Inc. 2.5% 3/15/18 | | 2,000,000 | 2,000,926 |
| Great-West Life & Annuity Insurance Co. 7.153% 5/16/46 (a)(b) | | 259,000 | 253,820 |
| Hartford Financial Services Group, Inc. 5.375% 3/15/17 | | 18,000 | 18,653 |
| Liberty Mutual Group, Inc. 5% 6/1/21 (a) | | 5,599,000 | 6,039,680 |
| Marsh & McLennan Companies, Inc.: | | | |
| 2.35% 9/10/19 | | 495,000 | 498,586 |
| 2.35% 3/6/20 | | 5,000,000 | 5,007,650 |
| 2.55% 10/15/18 | | 517,000 | 528,825 |
| MassMutual Global Funding II 2.35% 4/9/19 (a) | | 1,000,000 | 1,012,422 |
| MetLife, Inc.: | | | |
| 1.756% 12/15/17 (b) | | 269,000 | 269,107 |
| 1.903% 12/15/17 (b) | | 180,000 | 180,075 |
| Metropolitan Life Global Funding I: | | | |
| 1.3% 4/10/17 (a) | | 1,500,000 | 1,500,198 |
| 1.5% 1/10/18 (a) | | 4,431,000 | 4,399,890 |
| 2% 4/14/20 (a) | | 3,000,000 | 2,952,063 |
| New York Life Global Funding 1.55% 11/2/18 (a) | | 3,500,000 | 3,486,546 |
| Pacific LifeCorp 6% 2/10/20 (a) | | 1,579,000 | 1,766,724 |
| Pricoa Global Funding I: | | | |
| 1.15% 11/25/16 (a) | | 2,000,000 | 1,999,230 |
| 1.6% 5/29/18 (a) | | 967,000 | 961,402 |
| Principal Life Global Funding II 2.375% 9/11/19 (a) | | 2,200,000 | 2,212,285 |
| Prudential Financial, Inc. 3.5% 5/15/24 | | 2,550,000 | 2,499,112 |
| Symetra Financial Corp. 6.125% 4/1/16 (a) | | 892,000 | 895,440 |
| TIAA Asset Management Finance LLC 2.95% 11/1/19 (a) | | 280,000 | 281,411 |
| Unum Group: | | | |
| 5.625% 9/15/20 | | 2,743,000 | 3,003,489 |
| 7.125% 9/30/16 | | 704,000 | 725,257 |
| | | | 74,607,186 |
| Real Estate Investment Trusts - 1.5% | | | |
| Alexandria Real Estate Equities, Inc. 4.6% 4/1/22 | | 189,000 | 201,461 |
| American Campus Communities Operating Partnership LP 3.35% 10/1/20 | | 1,272,000 | 1,291,753 |
| Boston Properties, Inc.: | | | |
| 3.7% 11/15/18 | | 1,787,000 | 1,851,579 |
| 5.875% 10/15/19 | | 446,000 | 495,049 |
| DDR Corp.: | | | |
| 4.75% 4/15/18 | | 1,634,000 | 1,699,563 |
| 7.5% 4/1/17 | | 389,000 | 410,565 |
| Digital Delta Holdings LLC 3.4% 10/1/20 (a) | | 1,735,000 | 1,765,408 |
| Duke Realty LP: | | | |
| 5.95% 2/15/17 | | 354,000 | 367,509 |
| 6.75% 3/15/20 | | 35,000 | 40,124 |
| 8.25% 8/15/19 | | 7,000 | 8,297 |
| Equity One, Inc. 6% 9/15/17 | | 509,000 | 536,860 |
| ERP Operating LP: | | | |
| 2.375% 7/1/19 | | 1,641,000 | 1,648,826 |
| 3.375% 6/1/25 | | 3,000,000 | 3,052,035 |
| 5.75% 6/15/17 | | 442,000 | 463,662 |
| Federal Realty Investment Trust: | | | |
| 2.55% 1/15/21 | | 5,000,000 | 5,088,395 |
| 5.9% 4/1/20 | | 5,000 | 5,734 |
| Government Properties Income Trust 3.75% 8/15/19 | | 3,000,000 | 3,076,506 |
| Health Care Property Investors, Inc. 6% 1/30/17 | | 750,000 | 776,806 |
| Health Care REIT, Inc.: | | | |
| 2.25% 3/15/18 | | 250,000 | 249,343 |
| 4.7% 9/15/17 | | 2,436,000 | 2,536,980 |
| HRPT Properties Trust: | | | |
| 6.25% 6/15/17 | | 186,000 | 191,489 |
| 6.65% 1/15/18 | | 95,000 | 100,034 |
| Select Income REIT 2.85% 2/1/18 | | 597,000 | 595,066 |
| Simon Property Group LP 2.2% 2/1/19 | | 462,000 | 467,136 |
| United Dominion Realty Trust, Inc. 4.25% 6/1/18 | | 431,000 | 450,828 |
| | | | 27,371,008 |
| Real Estate Management & Development - 1.5% | | | |
| BioMed Realty LP 3.85% 4/15/16 | | 1,379,000 | 1,380,294 |
| Brandywine Operating Partnership LP: | | | |
| 4.95% 4/15/18 | | 51,000 | 53,290 |
| 5.7% 5/1/17 | | 369,000 | 383,280 |
| 6% 4/1/16 | | 2,124,000 | 2,131,217 |
| Essex Portfolio LP 5.5% 3/15/17 | | 2,046,000 | 2,122,643 |
| Liberty Property LP: | | | |
| 4.75% 10/1/20 | | 1,045,000 | 1,126,989 |
| 5.5% 12/15/16 | | 2,260,000 | 2,324,824 |
| 6.625% 10/1/17 | | 2,707,000 | 2,880,890 |
| Mack-Cali Realty LP: | | | |
| 2.5% 12/15/17 | | 439,000 | 434,917 |
| 4.5% 4/18/22 | | 185,000 | 180,117 |
| 7.75% 8/15/19 | | 1,298,000 | 1,424,996 |
| Prime Property Funding, Inc. 5.7% 4/15/17 (a) | | 405,000 | 417,554 |
| Reckson Operating Partnership LP 6% 3/31/16 | | 152,000 | 152,500 |
| Regency Centers LP 5.875% 6/15/17 | | 187,000 | 196,458 |
| Tanger Properties LP 6.125% 6/1/20 | | 606,000 | 689,085 |
| Ventas Realty LP: | | | |
| 1.25% 4/17/17 | | 1,882,000 | 1,866,673 |
| 1.55% 9/26/16 | | 346,000 | 346,160 |
| Ventas Realty LP/Ventas Capital Corp.: | | | |
| 2% 2/15/18 | | 1,743,000 | 1,734,079 |
| 4% 4/30/19 | | 6,000,000 | 6,266,298 |
| Washington Prime Group LP 3.85% 4/1/20 | | 2,090,000 | 2,153,477 |
| | | | 28,265,741 |
|
| TOTAL FINANCIALS | | | 632,873,796 |
|
| HEALTH CARE - 3.8% | | | |
| Biotechnology - 1.5% | | | |
| AbbVie, Inc.: | | | |
| 1.75% 11/6/17 | | 1,062,000 | 1,061,398 |
| 1.8% 5/14/18 | | 3,972,000 | 3,960,811 |
| 2.5% 5/14/20 | | 7,349,000 | 7,344,106 |
| Amgen, Inc.: | | | |
| 0.9982% 5/22/17 (b) | | 3,000,000 | 2,991,537 |
| 1.25% 5/22/17 | | 1,500,000 | 1,496,820 |
| 2.125% 5/1/20 | | 1,618,000 | 1,607,023 |
| 2.2% 5/22/19 | | 4,290,000 | 4,345,178 |
| 5.85% 6/1/17 | | 446,000 | 469,860 |
| Celgene Corp.: | | | |
| 2.125% 8/15/18 | | 1,549,000 | 1,555,995 |
| 2.875% 8/15/20 | | 3,000,000 | 3,041,232 |
| | | | 27,873,960 |
| Health Care Equipment & Supplies - 0.4% | | | |
| Becton, Dickinson & Co.: | | | |
| 1.8% 12/15/17 | | 1,486,000 | 1,487,877 |
| 2.675% 12/15/19 | | 329,000 | 335,914 |
| Medtronic, Inc.: | | | |
| 1.5% 3/15/18 | | 1,770,000 | 1,774,209 |
| 2.5% 3/15/20 | | 2,200,000 | 2,253,757 |
| Zimmer Biomet Holdings, Inc. 2% 4/1/18 | | 2,702,000 | 2,690,211 |
| | | | 8,541,968 |
| Health Care Providers & Services - 1.0% | | | |
| Cardinal Health, Inc. 1.95% 6/15/18 | | 462,000 | 462,152 |
| Coventry Health Care, Inc. 5.95% 3/15/17 | | 264,000 | 276,071 |
| Express Scripts Holding Co.: | | | |
| 1.25% 6/2/17 | | 1,500,000 | 1,492,229 |
| 2.25% 6/15/19 | | 1,000,000 | 993,543 |
| McKesson Corp. 2.284% 3/15/19 | | 686,000 | 688,483 |
| UnitedHealth Group, Inc.: | | | |
| 1.4% 10/15/17 | | 2,128,000 | 2,130,296 |
| 1.9% 7/16/18 | | 3,000,000 | 3,028,026 |
| 2.125% 3/15/21 | | 3,000,000 | 2,999,637 |
| 2.7% 7/15/20 | | 1,361,000 | 1,398,466 |
| 2.875% 12/15/21 | | 2,000,000 | 2,053,886 |
| WellPoint, Inc.: | | | |
| 1.875% 1/15/18 | | 326,000 | 325,322 |
| 2.25% 8/15/19 | | 2,950,000 | 2,932,188 |
| | | | 18,780,299 |
| Life Sciences Tools & Services - 0.2% | | | |
| Thermo Fisher Scientific, Inc.: | | | |
| 1.3% 2/1/17 | | 136,000 | 135,518 |
| 2.15% 12/14/18 | | 881,000 | 881,393 |
| 2.4% 2/1/19 | | 3,086,000 | 3,096,063 |
| | | | 4,112,974 |
| Pharmaceuticals - 0.7% | | | |
| Actavis Funding SCS: | | | |
| 1.3% 6/15/17 | | 2,400,000 | 2,387,438 |
| 2.35% 3/12/18 | | 3,000,000 | 3,018,123 |
| 2.45% 6/15/19 | | 352,000 | 353,012 |
| 3% 3/12/20 | | 1,157,000 | 1,176,914 |
| Bayer U.S. Finance LLC: | | | |
| 1.5% 10/6/17 (a) | | 1,863,000 | 1,866,385 |
| 2.375% 10/8/19 (a) | | 1,481,000 | 1,502,152 |
| Mylan, Inc. 1.35% 11/29/16 | | 160,000 | 158,895 |
| Perrigo Co. PLC 1.3% 11/8/16 | | 200,000 | 198,841 |
| Perrigo Finance PLC 3.5% 12/15/21 | | 263,000 | 260,641 |
| Watson Pharmaceuticals, Inc. 1.875% 10/1/17 | | 210,000 | 210,180 |
| Zoetis, Inc.: | | | |
| 1.875% 2/1/18 | | 1,616,000 | 1,598,592 |
| 3.45% 11/13/20 | | 493,000 | 502,205 |
| | | | 13,233,378 |
|
| TOTAL HEALTH CARE | | | 72,542,579 |
|
| INDUSTRIALS - 1.7% | | | |
| Aerospace & Defense - 0.8% | | | |
| BAE Systems Holdings, Inc. 2.85% 12/15/20 (a) | | 5,615,000 | 5,676,552 |
| L-3 Communications Corp. 1.5% 5/28/17 | | 3,685,000 | 3,635,606 |
| Lockheed Martin Corp. 2.5% 11/23/20 | | 2,361,000 | 2,402,596 |
| The Boeing Co. 1.65% 10/30/20 | | 3,000,000 | 2,963,865 |
| | | | 14,678,619 |
| Airlines - 0.0% | | | |
| Continental Airlines, Inc.: | | | |
| 6.648% 3/15/19 | | 131,410 | 133,539 |
| 6.795% 2/2/20 | | 2,618 | 2,716 |
| 6.9% 7/2/19 | | 24,663 | 25,080 |
| U.S. Airways pass-thru trust certificates: | | | |
| 6.85% 1/30/18 | | 151,811 | 155,439 |
| 8.36% 1/20/19 | | 96,657 | 99,741 |
| | | | 416,515 |
| Industrial Conglomerates - 0.7% | | | |
| Covidien International Finance SA 6% 10/15/17 | | 442,000 | 473,015 |
| Danaher Corp.: | | | |
| 1.65% 9/15/18 | | 3,976,000 | 3,999,498 |
| 2.4% 9/15/20 | | 619,000 | 632,000 |
| Roper Technologies, Inc.: | | | |
| 2.05% 10/1/18 | | 2,919,000 | 2,904,545 |
| 3% 12/15/20 | | 5,100,000 | 5,152,765 |
| | | | 13,161,823 |
| Machinery - 0.0% | | | |
| Ingersoll-Rand Luxembourg Finance SA 2.625% 5/1/20 | | 263,000 | 261,329 |
| Trading Companies & Distributors - 0.2% | | | |
| Air Lease Corp.: | | | |
| 2.125% 1/15/18 | | 414,000 | 404,168 |
| 2.625% 9/4/18 | | 1,628,000 | 1,579,689 |
| 3.75% 2/1/22 | | 1,228,000 | 1,141,008 |
| 3.875% 4/1/21 | | 500,000 | 483,750 |
| 4.75% 3/1/20 | | 605,000 | 615,588 |
| | | | 4,224,203 |
|
| TOTAL INDUSTRIALS | | | 32,742,489 |
|
| INFORMATION TECHNOLOGY - 2.1% | | | |
| Communications Equipment - 0.4% | | | |
| Cisco Systems, Inc.: | | | |
| 1.65% 6/15/18 | | 3,000,000 | 3,021,297 |
| 2.125% 3/1/19 | | 1,500,000 | 1,531,863 |
| 2.45% 6/15/20 | | 3,000,000 | 3,073,731 |
| | | | 7,626,891 |
| Electronic Equipment & Components - 0.5% | | | |
| Amphenol Corp. 1.55% 9/15/17 | | 1,426,000 | 1,422,150 |
| Tyco Electronics Group SA: | | | |
| 2.35% 8/1/19 | | 3,000,000 | 3,010,647 |
| 2.375% 12/17/18 | | 99,000 | 99,440 |
| 6.55% 10/1/17 | | 4,476,000 | 4,805,832 |
| | | | 9,338,069 |
| IT Services - 0.4% | | | |
| MasterCard, Inc. 2% 4/1/19 | | 289,000 | 293,400 |
| The Western Union Co.: | | | |
| 2.875% 12/10/17 | | 773,000 | 786,382 |
| 3.65% 8/22/18 | | 3,111,000 | 3,176,238 |
| Xerox Corp.: | | | |
| 2.75% 3/15/19 | | 2,585,000 | 2,459,338 |
| 2.95% 3/15/17 | | 1,057,000 | 1,059,252 |
| | | | 7,774,610 |
| Software - 0.4% | | | |
| Oracle Corp.: | | | |
| 2.25% 10/8/19 | | 1,552,000 | 1,590,133 |
| 2.5% 5/15/22 | | 5,000,000 | 5,028,325 |
| | | | 6,618,458 |
| Technology Hardware, Storage & Peripherals - 0.4% | | | |
| Apple, Inc. 2.85% 5/6/21 | | 850,000 | 883,223 |
| Hewlett Packard Enterprise Co.: | | | |
| 2.85% 10/5/18 (a) | | 4,000,000 | 4,001,316 |
| 3.6% 10/15/20 (a) | | 3,000,000 | 2,991,930 |
| | | | 7,876,469 |
|
| TOTAL INFORMATION TECHNOLOGY | | | 39,234,497 |
|
| MATERIALS - 1.4% | | | |
| Chemicals - 0.7% | | | |
| Albemarle Corp. U.S. 3% 12/1/19 | | 1,321,000 | 1,293,766 |
| Chevron Phillips Chemical Co. LLC / Chevron Phillips Chemical Co. LP 1.7% 5/1/18 (a) | | 5,340,000 | 5,247,266 |
| Ecolab, Inc.: | | | |
| 1.45% 12/8/17 | | 335,000 | 333,324 |
| 1.55% 1/12/18 | | 2,500,000 | 2,489,298 |
| Monsanto Co. 2.125% 7/15/19 | | 3,000,000 | 3,017,427 |
| Sherwin-Williams Co. 1.35% 12/15/17 | | 620,000 | 618,932 |
| | | | 13,000,013 |
| Metals & Mining - 0.7% | | | |
| Anglo American Capital PLC: | | | |
| 1.572% 4/15/16 (a)(b) | | 1,624,000 | 1,600,510 |
| 3.625% 5/14/20 (a) | | 1,513,000 | 1,202,835 |
| Corporacion Nacional del Cobre de Chile (Codelco) 3.875% 11/3/21 (a) | | 630,000 | 633,211 |
| Freeport-McMoRan, Inc.: | | | |
| 2.3% 11/14/17 | | 670,000 | 613,050 |
| 2.375% 3/15/18 | | 4,000,000 | 3,445,000 |
| Rio Tinto Finance (U.S.A.) PLC 1.625% 8/21/17 | | 2,440,000 | 2,390,387 |
| Teck Resources Ltd. 3% 3/1/19 | | 3,000,000 | 2,287,500 |
| Vale Overseas Ltd. 6.25% 1/23/17 | | 403,000 | 406,264 |
| | | | 12,578,757 |
|
| TOTAL MATERIALS | | | 25,578,770 |
|
| TELECOMMUNICATION SERVICES - 3.3% | | | |
| Diversified Telecommunication Services - 2.6% | | | |
| AT&T, Inc.: | | | |
| 1.4% 12/1/17 | | 1,620,000 | 1,612,166 |
| 2.375% 11/27/18 | | 10,000,000 | 10,107,600 |
| 2.45% 6/30/20 | | 1,563,000 | 1,556,843 |
| BellSouth Corp. 4.821% 4/26/16 (a)(b) | | 3,000,000 | 3,017,844 |
| British Telecommunications PLC: | | | |
| 1.25% 2/14/17 | | 1,000,000 | 998,730 |
| 1.625% 6/28/16 | | 4,314,000 | 4,321,002 |
| 2.35% 2/14/19 | | 4,296,000 | 4,336,666 |
| CenturyLink, Inc. 6.15% 9/15/19 | | 592,000 | 608,280 |
| Deutsche Telekom International Financial BV: | | | |
| 3.125% 4/11/16 (a) | | 923,000 | 924,911 |
| 5.75% 3/23/16 | | 2,000,000 | 2,005,562 |
| Verizon Communications, Inc.: | | | |
| 1.1% 11/1/17 | | 620,000 | 614,143 |
| 1.35% 6/9/17 | | 750,000 | 749,611 |
| 2% 11/1/16 | | 1,279,000 | 1,286,130 |
| 2.5% 9/15/16 | | 1,044,000 | 1,052,060 |
| 2.625% 2/21/20 | | 2,913,000 | 2,953,255 |
| 3.65% 9/14/18 | | 6,000,000 | 6,279,426 |
| 4.5% 9/15/20 | | 3,000,000 | 3,262,587 |
| 6.1% 4/15/18 | | 3,425,000 | 3,721,218 |
| | | | 49,408,034 |
| Wireless Telecommunication Services - 0.7% | | | |
| America Movil S.A.B. de CV 2.375% 9/8/16 | | 2,646,000 | 2,657,489 |
| Vodafone Group PLC: | | | |
| 1.5% 2/19/18 | | 2,625,000 | 2,600,068 |
| 1.625% 3/20/17 | | 5,400,000 | 5,421,832 |
| 5.45% 6/10/19 | | 2,000,000 | 2,191,938 |
| | | | 12,871,327 |
|
| TOTAL TELECOMMUNICATION SERVICES | | | 62,279,361 |
|
| UTILITIES - 4.6% | | | |
| Electric Utilities - 2.4% | | | |
| AmerenUE 6.4% 6/15/17 | | 519,000 | 550,381 |
| American Electric Power Co., Inc. 1.65% 12/15/17 | | 1,827,000 | 1,814,441 |
| Commonwealth Edison Co. 2.15% 1/15/19 | | 188,000 | 190,007 |
| Duke Energy Corp.: | | | |
| 0.9922% 4/3/17 (b) | | 2,894,000 | 2,872,836 |
| 1.625% 8/15/17 | | 3,304,000 | 3,301,205 |
| 2.1% 6/15/18 | | 5,395,000 | 5,406,205 |
| Duquesne Light Holdings, Inc. 6.4% 9/15/20 (a) | | 48,000 | 54,802 |
| Edison International 3.75% 9/15/17 | | 431,000 | 443,996 |
| Eversource Energy 1.45% 5/1/18 | | 153,000 | 151,174 |
| Exelon Corp.: | | | |
| 1.55% 6/9/17 | | 311,000 | 309,492 |
| 2.85% 6/15/20 | | 458,000 | 461,886 |
| FirstEnergy Corp.: | | | |
| 2.75% 3/15/18 | | 6,652,000 | 6,719,777 |
| 4.25% 3/15/23 | | 600,000 | 626,340 |
| FirstEnergy Solutions Corp. 6.05% 8/15/21 | | 655,000 | 695,750 |
| Hydro-Quebec 2% 6/30/16 | | 2,500,000 | 2,511,300 |
| IPALCO Enterprises, Inc. 3.45% 7/15/20 | | 2,576,000 | 2,566,340 |
| LG&E and KU Energy LLC 3.75% 11/15/20 | | 2,000 | 2,100 |
| Nevada Power Co.: | | | |
| 6.5% 5/15/18 | | 1,562,000 | 1,719,876 |
| 6.5% 8/1/18 | | 273,000 | 302,209 |
| NextEra Energy Capital Holdings, Inc. 1.586% 6/1/17 | | 2,904,000 | 2,899,182 |
| PacifiCorp 5.5% 1/15/19 | | 2,750,000 | 3,034,515 |
| Pennsylvania Electric Co. 6.05% 9/1/17 | | 115,000 | 122,183 |
| Public Service Electric & Gas Co. 2.3% 9/15/18 | | 2,000,000 | 2,029,604 |
| TECO Finance, Inc.: | | | |
| 1.2169% 4/10/18 (b) | | 3,000,000 | 2,957,541 |
| 5.15% 3/15/20 | | 252,000 | 274,297 |
| Xcel Energy, Inc. 1.2% 6/1/17 | | 3,153,000 | 3,141,838 |
| | | | 45,159,277 |
| Gas Utilities - 0.1% | | | |
| Texas Eastern Transmission LP 6% 9/15/17 (a) | | 1,096,000 | 1,150,942 |
| Independent Power and Renewable Electricity Producers - 0.2% | | | |
| Southern Power Co.: | | | |
| 1.85% 12/1/17 | | 704,000 | 704,132 |
| 2.375% 6/1/20 | | 1,087,000 | 1,068,419 |
| TransAlta Corp. 1.9% 6/3/17 | | 2,900,000 | 2,721,676 |
| | | | 4,494,227 |
| Multi-Utilities - 1.9% | | | |
| Ameren Illinois Co. 6.125% 11/15/17 | | 62,000 | 66,639 |
| Berkshire Hathaway Energy Co.: | | | |
| 1.1% 5/15/17 | | 1,000,000 | 997,097 |
| 2% 11/15/18 | | 544,000 | 544,917 |
| Dominion Resources, Inc.: | | | |
| 1.4% 9/15/17 | | 3,225,000 | 3,204,118 |
| 1.9% 6/15/18 | | 2,540,000 | 2,526,756 |
| 2.5% 12/1/19 | | 7,382,000 | 7,438,081 |
| 2.9031% 9/30/66 (b) | | 651,000 | 437,505 |
| 7.5% 6/30/66 (b) | | 567,000 | 474,863 |
| NiSource Finance Corp.: | | | |
| 3.85% 2/15/23 | | 700,000 | 729,931 |
| 5.45% 9/15/20 | | 43,000 | 47,595 |
| 6.4% 3/15/18 | | 888,000 | 963,072 |
| NSTAR 4.5% 11/15/19 | | 2,500,000 | 2,699,093 |
| PG&E Corp. 2.4% 3/1/19 | | 74,000 | 74,746 |
| Puget Energy, Inc. 6.5% 12/15/20 | | 991,000 | 1,156,255 |
| Sempra Energy: | | | |
| 2.3% 4/1/17 | | 4,935,000 | 4,967,127 |
| 2.4% 3/15/20 | | 1,890,000 | 1,854,825 |
| 2.85% 11/15/20 | | 1,392,000 | 1,397,163 |
| Wisconsin Energy Corp.: | | | |
| 1.65% 6/15/18 | | 3,006,000 | 3,000,481 |
| 2.45% 6/15/20 | | 2,901,000 | 2,937,341 |
| 6.25% 5/15/67 (b) | | 454,000 | 335,960 |
| | | | 35,853,565 |
|
| TOTAL UTILITIES | | | 86,658,011 |
|
| TOTAL NONCONVERTIBLE BONDS | | | |
| (Cost $1,330,486,155) | | | 1,321,778,285 |
|
| U.S. Treasury Obligations - 7.8% | | | |
| U.S. Treasury Notes: | | | |
| 0.75% 2/15/19 | | $64,146,000 | $63,847,822 |
| 0.875% 10/15/17 | | 10,230,000 | 10,243,186 |
| 1% 5/15/18 | | 12,459,000 | 12,504,264 |
| 1.125% 1/15/19 | | 11,574,000 | 11,646,789 |
| 1.375% 3/31/20 (c) | | 9,683,000 | 9,768,859 |
| 1.375% 1/31/21 | | 30,000,000 | 30,199,230 |
| 1.75% 12/31/20 | | 10,000,000 | 10,242,190 |
| TOTAL U.S. TREASURY OBLIGATIONS | | | |
| (Cost $148,247,181) | | | 148,452,340 |
|
| U.S. Government Agency - Mortgage Securities - 0.7% | | | |
| Fannie Mae - 0.5% | | | |
| 2.45% 11/1/36 (b) | | 149,520 | 157,298 |
| 2.468% 1/1/40 (b) | | 159,432 | 167,747 |
| 2.471% 3/1/40 (b) | | 117,232 | 123,895 |
| 2.489% 12/1/33 (b) | | 622,566 | 656,878 |
| 2.51% 7/1/35 (b) | | 76,754 | 81,056 |
| 2.557% 3/1/40 (b) | | 83,774 | 88,367 |
| 2.557% 6/1/42 (b) | | 51,722 | 53,279 |
| 2.595% 4/1/35 (b) | | 371,174 | 390,798 |
| 2.685% 12/1/39 (b) | | 46,132 | 48,780 |
| 2.689% 2/1/42 (b) | | 533,419 | 554,586 |
| 2.761% 1/1/42 (b) | | 443,205 | 461,244 |
| 2.951% 11/1/40 (b) | | 30,288 | 31,444 |
| 2.98% 9/1/41 (b) | | 36,605 | 38,279 |
| 2.991% 10/1/41 (b) | | 19,908 | 20,792 |
| 3.249% 7/1/41 (b) | | 53,942 | 56,357 |
| 3.347% 10/1/41 (b) | | 28,170 | 29,577 |
| 3.5% 7/1/26 to 10/1/29 | | 3,925,938 | 4,184,901 |
| 3.553% 7/1/41 (b) | | 66,657 | 70,095 |
| 4.5% 3/1/35 | | 35,980 | 39,312 |
| 6% 5/1/16 to 4/1/17 | | 4,292 | 4,324 |
| 6.5% 5/1/16 to 8/1/36 | | 492,494 | 576,010 |
| 7% 9/1/18 to 6/1/33 | | 296,771 | 352,410 |
| 7.5% 8/1/17 to 3/1/28 | | 98,062 | 115,527 |
| 8.5% 5/1/21 to 9/1/25 | | 7,611 | 8,878 |
| 9.5% 2/1/25 | | 515 | 559 |
| 10.5% 8/1/20 | | 4,847 | 5,256 |
|
| TOTAL FANNIE MAE | | | 8,317,649 |
|
| Freddie Mac - 0.2% | | | |
| 2.413% 4/1/40 (b) | | 90,242 | 95,134 |
| 2.53% 4/1/40 (b) | | 83,409 | 88,053 |
| 2.535% 2/1/40 (b) | | 134,267 | 141,670 |
| 3.208% 9/1/41 (b) | | 35,210 | 36,795 |
| 3.216% 4/1/41 (b) | | 40,299 | 42,125 |
| 3.297% 6/1/41(b) | | 45,031 | 47,062 |
| 3.451% 5/1/41 (b) | | 30,676 | 31,918 |
| 3.5% 8/1/26 | | 2,892,634 | 3,073,423 |
| 3.626% 6/1/41 (b) | | 65,362 | 68,520 |
| 3.706% 5/1/41 (b) | | 47,749 | 50,127 |
| 4.5% 8/1/18 | | 165,043 | 170,228 |
| 5% 3/1/19 | | 298,295 | 309,331 |
| 8.5% 9/1/24 to 8/1/27 | | 29,609 | 35,723 |
|
| TOTAL FREDDIE MAC | | | 4,190,109 |
|
| Ginnie Mae - 0.0% | | | |
| 7% 7/15/28 to 11/15/28 | | 80,591 | 95,797 |
| 7.5% 2/15/28 to 10/15/28 | | 3,477 | 4,227 |
| 8% 6/15/24 | | 60 | 70 |
| 8.5% 10/15/21 | | 23,279 | 26,451 |
| 11% 7/20/19 to 8/20/19 | | 1,163 | 1,269 |
|
| TOTAL GINNIE MAE | | | 127,814 |
|
| TOTAL U.S. GOVERNMENT AGENCY - MORTGAGE SECURITIES | | | |
| (Cost $12,453,990) | | | 12,635,572 |
|
| Asset-Backed Securities - 8.4% | | | |
| Accredited Mortgage Loan Trust Series 2005-1 Class M1, 1.1266% 4/25/35 (b) | | $56,669 | $50,620 |
| ACE Securities Corp. Home Equity Loan Trust Series 2004-HE1 Class M2, 2.0765% 3/25/34 (b) | | 33,430 | 31,836 |
| Ally Auto Receivables Trust Series 2015-SN1 Class A3, 1.21% 12/20/17 | | 670,000 | 669,791 |
| Ally Master Owner Trust: | | | |
| Series 2012-4 Class A, 1.72% 7/15/19 | | 292,000 | 292,617 |
| Series 2012-5 Class A, 1.54% 9/15/19 | | 11,057,000 | 11,059,799 |
| Series 2014-3 Class A, 1.33% 3/15/19 | | 2,425,000 | 2,423,954 |
| Series 2014-4 Class A2, 1.43% 6/17/19 | | 3,870,000 | 3,868,162 |
| Series 2014-5 Class A2, 1.6% 10/15/19 | | 3,000,000 | 3,001,941 |
| Series 2015-3 Class A, 1.63% 5/15/20 | | 3,130,000 | 3,129,670 |
| American Express Credit Account Master Trust: | | | |
| Series 2014-3 Class A, 1.49% 4/15/20 | | 2,000,000 | 2,010,564 |
| Series 2014-4 Class A, 1.43% 6/15/20 | | 3,780,000 | 3,795,992 |
| AmeriCredit Automobile Receivables Trust: | | | |
| Series 2013-5 Class A3, 0.9% 9/10/18 | | 344,793 | 344,403 |
| Series 2014-2 Class A3, 0.94% 2/8/19 | | 1,300,000 | 1,297,610 |
| Series 2014-4 Class A3, 1.27% 7/8/19 | | 505,000 | 503,911 |
| Series 2015-2 Class A3, 1.27% 1/8/20 | | 3,000,000 | 2,982,881 |
| Series 2016-1 Class A3, 2.14% 10/8/20 | | 1,888,000 | 1,894,388 |
| Ameriquest Mortgage Securities, Inc. pass-thru certificates: | | | |
| Series 2003-10 Class M1, 1.4858% 12/25/33 (b) | | 5,239 | 4,802 |
| Series 2004-R2 Class M3, 1.2608% 4/25/34 (b) | | 10,238 | 7,473 |
| Argent Securities, Inc. pass-thru certificates: | | | |
| Series 2003-W7 Class A2, 1.2158% 3/25/34 (b) | | 4,092 | 3,632 |
| Series 2004-W11 Class M2, 1.4858% 11/25/34 (b) | | 63,962 | 61,475 |
| Series 2004-W7 Class M1, 1.2608% 5/25/34 (b) | | 179,644 | 164,200 |
| Series 2006-W4 Class A2C, 0.5958% 5/25/36 (b) | | 130,347 | 46,202 |
| Asset Backed Securities Corp. Home Equity Loan Trust: | | | |
| Series 2004-HE2 Class M1, 1.2515% 4/25/34 (b) | | 142,339 | 123,552 |
| Series 2006-HE2 Class M1, 0.8058% 3/25/36 (b) | | 2,215 | 369 |
| Bank of America Credit Card Master Trust Series 2015-A2 Class A, 1.36% 9/15/20 | | 3,769,000 | 3,777,936 |
| Bear Stearns Asset Backed Securities I Trust Series 2005-HE2 Class M2, 1.5608% 2/25/35 (b) | | 378,742 | 334,166 |
| Capital Auto Receivables Asset Trust: | | | |
| Series 2014-2 Class A2, 0.91% 4/20/17 | | 231,473 | 231,472 |
| Series 2014-3 Class A2, 1.18% 12/20/17 | | 1,176,000 | 1,175,464 |
| Series 2015-1 Class A2, 1.42% 6/20/18 | | 1,807,000 | 1,808,549 |
| Series 2015-2 Class A2, 1.39% 9/20/18 | | 1,603,000 | 1,604,242 |
| Capital One Multi-Asset Execution Trust Series 2014-A5 Class A, 1.48% 7/15/20 | | 2,200,000 | 2,209,936 |
| Carrington Mortgage Loan Trust Series 2007-RFC1 Class A3, 0.5758% 12/25/36 (b) | | 205,465 | 139,790 |
| Chase Issuance Trust Series 2015-A2, Class A, 1.59% 2/18/20 | | 3,000,000 | 3,020,538 |
| Chrysler Capital Auto Receivables Trust Series 2015-AA Class A3, 1.22% 7/15/19 (a) | | 4,000,000 | 3,990,726 |
| CIT Equipment Collateral: | | | |
| Series 2013-VT1 Class A3, 1.13% 7/20/20 (a) | | 1,689,604 | 1,689,751 |
| Series 2014-VT1 Class A3, 1.5% 10/21/19 (a) | | 1,640,000 | 1,634,573 |
| Citibank Credit Card Issuance Trust Series 2014-A6 Class A6, 2.15% 7/15/21 | | 2,896,000 | 2,956,777 |
| Countrywide Home Loans, Inc.: | | | |
| Series 2003-BC1 Class B1, 5.6858% 3/25/32 (b) | | 9,741 | 8,905 |
| Series 2004-3 Class M4, 1.8908% 4/25/34 (b) | | 7,185 | 6,293 |
| Series 2004-4 Class M2, 1.2308% 6/25/34 (b) | | 8,377 | 7,575 |
| Dell Equipment Finance Trust Series 2015-1 Class A3, 1.3% 3/23/20 (a) | | 4,490,000 | 4,472,434 |
| Discover Card Master Trust: | | | |
| Series 2014-A5 Class A, 1.39% 4/15/20 | | 1,780,000 | 1,786,807 |
| Series 2016-A1 Class A1, 2.1% 7/15/21 | | 3,630,000 | 3,648,325 |
| Enterprise Fleet Financing LLC: | | | |
| Series 2014-1 Class A2, 0.87% 9/20/19 (a) | | 868,988 | 866,107 |
| Series 2014-2 Class A2, 1.05% 3/20/20 (a) | | 2,576,231 | 2,562,620 |
| Series 2015-1 Class A2, 1.3% 9/20/20 (a) | | 2,604,423 | 2,587,052 |
| Fannie Mae Series 2004-T5 Class AB3, 1.1189% 5/28/35 (b) | | 4,436 | 3,852 |
| Fieldstone Mortgage Investment Corp. Series 2004-3 Class M5, 2.6015% 8/25/34 (b) | | 33,155 | 31,312 |
| Flagship Credit Auto Trust Series 2016-1 Class A, 2.53% 12/15/20 (a) | | 4,000,000 | 3,990,391 |
| Ford Credit Auto Owner Trust: | | | |
| Series 2014-2 Class A, 2.31% 4/15/26 (a) | | 3,299,000 | 3,332,738 |
| Series 2015-1 Class A, 2.12% 7/15/26 (a) | | 2,785,000 | 2,793,976 |
| Series 2015-2 Class A, 2.44% 1/15/27 (a) | | 3,480,000 | 3,522,612 |
| Series 2016-1 Class A, 2.31% 8/15/27 (a) | | 4,000,000 | 3,998,914 |
| Ford Credit Floorplan Master Owner Trust: | | | |
| Series 2012-5 Class A, 1.49% 9/15/19 | | 8,055,000 | 8,069,835 |
| Series 2014-1 Class A1, 1.2% 2/15/19 | | 3,500,000 | 3,492,991 |
| Series 2014-4 Class A1, 1.4% 8/15/19 | | 11,000,000 | 11,007,425 |
| Series 2015-1 Class A1, 1.42% 1/15/20 | | 6,000,000 | 6,003,737 |
| Fremont Home Loan Trust Series 2005-A: | | | |
| Class M3, 1.1615% 1/25/35 (b) | | 81,136 | 70,350 |
| Class M4, 1.4465% 1/25/35 (b) | | 39,567 | 21,248 |
| GCO Education Loan Funding Master Trust II Series 2007-1A Class C1L, 1.0091% 2/25/47 (a)(b) | | 143,276 | 126,848 |
| GE Business Loan Trust Series 2006-2A: | | | |
| Class A, 0.6093% 11/15/34 (a)(b) | | 89,833 | 85,073 |
| Class B, 0.7105% 11/15/34 (a)(b) | | 32,594 | 28,683 |
| Class C, 0.8105% 11/15/34 (a)(b) | | 53,794 | 46,548 |
| Class D, 1.1805% 11/15/34 (a)(b) | | 20,404 | 16,905 |
| GM Financial Automobile Leasing Trust: | | | |
| Series 2014-2A Class A3, 1.22% 1/22/18 (a) | | 1,950,000 | 1,950,075 |
| Series 2015-1 Class A3, 1.53% 9/20/18 | | 2,398,000 | 2,413,268 |
| GMF Floorplan Owner Revolving Trust Series 2015-1 Class A1, 1.65% 5/15/20 (a) | | 3,732,000 | 3,723,488 |
| GSAMP Trust Series 2004-AR1 Class B4, 5.5% 6/25/34 (a) | | 29,997 | 864 |
| Home Equity Asset Trust: | | | |
| Series 2003-2 Class M1, 1.7558% 8/25/33 (b) | | 32,697 | 30,100 |
| Series 2003-5 Class A2, 1.1358% 12/25/33 (b) | | 2,817 | 2,605 |
| HSI Asset Securitization Corp. Trust Series 2007-HE1 Class 2A3, 0.6165% 1/25/37 (b) | | 141,116 | 90,492 |
| Hyundai Auto Lease Securitization Trust: | | | |
| Series 2014-B Class A3, 0.98% 11/15/17 (a) | | 1,200,000 | 1,199,357 |
| Series 2015-A Class A3, 1.42% 9/17/18 (a) | | 2,402,000 | 2,406,145 |
| Series 2015-B Class A3, 1.4% 11/15/18 (a) | | 2,966,000 | 2,967,041 |
| JPMorgan Mortgage Acquisition Trust: | | | |
| Series 2006-NC2 Class M2, 0.7216% 7/25/36 (b) | | 21,503 | 9,666 |
| Series 2007-CH1 Class AV4, 0.5658% 11/25/36 (b) | | 5,806 | 5,804 |
| KeyCorp Student Loan Trust: | | | |
| Series 1999-A Class A2, 0.9331% 12/27/29 (b) | | 7,059 | 7,022 |
| Series 2006-A Class 2C, 1.7531% 3/27/42 (b) | | 392,000 | 201,046 |
| MASTR Asset Backed Securities Trust Series 2007-HE1 Class M1, 0.7265% 5/25/37 (b) | | 35,682 | 1,122 |
| Meritage Mortgage Loan Trust Series 2004-1 Class M1, 1.1858% 7/25/34 (b) | | 14,160 | 11,761 |
| Merrill Lynch Mortgage Investors Trust: | | | |
| Series 2003-OPT1 Class M1, 1.4015% 7/25/34 (b) | | 32,514 | 30,398 |
| Series 2006-FM1 Class A2B, 0.5458% 4/25/37 (b) | | 11,599 | 11,534 |
| Series 2006-OPT1 Class A1A, 0.9465% 6/25/35 (b) | | 163,793 | 156,864 |
| Morgan Stanley ABS Capital I Trust: | | | |
| Series 2004-HE6 Class A2, 1.1158% 8/25/34 (b) | | 4,895 | 4,255 |
| Series 2004-NC8 Class M6, 2.3108% 9/25/34 (b) | | 54,359 | 50,117 |
| Series 2005-NC1 Class M1, 1.0958% 1/25/35 (b) | | 27,940 | 24,899 |
| Series 2005-NC2 Class B1, 2.1908% 3/25/35 (b) | | 19,093 | 427 |
| Nationstar HECM Loan Trust Series 2016-1A Class A, 3.1294% 2/25/26 (a) | | 2,000,000 | 1,999,998 |
| New Century Home Equity Loan Trust Series 2005-4 Class M2, 0.9365% 9/25/35 (b) | | 162,650 | 148,055 |
| Nissan Master Owner Trust Receivables Series 2015-A Class A2, 1.44% 1/15/20 | | 2,500,000 | 2,501,568 |
| Park Place Securities, Inc.: | | | |
| Series 2004-WCW1: | | | |
| Class M3, 2.3015% 9/25/34 (b) | | 60,741 | 55,316 |
| Class M4, 2.6015% 9/25/34 (b) | | 77,891 | 52,551 |
| Series 2005-WCH1 Class M4, 1.6715% 1/25/36 (b) | | 126,217 | 110,854 |
| Salomon Brothers Mortgage Securities VII, Inc. Series 2003-HE1 Class A, 1.2265% 4/25/33 (b) | | 582 | 498 |
| Santander Drive Auto Receivables Trust: | | | |
| Series 2013-4 Class B, 2.16% 1/15/20 | | 164,736 | 164,968 |
| Series 2014-4 Class B, 1.82% 5/15/19 | | 774,000 | 774,373 |
| Saxon Asset Securities Trust Series 2004-1 Class M1, 1.2308% 3/25/35 (b) | | 82,443 | 75,890 |
| SLM Private Credit Student Loan Trust Series 2004-A Class C, 1.462% 6/15/33 (b) | | 64,266 | 62,650 |
| Structured Asset Investment Loan Trust Series 2004-8 Class M5, 2.1608% 9/25/34 (b) | | 4,680 | 3,946 |
| Synchrony Credit Card Master Note Trust: | | | |
| Series 2015-1 Class A, 2.37% 3/15/23 | | 2,681,000 | 2,725,078 |
| Series 2015-2 Class A, 1.6% 4/15/21 | | 3,040,000 | 3,047,751 |
| Terwin Mortgage Trust Series 2003-4HE Class A1, 1.2865% 9/25/34 (b) | | 2,472 | 2,083 |
| Trapeza CDO XII Ltd./Trapeza CDO XII, Inc. Series 2007-12A Class B, 1.1717% 4/6/42 (a)(b) | | 316,998 | 155,329 |
| Volkswagen Credit Auto Master Trust Series 2014-1A Class A2, 1.4% 7/22/19 (a) | | 3,104,000 | 3,069,157 |
| Volvo Financial Equipment LLC Series 2015-1A Class A3, 1.51% 6/17/19 (a) | | 2,226,000 | 2,230,670 |
| World Omni Auto Receivables Trust Series 2014-B Class A3, 1.14% 1/15/20 | | 1,759,000 | 1,757,421 |
| World Omni Automobile Lease Securitization Trust Series 2014-A Class A3, 1.16% 9/15/17 | | 1,160,000 | 1,158,759 |
| TOTAL ASSET-BACKED SECURITIES | | | |
| (Cost $159,218,496) | | | 160,328,585 |
|
| Collateralized Mortgage Obligations - 1.6% | | | |
| Private Sponsor - 0.1% | | | |
| Credit Suisse Mortgage Trust Series 2012-2R Class 1A1, 2.7362% 5/27/35 (a)(b) | | 528,998 | 542,646 |
| MASTR Adjustable Rate Mortgages Trust Series 2007-3 Class 22A2, 0.6365% 5/25/47 (b) | | 28,857 | 26,469 |
| Merrill Lynch Alternative Note Asset Trust floater Series 2007-OAR1 Class A1, 0.6058% 2/25/37 (b) | | 64,804 | 57,351 |
| Nationstar HECM Loan Trust sequential payer Series 2015-2A Class A, 2.8826% 11/25/25 (a) | | 1,565,874 | 1,565,091 |
| RESI Finance LP/RESI Finance DE Corp. floater Series 2003-B: | | | |
| Class B5, 2.7735% 6/10/35 (a)(b) | | 40,467 | 36,007 |
| Class B6, 3.2735% 6/10/35 (a)(b) | | 67,321 | 60,717 |
| Sequoia Mortgage Trust floater Series 2004-6 Class A3B, 1.675% 7/20/34 (b) | | 2,538 | 2,473 |
|
| TOTAL PRIVATE SPONSOR | | | 2,290,754 |
|
| U.S. Government Agency - 1.5% | | | |
| Fannie Mae: | | | |
| pass-thru certificates Series 2012-127 Class DH, 4% 11/25/27 | | 358,644 | 379,448 |
| planned amortization class: | | | |
| Series 2002-9 Class PC, 6% 3/25/17 | | 2,786 | 2,838 |
| Series 2015-28 Class P, 2.5% 5/25/45 | | 7,659,776 | 7,835,591 |
| Series 2014-57 Class A, 3% 9/25/44 | | 2,165,864 | 2,240,737 |
| Series 2015-28 Class JE, 3% 5/25/45 | | 5,942,125 | 6,160,311 |
| Freddie Mac: | | | |
| planned amortization class: | | | |
| Series 2356 Class GD, 6% 9/15/16 | | 6,246 | 6,317 |
| Series 2363 Class PF, 6% 9/15/16 | | 4,004 | 4,034 |
| Series 3820 Class DA, 4% 11/15/35 | | 291,331 | 305,101 |
| Series 3777 Class AC, 3.5% 12/15/25 | | 517,671 | 544,566 |
| Series 3949 Class MK, 4.5% 10/15/34 | | 222,334 | 241,007 |
| Series 4472 Class WL, 3% 5/15/45 | | 2,714,751 | 2,808,667 |
| Ginnie Mae guaranteed REMIC pass-thru certificates Series 2015-H17 Class HA, 2.5% 5/20/65 (d) | | 7,682,437 | 7,843,958 |
|
| TOTAL U.S. GOVERNMENT AGENCY | | | 28,372,575 |
|
| TOTAL COLLATERALIZED MORTGAGE OBLIGATIONS | | | |
| (Cost $30,710,580) | | | 30,663,329 |
|
| Commercial Mortgage Securities - 7.6% | | | |
| 7 WTC Depositor LLC Trust Series 2012-7WTC Class A, 4.0824% 3/13/31 (a) | | 417,625 | 425,237 |
| Asset Securitization Corp. Series 1997-D5 Class PS1, 1.5885% 2/14/43 (b)(e) | | 41,857 | 303 |
| Banc of America Commercial Mortgage Trust: | | | |
| sequential payer: | | | |
| Series 2006-2 Class A4, 5.832% 5/10/45 (b) | | 486,650 | 486,447 |
| Series 2006-3 Class A4, 5.889% 7/10/44 (b) | | 4,576,290 | 4,580,360 |
| Series 2006-6 Class A3, 5.369% 10/10/45 | | 74,307 | 74,282 |
| Series 2006-4 Class A1A, 5.617% 7/10/46 (b) | | 811,416 | 817,033 |
| Series 2007-2 Class A4, 5.79% 4/10/49 (b) | | 7,498,000 | 7,604,610 |
| Series 2007-3 Class A4, 5.7423% 6/10/49 (b) | | 579,721 | 595,197 |
| Barclays Commercial Mortgage Securities LLC: | | | |
| floater Series 2015-RRI Class A, 1.5755% 5/15/32 (a)(b) | | 2,015,000 | 1,983,571 |
| Series 2015-STP Class A, 3.3228% 9/10/28 (a) | | 3,500,000 | 3,601,373 |
| Bayview Commercial Asset Trust floater: | | | |
| Series 2003-2 Class M1, 1.7108% 12/25/33 (a)(b) | | 3,266 | 2,901 |
| Series 2005-4A: | | | |
| Class A2, 0.8258% 1/25/36 (a)(b) | | 83,872 | 71,617 |
| Class B1, 1.8358% 1/25/36 (a)(b) | | 3,550 | 2,445 |
| Class M1, 0.8858% 1/25/36 (a)(b) | | 27,056 | 21,473 |
| Class M2, 0.9058% 1/25/36 (a)(b) | | 8,117 | 6,250 |
| Class M3, 0.9358% 1/25/36 (a)(b) | | 11,854 | 8,757 |
| Class M4, 1.0458% 1/25/36 (a)(b) | | 6,556 | 4,737 |
| Class M5, 1.0858% 1/25/36 (a)(b) | | 6,556 | 4,749 |
| Class M6, 1.1358% 1/25/36 (a)(b) | | 6,963 | 5,061 |
| Series 2006-3A Class M4, 0.8658% 10/25/36 (a)(b) | | 3,424 | 378 |
| Series 2007-1 Class A2, 0.7058% 3/25/37 (a)(b) | | 55,311 | 46,781 |
| Series 2007-2A: | | | |
| Class A1, 0.7058% 7/25/37 (a)(b) | | 57,469 | 48,233 |
| Class A2, 0.7558% 7/25/37 (a)(b) | | 53,728 | 42,535 |
| Class M1, 0.8058% 7/25/37 (a)(b) | | 18,867 | 14,287 |
| Class M2, 0.8458% 7/25/37 (a)(b) | | 10,193 | 7,123 |
| Class M3, 0.9258% 7/25/37 (a)(b) | | 7,826 | 4,933 |
| Series 2007-3: | | | |
| Class A2, 0.7258% 7/25/37 (a)(b) | | 51,618 | 41,080 |
| Class M1, 0.7458% 7/25/37 (a)(b) | | 11,450 | 8,576 |
| Class M2, 0.7758% 7/25/37 (a)(b) | | 12,285 | 8,761 |
| Class M3, 0.8058% 7/25/37 (a)(b) | | 18,952 | 9,299 |
| Class M4, 0.9358% 7/25/37 (a)(b) | | 29,987 | 14,432 |
| Class M5, 1.0358% 7/25/37 (a)(b) | | 14,479 | 3,043 |
| Series 2007-4A Class M1, 1.3716% 9/25/37 (a)(b) | | 16,497 | 4,065 |
| Bear Stearns Commercial Mortgage Securities Trust: | | | |
| sequential payer: | | | |
| Series 2006-PW13 Class A1A, 5.533% 9/11/41 | | 680,553 | 687,048 |
| Series 2006-PW14 Class A1A, 5.189% 12/11/38 | | 360,159 | 366,172 |
| Series 2006-T22 Class A1A, 5.8216% 4/12/38 (b) | | 10,268 | 10,258 |
| Series 2006-PW12 Class A1A, 5.9065% 9/11/38 (b) | | 370,888 | 371,138 |
| BXHTL Mortgage Trust Series 2015-JWRZ Class A, 1.656% 5/15/29 (a)(b) | | 2,065,000 | 2,016,019 |
| C-BASS Trust floater Series 2006-SC1 Class A, 0.7058% 5/25/36 (a)(b) | | 20,671 | 19,876 |
| CD Commercial Mortgage Trust Series 2007-CD5 Class A1A, 5.8% 11/15/44 | | 739,907 | 776,472 |
| CDGJ Commercial Mortgage Trust Series 2014-BXCH Class A, 1.827% 12/15/27 (a)(b) | | 7,424,941 | 7,400,557 |
| CGBAM Commercial Mortgage Trust Series 2015-SMRT Class A, 2.808% 4/10/28 (a) | | 5,000,000 | 5,105,490 |
| Citigroup Commercial Mortgage Trust: | | | |
| sequential payer Series 2006-C5 Class A4, 5.431% 10/15/49 | | 1,449,733 | 1,464,198 |
| Series 2006-C4 Class A1A, 6.0329% 3/15/49 (b) | | 323,431 | 323,552 |
| Series 2015-GC29 Class A2, 2.674% 4/10/48 | | 1,388,000 | 1,418,447 |
| Citigroup/Deutsche Bank Commercial Mortgage Trust sequential payer Series 2006-CD3 Class A5, 5.617% 10/15/48 | | 227,913 | 229,367 |
| COMM Mortgage Trust: | | | |
| floater Series 2014-KYO Class A, 1.324% 6/11/27 (a)(b) | | 1,500,000 | 1,462,944 |
| Series 2013-LC6 Class ASB, 2.478% 1/10/46 | | 2,180,000 | 2,196,679 |
| Series 2014-CR15 Class A2, 2.928% 2/10/47 | | 3,957,000 | 4,053,423 |
| Series 2014-CR17 Class A2, 3.012% 5/10/47 | | 790,000 | 813,347 |
| Series 2014-CR20 Class A2, 2.801% 11/10/47 | | 987,000 | 1,012,377 |
| Series 2014-UBS3 Class A2, 2.844% 6/10/47 | | 1,960,000 | 2,011,384 |
| Series 2015-CR22 Class A2, 2.856% 3/10/48 | | 953,000 | 981,991 |
| COMM Mortgage Trust pass-thru certificates: | | | |
| floater Series 2005-F10A Class J, 1.2805% 4/15/17 (a)(b) | | 14,378 | 14,277 |
| sequential payer: | | | |
| Series 2006-C7 Class A1A, 5.9515% 6/10/46 (b) | | 469,550 | 470,744 |
| Series 2006-C8: | | | |
| Class A1A, 5.292% 12/10/46 | | 1,093,029 | 1,108,645 |
| Class A4, 5.306% 12/10/46 | | 1,526,955 | 1,548,538 |
| Series 2006-C7 Class A4, 5.9625% 6/10/46 (b) | | 416,734 | 416,935 |
| Credit Suisse Commercial Mortgage Trust sequential payer: | | | |
| Series 2007-C2 Class A3, 5.542% 1/15/49 (b) | | 432,000 | 440,566 |
| Series 2007-C3 Class A4, 5.8888% 6/15/39 (b) | | 1,433,621 | 1,469,107 |
| Credit Suisse First Boston Mortgage Securities Corp. Series 2001-CKN5 Class AX, 0.0141% 9/15/34 (a)(b)(e) | | 102 | 0 |
| CSMC Series 2015-TOWN: | | | |
| Class B, 2.327% 3/15/17 (a)(b) | | 264,000 | 254,854 |
| Class C, 2.677% 3/15/17 (a)(b) | | 257,000 | 245,778 |
| Class D, 3.627% 3/15/17 (a)(b) | | 1,003,000 | 951,358 |
| GAHR Commercial Mortgage Trust: | | | |
| floater Series 2015-NRF Class AFL1, 1.7255% 12/15/16 (a)(b) | | 5,058,216 | 5,009,828 |
| Series 2015-NRF: | | | |
| Class BFX, 3.3822% 12/15/19 (a)(b) | | 2,358,850 | 2,342,301 |
| Class CFX, 3.3822% 12/15/19 (a)(b) | | 1,059,000 | 1,030,239 |
| GE Capital Commercial Mortgage Corp.: | | | |
| sequential payer Series 2007-C1 Class A4, 5.543% 12/10/49 | | 2,544,000 | 2,584,054 |
| Series 2007-C1 Class A1A, 5.483% 12/10/49 (b) | | 5,010,151 | 5,143,722 |
| Greenwich Capital Commercial Funding Corp.: | | | |
| sequential payer Series 2007-GG9 Class A4, 5.444% 3/10/39 | | 918,805 | 938,374 |
| Series 2006-GG7 Class A4, 6.0483% 7/10/38 (b) | | 1,002,018 | 1,004,481 |
| GS Mortgage Securities Corp. Trust Series 2013-C, 2.974% 1/10/30 (a) | | 150,000 | 150,341 |
| GS Mortgage Securities Trust: | | | |
| floater Series 2014-GSFL Class A, 1.4255% 7/15/31 (a)(b) | | 399,314 | 393,225 |
| sequential payer Series 2006-GG8: | | | |
| Class A1A, 5.547% 11/10/39 | | 429,722 | 434,481 |
| Class A4, 5.56% 11/10/39 | | 6,047,719 | 6,096,485 |
| Series 2015-GC32 Class A2, 3.062% 7/10/48 | | 2,500,000 | 2,594,221 |
| Hilton U.S.A. Trust: | | | |
| floater Series 2013-HLF Class AFL, 1.4295% 11/5/30 (a)(b) | | 440,663 | 439,986 |
| Series 2013-HLT: | | | |
| Class CFX, 3.7141% 11/5/30 (a) | | 110,000 | 109,655 |
| Class DFX, 4.4065% 11/5/30 (a) | | 1,039,000 | 1,035,748 |
| JP Morgan Chase Commercial Mortgage Securities Trust Series 2015-JP1 Class A2, 3.1438% 1/15/49 | | 1,975,000 | 2,071,900 |
| JPMBB Commercial Mortgage Secutities Trust Series 2015-C29 Class A2, 2.9213% 5/15/48 | | 1,567,000 | 1,626,740 |
| JPMorgan Chase Commercial Mortgage Securities Trust: | | | |
| floater: | | | |
| Series 2014-BXH Class A, 1.3305% 4/15/27 (a)(b) | | 1,100,000 | 1,086,464 |
| Series 2014-FL5 Class A, 1.4055% 7/15/31 (a)(b) | | 1,056,206 | 1,042,928 |
| sequential payer: | | | |
| Series 2006-CB16 Class A4, 5.552% 5/12/45 | | 1,394,608 | 1,401,800 |
| Series 2006-LDP8: | | | |
| Class A1A, 5.397% 5/15/45 | | 87,443 | 88,065 |
| Class A4, 5.399% 5/15/45 | | 1,456,273 | 1,460,800 |
| Series 2007-LD11 Class A4, 5.9599% 6/15/49 (b) | | 29,781 | 30,375 |
| Series 2007-LDPX Class A3, 5.42% 1/15/49 | | 3,625,347 | 3,696,463 |
| Series 2011-C3 Class A3, 4.3877% 2/15/46 (a) | | 1,718,000 | 1,793,022 |
| Series 2006-LDP7 Class A1A, 6.1056% 4/17/45 (b) | | 808,132 | 811,582 |
| LB-UBS Commercial Mortgage Trust: | | | |
| sequential payer: | | | |
| Series 2006-C6 Class A4, 5.372% 9/15/39 | | 227,635 | 229,746 |
| Series 2006-C7: | | | |
| Class A1A, 5.335% 11/15/38 | | 2,185,310 | 2,221,130 |
| Class A2, 5.3% 11/15/38 | | 26,694 | 26,969 |
| Series 2007-C1 Class A4, 5.424% 2/15/40 | | 2,994,053 | 3,051,337 |
| Series 2006-C6 Class A1A, 5.342% 9/15/39 (b) | | 1,110,047 | 1,120,482 |
| Series 2007-C7 Class A3, 5.866% 9/15/45 | | 1,225,377 | 1,290,861 |
| Merrill Lynch Mortgage Trust: | | | |
| Series 2005-LC1 Class F, 5.9178% 1/12/44 (a)(b) | | 56,826 | 56,723 |
| Series 2006-C2 Class A1A, 5.739% 8/12/43 (b) | | 673,587 | 678,296 |
| Merrill Lynch-CFC Commercial Mortgage Trust: | | | |
| sequential payer Series 2007-5 Class A4, 5.378% 8/12/48 | | 4,549,434 | 4,634,288 |
| Series 2007-6 Class B, 5.635% 3/12/51 (b) | | 216,000 | 60,653 |
| Morgan Stanley BAML Trust Series 2014-C14 Class A2, 2.916% 2/15/47 | | 817,000 | 844,156 |
| Morgan Stanley Capital I Trust: | | | |
| floater: | | | |
| Series 2006-XLF Class C, 1.631% 7/15/19 (a)(b) | | 40,774 | 40,285 |
| Series 2007-XLFA: | | | |
| Class D, 0.6155% 10/15/20 (a)(b) | | 31,745 | 31,747 |
| Class E, 0.6755% 10/15/20 (a)(b) | | 95,138 | 95,143 |
| Class F, 0.7255% 10/15/20 (a)(b) | | 57,094 | 57,097 |
| Class G, 0.7655% 10/15/20 (a)(b) | | 70,577 | 70,581 |
| Class H, 0.8555% 10/15/20 (a)(b) | | 44,426 | 44,471 |
| Class J, 1.0055% 10/15/20 (a)(b) | | 25,649 | 24,833 |
| sequential payer: | | | |
| Series 2007-IQ13 Class A1A, 5.312% 3/15/44 | | 337,456 | 344,969 |
| Series 2011-C2 Class A4, 4.661% 6/15/44 (a) | | 2,725,000 | 3,013,844 |
| Series 2006-HQ9 Class A4, 5.731% 7/12/44 (b) | | 313,668 | 313,471 |
| Series 2006-IQ11 Class A1A, 5.9599% 10/15/42 (b) | | 78,290 | 78,216 |
| Series 2007-IQ14 Class A4, 5.692% 4/15/49 | | 1,195,000 | 1,223,304 |
| Series 2007-T27 Class A1A, 5.8206% 6/11/42 (b) | | 818,328 | 852,290 |
| Providence Place Group Ltd. Partnership sequential payer Series 2000-C1 Class A1, 7.75% 7/20/16 (a) | | 2,678 | 2,743 |
| SCG Trust Series 2013-SRP1 Class A, 1.8255% 11/15/26 (a)(b) | | 2,027,000 | 2,017,928 |
| UBS Commercial Mortgage Trust Series 2012-C1 Class A2, 2.18% 5/10/45 | | 354,364 | 355,548 |
| Wachovia Bank Commercial Mortgage Trust: | | | |
| sequential payer: | | | |
| Series 2006-C29: | | | |
| Class A1A, 5.297% 11/15/48 | | 1,555,134 | 1,583,711 |
| Class A4, 5.308% 11/15/48 | | 553,769 | 559,669 |
| Series 2007-C30 Class A5, 5.342% 12/15/43 | | 5,468,000 | 5,599,694 |
| Series 2007-C32 Class A3, 5.8991% 6/15/49 (b) | | 367,000 | 374,925 |
| Series 2007-C33: | | | |
| Class A4, 6.1491% 2/15/51 (b) | | 3,074,873 | 3,175,855 |
| Class A5, 6.1491% 2/15/51 (b) | | 143,000 | 150,298 |
| Series 2006-C25 Class A1A, 5.9451% 5/15/43 (b) | | 212,102 | 211,739 |
| Series 2006-C26 Class A1A, 6.009% 6/15/45 (b) | | 593,776 | 594,663 |
| Series 2006-C27: | | | |
| Class A1A, 5.749% 7/15/45 (b) | | 434,540 | 436,541 |
| Class A3, 5.765% 7/15/45 (b) | | 459,802 | 459,271 |
| WF-RBS Commercial Mortgage Trust Series 2013-C11 Class ASB, 2.63% 3/15/45 | | 1,310,000 | 1,327,983 |
| WFCG Commercial Mortgage Trust floater Series 2015-BXRP Class A, 1.5475% 11/15/29 (a)(b) | | 1,589,600 | 1,568,778 |
| TOTAL COMMERCIAL MORTGAGE SECURITIES | | | |
| (Cost $145,752,333) | | | 143,432,988 |
|
| Municipal Securities - 0.8% | | | |
| Illinois Gen. Oblig.: | | | |
| Series 2003, 4.95% 6/1/23 | | $2,645,000 | $2,754,186 |
| Series 2011: | | | |
| 4.961% 3/1/16 | | 6,320,000 | 6,320,000 |
| 5.665% 3/1/18 | | 630,000 | 665,204 |
| 5.877% 3/1/19 | | 4,715,000 | 5,096,491 |
| Series 2013, 2.69% 12/1/17 | | 500,000 | 503,905 |
| TOTAL MUNICIPAL SECURITIES | | | |
| (Cost $15,294,534) | | | 15,339,786 |
|
| Foreign Government and Government Agency Obligations - 0.1% | | | |
Brazilian Federative Republic 6% 1/17/17
(Cost $2,071,670) | | $2,000,000 | $2,072,000 |
|
| Supranational Obligations - 0.0% | | | |
International Bank for Reconstruction & Development 1% 6/15/18
(Cost $425,464) | | 426,000 | 425,441 |
|
| Bank Notes - 2.3% | | | |
| Bank of America NA: | | | |
| 1.25% 2/14/17 | | $2,420,000 | $2,418,028 |
| 1.65% 3/26/18 | | 1,924,000 | 1,916,106 |
| 1.75% 6/5/18 | | 2,000,000 | 1,987,380 |
| 5.3% 3/15/17 | | 250,000 | 258,473 |
| Capital One Bank NA: | | | |
| 1.3% 6/5/17 | | 1,000,000 | 994,941 |
| 2.25% 2/13/19 | | 1,000,000 | 992,494 |
| Capital One NA 1.65% 2/5/18 | | 3,000,000 | 2,961,585 |
| Discover Bank 3.1% 6/4/20 | | 1,708,000 | 1,698,731 |
| Fifth Third Bank: | | | |
| 1.45% 2/28/18 | | 580,000 | 574,663 |
| 2.875% 10/1/21 | | 2,000,000 | 2,017,872 |
| First Tennessee Bank NA, Memphis 2.95% 12/1/19 | | 5,000,000 | 4,977,815 |
| JPMorgan Chase Bank 6% 10/1/17 | | 1,762,000 | 1,869,158 |
| KeyBank NA: | | | |
| 1.65% 2/1/18 | | 397,000 | 395,775 |
| 2.5% 12/15/19 | | 3,783,000 | 3,825,230 |
| Manufacturers & Traders Trust Co. 2.3% 1/30/19 | | 1,100,000 | 1,106,466 |
| Marshall & Ilsley Bank 5% 1/17/17 | | 1,868,000 | 1,917,125 |
| Regions Bank 7.5% 5/15/18 | | 250,000 | 275,560 |
| Regions Financial Corp. 2.25% 9/14/18 | | 4,000,000 | 3,982,764 |
| The Toronto-Dominion Bank 2.125% 7/2/19 | | 5,000,000 | 5,039,990 |
| U.S. Bank NA 2.125% 10/28/19 | | 2,186,000 | 2,211,596 |
| Union Bank NA 2.125% 6/16/17 | | 700,000 | 703,690 |
| Wachovia Bank NA 6% 11/15/17 | | 570,000 | 611,779 |
| TOTAL BANK NOTES | | | |
| (Cost $42,604,005) | | | 42,737,221 |
| | | Shares | Value |
|
| Fixed-Income Funds - 0.8% | | | |
| Fidelity Specialized High Income Central Fund (f) | | | |
| (Cost $16,910,667) | | 162,831 | 15,449,410 |
|
| Money Market Funds - 0.8% | | | |
| Fidelity Cash Central Fund, 0.40% (g) | | | |
| (Cost $14,718,871) | | 14,718,871 | 14,718,871 |
| | | Maturity Amount | Value |
|
| Cash Equivalents - 4.1% | | | |
| Investments in repurchase agreements in a joint trading account at 0.4%, dated 2/29/16 due 3/1/16 (Collateralized by U.S. Government Obligations) # (h) | | | |
| (Cost $78,443,000) | | 78,443,872 | 78,443,000 |
| TOTAL INVESTMENT PORTFOLIO - 104.7% | | | |
| (Cost $1,997,336,946) | | | 1,986,476,828 |
| NET OTHER ASSETS (LIABILITIES) - (4.7)% | | | (88,782,241) |
| NET ASSETS - 100% | | | $1,897,694,587 |
Swaps
| Underlying Reference | Rating(1) | Expiration Date | Clearinghouse/Counterparty | Fixed Payment Received/(Paid) | Notional Amount(2) | Value(1) | Upfront Premium Received/(Paid) | Unrealized Appreciation/(Depreciation) |
| Credit Default Swaps | | | | | | | | |
| Sell Protection | | | | | | | | |
| Morgan Stanley ABS Capital I Inc Series 2004-NC8 Class B3 | C | Oct. 2034 | Merrill Lynch International | 4.60% | USD 16,329 | $(1,264) | $0 | $(1,264) |
(1) Ratings are presented for credit default swaps in which the Fund has sold protection on the underlying referenced debt. Ratings for an underlying index represent a weighted average of the ratings of all securities included in the index. The credit rating or value can be measures of the current payment/performance risk. Ratings are from Moody's Investors Service, Inc. Where Moody's® ratings are not available, S&P® ratings are disclosed and are indicated as such. All ratings are as of the report date and do not reflect subsequent changes.
(2) The notional amount of each credit default swap where the Fund has sold protection approximates the maximum potential amount of future payments that the Fund could be required to make if a credit event were to occur.
Legend
(a) Security exempt from registration under Rule 144A of the Securities Act of 1933. These securities may be resold in transactions exempt from registration, normally to qualified institutional buyers. At the end of the period, the value of these securities amounted to $311,245,996 or 16.4% of net assets.
(b) Coupon rates for floating and adjustable rate securities reflect the rates in effect at period end.
(c) Security or a portion of the security has been segregated as collateral for open bi-lateral over-the-counter (OTC) swaps. At period end, the value of securities pledged amounted to $122,073.
(d) Represents an investment in an underlying pool of reverse mortgages which typically do not require regular principal and interest payments as repayment is deferred until a maturity event.
(e) Security represents right to receive monthly interest payments on an underlying pool of mortgages or assets. Principal shown is the outstanding par amount of the pool as of the end of the period.
(f) Affiliated fund that is generally available only to investment companies and other accounts managed by Fidelity Investments. A complete unaudited schedule of portfolio holdings for each Fidelity Central Fund is filed with the SEC for the first and third quarters of each fiscal year on Form N-Q and is available upon request or at the SEC's website at www.sec.gov. An unaudited holdings listing for the Fund, which presents direct holdings as well as the pro-rata share of securities and other investments held indirectly through its investment in underlying non-money market Fidelity Central Funds, is available at fidelity.com and/or advisor.fidelity.com, as applicable. In addition, each Fidelity Central Fund's financial statements are available on the SEC's website or upon request.
(g) Affiliated fund that is generally available only to investment companies and other accounts managed by Fidelity Investments. The rate quoted is the annualized seven-day yield of the fund at period end. A complete unaudited listing of the fund's holdings as of its most recent quarter end is available upon request. In addition, each Fidelity Central Fund's financial statements are available on the SEC's website or upon request.
(h) Includes investment made with cash collateral received from securities on loan.
Affiliated Central Funds
Information regarding fiscal year to date income earned by the Fund from investments in Fidelity Central Funds is as follows:
| Fund | Income earned |
| Fidelity Cash Central Fund | $51,578 |
| Fidelity Specialized High Income Central Fund | 445,486 |
| Total | $497,064 |
Additional information regarding the Fund's fiscal year to date purchases and sales, including the ownership percentage, of the non Money Market Central Funds is as follows:
| Fund | Value, beginning of period | Purchases | Sales Proceeds | Value, end of period | % ownership, end of period |
| Fidelity Specialized High Income Central Fund | $16,060,481 | $447,917 | $-- | $15,449,410 | 1.9% |
| Total | $16,060,481 | $447,917 | $-- | $15,449,410 | |
Investment Valuation
The following is a summary of the inputs used, as of February 29, 2016, involving the Fund's assets and liabilities carried at fair value. The inputs or methodology used for valuing securities may not be an indication of the risk associated with investing in those securities. For more information on valuation inputs, and their aggregation into the levels used below, please refer to the Investment Valuation section in the accompanying Notes to Financial Statements.
| | Valuation Inputs at Reporting Date: |
| Description | Total | Level 1 | Level 2 | Level 3 |
| Investments in Securities: | | | | |
| Corporate Bonds | $1,321,778,285 | $-- | $1,321,778,285 | $-- |
| U.S. Government and Government Agency Obligations | 148,452,340 | -- | 148,452,340 | -- |
| U.S. Government Agency - Mortgage Securities | 12,635,572 | -- | 12,635,572 | -- |
| Asset-Backed Securities | 160,328,585 | -- | 159,932,939 | 395,646 |
| Collateralized Mortgage Obligations | 30,663,329 | -- | 30,663,329 | -- |
| Commercial Mortgage Securities | 143,432,988 | -- | 143,432,610 | 378 |
| Municipal Securities | 15,339,786 | -- | 15,339,786 | -- |
| Foreign Government and Government Agency Obligations | 2,072,000 | -- | 2,072,000 | -- |
| Supranational Obligations | 425,441 | -- | 425,441 | -- |
| Bank Notes | 42,737,221 | -- | 42,737,221 | -- |
| Fixed-Income Funds | 15,449,410 | 15,449,410 | -- | -- |
| Money Market Funds | 14,718,871 | 14,718,871 | -- | -- |
| Cash Equivalents | 78,443,000 | -- | 78,443,000 | -- |
| Total Investments in Securities: | $1,986,476,828 | $30,168,281 | $1,955,912,523 | $396,024 |
| Derivative Instruments: | | | | |
| Liabilities | | | | |
| Swaps | $(1,264) | $-- | $(1,264) | $-- |
| Total Liabilities | $(1,264) | $-- | $(1,264) | $-- |
| Total Derivative Instruments: | $(1,264) | $-- | $(1,264) | $-- |
Value of Derivative Instruments
The following table is a summary of the Fund's value of derivative instruments by primary risk exposure as of February 29, 2016. For additional information on derivative instruments, please refer to the Derivative Instruments section in the accompanying Notes to Financial Statements.
| Primary Risk Exposure / Derivative Type | Value |
| | Asset | Liability |
| Credit Risk | | |
| Swaps(a) | $0 | $(1,264) |
| Total Credit Risk | 0 | (1,264) |
| Total Value of Derivatives | $0 | $(1,264) |
(a) For bi-lateral OTC swaps, reflects gross value which is presented in the Statement of Assets and Liabilities in the bi-lateral OTC swaps, at value line-items.
Other Information
# Additional information on each counterparty to the repurchase agreement is as follows:
| Repurchase Agreement / Counterparty | Value |
| $78,443,000 due 3/01/16 at 0.40% | |
| Commerz Markets LLC | $78,443,000 |
| | $78,443,000 |
Distribution of investments by country or territory of incorporation, as a percentage of Total Net Assets, is as follows (Unaudited):
| United States of America | 84.5% |
| United Kingdom | 4.7% |
| Canada | 2.8% |
| Japan | 1.6% |
| France | 1.1% |
| Others (Individually Less Than 1%) | 5.3% |
| | 100.0% |
The information in the above table is based on the combined investments of the Fund and its pro-rata share of the investments of Fidelity's Fixed-Income Central Funds.
See accompanying notes which are an integral part of the financial statements.
Financial Statements
Statement of Assets and Liabilities
| | | February 29, 2016 (Unaudited) |
| Assets | | |
Investment in securities, at value (including repurchase agreements of $78,443,000) — See accompanying schedule:
Unaffiliated issuers (cost $1,965,707,408) | $1,956,308,547 | |
| Fidelity Central Funds (cost $31,629,538) | 30,168,281 | |
| Total Investments (cost $1,997,336,946) | | $1,986,476,828 |
| Cash | | 17,300 |
| Receivable for investments sold | | 4,580,612 |
| Receivable for fund shares sold | | 5,143,838 |
| Interest receivable | | 10,745,959 |
| Distributions receivable from Fidelity Central Funds | | 85,876 |
| Other receivables | | 667 |
| Total assets | | 2,007,051,080 |
| Liabilities | | |
| Payable for investments purchased | $25,112,869 | |
| Payable for fund shares redeemed | 4,552,431 | |
| Distributions payable | 295,543 | |
| Bi-lateral OTC swaps, at value | 1,264 | |
| Accrued management fee | 488,306 | |
| Distribution and service plan fees payable | 197,027 | |
| Other affiliated payables | 265,748 | |
| Other payables and accrued expenses | 5 | |
| Collateral on securities loaned, at value | 78,443,300 | |
| Total liabilities | | 109,356,493 |
| Net Assets | | $1,897,694,587 |
| Net Assets consist of: | | |
| Paid in capital | | $1,927,755,442 |
| Undistributed net investment income | | 2,808,318 |
| Accumulated undistributed net realized gain (loss) on investments | | (22,007,791) |
| Net unrealized appreciation (depreciation) on investments | | (10,861,382) |
| Net Assets | | $1,897,694,587 |
| Calculation of Maximum Offering Price | | |
| Class A: | | |
| Net Asset Value and redemption price per share ($314,703,093 ÷ 27,708,466 shares) | | $11.36 |
| Maximum offering price per share (100/97.25 of $11.36) | | $11.68 |
| Class T: | | |
| Net Asset Value and redemption price per share ($193,597,348 ÷ 17,035,689 shares) | | $11.36 |
| Maximum offering price per share (100/97.25 of $11.36) | | $11.68 |
| Class B: | | |
| Net Asset Value and offering price per share ($900,323 ÷ 79,367 shares)(a) | | $11.34 |
| Class C: | | |
| Net Asset Value and offering price per share ($111,047,135 ÷ 9,799,616 shares)(a) | | $11.33 |
| Fidelity Limited Term Bond Fund: | | |
| Net Asset Value, offering price and redemption price per share ($831,639,600 ÷ 73,036,683 shares) | | $11.39 |
| Class I: | | |
| Net Asset Value, offering price and redemption price per share ($445,807,088 ÷ 39,144,534 shares) | | $11.39 |
(a) Redemption price per share is equal to net asset value less any applicable contingent deferred sales charge.
See accompanying notes which are an integral part of the financial statements.
Statement of Operations
| | | Six months ended February 29, 2016 (Unaudited) |
| Investment Income | | |
| Interest | | $22,504,412 |
| Income from Fidelity Central Funds | | 497,064 |
| Total income | | 23,001,476 |
| Expenses | | |
| Management fee | $2,770,688 | |
| Transfer agent fees | 1,186,625 | |
| Distribution and service plan fees | 1,093,513 | |
| Fund wide operations fee | 344,661 | |
| Independent trustees' compensation | 3,709 | |
| Miscellaneous | 1,153 | |
| Total expenses before reductions | 5,400,349 | |
| Expense reductions | (647) | 5,399,702 |
| Net investment income (loss) | | 17,601,774 |
| Realized and Unrealized Gain (Loss) | | |
| Net realized gain (loss) on: | | |
| Investment securities: | | |
| Unaffiliated issuers | 1,379,535 | |
| Swaps | 505 | |
| Total net realized gain (loss) | | 1,380,040 |
Change in net unrealized appreciation (depreciation) on:
Investment securities | (11,704,758) | |
| Swaps | 1,507 | |
| Total change in net unrealized appreciation (depreciation) | | (11,703,251) |
| Net gain (loss) | | (10,323,211) |
| Net increase (decrease) in net assets resulting from operations | | $7,278,563 |
See accompanying notes which are an integral part of the financial statements.
Statement of Changes in Net Assets
| | Six months ended February 29, 2016 (Unaudited) | Year ended August 31, 2015 |
| Increase (Decrease) in Net Assets | | |
| Operations | | |
| Net investment income (loss) | $17,601,774 | $21,313,755 |
| Net realized gain (loss) | 1,380,040 | 2,048,322 |
| Change in net unrealized appreciation (depreciation) | (11,703,251) | (16,775,250) |
| Net increase (decrease) in net assets resulting from operations | 7,278,563 | 6,586,827 |
| Distributions to shareholders from net investment income | (16,486,255) | (19,985,756) |
| Share transactions - net increase (decrease) | 176,353,500 | 941,601,529 |
| Total increase (decrease) in net assets | 167,145,808 | 928,202,600 |
| Net Assets | | |
| Beginning of period | 1,730,548,779 | 802,346,179 |
| End of period (including undistributed net investment income of $2,808,318 and undistributed net investment income of $1,692,799, respectively) | $1,897,694,587 | $1,730,548,779 |
See accompanying notes which are an integral part of the financial statements.
Financial Highlights — Fidelity Advisor Limited Term Bond Fund Class A
| | Six months ended February 29, (Unaudited) | Years ended August 31, | | | | |
| | 2016 | 2015 | 2014 | 2013 | 2012 | 2011 |
| Selected Per–Share Data | | | | | | |
| Net asset value, beginning of period | $11.42 | $11.52 | $11.33 | $11.69 | $11.45 | $11.28 |
| Income from Investment Operations | | | | | | |
| Net investment income (loss)A | .104 | .170 | .232 | .243 | .289 | .344 |
| Net realized and unrealized gain (loss) | (.068) | (.111) | .160 | (.384) | .215 | .163 |
| Total from investment operations | .036 | .059 | .392 | (.141) | .504 | .507 |
| Distributions from net investment income | (.096) | (.159) | (.202) | (.219) | (.264) | (.322) |
| Distributions from net realized gain | – | – | – | – | – | (.015) |
| Total distributions | (.096) | (.159) | (.202) | (.219) | (.264) | (.337) |
| Net asset value, end of period | $11.36 | $11.42 | $11.52 | $11.33 | $11.69 | $11.45 |
| Total ReturnB,C,D | .32% | .51% | 3.48% | (1.24)% | 4.46% | 4.59% |
| Ratios to Average Net AssetsE,F | | | | | | |
| Expenses before reductions | .76%G | .76% | .79% | .82% | .83% | .83% |
| Expenses net of fee waivers, if any | .76%G | .76% | .79% | .82% | .83% | .83% |
| Expenses net of all reductions | .76%G | .76% | .79% | .82% | .83% | .83% |
| Net investment income (loss) | 1.83%G | 1.48% | 2.02% | 2.09% | 2.52% | 3.06% |
| Supplemental Data | | | | | | |
| Net assets, end of period (000 omitted) | $314,703 | $304,040 | $215,800 | $155,980 | $192,761 | $187,442 |
| Portfolio turnover rateH | 40%G | 44% | 94% | 112% | 129% | 108%I |
A Calculated based on average shares outstanding during the period.
B Total returns for periods of less than one year are not annualized.
C Total returns would have been lower if certain expenses had not been reduced during the applicable periods shown.
D Total returns do not include the effect of the sales charges.
E Fees and expenses of any underlying Fidelity Central Funds are not included in the Fund's expense ratio. The Fund indirectly bears its proportionate share of the expenses of any underlying Fidelity Central Funds. Based on their most recent shareholder report date, the expenses of any underlying non-money market Fidelity Central Funds were less than .005%.
F Expense ratios reflect operating expenses of the class. Expenses before reductions do not reflect amounts reimbursed by the investment adviser or reductions from expense offset arrangements and do not represent the amount paid by the class during periods when reimbursements or reductions occur. Expenses net of fee waivers reflect expenses after reimbursement by the investment adviser but prior to reductions from expense offset arrangements. Expenses net of all reductions represent the net expenses paid by the class.
G Annualized
H Amount does not include the portfolio activity of any underlying Fidelity Central Funds.
I The portfolio turnover rate excludes liquidations and redemptions executed in-kind from Affiliated Central Funds.
See accompanying notes which are an integral part of the financial statements.
Financial Highlights — Fidelity Advisor Limited Term Bond Fund Class T
| | Six months ended February 29, (Unaudited) | Years ended August 31, | | | | |
| | 2016 | 2015 | 2014 | 2013 | 2012 | 2011 |
| Selected Per–Share Data | | | | | | |
| Net asset value, beginning of period | $11.42 | $11.53 | $11.34 | $11.70 | $11.45 | $11.29 |
| Income from Investment Operations | | | | | | |
| Net investment income (loss)A | .103 | .170 | .234 | .246 | .292 | .348 |
| Net realized and unrealized gain (loss) | (.067) | (.121) | .161 | (.384) | .225 | .153 |
| Total from investment operations | .036 | .049 | .395 | (.138) | .517 | .501 |
| Distributions from net investment income | (.096) | (.159) | (.205) | (.222) | (.267) | (.326) |
| Distributions from net realized gain | – | – | – | – | – | (.015) |
| Total distributions | (.096) | (.159) | (.205) | (.222) | (.267) | (.341) |
| Net asset value, end of period | $11.36 | $11.42 | $11.53 | $11.34 | $11.70 | $11.45 |
| Total ReturnB,C,D | .32% | .42% | 3.50% | (1.21)% | 4.57% | 4.53% |
| Ratios to Average Net AssetsE,F | | | | | | |
| Expenses before reductions | .77%G | .76% | .77% | .80% | .80% | .80% |
| Expenses net of fee waivers, if any | .77%G | .76% | .77% | .80% | .80% | .80% |
| Expenses net of all reductions | .77%G | .76% | .77% | .80% | .80% | .80% |
| Net investment income (loss) | 1.83%G | 1.48% | 2.04% | 2.11% | 2.54% | 3.09% |
| Supplemental Data | | | | | | |
| Net assets, end of period (000 omitted) | $193,597 | $193,612 | $198,510 | $210,150 | $265,426 | $274,215 |
| Portfolio turnover rateH | 40%G | 44% | 94% | 112% | 129% | 108%I |
A Calculated based on average shares outstanding during the period.
B Total returns for periods of less than one year are not annualized.
C Total returns would have been lower if certain expenses had not been reduced during the applicable periods shown.
D Total returns do not include the effect of the sales charges.
E Fees and expenses of any underlying Fidelity Central Funds are not included in the Fund's expense ratio. The Fund indirectly bears its proportionate share of the expenses of any underlying Fidelity Central Funds. Based on their most recent shareholder report date, the expenses of any underlying non-money market Fidelity Central Funds were less than .005%.
F Expense ratios reflect operating expenses of the class. Expenses before reductions do not reflect amounts reimbursed by the investment adviser or reductions from expense offset arrangements and do not represent the amount paid by the class during periods when reimbursements or reductions occur. Expenses net of fee waivers reflect expenses after reimbursement by the investment adviser but prior to reductions from expense offset arrangements. Expenses net of all reductions represent the net expenses paid by the class.
G Annualized
H Amount does not include the portfolio activity of any underlying Fidelity Central Funds.
I The portfolio turnover rate excludes liquidations and redemptions executed in-kind from Affiliated Central Funds.
See accompanying notes which are an integral part of the financial statements.
Financial Highlights — Fidelity Advisor Limited Term Bond Fund Class B
| | Six months ended February 29, (Unaudited) | Years ended August 31, | | | | |
| | 2016 | 2015 | 2014 | 2013 | 2012 | 2011 |
| Selected Per–Share Data | | | | | | |
| Net asset value, beginning of period | $11.40 | $11.51 | $11.32 | $11.68 | $11.43 | $11.27 |
| Income from Investment Operations | | | | | | |
| Net investment income (loss)A | .062 | .090 | .149 | .159 | .206 | .264 |
| Net realized and unrealized gain (loss) | (.068) | (.122) | .161 | (.384) | .225 | .154 |
| Total from investment operations | (.006) | (.032) | .310 | (.225) | .431 | .418 |
| Distributions from net investment income | (.054) | (.078) | (.120) | (.135) | (.181) | (.243) |
| Distributions from net realized gain | – | – | – | – | – | (.015) |
| Total distributions | (.054) | (.078) | (.120) | (.135) | (.181) | (.258) |
| Net asset value, end of period | $11.34 | $11.40 | $11.51 | $11.32 | $11.68 | $11.43 |
| Total ReturnB,C,D | (.05)% | (.28)% | 2.75% | (1.95)% | 3.81% | 3.77% |
| Ratios to Average Net AssetsE,F | | | | | | |
| Expenses before reductions | 1.51%G | 1.46% | 1.51% | 1.55% | 1.55% | 1.55% |
| Expenses net of fee waivers, if any | 1.51%G | 1.46% | 1.51% | 1.55% | 1.55% | 1.55% |
| Expenses net of all reductions | 1.51%G | 1.46% | 1.51% | 1.55% | 1.55% | 1.55% |
| Net investment income (loss) | 1.09%G | .78% | 1.30% | 1.36% | 1.79% | 2.35% |
| Supplemental Data | | | | | | |
| Net assets, end of period (000 omitted) | $900 | $919 | $1,507 | $2,956 | $5,209 | $7,018 |
| Portfolio turnover rateH | 40%G | 44% | 94% | 112% | 129% | 108%I |
A Calculated based on average shares outstanding during the period.
B Total returns for periods of less than one year are not annualized.
C Total returns would have been lower if certain expenses had not been reduced during the applicable periods shown.
D Total returns do not include the effect of the contingent deferred sales charge.
E Fees and expenses of any underlying Fidelity Central Funds are not included in the Fund's expense ratio. The Fund indirectly bears its proportionate share of the expenses of any underlying Fidelity Central Funds. Based on their most recent shareholder report date, the expenses of any underlying non-money market Fidelity Central Funds were less than .005%.
F Expense ratios reflect operating expenses of the class. Expenses before reductions do not reflect amounts reimbursed by the investment adviser or reductions from expense offset arrangements and do not represent the amount paid by the class during periods when reimbursements or reductions occur. Expenses net of fee waivers reflect expenses after reimbursement by the investment adviser but prior to reductions from expense offset arrangements. Expenses net of all reductions represent the net expenses paid by the class.
G Annualized
H Amount does not include the portfolio activity of any underlying Fidelity Central Funds.
I The portfolio turnover rate excludes liquidations and redemptions executed in-kind from Affiliated Central Funds.
See accompanying notes which are an integral part of the financial statements.
Financial Highlights — Fidelity Advisor Limited Term Bond Fund Class C
| | Six months ended February 29, (Unaudited) | Years ended August 31, | | | | |
| | 2016 | 2015 | 2014 | 2013 | 2012 | 2011 |
| Selected Per–Share Data | | | | | | |
| Net asset value, beginning of period | $11.39 | $11.50 | $11.31 | $11.67 | $11.42 | $11.26 |
| Income from Investment Operations | | | | | | |
| Net investment income (loss)A | .060 | .081 | .143 | .155 | .204 | .262 |
| Net realized and unrealized gain (loss) | (.068) | (.121) | .162 | (.384) | .225 | .154 |
| Total from investment operations | (.008) | (.040) | .305 | (.229) | .429 | .416 |
| Distributions from net investment income | (.052) | (.070) | (.115) | (.131) | (.179) | (.241) |
| Distributions from net realized gain | – | – | – | – | – | (.015) |
| Total distributions | (.052) | (.070) | (.115) | (.131) | (.179) | (.256) |
| Net asset value, end of period | $11.33 | $11.39 | $11.50 | $11.31 | $11.67 | $11.42 |
| Total ReturnB,C,D | (.07)% | (.35)% | 2.70% | (1.98)% | 3.79% | 3.76% |
| Ratios to Average Net AssetsE,F | | | | | | |
| Expenses before reductions | 1.54%G | 1.54% | 1.56% | 1.58% | 1.57% | 1.56% |
| Expenses net of fee waivers, if any | 1.54%G | 1.54% | 1.56% | 1.58% | 1.57% | 1.56% |
| Expenses net of all reductions | 1.54%G | 1.54% | 1.56% | 1.58% | 1.57% | 1.56% |
| Net investment income (loss) | 1.06%G | .71% | 1.25% | 1.34% | 1.78% | 2.33% |
| Supplemental Data | | | | | | |
| Net assets, end of period (000 omitted) | $111,047 | $81,929 | $64,333 | $53,096 | $65,425 | $63,435 |
| Portfolio turnover rateH | 40%G | 44% | 94% | 112% | 129% | 108%I |
A Calculated based on average shares outstanding during the period.
B Total returns for periods of less than one year are not annualized.
C Total returns would have been lower if certain expenses had not been reduced during the applicable periods shown.
D Total returns do not include the effect of the contingent deferred sales charge.
E Fees and expenses of any underlying Fidelity Central Funds are not included in the Fund's expense ratio. The Fund indirectly bears its proportionate share of the expenses of any underlying Fidelity Central Funds. Based on their most recent shareholder report date, the expenses of any underlying non-money market Fidelity Central Funds were less than .005%.
F Expense ratios reflect operating expenses of the class. Expenses before reductions do not reflect amounts reimbursed by the investment adviser or reductions from expense offset arrangements and do not represent the amount paid by the class during periods when reimbursements or reductions occur. Expenses net of fee waivers reflect expenses after reimbursement by the investment adviser but prior to reductions from expense offset arrangements. Expenses net of all reductions represent the net expenses paid by the class.
G Annualized
H Amount does not include the portfolio activity of any underlying Fidelity Central Funds.
I The portfolio turnover rate excludes liquidations and redemptions executed in-kind from Affiliated Central Funds.
See accompanying notes which are an integral part of the financial statements.
Financial Highlights — Fidelity Advisor Limited Term Bond Fund
| | Six months ended February 29, (Unaudited) | Years ended August 31, | |
| | 2016 | 2015 | 2014 A |
| Selected Per–Share Data | | | |
| Net asset value, beginning of period | $11.45 | $11.55 | $11.50 |
| Income from Investment Operations | | | |
| Net investment income (loss)B | .122 | .205 | .209 |
| Net realized and unrealized gain (loss) | (.068) | (.110) | .038 |
| Total from investment operations | .054 | .095 | .247 |
| Distributions from net investment income | (.114) | (.195) | (.197) |
| Net asset value, end of period | $11.39 | $11.45 | $11.55 |
| Total ReturnC,D | .48% | .83% | 2.17% |
| Ratios to Average Net AssetsE,F | | | |
| Expenses before reductions | .45%G | .45% | .46%G |
| Expenses net of fee waivers, if any | .45%G | .45% | .46%G |
| Expenses net of all reductions | .45%G | .45% | .46%G |
| Net investment income (loss) | 2.14%G | 1.79% | 2.22%G |
| Supplemental Data | | | |
| Net assets, end of period (000 omitted) | $831,640 | $758,240 | $147,629 |
| Portfolio turnover rateH | 40%G | 44% | 94% |
A For the period November 1, 2013 (commencement of sale of shares) to August 31, 2014.
B Calculated based on average shares outstanding during the period.
C Total returns for periods of less than one year are not annualized.
D Total returns would have been lower if certain expenses had not been reduced during the applicable periods shown.
E Fees and expenses of any underlying Fidelity Central Funds are not included in the Fund's expense ratio. The Fund indirectly bears its proportionate share of the expenses of any underlying Fidelity Central Funds. Based on their most recent shareholder report date, the expenses of any underlying non-money market Fidelity Central Funds were less than .005%.
F Expense ratios reflect operating expenses of the class. Expenses before reductions do not reflect amounts reimbursed by the investment adviser or reductions from expense offset arrangements and do not represent the amount paid by the class during periods when reimbursements or reductions occur. Expense ratios before reductions for start-up periods may not be representative of longer-term operating periods. Expenses net of fee waivers reflect expenses after reimbursement by the investment adviser but prior to reductions from expense offset arrangements. Expenses net of all reductions represent the net expenses paid by the class.
G Annualized
H Amount does not include the portfolio activity of any underlying Fidelity Central Funds.
See accompanying notes which are an integral part of the financial statements.
Financial Highlights — Fidelity Advisor Limited Term Bond Fund Class I
| | Six months ended February 29, (Unaudited) | Years ended August 31, | | | | |
| | 2016 | 2015 | 2014 | 2013 | 2012 | 2011 |
| Selected Per–Share Data | | | | | | |
| Net asset value, beginning of period | $11.45 | $11.55 | $11.36 | $11.72 | $11.48 | $11.31 |
| Income from Investment Operations | | | | | | |
| Net investment income (loss)A | .119 | .200 | .262 | .273 | .319 | .373 |
| Net realized and unrealized gain (loss) | (.068) | (.111) | .161 | (.385) | .213 | .163 |
| Total from investment operations | .051 | .089 | .423 | (.112) | .532 | .536 |
| Distributions from net investment income | (.111) | (.189) | (.233) | (.248) | (.292) | (.351) |
| Distributions from net realized gain | – | – | – | – | – | (.015) |
| Total distributions | (.111) | (.189) | (.233) | (.248) | (.292) | (.366) |
| Net asset value, end of period | $11.39 | $11.45 | $11.55 | $11.36 | $11.72 | $11.48 |
| Total ReturnB,C | .45% | .78% | 3.74% | (.99)% | 4.71% | 4.85% |
| Ratios to Average Net AssetsD,E | | | | | | |
| Expenses before reductions | .50%F | .50% | .53% | .57% | .58% | .58% |
| Expenses net of fee waivers, if any | .50%F | .50% | .53% | .57% | .58% | .58% |
| Expenses net of all reductions | .50%F | .50% | .53% | .57% | .58% | .58% |
| Net investment income (loss) | 2.09%F | 1.74% | 2.28% | 2.34% | 2.77% | 3.32% |
| Supplemental Data | | | | | | |
| Net assets, end of period (000 omitted) | $445,807 | $391,808 | $174,568 | $84,843 | $101,234 | $89,583 |
| Portfolio turnover rateG | 40%F | 44% | 94% | 112% | 129% | 108%H |
A Calculated based on average shares outstanding during the period.
B Total returns for periods of less than one year are not annualized.
C Total returns would have been lower if certain expenses had not been reduced during the applicable periods shown.
D Fees and expenses of any underlying Fidelity Central Funds are not included in the Fund's expense ratio. The Fund indirectly bears its proportionate share of the expenses of any underlying Fidelity Central Funds. Based on their most recent shareholder report date, the expenses of any underlying non-money market Fidelity Central Funds were less than .005%.
E Expense ratios reflect operating expenses of the class. Expenses before reductions do not reflect amounts reimbursed by the investment adviser or reductions from expense offset arrangements and do not represent the amount paid by the class during periods when reimbursements or reductions occur. Expenses net of fee waivers reflect expenses after reimbursement by the investment adviser but prior to reductions from expense offset arrangements. Expenses net of all reductions represent the net expenses paid by the class.
F Annualized
G Amount does not include the portfolio activity of any underlying Fidelity Central Funds.
H The portfolio turnover rate excludes liquidations and redemptions executed in-kind from Affiliated Central Funds.
See accompanying notes which are an integral part of the financial statements.
Notes to Financial Statements (Unaudited)
For the period ended February 29, 2016
1. Organization.
Fidelity Advisor Limited Term Bond Fund (the Fund) is a fund of Fidelity Advisor Series II (the Trust) and is authorized to issue an unlimited number of shares. The Trust is registered under the Investment Company Act of 1940, as amended (the 1940 Act), as an open-end management investment company organized as a Massachusetts business trust. The Fund offers Class A, Class T, Class C, Fidelity Limited Term Bond and Class I shares, each of which, along with Class B shares, has equal rights as to assets and voting privileges. Class B shares are closed to new accounts and additional purchases, except for exchanges and reinvestments. Each class has exclusive voting rights with respect to matters that affect that class. Class B shares will automatically convert to Class A shares after a maximum holding period of four years from the initial date of purchase.
During the period, the Board of Trustees approved the conversion of all existing Class B shares into Class A shares, effective on or about July 1, 2016, regardless of the length of times shares have been held.
2. Investments in Fidelity Central Funds.
The Fund invests in Fidelity Central Funds, which are open-end investment companies generally available only to other investment companies and accounts managed by the investment adviser and its affiliates. The Fund's Schedule of Investments lists each of the Fidelity Central Funds held as of period end, if any, as an investment of the Fund, but does not include the underlying holdings of each Fidelity Central Fund. As an Investing Fund, the Fund indirectly bears its proportionate share of the expenses of the underlying Fidelity Central Funds.
Based on its investment objective, each Fidelity Central Fund may invest or participate in various investment vehicles or strategies that are similar to those of the Fund. These strategies are consistent with the investment objectives of the Fund and may involve certain economic risks which may cause a decline in value of each of the Fidelity Central Funds and thus a decline in the value of the Fund. The Money Market Central Funds seek preservation of capital and current income and are managed by Fidelity Investments Money Management, Inc. (FIMM), an affiliate of the investment adviser. Annualized expenses of the Money Market Central Funds as of their most recent shareholder report date are less than .005%. The following summarizes the Fund's investment in each non-money market Fidelity Central Fund.
| Fidelity Central Fund | Investment Manager | Investment Objective | Investment Practices | Expense Ratio(a) |
| Fidelity Specialized High Income Central Fund | FMR Co., Inc. (FMRC) | Seeks a high level of current income by normally investing in income-producing debt securities, with an emphasis on lower-quality debt securities. | Loans & Direct Debt Instruments
Restricted Securities
| Less than .005% |
(a) Expenses expressed as a percentage of average net assets and are as of each underlying Central Fund's most recent annual or semi-annual shareholder report.
An unaudited holdings listing for the Fund, which presents direct holdings as well as the pro-rata share of any securities and other investments held indirectly through its investment in underlying non-money market Fidelity Central Funds, is available at fidelity.com and/or advisor.fidelity.com, as applicable. A complete unaudited list of holdings for each Fidelity Central Fund is available upon request or at the Securities and Exchange Commission (the SEC) website at www.sec.gov. In addition, the financial statements of the Fidelity Central Funds which contain the significant accounting policies (including investment valuation policies) of those funds are available on the SEC website or upon request.
3. Significant Accounting Policies.
The financial statements have been prepared in conformity with accounting principles generally accepted in the United States of America (GAAP), which require management to make certain estimates and assumptions at the date of the financial statements. Actual results could differ from those estimates. Subsequent events, if any, through the date that the financial statements were issued have been evaluated in the preparation of the financial statements. The following summarizes the significant accounting policies of the Fund:
Investment Valuation. Investments are valued as of 4:00 p.m. Eastern time on the last calendar day of the period. The Board of Trustees (the Board) has delegated the day to day responsibility for the valuation of the Fund's investments to the Fidelity Management & Research Company (FMR) Fair Value Committee (the Committee). In accordance with valuation policies and procedures approved by the Board, the Fund attempts to obtain prices from one or more third party pricing vendors or brokers to value its investments. When current market prices, quotations or currency exchange rates are not readily available or reliable, investments will be fair valued in good faith by the Committee, in accordance with procedures adopted by the Board. Factors used in determining fair value vary by investment type and may include market or investment specific events, changes in interest rates and credit quality. The frequency with which these procedures are used cannot be predicted and they may be utilized to a significant extent. The Committee oversees the Fund's valuation policies and procedures and reports to the Board on the Committee's activities and fair value determinations. The Board monitors the appropriateness of the procedures used in valuing the Fund's investments and ratifies the fair value determinations of the Committee.
The Fund categorizes the inputs to valuation techniques used to value its investments into a disclosure hierarchy consisting of three levels as shown below:
- Level 1 – quoted prices in active markets for identical investments
- Level 2 – other significant observable inputs (including quoted prices for similar investments, interest rates, prepayment speeds, etc.)
- Level 3 – unobservable inputs (including the Fund's own assumptions based on the best information available)
Valuation techniques used to value the Fund's investments by major category are as follows:
Debt securities, including restricted securities, are valued based on evaluated prices received from third party pricing vendors or from brokers who make markets in such securities. Corporate bonds, bank notes, foreign government and government agency obligations, municipal securities, supranational obligations and U.S. government and government agency obligations, are valued by pricing vendors who utilize matrix pricing which considers yield or price of bonds of comparable quality, coupon, maturity and type or by broker-supplied prices. Asset backed securities, collateralized mortgage obligations, commercial mortgage securities and U.S. government agency mortgage securities, are valued by pricing vendors who utilize matrix pricing which considers prepayment speed assumptions, attributes of the collateral, yield or price of bonds of comparable quality, coupon, maturity and type or by broker-supplied prices. Swaps are marked-to-market daily based on valuations from third party pricing vendors, registered derivatives clearing organizations (clearinghouses) or broker-supplied valuations. These pricing sources may utilize inputs such as interest rate curves, credit spread curves, default possibilities and recovery rates. When independent prices are unavailable or unreliable, debt securities and swaps may be valued utilizing pricing methodologies which consider similar factors that would be used by third party pricing vendors. Debt securities and swaps are generally categorized as Level 2 in the hierarchy but may be Level 3 depending on the circumstances.
Investments in open-end mutual funds, including the Fidelity Central Funds, are valued at their closing net asset value (NAV) each business day and are categorized as Level 1 in the hierarchy. Short-term securities with remaining maturities of sixty days or less may be valued at amortized cost, which approximates fair value, and are categorized as Level 2 in the hierarchy.
Changes in valuation techniques may result in transfers in or out of an assigned level within the disclosure hierarchy. The aggregate value of investments by input level as of February 29, 2016 is included at the end of the Fund's Schedule of Investments.
Investment Transactions and Income. For financial reporting purposes, the Fund's investment holdings and NAV include trades executed through the end of the last business day of the period. The NAV per share for processing shareholder transactions is calculated as of the close of business of the New York Stock Exchange (NYSE), normally 4:00 p.m. Eastern time and includes trades executed through the end of the prior business day. Gains and losses on securities sold are determined on the basis of identified cost and may include proceeds received from litigation. Income and capital gain distributions from Fidelity Central Funds, if any, are recorded on the ex-dividend date. Interest income is accrued as earned and includes coupon interest and amortization of premium and accretion of discount on debt securities as applicable. Debt obligations may be placed on non-accrual status and related interest income may be reduced by ceasing current accruals and writing off interest receivables when the collection of all or a portion of interest has become doubtful based on consistently applied procedures. A debt obligation is removed from non-accrual status when the issuer resumes interest payments or when collectability of interest is reasonably assured.
Class Allocations and Expenses. Investment income, realized and unrealized capital gains and losses, common expenses of the Fund, and certain fund-level expense reductions, if any, are allocated daily on a pro-rata basis to each class based on the relative net assets of each class to the total net assets of the Fund. Each class differs with respect to transfer agent and distribution and service plan fees incurred. Certain expense reductions may also differ by class. For the reporting period, the allocated portion of income and expenses to each class as a percent of its average net assets may vary due to the timing of recording these transactions in relation to fluctuating net assets of the classes. Expenses directly attributable to a fund are charged to that fund. Expenses attributable to more than one fund are allocated among the respective funds on the basis of relative net assets or other appropriate methods. Expense estimates are accrued in the period to which they relate and adjustments are made when actual amounts are known.
Income Tax Information and Distributions to Shareholders. Each year, the Fund intends to qualify as a regulated investment company under Subchapter M of the Internal Revenue Code, including distributing substantially all of its taxable income and realized gains. As a result, no provision for U.S. Federal income taxes is required. The Fund files a U.S. federal tax return, in addition to state and local tax returns as required. The Fund's federal income tax returns are subject to examination by the Internal Revenue Service (IRS) for a period of three fiscal years after they are filed. State and local tax returns may be subject to examination for an additional fiscal year depending on the jurisdiction.
Dividends are declared and recorded daily and paid monthly from net investment income. Distributions from realized gains, if any, are declared and recorded on the ex-dividend date. Income dividends and capital gain distributions are declared separately for each class. Income and capital gain distributions are determined in accordance with income tax regulations, which may differ from GAAP.
Capital accounts within the financial statements are adjusted for permanent book-tax differences. These adjustments have no impact on net assets or the results of operations. Capital accounts are not adjusted for temporary book-tax differences which will reverse in a subsequent period.
Book-tax differences are primarily due to swaps, market discount, partnerships (including allocations from Fidelity Central Funds), deferred trustees compensation, capital loss carryforwards and losses deferred due to wash sales and excise tax regulations.
The federal tax cost of investment securities and unrealized appreciation (depreciation) as of period end were as follows:
| Gross unrealized appreciation | $12,563,690 |
| Gross unrealized depreciation | (21,334,988) |
| Net unrealized appreciation (depreciation) on securities | $(8,771,298) |
| Tax cost | $1,995,248,126 |
Capital loss carryforwards are only available to offset future capital gains of the Fund to the extent provided by regulations and may be limited. Under the Regulated Investment Company Modernization Act of 2010 (the Act), the Fund is permitted to carry forward capital losses incurred in taxable years beginning after December 22, 2010 for an unlimited period and such capital losses are required to be used prior to any losses that expire. The capital loss carryforward information presented below, including any applicable limitation, is estimated as of prior fiscal period end and is subject to adjustment.
| Fiscal year of expiration | |
| 2017 | $(9,328) |
| 2018 | (18,759,952) |
| Total capital loss carryforward | $(18,769,280) |
Repurchase Agreements. Pursuant to an Exemptive Order issued by the SEC, the Fund along with other registered investment companies having management contracts with FMR, or other affiliated entities of FMR, are permitted to transfer uninvested cash balances into joint trading accounts which are then invested in repurchase agreements. The Fund may also invest directly with institutions in repurchase agreements. Upon settlement date, collateral is held in segregated accounts with custodian banks and may be obtained in the event of a default of the counterparty. The Fund monitors, on a daily basis, the value of the collateral to ensure it is at least equal to the principal amount of the repurchase agreement (including accrued interest). In the event of a default by the counterparty, realization of the collateral proceeds could be delayed, during which time the value of the collateral may decline.
Restricted Securities. The Fund may invest in securities that are subject to legal or contractual restrictions on resale. These securities generally may be resold in transactions exempt from registration or to the public if the securities are registered. Disposal of these securities may involve time-consuming negotiations and expense, and prompt sale at an acceptable price may be difficult. Information regarding restricted securities is included at the end of the Fund's Schedule of Investments.
4. Derivative Instruments.
Risk Exposures and the Use of Derivative Instruments. The Fund's investment objective allows the Fund to enter into various types of derivative contracts, including swaps. Derivatives are investments whose value is primarily derived from underlying assets, indices or reference rates and may be transacted on an exchange or over-the-counter (OTC). Derivatives may involve a future commitment to buy or sell a specified asset based on specified terms, to exchange future cash flows at periodic intervals based on a notional principal amount, or for one party to make one or more payments upon the occurrence of specified events in exchange for periodic payments from the other party.
The Fund used derivatives to increase returns, to gain exposure to certain types of assets and to manage exposure to certain risks as defined below. The success of any strategy involving derivatives depends on analysis of numerous economic factors, and if the strategies for investment do not work as intended, the Fund may not achieve its objectives.
The Fund's use of derivatives increased or decreased its exposure to the following risk:
| Credit Risk | Credit risk relates to the ability of the issuer of a financial instrument to make further principal or interest payments on an obligation or commitment that it has to the Fund.
|
The Fund is also exposed to additional risks from investing in derivatives, such as liquidity risk and counterparty credit risk. Liquidity risk is the risk that the Fund will be unable to close out the derivative in the open market in a timely manner. Counterparty credit risk is the risk that the counterparty will not be able to fulfill its obligation to the Fund. Derivative counterparty credit risk is managed through formal evaluation of the creditworthiness of all potential counterparties. On certain OTC derivatives such as bi-lateral swaps, the Fund attempts to reduce its exposure to counterparty credit risk by entering into an International Swaps and Derivatives Association, Inc. (ISDA) Master Agreement with each of its counterparties. The ISDA Master Agreement gives the Fund the right to terminate all transactions traded under such agreement upon the deterioration in the credit quality of the counterparty beyond specified levels. The ISDA Master Agreement gives each party the right, upon an event of default by the other party or a termination of the agreement, to close out all transactions traded under such agreement and to net amounts owed under each transaction to one net payable by one party to the other. To mitigate counterparty credit risk on bi-lateral OTC derivatives, the Fund receives collateral in the form of cash or securities once the Fund's net unrealized appreciation on outstanding derivative contracts under an ISDA Master Agreement exceeds certain applicable thresholds, subject to certain minimum transfer provisions. The collateral received is held in segregated accounts with the Fund's custodian bank in accordance with the collateral agreements entered into between the Fund, the counterparty and the Fund's custodian bank. The Fund could experience delays and costs in gaining access to the collateral even though it is held by the Fund's custodian bank. The Fund's maximum risk of loss from counterparty credit risk related to bi-lateral OTC derivatives is generally the aggregate unrealized appreciation and unpaid counterparty payments in excess of any collateral pledged by the counterparty to the Fund. The Fund may be required to pledge collateral for the benefit of the counterparties on bi-lateral OTC derivatives in an amount not less than each counterparty's unrealized appreciation on outstanding derivative contracts, subject to certain minimum transfer provisions, and any such pledged collateral is identified in the Schedule of Investments.
Investing in derivatives may involve greater risks than investing in the underlying assets directly and, to varying degrees, may involve risk of loss in excess of any initial investment and collateral received and amounts recognized in the Statement of Assets and Liabilities. In addition, there may be the risk that the change in value of the derivative contract does not correspond to the change in value of the underlying instrument.
Net Realized Gain (Loss) and Change in Net Unrealized Appreciation (Depreciation) on Derivatives. The table below, which reflects the impacts of derivatives on the financial performance of the Fund, summarizes the net realized gain (loss) and change in net unrealized appreciation (depreciation) for derivatives during the period as presented in the Statement of Operations.
| Primary Risk Exposure / Derivative Type | Net Realized Gain (Loss) | Change in Net Unrealized Appreciation (Depreciation) |
| Credit Risk | | |
| Swaps(a) | $505 | $1,507 |
(a) A summary of the value of derivatives by primary risk exposure as of period end is included at the end of the Schedule of Investments.
Swaps. A swap is a contract between two parties to exchange future cash flows at periodic intervals based on a notional principal amount. A bi-lateral OTC swap is a transaction between a fund and a dealer counterparty where cash flows are exchanged between the two parties for the life of the swap.
Bi-lateral OTC swaps are marked-to-market daily and changes in value are reflected in the Statement of Assets and Liabilities in the bi-lateral OTC swaps at value line items. Any upfront premiums paid or received upon entering a bi-lateral OTC swap to compensate for differences between stated terms of the swap and prevailing market conditions (e.g. credit spreads, interest rates or other factors) are recorded in net unrealized appreciation (depreciation) in the Statement of Assets and Liabilities and amortized to realized gain or (loss) ratably over the term of the swap. Any unamortized upfront premiums are presented in the Schedule of Investments.
Payments are exchanged at specified intervals, accrued daily commencing with the effective date of the contract and recorded as realized gain or (loss). Some swaps may be terminated prior to the effective date and realize a gain or loss upon termination. The net realized gain (loss) and change in net unrealized appreciation (depreciation) on swaps during the period is included in the Statement of Operations.
Any open swaps at period end are included in the Schedule of Investments under the caption "Swaps" and are representative of volume of activity during the period.
Credit Default Swaps. Credit default swaps enable the Fund to buy or sell protection against specified credit events on a single-name issuer or a traded credit index. Under the terms of a credit default swap the buyer of protection (buyer) receives credit protection in exchange for making periodic payments to the seller of protection (seller) based on a fixed percentage applied to a notional principal amount. In return for these payments, the seller will be required to make a payment upon the occurrence of one or more specified credit events. The Fund enters into credit default swaps as a seller to gain credit exposure to an issuer and/or as a buyer to obtain a measure of protection against defaults of an issuer. Periodic payments are made over the life of the contract by the buyer provided that no credit event occurs.
For credit default swaps on most corporate and sovereign issuers, credit events include bankruptcy, failure to pay or repudiation/moratorium. For credit default swaps on corporate or sovereign issuers, the obligation that may be put to the seller is not limited to the specific reference obligation described in the Schedule of Investments. For credit default swaps on asset-backed securities, a credit event may be triggered by events such as failure to pay principal, maturity extension, rating downgrade or write-down. For credit default swaps on asset-backed securities, the reference obligation described represents the security that may be put to the seller. For credit default swaps on a traded credit index, a specified credit event may affect all or individual underlying securities included in the index.
As a seller, if an underlying credit event occurs, the Fund will pay a net settlement amount of cash equal to the notional amount of the swap less the recovery value of the reference obligation or underlying securities comprising an index. Only in the event of the industry's inability to value the underlying asset will the Fund be required to take delivery of the reference obligation or underlying securities comprising an index and pay an amount equal to the notional amount of the swap.
As a buyer, if an underlying credit event occurs, the Fund will receive a net settlement amount of cash equal to the notional amount of the swap less the recovery value of the reference obligation or underlying securities comprising an index. Only in the event of the industry's inability to value the underlying asset will the Fund be required to deliver the reference obligation or underlying securities comprising an index in exchange for payment of an amount equal to the notional amount of the swap.
Typically, the value of each credit default swap and credit rating disclosed for each reference obligation in the Schedule of Investments, where the Fund is the seller, can be used as measures of the current payment/performance risk of the swap. As the value of the swap changes as a positive or negative percentage of the total notional amount, the payment/performance risk may decrease or increase, respectively. In addition to these measures, the investment adviser monitors a variety of factors including cash flow assumptions, market activity and market sentiment as part of its ongoing process of assessing payment/performance risk.
5. Purchases and Sales of Investments.
Purchases and sales of securities (including the Fixed-Income Central Funds), other than short-term securities and U.S. government securities, aggregated $267,231,937 and $106,864,859, respectively.
6. Fees and Other Transactions with Affiliates.
Management Fee. Fidelity Management & Research Company (the investment adviser) and its affiliates provide the Fund with investment management related services for which the Fund pays a monthly management fee. The management fee is the sum of an individual fund fee rate that is based on an annual rate of .20% of the Fund's average net assets and an annualized group fee rate that averaged .11% during the period. The group fee rate is based upon the average net assets of all the mutual funds advised by the investment adviser, including any mutual funds previously advised by the investment adviser that are currently advised by Fidelity SelectCo, LLC, an affiliate of the investment adviser. The group fee rate decreases as assets under management increase and increases as assets under management decrease. For the reporting period, the total annualized management fee rate was .31% of the Fund's average net assets.
Distribution and Service Plan Fees. In accordance with Rule 12b-1 of the 1940 Act, the Fund has adopted separate Distribution and Service Plans for each class of shares. Certain classes pay Fidelity Distributors Corporation (FDC), an affiliate of the investment adviser, separate Distribution and Service Fees, each of which is based on an annual percentage of each class' average net assets. In addition, FDC may pay financial intermediaries for selling shares of the Fund and providing shareholder support services. For the period, the Distribution and Service Fee rates, total fees and amounts retained by FDC were as follows:
| | Distribution
Fee | Service
Fee | Total Fees | Retained
by FDC |
| Class A | -% | .25% | $379,493 | $23,005 |
| Class T | -% | .25% | 242,500 | 792 |
| Class B | .65% | .25% | 4,101 | 2,962 |
| Class C | .75% | .25% | 467,419 | 93,881 |
| | | | $1,093,513 | $120,640 |
Sales Load. FDC may receive a front-end sales charge of up to 2.75% for selling Class A shares and Class T shares, some of which is paid to financial intermediaries for selling shares of the Fund. Depending on the holding period, FDC may receive contingent deferred sales charges levied on Class A, Class T, Class B, and Class C redemptions. The deferred sales charges range from 3.00% to 1.00% for Class B shares, 1.00% for Class C shares, .75% or .50% for certain purchases of Class A shares and .25% for certain purchases of Class T shares.
For the period, sales charge amounts retained by FDC were as follows:
| | Retained
by FDC |
| Class A | $16,720 |
| Class T | 13,688 |
| Class B(a) | 221 |
| Class C(a) | 15,446 |
| | $46,075 |
(a) When Class B and Class C shares are initially sold, FDC pays commissions from its own resources to financial intermediaries through which the sales are made.
Transfer Agent Fees. Fidelity Investments Institutional Operations Company, Inc., (FIIOC), an affiliate of the investment adviser, is the transfer, dividend disbursing and shareholder servicing agent for each class of the Fund. FIIOC receives account fees and asset-based fees that vary according to the account size and type of account of the shareholders of each respective class of the Fund, with the exception of Fidelity Limited Term Bond. FIIOC receives an asset-based fee of .10% of Fidelity Limited Term Bond's average net assets. FIIOC pays for typesetting, printing and mailing of shareholder reports, except proxy statements. For the period, transfer agent fees for each class were as follows:
| | Amount | % of
Class-Level Average
Net Assets(a) |
| Class A | $239,551 | .16 |
| Class T | 159,982 | .17 |
| Class B | 1,134 | .25 |
| Class C | 83,452 | .18 |
| Fidelity Limited Term Bond Fund | 381,484 | .10 |
| Class I | 321,022 | .15 |
| | $1,186,625 | |
(a) Annualized
Fund Wide Operations Fee. Pursuant to the Fund Wide Operations and Expense Agreement (FWOE), the investment adviser has agreed to provide for fund level expenses (which do not include transfer agent, Rule 12b-1 fees, compensation of the independent Trustees, interest (including commitment fees), taxes or extraordinary expenses, if any) in return for a FWOE fee equal to .35% of the Fund's average net assets less the total amount of the management fee. The FWOE paid by the Fund is reduced by an amount equal to the fees and expenses paid to the independent Trustees. For the period, the FWOE fee was equivalent to an annualized rate of .04% of average net assets.
Interfund Trades. The Fund may purchase from or sell securities to other Fidelity Funds under procedures adopted by the Board. The procedures have been designed to ensure these interfund trades are executed in accordance with Rule 17a-7 of the 1940 Act. Interfund trades are included within the respective purchases and sales amounts shown in the Purchases and Sales of Investments note.
7. Committed Line of Credit.
The Fund participates with other funds managed by the investment adviser or an affiliate in a $4.25 billion credit facility (the "line of credit") to be utilized for temporary or emergency purposes to fund shareholder redemptions or for other short-term liquidity purposes. The Fund has agreed to pay commitment fees on its pro-rata portion of the line of credit, which amounted to $1,153 and is reflected in Miscellaneous expenses on the Statement of Operations. During the period, the Fund did not borrow on this line of credit.
8. Security Lending.
The Fund lends portfolio securities from time to time in order to earn additional income. On the settlement date of the loan, the Fund receives collateral (in the form of U.S. Treasury obligations, letters of credit and/or cash) against the loaned securities and maintains collateral in an amount not less than 100% of the market value of the loaned securities during the period of the loan. The market value of the loaned securities is determined at the close of business of the Fund and any additional required collateral is delivered to the Fund on the next business day. The Fund or borrower may terminate the loan at any time, and if the borrower defaults on its obligation to return the securities loaned because of insolvency or other reasons, the Fund may apply collateral received from the borrower against the obligation. The Fund may experience delays and costs in recovering the securities loaned. Any cash collateral received is maintained at the Fund's custodian and/or invested in cash equivalents. The value of loaned securities and cash collateral at period end are disclosed on the Fund's Statement of Assets and Liabilities. Security lending income represents the income earned on investing cash collateral, less rebates paid to borrowers, plus any premium payments received for lending certain types of securities. Security lending income is presented in the Statement of Operations as a component of interest income. Total security lending income during the period amounted to $11,054.
9. Expense Reductions.
Through arrangements with the Fund's custodian, credits realized as a result of certain uninvested cash balances were used to reduce the Fund's expenses. During the period, these credits reduced the Fund's custody expenses by $647.
10. Distributions to Shareholders.
Distributions to shareholders of each class were as follows:
| | Six months ended February 29, 2016 | Year ended August 31, 2015 |
| From net investment income | | |
| Class A | $2,573,225 | $3,729,622 |
| Class T | 1,632,269 | 2,760,770 |
| Class B | 4,349 | 9,214 |
| Class C | 429,725 | 455,450 |
| Fidelity Limited Term Bond Fund | 7,670,510 | 7,753,652 |
| Class I | 4,176,177 | 5,277,048 |
| Total | $16,486,255 | $19,985,756 |
11. Share Transactions.
Share transactions for each class were as follows and may contain automatic conversions between classes or exchanges between affiliated funds:
| | Shares | Shares | Dollars | Dollars |
| | Six months ended February 29, 2016 | Year ended August 31, 2015 | Six months ended February 29, 2016 | Year ended August 31, 2015 |
| Class A | | | | |
| Shares sold | 9,493,588 | 22,883,010 | $108,124,976 | $262,802,297 |
| Reinvestment of distributions | 208,809 | 302,206 | 2,375,945 | 3,471,902 |
| Shares redeemed | (8,625,388) | (15,281,488) | (98,288,046) | (175,517,852) |
| Net increase (decrease) | 1,077,009 | 7,903,728 | $12,212,875 | $90,756,347 |
| Class T | | | | |
| Shares sold | 3,230,355 | 4,726,276 | $36,826,027 | $54,308,583 |
| Reinvestment of distributions | 135,211 | 225,689 | 1,539,145 | 2,594,606 |
| Shares redeemed | (3,279,036) | (5,219,634) | (37,380,244) | (59,996,049) |
| Net increase (decrease) | 86,530 | (267,669) | $984,928 | $(3,092,860) |
| Class B | | | | |
| Shares sold | 23,906 | 45,219 | $272,061 | $518,562 |
| Reinvestment of distributions | 348 | 769 | 3,946 | 8,827 |
| Shares redeemed | (25,488) | (96,326) | (290,091) | (1,103,458) |
| Net increase (decrease) | (1,234) | (50,338) | $(14,084) | $(576,069) |
| Class C | | | | |
| Shares sold | 3,748,755 | 3,762,661 | $42,556,513 | $43,110,911 |
| Reinvestment of distributions | 33,368 | 34,649 | 378,455 | 397,236 |
| Shares redeemed | (1,175,287) | (2,200,235) | (13,359,960) | (25,199,324) |
| Net increase (decrease) | 2,606,836 | 1,597,075 | $29,575,008 | $18,308,823 |
| Fidelity Limited Term Bond Fund | | | | |
| Shares sold | 30,185,709 | 73,683,363 | $344,754,445 | $848,661,103 |
| Reinvestment of distributions | 611,698 | 626,332 | 6,976,952 | 7,211,684 |
| Shares redeemed | (24,008,474) | (20,841,425) | (274,433,242) | (239,689,901) |
| Net increase (decrease) | 6,788,933 | 53,468,270 | $77,298,155 | $616,182,886 |
| Class I | | | | |
| Shares sold | 13,435,969 | 31,060,194 | $153,456,360 | $357,596,586 |
| Reinvestment of distributions | 285,314 | 376,794 | 3,255,224 | 4,341,226 |
| Shares redeemed | (8,802,281) | (12,319,776) | (100,414,966) | (141,915,410) |
| Net increase (decrease) | 4,919,002 | 19,117,212 | $56,296,618 | $220,022,402 |
12. Other.
The Fund's organizational documents provide former and current trustees and officers with a limited indemnification against liabilities arising in connection with the performance of their duties to the Fund. In the normal course of business, the Fund may also enter into contracts that provide general indemnifications. The Fund's maximum exposure under these arrangements is unknown as this would be dependent on future claims that may be made against the Fund. The risk of material loss from such claims is considered remote.
13. Credit Risk.
The Fund invests a portion of its assets in structured securities of issuers backed by commercial and residential mortgage loans, credit card receivables and automotive loans. The value and related income of these securities is sensitive to changes in economic conditions, including delinquencies and/or defaults.
Shareholder Expense Example
As a shareholder of the Fund, you incur two types of costs: (1) transaction costs, including sales charges (loads) on purchase payments or redemption proceeds, and (2) ongoing costs, including management fees, distribution and/or service (12b-1) fees and other Fund expenses. This Example is intended to help you understand your ongoing costs (in dollars) of investing in the Fund and to compare these costs with the ongoing costs of investing in other mutual funds.
The Example is based on an investment of $1,000 invested at the beginning of the period and held for the entire period (September 1, 2015 to February 29, 2016).
Actual Expenses
The first line of the accompanying table for each class of the Fund provides information about actual account values and actual expenses. You may use the information in this line, together with the amount you invested, to estimate the expenses that you paid over the period. Simply divide your account value by $1,000.00 (for example, an $8,600 account value divided by $1,000.00 = 8.6), then multiply the result by the number in the first line for a class of the Fund under the heading entitled "Expenses Paid During Period" to estimate the expenses you paid on your account during this period. A small balance maintenance fee of $12.00 that is charged once a year may apply for certain accounts with a value of less than $2,000. This fee is not included in the table below. If it was, the estimate of expenses you paid during the period would be higher, and your ending account value lower, by this amount. In addition, the Fund, as a shareholder in the underlying Fidelity Central Funds, will indirectly bear its pro-rata share of the fees and expenses incurred by the underlying Fidelity Central Funds. These fees and expenses are not included in the Fund's annualized expense ratio used to calculate the expense estimate in the table below.
Hypothetical Example for Comparison Purposes
The second line of the accompanying table for each class of the Fund provides information about hypothetical account values and hypothetical expenses based on a Class' actual expense ratio and an assumed rate of return of 5% per year before expenses, which is not the Class' actual return. The hypothetical account values and expenses may not be used to estimate the actual ending account balance or expenses you paid for the period. You may use this information to compare the ongoing costs of investing in the Fund and other funds. To do so, compare this 5% hypothetical example with the 5% hypothetical examples that appear in the shareholder reports of the other funds. A small balance maintenance fee of $12.00 that is charged once a year may apply for certain accounts with a value of less than $2,000. This fee is not included in the table below. If it was, the estimate of expenses you paid during the period would be higher, and your ending account value lower, by this amount. In addition, the Fund, as a shareholder in the underlying Fidelity Central Funds, will indirectly bear its pro-rata share of the fees and expenses incurred by the underlying Fidelity Central Funds. These fees and expenses are not included in the Fund's annualized expense ratio used to calculate the expense estimate in the table below.
Please note that the expenses shown in the table are meant to highlight your ongoing costs only and do not reflect any transaction costs. Therefore, the second line of the table is useful in comparing ongoing costs only, and will not help you determine the relative total costs of owning different funds. In addition, if these transactional costs were included, your costs would have been higher.
| | Annualized Expense Ratio-A | Beginning
Account Value
September 1, 2015 | Ending
Account Value
February 29, 2016 | Expenses Paid
During Period-B
September 1, 2015
to February 29, 2016 |
| Class A | .76% | | | |
| Actual | | $1,000.00 | $1,003.20 | $3.79 |
| Hypothetical-C | | $1,000.00 | $1,021.08 | $3.82 |
| Class T | .77% | | | |
| Actual | | $1,000.00 | $1,003.20 | $3.84 |
| Hypothetical-C | | $1,000.00 | $1,021.03 | $3.87 |
| Class B | 1.51% | | | |
| Actual | | $1,000.00 | $999.50 | $7.51 |
| Hypothetical-C | | $1,000.00 | $1,017.35 | $7.57 |
| Class C | 1.54% | | | |
| Actual | | $1,000.00 | $999.30 | $7.66 |
| Hypothetical-C | | $1,000.00 | $1,017.21 | $7.72 |
| Fidelity Limited Term Bond Fund | .45% | | | |
| Actual | | $1,000.00 | $1,004.80 | $2.24 |
| Hypothetical-C | | $1,000.00 | $1,022.63 | $2.26 |
| Class I | .50% | | | |
| Actual | | $1,000.00 | $1,004.50 | $2.49 |
| Hypothetical-C | | $1,000.00 | $1,022.38 | $2.51 |
A Annualized expense ratio reflects expenses net of applicable fee waivers.
B Expenses are equal to each Class' annualized expense ratio, multiplied by the average account value over the period, multiplied by 182/366 (to reflect the one-half year period). The fees and expenses of the underlying Fidelity Central Funds in which the Fund invests are not included in each Class' annualized expense ratio. In addition to the expenses noted above, the Fund also indirectly bears its proportional share of the expenses of the underlying Fidelity Central Funds. Annualized expenses of the underlying non-money market Fidelity Central Funds as of their most recent fiscal half year were less than .005%.
C 5% return per year before expenses
Board Approval of Investment Advisory Contracts and Management Fees
Fidelity Advisor Limited Term Bond Fund
Each year, the Board of Trustees, including the Independent Trustees (together, the Board), votes on the renewal of the management contract with Fidelity Management & Research Company (FMR) and the sub-advisory agreements (together, the Advisory Contracts) for the fund. The Board, assisted by the advice of fund counsel and Independent Trustees' counsel, requests and considers a broad range of information relevant to the renewal of the Advisory Contracts throughout the year.
The Board meets regularly and, at each of its meetings, covers an extensive agenda of topics and materials and considers factors that are relevant to its annual consideration of the renewal of the fund's Advisory Contracts, including the services and support provided to the fund and its shareholders. The Board has established four standing committees (Committees) — Operations, Audit, Fair Valuation, and Governance and Nominating — each composed of and chaired by Independent Trustees with varying backgrounds, to which the Board has assigned specific subject matter responsibilities in order to enhance effective decision-making by the Board. The Operations Committee, of which all of the Independent Trustees are members, meets regularly throughout the year and considers, among other matters, information specifically related to the annual consideration of the renewal of the fund's Advisory Contracts. The Board, acting directly and through its Committees, requests and receives information concerning the annual consideration of the renewal of the fund's Advisory Contracts. The Board also meets as needed to consider matters specifically related to the Board's annual consideration of the renewal of the Advisory Contracts. Members of the Board may also meet with trustees of other Fidelity funds through ad hoc joint committees to discuss certain matters relevant to all of the Fidelity funds.
At its September 2015 meeting, the Board unanimously determined to renew the fund's Advisory Contracts. In reaching its determination, the Board considered all factors it believed relevant, including (i) the nature, extent, and quality of the services to be provided to the fund and its shareholders (including the investment performance of the fund); (ii) the competitiveness of the fund's management fee and total expense ratio relative to peer funds; (iii) the total costs of the services to be provided by and the profits to be realized by Fidelity from its relationship with the fund; and (iv) the extent to which (if any) economies of scale exist and would be realized as the fund grows, and whether any economies of scale are appropriately shared with fund shareholders.
In considering whether to renew the Advisory Contracts for the fund, the Board reached a determination, with the assistance of fund counsel and Independent Trustees' counsel and through the exercise of its business judgment, that the renewal of the Advisory Contracts was in the best interests of the fund and its shareholders and that the compensation payable under the Advisory Contracts was fair and reasonable. The Board's decision to renew the Advisory Contracts was not based on any single factor, but rather was based on a comprehensive consideration of all the information provided to the Board at its meetings throughout the year. The Board, in reaching its determination to renew the Advisory Contracts, was aware that shareholders of the fund have a broad range of investment choices available to them, including a wide choice among funds offered by Fidelity's competitors, and that the fund's shareholders, who have the opportunity to review and weigh the disclosure provided by the fund in its prospectus and other public disclosures, have chosen to invest in this fund, which is part of the Fidelity family of funds.
Nature, Extent, and Quality of Services Provided. The Board considered Fidelity's staffing as it relates to the fund, including the backgrounds of investment personnel of Fidelity, and also considered the fund's investment objective, strategies, and related investment philosophy. The Independent Trustees also had discussions with senior management of Fidelity's investment operations and investment groups. The Board considered the structure of the portfolio manager compensation program and whether this structure provides appropriate incentives to act in the best interests of the fund. Additionally, the Board considered the portfolio managers' investments, if any, in the funds that they manage.
Resources Dedicated to Investment Management and Support Services. The Board reviewed the general qualifications and capabilities of Fidelity's investment staff, including its size, education, experience, and resources, as well as Fidelity's approach to recruiting, training, managing, and compensating investment personnel. The Board noted that Fidelity has continued to increase the resources devoted to non-U.S. offices, including expansion of Fidelity's global investment organization. The Board also noted that Fidelity's analysts have extensive resources, tools and capabilities that allow them to conduct sophisticated quantitative and fundamental analysis, as well as credit analysis of issuers, counterparties and guarantors. Further, the Board considered that Fidelity's investment professionals have sufficient access to global information and data so as to provide competitive investment results over time, and that those professionals also have access to sophisticated tools that permit them to assess portfolio construction and risk and performance attribution characteristics continuously, as well as to transmit new information and research conclusions rapidly around the world. Additionally, in its deliberations, the Board considered Fidelity's trading, risk management, compliance, and technology and operations capabilities and resources, which are integral parts of the investment management process.
Shareholder and Administrative Services. The Board considered (i) the nature, extent, quality, and cost of advisory, administrative, and shareholder services performed by FMR, the sub-advisers (together with FMR, the Investment Advisers), and their affiliates under the Advisory Contracts and under separate agreements covering transfer agency, pricing and bookkeeping, and securities lending services for the fund; (ii) the nature and extent of the supervision of third party service providers, principally custodians, subcustodians, and pricing vendors; and (iii) the resources devoted to, and the record of compliance with, the fund's compliance policies and procedures.
The Board noted that the growth of fund assets over time across the complex allows Fidelity to reinvest in the development of services designed to enhance the value or convenience of the Fidelity funds as investment vehicles. These services include 24-hour access to account information and market information through telephone representatives and over the Internet, investor education materials and asset allocation tools, and the expanded availability of Fidelity Investor Centers.
Investment in a Large Fund Family. The Board considered the benefits to shareholders of investing in a Fidelity fund, including the benefits of investing in a fund that is part of a large family of funds offering a variety of investment disciplines and providing a large variety of mutual fund investor services. The Board noted that Fidelity had taken, or had made recommendations that resulted in the Fidelity funds taking, a number of actions over the previous year that benefited particular funds, including (i) continuing to dedicate additional resources to investment research and to the support of the senior management team that oversees asset management; (ii) continuing efforts to enhance Fidelity's global research capabilities; (iii) launching new funds and making other enhancements to meet client needs; (iv) reducing management fees and total expenses for certain index funds and diversified international funds; (v) continuing to launch dedicated lower cost underlying funds to meet portfolio construction needs related to expanding underlying fund options for Fidelity funds of funds, specifically for the Freedom Fund product lines; (vi) rationalizing product lines and gaining increased efficiencies through fund mergers; (vii) launching active fixed-income exchange-traded funds; (viii) continuing to develop, acquire and implement systems and technology to improve services to the funds and shareholders, strengthen information security, and increase efficiency; (ix) implementing investment enhancements to further strengthen Fidelity's target date product line to increase investors' probability of success in achieving their goals; (x) modifying the eligibility criteria for certain share classes to accommodate roll-over assets from employer-sponsored retirement plans; (xi) launching a new Class W of the Freedom Index Funds to attract and retain Fidelity record-kept retirement plan assets; and (xii) implementing changes to Fidelity's money market product line in response to recent money market regulatory reforms.
Investment Performance. The Board considered whether the fund has operated in accordance with its investment objective, as well as its record of compliance with its investment restrictions and its performance history.
The Board took into account discussions with representatives of the Investment Advisers about fund investment performance that occur at Board meetings throughout the year. In this regard the Board noted that as part of regularly scheduled fund reviews and other reports to the Board on fund performance, the Board considers annualized return information for the fund for different time periods, measured against a securities market index ("benchmark index") and a peer group of funds with similar objectives ("peer group"), if any. In its evaluation of fund investment performance at meetings throughout the year, the Board gave particular attention to information indicating underperformance of certain Fidelity funds for specific time periods and discussed with the Investment Advisers the reasons for such underperformance.
In addition to reviewing absolute and relative fund performance, the Independent Trustees periodically consider the appropriateness of fund performance metrics in evaluating the results achieved. In general, the Independent Trustees believe that fund performance should be evaluated based on gross performance (before fees and expenses but after transaction costs) compared to appropriate benchmark indices, over appropriate time periods that may include full market cycles, and on net performance (after fees and expenses) compared to peer groups, as applicable, over the same periods, taking into account relevant factors including the following: general market conditions; expectations for interest rate levels and credit conditions; issuer-specific information including credit quality; the potential for incremental return versus the fund's benchmark index weighed against the risks involved in obtaining that incremental return, including the risk of diminished or negative total returns; and fund cash flows and other factors. Depending on the circumstances, the Independent Trustees may be satisfied with a fund's performance notwithstanding that it lags its benchmark index or peer group for certain periods.
The Independent Trustees recognize that shareholders evaluate performance on a net basis over their own holding periods, for which one-, three-, and five-year periods are often used as a proxy. For this reason, the performance information reviewed by the Board also included net cumulative calendar year total return information for the fund and an appropriate benchmark index and peer group for the most recent one-, three-, and five-year periods.
Based on its review, the Board concluded that the nature, extent, and quality of services provided to the fund under the Advisory Contracts should benefit the shareholders of the fund.
Competitiveness of Management Fee and Total Expense Ratio. The Board considered the fund's management fee and total expense ratio compared to "mapped groups" of competitive funds and classes created for the purpose of facilitating the Trustees' competitive analysis of management fees and total expenses. Fidelity creates "mapped groups" by combining similar Lipper investment objective categories that have comparable investment mandates. Combining Lipper investment objective categories aids the Board's management fee and total expense ratio comparisons by broadening the competitive group used for comparison.
Management Fee. The Board considered two proprietary management fee comparisons for the 12-month periods shown in basis points (BP) in the chart below. The group of Lipper funds used by the Board for management fee comparisons is referred to below as the "Total Mapped Group" and, for the reasons explained above, is broader than the Lipper peer group used by the Board for performance comparisons. The Total Mapped Group comparison focuses on a fund's standing in terms of gross management fees before expense reimbursements or caps relative to the total universe of funds with comparable investment mandates, regardless of whether their management fee structures also are comparable. Funds with comparable investment mandates offer exposure to similar types of securities. Funds with comparable management fee structures have similar management fee contractual arrangements (
e.g., flat rate charged for advisory services, all-inclusive fee rate,
etc.). "TMG %" represents the percentage of funds in the Total Mapped Group that had management fees that were lower than the fund's. For example, a hypothetical TMG % of 20% would mean that 80% of the funds in the Total Mapped Group had higher, and 20% had lower, management fees than the fund. The fund's actual TMG %s and the number of funds in the Total Mapped Group are in the chart below. The "Asset-Size Peer Group" (ASPG) comparison focuses on a fund's standing relative to a subset of non-Fidelity funds within the Total Mapped Group that are similar in size and management fee structure. For example, if a fund is in the first quartile of the ASPG, the fund's management fee ranks in the least expensive or lowest 25% of funds in the ASPG. The ASPG represents at least 15% of the funds in the Total Mapped Group with comparable asset size and management fee structures, subject to a minimum of 50 funds (or all funds in the Total Mapped Group if fewer than 50). Additional information, such as the ASPG quartile in which the fund's management fee rate ranked, is also included in the chart and considered by the Board.
Fidelity Advisor Limited Term Bond Fund
The Board noted that the fund's management fee rate ranked below the median of its Total Mapped Group and below the median of its ASPG for 2014.
The Board noted that, in 2014, the ad hoc Committee on Group Fee was formed by it and other Fidelity fund boards to conduct an in-depth review of the "group fee" component of the management fee of funds with such management fee structures. Committee focus included the mechanics of the group fee, the competitive landscape of group fee structures, Fidelity funds with no group fee component and investment products not included in group fee assets. The Board also considered that, for funds subject to the group fee, FMR agreed to voluntarily waive fees over a specified period of time in amounts designed to account for assets converted from certain funds to certain collective investment trusts.
Based on its review, the Board concluded that the fund's management fee is fair and reasonable in light of the services that the fund receives and the other factors considered.
Total Expense Ratio. In its review of each class's total expense ratio, the Board considered the fund's management fee rate as well as other fund or class expenses, as applicable, such as transfer agent fees, pricing and bookkeeping fees, fund-paid 12b-1 fees, and custodial, legal, and audit fees. The Board also noted that Fidelity may agree to waive fees and expenses from time to time, and the extent to which, if any, it has done so for the fund. As part of its review, the Board also considered the current and historical total expense ratios of each class of the fund compared to competitive fund median expenses. Each class of the fund is compared to those funds and classes in the Total Mapped Group (used by the Board for management fee comparisons) that have a similar sales load structure.
The Board noted that the total expense ratio of each class ranked below its competitive median for 2014.
The Board considered that the current contractual arrangements for the fund have the effect of setting the total "fund-level" (but not "class-level") expenses (including, among certain other "fund-level" expenses, the management fee) for each class at 0.35%. These contractual arrangements may not be increased without the approval of the Board.
The Board recognized that the fund's management contract incorporates a "group fee" structure, which provides for lower group fee rates as total group assets increase, and for higher group fee rates as total group assets decrease (with "group assets" defined to include fund assets under FMR's management plus sector fund assets previously under FMR's management and currently managed by Fidelity SelectCo, LLC). FMR calculates the group fee rates based on a tiered asset "breakpoint" schedule that varies based on asset class. The Board noted, however, that because the current contractual arrangements set the total "fund-level" expenses for each class at 0.35%, increases or decreases in the management fee due to changes in the group fee rate will not impact the total expense ratio.
Fees Charged to Other Fidelity Clients. The Board also considered Fidelity fee structures and other information with respect to clients of Fidelity, such as other funds advised or subadvised by Fidelity, pension plan clients, and other institutional clients with similar mandates. The Board noted the findings of the 2013 ad hoc joint committee (created with the board of other Fidelity funds), which reviewed and compared Fidelity's institutional investment advisory business with its business of providing services to the Fidelity funds, including the differences in services provided, fees charged, and costs incurred, as well as competition in their respective marketplaces.
Based on its review of total expense ratios and fees charged to other Fidelity clients, the Board concluded that the total expense ratio of each class of the fund was reasonable in light of the services that the fund and its shareholders receive and the other factors considered.
Costs of the Services and Profitability. The Board considered the revenues earned and the expenses incurred by Fidelity in conducting the business of developing, marketing, distributing, managing, administering and servicing the fund and servicing the fund's shareholders. The Board also considered the level of Fidelity's profits in respect of all the Fidelity funds.
On an annual basis, Fidelity presents to the Board information about the profitability of its relationship with the fund. Fidelity calculates profitability information for each fund, as well as aggregate profitability information for groups of Fidelity funds and all Fidelity funds, using a series of detailed revenue and cost allocation methodologies which originate with the books and records of Fidelity on which Fidelity's audited financial statements are based. The Audit Committee of the Board reviews any significant changes from the prior year's methodologies.
PricewaterhouseCoopers LLP (PwC), independent registered public accounting firm and auditor to Fidelity and certain Fidelity funds, has been engaged annually by the Board as part of the Board's assessment of Fidelity's profitability analysis. PwC's engagement includes the review and assessment of the methodologies used by Fidelity in determining the revenues and expenses attributable to Fidelity's mutual fund business, and completion of agreed-upon procedures in respect of the mathematical accuracy of fund profitability and its conformity to established allocation methodologies. After considering PwC's reports issued under the engagement and information provided by Fidelity, the Board concluded that while other allocation methods may also be reasonable, Fidelity's profitability methodologies are reasonable in all material respects.
The Board also reviewed Fidelity's non-fund businesses and fall-out benefits related to the mutual fund business as well as cases where Fidelity's affiliates may benefit from or be related to the fund's business.
The Board considered the costs of the services provided by and the profits realized by Fidelity in connection with the operation of the fund and was satisfied that the profitability was not excessive.
Economies of Scale. The Board considered whether there have been economies of scale in respect of the management of the Fidelity funds, whether the Fidelity funds (including the fund) have appropriately benefited from any such economies of scale, and whether there is potential for realization of any further economies of scale. The Board considered the extent to which the fund will benefit from economies of scale as assets grow through increased services to the fund, through waivers or reimbursements, or through fee or expense ratio reductions. The Board also noted that in 2013, it and the boards of other Fidelity funds created an ad hoc committee (the Economies of Scale Committee) to analyze whether Fidelity attains economies of scale in respect of the management and servicing of the Fidelity funds, whether the Fidelity funds have appropriately benefited from such economies of scale, and whether there is potential for realization of any further economies of scale.
The Board concluded, taking into account the analysis of the Economies of Scale Committee, that economies of scale, if any, are being appropriately shared between fund shareholders and Fidelity.
Additional Information Requested by the Board. In order to develop fully the factual basis for consideration of the Fidelity funds' Advisory Contracts, the Board requested and received additional information on certain topics, including: (i) Fidelity's fund profitability methodology, profitability trends for certain funds, and the impact of certain factors on fund profitability results; (ii) portfolio manager changes that have occurred during the past year and the amount of the investment that each portfolio manager has made in the Fidelity fund(s) that he or she manages; (iii) Fidelity's compensation structure for portfolio managers, research analysts, and other key personnel, including its effects on fund profitability, the rationale for the compensation structure, and the extent to which current market conditions have affected retention and recruitment; (iv) the arrangements with and compensation paid to certain fund sub-advisers on behalf of the Fidelity funds; (v) Fidelity's voluntary waiver of its fees to maintain minimum yields for certain money market funds and classes as well as contractual waivers in place for certain funds; (vi) the methodology with respect to competitive fund data and peer group classifications; (vii) Fidelity's transfer agent fee, expense, and service structures for different funds and classes relative to competitive trends, and the impact of the increased use of omnibus accounts; (viii) Fidelity's long-term expectations for its offerings in the workplace investing channel; (ix) new developments in the retail and institutional marketplaces; and (x) the impact of money market reform on Fidelity's money market funds. In addition, the Board considered its discussions with Fidelity throughout the year regarding enhanced information security initiatives and the funds' fair valuation policies.
Based on its evaluation of all of the conclusions noted above, and after considering all factors it believed relevant, the Board concluded that the advisory fee structures are fair and reasonable, and that the fund's Advisory Contracts should be renewed.

LTB-SANN-0416
1.704556.118
Fidelity Advisor® Mortgage Securities Fund
Class I
Semi-Annual Report February 29, 2016 |
|
Contents
To view a fund's proxy voting guidelines and proxy voting record for the 12-month period ended June 30, visit http://www.fidelity.com/proxyvotingresults or visit the Securities and Exchange Commission's (SEC) web site at http://www.sec.gov.
You may also call 1-877-208-0098 to request a free copy of the proxy voting guidelines.
Standard & Poor's, S&P and S&P 500 are registered service marks of The McGraw-Hill Companies, Inc. and have been licensed for use by Fidelity Distributors Corporation.
Other third-party marks appearing herein are the property of their respective owners.
All other marks appearing herein are registered or unregistered trademarks or service marks of FMR LLC or an affiliated company. © 2016 FMR LLC. All rights reserved.
This report and the financial statements contained herein are submitted for the general information of the shareholders of the Fund. This report is not authorized for distribution to prospective investors in the Fund unless preceded or accompanied by an effective prospectus.
A fund files its complete schedule of portfolio holdings with the SEC for the first and third quarters of each fiscal year on Form N-Q. Forms N-Q are available on the SEC’s web site at http://www.sec.gov. A fund's Forms N-Q may be reviewed and copied at the SEC’s Public Reference Room in Washington, DC. Information regarding the operation of the SEC's Public Reference Room may be obtained by calling 1-800-SEC-0330.
For a complete list of a fund's portfolio holdings, view the most recent holdings listing, semiannual report, or annual report on Fidelity's web site at http://www.fidelity.com, http://www.advisor.fidelity.com, or http://www.401k.com, as applicable.
NOT FDIC INSURED •MAY LOSE VALUE •NO BANK GUARANTEE
Neither the Fund nor Fidelity Distributors Corporation is a bank.
Investment Summary (Unaudited)
The information in the following tables is based on the combined investments of the Fund and its pro-rata share of the investments of Fidelity's Fixed-Income Central Funds.
Coupon Distribution as of February 29, 2016
| | % of fund's investments | % of fund's investments 6 months ago |
| Zero coupon bonds | 0.0 | 0.0 |
| 0.01 - 0.99% | 2.0 | 4.1 |
| 1 - 1.99% | 6.5 | 5.4 |
| 2 - 2.99% | 6.4 | 6.5 |
| 3 - 3.99% | 45.1 | 37.7 |
| 4 - 4.99% | 22.6 | 26.6 |
| 5 - 5.99% | 7.5 | 9.2 |
| 6 - 6.99% | 1.8 | 2.1 |
| 7% and above | 1.2 | 1.4 |
Coupon distribution shows the range of stated interest rates on the fund's investments, excluding short-term investments.
Weighted Average Maturity as of February 29, 2016
| | | 6 months ago |
| Years | 4.5 | 5.2 |
This is a weighted average of all the maturities of the securities held in a fund. Weighted Average Maturity (WAM) can be used as a measure of sensitivity to interest rate changes and market changes. Generally, the longer the maturity, the greater the sensitivity to such changes. WAM is based on the dollar-weighted average length of time until principal payments must be paid. Depending on the types of securities held in a fund, certain maturity shortening devices (e.g., demand features, interest rate resets, and call options) may be taken into account when calculating the WAM.
Duration as of February 29, 2016
| | | 6 months ago |
| Years | 3.0 | 3.6 |
Duration is a measure of a security's price sensitivity to changes in interest rates. Duration differs from maturity in that it considers a security's interest payments in addition to the amount of time until the security reaches maturity, and also takes into account certain maturity shortening features (e.g., demand features, interest rate resets, and call options) when applicable. Securities with longer durations generally tend to be more sensitive to interest rate changes than securities with shorter durations. A fund with a longer average duration generally can be expected to be more sensitive to interest rate changes than a fund with a shorter average duration.
Asset Allocation (% of fund's net assets)
| As of February 29, 2016*,** |
| | Mortgage Securities | 82.8% |
| | CMOs and Other Mortgage Related Securities | 25.5% |
| | Asset-Backed Securities | 6.8% |
| | Short-Term Investments and Net Other Assets (Liabilities)*** | (15.1)% |

* Foreign investments - 0.0%
** Futures and Swaps - (5.3)%
*** Short-Term Investments and Net Other Assets (Liabilities) are not included in the pie chart
| As of August 31, 2015*,** |
| | Mortgage Securities | 83.6% |
| | CMOs and Other Mortgage Related Securities | 32.2% |
| | Asset-Backed Securities | 3.5% |
| | Short-Term Investments and Net Other Assets (Liabilities)*** | (19.3)% |

* Foreign investments - 1.0%
** Futures and Swaps - (8.6)%
*** Short-Term Investments and Net Other Assets (Liabilities) are not included in the pie chart
An unaudited holdings listing for the Fund, which presents direct holdings as well as the pro-rata share of any securities and other investments held indirectly through its investment in underlying non-money market Fidelity Central Funds, is available at fidelity.com and/or advisor.fidelity.com, as applicable.
Percentages in the above tables are adjusted for the effect of TBA Sale Commitments.
Percentages shown as 0.0% may reflect amounts less than 0.05%.
Investments February 29, 2016 (Unaudited)
Showing Percentage of Net Assets
| U.S. Government Agency - Mortgage Securities - 88.2% | | | |
| | | Principal Amount (000s) | Value (000s) |
| Fannie Mae - 46.0% | | | |
| 1.814% 9/1/36 (a) | | 86 | 88 |
| 2.07% 4/1/37 (a) | | 104 | 109 |
| 2.108% 3/1/36 (a) | | 129 | 135 |
| 2.26% 1/1/35 (a) | | 176 | 183 |
| 2.302% 6/1/36 (a) | | 43 | 45 |
| 2.31% 4/1/36 (a) | | 147 | 155 |
| 2.315% 9/1/36 (a) | | 71 | 74 |
| 2.317% 5/1/36 (a) | | 218 | 228 |
| 2.408% 7/1/35 (a) | | 5 | 6 |
| 2.426% 8/1/35 (a) | | 264 | 278 |
| 2.45% 11/1/36 (a) | | 39 | 41 |
| 2.458% 3/1/35 (a) | | 29 | 31 |
| 2.472% 7/1/35 (a) | | 45 | 47 |
| 2.5% 2/1/30 | | 120 | 124 |
| 2.5% 3/1/31 (b) | | 100 | 103 |
| 2.525% 5/1/36 (a) | | 36 | 38 |
| 2.555% 6/1/36 (a) | | 385 | 407 |
| 2.557% 3/1/40 (a) | | 181 | 191 |
| 2.559% 10/1/33 (a) | | 40 | 43 |
| 2.689% 2/1/42 (a) | | 642 | 667 |
| 2.75% 10/1/36 (a) | | 172 | 182 |
| 2.761% 1/1/42 (a) | | 566 | 589 |
| 2.78% 9/1/37 (a) | | 29 | 31 |
| 3% 3/1/31 (b) | | 9,100 | 9,490 |
| 3% 11/1/42 to 3/1/44 | | 44,324 | 45,672 |
| 3% 3/1/46 (b) | | 50,900 | 52,192 |
| 3% 3/1/46 (b) | | 1,000 | 1,025 |
| 3% 3/1/46 (b) | | 700 | 718 |
| 3% 3/1/46 (b) | | 600 | 615 |
| 3.007% 8/1/41 (a) | | 411 | 430 |
| 3.346% 9/1/41 (a) | | 129 | 137 |
| 3.465% 12/1/40 (a) | | 5,394 | 5,666 |
| 3.5% 4/1/29 to 8/1/45 | | 78,604 | 83,098 |
| 3.5% 3/1/46 (b) | | 33,800 | 35,418 |
| 3.5% 3/1/46 (b) | | 20,800 | 21,796 |
| 3.5% 3/1/46 (b) | | 20,700 | 21,691 |
| 3.5% 3/1/46 (b) | | 2,000 | 2,096 |
| 3.5% 3/1/46 (b) | | 7,700 | 8,069 |
| 3.5% 3/1/46 (b) | | 1,000 | 1,048 |
| 3.5% 3/1/46 (b) | | 1,000 | 1,048 |
| 3.5% 3/1/46 (b) | | 1,000 | 1,048 |
| 3.5% 3/1/46 (b) | | 6,000 | 6,287 |
| 3.5% 3/1/46 (b) | | 1,000 | 1,048 |
| 3.5% 3/1/46 (b) | | 7,921 | 8,300 |
| 3.5% 3/1/46 (b) | | 6,679 | 6,999 |
| 4% 11/1/31 to 1/1/46 | | 107,571 | 115,429 |
| 4% 3/1/46 (b) | | 150 | 160 |
| 4% 3/1/46 (b) | | 100 | 107 |
| 4% 3/1/46 (b) | | 4,750 | 5,068 |
| 4% 3/1/46 (b) | | 4,750 | 5,068 |
| 4% 3/1/46 (b) | | 50 | 53 |
| 4% 3/1/46 (b) | | 3,300 | 3,521 |
| 4% 3/1/46 (b) | | 3,300 | 3,521 |
| 4% 3/1/46 (b) | | 1,300 | 1,387 |
| 4.5% 5/1/25 to 4/1/45 | | 41,087 | 44,763 |
| 5% 5/1/20 to 8/1/41 | | 495 | 536 |
| 5.255% 8/1/41 | | 893 | 1,011 |
| 5.5% 2/1/18 to 4/1/39 | | 3,507 | 3,978 |
| 5.565% 8/1/46 (a) | | 44 | 46 |
| 6.5% 3/1/16 to 5/1/38 | | 1,389 | 1,592 |
| 7% 3/1/17 to 5/1/30 | | 913 | 1,062 |
| 7.5% 8/1/22 to 9/1/32 | | 593 | 715 |
| 8% 12/1/29 to 3/1/37 | | 15 | 18 |
| 8.5% 2/1/22 to 3/1/23 | | 56 | 64 |
| 9% 10/1/30 | | 198 | 246 |
| 9.5% 7/1/16 to 8/1/22 | | 4 | 4 |
| | | | 506,035 |
| Freddie Mac - 19.0% | | | |
| 1.945% 3/1/35 (a) | | 89 | 92 |
| 2.154% 8/1/37 (a) | | 77 | 81 |
| 2.175% 6/1/37 (a) | | 29 | 31 |
| 2.21% 3/1/36 (a) | | 230 | 240 |
| 2.246% 5/1/37 (a) | | 74 | 78 |
| 2.362% 10/1/42 (a) | | 596 | 630 |
| 2.372% 11/1/35 (a) | | 264 | 275 |
| 2.481% 5/1/34 (a) | | 6 | 7 |
| 2.51% 6/1/37 (a) | | 21 | 22 |
| 2.54% 6/1/37 (a) | | 271 | 286 |
| 2.562% 6/1/37 (a) | | 464 | 488 |
| 2.595% 4/1/37 (a) | | 9 | 9 |
| 2.668% 4/1/37 (a) | | 96 | 101 |
| 2.698% 6/1/33 (a) | | 708 | 747 |
| 2.795% 7/1/36 (a) | | 73 | 77 |
| 3% 10/1/42 to 1/1/46 | | 37,238 | 38,198 |
| 3.03% 10/1/36 (a) | | 13 | 14 |
| 3.075% 12/1/36 (a) | | 398 | 422 |
| 3.082% 9/1/41 (a) | | 577 | 602 |
| 3.25% 10/1/35 (a) | | 41 | 43 |
| 3.427% 12/1/40 (a) | | 2,450 | 2,563 |
| 3.5% 4/1/42 to 6/1/45 (c) | | 66,999 | 70,339 |
| 4% 2/1/41 to 2/1/46 | | 30,408 | 32,599 |
| 4% 3/1/46 (b) | | 9,300 | 9,910 |
| 4% 3/1/46 (b) | | 4,100 | 4,369 |
| 4.5% 7/1/25 to 8/1/44 | | 10,818 | 11,773 |
| 5% 7/1/33 to 7/1/41 | | 11,164 | 12,438 |
| 5.5% 10/1/17 to 10/1/39 | | 10,414 | 11,714 |
| 6% 5/1/16 to 6/1/39 | | 2,282 | 2,593 |
| 6.5% 7/1/16 to 9/1/39 | | 3,771 | 4,317 |
| 7% 6/1/21 to 9/1/36 | | 1,309 | 1,537 |
| 7.5% 5/1/16 to 7/1/34 | | 1,637 | 1,945 |
| 8% 11/1/16 to 1/1/37 | | 17 | 21 |
| 8.5% 8/1/16 to 9/1/20 | | 1 | 1 |
| 9% 9/1/16 to 5/1/21 | | 5 | 5 |
| 10% 4/1/16 to 12/1/18 | | 0 | 0 |
| | | | 208,567 |
| Ginnie Mae - 23.2% | | | |
| 3% 6/15/42 to 12/20/45 | | 44,519 | 46,174 |
| 3.5% 11/20/41 to 1/20/44 | | 48,738 | 51,564 |
| 3.5% 3/1/46 (b) | | 11,900 | 12,565 |
| 3.5% 3/1/46 (b) | | 12,700 | 13,409 |
| 3.5% 3/1/46 (b) | | 6,100 | 6,441 |
| 3.5% 3/1/46 (b) | | 7,300 | 7,708 |
| 3.5% 3/1/46 (b) | | 1,600 | 1,689 |
| 4% 7/20/33 to 7/20/45 | | 50,826 | 54,466 |
| 4% 3/1/46 (b) | | 1,200 | 1,282 |
| 4% 3/1/46 (b) | | 6,200 | 6,621 |
| 4% 3/1/46 (b) | | 2,200 | 2,350 |
| 4.5% 8/15/33 to 5/20/41 | | 31,098 | 33,988 |
| 5% 9/20/33 to 6/15/41 | | 9,833 | 11,079 |
| 5.5% 10/15/33 to 9/15/39 | | 2,893 | 3,284 |
| 6.5% 10/15/34 to 7/15/36 | | 184 | 217 |
| 7% 2/15/24 to 4/20/32 | | 836 | 996 |
| 7.5% 12/15/21 to 12/15/29 | | 307 | 362 |
| 8% 6/15/21 to 12/15/25 | | 175 | 205 |
| 8.5% 1/15/17 to 10/15/28 | | 139 | 166 |
| 9% 11/20/17 | | 0 | 0 |
| 10.5% 10/20/17 to 2/20/18 | | 1 | 1 |
| | | | 254,567 |
| TOTAL U.S. GOVERNMENT AGENCY - MORTGAGE SECURITIES | | | |
| (Cost $953,105) | | | 969,169 |
|
| Asset-Backed Securities - 6.8% | | | |
| American Credit Acceptance Receivable Trust Series 2016-1A Class A, 2.37% 5/12/20 (d) | | $3,270 | $3,271 |
| American Credit Acceptance Receivables Trust Series 2015-3 Class A, 1.95% 9/12/19 (d) | | 4,058 | 4,048 |
| CFC LLC Series 2014-1A Class A, 1.46% 12/17/18 (d) | | 1,203 | 1,202 |
| Citi Held For Asset Issuance Series 2015-PM33 Class A, 2.56% 5/16/22 (d) | | 1,788 | 1,787 |
| Citi Held For Asset Issuance 2 Series 2015-PM2 Class A, 2% 3/15/22 (d) | | 3,696 | 3,675 |
| CPS Auto Receivables Trust: | | | |
| Series 2013-C Class A, 1.64% 4/16/18 (d) | | 629 | 629 |
| Series 2013-D Class A, 1.54% 7/16/18 (d) | | 1,061 | 1,059 |
| CPS Auto Trust Series 2015-C Class A, 1.77% 6/17/19 (d) | | 8,651 | 8,633 |
| Drive Auto Receivables Trust Series 2015-DA Class A2A, 1.23% 6/15/18 (d) | | 4,782 | 4,778 |
| Exeter Automobile Receivables Trust: | | | |
| Series 2014-2A Class A, 1.06% 8/15/18 (d) | | 679 | 677 |
| Series 2016-1A Class A, 2.8% 7/15/20 (d) | | 5,500 | 5,497 |
| Flagship Credit Auto Trust: | | | |
| Series 2015-3 Class A, 2.34% 10/15/20 (d) | | 2,868 | 2,861 |
| Series 2016-1 Class A, 2.53% 12/15/20 (d) | | 10,800 | 10,774 |
| GSAMP Trust Series 2004-AR1 Class B4, 5.5% 6/25/34 (d) | | 45 | 1 |
| JPMorgan Mortgage Acquisition Trust: | | | |
| Series 2007-CH1 Class AF3, 5.532% 11/25/36 | | 1,084 | 1,103 |
| Series 2007-CH4 Class A3, 0.5458% 2/25/32 (a) | | 1,190 | 1,182 |
| Merrill Lynch Mortgage Investors Trust Series 2006-FF1 Class M2, 0.7258% 8/25/36 (a) | | 5,300 | 5,061 |
| Nationstar HECM Loan Trust: | | | |
| Series 2015-1A Class A, 3.844% 5/25/18 (d) | | 6,679 | 6,646 |
| Series 2016-1A Class A, 3.1294% 2/25/26 (d) | | 2,138 | 2,138 |
| OneMain Financial Issuance Trust Series 2014-1A Class A, 2.43% 6/18/24 (d) | | 1,180 | 1,178 |
| Springcastle SPV Series 2014-AA Class A, 2.7% 5/25/23 (d) | | 6,013 | 5,991 |
| Structured Asset Securities Corp. Series 2005-NC2 Class M3, 0.8565% 5/25/35 (a) | | 1,995 | 1,926 |
| Vericrest Opportunity Loan Trust Series 2014-NP11 Class A1, 3.875% 4/25/55 (d) | | 796 | 792 |
| TOTAL ASSET-BACKED SECURITIES | | | |
| (Cost $75,077) | | | 74,909 |
|
| Collateralized Mortgage Obligations - 12.7% | | | |
| Private Sponsor - 6.1% | | | |
| Banc of America Funding Corp. Series 2015-R3 Class 10A1, 0.5665% 6/27/36 (a)(d) | | 7,033 | 6,744 |
| Banc of America Funding Trust sequential payer Series 2010-R3 Class 1A1, 2.808% 12/26/35 (a)(d) | | 1,352 | 1,369 |
| BCAP LLC II Trust Series 2012-RR10 Class 5A5, 0.6868% 4/26/36 (a)(d) | | 274 | 267 |
| BCAP LLC Trust sequential payer: | | | |
| Series 2010-RR11 Class 6A1, 2.7078% 3/27/36 (a)(d) | | $3,479 | $3,452 |
| Series 2012-RR5 Class 8A5, 0.6021% 7/26/36 (a)(d) | | 908 | 860 |
| Citigroup Mortgage Loan Trust sequential payer: | | | |
| Series 2012-A Class A, 2.5% 6/25/51 (d) | | 3,165 | 3,117 |
| Series 2014-8 Class 2A1, 3.45% 6/27/37 (a)(d) | | 6,623 | 6,629 |
| Credit Suisse Commercial Mortgage Trust: | | | |
| floater Series 2010-15R Class 5A5, 0.7816% 11/26/35 (a)(d) | | 4,976 | 4,930 |
| Series 2014-15R Class 7A3, 1.1596% 10/26/37 (a)(d) | | 2,285 | 2,237 |
| Credit Suisse Mortgage Trust Series 2012-2R Class 1A1, 2.7362% 5/27/35 (a)(d) | | 494 | 507 |
| CSMC: | | | |
| floater Series 2015-1R Class 6A1, 0.7004% 5/27/37 (a)(d) | | 4,408 | 4,035 |
| Series 2011-2R Class 2A1, 2.6521% 7/27/36 (d) | | 3,998 | 3,955 |
| Series 2014-3R Class 2A1, 1.1216% 5/27/37 (a)(d) | | 1,223 | 1,154 |
| Exeter Automobile Receivables Trust Series 2015-2A Class A, 1.54% 11/15/19 (d) | | 6,503 | 6,476 |
| FDIC Trust Series 2013-N1 Class A, 4.5% 10/25/18 (d) | | 181 | 181 |
| First Horizon Mortgage pass-thru Trust Series 2004-AR5 Class 2A1, 2.6557% 10/25/34 (a) | | 320 | 307 |
| JPMorgan Re-REMIC Trust floater Series 2009-5 Class 2A1, 1.9726% 1/26/37 (a)(d) | | 262 | 261 |
| MASTR Adjustable Rate Mortgages Trust Series 2007-3 Class 22A2, 0.6365% 5/25/47 (a) | | 237 | 218 |
| MASTR Alternative Loan Trust Series 2004-6 Class 5A1, 5.4126% 7/25/19 (a) | | 1,150 | 1,158 |
| Merrill Lynch Alternative Note Asset Trust floater Series 2007-OAR1 Class A1, 0.6058% 2/25/37 (a) | | 1,291 | 1,143 |
| Morgan Stanley Re-REMIC Trust Series 2010-R6 Class 1A, 2.6101% 2/26/37 (a)(d) | | 3,048 | 3,061 |
| Nationstar HECM Loan Trust sequential payer Series 2015-2A Class A, 2.8826% 11/25/25 (d) | | 906 | 906 |
| Nomura Resecuritization Trust sequential payer Series 2011-3RA Class 2A1, 2.8917% 3/26/37 (a)(d) | | 2,008 | 1,981 |
| Structured Asset Securities Corp. Series 2003-15A Class 4A, 2.7237% 4/25/33 (a) | | 122 | 118 |
| Thornburg Mortgage Securities Trust floater Series 2003-4 Class A1, 1.0665% 9/25/43 (a) | | 4,121 | 3,949 |
| WaMu Mortgage pass-thru certificates sequential payer: | | | |
| Series 2002-S8 Class 2A7, 5.25% 1/25/18 | | 170 | 171 |
| Series 2003-MS5 Class 1A1, 5% 3/25/18 | | 211 | 214 |
| Wells Fargo Mortgage Backed Securities Trust: | | | |
| Series 2003-I Class A1, 2.6097% 9/25/33 (a) | | 954 | 943 |
| Series 2005-AR10 Class 2A15, 2.7505% 6/25/35 (a) | | 5,237 | 5,332 |
| Series 2005-AR2 Class 1A2, 2.6956% 3/25/35 (a) | | 223 | 205 |
| Series 2006-AR10 Class 3A1, 2.7337% 7/25/36 (a) | | 820 | 803 |
| Wells Fargo Mortgage Loan Trust sequential payer Series 2011-RR4 Class 2A1, 4.3738% 6/27/36 (a)(d) | | 904 | 888 |
| | | | 67,571 |
| U.S. Government Agency - 6.6% | | | |
| Fannie Mae: | | | |
| floater Series 2003-118 Class S, 7.6642% 12/25/33 (a)(e)(f) | | 325 | 75 |
| planned amortization class: | | | |
| Series 1999-17 Class PG, 6% 4/25/29 | | 623 | 682 |
| Series 1999-32 Class PL, 6% 7/25/29 | | 561 | 615 |
| Series 1999-33 Class PK, 6% 7/25/29 | | 359 | 394 |
| Series 2001-52 Class YZ, 6.5% 10/25/31 | | 43 | 50 |
| Series 2005-39 Class TE, 5% 5/25/35 | | 904 | 999 |
| Series 2005-73 Class SA, 16.4169% 8/25/35 (a)(f) | | 69 | 89 |
| Series 2006-105 Class MD, 5.5% 6/25/35 | | 176 | 177 |
| Series 2011-35 Class PA, 4% 2/25/39 | | 293 | 298 |
| sequential payer: | | | |
| Series 2001-20 Class Z, 6% 5/25/31 | | 620 | 680 |
| Series 2001-31 Class ZC, 6.5% 7/25/31 | | 266 | 309 |
| Series 2002-16 Class ZD, 6.5% 4/25/32 | | 89 | 104 |
| Series 2002-74 Class SV, 7.1142% 11/25/32 (a)(e) | | 228 | 43 |
| Series 2012-67 Class AI, 4.5% 7/25/27 (e) | | 816 | 105 |
| Series 06-116 Class SG, 6.2042% 12/25/36 (a)(e)(f) | | 215 | 42 |
| Series 07-40 Class SE, 6.0042% 5/25/37 (a)(e)(f) | | 135 | 23 |
| Series 1993-165 Class SH, 18.5671% 9/25/23 (a)(f) | | 31 | 43 |
| Series 2003-21 Class SK, 7.6642% 3/25/33 (a)(e)(f) | | 101 | 20 |
| Series 2003-35 Class TQ, 7.0642% 5/25/18 (a)(e)(f) | | 35 | 2 |
| Series 2007-57 Class SA, 38.0052% 6/25/37 (a)(f) | | 434 | 929 |
| Series 2007-66 Class SB, 36.9852% 7/25/37 (a)(f) | | 142 | 281 |
| Series 2008-12 Class SG, 5.9142% 3/25/38 (a)(e)(f) | | 725 | 130 |
| Series 2009-114 Class AI, 5% 12/25/23 (e) | | 180 | 6 |
| Series 2009-16 Class SA, 5.8142% 3/25/24 (a)(e)(f) | | 93 | 2 |
| Series 2009-76 Class MI, 5.5% 9/25/24 (e) | | 117 | 5 |
| Series 2009-85 Class IB, 4.5% 8/25/24 (e) | | 81 | 6 |
| Series 2009-93 Class IC, 4.5% 9/25/24 (e) | | 121 | 8 |
| Series 2010-12 Class AI, 5% 12/25/18 (e) | | 407 | 18 |
| Series 2010-135 Class LS, 5.6142% 12/25/40 (a)(e)(f) | | 663 | 119 |
| Series 2010-139 Class NI, 4.5% 2/25/40 (e) | | 853 | 108 |
| Series 2010-23: | | | |
| Class AI, 5% 12/25/18 (e) | | 164 | 7 |
| Class HI, 4.5% 10/25/18 (e) | | 125 | 5 |
| Series 2010-29 Class LI, 4.5% 6/25/19 (e) | | 366 | 14 |
| Series 2010-97 Class CI, 4.5% 8/25/25 (e) | | 263 | 17 |
| Series 2011-67 Class AI, 4% 7/25/26 (e) | | 223 | 23 |
| Series 2011-83 Class DI, 6% 9/25/26 (e) | | 314 | 38 |
| Series 2013-N1 Class A, 6.2842% 6/25/35 (a)(e)(f) | | 689 | 166 |
| Series 2015-70 Class JC, 3% 10/25/45 | | 3,805 | 3,970 |
| Fannie Mae Stripped Mortgage-Backed Securities: | | | |
| Series 339 Class 29, 5.5% 8/25/18 (e) | | 102 | 4 |
| Series 348 Class 14, 6.5% 8/25/34 (a)(e) | | 180 | 39 |
| Series 351: | | | |
| Class 12, 5.5% 4/25/34 (a)(e) | | 122 | 22 |
| Class 13, 6% 3/25/34 (e) | | 163 | 33 |
| Series 359 Class 19, 6% 7/25/35 (a)(e) | | 111 | 20 |
| Series 384 Class 6, 5% 7/25/37 (e) | | 410 | 76 |
| Freddie Mac: | | | |
| planned amortization class: | | | |
| Series 2095 Class PE, 6% 11/15/28 | | 691 | 761 |
| Series 2104 Class PG, 6% 12/15/28 | | 197 | 216 |
| Series 2121 Class MG, 6% 2/15/29 | | 271 | 297 |
| Series 2154 Class PT, 6% 5/15/29 | | 472 | 518 |
| Series 2162 Class PH, 6% 6/15/29 | | 73 | 80 |
| Series 2520 Class BE, 6% 11/15/32 | | 352 | 386 |
| Series 2585 Class KS, 7.173% 3/15/23 (a)(e)(f) | | 33 | 4 |
| Series 2693 Class MD, 5.5% 10/15/33 | | 5,885 | 6,661 |
| Series 2802 Class OB, 6% 5/15/34 | | 1,628 | 1,829 |
| Series 3002 Class NE, 5% 7/15/35 | | 553 | 609 |
| Series 3189 Class PD, 6% 7/15/36 | | 586 | 655 |
| Series 3415 Class PC, 5% 12/15/37 | | 169 | 185 |
| Series 3786 Class HI, 4% 3/15/38 (e) | | 806 | 84 |
| Series 3806 Class UP, 4.5% 2/15/41 | | 1,347 | 1,451 |
| Series 3832 Class PE, 5% 3/15/41 | | 960 | 1,103 |
| Series 70 Class C, 9% 9/15/20 | | 4 | 4 |
| sequential payer: | | | |
| Series 2114 Class ZM, 6% 1/15/29 | | 93 | 102 |
| Series 2135 Class JE, 6% 3/15/29 | | 352 | 385 |
| Series 2274 Class ZM, 6.5% 1/15/31 | | 155 | 180 |
| Series 2281 Class ZB, 6% 3/15/30 | | 130 | 142 |
| Series 2357 Class ZB, 6.5% 9/15/31 | | 311 | 366 |
| Series 2502 Class ZC, 6% 9/15/32 | | 346 | 383 |
| Series 06-3115 Class SM, 6.173% 2/15/36 (a)(e)(f) | | 177 | 31 |
| Series 1658 Class GZ, 7% 1/15/24 | | 420 | 466 |
| Series 2013-4281 Class AI, 4% 12/15/28 (e) | | 1,900 | 203 |
| Series 2380 Class SY, 7.773% 11/15/31 (a)(e)(f) | | 1,278 | 269 |
| Series 2587 Class IM, 6.5% 3/15/33 (e) | | 186 | 38 |
| Series 2844: | | | |
| Class SC, 44.0245% 8/15/24 (a)(f) | | 13 | 23 |
| Class SD, 80.899% 8/15/24 (a)(f) | | 19 | 45 |
| Series 2935 Class ZK, 5.5% 2/15/35 | | 1,540 | 1,763 |
| Series 2947 Class XZ, 6% 3/15/35 | | 645 | 736 |
| Series 3055 Class CS, 6.163% 10/15/35 (a)(e) | | 238 | 44 |
| Series 3244 Class SG, 6.233% 11/15/36 (a)(e)(f) | | 481 | 107 |
| Series 3274 Class SM, 6.003% 2/15/37 (a)(e) | | 278 | 51 |
| Series 3284 Class CI, 5.693% 3/15/37 (a)(e) | | 1,057 | 200 |
| Series 3287 Class SD, 6.323% 3/15/37 (a)(e)(f) | | 686 | 143 |
| Series 3297 Class BI, 6.333% 4/15/37 (a)(e)(f) | | 1,004 | 211 |
| Series 3336 Class LI, 6.153% 6/15/37 (a)(e) | | 449 | 71 |
| Series 3772 Class BI, 4.5% 10/15/18 (e) | | 252 | 11 |
| Series 3949 Class MK, 4.5% 10/15/34 | | 392 | 425 |
| Series 3955 Class YI, 3% 11/15/21 (e) | | 1,435 | 80 |
| Series 4471 Class PA 4% 12/15/40 | | 5,973 | 6,351 |
| Freddie Mac Manufactured Housing participation certificates guaranteed planned amortization class Series 2043 Class CJ, 6.5% 4/15/28 | | 258 | 298 |
| Freddie Mac Multi-family Structured pass-thru certificates Series 4386 Class AZ, 4.5% 11/15/40 | | 3,238 | 3,654 |
| Ginnie Mae guaranteed REMIC pass-thru certificates: | | | |
| floater: | | | |
| Series 2007-37 Class TS, 6.2645% 6/16/37 (a)(e)(f) | | 232 | 40 |
| Series 2010-H17 Class FA, 0.7519% 7/20/60 (a)(g) | | 282 | 277 |
| Series 2010-H18 Class AF, 0.551% 9/20/60 (a)(g) | | 346 | 340 |
| Series 2010-H19 Class FG, 0.551% 8/20/60 (a)(g) | | 401 | 395 |
| Series 2011-H13 Class FA, 0.751% 4/20/61 (a)(g) | | 168 | 167 |
| planned amortization class Series 2011-136 Class WI, 4.5% 5/20/40 (e) | | 523 | 53 |
| sequential payer: | | | |
| Series 2002-24 Class SK, 7.5245% 4/16/32 (a)(e)(f) | | 1,139 | 251 |
| Series 2002-42 Class ZA, 6% 6/20/32 | | 412 | 476 |
| Series 2004-24 Class ZM, 5% 4/20/34 | | 844 | 939 |
| Series 1999-40 Class SE, 8.5195% 11/16/29 (a)(e)(f) | | 194 | 7 |
| Series 2001-3 Class S, 7.6745% 2/16/31 (a)(e) | | 259 | 54 |
| Series 2001-36: | | | |
| Class SB, 7.6745% 12/16/23 (a)(e)(f) | | 660 | 119 |
| Class SP, 8.3245% 9/16/26 (a)(e) | | 458 | 71 |
| Series 2001-38 Class SB, 7.1545% 8/16/31 (a)(e)(f) | | 422 | 85 |
| Series 2001-41 Class SG, 8.3195% 9/16/31 (a)(e) | | 220 | 28 |
| Series 2001-49: | | | |
| Class SC, 7.1745% 12/16/25 (a)(e)(f) | | 869 | 148 |
| Class SL, 7.1745% 5/16/30 (a)(e)(f) | | 1,178 | 233 |
| Class SV, 7.8245% 12/16/28 (a)(e)(f) | | 321 | 21 |
| Series 2001-50: | | | |
| Class SD, 7.768% 11/20/31 (a)(e)(f) | | 609 | 155 |
| Class ST, 7.2745% 8/16/27 (a)(e)(f) | | 261 | 55 |
| Series 2002-5 Class SP, 7.0245% 1/16/32 (a)(e)(f) | | 419 | 74 |
| Series 2004-32 Class GS, 6.0745% 5/16/34 (a)(e)(f) | | 394 | 83 |
| Series 2004-73 Class AL, 6.7695% 8/17/34 (a)(e)(f) | | 149 | 37 |
| Series 2010-98 Class HS, 6.174% 8/20/40 (a)(e) | | 726 | 129 |
| Series 2011-52 Class HI, 7% 4/16/41 (e) | | 1,570 | 360 |
| Series 2012-76 Class GS, 6.2745% 6/16/42 (a)(e)(f) | | 764 | 153 |
| Series 2012-97 Class JS, 5.8245% 8/16/42 (a)(e)(f) | | 2,686 | 489 |
| Series 2013-124: | | | |
| Class ES, 8.0987% 4/20/39 (a)(f) | | 1,482 | 1,641 |
| Class ST, 8.232% 8/20/39 (a)(f) | | 2,784 | 3,216 |
| Series 2013-147 Class A/S, 5.724% 10/20/43 (a)(e) | | 1,258 | 196 |
| Series 2013-160 Class MS, 5.774% 9/20/32 (a)(e)(f) | | 2,211 | 435 |
| Series 2015-H13 Class HA, 2.5% 8/20/64 (g) | | 13,353 | 13,627 |
| Series 2015-H17 Class HA, 2.5% 5/20/65 (g) | | 5,131 | 5,239 |
| Ginnie Mae pass thru certificates Series 2010-85 Class SE, 6.124% 7/20/40 (a)(e) | | 794 | 139 |
| | | | 72,149 |
| TOTAL COLLATERALIZED MORTGAGE OBLIGATIONS | | | |
| (Cost $137,675) | | | 139,720 |
|
| Commercial Mortgage Securities - 12.8% | | | |
| Asset Securitization Corp. Series 1997-D5 Class PS1, 1.5885% 2/14/43 (a)(e) | | 673 | 5 |
| Banc of America Commercial Mortgage Trust: | | | |
| Series 2006-4 Class A1A, 5.617% 7/10/46 (a) | | 2,102 | 2,117 |
| Series 2007-2 Class A4, 5.79% 4/10/49 (a) | | 1,293 | 1,311 |
| Barclays Commercial Mortgage Securities LLC Series 2015-STP Class A, 3.3228% 9/10/28 (d) | | 5,587 | 5,749 |
| Bayview Commercial Asset Trust floater Series 2007-3: | | | |
| Class M1, 0.7458% 7/25/37 (a)(d) | | 38 | 29 |
| Class M2, 0.7758% 7/25/37 (a)(d) | | 40 | 29 |
| Class M3, 0.8058% 7/25/37 (a)(d) | | 65 | 32 |
| CDGJ Commercial Mortgage Trust Series 2014-BXCH Class A, 1.827% 12/15/27 (a)(d) | | 8,859 | 8,830 |
| Citigroup/Deutsche Bank Commercial Mortgage Trust sequential payer: | | | |
| Series 2006-CD3 Class A5, 5.617% 10/15/48 | | 163 | 164 |
| Series 2007-CD4 Class A4, 5.322% 12/11/49 | | 3,940 | 4,026 |
| COMM Mortgage Trust: | | | |
| floater Series 2014-KYO Class A, 1.324% 6/11/27 (a)(d) | | 5,000 | 4,876 |
| Series 2013-CR10 Class XA, 1.1309% 8/10/46 (a)(e) | | 10,374 | 442 |
| Series 2014-CR19 Class XA, 1.4501% 8/10/47 (a)(e) | | 15,637 | 1,054 |
| Series 2014-CR20 Class XA, 1.3593% 11/10/47 (a)(e) | | 13,165 | 923 |
| Series 2014-LC17 Class XA, 1.1645% 10/10/47 (a)(e) | | 14,979 | 739 |
| Series 2014-UBS4 Class XA, 1.4292% 8/10/47 (a)(e) | | 13,158 | 906 |
| Series 2014-UBS6 Class XA, 1.2201% 12/10/47 (a)(e) | | 8,827 | 537 |
| Series 2015-PC1 Class A5, 3.902% 7/10/50 | | 3,400 | 3,598 |
| CSMC Series 2015-TOWN: | | | |
| Class A, 1.677% 3/15/17 (a)(d) | | 7,804 | 7,713 |
| Class B, 2.327% 3/15/17 (a)(d) | | 185 | 179 |
| Class C, 2.677% 3/15/17 (a)(d) | | 180 | 172 |
| Class D, 3.627% 3/15/17 (a)(d) | | 273 | 259 |
| Freddie Mac: | | | |
| sequential payer: | | | |
| Series K030 Class A2, 3.25% 4/25/23 | | 1,640 | 1,764 |
| Series K033 Class A2, 3.06% 7/25/23 | | 8,600 | 9,129 |
| Series K034 Class A2, 3.531% 7/25/23 | | 5,549 | 6,062 |
| Series K035 Class A2, 3.458% 8/25/23 | | 1,022 | 1,111 |
| Series K032 Class A2, 3.31% 5/25/23 | | 1,628 | 1,755 |
| Series K036 Class A2, 3.527% 10/25/23 | | 2,681 | 2,927 |
| Freddie Mac Multi-family Structured pass-thru certificates sequential payer Series K038 Class A2, 3.389% 3/25/24 | | 1,630 | 1,764 |
| GAHR Commercial Mortgage Trust: | | | |
| floater Series 2015-NRF Class AFL1, 1.7255% 12/15/16 (a)(d) | | 12,633 | 12,512 |
| Series 2015-NRF Class AFX, 3.2349% 12/15/19 (d) | | 7,000 | 7,167 |
| GE Capital Commercial Mortgage Corp.: | | | |
| sequential payer Series 2007-C1 Class A4, 5.543% 12/10/49 | | 914 | 928 |
| Series 2007-C1 Class A1A, 5.483% 12/10/49 (a) | | 4,802 | 4,930 |
| GS Mortgage Securities Trust: | | | |
| floater Series 2014-GSFL Class A, 1.4255% 7/15/31 (a)(d) | | 513 | 505 |
| Series 2015-GC34 Class XA, 1.5357% 10/10/48 (a)(e) | | 10,680 | 1,020 |
| Hyatt Hotel Portfolio Trust floater Series 2015-HYT Class A, 1.6755% 11/15/29 (a)(d) | | 844 | 839 |
| JPMorgan Chase Commercial Mortgage Securities Corp. Series 2012-CBX Class XA, 1.9192% 6/15/45 (a)(e) | | 46,578 | 3,011 |
| JPMorgan Chase Commercial Mortgage Securities Trust: | | | |
| floater Series 2014-BXH Class A, 1.3305% 4/15/27 (a)(d) | | 5,000 | 4,938 |
| sequential payer: | | | |
| Series 2006-CB16 Class A1A, 5.546% 5/12/45 | | 1,306 | 1,315 |
| Series 2006-LDP8 Class A1A, 5.397% 5/15/45 | | 930 | 936 |
| Series 2007-LD11 Class A4, 5.9599% 6/15/49 (a) | | 4,140 | 4,223 |
| Series 2007-CB20 Class A1A, 5.746% 2/12/51 | | 2,508 | 2,616 |
| Merrill Lynch-CFC Commercial Mortgage Trust sequential payer Series 2007-6 Class A4, 5.485% 3/12/51 (a) | | 175 | 179 |
| Morgan Stanley BAML Trust Series 2015-C25 Class XA, 1.3069% 10/15/48 (a)(e) | | 13,837 | 1,078 |
| Morgan Stanley Capital I Trust sequential payer Series 2007-IQ15 Class A4, 6.1142% 6/11/49 (a) | | 1,633 | 1,691 |
| SCG Trust Series 2013-SRP1 Class A, 1.8255% 11/15/26 (a)(d) | | 2,783 | 2,771 |
| Wachovia Bank Commercial Mortgage Trust: | | | |
| sequential payer: | | | |
| Series 2006-C29 Class A1A, 5.297% 11/15/48 | | 6,833 | 6,959 |
| Series 2007-C31: | | | |
| Class A4, 5.509% 4/15/47 | | 313 | 319 |
| Class A5, 5.5% 4/15/47 | | 8,506 | 8,754 |
| Series 2007-C32 Class A3, 5.8991% 6/15/49 (a) | | 1,150 | 1,175 |
| Series 2007-C33 Class A4, 6.1491% 2/15/51 (a) | | 1,786 | 1,845 |
| Series 2006-C27 Class A1A, 5.749% 7/15/45 (a) | | 1,771 | 1,779 |
| Wells Fargo Commercial Mortgage Trust Series 2015-C31 Class XA, 1.2791% 11/15/48 (a)(e) | | 11,180 | 865 |
| TOTAL COMMERCIAL MORTGAGE SECURITIES | | | |
| (Cost $141,740) | | | 140,557 |
| | | Shares | Value (000s) |
|
| Fixed-Income Funds - 0.2% | | | |
| Fidelity Mortgage Backed Securities Central Fund (h) | | | |
| (Cost $1,653) | | 15,043 | 1,656 |
| | | Maturity Amount (000s) | Value (000s) |
|
| Cash Equivalents - 3.1% | | | |
| Investments in repurchase agreements in a joint trading account at 0.4%, dated 2/29/16 due 3/1/16 (Collateralized by U.S. Government Obligations) # | | | |
| (Cost $34,343) | | 34,343 | 34,343 |
| TOTAL INVESTMENT PORTFOLIO - 123.8% | | | |
| (Cost $1,343,593) | | | 1,360,354 |
| NET OTHER ASSETS (LIABILITIES) - (23.8)% | | | (261,088) |
| NET ASSETS - 100% | | | $1,099,266 |
| TBA Sale Commitments | | |
| | Principal Amount (000s) | Value (000s) |
| Fannie Mae | | |
| 3.5% 3/1/46 | $(7,700) | $(8,069) |
| 3.5% 3/1/46 | (7,700) | (8,069) |
| 4% 3/1/46 | (100) | (107) |
| 4% 3/1/46 | (100) | (107) |
| 4% 3/1/46 | (5,400) | (5,762) |
| 4% 3/1/46 | (4,750) | (5,068) |
| 4% 3/1/46 | (50) | (53) |
| 4% 3/1/46 | (9,500) | (10,134) |
| 4.5% 3/1/46 | (6,200) | (6,734) |
|
| TOTAL FANNIE MAE | | (44,103) |
|
| Freddie Mac | | |
| 4% 3/1/46 | (719) | (766) |
| 4% 3/1/46 | (481) | (513) |
| 4% 3/1/46 | (3,600) | (3,836) |
|
| TOTAL FREDDIE MAC | | (5,115) |
|
| Ginnie Mae | | |
| 4% 3/1/46 | (5,200) | (5,553) |
| 4% 3/1/46 | (2,200) | (2,350) |
| 4% 3/1/46 | (2,200) | (2,350) |
|
| TOTAL GINNIE MAE | | (10,253) |
|
| TOTAL TBA SALE COMMITMENTS | | |
| (Proceeds $59,497) | | $(59,471) |
Swaps
| Clearinghouse/Counterparty(1) | Expiration Date | Notional Amount (000s) | Payment Received | Payment Paid | Value (000s) | Upfront Premium Received/(Paid) (000s)(2) | Unrealized Appreciation/(Depreciation) (000s) |
| Interest Rate Swaps | | | | | | | |
| LCH | Mar. 2018 | $30,200 | 3-month LIBOR | 1.5% | $(208) | $0 | $(208) |
| LCH | Mar. 2019 | 11,800 | 3-month LIBOR | 1.75% | (161) | 0 | (161) |
| LCH | Mar. 2021 | 13,800 | 3-month LIBOR | 2% | (388) | 0 | (388) |
| LCH | Mar. 2026 | 2,350 | 3-month LIBOR | 2.5% | (137) | 0 | (137) |
| LCH | Mar. 2046 | 830 | 3-month LIBOR | 2.75% | (102) | 0 | (102) |
|
| TOTAL INTEREST RATE SWAPS | | | | | $(996) | $0 | $(996) |
|
(1) Swaps with LCH Clearnet Group (LCH) are centrally cleared over-the-counter (OTC) swaps.
(2) Any premiums for centrally cleared over-the-counter (OTC) swaps are recorded periodically throughout the term of the swap to variation margin and included in unrealized appreciation (depreciation).
For the period, the average monthly notional amount for swaps in the aggregate was $79,203,000.
Values shown as $0 may reflect amounts less than $500.
Legend
(a) Coupon rates for floating and adjustable rate securities reflect the rates in effect at period end.
(b) Security or a portion of the security purchased on a delayed delivery or when-issued basis.
(c) Security or a portion of the security was pledged to cover margin requirements for centrally cleared OTC swaps. At period end, the value of securities pledged amounted to $1,119,000.
(d) Security exempt from registration under Rule 144A of the Securities Act of 1933. These securities may be resold in transactions exempt from registration, normally to qualified institutional buyers. At the end of the period, the value of these securities amounted to $175,247,000 or 15.9% of net assets.
(e) Security represents right to receive monthly interest payments on an underlying pool of mortgages or assets. Principal shown is the outstanding par amount of the pool as of the end of the period.
(f) Coupon is inversely indexed to a floating interest rate multiplied by a specified factor. The price may be considerably more volatile than the price of a comparable fixed rate security.
(g) Represents an investment in an underlying pool of reverse mortgages which typically do not require regular principal and interest payments as repayment is deferred until a maturity event.
(h) Affiliated fund that is generally available only to investment companies and other accounts managed by Fidelity Investments. A complete unaudited schedule of portfolio holdings for each Fidelity Central Fund is filed with the SEC for the first and third quarters of each fiscal year on Form N-Q and is available upon request or at the SEC's website at www.sec.gov. An unaudited holdings listing for the Fund, which presents direct holdings as well as the pro-rata share of securities and other investments held indirectly through its investment in underlying non-money market Fidelity Central Funds, is available at fidelity.com and/or advisor.fidelity.com, as applicable. In addition, each Fidelity Central Fund's financial statements are available on the SEC's website or upon request.
Affiliated Central Funds
Information regarding fiscal year to date income earned by the Fund from investments in Fidelity Central Funds is as follows:
| Fund | Income earned |
| | (Amounts in thousands) |
| Fidelity Mortgage Backed Securities Central Fund | $21 |
| Total | $21 |
Additional information regarding the Fund's fiscal year to date purchases and sales, including the ownership percentage, of the non Money Market Central Funds is as follows:
| Fund (Amounts in thousands) | Value, beginning of period | Purchases | Sales Proceeds | Value, end of period | % ownership, end of period |
| Fidelity Mortgage Backed Securities Central Fund | $1,622 | $21 | $-- | $1,656 | 0.0% |
| Total | $1,622 | $21 | $-- | $1,656 | |
Investment Valuation
The following is a summary of the inputs used, as of February 29, 2016, involving the Fund's assets and liabilities carried at fair value. The inputs or methodology used for valuing securities may not be an indication of the risk associated with investing in those securities. For more information on valuation inputs, and their aggregation into the levels used below, please refer to the Investment Valuation section in the accompanying Notes to Financial Statements.
| | Valuation Inputs at Reporting Date: |
| Description | Total | Level 1 | Level 2 | Level 3 |
| (Amounts in thousands) | | | | |
| Investments in Securities: | | | | |
| U.S. Government Agency - Mortgage Securities | $969,169 | $-- | $969,169 | $-- |
| Asset-Backed Securities | 74,909 | -- | 74,909 | -- |
| Collateralized Mortgage Obligations | 139,720 | -- | 139,720 | -- |
| Commercial Mortgage Securities | 140,557 | -- | 140,557 | -- |
| Fixed-Income Funds | 1,656 | 1,656 | -- | -- |
| Cash Equivalents | 34,343 | -- | 34,343 | -- |
| Total Investments in Securities: | $1,360,354 | $1,656 | $1,358,698 | $-- |
| Derivative Instruments: | | | | |
| Liabilities | | | | |
| Swaps | $(996) | $-- | $(996) | $-- |
| Total Liabilities | $(996) | $-- | $(996) | $-- |
| Total Derivative Instruments: | $(996) | $-- | $(996) | $-- |
| Other Financial Instruments: | | | | |
| TBA Sale Commitments | $(59,471) | $-- | $(59,471) | $-- |
| Total Other Financial Instruments: | $(59,471) | $-- | $(59,471) | $-- |
Value of Derivative Instruments
The following table is a summary of the Fund's value of derivative instruments by primary risk exposure as of February 29, 2016. For additional information on derivative instruments, please refer to the Derivative Instruments section in the accompanying Notes to Financial Statements.
| Primary Risk Exposure / Derivative Type | Value |
| (Amounts in thousands) | Asset | Liability |
| Interest Rate Risk | | |
| Swaps(a) | $0 | $(996) |
| Total Interest Rate Risk | 0 | (996) |
| Total Value of Derivatives | $0 | $(996) |
(a) For centrally cleared OTC swaps, reflects gross cumulative appreciation (depreciation) as presented in the Schedule of Investments. For centrally cleared OTC swaps, only the period end receivable or payable for daily variation margin and net unrealized appreciation (depreciation) are presented in the Statement of Assets and Liabilities
Other Information
# Additional information on each counterparty to the repurchase agreement is as follows:
| Repurchase Agreement / Counterparty | Value |
| $34,343,000 due 3/01/16 at 0.40% | (Amounts in thousands) |
| Commerz Markets LLC | $34,343 |
| | $34,343 |
See accompanying notes which are an integral part of the financial statements.
Financial Statements
Statement of Assets and Liabilities
| Amounts in thousands (except per-share amounts) | | February 29, 2016 (Unaudited) |
| Assets | | |
Investment in securities, at value (including repurchase agreements of $34,343) — See accompanying schedule:
Unaffiliated issuers (cost $1,341,940) | $1,358,698 | |
| Fidelity Central Funds (cost $1,653) | 1,656 | |
| Total Investments (cost $1,343,593) | | $1,360,354 |
| Cash | | 144 |
| Receivable for investments sold | | |
| Regular delivery | | 13,410 |
| Delayed delivery | | 5,112 |
| Receivable for TBA sale commitments | | 59,497 |
| Receivable for fund shares sold | | 1,411 |
| Interest receivable | | 3,141 |
| Distributions receivable from Fidelity Central Funds | | 4 |
| Receivable from investment adviser for expense reductions | | 29 |
| Total assets | | 1,443,102 |
| Liabilities | | |
| Payable for investments purchased | | |
| Regular delivery | $19,449 | |
| Delayed delivery | 263,501 | |
| TBA sale commitments, at value | 59,471 | |
| Payable for fund shares redeemed | 835 | |
| Distributions payable | 126 | |
| Accrued management fee | 281 | |
| Distribution and service plan fees payable | 29 | |
| Payable for daily variation margin for derivative instruments | 11 | |
| Other affiliated payables | 133 | |
| Total liabilities | | 343,836 |
| Net Assets | | $1,099,266 |
| Net Assets consist of: | | |
| Paid in capital | | $1,160,117 |
| Distributions in excess of net investment income | | (2,190) |
| Accumulated undistributed net realized gain (loss) on investments | | (74,452) |
| Net unrealized appreciation (depreciation) on investments | | 15,791 |
| Net Assets | | $1,099,266 |
| Calculation of Maximum Offering Price | | |
| Class A: | | |
| Net Asset Value and redemption price per share ($44,125 ÷ 3,885.80 shares) | | $11.36 |
| Maximum offering price per share (100/96.00 of $11.36) | | $11.83 |
| Class T: | | |
| Net Asset Value and redemption price per share ($24,125 ÷ 2,120.29 shares) | | $11.38 |
| Maximum offering price per share (100/96.00 of $11.38) | | $11.85 |
| Class B: | | |
| Net Asset Value and offering price per share ($714 ÷ 62.89 shares)(a) | | $11.35 |
| Class C: | | |
| Net Asset Value and offering price per share ($18,644 ÷ 1,644.40 shares)(a) | | $11.34 |
| Fidelity Mortgage Securities Fund: | | |
| Net Asset Value, offering price and redemption price per share ($932,567 ÷ 81,918.64 shares) | | $11.38 |
| Class I: | | |
| Net Asset Value, offering price and redemption price per share ($79,091 ÷ 6,972.41 shares) | | $11.34 |
(a) Redemption price per share is equal to net asset value less any applicable contingent deferred sales charge.
See accompanying notes which are an integral part of the financial statements.
Statement of Operations
| Amounts in thousands | | Six months ended February 29, 2016 (Unaudited) |
| Investment Income | | |
| Interest | | $14,700 |
| Income from Fidelity Central Funds | | 21 |
| Total income | | 14,721 |
| Expenses | | |
| Management fee | $1,616 | |
| Transfer agent fees | 575 | |
| Distribution and service plan fees | 161 | |
| Fund wide operations fee | 201 | |
| Independent trustees' compensation | 2 | |
| Miscellaneous | 9 | |
| Total expenses before reductions | 2,564 | |
| Expense reductions | (28) | 2,536 |
| Net investment income (loss) | | 12,185 |
| Realized and Unrealized Gain (Loss) | | |
| Net realized gain (loss) on: | | |
| Investment securities: | | |
| Unaffiliated issuers | 6,193 | |
| Swaps | (2,480) | |
| Total net realized gain (loss) | | 3,713 |
Change in net unrealized appreciation (depreciation) on:
Investment securities | 4,128 | |
| Swaps | 437 | |
| Delayed delivery commitments | (68) | |
| Total change in net unrealized appreciation (depreciation) | | 4,497 |
| Net gain (loss) | | 8,210 |
| Net increase (decrease) in net assets resulting from operations | | $20,395 |
See accompanying notes which are an integral part of the financial statements.
Statement of Changes in Net Assets
| Amounts in thousands | Six months ended February 29, 2016 (Unaudited) | Year ended August 31, 2015 |
| Increase (Decrease) in Net Assets | | |
| Operations | | |
| Net investment income (loss) | $12,185 | $22,215 |
| Net realized gain (loss) | 3,713 | 9,548 |
| Change in net unrealized appreciation (depreciation) | 4,497 | (7,250) |
| Net increase (decrease) in net assets resulting from operations | 20,395 | 24,513 |
| Distributions to shareholders from net investment income | (13,351) | (21,563) |
| Distributions to shareholders from net realized gain | (552) | (244) |
| Total distributions | (13,903) | (21,807) |
| Share transactions - net increase (decrease) | 89,918 | 86,045 |
| Total increase (decrease) in net assets | 96,410 | 88,751 |
| Net Assets | | |
| Beginning of period | 1,002,856 | 914,105 |
| End of period (including distributions in excess of net investment income of $2,190 and distributions in excess of net investment income of $1,024, respectively) | $1,099,266 | $1,002,856 |
See accompanying notes which are an integral part of the financial statements.
Financial Highlights — Fidelity Advisor Mortgage Securities Fund Class A
| | Six months ended February 29, (Unaudited) | Years ended August 31, | | | | |
| | 2016 | 2015 | 2014 | 2013 | 2012 | 2011 |
| Selected Per–Share Data | | | | | | |
| Net asset value, beginning of period | $11.29 | $11.24 | $10.89 | $11.34 | $11.14 | $10.91 |
| Income from Investment Operations | | | | | | |
| Net investment income (loss)A | .115 | .223 | .239 | .169 | .278 | .323 |
| Net realized and unrealized gain (loss) | .089 | .047 | .341 | (.457) | .206 | .235 |
| Total from investment operations | .204 | .270 | .580 | (.288) | .484 | .558 |
| Distributions from net investment income | (.128) | (.217) | (.230) | (.162) | (.284) | (.328) |
| Distributions from net realized gain | (.006) | (.003) | – | – | – | – |
| Total distributions | (.134) | (.220) | (.230) | (.162) | (.284) | (.328) |
| Net asset value, end of period | $11.36 | $11.29 | $11.24 | $10.89 | $11.34 | $11.14 |
| Total ReturnB,C,D | 1.82% | 2.41% | 5.37% | (2.57)% | 4.41% | 5.22% |
| Ratios to Average Net AssetsE,F | | | | | | |
| Expenses before reductions | .80%G | .81% | .81% | .79% | .81% | .82% |
| Expenses net of fee waivers, if any | .80%G | .81% | .81% | .79% | .81% | .82% |
| Expenses net of all reductions | .80%G | .81% | .81% | .79% | .81% | .82% |
| Net investment income (loss) | 2.05%G | 1.97% | 2.15% | 1.51% | 2.48% | 2.96% |
| Supplemental Data | | | | | | |
| Net assets, end of period (in millions) | $44 | $38 | $41 | $50 | $60 | $59 |
| Portfolio turnover rateH | 411%G | 439% | 398% | 474% | 451% | 490% |
A Calculated based on average shares outstanding during the period.
B Total returns for periods of less than one year are not annualized.
C Total returns would have been lower if certain expenses had not been reduced during the applicable periods shown.
D Total returns do not include the effect of the sales charges.
E Fees and expenses of any underlying Fidelity Central Funds are not included in the Fund's expense ratio. The Fund indirectly bears its proportionate share of the expenses of any underlying Fidelity Central Funds. Based on their most recent shareholder report date, the expenses of any underlying non-money market Fidelity Central Funds were less than .005%.
F Expense ratios reflect operating expenses of the class. Expenses before reductions do not reflect amounts reimbursed by the investment adviser or reductions from expense offset arrangements and do not represent the amount paid by the class during periods when reimbursements or reductions occur. Expenses net of fee waivers reflect expenses after reimbursement by the investment adviser but prior to reductions from expense offset arrangements. Expenses net of all reductions represent the net expenses paid by the class.
G Annualized
H Amount does not include the portfolio activity of any underlying Fidelity Central Funds.
See accompanying notes which are an integral part of the financial statements.
Financial Highlights — Fidelity Advisor Mortgage Securities Fund Class T
| | Six months ended February 29, (Unaudited) | Years ended August 31, | | | | |
| | 2016 | 2015 | 2014 | 2013 | 2012 | 2011 |
| Selected Per–Share Data | | | | | | |
| Net asset value, beginning of period | $11.31 | $11.27 | $10.92 | $11.37 | $11.16 | $10.93 |
| Income from Investment Operations | | | | | | |
| Net investment income (loss)A | .115 | .225 | .242 | .173 | .281 | .326 |
| Net realized and unrealized gain (loss) | .089 | .037 | .340 | (.458) | .216 | .235 |
| Total from investment operations | .204 | .262 | .582 | (.285) | .497 | .561 |
| Distributions from net investment income | (.128) | (.219) | (.232) | (.165) | (.287) | (.331) |
| Distributions from net realized gain | (.006) | (.003) | – | – | – | – |
| Total distributions | (.134) | (.222) | (.232) | (.165) | (.287) | (.331) |
| Net asset value, end of period | $11.38 | $11.31 | $11.27 | $10.92 | $11.37 | $11.16 |
| Total ReturnB,C,D | 1.82% | 2.33% | 5.38% | (2.54)% | 4.52% | 5.24% |
| Ratios to Average Net AssetsE,F | | | | | | |
| Expenses before reductions | .80%G | .79% | .79% | .77% | .78% | .79% |
| Expenses net of fee waivers, if any | .80%G | .79% | .79% | .77% | .78% | .79% |
| Expenses net of all reductions | .80%G | .79% | .79% | .77% | .78% | .79% |
| Net investment income (loss) | 2.05%G | 1.98% | 2.17% | 1.53% | 2.50% | 2.99% |
| Supplemental Data | | | | | | |
| Net assets, end of period (in millions) | $24 | $20 | $22 | $26 | $31 | $37 |
| Portfolio turnover rateH | 411%G | 439% | 398% | 474% | 451% | 490% |
A Calculated based on average shares outstanding during the period.
B Total returns for periods of less than one year are not annualized.
C Total returns would have been lower if certain expenses had not been reduced during the applicable periods shown.
D Total returns do not include the effect of the sales charges.
E Fees and expenses of any underlying Fidelity Central Funds are not included in the Fund's expense ratio. The Fund indirectly bears its proportionate share of the expenses of any underlying Fidelity Central Funds. Based on their most recent shareholder report date, the expenses of any underlying non-money market Fidelity Central Funds were less than .005%.
F Expense ratios reflect operating expenses of the class. Expenses before reductions do not reflect amounts reimbursed by the investment adviser or reductions from expense offset arrangements and do not represent the amount paid by the class during periods when reimbursements or reductions occur. Expenses net of fee waivers reflect expenses after reimbursement by the investment adviser but prior to reductions from expense offset arrangements. Expenses net of all reductions represent the net expenses paid by the class.
G Annualized
H Amount does not include the portfolio activity of any underlying Fidelity Central Funds.
See accompanying notes which are an integral part of the financial statements.
Financial Highlights — Fidelity Advisor Mortgage Securities Fund Class B
| | Six months ended February 29, (Unaudited) | Years ended August 31, | | | | |
| | 2016 | 2015 | 2014 | 2013 | 2012 | 2011 |
| Selected Per–Share Data | | | | | | |
| Net asset value, beginning of period | $11.28 | $11.24 | $10.89 | $11.34 | $11.14 | $10.91 |
| Income from Investment Operations | | | | | | |
| Net investment income (loss)A | .076 | .145 | .162 | .090 | .200 | .248 |
| Net realized and unrealized gain (loss) | .088 | .037 | .342 | (.457) | .207 | .235 |
| Total from investment operations | .164 | .182 | .504 | (.367) | .407 | .483 |
| Distributions from net investment income | (.088) | (.139) | (.154) | (.083) | (.207) | (.253) |
| Distributions from net realized gain | (.006) | (.003) | – | – | – | – |
| Total distributions | (.094) | (.142) | (.154) | (.083) | (.207) | (.253) |
| Net asset value, end of period | $11.35 | $11.28 | $11.24 | $10.89 | $11.34 | $11.14 |
| Total ReturnB,C,D | 1.46% | 1.62% | 4.65% | (3.25)% | 3.69% | 4.51% |
| Ratios to Average Net AssetsE,F | | | | | | |
| Expenses before reductions | 1.51%G | 1.50% | 1.50% | 1.50% | 1.50% | 1.50% |
| Expenses net of fee waivers, if any | 1.50%G | 1.50% | 1.50% | 1.50% | 1.50% | 1.50% |
| Expenses net of all reductions | 1.50%G | 1.50% | 1.50% | 1.50% | 1.50% | 1.50% |
| Net investment income (loss) | 1.35%G | 1.28% | 1.46% | .80% | 1.79% | 2.27% |
| Supplemental Data | | | | | | |
| Net assets, end of period (in millions) | $1 | $1 | $1 | $2 | $4 | $5 |
| Portfolio turnover rateH | 411%G | 439% | 398% | 474% | 451% | 490% |
A Calculated based on average shares outstanding during the period.
B Total returns for periods of less than one year are not annualized.
C Total returns would have been lower if certain expenses had not been reduced during the applicable periods shown.
D Total returns do not include the effect of the contingent deferred sales charge.
E Fees and expenses of any underlying Fidelity Central Funds are not included in the Fund's expense ratio. The Fund indirectly bears its proportionate share of the expenses of any underlying Fidelity Central Funds. Based on their most recent shareholder report date, the expenses of any underlying non-money market Fidelity Central Funds were less than .005%.
F Expense ratios reflect operating expenses of the class. Expenses before reductions do not reflect amounts reimbursed by the investment adviser or reductions from expense offset arrangements and do not represent the amount paid by the class during periods when reimbursements or reductions occur. Expenses net of fee waivers reflect expenses after reimbursement by the investment adviser but prior to reductions from expense offset arrangements. Expenses net of all reductions represent the net expenses paid by the class.
G Annualized
H Amount does not include the portfolio activity of any underlying Fidelity Central Funds.
See accompanying notes which are an integral part of the financial statements.
Financial Highlights — Fidelity Advisor Mortgage Securities Fund Class C
| | Six months ended February 29, (Unaudited) | Years ended August 31, | | | | |
| | 2016 | 2015 | 2014 | 2013 | 2012 | 2011 |
| Selected Per–Share Data | | | | | | |
| Net asset value, beginning of period | $11.27 | $11.23 | $10.88 | $11.33 | $11.12 | $10.90 |
| Income from Investment Operations | | | | | | |
| Net investment income (loss)A | .073 | .141 | .160 | .088 | .197 | .244 |
| Net realized and unrealized gain (loss) | .089 | .037 | .342 | (.457) | .217 | .226 |
| Total from investment operations | .162 | .178 | .502 | (.369) | .414 | .470 |
| Distributions from net investment income | (.086) | (.135) | (.152) | (.081) | (.204) | (.250) |
| Distributions from net realized gain | (.006) | (.003) | – | – | – | – |
| Total distributions | (.092) | (.138) | (.152) | (.081) | (.204) | (.250) |
| Net asset value, end of period | $11.34 | $11.27 | $11.23 | $10.88 | $11.33 | $11.12 |
| Total ReturnB,C,D | 1.44% | 1.59% | 4.64% | (3.28)% | 3.76% | 4.39% |
| Ratios to Average Net AssetsE,F | | | | | | |
| Expenses before reductions | 1.55%G | 1.53% | 1.52% | 1.52% | 1.53% | 1.53% |
| Expenses net of fee waivers, if any | 1.54%G | 1.53% | 1.52% | 1.52% | 1.53% | 1.53% |
| Expenses net of all reductions | 1.54%G | 1.53% | 1.52% | 1.52% | 1.53% | 1.53% |
| Net investment income (loss) | 1.31%G | 1.25% | 1.44% | .78% | 1.76% | 2.24% |
| Supplemental Data | | | | | | |
| Net assets, end of period (in millions) | $19 | $16 | $17 | $17 | $18 | $15 |
| Portfolio turnover rateH | 411%G | 439% | 398% | 474% | 451% | 490% |
A Calculated based on average shares outstanding during the period.
B Total returns for periods of less than one year are not annualized.
C Total returns would have been lower if certain expenses had not been reduced during the applicable periods shown.
D Total returns do not include the effect of the contingent deferred sales charge.
E Fees and expenses of any underlying Fidelity Central Funds are not included in the Fund's expense ratio. The Fund indirectly bears its proportionate share of the expenses of any underlying Fidelity Central Funds. Based on their most recent shareholder report date, the expenses of any underlying non-money market Fidelity Central Funds were less than .005%.
F Expense ratios reflect operating expenses of the class. Expenses before reductions do not reflect amounts reimbursed by the investment adviser or reductions from expense offset arrangements and do not represent the amount paid by the class during periods when reimbursements or reductions occur. Expenses net of fee waivers reflect expenses after reimbursement by the investment adviser but prior to reductions from expense offset arrangements. Expenses net of all reductions represent the net expenses paid by the class.
G Annualized
H Amount does not include the portfolio activity of any underlying Fidelity Central Funds.
See accompanying notes which are an integral part of the financial statements.
Financial Highlights — Fidelity Advisor Mortgage Securities Fund
| | Six months ended February 29, (Unaudited) | Years ended August 31, | | | | |
| | 2016 | 2015 | 2014 | 2013 | 2012 | 2011 |
| Selected Per–Share Data | | | | | | |
| Net asset value, beginning of period | $11.31 | $11.27 | $10.92 | $11.37 | $11.17 | $10.94 |
| Income from Investment Operations | | | | | | |
| Net investment income (loss)A | .135 | .264 | .279 | .209 | .318 | .364 |
| Net realized and unrealized gain (loss) | .089 | .037 | .341 | (.458) | .206 | .234 |
| Total from investment operations | .224 | .301 | .620 | (.249) | .524 | .598 |
| Distributions from net investment income | (.148) | (.258) | (.270) | (.201) | (.324) | (.368) |
| Distributions from net realized gain | (.006) | (.003) | – | – | – | – |
| Total distributions | (.154) | (.261) | (.270) | (.201) | (.324) | (.368) |
| Net asset value, end of period | $11.38 | $11.31 | $11.27 | $10.92 | $11.37 | $11.17 |
| Total ReturnB,C | 1.99% | 2.68% | 5.73% | (2.23)% | 4.77% | 5.59% |
| Ratios to Average Net AssetsD,E | | | | | | |
| Expenses before reductions | .45%F | .45% | .45% | .45% | .45% | .45% |
| Expenses net of fee waivers, if any | .45%F | .45% | .45% | .45% | .45% | .45% |
| Expenses net of all reductions | .45%F | .45% | .45% | .45% | .45% | .45% |
| Net investment income (loss) | 2.40%F | 2.33% | 2.51% | 1.85% | 2.84% | 3.33% |
| Supplemental Data | | | | | | |
| Net assets, end of period (in millions) | $933 | $856 | $785 | $778 | $850 | $765 |
| Portfolio turnover rateG | 411%F | 439% | 398% | 474% | 451% | 490% |
A Calculated based on average shares outstanding during the period.
B Total returns for periods of less than one year are not annualized.
C Total returns would have been lower if certain expenses had not been reduced during the applicable periods shown.
D Fees and expenses of any underlying Fidelity Central Funds are not included in the Fund's expense ratio. The Fund indirectly bears its proportionate share of the expenses of any underlying Fidelity Central Funds. Based on their most recent shareholder report date, the expenses of any underlying non-money market Fidelity Central Funds were less than .005%.
E Expense ratios reflect operating expenses of the class. Expenses before reductions do not reflect amounts reimbursed by the investment adviser or reductions from expense offset arrangements and do not represent the amount paid by the class during periods when reimbursements or reductions occur. Expenses net of fee waivers reflect expenses after reimbursement by the investment adviser but prior to reductions from expense offset arrangements. Expenses net of all reductions represent the net expenses paid by the class.
F Annualized
G Amount does not include the portfolio activity of any underlying Fidelity Central Funds.
See accompanying notes which are an integral part of the financial statements.
Financial Highlights — Fidelity Advisor Mortgage Securities Fund Class I
| | Six months ended February 29, (Unaudited) | Years ended August 31, | | | | |
| | 2016 | 2015 | 2014 | 2013 | 2012 | 2011 |
| Selected Per–Share Data | | | | | | |
| Net asset value, beginning of period | $11.27 | $11.23 | $10.88 | $11.33 | $11.13 | $10.90 |
| Income from Investment Operations | | | | | | |
| Net investment income (loss)A | .132 | .256 | .271 | .200 | .311 | .354 |
| Net realized and unrealized gain (loss) | .088 | .038 | .342 | (.456) | .207 | .235 |
| Total from investment operations | .220 | .294 | .613 | (.256) | .518 | .589 |
| Distributions from net investment income | (.144) | (.251) | (.263) | (.194) | (.318) | (.359) |
| Distributions from net realized gain | (.006) | (.003) | – | – | – | – |
| Total distributions | (.150) | (.254) | (.263) | (.194) | (.318) | (.359) |
| Net asset value, end of period | $11.34 | $11.27 | $11.23 | $10.88 | $11.33 | $11.13 |
| Total ReturnB,C | 1.97% | 2.64% | 5.69% | (2.30)% | 4.73% | 5.53% |
| Ratios to Average Net AssetsD,E | | | | | | |
| Expenses before reductions | .51%F | .50% | .51% | .51% | .50% | .53% |
| Expenses net of fee waivers, if any | .50%F | .50% | .51% | .51% | .50% | .53% |
| Expenses net of all reductions | .50%F | .50% | .51% | .51% | .50% | .53% |
| Net investment income (loss) | 2.35%F | 2.28% | 2.45% | 1.79% | 2.79% | 3.24% |
| Supplemental Data | | | | | | |
| Net assets, end of period (in millions) | $79 | $72 | $48 | $34 | $12 | $7 |
| Portfolio turnover rateG | 411%F | 439% | 398% | 474% | 451% | 490% |
A Calculated based on average shares outstanding during the period.
B Total returns for periods of less than one year are not annualized.
C Total returns would have been lower if certain expenses had not been reduced during the applicable periods shown.
D Fees and expenses of any underlying Fidelity Central Funds are not included in the Fund's expense ratio. The Fund indirectly bears its proportionate share of the expenses of any underlying Fidelity Central Funds. Based on their most recent shareholder report date, the expenses of any underlying non-money market Fidelity Central Funds were less than .005%.
E Expense ratios reflect operating expenses of the class. Expenses before reductions do not reflect amounts reimbursed by the investment adviser or reductions from expense offset arrangements and do not represent the amount paid by the class during periods when reimbursements or reductions occur. Expenses net of fee waivers reflect expenses after reimbursement by the investment adviser but prior to reductions from expense offset arrangements. Expenses net of all reductions represent the net expenses paid by the class.
F Annualized
G Amount does not include the portfolio activity of any underlying Fidelity Central Funds.
See accompanying notes which are an integral part of the financial statements.
Notes to Financial Statements (Unaudited)
For the period ended February 29, 2016
(Amounts in thousands except percentages)
1. Organization.
Fidelity Advisor Mortgage Securities Fund (the Fund) is a fund of Fidelity Advisor Series II (the Trust) and is authorized to issue an unlimited number of shares. The Trust is registered under the Investment Company Act of 1940, as amended (the 1940 Act), as an open-end management investment company organized as a Massachusetts business trust. The Fund offers Class A, Class T, Class C, Fidelity Mortgage Securities Fund and Class I shares, each of which, along with Class B shares, has equal rights as to assets and voting privileges. Class B shares are closed to new accounts and additional purchases, except for exchanges and reinvestments. Each class has exclusive voting rights with respect to matters that affect that class. Class B shares will automatically convert to Class A shares after a maximum holding period of seven years from the initial date of purchase.
During the period, the Board of Trustees approved the conversion of all existing Class B shares into Class A shares, effective on or about July 1, 2016, regardless of the length of times shares have been held.
2. Investments in Fidelity Central Funds.
The Fund invests in Fidelity Central Funds, which are open-end investment companies generally available only to other investment companies and accounts managed by the investment adviser and its affiliates. The Fund's Schedule of Investments lists each of the Fidelity Central Funds held as of period end, if any, as an investment of the Fund, but does not include the underlying holdings of each Fidelity Central Fund. As an Investing Fund, the Fund indirectly bears its proportionate share of the expenses of the underlying Fidelity Central Funds.
Based on its investment objective, each Fidelity Central Fund may invest or participate in various investment vehicles or strategies that are similar to those of the Fund. These strategies are consistent with the investment objectives of the Fund and may involve certain economic risks which may cause a decline in value of each of the Fidelity Central Funds and thus a decline in the value of the Fund. The following summarizes the Fund's investment in each non-money market Fidelity Central Fund.
| Fidelity Central Fund | Investment Manager | Investment Objective | Investment Practices | Expense Ratio(a) |
| Fidelity Mortgage Backed Securities Central Fund | Fidelity Investment Money Management, Inc. (FIMM) | Seeks a high level of income by normally investing in investment-grade mortgage-related securities and repurchase agreements for those securities. | Delayed Delivery & When Issued Securities
Repurchase Agreements
Swaps | Less than .005% |
(a) Expenses expressed as a percentage of average net assets and are as of each underlying Central Fund's most recent annual or semi-annual shareholder report.
An unaudited holdings listing for the Fund, which presents direct holdings as well as the pro-rata share of any securities and other investments held indirectly through its investment in underlying non-money market Fidelity Central Funds, is available at fidelity.com and/or advisor.fidelity.com, as applicable. A complete unaudited list of holdings for each Fidelity Central Fund is available upon request or at the Securities and Exchange Commission (the SEC) website at www.sec.gov. In addition, the financial statements of the Fidelity Central Funds which contain the significant accounting policies (including investment valuation policies) of those funds are available on the SEC website or upon request.
3. Significant Accounting Policies.
The financial statements have been prepared in conformity with accounting principles generally accepted in the United States of America (GAAP), which require management to make certain estimates and assumptions at the date of the financial statements. Actual results could differ from those estimates. Subsequent events, if any, through the date that the financial statements were issued have been evaluated in the preparation of the financial statements. The following summarizes the significant accounting policies of the Fund:
Investment Valuation. Investments are valued as of 4:00 p.m. Eastern time on the last calendar day of the period. The Board of Trustees (the Board) has delegated the day to day responsibility for the valuation of the Fund's investments to the Fidelity Management & Research Company (FMR) Fair Value Committee (the Committee). In accordance with valuation policies and procedures approved by the Board, the Fund attempts to obtain prices from one or more third party pricing vendors or brokers to value its investments. When current market prices, quotations or currency exchange rates are not readily available or reliable, investments will be fair valued in good faith by the Committee, in accordance with procedures adopted by the Board. Factors used in determining fair value vary by investment type and may include market or investment specific events, changes in interest rates and credit quality. The frequency with which these procedures are used cannot be predicted and they may be utilized to a significant extent. The Committee oversees the Fund's valuation policies and procedures and reports to the Board on the Committee's activities and fair value determinations. The Board monitors the appropriateness of the procedures used in valuing the Fund's investments and ratifies the fair value determinations of the Committee.
The Fund categorizes the inputs to valuation techniques used to value its investments into a disclosure hierarchy consisting of three levels as shown below:
- Level 1 – quoted prices in active markets for identical investments
- Level 2 – other significant observable inputs (including quoted prices for similar investments, interest rates, prepayment speeds, etc.)
- Level 3 – unobservable inputs (including the Fund's own assumptions based on the best information available)
Valuation techniques used to value the Fund's investments by major category are as follows:
Debt securities, including restricted securities, are valued based on evaluated prices received from third party pricing vendors or from brokers who make markets in such securities. Asset backed securities, collateralized mortgage obligations, commercial mortgage securities and U.S. government agency mortgage securities are valued by pricing vendors who utilize matrix pricing which considers prepayment speed assumptions, attributes of the collateral, yield or price of bonds of comparable quality, coupon, maturity and type or by broker-supplied prices. Brokers which make markets in asset backed securities, collateralized mortgage obligations and commercial mortgage securities may also consider such factors as the structure of the issue, cash flow assumptions, the value of underlying assets as well as any guarantees. Swaps are marked-to-market daily based on valuations from third party pricing vendors, registered derivatives clearing organizations (clearinghouses) or broker-supplied valuations. These pricing sources may utilize inputs such as interest rate curves, credit spread curves, default possibilities and recovery rates. When independent prices are unavailable or unreliable, debt securities and swaps may be valued utilizing pricing methodologies which consider similar factors that would be used by third party pricing vendors. Debt securities and swaps are generally categorized as Level 2 in the hierarchy but may be Level 3 depending on the circumstances.
Investments in open-end mutual funds, including the Fidelity Central Funds, are valued at their closing net asset value (NAV) each business day and are categorized as Level 1 in the hierarchy. Short-term securities with remaining maturities of sixty days or less may be valued at amortized cost, which approximates fair value, and are categorized as Level 2 in the hierarchy.
Changes in valuation techniques may result in transfers in or out of an assigned level within the disclosure hierarchy. The aggregate value of investments by input level as of February 29, 2016 is included at the end of the Fund's Schedule of Investments.
Investment Transactions and Income. For financial reporting purposes, the Fund's investment holdings and NAV include trades executed through the end of the last business day of the period. The NAV per share for processing shareholder transactions is calculated as of the close of business of the New York Stock Exchange (NYSE), normally 4:00 p.m. Eastern time and includes trades executed through the end of the prior business day. Gains and losses on securities sold are determined on the basis of identified cost and may include proceeds received from litigation. Income and capital gain distributions from Fidelity Central Funds, if any, are recorded on the ex-dividend date. Interest income is accrued as earned and includes coupon interest and amortization of premium and accretion of discount on debt securities as applicable.
Class Allocations and Expenses. Investment income, realized and unrealized capital gains and losses, common expenses of the Fund, and certain fund-level expense reductions, if any, are allocated daily on a pro-rata basis to each class based on the relative net assets of each class to the total net assets of the Fund. Each class differs with respect to transfer agent and distribution and service plan fees incurred. Certain expense reductions may also differ by class. For the reporting period, the allocated portion of income and expenses to each class as a percent of its average net assets may vary due to the timing of recording these transactions in relation to fluctuating net assets of the classes. Expenses directly attributable to a fund are charged to that fund. Expenses attributable to more than one fund are allocated among the respective funds on the basis of relative net assets or other appropriate methods. Expense estimates are accrued in the period to which they relate and adjustments are made when actual amounts are known.
Income Tax Information and Distributions to Shareholders. Each year, the Fund intends to qualify as a regulated investment company under Subchapter M of the Internal Revenue Code, including distributing substantially all of its taxable income and realized gains. As a result, no provision for U.S. Federal income taxes is required. The Fund files a U.S. federal tax return, in addition to state and local tax returns as required. The Fund's federal income tax returns are subject to examination by the Internal Revenue Service (IRS) for a period of three fiscal years after they are filed. State and local tax returns may be subject to examination for an additional fiscal year depending on the jurisdiction.
Dividends are declared and recorded daily and paid monthly from net investment income. Distributions from realized gains, if any, are declared and recorded on the ex-dividend date. Income dividends and capital gain distributions are declared separately for each class. Income and capital gain distributions are determined in accordance with income tax regulations, which may differ from GAAP.
Capital accounts within the financial statements are adjusted for permanent book-tax differences. These adjustments have no impact on net assets or the results of operations. Capital accounts are not adjusted for temporary book-tax differences which will reverse in a subsequent period.
Book-tax differences are primarily due to swaps, market discount, partnerships (including allocations from Fidelity Central Funds), deferred trustees compensation, financing transactions, capital loss carryforwards and losses deferred due to wash sales and excise tax regulations.
The federal tax cost of investment securities and unrealized appreciation (depreciation) as of period end were as follows:
| Gross unrealized appreciation | $21,912 |
| Gross unrealized depreciation | (5,152) |
| Net unrealized appreciation (depreciation) on securities | $16,760 |
| Tax cost | $1,343,594 |
Capital loss carryforwards are only available to offset future capital gains of the Fund to the extent provided by regulations and may be limited. Under the Regulated Investment Company Modernization Act of 2010 (the Act), the Fund is permitted to carry forward capital losses incurred in taxable years beginning after December 22, 2010 for an unlimited period and such capital losses are required to be used prior to any losses that expire. The capital loss carryforward information presented below, including any applicable limitation, is estimated as of prior fiscal period end and is subject to adjustment.
| Fiscal year of expiration | |
| 2017 | $(73,463) |
| No expiration | |
| Long-term | (3,849) |
| Total capital loss carryforward | $(77,312) |
Repurchase Agreements. Pursuant to an Exemptive Order issued by the SEC, the Fund along with other registered investment companies having management contracts with FMR, or other affiliated entities of FMR, are permitted to transfer uninvested cash balances into joint trading accounts which are then invested in repurchase agreements. The Fund may also invest directly with institutions in repurchase agreements. Repurchase agreements may be collateralized by government or non-government securities. Upon settlement date, collateral is held in segregated accounts with custodian banks and may be obtained in the event of a default of the counterparty. The Fund monitors, on a daily basis, the value of the collateral to ensure it is at least equal to the principal amount of the repurchase agreement (including accrued interest). In the event of a default by the counterparty, realization of the collateral proceeds could be delayed, during which time the value of the collateral may decline.
Delayed Delivery Transactions and When-Issued Securities. During the period, the Fund transacted in securities on a delayed delivery or when-issued basis. Payment and delivery may take place after the customary settlement period for that security. The price of the underlying securities and the date when the securities will be delivered and paid for are fixed at the time the transaction is negotiated. The securities purchased on a delayed delivery or when-issued basis are identified as such in the Fund's Schedule of Investments. The Fund may receive compensation for interest forgone in the purchase of a delayed delivery or when-issued security. With respect to purchase commitments, the Fund identifies securities as segregated in its records with a value at least equal to the amount of the commitment. Losses may arise due to changes in the value of the underlying securities or if the counterparty does not perform under the contract's terms, or if the issuer does not issue the securities due to political, economic, or other factors.
To-Be-Announced (TBA) Securities and Mortgage Dollar Rolls. During the period, the Fund transacted in TBA securities that involved buying or selling mortgage-backed securities (MBS) on a forward commitment basis. A TBA transaction typically does not designate the actual security to be delivered and only includes an approximate principal amount; however delivered securities must meet specified terms defined by industry guidelines, including issuer, rate and current principal amount outstanding on underlying mortgage pools. The Fund may enter into a TBA transaction with the intent to take possession of or deliver the underlying MBS, or the Fund may elect to extend the settlement by entering into either a mortgage or reverse mortgage dollar roll. Mortgage dollar rolls are transactions where a fund sells TBA securities and simultaneously agrees to repurchase MBS on a later date at a lower price and with the same counterparty. Reverse mortgage dollar rolls involve the purchase and simultaneous agreement to sell TBA securities on a later date at a lower price. Transactions in mortgage dollar rolls and reverse mortgage dollar rolls are accounted for as purchases and sales and may result in an increase to the Fund's portfolio turnover rate.
Purchases and sales of TBA securities involve risks similar to those discussed above for delayed delivery and when-issued securities. Also, if the counterparty in a mortgage dollar roll or a reverse mortgage dollar roll transaction files for bankruptcy or becomes insolvent, the Fund's right to repurchase or sell securities may be limited. Additionally, when a fund sells TBA securities without already owning or having the right to obtain the deliverable securities (an uncovered forward commitment to sell), it incurs a risk of loss because it could have to purchase the securities at a price that is higher than the price at which it sold them. A fund may be unable to purchase the deliverable securities if the corresponding market is illiquid.
TBA securities subject to a forward commitment to sell at period end are included at the end of the Fund's Schedule of Investments under the caption "TBA Sale Commitments." The proceeds and value of these commitments are reflected in the Fund's Statement of Assets and Liabilities as Receivable for TBA sale commitments and TBA sale commitments, at value, respectively.
Restricted Securities. The Fund may invest in securities that are subject to legal or contractual restrictions on resale. These securities generally may be resold in transactions exempt from registration or to the public if the securities are registered. Disposal of these securities may involve time-consuming negotiations and expense, and prompt sale at an acceptable price may be difficult. Information regarding restricted securities is included at the end of the Fund's Schedule of Investments.
4. Derivative Instruments.
Risk Exposures and the Use of Derivative Instruments. The Fund's investment objective allows the Fund to enter into various types of derivative contracts, including swaps. Derivatives are investments whose value is primarily derived from underlying assets, indices or reference rates and may be transacted on an exchange or over-the-counter (OTC). Derivatives may involve a future commitment to buy or sell a specified asset based on specified terms, to exchange future cash flows at periodic intervals based on a notional principal amount, or for one party to make one or more payments upon the occurrence of specified events in exchange for periodic payments from the other party.
The Fund used derivatives to increase returns, to gain exposure to certain types of assets and to manage exposure to certain risks as defined below. The success of any strategy involving derivatives depends on analysis of numerous economic factors, and if the strategies for investment do not work as intended, the Fund may not achieve its objectives.
The Fund's use of derivatives increased or decreased its exposure to the following risk:
| Interest Rate Risk | Interest rate risk relates to the fluctuations in the value of interest-bearing securities due to changes in the prevailing levels of market interest rates. |
The Fund is also exposed to additional risks from investing in derivatives, such as liquidity risk and counterparty credit risk. Liquidity risk is the risk that the Fund will be unable to close out the derivative in the open market in a timely manner. Counterparty credit risk is the risk that the counterparty will not be able to fulfill its obligation to the Fund. Counterparty credit risk related to centrally cleared OTC swaps may be mitigated by the protection provided by the clearinghouse.
Investing in derivatives may involve greater risks than investing in the underlying assets directly and, to varying degrees, may involve risk of loss in excess of any initial investment and collateral received and amounts recognized in the Statement of Assets and Liabilities. In addition, there may be the risk that the change in value of the derivative contract does not correspond to the change in value of the underlying instrument.
Net Realized Gain (Loss) and Change in Net Unrealized Appreciation (Depreciation) on Derivatives. The table below, which reflects the impacts of derivatives on the financial performance of the Fund, summarizes the net realized gain (loss) and change in net unrealized appreciation (depreciation) for derivatives during the period as presented in the Statement of Operations.
| Primary Risk Exposure / Derivative Type | Net Realized Gain (Loss) | Change in Net Unrealized Appreciation (Depreciation) |
| Interest Rate Risk | | |
| Swaps(a) | $(2,480) | $437 |
(a) A summary of the value of derivatives by primary risk exposure as of period end, if any, is included at the end of the Schedule of Investments
Swaps. A swap is a contract between two parties to exchange future cash flows at periodic intervals based on a notional principal amount. A centrally cleared OTC swap is a transaction executed between a fund and a dealer counterparty, then cleared by a futures commission merchant (FCM) through a clearinghouse. Once cleared, the clearinghouse serves as a central counterparty, with whom a fund exchanges cash flows for the life of the transaction, similar to transactions in futures contracts.
Centrally cleared OTC swaps require a fund to deposit either cash or securities (initial margin) with the FCM, at the instruction of and for the benefit of the clearinghouse. Securities deposited to meet initial margin requirements are identified in the Schedule of Investments. Centrally cleared OTC swaps are marked-to-market daily and subsequent payments (variation margin) are made or received depending on the daily fluctuations in the value of the swaps and are recorded as unrealized appreciation or (depreciation). These daily payments, if any, are included in receivable or payable for daily variation margin for derivative instruments in the Statement of Assets and Liabilities. Any premiums for centrally cleared OTC swaps are recorded periodically throughout the term of the swap to variation margin and included in unrealized appreciation (depreciation) in the Statement of Assets and Liabilities. Any premiums are recognized as realized gain (loss) upon termination or maturity of the swap.
Payments are exchanged at specified intervals, accrued daily commencing with the effective date of the contract and recorded as realized gain or (loss). Some swaps may be terminated prior to the effective date and realize a gain or loss upon termination. The net realized gain (loss) and change in net unrealized appreciation (depreciation) on swaps during the period is included in the Statement of Operations.
Any open swaps at period end are included in the Schedule of Investments under the caption "Swaps".
Interest Rate Swaps. Interest rate swaps are agreements between counterparties to exchange cash flows, one based on a fixed rate, and the other on a floating rate. The Fund entered into interest rate swaps to manage its exposure to interest rate changes. Changes in interest rates can have an effect on both the value of bond holdings as well as the amount of interest income earned. In general, the value of bonds can fall when interest rates rise and can rise when interest rates fall.
5. Purchases and Sales of Investments.
Purchases and sales of securities (including the Fixed-Income Central Funds), other than short-term securities and U.S. government securities, aggregated $95,240 and $74,217, respectively.
6. Fees and Other Transactions with Affiliates.
Management Fee. Fidelity Management & Research Company (the investment adviser) and its affiliates provide the Fund with investment management related services for which the Fund pays a monthly management fee. The management fee is the sum of an individual fund fee rate that is based on an annual rate of .20% of the Fund's average net assets and an annualized group fee rate that averaged .11% during the period. The group fee rate is based upon the average net assets of all the mutual funds advised by the investment adviser, including any mutual funds previously advised by the investment adviser that are currently advised by Fidelity SelectCo, LLC, an affiliate of the investment adviser. The group fee rate decreases as assets under management increase and increases as assets under management decrease. For the reporting period, the total annualized management fee rate was .31% of the Fund's average net assets.
Distribution and Service Plan Fees. In accordance with Rule 12b-1 of the 1940 Act, the Fund has adopted separate Distribution and Service Plans for each class of shares. Certain classes pay Fidelity Distributors Corporation (FDC), an affiliate of the investment adviser, separate Distribution and Service Fees, each of which is based on an annual percentage of each class' average net assets. In addition, FDC may pay financial intermediaries for selling shares of the Fund and providing shareholder support services. For the period, the Distribution and Service Fee rates, total fees and amounts retained by FDC were as follows:
| | Distribution
Fee | Service
Fee | Total Fees | Retained
by FDC |
| Class A | -% | .25% | $47 | $–(a) |
| Class T | -% | .25% | 28 | – |
| Class B | .65% | .25% | 3 | 2 |
| Class C | .75% | .25% | 83 | 1 |
| | | | $161 | $3 |
(a) Values shown as $0 may reflect amounts less than $500.
Sales Load. FDC may receive a front-end sales charge of up to 4.00% for selling Class A shares and Class T shares, some of which is paid to financial intermediaries for selling shares of the Fund. Depending on the holding period, FDC may receive contingent deferred sales charges levied on Class A, Class T, Class B, and Class C redemptions. The deferred sales charges range from 5.00% to 1.00% for Class B shares, 1.00% for Class C shares, .75% for certain purchases of Class A shares and .25% for certain purchases of Class T shares.
For the period, sales charge amounts retained by FDC were as follows:
| | Retained
by FDC |
| Class A | $2 |
| Class T | 2 |
| Class B(a) | 1 |
| Class C(a) | 1 |
| | $6 |
(a) When Class B and Class C shares are initially sold, FDC pays commissions from its own resources to financial intermediaries through which the sales are made.
Transfer Agent Fees. Fidelity Investments Institutional Operations Company, Inc., (FIIOC), an affiliate of the investment adviser, is the transfer, dividend disbursing and shareholder servicing agent for each class of the Fund. FIIOC receives account fees and asset-based fees that vary according to the account size and type of account of the shareholders of each respective class of the Fund, with the exception of Fidelity Mortgage Securities Fund. FIIOC receives an asset-based fee of .10% of Fidelity Mortgage Securities Fund's average net assets. FIIOC pays for typesetting, printing and mailing of shareholder reports, except proxy statements. For the period, transfer agent fees for each class were as follows:
| | Amount | % of
Class-Level Average
Net Assets(a) |
| Class A | $37 | .20 |
| Class T | 22 | .20 |
| Class B | 1 | .25 |
| Class C | 15 | .18 |
| Fidelity Mortgage Securities Fund | 444 | .10 |
| Class I | 56 | .15 |
| | $575 | |
(a) Annualized
Fund Wide Operations Fee. Pursuant to the Fund Wide Operations and Expense Agreement (FWOE), the investment adviser has agreed to provide for fund level expenses (which do not include transfer agent, Rule 12b-1 fees, compensation of the independent Trustees, interest (including commitment fees), taxes or extraordinary expenses, if any) in return for a FWOE fee equal to .35% of the Fund's average net assets less the total amount of the management fee. The FWOE paid by the Fund is reduced by an amount equal to the fees and expenses paid to the independent Trustees. For the period, the FWOE fee was equivalent to an annualized rate of .04% of average net assets.
Interfund Trades. The Fund may purchase from or sell securities to other Fidelity Funds under procedures adopted by the Board. The procedures have been designed to ensure these interfund trades are executed in accordance with Rule 17a-7 of the 1940 Act. Interfund trades are included within the respective purchases and sales amounts shown in the Purchases and Sales of Investments note.
7. Committed Line of Credit.
The Fund participates with other funds managed by the investment adviser or an affiliate in a $4.25 billion credit facility (the "line of credit") to be utilized for temporary or emergency purposes to fund shareholder redemptions or for other short-term liquidity purposes. The Fund has agreed to pay commitment fees on its pro-rata portion of the line of credit, which amounted to $1 and is reflected in Miscellaneous expenses on the Statement of Operations. During the period, the Fund did not borrow on this line of credit.
8. Expense Reductions.
During the period the investment adviser reimbursed and/or waived a portion of fund-level operating expenses in the amount of $28.
9. Distributions to Shareholders.
Distributions to shareholders of each class were as follows:
| | Six months ended February 29, 2016 | Year ended August 31, 2015 |
| From net investment income | | |
| Class A | $428 | $748 |
| Class T | 256 | 417 |
| Class B | 6 | 14 |
| Class C | 126 | 202 |
| Fidelity Mortgage Securities Fund | 11,589 | 18,864 |
| Class I | 946 | 1,318 |
| Total | $13,351 | $21,563 |
| From net realized gain | | |
| Class A | $20 | $10 |
| Class T | 13 | 6 |
| Class C | 9 | 5 |
| Fidelity Mortgage Securities Fund | 471 | 210 |
| Class I | 39 | 13 |
| Total | $552 | $244 |
10. Share Transactions.
Share transactions for each class were as follows and may contain automatic conversions between classes or exchanges between affiliated funds:
| | Shares | Shares | Dollars | Dollars |
| | Six months ended February 29, 2016 | Year ended August 31, 2015 | Six months ended February 29, 2016 | Year ended August 31, 2015 |
| Class A | | | | |
| Shares sold | 1,036 | 563 | $11,746 | $6,368 |
| Reinvestment of distributions | 35 | 59 | 399 | 669 |
| Shares redeemed | (577) | (872) | (6,530) | (9,855) |
| Net increase (decrease) | 494 | (250) | $5,615 | $(2,818) |
| Class T | | | | |
| Shares sold | 772 | 285 | $8,778 | $3,225 |
| Reinvestment of distributions | 23 | 36 | 258 | 409 |
| Shares redeemed | (486) | (458) | (5,477) | (5,196) |
| Net increase (decrease) | 309 | (137) | $3,559 | $(1,562) |
| Class B | | | | |
| Shares sold | 10 | 5 | $101 | $68 |
| Reinvestment of distributions | –(a) | 1 | 4 | 9 |
| Shares redeemed | (20) | (55) | (224) | (625) |
| Net increase (decrease) | (10) | (49) | $(119) | $(548) |
| Class C | | | | |
| Shares sold | 464 | 358 | $5,253 | $4,044 |
| Reinvestment of distributions | 10 | 15 | 113 | 166 |
| Shares redeemed | (209) | (502) | (2,363) | (5,678) |
| Net increase (decrease) | 265 | (129) | $3,003 | $(1,468) |
| Fidelity Mortgage Securities Fund | | | | |
| Shares sold | 12,675 | 20,281 | $143,608 | $230,420 |
| Reinvestment of distributions | 1,004 | 1,582 | 11,378 | 17,954 |
| Shares redeemed | (7,440) | (15,790) | (84,239) | (179,084) |
| Net increase (decrease) | 6,239 | 6,073 | $70,747 | $69,290 |
| Class I | | | | |
| Shares sold | 892 | 3,034 | $10,069 | $34,395 |
| Reinvestment of distributions | 85 | 114 | 959 | 1,290 |
| Shares redeemed | (347) | (1,110) | (3,915) | (12,534) |
| Net increase (decrease) | 630 | 2,038 | $7,113 | $23,151 |
(a) Values shown as 0 may reflect amounts less than 500.
11. Other.
The Fund's organizational documents provide former and current trustees and officers with a limited indemnification against liabilities arising in connection with the performance of their duties to the Fund. In the normal course of business, the Fund may also enter into contracts that provide general indemnifications. The Fund's maximum exposure under these arrangements is unknown as this would be dependent on future claims that may be made against the Fund. The risk of material loss from such claims is considered remote.
At the end of the period, the investment adviser or its affiliates were the owners of record of 10% of the total outstanding shares of the Fund.
12. Credit Risk.
The Fund invests a portion of its assets in structured securities of issuers backed by commercial and residential mortgage loans, credit card receivables and automotive loans. The value and related income of these securities is sensitive to changes in economic conditions, including delinquencies and/or defaults.
Shareholder Expense Example
As a shareholder of the Fund, you incur two types of costs: (1) transaction costs, including sales charges (loads) on purchase payments or redemption proceeds, and (2) ongoing costs, including management fees, distribution and/or service (12b-1) fees and other Fund expenses. This Example is intended to help you understand your ongoing costs (in dollars) of investing in the Fund and to compare these costs with the ongoing costs of investing in other mutual funds.
The Example is based on an investment of $1,000 invested at the beginning of the period and held for the entire period (September 1, 2015 to February 29, 2016).
Actual Expenses
The first line of the accompanying table for each class of the Fund provides information about actual account values and actual expenses. You may use the information in this line, together with the amount you invested, to estimate the expenses that you paid over the period. Simply divide your account value by $1,000.00 (for example, an $8,600 account value divided by $1,000.00 = 8.6), then multiply the result by the number in the first line for a class of the Fund under the heading entitled "Expenses Paid During Period" to estimate the expenses you paid on your account during this period. A small balance maintenance fee of $12.00 that is charged once a year may apply for certain accounts with a value of less than $2,000. This fee is not included in the table below. If it was, the estimate of expenses you paid during the period would be higher, and your ending account value lower, by this amount. In addition, the Fund, as a shareholder in the underlying Fidelity Central Funds, will indirectly bear its pro-rata share of the fees and expenses incurred by the underlying Fidelity Central Funds. These fees and expenses are not included in the Fund's annualized expense ratio used to calculate the expense estimate in the table below.
Hypothetical Example for Comparison Purposes
The second line of the accompanying table for each class of the Fund provides information about hypothetical account values and hypothetical expenses based on a Class' actual expense ratio and an assumed rate of return of 5% per year before expenses, which is not the Class' actual return. The hypothetical account values and expenses may not be used to estimate the actual ending account balance or expenses you paid for the period. You may use this information to compare the ongoing costs of investing in the Fund and other funds. To do so, compare this 5% hypothetical example with the 5% hypothetical examples that appear in the shareholder reports of the other funds. A small balance maintenance fee of $12.00 that is charged once a year may apply for certain accounts with a value of less than $2,000. This fee is not included in the table below. If it was, the estimate of expenses you paid during the period would be higher, and your ending account value lower, by this amount. In addition, the Fund, as a shareholder in the underlying Fidelity Central Funds, will indirectly bear its pro-rata share of the fees and expenses incurred by the underlying Fidelity Central Funds. These fees and expenses are not included in the Fund's annualized expense ratio used to calculate the expense estimate in the table below.
Please note that the expenses shown in the table are meant to highlight your ongoing costs only and do not reflect any transaction costs. Therefore, the second line of the table is useful in comparing ongoing costs only, and will not help you determine the relative total costs of owning different funds. In addition, if these transactional costs were included, your costs would have been higher.
| | Annualized Expense Ratio-A | Beginning
Account Value
September 1, 2015 | Ending
Account Value
February 29, 2016 | Expenses Paid
During Period-B
September 1, 2015
to February 29, 2016 |
| Class A | .80% | | | |
| Actual | | $1,000.00 | $1,018.20 | $4.01 |
| Hypothetical-C | | $1,000.00 | $1,020.89 | $4.02 |
| Class T | .80% | | | |
| Actual | | $1,000.00 | $1,018.20 | $4.01 |
| Hypothetical-C | | $1,000.00 | $1,020.89 | $4.02 |
| Class B | 1.50% | | | |
| Actual | | $1,000.00 | $1,014.60 | $7.51 |
| Hypothetical-C | | $1,000.00 | $1,017.40 | $7.52 |
| Class C | 1.54% | | | |
| Actual | | $1,000.00 | $1,014.40 | $7.71 |
| Hypothetical-C | | $1,000.00 | $1,017.21 | $7.72 |
| Fidelity Mortgage Securities Fund | .45% | | | |
| Actual | | $1,000.00 | $1,019.90 | $2.26 |
| Hypothetical-C | | $1,000.00 | $1,022.63 | $2.26 |
| Class I | .50% | | | |
| Actual | | $1,000.00 | $1,019.70 | $2.51 |
| Hypothetical-C | | $1,000.00 | $1,022.38 | $2.51 |
A Annualized expense ratio reflects expenses net of applicable fee waivers.
B Expenses are equal to each Class' annualized expense ratio, multiplied by the average account value over the period, multiplied by 182/366 (to reflect the one-half year period). The fees and expenses of the underlying Fidelity Central Funds in which the Fund invests are not included in each Class' annualized expense ratio. In addition to the expenses noted above, the Fund also indirectly bears its proportional share of the expenses of the underlying Fidelity Central Funds. Annualized expenses of the underlying non-money market Fidelity Central Funds as of their most recent fiscal half year were less than .005%.
C 5% return per year before expenses
Board Approval of Investment Advisory Contracts and Management Fees
Fidelity Advisor Mortgage Securities Fund
Each year, the Board of Trustees, including the Independent Trustees (together, the Board), votes on the renewal of the management contract with Fidelity Management & Research Company (FMR) and the sub-advisory agreements (together, the Advisory Contracts) for the fund. The Board, assisted by the advice of fund counsel and Independent Trustees' counsel, requests and considers a broad range of information relevant to the renewal of the Advisory Contracts throughout the year.
The Board meets regularly and, at each of its meetings, covers an extensive agenda of topics and materials and considers factors that are relevant to its annual consideration of the renewal of the fund's Advisory Contracts, including the services and support provided to the fund and its shareholders. The Board has established four standing committees (Committees) — Operations, Audit, Fair Valuation, and Governance and Nominating — each composed of and chaired by Independent Trustees with varying backgrounds, to which the Board has assigned specific subject matter responsibilities in order to enhance effective decision-making by the Board. The Operations Committee, of which all of the Independent Trustees are members, meets regularly throughout the year and considers, among other matters, information specifically related to the annual consideration of the renewal of the fund's Advisory Contracts. The Board, acting directly and through its Committees, requests and receives information concerning the annual consideration of the renewal of the fund's Advisory Contracts. The Board also meets as needed to consider matters specifically related to the Board's annual consideration of the renewal of the Advisory Contracts. Members of the Board may also meet with trustees of other Fidelity funds through ad hoc joint committees to discuss certain matters relevant to all of the Fidelity funds.
At its September 2015 meeting, the Board unanimously determined to renew the fund's Advisory Contracts. In reaching its determination, the Board considered all factors it believed relevant, including (i) the nature, extent, and quality of the services to be provided to the fund and its shareholders (including the investment performance of the fund); (ii) the competitiveness of the fund's management fee and total expense ratio relative to peer funds; (iii) the total costs of the services to be provided by and the profits to be realized by Fidelity from its relationship with the fund; and (iv) the extent to which (if any) economies of scale exist and would be realized as the fund grows, and whether any economies of scale are appropriately shared with fund shareholders.
In considering whether to renew the Advisory Contracts for the fund, the Board reached a determination, with the assistance of fund counsel and Independent Trustees' counsel and through the exercise of its business judgment, that the renewal of the Advisory Contracts was in the best interests of the fund and its shareholders and that the compensation payable under the Advisory Contracts was fair and reasonable. The Board's decision to renew the Advisory Contracts was not based on any single factor, but rather was based on a comprehensive consideration of all the information provided to the Board at its meetings throughout the year. The Board, in reaching its determination to renew the Advisory Contracts, was aware that shareholders of the fund have a broad range of investment choices available to them, including a wide choice among funds offered by Fidelity's competitors, and that the fund's shareholders, who have the opportunity to review and weigh the disclosure provided by the fund in its prospectus and other public disclosures, have chosen to invest in this fund, which is part of the Fidelity family of funds.
Nature, Extent, and Quality of Services Provided. The Board considered Fidelity's staffing as it relates to the fund, including the backgrounds of investment personnel of Fidelity, and also considered the fund's investment objective, strategies, and related investment philosophy. The Independent Trustees also had discussions with senior management of Fidelity's investment operations and investment groups. The Board considered the structure of the portfolio manager compensation program and whether this structure provides appropriate incentives to act in the best interests of the fund. Additionally, the Board considered the portfolio managers' investments, if any, in the funds that they manage.
Resources Dedicated to Investment Management and Support Services. The Board reviewed the general qualifications and capabilities of Fidelity's investment staff, including its size, education, experience, and resources, as well as Fidelity's approach to recruiting, training, managing, and compensating investment personnel. The Board noted that Fidelity has continued to increase the resources devoted to non-U.S. offices, including expansion of Fidelity's global investment organization. The Board also noted that Fidelity's analysts have extensive resources, tools and capabilities that allow them to conduct sophisticated quantitative and fundamental analysis, as well as credit analysis of issuers, counterparties and guarantors. Further, the Board considered that Fidelity's investment professionals have sufficient access to global information and data so as to provide competitive investment results over time, and that those professionals also have access to sophisticated tools that permit them to assess portfolio construction and risk and performance attribution characteristics continuously, as well as to transmit new information and research conclusions rapidly around the world. Additionally, in its deliberations, the Board considered Fidelity's trading, risk management, compliance, and technology and operations capabilities and resources, which are integral parts of the investment management process.
Shareholder and Administrative Services. The Board considered (i) the nature, extent, quality, and cost of advisory, administrative, and shareholder services performed by FMR, the sub-advisers (together with FMR, the Investment Advisers), and their affiliates under the Advisory Contracts and under separate agreements covering transfer agency, pricing and bookkeeping, and securities lending services for the fund; (ii) the nature and extent of the supervision of third party service providers, principally custodians, subcustodians, and pricing vendors; and (iii) the resources devoted to, and the record of compliance with, the fund's compliance policies and procedures.
The Board noted that the growth of fund assets over time across the complex allows Fidelity to reinvest in the development of services designed to enhance the value or convenience of the Fidelity funds as investment vehicles. These services include 24-hour access to account information and market information through telephone representatives and over the Internet, investor education materials and asset allocation tools, and the expanded availability of Fidelity Investor Centers.
Investment in a Large Fund Family. The Board considered the benefits to shareholders of investing in a Fidelity fund, including the benefits of investing in a fund that is part of a large family of funds offering a variety of investment disciplines and providing a large variety of mutual fund investor services. The Board noted that Fidelity had taken, or had made recommendations that resulted in the Fidelity funds taking, a number of actions over the previous year that benefited particular funds, including (i) continuing to dedicate additional resources to investment research and to the support of the senior management team that oversees asset management; (ii) continuing efforts to enhance Fidelity's global research capabilities; (iii) launching new funds and making other enhancements to meet client needs; (iv) reducing management fees and total expenses for certain index funds and diversified international funds; (v) continuing to launch dedicated lower cost underlying funds to meet portfolio construction needs related to expanding underlying fund options for Fidelity funds of funds, specifically for the Freedom Fund product lines; (vi) rationalizing product lines and gaining increased efficiencies through fund mergers; (vii) launching active fixed-income exchange-traded funds; (viii) continuing to develop, acquire and implement systems and technology to improve services to the funds and shareholders, strengthen information security, and increase efficiency; (ix) implementing investment enhancements to further strengthen Fidelity's target date product line to increase investors' probability of success in achieving their goals; (x) modifying the eligibility criteria for certain share classes to accommodate roll-over assets from employer-sponsored retirement plans; (xi) launching a new Class W of the Freedom Index Funds to attract and retain Fidelity record-kept retirement plan assets; and (xii) implementing changes to Fidelity's money market product line in response to recent money market regulatory reforms.
Investment Performance. The Board considered whether the fund has operated in accordance with its investment objective, as well as its record of compliance with its investment restrictions and its performance history.
The Board took into account discussions with representatives of the Investment Advisers about fund investment performance that occur at Board meetings throughout the year. In this regard the Board noted that as part of regularly scheduled fund reviews and other reports to the Board on fund performance, the Board considers annualized return information for the fund for different time periods, measured against a securities market index ("benchmark index") and a peer group of funds with similar objectives ("peer group"), if any. In its evaluation of fund investment performance at meetings throughout the year, the Board gave particular attention to information indicating underperformance of certain Fidelity funds for specific time periods and discussed with the Investment Advisers the reasons for such underperformance.
In addition to reviewing absolute and relative fund performance, the Independent Trustees periodically consider the appropriateness of fund performance metrics in evaluating the results achieved. In general, the Independent Trustees believe that fund performance should be evaluated based on gross performance (before fees and expenses but after transaction costs) compared to appropriate benchmark indices, over appropriate time periods that may include full market cycles, and on net performance (after fees and expenses) compared to peer groups, as applicable, over the same periods, taking into account relevant factors including the following: general market conditions; expectations for interest rate levels and credit conditions; issuer-specific information including credit quality; the potential for incremental return versus the fund's benchmark index weighed against the risks involved in obtaining that incremental return, including the risk of diminished or negative total returns; and fund cash flows and other factors. Depending on the circumstances, the Independent Trustees may be satisfied with a fund's performance notwithstanding that it lags its benchmark index or peer group for certain periods.
The Independent Trustees recognize that shareholders evaluate performance on a net basis over their own holding periods, for which one-, three-, and five-year periods are often used as a proxy. For this reason, the performance information reviewed by the Board also included net cumulative calendar year total return information for the fund and an appropriate benchmark index and peer group for the most recent one-, three-, and five-year periods.
Based on its review, the Board concluded that the nature, extent, and quality of services provided to the fund under the Advisory Contracts should benefit the shareholders of the fund.
Competitiveness of Management Fee and Total Expense Ratio. The Board considered the fund's management fee and total expense ratio compared to "mapped groups" of competitive funds and classes created for the purpose of facilitating the Trustees' competitive analysis of management fees and total expenses. Fidelity creates "mapped groups" by combining similar Lipper investment objective categories that have comparable investment mandates. Combining Lipper investment objective categories aids the Board's management fee and total expense ratio comparisons by broadening the competitive group used for comparison.
Management Fee. The Board considered two proprietary management fee comparisons for the 12-month periods shown in basis points (BP) in the chart below. The group of Lipper funds used by the Board for management fee comparisons is referred to below as the "Total Mapped Group" and, for the reasons explained above, is broader than the Lipper peer group used by the Board for performance comparisons. The Total Mapped Group comparison focuses on a fund's standing in terms of gross management fees before expense reimbursements or caps relative to the total universe of funds with comparable investment mandates, regardless of whether their management fee structures also are comparable. Funds with comparable investment mandates offer exposure to similar types of securities. Funds with comparable management fee structures have similar management fee contractual arrangements (
e.g., flat rate charged for advisory services, all-inclusive fee rate,
etc.). "TMG %" represents the percentage of funds in the Total Mapped Group that had management fees that were lower than the fund's. For example, a hypothetical TMG % of 20% would mean that 80% of the funds in the Total Mapped Group had higher, and 20% had lower, management fees than the fund. The fund's actual TMG %s and the number of funds in the Total Mapped Group are in the chart below. The "Asset-Size Peer Group" (ASPG) comparison focuses on a fund's standing relative to a subset of non-Fidelity funds within the Total Mapped Group that are similar in size and management fee structure. For example, if a fund is in the first quartile of the ASPG, the fund's management fee ranks in the least expensive or lowest 25% of funds in the ASPG. The ASPG represents at least 15% of the funds in the Total Mapped Group with comparable asset size and management fee structures, subject to a minimum of 50 funds (or all funds in the Total Mapped Group if fewer than 50). Additional information, such as the ASPG quartile in which the fund's management fee rate ranked, is also included in the chart and considered by the Board.
Fidelity Advisor Mortgage Securities Fund
The Board noted that the fund's management fee rate ranked below the median of its Total Mapped Group and below the median of its ASPG for 2014.
The Board noted that, in 2014, the ad hoc Committee on Group Fee was formed by it and other Fidelity fund boards to conduct an in-depth review of the "group fee" component of the management fee of funds with such management fee structures. Committee focus included the mechanics of the group fee, the competitive landscape of group fee structures, Fidelity funds with no group fee component and investment products not included in group fee assets. The Board also considered that, for funds subject to the group fee, FMR agreed to voluntarily waive fees over a specified period of time in amounts designed to account for assets converted from certain funds to certain collective investment trusts.
Based on its review, the Board concluded that the fund's management fee is fair and reasonable in light of the services that the fund receives and the other factors considered.
Total Expense Ratio. In its review of each class's total expense ratio, the Board considered the fund's management fee rate as well as other fund or class expenses, as applicable, such as transfer agent fees, pricing and bookkeeping fees, fund-paid 12b-1 fees, and custodial, legal, and audit fees. The Board also noted that Fidelity may agree to waive fees and expenses from time to time, and the extent to which, if any, it has done so for the fund. As part of its review, the Board also considered the current and historical total expense ratios of each class of the fund compared to competitive fund median expenses. Each class of the fund is compared to those funds and classes in the Total Mapped Group (used by the Board for management fee comparisons) that have a similar sales load structure.
The Board noted that the total expense ratio of each class ranked below its competitive median for 2014.
The Board considered that the current contractual arrangements for the fund have the effect of setting the total "fund-level" (but not "class-level") expenses (including, among certain other "fund-level" expenses, the management fee) for each class at 0.35%. These contractual arrangements may not be increased without the approval of the Board.
The Board recognized that the fund's management contract incorporates a "group fee" structure, which provides for lower group fee rates as total group assets increase, and for higher group fee rates as total group assets decrease (with "group assets" defined to include fund assets under FMR's management plus sector fund assets previously under FMR's management and currently managed by Fidelity SelectCo, LLC). FMR calculates the group fee rates based on a tiered asset "breakpoint" schedule that varies based on asset class. The Board noted, however, that because the current contractual arrangements set the total "fund-level" expenses for each class at 0.35%, increases or decreases in the management fee due to changes in the group fee rate will not impact the total expense ratio.
Fees Charged to Other Fidelity Clients. The Board also considered Fidelity fee structures and other information with respect to clients of Fidelity, such as other funds advised or subadvised by Fidelity, pension plan clients, and other institutional clients with similar mandates. The Board noted the findings of the 2013 ad hoc joint committee (created with the board of other Fidelity funds), which reviewed and compared Fidelity's institutional investment advisory business with its business of providing services to the Fidelity funds, including the differences in services provided, fees charged, and costs incurred, as well as competition in their respective marketplaces.
Based on its review of total expense ratios and fees charged to other Fidelity clients, the Board concluded that the total expense ratio of each class of the fund was reasonable in light of the services that the fund and its shareholders receive and the other factors considered.
Costs of the Services and Profitability. The Board considered the revenues earned and the expenses incurred by Fidelity in conducting the business of developing, marketing, distributing, managing, administering and servicing the fund and servicing the fund's shareholders. The Board also considered the level of Fidelity's profits in respect of all the Fidelity funds.
On an annual basis, Fidelity presents to the Board information about the profitability of its relationship with the fund. Fidelity calculates profitability information for each fund, as well as aggregate profitability information for groups of Fidelity funds and all Fidelity funds, using a series of detailed revenue and cost allocation methodologies which originate with the books and records of Fidelity on which Fidelity's audited financial statements are based. The Audit Committee of the Board reviews any significant changes from the prior year's methodologies.
PricewaterhouseCoopers LLP (PwC), independent registered public accounting firm and auditor to Fidelity and certain Fidelity funds, has been engaged annually by the Board as part of the Board's assessment of Fidelity's profitability analysis. PwC's engagement includes the review and assessment of the methodologies used by Fidelity in determining the revenues and expenses attributable to Fidelity's mutual fund business, and completion of agreed-upon procedures in respect of the mathematical accuracy of fund profitability and its conformity to established allocation methodologies. After considering PwC's reports issued under the engagement and information provided by Fidelity, the Board concluded that while other allocation methods may also be reasonable, Fidelity's profitability methodologies are reasonable in all material respects.
The Board also reviewed Fidelity's non-fund businesses and fall-out benefits related to the mutual fund business as well as cases where Fidelity's affiliates may benefit from or be related to the fund's business.
The Board considered the costs of the services provided by and the profits realized by Fidelity in connection with the operation of the fund and was satisfied that the profitability was not excessive.
Economies of Scale. The Board considered whether there have been economies of scale in respect of the management of the Fidelity funds, whether the Fidelity funds (including the fund) have appropriately benefited from any such economies of scale, and whether there is potential for realization of any further economies of scale. The Board considered the extent to which the fund will benefit from economies of scale as assets grow through increased services to the fund, through waivers or reimbursements, or through fee or expense ratio reductions. The Board also noted that in 2013, it and the boards of other Fidelity funds created an ad hoc committee (the Economies of Scale Committee) to analyze whether Fidelity attains economies of scale in respect of the management and servicing of the Fidelity funds, whether the Fidelity funds have appropriately benefited from such economies of scale, and whether there is potential for realization of any further economies of scale.
The Board concluded, taking into account the analysis of the Economies of Scale Committee, that economies of scale, if any, are being appropriately shared between fund shareholders and Fidelity.
Additional Information Requested by the Board. In order to develop fully the factual basis for consideration of the Fidelity funds' Advisory Contracts, the Board requested and received additional information on certain topics, including: (i) Fidelity's fund profitability methodology, profitability trends for certain funds, and the impact of certain factors on fund profitability results; (ii) portfolio manager changes that have occurred during the past year and the amount of the investment that each portfolio manager has made in the Fidelity fund(s) that he or she manages; (iii) Fidelity's compensation structure for portfolio managers, research analysts, and other key personnel, including its effects on fund profitability, the rationale for the compensation structure, and the extent to which current market conditions have affected retention and recruitment; (iv) the arrangements with and compensation paid to certain fund sub-advisers on behalf of the Fidelity funds; (v) Fidelity's voluntary waiver of its fees to maintain minimum yields for certain money market funds and classes as well as contractual waivers in place for certain funds; (vi) the methodology with respect to competitive fund data and peer group classifications; (vii) Fidelity's transfer agent fee, expense, and service structures for different funds and classes relative to competitive trends, and the impact of the increased use of omnibus accounts; (viii) Fidelity's long-term expectations for its offerings in the workplace investing channel; (ix) new developments in the retail and institutional marketplaces; and (x) the impact of money market reform on Fidelity's money market funds. In addition, the Board considered its discussions with Fidelity throughout the year regarding enhanced information security initiatives and the funds' fair valuation policies.
Based on its evaluation of all of the conclusions noted above, and after considering all factors it believed relevant, the Board concluded that the advisory fee structures are fair and reasonable, and that the fund's Advisory Contracts should be renewed.
AMORI-SANN-0416
1.703542.118
Fidelity Advisor® Short Fixed-Income Fund
Class A, Class T, Class B and Class C
Semi-Annual Report February 29, 2016 |
|
Contents
To view a fund's proxy voting guidelines and proxy voting record for the 12-month period ended June 30, visit http://www.fidelity.com/proxyvotingresults or visit the Securities and Exchange Commission's (SEC) web site at http://www.sec.gov.
You may also call 1-877-208-0098 to request a free copy of the proxy voting guidelines.
Standard & Poor's, S&P and S&P 500 are registered service marks of The McGraw-Hill Companies, Inc. and have been licensed for use by Fidelity Distributors Corporation.
Other third-party marks appearing herein are the property of their respective owners.
All other marks appearing herein are registered or unregistered trademarks or service marks of FMR LLC or an affiliated company. © 2016 FMR LLC. All rights reserved.
This report and the financial statements contained herein are submitted for the general information of the shareholders of the Fund. This report is not authorized for distribution to prospective investors in the Fund unless preceded or accompanied by an effective prospectus.
A fund files its complete schedule of portfolio holdings with the SEC for the first and third quarters of each fiscal year on Form N-Q. Forms N-Q are available on the SEC’s web site at http://www.sec.gov. A fund's Forms N-Q may be reviewed and copied at the SEC’s Public Reference Room in Washington, DC. Information regarding the operation of the SEC's Public Reference Room may be obtained by calling 1-800-SEC-0330.
For a complete list of a fund's portfolio holdings, view the most recent holdings listing, semiannual report, or annual report on Fidelity's web site at http://www.fidelity.com, http://www.advisor.fidelity.com, or http://www.401k.com, as applicable.
NOT FDIC INSURED •MAY LOSE VALUE •NO BANK GUARANTEE
Neither the Fund nor Fidelity Distributors Corporation is a bank.
Investment Summary (Unaudited)
Quality Diversification (% of fund's net assets)
| As of February 29, 2016 |
| | U.S. Government and U.S. Government Agency Obligations | 31.6% |
| | AAA | 20.3% |
| | AA | 3.8% |
| | A | 19.6% |
| | BBB | 20.9% |
| | BB and Below | 1.9% |
| | Not Rated | 0.3% |
| | Short-Term Investments and Net Other Assets | 1.6% |

| As of August 31, 2015 |
| | U.S. Government and U.S. Government Agency Obligations | 27.4% |
| | AAA | 24.1% |
| | AA | 4.2% |
| | A | 20.6% |
| | BBB | 20.2% |
| | BB and Below | 2.5% |
| | Not Rated | 0.2% |
| | Short-Term Investments and Net Other Assets | 0.8% |

We have used ratings from Moody's Investors Service, Inc. Where Moody's® ratings are not available, we have used S&P® ratings. All ratings are as of the date indicated and do not reflect subsequent changes. Securities rated BB or below were rated investment grade at the time of acquisition.
Weighted Average Maturity as of February 29, 2016
| | | 6 months ago |
| Years | 1.8 | 2.0 |
This is a weighted average of all the maturities of the securities held in a fund. Weighted Average Maturity (WAM) can be used as a measure of sensitivity to interest rate changes and market changes. Generally, the longer the maturity, the greater the sensitivity to such changes. WAM is based on the dollar-weighted average length of time until principal payments must be paid. Depending on the types of securities held in a fund, certain maturity shortening devices (e.g., demand features, interest rate resets, and call options) may be taken into account when calculating the WAM.
Duration as of February 29, 2016
| | | 6 months ago |
| Years | 1.7 | 1.7 |
Duration is a measure of a security's price sensitivity to changes in interest rates. Duration differs from maturity in that it considers a security's interest payments in addition to the amount of time until the security reaches maturity, and also takes into account certain maturity shortening features (e.g., demand features, interest rate resets, and call options) when applicable. Securities with longer durations generally tend to be more sensitive to interest rate changes than securities with shorter durations. A fund with a longer average duration generally can be expected to be more sensitive to interest rate changes than a fund with a shorter average duration.
Asset Allocation (% of fund's net assets)
| As of February 29, 2016 *,** |
| | Corporate Bonds | 42.3% |
| | U.S. Government and U.S. Government Agency Obligations | 31.6% |
| | Asset-Backed Securities | 14.3% |
| | CMOs and Other Mortgage Related Securities | 7.2% |
| | Municipal Bonds | 0.2% |
| | Other Investments | 2.8% |
| | Short-Term Investments and Net Other Assets (Liabilities) | 1.6% |

* Foreign investments - 13.3%
** Futures and Swaps - 0.0%
| As of August 31, 2015 *,** |
| | Corporate Bonds | 42.8% |
| | U.S. Government and U.S. Government Agency Obligations | 27.4% |
| | Asset-Backed Securities | 16.1% |
| | CMOs and Other Mortgage Related Securities | 10.0% |
| | Other Investments | 2.9% |
| | Short-Term Investments and Net Other Assets (Liabilities) | 0.8% |

* Foreign investments - 14.9%
** Futures and Swaps - 0.0%
Percentages shown as 0.0% may reflect amounts less than 0.05%.
Investments February 29, 2016 (Unaudited)
Showing Percentage of Net Assets
| Nonconvertible Bonds - 42.3% | | | |
| | | Principal Amount | Value |
| CONSUMER DISCRETIONARY - 2.9% | | | |
| Automobiles - 1.8% | | | |
| American Honda Finance Corp.: | | | |
| 0.95% 5/5/17 | | $1,580,000 | $1,574,721 |
| 1.125% 10/7/16 | | 1,248,000 | 1,250,626 |
| 1.7% 2/22/19 | | 870,000 | 871,286 |
| Daimler Finance North America LLC: | | | |
| 1.375% 8/1/17 (a) | | 1,642,000 | 1,631,596 |
| 1.45% 8/1/16 (a) | | 1,429,000 | 1,429,254 |
| 1.65% 3/2/18 (a) | | 821,000 | 812,884 |
| 1.65% 5/18/18 (a) | | 1,600,000 | 1,579,842 |
| General Motors Financial Co., Inc.: | | | |
| 2.4% 4/10/18 | | 1,827,000 | 1,794,933 |
| 4.2% 3/1/21 | | 1,000,000 | 1,001,501 |
| Volkswagen Group of America Finance LLC: | | | |
| 1.25% 5/23/17 (a) | | 1,642,000 | 1,613,216 |
| 1.65% 5/22/18 (a) | | 1,000,000 | 969,677 |
| Volkswagen International Finance NV 1.6% 11/20/17 (a) | | 1,090,000 | 1,067,904 |
| | | | 15,597,440 |
| Hotels, Restaurants & Leisure - 0.0% | | | |
| McDonald's Corp. 2.1% 12/7/18 | | 335,000 | 339,326 |
| Media - 1.1% | | | |
| Charter Communications Operating LLC/Charter Communications Operating Capital Corp. 3.579% 7/23/20 (a) | | 1,000,000 | 1,002,490 |
| COX Communications, Inc. 6.25% 6/1/18 (a) | | 411,000 | 440,130 |
| DIRECTV Holdings LLC/DIRECTV Financing, Inc. 2.4% 3/15/17 | | 1,642,000 | 1,658,143 |
| Thomson Reuters Corp. 0.875% 5/23/16 | | 440,000 | 439,538 |
| Time Warner Cable, Inc. 5.85% 5/1/17 | | 2,675,000 | 2,777,699 |
| Time Warner, Inc. 6.875% 6/15/18 | | 1,300,000 | 1,439,692 |
| Viacom, Inc. 2.2% 4/1/19 | | 821,000 | 805,671 |
| Walt Disney Co. 1.1% 12/1/17 | | 802,000 | 802,578 |
| | | | 9,365,941 |
|
| TOTAL CONSUMER DISCRETIONARY | | | 25,302,707 |
|
| CONSUMER STAPLES - 3.1% | | | |
| Beverages - 0.9% | | | |
| Anheuser-Busch InBev Finance, Inc.: | | | |
| 1.9% 2/1/19 | | 3,621,000 | 3,655,320 |
| 2.65% 2/1/21 | | 1,500,000 | 1,526,687 |
| Heineken NV 1.4% 10/1/17 (a) | | 457,000 | 456,847 |
| SABMiller Holdings, Inc. 2.45% 1/15/17 (a) | | 2,184,000 | 2,201,230 |
| | | | 7,840,084 |
| Food & Staples Retailing - 0.1% | | | |
| CVS Health Corp. 1.9% 7/20/18 | | 733,000 | 735,957 |
| Walgreens Boots Alliance, Inc. 1.75% 11/17/17 | | 212,000 | 211,731 |
| | | | 947,688 |
| Food Products - 0.6% | | | |
| General Mills, Inc. 1.4% 10/20/17 | | 2,053,000 | 2,053,511 |
| H.J. Heinz Co. 1.6% 6/30/17 (a) | | 1,180,000 | 1,178,729 |
| The J.M. Smucker Co. 1.75% 3/15/18 | | 533,000 | 531,302 |
| Tyson Foods, Inc. 2.65% 8/15/19 | | 821,000 | 832,094 |
| William Wrigley Jr. Co. 1.4% 10/21/16 (a) | | 560,000 | 560,162 |
| | | | 5,155,798 |
| Tobacco - 1.5% | | | |
| BAT International Finance PLC: | | | |
| 1.85% 6/15/18 (a) | | 3,000,000 | 3,012,354 |
| 2.75% 6/15/20 (a) | | 1,570,000 | 1,603,389 |
| Imperial Tobacco Finance PLC: | | | |
| 2.05% 2/11/18 (a) | | 867,000 | 866,183 |
| 2.05% 7/20/18 (a) | | 2,000,000 | 1,990,382 |
| Philip Morris International, Inc.: | | | |
| 1.25% 8/11/17 | | 1,349,000 | 1,352,103 |
| 1.375% 2/25/19 | | 2,000,000 | 1,993,316 |
| Reynolds American, Inc.: | | | |
| 2.3% 6/12/18 | | 349,000 | 352,730 |
| 3.25% 6/12/20 | | 576,000 | 599,028 |
| 6.75% 6/15/17 | | 1,350,000 | 1,449,198 |
| | | | 13,218,683 |
|
| TOTAL CONSUMER STAPLES | | | 27,162,253 |
|
| ENERGY - 3.7% | | | |
| Energy Equipment & Services - 0.2% | | | |
| Nabors Industries, Inc. 2.35% 9/15/16 | | 473,000 | 468,226 |
| Noble Holding International Ltd. 4% 3/16/18 | | 60,000 | 48,000 |
| Petrofac Ltd. 3.4% 10/10/18 (a) | | 1,478,000 | 1,253,634 |
| | | | 1,769,860 |
| Oil, Gas & Consumable Fuels - 3.5% | | | |
| BG Energy Capital PLC 2.875% 10/15/16 (a) | | 1,109,000 | 1,114,645 |
| BP Capital Markets PLC: | | | |
| 1.375% 5/10/18 | | 895,000 | 877,123 |
| 2.248% 11/1/16 | | 1,084,000 | 1,089,647 |
| Canadian Natural Resources Ltd. 1.75% 1/15/18 | | 340,000 | 310,727 |
| Columbia Pipeline Group, Inc. 2.45% 6/1/18 (a) | | 1,054,000 | 1,011,243 |
| ConocoPhillips Co. 1.5% 5/15/18 | | 2,114,000 | 2,018,194 |
| Enbridge, Inc.: | | | |
| 0.8662% 6/2/17 (b) | | 1,459,000 | 1,394,350 |
| 1.2622% 10/1/16 (b) | | 2,053,000 | 2,033,375 |
| Enterprise Products Operating LP: | | | |
| 1.65% 5/7/18 | | 1,000,000 | 966,141 |
| 2.55% 10/15/19 | | 162,000 | 156,781 |
| Exxon Mobil Corp. 1.6% 3/1/19 | | 2,000,000 | 2,000,000 |
| Kinder Morgan, Inc. 3.05% 12/1/19 | | 1,250,000 | 1,153,938 |
| Marathon Petroleum Corp.: | | | |
| 2.7% 12/14/18 | | 197,000 | 190,797 |
| 3.5% 3/1/16 | | 1,399,000 | 1,399,000 |
| Petro-Canada 6.05% 5/15/18 | | 821,000 | 839,936 |
| Petrobras Global Finance BV: | | | |
| 2% 5/20/16 | | 1,642,000 | 1,636,253 |
| 3.25% 3/17/17 | | 1,232,000 | 1,193,808 |
| Petroleos Mexicanos: | | | |
| 3.125% 1/23/19 | | 143,000 | 139,037 |
| 5.5% 2/4/19 (a) | | 1,000,000 | 1,034,000 |
| Phillips 66 Co. 2.95% 5/1/17 | | 534,000 | 540,706 |
| Schlumberger Investment SA 1.25% 8/1/17 (a) | | 1,232,000 | 1,211,020 |
| Shell International Finance BV 2.125% 5/11/20 | | 1,184,000 | 1,153,059 |
| Southwestern Energy Co. 3.3% 1/23/18 | | 321,000 | 231,120 |
| Spectra Energy Partners, LP 2.95% 6/15/16 | | 257,000 | 257,298 |
| TransCanada PipeLines Ltd.: | | | |
| 1.2831% 6/30/16 (b) | | 3,284,000 | 3,277,268 |
| 1.625% 11/9/17 | | 750,000 | 736,784 |
| 1.875% 1/12/18 | | 1,642,000 | 1,610,672 |
| 3.125% 1/15/19 | | 754,000 | 758,802 |
| | | | 30,335,724 |
|
| TOTAL ENERGY | | | 32,105,584 |
|
| FINANCIALS - 21.6% | | | |
| Banks - 12.5% | | | |
| ABN AMRO Bank NV 1.4211% 10/28/16 (a)(b) | | 3,740,000 | 3,745,685 |
| Australia & New Zealand Banking Group Ltd. 1.25% 1/10/17 | | 1,339,000 | 1,340,372 |
| Banco Nacional de Desenvolvimento Economico e Social 3.375% 9/26/16 (a) | | 957,000 | 954,608 |
| Bank of America Corp.: | | | |
| 2% 1/11/18 | | 2,340,000 | 2,331,796 |
| 2.6% 1/15/19 | | 1,000,000 | 1,004,726 |
| Bank of Montreal 1.4% 4/10/18 | | 800,000 | 795,859 |
| Bank of Nova Scotia 1.375% 12/18/17 | | 878,000 | 875,782 |
| Bank of Tokyo-Mitsubishi UFJ Ltd.: | | | |
| 1.45% 9/8/17 (a) | | 1,150,000 | 1,145,510 |
| 1.55% 9/9/16 (a) | | 945,000 | 946,200 |
| 1.7% 3/5/18 (a) | | 1,642,000 | 1,632,618 |
| Barclays PLC: | | | |
| 2% 3/16/18 | | 1,000,000 | 980,589 |
| 2.75% 11/8/19 | | 2,000,000 | 1,963,960 |
| 3.25% 1/12/21 | | 928,000 | 894,672 |
| BNP Paribas 2.375% 9/14/17 | | 1,700,000 | 1,716,201 |
| BPCE SA 1.625% 2/10/17 | | 1,080,000 | 1,078,820 |
| Citigroup, Inc.: | | | |
| 1.3% 11/15/16 | | 1,445,000 | 1,444,523 |
| 1.55% 8/14/17 | | 4,105,000 | 4,083,038 |
| 1.5786% 7/25/16 (b) | | 1,642,000 | 1,644,217 |
| 1.7% 4/27/18 | | 780,000 | 771,708 |
| 1.85% 11/24/17 | | 821,000 | 818,360 |
| 2.15% 7/30/18 | | 750,000 | 747,325 |
| 2.5% 9/26/18 | | 1,200,000 | 1,207,720 |
| 2.5% 7/29/19 | | 805,000 | 806,942 |
| Citizens Bank NA: | | | |
| 1.6% 12/4/17 | | 1,642,000 | 1,623,549 |
| 2.45% 12/4/19 | | 1,240,000 | 1,230,245 |
| Commonwealth Bank of Australia 1.125% 3/13/17 | | 1,766,000 | 1,763,921 |
| Credit Suisse New York Branch: | | | |
| 1.1246% 5/26/17 (b) | | 1,642,000 | 1,633,041 |
| 1.375% 5/26/17 | | 4,105,000 | 4,076,540 |
| 1.75% 1/29/18 | | 1,642,000 | 1,631,816 |
| Discover Bank: | | | |
| 2% 2/21/18 | | 2,053,000 | 2,028,247 |
| 2.6% 11/13/18 | | 1,000,000 | 998,992 |
| Fifth Third Bancorp 4.5% 6/1/18 | | 1,027,000 | 1,080,780 |
| Fifth Third Bank 2.15% 8/20/18 | | 963,000 | 967,058 |
| HSBC Bank PLC 1.5% 5/15/18 (a) | | 1,090,000 | 1,083,320 |
| HSBC U.S.A., Inc.: | | | |
| 1.7% 3/5/18 | | 994,000 | 986,612 |
| 2.625% 9/24/18 | | 821,000 | 825,732 |
| Huntington National Bank 2% 6/30/18 | | 1,570,000 | 1,562,148 |
| ING Bank NV 1.8% 3/16/18 (a) | | 1,000,000 | 998,273 |
| Intesa Sanpaolo SpA 2.375% 1/13/17 | | 3,428,000 | 3,438,880 |
| JPMorgan Chase & Co.: | | | |
| 1.35% 2/15/17 | | 6,568,000 | 6,569,885 |
| 2% 8/15/17 | | 1,642,000 | 1,649,497 |
| KeyBank NA 1.7% 6/1/18 | | 1,183,000 | 1,179,504 |
| La Caisse Centrale 1.75% 1/29/18 (a) | | 1,232,000 | 1,223,095 |
| Lloyds Bank PLC 1.75% 3/16/18 | | 1,232,000 | 1,226,231 |
| Mitsubishi UFJ Financial Group, Inc. 2.95% 3/1/21 | | 1,700,000 | 1,714,982 |
| Mitsubishi UFJ Trust & Banking Corp. 1.6% 10/16/17 (a) | | 1,232,000 | 1,224,912 |
| Mizuho Bank Ltd.: | | | |
| 1.0531% 9/25/17 (a)(b) | | 1,642,000 | 1,635,342 |
| 1.55% 10/17/17 (a) | | 2,693,000 | 2,676,635 |
| MUFG Americas Holdings Corp. 1.625% 2/9/18 | | 238,000 | 236,270 |
| MUFG Union Bank NA 1.5% 9/26/16 | | 753,000 | 754,559 |
| Nordea Bank AB 1.875% 9/17/18 (a) | | 1,200,000 | 1,199,116 |
| PNC Bank NA: | | | |
| 1.5% 2/23/18 | | 1,100,000 | 1,097,016 |
| 1.8% 11/5/18 | | 1,500,000 | 1,499,933 |
| Regions Financial Corp.: | | | |
| 2% 5/15/18 | | 1,654,000 | 1,639,334 |
| 3.2% 2/8/21 | | 1,000,000 | 995,154 |
| Royal Bank of Canada: | | | |
| 1.2% 1/23/17 | | 1,036,000 | 1,036,943 |
| 1.5% 1/16/18 | | 1,815,000 | 1,812,448 |
| 2.2% 7/27/18 | | 821,000 | 830,067 |
| Royal Bank of Scotland Group PLC 1.5431% 3/31/17 (b) | | 1,807,000 | 1,801,248 |
| Sumitomo Mitsui Banking Corp.: | | | |
| 1.3% 1/10/17 | | 2,053,000 | 2,051,542 |
| 1.75% 1/16/18 | | 1,642,000 | 1,635,834 |
| 1.8% 7/18/17 | | 1,618,000 | 1,620,173 |
| 2.05% 1/18/19 | | 2,000,000 | 1,999,010 |
| SunTrust Banks, Inc. 3.5% 1/20/17 | | 1,190,000 | 1,210,068 |
| Wells Fargo Bank NA 0.8282% 5/16/16 (b) | | 3,695,000 | 3,695,695 |
| Westpac Banking Corp.: | | | |
| 1.2% 5/19/17 | | 2,217,000 | 2,212,056 |
| 1.5% 12/1/17 | | 1,642,000 | 1,642,355 |
| 2% 8/14/17 | | 1,848,000 | 1,862,267 |
| | | | 108,791,556 |
| Capital Markets - 2.8% | | | |
| Deutsche Bank AG London Branch 1.4% 2/13/17 | | 4,105,000 | 4,078,441 |
| Goldman Sachs Group, Inc.: | | | |
| 1.2882% 5/22/17 (b) | | 1,000,000 | 997,994 |
| 1.748% 9/15/17 | | 2,874,000 | 2,871,853 |
| 2.375% 1/22/18 | | 1,807,000 | 1,817,956 |
| 2.55% 10/23/19 | | 830,000 | 831,504 |
| 2.625% 1/31/19 | | 1,232,000 | 1,241,368 |
| JPMorgan Chase & Co. 1.7% 3/1/18 | | 821,000 | 818,203 |
| Lazard Group LLC 6.85% 6/15/17 | | 28,000 | 29,439 |
| Morgan Stanley: | | | |
| 1.875% 1/5/18 | | 821,000 | 818,955 |
| 2.375% 7/23/19 | | 700,000 | 698,474 |
| 2.45% 2/1/19 | | 2,000,000 | 2,008,188 |
| 2.5% 1/24/19 | | 2,000,000 | 2,010,344 |
| 5.45% 1/9/17 | | 2,792,000 | 2,883,795 |
| UBS AG Stamford Branch: | | | |
| 1.375% 6/1/17 | | 590,000 | 588,512 |
| 1.375% 8/14/17 | | 1,618,000 | 1,611,955 |
| 1.8% 3/26/18 | | 1,174,000 | 1,174,639 |
| | | | 24,481,620 |
| Consumer Finance - 2.1% | | | |
| American Express Credit Corp.: | | | |
| 1.125% 6/5/17 | | 2,053,000 | 2,044,455 |
| 2.8% 9/19/16 | | 797,000 | 805,013 |
| Discover Financial Services 6.45% 6/12/17 | | 2,587,000 | 2,712,987 |
| Ford Motor Credit Co. LLC: | | | |
| 1.461% 3/27/17 | | 1,000,000 | 993,250 |
| 1.684% 9/8/17 | | 1,642,000 | 1,617,938 |
| 2.145% 1/9/18 | | 1,642,000 | 1,633,506 |
| 2.24% 6/15/18 | | 895,000 | 882,060 |
| 3% 6/12/17 | | 2,422,000 | 2,442,308 |
| Hyundai Capital America: | | | |
| 1.45% 2/6/17 (a) | | 1,151,000 | 1,147,167 |
| 2% 3/19/18 (a) | | 821,000 | 817,327 |
| 2.125% 10/2/17 (a) | | 1,196,000 | 1,196,968 |
| 2.875% 8/9/18 (a) | | 583,000 | 587,381 |
| John Deere Capital Corp. 1.6% 7/13/18 | | 279,000 | 279,312 |
| Synchrony Financial: | | | |
| 1.875% 8/15/17 | | 193,000 | 190,894 |
| 2.6% 1/15/19 | | 1,000,000 | 991,730 |
| | | | 18,342,296 |
| Diversified Financial Services - 1.3% | | | |
| AIG Global Funding 1.65% 12/15/17 (a) | | 1,232,000 | 1,229,001 |
| Berkshire Hathaway Finance Corp. 1.6% 5/15/17 | | 1,092,000 | 1,100,222 |
| Berkshire Hathaway, Inc. 1.55% 2/9/18 | | 912,000 | 918,536 |
| GE Capital International Funding Co. 0.964% 4/15/16 (a) | | 6,281,000 | 6,282,124 |
| McGraw Hill Financial, Inc. 2.5% 8/15/18 | | 489,000 | 491,472 |
| Moody's Corp. 2.75% 7/15/19 | | 1,500,000 | 1,528,803 |
| | | | 11,550,158 |
| Insurance - 2.2% | | | |
| ACE INA Holdings, Inc. 2.3% 11/3/20 | | 543,000 | 546,206 |
| AFLAC, Inc. 2.4% 3/16/20 | | 1,000,000 | 1,010,216 |
| American International Group, Inc.: | | | |
| 2.3% 7/16/19 | | 1,983,000 | 1,966,894 |
| 5.85% 1/16/18 | | 979,000 | 1,043,898 |
| Aon Corp.: | | | |
| 3.125% 5/27/16 | | 1,027,000 | 1,031,827 |
| 5% 9/30/20 | | 703,000 | 775,583 |
| Assurant, Inc. 2.5% 3/15/18 | | 920,000 | 920,426 |
| Marsh & McLennan Companies, Inc. 2.55% 10/15/18 | | 963,000 | 985,027 |
| MetLife, Inc.: | | | |
| 1.756% 12/15/17 (b) | | 382,000 | 382,152 |
| 1.903% 12/15/17 (b) | | 166,000 | 166,070 |
| Metropolitan Life Global Funding I: | | | |
| 1.3% 4/10/17 (a) | | 3,284,000 | 3,284,433 |
| 1.5% 1/10/18 (a) | | 2,101,000 | 2,086,249 |
| New York Life Global Funding 1.55% 11/2/18 (a) | | 1,610,000 | 1,603,811 |
| Pricoa Global Funding I: | | | |
| 1.15% 11/25/16 (a) | | 904,000 | 903,652 |
| 1.9% 9/21/18 (a) | | 750,000 | 748,172 |
| Principal Life Global Funding II 2.25% 10/15/18 (a) | | 1,500,000 | 1,516,524 |
| Prudential Financial, Inc. 2.3% 8/15/18 | | 300,000 | 300,802 |
| TIAA Asset Management Finance LLC 2.95% 11/1/19 (a) | | 238,000 | 239,199 |
| | | | 19,511,141 |
| Real Estate Investment Trusts - 0.3% | | | |
| Boston Properties, Inc. 3.7% 11/15/18 | | 825,000 | 854,814 |
| DDR Corp. 9.625% 3/15/16 | | 271,000 | 271,755 |
| ERP Operating LP 2.375% 7/1/19 | | 528,000 | 530,518 |
| Health Care REIT, Inc.: | | | |
| 2.25% 3/15/18 | | 280,000 | 279,264 |
| 4.7% 9/15/17 | | 500,000 | 520,727 |
| Select Income REIT 2.85% 2/1/18 | | 395,000 | 393,721 |
| | | | 2,850,799 |
| Real Estate Management & Development - 0.4% | | | |
| Mack-Cali Realty LP 2.5% 12/15/17 | | 633,000 | 627,113 |
| Ventas Realty LP: | | | |
| 1.25% 4/17/17 | | 405,000 | 401,702 |
| 1.55% 9/26/16 | | 236,000 | 236,109 |
| Ventas Realty LP/Ventas Capital Corp. 2% 2/15/18 | | 572,000 | 569,073 |
| Washington Prime Group LP 3.85% 4/1/20 | | 1,191,000 | 1,227,173 |
| | | | 3,061,170 |
|
| TOTAL FINANCIALS | | | 188,588,740 |
|
| HEALTH CARE - 2.8% | | | |
| Biotechnology - 0.8% | | | |
| AbbVie, Inc.: | | | |
| 1.75% 11/6/17 | | 1,532,000 | 1,531,131 |
| 1.8% 5/14/18 | | 2,061,000 | 2,055,194 |
| 2.5% 5/14/20 | | 1,100,000 | 1,099,267 |
| Amgen, Inc. 1.25% 5/22/17 | | 1,634,000 | 1,630,536 |
| Celgene Corp. 2.125% 8/15/18 | | 718,000 | 721,242 |
| | | | 7,037,370 |
| Health Care Equipment & Supplies - 0.5% | | | |
| Becton, Dickinson & Co. 1.8% 12/15/17 | | 1,129,000 | 1,130,426 |
| Medtronic, Inc. 1.5% 3/15/18 | | 1,358,000 | 1,361,229 |
| Zimmer Biomet Holdings, Inc. 2% 4/1/18 | | 1,563,000 | 1,556,181 |
| | | | 4,047,836 |
| Health Care Providers & Services - 0.5% | | | |
| Cardinal Health, Inc. 1.95% 6/15/18 | | 229,000 | 229,075 |
| Express Scripts Holding Co. 1.25% 6/2/17 | | 2,045,000 | 2,034,405 |
| UnitedHealth Group, Inc. 1.9% 7/16/18 | | 1,400,000 | 1,413,079 |
| WellPoint, Inc. 1.875% 1/15/18 | | 532,000 | 530,894 |
| | | | 4,207,453 |
| Life Sciences Tools & Services - 0.1% | | | |
| Thermo Fisher Scientific, Inc.: | | | |
| 1.3% 2/1/17 | | 253,000 | 252,103 |
| 2.15% 12/14/18 | | 398,000 | 398,178 |
| | | | 650,281 |
| Pharmaceuticals - 0.9% | | | |
| Actavis Funding SCS: | | | |
| 1.582% 3/12/18 (b) | | 2,053,000 | 2,058,933 |
| 2.35% 3/12/18 | | 1,642,000 | 1,651,919 |
| 3% 3/12/20 | | 687,000 | 698,825 |
| Bayer U.S. Finance LLC: | | | |
| 1.5% 10/6/17 (a) | | 1,710,000 | 1,713,107 |
| 2.375% 10/8/19 (a) | | 1,100,000 | 1,115,710 |
| Mylan, Inc. 1.35% 11/29/16 | | 299,000 | 296,936 |
| Perrigo Co. PLC 1.3% 11/8/16 | | 302,000 | 300,249 |
| Zoetis, Inc.: | | | |
| 1.875% 2/1/18 | | 143,000 | 141,460 |
| 3.45% 11/13/20 | | 223,000 | 227,164 |
| | | | 8,204,303 |
|
| TOTAL HEALTH CARE | | | 24,147,243 |
|
| INDUSTRIALS - 0.8% | | | |
| Aerospace & Defense - 0.4% | | | |
| L-3 Communications Corp. 1.5% 5/28/17 | | 813,000 | 802,103 |
| Lockheed Martin Corp. 1.85% 11/23/18 | | 2,830,000 | 2,848,186 |
| | | | 3,650,289 |
| Industrial Conglomerates - 0.3% | | | |
| Danaher Corp. 1.65% 9/15/18 | | 1,842,000 | 1,852,886 |
| Roper Technologies, Inc. 2.05% 10/1/18 | | 750,000 | 746,286 |
| | | | 2,599,172 |
| Trading Companies & Distributors - 0.1% | | | |
| Air Lease Corp. 2.125% 1/15/18 | | 405,000 | 395,381 |
|
| TOTAL INDUSTRIALS | | | 6,644,842 |
|
| INFORMATION TECHNOLOGY - 1.0% | | | |
| Communications Equipment - 0.1% | | | |
| Cisco Systems, Inc. 1.65% 6/15/18 | | 1,200,000 | 1,208,519 |
| Electronic Equipment & Components - 0.5% | | | |
| Amphenol Corp. 1.55% 9/15/17 | | 1,394,000 | 1,390,236 |
| Tyco Electronics Group SA: | | | |
| 2.375% 12/17/18 | | 185,000 | 185,821 |
| 6.55% 10/1/17 | | 2,775,000 | 2,979,487 |
| | | | 4,555,544 |
| IT Services - 0.2% | | | |
| The Western Union Co.: | | | |
| 2.875% 12/10/17 | | 915,000 | 930,840 |
| 3.65% 8/22/18 | | 522,000 | 532,946 |
| | | | 1,463,786 |
| Technology Hardware, Storage & Peripherals - 0.2% | | | |
| Hewlett Packard Enterprise Co. 2.85% 10/5/18 (a) | | 2,000,000 | 2,000,658 |
|
| TOTAL INFORMATION TECHNOLOGY | | | 9,228,507 |
|
| MATERIALS - 0.7% | | | |
| Chemicals - 0.5% | | | |
| Chevron Phillips Chemical Co. LLC / Chevron Phillips Chemical Co. LP 1.7% 5/1/18 (a) | | 1,970,000 | 1,935,789 |
| Ecolab, Inc.: | | | |
| 1.45% 12/8/17 | | 488,000 | 485,559 |
| 1.55% 1/12/18 | | 1,642,000 | 1,634,971 |
| | | | 4,056,319 |
| Metals & Mining - 0.2% | | | |
| Anglo American Capital PLC 1.572% 4/15/16 (a)(b) | | 966,000 | 952,028 |
| Freeport-McMoRan, Inc. 2.3% 11/14/17 | | 549,000 | 502,335 |
| Rio Tinto Finance (U.S.A.) PLC 1.3658% 6/17/16 (b) | | 821,000 | 818,698 |
| | | | 2,273,061 |
|
| TOTAL MATERIALS | | | 6,329,380 |
|
| TELECOMMUNICATION SERVICES - 2.8% | | | |
| Diversified Telecommunication Services - 2.3% | | | |
| AT&T, Inc.: | | | |
| 1.4% 12/1/17 | | 904,000 | 899,628 |
| 2.45% 6/30/20 | | 823,000 | 819,758 |
| 2.95% 5/15/16 | | 986,000 | 989,758 |
| BellSouth Corp. 4.821% 4/26/16 (a)(b) | | 1,500,000 | 1,508,922 |
| British Telecommunications PLC: | | | |
| 1.25% 2/14/17 | | 2,298,000 | 2,295,082 |
| 1.625% 6/28/16 | | 1,515,000 | 1,517,459 |
| 2.35% 2/14/19 | | 1,774,000 | 1,790,793 |
| CenturyLink, Inc. 5.15% 6/15/17 | | 904,000 | 926,600 |
| Deutsche Telekom International Financial BV: | | | |
| 3.125% 4/11/16 (a) | | 993,000 | 995,056 |
| 5.75% 3/23/16 | | 1,642,000 | 1,646,566 |
| Verizon Communications, Inc.: | | | |
| 1.35% 6/9/17 | | 1,279,000 | 1,278,336 |
| 2% 11/1/16 | | 2,239,000 | 2,251,482 |
| 2.5% 9/15/16 | | 3,081,000 | 3,104,785 |
| | | | 20,024,225 |
| Wireless Telecommunication Services - 0.5% | | | |
| America Movil S.A.B. de CV: | | | |
| 1.502% 9/12/16 (b) | | 986,000 | 986,106 |
| 2.375% 9/8/16 | | 1,258,000 | 1,263,462 |
| Vodafone Group PLC: | | | |
| 1.5% 2/19/18 | | 821,000 | 813,202 |
| 1.625% 3/20/17 | | 1,184,000 | 1,188,787 |
| | | | 4,251,557 |
|
| TOTAL TELECOMMUNICATION SERVICES | | | 24,275,782 |
|
| UTILITIES - 2.9% | | | |
| Electric Utilities - 1.9% | | | |
| American Electric Power Co., Inc. 1.65% 12/15/17 | | 1,260,000 | 1,251,339 |
| Duke Energy Corp.: | | | |
| 0.9922% 4/3/17 (b) | | 2,469,000 | 2,450,944 |
| 1.625% 8/15/17 | | 495,000 | 494,581 |
| 2.1% 6/15/18 | | 1,000,000 | 1,002,077 |
| Eversource Energy 1.45% 5/1/18 | | 239,000 | 236,148 |
| Exelon Corp.: | | | |
| 1.55% 6/9/17 | | 155,000 | 154,249 |
| 2.85% 6/15/20 | | 228,000 | 229,935 |
| FirstEnergy Corp. 2.75% 3/15/18 | | 2,632,000 | 2,658,817 |
| NextEra Energy Capital Holdings, Inc. 1.586% 6/1/17 | | 1,500,000 | 1,497,512 |
| Pacific Gas & Electric Co. 5.625% 11/30/17 | | 1,457,000 | 1,554,339 |
| Public Service Electric & Gas Co. 2.3% 9/15/18 | | 1,000,000 | 1,014,802 |
| TECO Finance, Inc. 1.2169% 4/10/18 (b) | | 2,200,000 | 2,168,863 |
| Xcel Energy, Inc. 0.75% 5/9/16 | | 1,807,000 | 1,805,901 |
| | | | 16,519,507 |
| Independent Power and Renewable Electricity Producers - 0.2% | | | |
| Southern Power Co.: | | | |
| 1.5% 6/1/18 | | 1,173,000 | 1,154,680 |
| 1.85% 12/1/17 | | 321,000 | 321,060 |
| | | | 1,475,740 |
| Multi-Utilities - 0.8% | | | |
| Berkshire Hathaway Energy Co. 1.1% 5/15/17 | | 2,150,000 | 2,143,759 |
| Dominion Resources, Inc.: | | | |
| 1.4% 9/15/17 | | 697,000 | 692,487 |
| 1.9% 6/15/18 | | 1,261,000 | 1,254,425 |
| 1.95% 8/15/16 | | 697,000 | 698,757 |
| 2.5% 12/1/19 | | 1,029,000 | 1,036,817 |
| 2.9031% 9/30/66 (b) | | 1,097,000 | 737,240 |
| Wisconsin Energy Corp. 1.65% 6/15/18 | | 456,000 | 455,163 |
| | | | 7,018,648 |
|
| TOTAL UTILITIES | | | 25,013,895 |
|
| TOTAL NONCONVERTIBLE BONDS | | | |
| (Cost $370,359,482) | | | 368,798,933 |
|
| U.S. Government and Government Agency Obligations - 28.3% | | | |
| U.S. Government Agency Obligations - 2.0% | | | |
| Fannie Mae: | | | |
| 1% 2/26/19 | | $10,421,000 | $10,408,161 |
| 1.125% 7/20/18 | | 2,073,000 | 2,081,758 |
| 1.125% 12/14/18 | | 158,000 | 158,522 |
| 1.875% 9/18/18 | | 114,000 | 116,614 |
| Freddie Mac: | | | |
| 0.5% 1/27/17 | | 2,668,000 | 2,661,591 |
| 1% 12/15/17 | | 2,209,000 | 2,213,389 |
|
| TOTAL U.S. GOVERNMENT AGENCY OBLIGATIONS | | | 17,640,035 |
|
| U.S. Treasury Obligations - 26.3% | | | |
| U.S. Treasury Notes: | | | |
| 0.5% 7/31/17 | | 22,000,000 | 21,916,642 |
| 0.75% 2/15/19 (c) | | 96,783,000 | 96,333,149 |
| 0.875% 10/15/17 | | 32,187,500 | 32,228,990 |
| 1% 5/15/18 | | 39,155,000 | 39,297,250 |
| 1.125% 1/15/19 | | 15,658,000 | 15,756,473 |
| 1.375% 2/28/19 | | 13,945,600 | 14,128,092 |
| 1.375% 3/31/20 | | 10,000,000 | 10,088,670 |
|
| TOTAL U.S. TREASURY OBLIGATIONS | | | 229,749,266 |
|
| TOTAL U.S. GOVERNMENT AND GOVERNMENT AGENCY OBLIGATIONS | | | |
| (Cost $247,152,584) | | | 247,389,301 |
|
| U.S. Government Agency - Mortgage Securities - 2.6% | | | |
| Fannie Mae - 1.7% | | | |
| 2.388% 2/1/35 (b) | | 251,024 | 263,177 |
| 2.406% 11/1/34 (b) | | 133,884 | 140,050 |
| 2.409% 10/1/35 (b) | | 285,697 | 299,254 |
| 2.45% 11/1/36 (b) | | 312,284 | 328,530 |
| 2.457% 2/1/44 (b) | | 120,688 | 124,293 |
| 2.467% 5/1/35 (b) | | 222,781 | 234,933 |
| 2.468% 1/1/40 (b) | | 252,080 | 265,227 |
| 2.471% 3/1/40 (b) | | 186,471 | 197,069 |
| 2.489% 12/1/33 (b) | | 127,645 | 134,680 |
| 2.501% 4/1/44 (b) | | 202,633 | 208,545 |
| 2.51% 7/1/35 (b) | | 807,306 | 852,556 |
| 2.523% 10/1/41 (b) | | 345,174 | 365,124 |
| 2.524% 2/1/44 (b) | | 119,090 | 122,605 |
| 2.543% 1/1/44 (b) | | 197,316 | 203,440 |
| 2.557% 3/1/40 (b) | | 134,778 | 142,166 |
| 2.557% 6/1/42 (b) | | 93,416 | 96,229 |
| 2.592% 5/1/44 (b) | | 230,153 | 236,817 |
| 2.595% 4/1/35 (b) | | 78,055 | 82,182 |
| 2.628% 5/1/44 (b) | | 319,327 | 329,243 |
| 2.674% 12/1/34 (b) | | 118,918 | 125,879 |
| 2.68% 9/1/41 (b) | | 488,541 | 517,224 |
| 2.685% 12/1/39 (b) | | 67,329 | 71,194 |
| 2.686% 4/1/44 (b) | | 492,261 | 507,671 |
| 2.689% 2/1/42 (b) | | 569,582 | 592,185 |
| 2.761% 1/1/42 (b) | | 492,164 | 512,197 |
| 2.791% 8/1/41 (b) | | 398,075 | 421,670 |
| 2.951% 11/1/40 (b) | | 62,162 | 64,535 |
| 2.965% 8/1/41 (b) | | 83,465 | 87,313 |
| 2.98% 9/1/41 (b) | | 75,129 | 78,564 |
| 2.991% 10/1/41 (b) | | 39,817 | 41,585 |
| 3.249% 7/1/41 (b) | | 99,639 | 104,101 |
| 3.347% 10/1/41 (b) | | 57,817 | 60,705 |
| 3.5% 1/1/26 to 9/1/29 | | 3,803,095 | 4,049,774 |
| 3.553% 7/1/41 (b) | | 125,862 | 132,354 |
| 4.5% 6/1/19 to 7/1/20 | | 146,719 | 152,083 |
| 5.5% 11/1/17 to 11/1/34 | | 2,417,521 | 2,690,371 |
| 6.5% 6/1/16 | | 224 | 225 |
| 7% 4/1/17 to 11/1/18 | | 2,851 | 2,912 |
|
| TOTAL FANNIE MAE | | | 14,838,662 |
|
| Freddie Mac - 0.9% | | | |
| 2.362% 10/1/42 (b) | | 523,160 | 552,432 |
| 2.413% 4/1/40 (b) | | 144,642 | 152,484 |
| 2.463% 11/1/35 (b) | | 169,307 | 177,223 |
| 2.53% 4/1/40 (b) | | 133,147 | 140,560 |
| 2.576% 8/1/36 (b) | | 88,522 | 93,241 |
| 2.977% 8/1/41 (b) | | 237,825 | 252,061 |
| 3% 8/1/21 | | 628,150 | 655,937 |
| 3.122% 9/1/41 (b) | | 150,070 | 157,785 |
| 3.208% 9/1/41 (b) | | 72,265 | 75,519 |
| 3.216% 4/1/41 (b) | | 72,786 | 76,084 |
| 3.297% 6/1/41 (b) | | 80,099 | 83,711 |
| 3.451% 5/1/41 (b) | | 60,441 | 62,888 |
| 3.5% 8/1/26 | | 1,912,987 | 2,032,549 |
| 3.626% 6/1/41 (b) | | 113,282 | 118,754 |
| 3.706% 5/1/41 (b) | | 93,100 | 97,736 |
| 4% 6/1/24 to 4/1/26 | | 2,216,479 | 2,365,389 |
| 4.5% 8/1/18 to 11/1/18 | | 424,978 | 438,630 |
| 8.5% 5/1/26 to 7/1/28 | | 29,070 | 34,782 |
|
| TOTAL FREDDIE MAC | | | 7,567,765 |
|
| Ginnie Mae - 0.0% | | | |
| 5.5% 6/15/35 | | 235,294 | 265,507 |
| 7% 1/15/25 to 6/15/32 | | 142,602 | 170,027 |
|
| TOTAL GINNIE MAE | | | 435,534 |
|
| TOTAL U.S. GOVERNMENT AGENCY - MORTGAGE SECURITIES | | | |
| (Cost $22,452,375) | | | 22,841,961 |
|
| Asset-Backed Securities - 14.3% | | | |
| Accredited Mortgage Loan Trust: | | | |
| Series 2003-3 Class A1, 5.21% 1/25/34 (AMBAC Insured) | | $203,153 | $196,041 |
| Series 2005-1 Class M1, 1.1266% 4/25/35 (b) | | 69,143 | 61,763 |
| Ally Auto Receivables Trust: | | | |
| Series 2014-SN1 Class A3, 0.75% 2/21/17 | | 643,504 | 643,261 |
| Series 2015-1 Class A3, 1.39% 9/16/19 | | 1,110,000 | 1,111,823 |
| Series 2015-SN1 Class A3, 1.21% 12/20/17 | | 457,000 | 456,857 |
| Ally Master Owner Trust: | | | |
| Series 2012-4 Class A, 1.72% 7/15/19 | | 544,000 | 545,149 |
| Series 2012-5 Class A, 1.54% 9/15/19 | | 2,291,000 | 2,291,580 |
| Series 2014-3 Class A, 1.33% 3/15/19 | | 3,918,000 | 3,916,309 |
| Series 2014-4 Class A2, 1.43% 6/17/19 | | 1,971,000 | 1,970,064 |
| Series 2014-5 Class A2, 1.6% 10/15/19 | | 2,053,000 | 2,054,329 |
| Series 2015-3 Class A, 1.63% 5/15/20 | | 1,570,000 | 1,569,835 |
| American Express Credit Account Master Trust: | | | |
| Series 2014-2 Class A, 1.26% 1/15/20 | | 1,610,000 | 1,614,136 |
| Series 2014-3 Class A, 1.49% 4/15/20 | | 2,462,886 | 2,475,895 |
| Series 2014-4 Class A, 1.43% 6/15/20 | | 2,422,000 | 2,432,247 |
| AmeriCredit Automobile Receivables Trust: | | | |
| Series 2013-5 Class A3, 0.9% 9/10/18 | | 648,057 | 647,324 |
| Series 2014-1 Class A3, 0.9% 2/8/19 | | 597,130 | 595,948 |
| Series 2014-2 Class A3, 0.94% 2/8/19 | | 1,626,000 | 1,623,011 |
| Series 2014-4 Class A3, 1.27% 7/8/19 | | 414,000 | 413,108 |
| Series 2015-2 Class A3, 1.27% 1/8/20 | | 1,500,000 | 1,491,440 |
| Series 2016-1 Class A3, 2.14% 10/8/20 | | 856,000 | 858,896 |
| Ameriquest Mortgage Securities, Inc. pass-thru certificates Series 2004-R2 Class M3, 1.2608% 4/25/34 (b) | | 11,399 | 8,320 |
| Argent Securities, Inc. pass-thru certificates: | | | |
| Series 2003-W7 Class A2, 1.2158% 3/25/34 (b) | | 67,779 | 60,158 |
| Series 2006-W4 Class A2C, 0.5958% 5/25/36 (b) | | 145,128 | 51,441 |
| Bank of America Credit Card Master Trust Series 2015-A2 Class A, 1.36% 9/15/20 | | 1,985,000 | 1,989,706 |
| BMV Vehicle Lease Trust Series 2014-1 Class A3, 0.73% 2/21/17 | | 698,354 | 697,964 |
| BMW Vehicle Lease Trust Series 2015-1 Class A3, 1.24% 12/20/17 | | 1,232,000 | 1,232,467 |
| Capital Auto Receivables Asset Trust: | | | |
| Series 2014-2 Class A2, 0.91% 4/20/17 | | 285,174 | 285,174 |
| Series 2014-3 Class A2, 1.18% 12/20/17 | | 1,204,000 | 1,203,451 |
| Series 2015-1 Class A2, 1.42% 6/20/18 | | 1,209,000 | 1,210,036 |
| Series 2015-2 Class A2, 1.39% 9/20/18 | | 822,000 | 822,637 |
| Capital One Multi-Asset Execution Trust: | | | |
| Series 2014-A5 Class A, 1.48% 7/15/20 | | 1,979,000 | 1,987,938 |
| Series 2015-A1 Class A, 1.39% 1/15/21 | | 1,940,000 | 1,947,289 |
| Series 2015-A5 Class A5, 1.6% 5/17/21 | | 1,500,000 | 1,509,753 |
| Carmax Auto Owner Trust: | | | |
| Series 2014-4 Class A3, 1.25% 11/15/19 | | 1,242,000 | 1,241,187 |
| Series 2015-3 Class A3, 1.63% 5/15/20 | | 761,000 | 764,801 |
| Carrington Mortgage Loan Trust Series 2007-RFC1 Class A3, 0.5758% 12/25/36 (b) | | 228,766 | 155,643 |
| CFC LLC Series 2014-1A Class A, 1.46% 12/17/18 (a) | | 164,614 | 164,428 |
| Chase Issuance Trust: | | | |
| Series 2014-A1 Class A, 1.15% 1/15/19 | | 1,232,000 | 1,234,414 |
| Series 2014-A7 Class A, 1.38% 11/15/19 | | 2,064,000 | 2,072,718 |
| Series 2015-A2, Class A, 1.59% 2/18/20 | | 1,416,000 | 1,425,694 |
| Chrysler Capital Auto Receivables Trust Series 2015-AA Class A3, 1.22% 7/15/19 (a) | | 2,500,000 | 2,494,204 |
| CIT Equipment Collateral: | | | |
| Series 2013-VT1 Class A3, 1.13% 7/20/20 (a) | | 818,252 | 818,323 |
| Series 2014-VT1 Class A3, 1.5% 10/21/19 (a) | | 1,239,653 | 1,235,551 |
| Citibank Credit Card Issuance Trust: | | | |
| Series 2014-A2 Class A2, 1.02% 2/22/19 | | 1,774,000 | 1,773,835 |
| Series 2014-A4 Class A4, 1.23% 4/24/19 | | 1,642,000 | 1,645,227 |
| Series 2014-A8 Class A8, 1.73% 4/9/20 | | 1,585,000 | 1,599,683 |
| Countrywide Home Loans, Inc.: | | | |
| Series 2003-BC1 Class B1, 5.6858% 3/25/32 (b) | | 7,098 | 6,488 |
| Series 2004-2 Class 3A4, 0.9358% 7/25/34 (b) | | 51,255 | 41,443 |
| Series 2004-3 Class M4, 1.8908% 4/25/34 (b) | | 7,947 | 6,960 |
| Series 2004-4 Class M2, 1.2308% 6/25/34 (b) | | 10,245 | 9,264 |
| Dell Equipment Finance Trust: | | | |
| Series 2014-1 Class A3, 0.94% 6/22/20 (a) | | 603,917 | 603,630 |
| Series 2015-1 Class A3, 1.3% 3/23/20 (a) | | 800,000 | 796,870 |
| Series 2015-2 Class A2A, 1.42% 12/22/17 (a) | | 1,000,000 | 998,147 |
| Discover Card Master Trust: | | | |
| Series 2012-A6 Class A6, 1.67% 1/18/22 | | 1,485,000 | 1,494,018 |
| Series 2013-A5 Class A5, 1.04% 4/15/19 | | 359,000 | 359,383 |
| Series 2014-A5 Class A, 1.39% 4/15/20 | | 1,651,000 | 1,657,314 |
| Series 2015-A2 Class A, 1.9% 10/17/22 | | 2,000,000 | 2,008,554 |
| Series 2016-A1 Class A1, 2.1% 7/15/21 | | 1,630,000 | 1,638,228 |
| Enterprise Fleet Financing LLC: | | | |
| Series 2014-1 Class A2, 0.87% 9/20/19 (a) | | 713,439 | 711,074 |
| Series 2014-2 Class A2, 1.05% 3/20/20 (a) | | 1,669,805 | 1,660,982 |
| Series 2015-1 Class A2, 1.3% 9/20/20 (a) | | 1,515,401 | 1,505,294 |
| Fannie Mae Series 2004-T5: | | | |
| Class AB1, 0.6969% 5/28/35 (b) | | 130,399 | 120,283 |
| Class AB3, 1.1189% 5/28/35 (b) | | 55,367 | 48,076 |
| Fieldstone Mortgage Investment Corp. Series 2004-3 Class M5, 2.6015% 8/25/34 (b) | | 36,914 | 34,862 |
| Flagship Credit Auto Trust Series 2016-1 Class A, 2.53% 12/15/20 (a) | | 2,000,000 | 1,995,196 |
| Ford Credit Auto Lease Trust Series 2015-A Class A3, 1.13% 6/15/18 | | 1,500,000 | 1,498,631 |
| Ford Credit Auto Owner Trust Series 2015-C Class A3, 1.41% 2/15/20 | | 1,169,000 | 1,173,236 |
| Ford Credit Floorplan Master Owner Trust: | | | |
| Series 2012-5 Class A, 1.49% 9/15/19 | | 4,516,000 | 4,524,317 |
| Series 2014-1 Class A1, 1.2% 2/15/19 | | 2,677,000 | 2,671,639 |
| Series 2014-4 Class A1, 1.4% 8/15/19 | | 3,614,000 | 3,616,439 |
| Series 2015-4 Class A1, 1.77% 8/15/20 | | 1,580,000 | 1,581,588 |
| Fremont Home Loan Trust: | | | |
| Series 2004-D: | | | |
| Class M4, 1.8515% 11/25/34 (b) | | 85,621 | 9,082 |
| Class M5, 1.9265% 11/25/34 (b) | | 24,561 | 442 |
| Series 2005-A: | | | |
| Class M3, 1.1615% 1/25/35 (b) | | 120,398 | 104,393 |
| Class M4, 1.4465% 1/25/35 (b) | | 44,055 | 23,658 |
| GCO Education Loan Funding Master Trust II Series 2007-1A Class C1L, 1.0091% 2/25/47 (a)(b) | | 127,452 | 112,838 |
| GM Financial Automobile Leasing Trust: | | | |
| Series 2014-1A Class A3, 1.01% 5/22/17 (a) | | 958,542 | 958,295 |
| Series 2014-2A Class A3, 1.22% 1/22/18 (a) | | 1,600,000 | 1,600,061 |
| Series 2015-1 Class A3, 1.53% 9/20/18 | | 1,367,000 | 1,375,704 |
| Series 2015-2 Class A3, 1.68% 12/20/18 | | 1,164,000 | 1,167,452 |
| GMF Floorplan Owner Revolving Trust Series 2015-1 Class A1, 1.65% 5/15/20 (a) | | 1,900,000 | 1,895,666 |
| Home Equity Asset Trust: | | | |
| Series 2003-5 Class A2, 1.1358% 12/25/33 (b) | | 36,254 | 33,534 |
| Series 2004-1 Class M2, 2.1358% 6/25/34 (b) | | 43,293 | 37,672 |
| HSI Asset Securitization Corp. Trust Series 2007-HE1 Class 2A3, 0.6165% 1/25/37 (b) | | 128,988 | 82,715 |
| Hyundai Auto Lease Securitization Trust: | | | |
| Series 2014-B Class A3, 0.98% 11/15/17 (a) | | 1,642,000 | 1,641,120 |
| Series 2015-A Class A3, 1.42% 9/17/18 (a) | | 1,232,000 | 1,234,126 |
| Series 2015-B Class A3, 1.4% 11/15/18 (a) | | 1,479,000 | 1,479,519 |
| Hyundai Auto Receivables Trust Series 2015-C Class A3, 1.46% 2/18/20 | | 1,159,000 | 1,163,133 |
| Hyundai Floorplan Master Owner Trust Series 2013-1A Class A, 0.7805% 5/15/18 (a)(b) | | 1,380,000 | 1,379,177 |
| JPMorgan Mortgage Acquisition Trust Series 2007-CH1 Class AV4, 0.5658% 11/25/36 (b) | | 5,184 | 5,182 |
| KeyCorp Student Loan Trust Series 1999-A Class A2, 0.9331% 12/27/29 (b) | | 8,619 | 8,574 |
| MASTR Asset Backed Securities Trust Series 2007-HE1 Class M1, 0.7265% 5/25/37 (b) | | 39,729 | 1,250 |
| Mercedes Benz Auto Lease Trust Series 2015-B Class A3, 1.34% 7/16/18 | | 800,000 | 800,560 |
| Mercedes-Benz Auto Lease Trust Series 2015-A Class A3, 1.1% 8/15/17 | | 1,631,000 | 1,631,363 |
| Merrill Lynch Mortgage Investors Trust: | | | |
| Series 2006-FM1 Class A2B, 0.5458% 4/25/37 (b) | | 10,603 | 10,542 |
| Series 2006-OPT1 Class A1A, 0.9465% 6/25/35 (b) | | 79,011 | 75,668 |
| Morgan Stanley ABS Capital I Trust: | | | |
| Series 2004-HE6 Class A2, 1.1158% 8/25/34 (b) | | 113,943 | 99,032 |
| Series 2004-NC8 Class M6, 2.3108% 9/25/34 (b) | | 39,499 | 36,416 |
| Series 2005-NC1 Class M1, 1.0958% 1/25/35 (b) | | 31,108 | 27,722 |
| Series 2005-NC2 Class B1, 2.1908% 3/25/35 (b) | | 21,258 | 476 |
| Nationstar HECM Loan Trust Series 2016-1A Class A, 3.1294% 2/25/26 (a) | | 1,000,000 | 999,999 |
| Nissan Auto Lease Trust Series 2014-A Class A3, 0.8% 2/15/17 | | 696,905 | 696,681 |
| Nissan Auto Receivables Owner Trust: | | | |
| Series 2015-C Class A3, 1.37% 5/15/20 | | 1,147,000 | 1,150,512 |
| Series 2016-A Class A3, 1.34% 10/15/20 | | 923,000 | 923,202 |
| Nissan Master Owner Trust Receivables Series 2015-A Class A2, 1.44% 1/15/20 | | 1,642,000 | 1,643,030 |
| Northstar Education Finance, Inc., Delaware Series 2005-1 Class A5, 1.0732% 10/30/45 (b) | | 374,960 | 353,400 |
| Park Place Securities, Inc.: | | | |
| Series 2004-WCW1: | | | |
| Class M3, 2.3015% 9/25/34 (b) | | 654,824 | 596,334 |
| Class M4, 2.6015% 9/25/34 (b) | | 892,159 | 601,916 |
| Series 2005-WCH1 Class M4, 1.6715% 1/25/36 (b) | | 153,762 | 135,046 |
| Salomon Brothers Mortgage Securities VII, Inc. Series 2003-HE1 Class A, 1.2265% 4/25/33 (b) | | 648 | 554 |
| Santander Drive Auto Receivables Trust Series 2014-4 Class B, 1.82% 5/15/19 | | 754,000 | 754,363 |
| Saxon Asset Securities Trust Series 2004-1 Class M1, 1.2308% 3/25/35 (b) | | 91,646 | 84,361 |
| SLM Private Credit Student Loan Trust: | | | |
| Series 2004-A: | | | |
| Class B, 1.092% 6/15/33 (b) | | 169,822 | 160,339 |
| Class C, 1.462% 6/15/33 (b) | | 429,920 | 419,108 |
| Series 2004-B: | | | |
| Class A2, 0.712% 6/15/21 (b) | | 275,845 | 273,857 |
| Class C, 1.382% 9/15/33 (b) | | 526,826 | 495,733 |
| Structured Asset Investment Loan Trust Series 2004-8 Class M5, 2.1608% 9/25/34 (b) | | 5,211 | 4,394 |
| Synchrony Credit Card Master Note Trust: | | | |
| Series 2015-2 Class A, 1.6% 4/15/21 | | 1,580,000 | 1,584,028 |
| Series 2015-3 class A, 1.74% 9/15/21 | | 1,000,000 | 999,940 |
| Terwin Mortgage Trust Series 2003-4HE Class A1, 1.2865% 9/25/34 (b) | | 71,344 | 60,096 |
| Volkswagen Auto Lease Trust: | | | |
| Series 2014-A Class A3, 0.8% 4/20/17 | | 798,916 | 797,220 |
| Series 2015-A Class A3, 1.25% 12/20/17 | | 510,000 | 506,645 |
| Volkswagen Auto Loan Enhanced Trust: | | | |
| Series 2013-2 Class A3, 0.7% 4/20/18 | | 1,044,785 | 1,039,331 |
| Series 2014-1 Class A3, 0.91% 10/22/18 | | 1,032,632 | 1,027,289 |
| Volkswagen Credit Auto Master Trust Series 2014-1A Class A2, 1.4% 7/22/19 (a) | | 1,020,000 | 1,008,550 |
| Volvo Financial Equipment LLC Series 2015-1A Class A3, 1.51% 6/17/19 (a) | | 1,289,000 | 1,291,704 |
| World Omni Auto Receivables Trust Series 2014-B Class A3, 1.14% 1/15/20 | | 1,509,000 | 1,507,645 |
| World Omni Automobile Lease Securitization Trust Series 2015-A Class A3, 1.54% 10/15/18 | | 1,180,000 | 1,182,244 |
| TOTAL ASSET-BACKED SECURITIES | | | |
| (Cost $124,829,779) | | | 124,655,867 |
|
| Collateralized Mortgage Obligations - 0.8% | | | |
| Private Sponsor - 0.2% | | | |
| BCAP LLC II Trust Series 2012-RR10 Class 5A5, 0.6868% 4/26/36 (a)(b) | | 285,466 | 279,063 |
| Credit Suisse Mortgage Trust Series 2012-2R Class 1A1, 2.7362% 5/27/35 (a)(b) | | 487,807 | 500,392 |
| MASTR Adjustable Rate Mortgages Trust Series 2007-3 Class 22A2, 0.6365% 5/25/47 (b) | | 42,964 | 39,407 |
| Merrill Lynch Alternative Note Asset Trust floater Series 2007-OAR1 Class A1, 0.6058% 2/25/37 (b) | | 59,471 | 52,631 |
| Nationstar HECM Loan Trust sequential payer Series 2015-2A Class A, 2.8826% 11/25/25 (a) | | 710,224 | 709,869 |
| RESI Finance LP/RESI Finance DE Corp. floater Series 2003-B Class B5, 2.7735% 6/10/35 (a)(b) | | 21,002 | 18,687 |
| Sequoia Mortgage Trust floater Series 2004-6 Class A3B, 1.675% 7/20/34 (b) | | 2,825 | 2,754 |
|
| TOTAL PRIVATE SPONSOR | | | 1,602,803 |
|
| U.S. Government Agency - 0.6% | | | |
| Fannie Mae: | | | |
| pass-thru certificates Series 2012-127 Class DH, 4% 11/25/27 | | 507,546 | 536,987 |
| planned amortization class Series 2012-94 Class E, 3% 6/25/22 | | 307,558 | 314,929 |
| sequential payer: | | | |
| Series 2001-40 Class Z, 6% 8/25/31 | | 128,719 | 146,533 |
| Series 2009-31 Class A, 4% 2/25/24 | | 55,952 | 57,091 |
| Freddie Mac: | | | |
| planned amortization class Series 3820 Class DA, 4% 11/15/35 | | 417,536 | 437,272 |
| Series 3949 Class MK, 4.5% 10/15/34 | | 316,739 | 343,341 |
| Series 4221-CLS Class GA, 1.4% 7/15/23 | | 1,417,281 | 1,406,561 |
| Ginnie Mae guaranteed REMIC pass-thru certificates Series 2015-H17 Class HA, 2.5% 5/20/65 (d) | | 1,920,609 | 1,960,989 |
|
| TOTAL U.S. GOVERNMENT AGENCY | | | 5,203,703 |
|
| TOTAL COLLATERALIZED MORTGAGE OBLIGATIONS | | | |
| (Cost $6,807,200) | | | 6,806,506 |
|
| Commercial Mortgage Securities - 7.1% | | | |
| Asset Securitization Corp. Series 1997-D5 Class PS1, 1.5885% 2/14/43 (b)(e) | | 145,163 | 1,049 |
| Banc of America Commercial Mortgage Trust: | | | |
| sequential payer Series 2006-4 Class A4, 5.634% 7/10/46 | | 461,879 | 462,751 |
| Series 2006-4 Class A1A, 5.617% 7/10/46 (b) | | 1,421,335 | 1,431,173 |
| Barclays Commercial Mortgage Securities LLC floater Series 2015-RRI Class A, 1.5755% 5/15/32 (a)(b) | | 1,028,000 | 1,011,966 |
| Bayview Commercial Asset Trust: | | | |
| floater: | | | |
| Series 2003-2 Class M1, 1.7108% 12/25/33 (a)(b) | | 3,636 | 3,230 |
| Series 2005-4A: | | | |
| Class A2, 0.8258% 1/25/36 (a)(b) | | 383,000 | 327,037 |
| Class B1, 1.8358% 1/25/36 (a)(b) | | 15,376 | 10,591 |
| Class M1, 0.8858% 1/25/36 (a)(b) | | 120,460 | 95,606 |
| Class M2, 0.9058% 1/25/36 (a)(b) | | 55,680 | 42,875 |
| Class M3, 0.9358% 1/25/36 (a)(b) | | 59,841 | 44,206 |
| Class M4, 1.0458% 1/25/36 (a)(b) | | 30,621 | 22,124 |
| Class M5, 1.0858% 1/25/36 (a)(b) | | 30,621 | 22,182 |
| Class M6, 1.1358% 1/25/36 (a)(b) | | 31,074 | 22,584 |
| Series 2006-3A Class M4, 0.8658% 10/25/36 (a)(b) | | 3,813 | 420 |
| Series 2007-1 Class A2, 0.7058% 3/25/37 (a)(b) | | 183,654 | 155,330 |
| Series 2007-2A: | | | |
| Class A1, 0.7058% 7/25/37 (a)(b) | | 41,423 | 34,766 |
| Class A2, 0.7558% 7/25/37 (a)(b) | | 38,797 | 30,714 |
| Class M1, 0.8058% 7/25/37 (a)(b) | | 13,828 | 10,471 |
| Class M2, 0.8458% 7/25/37 (a)(b) | | 7,759 | 5,423 |
| Class M3, 0.9258% 7/25/37 (a)(b) | | 5,982 | 3,771 |
| Series 2007-3: | | | |
| Class A2, 0.7258% 7/25/37 (a)(b) | | 57,471 | 45,739 |
| Class M1, 0.7458% 7/25/37 (a)(b) | | 43,419 | 32,519 |
| Class M2, 0.7758% 7/25/37 (a)(b) | | 45,649 | 32,555 |
| Class M3, 0.8058% 7/25/37 (a)(b) | | 73,891 | 36,257 |
| Class M4, 0.9358% 7/25/37 (a)(b) | | 116,847 | 56,234 |
| Class M5, 1.0358% 7/25/37 (a)(b) | | 54,108 | 11,371 |
| Series 2007-4A: | | | |
| Class A2, 0.9716% 9/25/37 (a)(b) | | 501,154 | 386,004 |
| Class M1, 1.3716% 9/25/37 (a)(b) | | 62,642 | 15,437 |
| Series 2006-2A Class IO, 0% 7/25/36 (a)(b)(e) | | 3,727,152 | 0 |
| Bear Stearns Commercial Mortgage Securities Trust: | | | |
| sequential payer: | | | |
| Series 2006-PW13 Class A1A, 5.533% 9/11/41 | | 1,252,094 | 1,264,044 |
| Series 2006-PW14 Class A1A, 5.189% 12/11/38 | | 512,932 | 521,494 |
| Series 2006-T22 Class A1A, 5.8216% 4/12/38 (b) | | 17,324 | 17,307 |
| Series 2006-PW12 Class A1A, 5.9065% 9/11/38 (b) | | 591,267 | 591,667 |
| BXHTL Mortgage Trust Series 2015-JWRZ Class A, 1.656% 5/15/29 (a)(b) | | 1,022,000 | 997,759 |
| C-BASS Trust floater Series 2006-SC1 Class A, 0.7058% 5/25/36 (a)(b) | | 23,015 | 22,130 |
| CD Commercial Mortgage Trust Series 2007-CD5 Class A1A, 5.8% 11/15/44 | | 763,344 | 801,068 |
| CDGJ Commercial Mortgage Trust Series 2014-BXCH Class A, 1.827% 12/15/27 (a)(b) | | 2,850,599 | 2,841,237 |
| Citigroup Commercial Mortgage Trust: | | | |
| sequential payer Series 2006-C5 Class A4, 5.431% 10/15/49 | | 463,381 | 468,005 |
| Series 2006-C4 Class A1A, 6.0329% 3/15/49 (b) | | 150,077 | 150,133 |
| Series 2013-GC11 Class A1, 0.754% 4/10/46 | | 306,726 | 304,192 |
| Cobalt CMBS Commercial Mortgage Trust Series 2007-C2 Class A3, 5.484% 4/15/47 | | 828,276 | 849,799 |
| COMM Mortgage Trust: | | | |
| floater Series 2014-KYO Class A, 1.324% 6/11/27 (a)(b) | | 2,052,405 | 2,001,703 |
| Series 2013-CR9 Class A1, 1.344% 7/10/45 | | 164,721 | 164,184 |
| Series 2014-CR15 Class A2, 2.928% 2/10/47 | | 1,530,000 | 1,567,283 |
| COMM Mortgage Trust pass-thru certificates: | | | |
| floater Series 2005-F10A Class J, 1.2805% 4/15/17 (a)(b) | | 16,009 | 15,897 |
| sequential payer: | | | |
| Series 2006-C7 Class A1A, 5.9515% 6/10/46 (b) | | 852,258 | 854,424 |
| Series 2006-C8 Class A1A, 5.292% 12/10/46 | | 1,217,480 | 1,234,874 |
| CSMC Series 2015-TOWN: | | | |
| Class B, 2.327% 3/15/17 (a)(b) | | 180,000 | 173,764 |
| Class C, 2.677% 3/15/17 (a)(b) | | 176,000 | 168,315 |
| Class D, 3.627% 3/15/17 (a)(b) | | 543,000 | 515,042 |
| Freddie Mac: | | | |
| pass-thru certificates Series K708 Class A1, 1.67% 10/25/18 | | 122,344 | 122,453 |
| Series K707 Class A1, 1.615% 9/25/18 | | 821,136 | 825,948 |
| GAHR Commercial Mortgage Trust floater Series 2015-NRF Class AFL1, 1.7255% 12/15/16 (a)(b) | | 2,742,558 | 2,716,322 |
| GE Capital Commercial Mortgage Corp.: | | | |
| sequential payer Series 2007-C1 Class A4, 5.543% 12/10/49 | | 1,727,752 | 1,754,955 |
| Series 2007-C1 Class A1A, 5.483% 12/10/49 (b) | | 2,327,122 | 2,389,163 |
| Greenwich Capital Commercial Funding Corp. Series 2006-GG7 Class A4, 6.0483% 7/10/38 (b) | | 288,186 | 288,895 |
| GS Mortgage Securities Corp. Trust Series 2013-C, 2.974% 1/10/30 (a) | | 290,000 | 290,660 |
| GS Mortgage Securities Trust: | | | |
| floater Series 2014-GSFL Class A, 1.4255% 7/15/31 (a)(b) | | 445,622 | 438,827 |
| sequential payer Series 2006-GG8: | | | |
| Class A1A, 5.547% 11/10/39 | | 777,588 | 786,199 |
| Class A4, 5.56% 11/10/39 | | 1,937,084 | 1,952,704 |
| Series 2013-GC12 Class A1, 0.742% 6/10/46 (b) | | 330,194 | 327,023 |
| Hilton U.S.A. Trust: | | | |
| floater Series 2013-HLF Class AFL, 1.4295% 11/5/30 (a)(b) | | 814,229 | 812,979 |
| Series 2013-HLT Class DFX, 4.4065% 11/5/30 (a) | | 270,000 | 269,155 |
| Hyatt Hotel Portfolio Trust floater Series 2015-HYT Class A, 1.6755% 11/15/29 (a)(b) | | 737,000 | 732,972 |
| JPMorgan Chase Commercial Mortgage Securities Trust: | | | |
| floater: | | | |
| Series 2014-BXH Class A, 1.3305% 4/15/27 (a)(b) | | 1,232,000 | 1,216,839 |
| Series 2014-FL5 Class A, 1.4055% 7/15/31 (a)(b) | | 867,332 | 856,428 |
| sequential payer: | | | |
| Series 2006-CB16 Class A1A, 5.546% 5/12/45 | | 1,461,079 | 1,470,919 |
| Series 2006-LDP8 Class A4, 5.399% 5/15/45 | | 884,468 | 887,218 |
| Series 2007-CB18 Class A4, 5.44% 6/12/47 | | 3,597,130 | 3,669,928 |
| Series 2007-CB19 Class A4, 5.8888% 2/12/49 (b) | | 1,941,673 | 1,996,245 |
| Series 2007-LDPX Class A3, 5.42% 1/15/49 | | 365,338 | 372,505 |
| Series 2011-C3 Class A3, 4.3877% 2/15/46 (a) | | 801,000 | 835,978 |
| Series 2006-LDP7 Class A1A, 6.1056% 4/17/45 (b) | | 1,410,628 | 1,416,649 |
| Series 2013-C13 Class A1, 1.3029% 1/15/46 | | 909,042 | 905,976 |
| LB-UBS Commercial Mortgage Trust: | | | |
| sequential payer: | | | |
| Series 2006-C6 Class A4, 5.372% 9/15/39 | | 345,687 | 348,893 |
| Series 2007-C1 Class A4, 5.424% 2/15/40 | | 1,596,157 | 1,626,695 |
| Series 2007-C7 Class A3, 5.866% 9/15/45 | | 684,748 | 721,341 |
| Lone Star Portfolio Trust floater Series 2015-LSP Class A1A2, 2.227% 9/15/28 (a)(b) | | 1,440,448 | 1,430,566 |
| Merrill Lynch Mortgage Trust Series 2006-C2 Class A1A, 5.739% 8/12/43 (b) | | 1,240,490 | 1,249,162 |
| Merrill Lynch-CFC Commercial Mortgage Trust sequential payer Series 2007-5 Class A4, 5.378% 8/12/48 | | 907,829 | 924,762 |
| Morgan Stanley Capital I Trust: | | | |
| floater: | | | |
| Series 2006-XLF Class C, 1.631% 7/15/19 (a)(b) | | 45,397 | 44,853 |
| Series 2007-XLFA: | | | |
| Class D, 0.6155% 10/15/20 (a)(b) | | 35,345 | 35,347 |
| Class E, 0.6755% 10/15/20 (a)(b) | | 105,926 | 105,932 |
| Class F, 0.7255% 10/15/20 (a)(b) | | 63,569 | 63,572 |
| Class G, 0.7655% 10/15/20 (a)(b) | | 78,581 | 78,585 |
| Class H, 0.8555% 10/15/20 (a)(b) | | 49,464 | 49,514 |
| Class J, 1.0055% 10/15/20 (a)(b) | | 28,557 | 27,649 |
| sequential payer: | | | |
| Series 2007-IQ13 Class A1A, 5.312% 3/15/44 | | 452,123 | 462,190 |
| Series 2007-IQ14 Class A2, 5.61% 4/15/49 | | 267,245 | 267,441 |
| Series 2012-C4 Class A1, 1.085% 3/15/45 | | 138,557 | 138,383 |
| Series 2006-HQ9 Class A4, 5.731% 7/12/44 (b) | | 291,973 | 291,790 |
| Series 2007-T27 Class A1A, 5.8206% 6/11/42 (b) | | 1,343,632 | 1,399,396 |
| SCG Trust Series 2013-SRP1 Class A, 1.8255% 11/15/26 (a)(b) | | 965,000 | 960,681 |
| UBS-Barclays Commercial Mortgage Trust sequential payer Series 2013-C6 Class A1, 0.8022% 4/10/46 | | 280,239 | 277,795 |
| Wachovia Bank Commercial Mortgage Trust: | | | |
| sequential payer: | | | |
| Series 2006-C29: | | | |
| Class A1A, 5.297% 11/15/48 | | 1,988,726 | 2,025,271 |
| Class A4, 5.308% 11/15/48 | | 375,084 | 379,080 |
| Series 2007-C31 Class A4, 5.509% 4/15/47 | | 250,394 | 255,196 |
| Series 2006-C26 Class A1A, 6.009% 6/15/45 (b) | | 996,919 | 998,409 |
| Series 2006-C27 Class A3, 5.765% 7/15/45 (b) | | 567,559 | 566,903 |
| WF-RBS Commercial Mortgage Trust Series 2013-C13 Class A1, 0.778% 5/15/45 | | 192,399 | 190,942 |
| TOTAL COMMERCIAL MORTGAGE SECURITIES | | | |
| (Cost $64,999,114) | | | 62,135,994 |
|
| Municipal Securities - 0.2% | | | |
| Illinois Gen. Oblig. Series 2011, 5.877% 3/1/19 | | | |
| (Cost $1,607,044) | | 1,500,000 | 1,621,365 |
|
| Supranational Obligations - 0.1% | | | |
International Bank for Reconstruction & Development 1% 6/15/18
(Cost $688,133) | | $689,000 | $688,095 |
|
| Bank Notes - 2.7% | | | |
| Bank of America NA: | | | |
| 1.25% 2/14/17 | | $2,529,000 | $2,526,939 |
| 1.75% 6/5/18 | | 1,500,000 | 1,490,535 |
| 5.3% 3/15/17 | | 250,000 | 258,473 |
| Branch Banking & Trust Co. 1.45% 10/3/16 | | 2,463,000 | 2,470,121 |
| Capital One Bank NA: | | | |
| 1.15% 11/21/16 | | 779,000 | 777,925 |
| 1.2% 2/13/17 | | 1,625,000 | 1,619,564 |
| 1.3% 6/5/17 | | 1,232,000 | 1,225,767 |
| Capital One NA: | | | |
| 1.5% 9/5/17 | | 1,000,000 | 992,123 |
| 1.65% 2/5/18 | | 1,232,000 | 1,216,224 |
| Discover Bank 3.1% 6/4/20 | | 750,000 | 745,930 |
| KeyBank NA: | | | |
| 1.65% 2/1/18 | | 735,000 | 732,733 |
| 2.5% 12/15/19 | | 777,000 | 785,674 |
| Manufacturers & Traders Trust Co.: | | | |
| 1.4% 7/25/17 | | 1,642,000 | 1,635,994 |
| 2.3% 1/30/19 | | 1,080,000 | 1,086,348 |
| Marshall & Ilsley Bank 5% 1/17/17 | | 558,000 | 572,674 |
| PNC Bank NA 1.15% 11/1/16 | | 1,281,000 | 1,280,914 |
| Regions Bank 7.5% 5/15/18 | | 250,000 | 275,560 |
| Regions Financial Corp. 2.25% 9/14/18 | | 2,070,000 | 2,061,080 |
| U.S. Bank NA 1.1% 1/30/17 | | 1,782,000 | 1,783,614 |
| TOTAL BANK NOTES | | | |
| (Cost $23,576,863) | | | 23,538,192 |
| | | Shares | Value |
|
| Money Market Funds - 2.4% | | | |
| Fidelity Cash Central Fund, 0.40% (f) | | | |
| (Cost $20,592,376) | | 20,592,376 | 20,592,376 |
| | | Maturity Amount | Value |
|
| Cash Equivalents - 8.9% | | | |
| Investments in repurchase agreements in a joint trading account at 0.4%, dated 2/29/16 due 3/1/16 (Collateralized by U.S. Government Obligations) # (g) | | 74,043,823 | 74,043,000 |
| With Mizuho Securities U.S.A., Inc. at 1.88%, dated 2/19/16 due 8/17/16 (Collateralized by Corporate Obligations valued at $4,322,482, .70% - .78%, 2/25/36 - 4/25/36) | | 4,037,600 | 4,000,000 |
| TOTAL CASH EQUIVALENTS | | | |
| (Cost $78,043,000) | | | 78,043,000 |
| TOTAL INVESTMENT PORTFOLIO - 109.7% | | | |
| (Cost $961,107,950) | | | 957,111,590 |
| NET OTHER ASSETS (LIABILITIES) - (9.7)% | | | (84,344,276) |
| NET ASSETS - 100% | | | $872,767,314 |
Swaps
| Underlying Reference | Rating(1) | Expiration Date | Clearinghouse/Counterparty | Fixed Payment Received/(Paid) | Notional Amount(2) | Value(1) | Upfront Premium Received/(Paid) | Unrealized Appreciation/(Depreciation) |
| Credit Default Swaps | | | | | | | | |
| Sell Protection | | | | | | | | |
| Morgan Stanley ABS Capital I Inc Series 2004-NC8 Class B3 | C | Oct. 2034 | Merrill Lynch International | 4.60% | USD 16,329 | $(1,265) | $0 | $(1,265) |
(1) Ratings are presented for credit default swaps in which the Fund has sold protection on the underlying referenced debt. Ratings for an underlying index represent a weighted average of the ratings of all securities included in the index. The credit rating or value can be measures of the current payment/performance risk. Ratings are from Moody's Investors Service, Inc. Where Moody's® ratings are not available, S&P® ratings are disclosed and are indicated as such. All ratings are as of the report date and do not reflect subsequent changes.
(2) The notional amount of each credit default swap where the Fund has sold protection approximates the maximum potential amount of future payments that the Portfolio could be required to make if a credit event were to occur.
Legend
(a) Security exempt from registration under Rule 144A of the Securities Act of 1933. These securities may be resold in transactions exempt from registration, normally to qualified institutional buyers. At the end of the period, the value of these securities amounted to $126,624,286 or 14.5% of net assets.
(b) Coupon rates for floating and adjustable rate securities reflect the rates in effect at period end.
(c) Security or a portion of the security is on loan at period end.
(d) Represents an investment in an underlying pool of reverse mortgages which typically do not require regular principal and interest payments as repayment is deferred until a maturity event.
(e) Security represents right to receive monthly interest payments on an underlying pool of mortgages or assets. Principal shown is the outstanding par amount of the pool as of the end of the period.
(f) Affiliated fund that is generally available only to investment companies and other accounts managed by Fidelity Investments. The rate quoted is the annualized seven-day yield of the fund at period end. A complete unaudited listing of the fund's holdings as of its most recent quarter end is available upon request. In addition, each Fidelity Central Fund's financial statements are available on the SEC's website or upon request.
(g) Includes investment made with cash collateral received from securities on loan.
Affiliated Central Funds
Information regarding fiscal year to date income earned by the Fund from investments in Fidelity Central Funds is as follows:
| Fund | Income earned |
| Fidelity Cash Central Fund | $36,928 |
Investment Valuation
The following is a summary of the inputs used, as of February 29, 2016, involving the Fund's assets and liabilities carried at fair value. The inputs or methodology used for valuing securities may not be an indication of the risk associated with investing in those securities. For more information on valuation inputs, and their aggregation into the levels used below, please refer to the Investment Valuation section in the accompanying Notes to Financial Statements.
| | Valuation Inputs at Reporting Date: |
| Description | Total | Level 1 | Level 2 | Level 3 |
| Investments in Securities: | | | | |
| Corporate Bonds | $368,798,933 | $-- | $368,798,933 | $-- |
| U.S. Government and Government Agency Obligations | 247,389,301 | -- | 247,389,301 | -- |
| U.S. Government Agency - Mortgage Securities | 22,841,961 | -- | 22,841,961 | -- |
| Asset-Backed Securities | 124,655,867 | -- | 124,366,542 | 289,325 |
| Collateralized Mortgage Obligations | 6,806,506 | -- | 6,806,506 | -- |
| Commercial Mortgage Securities | 62,135,994 | -- | 62,135,574 | 420 |
| Municipal Securities | 1,621,365 | -- | 1,621,365 | -- |
| Supranational Obligations | 688,095 | -- | 688,095 | -- |
| Bank Notes | 23,538,192 | -- | 23,538,192 | -- |
| Money Market Funds | 20,592,376 | 20,592,376 | -- | -- |
| Cash Equivalents | 78,043,000 | -- | 78,043,000 | -- |
| Total Investments in Securities: | $957,111,590 | $20,592,376 | $936,229,469 | $289,745 |
| Derivative Instruments: | | | | |
| Liabilities | | | | |
| Swaps | $(1,265) | $-- | $(1,265) | $-- |
| Total Liabilities | $(1,265) | $-- | $(1,265) | $-- |
| Total Derivative Instruments: | $(1,265) | $-- | $(1,265) | $-- |
Value of Derivative Instruments
The following table is a summary of the Fund's value of derivative instruments by primary risk exposure as of February 29, 2016. For additional information on derivative instruments, please refer to the Derivative Instruments section in the accompanying Notes to Financial Statements.
| Primary Risk Exposure / Derivative Type | Value |
| | Asset | Liability |
| Credit Risk | | |
| Swaps(a) | $0 | $(1,265) |
| Total Credit Risk | 0 | (1,265) |
| Total Value of Derivatives | $0 | $(1,265) |
(a) For bi-lateral over-the-counter (OTC) swaps, reflects gross value which is presented in the Statement of Assets and Liabilities in the bi-lateral OTC swaps, at value line-items.
Other Information
# Additional information on each counterparty to the repurchase agreement is as follows:
| Repurchase Agreement / Counterparty | Value |
| $74,043,000 due 3/01/16 at 0.40% | |
| Commerz Markets LLC | $74,043,000 |
| | $74,043,000 |
Distribution of investments by country or territory of incorporation, as a percentage of Total Net Assets, is as follows (Unaudited):
| United States of America | 86.7% |
| United Kingdom | 3.1% |
| Japan | 2.1% |
| Canada | 2.1% |
| Netherlands | 1.5% |
| Luxembourg | 1.1% |
| Others (Individually Less Than 1%) | 3.4% |
| | 100.0% |
See accompanying notes which are an integral part of the financial statements.
Financial Statements
Statement of Assets and Liabilities
| | | February 29, 2016 (Unaudited) |
| Assets | | |
Investment in securities, at value (including securities loaned of $72,660,696 and repurchase agreements of $78,043,000) — See accompanying schedule:
Unaffiliated issuers (cost $940,515,574) | $936,519,214 | |
| Fidelity Central Funds (cost $20,592,376) | 20,592,376 | |
| Total Investments (cost $961,107,950) | | $957,111,590 |
| Cash | | 900 |
| Receivable for investments sold | | 60,886 |
| Receivable for fund shares sold | | 2,067,053 |
| Interest receivable | | 2,838,304 |
| Distributions receivable from Fidelity Central Funds | | 13,421 |
| Prepaid expenses | | 1,200 |
| Other receivables | | 11 |
| Total assets | | 962,093,365 |
| Liabilities | | |
| Payable for investments purchased | $7,723,656 | |
| Payable for fund shares redeemed | 6,932,428 | |
| Distributions payable | 27,737 | |
| Bi-lateral OTC swaps, at value | 1,265 | |
| Accrued management fee | 220,325 | |
| Distribution and service plan fees payable | 110,508 | |
| Other affiliated payables | 136,913 | |
| Other payables and accrued expenses | 129,319 | |
| Collateral on securities loaned, at value | 74,043,900 | |
| Total liabilities | | 89,326,051 |
| Net Assets | | $872,767,314 |
| Net Assets consist of: | | |
| Paid in capital | | $910,983,328 |
| Undistributed net investment income | | 770,256 |
| Accumulated undistributed net realized gain (loss) on investments | | (34,988,645) |
| Net unrealized appreciation (depreciation) on investments | | (3,997,625) |
| Net Assets | | $872,767,314 |
| Calculation of Maximum Offering Price | | |
| Class A: | | |
| Net Asset Value and redemption price per share ($197,983,338 ÷ 21,248,908 shares) | | $9.32 |
| Maximum offering price per share (100/98.50 of $9.32) | | $9.46 |
| Class T: | | |
| Net Asset Value and redemption price per share ($93,634,545 ÷ 10,040,761 shares) | | $9.33 |
| Maximum offering price per share (100/98.50 of $9.33) | | $9.47 |
| Class B: | | |
| Net Asset Value and offering price per share ($1,379,465 ÷ 148,444 shares)(a) | | $9.29 |
| Class C: | | |
| Net Asset Value and offering price per share ($87,809,597 ÷ 9,471,921 shares)(a) | | $9.27 |
| Class I: | | |
| Net Asset Value, offering price and redemption price per share ($491,960,369 ÷ 52,755,221 shares) | | $9.33 |
(a) Redemption price per share is equal to net asset value less any applicable contingent deferred sales charge.
See accompanying notes which are an integral part of the financial statements.
Statement of Operations
| | | Six months ended February 29, 2016 (Unaudited) |
| Investment Income | | |
| Interest | | $7,656,175 |
| Income from Fidelity Central Funds | | 36,928 |
| Total income | | 7,693,103 |
| Expenses | | |
| Management fee | $1,265,919 | |
| Transfer agent fees | 654,321 | |
| Distribution and service plan fees | 620,499 | |
| Accounting and security lending fees | 151,488 | |
| Custodian fees and expenses | 8,618 | |
| Independent trustees' compensation | 1,726 | |
| Registration fees | 54,276 | |
| Audit | 91,482 | |
| Legal | 1,825 | |
| Miscellaneous | 38,180 | |
| Total expenses before reductions | 2,888,334 | |
| Expense reductions | (1,914) | 2,886,420 |
| Net investment income (loss) | | 4,806,683 |
| Realized and Unrealized Gain (Loss) | | |
| Net realized gain (loss) on: | | |
| Investment securities: | | |
| Unaffiliated issuers | 1,244,026 | |
| Swaps | 505 | |
| Total net realized gain (loss) | | 1,244,531 |
Change in net unrealized appreciation (depreciation) on:
Investment securities | (2,631,438) | |
| Swaps | 1,505 | |
| Total change in net unrealized appreciation (depreciation) | | (2,629,933) |
| Net gain (loss) | | (1,385,402) |
| Net increase (decrease) in net assets resulting from operations | | $3,421,281 |
See accompanying notes which are an integral part of the financial statements.
Statement of Changes in Net Assets
| | Six months ended February 29, 2016 (Unaudited) | Year ended August 31, 2015 |
| Increase (Decrease) in Net Assets | | |
| Operations | | |
| Net investment income (loss) | $4,806,683 | $7,242,950 |
| Net realized gain (loss) | 1,244,531 | 2,488,984 |
| Change in net unrealized appreciation (depreciation) | (2,629,933) | (5,315,199) |
| Net increase (decrease) in net assets resulting from operations | 3,421,281 | 4,416,735 |
| Distributions to shareholders from net investment income | (4,967,506) | (6,546,109) |
| Distributions to shareholders from net realized gain | – | (107,541) |
| Total distributions | (4,967,506) | (6,653,650) |
| Share transactions - net increase (decrease) | 68,551,911 | (168,945,549) |
| Total increase (decrease) in net assets | 67,005,686 | (171,182,464) |
| Net Assets | | |
| Beginning of period | 805,761,628 | 976,944,092 |
| End of period (including undistributed net investment income of $770,256 and undistributed net investment income of $931,079, respectively) | $872,767,314 | $805,761,628 |
See accompanying notes which are an integral part of the financial statements.
Financial Highlights — Fidelity Advisor Short Fixed-Income Fund Class A
| | Six months ended (Unaudited) | Years ended August 31, | | | | |
| | February 29, 2016 | 2015 | 2014 | 2013 | 2012 | 2011 |
| Selected Per–Share Data | | | | | | |
| Net asset value, beginning of period | $9.33 | $9.36 | $9.30 | $9.34 | $9.29 | $9.23 |
| Income from Investment Operations | | | | | | |
| Net investment income (loss)A | .055 | .073 | .070 | .070 | .090 | .134 |
| Net realized and unrealized gain (loss) | (.009) | (.037) | .052 | (.046) | .058 | .062 |
| Total from investment operations | .046 | .036 | .122 | .024 | .148 | .196 |
| Distributions from net investment income | (.056) | (.065) | (.062) | (.064) | (.098) | (.136) |
| Distributions from net realized gain | – | (.001) | – | – | – | – |
| Total distributions | (.056) | (.066) | (.062) | (.064) | (.098) | (.136) |
| Net asset value, end of period | $9.32 | $9.33 | $9.36 | $9.30 | $9.34 | $9.29 |
| Total ReturnB,C,D | .49% | .39% | 1.32% | .25% | 1.61% | 2.14% |
| Ratios to Average Net AssetsE,F | | | | | | |
| Expenses before reductions | .71%G | .70% | .70% | .70% | .70% | .70% |
| Expenses net of fee waivers, if any | .71%G | .70% | .70% | .70% | .70% | .70% |
| Expenses net of all reductions | .71%G | .70% | .70% | .70% | .69% | .70% |
| Net investment income (loss) | 1.19%G | .78% | .74% | .75% | .97% | 1.44% |
| Supplemental Data | | | | | | |
| Net assets, end of period (000 omitted) | $197,983 | $177,996 | $190,596 | $205,581 | $212,725 | $250,546 |
| Portfolio turnover rateH | 130%G | 75%I | 61% | 61% | 75% | 204% |
A Calculated based on average shares outstanding during the period.
B Total returns for periods of less than one year are not annualized.
C Total returns would have been lower if certain expenses had not been reduced during the applicable periods shown.
D Total returns do not include the effect of the sales charges.
E Fees and expenses of any underlying Fidelity Central Funds are not included in the Fund's expense ratio. The Fund indirectly bears its proportionate share of the expenses of any underlying Fidelity Central Funds.
F Expense ratios reflect operating expenses of the class. Expenses before reductions do not reflect amounts reimbursed by the investment adviser or reductions from expense offset arrangements and do not represent the amount paid by the class during periods when reimbursements or reductions occur. Expenses net of fee waivers reflect expenses after reimbursement by the investment adviser but prior to reductions from expense offset arrangements. Expenses net of all reductions represent the net expenses paid by the class.
G Annualized
H Amount does not include the portfolio activity of any underlying Fidelity Central Funds.
I Portfolio turnover rate excludes securities received or delivered in-kind.
See accompanying notes which are an integral part of the financial statements.
Financial Highlights — Fidelity Advisor Short Fixed-Income Fund Class T
| | Six months ended (Unaudited) | Years ended August 31, | | | | |
| | February 29,2016 | 2015 | 2014 | 2013 | 2012 | 2011 |
| Selected Per–Share Data | | | | | | |
| Net asset value, beginning of period | $9.34 | $9.37 | $9.31 | $9.34 | $9.29 | $9.24 |
| Income from Investment Operations | | | | | | |
| Net investment income (loss)A | .055 | .073 | .069 | .069 | .089 | .134 |
| Net realized and unrealized gain (loss) | (.010) | (.037) | .053 | (.036) | .059 | .052 |
| Total from investment operations | .045 | .036 | .122 | .033 | .148 | .186 |
| Distributions from net investment income | (.055) | (.065) | (.062) | (.063) | (.098) | (.136) |
| Distributions from net realized gain | – | (.001) | – | – | – | – |
| Total distributions | (.055) | (.066) | (.062) | (.063) | (.098) | (.136) |
| Net asset value, end of period | $9.33 | $9.34 | $9.37 | $9.31 | $9.34 | $9.29 |
| Total ReturnB,C,D | .49% | .38% | 1.31% | .36% | 1.60% | 2.03% |
| Ratios to Average Net AssetsE,F | | | | | | |
| Expenses before reductions | .72%G | .70% | .71% | .70% | .70% | .70% |
| Expenses net of fee waivers, if any | .72%G | .70% | .71% | .70% | .70% | .70% |
| Expenses net of all reductions | .72%G | .70% | .71% | .70% | .70% | .70% |
| Net investment income (loss) | 1.18%G | .77% | .74% | .74% | .96% | 1.44% |
| Supplemental Data | | | | | | |
| Net assets, end of period (000 omitted) | $93,635 | $95,409 | $103,447 | $127,404 | $140,285 | $163,217 |
| Portfolio turnover rateH | 130%G | 75%I | 61% | 61% | 75% | 204% |
A Calculated based on average shares outstanding during the period.
B Total returns for periods of less than one year are not annualized.
C Total returns would have been lower if certain expenses had not been reduced during the applicable periods shown.
D Total returns do not include the effect of the sales charges.
E Fees and expenses of any underlying Fidelity Central Funds are not included in the Fund's expense ratio. The Fund indirectly bears its proportionate share of the expenses of any underlying Fidelity Central Funds.
F Expense ratios reflect operating expenses of the class. Expenses before reductions do not reflect amounts reimbursed by the investment adviser or reductions from expense offset arrangements and do not represent the amount paid by the class during periods when reimbursements or reductions occur. Expenses net of fee waivers reflect expenses after reimbursement by the investment adviser but prior to reductions from expense offset arrangements. Expenses net of all reductions represent the net expenses paid by the class.
G Annualized
H Amount does not include the portfolio activity of any underlying Fidelity Central Funds.
I Portfolio turnover rate excludes securities received or delivered in-kind.
See accompanying notes which are an integral part of the financial statements.
Financial Highlights — Fidelity Advisor Short Fixed-Income Fund Class B
| | Six months ended (Unaudited) | Years ended August 31, | | | | |
| | February 29, 2016 | 2015 | 2014 | 2013 | 2012 | 2011 |
| Selected Per–Share Data | | | | | | |
| Net asset value, beginning of period | $9.32 | $9.35 | $9.30 | $9.35 | $9.30 | $9.24 |
| Income from Investment Operations | | | | | | |
| Net investment income (loss)A | .019 | .003 | (.007) | (.006) | .015 | .059 |
| Net realized and unrealized gain (loss) | (.022) | (.032) | .058 | (.042) | .059 | .062 |
| Total from investment operations | (.003) | (.029) | .051 | (.048) | .074 | .121 |
| Distributions from net investment income | (.027) | –B | (.001) | (.002) | (.024) | (.061) |
| Distributions from net realized gain | – | (.001) | – | – | – | – |
| Total distributions | (.027) | (.001) | (.001) | (.002) | (.024) | (.061) |
| Net asset value, end of period | $9.29 | $9.32 | $9.35 | $9.30 | $9.35 | $9.30 |
| Total ReturnC,D,E | (.03)% | (.31)% | .55% | (.51)% | .79% | 1.31% |
| Ratios to Average Net AssetsF,G | | | | | | |
| Expenses before reductions | 1.48%H | 1.45% | 1.52% | 1.51% | 1.50% | 1.52% |
| Expenses net of fee waivers, if any | 1.48%H | 1.45% | 1.52% | 1.51% | 1.50% | 1.52% |
| Expenses net of all reductions | 1.48%H | 1.45% | 1.52% | 1.51% | 1.50% | 1.52% |
| Net investment income (loss) | .42%H | .03% | (.07)% | (.06)% | .16% | .63% |
| Supplemental Data | | | | | | |
| Net assets, end of period (000 omitted) | $1,379 | $1,591 | $2,459 | $5,824 | $7,991 | $9,337 |
| Portfolio turnover rateI | 130%H | 75%J | 61% | 61% | 75% | 204% |
A Calculated based on average shares outstanding during the period.
B Amount represents less than $.0005 per share.
C Total returns for periods of less than one year are not annualized.
D Total returns would have been lower if certain expenses had not been reduced during the applicable periods shown.
E Total returns do not include the effect of the contingent deferred sales charge.
F Fees and expenses of any underlying Fidelity Central Funds are not included in the Fund's expense ratio. The Fund indirectly bears its proportionate share of the expenses of any underlying Fidelity Central Funds.
G Expense ratios reflect operating expenses of the class. Expenses before reductions do not reflect amounts reimbursed by the investment adviser or reductions from expense offset arrangements and do not represent the amount paid by the class during periods when reimbursements or reductions occur. Expenses net of fee waivers reflect expenses after reimbursement by the investment adviser but prior to reductions from expense offset arrangements. Expenses net of all reductions represent the net expenses paid by the class.
H Annualized
I Amount does not include the portfolio activity of any underlying Fidelity Central Funds.
J Portfolio turnover rate excludes securities received or delivered in-kind.
See accompanying notes which are an integral part of the financial statements.
Financial Highlights — Fidelity Advisor Short Fixed-Income Fund Class C
| | Six months ended (Unaudited) | Years ended August 31, | | | | |
| | February 29, 2016 | 2015 | 2014 | 2013 | 2012 | 2011 |
| Selected Per–Share Data | | | | | | |
| Net asset value, beginning of period | $9.30 | $9.34 | $9.29 | $9.35 | $9.30 | $9.24 |
| Income from Investment Operations | | | | | | |
| Net investment income (loss)A | .015 | (.006) | (.009) | (.009) | .012 | .056 |
| Net realized and unrealized gain (loss) | (.018) | (.033) | .060 | (.050) | .058 | .062 |
| Total from investment operations | (.003) | (.039) | .051 | (.059) | .070 | .118 |
| Distributions from net investment income | (.027) | – | (.001) | (.001) | (.020) | (.058) |
| Distributions from net realized gain | – | (.001) | – | – | – | – |
| Total distributions | (.027) | (.001) | (.001) | (.001) | (.020) | (.058) |
| Net asset value, end of period | $9.27 | $9.30 | $9.34 | $9.29 | $9.35 | $9.30 |
| Total ReturnB,C,D | (.04)% | (.42)% | .55% | (.63)% | .76% | 1.29% |
| Ratios to Average Net AssetsE,F | | | | | | |
| Expenses before reductions | 1.57%G | 1.55% | 1.54% | 1.54% | 1.54% | 1.54% |
| Expenses net of fee waivers, if any | 1.57%G | 1.55% | 1.54% | 1.54% | 1.54% | 1.54% |
| Expenses net of all reductions | 1.57%G | 1.55% | 1.54% | 1.54% | 1.54% | 1.54% |
| Net investment income (loss) | .33%G | (.07)% | (.10)% | (.10)% | .13% | .61% |
| Supplemental Data | | | | | | |
| Net assets, end of period (000 omitted) | $87,810 | $79,368 | $98,517 | $99,283 | $114,564 | $132,589 |
| Portfolio turnover rateH | 130%G | 75%I | 61% | 61% | 75% | 204% |
A Calculated based on average shares outstanding during the period.
B Total returns for periods of less than one year are not annualized.
C Total returns would have been lower if certain expenses had not been reduced during the applicable periods shown.
D Total returns do not include the effect of the contingent deferred sales charge.
E Fees and expenses of any underlying Fidelity Central Funds are not included in the Fund's expense ratio. The Fund indirectly bears its proportionate share of the expenses of any underlying Fidelity Central Funds.
F Expense ratios reflect operating expenses of the class. Expenses before reductions do not reflect amounts reimbursed by the investment adviser or reductions from expense offset arrangements and do not represent the amount paid by the class during periods when reimbursements or reductions occur. Expenses net of fee waivers reflect expenses after reimbursement by the investment adviser but prior to reductions from expense offset arrangements. Expenses net of all reductions represent the net expenses paid by the class.
G Annualized
H Amount does not include the portfolio activity of any underlying Fidelity Central Funds.
I Portfolio turnover rate excludes securities received or delivered in-kind.
See accompanying notes which are an integral part of the financial statements.
Financial Highlights — Fidelity Advisor Short Fixed-Income Fund Class I
| | Six months ended (Unaudited) | Years ended August 31, | | | | |
| | February 29, 2016 | 2015 | 2014 | 2013 | 2012 | 2011 |
| Selected Per–Share Data | | | | | | |
| Net asset value, beginning of period | $9.34 | $9.37 | $9.31 | $9.34 | $9.29 | $9.24 |
| Income from Investment Operations | | | | | | |
| Net investment income (loss)A | .062 | .089 | .087 | .087 | .106 | .150 |
| Net realized and unrealized gain (loss) | (.009) | (.037) | .053 | (.036) | .058 | .052 |
| Total from investment operations | .053 | .052 | .140 | .051 | .164 | .202 |
| Distributions from net investment income | (.063) | (.081) | (.080) | (.081) | (.114) | (.152) |
| Distributions from net realized gain | – | (.001) | – | – | – | – |
| Total distributions | (.063) | (.082) | (.080) | (.081) | (.114) | (.152) |
| Net asset value, end of period | $9.33 | $9.34 | $9.37 | $9.31 | $9.34 | $9.29 |
| Total ReturnB,C | .57% | .55% | 1.51% | .54% | 1.78% | 2.21% |
| Ratios to Average Net AssetsD,E | | | | | | |
| Expenses before reductions | .56%F | .53% | .51% | .52% | .52% | .53% |
| Expenses net of fee waivers, if any | .56%F | .53% | .51% | .52% | .52% | .53% |
| Expenses net of all reductions | .56%F | .53% | .51% | .52% | .52% | .53% |
| Net investment income (loss) | 1.34%F | .95% | .93% | .93% | 1.14% | 1.62% |
| Supplemental Data | | | | | | |
| Net assets, end of period (000 omitted) | $491,960 | $451,398 | $581,926 | $696,413 | $771,929 | $719,891 |
| Portfolio turnover rateG | 130%F | 75%H | 61% | 61% | 75% | 204% |
A Calculated based on average shares outstanding during the period.
B Total returns for periods of less than one year are not annualized.
C Total returns would have been lower if certain expenses had not been reduced during the applicable periods shown.
D Fees and expenses of any underlying Fidelity Central Funds are not included in the Fund's expense ratio. The Fund indirectly bears its proportionate share of the expenses of any underlying Fidelity Central Funds.
E Expense ratios reflect operating expenses of the class. Expenses before reductions do not reflect amounts reimbursed by the investment adviser or reductions from expense offset arrangements and do not represent the amount paid by the class during periods when reimbursements or reductions occur. Expenses net of fee waivers reflect expenses after reimbursement by the investment adviser but prior to reductions from expense offset arrangements. Expenses net of all reductions represent the net expenses paid by the class.
F Annualized
G Amount does not include the portfolio activity of any underlying Fidelity Central Funds.
H Portfolio turnover rate excludes securities received or delivered in-kind.
See accompanying notes which are an integral part of the financial statements.
Notes to Financial Statements (Unaudited)
For the period ended February 29, 2016
1. Organization.
Fidelity Advisor Short Fixed-Income Fund (the Fund) is a fund of Fidelity Advisor Series II (the Trust) and is authorized to issue an unlimited number of shares. The Trust is registered under the Investment Company Act of 1940, as amended (the 1940 Act), as an open-end management investment company organized as a Massachusetts business trust. The Fund offers Class A, Class T, Class C and Class I shares, each of which, along with Class B shares, has equal rights as to assets and voting privileges. Class B shares are closed to new accounts and additional purchases, except for exchanges and reinvestments. Each class has exclusive voting rights with respect to matters that affect that class. Class B shares will automatically convert to Class A shares after a maximum holding period of seven years from the initial date of purchase.
During the period, the Board of Trustees approved the conversion of all existing Class B shares into Class A shares, effective on or about July 1, 2016, regardless of the length of times shares have been held.
2. Investments in Fidelity Central Funds.
The Fund invests in Fidelity Central Funds, which are open-end investment companies generally available only to other investment companies and accounts managed by the investment adviser and its affiliates. The Fund's Schedule of Investments lists each of the Fidelity Central Funds held as of period end, if any, as an investment of the Fund, but does not include the underlying holdings of each Fidelity Central Fund. As an Investing Fund, the Fund indirectly bears its proportionate share of the expenses of the underlying Fidelity Central Funds.
The Money Market Central Funds seek preservation of capital and current income and are managed by Fidelity Investments Money Management, Inc. (FIMM), an affiliate of the investment adviser. Annualized expenses of the Money Market Central Funds as of their most recent shareholder report date are less than .005%.
A complete unaudited list of holdings for each Fidelity Central Fund is available upon request or at the Securities and Exchange Commission (the SEC) website at www.sec.gov. In addition, the financial statements of the Fidelity Central Funds are available on the SEC website or upon request.
3. Significant Accounting Policies.
The financial statements have been prepared in conformity with accounting principles generally accepted in the United States of America (GAAP), which require management to make certain estimates and assumptions at the date of the financial statements. Actual results could differ from those estimates. Subsequent events, if any, through the date that the financial statements were issued have been evaluated in the preparation of the financial statements. The following summarizes the significant accounting policies of the Fund:
Investment Valuation. Investments are valued as of 4:00 p.m. Eastern time on the last calendar day of the period. The Board of Trustees (the Board) has delegated the day to day responsibility for the valuation of the Fund's investments to the Fidelity Management & Research Company (FMR) Fair Value Committee (the Committee). In accordance with valuation policies and procedures approved by the Board, the Fund attempts to obtain prices from one or more third party pricing vendors or brokers to value its investments. When current market prices, quotations or currency exchange rates are not readily available or reliable, investments will be fair valued in good faith by the Committee, in accordance with procedures adopted by the Board. Factors used in determining fair value vary by investment type and may include market or investment specific events, changes in interest rates and credit quality. The frequency with which these procedures are used cannot be predicted and they may be utilized to a significant extent. The Committee oversees the Fund's valuation policies and procedures and reports to the Board on the Committee's activities and fair value determinations. The Board monitors the appropriateness of the procedures used in valuing the Fund's investments and ratifies the fair value determinations of the Committee.
The Fund categorizes the inputs to valuation techniques used to value its investments into a disclosure hierarchy consisting of three levels as shown below:
- Level 1 – quoted prices in active markets for identical investments
- Level 2 – other significant observable inputs (including quoted prices for similar investments, interest rates, prepayment speeds, etc.)
- Level 3 – unobservable inputs (including the Fund's own assumptions based on the best information available)
Valuation techniques used to value the Fund's investments by major category are as follows:
Debt securities, including restricted securities, are valued based on evaluated prices received from third party pricing vendors or from brokers who make markets in such securities. Corporate bonds, bank notes, municipal securities, supranational obligations and U.S. government and government agency obligations are valued by pricing vendors who utilize matrix pricing which considers yield or price of bonds of comparable quality, coupon, maturity and type or by broker-supplied prices. Asset backed securities, collateralized mortgage obligations, commercial mortgage securities and U.S. government agency mortgage securities are valued by pricing vendors who utilize matrix pricing which considers prepayment speed assumptions, attributes of the collateral, yield or price of bonds of comparable quality, coupon, maturity and type or by broker-supplied prices. Swaps are marked-to-market daily based on valuations from third party pricing vendors, registered derivatives clearing organizations (clearinghouses) or broker-supplied valuations. These pricing sources may utilize inputs such as interest rate curves, credit spread curves, default possibilities and recovery rates. When independent prices are unavailable or unreliable, debt securities and swaps may be valued utilizing pricing methodologies which consider similar factors that would be used by third party pricing vendors. Debt securities and swaps are generally categorized as Level 2 in the hierarchy but may be Level 3 depending on the circumstances.
Investments in open-end mutual funds, including the Fidelity Central Funds, are valued at their closing net asset value (NAV) each business day and are categorized as Level 1 in the hierarchy.
Changes in valuation techniques may result in transfers in or out of an assigned level within the disclosure hierarchy. The aggregate value of investments by input level as of February 29, 2016, is included at the end of the Fund's Schedule of Investments.
Investment Transactions and Income. For financial reporting purposes, the Fund's investment holdings and NAV include trades executed through the end of the last business day of the period. The NAV per share for processing shareholder transactions is calculated as of the close of business of the New York Stock Exchange (NYSE), normally 4:00 p.m. Eastern time and includes trades executed through the end of the prior business day. Gains and losses on securities sold are determined on the basis of identified cost and may include proceeds received from litigation. Income and capital gain distributions from Fidelity Central Funds, if any, are recorded on the ex-dividend date. Interest income is accrued as earned and includes coupon interest and amortization of premium and accretion of discount on debt securities as applicable. Debt obligations may be placed on non-accrual status and related interest income may be reduced by ceasing current accruals and writing off interest receivables when the collection of all or a portion of interest has become doubtful based on consistently applied procedures. A debt obligation is removed from non-accrual status when the issuer resumes interest payments or when collectability of interest is reasonably assured.
Class Allocations and Expenses. Investment income, realized and unrealized capital gains and losses, common expenses of the Fund, and certain fund-level expense reductions, if any, are allocated daily on a pro-rata basis to each class based on the relative net assets of each class to the total net assets of the Fund. Each class differs with respect to transfer agent and distribution and service plan fees incurred. Certain expense reductions may also differ by class. For the reporting period, the allocated portion of income and expenses to each class as a percent of its average net assets may vary due to the timing of recording these transactions in relation to fluctuating net assets of the classes. Expenses directly attributable to a fund are charged to that fund. Expenses attributable to more than one fund are allocated among the respective funds on the basis of relative net assets or other appropriate methods. Expense estimates are accrued in the period to which they relate and adjustments are made when actual amounts are known.
Income Tax Information and Distributions to Shareholders. Each year, the Fund intends to qualify as a regulated investment company under Subchapter M of the Internal Revenue Code, including distributing substantially all of its taxable income and realized gains. As a result, no provision for U.S. Federal income taxes is required. The Fund files a U.S. federal tax return, in addition to state and local tax returns as required. The Fund's federal income tax returns are subject to examination by the Internal Revenue Service (IRS) for a period of three fiscal years after they are filed. State and local tax returns may be subject to examination for an additional fiscal year depending on the jurisdiction.
Dividends are declared and recorded daily and paid monthly from net investment income. Distributions from realized gains, if any, are declared and recorded on the ex-dividend date. Income dividends and capital gain distributions are declared separately for each class. Income and capital gain distributions are determined in accordance with income tax regulations, which may differ from GAAP.
Capital accounts within the financial statements are adjusted for permanent book-tax differences. These adjustments have no impact on net assets or the results of operations. Capital accounts are not adjusted for temporary book-tax differences which will reverse in a subsequent period.
Book-tax differences are primarily due to swaps, market discount, redemptions in kind, deferred trustees compensation, capital loss carryforwards and losses deferred due to wash sales.
The federal tax cost of investment securities and unrealized appreciation (depreciation) as of period end were as follows:
| Gross unrealized appreciation | $2,856,552 |
| Gross unrealized depreciation | (6,250,299) |
| Net unrealized appreciation (depreciation) on securities | $(3,393,747) |
| Tax cost | $960,505,337 |
Capital loss carryforwards are only available to offset future capital gains of the Fund to the extent provided by regulations and may be limited. Under the Regulated Investment Company Modernization Act of 2010 (the Act), the Fund is permitted to carry forward capital losses incurred in taxable years beginning after December 22, 2010 for an unlimited period and such capital losses are required to be used prior to any losses that expire. The capital loss carryforward information presented below, including any applicable limitation, is estimated as of prior fiscal period end and is subject to adjustment.
| Fiscal year of expiration | |
| 2017 | $(19,679,244) |
| 2018 | (16,553,917) |
| Total capital loss carryforward | $(36,233,161) |
Repurchase Agreements. Pursuant to an Exemptive Order issued by the SEC, the Fund along with other registered investment companies having management contracts with FMR, or other affiliated entities of FMR, are permitted to transfer uninvested cash balances into joint trading accounts which are then invested in repurchase agreements. The Fund may also invest directly with institutions in repurchase agreements. Repurchase agreements may be collateralized by government or non-government securities. Upon settlement date, collateral is held in segregated accounts with custodian banks and may be obtained in the event of a default of the counterparty. The Fund monitors, on a daily basis, the value of the collateral to ensure it is at least equal to the principal amount of the repurchase agreement (including accrued interest). In the event of a default by the counterparty, realization of the collateral proceeds could be delayed, during which time the value of the collateral may decline.
Restricted Securities. The Fund may invest in securities that are subject to legal or contractual restrictions on resale. These securities generally may be resold in transactions exempt from registration or to the public if the securities are registered. Disposal of these securities may involve time-consuming negotiations and expense, and prompt sale at an acceptable price may be difficult. Information regarding restricted securities is included at the end of the Fund's Schedule of Investments.
4. Derivative Instruments.
Risk Exposures and the Use of Derivative Instruments. The Fund's investment objective allows the Fund to enter into various types of derivative contracts, including swaps. Derivatives are investments whose value is primarily derived from underlying assets, indices or reference rates and may be transacted on an exchange or over-the-counter (OTC). Derivatives may involve a future commitment to buy or sell a specified asset based on specified terms, to exchange future cash flows at periodic intervals based on a notional principal amount, or for one party to make one or more payments upon the occurrence of specified events in exchange for periodic payments from the other party.
The Fund used derivatives to increase returns, to gain exposure to certain types of assets and to manage exposure to certain risks as defined below. The success of any strategy involving derivatives depends on analysis of numerous economic factors, and if the strategies for investment do not work as intended, the Fund may not achieve its objectives.
The Fund's use of derivatives increased or decreased its exposure to the following risk:
| Credit Risk | Credit risk relates to the ability of the issuer of a financial instrument to make further principal or interest payments on an obligation or commitment that it has to the Fund.
|
The Fund is also exposed to additional risks from investing in derivatives, such as liquidity risk and counterparty credit risk. Liquidity risk is the risk that the Fund will be unable to close out the derivative in the open market in a timely manner. Counterparty credit risk is the risk that the counterparty will not be able to fulfill its obligation to the Fund. Derivative counterparty credit risk is managed through formal evaluation of the creditworthiness of all potential counterparties. On certain OTC derivatives such as bi-lateral swaps, the Fund attempts to reduce its exposure to counterparty credit risk by entering into an International Swaps and Derivatives Association, Inc. (ISDA) Master Agreement with each of its counterparties. The ISDA Master Agreement gives the Fund the right to terminate all transactions traded under such agreement upon the deterioration in the credit quality of the counterparty beyond specified levels. The ISDA Master Agreement gives each party the right, upon an event of default by the other party or a termination of the agreement, to close out all transactions traded under such agreement and to net amounts owed under each transaction to one net payable by one party to the other. To mitigate counterparty credit risk on bi-lateral OTC derivatives, the Fund receives collateral in the form of cash or securities once the Fund's net unrealized appreciation on outstanding derivative contracts under an ISDA Master Agreement exceeds certain applicable thresholds, subject to certain minimum transfer provisions. The collateral received is held in segregated accounts with the Fund's custodian bank in accordance with the collateral agreements entered into between the Fund, the counterparty and the Fund's custodian bank. The Fund could experience delays and costs in gaining access to the collateral even though it is held by the Fund's custodian bank. The Fund's maximum risk of loss from counterparty credit risk related to bi-lateral OTC derivatives is generally the aggregate unrealized appreciation and unpaid counterparty payments in excess of any collateral pledged by the counterparty to the Fund. The Fund may be required to pledge collateral for the benefit of the counterparties on bi-lateral OTC derivatives in an amount not less than each counterparty's unrealized appreciation on outstanding derivative contracts, subject to certain minimum transfer provisions, and any such pledged collateral is identified in the Schedule of Investments.
Investing in derivatives may involve greater risks than investing in the underlying assets directly and, to varying degrees, may involve risk of loss in excess of any initial investment and collateral received and amounts recognized in the Statement of Assets and Liabilities. In addition, there may be the risk that the change in value of the derivative contract does not correspond to the change in value of the underlying instrument.
Net Realized Gain (Loss) and Change in Net Unrealized Appreciation (Depreciation) on Derivatives. The table below, which reflects the impacts of derivatives on the financial performance of the Fund, summarizes the net realized gain (loss) and change in net unrealized appreciation (depreciation) for derivatives during the period as presented in the Statement of Operations.
| Primary Risk Exposure / Derivative Type | Net Realized Gain (Loss) | Change in Net Unrealized Appreciation (Depreciation) |
| Credit Risk | | |
| Swaps(a) | $505 | $1,505 |
(a) A summary of the value of derivatives by primary risk exposure as of period end, is included at the end of the Schedule of Investments.
Swaps. A swap is a contract between two parties to exchange future cash flows at periodic intervals based on a notional principal amount. A bi-lateral OTC swap is a transaction between a fund and a dealer counterparty where cash flows are exchanged between the two parties for the life of the swap.
Bi-lateral OTC swaps are marked-to-market daily and changes in value are reflected in the Statement of Assets and Liabilities in the bi-lateral OTC swaps at value line items. Any upfront premiums paid or received upon entering a bi-lateral OTC swap to compensate for differences between stated terms of the swap and prevailing market conditions (e.g. credit spreads, interest rates or other factors) are recorded in net unrealized appreciation (depreciation) in the Statement of Assets and Liabilities and amortized to realized gain or (loss) ratably over the term of the swap. Any unamortized upfront premiums are presented in the Schedule of Investments.
Payments are exchanged at specified intervals, accrued daily commencing with the effective date of the contract and recorded as realized gain or (loss). Some swaps may be terminated prior to the effective date and realize a gain or loss upon termination. The net realized gain (loss) and change in net unrealized appreciation (depreciation) on swaps during the period is included in the Statement of Operations.
Any open swaps at period end are included in the Schedule of Investments under the caption "Swaps" and are representative of volume of activity during the period.
Credit Default Swaps. Credit default swaps enable the Fund to buy or sell protection against specified credit events on a single-name issuer or a traded credit index. Under the terms of a credit default swap the buyer of protection (buyer) receives credit protection in exchange for making periodic payments to the seller of protection (seller) based on a fixed percentage applied to a notional principal amount. In return for these payments, the seller will be required to make a payment upon the occurrence of one or more specified credit events. The Fund enters into credit default swaps as a seller to gain credit exposure to an issuer and/or as a buyer to obtain a measure of protection against defaults of an issuer. Periodic payments are made over the life of the contract by the buyer provided that no credit event occurs.
For credit default swaps on most corporate and sovereign issuers, credit events include bankruptcy, failure to pay or repudiation/moratorium. For credit default swaps on corporate or sovereign issuers, the obligation that may be put to the seller is not limited to the specific reference obligation described in the Schedule of Investments. For credit default swaps on asset-backed securities, a credit event may be triggered by events such as failure to pay principal, maturity extension, rating downgrade or write-down. For credit default swaps on asset-backed securities, the reference obligation described represents the security that may be put to the seller. For credit default swaps on a traded credit index, a specified credit event may affect all or individual underlying securities included in the index.
As a seller, if an underlying credit event occurs, the Fund will pay a net settlement amount of cash equal to the notional amount of the swap less the recovery value of the reference obligation or underlying securities comprising an index. Only in the event of the industry's inability to value the underlying asset will the Fund be required to take delivery of the reference obligation or underlying securities comprising an index and pay an amount equal to the notional amount of the swap.
As a buyer, if an underlying credit event occurs, the Fund will receive a net settlement amount of cash equal to the notional amount of the swap less the recovery value of the reference obligation or underlying securities comprising an index. Only in the event of the industry's inability to value the underlying asset will the Fund be required to deliver the reference obligation or underlying securities comprising an index in exchange for payment of an amount equal to the notional amount of the swap.
Typically, the value of each credit default swap and credit rating disclosed for each reference obligation in the Schedule of Investments, where the Fund is the seller, can be used as measures of the current payment/performance risk of the swap. As the value of the swap changes as a positive or negative percentage of the total notional amount, the payment/performance risk may decrease or increase, respectively. In addition to these measures, the investment adviser monitors a variety of factors including cash flow assumptions, market activity and market sentiment as part of its ongoing process of assessing payment/performance risk.
5. Purchases and Sales of Investments.
Purchases and sales of securities, other than short-term securities and U.S. government securities, aggregated $92,021,474 and $90,665,836, respectively.
6. Fees and Other Transactions with Affiliates.
Management Fee. Fidelity Management & Research Company (the investment adviser) and its affiliates provide the Fund with investment management related services for which the Fund pays a monthly management fee. The management fee is the sum of an individual fund fee rate that is based on an annual rate of .20% of the Fund's average net assets and an annualized group fee rate that averaged .11% during the period. The group fee rate is based upon the average net assets of all the mutual funds advised by the investment adviser, including any mutual funds previously advised by the investment adviser that are currently advised by Fidelity SelectCo, LLC, an affiliate of the investment adviser. The group fee rate decreases as assets under management increase and increases as assets under management decrease. For the reporting period, the total annualized management fee rate was .31% of the Fund's average net assets.
Distribution and Service Plan Fees. In accordance with Rule 12b-1 of the 1940 Act, the Fund has adopted separate Distribution and Service Plans for each class of shares. Certain classes pay Fidelity Distributors Corporation (FDC), an affiliate of the investment adviser, separate Distribution and Service Fees, each of which is based on an annual percentage of each class' average net assets. In addition, FDC may pay financial intermediaries for selling shares of the Fund and providing shareholder support services. For the period, the Distribution and Service Fee rates, total fees and amounts retained by FDC were as follows:
| | Distribution
Fee | Service
Fee | Total Fees | Retained
by FDC |
| Class A | -% | .15% | $135,698 | $– |
| Class T | -% | .15% | 70,384 | 257 |
| Class B | .65% | .25% | 6,425 | 4,644 |
| Class C | .75% | .25% | 407,992 | 38,527 |
| | | | $620,499 | $43,428 |
Sales Load. FDC may receive a front-end sales charge of up to 1.50% for selling Class A and Class T shares, some of which is paid to financial intermediaries for selling shares of the Fund. Depending on the holding period, FDC may receive a contingent deferred sales charges levied on Class A, Class T, Class B and Class C redemptions. The deferred sales charges range from 3.00% to 1.00% for Class B shares, 1.00% for Class C shares, .75% or .50% for certain purchases of Class A shares and .25% for certain purchases of Class T shares.
For the period, sales charge amounts retained by FDC were as follows:
| | Retained
by FDC |
| Class A | $13,328 |
| Class T | 3,490 |
| Class B(a) | 407 |
| Class C(a) | 3,832 |
| | $21,057 |
(a) When Class B and Class C shares are initially sold, FDC pays commissions from its own resources to financial intermediaries through which the sales are made.
Transfer Agent Fees. Fidelity Investments Institutional Operations Company, Inc., (FIIOC), an affiliate of the investment adviser, is the transfer, dividend disbursing and shareholder servicing agent for each class of the Fund. FIIOC receives account fees and asset-based fees that vary according to the account size and type of account of the shareholders of the respective classes of the Fund. FIIOC pays for typesetting, printing and mailing of shareholder reports, except proxy statements.
For the period, transfer agent fees for each class were as follows:
| | Amount | % of
Class-Level Average
Net Assets(a) |
| Class A | $142,680 | .16 |
| Class T | 78,633 | .17 |
| Class B | 1,274 | .18 |
| Class C | 67,758 | .17 |
| Class I | 363,976 | .16 |
| | $654,321 | |
(a) Annualized
Accounting and Security Lending Fees. Fidelity Service Company, Inc. (FSC), an affiliate of the investment adviser, maintains the Fund's accounting records. The accounting fee is based on the level of average net assets for each month. Under a separate contract, FSC administers the security lending program. The security lending fee is based on the number and duration of lending transactions.
Interfund Trades. The Fund may purchase from or sell securities to other Fidelity Funds under procedures adopted by the Board. The procedures have been designed to ensure these interfund trades are executed in accordance with Rule 17a-7 of the 1940 Act. Interfund trades are included within the respective purchases and sales amounts shown in the Purchases and Sales of Investments note.
7. Committed Line of Credit.
The Fund participates with other funds managed by the investment adviser or an affiliate in a $4.25 billion credit facility (the "line of credit") to be utilized for temporary or emergency purposes to fund shareholder redemptions or for other short-term liquidity purposes. The Fund has agreed to pay commitment fees on its pro-rata portion of the line of credit, which amounted to $534 and is reflected in Miscellaneous expenses on the Statement of Operations. During the period, the Fund did not borrow on this line of credit.
8. Security Lending.
The Fund lends portfolio securities from time to time in order to earn additional income. On the settlement date of the loan, the Fund receives collateral (in the form of U.S. Treasury obligations, letters of credit and/or cash) against the loaned securities and maintains collateral in an amount not less than 100% of the market value of the loaned securities during the period of the loan. The market value of the loaned securities is determined at the close of business of the Fund and any additional required collateral is delivered to the Fund on the next business day. The Fund or borrower may terminate the loan at any time, and if the borrower defaults on its obligation to return the securities loaned because of insolvency or other reasons, the Fund may apply collateral received from the borrower against the obligation. The Fund may experience delays and costs in recovering the securities loaned. Any cash collateral received is maintained at the Fund's custodian and/or invested in cash equivalents. The value of loaned securities and cash collateral at period end are disclosed on the Fund's Statement of Assets and Liabilities. Security lending income represents the income earned on investing cash collateral, less rebates paid to borrowers, plus any premium payments received for lending certain types of securities. Security lending income is presented in the Statement of Operations as a component of interest income. Total security lending income during the period amounted to $24,380.
9. Expense Reductions.
Through arrangements with the Fund's custodian, credits realized as a result of certain uninvested cash balances were used to reduce the Fund's expenses. During the period, these credits reduced the Fund's custody expenses by $264.
In addition, during the period the investment adviser reimbursed and/or waived a portion of fund-level operating expenses in the amount of $1,650.
10. Distributions to Shareholders.
Distributions to shareholders of each class were as follows:
| | Six months ended February 29, 2016 | Year ended August 31, 2015 |
| From net investment income | | |
| Class A | $1,089,372 | $1,196,541 |
| Class T | 554,506 | 690,330 |
| Class B | 3,806 | 3 |
| Class C | 230,543 | – |
| Class I | 3,089,279 | 4,659,235 |
| Total | $4,967,506 | $6,546,109 |
| From net realized gain | | |
| Class A | $– | $18,431 |
| Class T | – | 10,934 |
| Class B | – | 215 |
| Class C | – | 9,861 |
| Class I | – | 68,100 |
| Total | $– | $107,541 |
11. Share Transactions.
Share transactions for each class were as follows and may contain automatic conversions between classes or exchanges between affiliated funds:
| | Shares | Shares | Dollars | Dollars |
| | Six months ended February 29, 2016 | Year ended August 31, 2015 | Six months ended February 29, 2016 | Year ended August 31, 2015 |
| Class A | | | | |
| Shares sold | 7,849,506 | 9,536,050 | $73,181,395 | $89,219,339 |
| Reinvestment of distributions | 110,687 | 121,681 | 1,030,552 | 1,138,630 |
| Shares redeemed | (5,780,451) | (10,949,529) | (53,915,300) | (102,439,584) |
| Net increase (decrease) | 2,179,742 | (1,291,798) | $20,296,647 | $(12,081,615) |
| Class T | | | | |
| Shares sold | 1,673,125 | 1,879,243 | $15,611,878 | $17,595,238 |
| Reinvestment of distributions | 55,692 | 69,901 | 518,719 | 654,822 |
| Shares redeemed | (1,900,643) | (2,777,951) | (17,734,399) | (26,009,778) |
| Net increase (decrease) | (171,826) | (828,807) | $(1,603,802) | $(7,759,718) |
| Class B | | | | |
| Shares sold | 32,684 | 42,735 | $303,556 | $399,209 |
| Reinvestment of distributions | 396 | 22 | 3,664 | 205 |
| Shares redeemed | (55,356) | (135,082) | (515,352) | (1,261,842) |
| Net increase (decrease) | (22,276) | (92,325) | $(208,132) | $(862,428) |
| Class C | | | | |
| Shares sold | 2,682,263 | 2,346,637 | $24,881,633 | $21,884,227 |
| Reinvestment of distributions | 21,373 | 928 | 197,485 | 8,636 |
| Shares redeemed | (1,767,467) | (4,360,719) | (16,407,195) | (40,704,289) |
| Net increase (decrease) | 936,169 | (2,013,154) | $8,671,923 | $(18,811,426) |
| Class I | | | | |
| Shares sold | 15,328,987 | 43,630,494 | $143,083,389 | $408,337,380 |
| Reinvestment of distributions | 308,396 | 470,860 | 2,873,079 | 4,410,891 |
| Shares redeemed | (11,199,972) | (57,895,728)(a) | (104,561,193) | (542,178,633)(a) |
| Net increase (decrease) | 4,437,411 | (13,794,374) | $41,395,275 | $(129,430,362) |
(a) Amount includes in-kind redemptions.
12. Other.
The Fund's organizational documents provide former and current trustees and officers with a limited indemnification against liabilities arising in connection with the performance of their duties to the Fund. In the normal course of business, the Fund may also enter into contracts that provide general indemnifications. The Fund's maximum exposure under these arrangements is unknown as this would be dependent on future claims that may be made against the Fund. The risk of material loss from such claims is considered remote.
13. Credit Risk.
The Fund invests a portion of its assets in structured securities of issuers backed by commercial and residential mortgage loans, credit card receivables and automotive loans. The value and related income of these securities is sensitive to changes in economic conditions, including delinquencies and/or defaults.
14. Proposed Reorganization.
The Board of Trustees of the Fund approved an Agreement and Plan of Reorganization (the Agreement) between the Fund and Short Term Bond Fund. The Agreement provides for the transfer of all the assets and the assumption of all the liabilities of the Fund in exchange for corresponding shares of Short Term Bond Fund equal in value to the net assets of the Fund on the day the reorganization is effective. The reorganization does not require shareholder approval and is expected to become effective on or about July 15, 2016. The reorganization is expected to qualify as a tax-free transaction for federal income tax purposes with no gain or loss recognized by the funds or their shareholders.
Shareholder Expense Example
As a shareholder of the Fund, you incur two types of costs: (1) transaction costs, including sales charges (loads) on purchase payments or redemption proceeds, and (2) ongoing costs, including management fees, distribution and/or service (12b-1) fees and other Fund expenses. This Example is intended to help you understand your ongoing costs (in dollars) of investing in the Fund and to compare these costs with the ongoing costs of investing in other mutual funds.
The Example is based on an investment of $1,000 invested at the beginning of the period and held for the entire period (September 1, 2015 to February 29, 2016).
Actual Expenses
The first line of the accompanying table for each class of the Fund provides information about actual account values and actual expenses. You may use the information in this line, together with the amount you invested, to estimate the expenses that you paid over the period. Simply divide your account value by $1,000.00 (for example, an $8,600 account value divided by $1,000.00 = 8.6), then multiply the result by the number in the first line for a class of the Fund under the heading entitled "Expenses Paid During Period" to estimate the expenses you paid on your account during this period. In addition, the Fund, as a shareholder in the underlying Fidelity Central Funds, will indirectly bear its pro-rata share of the fees and expenses incurred by the underlying Fidelity Central Funds. These fees and expenses are not included in the Fund's annualized expense ratio used to calculate the expense estimate in the table below.
Hypothetical Example for Comparison Purposes
The second line of the accompanying table for each class of the Fund provides information about hypothetical account values and hypothetical expenses based on a Class' actual expense ratio and an assumed rate of return of 5% per year before expenses, which is not the Class' actual return. The hypothetical account values and expenses may not be used to estimate the actual ending account balance or expenses you paid for the period. You may use this information to compare the ongoing costs of investing in the Fund and other funds. To do so, compare this 5% hypothetical example with the 5% hypothetical examples that appear in the shareholder reports of the other funds. In addition, the Fund, as a shareholder in the underlying Fidelity Central Funds, will indirectly bear its pro-rata share of the fees and expenses incurred by the underlying Fidelity Central Funds. These fees and expenses are not included in the Fund's annualized expense ratio used to calculate the expense estimate in the table below.
Please note that the expenses shown in the table are meant to highlight your ongoing costs only and do not reflect any transaction costs. Therefore, the second line of the table is useful in comparing ongoing costs only, and will not help you determine the relative total costs of owning different funds. In addition, if these transactional costs were included, your costs would have been higher.
| | Annualized Expense Ratio-A | Beginning
Account Value
September 1, 2015 | Ending
Account Value
February 29, 2016 | Expenses Paid
During Period-B
September 1, 2015
to February 29, 2016 |
| Class A | .71% | | | |
| Actual | | $1,000.00 | $1,004.90 | $3.54 |
| Hypothetical-C | | $1,000.00 | $1,021.33 | $3.57 |
| Class T | .72% | | | |
| Actual | | $1,000.00 | $1,004.90 | $3.59 |
| Hypothetical-C | | $1,000.00 | $1,021.28 | $3.62 |
| Class B | 1.48% | | | |
| Actual | | $1,000.00 | $999.70 | $7.36 |
| Hypothetical-C | | $1,000.00 | $1,017.50 | $7.42 |
| Class C | 1.57% | | | |
| Actual | | $1,000.00 | $999.60 | $7.81 |
| Hypothetical-C | | $1,000.00 | $1,017.06 | $7.87 |
| Class I | .56% | | | |
| Actual | | $1,000.00 | $1,005.70 | $2.79 |
| Hypothetical-C | | $1,000.00 | $1,022.08 | $2.82 |
A Annualized expense ratio reflects expenses net of applicable fee waivers.
B Expenses are equal to each Class' annualized expense ratio, multiplied by the average account value over the period, multiplied by 182/366 (to reflect the one-half year period).
C 5% return per year before expenses
Board Approval of Investment Advisory Contracts and Management Fees
Fidelity Advisor Short Fixed-Income Fund
Each year, the Board of Trustees, including the Independent Trustees (together, the Board), votes on the renewal of the management contract with Fidelity Management & Research Company (FMR) and the sub-advisory agreements (together, the Advisory Contracts) for the fund. The Board, assisted by the advice of fund counsel and Independent Trustees' counsel, requests and considers a broad range of information relevant to the renewal of the Advisory Contracts throughout the year.
The Board meets regularly and, at each of its meetings, covers an extensive agenda of topics and materials and considers factors that are relevant to its annual consideration of the renewal of the fund's Advisory Contracts, including the services and support provided to the fund and its shareholders. The Board has established four standing committees (Committees) — Operations, Audit, Fair Valuation, and Governance and Nominating — each composed of and chaired by Independent Trustees with varying backgrounds, to which the Board has assigned specific subject matter responsibilities in order to enhance effective decision-making by the Board. The Operations Committee, of which all of the Independent Trustees are members, meets regularly throughout the year and considers, among other matters, information specifically related to the annual consideration of the renewal of the fund's Advisory Contracts. The Board, acting directly and through its Committees, requests and receives information concerning the annual consideration of the renewal of the fund's Advisory Contracts. The Board also meets as needed to consider matters specifically related to the Board's annual consideration of the renewal of the Advisory Contracts. Members of the Board may also meet with trustees of other Fidelity funds through ad hoc joint committees to discuss certain matters relevant to all of the Fidelity funds.
At its September 2015 meeting, the Board unanimously determined to renew the fund's Advisory Contracts. In reaching its determination, the Board considered all factors it believed relevant, including (i) the nature, extent, and quality of the services to be provided to the fund and its shareholders (including the investment performance of the fund); (ii) the competitiveness of the fund's management fee and total expense ratio relative to peer funds; (iii) the total costs of the services to be provided by and the profits to be realized by Fidelity from its relationship with the fund; and (iv) the extent to which (if any) economies of scale exist and would be realized as the fund grows, and whether any economies of scale are appropriately shared with fund shareholders.
In considering whether to renew the Advisory Contracts for the fund, the Board reached a determination, with the assistance of fund counsel and Independent Trustees' counsel and through the exercise of its business judgment, that the renewal of the Advisory Contracts was in the best interests of the fund and its shareholders and that the compensation payable under the Advisory Contracts was fair and reasonable. The Board's decision to renew the Advisory Contracts was not based on any single factor, but rather was based on a comprehensive consideration of all the information provided to the Board at its meetings throughout the year. The Board, in reaching its determination to renew the Advisory Contracts, was aware that shareholders of the fund have a broad range of investment choices available to them, including a wide choice among funds offered by Fidelity's competitors, and that the fund's shareholders, who have the opportunity to review and weigh the disclosure provided by the fund in its prospectus and other public disclosures, have chosen to invest in this fund, which is part of the Fidelity family of funds.
Nature, Extent, and Quality of Services Provided. The Board considered Fidelity's staffing as it relates to the fund, including the backgrounds of investment personnel of Fidelity, and also considered the fund's investment objective, strategies, and related investment philosophy. The Independent Trustees also had discussions with senior management of Fidelity's investment operations and investment groups. The Board considered the structure of the portfolio manager compensation program and whether this structure provides appropriate incentives to act in the best interests of the fund. Additionally, the Board considered the portfolio managers' investments, if any, in the funds that they manage.
Resources Dedicated to Investment Management and Support Services. The Board reviewed the general qualifications and capabilities of Fidelity's investment staff, including its size, education, experience, and resources, as well as Fidelity's approach to recruiting, training, managing, and compensating investment personnel. The Board noted that Fidelity has continued to increase the resources devoted to non-U.S. offices, including expansion of Fidelity's global investment organization. The Board also noted that Fidelity's analysts have extensive resources, tools and capabilities that allow them to conduct sophisticated quantitative and fundamental analysis, as well as credit analysis of issuers, counterparties and guarantors. Further, the Board considered that Fidelity's investment professionals have sufficient access to global information and data so as to provide competitive investment results over time, and that those professionals also have access to sophisticated tools that permit them to assess portfolio construction and risk and performance attribution characteristics continuously, as well as to transmit new information and research conclusions rapidly around the world. Additionally, in its deliberations, the Board considered Fidelity's trading, risk management, compliance, and technology and operations capabilities and resources, which are integral parts of the investment management process.
Shareholder and Administrative Services. The Board considered (i) the nature, extent, quality, and cost of advisory, administrative, and shareholder services performed by FMR, the sub-advisers (together with FMR, the Investment Advisers), and their affiliates under the Advisory Contracts and under separate agreements covering transfer agency, pricing and bookkeeping, and securities lending services for the fund; (ii) the nature and extent of the supervision of third party service providers, principally custodians, subcustodians, and pricing vendors; and (iii) the resources devoted to, and the record of compliance with, the fund's compliance policies and procedures.
The Board noted that the growth of fund assets over time across the complex allows Fidelity to reinvest in the development of services designed to enhance the value or convenience of the Fidelity funds as investment vehicles. These services include 24-hour access to account information and market information through telephone representatives and over the Internet, investor education materials and asset allocation tools, and the expanded availability of Fidelity Investor Centers.
Investment in a Large Fund Family. The Board considered the benefits to shareholders of investing in a Fidelity fund, including the benefits of investing in a fund that is part of a large family of funds offering a variety of investment disciplines and providing a large variety of mutual fund investor services. The Board noted that Fidelity had taken, or had made recommendations that resulted in the Fidelity funds taking, a number of actions over the previous year that benefited particular funds, including (i) continuing to dedicate additional resources to investment research and to the support of the senior management team that oversees asset management; (ii) continuing efforts to enhance Fidelity's global research capabilities; (iii) launching new funds and making other enhancements to meet client needs; (iv) reducing management fees and total expenses for certain index funds and diversified international funds; (v) continuing to launch dedicated lower cost underlying funds to meet portfolio construction needs related to expanding underlying fund options for Fidelity funds of funds, specifically for the Freedom Fund product lines; (vi) rationalizing product lines and gaining increased efficiencies through fund mergers; (vii) launching active fixed-income exchange-traded funds; (viii) continuing to develop, acquire and implement systems and technology to improve services to the funds and shareholders, strengthen information security, and increase efficiency; (ix) implementing investment enhancements to further strengthen Fidelity's target date product line to increase investors' probability of success in achieving their goals; (x) modifying the eligibility criteria for certain share classes to accommodate roll-over assets from employer-sponsored retirement plans; (xi) launching a new Class W of the Freedom Index Funds to attract and retain Fidelity record-kept retirement plan assets; and (xii) implementing changes to Fidelity's money market product line in response to recent money market regulatory reforms.
Investment Performance. The Board considered whether the fund has operated in accordance with its investment objective, as well as its record of compliance with its investment restrictions and its performance history.
The Board took into account discussions with representatives of the Investment Advisers about fund investment performance that occur at Board meetings throughout the year. In this regard the Board noted that as part of regularly scheduled fund reviews and other reports to the Board on fund performance, the Board considers annualized return information for the fund for different time periods, measured against a securities market index ("benchmark index") and a peer group of funds with similar objectives ("peer group"), if any. In its evaluation of fund investment performance at meetings throughout the year, the Board gave particular attention to information indicating underperformance of certain Fidelity funds for specific time periods and discussed with the Investment Advisers the reasons for such underperformance.
In addition to reviewing absolute and relative fund performance, the Independent Trustees periodically consider the appropriateness of fund performance metrics in evaluating the results achieved. In general, the Independent Trustees believe that fund performance should be evaluated based on gross performance (before fees and expenses but after transaction costs) compared to appropriate benchmark indices, over appropriate time periods that may include full market cycles, and on net performance (after fees and expenses) compared to peer groups, as applicable, over the same periods, taking into account relevant factors including the following: general market conditions; expectations for interest rate levels and credit conditions; issuer-specific information including credit quality; the potential for incremental return versus the fund's benchmark index weighed against the risks involved in obtaining that incremental return, including the risk of diminished or negative total returns; and fund cash flows and other factors. Depending on the circumstances, the Independent Trustees may be satisfied with a fund's performance notwithstanding that it lags its benchmark index or peer group for certain periods.
The Independent Trustees recognize that shareholders evaluate performance on a net basis over their own holding periods, for which one-, three-, and five-year periods are often used as a proxy. For this reason, the performance information reviewed by the Board also included net cumulative calendar year total return information for the fund and an appropriate benchmark index and peer group for the most recent one-, three-, and five-year periods.
Based on its review, the Board concluded that the nature, extent, and quality of services provided to the fund under the Advisory Contracts should benefit the shareholders of the fund.
Competitiveness of Management Fee and Total Expense Ratio. The Board considered the fund's management fee and total expense ratio compared to "mapped groups" of competitive funds and classes created for the purpose of facilitating the Trustees' competitive analysis of management fees and total expenses. Fidelity creates "mapped groups" by combining similar Lipper investment objective categories that have comparable investment mandates. Combining Lipper investment objective categories aids the Board's management fee and total expense ratio comparisons by broadening the competitive group used for comparison.
Management Fee. The Board considered two proprietary management fee comparisons for the 12-month periods shown in basis points (BP) in the chart below. The group of Lipper funds used by the Board for management fee comparisons is referred to below as the "Total Mapped Group" and, for the reasons explained above, is broader than the Lipper peer group used by the Board for performance comparisons. The Total Mapped Group comparison focuses on a fund's standing in terms of gross management fees before expense reimbursements or caps relative to the total universe of funds with comparable investment mandates, regardless of whether their management fee structures also are comparable. Funds with comparable investment mandates offer exposure to similar types of securities. Funds with comparable management fee structures have similar management fee contractual arrangements (
e.g., flat rate charged for advisory services, all-inclusive fee rate,
etc.). "TMG %" represents the percentage of funds in the Total Mapped Group that had management fees that were lower than the fund's. For example, a hypothetical TMG % of 20% would mean that 80% of the funds in the Total Mapped Group had higher, and 20% had lower, management fees than the fund. The fund's actual TMG %s and the number of funds in the Total Mapped Group are in the chart below. The "Asset-Size Peer Group" (ASPG) comparison focuses on a fund's standing relative to a subset of non-Fidelity funds within the Total Mapped Group that are similar in size and management fee structure. For example, if a fund is in the first quartile of the ASPG, the fund's management fee ranks in the least expensive or lowest 25% of funds in the ASPG. The ASPG represents at least 15% of the funds in the Total Mapped Group with comparable asset size and management fee structures, subject to a minimum of 50 funds (or all funds in the Total Mapped Group if fewer than 50). Additional information, such as the ASPG quartile in which the fund's management fee rate ranked, is also included in the chart and considered by the Board.
Fidelity Advisor Short Fixed-Income Fund
The Board noted that the fund's management fee rate ranked below the median of its Total Mapped Group and below the median of its ASPG for 2014.
The Board noted that, in 2014, the ad hoc Committee on Group Fee was formed by it and other Fidelity fund boards to conduct an in-depth review of the "group fee" component of the management fee of funds with such management fee structures. Committee focus included the mechanics of the group fee, the competitive landscape of group fee structures, Fidelity funds with no group fee component and investment products not included in group fee assets. The Board also considered that, for funds subject to the group fee, FMR agreed to voluntarily waive fees over a specified period of time in amounts designed to account for assets converted from certain funds to certain collective investment trusts.
Based on its review, the Board concluded that the fund's management fee is fair and reasonable in light of the services that the fund receives and the other factors considered.
Total Expense Ratio. In its review of each class's total expense ratio, the Board considered the fund's management fee rate as well as other fund or class expenses, as applicable, such as transfer agent fees, pricing and bookkeeping fees, fund-paid 12b-1 fees, and custodial, legal, and audit fees. The Board also noted that Fidelity may agree to waive fees and expenses from time to time, and the extent to which, if any, it has done so for the fund. As part of its review, the Board also considered the current and historical total expense ratios of each class of the fund compared to competitive fund median expenses. Each class of the fund is compared to those funds and classes in the Total Mapped Group (used by the Board for management fee comparisons) that have a similar sales load structure.
The Board noted that the total expense ratio of each of Class A and Class T ranked below its competitive median for 2014 and the total expense ratio of each of Class B, Class C, and Class I ranked above its competitive median for 2014. The Board considered that, in general, various factors can affect total expense ratios. The Board also considered that the total expense ratio of each of Class B and Class I was above the competitive median because of high transfer agent fees due to small average account size. The Board noted that the total expense ratio of Class C was above the competitive median primarily because of higher 12b-1 fees compared to most competitor funds with Class C. The Board noted that the fund offers multiple classes, each of which has a different sales load and 12b-1 fee structure, and that the multiple structures are intended to offer a range of pricing options for the intermediary market. The Board also noted that the total expense ratios of the classes vary primarily by the level of their 12b-1 fees, although differences in transfer agent fees may also cause expenses to vary from class to class.
Fees Charged to Other Fidelity Clients. The Board also considered Fidelity fee structures and other information with respect to clients of Fidelity, such as other funds advised or subadvised by Fidelity, pension plan clients, and other institutional clients with similar mandates. The Board noted the findings of the 2013 ad hoc joint committee (created with the board of other Fidelity funds), which reviewed and compared Fidelity's institutional investment advisory business with its business of providing services to the Fidelity funds, including the differences in services provided, fees charged, and costs incurred, as well as competition in their respective marketplaces.
Based on its review of total expense ratios and fees charged to other Fidelity clients, the Board concluded that, although in some cases above the median of the universe presented for comparison, the total expense ratio of each class of the fund was reasonable in light of the services that the fund and its shareholders receive and the other factors considered.
Costs of the Services and Profitability. The Board considered the revenues earned and the expenses incurred by Fidelity in conducting the business of developing, marketing, distributing, managing, administering and servicing the fund and servicing the fund's shareholders. The Board also considered the level of Fidelity's profits in respect of all the Fidelity funds.
On an annual basis, Fidelity presents to the Board information about the profitability of its relationship with the fund. Fidelity calculates profitability information for each fund, as well as aggregate profitability information for groups of Fidelity funds and all Fidelity funds, using a series of detailed revenue and cost allocation methodologies which originate with the books and records of Fidelity on which Fidelity's audited financial statements are based. The Audit Committee of the Board reviews any significant changes from the prior year's methodologies.
PricewaterhouseCoopers LLP (PwC), independent registered public accounting firm and auditor to Fidelity and certain Fidelity funds, has been engaged annually by the Board as part of the Board's assessment of Fidelity's profitability analysis. PwC's engagement includes the review and assessment of the methodologies used by Fidelity in determining the revenues and expenses attributable to Fidelity's mutual fund business, and completion of agreed-upon procedures in respect of the mathematical accuracy of fund profitability and its conformity to established allocation methodologies. After considering PwC's reports issued under the engagement and information provided by Fidelity, the Board concluded that while other allocation methods may also be reasonable, Fidelity's profitability methodologies are reasonable in all material respects.
The Board also reviewed Fidelity's non-fund businesses and fall-out benefits related to the mutual fund business as well as cases where Fidelity's affiliates may benefit from or be related to the fund's business.
The Board considered the costs of the services provided by and the profits realized by Fidelity in connection with the operation of the fund and was satisfied that the profitability was not excessive.
Economies of Scale. The Board considered whether there have been economies of scale in respect of the management of the Fidelity funds, whether the Fidelity funds (including the fund) have appropriately benefited from any such economies of scale, and whether there is potential for realization of any further economies of scale. The Board considered the extent to which the fund will benefit from economies of scale as assets grow through increased services to the fund, through waivers or reimbursements, or through fee or expense ratio reductions. The Board also noted that in 2013, it and the boards of other Fidelity funds created an ad hoc committee (the Economies of Scale Committee) to analyze whether Fidelity attains economies of scale in respect of the management and servicing of the Fidelity funds, whether the Fidelity funds have appropriately benefited from such economies of scale, and whether there is potential for realization of any further economies of scale.
The Board recognized that the fund's management contract incorporates a "group fee" structure, which provides for lower group fee rates as total group assets increase, and for higher group fee rates as total group assets decrease (with "group assets" defined to include fund assets under FMR's management plus sector fund assets previously under FMR's management and currently managed by Fidelity SelectCo, LLC). FMR calculates the group fee rates based on a tiered asset "breakpoint" schedule that varies based on asset class. The Board considered that the group fee is designed to deliver the benefits of economies of scale to fund shareholders when total Fidelity fund assets increase, even if assets of any particular fund are unchanged or have declined, because some portion of Fidelity's costs are attributable to services provided to all Fidelity funds, and all funds benefit if those costs can be allocated among more assets. The Board concluded that, given the group fee structure, fund shareholders will benefit from lower management fees as group assets increase at the fund complex level, regardless of whether Fidelity achieves any such economies of scale.
The Board concluded, taking into account the analysis of the Economies of Scale Committee, that economies of scale, if any, are being appropriately shared between fund shareholders and Fidelity.
Additional Information Requested by the Board. In order to develop fully the factual basis for consideration of the Fidelity funds' Advisory Contracts, the Board requested and received additional information on certain topics, including: (i) Fidelity's fund profitability methodology, profitability trends for certain funds, and the impact of certain factors on fund profitability results; (ii) portfolio manager changes that have occurred during the past year and the amount of the investment that each portfolio manager has made in the Fidelity fund(s) that he or she manages; (iii) Fidelity's compensation structure for portfolio managers, research analysts, and other key personnel, including its effects on fund profitability, the rationale for the compensation structure, and the extent to which current market conditions have affected retention and recruitment; (iv) the arrangements with and compensation paid to certain fund sub-advisers on behalf of the Fidelity funds; (v) Fidelity's voluntary waiver of its fees to maintain minimum yields for certain money market funds and classes as well as contractual waivers in place for certain funds; (vi) the methodology with respect to competitive fund data and peer group classifications; (vii) Fidelity's transfer agent fee, expense, and service structures for different funds and classes relative to competitive trends, and the impact of the increased use of omnibus accounts; (viii) Fidelity's long-term expectations for its offerings in the workplace investing channel; (ix) new developments in the retail and institutional marketplaces; and (x) the impact of money market reform on Fidelity's money market funds. In addition, the Board considered its discussions with Fidelity throughout the year regarding enhanced information security initiatives and the funds' fair valuation policies.
Based on its evaluation of all of the conclusions noted above, and after considering all factors it believed relevant, the Board concluded that the advisory fee structures are fair and reasonable, and that the fund's Advisory Contracts should be renewed.
SFI-SANN-0416
1.703632.118
Fidelity® Limited Term Bond Fund
(A Class of Fidelity Advisor® Limited Term Bond Fund)
Semi-Annual Report February 29, 2016 |
|
Contents
To view a fund's proxy voting guidelines and proxy voting record for the 12-month period ended June 30, visit http://www.fidelity.com/proxyvotingresults or visit the Securities and Exchange Commission's (SEC) web site at http://www.sec.gov.
You may also call 1-800-544-8544 to request a free copy of the proxy voting guidelines.
Standard & Poor's, S&P and S&P 500 are registered service marks of The McGraw-Hill Companies, Inc. and have been licensed for use by Fidelity Distributors Corporation.
Other third-party marks appearing herein are the property of their respective owners.
All other marks appearing herein are registered or unregistered trademarks or service marks of FMR LLC or an affiliated company. © 2016 FMR LLC. All rights reserved.
This report and the financial statements contained herein are submitted for the general information of the shareholders of the Fund. This report is not authorized for distribution to prospective investors in the Fund unless preceded or accompanied by an effective prospectus.
A fund files its complete schedule of portfolio holdings with the SEC for the first and third quarters of each fiscal year on Form N-Q. Forms N-Q are available on the SEC’s web site at http://www.sec.gov. A fund's Forms N-Q may be reviewed and copied at the SEC’s Public Reference Room in Washington, DC. Information regarding the operation of the SEC's Public Reference Room may be obtained by calling 1-800-SEC-0330.
For a complete list of a fund's portfolio holdings, view the most recent holdings listing, semiannual report, or annual report on Fidelity's web site at http://www.fidelity.com, http://www.advisor.fidelity.com, or http://www.401k.com, as applicable.
NOT FDIC INSURED •MAY LOSE VALUE •NO BANK GUARANTEE
Neither the Fund nor Fidelity Distributors Corporation is a bank.
Investment Summary (Unaudited)
The information in the following tables is based on the combined investments of the Fund and its pro-rata share of the investments of Fidelity's Fixed-Income Central Funds.
Quality Diversification (% of fund's net assets)
| As of February 29, 2016 |
| | U.S. Government and U.S. Government Agency Obligations | 10.0% |
| | AAA | 14.5% |
| | AA | 3.6% |
| | A | 26.3% |
| | BBB | 38.5% |
| | BB and Below | 6.6% |
| | Not Rated | 0.3% |
| | Short-Term Investments and Net Other Assets | 0.2% |

| As of August 31, 2015 |
| | U.S. Government and U.S. Government Agency Obligations | 7.9% |
| | AAA | 16.1% |
| | AA | 4.3% |
| | A | 27.8% |
| | BBB | 37.0% |
| | BB and Below | 4.7% |
| | Not Rated | 0.1% |
| | Short-Term Investments and Net Other Assets | 2.1% |
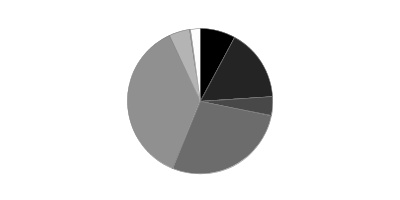
We have used ratings from Moody's Investors Service, Inc. Where Moody's® ratings are not available, we have used S&P® ratings. All ratings are as of the date indicated and do not reflect subsequent changes.
Weighted Average Maturity as of February 29, 2016
| | | 6 months ago |
| Years | 2.7 | 2.9 |
This is a weighted average of all the maturities of the securities held in a fund. Weighted Average Maturity (WAM) can be used as a measure of sensitivity to interest rate changes and market changes. Generally, the longer the maturity, the greater the sensitivity to such changes. WAM is based on the dollar-weighted average length of time until principal payments must be paid. Depending on the types of securities held in a fund, certain maturity shortening devices (e.g., demand features, interest rate resets, and call options) may be taken into account when calculating the WAM.
Duration as of February 29, 2016
| | | 6 months ago |
| Years | 2.6 | 2.7 |
Duration is a measure of a security's price sensitivity to changes in interest rates. Duration differs from maturity in that it considers a security's interest payments in addition to the amount of time until the security reaches maturity, and also takes into account certain maturity shortening features (e.g., demand features, interest rate resets, and call options) when applicable. Securities with longer durations generally tend to be more sensitive to interest rate changes than securities with shorter durations. A fund with a longer average duration generally can be expected to be more sensitive to interest rate changes than a fund with a shorter average duration.
Asset Allocation (% of fund's net assets)
| As of February 29, 2016*,** |
| | Corporate Bonds | 70.3% |
| | U.S. Government and U.S. Government Agency Obligations | 10.0% |
| | Asset-Backed Securities | 8.4% |
| | CMOs and Other Mortgage Related Securities | 7.7% |
| | Municipal Bonds | 0.8% |
| | Other Investments | 2.6% |
| | Short-Term Investments and Net Other Assets (Liabilities) | 0.2% |

* Foreign investments - 15.5%
** Futures and Swaps - 0.0%
| As of August 31, 2015*,** |
| | Corporate Bonds | 68.9% |
| | U.S. Government and U.S. Government Agency Obligations | 7.9% |
| | Asset-Backed Securities | 9.4% |
| | CMOs and Other Mortgage Related Securities | 8.5% |
| | Municipal Bonds | 0.4% |
| | Other Investments | 2.8% |
| | Short-Term Investments and Net Other Assets (Liabilities) | 2.1% |

* Foreign investments - 15.6%
** Futures and Swaps - 0.0%
An unaudited holdings listing for the Fund, which presents direct holdings as well as the pro-rata share of any securities and other investments held indirectly through its investment in underlying non-money market Fidelity Central Funds, is available at fidelity.com and/or advisor.fidelity.com, as applicable.
Percentages shown as 0.0% may reflect amounts less than 0.05%.
Investments February 29, 2016 (Unaudited)
Showing Percentage of Net Assets
| Nonconvertible Bonds - 69.7% | | | |
| | | Principal Amount | Value |
| CONSUMER DISCRETIONARY - 6.9% | | | |
| Automobiles - 2.3% | | | |
| American Honda Finance Corp.: | | | |
| 1.2% 7/14/17 | | $5,000,000 | $4,989,465 |
| 1.7% 2/22/19 | | 1,918,000 | 1,920,835 |
| 2.125% 10/10/18 | | 500,000 | 505,172 |
| Daimler Finance North America LLC: | | | |
| 1.375% 8/1/17 (a) | | 2,000,000 | 1,987,328 |
| 1.45% 8/1/16 (a) | | 1,461,000 | 1,461,260 |
| 1.65% 5/18/18 (a) | | 3,000,000 | 2,962,203 |
| 2.25% 3/2/20 (a) | | 3,020,000 | 2,975,839 |
| 2.375% 8/1/18 (a) | | 1,000,000 | 1,005,376 |
| General Motors Financial Co., Inc.: | | | |
| 2.4% 4/10/18 | | 3,000,000 | 2,947,344 |
| 3% 9/25/17 | | 3,000,000 | 3,002,646 |
| 3.15% 1/15/20 | | 5,000,000 | 4,885,795 |
| 3.2% 7/13/20 | | 5,000,000 | 4,833,350 |
| 4.2% 3/1/21 | | 3,000,000 | 3,004,503 |
| Volkswagen Group of America Finance LLC: | | | |
| 1.25% 5/23/17 (a) | | 1,000,000 | 982,470 |
| 2.4% 5/22/20 (a) | | 3,098,000 | 2,937,582 |
| Volkswagen International Finance NV: | | | |
| 1.6% 11/20/17 (a) | | 620,000 | 607,431 |
| 2.125% 11/20/18 (a) | | 1,500,000 | 1,451,678 |
| 2.375% 3/22/17 (a) | | 600,000 | 599,731 |
| | | | 43,060,008 |
| Diversified Consumer Services - 0.0% | | | |
| Ingersoll-Rand Global Holding Co. Ltd. 6.875% 8/15/18 | | 1,020,000 | 1,126,623 |
| Hotels, Restaurants & Leisure - 0.3% | | | |
| McDonald's Corp.: | | | |
| 2.1% 12/7/18 | | 742,000 | 751,582 |
| 2.2% 5/26/20 | | 5,000,000 | 5,046,465 |
| 2.75% 12/9/20 | | 345,000 | 355,023 |
| | | | 6,153,070 |
| Household Durables - 0.4% | | | |
| D.R. Horton, Inc.: | | | |
| 3.75% 3/1/19 | | 2,000,000 | 2,035,000 |
| 4% 2/15/20 | | 3,000,000 | 3,052,500 |
| Toll Brothers Finance Corp. 4% 12/31/18 | | 2,500,000 | 2,556,250 |
| | | | 7,643,750 |
| Media - 3.9% | | | |
| 21st Century Fox America, Inc. 6.9% 3/1/19 | | 750,000 | 851,442 |
| British Sky Broadcasting Group PLC 2.625% 9/16/19 (a) | | 3,000,000 | 3,011,283 |
| CBS Corp. 2.3% 8/15/19 | | 1,500,000 | 1,507,266 |
| Charter Communications Operating LLC/Charter Communications Operating Capital Corp. 3.579% 7/23/20 (a) | | 10,000,000 | 10,024,900 |
| Comcast Corp.: | | | |
| 5.7% 5/15/18 | | 42,000 | 45,824 |
| 6.3% 11/15/17 | | 6,000,000 | 6,491,640 |
| COX Communications, Inc. 6.25% 6/1/18 (a) | | 4,000,000 | 4,283,500 |
| DIRECTV Holdings LLC/DIRECTV Financing, Inc.: | | | |
| 2.4% 3/15/17 | | 2,700,000 | 2,726,544 |
| 5.875% 10/1/19 | | 5,034,000 | 5,631,294 |
| Discovery Communications LLC 5.05% 6/1/20 | | 322,000 | 337,086 |
| NBCUniversal Enterprise, Inc. 1.974% 4/15/19 (a) | | 3,000,000 | 3,018,849 |
| Thomson Reuters Corp.: | | | |
| 0.875% 5/23/16 | | 278,000 | 277,708 |
| 1.65% 9/29/17 | | 5,050,000 | 5,028,633 |
| Time Warner Cable, Inc.: | | | |
| 5.85% 5/1/17 | | 4,996,000 | 5,187,806 |
| 6.75% 7/1/18 | | 1,141,000 | 1,243,342 |
| 8.25% 4/1/19 | | 500,000 | 571,677 |
| Time Warner, Inc.: | | | |
| 2.1% 6/1/19 | | 2,000,000 | 1,982,546 |
| 6.875% 6/15/18 | | 5,095,000 | 5,642,483 |
| Viacom, Inc.: | | | |
| 2.2% 4/1/19 | | 6,000,000 | 5,887,974 |
| 3.5% 4/1/17 | | 455,000 | 459,508 |
| 6.125% 10/5/17 | | 3,179,000 | 3,337,079 |
| Walt Disney Co. 1.85% 5/30/19 | | 6,000,000 | 6,110,034 |
| | | | 73,658,418 |
|
| TOTAL CONSUMER DISCRETIONARY | | | 131,641,869 |
|
| CONSUMER STAPLES - 6.1% | | | |
| Beverages - 1.1% | | | |
| Anheuser-Busch InBev Finance, Inc.: | | | |
| 1.9% 2/1/19 | | 5,000,000 | 5,047,390 |
| 2.15% 2/1/19 | | 1,500,000 | 1,521,384 |
| 2.65% 2/1/21 | | 3,890,000 | 3,959,207 |
| 3.3% 2/1/23 | | 4,190,000 | 4,307,245 |
| Heineken NV 1.4% 10/1/17 (a) | | 321,000 | 320,893 |
| PepsiCo, Inc. 7.9% 11/1/18 | | 815,000 | 948,238 |
| SABMiller Holdings, Inc.: | | | |
| 2.2% 8/1/18 (a) | | 2,310,000 | 2,322,703 |
| 2.45% 1/15/17 (a) | | 1,280,000 | 1,290,098 |
| | | | 19,717,158 |
| Food & Staples Retailing - 1.1% | | | |
| CVS Health Corp.: | | | |
| 1.9% 7/20/18 | | 1,549,000 | 1,555,249 |
| 2.25% 12/5/18 | | 8,376,000 | 8,462,742 |
| 2.25% 8/12/19 | | 5,000,000 | 5,058,430 |
| 2.8% 7/20/20 | | 1,496,000 | 1,531,983 |
| Kroger Co. 1.1496% 10/17/16 (b) | | 5,000,000 | 5,002,120 |
| | | | 21,610,524 |
| Food Products - 1.8% | | | |
| Cargill, Inc. 6% 11/27/17 (a) | | 106,000 | 113,511 |
| ConAgra Foods, Inc. 1.9% 1/25/18 | | 2,222,000 | 2,220,116 |
| General Mills, Inc.: | | | |
| 1.4% 10/20/17 | | 3,000,000 | 3,000,747 |
| 2.2% 10/21/19 | | 2,000,000 | 2,020,428 |
| 5.7% 2/15/17 | | 5,000,000 | 5,216,580 |
| Kraft Foods Group, Inc.: | | | |
| 2.25% 6/5/17 | | 610,000 | 614,731 |
| 5.375% 2/10/20 | | 5,000,000 | 5,533,035 |
| The J.M. Smucker Co.: | | | |
| 1.75% 3/15/18 | | 5,874,000 | 5,855,291 |
| 2.5% 3/15/20 | | 1,964,000 | 1,980,482 |
| Tyson Foods, Inc. 2.65% 8/15/19 | | 7,000,000 | 7,094,591 |
| William Wrigley Jr. Co. 2% 10/20/17 (a) | | 428,000 | 429,018 |
| | | | 34,078,530 |
| Tobacco - 2.1% | | | |
| Altria Group, Inc. 2.625% 1/14/20 | | 5,000,000 | 5,093,715 |
| BAT International Finance PLC: | | | |
| 1.85% 6/15/18 (a) | | 7,000,000 | 7,028,826 |
| 2.75% 6/15/20 (a) | | 3,160,000 | 3,227,204 |
| Imperial Tobacco Finance PLC: | | | |
| 2.05% 2/11/18 (a) | | 1,906,000 | 1,904,205 |
| 2.05% 7/20/18 (a) | | 2,866,000 | 2,852,217 |
| 2.95% 7/21/20 (a) | | 3,000,000 | 3,042,849 |
| Philip Morris International, Inc.: | | | |
| 1.25% 8/11/17 | | 2,907,000 | 2,913,686 |
| 1.875% 1/15/19 | | 2,641,000 | 2,672,975 |
| 2.15% 2/25/21 | | 3,088,000 | 3,069,932 |
| Reynolds American, Inc.: | | | |
| 2.3% 6/12/18 | | 5,704,000 | 5,764,970 |
| 3.25% 6/12/20 | | 1,162,000 | 1,208,456 |
| 4% 6/12/22 | | 1,077,000 | 1,162,732 |
| 6.75% 6/15/17 | | 513,000 | 550,695 |
| | | | 40,492,462 |
|
| TOTAL CONSUMER STAPLES | | | 115,898,674 |
|
| ENERGY - 6.4% | | | |
| Energy Equipment & Services - 1.2% | | | |
| DCP Midstream LLC 5.35% 3/15/20 (a) | | 6,738,000 | 5,074,105 |
| El Paso Pipeline Partners Operating Co. LLC 6.5% 4/1/20 | | 768,000 | 775,116 |
| Halliburton Co. 2.7% 11/15/20 | | 10,247,000 | 10,100,007 |
| Nabors Industries, Inc. 2.35% 9/15/16 | | 257,000 | 254,406 |
| National Oilwell Varco, Inc. 1.35% 12/1/17 | | 620,000 | 601,065 |
| Noble Holding International Ltd.: | | | |
| 2.5% 3/15/17 | | 2,062,000 | 1,972,447 |
| 4% 3/16/18 | | 102,000 | 81,600 |
| Petrofac Ltd. 3.4% 10/10/18 (a) | | 1,000,000 | 848,196 |
| Transocean, Inc. 3% 10/15/17 (b) | | 3,500,000 | 3,150,000 |
| | | | 22,856,942 |
| Oil, Gas & Consumable Fuels - 5.2% | | | |
| Anadarko Petroleum Corp.: | | | |
| 5.95% 9/15/16 | | 45,000 | 45,258 |
| 6.375% 9/15/17 | | 555,000 | 563,897 |
| BG Energy Capital PLC 2.875% 10/15/16 (a) | | 620,000 | 623,156 |
| BP Capital Markets PLC: | | | |
| 1.375% 5/10/18 | | 5,000,000 | 4,900,130 |
| 2.248% 11/1/16 | | 620,000 | 623,230 |
| 2.521% 1/15/20 | | 4,688,000 | 4,602,936 |
| Canadian Natural Resources Ltd. 1.75% 1/15/18 | | 415,000 | 379,270 |
| Cenovus Energy, Inc. 5.7% 10/15/19 | | 297,000 | 262,092 |
| Chevron Corp. 1.961% 3/3/20 | | 4,000,000 | 3,945,772 |
| Columbia Pipeline Group, Inc.: | | | |
| 2.45% 6/1/18 (a) | | 2,107,000 | 2,021,527 |
| 3.3% 6/1/20 (a) | | 1,439,000 | 1,347,461 |
| ConocoPhillips Co.: | | | |
| 1.5% 5/15/18 | | 4,373,000 | 4,174,816 |
| 2.2% 5/15/20 | | 1,962,000 | 1,813,934 |
| DCP Midstream Operating LP: | | | |
| 2.5% 12/1/17 | | 292,000 | 266,520 |
| 2.7% 4/1/19 | | 821,000 | 673,348 |
| Devon Energy Corp. 2.25% 12/15/18 | | 3,484,000 | 3,036,045 |
| El Paso Natural Gas Co. 5.95% 4/15/17 | | 21,000 | 21,247 |
| Enable Midstream Partners LP 2.4% 5/15/19 | | 174,000 | 134,048 |
| Enbridge, Inc. 0.8662% 6/2/17 (b) | | 2,613,000 | 2,497,215 |
| Encana Corp. 6.5% 5/15/19 | | 5,000,000 | 4,106,895 |
| EnLink Midstream Partners LP 2.7% 4/1/19 | | 785,000 | 612,715 |
| Enterprise Products Operating LP: | | | |
| 1.65% 5/7/18 | | 3,631,000 | 3,508,058 |
| 2.55% 10/15/19 | | 178,000 | 172,265 |
| Exxon Mobil Corp.: | | | |
| 2.25% 3/1/21 | | 3,780,000 | 3,780,000 |
| 2.75% 3/1/23 | | 2,954,000 | 2,954,000 |
| Gulfstream Natural Gas System LLC 6.95% 6/1/16 (a) | | 20,000 | 20,233 |
| Kinder Morgan Energy Partners LP 2.65% 2/1/19 | | 1,737,000 | 1,624,635 |
| Kinder Morgan, Inc.: | | | |
| 2% 12/1/17 | | 393,000 | 375,315 |
| 3.05% 12/1/19 | | 3,758,000 | 3,469,198 |
| Marathon Petroleum Corp.: | | | |
| 2.7% 12/14/18 | | 436,000 | 422,271 |
| 3.5% 3/1/16 | | 875,000 | 875,000 |
| Petro-Canada 6.05% 5/15/18 | | 3,326,000 | 3,402,714 |
| Petrobras Global Finance BV 3.25% 3/17/17 | | 3,500,000 | 3,391,500 |
| Petrobras International Finance Co. Ltd. 5.875% 3/1/18 | | 3,000,000 | 2,814,150 |
| Petroleos Mexicanos: | | | |
| 3.125% 1/23/19 | | 77,000 | 74,866 |
| 3.5% 7/18/18 | | 5,000,000 | 4,962,500 |
| 3.5% 7/23/20 (a) | | 1,355,000 | 1,277,088 |
| 5.5% 2/4/19 (a) | | 2,000,000 | 2,068,000 |
| 6.375% 2/4/21 (a) | | 2,000,000 | 2,079,500 |
| Phillips 66 Co. 2.95% 5/1/17 | | 1,260,000 | 1,275,823 |
| Plains All American Pipeline LP/PAA Finance Corp.: | | | |
| 2.6% 12/15/19 | | 3,000,000 | 2,662,155 |
| 5.75% 1/15/20 | | 962,000 | 927,449 |
| Schlumberger Investment SA 1.25% 8/1/17 (a) | | 1,000,000 | 982,971 |
| Shell International Finance BV 2.125% 5/11/20 | | 2,287,000 | 2,227,234 |
| Southwestern Energy Co.: | | | |
| 3.3% 1/23/18 | | 2,476,000 | 1,782,720 |
| 4.05% 1/23/20 | | 864,000 | 557,280 |
| Spectra Energy Capital, LLC 5.65% 3/1/20 | | 28,000 | 27,963 |
| Spectra Energy Partners, LP 2.95% 9/25/18 | | 90,000 | 88,608 |
| Suncor Energy, Inc. 6.1% 6/1/18 | | 944,000 | 968,638 |
| Total Capital International SA 2.125% 1/10/19 | | 2,000,000 | 1,994,442 |
| TransCanada PipeLines Ltd.: | | | |
| 1.4111% 1/12/18 (b) | | 2,500,000 | 2,454,215 |
| 1.625% 11/9/17 | | 3,000,000 | 2,947,137 |
| 1.875% 1/12/18 | | 3,000,000 | 2,942,763 |
| 3.125% 1/15/19 | | 1,693,000 | 1,703,783 |
| Transcontinental Gas Pipe Line Corp. 6.4% 4/15/16 | | 394,000 | 394,288 |
| Western Gas Partners LP: | | | |
| 2.6% 8/15/18 | | 1,257,000 | 1,098,480 |
| 5.375% 6/1/21 | | 600,000 | 512,543 |
| | | | 99,471,297 |
|
| TOTAL ENERGY | | | 122,328,239 |
|
| FINANCIALS - 33.4% | | | |
| Banks - 16.2% | | | |
| ABN AMRO Bank NV 2.5% 10/30/18 (a) | | 4,000,000 | 4,036,288 |
| Australia & New Zealand Banking Group Ltd.: | | | |
| 1.45% 5/15/18 | | 570,000 | 566,226 |
| 2.25% 6/13/19 | | 2,000,000 | 2,008,374 |
| Banco Nacional de Desenvolvimento Economico e Social: | | | |
| 3.375% 9/26/16 (a) | | 520,000 | 518,700 |
| 4% 4/14/19 (a) | | 2,575,000 | 2,369,000 |
| 6.369% 6/16/18(a) | | 962,000 | 967,291 |
| Bank of America Corp.: | | | |
| 1.7% 8/25/17 | | 4,428,000 | 4,406,537 |
| 2% 1/11/18 | | 11,200,000 | 11,160,733 |
| 2.25% 4/21/20 | | 6,000,000 | 5,880,714 |
| 2.6% 1/15/19 | | 7,495,000 | 7,530,421 |
| 2.65% 4/1/19 | | 7,100,000 | 7,136,210 |
| 5.75% 12/1/17 | | 1,150,000 | 1,219,627 |
| Bank of Nova Scotia 2.8% 7/21/21 | | 2,000,000 | 2,037,454 |
| Bank of Tokyo-Mitsubishi UFJ Ltd.: | | | |
| 1.65% 2/26/18 (a) | | 590,000 | 587,812 |
| 2.3% 3/5/20 (a) | | 3,000,000 | 2,979,918 |
| 2.35% 9/8/19 (a) | | 3,050,000 | 3,070,072 |
| 2.7% 9/9/18 (a) | | 500,000 | 507,476 |
| Barclays PLC: | | | |
| 2% 3/16/18 | | 5,000,000 | 4,902,945 |
| 2.75% 11/8/19 | | 2,831,000 | 2,779,985 |
| 2.875% 6/8/20 | | 3,000,000 | 2,875,242 |
| 3.25% 1/12/21 | | 2,046,000 | 1,972,520 |
| BNP Paribas 2.375% 9/14/17 | | 6,000,000 | 6,057,180 |
| BNP Paribas SA 2.375% 5/21/20 | | 3,000,000 | 2,963,892 |
| BPCE SA: | | | |
| 1.625% 2/10/17 | | 450,000 | 449,508 |
| 2.5% 7/15/19 | | 2,000,000 | 2,012,936 |
| Capital One NA: | | | |
| 2.35% 8/17/18 | | 500,000 | 497,679 |
| 2.4% 9/5/19 | | 2,000,000 | 1,973,672 |
| CIT Group, Inc. 3.875% 2/19/19 | | 5,090,000 | 5,064,550 |
| Citigroup, Inc.: | | | |
| 0.747% 6/9/16 (b) | | 3,000,000 | 2,995,281 |
| 1.55% 8/14/17 | | 2,000,000 | 1,989,300 |
| 1.7% 4/27/18 | | 1,500,000 | 1,484,054 |
| 1.75% 5/1/18 | | 2,870,000 | 2,841,601 |
| 1.85% 11/24/17 | | 3,000,000 | 2,990,352 |
| 2.15% 7/30/18 | | 2,000,000 | 1,992,866 |
| 2.4% 2/18/20 | | 4,000,000 | 3,964,536 |
| 2.5% 9/26/18 | | 1,500,000 | 1,509,650 |
| 2.5% 7/29/19 | | 2,000,000 | 2,004,824 |
| 2.55% 4/8/19 | | 3,000,000 | 3,009,075 |
| 2.65% 10/26/20 | | 3,000,000 | 2,995,935 |
| 4.4% 6/10/25 | | 2,604,000 | 2,596,412 |
| Citizens Bank NA: | | | |
| 2.3% 12/3/18 | | 1,384,000 | 1,385,749 |
| 2.45% 12/4/19 | | 3,000,000 | 2,976,399 |
| Comerica, Inc. 2.125% 5/23/19 | | 345,000 | 339,321 |
| Commonwealth Bank of Australia: | | | |
| 2.25% 3/13/19 | | 750,000 | 755,015 |
| 2.3% 9/6/19 | | 2,000,000 | 2,013,424 |
| Cooperatieve Centrale Raiffeisen-Boerenleenbank BA 1.7% 3/19/18 | | 2,000,000 | 1,997,872 |
| Credit Agricole SA 2.75% 6/10/20 (a) | | 8,000,000 | 8,052,856 |
| Credit Suisse AG 6% 2/15/18 | | 3,680,000 | 3,896,012 |
| Credit Suisse New York Branch: | | | |
| 1.75% 1/29/18 | | 2,000,000 | 1,987,596 |
| 2.3% 5/28/19 | | 5,750,000 | 5,703,437 |
| 3% 10/29/21 | | 1,500,000 | 1,501,599 |
| Discover Bank: | | | |
| 2% 2/21/18 | | 5,920,000 | 5,848,623 |
| 2.6% 11/13/18 | | 2,000,000 | 1,997,984 |
| Fifth Third Bancorp: | | | |
| 2.3% 3/1/19 | | 279,000 | 279,360 |
| 2.875% 7/27/20 | | 3,200,000 | 3,225,056 |
| 4.5% 6/1/18 | | 3,024,000 | 3,182,355 |
| 5.45% 1/15/17 | | 291,000 | 300,530 |
| Fifth Third Bank 2.375% 4/25/19 | | 1,000,000 | 1,004,531 |
| First Horizon National Corp. 3.5% 12/15/20 | | 3,000,000 | 2,978,658 |
| HBOS PLC 6.75% 5/21/18 (a) | | 509,000 | 547,333 |
| HSBC Bank PLC 1.5% 5/15/18 (a) | | 1,570,000 | 1,560,379 |
| HSBC U.S.A., Inc.: | | | |
| 2.375% 11/13/19 | | 3,000,000 | 2,968,404 |
| 2.625% 9/24/18 | | 262,000 | 263,510 |
| Huntington Bancshares, Inc. 7% 12/15/20 | | 180,000 | 213,584 |
| Huntington National Bank 2.2% 4/1/19 | | 1,000,000 | 991,448 |
| ING Bank NV 1.8% 3/16/18 (a) | | 3,000,000 | 2,994,819 |
| Intesa Sanpaolo SpA 2.375% 1/13/17 | | 10,750,000 | 10,784,121 |
| JPMorgan Chase & Co.: | | | |
| 1.35% 2/15/17 | | 2,500,000 | 2,500,718 |
| 1.625% 5/15/18 | | 4,500,000 | 4,477,964 |
| 2% 8/15/17 | | 4,500,000 | 4,520,547 |
| 2.2% 10/22/19 | | 10,058,000 | 10,052,247 |
| 2.25% 1/23/20 | | 3,000,000 | 2,993,340 |
| 2.35% 1/28/19 | | 1,942,000 | 1,961,261 |
| 2.55% 10/29/20 | | 3,000,000 | 3,006,915 |
| 2.75% 6/23/20 | | 3,000,000 | 3,032,724 |
| KeyCorp. 2.3% 12/13/18 | | 2,000,000 | 2,000,810 |
| La Caisse Centrale 1.75% 1/29/18 (a) | | 4,000,000 | 3,971,088 |
| Lloyds Bank PLC 1.75% 3/16/18 | | 3,000,000 | 2,985,951 |
| Manufacturers & Traders Trust Co. 2.1% 2/6/20 | | 3,000,000 | 2,958,391 |
| Mitsubishi UFJ Financial Group, Inc. 2.95% 3/1/21 | | 4,000,000 | 4,035,252 |
| Mizuho Bank Ltd.: | | | |
| 1.55% 10/17/17 (a) | | 1,940,000 | 1,928,211 |
| 1.8% 3/26/18 (a) | | 1,500,000 | 1,492,547 |
| 2.45% 4/16/19 (a) | | 1,400,000 | 1,409,345 |
| 2.65% 9/25/19 (a) | | 2,000,000 | 2,027,798 |
| MUFG Americas Holdings Corp. 2.25% 2/10/20 | | 1,241,000 | 1,225,025 |
| Nordea Bank AB 2.375% 4/4/19 (a) | | 1,000,000 | 1,007,280 |
| PNC Bank NA: | | | |
| 1.5% 2/23/18 | | 2,100,000 | 2,094,303 |
| 1.8% 11/5/18 | | 2,000,000 | 1,999,910 |
| 2.4% 10/18/19 | | 3,000,000 | 3,041,841 |
| Regions Financial Corp.: | | | |
| 2% 5/15/18 | | 5,330,000 | 5,282,739 |
| 3.2% 2/8/21 | | 4,000,000 | 3,980,616 |
| Royal Bank of Canada: | | | |
| 1.5% 1/16/18 | | 2,720,000 | 2,716,176 |
| 4.65% 1/27/26 | | 2,144,000 | 2,162,595 |
| Royal Bank of Scotland Group PLC 1.5431% 3/31/17 (b) | | 8,715,000 | 8,687,260 |
| Sumitomo Mitsui Banking Corp.: | | | |
| 1.8% 7/18/17 | | 940,000 | 941,262 |
| 2.25% 7/11/19 | | 3,500,000 | 3,502,478 |
| 2.45% 1/10/19 | | 590,000 | 595,455 |
| 2.45% 1/16/20 | | 3,000,000 | 3,001,353 |
| 2.65% 7/23/20 | | 3,000,000 | 3,029,907 |
| SunTrust Banks, Inc.: | | | |
| 2.35% 11/1/18 | | 924,000 | 926,272 |
| 2.5% 5/1/19 | | 550,000 | 552,672 |
| 3% 3/3/21 | | 2,828,000 | 2,821,863 |
| 3.5% 1/20/17 | | 1,378,000 | 1,401,239 |
| Svenska Handelsbanken AB 1.625% 3/21/18 | | 2,000,000 | 1,994,100 |
| The Toronto-Dominion Bank: | | | |
| 2.25% 11/5/19 | | 2,000,000 | 2,022,318 |
| 2.625% 9/10/18 | | 1,200,000 | 1,223,944 |
| Wells Fargo & Co.: | | | |
| 1.5% 1/16/18 | | 1,300,000 | 1,297,769 |
| 2.15% 1/15/19 | | 5,500,000 | 5,538,621 |
| 2.6% 7/22/20 | | 3,000,000 | 3,034,137 |
| | | | 308,093,067 |
| Capital Markets - 4.5% | | | |
| Deutsche Bank AG London Branch: | | | |
| 1.4% 2/13/17 | | 1,000,000 | 993,530 |
| 2.5% 2/13/19 | | 2,250,000 | 2,201,945 |
| Goldman Sachs Group, Inc.: | | | |
| 1.312% 12/15/17 (b) | | 3,000,000 | 2,986,422 |
| 2.375% 1/22/18 | | 8,850,000 | 8,903,658 |
| 2.625% 1/31/19 | | 13,000,000 | 13,098,852 |
| 5.95% 1/18/18 | | 1,693,000 | 1,805,222 |
| 6.15% 4/1/18 | | 402,000 | 433,292 |
| Lazard Group LLC: | | | |
| 4.25% 11/14/20 | | 543,000 | 557,173 |
| 6.85% 6/15/17 | | 125,000 | 131,425 |
| Legg Mason, Inc. 2.7% 7/15/19 | | 2,000,000 | 2,027,170 |
| Merrill Lynch & Co., Inc.: | | | |
| 6.4% 8/28/17 | | 40,000 | 42,433 |
| 6.875% 4/25/18 | | 726,000 | 792,950 |
| Morgan Stanley: | | | |
| 1.875% 1/5/18 | | 2,000,000 | 1,995,018 |
| 2.125% 4/25/18 | | 3,580,000 | 3,578,965 |
| 2.375% 7/23/19 | | 9,660,000 | 9,638,941 |
| 2.5% 1/24/19 | | 1,750,000 | 1,759,051 |
| 2.65% 1/27/20 | | 11,000,000 | 10,983,522 |
| 4.75% 3/22/17 | | 2,000,000 | 2,065,596 |
| 4.875% 11/1/22 | | 2,000,000 | 2,108,646 |
| 5.5% 1/26/20 | | 2,000,000 | 2,197,642 |
| 5.625% 9/23/19 | | 112,000 | 122,919 |
| 5.95% 12/28/17 | | 383,000 | 408,970 |
| 7.3% 5/13/19 | | 603,000 | 689,615 |
| UBS AG Stamford Branch: | | | |
| 1.3031% 3/26/18 (b) | | 3,000,000 | 2,992,602 |
| 1.375% 6/1/17 | | 5,675,000 | 5,660,688 |
| 1.375% 8/14/17 | | 6,700,000 | 6,674,969 |
| | | | 84,851,216 |
| Consumer Finance - 4.4% | | | |
| Ally Financial, Inc.: | | | |
| 3.25% 2/13/18 | | 3,000,000 | 2,970,000 |
| 3.25% 11/5/18 | | 3,000,000 | 2,947,500 |
| American Express Co. 1.55% 5/22/18 | | 3,000,000 | 2,968,890 |
| American Express Credit Corp. 2.125% 3/18/19 | | 5,520,000 | 5,521,932 |
| American Honda Finance Corp. 1.5% 9/11/17 (a) | | 620,000 | 620,854 |
| Capital One Financial Corp. 2.45% 4/24/19 | | 5,450,000 | 5,449,995 |
| Discover Financial Services 6.45% 6/12/17 | | 3,381,000 | 3,545,655 |
| Ford Motor Credit Co. LLC: | | | |
| 1.461% 3/27/17 | | 2,000,000 | 1,986,500 |
| 1.684% 9/8/17 | | 1,000,000 | 985,346 |
| 2.145% 1/9/18 | | 2,500,000 | 2,487,068 |
| 2.24% 6/15/18 | | 6,000,000 | 5,913,252 |
| 2.597% 11/4/19 | | 5,000,000 | 4,926,150 |
| 2.875% 10/1/18 | | 2,500,000 | 2,501,283 |
| 3% 6/12/17 | | 4,500,000 | 4,537,733 |
| 3.157% 8/4/20 | | 3,000,000 | 2,987,739 |
| General Electric Capital Corp. 2.2% 1/9/20 | | 2,577,000 | 2,628,682 |
| Hyundai Capital America: | | | |
| 1.45% 2/6/17 (a) | | 632,000 | 629,895 |
| 2% 3/19/18 (a) | | 1,891,000 | 1,882,540 |
| 2.125% 10/2/17 (a) | | 2,437,000 | 2,438,972 |
| 2.55% 2/6/19 (a) | | 4,759,000 | 4,773,653 |
| 2.6% 3/19/20 (a) | | 2,000,000 | 2,001,038 |
| 2.875% 8/9/18 (a) | | 2,606,000 | 2,625,584 |
| John Deere Capital Corp. 1.6% 7/13/18 | | 590,000 | 590,660 |
| Synchrony Financial: | | | |
| 1.875% 8/15/17 | | 173,000 | 171,112 |
| 2.6% 1/15/19 | | 3,000,000 | 2,975,190 |
| 2.7% 2/3/20 | | 2,500,000 | 2,450,305 |
| 3% 8/15/19 | | 3,000,000 | 3,004,803 |
| Toyota Motor Credit Corp.: | | | |
| 1.55% 7/13/18 | | 5,000,000 | 5,000,930 |
| 2% 10/24/18 | | 2,500,000 | 2,526,355 |
| | | | 84,049,616 |
| Diversified Financial Services - 1.4% | | | |
| AIG Global Funding 1.65% 12/15/17 (a) | | 2,000,000 | 1,995,132 |
| Berkshire Hathaway Finance Corp. 1.6% 5/15/17 | | 620,000 | 624,668 |
| Brixmor Operating Partnership LP 3.875% 8/15/22 | | 1,161,000 | 1,079,701 |
| GE Capital International Funding Co. 2.342% 11/15/20 (a) | | 11,630,000 | 11,747,835 |
| IntercontinentalExchange, Inc.: | | | |
| 2.5% 10/15/18 | | 347,000 | 351,491 |
| 2.75% 12/1/20 | | 619,000 | 629,216 |
| McGraw Hill Financial, Inc. 2.5% 8/15/18 | | 1,049,000 | 1,054,303 |
| Moody's Corp. 2.75% 7/15/19 | | 8,000,000 | 8,153,616 |
| | | | 25,635,962 |
| Insurance - 3.9% | | | |
| ACE INA Holdings, Inc. 2.3% 11/3/20 | | 1,173,000 | 1,179,925 |
| AFLAC, Inc. 2.4% 3/16/20 | | 6,000,000 | 6,061,296 |
| AIA Group Ltd. 2.25% 3/11/19 (a) | | 3,529,000 | 3,531,064 |
| American International Group, Inc.: | | | |
| 2.3% 7/16/19 | | 5,304,000 | 5,260,921 |
| 3.3% 3/1/21 | | 987,000 | 997,892 |
| 4.875% 6/1/22 | | 1,484,000 | 1,583,444 |
| 5.85% 1/16/18 | | 1,910,000 | 2,036,614 |
| Aon Corp.: | | | |
| 3.125% 5/27/16 | | 2,000,000 | 2,009,400 |
| 5% 9/30/20 | | 2,178,000 | 2,402,872 |
| Aon PLC 2.8% 3/15/21 | | 7,000,000 | 7,050,967 |
| Assurant, Inc. 2.5% 3/15/18 | | 2,000,000 | 2,000,926 |
| Great-West Life & Annuity Insurance Co. 7.153% 5/16/46 (a)(b) | | 259,000 | 253,820 |
| Hartford Financial Services Group, Inc. 5.375% 3/15/17 | | 18,000 | 18,653 |
| Liberty Mutual Group, Inc. 5% 6/1/21 (a) | | 5,599,000 | 6,039,680 |
| Marsh & McLennan Companies, Inc.: | | | |
| 2.35% 9/10/19 | | 495,000 | 498,586 |
| 2.35% 3/6/20 | | 5,000,000 | 5,007,650 |
| 2.55% 10/15/18 | | 517,000 | 528,825 |
| MassMutual Global Funding II 2.35% 4/9/19 (a) | | 1,000,000 | 1,012,422 |
| MetLife, Inc.: | | | |
| 1.756% 12/15/17 (b) | | 269,000 | 269,107 |
| 1.903% 12/15/17 (b) | | 180,000 | 180,075 |
| Metropolitan Life Global Funding I: | | | |
| 1.3% 4/10/17 (a) | | 1,500,000 | 1,500,198 |
| 1.5% 1/10/18 (a) | | 4,431,000 | 4,399,890 |
| 2% 4/14/20 (a) | | 3,000,000 | 2,952,063 |
| New York Life Global Funding 1.55% 11/2/18 (a) | | 3,500,000 | 3,486,546 |
| Pacific LifeCorp 6% 2/10/20 (a) | | 1,579,000 | 1,766,724 |
| Pricoa Global Funding I: | | | |
| 1.15% 11/25/16 (a) | | 2,000,000 | 1,999,230 |
| 1.6% 5/29/18 (a) | | 967,000 | 961,402 |
| Principal Life Global Funding II 2.375% 9/11/19 (a) | | 2,200,000 | 2,212,285 |
| Prudential Financial, Inc. 3.5% 5/15/24 | | 2,550,000 | 2,499,112 |
| Symetra Financial Corp. 6.125% 4/1/16 (a) | | 892,000 | 895,440 |
| TIAA Asset Management Finance LLC 2.95% 11/1/19 (a) | | 280,000 | 281,411 |
| Unum Group: | | | |
| 5.625% 9/15/20 | | 2,743,000 | 3,003,489 |
| 7.125% 9/30/16 | | 704,000 | 725,257 |
| | | | 74,607,186 |
| Real Estate Investment Trusts - 1.5% | | | |
| Alexandria Real Estate Equities, Inc. 4.6% 4/1/22 | | 189,000 | 201,461 |
| American Campus Communities Operating Partnership LP 3.35% 10/1/20 | | 1,272,000 | 1,291,753 |
| Boston Properties, Inc.: | | | |
| 3.7% 11/15/18 | | 1,787,000 | 1,851,579 |
| 5.875% 10/15/19 | | 446,000 | 495,049 |
| DDR Corp.: | | | |
| 4.75% 4/15/18 | | 1,634,000 | 1,699,563 |
| 7.5% 4/1/17 | | 389,000 | 410,565 |
| Digital Delta Holdings LLC 3.4% 10/1/20 (a) | | 1,735,000 | 1,765,408 |
| Duke Realty LP: | | | |
| 5.95% 2/15/17 | | 354,000 | 367,509 |
| 6.75% 3/15/20 | | 35,000 | 40,124 |
| 8.25% 8/15/19 | | 7,000 | 8,297 |
| Equity One, Inc. 6% 9/15/17 | | 509,000 | 536,860 |
| ERP Operating LP: | | | |
| 2.375% 7/1/19 | | 1,641,000 | 1,648,826 |
| 3.375% 6/1/25 | | 3,000,000 | 3,052,035 |
| 5.75% 6/15/17 | | 442,000 | 463,662 |
| Federal Realty Investment Trust: | | | |
| 2.55% 1/15/21 | | 5,000,000 | 5,088,395 |
| 5.9% 4/1/20 | | 5,000 | 5,734 |
| Government Properties Income Trust 3.75% 8/15/19 | | 3,000,000 | 3,076,506 |
| Health Care Property Investors, Inc. 6% 1/30/17 | | 750,000 | 776,806 |
| Health Care REIT, Inc.: | | | |
| 2.25% 3/15/18 | | 250,000 | 249,343 |
| 4.7% 9/15/17 | | 2,436,000 | 2,536,980 |
| HRPT Properties Trust: | | | |
| 6.25% 6/15/17 | | 186,000 | 191,489 |
| 6.65% 1/15/18 | | 95,000 | 100,034 |
| Select Income REIT 2.85% 2/1/18 | | 597,000 | 595,066 |
| Simon Property Group LP 2.2% 2/1/19 | | 462,000 | 467,136 |
| United Dominion Realty Trust, Inc. 4.25% 6/1/18 | | 431,000 | 450,828 |
| | | | 27,371,008 |
| Real Estate Management & Development - 1.5% | | | |
| BioMed Realty LP 3.85% 4/15/16 | | 1,379,000 | 1,380,294 |
| Brandywine Operating Partnership LP: | | | |
| 4.95% 4/15/18 | | 51,000 | 53,290 |
| 5.7% 5/1/17 | | 369,000 | 383,280 |
| 6% 4/1/16 | | 2,124,000 | 2,131,217 |
| Essex Portfolio LP 5.5% 3/15/17 | | 2,046,000 | 2,122,643 |
| Liberty Property LP: | | | |
| 4.75% 10/1/20 | | 1,045,000 | 1,126,989 |
| 5.5% 12/15/16 | | 2,260,000 | 2,324,824 |
| 6.625% 10/1/17 | | 2,707,000 | 2,880,890 |
| Mack-Cali Realty LP: | | | |
| 2.5% 12/15/17 | | 439,000 | 434,917 |
| 4.5% 4/18/22 | | 185,000 | 180,117 |
| 7.75% 8/15/19 | | 1,298,000 | 1,424,996 |
| Prime Property Funding, Inc. 5.7% 4/15/17 (a) | | 405,000 | 417,554 |
| Reckson Operating Partnership LP 6% 3/31/16 | | 152,000 | 152,500 |
| Regency Centers LP 5.875% 6/15/17 | | 187,000 | 196,458 |
| Tanger Properties LP 6.125% 6/1/20 | | 606,000 | 689,085 |
| Ventas Realty LP: | | | |
| 1.25% 4/17/17 | | 1,882,000 | 1,866,673 |
| 1.55% 9/26/16 | | 346,000 | 346,160 |
| Ventas Realty LP/Ventas Capital Corp.: | | | |
| 2% 2/15/18 | | 1,743,000 | 1,734,079 |
| 4% 4/30/19 | | 6,000,000 | 6,266,298 |
| Washington Prime Group LP 3.85% 4/1/20 | | 2,090,000 | 2,153,477 |
| | | | 28,265,741 |
|
| TOTAL FINANCIALS | | | 632,873,796 |
|
| HEALTH CARE - 3.8% | | | |
| Biotechnology - 1.5% | | | |
| AbbVie, Inc.: | | | |
| 1.75% 11/6/17 | | 1,062,000 | 1,061,398 |
| 1.8% 5/14/18 | | 3,972,000 | 3,960,811 |
| 2.5% 5/14/20 | | 7,349,000 | 7,344,106 |
| Amgen, Inc.: | | | |
| 0.9982% 5/22/17 (b) | | 3,000,000 | 2,991,537 |
| 1.25% 5/22/17 | | 1,500,000 | 1,496,820 |
| 2.125% 5/1/20 | | 1,618,000 | 1,607,023 |
| 2.2% 5/22/19 | | 4,290,000 | 4,345,178 |
| 5.85% 6/1/17 | | 446,000 | 469,860 |
| Celgene Corp.: | | | |
| 2.125% 8/15/18 | | 1,549,000 | 1,555,995 |
| 2.875% 8/15/20 | | 3,000,000 | 3,041,232 |
| | | | 27,873,960 |
| Health Care Equipment & Supplies - 0.4% | | | |
| Becton, Dickinson & Co.: | | | |
| 1.8% 12/15/17 | | 1,486,000 | 1,487,877 |
| 2.675% 12/15/19 | | 329,000 | 335,914 |
| Medtronic, Inc.: | | | |
| 1.5% 3/15/18 | | 1,770,000 | 1,774,209 |
| 2.5% 3/15/20 | | 2,200,000 | 2,253,757 |
| Zimmer Biomet Holdings, Inc. 2% 4/1/18 | | 2,702,000 | 2,690,211 |
| | | | 8,541,968 |
| Health Care Providers & Services - 1.0% | | | |
| Cardinal Health, Inc. 1.95% 6/15/18 | | 462,000 | 462,152 |
| Coventry Health Care, Inc. 5.95% 3/15/17 | | 264,000 | 276,071 |
| Express Scripts Holding Co.: | | | |
| 1.25% 6/2/17 | | 1,500,000 | 1,492,229 |
| 2.25% 6/15/19 | | 1,000,000 | 993,543 |
| McKesson Corp. 2.284% 3/15/19 | | 686,000 | 688,483 |
| UnitedHealth Group, Inc.: | | | |
| 1.4% 10/15/17 | | 2,128,000 | 2,130,296 |
| 1.9% 7/16/18 | | 3,000,000 | 3,028,026 |
| 2.125% 3/15/21 | | 3,000,000 | 2,999,637 |
| 2.7% 7/15/20 | | 1,361,000 | 1,398,466 |
| 2.875% 12/15/21 | | 2,000,000 | 2,053,886 |
| WellPoint, Inc.: | | | |
| 1.875% 1/15/18 | | 326,000 | 325,322 |
| 2.25% 8/15/19 | | 2,950,000 | 2,932,188 |
| | | | 18,780,299 |
| Life Sciences Tools & Services - 0.2% | | | |
| Thermo Fisher Scientific, Inc.: | | | |
| 1.3% 2/1/17 | | 136,000 | 135,518 |
| 2.15% 12/14/18 | | 881,000 | 881,393 |
| 2.4% 2/1/19 | | 3,086,000 | 3,096,063 |
| | | | 4,112,974 |
| Pharmaceuticals - 0.7% | | | |
| Actavis Funding SCS: | | | |
| 1.3% 6/15/17 | | 2,400,000 | 2,387,438 |
| 2.35% 3/12/18 | | 3,000,000 | 3,018,123 |
| 2.45% 6/15/19 | | 352,000 | 353,012 |
| 3% 3/12/20 | | 1,157,000 | 1,176,914 |
| Bayer U.S. Finance LLC: | | | |
| 1.5% 10/6/17 (a) | | 1,863,000 | 1,866,385 |
| 2.375% 10/8/19 (a) | | 1,481,000 | 1,502,152 |
| Mylan, Inc. 1.35% 11/29/16 | | 160,000 | 158,895 |
| Perrigo Co. PLC 1.3% 11/8/16 | | 200,000 | 198,841 |
| Perrigo Finance PLC 3.5% 12/15/21 | | 263,000 | 260,641 |
| Watson Pharmaceuticals, Inc. 1.875% 10/1/17 | | 210,000 | 210,180 |
| Zoetis, Inc.: | | | |
| 1.875% 2/1/18 | | 1,616,000 | 1,598,592 |
| 3.45% 11/13/20 | | 493,000 | 502,205 |
| | | | 13,233,378 |
|
| TOTAL HEALTH CARE | | | 72,542,579 |
|
| INDUSTRIALS - 1.7% | | | |
| Aerospace & Defense - 0.8% | | | |
| BAE Systems Holdings, Inc. 2.85% 12/15/20 (a) | | 5,615,000 | 5,676,552 |
| L-3 Communications Corp. 1.5% 5/28/17 | | 3,685,000 | 3,635,606 |
| Lockheed Martin Corp. 2.5% 11/23/20 | | 2,361,000 | 2,402,596 |
| The Boeing Co. 1.65% 10/30/20 | | 3,000,000 | 2,963,865 |
| | | | 14,678,619 |
| Airlines - 0.0% | | | |
| Continental Airlines, Inc.: | | | |
| 6.648% 3/15/19 | | 131,410 | 133,539 |
| 6.795% 2/2/20 | | 2,618 | 2,716 |
| 6.9% 7/2/19 | | 24,663 | 25,080 |
| U.S. Airways pass-thru trust certificates: | | | |
| 6.85% 1/30/18 | | 151,811 | 155,439 |
| 8.36% 1/20/19 | | 96,657 | 99,741 |
| | | | 416,515 |
| Industrial Conglomerates - 0.7% | | | |
| Covidien International Finance SA 6% 10/15/17 | | 442,000 | 473,015 |
| Danaher Corp.: | | | |
| 1.65% 9/15/18 | | 3,976,000 | 3,999,498 |
| 2.4% 9/15/20 | | 619,000 | 632,000 |
| Roper Technologies, Inc.: | | | |
| 2.05% 10/1/18 | | 2,919,000 | 2,904,545 |
| 3% 12/15/20 | | 5,100,000 | 5,152,765 |
| | | | 13,161,823 |
| Machinery - 0.0% | | | |
| Ingersoll-Rand Luxembourg Finance SA 2.625% 5/1/20 | | 263,000 | 261,329 |
| Trading Companies & Distributors - 0.2% | | | |
| Air Lease Corp.: | | | |
| 2.125% 1/15/18 | | 414,000 | 404,168 |
| 2.625% 9/4/18 | | 1,628,000 | 1,579,689 |
| 3.75% 2/1/22 | | 1,228,000 | 1,141,008 |
| 3.875% 4/1/21 | | 500,000 | 483,750 |
| 4.75% 3/1/20 | | 605,000 | 615,588 |
| | | | 4,224,203 |
|
| TOTAL INDUSTRIALS | | | 32,742,489 |
|
| INFORMATION TECHNOLOGY - 2.1% | | | |
| Communications Equipment - 0.4% | | | |
| Cisco Systems, Inc.: | | | |
| 1.65% 6/15/18 | | 3,000,000 | 3,021,297 |
| 2.125% 3/1/19 | | 1,500,000 | 1,531,863 |
| 2.45% 6/15/20 | | 3,000,000 | 3,073,731 |
| | | | 7,626,891 |
| Electronic Equipment & Components - 0.5% | | | |
| Amphenol Corp. 1.55% 9/15/17 | | 1,426,000 | 1,422,150 |
| Tyco Electronics Group SA: | | | |
| 2.35% 8/1/19 | | 3,000,000 | 3,010,647 |
| 2.375% 12/17/18 | | 99,000 | 99,440 |
| 6.55% 10/1/17 | | 4,476,000 | 4,805,832 |
| | | | 9,338,069 |
| IT Services - 0.4% | | | |
| MasterCard, Inc. 2% 4/1/19 | | 289,000 | 293,400 |
| The Western Union Co.: | | | |
| 2.875% 12/10/17 | | 773,000 | 786,382 |
| 3.65% 8/22/18 | | 3,111,000 | 3,176,238 |
| Xerox Corp.: | | | |
| 2.75% 3/15/19 | | 2,585,000 | 2,459,338 |
| 2.95% 3/15/17 | | 1,057,000 | 1,059,252 |
| | | | 7,774,610 |
| Software - 0.4% | | | |
| Oracle Corp.: | | | |
| 2.25% 10/8/19 | | 1,552,000 | 1,590,133 |
| 2.5% 5/15/22 | | 5,000,000 | 5,028,325 |
| | | | 6,618,458 |
| Technology Hardware, Storage & Peripherals - 0.4% | | | |
| Apple, Inc. 2.85% 5/6/21 | | 850,000 | 883,223 |
| Hewlett Packard Enterprise Co.: | | | |
| 2.85% 10/5/18 (a) | | 4,000,000 | 4,001,316 |
| 3.6% 10/15/20 (a) | | 3,000,000 | 2,991,930 |
| | | | 7,876,469 |
|
| TOTAL INFORMATION TECHNOLOGY | | | 39,234,497 |
|
| MATERIALS - 1.4% | | | |
| Chemicals - 0.7% | | | |
| Albemarle Corp. U.S. 3% 12/1/19 | | 1,321,000 | 1,293,766 |
| Chevron Phillips Chemical Co. LLC / Chevron Phillips Chemical Co. LP 1.7% 5/1/18 (a) | | 5,340,000 | 5,247,266 |
| Ecolab, Inc.: | | | |
| 1.45% 12/8/17 | | 335,000 | 333,324 |
| 1.55% 1/12/18 | | 2,500,000 | 2,489,298 |
| Monsanto Co. 2.125% 7/15/19 | | 3,000,000 | 3,017,427 |
| Sherwin-Williams Co. 1.35% 12/15/17 | | 620,000 | 618,932 |
| | | | 13,000,013 |
| Metals & Mining - 0.7% | | | |
| Anglo American Capital PLC: | | | |
| 1.572% 4/15/16 (a)(b) | | 1,624,000 | 1,600,510 |
| 3.625% 5/14/20 (a) | | 1,513,000 | 1,202,835 |
| Corporacion Nacional del Cobre de Chile (Codelco) 3.875% 11/3/21 (a) | | 630,000 | 633,211 |
| Freeport-McMoRan, Inc.: | | | |
| 2.3% 11/14/17 | | 670,000 | 613,050 |
| 2.375% 3/15/18 | | 4,000,000 | 3,445,000 |
| Rio Tinto Finance (U.S.A.) PLC 1.625% 8/21/17 | | 2,440,000 | 2,390,387 |
| Teck Resources Ltd. 3% 3/1/19 | | 3,000,000 | 2,287,500 |
| Vale Overseas Ltd. 6.25% 1/23/17 | | 403,000 | 406,264 |
| | | | 12,578,757 |
|
| TOTAL MATERIALS | | | 25,578,770 |
|
| TELECOMMUNICATION SERVICES - 3.3% | | | |
| Diversified Telecommunication Services - 2.6% | | | |
| AT&T, Inc.: | | | |
| 1.4% 12/1/17 | | 1,620,000 | 1,612,166 |
| 2.375% 11/27/18 | | 10,000,000 | 10,107,600 |
| 2.45% 6/30/20 | | 1,563,000 | 1,556,843 |
| BellSouth Corp. 4.821% 4/26/16 (a)(b) | | 3,000,000 | 3,017,844 |
| British Telecommunications PLC: | | | |
| 1.25% 2/14/17 | | 1,000,000 | 998,730 |
| 1.625% 6/28/16 | | 4,314,000 | 4,321,002 |
| 2.35% 2/14/19 | | 4,296,000 | 4,336,666 |
| CenturyLink, Inc. 6.15% 9/15/19 | | 592,000 | 608,280 |
| Deutsche Telekom International Financial BV: | | | |
| 3.125% 4/11/16 (a) | | 923,000 | 924,911 |
| 5.75% 3/23/16 | | 2,000,000 | 2,005,562 |
| Verizon Communications, Inc.: | | | |
| 1.1% 11/1/17 | | 620,000 | 614,143 |
| 1.35% 6/9/17 | | 750,000 | 749,611 |
| 2% 11/1/16 | | 1,279,000 | 1,286,130 |
| 2.5% 9/15/16 | | 1,044,000 | 1,052,060 |
| 2.625% 2/21/20 | | 2,913,000 | 2,953,255 |
| 3.65% 9/14/18 | | 6,000,000 | 6,279,426 |
| 4.5% 9/15/20 | | 3,000,000 | 3,262,587 |
| 6.1% 4/15/18 | | 3,425,000 | 3,721,218 |
| | | | 49,408,034 |
| Wireless Telecommunication Services - 0.7% | | | |
| America Movil S.A.B. de CV 2.375% 9/8/16 | | 2,646,000 | 2,657,489 |
| Vodafone Group PLC: | | | |
| 1.5% 2/19/18 | | 2,625,000 | 2,600,068 |
| 1.625% 3/20/17 | | 5,400,000 | 5,421,832 |
| 5.45% 6/10/19 | | 2,000,000 | 2,191,938 |
| | | | 12,871,327 |
|
| TOTAL TELECOMMUNICATION SERVICES | | | 62,279,361 |
|
| UTILITIES - 4.6% | | | |
| Electric Utilities - 2.4% | | | |
| AmerenUE 6.4% 6/15/17 | | 519,000 | 550,381 |
| American Electric Power Co., Inc. 1.65% 12/15/17 | | 1,827,000 | 1,814,441 |
| Commonwealth Edison Co. 2.15% 1/15/19 | | 188,000 | 190,007 |
| Duke Energy Corp.: | | | |
| 0.9922% 4/3/17 (b) | | 2,894,000 | 2,872,836 |
| 1.625% 8/15/17 | | 3,304,000 | 3,301,205 |
| 2.1% 6/15/18 | | 5,395,000 | 5,406,205 |
| Duquesne Light Holdings, Inc. 6.4% 9/15/20 (a) | | 48,000 | 54,802 |
| Edison International 3.75% 9/15/17 | | 431,000 | 443,996 |
| Eversource Energy 1.45% 5/1/18 | | 153,000 | 151,174 |
| Exelon Corp.: | | | |
| 1.55% 6/9/17 | | 311,000 | 309,492 |
| 2.85% 6/15/20 | | 458,000 | 461,886 |
| FirstEnergy Corp.: | | | |
| 2.75% 3/15/18 | | 6,652,000 | 6,719,777 |
| 4.25% 3/15/23 | | 600,000 | 626,340 |
| FirstEnergy Solutions Corp. 6.05% 8/15/21 | | 655,000 | 695,750 |
| Hydro-Quebec 2% 6/30/16 | | 2,500,000 | 2,511,300 |
| IPALCO Enterprises, Inc. 3.45% 7/15/20 | | 2,576,000 | 2,566,340 |
| LG&E and KU Energy LLC 3.75% 11/15/20 | | 2,000 | 2,100 |
| Nevada Power Co.: | | | |
| 6.5% 5/15/18 | | 1,562,000 | 1,719,876 |
| 6.5% 8/1/18 | | 273,000 | 302,209 |
| NextEra Energy Capital Holdings, Inc. 1.586% 6/1/17 | | 2,904,000 | 2,899,182 |
| PacifiCorp 5.5% 1/15/19 | | 2,750,000 | 3,034,515 |
| Pennsylvania Electric Co. 6.05% 9/1/17 | | 115,000 | 122,183 |
| Public Service Electric & Gas Co. 2.3% 9/15/18 | | 2,000,000 | 2,029,604 |
| TECO Finance, Inc.: | | | |
| 1.2169% 4/10/18 (b) | | 3,000,000 | 2,957,541 |
| 5.15% 3/15/20 | | 252,000 | 274,297 |
| Xcel Energy, Inc. 1.2% 6/1/17 | | 3,153,000 | 3,141,838 |
| | | | 45,159,277 |
| Gas Utilities - 0.1% | | | |
| Texas Eastern Transmission LP 6% 9/15/17 (a) | | 1,096,000 | 1,150,942 |
| Independent Power and Renewable Electricity Producers - 0.2% | | | |
| Southern Power Co.: | | | |
| 1.85% 12/1/17 | | 704,000 | 704,132 |
| 2.375% 6/1/20 | | 1,087,000 | 1,068,419 |
| TransAlta Corp. 1.9% 6/3/17 | | 2,900,000 | 2,721,676 |
| | | | 4,494,227 |
| Multi-Utilities - 1.9% | | | |
| Ameren Illinois Co. 6.125% 11/15/17 | | 62,000 | 66,639 |
| Berkshire Hathaway Energy Co.: | | | |
| 1.1% 5/15/17 | | 1,000,000 | 997,097 |
| 2% 11/15/18 | | 544,000 | 544,917 |
| Dominion Resources, Inc.: | | | |
| 1.4% 9/15/17 | | 3,225,000 | 3,204,118 |
| 1.9% 6/15/18 | | 2,540,000 | 2,526,756 |
| 2.5% 12/1/19 | | 7,382,000 | 7,438,081 |
| 2.9031% 9/30/66 (b) | | 651,000 | 437,505 |
| 7.5% 6/30/66 (b) | | 567,000 | 474,863 |
| NiSource Finance Corp.: | | | |
| 3.85% 2/15/23 | | 700,000 | 729,931 |
| 5.45% 9/15/20 | | 43,000 | 47,595 |
| 6.4% 3/15/18 | | 888,000 | 963,072 |
| NSTAR 4.5% 11/15/19 | | 2,500,000 | 2,699,093 |
| PG&E Corp. 2.4% 3/1/19 | | 74,000 | 74,746 |
| Puget Energy, Inc. 6.5% 12/15/20 | | 991,000 | 1,156,255 |
| Sempra Energy: | | | |
| 2.3% 4/1/17 | | 4,935,000 | 4,967,127 |
| 2.4% 3/15/20 | | 1,890,000 | 1,854,825 |
| 2.85% 11/15/20 | | 1,392,000 | 1,397,163 |
| Wisconsin Energy Corp.: | | | |
| 1.65% 6/15/18 | | 3,006,000 | 3,000,481 |
| 2.45% 6/15/20 | | 2,901,000 | 2,937,341 |
| 6.25% 5/15/67 (b) | | 454,000 | 335,960 |
| | | | 35,853,565 |
|
| TOTAL UTILITIES | | | 86,658,011 |
|
| TOTAL NONCONVERTIBLE BONDS | | | |
| (Cost $1,330,486,155) | | | 1,321,778,285 |
|
| U.S. Treasury Obligations - 7.8% | | | |
| U.S. Treasury Notes: | | | |
| 0.75% 2/15/19 | | $64,146,000 | $63,847,822 |
| 0.875% 10/15/17 | | 10,230,000 | 10,243,186 |
| 1% 5/15/18 | | 12,459,000 | 12,504,264 |
| 1.125% 1/15/19 | | 11,574,000 | 11,646,789 |
| 1.375% 3/31/20 (c) | | 9,683,000 | 9,768,859 |
| 1.375% 1/31/21 | | 30,000,000 | 30,199,230 |
| 1.75% 12/31/20 | | 10,000,000 | 10,242,190 |
| TOTAL U.S. TREASURY OBLIGATIONS | | | |
| (Cost $148,247,181) | | | 148,452,340 |
|
| U.S. Government Agency - Mortgage Securities - 0.7% | | | |
| Fannie Mae - 0.5% | | | |
| 2.45% 11/1/36 (b) | | 149,520 | 157,298 |
| 2.468% 1/1/40 (b) | | 159,432 | 167,747 |
| 2.471% 3/1/40 (b) | | 117,232 | 123,895 |
| 2.489% 12/1/33 (b) | | 622,566 | 656,878 |
| 2.51% 7/1/35 (b) | | 76,754 | 81,056 |
| 2.557% 3/1/40 (b) | | 83,774 | 88,367 |
| 2.557% 6/1/42 (b) | | 51,722 | 53,279 |
| 2.595% 4/1/35 (b) | | 371,174 | 390,798 |
| 2.685% 12/1/39 (b) | | 46,132 | 48,780 |
| 2.689% 2/1/42 (b) | | 533,419 | 554,586 |
| 2.761% 1/1/42 (b) | | 443,205 | 461,244 |
| 2.951% 11/1/40 (b) | | 30,288 | 31,444 |
| 2.98% 9/1/41 (b) | | 36,605 | 38,279 |
| 2.991% 10/1/41 (b) | | 19,908 | 20,792 |
| 3.249% 7/1/41 (b) | | 53,942 | 56,357 |
| 3.347% 10/1/41 (b) | | 28,170 | 29,577 |
| 3.5% 7/1/26 to 10/1/29 | | 3,925,938 | 4,184,901 |
| 3.553% 7/1/41 (b) | | 66,657 | 70,095 |
| 4.5% 3/1/35 | | 35,980 | 39,312 |
| 6% 5/1/16 to 4/1/17 | | 4,292 | 4,324 |
| 6.5% 5/1/16 to 8/1/36 | | 492,494 | 576,010 |
| 7% 9/1/18 to 6/1/33 | | 296,771 | 352,410 |
| 7.5% 8/1/17 to 3/1/28 | | 98,062 | 115,527 |
| 8.5% 5/1/21 to 9/1/25 | | 7,611 | 8,878 |
| 9.5% 2/1/25 | | 515 | 559 |
| 10.5% 8/1/20 | | 4,847 | 5,256 |
|
| TOTAL FANNIE MAE | | | 8,317,649 |
|
| Freddie Mac - 0.2% | | | |
| 2.413% 4/1/40 (b) | | 90,242 | 95,134 |
| 2.53% 4/1/40 (b) | | 83,409 | 88,053 |
| 2.535% 2/1/40 (b) | | 134,267 | 141,670 |
| 3.208% 9/1/41 (b) | | 35,210 | 36,795 |
| 3.216% 4/1/41 (b) | | 40,299 | 42,125 |
| 3.297% 6/1/41(b) | | 45,031 | 47,062 |
| 3.451% 5/1/41 (b) | | 30,676 | 31,918 |
| 3.5% 8/1/26 | | 2,892,634 | 3,073,423 |
| 3.626% 6/1/41 (b) | | 65,362 | 68,520 |
| 3.706% 5/1/41 (b) | | 47,749 | 50,127 |
| 4.5% 8/1/18 | | 165,043 | 170,228 |
| 5% 3/1/19 | | 298,295 | 309,331 |
| 8.5% 9/1/24 to 8/1/27 | | 29,609 | 35,723 |
|
| TOTAL FREDDIE MAC | | | 4,190,109 |
|
| Ginnie Mae - 0.0% | | | |
| 7% 7/15/28 to 11/15/28 | | 80,591 | 95,797 |
| 7.5% 2/15/28 to 10/15/28 | | 3,477 | 4,227 |
| 8% 6/15/24 | | 60 | 70 |
| 8.5% 10/15/21 | | 23,279 | 26,451 |
| 11% 7/20/19 to 8/20/19 | | 1,163 | 1,269 |
|
| TOTAL GINNIE MAE | | | 127,814 |
|
| TOTAL U.S. GOVERNMENT AGENCY - MORTGAGE SECURITIES | | | |
| (Cost $12,453,990) | | | 12,635,572 |
|
| Asset-Backed Securities - 8.4% | | | |
| Accredited Mortgage Loan Trust Series 2005-1 Class M1, 1.1266% 4/25/35 (b) | | $56,669 | $50,620 |
| ACE Securities Corp. Home Equity Loan Trust Series 2004-HE1 Class M2, 2.0765% 3/25/34 (b) | | 33,430 | 31,836 |
| Ally Auto Receivables Trust Series 2015-SN1 Class A3, 1.21% 12/20/17 | | 670,000 | 669,791 |
| Ally Master Owner Trust: | | | |
| Series 2012-4 Class A, 1.72% 7/15/19 | | 292,000 | 292,617 |
| Series 2012-5 Class A, 1.54% 9/15/19 | | 11,057,000 | 11,059,799 |
| Series 2014-3 Class A, 1.33% 3/15/19 | | 2,425,000 | 2,423,954 |
| Series 2014-4 Class A2, 1.43% 6/17/19 | | 3,870,000 | 3,868,162 |
| Series 2014-5 Class A2, 1.6% 10/15/19 | | 3,000,000 | 3,001,941 |
| Series 2015-3 Class A, 1.63% 5/15/20 | | 3,130,000 | 3,129,670 |
| American Express Credit Account Master Trust: | | | |
| Series 2014-3 Class A, 1.49% 4/15/20 | | 2,000,000 | 2,010,564 |
| Series 2014-4 Class A, 1.43% 6/15/20 | | 3,780,000 | 3,795,992 |
| AmeriCredit Automobile Receivables Trust: | | | |
| Series 2013-5 Class A3, 0.9% 9/10/18 | | 344,793 | 344,403 |
| Series 2014-2 Class A3, 0.94% 2/8/19 | | 1,300,000 | 1,297,610 |
| Series 2014-4 Class A3, 1.27% 7/8/19 | | 505,000 | 503,911 |
| Series 2015-2 Class A3, 1.27% 1/8/20 | | 3,000,000 | 2,982,881 |
| Series 2016-1 Class A3, 2.14% 10/8/20 | | 1,888,000 | 1,894,388 |
| Ameriquest Mortgage Securities, Inc. pass-thru certificates: | | | |
| Series 2003-10 Class M1, 1.4858% 12/25/33 (b) | | 5,239 | 4,802 |
| Series 2004-R2 Class M3, 1.2608% 4/25/34 (b) | | 10,238 | 7,473 |
| Argent Securities, Inc. pass-thru certificates: | | | |
| Series 2003-W7 Class A2, 1.2158% 3/25/34 (b) | | 4,092 | 3,632 |
| Series 2004-W11 Class M2, 1.4858% 11/25/34 (b) | | 63,962 | 61,475 |
| Series 2004-W7 Class M1, 1.2608% 5/25/34 (b) | | 179,644 | 164,200 |
| Series 2006-W4 Class A2C, 0.5958% 5/25/36 (b) | | 130,347 | 46,202 |
| Asset Backed Securities Corp. Home Equity Loan Trust: | | | |
| Series 2004-HE2 Class M1, 1.2515% 4/25/34 (b) | | 142,339 | 123,552 |
| Series 2006-HE2 Class M1, 0.8058% 3/25/36 (b) | | 2,215 | 369 |
| Bank of America Credit Card Master Trust Series 2015-A2 Class A, 1.36% 9/15/20 | | 3,769,000 | 3,777,936 |
| Bear Stearns Asset Backed Securities I Trust Series 2005-HE2 Class M2, 1.5608% 2/25/35 (b) | | 378,742 | 334,166 |
| Capital Auto Receivables Asset Trust: | | | |
| Series 2014-2 Class A2, 0.91% 4/20/17 | | 231,473 | 231,472 |
| Series 2014-3 Class A2, 1.18% 12/20/17 | | 1,176,000 | 1,175,464 |
| Series 2015-1 Class A2, 1.42% 6/20/18 | | 1,807,000 | 1,808,549 |
| Series 2015-2 Class A2, 1.39% 9/20/18 | | 1,603,000 | 1,604,242 |
| Capital One Multi-Asset Execution Trust Series 2014-A5 Class A, 1.48% 7/15/20 | | 2,200,000 | 2,209,936 |
| Carrington Mortgage Loan Trust Series 2007-RFC1 Class A3, 0.5758% 12/25/36 (b) | | 205,465 | 139,790 |
| Chase Issuance Trust Series 2015-A2, Class A, 1.59% 2/18/20 | | 3,000,000 | 3,020,538 |
| Chrysler Capital Auto Receivables Trust Series 2015-AA Class A3, 1.22% 7/15/19 (a) | | 4,000,000 | 3,990,726 |
| CIT Equipment Collateral: | | | |
| Series 2013-VT1 Class A3, 1.13% 7/20/20 (a) | | 1,689,604 | 1,689,751 |
| Series 2014-VT1 Class A3, 1.5% 10/21/19 (a) | | 1,640,000 | 1,634,573 |
| Citibank Credit Card Issuance Trust Series 2014-A6 Class A6, 2.15% 7/15/21 | | 2,896,000 | 2,956,777 |
| Countrywide Home Loans, Inc.: | | | |
| Series 2003-BC1 Class B1, 5.6858% 3/25/32 (b) | | 9,741 | 8,905 |
| Series 2004-3 Class M4, 1.8908% 4/25/34 (b) | | 7,185 | 6,293 |
| Series 2004-4 Class M2, 1.2308% 6/25/34 (b) | | 8,377 | 7,575 |
| Dell Equipment Finance Trust Series 2015-1 Class A3, 1.3% 3/23/20 (a) | | 4,490,000 | 4,472,434 |
| Discover Card Master Trust: | | | |
| Series 2014-A5 Class A, 1.39% 4/15/20 | | 1,780,000 | 1,786,807 |
| Series 2016-A1 Class A1, 2.1% 7/15/21 | | 3,630,000 | 3,648,325 |
| Enterprise Fleet Financing LLC: | | | |
| Series 2014-1 Class A2, 0.87% 9/20/19 (a) | | 868,988 | 866,107 |
| Series 2014-2 Class A2, 1.05% 3/20/20 (a) | | 2,576,231 | 2,562,620 |
| Series 2015-1 Class A2, 1.3% 9/20/20 (a) | | 2,604,423 | 2,587,052 |
| Fannie Mae Series 2004-T5 Class AB3, 1.1189% 5/28/35 (b) | | 4,436 | 3,852 |
| Fieldstone Mortgage Investment Corp. Series 2004-3 Class M5, 2.6015% 8/25/34 (b) | | 33,155 | 31,312 |
| Flagship Credit Auto Trust Series 2016-1 Class A, 2.53% 12/15/20 (a) | | 4,000,000 | 3,990,391 |
| Ford Credit Auto Owner Trust: | | | |
| Series 2014-2 Class A, 2.31% 4/15/26 (a) | | 3,299,000 | 3,332,738 |
| Series 2015-1 Class A, 2.12% 7/15/26 (a) | | 2,785,000 | 2,793,976 |
| Series 2015-2 Class A, 2.44% 1/15/27 (a) | | 3,480,000 | 3,522,612 |
| Series 2016-1 Class A, 2.31% 8/15/27 (a) | | 4,000,000 | 3,998,914 |
| Ford Credit Floorplan Master Owner Trust: | | | |
| Series 2012-5 Class A, 1.49% 9/15/19 | | 8,055,000 | 8,069,835 |
| Series 2014-1 Class A1, 1.2% 2/15/19 | | 3,500,000 | 3,492,991 |
| Series 2014-4 Class A1, 1.4% 8/15/19 | | 11,000,000 | 11,007,425 |
| Series 2015-1 Class A1, 1.42% 1/15/20 | | 6,000,000 | 6,003,737 |
| Fremont Home Loan Trust Series 2005-A: | | | |
| Class M3, 1.1615% 1/25/35 (b) | | 81,136 | 70,350 |
| Class M4, 1.4465% 1/25/35 (b) | | 39,567 | 21,248 |
| GCO Education Loan Funding Master Trust II Series 2007-1A Class C1L, 1.0091% 2/25/47 (a)(b) | | 143,276 | 126,848 |
| GE Business Loan Trust Series 2006-2A: | | | |
| Class A, 0.6093% 11/15/34 (a)(b) | | 89,833 | 85,073 |
| Class B, 0.7105% 11/15/34 (a)(b) | | 32,594 | 28,683 |
| Class C, 0.8105% 11/15/34 (a)(b) | | 53,794 | 46,548 |
| Class D, 1.1805% 11/15/34 (a)(b) | | 20,404 | 16,905 |
| GM Financial Automobile Leasing Trust: | | | |
| Series 2014-2A Class A3, 1.22% 1/22/18 (a) | | 1,950,000 | 1,950,075 |
| Series 2015-1 Class A3, 1.53% 9/20/18 | | 2,398,000 | 2,413,268 |
| GMF Floorplan Owner Revolving Trust Series 2015-1 Class A1, 1.65% 5/15/20 (a) | | 3,732,000 | 3,723,488 |
| GSAMP Trust Series 2004-AR1 Class B4, 5.5% 6/25/34 (a) | | 29,997 | 864 |
| Home Equity Asset Trust: | | | |
| Series 2003-2 Class M1, 1.7558% 8/25/33 (b) | | 32,697 | 30,100 |
| Series 2003-5 Class A2, 1.1358% 12/25/33 (b) | | 2,817 | 2,605 |
| HSI Asset Securitization Corp. Trust Series 2007-HE1 Class 2A3, 0.6165% 1/25/37 (b) | | 141,116 | 90,492 |
| Hyundai Auto Lease Securitization Trust: | | | |
| Series 2014-B Class A3, 0.98% 11/15/17 (a) | | 1,200,000 | 1,199,357 |
| Series 2015-A Class A3, 1.42% 9/17/18 (a) | | 2,402,000 | 2,406,145 |
| Series 2015-B Class A3, 1.4% 11/15/18 (a) | | 2,966,000 | 2,967,041 |
| JPMorgan Mortgage Acquisition Trust: | | | |
| Series 2006-NC2 Class M2, 0.7216% 7/25/36 (b) | | 21,503 | 9,666 |
| Series 2007-CH1 Class AV4, 0.5658% 11/25/36 (b) | | 5,806 | 5,804 |
| KeyCorp Student Loan Trust: | | | |
| Series 1999-A Class A2, 0.9331% 12/27/29 (b) | | 7,059 | 7,022 |
| Series 2006-A Class 2C, 1.7531% 3/27/42 (b) | | 392,000 | 201,046 |
| MASTR Asset Backed Securities Trust Series 2007-HE1 Class M1, 0.7265% 5/25/37 (b) | | 35,682 | 1,122 |
| Meritage Mortgage Loan Trust Series 2004-1 Class M1, 1.1858% 7/25/34 (b) | | 14,160 | 11,761 |
| Merrill Lynch Mortgage Investors Trust: | | | |
| Series 2003-OPT1 Class M1, 1.4015% 7/25/34 (b) | | 32,514 | 30,398 |
| Series 2006-FM1 Class A2B, 0.5458% 4/25/37 (b) | | 11,599 | 11,534 |
| Series 2006-OPT1 Class A1A, 0.9465% 6/25/35 (b) | | 163,793 | 156,864 |
| Morgan Stanley ABS Capital I Trust: | | | |
| Series 2004-HE6 Class A2, 1.1158% 8/25/34 (b) | | 4,895 | 4,255 |
| Series 2004-NC8 Class M6, 2.3108% 9/25/34 (b) | | 54,359 | 50,117 |
| Series 2005-NC1 Class M1, 1.0958% 1/25/35 (b) | | 27,940 | 24,899 |
| Series 2005-NC2 Class B1, 2.1908% 3/25/35 (b) | | 19,093 | 427 |
| Nationstar HECM Loan Trust Series 2016-1A Class A, 3.1294% 2/25/26 (a) | | 2,000,000 | 1,999,998 |
| New Century Home Equity Loan Trust Series 2005-4 Class M2, 0.9365% 9/25/35 (b) | | 162,650 | 148,055 |
| Nissan Master Owner Trust Receivables Series 2015-A Class A2, 1.44% 1/15/20 | | 2,500,000 | 2,501,568 |
| Park Place Securities, Inc.: | | | |
| Series 2004-WCW1: | | | |
| Class M3, 2.3015% 9/25/34 (b) | | 60,741 | 55,316 |
| Class M4, 2.6015% 9/25/34 (b) | | 77,891 | 52,551 |
| Series 2005-WCH1 Class M4, 1.6715% 1/25/36 (b) | | 126,217 | 110,854 |
| Salomon Brothers Mortgage Securities VII, Inc. Series 2003-HE1 Class A, 1.2265% 4/25/33 (b) | | 582 | 498 |
| Santander Drive Auto Receivables Trust: | | | |
| Series 2013-4 Class B, 2.16% 1/15/20 | | 164,736 | 164,968 |
| Series 2014-4 Class B, 1.82% 5/15/19 | | 774,000 | 774,373 |
| Saxon Asset Securities Trust Series 2004-1 Class M1, 1.2308% 3/25/35 (b) | | 82,443 | 75,890 |
| SLM Private Credit Student Loan Trust Series 2004-A Class C, 1.462% 6/15/33 (b) | | 64,266 | 62,650 |
| Structured Asset Investment Loan Trust Series 2004-8 Class M5, 2.1608% 9/25/34 (b) | | 4,680 | 3,946 |
| Synchrony Credit Card Master Note Trust: | | | |
| Series 2015-1 Class A, 2.37% 3/15/23 | | 2,681,000 | 2,725,078 |
| Series 2015-2 Class A, 1.6% 4/15/21 | | 3,040,000 | 3,047,751 |
| Terwin Mortgage Trust Series 2003-4HE Class A1, 1.2865% 9/25/34 (b) | | 2,472 | 2,083 |
| Trapeza CDO XII Ltd./Trapeza CDO XII, Inc. Series 2007-12A Class B, 1.1717% 4/6/42 (a)(b) | | 316,998 | 155,329 |
| Volkswagen Credit Auto Master Trust Series 2014-1A Class A2, 1.4% 7/22/19 (a) | | 3,104,000 | 3,069,157 |
| Volvo Financial Equipment LLC Series 2015-1A Class A3, 1.51% 6/17/19 (a) | | 2,226,000 | 2,230,670 |
| World Omni Auto Receivables Trust Series 2014-B Class A3, 1.14% 1/15/20 | | 1,759,000 | 1,757,421 |
| World Omni Automobile Lease Securitization Trust Series 2014-A Class A3, 1.16% 9/15/17 | | 1,160,000 | 1,158,759 |
| TOTAL ASSET-BACKED SECURITIES | | | |
| (Cost $159,218,496) | | | 160,328,585 |
|
| Collateralized Mortgage Obligations - 1.6% | | | |
| Private Sponsor - 0.1% | | | |
| Credit Suisse Mortgage Trust Series 2012-2R Class 1A1, 2.7362% 5/27/35 (a)(b) | | 528,998 | 542,646 |
| MASTR Adjustable Rate Mortgages Trust Series 2007-3 Class 22A2, 0.6365% 5/25/47 (b) | | 28,857 | 26,469 |
| Merrill Lynch Alternative Note Asset Trust floater Series 2007-OAR1 Class A1, 0.6058% 2/25/37 (b) | | 64,804 | 57,351 |
| Nationstar HECM Loan Trust sequential payer Series 2015-2A Class A, 2.8826% 11/25/25 (a) | | 1,565,874 | 1,565,091 |
| RESI Finance LP/RESI Finance DE Corp. floater Series 2003-B: | | | |
| Class B5, 2.7735% 6/10/35 (a)(b) | | 40,467 | 36,007 |
| Class B6, 3.2735% 6/10/35 (a)(b) | | 67,321 | 60,717 |
| Sequoia Mortgage Trust floater Series 2004-6 Class A3B, 1.675% 7/20/34 (b) | | 2,538 | 2,473 |
|
| TOTAL PRIVATE SPONSOR | | | 2,290,754 |
|
| U.S. Government Agency - 1.5% | | | |
| Fannie Mae: | | | |
| pass-thru certificates Series 2012-127 Class DH, 4% 11/25/27 | | 358,644 | 379,448 |
| planned amortization class: | | | |
| Series 2002-9 Class PC, 6% 3/25/17 | | 2,786 | 2,838 |
| Series 2015-28 Class P, 2.5% 5/25/45 | | 7,659,776 | 7,835,591 |
| Series 2014-57 Class A, 3% 9/25/44 | | 2,165,864 | 2,240,737 |
| Series 2015-28 Class JE, 3% 5/25/45 | | 5,942,125 | 6,160,311 |
| Freddie Mac: | | | |
| planned amortization class: | | | |
| Series 2356 Class GD, 6% 9/15/16 | | 6,246 | 6,317 |
| Series 2363 Class PF, 6% 9/15/16 | | 4,004 | 4,034 |
| Series 3820 Class DA, 4% 11/15/35 | | 291,331 | 305,101 |
| Series 3777 Class AC, 3.5% 12/15/25 | | 517,671 | 544,566 |
| Series 3949 Class MK, 4.5% 10/15/34 | | 222,334 | 241,007 |
| Series 4472 Class WL, 3% 5/15/45 | | 2,714,751 | 2,808,667 |
| Ginnie Mae guaranteed REMIC pass-thru certificates Series 2015-H17 Class HA, 2.5% 5/20/65 (d) | | 7,682,437 | 7,843,958 |
|
| TOTAL U.S. GOVERNMENT AGENCY | | | 28,372,575 |
|
| TOTAL COLLATERALIZED MORTGAGE OBLIGATIONS | | | |
| (Cost $30,710,580) | | | 30,663,329 |
|
| Commercial Mortgage Securities - 7.6% | | | |
| 7 WTC Depositor LLC Trust Series 2012-7WTC Class A, 4.0824% 3/13/31 (a) | | 417,625 | 425,237 |
| Asset Securitization Corp. Series 1997-D5 Class PS1, 1.5885% 2/14/43 (b)(e) | | 41,857 | 303 |
| Banc of America Commercial Mortgage Trust: | | | |
| sequential payer: | | | |
| Series 2006-2 Class A4, 5.832% 5/10/45 (b) | | 486,650 | 486,447 |
| Series 2006-3 Class A4, 5.889% 7/10/44 (b) | | 4,576,290 | 4,580,360 |
| Series 2006-6 Class A3, 5.369% 10/10/45 | | 74,307 | 74,282 |
| Series 2006-4 Class A1A, 5.617% 7/10/46 (b) | | 811,416 | 817,033 |
| Series 2007-2 Class A4, 5.79% 4/10/49 (b) | | 7,498,000 | 7,604,610 |
| Series 2007-3 Class A4, 5.7423% 6/10/49 (b) | | 579,721 | 595,197 |
| Barclays Commercial Mortgage Securities LLC: | | | |
| floater Series 2015-RRI Class A, 1.5755% 5/15/32 (a)(b) | | 2,015,000 | 1,983,571 |
| Series 2015-STP Class A, 3.3228% 9/10/28 (a) | | 3,500,000 | 3,601,373 |
| Bayview Commercial Asset Trust floater: | | | |
| Series 2003-2 Class M1, 1.7108% 12/25/33 (a)(b) | | 3,266 | 2,901 |
| Series 2005-4A: | | | |
| Class A2, 0.8258% 1/25/36 (a)(b) | | 83,872 | 71,617 |
| Class B1, 1.8358% 1/25/36 (a)(b) | | 3,550 | 2,445 |
| Class M1, 0.8858% 1/25/36 (a)(b) | | 27,056 | 21,473 |
| Class M2, 0.9058% 1/25/36 (a)(b) | | 8,117 | 6,250 |
| Class M3, 0.9358% 1/25/36 (a)(b) | | 11,854 | 8,757 |
| Class M4, 1.0458% 1/25/36 (a)(b) | | 6,556 | 4,737 |
| Class M5, 1.0858% 1/25/36 (a)(b) | | 6,556 | 4,749 |
| Class M6, 1.1358% 1/25/36 (a)(b) | | 6,963 | 5,061 |
| Series 2006-3A Class M4, 0.8658% 10/25/36 (a)(b) | | 3,424 | 378 |
| Series 2007-1 Class A2, 0.7058% 3/25/37 (a)(b) | | 55,311 | 46,781 |
| Series 2007-2A: | | | |
| Class A1, 0.7058% 7/25/37 (a)(b) | | 57,469 | 48,233 |
| Class A2, 0.7558% 7/25/37 (a)(b) | | 53,728 | 42,535 |
| Class M1, 0.8058% 7/25/37 (a)(b) | | 18,867 | 14,287 |
| Class M2, 0.8458% 7/25/37 (a)(b) | | 10,193 | 7,123 |
| Class M3, 0.9258% 7/25/37 (a)(b) | | 7,826 | 4,933 |
| Series 2007-3: | | | |
| Class A2, 0.7258% 7/25/37 (a)(b) | | 51,618 | 41,080 |
| Class M1, 0.7458% 7/25/37 (a)(b) | | 11,450 | 8,576 |
| Class M2, 0.7758% 7/25/37 (a)(b) | | 12,285 | 8,761 |
| Class M3, 0.8058% 7/25/37 (a)(b) | | 18,952 | 9,299 |
| Class M4, 0.9358% 7/25/37 (a)(b) | | 29,987 | 14,432 |
| Class M5, 1.0358% 7/25/37 (a)(b) | | 14,479 | 3,043 |
| Series 2007-4A Class M1, 1.3716% 9/25/37 (a)(b) | | 16,497 | 4,065 |
| Bear Stearns Commercial Mortgage Securities Trust: | | | |
| sequential payer: | | | |
| Series 2006-PW13 Class A1A, 5.533% 9/11/41 | | 680,553 | 687,048 |
| Series 2006-PW14 Class A1A, 5.189% 12/11/38 | | 360,159 | 366,172 |
| Series 2006-T22 Class A1A, 5.8216% 4/12/38 (b) | | 10,268 | 10,258 |
| Series 2006-PW12 Class A1A, 5.9065% 9/11/38 (b) | | 370,888 | 371,138 |
| BXHTL Mortgage Trust Series 2015-JWRZ Class A, 1.656% 5/15/29 (a)(b) | | 2,065,000 | 2,016,019 |
| C-BASS Trust floater Series 2006-SC1 Class A, 0.7058% 5/25/36 (a)(b) | | 20,671 | 19,876 |
| CD Commercial Mortgage Trust Series 2007-CD5 Class A1A, 5.8% 11/15/44 | | 739,907 | 776,472 |
| CDGJ Commercial Mortgage Trust Series 2014-BXCH Class A, 1.827% 12/15/27 (a)(b) | | 7,424,941 | 7,400,557 |
| CGBAM Commercial Mortgage Trust Series 2015-SMRT Class A, 2.808% 4/10/28 (a) | | 5,000,000 | 5,105,490 |
| Citigroup Commercial Mortgage Trust: | | | |
| sequential payer Series 2006-C5 Class A4, 5.431% 10/15/49 | | 1,449,733 | 1,464,198 |
| Series 2006-C4 Class A1A, 6.0329% 3/15/49 (b) | | 323,431 | 323,552 |
| Series 2015-GC29 Class A2, 2.674% 4/10/48 | | 1,388,000 | 1,418,447 |
| Citigroup/Deutsche Bank Commercial Mortgage Trust sequential payer Series 2006-CD3 Class A5, 5.617% 10/15/48 | | 227,913 | 229,367 |
| COMM Mortgage Trust: | | | |
| floater Series 2014-KYO Class A, 1.324% 6/11/27 (a)(b) | | 1,500,000 | 1,462,944 |
| Series 2013-LC6 Class ASB, 2.478% 1/10/46 | | 2,180,000 | 2,196,679 |
| Series 2014-CR15 Class A2, 2.928% 2/10/47 | | 3,957,000 | 4,053,423 |
| Series 2014-CR17 Class A2, 3.012% 5/10/47 | | 790,000 | 813,347 |
| Series 2014-CR20 Class A2, 2.801% 11/10/47 | | 987,000 | 1,012,377 |
| Series 2014-UBS3 Class A2, 2.844% 6/10/47 | | 1,960,000 | 2,011,384 |
| Series 2015-CR22 Class A2, 2.856% 3/10/48 | | 953,000 | 981,991 |
| COMM Mortgage Trust pass-thru certificates: | | | |
| floater Series 2005-F10A Class J, 1.2805% 4/15/17 (a)(b) | | 14,378 | 14,277 |
| sequential payer: | | | |
| Series 2006-C7 Class A1A, 5.9515% 6/10/46 (b) | | 469,550 | 470,744 |
| Series 2006-C8: | | | |
| Class A1A, 5.292% 12/10/46 | | 1,093,029 | 1,108,645 |
| Class A4, 5.306% 12/10/46 | | 1,526,955 | 1,548,538 |
| Series 2006-C7 Class A4, 5.9625% 6/10/46 (b) | | 416,734 | 416,935 |
| Credit Suisse Commercial Mortgage Trust sequential payer: | | | |
| Series 2007-C2 Class A3, 5.542% 1/15/49 (b) | | 432,000 | 440,566 |
| Series 2007-C3 Class A4, 5.8888% 6/15/39 (b) | | 1,433,621 | 1,469,107 |
| Credit Suisse First Boston Mortgage Securities Corp. Series 2001-CKN5 Class AX, 0.0141% 9/15/34 (a)(b)(e) | | 102 | 0 |
| CSMC Series 2015-TOWN: | | | |
| Class B, 2.327% 3/15/17 (a)(b) | | 264,000 | 254,854 |
| Class C, 2.677% 3/15/17 (a)(b) | | 257,000 | 245,778 |
| Class D, 3.627% 3/15/17 (a)(b) | | 1,003,000 | 951,358 |
| GAHR Commercial Mortgage Trust: | | | |
| floater Series 2015-NRF Class AFL1, 1.7255% 12/15/16 (a)(b) | | 5,058,216 | 5,009,828 |
| Series 2015-NRF: | | | |
| Class BFX, 3.3822% 12/15/19 (a)(b) | | 2,358,850 | 2,342,301 |
| Class CFX, 3.3822% 12/15/19 (a)(b) | | 1,059,000 | 1,030,239 |
| GE Capital Commercial Mortgage Corp.: | | | |
| sequential payer Series 2007-C1 Class A4, 5.543% 12/10/49 | | 2,544,000 | 2,584,054 |
| Series 2007-C1 Class A1A, 5.483% 12/10/49 (b) | | 5,010,151 | 5,143,722 |
| Greenwich Capital Commercial Funding Corp.: | | | |
| sequential payer Series 2007-GG9 Class A4, 5.444% 3/10/39 | | 918,805 | 938,374 |
| Series 2006-GG7 Class A4, 6.0483% 7/10/38 (b) | | 1,002,018 | 1,004,481 |
| GS Mortgage Securities Corp. Trust Series 2013-C, 2.974% 1/10/30 (a) | | 150,000 | 150,341 |
| GS Mortgage Securities Trust: | | | |
| floater Series 2014-GSFL Class A, 1.4255% 7/15/31 (a)(b) | | 399,314 | 393,225 |
| sequential payer Series 2006-GG8: | | | |
| Class A1A, 5.547% 11/10/39 | | 429,722 | 434,481 |
| Class A4, 5.56% 11/10/39 | | 6,047,719 | 6,096,485 |
| Series 2015-GC32 Class A2, 3.062% 7/10/48 | | 2,500,000 | 2,594,221 |
| Hilton U.S.A. Trust: | | | |
| floater Series 2013-HLF Class AFL, 1.4295% 11/5/30 (a)(b) | | 440,663 | 439,986 |
| Series 2013-HLT: | | | |
| Class CFX, 3.7141% 11/5/30 (a) | | 110,000 | 109,655 |
| Class DFX, 4.4065% 11/5/30 (a) | | 1,039,000 | 1,035,748 |
| JP Morgan Chase Commercial Mortgage Securities Trust Series 2015-JP1 Class A2, 3.1438% 1/15/49 | | 1,975,000 | 2,071,900 |
| JPMBB Commercial Mortgage Secutities Trust Series 2015-C29 Class A2, 2.9213% 5/15/48 | | 1,567,000 | 1,626,740 |
| JPMorgan Chase Commercial Mortgage Securities Trust: | | | |
| floater: | | | |
| Series 2014-BXH Class A, 1.3305% 4/15/27 (a)(b) | | 1,100,000 | 1,086,464 |
| Series 2014-FL5 Class A, 1.4055% 7/15/31 (a)(b) | | 1,056,206 | 1,042,928 |
| sequential payer: | | | |
| Series 2006-CB16 Class A4, 5.552% 5/12/45 | | 1,394,608 | 1,401,800 |
| Series 2006-LDP8: | | | |
| Class A1A, 5.397% 5/15/45 | | 87,443 | 88,065 |
| Class A4, 5.399% 5/15/45 | | 1,456,273 | 1,460,800 |
| Series 2007-LD11 Class A4, 5.9599% 6/15/49 (b) | | 29,781 | 30,375 |
| Series 2007-LDPX Class A3, 5.42% 1/15/49 | | 3,625,347 | 3,696,463 |
| Series 2011-C3 Class A3, 4.3877% 2/15/46 (a) | | 1,718,000 | 1,793,022 |
| Series 2006-LDP7 Class A1A, 6.1056% 4/17/45 (b) | | 808,132 | 811,582 |
| LB-UBS Commercial Mortgage Trust: | | | |
| sequential payer: | | | |
| Series 2006-C6 Class A4, 5.372% 9/15/39 | | 227,635 | 229,746 |
| Series 2006-C7: | | | |
| Class A1A, 5.335% 11/15/38 | | 2,185,310 | 2,221,130 |
| Class A2, 5.3% 11/15/38 | | 26,694 | 26,969 |
| Series 2007-C1 Class A4, 5.424% 2/15/40 | | 2,994,053 | 3,051,337 |
| Series 2006-C6 Class A1A, 5.342% 9/15/39 (b) | | 1,110,047 | 1,120,482 |
| Series 2007-C7 Class A3, 5.866% 9/15/45 | | 1,225,377 | 1,290,861 |
| Merrill Lynch Mortgage Trust: | | | |
| Series 2005-LC1 Class F, 5.9178% 1/12/44 (a)(b) | | 56,826 | 56,723 |
| Series 2006-C2 Class A1A, 5.739% 8/12/43 (b) | | 673,587 | 678,296 |
| Merrill Lynch-CFC Commercial Mortgage Trust: | | | |
| sequential payer Series 2007-5 Class A4, 5.378% 8/12/48 | | 4,549,434 | 4,634,288 |
| Series 2007-6 Class B, 5.635% 3/12/51 (b) | | 216,000 | 60,653 |
| Morgan Stanley BAML Trust Series 2014-C14 Class A2, 2.916% 2/15/47 | | 817,000 | 844,156 |
| Morgan Stanley Capital I Trust: | | | |
| floater: | | | |
| Series 2006-XLF Class C, 1.631% 7/15/19 (a)(b) | | 40,774 | 40,285 |
| Series 2007-XLFA: | | | |
| Class D, 0.6155% 10/15/20 (a)(b) | | 31,745 | 31,747 |
| Class E, 0.6755% 10/15/20 (a)(b) | | 95,138 | 95,143 |
| Class F, 0.7255% 10/15/20 (a)(b) | | 57,094 | 57,097 |
| Class G, 0.7655% 10/15/20 (a)(b) | | 70,577 | 70,581 |
| Class H, 0.8555% 10/15/20 (a)(b) | | 44,426 | 44,471 |
| Class J, 1.0055% 10/15/20 (a)(b) | | 25,649 | 24,833 |
| sequential payer: | | | |
| Series 2007-IQ13 Class A1A, 5.312% 3/15/44 | | 337,456 | 344,969 |
| Series 2011-C2 Class A4, 4.661% 6/15/44 (a) | | 2,725,000 | 3,013,844 |
| Series 2006-HQ9 Class A4, 5.731% 7/12/44 (b) | | 313,668 | 313,471 |
| Series 2006-IQ11 Class A1A, 5.9599% 10/15/42 (b) | | 78,290 | 78,216 |
| Series 2007-IQ14 Class A4, 5.692% 4/15/49 | | 1,195,000 | 1,223,304 |
| Series 2007-T27 Class A1A, 5.8206% 6/11/42 (b) | | 818,328 | 852,290 |
| Providence Place Group Ltd. Partnership sequential payer Series 2000-C1 Class A1, 7.75% 7/20/16 (a) | | 2,678 | 2,743 |
| SCG Trust Series 2013-SRP1 Class A, 1.8255% 11/15/26 (a)(b) | | 2,027,000 | 2,017,928 |
| UBS Commercial Mortgage Trust Series 2012-C1 Class A2, 2.18% 5/10/45 | | 354,364 | 355,548 |
| Wachovia Bank Commercial Mortgage Trust: | | | |
| sequential payer: | | | |
| Series 2006-C29: | | | |
| Class A1A, 5.297% 11/15/48 | | 1,555,134 | 1,583,711 |
| Class A4, 5.308% 11/15/48 | | 553,769 | 559,669 |
| Series 2007-C30 Class A5, 5.342% 12/15/43 | | 5,468,000 | 5,599,694 |
| Series 2007-C32 Class A3, 5.8991% 6/15/49 (b) | | 367,000 | 374,925 |
| Series 2007-C33: | | | |
| Class A4, 6.1491% 2/15/51 (b) | | 3,074,873 | 3,175,855 |
| Class A5, 6.1491% 2/15/51 (b) | | 143,000 | 150,298 |
| Series 2006-C25 Class A1A, 5.9451% 5/15/43 (b) | | 212,102 | 211,739 |
| Series 2006-C26 Class A1A, 6.009% 6/15/45 (b) | | 593,776 | 594,663 |
| Series 2006-C27: | | | |
| Class A1A, 5.749% 7/15/45 (b) | | 434,540 | 436,541 |
| Class A3, 5.765% 7/15/45 (b) | | 459,802 | 459,271 |
| WF-RBS Commercial Mortgage Trust Series 2013-C11 Class ASB, 2.63% 3/15/45 | | 1,310,000 | 1,327,983 |
| WFCG Commercial Mortgage Trust floater Series 2015-BXRP Class A, 1.5475% 11/15/29 (a)(b) | | 1,589,600 | 1,568,778 |
| TOTAL COMMERCIAL MORTGAGE SECURITIES | | | |
| (Cost $145,752,333) | | | 143,432,988 |
|
| Municipal Securities - 0.8% | | | |
| Illinois Gen. Oblig.: | | | |
| Series 2003, 4.95% 6/1/23 | | $2,645,000 | $2,754,186 |
| Series 2011: | | | |
| 4.961% 3/1/16 | | 6,320,000 | 6,320,000 |
| 5.665% 3/1/18 | | 630,000 | 665,204 |
| 5.877% 3/1/19 | | 4,715,000 | 5,096,491 |
| Series 2013, 2.69% 12/1/17 | | 500,000 | 503,905 |
| TOTAL MUNICIPAL SECURITIES | | | |
| (Cost $15,294,534) | | | 15,339,786 |
|
| Foreign Government and Government Agency Obligations - 0.1% | | | |
Brazilian Federative Republic 6% 1/17/17
(Cost $2,071,670) | | $2,000,000 | $2,072,000 |
|
| Supranational Obligations - 0.0% | | | |
International Bank for Reconstruction & Development 1% 6/15/18
(Cost $425,464) | | 426,000 | 425,441 |
|
| Bank Notes - 2.3% | | | |
| Bank of America NA: | | | |
| 1.25% 2/14/17 | | $2,420,000 | $2,418,028 |
| 1.65% 3/26/18 | | 1,924,000 | 1,916,106 |
| 1.75% 6/5/18 | | 2,000,000 | 1,987,380 |
| 5.3% 3/15/17 | | 250,000 | 258,473 |
| Capital One Bank NA: | | | |
| 1.3% 6/5/17 | | 1,000,000 | 994,941 |
| 2.25% 2/13/19 | | 1,000,000 | 992,494 |
| Capital One NA 1.65% 2/5/18 | | 3,000,000 | 2,961,585 |
| Discover Bank 3.1% 6/4/20 | | 1,708,000 | 1,698,731 |
| Fifth Third Bank: | | | |
| 1.45% 2/28/18 | | 580,000 | 574,663 |
| 2.875% 10/1/21 | | 2,000,000 | 2,017,872 |
| First Tennessee Bank NA, Memphis 2.95% 12/1/19 | | 5,000,000 | 4,977,815 |
| JPMorgan Chase Bank 6% 10/1/17 | | 1,762,000 | 1,869,158 |
| KeyBank NA: | | | |
| 1.65% 2/1/18 | | 397,000 | 395,775 |
| 2.5% 12/15/19 | | 3,783,000 | 3,825,230 |
| Manufacturers & Traders Trust Co. 2.3% 1/30/19 | | 1,100,000 | 1,106,466 |
| Marshall & Ilsley Bank 5% 1/17/17 | | 1,868,000 | 1,917,125 |
| Regions Bank 7.5% 5/15/18 | | 250,000 | 275,560 |
| Regions Financial Corp. 2.25% 9/14/18 | | 4,000,000 | 3,982,764 |
| The Toronto-Dominion Bank 2.125% 7/2/19 | | 5,000,000 | 5,039,990 |
| U.S. Bank NA 2.125% 10/28/19 | | 2,186,000 | 2,211,596 |
| Union Bank NA 2.125% 6/16/17 | | 700,000 | 703,690 |
| Wachovia Bank NA 6% 11/15/17 | | 570,000 | 611,779 |
| TOTAL BANK NOTES | | | |
| (Cost $42,604,005) | | | 42,737,221 |
| | | Shares | Value |
|
| Fixed-Income Funds - 0.8% | | | |
| Fidelity Specialized High Income Central Fund (f) | | | |
| (Cost $16,910,667) | | 162,831 | 15,449,410 |
|
| Money Market Funds - 0.8% | | | |
| Fidelity Cash Central Fund, 0.40% (g) | | | |
| (Cost $14,718,871) | | 14,718,871 | 14,718,871 |
| | | Maturity Amount | Value |
|
| Cash Equivalents - 4.1% | | | |
| Investments in repurchase agreements in a joint trading account at 0.4%, dated 2/29/16 due 3/1/16 (Collateralized by U.S. Government Obligations) # (h) | | | |
| (Cost $78,443,000) | | 78,443,872 | 78,443,000 |
| TOTAL INVESTMENT PORTFOLIO - 104.7% | | | |
| (Cost $1,997,336,946) | | | 1,986,476,828 |
| NET OTHER ASSETS (LIABILITIES) - (4.7)% | | | (88,782,241) |
| NET ASSETS - 100% | | | $1,897,694,587 |
Swaps
| Underlying Reference | Rating(1) | Expiration Date | Clearinghouse/Counterparty | Fixed Payment Received/(Paid) | Notional Amount(2) | Value(1) | Upfront Premium Received/(Paid) | Unrealized Appreciation/(Depreciation) |
| Credit Default Swaps | | | | | | | | |
| Sell Protection | | | | | | | | |
| Morgan Stanley ABS Capital I Inc Series 2004-NC8 Class B3 | C | Oct. 2034 | Merrill Lynch International | 4.60% | USD 16,329 | $(1,264) | $0 | $(1,264) |
(1) Ratings are presented for credit default swaps in which the Fund has sold protection on the underlying referenced debt. Ratings for an underlying index represent a weighted average of the ratings of all securities included in the index. The credit rating or value can be measures of the current payment/performance risk. Ratings are from Moody's Investors Service, Inc. Where Moody's® ratings are not available, S&P® ratings are disclosed and are indicated as such. All ratings are as of the report date and do not reflect subsequent changes.
(2) The notional amount of each credit default swap where the Fund has sold protection approximates the maximum potential amount of future payments that the Fund could be required to make if a credit event were to occur.
Legend
(a) Security exempt from registration under Rule 144A of the Securities Act of 1933. These securities may be resold in transactions exempt from registration, normally to qualified institutional buyers. At the end of the period, the value of these securities amounted to $311,245,996 or 16.4% of net assets.
(b) Coupon rates for floating and adjustable rate securities reflect the rates in effect at period end.
(c) Security or a portion of the security has been segregated as collateral for open bi-lateral over-the-counter (OTC) swaps. At period end, the value of securities pledged amounted to $122,073.
(d) Represents an investment in an underlying pool of reverse mortgages which typically do not require regular principal and interest payments as repayment is deferred until a maturity event.
(e) Security represents right to receive monthly interest payments on an underlying pool of mortgages or assets. Principal shown is the outstanding par amount of the pool as of the end of the period.
(f) Affiliated fund that is generally available only to investment companies and other accounts managed by Fidelity Investments. A complete unaudited schedule of portfolio holdings for each Fidelity Central Fund is filed with the SEC for the first and third quarters of each fiscal year on Form N-Q and is available upon request or at the SEC's website at www.sec.gov. An unaudited holdings listing for the Fund, which presents direct holdings as well as the pro-rata share of securities and other investments held indirectly through its investment in underlying non-money market Fidelity Central Funds, is available at fidelity.com and/or advisor.fidelity.com, as applicable. In addition, each Fidelity Central Fund's financial statements are available on the SEC's website or upon request.
(g) Affiliated fund that is generally available only to investment companies and other accounts managed by Fidelity Investments. The rate quoted is the annualized seven-day yield of the fund at period end. A complete unaudited listing of the fund's holdings as of its most recent quarter end is available upon request. In addition, each Fidelity Central Fund's financial statements are available on the SEC's website or upon request.
(h) Includes investment made with cash collateral received from securities on loan.
Affiliated Central Funds
Information regarding fiscal year to date income earned by the Fund from investments in Fidelity Central Funds is as follows:
| Fund | Income earned |
| Fidelity Cash Central Fund | $51,578 |
| Fidelity Specialized High Income Central Fund | 445,486 |
| Total | $497,064 |
Additional information regarding the Fund's fiscal year to date purchases and sales, including the ownership percentage, of the non Money Market Central Funds is as follows:
| Fund | Value, beginning of period | Purchases | Sales Proceeds | Value, end of period | % ownership, end of period |
| Fidelity Specialized High Income Central Fund | $16,060,481 | $447,917 | $-- | $15,449,410 | 1.9% |
| Total | $16,060,481 | $447,917 | $-- | $15,449,410 | |
Investment Valuation
The following is a summary of the inputs used, as of February 29, 2016, involving the Fund's assets and liabilities carried at fair value. The inputs or methodology used for valuing securities may not be an indication of the risk associated with investing in those securities. For more information on valuation inputs, and their aggregation into the levels used below, please refer to the Investment Valuation section in the accompanying Notes to Financial Statements.
| | Valuation Inputs at Reporting Date: |
| Description | Total | Level 1 | Level 2 | Level 3 |
| Investments in Securities: | | | | |
| Corporate Bonds | $1,321,778,285 | $-- | $1,321,778,285 | $-- |
| U.S. Government and Government Agency Obligations | 148,452,340 | -- | 148,452,340 | -- |
| U.S. Government Agency - Mortgage Securities | 12,635,572 | -- | 12,635,572 | -- |
| Asset-Backed Securities | 160,328,585 | -- | 159,932,939 | 395,646 |
| Collateralized Mortgage Obligations | 30,663,329 | -- | 30,663,329 | -- |
| Commercial Mortgage Securities | 143,432,988 | -- | 143,432,610 | 378 |
| Municipal Securities | 15,339,786 | -- | 15,339,786 | -- |
| Foreign Government and Government Agency Obligations | 2,072,000 | -- | 2,072,000 | -- |
| Supranational Obligations | 425,441 | -- | 425,441 | -- |
| Bank Notes | 42,737,221 | -- | 42,737,221 | -- |
| Fixed-Income Funds | 15,449,410 | 15,449,410 | -- | -- |
| Money Market Funds | 14,718,871 | 14,718,871 | -- | -- |
| Cash Equivalents | 78,443,000 | -- | 78,443,000 | -- |
| Total Investments in Securities: | $1,986,476,828 | $30,168,281 | $1,955,912,523 | $396,024 |
| Derivative Instruments: | | | | |
| Liabilities | | | | |
| Swaps | $(1,264) | $-- | $(1,264) | $-- |
| Total Liabilities | $(1,264) | $-- | $(1,264) | $-- |
| Total Derivative Instruments: | $(1,264) | $-- | $(1,264) | $-- |
Value of Derivative Instruments
The following table is a summary of the Fund's value of derivative instruments by primary risk exposure as of February 29, 2016. For additional information on derivative instruments, please refer to the Derivative Instruments section in the accompanying Notes to Financial Statements.
| Primary Risk Exposure / Derivative Type | Value |
| | Asset | Liability |
| Credit Risk | | |
| Swaps(a) | $0 | $(1,264) |
| Total Credit Risk | 0 | (1,264) |
| Total Value of Derivatives | $0 | $(1,264) |
(a) For bi-lateral OTC swaps, reflects gross value which is presented in the Statement of Assets and Liabilities in the bi-lateral OTC swaps, at value line-items.
Other Information
# Additional information on each counterparty to the repurchase agreement is as follows:
| Repurchase Agreement / Counterparty | Value |
| $78,443,000 due 3/01/16 at 0.40% | |
| Commerz Markets LLC | $78,443,000 |
| | $78,443,000 |
Distribution of investments by country or territory of incorporation, as a percentage of Total Net Assets, is as follows (Unaudited):
| United States of America | 84.5% |
| United Kingdom | 4.7% |
| Canada | 2.8% |
| Japan | 1.6% |
| France | 1.1% |
| Others (Individually Less Than 1%) | 5.3% |
| | 100.0% |
The information in the above table is based on the combined investments of the Fund and its pro-rata share of the investments of Fidelity's Fixed-Income Central Funds.
See accompanying notes which are an integral part of the financial statements.
Financial Statements
Statement of Assets and Liabilities
| | | February 29, 2016 (Unaudited) |
| Assets | | |
Investment in securities, at value (including repurchase agreements of $78,443,000) — See accompanying schedule:
Unaffiliated issuers (cost $1,965,707,408) | $1,956,308,547 | |
| Fidelity Central Funds (cost $31,629,538) | 30,168,281 | |
| Total Investments (cost $1,997,336,946) | | $1,986,476,828 |
| Cash | | 17,300 |
| Receivable for investments sold | | 4,580,612 |
| Receivable for fund shares sold | | 5,143,838 |
| Interest receivable | | 10,745,959 |
| Distributions receivable from Fidelity Central Funds | | 85,876 |
| Other receivables | | 667 |
| Total assets | | 2,007,051,080 |
| Liabilities | | |
| Payable for investments purchased | $25,112,869 | |
| Payable for fund shares redeemed | 4,552,431 | |
| Distributions payable | 295,543 | |
| Bi-lateral OTC swaps, at value | 1,264 | |
| Accrued management fee | 488,306 | |
| Distribution and service plan fees payable | 197,027 | |
| Other affiliated payables | 265,748 | |
| Other payables and accrued expenses | 5 | |
| Collateral on securities loaned, at value | 78,443,300 | |
| Total liabilities | | 109,356,493 |
| Net Assets | | $1,897,694,587 |
| Net Assets consist of: | | |
| Paid in capital | | $1,927,755,442 |
| Undistributed net investment income | | 2,808,318 |
| Accumulated undistributed net realized gain (loss) on investments | | (22,007,791) |
| Net unrealized appreciation (depreciation) on investments | | (10,861,382) |
| Net Assets | | $1,897,694,587 |
| Calculation of Maximum Offering Price | | |
| Class A: | | |
| Net Asset Value and redemption price per share ($314,703,093 ÷ 27,708,466 shares) | | $11.36 |
| Maximum offering price per share (100/97.25 of $11.36) | | $11.68 |
| Class T: | | |
| Net Asset Value and redemption price per share ($193,597,348 ÷ 17,035,689 shares) | | $11.36 |
| Maximum offering price per share (100/97.25 of $11.36) | | $11.68 |
| Class B: | | |
| Net Asset Value and offering price per share ($900,323 ÷ 79,367 shares)(a) | | $11.34 |
| Class C: | | |
| Net Asset Value and offering price per share ($111,047,135 ÷ 9,799,616 shares)(a) | | $11.33 |
| Fidelity Limited Term Bond Fund: | | |
| Net Asset Value, offering price and redemption price per share ($831,639,600 ÷ 73,036,683 shares) | | $11.39 |
| Class I: | | |
| Net Asset Value, offering price and redemption price per share ($445,807,088 ÷ 39,144,534 shares) | | $11.39 |
(a) Redemption price per share is equal to net asset value less any applicable contingent deferred sales charge.
See accompanying notes which are an integral part of the financial statements.
Statement of Operations
| | | Six months ended February 29, 2016 (Unaudited) |
| Investment Income | | |
| Interest | | $22,504,412 |
| Income from Fidelity Central Funds | | 497,064 |
| Total income | | 23,001,476 |
| Expenses | | |
| Management fee | $2,770,688 | |
| Transfer agent fees | 1,186,625 | |
| Distribution and service plan fees | 1,093,513 | |
| Fund wide operations fee | 344,661 | |
| Independent trustees' compensation | 3,709 | |
| Miscellaneous | 1,153 | |
| Total expenses before reductions | 5,400,349 | |
| Expense reductions | (647) | 5,399,702 |
| Net investment income (loss) | | 17,601,774 |
| Realized and Unrealized Gain (Loss) | | |
| Net realized gain (loss) on: | | |
| Investment securities: | | |
| Unaffiliated issuers | 1,379,535 | |
| Swaps | 505 | |
| Total net realized gain (loss) | | 1,380,040 |
Change in net unrealized appreciation (depreciation) on:
Investment securities | (11,704,758) | |
| Swaps | 1,507 | |
| Total change in net unrealized appreciation (depreciation) | | (11,703,251) |
| Net gain (loss) | | (10,323,211) |
| Net increase (decrease) in net assets resulting from operations | | $7,278,563 |
See accompanying notes which are an integral part of the financial statements.
Statement of Changes in Net Assets
| | Six months ended February 29, 2016 (Unaudited) | Year ended August 31, 2015 |
| Increase (Decrease) in Net Assets | | |
| Operations | | |
| Net investment income (loss) | $17,601,774 | $21,313,755 |
| Net realized gain (loss) | 1,380,040 | 2,048,322 |
| Change in net unrealized appreciation (depreciation) | (11,703,251) | (16,775,250) |
| Net increase (decrease) in net assets resulting from operations | 7,278,563 | 6,586,827 |
| Distributions to shareholders from net investment income | (16,486,255) | (19,985,756) |
| Share transactions - net increase (decrease) | 176,353,500 | 941,601,529 |
| Total increase (decrease) in net assets | 167,145,808 | 928,202,600 |
| Net Assets | | |
| Beginning of period | 1,730,548,779 | 802,346,179 |
| End of period (including undistributed net investment income of $2,808,318 and undistributed net investment income of $1,692,799, respectively) | $1,897,694,587 | $1,730,548,779 |
See accompanying notes which are an integral part of the financial statements.
Financial Highlights — Fidelity Advisor Limited Term Bond Fund Class A
| | Six months ended February 29, (Unaudited) | Years ended August 31, | | | | |
| | 2016 | 2015 | 2014 | 2013 | 2012 | 2011 |
| Selected Per–Share Data | | | | | | |
| Net asset value, beginning of period | $11.42 | $11.52 | $11.33 | $11.69 | $11.45 | $11.28 |
| Income from Investment Operations | | | | | | |
| Net investment income (loss)A | .104 | .170 | .232 | .243 | .289 | .344 |
| Net realized and unrealized gain (loss) | (.068) | (.111) | .160 | (.384) | .215 | .163 |
| Total from investment operations | .036 | .059 | .392 | (.141) | .504 | .507 |
| Distributions from net investment income | (.096) | (.159) | (.202) | (.219) | (.264) | (.322) |
| Distributions from net realized gain | – | – | – | – | – | (.015) |
| Total distributions | (.096) | (.159) | (.202) | (.219) | (.264) | (.337) |
| Net asset value, end of period | $11.36 | $11.42 | $11.52 | $11.33 | $11.69 | $11.45 |
| Total ReturnB,C,D | .32% | .51% | 3.48% | (1.24)% | 4.46% | 4.59% |
| Ratios to Average Net AssetsE,F | | | | | | |
| Expenses before reductions | .76%G | .76% | .79% | .82% | .83% | .83% |
| Expenses net of fee waivers, if any | .76%G | .76% | .79% | .82% | .83% | .83% |
| Expenses net of all reductions | .76%G | .76% | .79% | .82% | .83% | .83% |
| Net investment income (loss) | 1.83%G | 1.48% | 2.02% | 2.09% | 2.52% | 3.06% |
| Supplemental Data | | | | | | |
| Net assets, end of period (000 omitted) | $314,703 | $304,040 | $215,800 | $155,980 | $192,761 | $187,442 |
| Portfolio turnover rateH | 40%G | 44% | 94% | 112% | 129% | 108%I |
A Calculated based on average shares outstanding during the period.
B Total returns for periods of less than one year are not annualized.
C Total returns would have been lower if certain expenses had not been reduced during the applicable periods shown.
D Total returns do not include the effect of the sales charges.
E Fees and expenses of any underlying Fidelity Central Funds are not included in the Fund's expense ratio. The Fund indirectly bears its proportionate share of the expenses of any underlying Fidelity Central Funds. Based on their most recent shareholder report date, the expenses of any underlying non-money market Fidelity Central Funds were less than .005%.
F Expense ratios reflect operating expenses of the class. Expenses before reductions do not reflect amounts reimbursed by the investment adviser or reductions from expense offset arrangements and do not represent the amount paid by the class during periods when reimbursements or reductions occur. Expenses net of fee waivers reflect expenses after reimbursement by the investment adviser but prior to reductions from expense offset arrangements. Expenses net of all reductions represent the net expenses paid by the class.
G Annualized
H Amount does not include the portfolio activity of any underlying Fidelity Central Funds.
I The portfolio turnover rate excludes liquidations and redemptions executed in-kind from Affiliated Central Funds.
See accompanying notes which are an integral part of the financial statements.
Financial Highlights — Fidelity Advisor Limited Term Bond Fund Class T
| | Six months ended February 29, (Unaudited) | Years ended August 31, | | | | |
| | 2016 | 2015 | 2014 | 2013 | 2012 | 2011 |
| Selected Per–Share Data | | | | | | |
| Net asset value, beginning of period | $11.42 | $11.53 | $11.34 | $11.70 | $11.45 | $11.29 |
| Income from Investment Operations | | | | | | |
| Net investment income (loss)A | .103 | .170 | .234 | .246 | .292 | .348 |
| Net realized and unrealized gain (loss) | (.067) | (.121) | .161 | (.384) | .225 | .153 |
| Total from investment operations | .036 | .049 | .395 | (.138) | .517 | .501 |
| Distributions from net investment income | (.096) | (.159) | (.205) | (.222) | (.267) | (.326) |
| Distributions from net realized gain | – | – | – | – | – | (.015) |
| Total distributions | (.096) | (.159) | (.205) | (.222) | (.267) | (.341) |
| Net asset value, end of period | $11.36 | $11.42 | $11.53 | $11.34 | $11.70 | $11.45 |
| Total ReturnB,C,D | .32% | .42% | 3.50% | (1.21)% | 4.57% | 4.53% |
| Ratios to Average Net AssetsE,F | | | | | | |
| Expenses before reductions | .77%G | .76% | .77% | .80% | .80% | .80% |
| Expenses net of fee waivers, if any | .77%G | .76% | .77% | .80% | .80% | .80% |
| Expenses net of all reductions | .77%G | .76% | .77% | .80% | .80% | .80% |
| Net investment income (loss) | 1.83%G | 1.48% | 2.04% | 2.11% | 2.54% | 3.09% |
| Supplemental Data | | | | | | |
| Net assets, end of period (000 omitted) | $193,597 | $193,612 | $198,510 | $210,150 | $265,426 | $274,215 |
| Portfolio turnover rateH | 40%G | 44% | 94% | 112% | 129% | 108%I |
A Calculated based on average shares outstanding during the period.
B Total returns for periods of less than one year are not annualized.
C Total returns would have been lower if certain expenses had not been reduced during the applicable periods shown.
D Total returns do not include the effect of the sales charges.
E Fees and expenses of any underlying Fidelity Central Funds are not included in the Fund's expense ratio. The Fund indirectly bears its proportionate share of the expenses of any underlying Fidelity Central Funds. Based on their most recent shareholder report date, the expenses of any underlying non-money market Fidelity Central Funds were less than .005%.
F Expense ratios reflect operating expenses of the class. Expenses before reductions do not reflect amounts reimbursed by the investment adviser or reductions from expense offset arrangements and do not represent the amount paid by the class during periods when reimbursements or reductions occur. Expenses net of fee waivers reflect expenses after reimbursement by the investment adviser but prior to reductions from expense offset arrangements. Expenses net of all reductions represent the net expenses paid by the class.
G Annualized
H Amount does not include the portfolio activity of any underlying Fidelity Central Funds.
I The portfolio turnover rate excludes liquidations and redemptions executed in-kind from Affiliated Central Funds.
See accompanying notes which are an integral part of the financial statements.
Financial Highlights — Fidelity Advisor Limited Term Bond Fund Class B
| | Six months ended February 29, (Unaudited) | Years ended August 31, | | | | |
| | 2016 | 2015 | 2014 | 2013 | 2012 | 2011 |
| Selected Per–Share Data | | | | | | |
| Net asset value, beginning of period | $11.40 | $11.51 | $11.32 | $11.68 | $11.43 | $11.27 |
| Income from Investment Operations | | | | | | |
| Net investment income (loss)A | .062 | .090 | .149 | .159 | .206 | .264 |
| Net realized and unrealized gain (loss) | (.068) | (.122) | .161 | (.384) | .225 | .154 |
| Total from investment operations | (.006) | (.032) | .310 | (.225) | .431 | .418 |
| Distributions from net investment income | (.054) | (.078) | (.120) | (.135) | (.181) | (.243) |
| Distributions from net realized gain | – | – | – | – | – | (.015) |
| Total distributions | (.054) | (.078) | (.120) | (.135) | (.181) | (.258) |
| Net asset value, end of period | $11.34 | $11.40 | $11.51 | $11.32 | $11.68 | $11.43 |
| Total ReturnB,C,D | (.05)% | (.28)% | 2.75% | (1.95)% | 3.81% | 3.77% |
| Ratios to Average Net AssetsE,F | | | | | | |
| Expenses before reductions | 1.51%G | 1.46% | 1.51% | 1.55% | 1.55% | 1.55% |
| Expenses net of fee waivers, if any | 1.51%G | 1.46% | 1.51% | 1.55% | 1.55% | 1.55% |
| Expenses net of all reductions | 1.51%G | 1.46% | 1.51% | 1.55% | 1.55% | 1.55% |
| Net investment income (loss) | 1.09%G | .78% | 1.30% | 1.36% | 1.79% | 2.35% |
| Supplemental Data | | | | | | |
| Net assets, end of period (000 omitted) | $900 | $919 | $1,507 | $2,956 | $5,209 | $7,018 |
| Portfolio turnover rateH | 40%G | 44% | 94% | 112%�� | 129% | 108%I |
A Calculated based on average shares outstanding during the period.
B Total returns for periods of less than one year are not annualized.
C Total returns would have been lower if certain expenses had not been reduced during the applicable periods shown.
D Total returns do not include the effect of the contingent deferred sales charge.
E Fees and expenses of any underlying Fidelity Central Funds are not included in the Fund's expense ratio. The Fund indirectly bears its proportionate share of the expenses of any underlying Fidelity Central Funds. Based on their most recent shareholder report date, the expenses of any underlying non-money market Fidelity Central Funds were less than .005%.
F Expense ratios reflect operating expenses of the class. Expenses before reductions do not reflect amounts reimbursed by the investment adviser or reductions from expense offset arrangements and do not represent the amount paid by the class during periods when reimbursements or reductions occur. Expenses net of fee waivers reflect expenses after reimbursement by the investment adviser but prior to reductions from expense offset arrangements. Expenses net of all reductions represent the net expenses paid by the class.
G Annualized
H Amount does not include the portfolio activity of any underlying Fidelity Central Funds.
I The portfolio turnover rate excludes liquidations and redemptions executed in-kind from Affiliated Central Funds.
See accompanying notes which are an integral part of the financial statements.
Financial Highlights — Fidelity Advisor Limited Term Bond Fund Class C
| | Six months ended February 29, (Unaudited) | Years ended August 31, | | | | |
| | 2016 | 2015 | 2014 | 2013 | 2012 | 2011 |
| Selected Per–Share Data | | | | | | |
| Net asset value, beginning of period | $11.39 | $11.50 | $11.31 | $11.67 | $11.42 | $11.26 |
| Income from Investment Operations | | | | | | |
| Net investment income (loss)A | .060 | .081 | .143 | .155 | .204 | .262 |
| Net realized and unrealized gain (loss) | (.068) | (.121) | .162 | (.384) | .225 | .154 |
| Total from investment operations | (.008) | (.040) | .305 | (.229) | .429 | .416 |
| Distributions from net investment income | (.052) | (.070) | (.115) | (.131) | (.179) | (.241) |
| Distributions from net realized gain | – | – | – | – | – | (.015) |
| Total distributions | (.052) | (.070) | (.115) | (.131) | (.179) | (.256) |
| Net asset value, end of period | $11.33 | $11.39 | $11.50 | $11.31 | $11.67 | $11.42 |
| Total ReturnB,C,D | (.07)% | (.35)% | 2.70% | (1.98)% | 3.79% | 3.76% |
| Ratios to Average Net AssetsE,F | | | | | | |
| Expenses before reductions | 1.54%G | 1.54% | 1.56% | 1.58% | 1.57% | 1.56% |
| Expenses net of fee waivers, if any | 1.54%G | 1.54% | 1.56% | 1.58% | 1.57% | 1.56% |
| Expenses net of all reductions | 1.54%G | 1.54% | 1.56% | 1.58% | 1.57% | 1.56% |
| Net investment income (loss) | 1.06%G | .71% | 1.25% | 1.34% | 1.78% | 2.33% |
| Supplemental Data | | | | | | |
| Net assets, end of period (000 omitted) | $111,047 | $81,929 | $64,333 | $53,096 | $65,425 | $63,435 |
| Portfolio turnover rateH | 40%G | 44% | 94% | 112% | 129% | 108%I |
A Calculated based on average shares outstanding during the period.
B Total returns for periods of less than one year are not annualized.
C Total returns would have been lower if certain expenses had not been reduced during the applicable periods shown.
D Total returns do not include the effect of the contingent deferred sales charge.
E Fees and expenses of any underlying Fidelity Central Funds are not included in the Fund's expense ratio. The Fund indirectly bears its proportionate share of the expenses of any underlying Fidelity Central Funds. Based on their most recent shareholder report date, the expenses of any underlying non-money market Fidelity Central Funds were less than .005%.
F Expense ratios reflect operating expenses of the class. Expenses before reductions do not reflect amounts reimbursed by the investment adviser or reductions from expense offset arrangements and do not represent the amount paid by the class during periods when reimbursements or reductions occur. Expenses net of fee waivers reflect expenses after reimbursement by the investment adviser but prior to reductions from expense offset arrangements. Expenses net of all reductions represent the net expenses paid by the class.
G Annualized
H Amount does not include the portfolio activity of any underlying Fidelity Central Funds.
I The portfolio turnover rate excludes liquidations and redemptions executed in-kind from Affiliated Central Funds.
See accompanying notes which are an integral part of the financial statements.
Financial Highlights — Fidelity Advisor Limited Term Bond Fund
| | Six months ended February 29, (Unaudited) | Years ended August 31, | |
| | 2016 | 2015 | 2014 A |
| Selected Per–Share Data | | | |
| Net asset value, beginning of period | $11.45 | $11.55 | $11.50 |
| Income from Investment Operations | | | |
| Net investment income (loss)B | .122 | .205 | .209 |
| Net realized and unrealized gain (loss) | (.068) | (.110) | .038 |
| Total from investment operations | .054 | .095 | .247 |
| Distributions from net investment income | (.114) | (.195) | (.197) |
| Net asset value, end of period | $11.39 | $11.45 | $11.55 |
| Total ReturnC,D | .48% | .83% | 2.17% |
| Ratios to Average Net AssetsE,F | | | |
| Expenses before reductions | .45%G | .45% | .46%G |
| Expenses net of fee waivers, if any | .45%G | .45% | .46%G |
| Expenses net of all reductions | .45%G | .45% | .46%G |
| Net investment income (loss) | 2.14%G | 1.79% | 2.22%G |
| Supplemental Data | | | |
| Net assets, end of period (000 omitted) | $831,640 | $758,240 | $147,629 |
| Portfolio turnover rateH | 40%G | 44% | 94% |
A For the period November 1, 2013 (commencement of sale of shares) to August 31, 2014.
B Calculated based on average shares outstanding during the period.
C Total returns for periods of less than one year are not annualized.
D Total returns would have been lower if certain expenses had not been reduced during the applicable periods shown.
E Fees and expenses of any underlying Fidelity Central Funds are not included in the Fund's expense ratio. The Fund indirectly bears its proportionate share of the expenses of any underlying Fidelity Central Funds. Based on their most recent shareholder report date, the expenses of any underlying non-money market Fidelity Central Funds were less than .005%.
F Expense ratios reflect operating expenses of the class. Expenses before reductions do not reflect amounts reimbursed by the investment adviser or reductions from expense offset arrangements and do not represent the amount paid by the class during periods when reimbursements or reductions occur. Expense ratios before reductions for start-up periods may not be representative of longer-term operating periods. Expenses net of fee waivers reflect expenses after reimbursement by the investment adviser but prior to reductions from expense offset arrangements. Expenses net of all reductions represent the net expenses paid by the class.
G Annualized
H Amount does not include the portfolio activity of any underlying Fidelity Central Funds.
See accompanying notes which are an integral part of the financial statements.
Financial Highlights — Fidelity Advisor Limited Term Bond Fund Class I
| | Six months ended February 29, (Unaudited) | Years ended August 31, | | | | |
| | 2016 | 2015 | 2014 | 2013 | 2012 | 2011 |
| Selected Per–Share Data | | | | | | |
| Net asset value, beginning of period | $11.45 | $11.55 | $11.36 | $11.72 | $11.48 | $11.31 |
| Income from Investment Operations | | | | | | |
| Net investment income (loss)A | .119 | .200 | .262 | .273 | .319 | .373 |
| Net realized and unrealized gain (loss) | (.068) | (.111) | .161 | (.385) | .213 | .163 |
| Total from investment operations | .051 | .089 | .423 | (.112) | .532 | .536 |
| Distributions from net investment income | (.111) | (.189) | (.233) | (.248) | (.292) | (.351) |
| Distributions from net realized gain | – | – | – | – | – | (.015) |
| Total distributions | (.111) | (.189) | (.233) | (.248) | (.292) | (.366) |
| Net asset value, end of period | $11.39 | $11.45 | $11.55 | $11.36 | $11.72 | $11.48 |
| Total ReturnB,C | .45% | .78% | 3.74% | (.99)% | 4.71% | 4.85% |
| Ratios to Average Net AssetsD,E | | | | | | |
| Expenses before reductions | .50%F | .50% | .53% | .57% | .58% | .58% |
| Expenses net of fee waivers, if any | .50%F | .50% | .53% | .57% | .58% | .58% |
| Expenses net of all reductions | .50%F | .50% | .53% | .57% | .58% | .58% |
| Net investment income (loss) | 2.09%F | 1.74% | 2.28% | 2.34% | 2.77% | 3.32% |
| Supplemental Data | | | | | | |
| Net assets, end of period (000 omitted) | $445,807 | $391,808 | $174,568 | $84,843 | $101,234 | $89,583 |
| Portfolio turnover rateG | 40%F | 44% | 94% | 112% | 129% | 108%H |
A Calculated based on average shares outstanding during the period.
B Total returns for periods of less than one year are not annualized.
C Total returns would have been lower if certain expenses had not been reduced during the applicable periods shown.
D Fees and expenses of any underlying Fidelity Central Funds are not included in the Fund's expense ratio. The Fund indirectly bears its proportionate share of the expenses of any underlying Fidelity Central Funds. Based on their most recent shareholder report date, the expenses of any underlying non-money market Fidelity Central Funds were less than .005%.
E Expense ratios reflect operating expenses of the class. Expenses before reductions do not reflect amounts reimbursed by the investment adviser or reductions from expense offset arrangements and do not represent the amount paid by the class during periods when reimbursements or reductions occur. Expenses net of fee waivers reflect expenses after reimbursement by the investment adviser but prior to reductions from expense offset arrangements. Expenses net of all reductions represent the net expenses paid by the class.
F Annualized
G Amount does not include the portfolio activity of any underlying Fidelity Central Funds.
H The portfolio turnover rate excludes liquidations and redemptions executed in-kind from Affiliated Central Funds.
See accompanying notes which are an integral part of the financial statements.
Notes to Financial Statements (Unaudited)
For the period ended February 29, 2016
1. Organization.
Fidelity Advisor Limited Term Bond Fund (the Fund) is a fund of Fidelity Advisor Series II (the Trust) and is authorized to issue an unlimited number of shares. The Trust is registered under the Investment Company Act of 1940, as amended (the 1940 Act), as an open-end management investment company organized as a Massachusetts business trust. The Fund offers Class A, Class T, Class C, Fidelity Limited Term Bond and Class I shares, each of which, along with Class B shares, has equal rights as to assets and voting privileges. Class B shares are closed to new accounts and additional purchases, except for exchanges and reinvestments. Each class has exclusive voting rights with respect to matters that affect that class. Class B shares will automatically convert to Class A shares after a maximum holding period of four years from the initial date of purchase.
During the period, the Board of Trustees approved the conversion of all existing Class B shares into Class A shares, effective on or about July 1, 2016, regardless of the length of times shares have been held.
2. Investments in Fidelity Central Funds.
The Fund invests in Fidelity Central Funds, which are open-end investment companies generally available only to other investment companies and accounts managed by the investment adviser and its affiliates. The Fund's Schedule of Investments lists each of the Fidelity Central Funds held as of period end, if any, as an investment of the Fund, but does not include the underlying holdings of each Fidelity Central Fund. As an Investing Fund, the Fund indirectly bears its proportionate share of the expenses of the underlying Fidelity Central Funds.
Based on its investment objective, each Fidelity Central Fund may invest or participate in various investment vehicles or strategies that are similar to those of the Fund. These strategies are consistent with the investment objectives of the Fund and may involve certain economic risks which may cause a decline in value of each of the Fidelity Central Funds and thus a decline in the value of the Fund. The Money Market Central Funds seek preservation of capital and current income and are managed by Fidelity Investments Money Management, Inc. (FIMM), an affiliate of the investment adviser. Annualized expenses of the Money Market Central Funds as of their most recent shareholder report date are less than .005%. The following summarizes the Fund's investment in each non-money market Fidelity Central Fund.
| Fidelity Central Fund | Investment Manager | Investment Objective | Investment Practices | Expense Ratio(a) |
| Fidelity Specialized High Income Central Fund | FMR Co., Inc. (FMRC) | Seeks a high level of current income by normally investing in income-producing debt securities, with an emphasis on lower-quality debt securities. | Loans & Direct Debt Instruments
Restricted Securities
| Less than .005% |
(a) Expenses expressed as a percentage of average net assets and are as of each underlying Central Fund's most recent annual or semi-annual shareholder report.
An unaudited holdings listing for the Fund, which presents direct holdings as well as the pro-rata share of any securities and other investments held indirectly through its investment in underlying non-money market Fidelity Central Funds, is available at fidelity.com and/or advisor.fidelity.com, as applicable. A complete unaudited list of holdings for each Fidelity Central Fund is available upon request or at the Securities and Exchange Commission (the SEC) website at www.sec.gov. In addition, the financial statements of the Fidelity Central Funds which contain the significant accounting policies (including investment valuation policies) of those funds are available on the SEC website or upon request.
3. Significant Accounting Policies.
The financial statements have been prepared in conformity with accounting principles generally accepted in the United States of America (GAAP), which require management to make certain estimates and assumptions at the date of the financial statements. Actual results could differ from those estimates. Subsequent events, if any, through the date that the financial statements were issued have been evaluated in the preparation of the financial statements. The following summarizes the significant accounting policies of the Fund:
Investment Valuation. Investments are valued as of 4:00 p.m. Eastern time on the last calendar day of the period. The Board of Trustees (the Board) has delegated the day to day responsibility for the valuation of the Fund's investments to the Fidelity Management & Research Company (FMR) Fair Value Committee (the Committee). In accordance with valuation policies and procedures approved by the Board, the Fund attempts to obtain prices from one or more third party pricing vendors or brokers to value its investments. When current market prices, quotations or currency exchange rates are not readily available or reliable, investments will be fair valued in good faith by the Committee, in accordance with procedures adopted by the Board. Factors used in determining fair value vary by investment type and may include market or investment specific events, changes in interest rates and credit quality. The frequency with which these procedures are used cannot be predicted and they may be utilized to a significant extent. The Committee oversees the Fund's valuation policies and procedures and reports to the Board on the Committee's activities and fair value determinations. The Board monitors the appropriateness of the procedures used in valuing the Fund's investments and ratifies the fair value determinations of the Committee.
The Fund categorizes the inputs to valuation techniques used to value its investments into a disclosure hierarchy consisting of three levels as shown below:
- Level 1 – quoted prices in active markets for identical investments
- Level 2 – other significant observable inputs (including quoted prices for similar investments, interest rates, prepayment speeds, etc.)
- Level 3 – unobservable inputs (including the Fund's own assumptions based on the best information available)
Valuation techniques used to value the Fund's investments by major category are as follows:
Debt securities, including restricted securities, are valued based on evaluated prices received from third party pricing vendors or from brokers who make markets in such securities. Corporate bonds, bank notes, foreign government and government agency obligations, municipal securities, supranational obligations and U.S. government and government agency obligations, are valued by pricing vendors who utilize matrix pricing which considers yield or price of bonds of comparable quality, coupon, maturity and type or by broker-supplied prices. Asset backed securities, collateralized mortgage obligations, commercial mortgage securities and U.S. government agency mortgage securities, are valued by pricing vendors who utilize matrix pricing which considers prepayment speed assumptions, attributes of the collateral, yield or price of bonds of comparable quality, coupon, maturity and type or by broker-supplied prices. Swaps are marked-to-market daily based on valuations from third party pricing vendors, registered derivatives clearing organizations (clearinghouses) or broker-supplied valuations. These pricing sources may utilize inputs such as interest rate curves, credit spread curves, default possibilities and recovery rates. When independent prices are unavailable or unreliable, debt securities and swaps may be valued utilizing pricing methodologies which consider similar factors that would be used by third party pricing vendors. Debt securities and swaps are generally categorized as Level 2 in the hierarchy but may be Level 3 depending on the circumstances.
Investments in open-end mutual funds, including the Fidelity Central Funds, are valued at their closing net asset value (NAV) each business day and are categorized as Level 1 in the hierarchy. Short-term securities with remaining maturities of sixty days or less may be valued at amortized cost, which approximates fair value, and are categorized as Level 2 in the hierarchy.
Changes in valuation techniques may result in transfers in or out of an assigned level within the disclosure hierarchy. The aggregate value of investments by input level as of February 29, 2016 is included at the end of the Fund's Schedule of Investments.
Investment Transactions and Income. For financial reporting purposes, the Fund's investment holdings and NAV include trades executed through the end of the last business day of the period. The NAV per share for processing shareholder transactions is calculated as of the close of business of the New York Stock Exchange (NYSE), normally 4:00 p.m. Eastern time and includes trades executed through the end of the prior business day. Gains and losses on securities sold are determined on the basis of identified cost and may include proceeds received from litigation. Income and capital gain distributions from Fidelity Central Funds, if any, are recorded on the ex-dividend date. Interest income is accrued as earned and includes coupon interest and amortization of premium and accretion of discount on debt securities as applicable. Debt obligations may be placed on non-accrual status and related interest income may be reduced by ceasing current accruals and writing off interest receivables when the collection of all or a portion of interest has become doubtful based on consistently applied procedures. A debt obligation is removed from non-accrual status when the issuer resumes interest payments or when collectability of interest is reasonably assured.
Class Allocations and Expenses. Investment income, realized and unrealized capital gains and losses, common expenses of the Fund, and certain fund-level expense reductions, if any, are allocated daily on a pro-rata basis to each class based on the relative net assets of each class to the total net assets of the Fund. Each class differs with respect to transfer agent and distribution and service plan fees incurred. Certain expense reductions may also differ by class. For the reporting period, the allocated portion of income and expenses to each class as a percent of its average net assets may vary due to the timing of recording these transactions in relation to fluctuating net assets of the classes. Expenses directly attributable to a fund are charged to that fund. Expenses attributable to more than one fund are allocated among the respective funds on the basis of relative net assets or other appropriate methods. Expense estimates are accrued in the period to which they relate and adjustments are made when actual amounts are known.
Income Tax Information and Distributions to Shareholders. Each year, the Fund intends to qualify as a regulated investment company under Subchapter M of the Internal Revenue Code, including distributing substantially all of its taxable income and realized gains. As a result, no provision for U.S. Federal income taxes is required. The Fund files a U.S. federal tax return, in addition to state and local tax returns as required. The Fund's federal income tax returns are subject to examination by the Internal Revenue Service (IRS) for a period of three fiscal years after they are filed. State and local tax returns may be subject to examination for an additional fiscal year depending on the jurisdiction.
Dividends are declared and recorded daily and paid monthly from net investment income. Distributions from realized gains, if any, are declared and recorded on the ex-dividend date. Income dividends and capital gain distributions are declared separately for each class. Income and capital gain distributions are determined in accordance with income tax regulations, which may differ from GAAP.
Capital accounts within the financial statements are adjusted for permanent book-tax differences. These adjustments have no impact on net assets or the results of operations. Capital accounts are not adjusted for temporary book-tax differences which will reverse in a subsequent period.
Book-tax differences are primarily due to swaps, market discount, partnerships (including allocations from Fidelity Central Funds), deferred trustees compensation, capital loss carryforwards and losses deferred due to wash sales and excise tax regulations.
The federal tax cost of investment securities and unrealized appreciation (depreciation) as of period end were as follows:
| Gross unrealized appreciation | $12,563,690 |
| Gross unrealized depreciation | (21,334,988) |
| Net unrealized appreciation (depreciation) on securities | $(8,771,298) |
| Tax cost | $1,995,248,126 |
Capital loss carryforwards are only available to offset future capital gains of the Fund to the extent provided by regulations and may be limited. Under the Regulated Investment Company Modernization Act of 2010 (the Act), the Fund is permitted to carry forward capital losses incurred in taxable years beginning after December 22, 2010 for an unlimited period and such capital losses are required to be used prior to any losses that expire. The capital loss carryforward information presented below, including any applicable limitation, is estimated as of prior fiscal period end and is subject to adjustment.
| Fiscal year of expiration | |
| 2017 | $(9,328) |
| 2018 | (18,759,952) |
| Total capital loss carryforward | $(18,769,280) |
Repurchase Agreements. Pursuant to an Exemptive Order issued by the SEC, the Fund along with other registered investment companies having management contracts with FMR, or other affiliated entities of FMR, are permitted to transfer uninvested cash balances into joint trading accounts which are then invested in repurchase agreements. The Fund may also invest directly with institutions in repurchase agreements. Upon settlement date, collateral is held in segregated accounts with custodian banks and may be obtained in the event of a default of the counterparty. The Fund monitors, on a daily basis, the value of the collateral to ensure it is at least equal to the principal amount of the repurchase agreement (including accrued interest). In the event of a default by the counterparty, realization of the collateral proceeds could be delayed, during which time the value of the collateral may decline.
Restricted Securities. The Fund may invest in securities that are subject to legal or contractual restrictions on resale. These securities generally may be resold in transactions exempt from registration or to the public if the securities are registered. Disposal of these securities may involve time-consuming negotiations and expense, and prompt sale at an acceptable price may be difficult. Information regarding restricted securities is included at the end of the Fund's Schedule of Investments.
4. Derivative Instruments.
Risk Exposures and the Use of Derivative Instruments. The Fund's investment objective allows the Fund to enter into various types of derivative contracts, including swaps. Derivatives are investments whose value is primarily derived from underlying assets, indices or reference rates and may be transacted on an exchange or over-the-counter (OTC). Derivatives may involve a future commitment to buy or sell a specified asset based on specified terms, to exchange future cash flows at periodic intervals based on a notional principal amount, or for one party to make one or more payments upon the occurrence of specified events in exchange for periodic payments from the other party.
The Fund used derivatives to increase returns, to gain exposure to certain types of assets and to manage exposure to certain risks as defined below. The success of any strategy involving derivatives depends on analysis of numerous economic factors, and if the strategies for investment do not work as intended, the Fund may not achieve its objectives.
The Fund's use of derivatives increased or decreased its exposure to the following risk:
| Credit Risk | Credit risk relates to the ability of the issuer of a financial instrument to make further principal or interest payments on an obligation or commitment that it has to the Fund.
|
The Fund is also exposed to additional risks from investing in derivatives, such as liquidity risk and counterparty credit risk. Liquidity risk is the risk that the Fund will be unable to close out the derivative in the open market in a timely manner. Counterparty credit risk is the risk that the counterparty will not be able to fulfill its obligation to the Fund. Derivative counterparty credit risk is managed through formal evaluation of the creditworthiness of all potential counterparties. On certain OTC derivatives such as bi-lateral swaps, the Fund attempts to reduce its exposure to counterparty credit risk by entering into an International Swaps and Derivatives Association, Inc. (ISDA) Master Agreement with each of its counterparties. The ISDA Master Agreement gives the Fund the right to terminate all transactions traded under such agreement upon the deterioration in the credit quality of the counterparty beyond specified levels. The ISDA Master Agreement gives each party the right, upon an event of default by the other party or a termination of the agreement, to close out all transactions traded under such agreement and to net amounts owed under each transaction to one net payable by one party to the other. To mitigate counterparty credit risk on bi-lateral OTC derivatives, the Fund receives collateral in the form of cash or securities once the Fund's net unrealized appreciation on outstanding derivative contracts under an ISDA Master Agreement exceeds certain applicable thresholds, subject to certain minimum transfer provisions. The collateral received is held in segregated accounts with the Fund's custodian bank in accordance with the collateral agreements entered into between the Fund, the counterparty and the Fund's custodian bank. The Fund could experience delays and costs in gaining access to the collateral even though it is held by the Fund's custodian bank. The Fund's maximum risk of loss from counterparty credit risk related to bi-lateral OTC derivatives is generally the aggregate unrealized appreciation and unpaid counterparty payments in excess of any collateral pledged by the counterparty to the Fund. The Fund may be required to pledge collateral for the benefit of the counterparties on bi-lateral OTC derivatives in an amount not less than each counterparty's unrealized appreciation on outstanding derivative contracts, subject to certain minimum transfer provisions, and any such pledged collateral is identified in the Schedule of Investments.
Investing in derivatives may involve greater risks than investing in the underlying assets directly and, to varying degrees, may involve risk of loss in excess of any initial investment and collateral received and amounts recognized in the Statement of Assets and Liabilities. In addition, there may be the risk that the change in value of the derivative contract does not correspond to the change in value of the underlying instrument.
Net Realized Gain (Loss) and Change in Net Unrealized Appreciation (Depreciation) on Derivatives. The table below, which reflects the impacts of derivatives on the financial performance of the Fund, summarizes the net realized gain (loss) and change in net unrealized appreciation (depreciation) for derivatives during the period as presented in the Statement of Operations.
| Primary Risk Exposure / Derivative Type | Net Realized Gain (Loss) | Change in Net Unrealized Appreciation (Depreciation) |
| Credit Risk | | |
| Swaps(a) | $505 | $1,507 |
(a) A summary of the value of derivatives by primary risk exposure as of period end is included at the end of the Schedule of Investments.
Swaps. A swap is a contract between two parties to exchange future cash flows at periodic intervals based on a notional principal amount. A bi-lateral OTC swap is a transaction between a fund and a dealer counterparty where cash flows are exchanged between the two parties for the life of the swap.
Bi-lateral OTC swaps are marked-to-market daily and changes in value are reflected in the Statement of Assets and Liabilities in the bi-lateral OTC swaps at value line items. Any upfront premiums paid or received upon entering a bi-lateral OTC swap to compensate for differences between stated terms of the swap and prevailing market conditions (e.g. credit spreads, interest rates or other factors) are recorded in net unrealized appreciation (depreciation) in the Statement of Assets and Liabilities and amortized to realized gain or (loss) ratably over the term of the swap. Any unamortized upfront premiums are presented in the Schedule of Investments.
Payments are exchanged at specified intervals, accrued daily commencing with the effective date of the contract and recorded as realized gain or (loss). Some swaps may be terminated prior to the effective date and realize a gain or loss upon termination. The net realized gain (loss) and change in net unrealized appreciation (depreciation) on swaps during the period is included in the Statement of Operations.
Any open swaps at period end are included in the Schedule of Investments under the caption "Swaps" and are representative of volume of activity during the period.
Credit Default Swaps. Credit default swaps enable the Fund to buy or sell protection against specified credit events on a single-name issuer or a traded credit index. Under the terms of a credit default swap the buyer of protection (buyer) receives credit protection in exchange for making periodic payments to the seller of protection (seller) based on a fixed percentage applied to a notional principal amount. In return for these payments, the seller will be required to make a payment upon the occurrence of one or more specified credit events. The Fund enters into credit default swaps as a seller to gain credit exposure to an issuer and/or as a buyer to obtain a measure of protection against defaults of an issuer. Periodic payments are made over the life of the contract by the buyer provided that no credit event occurs.
For credit default swaps on most corporate and sovereign issuers, credit events include bankruptcy, failure to pay or repudiation/moratorium. For credit default swaps on corporate or sovereign issuers, the obligation that may be put to the seller is not limited to the specific reference obligation described in the Schedule of Investments. For credit default swaps on asset-backed securities, a credit event may be triggered by events such as failure to pay principal, maturity extension, rating downgrade or write-down. For credit default swaps on asset-backed securities, the reference obligation described represents the security that may be put to the seller. For credit default swaps on a traded credit index, a specified credit event may affect all or individual underlying securities included in the index.
As a seller, if an underlying credit event occurs, the Fund will pay a net settlement amount of cash equal to the notional amount of the swap less the recovery value of the reference obligation or underlying securities comprising an index. Only in the event of the industry's inability to value the underlying asset will the Fund be required to take delivery of the reference obligation or underlying securities comprising an index and pay an amount equal to the notional amount of the swap.
As a buyer, if an underlying credit event occurs, the Fund will receive a net settlement amount of cash equal to the notional amount of the swap less the recovery value of the reference obligation or underlying securities comprising an index. Only in the event of the industry's inability to value the underlying asset will the Fund be required to deliver the reference obligation or underlying securities comprising an index in exchange for payment of an amount equal to the notional amount of the swap.
Typically, the value of each credit default swap and credit rating disclosed for each reference obligation in the Schedule of Investments, where the Fund is the seller, can be used as measures of the current payment/performance risk of the swap. As the value of the swap changes as a positive or negative percentage of the total notional amount, the payment/performance risk may decrease or increase, respectively. In addition to these measures, the investment adviser monitors a variety of factors including cash flow assumptions, market activity and market sentiment as part of its ongoing process of assessing payment/performance risk.
5. Purchases and Sales of Investments.
Purchases and sales of securities (including the Fixed-Income Central Funds), other than short-term securities and U.S. government securities, aggregated $267,231,937 and $106,864,859, respectively.
6. Fees and Other Transactions with Affiliates.
Management Fee. Fidelity Management & Research Company (the investment adviser) and its affiliates provide the Fund with investment management related services for which the Fund pays a monthly management fee. The management fee is the sum of an individual fund fee rate that is based on an annual rate of .20% of the Fund's average net assets and an annualized group fee rate that averaged .11% during the period. The group fee rate is based upon the average net assets of all the mutual funds advised by the investment adviser, including any mutual funds previously advised by the investment adviser that are currently advised by Fidelity SelectCo, LLC, an affiliate of the investment adviser. The group fee rate decreases as assets under management increase and increases as assets under management decrease. For the reporting period, the total annualized management fee rate was .31% of the Fund's average net assets.
Distribution and Service Plan Fees. In accordance with Rule 12b-1 of the 1940 Act, the Fund has adopted separate Distribution and Service Plans for each class of shares. Certain classes pay Fidelity Distributors Corporation (FDC), an affiliate of the investment adviser, separate Distribution and Service Fees, each of which is based on an annual percentage of each class' average net assets. In addition, FDC may pay financial intermediaries for selling shares of the Fund and providing shareholder support services. For the period, the Distribution and Service Fee rates, total fees and amounts retained by FDC were as follows:
| | Distribution
Fee | Service
Fee | Total Fees | Retained
by FDC |
| Class A | -% | .25% | $379,493 | $23,005 |
| Class T | -% | .25% | 242,500 | 792 |
| Class B | .65% | .25% | 4,101 | 2,962 |
| Class C | .75% | .25% | 467,419 | 93,881 |
| | | | $1,093,513 | $120,640 |
Sales Load. FDC may receive a front-end sales charge of up to 2.75% for selling Class A shares and Class T shares, some of which is paid to financial intermediaries for selling shares of the Fund. Depending on the holding period, FDC may receive contingent deferred sales charges levied on Class A, Class T, Class B, and Class C redemptions. The deferred sales charges range from 3.00% to 1.00% for Class B shares, 1.00% for Class C shares, .75% or .50% for certain purchases of Class A shares and .25% for certain purchases of Class T shares.
For the period, sales charge amounts retained by FDC were as follows:
| | Retained
by FDC |
| Class A | $16,720 |
| Class T | 13,688 |
| Class B(a) | 221 |
| Class C(a) | 15,446 |
| | $46,075 |
(a) When Class B and Class C shares are initially sold, FDC pays commissions from its own resources to financial intermediaries through which the sales are made.
Transfer Agent Fees. Fidelity Investments Institutional Operations Company, Inc., (FIIOC), an affiliate of the investment adviser, is the transfer, dividend disbursing and shareholder servicing agent for each class of the Fund. FIIOC receives account fees and asset-based fees that vary according to the account size and type of account of the shareholders of each respective class of the Fund, with the exception of Fidelity Limited Term Bond. FIIOC receives an asset-based fee of .10% of Fidelity Limited Term Bond's average net assets. FIIOC pays for typesetting, printing and mailing of shareholder reports, except proxy statements. For the period, transfer agent fees for each class were as follows:
| | Amount | % of
Class-Level Average
Net Assets(a) |
| Class A | $239,551 | .16 |
| Class T | 159,982 | .17 |
| Class B | 1,134 | .25 |
| Class C | 83,452 | .18 |
| Fidelity Limited Term Bond Fund | 381,484 | .10 |
| Class I | 321,022 | .15 |
| | $1,186,625 | |
(a) Annualized
Fund Wide Operations Fee. Pursuant to the Fund Wide Operations and Expense Agreement (FWOE), the investment adviser has agreed to provide for fund level expenses (which do not include transfer agent, Rule 12b-1 fees, compensation of the independent Trustees, interest (including commitment fees), taxes or extraordinary expenses, if any) in return for a FWOE fee equal to .35% of the Fund's average net assets less the total amount of the management fee. The FWOE paid by the Fund is reduced by an amount equal to the fees and expenses paid to the independent Trustees. For the period, the FWOE fee was equivalent to an annualized rate of .04% of average net assets.
Interfund Trades. The Fund may purchase from or sell securities to other Fidelity Funds under procedures adopted by the Board. The procedures have been designed to ensure these interfund trades are executed in accordance with Rule 17a-7 of the 1940 Act. Interfund trades are included within the respective purchases and sales amounts shown in the Purchases and Sales of Investments note.
7. Committed Line of Credit.
The Fund participates with other funds managed by the investment adviser or an affiliate in a $4.25 billion credit facility (the "line of credit") to be utilized for temporary or emergency purposes to fund shareholder redemptions or for other short-term liquidity purposes. The Fund has agreed to pay commitment fees on its pro-rata portion of the line of credit, which amounted to $1,153 and is reflected in Miscellaneous expenses on the Statement of Operations. During the period, the Fund did not borrow on this line of credit.
8. Security Lending.
The Fund lends portfolio securities from time to time in order to earn additional income. On the settlement date of the loan, the Fund receives collateral (in the form of U.S. Treasury obligations, letters of credit and/or cash) against the loaned securities and maintains collateral in an amount not less than 100% of the market value of the loaned securities during the period of the loan. The market value of the loaned securities is determined at the close of business of the Fund and any additional required collateral is delivered to the Fund on the next business day. The Fund or borrower may terminate the loan at any time, and if the borrower defaults on its obligation to return the securities loaned because of insolvency or other reasons, the Fund may apply collateral received from the borrower against the obligation. The Fund may experience delays and costs in recovering the securities loaned. Any cash collateral received is maintained at the Fund's custodian and/or invested in cash equivalents. The value of loaned securities and cash collateral at period end are disclosed on the Fund's Statement of Assets and Liabilities. Security lending income represents the income earned on investing cash collateral, less rebates paid to borrowers, plus any premium payments received for lending certain types of securities. Security lending income is presented in the Statement of Operations as a component of interest income. Total security lending income during the period amounted to $11,054.
9. Expense Reductions.
Through arrangements with the Fund's custodian, credits realized as a result of certain uninvested cash balances were used to reduce the Fund's expenses. During the period, these credits reduced the Fund's custody expenses by $647.
10. Distributions to Shareholders.
Distributions to shareholders of each class were as follows:
| | Six months ended February 29, 2016 | Year ended August 31, 2015 |
| From net investment income | | |
| Class A | $2,573,225 | $3,729,622 |
| Class T | 1,632,269 | 2,760,770 |
| Class B | 4,349 | 9,214 |
| Class C | 429,725 | 455,450 |
| Fidelity Limited Term Bond Fund | 7,670,510 | 7,753,652 |
| Class I | 4,176,177 | 5,277,048 |
| Total | $16,486,255 | $19,985,756 |
11. Share Transactions.
Share transactions for each class were as follows and may contain automatic conversions between classes or exchanges between affiliated funds:
| | Shares | Shares | Dollars | Dollars |
| | Six months ended February 29, 2016 | Year ended August 31, 2015 | Six months ended February 29, 2016 | Year ended August 31, 2015 |
| Class A | | | | |
| Shares sold | 9,493,588 | 22,883,010 | $108,124,976 | $262,802,297 |
| Reinvestment of distributions | 208,809 | 302,206 | 2,375,945 | 3,471,902 |
| Shares redeemed | (8,625,388) | (15,281,488) | (98,288,046) | (175,517,852) |
| Net increase (decrease) | 1,077,009 | 7,903,728 | $12,212,875 | $90,756,347 |
| Class T | | | | |
| Shares sold | 3,230,355 | 4,726,276 | $36,826,027 | $54,308,583 |
| Reinvestment of distributions | 135,211 | 225,689 | 1,539,145 | 2,594,606 |
| Shares redeemed | (3,279,036) | (5,219,634) | (37,380,244) | (59,996,049) |
| Net increase (decrease) | 86,530 | (267,669) | $984,928 | $(3,092,860) |
| Class B | | | | |
| Shares sold | 23,906 | 45,219 | $272,061 | $518,562 |
| Reinvestment of distributions | 348 | 769 | 3,946 | 8,827 |
| Shares redeemed | (25,488) | (96,326) | (290,091) | (1,103,458) |
| Net increase (decrease) | (1,234) | (50,338) | $(14,084) | $(576,069) |
| Class C | | | | |
| Shares sold | 3,748,755 | 3,762,661 | $42,556,513 | $43,110,911 |
| Reinvestment of distributions | 33,368 | 34,649 | 378,455 | 397,236 |
| Shares redeemed | (1,175,287) | (2,200,235) | (13,359,960) | (25,199,324) |
| Net increase (decrease) | 2,606,836 | 1,597,075 | $29,575,008 | $18,308,823 |
| Fidelity Limited Term Bond Fund | | | | |
| Shares sold | 30,185,709 | 73,683,363 | $344,754,445 | $848,661,103 |
| Reinvestment of distributions | 611,698 | 626,332 | 6,976,952 | 7,211,684 |
| Shares redeemed | (24,008,474) | (20,841,425) | (274,433,242) | (239,689,901) |
| Net increase (decrease) | 6,788,933 | 53,468,270 | $77,298,155 | $616,182,886 |
| Class I | | | | |
| Shares sold | 13,435,969 | 31,060,194 | $153,456,360 | $357,596,586 |
| Reinvestment of distributions | 285,314 | 376,794 | 3,255,224 | 4,341,226 |
| Shares redeemed | (8,802,281) | (12,319,776) | (100,414,966) | (141,915,410) |
| Net increase (decrease) | 4,919,002 | 19,117,212 | $56,296,618 | $220,022,402 |
12. Other.
The Fund's organizational documents provide former and current trustees and officers with a limited indemnification against liabilities arising in connection with the performance of their duties to the Fund. In the normal course of business, the Fund may also enter into contracts that provide general indemnifications. The Fund's maximum exposure under these arrangements is unknown as this would be dependent on future claims that may be made against the Fund. The risk of material loss from such claims is considered remote.
13. Credit Risk.
The Fund invests a portion of its assets in structured securities of issuers backed by commercial and residential mortgage loans, credit card receivables and automotive loans. The value and related income of these securities is sensitive to changes in economic conditions, including delinquencies and/or defaults.
Shareholder Expense Example
As a shareholder of the Fund, you incur two types of costs: (1) transaction costs, including sales charges (loads) on purchase payments or redemption proceeds, and (2) ongoing costs, including management fees, distribution and/or service (12b-1) fees and other Fund expenses. This Example is intended to help you understand your ongoing costs (in dollars) of investing in the Fund and to compare these costs with the ongoing costs of investing in other mutual funds.
The Example is based on an investment of $1,000 invested at the beginning of the period and held for the entire period (September 1, 2015 to February 29, 2016).
Actual Expenses
The first line of the accompanying table for each class of the Fund provides information about actual account values and actual expenses. You may use the information in this line, together with the amount you invested, to estimate the expenses that you paid over the period. Simply divide your account value by $1,000.00 (for example, an $8,600 account value divided by $1,000.00 = 8.6), then multiply the result by the number in the first line for a class of the Fund under the heading entitled "Expenses Paid During Period" to estimate the expenses you paid on your account during this period. A small balance maintenance fee of $12.00 that is charged once a year may apply for certain accounts with a value of less than $2,000. This fee is not included in the table below. If it was, the estimate of expenses you paid during the period would be higher, and your ending account value lower, by this amount. In addition, the Fund, as a shareholder in the underlying Fidelity Central Funds, will indirectly bear its pro-rata share of the fees and expenses incurred by the underlying Fidelity Central Funds. These fees and expenses are not included in the Fund's annualized expense ratio used to calculate the expense estimate in the table below.
Hypothetical Example for Comparison Purposes
The second line of the accompanying table for each class of the Fund provides information about hypothetical account values and hypothetical expenses based on a Class' actual expense ratio and an assumed rate of return of 5% per year before expenses, which is not the Class' actual return. The hypothetical account values and expenses may not be used to estimate the actual ending account balance or expenses you paid for the period. You may use this information to compare the ongoing costs of investing in the Fund and other funds. To do so, compare this 5% hypothetical example with the 5% hypothetical examples that appear in the shareholder reports of the other funds. A small balance maintenance fee of $12.00 that is charged once a year may apply for certain accounts with a value of less than $2,000. This fee is not included in the table below. If it was, the estimate of expenses you paid during the period would be higher, and your ending account value lower, by this amount. In addition, the Fund, as a shareholder in the underlying Fidelity Central Funds, will indirectly bear its pro-rata share of the fees and expenses incurred by the underlying Fidelity Central Funds. These fees and expenses are not included in the Fund's annualized expense ratio used to calculate the expense estimate in the table below.
Please note that the expenses shown in the table are meant to highlight your ongoing costs only and do not reflect any transaction costs. Therefore, the second line of the table is useful in comparing ongoing costs only, and will not help you determine the relative total costs of owning different funds. In addition, if these transactional costs were included, your costs would have been higher.
| | Annualized Expense Ratio-A | Beginning
Account Value
September 1, 2015 | Ending
Account Value
February 29, 2016 | Expenses Paid
During Period-B
September 1, 2015
to February 29, 2016 |
| Class A | .76% | | | |
| Actual | | $1,000.00 | $1,003.20 | $3.79 |
| Hypothetical-C | | $1,000.00 | $1,021.08 | $3.82 |
| Class T | .77% | | | |
| Actual | | $1,000.00 | $1,003.20 | $3.84 |
| Hypothetical-C | | $1,000.00 | $1,021.03 | $3.87 |
| Class B | 1.51% | | | |
| Actual | | $1,000.00 | $999.50 | $7.51 |
| Hypothetical-C | | $1,000.00 | $1,017.35 | $7.57 |
| Class C | 1.54% | | | |
| Actual | | $1,000.00 | $999.30 | $7.66 |
| Hypothetical-C | | $1,000.00 | $1,017.21 | $7.72 |
| Fidelity Limited Term Bond Fund | .45% | | | |
| Actual | | $1,000.00 | $1,004.80 | $2.24 |
| Hypothetical-C | | $1,000.00 | $1,022.63 | $2.26 |
| Class I | .50% | | | |
| Actual | | $1,000.00 | $1,004.50 | $2.49 |
| Hypothetical-C | | $1,000.00 | $1,022.38 | $2.51 |
A Annualized expense ratio reflects expenses net of applicable fee waivers.
B Expenses are equal to each Class' annualized expense ratio, multiplied by the average account value over the period, multiplied by 182/366 (to reflect the one-half year period). The fees and expenses of the underlying Fidelity Central Funds in which the Fund invests are not included in each Class' annualized expense ratio. In addition to the expenses noted above, the Fund also indirectly bears its proportional share of the expenses of the underlying Fidelity Central Funds. Annualized expenses of the underlying non-money market Fidelity Central Funds as of their most recent fiscal half year were less than .005%.
C 5% return per year before expenses
Board Approval of Investment Advisory Contracts and Management Fees
Fidelity Advisor Limited Term Bond Fund
Each year, the Board of Trustees, including the Independent Trustees (together, the Board), votes on the renewal of the management contract with Fidelity Management & Research Company (FMR) and the sub-advisory agreements (together, the Advisory Contracts) for the fund. The Board, assisted by the advice of fund counsel and Independent Trustees' counsel, requests and considers a broad range of information relevant to the renewal of the Advisory Contracts throughout the year.
The Board meets regularly and, at each of its meetings, covers an extensive agenda of topics and materials and considers factors that are relevant to its annual consideration of the renewal of the fund's Advisory Contracts, including the services and support provided to the fund and its shareholders. The Board has established four standing committees (Committees) — Operations, Audit, Fair Valuation, and Governance and Nominating — each composed of and chaired by Independent Trustees with varying backgrounds, to which the Board has assigned specific subject matter responsibilities in order to enhance effective decision-making by the Board. The Operations Committee, of which all of the Independent Trustees are members, meets regularly throughout the year and considers, among other matters, information specifically related to the annual consideration of the renewal of the fund's Advisory Contracts. The Board, acting directly and through its Committees, requests and receives information concerning the annual consideration of the renewal of the fund's Advisory Contracts. The Board also meets as needed to consider matters specifically related to the Board's annual consideration of the renewal of the Advisory Contracts. Members of the Board may also meet with trustees of other Fidelity funds through ad hoc joint committees to discuss certain matters relevant to all of the Fidelity funds.
At its September 2015 meeting, the Board unanimously determined to renew the fund's Advisory Contracts. In reaching its determination, the Board considered all factors it believed relevant, including (i) the nature, extent, and quality of the services to be provided to the fund and its shareholders (including the investment performance of the fund); (ii) the competitiveness of the fund's management fee and total expense ratio relative to peer funds; (iii) the total costs of the services to be provided by and the profits to be realized by Fidelity from its relationship with the fund; and (iv) the extent to which (if any) economies of scale exist and would be realized as the fund grows, and whether any economies of scale are appropriately shared with fund shareholders.
In considering whether to renew the Advisory Contracts for the fund, the Board reached a determination, with the assistance of fund counsel and Independent Trustees' counsel and through the exercise of its business judgment, that the renewal of the Advisory Contracts was in the best interests of the fund and its shareholders and that the compensation payable under the Advisory Contracts was fair and reasonable. The Board's decision to renew the Advisory Contracts was not based on any single factor, but rather was based on a comprehensive consideration of all the information provided to the Board at its meetings throughout the year. The Board, in reaching its determination to renew the Advisory Contracts, was aware that shareholders of the fund have a broad range of investment choices available to them, including a wide choice among funds offered by Fidelity's competitors, and that the fund's shareholders, who have the opportunity to review and weigh the disclosure provided by the fund in its prospectus and other public disclosures, have chosen to invest in this fund, which is part of the Fidelity family of funds.
Nature, Extent, and Quality of Services Provided. The Board considered Fidelity's staffing as it relates to the fund, including the backgrounds of investment personnel of Fidelity, and also considered the fund's investment objective, strategies, and related investment philosophy. The Independent Trustees also had discussions with senior management of Fidelity's investment operations and investment groups. The Board considered the structure of the portfolio manager compensation program and whether this structure provides appropriate incentives to act in the best interests of the fund. Additionally, the Board considered the portfolio managers' investments, if any, in the funds that they manage.
Resources Dedicated to Investment Management and Support Services. The Board reviewed the general qualifications and capabilities of Fidelity's investment staff, including its size, education, experience, and resources, as well as Fidelity's approach to recruiting, training, managing, and compensating investment personnel. The Board noted that Fidelity has continued to increase the resources devoted to non-U.S. offices, including expansion of Fidelity's global investment organization. The Board also noted that Fidelity's analysts have extensive resources, tools and capabilities that allow them to conduct sophisticated quantitative and fundamental analysis, as well as credit analysis of issuers, counterparties and guarantors. Further, the Board considered that Fidelity's investment professionals have sufficient access to global information and data so as to provide competitive investment results over time, and that those professionals also have access to sophisticated tools that permit them to assess portfolio construction and risk and performance attribution characteristics continuously, as well as to transmit new information and research conclusions rapidly around the world. Additionally, in its deliberations, the Board considered Fidelity's trading, risk management, compliance, and technology and operations capabilities and resources, which are integral parts of the investment management process.
Shareholder and Administrative Services. The Board considered (i) the nature, extent, quality, and cost of advisory, administrative, and shareholder services performed by FMR, the sub-advisers (together with FMR, the Investment Advisers), and their affiliates under the Advisory Contracts and under separate agreements covering transfer agency, pricing and bookkeeping, and securities lending services for the fund; (ii) the nature and extent of the supervision of third party service providers, principally custodians, subcustodians, and pricing vendors; and (iii) the resources devoted to, and the record of compliance with, the fund's compliance policies and procedures.
The Board noted that the growth of fund assets over time across the complex allows Fidelity to reinvest in the development of services designed to enhance the value or convenience of the Fidelity funds as investment vehicles. These services include 24-hour access to account information and market information through telephone representatives and over the Internet, investor education materials and asset allocation tools, and the expanded availability of Fidelity Investor Centers.
Investment in a Large Fund Family. The Board considered the benefits to shareholders of investing in a Fidelity fund, including the benefits of investing in a fund that is part of a large family of funds offering a variety of investment disciplines and providing a large variety of mutual fund investor services. The Board noted that Fidelity had taken, or had made recommendations that resulted in the Fidelity funds taking, a number of actions over the previous year that benefited particular funds, including (i) continuing to dedicate additional resources to investment research and to the support of the senior management team that oversees asset management; (ii) continuing efforts to enhance Fidelity's global research capabilities; (iii) launching new funds and making other enhancements to meet client needs; (iv) reducing management fees and total expenses for certain index funds and diversified international funds; (v) continuing to launch dedicated lower cost underlying funds to meet portfolio construction needs related to expanding underlying fund options for Fidelity funds of funds, specifically for the Freedom Fund product lines; (vi) rationalizing product lines and gaining increased efficiencies through fund mergers; (vii) launching active fixed-income exchange-traded funds; (viii) continuing to develop, acquire and implement systems and technology to improve services to the funds and shareholders, strengthen information security, and increase efficiency; (ix) implementing investment enhancements to further strengthen Fidelity's target date product line to increase investors' probability of success in achieving their goals; (x) modifying the eligibility criteria for certain share classes to accommodate roll-over assets from employer-sponsored retirement plans; (xi) launching a new Class W of the Freedom Index Funds to attract and retain Fidelity record-kept retirement plan assets; and (xii) implementing changes to Fidelity's money market product line in response to recent money market regulatory reforms.
Investment Performance. The Board considered whether the fund has operated in accordance with its investment objective, as well as its record of compliance with its investment restrictions and its performance history.
The Board took into account discussions with representatives of the Investment Advisers about fund investment performance that occur at Board meetings throughout the year. In this regard the Board noted that as part of regularly scheduled fund reviews and other reports to the Board on fund performance, the Board considers annualized return information for the fund for different time periods, measured against a securities market index ("benchmark index") and a peer group of funds with similar objectives ("peer group"), if any. In its evaluation of fund investment performance at meetings throughout the year, the Board gave particular attention to information indicating underperformance of certain Fidelity funds for specific time periods and discussed with the Investment Advisers the reasons for such underperformance.
In addition to reviewing absolute and relative fund performance, the Independent Trustees periodically consider the appropriateness of fund performance metrics in evaluating the results achieved. In general, the Independent Trustees believe that fund performance should be evaluated based on gross performance (before fees and expenses but after transaction costs) compared to appropriate benchmark indices, over appropriate time periods that may include full market cycles, and on net performance (after fees and expenses) compared to peer groups, as applicable, over the same periods, taking into account relevant factors including the following: general market conditions; expectations for interest rate levels and credit conditions; issuer-specific information including credit quality; the potential for incremental return versus the fund's benchmark index weighed against the risks involved in obtaining that incremental return, including the risk of diminished or negative total returns; and fund cash flows and other factors. Depending on the circumstances, the Independent Trustees may be satisfied with a fund's performance notwithstanding that it lags its benchmark index or peer group for certain periods.
The Independent Trustees recognize that shareholders evaluate performance on a net basis over their own holding periods, for which one-, three-, and five-year periods are often used as a proxy. For this reason, the performance information reviewed by the Board also included net cumulative calendar year total return information for the fund and an appropriate benchmark index and peer group for the most recent one-, three-, and five-year periods.
Based on its review, the Board concluded that the nature, extent, and quality of services provided to the fund under the Advisory Contracts should benefit the shareholders of the fund.
Competitiveness of Management Fee and Total Expense Ratio. The Board considered the fund's management fee and total expense ratio compared to "mapped groups" of competitive funds and classes created for the purpose of facilitating the Trustees' competitive analysis of management fees and total expenses. Fidelity creates "mapped groups" by combining similar Lipper investment objective categories that have comparable investment mandates. Combining Lipper investment objective categories aids the Board's management fee and total expense ratio comparisons by broadening the competitive group used for comparison.
Management Fee. The Board considered two proprietary management fee comparisons for the 12-month periods shown in basis points (BP) in the chart below. The group of Lipper funds used by the Board for management fee comparisons is referred to below as the "Total Mapped Group" and, for the reasons explained above, is broader than the Lipper peer group used by the Board for performance comparisons. The Total Mapped Group comparison focuses on a fund's standing in terms of gross management fees before expense reimbursements or caps relative to the total universe of funds with comparable investment mandates, regardless of whether their management fee structures also are comparable. Funds with comparable investment mandates offer exposure to similar types of securities. Funds with comparable management fee structures have similar management fee contractual arrangements (
e.g., flat rate charged for advisory services, all-inclusive fee rate,
etc.). "TMG %" represents the percentage of funds in the Total Mapped Group that had management fees that were lower than the fund's. For example, a hypothetical TMG % of 20% would mean that 80% of the funds in the Total Mapped Group had higher, and 20% had lower, management fees than the fund. The fund's actual TMG %s and the number of funds in the Total Mapped Group are in the chart below. The "Asset-Size Peer Group" (ASPG) comparison focuses on a fund's standing relative to a subset of non-Fidelity funds within the Total Mapped Group that are similar in size and management fee structure. For example, if a fund is in the first quartile of the ASPG, the fund's management fee ranks in the least expensive or lowest 25% of funds in the ASPG. The ASPG represents at least 15% of the funds in the Total Mapped Group with comparable asset size and management fee structures, subject to a minimum of 50 funds (or all funds in the Total Mapped Group if fewer than 50). Additional information, such as the ASPG quartile in which the fund's management fee rate ranked, is also included in the chart and considered by the Board.
Fidelity Advisor Limited Term Bond Fund
The Board noted that the fund's management fee rate ranked below the median of its Total Mapped Group and below the median of its ASPG for 2014.
The Board noted that, in 2014, the ad hoc Committee on Group Fee was formed by it and other Fidelity fund boards to conduct an in-depth review of the "group fee" component of the management fee of funds with such management fee structures. Committee focus included the mechanics of the group fee, the competitive landscape of group fee structures, Fidelity funds with no group fee component and investment products not included in group fee assets. The Board also considered that, for funds subject to the group fee, FMR agreed to voluntarily waive fees over a specified period of time in amounts designed to account for assets converted from certain funds to certain collective investment trusts.
Based on its review, the Board concluded that the fund's management fee is fair and reasonable in light of the services that the fund receives and the other factors considered.
Total Expense Ratio. In its review of each class's total expense ratio, the Board considered the fund's management fee rate as well as other fund or class expenses, as applicable, such as transfer agent fees, pricing and bookkeeping fees, fund-paid 12b-1 fees, and custodial, legal, and audit fees. The Board also noted that Fidelity may agree to waive fees and expenses from time to time, and the extent to which, if any, it has done so for the fund. As part of its review, the Board also considered the current and historical total expense ratios of each class of the fund compared to competitive fund median expenses. Each class of the fund is compared to those funds and classes in the Total Mapped Group (used by the Board for management fee comparisons) that have a similar sales load structure.
The Board noted that the total expense ratio of each class ranked below its competitive median for 2014.
The Board considered that the current contractual arrangements for the fund have the effect of setting the total "fund-level" (but not "class-level") expenses (including, among certain other "fund-level" expenses, the management fee) for each class at 0.35%. These contractual arrangements may not be increased without the approval of the Board.
The Board recognized that the fund's management contract incorporates a "group fee" structure, which provides for lower group fee rates as total group assets increase, and for higher group fee rates as total group assets decrease (with "group assets" defined to include fund assets under FMR's management plus sector fund assets previously under FMR's management and currently managed by Fidelity SelectCo, LLC). FMR calculates the group fee rates based on a tiered asset "breakpoint" schedule that varies based on asset class. The Board noted, however, that because the current contractual arrangements set the total "fund-level" expenses for each class at 0.35%, increases or decreases in the management fee due to changes in the group fee rate will not impact the total expense ratio.
Fees Charged to Other Fidelity Clients. The Board also considered Fidelity fee structures and other information with respect to clients of Fidelity, such as other funds advised or subadvised by Fidelity, pension plan clients, and other institutional clients with similar mandates. The Board noted the findings of the 2013 ad hoc joint committee (created with the board of other Fidelity funds), which reviewed and compared Fidelity's institutional investment advisory business with its business of providing services to the Fidelity funds, including the differences in services provided, fees charged, and costs incurred, as well as competition in their respective marketplaces.
Based on its review of total expense ratios and fees charged to other Fidelity clients, the Board concluded that the total expense ratio of each class of the fund was reasonable in light of the services that the fund and its shareholders receive and the other factors considered.
Costs of the Services and Profitability. The Board considered the revenues earned and the expenses incurred by Fidelity in conducting the business of developing, marketing, distributing, managing, administering and servicing the fund and servicing the fund's shareholders. The Board also considered the level of Fidelity's profits in respect of all the Fidelity funds.
On an annual basis, Fidelity presents to the Board information about the profitability of its relationship with the fund. Fidelity calculates profitability information for each fund, as well as aggregate profitability information for groups of Fidelity funds and all Fidelity funds, using a series of detailed revenue and cost allocation methodologies which originate with the books and records of Fidelity on which Fidelity's audited financial statements are based. The Audit Committee of the Board reviews any significant changes from the prior year's methodologies.
PricewaterhouseCoopers LLP (PwC), independent registered public accounting firm and auditor to Fidelity and certain Fidelity funds, has been engaged annually by the Board as part of the Board's assessment of Fidelity's profitability analysis. PwC's engagement includes the review and assessment of the methodologies used by Fidelity in determining the revenues and expenses attributable to Fidelity's mutual fund business, and completion of agreed-upon procedures in respect of the mathematical accuracy of fund profitability and its conformity to established allocation methodologies. After considering PwC's reports issued under the engagement and information provided by Fidelity, the Board concluded that while other allocation methods may also be reasonable, Fidelity's profitability methodologies are reasonable in all material respects.
The Board also reviewed Fidelity's non-fund businesses and fall-out benefits related to the mutual fund business as well as cases where Fidelity's affiliates may benefit from or be related to the fund's business.
The Board considered the costs of the services provided by and the profits realized by Fidelity in connection with the operation of the fund and was satisfied that the profitability was not excessive.
Economies of Scale. The Board considered whether there have been economies of scale in respect of the management of the Fidelity funds, whether the Fidelity funds (including the fund) have appropriately benefited from any such economies of scale, and whether there is potential for realization of any further economies of scale. The Board considered the extent to which the fund will benefit from economies of scale as assets grow through increased services to the fund, through waivers or reimbursements, or through fee or expense ratio reductions. The Board also noted that in 2013, it and the boards of other Fidelity funds created an ad hoc committee (the Economies of Scale Committee) to analyze whether Fidelity attains economies of scale in respect of the management and servicing of the Fidelity funds, whether the Fidelity funds have appropriately benefited from such economies of scale, and whether there is potential for realization of any further economies of scale.
The Board concluded, taking into account the analysis of the Economies of Scale Committee, that economies of scale, if any, are being appropriately shared between fund shareholders and Fidelity.
Additional Information Requested by the Board. In order to develop fully the factual basis for consideration of the Fidelity funds' Advisory Contracts, the Board requested and received additional information on certain topics, including: (i) Fidelity's fund profitability methodology, profitability trends for certain funds, and the impact of certain factors on fund profitability results; (ii) portfolio manager changes that have occurred during the past year and the amount of the investment that each portfolio manager has made in the Fidelity fund(s) that he or she manages; (iii) Fidelity's compensation structure for portfolio managers, research analysts, and other key personnel, including its effects on fund profitability, the rationale for the compensation structure, and the extent to which current market conditions have affected retention and recruitment; (iv) the arrangements with and compensation paid to certain fund sub-advisers on behalf of the Fidelity funds; (v) Fidelity's voluntary waiver of its fees to maintain minimum yields for certain money market funds and classes as well as contractual waivers in place for certain funds; (vi) the methodology with respect to competitive fund data and peer group classifications; (vii) Fidelity's transfer agent fee, expense, and service structures for different funds and classes relative to competitive trends, and the impact of the increased use of omnibus accounts; (viii) Fidelity's long-term expectations for its offerings in the workplace investing channel; (ix) new developments in the retail and institutional marketplaces; and (x) the impact of money market reform on Fidelity's money market funds. In addition, the Board considered its discussions with Fidelity throughout the year regarding enhanced information security initiatives and the funds' fair valuation policies.
Based on its evaluation of all of the conclusions noted above, and after considering all factors it believed relevant, the Board concluded that the advisory fee structures are fair and reasonable, and that the fund's Advisory Contracts should be renewed.
Corporate Headquarters
245 Summer St.
Boston, MA 02210
www.fidelity.com
BTL-SANN-0416
1.9584918.102
Fidelity Advisor® Limited Term Bond Fund
Class I
Semi-Annual Report February 29, 2016 |
|
Contents
To view a fund's proxy voting guidelines and proxy voting record for the 12-month period ended June 30, visit http://www.fidelity.com/proxyvotingresults or visit the Securities and Exchange Commission's (SEC) web site at http://www.sec.gov.
You may also call 1-877-208-0098 to request a free copy of the proxy voting guidelines.
Standard & Poor's, S&P and S&P 500 are registered service marks of The McGraw-Hill Companies, Inc. and have been licensed for use by Fidelity Distributors Corporation.
Other third-party marks appearing herein are the property of their respective owners.
All other marks appearing herein are registered or unregistered trademarks or service marks of FMR LLC or an affiliated company. © 2016 FMR LLC. All rights reserved.
This report and the financial statements contained herein are submitted for the general information of the shareholders of the Fund. This report is not authorized for distribution to prospective investors in the Fund unless preceded or accompanied by an effective prospectus.
A fund files its complete schedule of portfolio holdings with the SEC for the first and third quarters of each fiscal year on Form N-Q. Forms N-Q are available on the SEC’s web site at http://www.sec.gov. A fund's Forms N-Q may be reviewed and copied at the SEC’s Public Reference Room in Washington, DC. Information regarding the operation of the SEC's Public Reference Room may be obtained by calling 1-800-SEC-0330.
For a complete list of a fund's portfolio holdings, view the most recent holdings listing, semiannual report, or annual report on Fidelity's web site at http://www.fidelity.com, http://www.advisor.fidelity.com, or http://www.401k.com, as applicable.
NOT FDIC INSURED •MAY LOSE VALUE •NO BANK GUARANTEE
Neither the Fund nor Fidelity Distributors Corporation is a bank.
Investment Summary (Unaudited)
The information in the following tables is based on the combined investments of the Fund and its pro-rata share of the investments of Fidelity's Fixed-Income Central Funds.
Quality Diversification (% of fund's net assets)
| As of February 29, 2016 |
| | U.S. Government and U.S. Government Agency Obligations | 10.0% |
| | AAA | 14.5% |
| | AA | 3.6% |
| | A | 26.3% |
| | BBB | 38.5% |
| | BB and Below | 6.6% |
| | Not Rated | 0.3% |
| | Short-Term Investments and Net Other Assets | 0.2% |

| As of August 31, 2015 |
| | U.S. Government and U.S. Government Agency Obligations | 7.9% |
| | AAA | 16.1% |
| | AA | 4.3% |
| | A | 27.8% |
| | BBB | 37.0% |
| | BB and Below | 4.7% |
| | Not Rated | 0.1% |
| | Short-Term Investments and Net Other Assets | 2.1% |

We have used ratings from Moody's Investors Service, Inc. Where Moody's® ratings are not available, we have used S&P® ratings. All ratings are as of the date indicated and do not reflect subsequent changes.
Weighted Average Maturity as of February 29, 2016
| | | 6 months ago |
| Years | 2.7 | 2.9 |
This is a weighted average of all the maturities of the securities held in a fund. Weighted Average Maturity (WAM) can be used as a measure of sensitivity to interest rate changes and market changes. Generally, the longer the maturity, the greater the sensitivity to such changes. WAM is based on the dollar-weighted average length of time until principal payments must be paid. Depending on the types of securities held in a fund, certain maturity shortening devices (e.g., demand features, interest rate resets, and call options) may be taken into account when calculating the WAM.
Duration as of February 29, 2016
| | | 6 months ago |
| Years | 2.6 | 2.7 |
Duration is a measure of a security's price sensitivity to changes in interest rates. Duration differs from maturity in that it considers a security's interest payments in addition to the amount of time until the security reaches maturity, and also takes into account certain maturity shortening features (e.g., demand features, interest rate resets, and call options) when applicable. Securities with longer durations generally tend to be more sensitive to interest rate changes than securities with shorter durations. A fund with a longer average duration generally can be expected to be more sensitive to interest rate changes than a fund with a shorter average duration.
Asset Allocation (% of fund's net assets)
| As of February 29, 2016*,** |
| | Corporate Bonds | 70.3% |
| | U.S. Government and U.S. Government Agency Obligations | 10.0% |
| | Asset-Backed Securities | 8.4% |
| | CMOs and Other Mortgage Related Securities | 7.7% |
| | Municipal Bonds | 0.8% |
| | Other Investments | 2.6% |
| | Short-Term Investments and Net Other Assets (Liabilities) | 0.2% |

* Foreign investments - 15.5%
** Futures and Swaps - 0.0%
| As of August 31, 2015*,** |
| | Corporate Bonds | 68.9% |
| | U.S. Government and U.S. Government Agency Obligations | 7.9% |
| | Asset-Backed Securities | 9.4% |
| | CMOs and Other Mortgage Related Securities | 8.5% |
| | Municipal Bonds | 0.4% |
| | Other Investments | 2.8% |
| | Short-Term Investments and Net Other Assets (Liabilities) | 2.1% |

* Foreign investments - 15.6%
** Futures and Swaps - 0.0%
An unaudited holdings listing for the Fund, which presents direct holdings as well as the pro-rata share of any securities and other investments held indirectly through its investment in underlying non-money market Fidelity Central Funds, is available at fidelity.com and/or advisor.fidelity.com, as applicable.
Percentages shown as 0.0% may reflect amounts less than 0.05%.
Investments February 29, 2016 (Unaudited)
Showing Percentage of Net Assets
| Nonconvertible Bonds - 69.7% | | | |
| | | Principal Amount | Value |
| CONSUMER DISCRETIONARY - 6.9% | | | |
| Automobiles - 2.3% | | | |
| American Honda Finance Corp.: | | | |
| 1.2% 7/14/17 | | $5,000,000 | $4,989,465 |
| 1.7% 2/22/19 | | 1,918,000 | 1,920,835 |
| 2.125% 10/10/18 | | 500,000 | 505,172 |
| Daimler Finance North America LLC: | | | |
| 1.375% 8/1/17 (a) | | 2,000,000 | 1,987,328 |
| 1.45% 8/1/16 (a) | | 1,461,000 | 1,461,260 |
| 1.65% 5/18/18 (a) | | 3,000,000 | 2,962,203 |
| 2.25% 3/2/20 (a) | | 3,020,000 | 2,975,839 |
| 2.375% 8/1/18 (a) | | 1,000,000 | 1,005,376 |
| General Motors Financial Co., Inc.: | | | |
| 2.4% 4/10/18 | | 3,000,000 | 2,947,344 |
| 3% 9/25/17 | | 3,000,000 | 3,002,646 |
| 3.15% 1/15/20 | | 5,000,000 | 4,885,795 |
| 3.2% 7/13/20 | | 5,000,000 | 4,833,350 |
| 4.2% 3/1/21 | | 3,000,000 | 3,004,503 |
| Volkswagen Group of America Finance LLC: | | | |
| 1.25% 5/23/17 (a) | | 1,000,000 | 982,470 |
| 2.4% 5/22/20 (a) | | 3,098,000 | 2,937,582 |
| Volkswagen International Finance NV: | | | |
| 1.6% 11/20/17 (a) | | 620,000 | 607,431 |
| 2.125% 11/20/18 (a) | | 1,500,000 | 1,451,678 |
| 2.375% 3/22/17 (a) | | 600,000 | 599,731 |
| | | | 43,060,008 |
| Diversified Consumer Services - 0.0% | | | |
| Ingersoll-Rand Global Holding Co. Ltd. 6.875% 8/15/18 | | 1,020,000 | 1,126,623 |
| Hotels, Restaurants & Leisure - 0.3% | | | |
| McDonald's Corp.: | | | |
| 2.1% 12/7/18 | | 742,000 | 751,582 |
| 2.2% 5/26/20 | | 5,000,000 | 5,046,465 |
| 2.75% 12/9/20 | | 345,000 | 355,023 |
| | | | 6,153,070 |
| Household Durables - 0.4% | | | |
| D.R. Horton, Inc.: | | | |
| 3.75% 3/1/19 | | 2,000,000 | 2,035,000 |
| 4% 2/15/20 | | 3,000,000 | 3,052,500 |
| Toll Brothers Finance Corp. 4% 12/31/18 | | 2,500,000 | 2,556,250 |
| | | | 7,643,750 |
| Media - 3.9% | | | |
| 21st Century Fox America, Inc. 6.9% 3/1/19 | | 750,000 | 851,442 |
| British Sky Broadcasting Group PLC 2.625% 9/16/19 (a) | | 3,000,000 | 3,011,283 |
| CBS Corp. 2.3% 8/15/19 | | 1,500,000 | 1,507,266 |
| Charter Communications Operating LLC/Charter Communications Operating Capital Corp. 3.579% 7/23/20 (a) | | 10,000,000 | 10,024,900 |
| Comcast Corp.: | | | |
| 5.7% 5/15/18 | | 42,000 | 45,824 |
| 6.3% 11/15/17 | | 6,000,000 | 6,491,640 |
| COX Communications, Inc. 6.25% 6/1/18 (a) | | 4,000,000 | 4,283,500 |
| DIRECTV Holdings LLC/DIRECTV Financing, Inc.: | | | |
| 2.4% 3/15/17 | | 2,700,000 | 2,726,544 |
| 5.875% 10/1/19 | | 5,034,000 | 5,631,294 |
| Discovery Communications LLC 5.05% 6/1/20 | | 322,000 | 337,086 |
| NBCUniversal Enterprise, Inc. 1.974% 4/15/19 (a) | | 3,000,000 | 3,018,849 |
| Thomson Reuters Corp.: | | | |
| 0.875% 5/23/16 | | 278,000 | 277,708 |
| 1.65% 9/29/17 | | 5,050,000 | 5,028,633 |
| Time Warner Cable, Inc.: | | | |
| 5.85% 5/1/17 | | 4,996,000 | 5,187,806 |
| 6.75% 7/1/18 | | 1,141,000 | 1,243,342 |
| 8.25% 4/1/19 | | 500,000 | 571,677 |
| Time Warner, Inc.: | | | |
| 2.1% 6/1/19 | | 2,000,000 | 1,982,546 |
| 6.875% 6/15/18 | | 5,095,000 | 5,642,483 |
| Viacom, Inc.: | | | |
| 2.2% 4/1/19 | | 6,000,000 | 5,887,974 |
| 3.5% 4/1/17 | | 455,000 | 459,508 |
| 6.125% 10/5/17 | | 3,179,000 | 3,337,079 |
| Walt Disney Co. 1.85% 5/30/19 | | 6,000,000 | 6,110,034 |
| | | | 73,658,418 |
|
| TOTAL CONSUMER DISCRETIONARY | | | 131,641,869 |
|
| CONSUMER STAPLES - 6.1% | | | |
| Beverages - 1.1% | | | |
| Anheuser-Busch InBev Finance, Inc.: | | | |
| 1.9% 2/1/19 | | 5,000,000 | 5,047,390 |
| 2.15% 2/1/19 | | 1,500,000 | 1,521,384 |
| 2.65% 2/1/21 | | 3,890,000 | 3,959,207 |
| 3.3% 2/1/23 | | 4,190,000 | 4,307,245 |
| Heineken NV 1.4% 10/1/17 (a) | | 321,000 | 320,893 |
| PepsiCo, Inc. 7.9% 11/1/18 | | 815,000 | 948,238 |
| SABMiller Holdings, Inc.: | | | |
| 2.2% 8/1/18 (a) | | 2,310,000 | 2,322,703 |
| 2.45% 1/15/17 (a) | | 1,280,000 | 1,290,098 |
| | | | 19,717,158 |
| Food & Staples Retailing - 1.1% | | | |
| CVS Health Corp.: | | | |
| 1.9% 7/20/18 | | 1,549,000 | 1,555,249 |
| 2.25% 12/5/18 | | 8,376,000 | 8,462,742 |
| 2.25% 8/12/19 | | 5,000,000 | 5,058,430 |
| 2.8% 7/20/20 | | 1,496,000 | 1,531,983 |
| Kroger Co. 1.1496% 10/17/16 (b) | | 5,000,000 | 5,002,120 |
| | | | 21,610,524 |
| Food Products - 1.8% | | | |
| Cargill, Inc. 6% 11/27/17 (a) | | 106,000 | 113,511 |
| ConAgra Foods, Inc. 1.9% 1/25/18 | | 2,222,000 | 2,220,116 |
| General Mills, Inc.: | | | |
| 1.4% 10/20/17 | | 3,000,000 | 3,000,747 |
| 2.2% 10/21/19 | | 2,000,000 | 2,020,428 |
| 5.7% 2/15/17 | | 5,000,000 | 5,216,580 |
| Kraft Foods Group, Inc.: | | | |
| 2.25% 6/5/17 | | 610,000 | 614,731 |
| 5.375% 2/10/20 | | 5,000,000 | 5,533,035 |
| The J.M. Smucker Co.: | | | |
| 1.75% 3/15/18 | | 5,874,000 | 5,855,291 |
| 2.5% 3/15/20 | | 1,964,000 | 1,980,482 |
| Tyson Foods, Inc. 2.65% 8/15/19 | | 7,000,000 | 7,094,591 |
| William Wrigley Jr. Co. 2% 10/20/17 (a) | | 428,000 | 429,018 |
| | | | 34,078,530 |
| Tobacco - 2.1% | | | |
| Altria Group, Inc. 2.625% 1/14/20 | | 5,000,000 | 5,093,715 |
| BAT International Finance PLC: | | | |
| 1.85% 6/15/18 (a) | | 7,000,000 | 7,028,826 |
| 2.75% 6/15/20 (a) | | 3,160,000 | 3,227,204 |
| Imperial Tobacco Finance PLC: | | | |
| 2.05% 2/11/18 (a) | | 1,906,000 | 1,904,205 |
| 2.05% 7/20/18 (a) | | 2,866,000 | 2,852,217 |
| 2.95% 7/21/20 (a) | | 3,000,000 | 3,042,849 |
| Philip Morris International, Inc.: | | | |
| 1.25% 8/11/17 | | 2,907,000 | 2,913,686 |
| 1.875% 1/15/19 | | 2,641,000 | 2,672,975 |
| 2.15% 2/25/21 | | 3,088,000 | 3,069,932 |
| Reynolds American, Inc.: | | | |
| 2.3% 6/12/18 | | 5,704,000 | 5,764,970 |
| 3.25% 6/12/20 | | 1,162,000 | 1,208,456 |
| 4% 6/12/22 | | 1,077,000 | 1,162,732 |
| 6.75% 6/15/17 | | 513,000 | 550,695 |
| | | | 40,492,462 |
|
| TOTAL CONSUMER STAPLES | | | 115,898,674 |
|
| ENERGY - 6.4% | | | |
| Energy Equipment & Services - 1.2% | | | |
| DCP Midstream LLC 5.35% 3/15/20 (a) | | 6,738,000 | 5,074,105 |
| El Paso Pipeline Partners Operating Co. LLC 6.5% 4/1/20 | | 768,000 | 775,116 |
| Halliburton Co. 2.7% 11/15/20 | | 10,247,000 | 10,100,007 |
| Nabors Industries, Inc. 2.35% 9/15/16 | | 257,000 | 254,406 |
| National Oilwell Varco, Inc. 1.35% 12/1/17 | | 620,000 | 601,065 |
| Noble Holding International Ltd.: | | | |
| 2.5% 3/15/17 | | 2,062,000 | 1,972,447 |
| 4% 3/16/18 | | 102,000 | 81,600 |
| Petrofac Ltd. 3.4% 10/10/18 (a) | | 1,000,000 | 848,196 |
| Transocean, Inc. 3% 10/15/17 (b) | | 3,500,000 | 3,150,000 |
| | | | 22,856,942 |
| Oil, Gas & Consumable Fuels - 5.2% | | | |
| Anadarko Petroleum Corp.: | | | |
| 5.95% 9/15/16 | | 45,000 | 45,258 |
| 6.375% 9/15/17 | | 555,000 | 563,897 |
| BG Energy Capital PLC 2.875% 10/15/16 (a) | | 620,000 | 623,156 |
| BP Capital Markets PLC: | | | |
| 1.375% 5/10/18 | | 5,000,000 | 4,900,130 |
| 2.248% 11/1/16 | | 620,000 | 623,230 |
| 2.521% 1/15/20 | | 4,688,000 | 4,602,936 |
| Canadian Natural Resources Ltd. 1.75% 1/15/18 | | 415,000 | 379,270 |
| Cenovus Energy, Inc. 5.7% 10/15/19 | | 297,000 | 262,092 |
| Chevron Corp. 1.961% 3/3/20 | | 4,000,000 | 3,945,772 |
| Columbia Pipeline Group, Inc.: | | | |
| 2.45% 6/1/18 (a) | | 2,107,000 | 2,021,527 |
| 3.3% 6/1/20 (a) | | 1,439,000 | 1,347,461 |
| ConocoPhillips Co.: | | | |
| 1.5% 5/15/18 | | 4,373,000 | 4,174,816 |
| 2.2% 5/15/20 | | 1,962,000 | 1,813,934 |
| DCP Midstream Operating LP: | | | |
| 2.5% 12/1/17 | | 292,000 | 266,520 |
| 2.7% 4/1/19 | | 821,000 | 673,348 |
| Devon Energy Corp. 2.25% 12/15/18 | | 3,484,000 | 3,036,045 |
| El Paso Natural Gas Co. 5.95% 4/15/17 | | 21,000 | 21,247 |
| Enable Midstream Partners LP 2.4% 5/15/19 | | 174,000 | 134,048 |
| Enbridge, Inc. 0.8662% 6/2/17 (b) | | 2,613,000 | 2,497,215 |
| Encana Corp. 6.5% 5/15/19 | | 5,000,000 | 4,106,895 |
| EnLink Midstream Partners LP 2.7% 4/1/19 | | 785,000 | 612,715 |
| Enterprise Products Operating LP: | | | |
| 1.65% 5/7/18 | | 3,631,000 | 3,508,058 |
| 2.55% 10/15/19 | | 178,000 | 172,265 |
| Exxon Mobil Corp.: | | | |
| 2.25% 3/1/21 | | 3,780,000 | 3,780,000 |
| 2.75% 3/1/23 | | 2,954,000 | 2,954,000 |
| Gulfstream Natural Gas System LLC 6.95% 6/1/16 (a) | | 20,000 | 20,233 |
| Kinder Morgan Energy Partners LP 2.65% 2/1/19 | | 1,737,000 | 1,624,635 |
| Kinder Morgan, Inc.: | | | |
| 2% 12/1/17 | | 393,000 | 375,315 |
| 3.05% 12/1/19 | | 3,758,000 | 3,469,198 |
| Marathon Petroleum Corp.: | | | |
| 2.7% 12/14/18 | | 436,000 | 422,271 |
| 3.5% 3/1/16 | | 875,000 | 875,000 |
| Petro-Canada 6.05% 5/15/18 | | 3,326,000 | 3,402,714 |
| Petrobras Global Finance BV 3.25% 3/17/17 | | 3,500,000 | 3,391,500 |
| Petrobras International Finance Co. Ltd. 5.875% 3/1/18 | | 3,000,000 | 2,814,150 |
| Petroleos Mexicanos: | | | |
| 3.125% 1/23/19 | | 77,000 | 74,866 |
| 3.5% 7/18/18 | | 5,000,000 | 4,962,500 |
| 3.5% 7/23/20 (a) | | 1,355,000 | 1,277,088 |
| 5.5% 2/4/19 (a) | | 2,000,000 | 2,068,000 |
| 6.375% 2/4/21 (a) | | 2,000,000 | 2,079,500 |
| Phillips 66 Co. 2.95% 5/1/17 | | 1,260,000 | 1,275,823 |
| Plains All American Pipeline LP/PAA Finance Corp.: | | | |
| 2.6% 12/15/19 | | 3,000,000 | 2,662,155 |
| 5.75% 1/15/20 | | 962,000 | 927,449 |
| Schlumberger Investment SA 1.25% 8/1/17 (a) | | 1,000,000 | 982,971 |
| Shell International Finance BV 2.125% 5/11/20 | | 2,287,000 | 2,227,234 |
| Southwestern Energy Co.: | | | |
| 3.3% 1/23/18 | | 2,476,000 | 1,782,720 |
| 4.05% 1/23/20 | | 864,000 | 557,280 |
| Spectra Energy Capital, LLC 5.65% 3/1/20 | | 28,000 | 27,963 |
| Spectra Energy Partners, LP 2.95% 9/25/18 | | 90,000 | 88,608 |
| Suncor Energy, Inc. 6.1% 6/1/18 | | 944,000 | 968,638 |
| Total Capital International SA 2.125% 1/10/19 | | 2,000,000 | 1,994,442 |
| TransCanada PipeLines Ltd.: | | | |
| 1.4111% 1/12/18 (b) | | 2,500,000 | 2,454,215 |
| 1.625% 11/9/17 | | 3,000,000 | 2,947,137 |
| 1.875% 1/12/18 | | 3,000,000 | 2,942,763 |
| 3.125% 1/15/19 | | 1,693,000 | 1,703,783 |
| Transcontinental Gas Pipe Line Corp. 6.4% 4/15/16 | | 394,000 | 394,288 |
| Western Gas Partners LP: | | | |
| 2.6% 8/15/18 | | 1,257,000 | 1,098,480 |
| 5.375% 6/1/21 | | 600,000 | 512,543 |
| | | | 99,471,297 |
|
| TOTAL ENERGY | | | 122,328,239 |
|
| FINANCIALS - 33.4% | | | |
| Banks - 16.2% | | | |
| ABN AMRO Bank NV 2.5% 10/30/18 (a) | | 4,000,000 | 4,036,288 |
| Australia & New Zealand Banking Group Ltd.: | | | |
| 1.45% 5/15/18 | | 570,000 | 566,226 |
| 2.25% 6/13/19 | | 2,000,000 | 2,008,374 |
| Banco Nacional de Desenvolvimento Economico e Social: | | | |
| 3.375% 9/26/16 (a) | | 520,000 | 518,700 |
| 4% 4/14/19 (a) | | 2,575,000 | 2,369,000 |
| 6.369% 6/16/18(a) | | 962,000 | 967,291 |
| Bank of America Corp.: | | | |
| 1.7% 8/25/17 | | 4,428,000 | 4,406,537 |
| 2% 1/11/18 | | 11,200,000 | 11,160,733 |
| 2.25% 4/21/20 | | 6,000,000 | 5,880,714 |
| 2.6% 1/15/19 | | 7,495,000 | 7,530,421 |
| 2.65% 4/1/19 | | 7,100,000 | 7,136,210 |
| 5.75% 12/1/17 | | 1,150,000 | 1,219,627 |
| Bank of Nova Scotia 2.8% 7/21/21 | | 2,000,000 | 2,037,454 |
| Bank of Tokyo-Mitsubishi UFJ Ltd.: | | | |
| 1.65% 2/26/18 (a) | | 590,000 | 587,812 |
| 2.3% 3/5/20 (a) | | 3,000,000 | 2,979,918 |
| 2.35% 9/8/19 (a) | | 3,050,000 | 3,070,072 |
| 2.7% 9/9/18 (a) | | 500,000 | 507,476 |
| Barclays PLC: | | | |
| 2% 3/16/18 | | 5,000,000 | 4,902,945 |
| 2.75% 11/8/19 | | 2,831,000 | 2,779,985 |
| 2.875% 6/8/20 | | 3,000,000 | 2,875,242 |
| 3.25% 1/12/21 | | 2,046,000 | 1,972,520 |
| BNP Paribas 2.375% 9/14/17 | | 6,000,000 | 6,057,180 |
| BNP Paribas SA 2.375% 5/21/20 | | 3,000,000 | 2,963,892 |
| BPCE SA: | | | |
| 1.625% 2/10/17 | | 450,000 | 449,508 |
| 2.5% 7/15/19 | | 2,000,000 | 2,012,936 |
| Capital One NA: | | | |
| 2.35% 8/17/18 | | 500,000 | 497,679 |
| 2.4% 9/5/19 | | 2,000,000 | 1,973,672 |
| CIT Group, Inc. 3.875% 2/19/19 | | 5,090,000 | 5,064,550 |
| Citigroup, Inc.: | | | |
| 0.747% 6/9/16 (b) | | 3,000,000 | 2,995,281 |
| 1.55% 8/14/17 | | 2,000,000 | 1,989,300 |
| 1.7% 4/27/18 | | 1,500,000 | 1,484,054 |
| 1.75% 5/1/18 | | 2,870,000 | 2,841,601 |
| 1.85% 11/24/17 | | 3,000,000 | 2,990,352 |
| 2.15% 7/30/18 | | 2,000,000 | 1,992,866 |
| 2.4% 2/18/20 | | 4,000,000 | 3,964,536 |
| 2.5% 9/26/18 | | 1,500,000 | 1,509,650 |
| 2.5% 7/29/19 | | 2,000,000 | 2,004,824 |
| 2.55% 4/8/19 | | 3,000,000 | 3,009,075 |
| 2.65% 10/26/20 | | 3,000,000 | 2,995,935 |
| 4.4% 6/10/25 | | 2,604,000 | 2,596,412 |
| Citizens Bank NA: | | | |
| 2.3% 12/3/18 | | 1,384,000 | 1,385,749 |
| 2.45% 12/4/19 | | 3,000,000 | 2,976,399 |
| Comerica, Inc. 2.125% 5/23/19 | | 345,000 | 339,321 |
| Commonwealth Bank of Australia: | | | |
| 2.25% 3/13/19 | | 750,000 | 755,015 |
| 2.3% 9/6/19 | | 2,000,000 | 2,013,424 |
| Cooperatieve Centrale Raiffeisen-Boerenleenbank BA 1.7% 3/19/18 | | 2,000,000 | 1,997,872 |
| Credit Agricole SA 2.75% 6/10/20 (a) | | 8,000,000 | 8,052,856 |
| Credit Suisse AG 6% 2/15/18 | | 3,680,000 | 3,896,012 |
| Credit Suisse New York Branch: | | | |
| 1.75% 1/29/18 | | 2,000,000 | 1,987,596 |
| 2.3% 5/28/19 | | 5,750,000 | 5,703,437 |
| 3% 10/29/21 | | 1,500,000 | 1,501,599 |
| Discover Bank: | | | |
| 2% 2/21/18 | | 5,920,000 | 5,848,623 |
| 2.6% 11/13/18 | | 2,000,000 | 1,997,984 |
| Fifth Third Bancorp: | | | |
| 2.3% 3/1/19 | | 279,000 | 279,360 |
| 2.875% 7/27/20 | | 3,200,000 | 3,225,056 |
| 4.5% 6/1/18 | | 3,024,000 | 3,182,355 |
| 5.45% 1/15/17 | | 291,000 | 300,530 |
| Fifth Third Bank 2.375% 4/25/19 | | 1,000,000 | 1,004,531 |
| First Horizon National Corp. 3.5% 12/15/20 | | 3,000,000 | 2,978,658 |
| HBOS PLC 6.75% 5/21/18 (a) | | 509,000 | 547,333 |
| HSBC Bank PLC 1.5% 5/15/18 (a) | | 1,570,000 | 1,560,379 |
| HSBC U.S.A., Inc.: | | | |
| 2.375% 11/13/19 | | 3,000,000 | 2,968,404 |
| 2.625% 9/24/18 | | 262,000 | 263,510 |
| Huntington Bancshares, Inc. 7% 12/15/20 | | 180,000 | 213,584 |
| Huntington National Bank 2.2% 4/1/19 | | 1,000,000 | 991,448 |
| ING Bank NV 1.8% 3/16/18 (a) | | 3,000,000 | 2,994,819 |
| Intesa Sanpaolo SpA 2.375% 1/13/17 | | 10,750,000 | 10,784,121 |
| JPMorgan Chase & Co.: | | | |
| 1.35% 2/15/17 | | 2,500,000 | 2,500,718 |
| 1.625% 5/15/18 | | 4,500,000 | 4,477,964 |
| 2% 8/15/17 | | 4,500,000 | 4,520,547 |
| 2.2% 10/22/19 | | 10,058,000 | 10,052,247 |
| 2.25% 1/23/20 | | 3,000,000 | 2,993,340 |
| 2.35% 1/28/19 | | 1,942,000 | 1,961,261 |
| 2.55% 10/29/20 | | 3,000,000 | 3,006,915 |
| 2.75% 6/23/20 | | 3,000,000 | 3,032,724 |
| KeyCorp. 2.3% 12/13/18 | | 2,000,000 | 2,000,810 |
| La Caisse Centrale 1.75% 1/29/18 (a) | | 4,000,000 | 3,971,088 |
| Lloyds Bank PLC 1.75% 3/16/18 | | 3,000,000 | 2,985,951 |
| Manufacturers & Traders Trust Co. 2.1% 2/6/20 | | 3,000,000 | 2,958,391 |
| Mitsubishi UFJ Financial Group, Inc. 2.95% 3/1/21 | | 4,000,000 | 4,035,252 |
| Mizuho Bank Ltd.: | | | |
| 1.55% 10/17/17 (a) | | 1,940,000 | 1,928,211 |
| 1.8% 3/26/18 (a) | | 1,500,000 | 1,492,547 |
| 2.45% 4/16/19 (a) | | 1,400,000 | 1,409,345 |
| 2.65% 9/25/19 (a) | | 2,000,000 | 2,027,798 |
| MUFG Americas Holdings Corp. 2.25% 2/10/20 | | 1,241,000 | 1,225,025 |
| Nordea Bank AB 2.375% 4/4/19 (a) | | 1,000,000 | 1,007,280 |
| PNC Bank NA: | | | |
| 1.5% 2/23/18 | | 2,100,000 | 2,094,303 |
| 1.8% 11/5/18 | | 2,000,000 | 1,999,910 |
| 2.4% 10/18/19 | | 3,000,000 | 3,041,841 |
| Regions Financial Corp.: | | | |
| 2% 5/15/18 | | 5,330,000 | 5,282,739 |
| 3.2% 2/8/21 | | 4,000,000 | 3,980,616 |
| Royal Bank of Canada: | | | |
| 1.5% 1/16/18 | | 2,720,000 | 2,716,176 |
| 4.65% 1/27/26 | | 2,144,000 | 2,162,595 |
| Royal Bank of Scotland Group PLC 1.5431% 3/31/17 (b) | | 8,715,000 | 8,687,260 |
| Sumitomo Mitsui Banking Corp.: | | | |
| 1.8% 7/18/17 | | 940,000 | 941,262 |
| 2.25% 7/11/19 | | 3,500,000 | 3,502,478 |
| 2.45% 1/10/19 | | 590,000 | 595,455 |
| 2.45% 1/16/20 | | 3,000,000 | 3,001,353 |
| 2.65% 7/23/20 | | 3,000,000 | 3,029,907 |
| SunTrust Banks, Inc.: | | | |
| 2.35% 11/1/18 | | 924,000 | 926,272 |
| 2.5% 5/1/19 | | 550,000 | 552,672 |
| 3% 3/3/21 | | 2,828,000 | 2,821,863 |
| 3.5% 1/20/17 | | 1,378,000 | 1,401,239 |
| Svenska Handelsbanken AB 1.625% 3/21/18 | | 2,000,000 | 1,994,100 |
| The Toronto-Dominion Bank: | | | |
| 2.25% 11/5/19 | | 2,000,000 | 2,022,318 |
| 2.625% 9/10/18 | | 1,200,000 | 1,223,944 |
| Wells Fargo & Co.: | | | |
| 1.5% 1/16/18 | | 1,300,000 | 1,297,769 |
| 2.15% 1/15/19 | | 5,500,000 | 5,538,621 |
| 2.6% 7/22/20 | | 3,000,000 | 3,034,137 |
| | | | 308,093,067 |
| Capital Markets - 4.5% | | | |
| Deutsche Bank AG London Branch: | | | |
| 1.4% 2/13/17 | | 1,000,000 | 993,530 |
| 2.5% 2/13/19 | | 2,250,000 | 2,201,945 |
| Goldman Sachs Group, Inc.: | | | |
| 1.312% 12/15/17 (b) | | 3,000,000 | 2,986,422 |
| 2.375% 1/22/18 | | 8,850,000 | 8,903,658 |
| 2.625% 1/31/19 | | 13,000,000 | 13,098,852 |
| 5.95% 1/18/18 | | 1,693,000 | 1,805,222 |
| 6.15% 4/1/18 | | 402,000 | 433,292 |
| Lazard Group LLC: | | | |
| 4.25% 11/14/20 | | 543,000 | 557,173 |
| 6.85% 6/15/17 | | 125,000 | 131,425 |
| Legg Mason, Inc. 2.7% 7/15/19 | | 2,000,000 | 2,027,170 |
| Merrill Lynch & Co., Inc.: | | | |
| 6.4% 8/28/17 | | 40,000 | 42,433 |
| 6.875% 4/25/18 | | 726,000 | 792,950 |
| Morgan Stanley: | | | |
| 1.875% 1/5/18 | | 2,000,000 | 1,995,018 |
| 2.125% 4/25/18 | | 3,580,000 | 3,578,965 |
| 2.375% 7/23/19 | | 9,660,000 | 9,638,941 |
| 2.5% 1/24/19 | | 1,750,000 | 1,759,051 |
| 2.65% 1/27/20 | | 11,000,000 | 10,983,522 |
| 4.75% 3/22/17 | | 2,000,000 | 2,065,596 |
| 4.875% 11/1/22 | | 2,000,000 | 2,108,646 |
| 5.5% 1/26/20 | | 2,000,000 | 2,197,642 |
| 5.625% 9/23/19 | | 112,000 | 122,919 |
| 5.95% 12/28/17 | | 383,000 | 408,970 |
| 7.3% 5/13/19 | | 603,000 | 689,615 |
| UBS AG Stamford Branch: | | | |
| 1.3031% 3/26/18 (b) | | 3,000,000 | 2,992,602 |
| 1.375% 6/1/17 | | 5,675,000 | 5,660,688 |
| 1.375% 8/14/17 | | 6,700,000 | 6,674,969 |
| | | | 84,851,216 |
| Consumer Finance - 4.4% | | | |
| Ally Financial, Inc.: | | | |
| 3.25% 2/13/18 | | 3,000,000 | 2,970,000 |
| 3.25% 11/5/18 | | 3,000,000 | 2,947,500 |
| American Express Co. 1.55% 5/22/18 | | 3,000,000 | 2,968,890 |
| American Express Credit Corp. 2.125% 3/18/19 | | 5,520,000 | 5,521,932 |
| American Honda Finance Corp. 1.5% 9/11/17 (a) | | 620,000 | 620,854 |
| Capital One Financial Corp. 2.45% 4/24/19 | | 5,450,000 | 5,449,995 |
| Discover Financial Services 6.45% 6/12/17 | | 3,381,000 | 3,545,655 |
| Ford Motor Credit Co. LLC: | | | |
| 1.461% 3/27/17 | | 2,000,000 | 1,986,500 |
| 1.684% 9/8/17 | | 1,000,000 | 985,346 |
| 2.145% 1/9/18 | | 2,500,000 | 2,487,068 |
| 2.24% 6/15/18 | | 6,000,000 | 5,913,252 |
| 2.597% 11/4/19 | | 5,000,000 | 4,926,150 |
| 2.875% 10/1/18 | | 2,500,000 | 2,501,283 |
| 3% 6/12/17 | | 4,500,000 | 4,537,733 |
| 3.157% 8/4/20 | | 3,000,000 | 2,987,739 |
| General Electric Capital Corp. 2.2% 1/9/20 | | 2,577,000 | 2,628,682 |
| Hyundai Capital America: | | | |
| 1.45% 2/6/17 (a) | | 632,000 | 629,895 |
| 2% 3/19/18 (a) | | 1,891,000 | 1,882,540 |
| 2.125% 10/2/17 (a) | | 2,437,000 | 2,438,972 |
| 2.55% 2/6/19 (a) | | 4,759,000 | 4,773,653 |
| 2.6% 3/19/20 (a) | | 2,000,000 | 2,001,038 |
| 2.875% 8/9/18 (a) | | 2,606,000 | 2,625,584 |
| John Deere Capital Corp. 1.6% 7/13/18 | | 590,000 | 590,660 |
| Synchrony Financial: | | | |
| 1.875% 8/15/17 | | 173,000 | 171,112 |
| 2.6% 1/15/19 | | 3,000,000 | 2,975,190 |
| 2.7% 2/3/20 | | 2,500,000 | 2,450,305 |
| 3% 8/15/19 | | 3,000,000 | 3,004,803 |
| Toyota Motor Credit Corp.: | | | |
| 1.55% 7/13/18 | | 5,000,000 | 5,000,930 |
| 2% 10/24/18 | | 2,500,000 | 2,526,355 |
| | | | 84,049,616 |
| Diversified Financial Services - 1.4% | | | |
| AIG Global Funding 1.65% 12/15/17 (a) | | 2,000,000 | 1,995,132 |
| Berkshire Hathaway Finance Corp. 1.6% 5/15/17 | | 620,000 | 624,668 |
| Brixmor Operating Partnership LP 3.875% 8/15/22 | | 1,161,000 | 1,079,701 |
| GE Capital International Funding Co. 2.342% 11/15/20 (a) | | 11,630,000 | 11,747,835 |
| IntercontinentalExchange, Inc.: | | | |
| 2.5% 10/15/18 | | 347,000 | 351,491 |
| 2.75% 12/1/20 | | 619,000 | 629,216 |
| McGraw Hill Financial, Inc. 2.5% 8/15/18 | | 1,049,000 | 1,054,303 |
| Moody's Corp. 2.75% 7/15/19 | | 8,000,000 | 8,153,616 |
| | | | 25,635,962 |
| Insurance - 3.9% | | | |
| ACE INA Holdings, Inc. 2.3% 11/3/20 | | 1,173,000 | 1,179,925 |
| AFLAC, Inc. 2.4% 3/16/20 | | 6,000,000 | 6,061,296 |
| AIA Group Ltd. 2.25% 3/11/19 (a) | | 3,529,000 | 3,531,064 |
| American International Group, Inc.: | | | |
| 2.3% 7/16/19 | | 5,304,000 | 5,260,921 |
| 3.3% 3/1/21 | | 987,000 | 997,892 |
| 4.875% 6/1/22 | | 1,484,000 | 1,583,444 |
| 5.85% 1/16/18 | | 1,910,000 | 2,036,614 |
| Aon Corp.: | | | |
| 3.125% 5/27/16 | | 2,000,000 | 2,009,400 |
| 5% 9/30/20 | | 2,178,000 | 2,402,872 |
| Aon PLC 2.8% 3/15/21 | | 7,000,000 | 7,050,967 |
| Assurant, Inc. 2.5% 3/15/18 | | 2,000,000 | 2,000,926 |
| Great-West Life & Annuity Insurance Co. 7.153% 5/16/46 (a)(b) | | 259,000 | 253,820 |
| Hartford Financial Services Group, Inc. 5.375% 3/15/17 | | 18,000 | 18,653 |
| Liberty Mutual Group, Inc. 5% 6/1/21 (a) | | 5,599,000 | 6,039,680 |
| Marsh & McLennan Companies, Inc.: | | | |
| 2.35% 9/10/19 | | 495,000 | 498,586 |
| 2.35% 3/6/20 | | 5,000,000 | 5,007,650 |
| 2.55% 10/15/18 | | 517,000 | 528,825 |
| MassMutual Global Funding II 2.35% 4/9/19 (a) | | 1,000,000 | 1,012,422 |
| MetLife, Inc.: | | | |
| 1.756% 12/15/17 (b) | | 269,000 | 269,107 |
| 1.903% 12/15/17 (b) | | 180,000 | 180,075 |
| Metropolitan Life Global Funding I: | | | |
| 1.3% 4/10/17 (a) | | 1,500,000 | 1,500,198 |
| 1.5% 1/10/18 (a) | | 4,431,000 | 4,399,890 |
| 2% 4/14/20 (a) | | 3,000,000 | 2,952,063 |
| New York Life Global Funding 1.55% 11/2/18 (a) | | 3,500,000 | 3,486,546 |
| Pacific LifeCorp 6% 2/10/20 (a) | | 1,579,000 | 1,766,724 |
| Pricoa Global Funding I: | | | |
| 1.15% 11/25/16 (a) | | 2,000,000 | 1,999,230 |
| 1.6% 5/29/18 (a) | | 967,000 | 961,402 |
| Principal Life Global Funding II 2.375% 9/11/19 (a) | | 2,200,000 | 2,212,285 |
| Prudential Financial, Inc. 3.5% 5/15/24 | | 2,550,000 | 2,499,112 |
| Symetra Financial Corp. 6.125% 4/1/16 (a) | | 892,000 | 895,440 |
| TIAA Asset Management Finance LLC 2.95% 11/1/19 (a) | | 280,000 | 281,411 |
| Unum Group: | | | |
| 5.625% 9/15/20 | | 2,743,000 | 3,003,489 |
| 7.125% 9/30/16 | | 704,000 | 725,257 |
| | | | 74,607,186 |
| Real Estate Investment Trusts - 1.5% | | | |
| Alexandria Real Estate Equities, Inc. 4.6% 4/1/22 | | 189,000 | 201,461 |
| American Campus Communities Operating Partnership LP 3.35% 10/1/20 | | 1,272,000 | 1,291,753 |
| Boston Properties, Inc.: | | | |
| 3.7% 11/15/18 | | 1,787,000 | 1,851,579 |
| 5.875% 10/15/19 | | 446,000 | 495,049 |
| DDR Corp.: | | | |
| 4.75% 4/15/18 | | 1,634,000 | 1,699,563 |
| 7.5% 4/1/17 | | 389,000 | 410,565 |
| Digital Delta Holdings LLC 3.4% 10/1/20 (a) | | 1,735,000 | 1,765,408 |
| Duke Realty LP: | | | |
| 5.95% 2/15/17 | | 354,000 | 367,509 |
| 6.75% 3/15/20 | | 35,000 | 40,124 |
| 8.25% 8/15/19 | | 7,000 | 8,297 |
| Equity One, Inc. 6% 9/15/17 | | 509,000 | 536,860 |
| ERP Operating LP: | | | |
| 2.375% 7/1/19 | | 1,641,000 | 1,648,826 |
| 3.375% 6/1/25 | | 3,000,000 | 3,052,035 |
| 5.75% 6/15/17 | | 442,000 | 463,662 |
| Federal Realty Investment Trust: | | | |
| 2.55% 1/15/21 | | 5,000,000 | 5,088,395 |
| 5.9% 4/1/20 | | 5,000 | 5,734 |
| Government Properties Income Trust 3.75% 8/15/19 | | 3,000,000 | 3,076,506 |
| Health Care Property Investors, Inc. 6% 1/30/17 | | 750,000 | 776,806 |
| Health Care REIT, Inc.: | | | |
| 2.25% 3/15/18 | | 250,000 | 249,343 |
| 4.7% 9/15/17 | | 2,436,000 | 2,536,980 |
| HRPT Properties Trust: | | | |
| 6.25% 6/15/17 | | 186,000 | 191,489 |
| 6.65% 1/15/18 | | 95,000 | 100,034 |
| Select Income REIT 2.85% 2/1/18 | | 597,000 | 595,066 |
| Simon Property Group LP 2.2% 2/1/19 | | 462,000 | 467,136 |
| United Dominion Realty Trust, Inc. 4.25% 6/1/18 | | 431,000 | 450,828 |
| | | | 27,371,008 |
| Real Estate Management & Development - 1.5% | | | |
| BioMed Realty LP 3.85% 4/15/16 | | 1,379,000 | 1,380,294 |
| Brandywine Operating Partnership LP: | | | |
| 4.95% 4/15/18 | | 51,000 | 53,290 |
| 5.7% 5/1/17 | | 369,000 | 383,280 |
| 6% 4/1/16 | | 2,124,000 | 2,131,217 |
| Essex Portfolio LP 5.5% 3/15/17 | | 2,046,000 | 2,122,643 |
| Liberty Property LP: | | | |
| 4.75% 10/1/20 | | 1,045,000 | 1,126,989 |
| 5.5% 12/15/16 | | 2,260,000 | 2,324,824 |
| 6.625% 10/1/17 | | 2,707,000 | 2,880,890 |
| Mack-Cali Realty LP: | | | |
| 2.5% 12/15/17 | | 439,000 | 434,917 |
| 4.5% 4/18/22 | | 185,000 | 180,117 |
| 7.75% 8/15/19 | | 1,298,000 | 1,424,996 |
| Prime Property Funding, Inc. 5.7% 4/15/17 (a) | | 405,000 | 417,554 |
| Reckson Operating Partnership LP 6% 3/31/16 | | 152,000 | 152,500 |
| Regency Centers LP 5.875% 6/15/17 | | 187,000 | 196,458 |
| Tanger Properties LP 6.125% 6/1/20 | | 606,000 | 689,085 |
| Ventas Realty LP: | | | |
| 1.25% 4/17/17 | | 1,882,000 | 1,866,673 |
| 1.55% 9/26/16 | | 346,000 | 346,160 |
| Ventas Realty LP/Ventas Capital Corp.: | | | |
| 2% 2/15/18 | | 1,743,000 | 1,734,079 |
| 4% 4/30/19 | | 6,000,000 | 6,266,298 |
| Washington Prime Group LP 3.85% 4/1/20 | | 2,090,000 | 2,153,477 |
| | | | 28,265,741 |
|
| TOTAL FINANCIALS | | | 632,873,796 |
|
| HEALTH CARE - 3.8% | | | |
| Biotechnology - 1.5% | | | |
| AbbVie, Inc.: | | | |
| 1.75% 11/6/17 | | 1,062,000 | 1,061,398 |
| 1.8% 5/14/18 | | 3,972,000 | 3,960,811 |
| 2.5% 5/14/20 | | 7,349,000 | 7,344,106 |
| Amgen, Inc.: | | | |
| 0.9982% 5/22/17 (b) | | 3,000,000 | 2,991,537 |
| 1.25% 5/22/17 | | 1,500,000 | 1,496,820 |
| 2.125% 5/1/20 | | 1,618,000 | 1,607,023 |
| 2.2% 5/22/19 | | 4,290,000 | 4,345,178 |
| 5.85% 6/1/17 | | 446,000 | 469,860 |
| Celgene Corp.: | | | |
| 2.125% 8/15/18 | | 1,549,000 | 1,555,995 |
| 2.875% 8/15/20 | | 3,000,000 | 3,041,232 |
| | | | 27,873,960 |
| Health Care Equipment & Supplies - 0.4% | | | |
| Becton, Dickinson & Co.: | | | |
| 1.8% 12/15/17 | | 1,486,000 | 1,487,877 |
| 2.675% 12/15/19 | | 329,000 | 335,914 |
| Medtronic, Inc.: | | | |
| 1.5% 3/15/18 | | 1,770,000 | 1,774,209 |
| 2.5% 3/15/20 | | 2,200,000 | 2,253,757 |
| Zimmer Biomet Holdings, Inc. 2% 4/1/18 | | 2,702,000 | 2,690,211 |
| | | | 8,541,968 |
| Health Care Providers & Services - 1.0% | | | |
| Cardinal Health, Inc. 1.95% 6/15/18 | | 462,000 | 462,152 |
| Coventry Health Care, Inc. 5.95% 3/15/17 | | 264,000 | 276,071 |
| Express Scripts Holding Co.: | | | |
| 1.25% 6/2/17 | | 1,500,000 | 1,492,229 |
| 2.25% 6/15/19 | | 1,000,000 | 993,543 |
| McKesson Corp. 2.284% 3/15/19 | | 686,000 | 688,483 |
| UnitedHealth Group, Inc.: | | | |
| 1.4% 10/15/17 | | 2,128,000 | 2,130,296 |
| 1.9% 7/16/18 | | 3,000,000 | 3,028,026 |
| 2.125% 3/15/21 | | 3,000,000 | 2,999,637 |
| 2.7% 7/15/20 | | 1,361,000 | 1,398,466 |
| 2.875% 12/15/21 | | 2,000,000 | 2,053,886 |
| WellPoint, Inc.: | | | |
| 1.875% 1/15/18 | | 326,000 | 325,322 |
| 2.25% 8/15/19 | | 2,950,000 | 2,932,188 |
| | | | 18,780,299 |
| Life Sciences Tools & Services - 0.2% | | | |
| Thermo Fisher Scientific, Inc.: | | | |
| 1.3% 2/1/17 | | 136,000 | 135,518 |
| 2.15% 12/14/18 | | 881,000 | 881,393 |
| 2.4% 2/1/19 | | 3,086,000 | 3,096,063 |
| | | | 4,112,974 |
| Pharmaceuticals - 0.7% | | | |
| Actavis Funding SCS: | | | |
| 1.3% 6/15/17 | | 2,400,000 | 2,387,438 |
| 2.35% 3/12/18 | | 3,000,000 | 3,018,123 |
| 2.45% 6/15/19 | | 352,000 | 353,012 |
| 3% 3/12/20 | | 1,157,000 | 1,176,914 |
| Bayer U.S. Finance LLC: | | | |
| 1.5% 10/6/17 (a) | | 1,863,000 | 1,866,385 |
| 2.375% 10/8/19 (a) | | 1,481,000 | 1,502,152 |
| Mylan, Inc. 1.35% 11/29/16 | | 160,000 | 158,895 |
| Perrigo Co. PLC 1.3% 11/8/16 | | 200,000 | 198,841 |
| Perrigo Finance PLC 3.5% 12/15/21 | | 263,000 | 260,641 |
| Watson Pharmaceuticals, Inc. 1.875% 10/1/17 | | 210,000 | 210,180 |
| Zoetis, Inc.: | | | |
| 1.875% 2/1/18 | | 1,616,000 | 1,598,592 |
| 3.45% 11/13/20 | | 493,000 | 502,205 |
| | | | 13,233,378 |
|
| TOTAL HEALTH CARE | | | 72,542,579 |
|
| INDUSTRIALS - 1.7% | | | |
| Aerospace & Defense - 0.8% | | | |
| BAE Systems Holdings, Inc. 2.85% 12/15/20 (a) | | 5,615,000 | 5,676,552 |
| L-3 Communications Corp. 1.5% 5/28/17 | | 3,685,000 | 3,635,606 |
| Lockheed Martin Corp. 2.5% 11/23/20 | | 2,361,000 | 2,402,596 |
| The Boeing Co. 1.65% 10/30/20 | | 3,000,000 | 2,963,865 |
| | | | 14,678,619 |
| Airlines - 0.0% | | | |
| Continental Airlines, Inc.: | | | |
| 6.648% 3/15/19 | | 131,410 | 133,539 |
| 6.795% 2/2/20 | | 2,618 | 2,716 |
| 6.9% 7/2/19 | | 24,663 | 25,080 |
| U.S. Airways pass-thru trust certificates: | | | |
| 6.85% 1/30/18 | | 151,811 | 155,439 |
| 8.36% 1/20/19 | | 96,657 | 99,741 |
| | | | 416,515 |
| Industrial Conglomerates - 0.7% | | | |
| Covidien International Finance SA 6% 10/15/17 | | 442,000 | 473,015 |
| Danaher Corp.: | | | |
| 1.65% 9/15/18 | | 3,976,000 | 3,999,498 |
| 2.4% 9/15/20 | | 619,000 | 632,000 |
| Roper Technologies, Inc.: | | | |
| 2.05% 10/1/18 | | 2,919,000 | 2,904,545 |
| 3% 12/15/20 | | 5,100,000 | 5,152,765 |
| | | | 13,161,823 |
| Machinery - 0.0% | | | |
| Ingersoll-Rand Luxembourg Finance SA 2.625% 5/1/20 | | 263,000 | 261,329 |
| Trading Companies & Distributors - 0.2% | | | |
| Air Lease Corp.: | | | |
| 2.125% 1/15/18 | | 414,000 | 404,168 |
| 2.625% 9/4/18 | | 1,628,000 | 1,579,689 |
| 3.75% 2/1/22 | | 1,228,000 | 1,141,008 |
| 3.875% 4/1/21 | | 500,000 | 483,750 |
| 4.75% 3/1/20 | | 605,000 | 615,588 |
| | | | 4,224,203 |
|
| TOTAL INDUSTRIALS | | | 32,742,489 |
|
| INFORMATION TECHNOLOGY - 2.1% | | | |
| Communications Equipment - 0.4% | | | |
| Cisco Systems, Inc.: | | | |
| 1.65% 6/15/18 | | 3,000,000 | 3,021,297 |
| 2.125% 3/1/19 | | 1,500,000 | 1,531,863 |
| 2.45% 6/15/20 | | 3,000,000 | 3,073,731 |
| | | | 7,626,891 |
| Electronic Equipment & Components - 0.5% | | | |
| Amphenol Corp. 1.55% 9/15/17 | | 1,426,000 | 1,422,150 |
| Tyco Electronics Group SA: | | | |
| 2.35% 8/1/19 | | 3,000,000 | 3,010,647 |
| 2.375% 12/17/18 | | 99,000 | 99,440 |
| 6.55% 10/1/17 | | 4,476,000 | 4,805,832 |
| | | | 9,338,069 |
| IT Services - 0.4% | | | |
| MasterCard, Inc. 2% 4/1/19 | | 289,000 | 293,400 |
| The Western Union Co.: | | | |
| 2.875% 12/10/17 | | 773,000 | 786,382 |
| 3.65% 8/22/18 | | 3,111,000 | 3,176,238 |
| Xerox Corp.: | | | |
| 2.75% 3/15/19 | | 2,585,000 | 2,459,338 |
| 2.95% 3/15/17 | | 1,057,000 | 1,059,252 |
| | | | 7,774,610 |
| Software - 0.4% | | | |
| Oracle Corp.: | | | |
| 2.25% 10/8/19 | | 1,552,000 | 1,590,133 |
| 2.5% 5/15/22 | | 5,000,000 | 5,028,325 |
| | | | 6,618,458 |
| Technology Hardware, Storage & Peripherals - 0.4% | | | |
| Apple, Inc. 2.85% 5/6/21 | | 850,000 | 883,223 |
| Hewlett Packard Enterprise Co.: | | | |
| 2.85% 10/5/18 (a) | | 4,000,000 | 4,001,316 |
| 3.6% 10/15/20 (a) | | 3,000,000 | 2,991,930 |
| | | | 7,876,469 |
|
| TOTAL INFORMATION TECHNOLOGY | | | 39,234,497 |
|
| MATERIALS - 1.4% | | | |
| Chemicals - 0.7% | | | |
| Albemarle Corp. U.S. 3% 12/1/19 | | 1,321,000 | 1,293,766 |
| Chevron Phillips Chemical Co. LLC / Chevron Phillips Chemical Co. LP 1.7% 5/1/18 (a) | | 5,340,000 | 5,247,266 |
| Ecolab, Inc.: | | | |
| 1.45% 12/8/17 | | 335,000 | 333,324 |
| 1.55% 1/12/18 | | 2,500,000 | 2,489,298 |
| Monsanto Co. 2.125% 7/15/19 | | 3,000,000 | 3,017,427 |
| Sherwin-Williams Co. 1.35% 12/15/17 | | 620,000 | 618,932 |
| | | | 13,000,013 |
| Metals & Mining - 0.7% | | | |
| Anglo American Capital PLC: | | | |
| 1.572% 4/15/16 (a)(b) | | 1,624,000 | 1,600,510 |
| 3.625% 5/14/20 (a) | | 1,513,000 | 1,202,835 |
| Corporacion Nacional del Cobre de Chile (Codelco) 3.875% 11/3/21 (a) | | 630,000 | 633,211 |
| Freeport-McMoRan, Inc.: | | | |
| 2.3% 11/14/17 | | 670,000 | 613,050 |
| 2.375% 3/15/18 | | 4,000,000 | 3,445,000 |
| Rio Tinto Finance (U.S.A.) PLC 1.625% 8/21/17 | | 2,440,000 | 2,390,387 |
| Teck Resources Ltd. 3% 3/1/19 | | 3,000,000 | 2,287,500 |
| Vale Overseas Ltd. 6.25% 1/23/17 | | 403,000 | 406,264 |
| | | | 12,578,757 |
|
| TOTAL MATERIALS | | | 25,578,770 |
|
| TELECOMMUNICATION SERVICES - 3.3% | | | |
| Diversified Telecommunication Services - 2.6% | | | |
| AT&T, Inc.: | | | |
| 1.4% 12/1/17 | | 1,620,000 | 1,612,166 |
| 2.375% 11/27/18 | | 10,000,000 | 10,107,600 |
| 2.45% 6/30/20 | | 1,563,000 | 1,556,843 |
| BellSouth Corp. 4.821% 4/26/16 (a)(b) | | 3,000,000 | 3,017,844 |
| British Telecommunications PLC: | | | |
| 1.25% 2/14/17 | | 1,000,000 | 998,730 |
| 1.625% 6/28/16 | | 4,314,000 | 4,321,002 |
| 2.35% 2/14/19 | | 4,296,000 | 4,336,666 |
| CenturyLink, Inc. 6.15% 9/15/19 | | 592,000 | 608,280 |
| Deutsche Telekom International Financial BV: | | | |
| 3.125% 4/11/16 (a) | | 923,000 | 924,911 |
| 5.75% 3/23/16 | | 2,000,000 | 2,005,562 |
| Verizon Communications, Inc.: | | | |
| 1.1% 11/1/17 | | 620,000 | 614,143 |
| 1.35% 6/9/17 | | 750,000 | 749,611 |
| 2% 11/1/16 | | 1,279,000 | 1,286,130 |
| 2.5% 9/15/16 | | 1,044,000 | 1,052,060 |
| 2.625% 2/21/20 | | 2,913,000 | 2,953,255 |
| 3.65% 9/14/18 | | 6,000,000 | 6,279,426 |
| 4.5% 9/15/20 | | 3,000,000 | 3,262,587 |
| 6.1% 4/15/18 | | 3,425,000 | 3,721,218 |
| | | | 49,408,034 |
| Wireless Telecommunication Services - 0.7% | | | |
| America Movil S.A.B. de CV 2.375% 9/8/16 | | 2,646,000 | 2,657,489 |
| Vodafone Group PLC: | | | |
| 1.5% 2/19/18 | | 2,625,000 | 2,600,068 |
| 1.625% 3/20/17 | | 5,400,000 | 5,421,832 |
| 5.45% 6/10/19 | | 2,000,000 | 2,191,938 |
| | | | 12,871,327 |
|
| TOTAL TELECOMMUNICATION SERVICES | | | 62,279,361 |
|
| UTILITIES - 4.6% | | | |
| Electric Utilities - 2.4% | | | |
| AmerenUE 6.4% 6/15/17 | | 519,000 | 550,381 |
| American Electric Power Co., Inc. 1.65% 12/15/17 | | 1,827,000 | 1,814,441 |
| Commonwealth Edison Co. 2.15% 1/15/19 | | 188,000 | 190,007 |
| Duke Energy Corp.: | | | |
| 0.9922% 4/3/17 (b) | | 2,894,000 | 2,872,836 |
| 1.625% 8/15/17 | | 3,304,000 | 3,301,205 |
| 2.1% 6/15/18 | | 5,395,000 | 5,406,205 |
| Duquesne Light Holdings, Inc. 6.4% 9/15/20 (a) | | 48,000 | 54,802 |
| Edison International 3.75% 9/15/17 | | 431,000 | 443,996 |
| Eversource Energy 1.45% 5/1/18 | | 153,000 | 151,174 |
| Exelon Corp.: | | | |
| 1.55% 6/9/17 | | 311,000 | 309,492 |
| 2.85% 6/15/20 | | 458,000 | 461,886 |
| FirstEnergy Corp.: | | | |
| 2.75% 3/15/18 | | 6,652,000 | 6,719,777 |
| 4.25% 3/15/23 | | 600,000 | 626,340 |
| FirstEnergy Solutions Corp. 6.05% 8/15/21 | | 655,000 | 695,750 |
| Hydro-Quebec 2% 6/30/16 | | 2,500,000 | 2,511,300 |
| IPALCO Enterprises, Inc. 3.45% 7/15/20 | | 2,576,000 | 2,566,340 |
| LG&E and KU Energy LLC 3.75% 11/15/20 | | 2,000 | 2,100 |
| Nevada Power Co.: | | | |
| 6.5% 5/15/18 | | 1,562,000 | 1,719,876 |
| 6.5% 8/1/18 | | 273,000 | 302,209 |
| NextEra Energy Capital Holdings, Inc. 1.586% 6/1/17 | | 2,904,000 | 2,899,182 |
| PacifiCorp 5.5% 1/15/19 | | 2,750,000 | 3,034,515 |
| Pennsylvania Electric Co. 6.05% 9/1/17 | | 115,000 | 122,183 |
| Public Service Electric & Gas Co. 2.3% 9/15/18 | | 2,000,000 | 2,029,604 |
| TECO Finance, Inc.: | | | |
| 1.2169% 4/10/18 (b) | | 3,000,000 | 2,957,541 |
| 5.15% 3/15/20 | | 252,000 | 274,297 |
| Xcel Energy, Inc. 1.2% 6/1/17 | | 3,153,000 | 3,141,838 |
| | | | 45,159,277 |
| Gas Utilities - 0.1% | | | |
| Texas Eastern Transmission LP 6% 9/15/17 (a) | | 1,096,000 | 1,150,942 |
| Independent Power and Renewable Electricity Producers - 0.2% | | | |
| Southern Power Co.: | | | |
| 1.85% 12/1/17 | | 704,000 | 704,132 |
| 2.375% 6/1/20 | | 1,087,000 | 1,068,419 |
| TransAlta Corp. 1.9% 6/3/17 | | 2,900,000 | 2,721,676 |
| | | | 4,494,227 |
| Multi-Utilities - 1.9% | | | |
| Ameren Illinois Co. 6.125% 11/15/17 | | 62,000 | 66,639 |
| Berkshire Hathaway Energy Co.: | | | |
| 1.1% 5/15/17 | | 1,000,000 | 997,097 |
| 2% 11/15/18 | | 544,000 | 544,917 |
| Dominion Resources, Inc.: | | | |
| 1.4% 9/15/17 | | 3,225,000 | 3,204,118 |
| 1.9% 6/15/18 | | 2,540,000 | 2,526,756 |
| 2.5% 12/1/19 | | 7,382,000 | 7,438,081 |
| 2.9031% 9/30/66 (b) | | 651,000 | 437,505 |
| 7.5% 6/30/66 (b) | | 567,000 | 474,863 |
| NiSource Finance Corp.: | | | |
| 3.85% 2/15/23 | | 700,000 | 729,931 |
| 5.45% 9/15/20 | | 43,000 | 47,595 |
| 6.4% 3/15/18 | | 888,000 | 963,072 |
| NSTAR 4.5% 11/15/19 | | 2,500,000 | 2,699,093 |
| PG&E Corp. 2.4% 3/1/19 | | 74,000 | 74,746 |
| Puget Energy, Inc. 6.5% 12/15/20 | | 991,000 | 1,156,255 |
| Sempra Energy: | | | |
| 2.3% 4/1/17 | | 4,935,000 | 4,967,127 |
| 2.4% 3/15/20 | | 1,890,000 | 1,854,825 |
| 2.85% 11/15/20 | | 1,392,000 | 1,397,163 |
| Wisconsin Energy Corp.: | | | |
| 1.65% 6/15/18 | | 3,006,000 | 3,000,481 |
| 2.45% 6/15/20 | | 2,901,000 | 2,937,341 |
| 6.25% 5/15/67 (b) | | 454,000 | 335,960 |
| | | | 35,853,565 |
|
| TOTAL UTILITIES | | | 86,658,011 |
|
| TOTAL NONCONVERTIBLE BONDS | | | |
| (Cost $1,330,486,155) | | | 1,321,778,285 |
|
| U.S. Treasury Obligations - 7.8% | | | |
| U.S. Treasury Notes: | | | |
| 0.75% 2/15/19 | | $64,146,000 | $63,847,822 |
| 0.875% 10/15/17 | | 10,230,000 | 10,243,186 |
| 1% 5/15/18 | | 12,459,000 | 12,504,264 |
| 1.125% 1/15/19 | | 11,574,000 | 11,646,789 |
| 1.375% 3/31/20 (c) | | 9,683,000 | 9,768,859 |
| 1.375% 1/31/21 | | 30,000,000 | 30,199,230 |
| 1.75% 12/31/20 | | 10,000,000 | 10,242,190 |
| TOTAL U.S. TREASURY OBLIGATIONS | | | |
| (Cost $148,247,181) | | | 148,452,340 |
|
| U.S. Government Agency - Mortgage Securities - 0.7% | | | |
| Fannie Mae - 0.5% | | | |
| 2.45% 11/1/36 (b) | | 149,520 | 157,298 |
| 2.468% 1/1/40 (b) | | 159,432 | 167,747 |
| 2.471% 3/1/40 (b) | | 117,232 | 123,895 |
| 2.489% 12/1/33 (b) | | 622,566 | 656,878 |
| 2.51% 7/1/35 (b) | | 76,754 | 81,056 |
| 2.557% 3/1/40 (b) | | 83,774 | 88,367 |
| 2.557% 6/1/42 (b) | | 51,722 | 53,279 |
| 2.595% 4/1/35 (b) | | 371,174 | 390,798 |
| 2.685% 12/1/39 (b) | | 46,132 | 48,780 |
| 2.689% 2/1/42 (b) | | 533,419 | 554,586 |
| 2.761% 1/1/42 (b) | | 443,205 | 461,244 |
| 2.951% 11/1/40 (b) | | 30,288 | 31,444 |
| 2.98% 9/1/41 (b) | | 36,605 | 38,279 |
| 2.991% 10/1/41 (b) | | 19,908 | 20,792 |
| 3.249% 7/1/41 (b) | | 53,942 | 56,357 |
| 3.347% 10/1/41 (b) | | 28,170 | 29,577 |
| 3.5% 7/1/26 to 10/1/29 | | 3,925,938 | 4,184,901 |
| 3.553% 7/1/41 (b) | | 66,657 | 70,095 |
| 4.5% 3/1/35 | | 35,980 | 39,312 |
| 6% 5/1/16 to 4/1/17 | | 4,292 | 4,324 |
| 6.5% 5/1/16 to 8/1/36 | | 492,494 | 576,010 |
| 7% 9/1/18 to 6/1/33 | | 296,771 | 352,410 |
| 7.5% 8/1/17 to 3/1/28 | | 98,062 | 115,527 |
| 8.5% 5/1/21 to 9/1/25 | | 7,611 | 8,878 |
| 9.5% 2/1/25 | | 515 | 559 |
| 10.5% 8/1/20 | | 4,847 | 5,256 |
|
| TOTAL FANNIE MAE | | | 8,317,649 |
|
| Freddie Mac - 0.2% | | | |
| 2.413% 4/1/40 (b) | | 90,242 | 95,134 |
| 2.53% 4/1/40 (b) | | 83,409 | 88,053 |
| 2.535% 2/1/40 (b) | | 134,267 | 141,670 |
| 3.208% 9/1/41 (b) | | 35,210 | 36,795 |
| 3.216% 4/1/41 (b) | | 40,299 | 42,125 |
| 3.297% 6/1/41(b) | | 45,031 | 47,062 |
| 3.451% 5/1/41 (b) | | 30,676 | 31,918 |
| 3.5% 8/1/26 | | 2,892,634 | 3,073,423 |
| 3.626% 6/1/41 (b) | | 65,362 | 68,520 |
| 3.706% 5/1/41 (b) | | 47,749 | 50,127 |
| 4.5% 8/1/18 | | 165,043 | 170,228 |
| 5% 3/1/19 | | 298,295 | 309,331 |
| 8.5% 9/1/24 to 8/1/27 | | 29,609 | 35,723 |
|
| TOTAL FREDDIE MAC | | | 4,190,109 |
|
| Ginnie Mae - 0.0% | | | |
| 7% 7/15/28 to 11/15/28 | | 80,591 | 95,797 |
| 7.5% 2/15/28 to 10/15/28 | | 3,477 | 4,227 |
| 8% 6/15/24 | | 60 | 70 |
| 8.5% 10/15/21 | | 23,279 | 26,451 |
| 11% 7/20/19 to 8/20/19 | | 1,163 | 1,269 |
|
| TOTAL GINNIE MAE | | | 127,814 |
|
| TOTAL U.S. GOVERNMENT AGENCY - MORTGAGE SECURITIES | | | |
| (Cost $12,453,990) | | | 12,635,572 |
|
| Asset-Backed Securities - 8.4% | | | |
| Accredited Mortgage Loan Trust Series 2005-1 Class M1, 1.1266% 4/25/35 (b) | | $56,669 | $50,620 |
| ACE Securities Corp. Home Equity Loan Trust Series 2004-HE1 Class M2, 2.0765% 3/25/34 (b) | | 33,430 | 31,836 |
| Ally Auto Receivables Trust Series 2015-SN1 Class A3, 1.21% 12/20/17 | | 670,000 | 669,791 |
| Ally Master Owner Trust: | | | |
| Series 2012-4 Class A, 1.72% 7/15/19 | | 292,000 | 292,617 |
| Series 2012-5 Class A, 1.54% 9/15/19 | | 11,057,000 | 11,059,799 |
| Series 2014-3 Class A, 1.33% 3/15/19 | | 2,425,000 | 2,423,954 |
| Series 2014-4 Class A2, 1.43% 6/17/19 | | 3,870,000 | 3,868,162 |
| Series 2014-5 Class A2, 1.6% 10/15/19 | | 3,000,000 | 3,001,941 |
| Series 2015-3 Class A, 1.63% 5/15/20 | | 3,130,000 | 3,129,670 |
| American Express Credit Account Master Trust: | | | |
| Series 2014-3 Class A, 1.49% 4/15/20 | | 2,000,000 | 2,010,564 |
| Series 2014-4 Class A, 1.43% 6/15/20 | | 3,780,000 | 3,795,992 |
| AmeriCredit Automobile Receivables Trust: | | | |
| Series 2013-5 Class A3, 0.9% 9/10/18 | | 344,793 | 344,403 |
| Series 2014-2 Class A3, 0.94% 2/8/19 | | 1,300,000 | 1,297,610 |
| Series 2014-4 Class A3, 1.27% 7/8/19 | | 505,000 | 503,911 |
| Series 2015-2 Class A3, 1.27% 1/8/20 | | 3,000,000 | 2,982,881 |
| Series 2016-1 Class A3, 2.14% 10/8/20 | | 1,888,000 | 1,894,388 |
| Ameriquest Mortgage Securities, Inc. pass-thru certificates: | | | |
| Series 2003-10 Class M1, 1.4858% 12/25/33 (b) | | 5,239 | 4,802 |
| Series 2004-R2 Class M3, 1.2608% 4/25/34 (b) | | 10,238 | 7,473 |
| Argent Securities, Inc. pass-thru certificates: | | | |
| Series 2003-W7 Class A2, 1.2158% 3/25/34 (b) | | 4,092 | 3,632 |
| Series 2004-W11 Class M2, 1.4858% 11/25/34 (b) | | 63,962 | 61,475 |
| Series 2004-W7 Class M1, 1.2608% 5/25/34 (b) | | 179,644 | 164,200 |
| Series 2006-W4 Class A2C, 0.5958% 5/25/36 (b) | | 130,347 | 46,202 |
| Asset Backed Securities Corp. Home Equity Loan Trust: | | | |
| Series 2004-HE2 Class M1, 1.2515% 4/25/34 (b) | | 142,339 | 123,552 |
| Series 2006-HE2 Class M1, 0.8058% 3/25/36 (b) | | 2,215 | 369 |
| Bank of America Credit Card Master Trust Series 2015-A2 Class A, 1.36% 9/15/20 | | 3,769,000 | 3,777,936 |
| Bear Stearns Asset Backed Securities I Trust Series 2005-HE2 Class M2, 1.5608% 2/25/35 (b) | | 378,742 | 334,166 |
| Capital Auto Receivables Asset Trust: | | | |
| Series 2014-2 Class A2, 0.91% 4/20/17 | | 231,473 | 231,472 |
| Series 2014-3 Class A2, 1.18% 12/20/17 | | 1,176,000 | 1,175,464 |
| Series 2015-1 Class A2, 1.42% 6/20/18 | | 1,807,000 | 1,808,549 |
| Series 2015-2 Class A2, 1.39% 9/20/18 | | 1,603,000 | 1,604,242 |
| Capital One Multi-Asset Execution Trust Series 2014-A5 Class A, 1.48% 7/15/20 | | 2,200,000 | 2,209,936 |
| Carrington Mortgage Loan Trust Series 2007-RFC1 Class A3, 0.5758% 12/25/36 (b) | | 205,465 | 139,790 |
| Chase Issuance Trust Series 2015-A2, Class A, 1.59% 2/18/20 | | 3,000,000 | 3,020,538 |
| Chrysler Capital Auto Receivables Trust Series 2015-AA Class A3, 1.22% 7/15/19 (a) | | 4,000,000 | 3,990,726 |
| CIT Equipment Collateral: | | | |
| Series 2013-VT1 Class A3, 1.13% 7/20/20 (a) | | 1,689,604 | 1,689,751 |
| Series 2014-VT1 Class A3, 1.5% 10/21/19 (a) | | 1,640,000 | 1,634,573 |
| Citibank Credit Card Issuance Trust Series 2014-A6 Class A6, 2.15% 7/15/21 | | 2,896,000 | 2,956,777 |
| Countrywide Home Loans, Inc.: | | | |
| Series 2003-BC1 Class B1, 5.6858% 3/25/32 (b) | | 9,741 | 8,905 |
| Series 2004-3 Class M4, 1.8908% 4/25/34 (b) | | 7,185 | 6,293 |
| Series 2004-4 Class M2, 1.2308% 6/25/34 (b) | | 8,377 | 7,575 |
| Dell Equipment Finance Trust Series 2015-1 Class A3, 1.3% 3/23/20 (a) | | 4,490,000 | 4,472,434 |
| Discover Card Master Trust: | | | |
| Series 2014-A5 Class A, 1.39% 4/15/20 | | 1,780,000 | 1,786,807 |
| Series 2016-A1 Class A1, 2.1% 7/15/21 | | 3,630,000 | 3,648,325 |
| Enterprise Fleet Financing LLC: | | | |
| Series 2014-1 Class A2, 0.87% 9/20/19 (a) | | 868,988 | 866,107 |
| Series 2014-2 Class A2, 1.05% 3/20/20 (a) | | 2,576,231 | 2,562,620 |
| Series 2015-1 Class A2, 1.3% 9/20/20 (a) | | 2,604,423 | 2,587,052 |
| Fannie Mae Series 2004-T5 Class AB3, 1.1189% 5/28/35 (b) | | 4,436 | 3,852 |
| Fieldstone Mortgage Investment Corp. Series 2004-3 Class M5, 2.6015% 8/25/34 (b) | | 33,155 | 31,312 |
| Flagship Credit Auto Trust Series 2016-1 Class A, 2.53% 12/15/20 (a) | | 4,000,000 | 3,990,391 |
| Ford Credit Auto Owner Trust: | | | |
| Series 2014-2 Class A, 2.31% 4/15/26 (a) | | 3,299,000 | 3,332,738 |
| Series 2015-1 Class A, 2.12% 7/15/26 (a) | | 2,785,000 | 2,793,976 |
| Series 2015-2 Class A, 2.44% 1/15/27 (a) | | 3,480,000 | 3,522,612 |
| Series 2016-1 Class A, 2.31% 8/15/27 (a) | | 4,000,000 | 3,998,914 |
| Ford Credit Floorplan Master Owner Trust: | | | |
| Series 2012-5 Class A, 1.49% 9/15/19 | | 8,055,000 | 8,069,835 |
| Series 2014-1 Class A1, 1.2% 2/15/19 | | 3,500,000 | 3,492,991 |
| Series 2014-4 Class A1, 1.4% 8/15/19 | | 11,000,000 | 11,007,425 |
| Series 2015-1 Class A1, 1.42% 1/15/20 | | 6,000,000 | 6,003,737 |
| Fremont Home Loan Trust Series 2005-A: | | | |
| Class M3, 1.1615% 1/25/35 (b) | | 81,136 | 70,350 |
| Class M4, 1.4465% 1/25/35 (b) | | 39,567 | 21,248 |
| GCO Education Loan Funding Master Trust II Series 2007-1A Class C1L, 1.0091% 2/25/47 (a)(b) | | 143,276 | 126,848 |
| GE Business Loan Trust Series 2006-2A: | | | |
| Class A, 0.6093% 11/15/34 (a)(b) | | 89,833 | 85,073 |
| Class B, 0.7105% 11/15/34 (a)(b) | | 32,594 | 28,683 |
| Class C, 0.8105% 11/15/34 (a)(b) | | 53,794 | 46,548 |
| Class D, 1.1805% 11/15/34 (a)(b) | | 20,404 | 16,905 |
| GM Financial Automobile Leasing Trust: | | | |
| Series 2014-2A Class A3, 1.22% 1/22/18 (a) | | 1,950,000 | 1,950,075 |
| Series 2015-1 Class A3, 1.53% 9/20/18 | | 2,398,000 | 2,413,268 |
| GMF Floorplan Owner Revolving Trust Series 2015-1 Class A1, 1.65% 5/15/20 (a) | | 3,732,000 | 3,723,488 |
| GSAMP Trust Series 2004-AR1 Class B4, 5.5% 6/25/34 (a) | | 29,997 | 864 |
| Home Equity Asset Trust: | | | |
| Series 2003-2 Class M1, 1.7558% 8/25/33 (b) | | 32,697 | 30,100 |
| Series 2003-5 Class A2, 1.1358% 12/25/33 (b) | | 2,817 | 2,605 |
| HSI Asset Securitization Corp. Trust Series 2007-HE1 Class 2A3, 0.6165% 1/25/37 (b) | | 141,116 | 90,492 |
| Hyundai Auto Lease Securitization Trust: | | | |
| Series 2014-B Class A3, 0.98% 11/15/17 (a) | | 1,200,000 | 1,199,357 |
| Series 2015-A Class A3, 1.42% 9/17/18 (a) | | 2,402,000 | 2,406,145 |
| Series 2015-B Class A3, 1.4% 11/15/18 (a) | | 2,966,000 | 2,967,041 |
| JPMorgan Mortgage Acquisition Trust: | | | |
| Series 2006-NC2 Class M2, 0.7216% 7/25/36 (b) | | 21,503 | 9,666 |
| Series 2007-CH1 Class AV4, 0.5658% 11/25/36 (b) | | 5,806 | 5,804 |
| KeyCorp Student Loan Trust: | | | |
| Series 1999-A Class A2, 0.9331% 12/27/29 (b) | | 7,059 | 7,022 |
| Series 2006-A Class 2C, 1.7531% 3/27/42 (b) | | 392,000 | 201,046 |
| MASTR Asset Backed Securities Trust Series 2007-HE1 Class M1, 0.7265% 5/25/37 (b) | | 35,682 | 1,122 |
| Meritage Mortgage Loan Trust Series 2004-1 Class M1, 1.1858% 7/25/34 (b) | | 14,160 | 11,761 |
| Merrill Lynch Mortgage Investors Trust: | | | |
| Series 2003-OPT1 Class M1, 1.4015% 7/25/34 (b) | | 32,514 | 30,398 |
| Series 2006-FM1 Class A2B, 0.5458% 4/25/37 (b) | | 11,599 | 11,534 |
| Series 2006-OPT1 Class A1A, 0.9465% 6/25/35 (b) | | 163,793 | 156,864 |
| Morgan Stanley ABS Capital I Trust: | | | |
| Series 2004-HE6 Class A2, 1.1158% 8/25/34 (b) | | 4,895 | 4,255 |
| Series 2004-NC8 Class M6, 2.3108% 9/25/34 (b) | | 54,359 | 50,117 |
| Series 2005-NC1 Class M1, 1.0958% 1/25/35 (b) | | 27,940 | 24,899 |
| Series 2005-NC2 Class B1, 2.1908% 3/25/35 (b) | | 19,093 | 427 |
| Nationstar HECM Loan Trust Series 2016-1A Class A, 3.1294% 2/25/26 (a) | | 2,000,000 | 1,999,998 |
| New Century Home Equity Loan Trust Series 2005-4 Class M2, 0.9365% 9/25/35 (b) | | 162,650 | 148,055 |
| Nissan Master Owner Trust Receivables Series 2015-A Class A2, 1.44% 1/15/20 | | 2,500,000 | 2,501,568 |
| Park Place Securities, Inc.: | | | |
| Series 2004-WCW1: | | | |
| Class M3, 2.3015% 9/25/34 (b) | | 60,741 | 55,316 |
| Class M4, 2.6015% 9/25/34 (b) | | 77,891 | 52,551 |
| Series 2005-WCH1 Class M4, 1.6715% 1/25/36 (b) | | 126,217 | 110,854 |
| Salomon Brothers Mortgage Securities VII, Inc. Series 2003-HE1 Class A, 1.2265% 4/25/33 (b) | | 582 | 498 |
| Santander Drive Auto Receivables Trust: | | | |
| Series 2013-4 Class B, 2.16% 1/15/20 | | 164,736 | 164,968 |
| Series 2014-4 Class B, 1.82% 5/15/19 | | 774,000 | 774,373 |
| Saxon Asset Securities Trust Series 2004-1 Class M1, 1.2308% 3/25/35 (b) | | 82,443 | 75,890 |
| SLM Private Credit Student Loan Trust Series 2004-A Class C, 1.462% 6/15/33 (b) | | 64,266 | 62,650 |
| Structured Asset Investment Loan Trust Series 2004-8 Class M5, 2.1608% 9/25/34 (b) | | 4,680 | 3,946 |
| Synchrony Credit Card Master Note Trust: | | | |
| Series 2015-1 Class A, 2.37% 3/15/23 | | 2,681,000 | 2,725,078 |
| Series 2015-2 Class A, 1.6% 4/15/21 | | 3,040,000 | 3,047,751 |
| Terwin Mortgage Trust Series 2003-4HE Class A1, 1.2865% 9/25/34 (b) | | 2,472 | 2,083 |
| Trapeza CDO XII Ltd./Trapeza CDO XII, Inc. Series 2007-12A Class B, 1.1717% 4/6/42 (a)(b) | | 316,998 | 155,329 |
| Volkswagen Credit Auto Master Trust Series 2014-1A Class A2, 1.4% 7/22/19 (a) | | 3,104,000 | 3,069,157 |
| Volvo Financial Equipment LLC Series 2015-1A Class A3, 1.51% 6/17/19 (a) | | 2,226,000 | 2,230,670 |
| World Omni Auto Receivables Trust Series 2014-B Class A3, 1.14% 1/15/20 | | 1,759,000 | 1,757,421 |
| World Omni Automobile Lease Securitization Trust Series 2014-A Class A3, 1.16% 9/15/17 | | 1,160,000 | 1,158,759 |
| TOTAL ASSET-BACKED SECURITIES | | | |
| (Cost $159,218,496) | | | 160,328,585 |
|
| Collateralized Mortgage Obligations - 1.6% | | | |
| Private Sponsor - 0.1% | | | |
| Credit Suisse Mortgage Trust Series 2012-2R Class 1A1, 2.7362% 5/27/35 (a)(b) | | 528,998 | 542,646 |
| MASTR Adjustable Rate Mortgages Trust Series 2007-3 Class 22A2, 0.6365% 5/25/47 (b) | | 28,857 | 26,469 |
| Merrill Lynch Alternative Note Asset Trust floater Series 2007-OAR1 Class A1, 0.6058% 2/25/37 (b) | | 64,804 | 57,351 |
| Nationstar HECM Loan Trust sequential payer Series 2015-2A Class A, 2.8826% 11/25/25 (a) | | 1,565,874 | 1,565,091 |
| RESI Finance LP/RESI Finance DE Corp. floater Series 2003-B: | | | |
| Class B5, 2.7735% 6/10/35 (a)(b) | | 40,467 | 36,007 |
| Class B6, 3.2735% 6/10/35 (a)(b) | | 67,321 | 60,717 |
| Sequoia Mortgage Trust floater Series 2004-6 Class A3B, 1.675% 7/20/34 (b) | | 2,538 | 2,473 |
|
| TOTAL PRIVATE SPONSOR | | | 2,290,754 |
|
| U.S. Government Agency - 1.5% | | | |
| Fannie Mae: | | | |
| pass-thru certificates Series 2012-127 Class DH, 4% 11/25/27 | | 358,644 | 379,448 |
| planned amortization class: | | | |
| Series 2002-9 Class PC, 6% 3/25/17 | | 2,786 | 2,838 |
| Series 2015-28 Class P, 2.5% 5/25/45 | | 7,659,776 | 7,835,591 |
| Series 2014-57 Class A, 3% 9/25/44 | | 2,165,864 | 2,240,737 |
| Series 2015-28 Class JE, 3% 5/25/45 | | 5,942,125 | 6,160,311 |
| Freddie Mac: | | | |
| planned amortization class: | | | |
| Series 2356 Class GD, 6% 9/15/16 | | 6,246 | 6,317 |
| Series 2363 Class PF, 6% 9/15/16 | | 4,004 | 4,034 |
| Series 3820 Class DA, 4% 11/15/35 | | 291,331 | 305,101 |
| Series 3777 Class AC, 3.5% 12/15/25 | | 517,671 | 544,566 |
| Series 3949 Class MK, 4.5% 10/15/34 | | 222,334 | 241,007 |
| Series 4472 Class WL, 3% 5/15/45 | | 2,714,751 | 2,808,667 |
| Ginnie Mae guaranteed REMIC pass-thru certificates Series 2015-H17 Class HA, 2.5% 5/20/65 (d) | | 7,682,437 | 7,843,958 |
|
| TOTAL U.S. GOVERNMENT AGENCY | | | 28,372,575 |
|
| TOTAL COLLATERALIZED MORTGAGE OBLIGATIONS | | | |
| (Cost $30,710,580) | | | 30,663,329 |
|
| Commercial Mortgage Securities - 7.6% | | | |
| 7 WTC Depositor LLC Trust Series 2012-7WTC Class A, 4.0824% 3/13/31 (a) | | 417,625 | 425,237 |
| Asset Securitization Corp. Series 1997-D5 Class PS1, 1.5885% 2/14/43 (b)(e) | | 41,857 | 303 |
| Banc of America Commercial Mortgage Trust: | | | |
| sequential payer: | | | |
| Series 2006-2 Class A4, 5.832% 5/10/45 (b) | | 486,650 | 486,447 |
| Series 2006-3 Class A4, 5.889% 7/10/44 (b) | | 4,576,290 | 4,580,360 |
| Series 2006-6 Class A3, 5.369% 10/10/45 | | 74,307 | 74,282 |
| Series 2006-4 Class A1A, 5.617% 7/10/46 (b) | | 811,416 | 817,033 |
| Series 2007-2 Class A4, 5.79% 4/10/49 (b) | | 7,498,000 | 7,604,610 |
| Series 2007-3 Class A4, 5.7423% 6/10/49 (b) | | 579,721 | 595,197 |
| Barclays Commercial Mortgage Securities LLC: | | | |
| floater Series 2015-RRI Class A, 1.5755% 5/15/32 (a)(b) | | 2,015,000 | 1,983,571 |
| Series 2015-STP Class A, 3.3228% 9/10/28 (a) | | 3,500,000 | 3,601,373 |
| Bayview Commercial Asset Trust floater: | | | |
| Series 2003-2 Class M1, 1.7108% 12/25/33 (a)(b) | | 3,266 | 2,901 |
| Series 2005-4A: | | | |
| Class A2, 0.8258% 1/25/36 (a)(b) | | 83,872 | 71,617 |
| Class B1, 1.8358% 1/25/36 (a)(b) | | 3,550 | 2,445 |
| Class M1, 0.8858% 1/25/36 (a)(b) | | 27,056 | 21,473 |
| Class M2, 0.9058% 1/25/36 (a)(b) | | 8,117 | 6,250 |
| Class M3, 0.9358% 1/25/36 (a)(b) | | 11,854 | 8,757 |
| Class M4, 1.0458% 1/25/36 (a)(b) | | 6,556 | 4,737 |
| Class M5, 1.0858% 1/25/36 (a)(b) | | 6,556 | 4,749 |
| Class M6, 1.1358% 1/25/36 (a)(b) | | 6,963 | 5,061 |
| Series 2006-3A Class M4, 0.8658% 10/25/36 (a)(b) | | 3,424 | 378 |
| Series 2007-1 Class A2, 0.7058% 3/25/37 (a)(b) | | 55,311 | 46,781 |
| Series 2007-2A: | | | |
| Class A1, 0.7058% 7/25/37 (a)(b) | | 57,469 | 48,233 |
| Class A2, 0.7558% 7/25/37 (a)(b) | | 53,728 | 42,535 |
| Class M1, 0.8058% 7/25/37 (a)(b) | | 18,867 | 14,287 |
| Class M2, 0.8458% 7/25/37 (a)(b) | | 10,193 | 7,123 |
| Class M3, 0.9258% 7/25/37 (a)(b) | | 7,826 | 4,933 |
| Series 2007-3: | | | |
| Class A2, 0.7258% 7/25/37 (a)(b) | | 51,618 | 41,080 |
| Class M1, 0.7458% 7/25/37 (a)(b) | | 11,450 | 8,576 |
| Class M2, 0.7758% 7/25/37 (a)(b) | | 12,285 | 8,761 |
| Class M3, 0.8058% 7/25/37 (a)(b) | | 18,952 | 9,299 |
| Class M4, 0.9358% 7/25/37 (a)(b) | | 29,987 | 14,432 |
| Class M5, 1.0358% 7/25/37 (a)(b) | | 14,479 | 3,043 |
| Series 2007-4A Class M1, 1.3716% 9/25/37 (a)(b) | | 16,497 | 4,065 |
| Bear Stearns Commercial Mortgage Securities Trust: | | | |
| sequential payer: | | | |
| Series 2006-PW13 Class A1A, 5.533% 9/11/41 | | 680,553 | 687,048 |
| Series 2006-PW14 Class A1A, 5.189% 12/11/38 | | 360,159 | 366,172 |
| Series 2006-T22 Class A1A, 5.8216% 4/12/38 (b) | | 10,268 | 10,258 |
| Series 2006-PW12 Class A1A, 5.9065% 9/11/38 (b) | | 370,888 | 371,138 |
| BXHTL Mortgage Trust Series 2015-JWRZ Class A, 1.656% 5/15/29 (a)(b) | | 2,065,000 | 2,016,019 |
| C-BASS Trust floater Series 2006-SC1 Class A, 0.7058% 5/25/36 (a)(b) | | 20,671 | 19,876 |
| CD Commercial Mortgage Trust Series 2007-CD5 Class A1A, 5.8% 11/15/44 | | 739,907 | 776,472 |
| CDGJ Commercial Mortgage Trust Series 2014-BXCH Class A, 1.827% 12/15/27 (a)(b) | | 7,424,941 | 7,400,557 |
| CGBAM Commercial Mortgage Trust Series 2015-SMRT Class A, 2.808% 4/10/28 (a) | | 5,000,000 | 5,105,490 |
| Citigroup Commercial Mortgage Trust: | | | |
| sequential payer Series 2006-C5 Class A4, 5.431% 10/15/49 | | 1,449,733 | 1,464,198 |
| Series 2006-C4 Class A1A, 6.0329% 3/15/49 (b) | | 323,431 | 323,552 |
| Series 2015-GC29 Class A2, 2.674% 4/10/48 | | 1,388,000 | 1,418,447 |
| Citigroup/Deutsche Bank Commercial Mortgage Trust sequential payer Series 2006-CD3 Class A5, 5.617% 10/15/48 | | 227,913 | 229,367 |
| COMM Mortgage Trust: | | | |
| floater Series 2014-KYO Class A, 1.324% 6/11/27 (a)(b) | | 1,500,000 | 1,462,944 |
| Series 2013-LC6 Class ASB, 2.478% 1/10/46 | | 2,180,000 | 2,196,679 |
| Series 2014-CR15 Class A2, 2.928% 2/10/47 | | 3,957,000 | 4,053,423 |
| Series 2014-CR17 Class A2, 3.012% 5/10/47 | | 790,000 | 813,347 |
| Series 2014-CR20 Class A2, 2.801% 11/10/47 | | 987,000 | 1,012,377 |
| Series 2014-UBS3 Class A2, 2.844% 6/10/47 | | 1,960,000 | 2,011,384 |
| Series 2015-CR22 Class A2, 2.856% 3/10/48 | | 953,000 | 981,991 |
| COMM Mortgage Trust pass-thru certificates: | | | |
| floater Series 2005-F10A Class J, 1.2805% 4/15/17 (a)(b) | | 14,378 | 14,277 |
| sequential payer: | | | |
| Series 2006-C7 Class A1A, 5.9515% 6/10/46 (b) | | 469,550 | 470,744 |
| Series 2006-C8: | | | |
| Class A1A, 5.292% 12/10/46 | | 1,093,029 | 1,108,645 |
| Class A4, 5.306% 12/10/46 | | 1,526,955 | 1,548,538 |
| Series 2006-C7 Class A4, 5.9625% 6/10/46 (b) | | 416,734 | 416,935 |
| Credit Suisse Commercial Mortgage Trust sequential payer: | | | |
| Series 2007-C2 Class A3, 5.542% 1/15/49 (b) | | 432,000 | 440,566 |
| Series 2007-C3 Class A4, 5.8888% 6/15/39 (b) | | 1,433,621 | 1,469,107 |
| Credit Suisse First Boston Mortgage Securities Corp. Series 2001-CKN5 Class AX, 0.0141% 9/15/34 (a)(b)(e) | | 102 | 0 |
| CSMC Series 2015-TOWN: | | | |
| Class B, 2.327% 3/15/17 (a)(b) | | 264,000 | 254,854 |
| Class C, 2.677% 3/15/17 (a)(b) | | 257,000 | 245,778 |
| Class D, 3.627% 3/15/17 (a)(b) | | 1,003,000 | 951,358 |
| GAHR Commercial Mortgage Trust: | | | |
| floater Series 2015-NRF Class AFL1, 1.7255% 12/15/16 (a)(b) | | 5,058,216 | 5,009,828 |
| Series 2015-NRF: | | | |
| Class BFX, 3.3822% 12/15/19 (a)(b) | | 2,358,850 | 2,342,301 |
| Class CFX, 3.3822% 12/15/19 (a)(b) | | 1,059,000 | 1,030,239 |
| GE Capital Commercial Mortgage Corp.: | | | |
| sequential payer Series 2007-C1 Class A4, 5.543% 12/10/49 | | 2,544,000 | 2,584,054 |
| Series 2007-C1 Class A1A, 5.483% 12/10/49 (b) | | 5,010,151 | 5,143,722 |
| Greenwich Capital Commercial Funding Corp.: | | | |
| sequential payer Series 2007-GG9 Class A4, 5.444% 3/10/39 | | 918,805 | 938,374 |
| Series 2006-GG7 Class A4, 6.0483% 7/10/38 (b) | | 1,002,018 | 1,004,481 |
| GS Mortgage Securities Corp. Trust Series 2013-C, 2.974% 1/10/30 (a) | | 150,000 | 150,341 |
| GS Mortgage Securities Trust: | | | |
| floater Series 2014-GSFL Class A, 1.4255% 7/15/31 (a)(b) | | 399,314 | 393,225 |
| sequential payer Series 2006-GG8: | | | |
| Class A1A, 5.547% 11/10/39 | | 429,722 | 434,481 |
| Class A4, 5.56% 11/10/39 | | 6,047,719 | 6,096,485 |
| Series 2015-GC32 Class A2, 3.062% 7/10/48 | | 2,500,000 | 2,594,221 |
| Hilton U.S.A. Trust: | | | |
| floater Series 2013-HLF Class AFL, 1.4295% 11/5/30 (a)(b) | | 440,663 | 439,986 |
| Series 2013-HLT: | | | |
| Class CFX, 3.7141% 11/5/30 (a) | | 110,000 | 109,655 |
| Class DFX, 4.4065% 11/5/30 (a) | | 1,039,000 | 1,035,748 |
| JP Morgan Chase Commercial Mortgage Securities Trust Series 2015-JP1 Class A2, 3.1438% 1/15/49 | | 1,975,000 | 2,071,900 |
| JPMBB Commercial Mortgage Secutities Trust Series 2015-C29 Class A2, 2.9213% 5/15/48 | | 1,567,000 | 1,626,740 |
| JPMorgan Chase Commercial Mortgage Securities Trust: | | | |
| floater: | | | |
| Series 2014-BXH Class A, 1.3305% 4/15/27 (a)(b) | | 1,100,000 | 1,086,464 |
| Series 2014-FL5 Class A, 1.4055% 7/15/31 (a)(b) | | 1,056,206 | 1,042,928 |
| sequential payer: | | | |
| Series 2006-CB16 Class A4, 5.552% 5/12/45 | | 1,394,608 | 1,401,800 |
| Series 2006-LDP8: | | | |
| Class A1A, 5.397% 5/15/45 | | 87,443 | 88,065 |
| Class A4, 5.399% 5/15/45 | | 1,456,273 | 1,460,800 |
| Series 2007-LD11 Class A4, 5.9599% 6/15/49 (b) | | 29,781 | 30,375 |
| Series 2007-LDPX Class A3, 5.42% 1/15/49 | | 3,625,347 | 3,696,463 |
| Series 2011-C3 Class A3, 4.3877% 2/15/46 (a) | | 1,718,000 | 1,793,022 |
| Series 2006-LDP7 Class A1A, 6.1056% 4/17/45 (b) | | 808,132 | 811,582 |
| LB-UBS Commercial Mortgage Trust: | | | |
| sequential payer: | | | |
| Series 2006-C6 Class A4, 5.372% 9/15/39 | | 227,635 | 229,746 |
| Series 2006-C7: | | | |
| Class A1A, 5.335% 11/15/38 | | 2,185,310 | 2,221,130 |
| Class A2, 5.3% 11/15/38 | | 26,694 | 26,969 |
| Series 2007-C1 Class A4, 5.424% 2/15/40 | | 2,994,053 | 3,051,337 |
| Series 2006-C6 Class A1A, 5.342% 9/15/39 (b) | | 1,110,047 | 1,120,482 |
| Series 2007-C7 Class A3, 5.866% 9/15/45 | | 1,225,377 | 1,290,861 |
| Merrill Lynch Mortgage Trust: | | | |
| Series 2005-LC1 Class F, 5.9178% 1/12/44 (a)(b) | | 56,826 | 56,723 |
| Series 2006-C2 Class A1A, 5.739% 8/12/43 (b) | | 673,587 | 678,296 |
| Merrill Lynch-CFC Commercial Mortgage Trust: | | | |
| sequential payer Series 2007-5 Class A4, 5.378% 8/12/48 | | 4,549,434 | 4,634,288 |
| Series 2007-6 Class B, 5.635% 3/12/51 (b) | | 216,000 | 60,653 |
| Morgan Stanley BAML Trust Series 2014-C14 Class A2, 2.916% 2/15/47 | | 817,000 | 844,156 |
| Morgan Stanley Capital I Trust: | | | |
| floater: | | | |
| Series 2006-XLF Class C, 1.631% 7/15/19 (a)(b) | | 40,774 | 40,285 |
| Series 2007-XLFA: | | | |
| Class D, 0.6155% 10/15/20 (a)(b) | | 31,745 | 31,747 |
| Class E, 0.6755% 10/15/20 (a)(b) | | 95,138 | 95,143 |
| Class F, 0.7255% 10/15/20 (a)(b) | | 57,094 | 57,097 |
| Class G, 0.7655% 10/15/20 (a)(b) | | 70,577 | 70,581 |
| Class H, 0.8555% 10/15/20 (a)(b) | | 44,426 | 44,471 |
| Class J, 1.0055% 10/15/20 (a)(b) | | 25,649 | 24,833 |
| sequential payer: | | | |
| Series 2007-IQ13 Class A1A, 5.312% 3/15/44 | | 337,456 | 344,969 |
| Series 2011-C2 Class A4, 4.661% 6/15/44 (a) | | 2,725,000 | 3,013,844 |
| Series 2006-HQ9 Class A4, 5.731% 7/12/44 (b) | | 313,668 | 313,471 |
| Series 2006-IQ11 Class A1A, 5.9599% 10/15/42 (b) | | 78,290 | 78,216 |
| Series 2007-IQ14 Class A4, 5.692% 4/15/49 | | 1,195,000 | 1,223,304 |
| Series 2007-T27 Class A1A, 5.8206% 6/11/42 (b) | | 818,328 | 852,290 |
| Providence Place Group Ltd. Partnership sequential payer Series 2000-C1 Class A1, 7.75% 7/20/16 (a) | | 2,678 | 2,743 |
| SCG Trust Series 2013-SRP1 Class A, 1.8255% 11/15/26 (a)(b) | | 2,027,000 | 2,017,928 |
| UBS Commercial Mortgage Trust Series 2012-C1 Class A2, 2.18% 5/10/45 | | 354,364 | 355,548 |
| Wachovia Bank Commercial Mortgage Trust: | | | |
| sequential payer: | | | |
| Series 2006-C29: | | | |
| Class A1A, 5.297% 11/15/48 | | 1,555,134 | 1,583,711 |
| Class A4, 5.308% 11/15/48 | | 553,769 | 559,669 |
| Series 2007-C30 Class A5, 5.342% 12/15/43 | | 5,468,000 | 5,599,694 |
| Series 2007-C32 Class A3, 5.8991% 6/15/49 (b) | | 367,000 | 374,925 |
| Series 2007-C33: | | | |
| Class A4, 6.1491% 2/15/51 (b) | | 3,074,873 | 3,175,855 |
| Class A5, 6.1491% 2/15/51 (b) | | 143,000 | 150,298 |
| Series 2006-C25 Class A1A, 5.9451% 5/15/43 (b) | | 212,102 | 211,739 |
| Series 2006-C26 Class A1A, 6.009% 6/15/45 (b) | | 593,776 | 594,663 |
| Series 2006-C27: | | | |
| Class A1A, 5.749% 7/15/45 (b) | | 434,540 | 436,541 |
| Class A3, 5.765% 7/15/45 (b) | | 459,802 | 459,271 |
| WF-RBS Commercial Mortgage Trust Series 2013-C11 Class ASB, 2.63% 3/15/45 | | 1,310,000 | 1,327,983 |
| WFCG Commercial Mortgage Trust floater Series 2015-BXRP Class A, 1.5475% 11/15/29 (a)(b) | | 1,589,600 | 1,568,778 |
| TOTAL COMMERCIAL MORTGAGE SECURITIES | | | |
| (Cost $145,752,333) | | | 143,432,988 |
|
| Municipal Securities - 0.8% | | | |
| Illinois Gen. Oblig.: | | | |
| Series 2003, 4.95% 6/1/23 | | $2,645,000 | $2,754,186 |
| Series 2011: | | | |
| 4.961% 3/1/16 | | 6,320,000 | 6,320,000 |
| 5.665% 3/1/18 | | 630,000 | 665,204 |
| 5.877% 3/1/19 | | 4,715,000 | 5,096,491 |
| Series 2013, 2.69% 12/1/17 | | 500,000 | 503,905 |
| TOTAL MUNICIPAL SECURITIES | | | |
| (Cost $15,294,534) | | | 15,339,786 |
|
| Foreign Government and Government Agency Obligations - 0.1% | | | |
Brazilian Federative Republic 6% 1/17/17
(Cost $2,071,670) | | $2,000,000 | $2,072,000 |
|
| Supranational Obligations - 0.0% | | | |
International Bank for Reconstruction & Development 1% 6/15/18
(Cost $425,464) | | 426,000 | 425,441 |
|
| Bank Notes - 2.3% | | | |
| Bank of America NA: | | | |
| 1.25% 2/14/17 | | $2,420,000 | $2,418,028 |
| 1.65% 3/26/18 | | 1,924,000 | 1,916,106 |
| 1.75% 6/5/18 | | 2,000,000 | 1,987,380 |
| 5.3% 3/15/17 | | 250,000 | 258,473 |
| Capital One Bank NA: | | | |
| 1.3% 6/5/17 | | 1,000,000 | 994,941 |
| 2.25% 2/13/19 | | 1,000,000 | 992,494 |
| Capital One NA 1.65% 2/5/18 | | 3,000,000 | 2,961,585 |
| Discover Bank 3.1% 6/4/20 | | 1,708,000 | 1,698,731 |
| Fifth Third Bank: | | | |
| 1.45% 2/28/18 | | 580,000 | 574,663 |
| 2.875% 10/1/21 | | 2,000,000 | 2,017,872 |
| First Tennessee Bank NA, Memphis 2.95% 12/1/19 | | 5,000,000 | 4,977,815 |
| JPMorgan Chase Bank 6% 10/1/17 | | 1,762,000 | 1,869,158 |
| KeyBank NA: | | | |
| 1.65% 2/1/18 | | 397,000 | 395,775 |
| 2.5% 12/15/19 | | 3,783,000 | 3,825,230 |
| Manufacturers & Traders Trust Co. 2.3% 1/30/19 | | 1,100,000 | 1,106,466 |
| Marshall & Ilsley Bank 5% 1/17/17 | | 1,868,000 | 1,917,125 |
| Regions Bank 7.5% 5/15/18 | | 250,000 | 275,560 |
| Regions Financial Corp. 2.25% 9/14/18 | | 4,000,000 | 3,982,764 |
| The Toronto-Dominion Bank 2.125% 7/2/19 | | 5,000,000 | 5,039,990 |
| U.S. Bank NA 2.125% 10/28/19 | | 2,186,000 | 2,211,596 |
| Union Bank NA 2.125% 6/16/17 | | 700,000 | 703,690 |
| Wachovia Bank NA 6% 11/15/17 | | 570,000 | 611,779 |
| TOTAL BANK NOTES | | | |
| (Cost $42,604,005) | | | 42,737,221 |
| | | Shares | Value |
|
| Fixed-Income Funds - 0.8% | | | |
| Fidelity Specialized High Income Central Fund (f) | | | |
| (Cost $16,910,667) | | 162,831 | 15,449,410 |
|
| Money Market Funds - 0.8% | | | |
| Fidelity Cash Central Fund, 0.40% (g) | | | |
| (Cost $14,718,871) | | 14,718,871 | 14,718,871 |
| | | Maturity Amount | Value |
|
| Cash Equivalents - 4.1% | | | |
| Investments in repurchase agreements in a joint trading account at 0.4%, dated 2/29/16 due 3/1/16 (Collateralized by U.S. Government Obligations) # (h) | | | |
| (Cost $78,443,000) | | 78,443,872 | 78,443,000 |
| TOTAL INVESTMENT PORTFOLIO - 104.7% | | | |
| (Cost $1,997,336,946) | | | 1,986,476,828 |
| NET OTHER ASSETS (LIABILITIES) - (4.7)% | | | (88,782,241) |
| NET ASSETS - 100% | | | $1,897,694,587 |
Swaps
| Underlying Reference | Rating(1) | Expiration Date | Clearinghouse/Counterparty | Fixed Payment Received/(Paid) | Notional Amount(2) | Value(1) | Upfront Premium Received/(Paid) | Unrealized Appreciation/(Depreciation) |
| Credit Default Swaps | | | | | | | | |
| Sell Protection | | | | | | | | |
| Morgan Stanley ABS Capital I Inc Series 2004-NC8 Class B3 | C | Oct. 2034 | Merrill Lynch International | 4.60% | USD 16,329 | $(1,264) | $0 | $(1,264) |
(1) Ratings are presented for credit default swaps in which the Fund has sold protection on the underlying referenced debt. Ratings for an underlying index represent a weighted average of the ratings of all securities included in the index. The credit rating or value can be measures of the current payment/performance risk. Ratings are from Moody's Investors Service, Inc. Where Moody's® ratings are not available, S&P® ratings are disclosed and are indicated as such. All ratings are as of the report date and do not reflect subsequent changes.
(2) The notional amount of each credit default swap where the Fund has sold protection approximates the maximum potential amount of future payments that the Fund could be required to make if a credit event were to occur.
Legend
(a) Security exempt from registration under Rule 144A of the Securities Act of 1933. These securities may be resold in transactions exempt from registration, normally to qualified institutional buyers. At the end of the period, the value of these securities amounted to $311,245,996 or 16.4% of net assets.
(b) Coupon rates for floating and adjustable rate securities reflect the rates in effect at period end.
(c) Security or a portion of the security has been segregated as collateral for open bi-lateral over-the-counter (OTC) swaps. At period end, the value of securities pledged amounted to $122,073.
(d) Represents an investment in an underlying pool of reverse mortgages which typically do not require regular principal and interest payments as repayment is deferred until a maturity event.
(e) Security represents right to receive monthly interest payments on an underlying pool of mortgages or assets. Principal shown is the outstanding par amount of the pool as of the end of the period.
(f) Affiliated fund that is generally available only to investment companies and other accounts managed by Fidelity Investments. A complete unaudited schedule of portfolio holdings for each Fidelity Central Fund is filed with the SEC for the first and third quarters of each fiscal year on Form N-Q and is available upon request or at the SEC's website at www.sec.gov. An unaudited holdings listing for the Fund, which presents direct holdings as well as the pro-rata share of securities and other investments held indirectly through its investment in underlying non-money market Fidelity Central Funds, is available at fidelity.com and/or advisor.fidelity.com, as applicable. In addition, each Fidelity Central Fund's financial statements are available on the SEC's website or upon request.
(g) Affiliated fund that is generally available only to investment companies and other accounts managed by Fidelity Investments. The rate quoted is the annualized seven-day yield of the fund at period end. A complete unaudited listing of the fund's holdings as of its most recent quarter end is available upon request. In addition, each Fidelity Central Fund's financial statements are available on the SEC's website or upon request.
(h) Includes investment made with cash collateral received from securities on loan.
Affiliated Central Funds
Information regarding fiscal year to date income earned by the Fund from investments in Fidelity Central Funds is as follows:
| Fund | Income earned |
| Fidelity Cash Central Fund | $51,578 |
| Fidelity Specialized High Income Central Fund | 445,486 |
| Total | $497,064 |
Additional information regarding the Fund's fiscal year to date purchases and sales, including the ownership percentage, of the non Money Market Central Funds is as follows:
| Fund | Value, beginning of period | Purchases | Sales Proceeds | Value, end of period | % ownership, end of period |
| Fidelity Specialized High Income Central Fund | $16,060,481 | $447,917 | $-- | $15,449,410 | 1.9% |
| Total | $16,060,481 | $447,917 | $-- | $15,449,410 | |
Investment Valuation
The following is a summary of the inputs used, as of February 29, 2016, involving the Fund's assets and liabilities carried at fair value. The inputs or methodology used for valuing securities may not be an indication of the risk associated with investing in those securities. For more information on valuation inputs, and their aggregation into the levels used below, please refer to the Investment Valuation section in the accompanying Notes to Financial Statements.
| | Valuation Inputs at Reporting Date: |
| Description | Total | Level 1 | Level 2 | Level 3 |
| Investments in Securities: | | | | |
| Corporate Bonds | $1,321,778,285 | $-- | $1,321,778,285 | $-- |
| U.S. Government and Government Agency Obligations | 148,452,340 | -- | 148,452,340 | -- |
| U.S. Government Agency - Mortgage Securities | 12,635,572 | -- | 12,635,572 | -- |
| Asset-Backed Securities | 160,328,585 | -- | 159,932,939 | 395,646 |
| Collateralized Mortgage Obligations | 30,663,329 | -- | 30,663,329 | -- |
| Commercial Mortgage Securities | 143,432,988 | -- | 143,432,610 | 378 |
| Municipal Securities | 15,339,786 | -- | 15,339,786 | -- |
| Foreign Government and Government Agency Obligations | 2,072,000 | -- | 2,072,000 | -- |
| Supranational Obligations | 425,441 | -- | 425,441 | -- |
| Bank Notes | 42,737,221 | -- | 42,737,221 | -- |
| Fixed-Income Funds | 15,449,410 | 15,449,410 | -- | -- |
| Money Market Funds | 14,718,871 | 14,718,871 | -- | -- |
| Cash Equivalents | 78,443,000 | -- | 78,443,000 | -- |
| Total Investments in Securities: | $1,986,476,828 | $30,168,281 | $1,955,912,523 | $396,024 |
| Derivative Instruments: | | | | |
| Liabilities | | | | |
| Swaps | $(1,264) | $-- | $(1,264) | $-- |
| Total Liabilities | $(1,264) | $-- | $(1,264) | $-- |
| Total Derivative Instruments: | $(1,264) | $-- | $(1,264) | $-- |
Value of Derivative Instruments
The following table is a summary of the Fund's value of derivative instruments by primary risk exposure as of February 29, 2016. For additional information on derivative instruments, please refer to the Derivative Instruments section in the accompanying Notes to Financial Statements.
| Primary Risk Exposure / Derivative Type | Value |
| | Asset | Liability |
| Credit Risk | | |
| Swaps(a) | $0 | $(1,264) |
| Total Credit Risk | 0 | (1,264) |
| Total Value of Derivatives | $0 | $(1,264) |
(a) For bi-lateral OTC swaps, reflects gross value which is presented in the Statement of Assets and Liabilities in the bi-lateral OTC swaps, at value line-items.
Other Information
# Additional information on each counterparty to the repurchase agreement is as follows:
| Repurchase Agreement / Counterparty | Value |
| $78,443,000 due 3/01/16 at 0.40% | |
| Commerz Markets LLC | $78,443,000 |
| | $78,443,000 |
Distribution of investments by country or territory of incorporation, as a percentage of Total Net Assets, is as follows (Unaudited):
| United States of America | 84.5% |
| United Kingdom | 4.7% |
| Canada | 2.8% |
| Japan | 1.6% |
| France | 1.1% |
| Others (Individually Less Than 1%) | 5.3% |
| | 100.0% |
The information in the above table is based on the combined investments of the Fund and its pro-rata share of the investments of Fidelity's Fixed-Income Central Funds.
See accompanying notes which are an integral part of the financial statements.
Financial Statements
Statement of Assets and Liabilities
| | | February 29, 2016 (Unaudited) |
| Assets | | |
Investment in securities, at value (including repurchase agreements of $78,443,000) — See accompanying schedule:
Unaffiliated issuers (cost $1,965,707,408) | $1,956,308,547 | |
| Fidelity Central Funds (cost $31,629,538) | 30,168,281 | |
| Total Investments (cost $1,997,336,946) | | $1,986,476,828 |
| Cash | | 17,300 |
| Receivable for investments sold | | 4,580,612 |
| Receivable for fund shares sold | | 5,143,838 |
| Interest receivable | | 10,745,959 |
| Distributions receivable from Fidelity Central Funds | | 85,876 |
| Other receivables | | 667 |
| Total assets | | 2,007,051,080 |
| Liabilities | | |
| Payable for investments purchased | $25,112,869 | |
| Payable for fund shares redeemed | 4,552,431 | |
| Distributions payable | 295,543 | |
| Bi-lateral OTC swaps, at value | 1,264 | |
| Accrued management fee | 488,306 | |
| Distribution and service plan fees payable | 197,027 | |
| Other affiliated payables | 265,748 | |
| Other payables and accrued expenses | 5 | |
| Collateral on securities loaned, at value | 78,443,300 | |
| Total liabilities | | 109,356,493 |
| Net Assets | | $1,897,694,587 |
| Net Assets consist of: | | |
| Paid in capital | | $1,927,755,442 |
| Undistributed net investment income | | 2,808,318 |
| Accumulated undistributed net realized gain (loss) on investments | | (22,007,791) |
| Net unrealized appreciation (depreciation) on investments | | (10,861,382) |
| Net Assets | | $1,897,694,587 |
| Calculation of Maximum Offering Price | | |
| Class A: | | |
| Net Asset Value and redemption price per share ($314,703,093 ÷ 27,708,466 shares) | | $11.36 |
| Maximum offering price per share (100/97.25 of $11.36) | | $11.68 |
| Class T: | | |
| Net Asset Value and redemption price per share ($193,597,348 ÷ 17,035,689 shares) | | $11.36 |
| Maximum offering price per share (100/97.25 of $11.36) | | $11.68 |
| Class B: | | |
| Net Asset Value and offering price per share ($900,323 ÷ 79,367 shares)(a) | | $11.34 |
| Class C: | | |
| Net Asset Value and offering price per share ($111,047,135 ÷ 9,799,616 shares)(a) | | $11.33 |
| Fidelity Limited Term Bond Fund: | | |
| Net Asset Value, offering price and redemption price per share ($831,639,600 ÷ 73,036,683 shares) | | $11.39 |
| Class I: | | |
| Net Asset Value, offering price and redemption price per share ($445,807,088 ÷ 39,144,534 shares) | | $11.39 |
(a) Redemption price per share is equal to net asset value less any applicable contingent deferred sales charge.
See accompanying notes which are an integral part of the financial statements.
Statement of Operations
| | | Six months ended February 29, 2016 (Unaudited) |
| Investment Income | | |
| Interest | | $22,504,412 |
| Income from Fidelity Central Funds | | 497,064 |
| Total income | | 23,001,476 |
| Expenses | | |
| Management fee | $2,770,688 | |
| Transfer agent fees | 1,186,625 | |
| Distribution and service plan fees | 1,093,513 | |
| Fund wide operations fee | 344,661 | |
| Independent trustees' compensation | 3,709 | |
| Miscellaneous | 1,153 | |
| Total expenses before reductions | 5,400,349 | |
| Expense reductions | (647) | 5,399,702 |
| Net investment income (loss) | | 17,601,774 |
| Realized and Unrealized Gain (Loss) | | |
| Net realized gain (loss) on: | | |
| Investment securities: | | |
| Unaffiliated issuers | 1,379,535 | |
| Swaps | 505 | |
| Total net realized gain (loss) | | 1,380,040 |
Change in net unrealized appreciation (depreciation) on:
Investment securities | (11,704,758) | |
| Swaps | 1,507 | |
| Total change in net unrealized appreciation (depreciation) | | (11,703,251) |
| Net gain (loss) | | (10,323,211) |
| Net increase (decrease) in net assets resulting from operations | | $7,278,563 |
See accompanying notes which are an integral part of the financial statements.
Statement of Changes in Net Assets
| | Six months ended February 29, 2016 (Unaudited) | Year ended August 31, 2015 |
| Increase (Decrease) in Net Assets | | |
| Operations | | |
| Net investment income (loss) | $17,601,774 | $21,313,755 |
| Net realized gain (loss) | 1,380,040 | 2,048,322 |
| Change in net unrealized appreciation (depreciation) | (11,703,251) | (16,775,250) |
| Net increase (decrease) in net assets resulting from operations | 7,278,563 | 6,586,827 |
| Distributions to shareholders from net investment income | (16,486,255) | (19,985,756) |
| Share transactions - net increase (decrease) | 176,353,500 | 941,601,529 |
| Total increase (decrease) in net assets | 167,145,808 | 928,202,600 |
| Net Assets | | |
| Beginning of period | 1,730,548,779 | 802,346,179 |
| End of period (including undistributed net investment income of $2,808,318 and undistributed net investment income of $1,692,799, respectively) | $1,897,694,587 | $1,730,548,779 |
See accompanying notes which are an integral part of the financial statements.
Financial Highlights — Fidelity Advisor Limited Term Bond Fund Class A
| | Six months ended February 29, (Unaudited) | Years ended August 31, | | | | |
| | 2016 | 2015 | 2014 | 2013 | 2012 | 2011 |
| Selected Per–Share Data | | | | | | |
| Net asset value, beginning of period | $11.42 | $11.52 | $11.33 | $11.69 | $11.45 | $11.28 |
| Income from Investment Operations | | | | | | |
| Net investment income (loss)A | .104 | .170 | .232 | .243 | .289 | .344 |
| Net realized and unrealized gain (loss) | (.068) | (.111) | .160 | (.384) | .215 | .163 |
| Total from investment operations | .036 | .059 | .392 | (.141) | .504 | .507 |
| Distributions from net investment income | (.096) | (.159) | (.202) | (.219) | (.264) | (.322) |
| Distributions from net realized gain | – | – | – | – | – | (.015) |
| Total distributions | (.096) | (.159) | (.202) | (.219) | (.264) | (.337) |
| Net asset value, end of period | $11.36 | $11.42 | $11.52 | $11.33 | $11.69 | $11.45 |
| Total ReturnB,C,D | .32% | .51% | 3.48% | (1.24)% | 4.46% | 4.59% |
| Ratios to Average Net AssetsE,F | | | | | | |
| Expenses before reductions | .76%G | .76% | .79% | .82% | .83% | .83% |
| Expenses net of fee waivers, if any | .76%G | .76% | .79% | .82% | .83% | .83% |
| Expenses net of all reductions | .76%G | .76% | .79% | .82% | .83% | .83% |
| Net investment income (loss) | 1.83%G | 1.48% | 2.02% | 2.09% | 2.52% | 3.06% |
| Supplemental Data | | | | | | |
| Net assets, end of period (000 omitted) | $314,703 | $304,040 | $215,800 | $155,980 | $192,761 | $187,442 |
| Portfolio turnover rateH | 40%G | 44% | 94% | 112% | 129% | 108%I |
A Calculated based on average shares outstanding during the period.
B Total returns for periods of less than one year are not annualized.
C Total returns would have been lower if certain expenses had not been reduced during the applicable periods shown.
D Total returns do not include the effect of the sales charges.
E Fees and expenses of any underlying Fidelity Central Funds are not included in the Fund's expense ratio. The Fund indirectly bears its proportionate share of the expenses of any underlying Fidelity Central Funds. Based on their most recent shareholder report date, the expenses of any underlying non-money market Fidelity Central Funds were less than .005%.
F Expense ratios reflect operating expenses of the class. Expenses before reductions do not reflect amounts reimbursed by the investment adviser or reductions from expense offset arrangements and do not represent the amount paid by the class during periods when reimbursements or reductions occur. Expenses net of fee waivers reflect expenses after reimbursement by the investment adviser but prior to reductions from expense offset arrangements. Expenses net of all reductions represent the net expenses paid by the class.
G Annualized
H Amount does not include the portfolio activity of any underlying Fidelity Central Funds.
I The portfolio turnover rate excludes liquidations and redemptions executed in-kind from Affiliated Central Funds.
See accompanying notes which are an integral part of the financial statements.
Financial Highlights — Fidelity Advisor Limited Term Bond Fund Class T
| | Six months ended February 29, (Unaudited) | Years ended August 31, | | | | |
| | 2016 | 2015 | 2014 | 2013 | 2012 | 2011 |
| Selected Per–Share Data | | | | | | |
| Net asset value, beginning of period | $11.42 | $11.53 | $11.34 | $11.70 | $11.45 | $11.29 |
| Income from Investment Operations | | | | | | |
| Net investment income (loss)A | .103 | .170 | .234 | .246 | .292 | .348 |
| Net realized and unrealized gain (loss) | (.067) | (.121) | .161 | (.384) | .225 | .153 |
| Total from investment operations | .036 | .049 | .395 | (.138) | .517 | .501 |
| Distributions from net investment income | (.096) | (.159) | (.205) | (.222) | (.267) | (.326) |
| Distributions from net realized gain | – | – | – | – | – | (.015) |
| Total distributions | (.096) | (.159) | (.205) | (.222) | (.267) | (.341) |
| Net asset value, end of period | $11.36 | $11.42 | $11.53 | $11.34 | $11.70 | $11.45 |
| Total ReturnB,C,D | .32% | .42% | 3.50% | (1.21)% | 4.57% | 4.53% |
| Ratios to Average Net AssetsE,F | | | | | | |
| Expenses before reductions | .77%G | .76% | .77% | .80% | .80% | .80% |
| Expenses net of fee waivers, if any | .77%G | .76% | .77% | .80% | .80% | .80% |
| Expenses net of all reductions | .77%G | .76% | .77% | .80% | .80% | .80% |
| Net investment income (loss) | 1.83%G | 1.48% | 2.04% | 2.11% | 2.54% | 3.09% |
| Supplemental Data | | | | | | |
| Net assets, end of period (000 omitted) | $193,597 | $193,612 | $198,510 | $210,150 | $265,426 | $274,215 |
| Portfolio turnover rateH | 40%G | 44% | 94% | 112% | 129% | 108%I |
A Calculated based on average shares outstanding during the period.
B Total returns for periods of less than one year are not annualized.
C Total returns would have been lower if certain expenses had not been reduced during the applicable periods shown.
D Total returns do not include the effect of the sales charges.
E Fees and expenses of any underlying Fidelity Central Funds are not included in the Fund's expense ratio. The Fund indirectly bears its proportionate share of the expenses of any underlying Fidelity Central Funds. Based on their most recent shareholder report date, the expenses of any underlying non-money market Fidelity Central Funds were less than .005%.
F Expense ratios reflect operating expenses of the class. Expenses before reductions do not reflect amounts reimbursed by the investment adviser or reductions from expense offset arrangements and do not represent the amount paid by the class during periods when reimbursements or reductions occur. Expenses net of fee waivers reflect expenses after reimbursement by the investment adviser but prior to reductions from expense offset arrangements. Expenses net of all reductions represent the net expenses paid by the class.
G Annualized
H Amount does not include the portfolio activity of any underlying Fidelity Central Funds.
I The portfolio turnover rate excludes liquidations and redemptions executed in-kind from Affiliated Central Funds.
See accompanying notes which are an integral part of the financial statements.
Financial Highlights — Fidelity Advisor Limited Term Bond Fund Class B
| | Six months ended February 29, (Unaudited) | Years ended August 31, | | | | |
| | 2016 | 2015 | 2014 | 2013 | 2012 | 2011 |
| Selected Per–Share Data | | | | | | |
| Net asset value, beginning of period | $11.40 | $11.51 | $11.32 | $11.68 | $11.43 | $11.27 |
| Income from Investment Operations | | | | | | |
| Net investment income (loss)A | .062 | .090 | .149 | .159 | .206 | .264 |
| Net realized and unrealized gain (loss) | (.068) | (.122) | .161 | (.384) | .225 | .154 |
| Total from investment operations | (.006) | (.032) | .310 | (.225) | .431 | .418 |
| Distributions from net investment income | (.054) | (.078) | (.120) | (.135) | (.181) | (.243) |
| Distributions from net realized gain | – | – | – | – | – | (.015) |
| Total distributions | (.054) | (.078) | (.120) | (.135) | (.181) | (.258) |
| Net asset value, end of period | $11.34 | $11.40 | $11.51 | $11.32 | $11.68 | $11.43 |
| Total ReturnB,C,D | (.05)% | (.28)% | 2.75% | (1.95)% | 3.81% | 3.77% |
| Ratios to Average Net AssetsE,F | | | | | | |
| Expenses before reductions | 1.51%G | 1.46% | 1.51% | 1.55% | 1.55% | 1.55% |
| Expenses net of fee waivers, if any | 1.51%G | 1.46% | 1.51% | 1.55% | 1.55% | 1.55% |
| Expenses net of all reductions | 1.51%G | 1.46% | 1.51% | 1.55% | 1.55% | 1.55% |
| Net investment income (loss) | 1.09%G | .78% | 1.30% | 1.36% | 1.79% | 2.35% |
| Supplemental Data | | | | | | |
| Net assets, end of period (000 omitted) | $900 | $919 | $1,507 | $2,956 | $5,209 | $7,018 |
| Portfolio turnover rateH | 40%G | 44% | 94% | 112% | 129% | 108%I |
A Calculated based on average shares outstanding during the period.
B Total returns for periods of less than one year are not annualized.
C Total returns would have been lower if certain expenses had not been reduced during the applicable periods shown.
D Total returns do not include the effect of the contingent deferred sales charge.
E Fees and expenses of any underlying Fidelity Central Funds are not included in the Fund's expense ratio. The Fund indirectly bears its proportionate share of the expenses of any underlying Fidelity Central Funds. Based on their most recent shareholder report date, the expenses of any underlying non-money market Fidelity Central Funds were less than .005%.
F Expense ratios reflect operating expenses of the class. Expenses before reductions do not reflect amounts reimbursed by the investment adviser or reductions from expense offset arrangements and do not represent the amount paid by the class during periods when reimbursements or reductions occur. Expenses net of fee waivers reflect expenses after reimbursement by the investment adviser but prior to reductions from expense offset arrangements. Expenses net of all reductions represent the net expenses paid by the class.
G Annualized
H Amount does not include the portfolio activity of any underlying Fidelity Central Funds.
I The portfolio turnover rate excludes liquidations and redemptions executed in-kind from Affiliated Central Funds.
See accompanying notes which are an integral part of the financial statements.
Financial Highlights — Fidelity Advisor Limited Term Bond Fund Class C
| | Six months ended February 29, (Unaudited) | Years ended August 31, | | | | |
| | 2016 | 2015 | 2014 | 2013 | 2012 | 2011 |
| Selected Per–Share Data | | | | | | |
| Net asset value, beginning of period | $11.39 | $11.50 | $11.31 | $11.67 | $11.42 | $11.26 |
| Income from Investment Operations | | | | | | |
| Net investment income (loss)A | .060 | .081 | .143 | .155 | .204 | .262 |
| Net realized and unrealized gain (loss) | (.068) | (.121) | .162 | (.384) | .225 | .154 |
| Total from investment operations | (.008) | (.040) | .305 | (.229) | .429 | .416 |
| Distributions from net investment income | (.052) | (.070) | (.115) | (.131) | (.179) | (.241) |
| Distributions from net realized gain | – | – | – | – | – | (.015) |
| Total distributions | (.052) | (.070) | (.115) | (.131) | (.179) | (.256) |
| Net asset value, end of period | $11.33 | $11.39 | $11.50 | $11.31 | $11.67 | $11.42 |
| Total ReturnB,C,D | (.07)% | (.35)% | 2.70% | (1.98)% | 3.79% | 3.76% |
| Ratios to Average Net AssetsE,F | | | | | | |
| Expenses before reductions | 1.54%G | 1.54% | 1.56% | 1.58% | 1.57% | 1.56% |
| Expenses net of fee waivers, if any | 1.54%G | 1.54% | 1.56% | 1.58% | 1.57% | 1.56% |
| Expenses net of all reductions | 1.54%G | 1.54% | 1.56% | 1.58% | 1.57% | 1.56% |
| Net investment income (loss) | 1.06%G | .71% | 1.25% | 1.34% | 1.78% | 2.33% |
| Supplemental Data | | | | | | |
| Net assets, end of period (000 omitted) | $111,047 | $81,929 | $64,333 | $53,096 | $65,425 | $63,435 |
| Portfolio turnover rateH | 40%G | 44% | 94% | 112% | 129% | 108%I |
A Calculated based on average shares outstanding during the period.
B Total returns for periods of less than one year are not annualized.
C Total returns would have been lower if certain expenses had not been reduced during the applicable periods shown.
D Total returns do not include the effect of the contingent deferred sales charge.
E Fees and expenses of any underlying Fidelity Central Funds are not included in the Fund's expense ratio. The Fund indirectly bears its proportionate share of the expenses of any underlying Fidelity Central Funds. Based on their most recent shareholder report date, the expenses of any underlying non-money market Fidelity Central Funds were less than .005%.
F Expense ratios reflect operating expenses of the class. Expenses before reductions do not reflect amounts reimbursed by the investment adviser or reductions from expense offset arrangements and do not represent the amount paid by the class during periods when reimbursements or reductions occur. Expenses net of fee waivers reflect expenses after reimbursement by the investment adviser but prior to reductions from expense offset arrangements. Expenses net of all reductions represent the net expenses paid by the class.
G Annualized
H Amount does not include the portfolio activity of any underlying Fidelity Central Funds.
I The portfolio turnover rate excludes liquidations and redemptions executed in-kind from Affiliated Central Funds.
See accompanying notes which are an integral part of the financial statements.
Financial Highlights — Fidelity Advisor Limited Term Bond Fund
| | Six months ended February 29, (Unaudited) | Years ended August 31, | |
| | 2016 | 2015 | 2014 A |
| Selected Per–Share Data | | | |
| Net asset value, beginning of period | $11.45 | $11.55 | $11.50 |
| Income from Investment Operations | | | |
| Net investment income (loss)B | .122 | .205 | .209 |
| Net realized and unrealized gain (loss) | (.068) | (.110) | .038 |
| Total from investment operations | .054 | .095 | .247 |
| Distributions from net investment income | (.114) | (.195) | (.197) |
| Net asset value, end of period | $11.39 | $11.45 | $11.55 |
| Total ReturnC,D | .48% | .83% | 2.17% |
| Ratios to Average Net AssetsE,F | | | |
| Expenses before reductions | .45%G | .45% | .46%G |
| Expenses net of fee waivers, if any | .45%G | .45% | .46%G |
| Expenses net of all reductions | .45%G | .45% | .46%G |
| Net investment income (loss) | 2.14%G | 1.79% | 2.22%G |
| Supplemental Data | | | |
| Net assets, end of period (000 omitted) | $831,640 | $758,240 | $147,629 |
| Portfolio turnover rateH | 40%G | 44% | 94% |
A For the period November 1, 2013 (commencement of sale of shares) to August 31, 2014.
B Calculated based on average shares outstanding during the period.
C Total returns for periods of less than one year are not annualized.
D Total returns would have been lower if certain expenses had not been reduced during the applicable periods shown.
E Fees and expenses of any underlying Fidelity Central Funds are not included in the Fund's expense ratio. The Fund indirectly bears its proportionate share of the expenses of any underlying Fidelity Central Funds. Based on their most recent shareholder report date, the expenses of any underlying non-money market Fidelity Central Funds were less than .005%.
F Expense ratios reflect operating expenses of the class. Expenses before reductions do not reflect amounts reimbursed by the investment adviser or reductions from expense offset arrangements and do not represent the amount paid by the class during periods when reimbursements or reductions occur. Expense ratios before reductions for start-up periods may not be representative of longer-term operating periods. Expenses net of fee waivers reflect expenses after reimbursement by the investment adviser but prior to reductions from expense offset arrangements. Expenses net of all reductions represent the net expenses paid by the class.
G Annualized
H Amount does not include the portfolio activity of any underlying Fidelity Central Funds.
See accompanying notes which are an integral part of the financial statements.
Financial Highlights — Fidelity Advisor Limited Term Bond Fund Class I
| | Six months ended February 29, (Unaudited) | Years ended August 31, | | | | |
| | 2016 | 2015 | 2014 | 2013 | 2012 | 2011 |
| Selected Per–Share Data | | | | | | |
| Net asset value, beginning of period | $11.45 | $11.55 | $11.36 | $11.72 | $11.48 | $11.31 |
| Income from Investment Operations | | | | | | |
| Net investment income (loss)A | .119 | .200 | .262 | .273 | .319 | .373 |
| Net realized and unrealized gain (loss) | (.068) | (.111) | .161 | (.385) | .213 | .163 |
| Total from investment operations | .051 | .089 | .423 | (.112) | .532 | .536 |
| Distributions from net investment income | (.111) | (.189) | (.233) | (.248) | (.292) | (.351) |
| Distributions from net realized gain | – | – | – | – | – | (.015) |
| Total distributions | (.111) | (.189) | (.233) | (.248) | (.292) | (.366) |
| Net asset value, end of period | $11.39 | $11.45 | $11.55 | $11.36 | $11.72 | $11.48 |
| Total ReturnB,C | .45% | .78% | 3.74% | (.99)% | 4.71% | 4.85% |
| Ratios to Average Net AssetsD,E | | | | | | |
| Expenses before reductions | .50%F | .50% | .53% | .57% | .58% | .58% |
| Expenses net of fee waivers, if any | .50%F | .50% | .53% | .57% | .58% | .58% |
| Expenses net of all reductions | .50%F | .50% | .53% | .57% | .58% | .58% |
| Net investment income (loss) | 2.09%F | 1.74% | 2.28% | 2.34% | 2.77% | 3.32% |
| Supplemental Data | | | | | | |
| Net assets, end of period (000 omitted) | $445,807 | $391,808 | $174,568 | $84,843 | $101,234 | $89,583 |
| Portfolio turnover rateG | 40%F | 44% | 94% | 112% | 129% | 108%H |
A Calculated based on average shares outstanding during the period.
B Total returns for periods of less than one year are not annualized.
C Total returns would have been lower if certain expenses had not been reduced during the applicable periods shown.
D Fees and expenses of any underlying Fidelity Central Funds are not included in the Fund's expense ratio. The Fund indirectly bears its proportionate share of the expenses of any underlying Fidelity Central Funds. Based on their most recent shareholder report date, the expenses of any underlying non-money market Fidelity Central Funds were less than .005%.
E Expense ratios reflect operating expenses of the class. Expenses before reductions do not reflect amounts reimbursed by the investment adviser or reductions from expense offset arrangements and do not represent the amount paid by the class during periods when reimbursements or reductions occur. Expenses net of fee waivers reflect expenses after reimbursement by the investment adviser but prior to reductions from expense offset arrangements. Expenses net of all reductions represent the net expenses paid by the class.
F Annualized
G Amount does not include the portfolio activity of any underlying Fidelity Central Funds.
H The portfolio turnover rate excludes liquidations and redemptions executed in-kind from Affiliated Central Funds.
See accompanying notes which are an integral part of the financial statements.
Notes to Financial Statements (Unaudited)
For the period ended February 29, 2016
1. Organization.
Fidelity Advisor Limited Term Bond Fund (the Fund) is a fund of Fidelity Advisor Series II (the Trust) and is authorized to issue an unlimited number of shares. The Trust is registered under the Investment Company Act of 1940, as amended (the 1940 Act), as an open-end management investment company organized as a Massachusetts business trust. The Fund offers Class A, Class T, Class C, Fidelity Limited Term Bond and Class I shares, each of which, along with Class B shares, has equal rights as to assets and voting privileges. Class B shares are closed to new accounts and additional purchases, except for exchanges and reinvestments. Each class has exclusive voting rights with respect to matters that affect that class. Class B shares will automatically convert to Class A shares after a maximum holding period of four years from the initial date of purchase.
During the period, the Board of Trustees approved the conversion of all existing Class B shares into Class A shares, effective on or about July 1, 2016, regardless of the length of times shares have been held.
2. Investments in Fidelity Central Funds.
The Fund invests in Fidelity Central Funds, which are open-end investment companies generally available only to other investment companies and accounts managed by the investment adviser and its affiliates. The Fund's Schedule of Investments lists each of the Fidelity Central Funds held as of period end, if any, as an investment of the Fund, but does not include the underlying holdings of each Fidelity Central Fund. As an Investing Fund, the Fund indirectly bears its proportionate share of the expenses of the underlying Fidelity Central Funds.
Based on its investment objective, each Fidelity Central Fund may invest or participate in various investment vehicles or strategies that are similar to those of the Fund. These strategies are consistent with the investment objectives of the Fund and may involve certain economic risks which may cause a decline in value of each of the Fidelity Central Funds and thus a decline in the value of the Fund. The Money Market Central Funds seek preservation of capital and current income and are managed by Fidelity Investments Money Management, Inc. (FIMM), an affiliate of the investment adviser. Annualized expenses of the Money Market Central Funds as of their most recent shareholder report date are less than .005%. The following summarizes the Fund's investment in each non-money market Fidelity Central Fund.
| Fidelity Central Fund | Investment Manager | Investment Objective | Investment Practices | Expense Ratio(a) |
| Fidelity Specialized High Income Central Fund | FMR Co., Inc. (FMRC) | Seeks a high level of current income by normally investing in income-producing debt securities, with an emphasis on lower-quality debt securities. | Loans & Direct Debt Instruments
Restricted Securities
| Less than .005% |
(a) Expenses expressed as a percentage of average net assets and are as of each underlying Central Fund's most recent annual or semi-annual shareholder report.
An unaudited holdings listing for the Fund, which presents direct holdings as well as the pro-rata share of any securities and other investments held indirectly through its investment in underlying non-money market Fidelity Central Funds, is available at fidelity.com and/or advisor.fidelity.com, as applicable. A complete unaudited list of holdings for each Fidelity Central Fund is available upon request or at the Securities and Exchange Commission (the SEC) website at www.sec.gov. In addition, the financial statements of the Fidelity Central Funds which contain the significant accounting policies (including investment valuation policies) of those funds are available on the SEC website or upon request.
3. Significant Accounting Policies.
The financial statements have been prepared in conformity with accounting principles generally accepted in the United States of America (GAAP), which require management to make certain estimates and assumptions at the date of the financial statements. Actual results could differ from those estimates. Subsequent events, if any, through the date that the financial statements were issued have been evaluated in the preparation of the financial statements. The following summarizes the significant accounting policies of the Fund:
Investment Valuation. Investments are valued as of 4:00 p.m. Eastern time on the last calendar day of the period. The Board of Trustees (the Board) has delegated the day to day responsibility for the valuation of the Fund's investments to the Fidelity Management & Research Company (FMR) Fair Value Committee (the Committee). In accordance with valuation policies and procedures approved by the Board, the Fund attempts to obtain prices from one or more third party pricing vendors or brokers to value its investments. When current market prices, quotations or currency exchange rates are not readily available or reliable, investments will be fair valued in good faith by the Committee, in accordance with procedures adopted by the Board. Factors used in determining fair value vary by investment type and may include market or investment specific events, changes in interest rates and credit quality. The frequency with which these procedures are used cannot be predicted and they may be utilized to a significant extent. The Committee oversees the Fund's valuation policies and procedures and reports to the Board on the Committee's activities and fair value determinations. The Board monitors the appropriateness of the procedures used in valuing the Fund's investments and ratifies the fair value determinations of the Committee.
The Fund categorizes the inputs to valuation techniques used to value its investments into a disclosure hierarchy consisting of three levels as shown below:
- Level 1 – quoted prices in active markets for identical investments
- Level 2 – other significant observable inputs (including quoted prices for similar investments, interest rates, prepayment speeds, etc.)
- Level 3 – unobservable inputs (including the Fund's own assumptions based on the best information available)
Valuation techniques used to value the Fund's investments by major category are as follows:
Debt securities, including restricted securities, are valued based on evaluated prices received from third party pricing vendors or from brokers who make markets in such securities. Corporate bonds, bank notes, foreign government and government agency obligations, municipal securities, supranational obligations and U.S. government and government agency obligations, are valued by pricing vendors who utilize matrix pricing which considers yield or price of bonds of comparable quality, coupon, maturity and type or by broker-supplied prices. Asset backed securities, collateralized mortgage obligations, commercial mortgage securities and U.S. government agency mortgage securities, are valued by pricing vendors who utilize matrix pricing which considers prepayment speed assumptions, attributes of the collateral, yield or price of bonds of comparable quality, coupon, maturity and type or by broker-supplied prices. Swaps are marked-to-market daily based on valuations from third party pricing vendors, registered derivatives clearing organizations (clearinghouses) or broker-supplied valuations. These pricing sources may utilize inputs such as interest rate curves, credit spread curves, default possibilities and recovery rates. When independent prices are unavailable or unreliable, debt securities and swaps may be valued utilizing pricing methodologies which consider similar factors that would be used by third party pricing vendors. Debt securities and swaps are generally categorized as Level 2 in the hierarchy but may be Level 3 depending on the circumstances.
Investments in open-end mutual funds, including the Fidelity Central Funds, are valued at their closing net asset value (NAV) each business day and are categorized as Level 1 in the hierarchy. Short-term securities with remaining maturities of sixty days or less may be valued at amortized cost, which approximates fair value, and are categorized as Level 2 in the hierarchy.
Changes in valuation techniques may result in transfers in or out of an assigned level within the disclosure hierarchy. The aggregate value of investments by input level as of February 29, 2016 is included at the end of the Fund's Schedule of Investments.
Investment Transactions and Income. For financial reporting purposes, the Fund's investment holdings and NAV include trades executed through the end of the last business day of the period. The NAV per share for processing shareholder transactions is calculated as of the close of business of the New York Stock Exchange (NYSE), normally 4:00 p.m. Eastern time and includes trades executed through the end of the prior business day. Gains and losses on securities sold are determined on the basis of identified cost and may include proceeds received from litigation. Income and capital gain distributions from Fidelity Central Funds, if any, are recorded on the ex-dividend date. Interest income is accrued as earned and includes coupon interest and amortization of premium and accretion of discount on debt securities as applicable. Debt obligations may be placed on non-accrual status and related interest income may be reduced by ceasing current accruals and writing off interest receivables when the collection of all or a portion of interest has become doubtful based on consistently applied procedures. A debt obligation is removed from non-accrual status when the issuer resumes interest payments or when collectability of interest is reasonably assured.
Class Allocations and Expenses. Investment income, realized and unrealized capital gains and losses, common expenses of the Fund, and certain fund-level expense reductions, if any, are allocated daily on a pro-rata basis to each class based on the relative net assets of each class to the total net assets of the Fund. Each class differs with respect to transfer agent and distribution and service plan fees incurred. Certain expense reductions may also differ by class. For the reporting period, the allocated portion of income and expenses to each class as a percent of its average net assets may vary due to the timing of recording these transactions in relation to fluctuating net assets of the classes. Expenses directly attributable to a fund are charged to that fund. Expenses attributable to more than one fund are allocated among the respective funds on the basis of relative net assets or other appropriate methods. Expense estimates are accrued in the period to which they relate and adjustments are made when actual amounts are known.
Income Tax Information and Distributions to Shareholders. Each year, the Fund intends to qualify as a regulated investment company under Subchapter M of the Internal Revenue Code, including distributing substantially all of its taxable income and realized gains. As a result, no provision for U.S. Federal income taxes is required. The Fund files a U.S. federal tax return, in addition to state and local tax returns as required. The Fund's federal income tax returns are subject to examination by the Internal Revenue Service (IRS) for a period of three fiscal years after they are filed. State and local tax returns may be subject to examination for an additional fiscal year depending on the jurisdiction.
Dividends are declared and recorded daily and paid monthly from net investment income. Distributions from realized gains, if any, are declared and recorded on the ex-dividend date. Income dividends and capital gain distributions are declared separately for each class. Income and capital gain distributions are determined in accordance with income tax regulations, which may differ from GAAP.
Capital accounts within the financial statements are adjusted for permanent book-tax differences. These adjustments have no impact on net assets or the results of operations. Capital accounts are not adjusted for temporary book-tax differences which will reverse in a subsequent period.
Book-tax differences are primarily due to swaps, market discount, partnerships (including allocations from Fidelity Central Funds), deferred trustees compensation, capital loss carryforwards and losses deferred due to wash sales and excise tax regulations.
The federal tax cost of investment securities and unrealized appreciation (depreciation) as of period end were as follows:
| Gross unrealized appreciation | $12,563,690 |
| Gross unrealized depreciation | (21,334,988) |
| Net unrealized appreciation (depreciation) on securities | $(8,771,298) |
| Tax cost | $1,995,248,126 |
Capital loss carryforwards are only available to offset future capital gains of the Fund to the extent provided by regulations and may be limited. Under the Regulated Investment Company Modernization Act of 2010 (the Act), the Fund is permitted to carry forward capital losses incurred in taxable years beginning after December 22, 2010 for an unlimited period and such capital losses are required to be used prior to any losses that expire. The capital loss carryforward information presented below, including any applicable limitation, is estimated as of prior fiscal period end and is subject to adjustment.
| Fiscal year of expiration | |
| 2017 | $(9,328) |
| 2018 | (18,759,952) |
| Total capital loss carryforward | $(18,769,280) |
Repurchase Agreements. Pursuant to an Exemptive Order issued by the SEC, the Fund along with other registered investment companies having management contracts with FMR, or other affiliated entities of FMR, are permitted to transfer uninvested cash balances into joint trading accounts which are then invested in repurchase agreements. The Fund may also invest directly with institutions in repurchase agreements. Upon settlement date, collateral is held in segregated accounts with custodian banks and may be obtained in the event of a default of the counterparty. The Fund monitors, on a daily basis, the value of the collateral to ensure it is at least equal to the principal amount of the repurchase agreement (including accrued interest). In the event of a default by the counterparty, realization of the collateral proceeds could be delayed, during which time the value of the collateral may decline.
Restricted Securities. The Fund may invest in securities that are subject to legal or contractual restrictions on resale. These securities generally may be resold in transactions exempt from registration or to the public if the securities are registered. Disposal of these securities may involve time-consuming negotiations and expense, and prompt sale at an acceptable price may be difficult. Information regarding restricted securities is included at the end of the Fund's Schedule of Investments.
4. Derivative Instruments.
Risk Exposures and the Use of Derivative Instruments. The Fund's investment objective allows the Fund to enter into various types of derivative contracts, including swaps. Derivatives are investments whose value is primarily derived from underlying assets, indices or reference rates and may be transacted on an exchange or over-the-counter (OTC). Derivatives may involve a future commitment to buy or sell a specified asset based on specified terms, to exchange future cash flows at periodic intervals based on a notional principal amount, or for one party to make one or more payments upon the occurrence of specified events in exchange for periodic payments from the other party.
The Fund used derivatives to increase returns, to gain exposure to certain types of assets and to manage exposure to certain risks as defined below. The success of any strategy involving derivatives depends on analysis of numerous economic factors, and if the strategies for investment do not work as intended, the Fund may not achieve its objectives.
The Fund's use of derivatives increased or decreased its exposure to the following risk:
| Credit Risk | Credit risk relates to the ability of the issuer of a financial instrument to make further principal or interest payments on an obligation or commitment that it has to the Fund.
|
The Fund is also exposed to additional risks from investing in derivatives, such as liquidity risk and counterparty credit risk. Liquidity risk is the risk that the Fund will be unable to close out the derivative in the open market in a timely manner. Counterparty credit risk is the risk that the counterparty will not be able to fulfill its obligation to the Fund. Derivative counterparty credit risk is managed through formal evaluation of the creditworthiness of all potential counterparties. On certain OTC derivatives such as bi-lateral swaps, the Fund attempts to reduce its exposure to counterparty credit risk by entering into an International Swaps and Derivatives Association, Inc. (ISDA) Master Agreement with each of its counterparties. The ISDA Master Agreement gives the Fund the right to terminate all transactions traded under such agreement upon the deterioration in the credit quality of the counterparty beyond specified levels. The ISDA Master Agreement gives each party the right, upon an event of default by the other party or a termination of the agreement, to close out all transactions traded under such agreement and to net amounts owed under each transaction to one net payable by one party to the other. To mitigate counterparty credit risk on bi-lateral OTC derivatives, the Fund receives collateral in the form of cash or securities once the Fund's net unrealized appreciation on outstanding derivative contracts under an ISDA Master Agreement exceeds certain applicable thresholds, subject to certain minimum transfer provisions. The collateral received is held in segregated accounts with the Fund's custodian bank in accordance with the collateral agreements entered into between the Fund, the counterparty and the Fund's custodian bank. The Fund could experience delays and costs in gaining access to the collateral even though it is held by the Fund's custodian bank. The Fund's maximum risk of loss from counterparty credit risk related to bi-lateral OTC derivatives is generally the aggregate unrealized appreciation and unpaid counterparty payments in excess of any collateral pledged by the counterparty to the Fund. The Fund may be required to pledge collateral for the benefit of the counterparties on bi-lateral OTC derivatives in an amount not less than each counterparty's unrealized appreciation on outstanding derivative contracts, subject to certain minimum transfer provisions, and any such pledged collateral is identified in the Schedule of Investments.
Investing in derivatives may involve greater risks than investing in the underlying assets directly and, to varying degrees, may involve risk of loss in excess of any initial investment and collateral received and amounts recognized in the Statement of Assets and Liabilities. In addition, there may be the risk that the change in value of the derivative contract does not correspond to the change in value of the underlying instrument.
Net Realized Gain (Loss) and Change in Net Unrealized Appreciation (Depreciation) on Derivatives. The table below, which reflects the impacts of derivatives on the financial performance of the Fund, summarizes the net realized gain (loss) and change in net unrealized appreciation (depreciation) for derivatives during the period as presented in the Statement of Operations.
| Primary Risk Exposure / Derivative Type | Net Realized Gain (Loss) | Change in Net Unrealized Appreciation (Depreciation) |
| Credit Risk | | |
| Swaps(a) | $505 | $1,507 |
(a) A summary of the value of derivatives by primary risk exposure as of period end is included at the end of the Schedule of Investments.
Swaps. A swap is a contract between two parties to exchange future cash flows at periodic intervals based on a notional principal amount. A bi-lateral OTC swap is a transaction between a fund and a dealer counterparty where cash flows are exchanged between the two parties for the life of the swap.
Bi-lateral OTC swaps are marked-to-market daily and changes in value are reflected in the Statement of Assets and Liabilities in the bi-lateral OTC swaps at value line items. Any upfront premiums paid or received upon entering a bi-lateral OTC swap to compensate for differences between stated terms of the swap and prevailing market conditions (e.g. credit spreads, interest rates or other factors) are recorded in net unrealized appreciation (depreciation) in the Statement of Assets and Liabilities and amortized to realized gain or (loss) ratably over the term of the swap. Any unamortized upfront premiums are presented in the Schedule of Investments.
Payments are exchanged at specified intervals, accrued daily commencing with the effective date of the contract and recorded as realized gain or (loss). Some swaps may be terminated prior to the effective date and realize a gain or loss upon termination. The net realized gain (loss) and change in net unrealized appreciation (depreciation) on swaps during the period is included in the Statement of Operations.
Any open swaps at period end are included in the Schedule of Investments under the caption "Swaps" and are representative of volume of activity during the period.
Credit Default Swaps. Credit default swaps enable the Fund to buy or sell protection against specified credit events on a single-name issuer or a traded credit index. Under the terms of a credit default swap the buyer of protection (buyer) receives credit protection in exchange for making periodic payments to the seller of protection (seller) based on a fixed percentage applied to a notional principal amount. In return for these payments, the seller will be required to make a payment upon the occurrence of one or more specified credit events. The Fund enters into credit default swaps as a seller to gain credit exposure to an issuer and/or as a buyer to obtain a measure of protection against defaults of an issuer. Periodic payments are made over the life of the contract by the buyer provided that no credit event occurs.
For credit default swaps on most corporate and sovereign issuers, credit events include bankruptcy, failure to pay or repudiation/moratorium. For credit default swaps on corporate or sovereign issuers, the obligation that may be put to the seller is not limited to the specific reference obligation described in the Schedule of Investments. For credit default swaps on asset-backed securities, a credit event may be triggered by events such as failure to pay principal, maturity extension, rating downgrade or write-down. For credit default swaps on asset-backed securities, the reference obligation described represents the security that may be put to the seller. For credit default swaps on a traded credit index, a specified credit event may affect all or individual underlying securities included in the index.
As a seller, if an underlying credit event occurs, the Fund will pay a net settlement amount of cash equal to the notional amount of the swap less the recovery value of the reference obligation or underlying securities comprising an index. Only in the event of the industry's inability to value the underlying asset will the Fund be required to take delivery of the reference obligation or underlying securities comprising an index and pay an amount equal to the notional amount of the swap.
As a buyer, if an underlying credit event occurs, the Fund will receive a net settlement amount of cash equal to the notional amount of the swap less the recovery value of the reference obligation or underlying securities comprising an index. Only in the event of the industry's inability to value the underlying asset will the Fund be required to deliver the reference obligation or underlying securities comprising an index in exchange for payment of an amount equal to the notional amount of the swap.
Typically, the value of each credit default swap and credit rating disclosed for each reference obligation in the Schedule of Investments, where the Fund is the seller, can be used as measures of the current payment/performance risk of the swap. As the value of the swap changes as a positive or negative percentage of the total notional amount, the payment/performance risk may decrease or increase, respectively. In addition to these measures, the investment adviser monitors a variety of factors including cash flow assumptions, market activity and market sentiment as part of its ongoing process of assessing payment/performance risk.
5. Purchases and Sales of Investments.
Purchases and sales of securities (including the Fixed-Income Central Funds), other than short-term securities and U.S. government securities, aggregated $267,231,937 and $106,864,859, respectively.
6. Fees and Other Transactions with Affiliates.
Management Fee. Fidelity Management & Research Company (the investment adviser) and its affiliates provide the Fund with investment management related services for which the Fund pays a monthly management fee. The management fee is the sum of an individual fund fee rate that is based on an annual rate of .20% of the Fund's average net assets and an annualized group fee rate that averaged .11% during the period. The group fee rate is based upon the average net assets of all the mutual funds advised by the investment adviser, including any mutual funds previously advised by the investment adviser that are currently advised by Fidelity SelectCo, LLC, an affiliate of the investment adviser. The group fee rate decreases as assets under management increase and increases as assets under management decrease. For the reporting period, the total annualized management fee rate was .31% of the Fund's average net assets.
Distribution and Service Plan Fees. In accordance with Rule 12b-1 of the 1940 Act, the Fund has adopted separate Distribution and Service Plans for each class of shares. Certain classes pay Fidelity Distributors Corporation (FDC), an affiliate of the investment adviser, separate Distribution and Service Fees, each of which is based on an annual percentage of each class' average net assets. In addition, FDC may pay financial intermediaries for selling shares of the Fund and providing shareholder support services. For the period, the Distribution and Service Fee rates, total fees and amounts retained by FDC were as follows:
| | Distribution
Fee | Service
Fee | Total Fees | Retained
by FDC |
| Class A | -% | .25% | $379,493 | $23,005 |
| Class T | -% | .25% | 242,500 | 792 |
| Class B | .65% | .25% | 4,101 | 2,962 |
| Class C | .75% | .25% | 467,419 | 93,881 |
| | | | $1,093,513 | $120,640 |
Sales Load. FDC may receive a front-end sales charge of up to 2.75% for selling Class A shares and Class T shares, some of which is paid to financial intermediaries for selling shares of the Fund. Depending on the holding period, FDC may receive contingent deferred sales charges levied on Class A, Class T, Class B, and Class C redemptions. The deferred sales charges range from 3.00% to 1.00% for Class B shares, 1.00% for Class C shares, .75% or .50% for certain purchases of Class A shares and .25% for certain purchases of Class T shares.
For the period, sales charge amounts retained by FDC were as follows:
| | Retained
by FDC |
| Class A | $16,720 |
| Class T | 13,688 |
| Class B(a) | 221 |
| Class C(a) | 15,446 |
| | $46,075 |
(a) When Class B and Class C shares are initially sold, FDC pays commissions from its own resources to financial intermediaries through which the sales are made.
Transfer Agent Fees. Fidelity Investments Institutional Operations Company, Inc., (FIIOC), an affiliate of the investment adviser, is the transfer, dividend disbursing and shareholder servicing agent for each class of the Fund. FIIOC receives account fees and asset-based fees that vary according to the account size and type of account of the shareholders of each respective class of the Fund, with the exception of Fidelity Limited Term Bond. FIIOC receives an asset-based fee of .10% of Fidelity Limited Term Bond's average net assets. FIIOC pays for typesetting, printing and mailing of shareholder reports, except proxy statements. For the period, transfer agent fees for each class were as follows:
| | Amount | % of
Class-Level Average
Net Assets(a) |
| Class A | $239,551 | .16 |
| Class T | 159,982 | .17 |
| Class B | 1,134 | .25 |
| Class C | 83,452 | .18 |
| Fidelity Limited Term Bond Fund | 381,484 | .10 |
| Class I | 321,022 | .15 |
| | $1,186,625 | |
(a) Annualized
Fund Wide Operations Fee. Pursuant to the Fund Wide Operations and Expense Agreement (FWOE), the investment adviser has agreed to provide for fund level expenses (which do not include transfer agent, Rule 12b-1 fees, compensation of the independent Trustees, interest (including commitment fees), taxes or extraordinary expenses, if any) in return for a FWOE fee equal to .35% of the Fund's average net assets less the total amount of the management fee. The FWOE paid by the Fund is reduced by an amount equal to the fees and expenses paid to the independent Trustees. For the period, the FWOE fee was equivalent to an annualized rate of .04% of average net assets.
Interfund Trades. The Fund may purchase from or sell securities to other Fidelity Funds under procedures adopted by the Board. The procedures have been designed to ensure these interfund trades are executed in accordance with Rule 17a-7 of the 1940 Act. Interfund trades are included within the respective purchases and sales amounts shown in the Purchases and Sales of Investments note.
7. Committed Line of Credit.
The Fund participates with other funds managed by the investment adviser or an affiliate in a $4.25 billion credit facility (the "line of credit") to be utilized for temporary or emergency purposes to fund shareholder redemptions or for other short-term liquidity purposes. The Fund has agreed to pay commitment fees on its pro-rata portion of the line of credit, which amounted to $1,153 and is reflected in Miscellaneous expenses on the Statement of Operations. During the period, the Fund did not borrow on this line of credit.
8. Security Lending.
The Fund lends portfolio securities from time to time in order to earn additional income. On the settlement date of the loan, the Fund receives collateral (in the form of U.S. Treasury obligations, letters of credit and/or cash) against the loaned securities and maintains collateral in an amount not less than 100% of the market value of the loaned securities during the period of the loan. The market value of the loaned securities is determined at the close of business of the Fund and any additional required collateral is delivered to the Fund on the next business day. The Fund or borrower may terminate the loan at any time, and if the borrower defaults on its obligation to return the securities loaned because of insolvency or other reasons, the Fund may apply collateral received from the borrower against the obligation. The Fund may experience delays and costs in recovering the securities loaned. Any cash collateral received is maintained at the Fund's custodian and/or invested in cash equivalents. The value of loaned securities and cash collateral at period end are disclosed on the Fund's Statement of Assets and Liabilities. Security lending income represents the income earned on investing cash collateral, less rebates paid to borrowers, plus any premium payments received for lending certain types of securities. Security lending income is presented in the Statement of Operations as a component of interest income. Total security lending income during the period amounted to $11,054.
9. Expense Reductions.
Through arrangements with the Fund's custodian, credits realized as a result of certain uninvested cash balances were used to reduce the Fund's expenses. During the period, these credits reduced the Fund's custody expenses by $647.
10. Distributions to Shareholders.
Distributions to shareholders of each class were as follows:
| | Six months ended February 29, 2016 | Year ended August 31, 2015 |
| From net investment income | | |
| Class A | $2,573,225 | $3,729,622 |
| Class T | 1,632,269 | 2,760,770 |
| Class B | 4,349 | 9,214 |
| Class C | 429,725 | 455,450 |
| Fidelity Limited Term Bond Fund | 7,670,510 | 7,753,652 |
| Class I | 4,176,177 | 5,277,048 |
| Total | $16,486,255 | $19,985,756 |
11. Share Transactions.
Share transactions for each class were as follows and may contain automatic conversions between classes or exchanges between affiliated funds:
| | Shares | Shares | Dollars | Dollars |
| | Six months ended February 29, 2016 | Year ended August 31, 2015 | Six months ended February 29, 2016 | Year ended August 31, 2015 |
| Class A | | | | |
| Shares sold | 9,493,588 | 22,883,010 | $108,124,976 | $262,802,297 |
| Reinvestment of distributions | 208,809 | 302,206 | 2,375,945 | 3,471,902 |
| Shares redeemed | (8,625,388) | (15,281,488) | (98,288,046) | (175,517,852) |
| Net increase (decrease) | 1,077,009 | 7,903,728 | $12,212,875 | $90,756,347 |
| Class T | | | | |
| Shares sold | 3,230,355 | 4,726,276 | $36,826,027 | $54,308,583 |
| Reinvestment of distributions | 135,211 | 225,689 | 1,539,145 | 2,594,606 |
| Shares redeemed | (3,279,036) | (5,219,634) | (37,380,244) | (59,996,049) |
| Net increase (decrease) | 86,530 | (267,669) | $984,928 | $(3,092,860) |
| Class B | | | | |
| Shares sold | 23,906 | 45,219 | $272,061 | $518,562 |
| Reinvestment of distributions | 348 | 769 | 3,946 | 8,827 |
| Shares redeemed | (25,488) | (96,326) | (290,091) | (1,103,458) |
| Net increase (decrease) | (1,234) | (50,338) | $(14,084) | $(576,069) |
| Class C | | | | |
| Shares sold | 3,748,755 | 3,762,661 | $42,556,513 | $43,110,911 |
| Reinvestment of distributions | 33,368 | 34,649 | 378,455 | 397,236 |
| Shares redeemed | (1,175,287) | (2,200,235) | (13,359,960) | (25,199,324) |
| Net increase (decrease) | 2,606,836 | 1,597,075 | $29,575,008 | $18,308,823 |
| Fidelity Limited Term Bond Fund | | | | |
| Shares sold | 30,185,709 | 73,683,363 | $344,754,445 | $848,661,103 |
| Reinvestment of distributions | 611,698 | 626,332 | 6,976,952 | 7,211,684 |
| Shares redeemed | (24,008,474) | (20,841,425) | (274,433,242) | (239,689,901) |
| Net increase (decrease) | 6,788,933 | 53,468,270 | $77,298,155 | $616,182,886 |
| Class I | | | | |
| Shares sold | 13,435,969 | 31,060,194 | $153,456,360 | $357,596,586 |
| Reinvestment of distributions | 285,314 | 376,794 | 3,255,224 | 4,341,226 |
| Shares redeemed | (8,802,281) | (12,319,776) | (100,414,966) | (141,915,410) |
| Net increase (decrease) | 4,919,002 | 19,117,212 | $56,296,618 | $220,022,402 |
12. Other.
The Fund's organizational documents provide former and current trustees and officers with a limited indemnification against liabilities arising in connection with the performance of their duties to the Fund. In the normal course of business, the Fund may also enter into contracts that provide general indemnifications. The Fund's maximum exposure under these arrangements is unknown as this would be dependent on future claims that may be made against the Fund. The risk of material loss from such claims is considered remote.
13. Credit Risk.
The Fund invests a portion of its assets in structured securities of issuers backed by commercial and residential mortgage loans, credit card receivables and automotive loans. The value and related income of these securities is sensitive to changes in economic conditions, including delinquencies and/or defaults.
Shareholder Expense Example
As a shareholder of the Fund, you incur two types of costs: (1) transaction costs, including sales charges (loads) on purchase payments or redemption proceeds, and (2) ongoing costs, including management fees, distribution and/or service (12b-1) fees and other Fund expenses. This Example is intended to help you understand your ongoing costs (in dollars) of investing in the Fund and to compare these costs with the ongoing costs of investing in other mutual funds.
The Example is based on an investment of $1,000 invested at the beginning of the period and held for the entire period (September 1, 2015 to February 29, 2016).
Actual Expenses
The first line of the accompanying table for each class of the Fund provides information about actual account values and actual expenses. You may use the information in this line, together with the amount you invested, to estimate the expenses that you paid over the period. Simply divide your account value by $1,000.00 (for example, an $8,600 account value divided by $1,000.00 = 8.6), then multiply the result by the number in the first line for a class of the Fund under the heading entitled "Expenses Paid During Period" to estimate the expenses you paid on your account during this period. A small balance maintenance fee of $12.00 that is charged once a year may apply for certain accounts with a value of less than $2,000. This fee is not included in the table below. If it was, the estimate of expenses you paid during the period would be higher, and your ending account value lower, by this amount. In addition, the Fund, as a shareholder in the underlying Fidelity Central Funds, will indirectly bear its pro-rata share of the fees and expenses incurred by the underlying Fidelity Central Funds. These fees and expenses are not included in the Fund's annualized expense ratio used to calculate the expense estimate in the table below.
Hypothetical Example for Comparison Purposes
The second line of the accompanying table for each class of the Fund provides information about hypothetical account values and hypothetical expenses based on a Class' actual expense ratio and an assumed rate of return of 5% per year before expenses, which is not the Class' actual return. The hypothetical account values and expenses may not be used to estimate the actual ending account balance or expenses you paid for the period. You may use this information to compare the ongoing costs of investing in the Fund and other funds. To do so, compare this 5% hypothetical example with the 5% hypothetical examples that appear in the shareholder reports of the other funds. A small balance maintenance fee of $12.00 that is charged once a year may apply for certain accounts with a value of less than $2,000. This fee is not included in the table below. If it was, the estimate of expenses you paid during the period would be higher, and your ending account value lower, by this amount. In addition, the Fund, as a shareholder in the underlying Fidelity Central Funds, will indirectly bear its pro-rata share of the fees and expenses incurred by the underlying Fidelity Central Funds. These fees and expenses are not included in the Fund's annualized expense ratio used to calculate the expense estimate in the table below.
Please note that the expenses shown in the table are meant to highlight your ongoing costs only and do not reflect any transaction costs. Therefore, the second line of the table is useful in comparing ongoing costs only, and will not help you determine the relative total costs of owning different funds. In addition, if these transactional costs were included, your costs would have been higher.
| | Annualized Expense Ratio-A | Beginning
Account Value
September 1, 2015 | Ending
Account Value
February 29, 2016 | Expenses Paid
During Period-B
September 1, 2015
to February 29, 2016 |
| Class A | .76% | | | |
| Actual | | $1,000.00 | $1,003.20 | $3.79 |
| Hypothetical-C | | $1,000.00 | $1,021.08 | $3.82 |
| Class T | .77% | | | |
| Actual | | $1,000.00 | $1,003.20 | $3.84 |
| Hypothetical-C | | $1,000.00 | $1,021.03 | $3.87 |
| Class B | 1.51% | | | |
| Actual | | $1,000.00 | $999.50 | $7.51 |
| Hypothetical-C | | $1,000.00 | $1,017.35 | $7.57 |
| Class C | 1.54% | | | |
| Actual | | $1,000.00 | $999.30 | $7.66 |
| Hypothetical-C | | $1,000.00 | $1,017.21 | $7.72 |
| Fidelity Limited Term Bond Fund | .45% | | | |
| Actual | | $1,000.00 | $1,004.80 | $2.24 |
| Hypothetical-C | | $1,000.00 | $1,022.63 | $2.26 |
| Class I | .50% | | | |
| Actual | | $1,000.00 | $1,004.50 | $2.49 |
| Hypothetical-C | | $1,000.00 | $1,022.38 | $2.51 |
A Annualized expense ratio reflects expenses net of applicable fee waivers.
B Expenses are equal to each Class' annualized expense ratio, multiplied by the average account value over the period, multiplied by 182/366 (to reflect the one-half year period). The fees and expenses of the underlying Fidelity Central Funds in which the Fund invests are not included in each Class' annualized expense ratio. In addition to the expenses noted above, the Fund also indirectly bears its proportional share of the expenses of the underlying Fidelity Central Funds. Annualized expenses of the underlying non-money market Fidelity Central Funds as of their most recent fiscal half year were less than .005%.
C 5% return per year before expenses
Board Approval of Investment Advisory Contracts and Management Fees
Fidelity Advisor Limited Term Bond Fund
Each year, the Board of Trustees, including the Independent Trustees (together, the Board), votes on the renewal of the management contract with Fidelity Management & Research Company (FMR) and the sub-advisory agreements (together, the Advisory Contracts) for the fund. The Board, assisted by the advice of fund counsel and Independent Trustees' counsel, requests and considers a broad range of information relevant to the renewal of the Advisory Contracts throughout the year.
The Board meets regularly and, at each of its meetings, covers an extensive agenda of topics and materials and considers factors that are relevant to its annual consideration of the renewal of the fund's Advisory Contracts, including the services and support provided to the fund and its shareholders. The Board has established four standing committees (Committees) — Operations, Audit, Fair Valuation, and Governance and Nominating — each composed of and chaired by Independent Trustees with varying backgrounds, to which the Board has assigned specific subject matter responsibilities in order to enhance effective decision-making by the Board. The Operations Committee, of which all of the Independent Trustees are members, meets regularly throughout the year and considers, among other matters, information specifically related to the annual consideration of the renewal of the fund's Advisory Contracts. The Board, acting directly and through its Committees, requests and receives information concerning the annual consideration of the renewal of the fund's Advisory Contracts. The Board also meets as needed to consider matters specifically related to the Board's annual consideration of the renewal of the Advisory Contracts. Members of the Board may also meet with trustees of other Fidelity funds through ad hoc joint committees to discuss certain matters relevant to all of the Fidelity funds.
At its September 2015 meeting, the Board unanimously determined to renew the fund's Advisory Contracts. In reaching its determination, the Board considered all factors it believed relevant, including (i) the nature, extent, and quality of the services to be provided to the fund and its shareholders (including the investment performance of the fund); (ii) the competitiveness of the fund's management fee and total expense ratio relative to peer funds; (iii) the total costs of the services to be provided by and the profits to be realized by Fidelity from its relationship with the fund; and (iv) the extent to which (if any) economies of scale exist and would be realized as the fund grows, and whether any economies of scale are appropriately shared with fund shareholders.
In considering whether to renew the Advisory Contracts for the fund, the Board reached a determination, with the assistance of fund counsel and Independent Trustees' counsel and through the exercise of its business judgment, that the renewal of the Advisory Contracts was in the best interests of the fund and its shareholders and that the compensation payable under the Advisory Contracts was fair and reasonable. The Board's decision to renew the Advisory Contracts was not based on any single factor, but rather was based on a comprehensive consideration of all the information provided to the Board at its meetings throughout the year. The Board, in reaching its determination to renew the Advisory Contracts, was aware that shareholders of the fund have a broad range of investment choices available to them, including a wide choice among funds offered by Fidelity's competitors, and that the fund's shareholders, who have the opportunity to review and weigh the disclosure provided by the fund in its prospectus and other public disclosures, have chosen to invest in this fund, which is part of the Fidelity family of funds.
Nature, Extent, and Quality of Services Provided. The Board considered Fidelity's staffing as it relates to the fund, including the backgrounds of investment personnel of Fidelity, and also considered the fund's investment objective, strategies, and related investment philosophy. The Independent Trustees also had discussions with senior management of Fidelity's investment operations and investment groups. The Board considered the structure of the portfolio manager compensation program and whether this structure provides appropriate incentives to act in the best interests of the fund. Additionally, the Board considered the portfolio managers' investments, if any, in the funds that they manage.
Resources Dedicated to Investment Management and Support Services. The Board reviewed the general qualifications and capabilities of Fidelity's investment staff, including its size, education, experience, and resources, as well as Fidelity's approach to recruiting, training, managing, and compensating investment personnel. The Board noted that Fidelity has continued to increase the resources devoted to non-U.S. offices, including expansion of Fidelity's global investment organization. The Board also noted that Fidelity's analysts have extensive resources, tools and capabilities that allow them to conduct sophisticated quantitative and fundamental analysis, as well as credit analysis of issuers, counterparties and guarantors. Further, the Board considered that Fidelity's investment professionals have sufficient access to global information and data so as to provide competitive investment results over time, and that those professionals also have access to sophisticated tools that permit them to assess portfolio construction and risk and performance attribution characteristics continuously, as well as to transmit new information and research conclusions rapidly around the world. Additionally, in its deliberations, the Board considered Fidelity's trading, risk management, compliance, and technology and operations capabilities and resources, which are integral parts of the investment management process.
Shareholder and Administrative Services. The Board considered (i) the nature, extent, quality, and cost of advisory, administrative, and shareholder services performed by FMR, the sub-advisers (together with FMR, the Investment Advisers), and their affiliates under the Advisory Contracts and under separate agreements covering transfer agency, pricing and bookkeeping, and securities lending services for the fund; (ii) the nature and extent of the supervision of third party service providers, principally custodians, subcustodians, and pricing vendors; and (iii) the resources devoted to, and the record of compliance with, the fund's compliance policies and procedures.
The Board noted that the growth of fund assets over time across the complex allows Fidelity to reinvest in the development of services designed to enhance the value or convenience of the Fidelity funds as investment vehicles. These services include 24-hour access to account information and market information through telephone representatives and over the Internet, investor education materials and asset allocation tools, and the expanded availability of Fidelity Investor Centers.
Investment in a Large Fund Family. The Board considered the benefits to shareholders of investing in a Fidelity fund, including the benefits of investing in a fund that is part of a large family of funds offering a variety of investment disciplines and providing a large variety of mutual fund investor services. The Board noted that Fidelity had taken, or had made recommendations that resulted in the Fidelity funds taking, a number of actions over the previous year that benefited particular funds, including (i) continuing to dedicate additional resources to investment research and to the support of the senior management team that oversees asset management; (ii) continuing efforts to enhance Fidelity's global research capabilities; (iii) launching new funds and making other enhancements to meet client needs; (iv) reducing management fees and total expenses for certain index funds and diversified international funds; (v) continuing to launch dedicated lower cost underlying funds to meet portfolio construction needs related to expanding underlying fund options for Fidelity funds of funds, specifically for the Freedom Fund product lines; (vi) rationalizing product lines and gaining increased efficiencies through fund mergers; (vii) launching active fixed-income exchange-traded funds; (viii) continuing to develop, acquire and implement systems and technology to improve services to the funds and shareholders, strengthen information security, and increase efficiency; (ix) implementing investment enhancements to further strengthen Fidelity's target date product line to increase investors' probability of success in achieving their goals; (x) modifying the eligibility criteria for certain share classes to accommodate roll-over assets from employer-sponsored retirement plans; (xi) launching a new Class W of the Freedom Index Funds to attract and retain Fidelity record-kept retirement plan assets; and (xii) implementing changes to Fidelity's money market product line in response to recent money market regulatory reforms.
Investment Performance. The Board considered whether the fund has operated in accordance with its investment objective, as well as its record of compliance with its investment restrictions and its performance history.
The Board took into account discussions with representatives of the Investment Advisers about fund investment performance that occur at Board meetings throughout the year. In this regard the Board noted that as part of regularly scheduled fund reviews and other reports to the Board on fund performance, the Board considers annualized return information for the fund for different time periods, measured against a securities market index ("benchmark index") and a peer group of funds with similar objectives ("peer group"), if any. In its evaluation of fund investment performance at meetings throughout the year, the Board gave particular attention to information indicating underperformance of certain Fidelity funds for specific time periods and discussed with the Investment Advisers the reasons for such underperformance.
In addition to reviewing absolute and relative fund performance, the Independent Trustees periodically consider the appropriateness of fund performance metrics in evaluating the results achieved. In general, the Independent Trustees believe that fund performance should be evaluated based on gross performance (before fees and expenses but after transaction costs) compared to appropriate benchmark indices, over appropriate time periods that may include full market cycles, and on net performance (after fees and expenses) compared to peer groups, as applicable, over the same periods, taking into account relevant factors including the following: general market conditions; expectations for interest rate levels and credit conditions; issuer-specific information including credit quality; the potential for incremental return versus the fund's benchmark index weighed against the risks involved in obtaining that incremental return, including the risk of diminished or negative total returns; and fund cash flows and other factors. Depending on the circumstances, the Independent Trustees may be satisfied with a fund's performance notwithstanding that it lags its benchmark index or peer group for certain periods.
The Independent Trustees recognize that shareholders evaluate performance on a net basis over their own holding periods, for which one-, three-, and five-year periods are often used as a proxy. For this reason, the performance information reviewed by the Board also included net cumulative calendar year total return information for the fund and an appropriate benchmark index and peer group for the most recent one-, three-, and five-year periods.
Based on its review, the Board concluded that the nature, extent, and quality of services provided to the fund under the Advisory Contracts should benefit the shareholders of the fund.
Competitiveness of Management Fee and Total Expense Ratio. The Board considered the fund's management fee and total expense ratio compared to "mapped groups" of competitive funds and classes created for the purpose of facilitating the Trustees' competitive analysis of management fees and total expenses. Fidelity creates "mapped groups" by combining similar Lipper investment objective categories that have comparable investment mandates. Combining Lipper investment objective categories aids the Board's management fee and total expense ratio comparisons by broadening the competitive group used for comparison.
Management Fee. The Board considered two proprietary management fee comparisons for the 12-month periods shown in basis points (BP) in the chart below. The group of Lipper funds used by the Board for management fee comparisons is referred to below as the "Total Mapped Group" and, for the reasons explained above, is broader than the Lipper peer group used by the Board for performance comparisons. The Total Mapped Group comparison focuses on a fund's standing in terms of gross management fees before expense reimbursements or caps relative to the total universe of funds with comparable investment mandates, regardless of whether their management fee structures also are comparable. Funds with comparable investment mandates offer exposure to similar types of securities. Funds with comparable management fee structures have similar management fee contractual arrangements (
e.g., flat rate charged for advisory services, all-inclusive fee rate,
etc.). "TMG %" represents the percentage of funds in the Total Mapped Group that had management fees that were lower than the fund's. For example, a hypothetical TMG % of 20% would mean that 80% of the funds in the Total Mapped Group had higher, and 20% had lower, management fees than the fund. The fund's actual TMG %s and the number of funds in the Total Mapped Group are in the chart below. The "Asset-Size Peer Group" (ASPG) comparison focuses on a fund's standing relative to a subset of non-Fidelity funds within the Total Mapped Group that are similar in size and management fee structure. For example, if a fund is in the first quartile of the ASPG, the fund's management fee ranks in the least expensive or lowest 25% of funds in the ASPG. The ASPG represents at least 15% of the funds in the Total Mapped Group with comparable asset size and management fee structures, subject to a minimum of 50 funds (or all funds in the Total Mapped Group if fewer than 50). Additional information, such as the ASPG quartile in which the fund's management fee rate ranked, is also included in the chart and considered by the Board.
Fidelity Advisor Limited Term Bond Fund
The Board noted that the fund's management fee rate ranked below the median of its Total Mapped Group and below the median of its ASPG for 2014.
The Board noted that, in 2014, the ad hoc Committee on Group Fee was formed by it and other Fidelity fund boards to conduct an in-depth review of the "group fee" component of the management fee of funds with such management fee structures. Committee focus included the mechanics of the group fee, the competitive landscape of group fee structures, Fidelity funds with no group fee component and investment products not included in group fee assets. The Board also considered that, for funds subject to the group fee, FMR agreed to voluntarily waive fees over a specified period of time in amounts designed to account for assets converted from certain funds to certain collective investment trusts.
Based on its review, the Board concluded that the fund's management fee is fair and reasonable in light of the services that the fund receives and the other factors considered.
Total Expense Ratio. In its review of each class's total expense ratio, the Board considered the fund's management fee rate as well as other fund or class expenses, as applicable, such as transfer agent fees, pricing and bookkeeping fees, fund-paid 12b-1 fees, and custodial, legal, and audit fees. The Board also noted that Fidelity may agree to waive fees and expenses from time to time, and the extent to which, if any, it has done so for the fund. As part of its review, the Board also considered the current and historical total expense ratios of each class of the fund compared to competitive fund median expenses. Each class of the fund is compared to those funds and classes in the Total Mapped Group (used by the Board for management fee comparisons) that have a similar sales load structure.
The Board noted that the total expense ratio of each class ranked below its competitive median for 2014.
The Board considered that the current contractual arrangements for the fund have the effect of setting the total "fund-level" (but not "class-level") expenses (including, among certain other "fund-level" expenses, the management fee) for each class at 0.35%. These contractual arrangements may not be increased without the approval of the Board.
The Board recognized that the fund's management contract incorporates a "group fee" structure, which provides for lower group fee rates as total group assets increase, and for higher group fee rates as total group assets decrease (with "group assets" defined to include fund assets under FMR's management plus sector fund assets previously under FMR's management and currently managed by Fidelity SelectCo, LLC). FMR calculates the group fee rates based on a tiered asset "breakpoint" schedule that varies based on asset class. The Board noted, however, that because the current contractual arrangements set the total "fund-level" expenses for each class at 0.35%, increases or decreases in the management fee due to changes in the group fee rate will not impact the total expense ratio.
Fees Charged to Other Fidelity Clients. The Board also considered Fidelity fee structures and other information with respect to clients of Fidelity, such as other funds advised or subadvised by Fidelity, pension plan clients, and other institutional clients with similar mandates. The Board noted the findings of the 2013 ad hoc joint committee (created with the board of other Fidelity funds), which reviewed and compared Fidelity's institutional investment advisory business with its business of providing services to the Fidelity funds, including the differences in services provided, fees charged, and costs incurred, as well as competition in their respective marketplaces.
Based on its review of total expense ratios and fees charged to other Fidelity clients, the Board concluded that the total expense ratio of each class of the fund was reasonable in light of the services that the fund and its shareholders receive and the other factors considered.
Costs of the Services and Profitability. The Board considered the revenues earned and the expenses incurred by Fidelity in conducting the business of developing, marketing, distributing, managing, administering and servicing the fund and servicing the fund's shareholders. The Board also considered the level of Fidelity's profits in respect of all the Fidelity funds.
On an annual basis, Fidelity presents to the Board information about the profitability of its relationship with the fund. Fidelity calculates profitability information for each fund, as well as aggregate profitability information for groups of Fidelity funds and all Fidelity funds, using a series of detailed revenue and cost allocation methodologies which originate with the books and records of Fidelity on which Fidelity's audited financial statements are based. The Audit Committee of the Board reviews any significant changes from the prior year's methodologies.
PricewaterhouseCoopers LLP (PwC), independent registered public accounting firm and auditor to Fidelity and certain Fidelity funds, has been engaged annually by the Board as part of the Board's assessment of Fidelity's profitability analysis. PwC's engagement includes the review and assessment of the methodologies used by Fidelity in determining the revenues and expenses attributable to Fidelity's mutual fund business, and completion of agreed-upon procedures in respect of the mathematical accuracy of fund profitability and its conformity to established allocation methodologies. After considering PwC's reports issued under the engagement and information provided by Fidelity, the Board concluded that while other allocation methods may also be reasonable, Fidelity's profitability methodologies are reasonable in all material respects.
The Board also reviewed Fidelity's non-fund businesses and fall-out benefits related to the mutual fund business as well as cases where Fidelity's affiliates may benefit from or be related to the fund's business.
The Board considered the costs of the services provided by and the profits realized by Fidelity in connection with the operation of the fund and was satisfied that the profitability was not excessive.
Economies of Scale. The Board considered whether there have been economies of scale in respect of the management of the Fidelity funds, whether the Fidelity funds (including the fund) have appropriately benefited from any such economies of scale, and whether there is potential for realization of any further economies of scale. The Board considered the extent to which the fund will benefit from economies of scale as assets grow through increased services to the fund, through waivers or reimbursements, or through fee or expense ratio reductions. The Board also noted that in 2013, it and the boards of other Fidelity funds created an ad hoc committee (the Economies of Scale Committee) to analyze whether Fidelity attains economies of scale in respect of the management and servicing of the Fidelity funds, whether the Fidelity funds have appropriately benefited from such economies of scale, and whether there is potential for realization of any further economies of scale.
The Board concluded, taking into account the analysis of the Economies of Scale Committee, that economies of scale, if any, are being appropriately shared between fund shareholders and Fidelity.
Additional Information Requested by the Board. In order to develop fully the factual basis for consideration of the Fidelity funds' Advisory Contracts, the Board requested and received additional information on certain topics, including: (i) Fidelity's fund profitability methodology, profitability trends for certain funds, and the impact of certain factors on fund profitability results; (ii) portfolio manager changes that have occurred during the past year and the amount of the investment that each portfolio manager has made in the Fidelity fund(s) that he or she manages; (iii) Fidelity's compensation structure for portfolio managers, research analysts, and other key personnel, including its effects on fund profitability, the rationale for the compensation structure, and the extent to which current market conditions have affected retention and recruitment; (iv) the arrangements with and compensation paid to certain fund sub-advisers on behalf of the Fidelity funds; (v) Fidelity's voluntary waiver of its fees to maintain minimum yields for certain money market funds and classes as well as contractual waivers in place for certain funds; (vi) the methodology with respect to competitive fund data and peer group classifications; (vii) Fidelity's transfer agent fee, expense, and service structures for different funds and classes relative to competitive trends, and the impact of the increased use of omnibus accounts; (viii) Fidelity's long-term expectations for its offerings in the workplace investing channel; (ix) new developments in the retail and institutional marketplaces; and (x) the impact of money market reform on Fidelity's money market funds. In addition, the Board considered its discussions with Fidelity throughout the year regarding enhanced information security initiatives and the funds' fair valuation policies.
Based on its evaluation of all of the conclusions noted above, and after considering all factors it believed relevant, the Board concluded that the advisory fee structures are fair and reasonable, and that the fund's Advisory Contracts should be renewed.
LTBI-SANN-0416
1.704557.118
Fidelity Advisor® Mortgage Securities Fund
Class A, Class T, Class B and Class C
Semi-Annual Report February 29, 2016 |
|
Contents
To view a fund's proxy voting guidelines and proxy voting record for the 12-month period ended June 30, visit http://www.fidelity.com/proxyvotingresults or visit the Securities and Exchange Commission's (SEC) web site at http://www.sec.gov.
You may also call 1-877-208-0098 to request a free copy of the proxy voting guidelines.
Standard & Poor's, S&P and S&P 500 are registered service marks of The McGraw-Hill Companies, Inc. and have been licensed for use by Fidelity Distributors Corporation.
Other third-party marks appearing herein are the property of their respective owners.
All other marks appearing herein are registered or unregistered trademarks or service marks of FMR LLC or an affiliated company. © 2016 FMR LLC. All rights reserved.
This report and the financial statements contained herein are submitted for the general information of the shareholders of the Fund. This report is not authorized for distribution to prospective investors in the Fund unless preceded or accompanied by an effective prospectus.
A fund files its complete schedule of portfolio holdings with the SEC for the first and third quarters of each fiscal year on Form N-Q. Forms N-Q are available on the SEC’s web site at http://www.sec.gov. A fund's Forms N-Q may be reviewed and copied at the SEC’s Public Reference Room in Washington, DC. Information regarding the operation of the SEC's Public Reference Room may be obtained by calling 1-800-SEC-0330.
For a complete list of a fund's portfolio holdings, view the most recent holdings listing, semiannual report, or annual report on Fidelity's web site at http://www.fidelity.com, http://www.advisor.fidelity.com, or http://www.401k.com, as applicable.
NOT FDIC INSURED •MAY LOSE VALUE •NO BANK GUARANTEE
Neither the Fund nor Fidelity Distributors Corporation is a bank.
Investment Summary (Unaudited)
The information in the following tables is based on the combined investments of the Fund and its pro-rata share of the investments of Fidelity's Fixed-Income Central Funds.
Coupon Distribution as of February 29, 2016
| | % of fund's investments | % of fund's investments 6 months ago |
| Zero coupon bonds | 0.0 | 0.0 |
| 0.01 - 0.99% | 2.0 | 4.1 |
| 1 - 1.99% | 6.5 | 5.4 |
| 2 - 2.99% | 6.4 | 6.5 |
| 3 - 3.99% | 45.1 | 37.7 |
| 4 - 4.99% | 22.6 | 26.6 |
| 5 - 5.99% | 7.5 | 9.2 |
| 6 - 6.99% | 1.8 | 2.1 |
| 7% and above | 1.2 | 1.4 |
Coupon distribution shows the range of stated interest rates on the fund's investments, excluding short-term investments.
Weighted Average Maturity as of February 29, 2016
| | | 6 months ago |
| Years | 4.5 | 5.2 |
This is a weighted average of all the maturities of the securities held in a fund. Weighted Average Maturity (WAM) can be used as a measure of sensitivity to interest rate changes and market changes. Generally, the longer the maturity, the greater the sensitivity to such changes. WAM is based on the dollar-weighted average length of time until principal payments must be paid. Depending on the types of securities held in a fund, certain maturity shortening devices (e.g., demand features, interest rate resets, and call options) may be taken into account when calculating the WAM.
Duration as of February 29, 2016
| | | 6 months ago |
| Years | 3.0 | 3.6 |
Duration is a measure of a security's price sensitivity to changes in interest rates. Duration differs from maturity in that it considers a security's interest payments in addition to the amount of time until the security reaches maturity, and also takes into account certain maturity shortening features (e.g., demand features, interest rate resets, and call options) when applicable. Securities with longer durations generally tend to be more sensitive to interest rate changes than securities with shorter durations. A fund with a longer average duration generally can be expected to be more sensitive to interest rate changes than a fund with a shorter average duration.
Asset Allocation (% of fund's net assets)
| As of February 29, 2016*,** |
| | Mortgage Securities | 82.8% |
| | CMOs and Other Mortgage Related Securities | 25.5% |
| | Asset-Backed Securities | 6.8% |
| | Short-Term Investments and Net Other Assets (Liabilities)*** | (15.1)% |

* Foreign investments - 0.0%
** Futures and Swaps - (5.3)%
*** Short-Term Investments and Net Other Assets (Liabilities) are not included in the pie chart
| As of August 31, 2015*,** |
| | Mortgage Securities | 83.6% |
| | CMOs and Other Mortgage Related Securities | 32.2% |
| | Asset-Backed Securities | 3.5% |
| | Short-Term Investments and Net Other Assets (Liabilities)*** | (19.3)% |

* Foreign investments - 1.0%
** Futures and Swaps - (8.6)%
*** Short-Term Investments and Net Other Assets (Liabilities) are not included in the pie chart
An unaudited holdings listing for the Fund, which presents direct holdings as well as the pro-rata share of any securities and other investments held indirectly through its investment in underlying non-money market Fidelity Central Funds, is available at fidelity.com and/or advisor.fidelity.com, as applicable.
Percentages in the above tables are adjusted for the effect of TBA Sale Commitments.
Percentages shown as 0.0% may reflect amounts less than 0.05%.
Investments February 29, 2016 (Unaudited)
Showing Percentage of Net Assets
| U.S. Government Agency - Mortgage Securities - 88.2% | | | |
| | | Principal Amount (000s) | Value (000s) |
| Fannie Mae - 46.0% | | | |
| 1.814% 9/1/36 (a) | | 86 | 88 |
| 2.07% 4/1/37 (a) | | 104 | 109 |
| 2.108% 3/1/36 (a) | | 129 | 135 |
| 2.26% 1/1/35 (a) | | 176 | 183 |
| 2.302% 6/1/36 (a) | | 43 | 45 |
| 2.31% 4/1/36 (a) | | 147 | 155 |
| 2.315% 9/1/36 (a) | | 71 | 74 |
| 2.317% 5/1/36 (a) | | 218 | 228 |
| 2.408% 7/1/35 (a) | | 5 | 6 |
| 2.426% 8/1/35 (a) | | 264 | 278 |
| 2.45% 11/1/36 (a) | | 39 | 41 |
| 2.458% 3/1/35 (a) | | 29 | 31 |
| 2.472% 7/1/35 (a) | | 45 | 47 |
| 2.5% 2/1/30 | | 120 | 124 |
| 2.5% 3/1/31 (b) | | 100 | 103 |
| 2.525% 5/1/36 (a) | | 36 | 38 |
| 2.555% 6/1/36 (a) | | 385 | 407 |
| 2.557% 3/1/40 (a) | | 181 | 191 |
| 2.559% 10/1/33 (a) | | 40 | 43 |
| 2.689% 2/1/42 (a) | | 642 | 667 |
| 2.75% 10/1/36 (a) | | 172 | 182 |
| 2.761% 1/1/42 (a) | | 566 | 589 |
| 2.78% 9/1/37 (a) | | 29 | 31 |
| 3% 3/1/31 (b) | | 9,100 | 9,490 |
| 3% 11/1/42 to 3/1/44 | | 44,324 | 45,672 |
| 3% 3/1/46 (b) | | 50,900 | 52,192 |
| 3% 3/1/46 (b) | | 1,000 | 1,025 |
| 3% 3/1/46 (b) | | 700 | 718 |
| 3% 3/1/46 (b) | | 600 | 615 |
| 3.007% 8/1/41 (a) | | 411 | 430 |
| 3.346% 9/1/41 (a) | | 129 | 137 |
| 3.465% 12/1/40 (a) | | 5,394 | 5,666 |
| 3.5% 4/1/29 to 8/1/45 | | 78,604 | 83,098 |
| 3.5% 3/1/46 (b) | | 33,800 | 35,418 |
| 3.5% 3/1/46 (b) | | 20,800 | 21,796 |
| 3.5% 3/1/46 (b) | | 20,700 | 21,691 |
| 3.5% 3/1/46 (b) | | 2,000 | 2,096 |
| 3.5% 3/1/46 (b) | | 7,700 | 8,069 |
| 3.5% 3/1/46 (b) | | 1,000 | 1,048 |
| 3.5% 3/1/46 (b) | | 1,000 | 1,048 |
| 3.5% 3/1/46 (b) | | 1,000 | 1,048 |
| 3.5% 3/1/46 (b) | | 6,000 | 6,287 |
| 3.5% 3/1/46 (b) | | 1,000 | 1,048 |
| 3.5% 3/1/46 (b) | | 7,921 | 8,300 |
| 3.5% 3/1/46 (b) | | 6,679 | 6,999 |
| 4% 11/1/31 to 1/1/46 | | 107,571 | 115,429 |
| 4% 3/1/46 (b) | | 150 | 160 |
| 4% 3/1/46 (b) | | 100 | 107 |
| 4% 3/1/46 (b) | | 4,750 | 5,068 |
| 4% 3/1/46 (b) | | 4,750 | 5,068 |
| 4% 3/1/46 (b) | | 50 | 53 |
| 4% 3/1/46 (b) | | 3,300 | 3,521 |
| 4% 3/1/46 (b) | | 3,300 | 3,521 |
| 4% 3/1/46 (b) | | 1,300 | 1,387 |
| 4.5% 5/1/25 to 4/1/45 | | 41,087 | 44,763 |
| 5% 5/1/20 to 8/1/41 | | 495 | 536 |
| 5.255% 8/1/41 | | 893 | 1,011 |
| 5.5% 2/1/18 to 4/1/39 | | 3,507 | 3,978 |
| 5.565% 8/1/46 (a) | | 44 | 46 |
| 6.5% 3/1/16 to 5/1/38 | | 1,389 | 1,592 |
| 7% 3/1/17 to 5/1/30 | | 913 | 1,062 |
| 7.5% 8/1/22 to 9/1/32 | | 593 | 715 |
| 8% 12/1/29 to 3/1/37 | | 15 | 18 |
| 8.5% 2/1/22 to 3/1/23 | | 56 | 64 |
| 9% 10/1/30 | | 198 | 246 |
| 9.5% 7/1/16 to 8/1/22 | | 4 | 4 |
| | | | 506,035 |
| Freddie Mac - 19.0% | | | |
| 1.945% 3/1/35 (a) | | 89 | 92 |
| 2.154% 8/1/37 (a) | | 77 | 81 |
| 2.175% 6/1/37 (a) | | 29 | 31 |
| 2.21% 3/1/36 (a) | | 230 | 240 |
| 2.246% 5/1/37 (a) | | 74 | 78 |
| 2.362% 10/1/42 (a) | | 596 | 630 |
| 2.372% 11/1/35 (a) | | 264 | 275 |
| 2.481% 5/1/34 (a) | | 6 | 7 |
| 2.51% 6/1/37 (a) | | 21 | 22 |
| 2.54% 6/1/37 (a) | | 271 | 286 |
| 2.562% 6/1/37 (a) | | 464 | 488 |
| 2.595% 4/1/37 (a) | | 9 | 9 |
| 2.668% 4/1/37 (a) | | 96 | 101 |
| 2.698% 6/1/33 (a) | | 708 | 747 |
| 2.795% 7/1/36 (a) | | 73 | 77 |
| 3% 10/1/42 to 1/1/46 | | 37,238 | 38,198 |
| 3.03% 10/1/36 (a) | | 13 | 14 |
| 3.075% 12/1/36 (a) | | 398 | 422 |
| 3.082% 9/1/41 (a) | | 577 | 602 |
| 3.25% 10/1/35 (a) | | 41 | 43 |
| 3.427% 12/1/40 (a) | | 2,450 | 2,563 |
| 3.5% 4/1/42 to 6/1/45 (c) | | 66,999 | 70,339 |
| 4% 2/1/41 to 2/1/46 | | 30,408 | 32,599 |
| 4% 3/1/46 (b) | | 9,300 | 9,910 |
| 4% 3/1/46 (b) | | 4,100 | 4,369 |
| 4.5% 7/1/25 to 8/1/44 | | 10,818 | 11,773 |
| 5% 7/1/33 to 7/1/41 | | 11,164 | 12,438 |
| 5.5% 10/1/17 to 10/1/39 | | 10,414 | 11,714 |
| 6% 5/1/16 to 6/1/39 | | 2,282 | 2,593 |
| 6.5% 7/1/16 to 9/1/39 | | 3,771 | 4,317 |
| 7% 6/1/21 to 9/1/36 | | 1,309 | 1,537 |
| 7.5% 5/1/16 to 7/1/34 | | 1,637 | 1,945 |
| 8% 11/1/16 to 1/1/37 | | 17 | 21 |
| 8.5% 8/1/16 to 9/1/20 | | 1 | 1 |
| 9% 9/1/16 to 5/1/21 | | 5 | 5 |
| 10% 4/1/16 to 12/1/18 | | 0 | 0 |
| | | | 208,567 |
| Ginnie Mae - 23.2% | | | |
| 3% 6/15/42 to 12/20/45 | | 44,519 | 46,174 |
| 3.5% 11/20/41 to 1/20/44 | | 48,738 | 51,564 |
| 3.5% 3/1/46 (b) | | 11,900 | 12,565 |
| 3.5% 3/1/46 (b) | | 12,700 | 13,409 |
| 3.5% 3/1/46 (b) | | 6,100 | 6,441 |
| 3.5% 3/1/46 (b) | | 7,300 | 7,708 |
| 3.5% 3/1/46 (b) | | 1,600 | 1,689 |
| 4% 7/20/33 to 7/20/45 | | 50,826 | 54,466 |
| 4% 3/1/46 (b) | | 1,200 | 1,282 |
| 4% 3/1/46 (b) | | 6,200 | 6,621 |
| 4% 3/1/46 (b) | | 2,200 | 2,350 |
| 4.5% 8/15/33 to 5/20/41 | | 31,098 | 33,988 |
| 5% 9/20/33 to 6/15/41 | | 9,833 | 11,079 |
| 5.5% 10/15/33 to 9/15/39 | | 2,893 | 3,284 |
| 6.5% 10/15/34 to 7/15/36 | | 184 | 217 |
| 7% 2/15/24 to 4/20/32 | | 836 | 996 |
| 7.5% 12/15/21 to 12/15/29 | | 307 | 362 |
| 8% 6/15/21 to 12/15/25 | | 175 | 205 |
| 8.5% 1/15/17 to 10/15/28 | | 139 | 166 |
| 9% 11/20/17 | | 0 | 0 |
| 10.5% 10/20/17 to 2/20/18 | | 1 | 1 |
| | | | 254,567 |
| TOTAL U.S. GOVERNMENT AGENCY - MORTGAGE SECURITIES | | | |
| (Cost $953,105) | | | 969,169 |
|
| Asset-Backed Securities - 6.8% | | | |
| American Credit Acceptance Receivable Trust Series 2016-1A Class A, 2.37% 5/12/20 (d) | | $3,270 | $3,271 |
| American Credit Acceptance Receivables Trust Series 2015-3 Class A, 1.95% 9/12/19 (d) | | 4,058 | 4,048 |
| CFC LLC Series 2014-1A Class A, 1.46% 12/17/18 (d) | | 1,203 | 1,202 |
| Citi Held For Asset Issuance Series 2015-PM33 Class A, 2.56% 5/16/22 (d) | | 1,788 | 1,787 |
| Citi Held For Asset Issuance 2 Series 2015-PM2 Class A, 2% 3/15/22 (d) | | 3,696 | 3,675 |
| CPS Auto Receivables Trust: | | | |
| Series 2013-C Class A, 1.64% 4/16/18 (d) | | 629 | 629 |
| Series 2013-D Class A, 1.54% 7/16/18 (d) | | 1,061 | 1,059 |
| CPS Auto Trust Series 2015-C Class A, 1.77% 6/17/19 (d) | | 8,651 | 8,633 |
| Drive Auto Receivables Trust Series 2015-DA Class A2A, 1.23% 6/15/18 (d) | | 4,782 | 4,778 |
| Exeter Automobile Receivables Trust: | | | |
| Series 2014-2A Class A, 1.06% 8/15/18 (d) | | 679 | 677 |
| Series 2016-1A Class A, 2.8% 7/15/20 (d) | | 5,500 | 5,497 |
| Flagship Credit Auto Trust: | | | |
| Series 2015-3 Class A, 2.34% 10/15/20 (d) | | 2,868 | 2,861 |
| Series 2016-1 Class A, 2.53% 12/15/20 (d) | | 10,800 | 10,774 |
| GSAMP Trust Series 2004-AR1 Class B4, 5.5% 6/25/34 (d) | | 45 | 1 |
| JPMorgan Mortgage Acquisition Trust: | | | |
| Series 2007-CH1 Class AF3, 5.532% 11/25/36 | | 1,084 | 1,103 |
| Series 2007-CH4 Class A3, 0.5458% 2/25/32 (a) | | 1,190 | 1,182 |
| Merrill Lynch Mortgage Investors Trust Series 2006-FF1 Class M2, 0.7258% 8/25/36 (a) | | 5,300 | 5,061 |
| Nationstar HECM Loan Trust: | | | |
| Series 2015-1A Class A, 3.844% 5/25/18 (d) | | 6,679 | 6,646 |
| Series 2016-1A Class A, 3.1294% 2/25/26 (d) | | 2,138 | 2,138 |
| OneMain Financial Issuance Trust Series 2014-1A Class A, 2.43% 6/18/24 (d) | | 1,180 | 1,178 |
| Springcastle SPV Series 2014-AA Class A, 2.7% 5/25/23 (d) | | 6,013 | 5,991 |
| Structured Asset Securities Corp. Series 2005-NC2 Class M3, 0.8565% 5/25/35 (a) | | 1,995 | 1,926 |
| Vericrest Opportunity Loan Trust Series 2014-NP11 Class A1, 3.875% 4/25/55 (d) | | 796 | 792 |
| TOTAL ASSET-BACKED SECURITIES | | | |
| (Cost $75,077) | | | 74,909 |
|
| Collateralized Mortgage Obligations - 12.7% | | | |
| Private Sponsor - 6.1% | | | |
| Banc of America Funding Corp. Series 2015-R3 Class 10A1, 0.5665% 6/27/36 (a)(d) | | 7,033 | 6,744 |
| Banc of America Funding Trust sequential payer Series 2010-R3 Class 1A1, 2.808% 12/26/35 (a)(d) | | 1,352 | 1,369 |
| BCAP LLC II Trust Series 2012-RR10 Class 5A5, 0.6868% 4/26/36 (a)(d) | | 274 | 267 |
| BCAP LLC Trust sequential payer: | | | |
| Series 2010-RR11 Class 6A1, 2.7078% 3/27/36 (a)(d) | | $3,479 | $3,452 |
| Series 2012-RR5 Class 8A5, 0.6021% 7/26/36 (a)(d) | | 908 | 860 |
| Citigroup Mortgage Loan Trust sequential payer: | | | |
| Series 2012-A Class A, 2.5% 6/25/51 (d) | | 3,165 | 3,117 |
| Series 2014-8 Class 2A1, 3.45% 6/27/37 (a)(d) | | 6,623 | 6,629 |
| Credit Suisse Commercial Mortgage Trust: | | | |
| floater Series 2010-15R Class 5A5, 0.7816% 11/26/35 (a)(d) | | 4,976 | 4,930 |
| Series 2014-15R Class 7A3, 1.1596% 10/26/37 (a)(d) | | 2,285 | 2,237 |
| Credit Suisse Mortgage Trust Series 2012-2R Class 1A1, 2.7362% 5/27/35 (a)(d) | | 494 | 507 |
| CSMC: | | | |
| floater Series 2015-1R Class 6A1, 0.7004% 5/27/37 (a)(d) | | 4,408 | 4,035 |
| Series 2011-2R Class 2A1, 2.6521% 7/27/36 (d) | | 3,998 | 3,955 |
| Series 2014-3R Class 2A1, 1.1216% 5/27/37 (a)(d) | | 1,223 | 1,154 |
| Exeter Automobile Receivables Trust Series 2015-2A Class A, 1.54% 11/15/19 (d) | | 6,503 | 6,476 |
| FDIC Trust Series 2013-N1 Class A, 4.5% 10/25/18 (d) | | 181 | 181 |
| First Horizon Mortgage pass-thru Trust Series 2004-AR5 Class 2A1, 2.6557% 10/25/34 (a) | | 320 | 307 |
| JPMorgan Re-REMIC Trust floater Series 2009-5 Class 2A1, 1.9726% 1/26/37 (a)(d) | | 262 | 261 |
| MASTR Adjustable Rate Mortgages Trust Series 2007-3 Class 22A2, 0.6365% 5/25/47 (a) | | 237 | 218 |
| MASTR Alternative Loan Trust Series 2004-6 Class 5A1, 5.4126% 7/25/19 (a) | | 1,150 | 1,158 |
| Merrill Lynch Alternative Note Asset Trust floater Series 2007-OAR1 Class A1, 0.6058% 2/25/37 (a) | | 1,291 | 1,143 |
| Morgan Stanley Re-REMIC Trust Series 2010-R6 Class 1A, 2.6101% 2/26/37 (a)(d) | | 3,048 | 3,061 |
| Nationstar HECM Loan Trust sequential payer Series 2015-2A Class A, 2.8826% 11/25/25 (d) | | 906 | 906 |
| Nomura Resecuritization Trust sequential payer Series 2011-3RA Class 2A1, 2.8917% 3/26/37 (a)(d) | | 2,008 | 1,981 |
| Structured Asset Securities Corp. Series 2003-15A Class 4A, 2.7237% 4/25/33 (a) | | 122 | 118 |
| Thornburg Mortgage Securities Trust floater Series 2003-4 Class A1, 1.0665% 9/25/43 (a) | | 4,121 | 3,949 |
| WaMu Mortgage pass-thru certificates sequential payer: | | | |
| Series 2002-S8 Class 2A7, 5.25% 1/25/18 | | 170 | 171 |
| Series 2003-MS5 Class 1A1, 5% 3/25/18 | | 211 | 214 |
| Wells Fargo Mortgage Backed Securities Trust: | | | |
| Series 2003-I Class A1, 2.6097% 9/25/33 (a) | | 954 | 943 |
| Series 2005-AR10 Class 2A15, 2.7505% 6/25/35 (a) | | 5,237 | 5,332 |
| Series 2005-AR2 Class 1A2, 2.6956% 3/25/35 (a) | | 223 | 205 |
| Series 2006-AR10 Class 3A1, 2.7337% 7/25/36 (a) | | 820 | 803 |
| Wells Fargo Mortgage Loan Trust sequential payer Series 2011-RR4 Class 2A1, 4.3738% 6/27/36 (a)(d) | | 904 | 888 |
| | | | 67,571 |
| U.S. Government Agency - 6.6% | | | |
| Fannie Mae: | | | |
| floater Series 2003-118 Class S, 7.6642% 12/25/33 (a)(e)(f) | | 325 | 75 |
| planned amortization class: | | | |
| Series 1999-17 Class PG, 6% 4/25/29 | | 623 | 682 |
| Series 1999-32 Class PL, 6% 7/25/29 | | 561 | 615 |
| Series 1999-33 Class PK, 6% 7/25/29 | | 359 | 394 |
| Series 2001-52 Class YZ, 6.5% 10/25/31 | | 43 | 50 |
| Series 2005-39 Class TE, 5% 5/25/35 | | 904 | 999 |
| Series 2005-73 Class SA, 16.4169% 8/25/35 (a)(f) | | 69 | 89 |
| Series 2006-105 Class MD, 5.5% 6/25/35 | | 176 | 177 |
| Series 2011-35 Class PA, 4% 2/25/39 | | 293 | 298 |
| sequential payer: | | | |
| Series 2001-20 Class Z, 6% 5/25/31 | | 620 | 680 |
| Series 2001-31 Class ZC, 6.5% 7/25/31 | | 266 | 309 |
| Series 2002-16 Class ZD, 6.5% 4/25/32 | | 89 | 104 |
| Series 2002-74 Class SV, 7.1142% 11/25/32 (a)(e) | | 228 | 43 |
| Series 2012-67 Class AI, 4.5% 7/25/27 (e) | | 816 | 105 |
| Series 06-116 Class SG, 6.2042% 12/25/36 (a)(e)(f) | | 215 | 42 |
| Series 07-40 Class SE, 6.0042% 5/25/37 (a)(e)(f) | | 135 | 23 |
| Series 1993-165 Class SH, 18.5671% 9/25/23 (a)(f) | | 31 | 43 |
| Series 2003-21 Class SK, 7.6642% 3/25/33 (a)(e)(f) | | 101 | 20 |
| Series 2003-35 Class TQ, 7.0642% 5/25/18 (a)(e)(f) | | 35 | 2 |
| Series 2007-57 Class SA, 38.0052% 6/25/37 (a)(f) | | 434 | 929 |
| Series 2007-66 Class SB, 36.9852% 7/25/37 (a)(f) | | 142 | 281 |
| Series 2008-12 Class SG, 5.9142% 3/25/38 (a)(e)(f) | | 725 | 130 |
| Series 2009-114 Class AI, 5% 12/25/23 (e) | | 180 | 6 |
| Series 2009-16 Class SA, 5.8142% 3/25/24 (a)(e)(f) | | 93 | 2 |
| Series 2009-76 Class MI, 5.5% 9/25/24 (e) | | 117 | 5 |
| Series 2009-85 Class IB, 4.5% 8/25/24 (e) | | 81 | 6 |
| Series 2009-93 Class IC, 4.5% 9/25/24 (e) | | 121 | 8 |
| Series 2010-12 Class AI, 5% 12/25/18 (e) | | 407 | 18 |
| Series 2010-135 Class LS, 5.6142% 12/25/40 (a)(e)(f) | | 663 | 119 |
| Series 2010-139 Class NI, 4.5% 2/25/40 (e) | | 853 | 108 |
| Series 2010-23: | | | |
| Class AI, 5% 12/25/18 (e) | | 164 | 7 |
| Class HI, 4.5% 10/25/18 (e) | | 125 | 5 |
| Series 2010-29 Class LI, 4.5% 6/25/19 (e) | | 366 | 14 |
| Series 2010-97 Class CI, 4.5% 8/25/25 (e) | | 263 | 17 |
| Series 2011-67 Class AI, 4% 7/25/26 (e) | | 223 | 23 |
| Series 2011-83 Class DI, 6% 9/25/26 (e) | | 314 | 38 |
| Series 2013-N1 Class A, 6.2842% 6/25/35 (a)(e)(f) | | 689 | 166 |
| Series 2015-70 Class JC, 3% 10/25/45 | | 3,805 | 3,970 |
| Fannie Mae Stripped Mortgage-Backed Securities: | | | |
| Series 339 Class 29, 5.5% 8/25/18 (e) | | 102 | 4 |
| Series 348 Class 14, 6.5% 8/25/34 (a)(e) | | 180 | 39 |
| Series 351: | | | |
| Class 12, 5.5% 4/25/34 (a)(e) | | 122 | 22 |
| Class 13, 6% 3/25/34 (e) | | 163 | 33 |
| Series 359 Class 19, 6% 7/25/35 (a)(e) | | 111 | 20 |
| Series 384 Class 6, 5% 7/25/37 (e) | | 410 | 76 |
| Freddie Mac: | | | |
| planned amortization class: | | | |
| Series 2095 Class PE, 6% 11/15/28 | | 691 | 761 |
| Series 2104 Class PG, 6% 12/15/28 | | 197 | 216 |
| Series 2121 Class MG, 6% 2/15/29 | | 271 | 297 |
| Series 2154 Class PT, 6% 5/15/29 | | 472 | 518 |
| Series 2162 Class PH, 6% 6/15/29 | | 73 | 80 |
| Series 2520 Class BE, 6% 11/15/32 | | 352 | 386 |
| Series 2585 Class KS, 7.173% 3/15/23 (a)(e)(f) | | 33 | 4 |
| Series 2693 Class MD, 5.5% 10/15/33 | | 5,885 | 6,661 |
| Series 2802 Class OB, 6% 5/15/34 | | 1,628 | 1,829 |
| Series 3002 Class NE, 5% 7/15/35 | | 553 | 609 |
| Series 3189 Class PD, 6% 7/15/36 | | 586 | 655 |
| Series 3415 Class PC, 5% 12/15/37 | | 169 | 185 |
| Series 3786 Class HI, 4% 3/15/38 (e) | | 806 | 84 |
| Series 3806 Class UP, 4.5% 2/15/41 | | 1,347 | 1,451 |
| Series 3832 Class PE, 5% 3/15/41 | | 960 | 1,103 |
| Series 70 Class C, 9% 9/15/20 | | 4 | 4 |
| sequential payer: | | | |
| Series 2114 Class ZM, 6% 1/15/29 | | 93 | 102 |
| Series 2135 Class JE, 6% 3/15/29 | | 352 | 385 |
| Series 2274 Class ZM, 6.5% 1/15/31 | | 155 | 180 |
| Series 2281 Class ZB, 6% 3/15/30 | | 130 | 142 |
| Series 2357 Class ZB, 6.5% 9/15/31 | | 311 | 366 |
| Series 2502 Class ZC, 6% 9/15/32 | | 346 | 383 |
| Series 06-3115 Class SM, 6.173% 2/15/36 (a)(e)(f) | | 177 | 31 |
| Series 1658 Class GZ, 7% 1/15/24 | | 420 | 466 |
| Series 2013-4281 Class AI, 4% 12/15/28 (e) | | 1,900 | 203 |
| Series 2380 Class SY, 7.773% 11/15/31 (a)(e)(f) | | 1,278 | 269 |
| Series 2587 Class IM, 6.5% 3/15/33 (e) | | 186 | 38 |
| Series 2844: | | | |
| Class SC, 44.0245% 8/15/24 (a)(f) | | 13 | 23 |
| Class SD, 80.899% 8/15/24 (a)(f) | | 19 | 45 |
| Series 2935 Class ZK, 5.5% 2/15/35 | | 1,540 | 1,763 |
| Series 2947 Class XZ, 6% 3/15/35 | | 645 | 736 |
| Series 3055 Class CS, 6.163% 10/15/35 (a)(e) | | 238 | 44 |
| Series 3244 Class SG, 6.233% 11/15/36 (a)(e)(f) | | 481 | 107 |
| Series 3274 Class SM, 6.003% 2/15/37 (a)(e) | | 278 | 51 |
| Series 3284 Class CI, 5.693% 3/15/37 (a)(e) | | 1,057 | 200 |
| Series 3287 Class SD, 6.323% 3/15/37 (a)(e)(f) | | 686 | 143 |
| Series 3297 Class BI, 6.333% 4/15/37 (a)(e)(f) | | 1,004 | 211 |
| Series 3336 Class LI, 6.153% 6/15/37 (a)(e) | | 449 | 71 |
| Series 3772 Class BI, 4.5% 10/15/18 (e) | | 252 | 11 |
| Series 3949 Class MK, 4.5% 10/15/34 | | 392 | 425 |
| Series 3955 Class YI, 3% 11/15/21 (e) | | 1,435 | 80 |
| Series 4471 Class PA 4% 12/15/40 | | 5,973 | 6,351 |
| Freddie Mac Manufactured Housing participation certificates guaranteed planned amortization class Series 2043 Class CJ, 6.5% 4/15/28 | | 258 | 298 |
| Freddie Mac Multi-family Structured pass-thru certificates Series 4386 Class AZ, 4.5% 11/15/40 | | 3,238 | 3,654 |
| Ginnie Mae guaranteed REMIC pass-thru certificates: | | | |
| floater: | | | |
| Series 2007-37 Class TS, 6.2645% 6/16/37 (a)(e)(f) | | 232 | 40 |
| Series 2010-H17 Class FA, 0.7519% 7/20/60 (a)(g) | | 282 | 277 |
| Series 2010-H18 Class AF, 0.551% 9/20/60 (a)(g) | | 346 | 340 |
| Series 2010-H19 Class FG, 0.551% 8/20/60 (a)(g) | | 401 | 395 |
| Series 2011-H13 Class FA, 0.751% 4/20/61 (a)(g) | | 168 | 167 |
| planned amortization class Series 2011-136 Class WI, 4.5% 5/20/40 (e) | | 523 | 53 |
| sequential payer: | | | |
| Series 2002-24 Class SK, 7.5245% 4/16/32 (a)(e)(f) | | 1,139 | 251 |
| Series 2002-42 Class ZA, 6% 6/20/32 | | 412 | 476 |
| Series 2004-24 Class ZM, 5% 4/20/34 | | 844 | 939 |
| Series 1999-40 Class SE, 8.5195% 11/16/29 (a)(e)(f) | | 194 | 7 |
| Series 2001-3 Class S, 7.6745% 2/16/31 (a)(e) | | 259 | 54 |
| Series 2001-36: | | | |
| Class SB, 7.6745% 12/16/23 (a)(e)(f) | | 660 | 119 |
| Class SP, 8.3245% 9/16/26 (a)(e) | | 458 | 71 |
| Series 2001-38 Class SB, 7.1545% 8/16/31 (a)(e)(f) | | 422 | 85 |
| Series 2001-41 Class SG, 8.3195% 9/16/31 (a)(e) | | 220 | 28 |
| Series 2001-49: | | | |
| Class SC, 7.1745% 12/16/25 (a)(e)(f) | | 869 | 148 |
| Class SL, 7.1745% 5/16/30 (a)(e)(f) | | 1,178 | 233 |
| Class SV, 7.8245% 12/16/28 (a)(e)(f) | | 321 | 21 |
| Series 2001-50: | | | |
| Class SD, 7.768% 11/20/31 (a)(e)(f) | | 609 | 155 |
| Class ST, 7.2745% 8/16/27 (a)(e)(f) | | 261 | 55 |
| Series 2002-5 Class SP, 7.0245% 1/16/32 (a)(e)(f) | | 419 | 74 |
| Series 2004-32 Class GS, 6.0745% 5/16/34 (a)(e)(f) | | 394 | 83 |
| Series 2004-73 Class AL, 6.7695% 8/17/34 (a)(e)(f) | | 149 | 37 |
| Series 2010-98 Class HS, 6.174% 8/20/40 (a)(e) | | 726 | 129 |
| Series 2011-52 Class HI, 7% 4/16/41 (e) | | 1,570 | 360 |
| Series 2012-76 Class GS, 6.2745% 6/16/42 (a)(e)(f) | | 764 | 153 |
| Series 2012-97 Class JS, 5.8245% 8/16/42 (a)(e)(f) | | 2,686 | 489 |
| Series 2013-124: | | | |
| Class ES, 8.0987% 4/20/39 (a)(f) | | 1,482 | 1,641 |
| Class ST, 8.232% 8/20/39 (a)(f) | | 2,784 | 3,216 |
| Series 2013-147 Class A/S, 5.724% 10/20/43 (a)(e) | | 1,258 | 196 |
| Series 2013-160 Class MS, 5.774% 9/20/32 (a)(e)(f) | | 2,211 | 435 |
| Series 2015-H13 Class HA, 2.5% 8/20/64 (g) | | 13,353 | 13,627 |
| Series 2015-H17 Class HA, 2.5% 5/20/65 (g) | | 5,131 | 5,239 |
| Ginnie Mae pass thru certificates Series 2010-85 Class SE, 6.124% 7/20/40 (a)(e) | | 794 | 139 |
| | | | 72,149 |
| TOTAL COLLATERALIZED MORTGAGE OBLIGATIONS | | | |
| (Cost $137,675) | | | 139,720 |
|
| Commercial Mortgage Securities - 12.8% | | | |
| Asset Securitization Corp. Series 1997-D5 Class PS1, 1.5885% 2/14/43 (a)(e) | | 673 | 5 |
| Banc of America Commercial Mortgage Trust: | | | |
| Series 2006-4 Class A1A, 5.617% 7/10/46 (a) | | 2,102 | 2,117 |
| Series 2007-2 Class A4, 5.79% 4/10/49 (a) | | 1,293 | 1,311 |
| Barclays Commercial Mortgage Securities LLC Series 2015-STP Class A, 3.3228% 9/10/28 (d) | | 5,587 | 5,749 |
| Bayview Commercial Asset Trust floater Series 2007-3: | | | |
| Class M1, 0.7458% 7/25/37 (a)(d) | | 38 | 29 |
| Class M2, 0.7758% 7/25/37 (a)(d) | | 40 | 29 |
| Class M3, 0.8058% 7/25/37 (a)(d) | | 65 | 32 |
| CDGJ Commercial Mortgage Trust Series 2014-BXCH Class A, 1.827% 12/15/27 (a)(d) | | 8,859 | 8,830 |
| Citigroup/Deutsche Bank Commercial Mortgage Trust sequential payer: | | | |
| Series 2006-CD3 Class A5, 5.617% 10/15/48 | | 163 | 164 |
| Series 2007-CD4 Class A4, 5.322% 12/11/49 | | 3,940 | 4,026 |
| COMM Mortgage Trust: | | | |
| floater Series 2014-KYO Class A, 1.324% 6/11/27 (a)(d) | | 5,000 | 4,876 |
| Series 2013-CR10 Class XA, 1.1309% 8/10/46 (a)(e) | | 10,374 | 442 |
| Series 2014-CR19 Class XA, 1.4501% 8/10/47 (a)(e) | | 15,637 | 1,054 |
| Series 2014-CR20 Class XA, 1.3593% 11/10/47 (a)(e) | | 13,165 | 923 |
| Series 2014-LC17 Class XA, 1.1645% 10/10/47 (a)(e) | | 14,979 | 739 |
| Series 2014-UBS4 Class XA, 1.4292% 8/10/47 (a)(e) | | 13,158 | 906 |
| Series 2014-UBS6 Class XA, 1.2201% 12/10/47 (a)(e) | | 8,827 | 537 |
| Series 2015-PC1 Class A5, 3.902% 7/10/50 | | 3,400 | 3,598 |
| CSMC Series 2015-TOWN: | | | |
| Class A, 1.677% 3/15/17 (a)(d) | | 7,804 | 7,713 |
| Class B, 2.327% 3/15/17 (a)(d) | | 185 | 179 |
| Class C, 2.677% 3/15/17 (a)(d) | | 180 | 172 |
| Class D, 3.627% 3/15/17 (a)(d) | | 273 | 259 |
| Freddie Mac: | | | |
| sequential payer: | | | |
| Series K030 Class A2, 3.25% 4/25/23 | | 1,640 | 1,764 |
| Series K033 Class A2, 3.06% 7/25/23 | | 8,600 | 9,129 |
| Series K034 Class A2, 3.531% 7/25/23 | | 5,549 | 6,062 |
| Series K035 Class A2, 3.458% 8/25/23 | | 1,022 | 1,111 |
| Series K032 Class A2, 3.31% 5/25/23 | | 1,628 | 1,755 |
| Series K036 Class A2, 3.527% 10/25/23 | | 2,681 | 2,927 |
| Freddie Mac Multi-family Structured pass-thru certificates sequential payer Series K038 Class A2, 3.389% 3/25/24 | | 1,630 | 1,764 |
| GAHR Commercial Mortgage Trust: | | | |
| floater Series 2015-NRF Class AFL1, 1.7255% 12/15/16 (a)(d) | | 12,633 | 12,512 |
| Series 2015-NRF Class AFX, 3.2349% 12/15/19 (d) | | 7,000 | 7,167 |
| GE Capital Commercial Mortgage Corp.: | | | |
| sequential payer Series 2007-C1 Class A4, 5.543% 12/10/49 | | 914 | 928 |
| Series 2007-C1 Class A1A, 5.483% 12/10/49 (a) | | 4,802 | 4,930 |
| GS Mortgage Securities Trust: | | | |
| floater Series 2014-GSFL Class A, 1.4255% 7/15/31 (a)(d) | | 513 | 505 |
| Series 2015-GC34 Class XA, 1.5357% 10/10/48 (a)(e) | | 10,680 | 1,020 |
| Hyatt Hotel Portfolio Trust floater Series 2015-HYT Class A, 1.6755% 11/15/29 (a)(d) | | 844 | 839 |
| JPMorgan Chase Commercial Mortgage Securities Corp. Series 2012-CBX Class XA, 1.9192% 6/15/45 (a)(e) | | 46,578 | 3,011 |
| JPMorgan Chase Commercial Mortgage Securities Trust: | | | |
| floater Series 2014-BXH Class A, 1.3305% 4/15/27 (a)(d) | | 5,000 | 4,938 |
| sequential payer: | | | |
| Series 2006-CB16 Class A1A, 5.546% 5/12/45 | | 1,306 | 1,315 |
| Series 2006-LDP8 Class A1A, 5.397% 5/15/45 | | 930 | 936 |
| Series 2007-LD11 Class A4, 5.9599% 6/15/49 (a) | | 4,140 | 4,223 |
| Series 2007-CB20 Class A1A, 5.746% 2/12/51 | | 2,508 | 2,616 |
| Merrill Lynch-CFC Commercial Mortgage Trust sequential payer Series 2007-6 Class A4, 5.485% 3/12/51 (a) | | 175 | 179 |
| Morgan Stanley BAML Trust Series 2015-C25 Class XA, 1.3069% 10/15/48 (a)(e) | | 13,837 | 1,078 |
| Morgan Stanley Capital I Trust sequential payer Series 2007-IQ15 Class A4, 6.1142% 6/11/49 (a) | | 1,633 | 1,691 |
| SCG Trust Series 2013-SRP1 Class A, 1.8255% 11/15/26 (a)(d) | | 2,783 | 2,771 |
| Wachovia Bank Commercial Mortgage Trust: | | | |
| sequential payer: | | | |
| Series 2006-C29 Class A1A, 5.297% 11/15/48 | | 6,833 | 6,959 |
| Series 2007-C31: | | | |
| Class A4, 5.509% 4/15/47 | | 313 | 319 |
| Class A5, 5.5% 4/15/47 | | 8,506 | 8,754 |
| Series 2007-C32 Class A3, 5.8991% 6/15/49 (a) | | 1,150 | 1,175 |
| Series 2007-C33 Class A4, 6.1491% 2/15/51 (a) | | 1,786 | 1,845 |
| Series 2006-C27 Class A1A, 5.749% 7/15/45 (a) | | 1,771 | 1,779 |
| Wells Fargo Commercial Mortgage Trust Series 2015-C31 Class XA, 1.2791% 11/15/48 (a)(e) | | 11,180 | 865 |
| TOTAL COMMERCIAL MORTGAGE SECURITIES | | | |
| (Cost $141,740) | | | 140,557 |
| | | Shares | Value (000s) |
|
| Fixed-Income Funds - 0.2% | | | |
| Fidelity Mortgage Backed Securities Central Fund (h) | | | |
| (Cost $1,653) | | 15,043 | 1,656 |
| | | Maturity Amount (000s) | Value (000s) |
|
| Cash Equivalents - 3.1% | | | |
| Investments in repurchase agreements in a joint trading account at 0.4%, dated 2/29/16 due 3/1/16 (Collateralized by U.S. Government Obligations) # | | | |
| (Cost $34,343) | | 34,343 | 34,343 |
| TOTAL INVESTMENT PORTFOLIO - 123.8% | | | |
| (Cost $1,343,593) | | | 1,360,354 |
| NET OTHER ASSETS (LIABILITIES) - (23.8)% | | | (261,088) |
| NET ASSETS - 100% | | | $1,099,266 |
| TBA Sale Commitments | | |
| | Principal Amount (000s) | Value (000s) |
| Fannie Mae | | |
| 3.5% 3/1/46 | $(7,700) | $(8,069) |
| 3.5% 3/1/46 | (7,700) | (8,069) |
| 4% 3/1/46 | (100) | (107) |
| 4% 3/1/46 | (100) | (107) |
| 4% 3/1/46 | (5,400) | (5,762) |
| 4% 3/1/46 | (4,750) | (5,068) |
| 4% 3/1/46 | (50) | (53) |
| 4% 3/1/46 | (9,500) | (10,134) |
| 4.5% 3/1/46 | (6,200) | (6,734) |
|
| TOTAL FANNIE MAE | | (44,103) |
|
| Freddie Mac | | |
| 4% 3/1/46 | (719) | (766) |
| 4% 3/1/46 | (481) | (513) |
| 4% 3/1/46 | (3,600) | (3,836) |
|
| TOTAL FREDDIE MAC | | (5,115) |
|
| Ginnie Mae | | |
| 4% 3/1/46 | (5,200) | (5,553) |
| 4% 3/1/46 | (2,200) | (2,350) |
| 4% 3/1/46 | (2,200) | (2,350) |
|
| TOTAL GINNIE MAE | | (10,253) |
|
| TOTAL TBA SALE COMMITMENTS | | |
| (Proceeds $59,497) | | $(59,471) |
Swaps
| Clearinghouse/Counterparty(1) | Expiration Date | Notional Amount (000s) | Payment Received | Payment Paid | Value (000s) | Upfront Premium Received/(Paid) (000s)(2) | Unrealized Appreciation/(Depreciation) (000s) |
| Interest Rate Swaps | | | | | | | |
| LCH | Mar. 2018 | $30,200 | 3-month LIBOR | 1.5% | $(208) | $0 | $(208) |
| LCH | Mar. 2019 | 11,800 | 3-month LIBOR | 1.75% | (161) | 0 | (161) |
| LCH | Mar. 2021 | 13,800 | 3-month LIBOR | 2% | (388) | 0 | (388) |
| LCH | Mar. 2026 | 2,350 | 3-month LIBOR | 2.5% | (137) | 0 | (137) |
| LCH | Mar. 2046 | 830 | 3-month LIBOR | 2.75% | (102) | 0 | (102) |
|
| TOTAL INTEREST RATE SWAPS | | | | | $(996) | $0 | $(996) |
|
(1) Swaps with LCH Clearnet Group (LCH) are centrally cleared over-the-counter (OTC) swaps.
(2) Any premiums for centrally cleared over-the-counter (OTC) swaps are recorded periodically throughout the term of the swap to variation margin and included in unrealized appreciation (depreciation).
For the period, the average monthly notional amount for swaps in the aggregate was $79,203,000.
Values shown as $0 may reflect amounts less than $500.
Legend
(a) Coupon rates for floating and adjustable rate securities reflect the rates in effect at period end.
(b) Security or a portion of the security purchased on a delayed delivery or when-issued basis.
(c) Security or a portion of the security was pledged to cover margin requirements for centrally cleared OTC swaps. At period end, the value of securities pledged amounted to $1,119,000.
(d) Security exempt from registration under Rule 144A of the Securities Act of 1933. These securities may be resold in transactions exempt from registration, normally to qualified institutional buyers. At the end of the period, the value of these securities amounted to $175,247,000 or 15.9% of net assets.
(e) Security represents right to receive monthly interest payments on an underlying pool of mortgages or assets. Principal shown is the outstanding par amount of the pool as of the end of the period.
(f) Coupon is inversely indexed to a floating interest rate multiplied by a specified factor. The price may be considerably more volatile than the price of a comparable fixed rate security.
(g) Represents an investment in an underlying pool of reverse mortgages which typically do not require regular principal and interest payments as repayment is deferred until a maturity event.
(h) Affiliated fund that is generally available only to investment companies and other accounts managed by Fidelity Investments. A complete unaudited schedule of portfolio holdings for each Fidelity Central Fund is filed with the SEC for the first and third quarters of each fiscal year on Form N-Q and is available upon request or at the SEC's website at www.sec.gov. An unaudited holdings listing for the Fund, which presents direct holdings as well as the pro-rata share of securities and other investments held indirectly through its investment in underlying non-money market Fidelity Central Funds, is available at fidelity.com and/or advisor.fidelity.com, as applicable. In addition, each Fidelity Central Fund's financial statements are available on the SEC's website or upon request.
Affiliated Central Funds
Information regarding fiscal year to date income earned by the Fund from investments in Fidelity Central Funds is as follows:
| Fund | Income earned |
| | (Amounts in thousands) |
| Fidelity Mortgage Backed Securities Central Fund | $21 |
| Total | $21 |
Additional information regarding the Fund's fiscal year to date purchases and sales, including the ownership percentage, of the non Money Market Central Funds is as follows:
| Fund (Amounts in thousands) | Value, beginning of period | Purchases | Sales Proceeds | Value, end of period | % ownership, end of period |
| Fidelity Mortgage Backed Securities Central Fund | $1,622 | $21 | $-- | $1,656 | 0.0% |
| Total | $1,622 | $21 | $-- | $1,656 | |
Investment Valuation
The following is a summary of the inputs used, as of February 29, 2016, involving the Fund's assets and liabilities carried at fair value. The inputs or methodology used for valuing securities may not be an indication of the risk associated with investing in those securities. For more information on valuation inputs, and their aggregation into the levels used below, please refer to the Investment Valuation section in the accompanying Notes to Financial Statements.
| | Valuation Inputs at Reporting Date: |
| Description | Total | Level 1 | Level 2 | Level 3 |
| (Amounts in thousands) | | | | |
| Investments in Securities: | | | | |
| U.S. Government Agency - Mortgage Securities | $969,169 | $-- | $969,169 | $-- |
| Asset-Backed Securities | 74,909 | -- | 74,909 | -- |
| Collateralized Mortgage Obligations | 139,720 | -- | 139,720 | -- |
| Commercial Mortgage Securities | 140,557 | -- | 140,557 | -- |
| Fixed-Income Funds | 1,656 | 1,656 | -- | -- |
| Cash Equivalents | 34,343 | -- | 34,343 | -- |
| Total Investments in Securities: | $1,360,354 | $1,656 | $1,358,698 | $-- |
| Derivative Instruments: | | | | |
| Liabilities | | | | |
| Swaps | $(996) | $-- | $(996) | $-- |
| Total Liabilities | $(996) | $-- | $(996) | $-- |
| Total Derivative Instruments: | $(996) | $-- | $(996) | $-- |
| Other Financial Instruments: | | | | |
| TBA Sale Commitments | $(59,471) | $-- | $(59,471) | $-- |
| Total Other Financial Instruments: | $(59,471) | $-- | $(59,471) | $-- |
Value of Derivative Instruments
The following table is a summary of the Fund's value of derivative instruments by primary risk exposure as of February 29, 2016. For additional information on derivative instruments, please refer to the Derivative Instruments section in the accompanying Notes to Financial Statements.
| Primary Risk Exposure / Derivative Type | Value |
| (Amounts in thousands) | Asset | Liability |
| Interest Rate Risk | | |
| Swaps(a) | $0 | $(996) |
| Total Interest Rate Risk | 0 | (996) |
| Total Value of Derivatives | $0 | $(996) |
(a) For centrally cleared OTC swaps, reflects gross cumulative appreciation (depreciation) as presented in the Schedule of Investments. For centrally cleared OTC swaps, only the period end receivable or payable for daily variation margin and net unrealized appreciation (depreciation) are presented in the Statement of Assets and Liabilities
Other Information
# Additional information on each counterparty to the repurchase agreement is as follows:
| Repurchase Agreement / Counterparty | Value |
| $34,343,000 due 3/01/16 at 0.40% | (Amounts in thousands) |
| Commerz Markets LLC | $34,343 |
| | $34,343 |
See accompanying notes which are an integral part of the financial statements.
Financial Statements
Statement of Assets and Liabilities
| Amounts in thousands (except per-share amounts) | | February 29, 2016 (Unaudited) |
| Assets | | |
Investment in securities, at value (including repurchase agreements of $34,343) — See accompanying schedule:
Unaffiliated issuers (cost $1,341,940) | $1,358,698 | |
| Fidelity Central Funds (cost $1,653) | 1,656 | |
| Total Investments (cost $1,343,593) | | $1,360,354 |
| Cash | | 144 |
| Receivable for investments sold | | |
| Regular delivery | | 13,410 |
| Delayed delivery | | 5,112 |
| Receivable for TBA sale commitments | | 59,497 |
| Receivable for fund shares sold | | 1,411 |
| Interest receivable | | 3,141 |
| Distributions receivable from Fidelity Central Funds | | 4 |
| Receivable from investment adviser for expense reductions | | 29 |
| Total assets | | 1,443,102 |
| Liabilities | | |
| Payable for investments purchased | | |
| Regular delivery | $19,449 | |
| Delayed delivery | 263,501 | |
| TBA sale commitments, at value | 59,471 | |
| Payable for fund shares redeemed | 835 | |
| Distributions payable | 126 | |
| Accrued management fee | 281 | |
| Distribution and service plan fees payable | 29 | |
| Payable for daily variation margin for derivative instruments | 11 | |
| Other affiliated payables | 133 | |
| Total liabilities | | 343,836 |
| Net Assets | | $1,099,266 |
| Net Assets consist of: | | |
| Paid in capital | | $1,160,117 |
| Distributions in excess of net investment income | | (2,190) |
| Accumulated undistributed net realized gain (loss) on investments | | (74,452) |
| Net unrealized appreciation (depreciation) on investments | | 15,791 |
| Net Assets | | $1,099,266 |
| Calculation of Maximum Offering Price | | |
| Class A: | | |
| Net Asset Value and redemption price per share ($44,125 ÷ 3,885.80 shares) | | $11.36 |
| Maximum offering price per share (100/96.00 of $11.36) | | $11.83 |
| Class T: | | |
| Net Asset Value and redemption price per share ($24,125 ÷ 2,120.29 shares) | | $11.38 |
| Maximum offering price per share (100/96.00 of $11.38) | | $11.85 |
| Class B: | | |
| Net Asset Value and offering price per share ($714 ÷ 62.89 shares)(a) | | $11.35 |
| Class C: | | |
| Net Asset Value and offering price per share ($18,644 ÷ 1,644.40 shares)(a) | | $11.34 |
| Fidelity Mortgage Securities Fund: | | |
| Net Asset Value, offering price and redemption price per share ($932,567 ÷ 81,918.64 shares) | | $11.38 |
| Class I: | | |
| Net Asset Value, offering price and redemption price per share ($79,091 ÷ 6,972.41 shares) | | $11.34 |
(a) Redemption price per share is equal to net asset value less any applicable contingent deferred sales charge.
See accompanying notes which are an integral part of the financial statements.
Statement of Operations
| Amounts in thousands | | Six months ended February 29, 2016 (Unaudited) |
| Investment Income | | |
| Interest | | $14,700 |
| Income from Fidelity Central Funds | | 21 |
| Total income | | 14,721 |
| Expenses | | |
| Management fee | $1,616 | |
| Transfer agent fees | 575 | |
| Distribution and service plan fees | 161 | |
| Fund wide operations fee | 201 | |
| Independent trustees' compensation | 2 | |
| Miscellaneous | 9 | |
| Total expenses before reductions | 2,564 | |
| Expense reductions | (28) | 2,536 |
| Net investment income (loss) | | 12,185 |
| Realized and Unrealized Gain (Loss) | | |
| Net realized gain (loss) on: | | |
| Investment securities: | | |
| Unaffiliated issuers | 6,193 | |
| Swaps | (2,480) | |
| Total net realized gain (loss) | | 3,713 |
Change in net unrealized appreciation (depreciation) on:
Investment securities | 4,128 | |
| Swaps | 437 | |
| Delayed delivery commitments | (68) | |
| Total change in net unrealized appreciation (depreciation) | | 4,497 |
| Net gain (loss) | | 8,210 |
| Net increase (decrease) in net assets resulting from operations | | $20,395 |
See accompanying notes which are an integral part of the financial statements.
Statement of Changes in Net Assets
| Amounts in thousands | Six months ended February 29, 2016 (Unaudited) | Year ended August 31, 2015 |
| Increase (Decrease) in Net Assets | | |
| Operations | | |
| Net investment income (loss) | $12,185 | $22,215 |
| Net realized gain (loss) | 3,713 | 9,548 |
| Change in net unrealized appreciation (depreciation) | 4,497 | (7,250) |
| Net increase (decrease) in net assets resulting from operations | 20,395 | 24,513 |
| Distributions to shareholders from net investment income | (13,351) | (21,563) |
| Distributions to shareholders from net realized gain | (552) | (244) |
| Total distributions | (13,903) | (21,807) |
| Share transactions - net increase (decrease) | 89,918 | 86,045 |
| Total increase (decrease) in net assets | 96,410 | 88,751 |
| Net Assets | | |
| Beginning of period | 1,002,856 | 914,105 |
| End of period (including distributions in excess of net investment income of $2,190 and distributions in excess of net investment income of $1,024, respectively) | $1,099,266 | $1,002,856 |
See accompanying notes which are an integral part of the financial statements.
Financial Highlights — Fidelity Advisor Mortgage Securities Fund Class A
| | Six months ended February 29, (Unaudited) | Years ended August 31, | | | | |
| | 2016 | 2015 | 2014 | 2013 | 2012 | 2011 |
| Selected Per–Share Data | | | | | | |
| Net asset value, beginning of period | $11.29 | $11.24 | $10.89 | $11.34 | $11.14 | $10.91 |
| Income from Investment Operations | | | | | | |
| Net investment income (loss)A | .115 | .223 | .239 | .169 | .278 | .323 |
| Net realized and unrealized gain (loss) | .089 | .047 | .341 | (.457) | .206 | .235 |
| Total from investment operations | .204 | .270 | .580 | (.288) | .484 | .558 |
| Distributions from net investment income | (.128) | (.217) | (.230) | (.162) | (.284) | (.328) |
| Distributions from net realized gain | (.006) | (.003) | – | – | – | – |
| Total distributions | (.134) | (.220) | (.230) | (.162) | (.284) | (.328) |
| Net asset value, end of period | $11.36 | $11.29 | $11.24 | $10.89 | $11.34 | $11.14 |
| Total ReturnB,C,D | 1.82% | 2.41% | 5.37% | (2.57)% | 4.41% | 5.22% |
| Ratios to Average Net AssetsE,F | | | | | | |
| Expenses before reductions | .80%G | .81% | .81% | .79% | .81% | .82% |
| Expenses net of fee waivers, if any | .80%G | .81% | .81% | .79% | .81% | .82% |
| Expenses net of all reductions | .80%G | .81% | .81% | .79% | .81% | .82% |
| Net investment income (loss) | 2.05%G | 1.97% | 2.15% | 1.51% | 2.48% | 2.96% |
| Supplemental Data | | | | | | |
| Net assets, end of period (in millions) | $44 | $38 | $41 | $50 | $60 | $59 |
| Portfolio turnover rateH | 411%G | 439% | 398% | 474% | 451% | 490% |
A Calculated based on average shares outstanding during the period.
B Total returns for periods of less than one year are not annualized.
C Total returns would have been lower if certain expenses had not been reduced during the applicable periods shown.
D Total returns do not include the effect of the sales charges.
E Fees and expenses of any underlying Fidelity Central Funds are not included in the Fund's expense ratio. The Fund indirectly bears its proportionate share of the expenses of any underlying Fidelity Central Funds. Based on their most recent shareholder report date, the expenses of any underlying non-money market Fidelity Central Funds were less than .005%.
F Expense ratios reflect operating expenses of the class. Expenses before reductions do not reflect amounts reimbursed by the investment adviser or reductions from expense offset arrangements and do not represent the amount paid by the class during periods when reimbursements or reductions occur. Expenses net of fee waivers reflect expenses after reimbursement by the investment adviser but prior to reductions from expense offset arrangements. Expenses net of all reductions represent the net expenses paid by the class.
G Annualized
H Amount does not include the portfolio activity of any underlying Fidelity Central Funds.
See accompanying notes which are an integral part of the financial statements.
Financial Highlights — Fidelity Advisor Mortgage Securities Fund Class T
| | Six months ended February 29, (Unaudited) | Years ended August 31, | | | | |
| | 2016 | 2015 | 2014 | 2013 | 2012 | 2011 |
| Selected Per–Share Data | | | | | | |
| Net asset value, beginning of period | $11.31 | $11.27 | $10.92 | $11.37 | $11.16 | $10.93 |
| Income from Investment Operations | | | | | | |
| Net investment income (loss)A | .115 | .225 | .242 | .173 | .281 | .326 |
| Net realized and unrealized gain (loss) | .089 | .037 | .340 | (.458) | .216 | .235 |
| Total from investment operations | .204 | .262 | .582 | (.285) | .497 | .561 |
| Distributions from net investment income | (.128) | (.219) | (.232) | (.165) | (.287) | (.331) |
| Distributions from net realized gain | (.006) | (.003) | – | – | – | – |
| Total distributions | (.134) | (.222) | (.232) | (.165) | (.287) | (.331) |
| Net asset value, end of period | $11.38 | $11.31 | $11.27 | $10.92 | $11.37 | $11.16 |
| Total ReturnB,C,D | 1.82% | 2.33% | 5.38% | (2.54)% | 4.52% | 5.24% |
| Ratios to Average Net AssetsE,F | | | | | | |
| Expenses before reductions | .80%G | .79% | .79% | .77% | .78% | .79% |
| Expenses net of fee waivers, if any | .80%G | .79% | .79% | .77% | .78% | .79% |
| Expenses net of all reductions | .80%G | .79% | .79% | .77% | .78% | .79% |
| Net investment income (loss) | 2.05%G | 1.98% | 2.17% | 1.53% | 2.50% | 2.99% |
| Supplemental Data | | | | | | |
| Net assets, end of period (in millions) | $24 | $20 | $22 | $26 | $31 | $37 |
| Portfolio turnover rateH | 411%G | 439% | 398% | 474% | 451% | 490% |
A Calculated based on average shares outstanding during the period.
B Total returns for periods of less than one year are not annualized.
C Total returns would have been lower if certain expenses had not been reduced during the applicable periods shown.
D Total returns do not include the effect of the sales charges.
E Fees and expenses of any underlying Fidelity Central Funds are not included in the Fund's expense ratio. The Fund indirectly bears its proportionate share of the expenses of any underlying Fidelity Central Funds. Based on their most recent shareholder report date, the expenses of any underlying non-money market Fidelity Central Funds were less than .005%.
F Expense ratios reflect operating expenses of the class. Expenses before reductions do not reflect amounts reimbursed by the investment adviser or reductions from expense offset arrangements and do not represent the amount paid by the class during periods when reimbursements or reductions occur. Expenses net of fee waivers reflect expenses after reimbursement by the investment adviser but prior to reductions from expense offset arrangements. Expenses net of all reductions represent the net expenses paid by the class.
G Annualized
H Amount does not include the portfolio activity of any underlying Fidelity Central Funds.
See accompanying notes which are an integral part of the financial statements.
Financial Highlights — Fidelity Advisor Mortgage Securities Fund Class B
| | Six months ended February 29, (Unaudited) | Years ended August 31, | | | | |
| | 2016 | 2015 | 2014 | 2013 | 2012 | 2011 |
| Selected Per–Share Data | | | | | | |
| Net asset value, beginning of period | $11.28 | $11.24 | $10.89 | $11.34 | $11.14 | $10.91 |
| Income from Investment Operations | | | | | | |
| Net investment income (loss)A | .076 | .145 | .162 | .090 | .200 | .248 |
| Net realized and unrealized gain (loss) | .088 | .037 | .342 | (.457) | .207 | .235 |
| Total from investment operations | .164 | .182 | .504 | (.367) | .407 | .483 |
| Distributions from net investment income | (.088) | (.139) | (.154) | (.083) | (.207) | (.253) |
| Distributions from net realized gain | (.006) | (.003) | – | – | – | – |
| Total distributions | (.094) | (.142) | (.154) | (.083) | (.207) | (.253) |
| Net asset value, end of period | $11.35 | $11.28 | $11.24 | $10.89 | $11.34 | $11.14 |
| Total ReturnB,C,D | 1.46% | 1.62% | 4.65% | (3.25)% | 3.69% | 4.51% |
| Ratios to Average Net AssetsE,F | | | | | | |
| Expenses before reductions | 1.51%G | 1.50% | 1.50% | 1.50% | 1.50% | 1.50% |
| Expenses net of fee waivers, if any | 1.50%G | 1.50% | 1.50% | 1.50% | 1.50% | 1.50% |
| Expenses net of all reductions | 1.50%G | 1.50% | 1.50% | 1.50% | 1.50% | 1.50% |
| Net investment income (loss) | 1.35%G | 1.28% | 1.46% | .80% | 1.79% | 2.27% |
| Supplemental Data | | | | | | |
| Net assets, end of period (in millions) | $1 | $1 | $1 | $2 | $4 | $5 |
| Portfolio turnover rateH | 411%G | 439% | 398% | 474% | 451% | 490% |
A Calculated based on average shares outstanding during the period.
B Total returns for periods of less than one year are not annualized.
C Total returns would have been lower if certain expenses had not been reduced during the applicable periods shown.
D Total returns do not include the effect of the contingent deferred sales charge.
E Fees and expenses of any underlying Fidelity Central Funds are not included in the Fund's expense ratio. The Fund indirectly bears its proportionate share of the expenses of any underlying Fidelity Central Funds. Based on their most recent shareholder report date, the expenses of any underlying non-money market Fidelity Central Funds were less than .005%.
F Expense ratios reflect operating expenses of the class. Expenses before reductions do not reflect amounts reimbursed by the investment adviser or reductions from expense offset arrangements and do not represent the amount paid by the class during periods when reimbursements or reductions occur. Expenses net of fee waivers reflect expenses after reimbursement by the investment adviser but prior to reductions from expense offset arrangements. Expenses net of all reductions represent the net expenses paid by the class.
G Annualized
H Amount does not include the portfolio activity of any underlying Fidelity Central Funds.
See accompanying notes which are an integral part of the financial statements.
Financial Highlights — Fidelity Advisor Mortgage Securities Fund Class C
| | Six months ended February 29, (Unaudited) | Years ended August 31, | | | | |
| | 2016 | 2015 | 2014 | 2013 | 2012 | 2011 |
| Selected Per–Share Data | | | | | | |
| Net asset value, beginning of period | $11.27 | $11.23 | $10.88 | $11.33 | $11.12 | $10.90 |
| Income from Investment Operations | | | | | | |
| Net investment income (loss)A | .073 | .141 | .160 | .088 | .197 | .244 |
| Net realized and unrealized gain (loss) | .089 | .037 | .342 | (.457) | .217 | .226 |
| Total from investment operations | .162 | .178 | .502 | (.369) | .414 | .470 |
| Distributions from net investment income | (.086) | (.135) | (.152) | (.081) | (.204) | (.250) |
| Distributions from net realized gain | (.006) | (.003) | – | – | – | – |
| Total distributions | (.092) | (.138) | (.152) | (.081) | (.204) | (.250) |
| Net asset value, end of period | $11.34 | $11.27 | $11.23 | $10.88 | $11.33 | $11.12 |
| Total ReturnB,C,D | 1.44% | 1.59% | 4.64% | (3.28)% | 3.76% | 4.39% |
| Ratios to Average Net AssetsE,F | | | | | | |
| Expenses before reductions | 1.55%G | 1.53% | 1.52% | 1.52% | 1.53% | 1.53% |
| Expenses net of fee waivers, if any | 1.54%G | 1.53% | 1.52% | 1.52% | 1.53% | 1.53% |
| Expenses net of all reductions | 1.54%G | 1.53% | 1.52% | 1.52% | 1.53% | 1.53% |
| Net investment income (loss) | 1.31%G | 1.25% | 1.44% | .78% | 1.76% | 2.24% |
| Supplemental Data | | | | | | |
| Net assets, end of period (in millions) | $19 | $16 | $17 | $17 | $18 | $15 |
| Portfolio turnover rateH | 411%G | 439% | 398% | 474% | 451% | 490% |
A Calculated based on average shares outstanding during the period.
B Total returns for periods of less than one year are not annualized.
C Total returns would have been lower if certain expenses had not been reduced during the applicable periods shown.
D Total returns do not include the effect of the contingent deferred sales charge.
E Fees and expenses of any underlying Fidelity Central Funds are not included in the Fund's expense ratio. The Fund indirectly bears its proportionate share of the expenses of any underlying Fidelity Central Funds. Based on their most recent shareholder report date, the expenses of any underlying non-money market Fidelity Central Funds were less than .005%.
F Expense ratios reflect operating expenses of the class. Expenses before reductions do not reflect amounts reimbursed by the investment adviser or reductions from expense offset arrangements and do not represent the amount paid by the class during periods when reimbursements or reductions occur. Expenses net of fee waivers reflect expenses after reimbursement by the investment adviser but prior to reductions from expense offset arrangements. Expenses net of all reductions represent the net expenses paid by the class.
G Annualized
H Amount does not include the portfolio activity of any underlying Fidelity Central Funds.
See accompanying notes which are an integral part of the financial statements.
Financial Highlights — Fidelity Advisor Mortgage Securities Fund
| | Six months ended February 29, (Unaudited) | Years ended August 31, | | | | |
| | 2016 | 2015 | 2014 | 2013 | 2012 | 2011 |
| Selected Per–Share Data | | | | | | |
| Net asset value, beginning of period | $11.31 | $11.27 | $10.92 | $11.37 | $11.17 | $10.94 |
| Income from Investment Operations | | | | | | |
| Net investment income (loss)A | .135 | .264 | .279 | .209 | .318 | .364 |
| Net realized and unrealized gain (loss) | .089 | .037 | .341 | (.458) | .206 | .234 |
| Total from investment operations | .224 | .301 | .620 | (.249) | .524 | .598 |
| Distributions from net investment income | (.148) | (.258) | (.270) | (.201) | (.324) | (.368) |
| Distributions from net realized gain | (.006) | (.003) | – | – | – | – |
| Total distributions | (.154) | (.261) | (.270) | (.201) | (.324) | (.368) |
| Net asset value, end of period | $11.38 | $11.31 | $11.27 | $10.92 | $11.37 | $11.17 |
| Total ReturnB,C | 1.99% | 2.68% | 5.73% | (2.23)% | 4.77% | 5.59% |
| Ratios to Average Net AssetsD,E | | | | | | |
| Expenses before reductions | .45%F | .45% | .45% | .45% | .45% | .45% |
| Expenses net of fee waivers, if any | .45%F | .45% | .45% | .45% | .45% | .45% |
| Expenses net of all reductions | .45%F | .45% | .45% | .45% | .45% | .45% |
| Net investment income (loss) | 2.40%F | 2.33% | 2.51% | 1.85% | 2.84% | 3.33% |
| Supplemental Data | | | | | | |
| Net assets, end of period (in millions) | $933 | $856 | $785 | $778 | $850 | $765 |
| Portfolio turnover rateG | 411%F | 439% | 398% | 474% | 451% | 490% |
A Calculated based on average shares outstanding during the period.
B Total returns for periods of less than one year are not annualized.
C Total returns would have been lower if certain expenses had not been reduced during the applicable periods shown.
D Fees and expenses of any underlying Fidelity Central Funds are not included in the Fund's expense ratio. The Fund indirectly bears its proportionate share of the expenses of any underlying Fidelity Central Funds. Based on their most recent shareholder report date, the expenses of any underlying non-money market Fidelity Central Funds were less than .005%.
E Expense ratios reflect operating expenses of the class. Expenses before reductions do not reflect amounts reimbursed by the investment adviser or reductions from expense offset arrangements and do not represent the amount paid by the class during periods when reimbursements or reductions occur. Expenses net of fee waivers reflect expenses after reimbursement by the investment adviser but prior to reductions from expense offset arrangements. Expenses net of all reductions represent the net expenses paid by the class.
F Annualized
G Amount does not include the portfolio activity of any underlying Fidelity Central Funds.
See accompanying notes which are an integral part of the financial statements.
Financial Highlights — Fidelity Advisor Mortgage Securities Fund Class I
| | Six months ended February 29, (Unaudited) | Years ended August 31, | | | | |
| | 2016 | 2015 | 2014 | 2013 | 2012 | 2011 |
| Selected Per–Share Data | | | | | | |
| Net asset value, beginning of period | $11.27 | $11.23 | $10.88 | $11.33 | $11.13 | $10.90 |
| Income from Investment Operations | | | | | | |
| Net investment income (loss)A | .132 | .256 | .271 | .200 | .311 | .354 |
| Net realized and unrealized gain (loss) | .088 | .038 | .342 | (.456) | .207 | .235 |
| Total from investment operations | .220 | .294 | .613 | (.256) | .518 | .589 |
| Distributions from net investment income | (.144) | (.251) | (.263) | (.194) | (.318) | (.359) |
| Distributions from net realized gain | (.006) | (.003) | – | – | – | – |
| Total distributions | (.150) | (.254) | (.263) | (.194) | (.318) | (.359) |
| Net asset value, end of period | $11.34 | $11.27 | $11.23 | $10.88 | $11.33 | $11.13 |
| Total ReturnB,C | 1.97% | 2.64% | 5.69% | (2.30)% | 4.73% | 5.53% |
| Ratios to Average Net AssetsD,E | | | | | | |
| Expenses before reductions | .51%F | .50% | .51% | .51% | .50% | .53% |
| Expenses net of fee waivers, if any | .50%F | .50% | .51% | .51% | .50% | .53% |
| Expenses net of all reductions | .50%F | .50% | .51% | .51% | .50% | .53% |
| Net investment income (loss) | 2.35%F | 2.28% | 2.45% | 1.79% | 2.79% | 3.24% |
| Supplemental Data | | | | | | |
| Net assets, end of period (in millions) | $79 | $72 | $48 | $34 | $12 | $7 |
| Portfolio turnover rateG | 411%F | 439% | 398% | 474% | 451% | 490% |
A Calculated based on average shares outstanding during the period.
B Total returns for periods of less than one year are not annualized.
C Total returns would have been lower if certain expenses had not been reduced during the applicable periods shown.
D Fees and expenses of any underlying Fidelity Central Funds are not included in the Fund's expense ratio. The Fund indirectly bears its proportionate share of the expenses of any underlying Fidelity Central Funds. Based on their most recent shareholder report date, the expenses of any underlying non-money market Fidelity Central Funds were less than .005%.
E Expense ratios reflect operating expenses of the class. Expenses before reductions do not reflect amounts reimbursed by the investment adviser or reductions from expense offset arrangements and do not represent the amount paid by the class during periods when reimbursements or reductions occur. Expenses net of fee waivers reflect expenses after reimbursement by the investment adviser but prior to reductions from expense offset arrangements. Expenses net of all reductions represent the net expenses paid by the class.
F Annualized
G Amount does not include the portfolio activity of any underlying Fidelity Central Funds.
See accompanying notes which are an integral part of the financial statements.
Notes to Financial Statements (Unaudited)
For the period ended February 29, 2016
(Amounts in thousands except percentages)
1. Organization.
Fidelity Advisor Mortgage Securities Fund (the Fund) is a fund of Fidelity Advisor Series II (the Trust) and is authorized to issue an unlimited number of shares. The Trust is registered under the Investment Company Act of 1940, as amended (the 1940 Act), as an open-end management investment company organized as a Massachusetts business trust. The Fund offers Class A, Class T, Class C, Fidelity Mortgage Securities Fund and Class I shares, each of which, along with Class B shares, has equal rights as to assets and voting privileges. Class B shares are closed to new accounts and additional purchases, except for exchanges and reinvestments. Each class has exclusive voting rights with respect to matters that affect that class. Class B shares will automatically convert to Class A shares after a maximum holding period of seven years from the initial date of purchase.
During the period, the Board of Trustees approved the conversion of all existing Class B shares into Class A shares, effective on or about July 1, 2016, regardless of the length of times shares have been held.
2. Investments in Fidelity Central Funds.
The Fund invests in Fidelity Central Funds, which are open-end investment companies generally available only to other investment companies and accounts managed by the investment adviser and its affiliates. The Fund's Schedule of Investments lists each of the Fidelity Central Funds held as of period end, if any, as an investment of the Fund, but does not include the underlying holdings of each Fidelity Central Fund. As an Investing Fund, the Fund indirectly bears its proportionate share of the expenses of the underlying Fidelity Central Funds.
Based on its investment objective, each Fidelity Central Fund may invest or participate in various investment vehicles or strategies that are similar to those of the Fund. These strategies are consistent with the investment objectives of the Fund and may involve certain economic risks which may cause a decline in value of each of the Fidelity Central Funds and thus a decline in the value of the Fund. The following summarizes the Fund's investment in each non-money market Fidelity Central Fund.
| Fidelity Central Fund | Investment Manager | Investment Objective | Investment Practices | Expense Ratio(a) |
| Fidelity Mortgage Backed Securities Central Fund | Fidelity Investment Money Management, Inc. (FIMM) | Seeks a high level of income by normally investing in investment-grade mortgage-related securities and repurchase agreements for those securities. | Delayed Delivery & When Issued Securities
Repurchase Agreements
Swaps | Less than .005% |
(a) Expenses expressed as a percentage of average net assets and are as of each underlying Central Fund's most recent annual or semi-annual shareholder report.
An unaudited holdings listing for the Fund, which presents direct holdings as well as the pro-rata share of any securities and other investments held indirectly through its investment in underlying non-money market Fidelity Central Funds, is available at fidelity.com and/or advisor.fidelity.com, as applicable. A complete unaudited list of holdings for each Fidelity Central Fund is available upon request or at the Securities and Exchange Commission (the SEC) website at www.sec.gov. In addition, the financial statements of the Fidelity Central Funds which contain the significant accounting policies (including investment valuation policies) of those funds are available on the SEC website or upon request.
3. Significant Accounting Policies.
The financial statements have been prepared in conformity with accounting principles generally accepted in the United States of America (GAAP), which require management to make certain estimates and assumptions at the date of the financial statements. Actual results could differ from those estimates. Subsequent events, if any, through the date that the financial statements were issued have been evaluated in the preparation of the financial statements. The following summarizes the significant accounting policies of the Fund:
Investment Valuation. Investments are valued as of 4:00 p.m. Eastern time on the last calendar day of the period. The Board of Trustees (the Board) has delegated the day to day responsibility for the valuation of the Fund's investments to the Fidelity Management & Research Company (FMR) Fair Value Committee (the Committee). In accordance with valuation policies and procedures approved by the Board, the Fund attempts to obtain prices from one or more third party pricing vendors or brokers to value its investments. When current market prices, quotations or currency exchange rates are not readily available or reliable, investments will be fair valued in good faith by the Committee, in accordance with procedures adopted by the Board. Factors used in determining fair value vary by investment type and may include market or investment specific events, changes in interest rates and credit quality. The frequency with which these procedures are used cannot be predicted and they may be utilized to a significant extent. The Committee oversees the Fund's valuation policies and procedures and reports to the Board on the Committee's activities and fair value determinations. The Board monitors the appropriateness of the procedures used in valuing the Fund's investments and ratifies the fair value determinations of the Committee.
The Fund categorizes the inputs to valuation techniques used to value its investments into a disclosure hierarchy consisting of three levels as shown below:
- Level 1 – quoted prices in active markets for identical investments
- Level 2 – other significant observable inputs (including quoted prices for similar investments, interest rates, prepayment speeds, etc.)
- Level 3 – unobservable inputs (including the Fund's own assumptions based on the best information available)
Valuation techniques used to value the Fund's investments by major category are as follows:
Debt securities, including restricted securities, are valued based on evaluated prices received from third party pricing vendors or from brokers who make markets in such securities. Asset backed securities, collateralized mortgage obligations, commercial mortgage securities and U.S. government agency mortgage securities are valued by pricing vendors who utilize matrix pricing which considers prepayment speed assumptions, attributes of the collateral, yield or price of bonds of comparable quality, coupon, maturity and type or by broker-supplied prices. Brokers which make markets in asset backed securities, collateralized mortgage obligations and commercial mortgage securities may also consider such factors as the structure of the issue, cash flow assumptions, the value of underlying assets as well as any guarantees. Swaps are marked-to-market daily based on valuations from third party pricing vendors, registered derivatives clearing organizations (clearinghouses) or broker-supplied valuations. These pricing sources may utilize inputs such as interest rate curves, credit spread curves, default possibilities and recovery rates. When independent prices are unavailable or unreliable, debt securities and swaps may be valued utilizing pricing methodologies which consider similar factors that would be used by third party pricing vendors. Debt securities and swaps are generally categorized as Level 2 in the hierarchy but may be Level 3 depending on the circumstances.
Investments in open-end mutual funds, including the Fidelity Central Funds, are valued at their closing net asset value (NAV) each business day and are categorized as Level 1 in the hierarchy. Short-term securities with remaining maturities of sixty days or less may be valued at amortized cost, which approximates fair value, and are categorized as Level 2 in the hierarchy.
Changes in valuation techniques may result in transfers in or out of an assigned level within the disclosure hierarchy. The aggregate value of investments by input level as of February 29, 2016 is included at the end of the Fund's Schedule of Investments.
Investment Transactions and Income. For financial reporting purposes, the Fund's investment holdings and NAV include trades executed through the end of the last business day of the period. The NAV per share for processing shareholder transactions is calculated as of the close of business of the New York Stock Exchange (NYSE), normally 4:00 p.m. Eastern time and includes trades executed through the end of the prior business day. Gains and losses on securities sold are determined on the basis of identified cost and may include proceeds received from litigation. Income and capital gain distributions from Fidelity Central Funds, if any, are recorded on the ex-dividend date. Interest income is accrued as earned and includes coupon interest and amortization of premium and accretion of discount on debt securities as applicable.
Class Allocations and Expenses. Investment income, realized and unrealized capital gains and losses, common expenses of the Fund, and certain fund-level expense reductions, if any, are allocated daily on a pro-rata basis to each class based on the relative net assets of each class to the total net assets of the Fund. Each class differs with respect to transfer agent and distribution and service plan fees incurred. Certain expense reductions may also differ by class. For the reporting period, the allocated portion of income and expenses to each class as a percent of its average net assets may vary due to the timing of recording these transactions in relation to fluctuating net assets of the classes. Expenses directly attributable to a fund are charged to that fund. Expenses attributable to more than one fund are allocated among the respective funds on the basis of relative net assets or other appropriate methods. Expense estimates are accrued in the period to which they relate and adjustments are made when actual amounts are known.
Income Tax Information and Distributions to Shareholders. Each year, the Fund intends to qualify as a regulated investment company under Subchapter M of the Internal Revenue Code, including distributing substantially all of its taxable income and realized gains. As a result, no provision for U.S. Federal income taxes is required. The Fund files a U.S. federal tax return, in addition to state and local tax returns as required. The Fund's federal income tax returns are subject to examination by the Internal Revenue Service (IRS) for a period of three fiscal years after they are filed. State and local tax returns may be subject to examination for an additional fiscal year depending on the jurisdiction.
Dividends are declared and recorded daily and paid monthly from net investment income. Distributions from realized gains, if any, are declared and recorded on the ex-dividend date. Income dividends and capital gain distributions are declared separately for each class. Income and capital gain distributions are determined in accordance with income tax regulations, which may differ from GAAP.
Capital accounts within the financial statements are adjusted for permanent book-tax differences. These adjustments have no impact on net assets or the results of operations. Capital accounts are not adjusted for temporary book-tax differences which will reverse in a subsequent period.
Book-tax differences are primarily due to swaps, market discount, partnerships (including allocations from Fidelity Central Funds), deferred trustees compensation, financing transactions, capital loss carryforwards and losses deferred due to wash sales and excise tax regulations.
The federal tax cost of investment securities and unrealized appreciation (depreciation) as of period end were as follows:
| Gross unrealized appreciation | $21,912 |
| Gross unrealized depreciation | (5,152) |
| Net unrealized appreciation (depreciation) on securities | $16,760 |
| Tax cost | $1,343,594 |
Capital loss carryforwards are only available to offset future capital gains of the Fund to the extent provided by regulations and may be limited. Under the Regulated Investment Company Modernization Act of 2010 (the Act), the Fund is permitted to carry forward capital losses incurred in taxable years beginning after December 22, 2010 for an unlimited period and such capital losses are required to be used prior to any losses that expire. The capital loss carryforward information presented below, including any applicable limitation, is estimated as of prior fiscal period end and is subject to adjustment.
| Fiscal year of expiration | |
| 2017 | $(73,463) |
| No expiration | |
| Long-term | (3,849) |
| Total capital loss carryforward | $(77,312) |
Repurchase Agreements. Pursuant to an Exemptive Order issued by the SEC, the Fund along with other registered investment companies having management contracts with FMR, or other affiliated entities of FMR, are permitted to transfer uninvested cash balances into joint trading accounts which are then invested in repurchase agreements. The Fund may also invest directly with institutions in repurchase agreements. Repurchase agreements may be collateralized by government or non-government securities. Upon settlement date, collateral is held in segregated accounts with custodian banks and may be obtained in the event of a default of the counterparty. The Fund monitors, on a daily basis, the value of the collateral to ensure it is at least equal to the principal amount of the repurchase agreement (including accrued interest). In the event of a default by the counterparty, realization of the collateral proceeds could be delayed, during which time the value of the collateral may decline.
Delayed Delivery Transactions and When-Issued Securities. During the period, the Fund transacted in securities on a delayed delivery or when-issued basis. Payment and delivery may take place after the customary settlement period for that security. The price of the underlying securities and the date when the securities will be delivered and paid for are fixed at the time the transaction is negotiated. The securities purchased on a delayed delivery or when-issued basis are identified as such in the Fund's Schedule of Investments. The Fund may receive compensation for interest forgone in the purchase of a delayed delivery or when-issued security. With respect to purchase commitments, the Fund identifies securities as segregated in its records with a value at least equal to the amount of the commitment. Losses may arise due to changes in the value of the underlying securities or if the counterparty does not perform under the contract's terms, or if the issuer does not issue the securities due to political, economic, or other factors.
To-Be-Announced (TBA) Securities and Mortgage Dollar Rolls. During the period, the Fund transacted in TBA securities that involved buying or selling mortgage-backed securities (MBS) on a forward commitment basis. A TBA transaction typically does not designate the actual security to be delivered and only includes an approximate principal amount; however delivered securities must meet specified terms defined by industry guidelines, including issuer, rate and current principal amount outstanding on underlying mortgage pools. The Fund may enter into a TBA transaction with the intent to take possession of or deliver the underlying MBS, or the Fund may elect to extend the settlement by entering into either a mortgage or reverse mortgage dollar roll. Mortgage dollar rolls are transactions where a fund sells TBA securities and simultaneously agrees to repurchase MBS on a later date at a lower price and with the same counterparty. Reverse mortgage dollar rolls involve the purchase and simultaneous agreement to sell TBA securities on a later date at a lower price. Transactions in mortgage dollar rolls and reverse mortgage dollar rolls are accounted for as purchases and sales and may result in an increase to the Fund's portfolio turnover rate.
Purchases and sales of TBA securities involve risks similar to those discussed above for delayed delivery and when-issued securities. Also, if the counterparty in a mortgage dollar roll or a reverse mortgage dollar roll transaction files for bankruptcy or becomes insolvent, the Fund's right to repurchase or sell securities may be limited. Additionally, when a fund sells TBA securities without already owning or having the right to obtain the deliverable securities (an uncovered forward commitment to sell), it incurs a risk of loss because it could have to purchase the securities at a price that is higher than the price at which it sold them. A fund may be unable to purchase the deliverable securities if the corresponding market is illiquid.
TBA securities subject to a forward commitment to sell at period end are included at the end of the Fund's Schedule of Investments under the caption "TBA Sale Commitments." The proceeds and value of these commitments are reflected in the Fund's Statement of Assets and Liabilities as Receivable for TBA sale commitments and TBA sale commitments, at value, respectively.
Restricted Securities. The Fund may invest in securities that are subject to legal or contractual restrictions on resale. These securities generally may be resold in transactions exempt from registration or to the public if the securities are registered. Disposal of these securities may involve time-consuming negotiations and expense, and prompt sale at an acceptable price may be difficult. Information regarding restricted securities is included at the end of the Fund's Schedule of Investments.
4. Derivative Instruments.
Risk Exposures and the Use of Derivative Instruments. The Fund's investment objective allows the Fund to enter into various types of derivative contracts, including swaps. Derivatives are investments whose value is primarily derived from underlying assets, indices or reference rates and may be transacted on an exchange or over-the-counter (OTC). Derivatives may involve a future commitment to buy or sell a specified asset based on specified terms, to exchange future cash flows at periodic intervals based on a notional principal amount, or for one party to make one or more payments upon the occurrence of specified events in exchange for periodic payments from the other party.
The Fund used derivatives to increase returns, to gain exposure to certain types of assets and to manage exposure to certain risks as defined below. The success of any strategy involving derivatives depends on analysis of numerous economic factors, and if the strategies for investment do not work as intended, the Fund may not achieve its objectives.
The Fund's use of derivatives increased or decreased its exposure to the following risk:
| Interest Rate Risk | Interest rate risk relates to the fluctuations in the value of interest-bearing securities due to changes in the prevailing levels of market interest rates. |
The Fund is also exposed to additional risks from investing in derivatives, such as liquidity risk and counterparty credit risk. Liquidity risk is the risk that the Fund will be unable to close out the derivative in the open market in a timely manner. Counterparty credit risk is the risk that the counterparty will not be able to fulfill its obligation to the Fund. Counterparty credit risk related to centrally cleared OTC swaps may be mitigated by the protection provided by the clearinghouse.
Investing in derivatives may involve greater risks than investing in the underlying assets directly and, to varying degrees, may involve risk of loss in excess of any initial investment and collateral received and amounts recognized in the Statement of Assets and Liabilities. In addition, there may be the risk that the change in value of the derivative contract does not correspond to the change in value of the underlying instrument.
Net Realized Gain (Loss) and Change in Net Unrealized Appreciation (Depreciation) on Derivatives. The table below, which reflects the impacts of derivatives on the financial performance of the Fund, summarizes the net realized gain (loss) and change in net unrealized appreciation (depreciation) for derivatives during the period as presented in the Statement of Operations.
| Primary Risk Exposure / Derivative Type | Net Realized Gain (Loss) | Change in Net Unrealized Appreciation (Depreciation) |
| Interest Rate Risk | | |
| Swaps(a) | $(2,480) | $437 |
(a) A summary of the value of derivatives by primary risk exposure as of period end, if any, is included at the end of the Schedule of Investments
Swaps. A swap is a contract between two parties to exchange future cash flows at periodic intervals based on a notional principal amount. A centrally cleared OTC swap is a transaction executed between a fund and a dealer counterparty, then cleared by a futures commission merchant (FCM) through a clearinghouse. Once cleared, the clearinghouse serves as a central counterparty, with whom a fund exchanges cash flows for the life of the transaction, similar to transactions in futures contracts.
Centrally cleared OTC swaps require a fund to deposit either cash or securities (initial margin) with the FCM, at the instruction of and for the benefit of the clearinghouse. Securities deposited to meet initial margin requirements are identified in the Schedule of Investments. Centrally cleared OTC swaps are marked-to-market daily and subsequent payments (variation margin) are made or received depending on the daily fluctuations in the value of the swaps and are recorded as unrealized appreciation or (depreciation). These daily payments, if any, are included in receivable or payable for daily variation margin for derivative instruments in the Statement of Assets and Liabilities. Any premiums for centrally cleared OTC swaps are recorded periodically throughout the term of the swap to variation margin and included in unrealized appreciation (depreciation) in the Statement of Assets and Liabilities. Any premiums are recognized as realized gain (loss) upon termination or maturity of the swap.
Payments are exchanged at specified intervals, accrued daily commencing with the effective date of the contract and recorded as realized gain or (loss). Some swaps may be terminated prior to the effective date and realize a gain or loss upon termination. The net realized gain (loss) and change in net unrealized appreciation (depreciation) on swaps during the period is included in the Statement of Operations.
Any open swaps at period end are included in the Schedule of Investments under the caption "Swaps".
Interest Rate Swaps. Interest rate swaps are agreements between counterparties to exchange cash flows, one based on a fixed rate, and the other on a floating rate. The Fund entered into interest rate swaps to manage its exposure to interest rate changes. Changes in interest rates can have an effect on both the value of bond holdings as well as the amount of interest income earned. In general, the value of bonds can fall when interest rates rise and can rise when interest rates fall.
5. Purchases and Sales of Investments.
Purchases and sales of securities (including the Fixed-Income Central Funds), other than short-term securities and U.S. government securities, aggregated $95,240 and $74,217, respectively.
6. Fees and Other Transactions with Affiliates.
Management Fee. Fidelity Management & Research Company (the investment adviser) and its affiliates provide the Fund with investment management related services for which the Fund pays a monthly management fee. The management fee is the sum of an individual fund fee rate that is based on an annual rate of .20% of the Fund's average net assets and an annualized group fee rate that averaged .11% during the period. The group fee rate is based upon the average net assets of all the mutual funds advised by the investment adviser, including any mutual funds previously advised by the investment adviser that are currently advised by Fidelity SelectCo, LLC, an affiliate of the investment adviser. The group fee rate decreases as assets under management increase and increases as assets under management decrease. For the reporting period, the total annualized management fee rate was .31% of the Fund's average net assets.
Distribution and Service Plan Fees. In accordance with Rule 12b-1 of the 1940 Act, the Fund has adopted separate Distribution and Service Plans for each class of shares. Certain classes pay Fidelity Distributors Corporation (FDC), an affiliate of the investment adviser, separate Distribution and Service Fees, each of which is based on an annual percentage of each class' average net assets. In addition, FDC may pay financial intermediaries for selling shares of the Fund and providing shareholder support services. For the period, the Distribution and Service Fee rates, total fees and amounts retained by FDC were as follows:
| | Distribution
Fee | Service
Fee | Total Fees | Retained
by FDC |
| Class A | -% | .25% | $47 | $–(a) |
| Class T | -% | .25% | 28 | – |
| Class B | .65% | .25% | 3 | 2 |
| Class C | .75% | .25% | 83 | 1 |
| | | | $161 | $3 |
(a) Values shown as $0 may reflect amounts less than $500.
Sales Load. FDC may receive a front-end sales charge of up to 4.00% for selling Class A shares and Class T shares, some of which is paid to financial intermediaries for selling shares of the Fund. Depending on the holding period, FDC may receive contingent deferred sales charges levied on Class A, Class T, Class B, and Class C redemptions. The deferred sales charges range from 5.00% to 1.00% for Class B shares, 1.00% for Class C shares, .75% for certain purchases of Class A shares and .25% for certain purchases of Class T shares.
For the period, sales charge amounts retained by FDC were as follows:
| | Retained
by FDC |
| Class A | $2 |
| Class T | 2 |
| Class B(a) | 1 |
| Class C(a) | 1 |
| | $6 |
(a) When Class B and Class C shares are initially sold, FDC pays commissions from its own resources to financial intermediaries through which the sales are made.
Transfer Agent Fees. Fidelity Investments Institutional Operations Company, Inc., (FIIOC), an affiliate of the investment adviser, is the transfer, dividend disbursing and shareholder servicing agent for each class of the Fund. FIIOC receives account fees and asset-based fees that vary according to the account size and type of account of the shareholders of each respective class of the Fund, with the exception of Fidelity Mortgage Securities Fund. FIIOC receives an asset-based fee of .10% of Fidelity Mortgage Securities Fund's average net assets. FIIOC pays for typesetting, printing and mailing of shareholder reports, except proxy statements. For the period, transfer agent fees for each class were as follows:
| | Amount | % of
Class-Level Average
Net Assets(a) |
| Class A | $37 | .20 |
| Class T | 22 | .20 |
| Class B | 1 | .25 |
| Class C | 15 | .18 |
| Fidelity Mortgage Securities Fund | 444 | .10 |
| Class I | 56 | .15 |
| | $575 | |
(a) Annualized
Fund Wide Operations Fee. Pursuant to the Fund Wide Operations and Expense Agreement (FWOE), the investment adviser has agreed to provide for fund level expenses (which do not include transfer agent, Rule 12b-1 fees, compensation of the independent Trustees, interest (including commitment fees), taxes or extraordinary expenses, if any) in return for a FWOE fee equal to .35% of the Fund's average net assets less the total amount of the management fee. The FWOE paid by the Fund is reduced by an amount equal to the fees and expenses paid to the independent Trustees. For the period, the FWOE fee was equivalent to an annualized rate of .04% of average net assets.
Interfund Trades. The Fund may purchase from or sell securities to other Fidelity Funds under procedures adopted by the Board. The procedures have been designed to ensure these interfund trades are executed in accordance with Rule 17a-7 of the 1940 Act. Interfund trades are included within the respective purchases and sales amounts shown in the Purchases and Sales of Investments note.
7. Committed Line of Credit.
The Fund participates with other funds managed by the investment adviser or an affiliate in a $4.25 billion credit facility (the "line of credit") to be utilized for temporary or emergency purposes to fund shareholder redemptions or for other short-term liquidity purposes. The Fund has agreed to pay commitment fees on its pro-rata portion of the line of credit, which amounted to $1 and is reflected in Miscellaneous expenses on the Statement of Operations. During the period, the Fund did not borrow on this line of credit.
8. Expense Reductions.
During the period the investment adviser reimbursed and/or waived a portion of fund-level operating expenses in the amount of $28.
9. Distributions to Shareholders.
Distributions to shareholders of each class were as follows:
| | Six months ended February 29, 2016 | Year ended August 31, 2015 |
| From net investment income | | |
| Class A | $428 | $748 |
| Class T | 256 | 417 |
| Class B | 6 | 14 |
| Class C | 126 | 202 |
| Fidelity Mortgage Securities Fund | 11,589 | 18,864 |
| Class I | 946 | 1,318 |
| Total | $13,351 | $21,563 |
| From net realized gain | | |
| Class A | $20 | $10 |
| Class T | 13 | 6 |
| Class C | 9 | 5 |
| Fidelity Mortgage Securities Fund | 471 | 210 |
| Class I | 39 | 13 |
| Total | $552 | $244 |
10. Share Transactions.
Share transactions for each class were as follows and may contain automatic conversions between classes or exchanges between affiliated funds:
| | Shares | Shares | Dollars | Dollars |
| | Six months ended February 29, 2016 | Year ended August 31, 2015 | Six months ended February 29, 2016 | Year ended August 31, 2015 |
| Class A | | | | |
| Shares sold | 1,036 | 563 | $11,746 | $6,368 |
| Reinvestment of distributions | 35 | 59 | 399 | 669 |
| Shares redeemed | (577) | (872) | (6,530) | (9,855) |
| Net increase (decrease) | 494 | (250) | $5,615 | $(2,818) |
| Class T | | | | |
| Shares sold | 772 | 285 | $8,778 | $3,225 |
| Reinvestment of distributions | 23 | 36 | 258 | 409 |
| Shares redeemed | (486) | (458) | (5,477) | (5,196) |
| Net increase (decrease) | 309 | (137) | $3,559 | $(1,562) |
| Class B | | | | |
| Shares sold | 10 | 5 | $101 | $68 |
| Reinvestment of distributions | –(a) | 1 | 4 | 9 |
| Shares redeemed | (20) | (55) | (224) | (625) |
| Net increase (decrease) | (10) | (49) | $(119) | $(548) |
| Class C | | | | |
| Shares sold | 464 | 358 | $5,253 | $4,044 |
| Reinvestment of distributions | 10 | 15 | 113 | 166 |
| Shares redeemed | (209) | (502) | (2,363) | (5,678) |
| Net increase (decrease) | 265 | (129) | $3,003 | $(1,468) |
| Fidelity Mortgage Securities Fund | | | | |
| Shares sold | 12,675 | 20,281 | $143,608 | $230,420 |
| Reinvestment of distributions | 1,004 | 1,582 | 11,378 | 17,954 |
| Shares redeemed | (7,440) | (15,790) | (84,239) | (179,084) |
| Net increase (decrease) | 6,239 | 6,073 | $70,747 | $69,290 |
| Class I | | | | |
| Shares sold | 892 | 3,034 | $10,069 | $34,395 |
| Reinvestment of distributions | 85 | 114 | 959 | 1,290 |
| Shares redeemed | (347) | (1,110) | (3,915) | (12,534) |
| Net increase (decrease) | 630 | 2,038 | $7,113 | $23,151 |
(a) Values shown as 0 may reflect amounts less than 500.
11. Other.
The Fund's organizational documents provide former and current trustees and officers with a limited indemnification against liabilities arising in connection with the performance of their duties to the Fund. In the normal course of business, the Fund may also enter into contracts that provide general indemnifications. The Fund's maximum exposure under these arrangements is unknown as this would be dependent on future claims that may be made against the Fund. The risk of material loss from such claims is considered remote.
At the end of the period, the investment adviser or its affiliates were the owners of record of 10% of the total outstanding shares of the Fund.
12. Credit Risk.
The Fund invests a portion of its assets in structured securities of issuers backed by commercial and residential mortgage loans, credit card receivables and automotive loans. The value and related income of these securities is sensitive to changes in economic conditions, including delinquencies and/or defaults.
Shareholder Expense Example
As a shareholder of the Fund, you incur two types of costs: (1) transaction costs, including sales charges (loads) on purchase payments or redemption proceeds, and (2) ongoing costs, including management fees, distribution and/or service (12b-1) fees and other Fund expenses. This Example is intended to help you understand your ongoing costs (in dollars) of investing in the Fund and to compare these costs with the ongoing costs of investing in other mutual funds.
The Example is based on an investment of $1,000 invested at the beginning of the period and held for the entire period (September 1, 2015 to February 29, 2016).
Actual Expenses
The first line of the accompanying table for each class of the Fund provides information about actual account values and actual expenses. You may use the information in this line, together with the amount you invested, to estimate the expenses that you paid over the period. Simply divide your account value by $1,000.00 (for example, an $8,600 account value divided by $1,000.00 = 8.6), then multiply the result by the number in the first line for a class of the Fund under the heading entitled "Expenses Paid During Period" to estimate the expenses you paid on your account during this period. A small balance maintenance fee of $12.00 that is charged once a year may apply for certain accounts with a value of less than $2,000. This fee is not included in the table below. If it was, the estimate of expenses you paid during the period would be higher, and your ending account value lower, by this amount. In addition, the Fund, as a shareholder in the underlying Fidelity Central Funds, will indirectly bear its pro-rata share of the fees and expenses incurred by the underlying Fidelity Central Funds. These fees and expenses are not included in the Fund's annualized expense ratio used to calculate the expense estimate in the table below.
Hypothetical Example for Comparison Purposes
The second line of the accompanying table for each class of the Fund provides information about hypothetical account values and hypothetical expenses based on a Class' actual expense ratio and an assumed rate of return of 5% per year before expenses, which is not the Class' actual return. The hypothetical account values and expenses may not be used to estimate the actual ending account balance or expenses you paid for the period. You may use this information to compare the ongoing costs of investing in the Fund and other funds. To do so, compare this 5% hypothetical example with the 5% hypothetical examples that appear in the shareholder reports of the other funds. A small balance maintenance fee of $12.00 that is charged once a year may apply for certain accounts with a value of less than $2,000. This fee is not included in the table below. If it was, the estimate of expenses you paid during the period would be higher, and your ending account value lower, by this amount. In addition, the Fund, as a shareholder in the underlying Fidelity Central Funds, will indirectly bear its pro-rata share of the fees and expenses incurred by the underlying Fidelity Central Funds. These fees and expenses are not included in the Fund's annualized expense ratio used to calculate the expense estimate in the table below.
Please note that the expenses shown in the table are meant to highlight your ongoing costs only and do not reflect any transaction costs. Therefore, the second line of the table is useful in comparing ongoing costs only, and will not help you determine the relative total costs of owning different funds. In addition, if these transactional costs were included, your costs would have been higher.
| | Annualized Expense Ratio-A | Beginning
Account Value
September 1, 2015 | Ending
Account Value
February 29, 2016 | Expenses Paid
During Period-B
September 1, 2015
to February 29, 2016 |
| Class A | .80% | | | |
| Actual | | $1,000.00 | $1,018.20 | $4.01 |
| Hypothetical-C | | $1,000.00 | $1,020.89 | $4.02 |
| Class T | .80% | | | |
| Actual | | $1,000.00 | $1,018.20 | $4.01 |
| Hypothetical-C | | $1,000.00 | $1,020.89 | $4.02 |
| Class B | 1.50% | | | |
| Actual | | $1,000.00 | $1,014.60 | $7.51 |
| Hypothetical-C | | $1,000.00 | $1,017.40 | $7.52 |
| Class C | 1.54% | | | |
| Actual | | $1,000.00 | $1,014.40 | $7.71 |
| Hypothetical-C | | $1,000.00 | $1,017.21 | $7.72 |
| Fidelity Mortgage Securities Fund | .45% | | | |
| Actual | | $1,000.00 | $1,019.90 | $2.26 |
| Hypothetical-C | | $1,000.00 | $1,022.63 | $2.26 |
| Class I | .50% | | | |
| Actual | | $1,000.00 | $1,019.70 | $2.51 |
| Hypothetical-C | | $1,000.00 | $1,022.38 | $2.51 |
A Annualized expense ratio reflects expenses net of applicable fee waivers.
B Expenses are equal to each Class' annualized expense ratio, multiplied by the average account value over the period, multiplied by 182/366 (to reflect the one-half year period). The fees and expenses of the underlying Fidelity Central Funds in which the Fund invests are not included in each Class' annualized expense ratio. In addition to the expenses noted above, the Fund also indirectly bears its proportional share of the expenses of the underlying Fidelity Central Funds. Annualized expenses of the underlying non-money market Fidelity Central Funds as of their most recent fiscal half year were less than .005%.
C 5% return per year before expenses
Board Approval of Investment Advisory Contracts and Management Fees
Fidelity Advisor Mortgage Securities Fund
Each year, the Board of Trustees, including the Independent Trustees (together, the Board), votes on the renewal of the management contract with Fidelity Management & Research Company (FMR) and the sub-advisory agreements (together, the Advisory Contracts) for the fund. The Board, assisted by the advice of fund counsel and Independent Trustees' counsel, requests and considers a broad range of information relevant to the renewal of the Advisory Contracts throughout the year.
The Board meets regularly and, at each of its meetings, covers an extensive agenda of topics and materials and considers factors that are relevant to its annual consideration of the renewal of the fund's Advisory Contracts, including the services and support provided to the fund and its shareholders. The Board has established four standing committees (Committees) — Operations, Audit, Fair Valuation, and Governance and Nominating — each composed of and chaired by Independent Trustees with varying backgrounds, to which the Board has assigned specific subject matter responsibilities in order to enhance effective decision-making by the Board. The Operations Committee, of which all of the Independent Trustees are members, meets regularly throughout the year and considers, among other matters, information specifically related to the annual consideration of the renewal of the fund's Advisory Contracts. The Board, acting directly and through its Committees, requests and receives information concerning the annual consideration of the renewal of the fund's Advisory Contracts. The Board also meets as needed to consider matters specifically related to the Board's annual consideration of the renewal of the Advisory Contracts. Members of the Board may also meet with trustees of other Fidelity funds through ad hoc joint committees to discuss certain matters relevant to all of the Fidelity funds.
At its September 2015 meeting, the Board unanimously determined to renew the fund's Advisory Contracts. In reaching its determination, the Board considered all factors it believed relevant, including (i) the nature, extent, and quality of the services to be provided to the fund and its shareholders (including the investment performance of the fund); (ii) the competitiveness of the fund's management fee and total expense ratio relative to peer funds; (iii) the total costs of the services to be provided by and the profits to be realized by Fidelity from its relationship with the fund; and (iv) the extent to which (if any) economies of scale exist and would be realized as the fund grows, and whether any economies of scale are appropriately shared with fund shareholders.
In considering whether to renew the Advisory Contracts for the fund, the Board reached a determination, with the assistance of fund counsel and Independent Trustees' counsel and through the exercise of its business judgment, that the renewal of the Advisory Contracts was in the best interests of the fund and its shareholders and that the compensation payable under the Advisory Contracts was fair and reasonable. The Board's decision to renew the Advisory Contracts was not based on any single factor, but rather was based on a comprehensive consideration of all the information provided to the Board at its meetings throughout the year. The Board, in reaching its determination to renew the Advisory Contracts, was aware that shareholders of the fund have a broad range of investment choices available to them, including a wide choice among funds offered by Fidelity's competitors, and that the fund's shareholders, who have the opportunity to review and weigh the disclosure provided by the fund in its prospectus and other public disclosures, have chosen to invest in this fund, which is part of the Fidelity family of funds.
Nature, Extent, and Quality of Services Provided. The Board considered Fidelity's staffing as it relates to the fund, including the backgrounds of investment personnel of Fidelity, and also considered the fund's investment objective, strategies, and related investment philosophy. The Independent Trustees also had discussions with senior management of Fidelity's investment operations and investment groups. The Board considered the structure of the portfolio manager compensation program and whether this structure provides appropriate incentives to act in the best interests of the fund. Additionally, the Board considered the portfolio managers' investments, if any, in the funds that they manage.
Resources Dedicated to Investment Management and Support Services. The Board reviewed the general qualifications and capabilities of Fidelity's investment staff, including its size, education, experience, and resources, as well as Fidelity's approach to recruiting, training, managing, and compensating investment personnel. The Board noted that Fidelity has continued to increase the resources devoted to non-U.S. offices, including expansion of Fidelity's global investment organization. The Board also noted that Fidelity's analysts have extensive resources, tools and capabilities that allow them to conduct sophisticated quantitative and fundamental analysis, as well as credit analysis of issuers, counterparties and guarantors. Further, the Board considered that Fidelity's investment professionals have sufficient access to global information and data so as to provide competitive investment results over time, and that those professionals also have access to sophisticated tools that permit them to assess portfolio construction and risk and performance attribution characteristics continuously, as well as to transmit new information and research conclusions rapidly around the world. Additionally, in its deliberations, the Board considered Fidelity's trading, risk management, compliance, and technology and operations capabilities and resources, which are integral parts of the investment management process.
Shareholder and Administrative Services. The Board considered (i) the nature, extent, quality, and cost of advisory, administrative, and shareholder services performed by FMR, the sub-advisers (together with FMR, the Investment Advisers), and their affiliates under the Advisory Contracts and under separate agreements covering transfer agency, pricing and bookkeeping, and securities lending services for the fund; (ii) the nature and extent of the supervision of third party service providers, principally custodians, subcustodians, and pricing vendors; and (iii) the resources devoted to, and the record of compliance with, the fund's compliance policies and procedures.
The Board noted that the growth of fund assets over time across the complex allows Fidelity to reinvest in the development of services designed to enhance the value or convenience of the Fidelity funds as investment vehicles. These services include 24-hour access to account information and market information through telephone representatives and over the Internet, investor education materials and asset allocation tools, and the expanded availability of Fidelity Investor Centers.
Investment in a Large Fund Family. The Board considered the benefits to shareholders of investing in a Fidelity fund, including the benefits of investing in a fund that is part of a large family of funds offering a variety of investment disciplines and providing a large variety of mutual fund investor services. The Board noted that Fidelity had taken, or had made recommendations that resulted in the Fidelity funds taking, a number of actions over the previous year that benefited particular funds, including (i) continuing to dedicate additional resources to investment research and to the support of the senior management team that oversees asset management; (ii) continuing efforts to enhance Fidelity's global research capabilities; (iii) launching new funds and making other enhancements to meet client needs; (iv) reducing management fees and total expenses for certain index funds and diversified international funds; (v) continuing to launch dedicated lower cost underlying funds to meet portfolio construction needs related to expanding underlying fund options for Fidelity funds of funds, specifically for the Freedom Fund product lines; (vi) rationalizing product lines and gaining increased efficiencies through fund mergers; (vii) launching active fixed-income exchange-traded funds; (viii) continuing to develop, acquire and implement systems and technology to improve services to the funds and shareholders, strengthen information security, and increase efficiency; (ix) implementing investment enhancements to further strengthen Fidelity's target date product line to increase investors' probability of success in achieving their goals; (x) modifying the eligibility criteria for certain share classes to accommodate roll-over assets from employer-sponsored retirement plans; (xi) launching a new Class W of the Freedom Index Funds to attract and retain Fidelity record-kept retirement plan assets; and (xii) implementing changes to Fidelity's money market product line in response to recent money market regulatory reforms.
Investment Performance. The Board considered whether the fund has operated in accordance with its investment objective, as well as its record of compliance with its investment restrictions and its performance history.
The Board took into account discussions with representatives of the Investment Advisers about fund investment performance that occur at Board meetings throughout the year. In this regard the Board noted that as part of regularly scheduled fund reviews and other reports to the Board on fund performance, the Board considers annualized return information for the fund for different time periods, measured against a securities market index ("benchmark index") and a peer group of funds with similar objectives ("peer group"), if any. In its evaluation of fund investment performance at meetings throughout the year, the Board gave particular attention to information indicating underperformance of certain Fidelity funds for specific time periods and discussed with the Investment Advisers the reasons for such underperformance.
In addition to reviewing absolute and relative fund performance, the Independent Trustees periodically consider the appropriateness of fund performance metrics in evaluating the results achieved. In general, the Independent Trustees believe that fund performance should be evaluated based on gross performance (before fees and expenses but after transaction costs) compared to appropriate benchmark indices, over appropriate time periods that may include full market cycles, and on net performance (after fees and expenses) compared to peer groups, as applicable, over the same periods, taking into account relevant factors including the following: general market conditions; expectations for interest rate levels and credit conditions; issuer-specific information including credit quality; the potential for incremental return versus the fund's benchmark index weighed against the risks involved in obtaining that incremental return, including the risk of diminished or negative total returns; and fund cash flows and other factors. Depending on the circumstances, the Independent Trustees may be satisfied with a fund's performance notwithstanding that it lags its benchmark index or peer group for certain periods.
The Independent Trustees recognize that shareholders evaluate performance on a net basis over their own holding periods, for which one-, three-, and five-year periods are often used as a proxy. For this reason, the performance information reviewed by the Board also included net cumulative calendar year total return information for the fund and an appropriate benchmark index and peer group for the most recent one-, three-, and five-year periods.
Based on its review, the Board concluded that the nature, extent, and quality of services provided to the fund under the Advisory Contracts should benefit the shareholders of the fund.
Competitiveness of Management Fee and Total Expense Ratio. The Board considered the fund's management fee and total expense ratio compared to "mapped groups" of competitive funds and classes created for the purpose of facilitating the Trustees' competitive analysis of management fees and total expenses. Fidelity creates "mapped groups" by combining similar Lipper investment objective categories that have comparable investment mandates. Combining Lipper investment objective categories aids the Board's management fee and total expense ratio comparisons by broadening the competitive group used for comparison.
Management Fee. The Board considered two proprietary management fee comparisons for the 12-month periods shown in basis points (BP) in the chart below. The group of Lipper funds used by the Board for management fee comparisons is referred to below as the "Total Mapped Group" and, for the reasons explained above, is broader than the Lipper peer group used by the Board for performance comparisons. The Total Mapped Group comparison focuses on a fund's standing in terms of gross management fees before expense reimbursements or caps relative to the total universe of funds with comparable investment mandates, regardless of whether their management fee structures also are comparable. Funds with comparable investment mandates offer exposure to similar types of securities. Funds with comparable management fee structures have similar management fee contractual arrangements (
e.g., flat rate charged for advisory services, all-inclusive fee rate,
etc.). "TMG %" represents the percentage of funds in the Total Mapped Group that had management fees that were lower than the fund's. For example, a hypothetical TMG % of 20% would mean that 80% of the funds in the Total Mapped Group had higher, and 20% had lower, management fees than the fund. The fund's actual TMG %s and the number of funds in the Total Mapped Group are in the chart below. The "Asset-Size Peer Group" (ASPG) comparison focuses on a fund's standing relative to a subset of non-Fidelity funds within the Total Mapped Group that are similar in size and management fee structure. For example, if a fund is in the first quartile of the ASPG, the fund's management fee ranks in the least expensive or lowest 25% of funds in the ASPG. The ASPG represents at least 15% of the funds in the Total Mapped Group with comparable asset size and management fee structures, subject to a minimum of 50 funds (or all funds in the Total Mapped Group if fewer than 50). Additional information, such as the ASPG quartile in which the fund's management fee rate ranked, is also included in the chart and considered by the Board.
Fidelity Advisor Mortgage Securities Fund
The Board noted that the fund's management fee rate ranked below the median of its Total Mapped Group and below the median of its ASPG for 2014.
The Board noted that, in 2014, the ad hoc Committee on Group Fee was formed by it and other Fidelity fund boards to conduct an in-depth review of the "group fee" component of the management fee of funds with such management fee structures. Committee focus included the mechanics of the group fee, the competitive landscape of group fee structures, Fidelity funds with no group fee component and investment products not included in group fee assets. The Board also considered that, for funds subject to the group fee, FMR agreed to voluntarily waive fees over a specified period of time in amounts designed to account for assets converted from certain funds to certain collective investment trusts.
Based on its review, the Board concluded that the fund's management fee is fair and reasonable in light of the services that the fund receives and the other factors considered.
Total Expense Ratio. In its review of each class's total expense ratio, the Board considered the fund's management fee rate as well as other fund or class expenses, as applicable, such as transfer agent fees, pricing and bookkeeping fees, fund-paid 12b-1 fees, and custodial, legal, and audit fees. The Board also noted that Fidelity may agree to waive fees and expenses from time to time, and the extent to which, if any, it has done so for the fund. As part of its review, the Board also considered the current and historical total expense ratios of each class of the fund compared to competitive fund median expenses. Each class of the fund is compared to those funds and classes in the Total Mapped Group (used by the Board for management fee comparisons) that have a similar sales load structure.
The Board noted that the total expense ratio of each class ranked below its competitive median for 2014.
The Board considered that the current contractual arrangements for the fund have the effect of setting the total "fund-level" (but not "class-level") expenses (including, among certain other "fund-level" expenses, the management fee) for each class at 0.35%. These contractual arrangements may not be increased without the approval of the Board.
The Board recognized that the fund's management contract incorporates a "group fee" structure, which provides for lower group fee rates as total group assets increase, and for higher group fee rates as total group assets decrease (with "group assets" defined to include fund assets under FMR's management plus sector fund assets previously under FMR's management and currently managed by Fidelity SelectCo, LLC). FMR calculates the group fee rates based on a tiered asset "breakpoint" schedule that varies based on asset class. The Board noted, however, that because the current contractual arrangements set the total "fund-level" expenses for each class at 0.35%, increases or decreases in the management fee due to changes in the group fee rate will not impact the total expense ratio.
Fees Charged to Other Fidelity Clients. The Board also considered Fidelity fee structures and other information with respect to clients of Fidelity, such as other funds advised or subadvised by Fidelity, pension plan clients, and other institutional clients with similar mandates. The Board noted the findings of the 2013 ad hoc joint committee (created with the board of other Fidelity funds), which reviewed and compared Fidelity's institutional investment advisory business with its business of providing services to the Fidelity funds, including the differences in services provided, fees charged, and costs incurred, as well as competition in their respective marketplaces.
Based on its review of total expense ratios and fees charged to other Fidelity clients, the Board concluded that the total expense ratio of each class of the fund was reasonable in light of the services that the fund and its shareholders receive and the other factors considered.
Costs of the Services and Profitability. The Board considered the revenues earned and the expenses incurred by Fidelity in conducting the business of developing, marketing, distributing, managing, administering and servicing the fund and servicing the fund's shareholders. The Board also considered the level of Fidelity's profits in respect of all the Fidelity funds.
On an annual basis, Fidelity presents to the Board information about the profitability of its relationship with the fund. Fidelity calculates profitability information for each fund, as well as aggregate profitability information for groups of Fidelity funds and all Fidelity funds, using a series of detailed revenue and cost allocation methodologies which originate with the books and records of Fidelity on which Fidelity's audited financial statements are based. The Audit Committee of the Board reviews any significant changes from the prior year's methodologies.
PricewaterhouseCoopers LLP (PwC), independent registered public accounting firm and auditor to Fidelity and certain Fidelity funds, has been engaged annually by the Board as part of the Board's assessment of Fidelity's profitability analysis. PwC's engagement includes the review and assessment of the methodologies used by Fidelity in determining the revenues and expenses attributable to Fidelity's mutual fund business, and completion of agreed-upon procedures in respect of the mathematical accuracy of fund profitability and its conformity to established allocation methodologies. After considering PwC's reports issued under the engagement and information provided by Fidelity, the Board concluded that while other allocation methods may also be reasonable, Fidelity's profitability methodologies are reasonable in all material respects.
The Board also reviewed Fidelity's non-fund businesses and fall-out benefits related to the mutual fund business as well as cases where Fidelity's affiliates may benefit from or be related to the fund's business.
The Board considered the costs of the services provided by and the profits realized by Fidelity in connection with the operation of the fund and was satisfied that the profitability was not excessive.
Economies of Scale. The Board considered whether there have been economies of scale in respect of the management of the Fidelity funds, whether the Fidelity funds (including the fund) have appropriately benefited from any such economies of scale, and whether there is potential for realization of any further economies of scale. The Board considered the extent to which the fund will benefit from economies of scale as assets grow through increased services to the fund, through waivers or reimbursements, or through fee or expense ratio reductions. The Board also noted that in 2013, it and the boards of other Fidelity funds created an ad hoc committee (the Economies of Scale Committee) to analyze whether Fidelity attains economies of scale in respect of the management and servicing of the Fidelity funds, whether the Fidelity funds have appropriately benefited from such economies of scale, and whether there is potential for realization of any further economies of scale.
The Board concluded, taking into account the analysis of the Economies of Scale Committee, that economies of scale, if any, are being appropriately shared between fund shareholders and Fidelity.
Additional Information Requested by the Board. In order to develop fully the factual basis for consideration of the Fidelity funds' Advisory Contracts, the Board requested and received additional information on certain topics, including: (i) Fidelity's fund profitability methodology, profitability trends for certain funds, and the impact of certain factors on fund profitability results; (ii) portfolio manager changes that have occurred during the past year and the amount of the investment that each portfolio manager has made in the Fidelity fund(s) that he or she manages; (iii) Fidelity's compensation structure for portfolio managers, research analysts, and other key personnel, including its effects on fund profitability, the rationale for the compensation structure, and the extent to which current market conditions have affected retention and recruitment; (iv) the arrangements with and compensation paid to certain fund sub-advisers on behalf of the Fidelity funds; (v) Fidelity's voluntary waiver of its fees to maintain minimum yields for certain money market funds and classes as well as contractual waivers in place for certain funds; (vi) the methodology with respect to competitive fund data and peer group classifications; (vii) Fidelity's transfer agent fee, expense, and service structures for different funds and classes relative to competitive trends, and the impact of the increased use of omnibus accounts; (viii) Fidelity's long-term expectations for its offerings in the workplace investing channel; (ix) new developments in the retail and institutional marketplaces; and (x) the impact of money market reform on Fidelity's money market funds. In addition, the Board considered its discussions with Fidelity throughout the year regarding enhanced information security initiatives and the funds' fair valuation policies.
Based on its evaluation of all of the conclusions noted above, and after considering all factors it believed relevant, the Board concluded that the advisory fee structures are fair and reasonable, and that the fund's Advisory Contracts should be renewed.
AMOR-SANN-0416
1.703540.118
Fidelity Advisor® Short Fixed-Income Fund
Class I
Semi-Annual Report February 29, 2016 |
|
Contents
To view a fund's proxy voting guidelines and proxy voting record for the 12-month period ended June 30, visit http://www.fidelity.com/proxyvotingresults or visit the Securities and Exchange Commission's (SEC) web site at http://www.sec.gov.
You may also call 1-877-208-0098 to request a free copy of the proxy voting guidelines.
Standard & Poor's, S&P and S&P 500 are registered service marks of The McGraw-Hill Companies, Inc. and have been licensed for use by Fidelity Distributors Corporation.
Other third-party marks appearing herein are the property of their respective owners.
All other marks appearing herein are registered or unregistered trademarks or service marks of FMR LLC or an affiliated company. © 2016 FMR LLC. All rights reserved.
This report and the financial statements contained herein are submitted for the general information of the shareholders of the Fund. This report is not authorized for distribution to prospective investors in the Fund unless preceded or accompanied by an effective prospectus.
A fund files its complete schedule of portfolio holdings with the SEC for the first and third quarters of each fiscal year on Form N-Q. Forms N-Q are available on the SEC’s web site at http://www.sec.gov. A fund's Forms N-Q may be reviewed and copied at the SEC’s Public Reference Room in Washington, DC. Information regarding the operation of the SEC's Public Reference Room may be obtained by calling 1-800-SEC-0330.
For a complete list of a fund's portfolio holdings, view the most recent holdings listing, semiannual report, or annual report on Fidelity's web site at http://www.fidelity.com, http://www.advisor.fidelity.com, or http://www.401k.com, as applicable.
NOT FDIC INSURED •MAY LOSE VALUE •NO BANK GUARANTEE
Neither the Fund nor Fidelity Distributors Corporation is a bank.
Investment Summary (Unaudited)
Quality Diversification (% of fund's net assets)
| As of February 29, 2016 |
| | U.S. Government and U.S. Government Agency Obligations | 31.6% |
| | AAA | 20.3% |
| | AA | 3.8% |
| | A | 19.6% |
| | BBB | 20.9% |
| | BB and Below | 1.9% |
| | Not Rated | 0.3% |
| | Short-Term Investments and Net Other Assets | 1.6% |
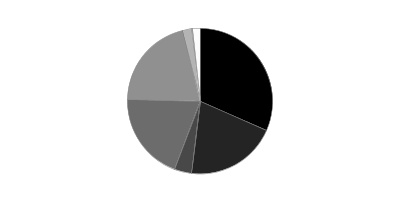
| As of August 31, 2015 |
| | U.S. Government and U.S. Government Agency Obligations | 27.4% |
| | AAA | 24.1% |
| | AA | 4.2% |
| | A | 20.6% |
| | BBB | 20.2% |
| | BB and Below | 2.5% |
| | Not Rated | 0.2% |
| | Short-Term Investments and Net Other Assets | 0.8% |

We have used ratings from Moody's Investors Service, Inc. Where Moody's® ratings are not available, we have used S&P® ratings. All ratings are as of the date indicated and do not reflect subsequent changes. Securities rated as BB or below were rated investment grade at the time of acquisition.
Weighted Average Maturity as of February 29, 2016
| | | 6 months ago |
| Years | 1.8 | 2.0 |
This is a weighted average of all the maturities of the securities held in a fund. Weighted Average Maturity (WAM) can be used as a measure of sensitivity to interest rate changes and market changes. Generally, the longer the maturity, the greater the sensitivity to such changes. WAM is based on the dollar-weighted average length of time until principal payments must be paid. Depending on the types of securities held in a fund, certain maturity shortening devices (e.g., demand features, interest rate resets, and call options) may be taken into account when calculating the WAM.
Duration as of February 29, 2016
| | | 6 months ago |
| Years | 1.7 | 1.7 |
Duration is a measure of a security's price sensitivity to changes in interest rates. Duration differs from maturity in that it considers a security's interest payments in addition to the amount of time until the security reaches maturity, and also takes into account certain maturity shortening features (e.g., demand features, interest rate resets, and call options) when applicable. Securities with longer durations generally tend to be more sensitive to interest rate changes than securities with shorter durations. A fund with a longer average duration generally can be expected to be more sensitive to interest rate changes than a fund with a shorter average duration.
Asset Allocation (% of fund's net assets)
| As of February 29, 2016 *,** |
| | Corporate Bonds | 42.3% |
| | U.S. Government and U.S. Government Agency Obligations | 31.6% |
| | Asset-Backed Securities | 14.3% |
| | CMOs and Other Mortgage Related Securities | 7.2% |
| | Municipal Bonds | 0.2% |
| | Other Investments | 2.8% |
| | Short-Term Investments and Net Other Assets (Liabilities) | 1.6% |
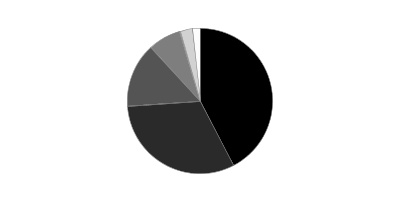
* Foreign investments - 13.3%
** Futures and Swaps - 0.0%
| As of August 31, 2015 *,** |
| | Corporate Bonds | 42.8% |
| | U.S. Government and U.S. Government Agency Obligations | 27.4% |
| | Asset-Backed Securities | 16.1% |
| | CMOs and Other Mortgage Related Securities | 10.0% |
| | Other Investments | 2.9% |
| | Short-Term Investments and Net Other Assets (Liabilities) | 0.8% |

* Foreign investments - 14.9%
** Futures and Swaps - 0.0%
Percentages shown as 0.0% may reflect amounts less than 0.05%.
Investments February 29, 2016 (Unaudited)
Showing Percentage of Net Assets
| Nonconvertible Bonds - 42.3% | | | |
| | | Principal Amount | Value |
| CONSUMER DISCRETIONARY - 2.9% | | | |
| Automobiles - 1.8% | | | |
| American Honda Finance Corp.: | | | |
| 0.95% 5/5/17 | | $1,580,000 | $1,574,721 |
| 1.125% 10/7/16 | | 1,248,000 | 1,250,626 |
| 1.7% 2/22/19 | | 870,000 | 871,286 |
| Daimler Finance North America LLC: | | | |
| 1.375% 8/1/17 (a) | | 1,642,000 | 1,631,596 |
| 1.45% 8/1/16 (a) | | 1,429,000 | 1,429,254 |
| 1.65% 3/2/18 (a) | | 821,000 | 812,884 |
| 1.65% 5/18/18 (a) | | 1,600,000 | 1,579,842 |
| General Motors Financial Co., Inc.: | | | |
| 2.4% 4/10/18 | | 1,827,000 | 1,794,933 |
| 4.2% 3/1/21 | | 1,000,000 | 1,001,501 |
| Volkswagen Group of America Finance LLC: | | | |
| 1.25% 5/23/17 (a) | | 1,642,000 | 1,613,216 |
| 1.65% 5/22/18 (a) | | 1,000,000 | 969,677 |
| Volkswagen International Finance NV 1.6% 11/20/17 (a) | | 1,090,000 | 1,067,904 |
| | | | 15,597,440 |
| Hotels, Restaurants & Leisure - 0.0% | | | |
| McDonald's Corp. 2.1% 12/7/18 | | 335,000 | 339,326 |
| Media - 1.1% | | | |
| Charter Communications Operating LLC/Charter Communications Operating Capital Corp. 3.579% 7/23/20 (a) | | 1,000,000 | 1,002,490 |
| COX Communications, Inc. 6.25% 6/1/18 (a) | | 411,000 | 440,130 |
| DIRECTV Holdings LLC/DIRECTV Financing, Inc. 2.4% 3/15/17 | | 1,642,000 | 1,658,143 |
| Thomson Reuters Corp. 0.875% 5/23/16 | | 440,000 | 439,538 |
| Time Warner Cable, Inc. 5.85% 5/1/17 | | 2,675,000 | 2,777,699 |
| Time Warner, Inc. 6.875% 6/15/18 | | 1,300,000 | 1,439,692 |
| Viacom, Inc. 2.2% 4/1/19 | | 821,000 | 805,671 |
| Walt Disney Co. 1.1% 12/1/17 | | 802,000 | 802,578 |
| | | | 9,365,941 |
|
| TOTAL CONSUMER DISCRETIONARY | | | 25,302,707 |
|
| CONSUMER STAPLES - 3.1% | | | |
| Beverages - 0.9% | | | |
| Anheuser-Busch InBev Finance, Inc.: | | | |
| 1.9% 2/1/19 | | 3,621,000 | 3,655,320 |
| 2.65% 2/1/21 | | 1,500,000 | 1,526,687 |
| Heineken NV 1.4% 10/1/17 (a) | | 457,000 | 456,847 |
| SABMiller Holdings, Inc. 2.45% 1/15/17 (a) | | 2,184,000 | 2,201,230 |
| | | | 7,840,084 |
| Food & Staples Retailing - 0.1% | | | |
| CVS Health Corp. 1.9% 7/20/18 | | 733,000 | 735,957 |
| Walgreens Boots Alliance, Inc. 1.75% 11/17/17 | | 212,000 | 211,731 |
| | | | 947,688 |
| Food Products - 0.6% | | | |
| General Mills, Inc. 1.4% 10/20/17 | | 2,053,000 | 2,053,511 |
| H.J. Heinz Co. 1.6% 6/30/17 (a) | | 1,180,000 | 1,178,729 |
| The J.M. Smucker Co. 1.75% 3/15/18 | | 533,000 | 531,302 |
| Tyson Foods, Inc. 2.65% 8/15/19 | | 821,000 | 832,094 |
| William Wrigley Jr. Co. 1.4% 10/21/16 (a) | | 560,000 | 560,162 |
| | | | 5,155,798 |
| Tobacco - 1.5% | | | |
| BAT International Finance PLC: | | | |
| 1.85% 6/15/18 (a) | | 3,000,000 | 3,012,354 |
| 2.75% 6/15/20 (a) | | 1,570,000 | 1,603,389 |
| Imperial Tobacco Finance PLC: | | | |
| 2.05% 2/11/18 (a) | | 867,000 | 866,183 |
| 2.05% 7/20/18 (a) | | 2,000,000 | 1,990,382 |
| Philip Morris International, Inc.: | | | |
| 1.25% 8/11/17 | | 1,349,000 | 1,352,103 |
| 1.375% 2/25/19 | | 2,000,000 | 1,993,316 |
| Reynolds American, Inc.: | | | |
| 2.3% 6/12/18 | | 349,000 | 352,730 |
| 3.25% 6/12/20 | | 576,000 | 599,028 |
| 6.75% 6/15/17 | | 1,350,000 | 1,449,198 |
| | | | 13,218,683 |
|
| TOTAL CONSUMER STAPLES | | | 27,162,253 |
|
| ENERGY - 3.7% | | | |
| Energy Equipment & Services - 0.2% | | | |
| Nabors Industries, Inc. 2.35% 9/15/16 | | 473,000 | 468,226 |
| Noble Holding International Ltd. 4% 3/16/18 | | 60,000 | 48,000 |
| Petrofac Ltd. 3.4% 10/10/18 (a) | | 1,478,000 | 1,253,634 |
| | | | 1,769,860 |
| Oil, Gas & Consumable Fuels - 3.5% | | | |
| BG Energy Capital PLC 2.875% 10/15/16 (a) | | 1,109,000 | 1,114,645 |
| BP Capital Markets PLC: | | | |
| 1.375% 5/10/18 | | 895,000 | 877,123 |
| 2.248% 11/1/16 | | 1,084,000 | 1,089,647 |
| Canadian Natural Resources Ltd. 1.75% 1/15/18 | | 340,000 | 310,727 |
| Columbia Pipeline Group, Inc. 2.45% 6/1/18 (a) | | 1,054,000 | 1,011,243 |
| ConocoPhillips Co. 1.5% 5/15/18 | | 2,114,000 | 2,018,194 |
| Enbridge, Inc.: | | | |
| 0.8662% 6/2/17 (b) | | 1,459,000 | 1,394,350 |
| 1.2622% 10/1/16 (b) | | 2,053,000 | 2,033,375 |
| Enterprise Products Operating LP: | | | |
| 1.65% 5/7/18 | | 1,000,000 | 966,141 |
| 2.55% 10/15/19 | | 162,000 | 156,781 |
| Exxon Mobil Corp. 1.6% 3/1/19 | | 2,000,000 | 2,000,000 |
| Kinder Morgan, Inc. 3.05% 12/1/19 | | 1,250,000 | 1,153,938 |
| Marathon Petroleum Corp.: | | | |
| 2.7% 12/14/18 | | 197,000 | 190,797 |
| 3.5% 3/1/16 | | 1,399,000 | 1,399,000 |
| Petro-Canada 6.05% 5/15/18 | | 821,000 | 839,936 |
| Petrobras Global Finance BV: | | | |
| 2% 5/20/16 | | 1,642,000 | 1,636,253 |
| 3.25% 3/17/17 | | 1,232,000 | 1,193,808 |
| Petroleos Mexicanos: | | | |
| 3.125% 1/23/19 | | 143,000 | 139,037 |
| 5.5% 2/4/19 (a) | | 1,000,000 | 1,034,000 |
| Phillips 66 Co. 2.95% 5/1/17 | | 534,000 | 540,706 |
| Schlumberger Investment SA 1.25% 8/1/17 (a) | | 1,232,000 | 1,211,020 |
| Shell International Finance BV 2.125% 5/11/20 | | 1,184,000 | 1,153,059 |
| Southwestern Energy Co. 3.3% 1/23/18 | | 321,000 | 231,120 |
| Spectra Energy Partners, LP 2.95% 6/15/16 | | 257,000 | 257,298 |
| TransCanada PipeLines Ltd.: | | | |
| 1.2831% 6/30/16 (b) | | 3,284,000 | 3,277,268 |
| 1.625% 11/9/17 | | 750,000 | 736,784 |
| 1.875% 1/12/18 | | 1,642,000 | 1,610,672 |
| 3.125% 1/15/19 | | 754,000 | 758,802 |
| | | | 30,335,724 |
|
| TOTAL ENERGY | | | 32,105,584 |
|
| FINANCIALS - 21.6% | | | |
| Banks - 12.5% | | | |
| ABN AMRO Bank NV 1.4211% 10/28/16 (a)(b) | | 3,740,000 | 3,745,685 |
| Australia & New Zealand Banking Group Ltd. 1.25% 1/10/17 | | 1,339,000 | 1,340,372 |
| Banco Nacional de Desenvolvimento Economico e Social 3.375% 9/26/16 (a) | | 957,000 | 954,608 |
| Bank of America Corp.: | | | |
| 2% 1/11/18 | | 2,340,000 | 2,331,796 |
| 2.6% 1/15/19 | | 1,000,000 | 1,004,726 |
| Bank of Montreal 1.4% 4/10/18 | | 800,000 | 795,859 |
| Bank of Nova Scotia 1.375% 12/18/17 | | 878,000 | 875,782 |
| Bank of Tokyo-Mitsubishi UFJ Ltd.: | | | |
| 1.45% 9/8/17 (a) | | 1,150,000 | 1,145,510 |
| 1.55% 9/9/16 (a) | | 945,000 | 946,200 |
| 1.7% 3/5/18 (a) | | 1,642,000 | 1,632,618 |
| Barclays PLC: | | | |
| 2% 3/16/18 | | 1,000,000 | 980,589 |
| 2.75% 11/8/19 | | 2,000,000 | 1,963,960 |
| 3.25% 1/12/21 | | 928,000 | 894,672 |
| BNP Paribas 2.375% 9/14/17 | | 1,700,000 | 1,716,201 |
| BPCE SA 1.625% 2/10/17 | | 1,080,000 | 1,078,820 |
| Citigroup, Inc.: | | | |
| 1.3% 11/15/16 | | 1,445,000 | 1,444,523 |
| 1.55% 8/14/17 | | 4,105,000 | 4,083,038 |
| 1.5786% 7/25/16 (b) | | 1,642,000 | 1,644,217 |
| 1.7% 4/27/18 | | 780,000 | 771,708 |
| 1.85% 11/24/17 | | 821,000 | 818,360 |
| 2.15% 7/30/18 | | 750,000 | 747,325 |
| 2.5% 9/26/18 | | 1,200,000 | 1,207,720 |
| 2.5% 7/29/19 | | 805,000 | 806,942 |
| Citizens Bank NA: | | | |
| 1.6% 12/4/17 | | 1,642,000 | 1,623,549 |
| 2.45% 12/4/19 | | 1,240,000 | 1,230,245 |
| Commonwealth Bank of Australia 1.125% 3/13/17 | | 1,766,000 | 1,763,921 |
| Credit Suisse New York Branch: | | | |
| 1.1246% 5/26/17 (b) | | 1,642,000 | 1,633,041 |
| 1.375% 5/26/17 | | 4,105,000 | 4,076,540 |
| 1.75% 1/29/18 | | 1,642,000 | 1,631,816 |
| Discover Bank: | | | |
| 2% 2/21/18 | | 2,053,000 | 2,028,247 |
| 2.6% 11/13/18 | | 1,000,000 | 998,992 |
| Fifth Third Bancorp 4.5% 6/1/18 | | 1,027,000 | 1,080,780 |
| Fifth Third Bank 2.15% 8/20/18 | | 963,000 | 967,058 |
| HSBC Bank PLC 1.5% 5/15/18 (a) | | 1,090,000 | 1,083,320 |
| HSBC U.S.A., Inc.: | | | |
| 1.7% 3/5/18 | | 994,000 | 986,612 |
| 2.625% 9/24/18 | | 821,000 | 825,732 |
| Huntington National Bank 2% 6/30/18 | | 1,570,000 | 1,562,148 |
| ING Bank NV 1.8% 3/16/18 (a) | | 1,000,000 | 998,273 |
| Intesa Sanpaolo SpA 2.375% 1/13/17 | | 3,428,000 | 3,438,880 |
| JPMorgan Chase & Co.: | | | |
| 1.35% 2/15/17 | | 6,568,000 | 6,569,885 |
| 2% 8/15/17 | | 1,642,000 | 1,649,497 |
| KeyBank NA 1.7% 6/1/18 | | 1,183,000 | 1,179,504 |
| La Caisse Centrale 1.75% 1/29/18 (a) | | 1,232,000 | 1,223,095 |
| Lloyds Bank PLC 1.75% 3/16/18 | | 1,232,000 | 1,226,231 |
| Mitsubishi UFJ Financial Group, Inc. 2.95% 3/1/21 | | 1,700,000 | 1,714,982 |
| Mitsubishi UFJ Trust & Banking Corp. 1.6% 10/16/17 (a) | | 1,232,000 | 1,224,912 |
| Mizuho Bank Ltd.: | | | |
| 1.0531% 9/25/17 (a)(b) | | 1,642,000 | 1,635,342 |
| 1.55% 10/17/17 (a) | | 2,693,000 | 2,676,635 |
| MUFG Americas Holdings Corp. 1.625% 2/9/18 | | 238,000 | 236,270 |
| MUFG Union Bank NA 1.5% 9/26/16 | | 753,000 | 754,559 |
| Nordea Bank AB 1.875% 9/17/18 (a) | | 1,200,000 | 1,199,116 |
| PNC Bank NA: | | | |
| 1.5% 2/23/18 | | 1,100,000 | 1,097,016 |
| 1.8% 11/5/18 | | 1,500,000 | 1,499,933 |
| Regions Financial Corp.: | | | |
| 2% 5/15/18 | | 1,654,000 | 1,639,334 |
| 3.2% 2/8/21 | | 1,000,000 | 995,154 |
| Royal Bank of Canada: | | | |
| 1.2% 1/23/17 | | 1,036,000 | 1,036,943 |
| 1.5% 1/16/18 | | 1,815,000 | 1,812,448 |
| 2.2% 7/27/18 | | 821,000 | 830,067 |
| Royal Bank of Scotland Group PLC 1.5431% 3/31/17 (b) | | 1,807,000 | 1,801,248 |
| Sumitomo Mitsui Banking Corp.: | | | |
| 1.3% 1/10/17 | | 2,053,000 | 2,051,542 |
| 1.75% 1/16/18 | | 1,642,000 | 1,635,834 |
| 1.8% 7/18/17 | | 1,618,000 | 1,620,173 |
| 2.05% 1/18/19 | | 2,000,000 | 1,999,010 |
| SunTrust Banks, Inc. 3.5% 1/20/17 | | 1,190,000 | 1,210,068 |
| Wells Fargo Bank NA 0.8282% 5/16/16 (b) | | 3,695,000 | 3,695,695 |
| Westpac Banking Corp.: | | | |
| 1.2% 5/19/17 | | 2,217,000 | 2,212,056 |
| 1.5% 12/1/17 | | 1,642,000 | 1,642,355 |
| 2% 8/14/17 | | 1,848,000 | 1,862,267 |
| | | | 108,791,556 |
| Capital Markets - 2.8% | | | |
| Deutsche Bank AG London Branch 1.4% 2/13/17 | | 4,105,000 | 4,078,441 |
| Goldman Sachs Group, Inc.: | | | |
| 1.2882% 5/22/17 (b) | | 1,000,000 | 997,994 |
| 1.748% 9/15/17 | | 2,874,000 | 2,871,853 |
| 2.375% 1/22/18 | | 1,807,000 | 1,817,956 |
| 2.55% 10/23/19 | | 830,000 | 831,504 |
| 2.625% 1/31/19 | | 1,232,000 | 1,241,368 |
| JPMorgan Chase & Co. 1.7% 3/1/18 | | 821,000 | 818,203 |
| Lazard Group LLC 6.85% 6/15/17 | | 28,000 | 29,439 |
| Morgan Stanley: | | | |
| 1.875% 1/5/18 | | 821,000 | 818,955 |
| 2.375% 7/23/19 | | 700,000 | 698,474 |
| 2.45% 2/1/19 | | 2,000,000 | 2,008,188 |
| 2.5% 1/24/19 | | 2,000,000 | 2,010,344 |
| 5.45% 1/9/17 | | 2,792,000 | 2,883,795 |
| UBS AG Stamford Branch: | | | |
| 1.375% 6/1/17 | | 590,000 | 588,512 |
| 1.375% 8/14/17 | | 1,618,000 | 1,611,955 |
| 1.8% 3/26/18 | | 1,174,000 | 1,174,639 |
| | | | 24,481,620 |
| Consumer Finance - 2.1% | | | |
| American Express Credit Corp.: | | | |
| 1.125% 6/5/17 | | 2,053,000 | 2,044,455 |
| 2.8% 9/19/16 | | 797,000 | 805,013 |
| Discover Financial Services 6.45% 6/12/17 | | 2,587,000 | 2,712,987 |
| Ford Motor Credit Co. LLC: | | | |
| 1.461% 3/27/17 | | 1,000,000 | 993,250 |
| 1.684% 9/8/17 | | 1,642,000 | 1,617,938 |
| 2.145% 1/9/18 | | 1,642,000 | 1,633,506 |
| 2.24% 6/15/18 | | 895,000 | 882,060 |
| 3% 6/12/17 | | 2,422,000 | 2,442,308 |
| Hyundai Capital America: | | | |
| 1.45% 2/6/17 (a) | | 1,151,000 | 1,147,167 |
| 2% 3/19/18 (a) | | 821,000 | 817,327 |
| 2.125% 10/2/17 (a) | | 1,196,000 | 1,196,968 |
| 2.875% 8/9/18 (a) | | 583,000 | 587,381 |
| John Deere Capital Corp. 1.6% 7/13/18 | | 279,000 | 279,312 |
| Synchrony Financial: | | | |
| 1.875% 8/15/17 | | 193,000 | 190,894 |
| 2.6% 1/15/19 | | 1,000,000 | 991,730 |
| | | | 18,342,296 |
| Diversified Financial Services - 1.3% | | | |
| AIG Global Funding 1.65% 12/15/17 (a) | | 1,232,000 | 1,229,001 |
| Berkshire Hathaway Finance Corp. 1.6% 5/15/17 | | 1,092,000 | 1,100,222 |
| Berkshire Hathaway, Inc. 1.55% 2/9/18 | | 912,000 | 918,536 |
| GE Capital International Funding Co. 0.964% 4/15/16 (a) | | 6,281,000 | 6,282,124 |
| McGraw Hill Financial, Inc. 2.5% 8/15/18 | | 489,000 | 491,472 |
| Moody's Corp. 2.75% 7/15/19 | | 1,500,000 | 1,528,803 |
| | | | 11,550,158 |
| Insurance - 2.2% | | | |
| ACE INA Holdings, Inc. 2.3% 11/3/20 | | 543,000 | 546,206 |
| AFLAC, Inc. 2.4% 3/16/20 | | 1,000,000 | 1,010,216 |
| American International Group, Inc.: | | | |
| 2.3% 7/16/19 | | 1,983,000 | 1,966,894 |
| 5.85% 1/16/18 | | 979,000 | 1,043,898 |
| Aon Corp.: | | | |
| 3.125% 5/27/16 | | 1,027,000 | 1,031,827 |
| 5% 9/30/20 | | 703,000 | 775,583 |
| Assurant, Inc. 2.5% 3/15/18 | | 920,000 | 920,426 |
| Marsh & McLennan Companies, Inc. 2.55% 10/15/18 | | 963,000 | 985,027 |
| MetLife, Inc.: | | | |
| 1.756% 12/15/17 (b) | | 382,000 | 382,152 |
| 1.903% 12/15/17 (b) | | 166,000 | 166,070 |
| Metropolitan Life Global Funding I: | | | |
| 1.3% 4/10/17 (a) | | 3,284,000 | 3,284,433 |
| 1.5% 1/10/18 (a) | | 2,101,000 | 2,086,249 |
| New York Life Global Funding 1.55% 11/2/18 (a) | | 1,610,000 | 1,603,811 |
| Pricoa Global Funding I: | | | |
| 1.15% 11/25/16 (a) | | 904,000 | 903,652 |
| 1.9% 9/21/18 (a) | | 750,000 | 748,172 |
| Principal Life Global Funding II 2.25% 10/15/18 (a) | | 1,500,000 | 1,516,524 |
| Prudential Financial, Inc. 2.3% 8/15/18 | | 300,000 | 300,802 |
| TIAA Asset Management Finance LLC 2.95% 11/1/19 (a) | | 238,000 | 239,199 |
| | | | 19,511,141 |
| Real Estate Investment Trusts - 0.3% | | | |
| Boston Properties, Inc. 3.7% 11/15/18 | | 825,000 | 854,814 |
| DDR Corp. 9.625% 3/15/16 | | 271,000 | 271,755 |
| ERP Operating LP 2.375% 7/1/19 | | 528,000 | 530,518 |
| Health Care REIT, Inc.: | | | |
| 2.25% 3/15/18 | | 280,000 | 279,264 |
| 4.7% 9/15/17 | | 500,000 | 520,727 |
| Select Income REIT 2.85% 2/1/18 | | 395,000 | 393,721 |
| | | | 2,850,799 |
| Real Estate Management & Development - 0.4% | | | |
| Mack-Cali Realty LP 2.5% 12/15/17 | | 633,000 | 627,113 |
| Ventas Realty LP: | | | |
| 1.25% 4/17/17 | | 405,000 | 401,702 |
| 1.55% 9/26/16 | | 236,000 | 236,109 |
| Ventas Realty LP/Ventas Capital Corp. 2% 2/15/18 | | 572,000 | 569,073 |
| Washington Prime Group LP 3.85% 4/1/20 | | 1,191,000 | 1,227,173 |
| | | | 3,061,170 |
|
| TOTAL FINANCIALS | | | 188,588,740 |
|
| HEALTH CARE - 2.8% | | | |
| Biotechnology - 0.8% | | | |
| AbbVie, Inc.: | | | |
| 1.75% 11/6/17 | | 1,532,000 | 1,531,131 |
| 1.8% 5/14/18 | | 2,061,000 | 2,055,194 |
| 2.5% 5/14/20 | | 1,100,000 | 1,099,267 |
| Amgen, Inc. 1.25% 5/22/17 | | 1,634,000 | 1,630,536 |
| Celgene Corp. 2.125% 8/15/18 | | 718,000 | 721,242 |
| | | | 7,037,370 |
| Health Care Equipment & Supplies - 0.5% | | | |
| Becton, Dickinson & Co. 1.8% 12/15/17 | | 1,129,000 | 1,130,426 |
| Medtronic, Inc. 1.5% 3/15/18 | | 1,358,000 | 1,361,229 |
| Zimmer Biomet Holdings, Inc. 2% 4/1/18 | | 1,563,000 | 1,556,181 |
| | | | 4,047,836 |
| Health Care Providers & Services - 0.5% | | | |
| Cardinal Health, Inc. 1.95% 6/15/18 | | 229,000 | 229,075 |
| Express Scripts Holding Co. 1.25% 6/2/17 | | 2,045,000 | 2,034,405 |
| UnitedHealth Group, Inc. 1.9% 7/16/18 | | 1,400,000 | 1,413,079 |
| WellPoint, Inc. 1.875% 1/15/18 | | 532,000 | 530,894 |
| | | | 4,207,453 |
| Life Sciences Tools & Services - 0.1% | | | |
| Thermo Fisher Scientific, Inc.: | | | |
| 1.3% 2/1/17 | | 253,000 | 252,103 |
| 2.15% 12/14/18 | | 398,000 | 398,178 |
| | | | 650,281 |
| Pharmaceuticals - 0.9% | | | |
| Actavis Funding SCS: | | | |
| 1.582% 3/12/18 (b) | | 2,053,000 | 2,058,933 |
| 2.35% 3/12/18 | | 1,642,000 | 1,651,919 |
| 3% 3/12/20 | | 687,000 | 698,825 |
| Bayer U.S. Finance LLC: | | | |
| 1.5% 10/6/17 (a) | | 1,710,000 | 1,713,107 |
| 2.375% 10/8/19 (a) | | 1,100,000 | 1,115,710 |
| Mylan, Inc. 1.35% 11/29/16 | | 299,000 | 296,936 |
| Perrigo Co. PLC 1.3% 11/8/16 | | 302,000 | 300,249 |
| Zoetis, Inc.: | | | |
| 1.875% 2/1/18 | | 143,000 | 141,460 |
| 3.45% 11/13/20 | | 223,000 | 227,164 |
| | | | 8,204,303 |
|
| TOTAL HEALTH CARE | | | 24,147,243 |
|
| INDUSTRIALS - 0.8% | | | |
| Aerospace & Defense - 0.4% | | | |
| L-3 Communications Corp. 1.5% 5/28/17 | | 813,000 | 802,103 |
| Lockheed Martin Corp. 1.85% 11/23/18 | | 2,830,000 | 2,848,186 |
| | | | 3,650,289 |
| Industrial Conglomerates - 0.3% | | | |
| Danaher Corp. 1.65% 9/15/18 | | 1,842,000 | 1,852,886 |
| Roper Technologies, Inc. 2.05% 10/1/18 | | 750,000 | 746,286 |
| | | | 2,599,172 |
| Trading Companies & Distributors - 0.1% | | | |
| Air Lease Corp. 2.125% 1/15/18 | | 405,000 | 395,381 |
|
| TOTAL INDUSTRIALS | | | 6,644,842 |
|
| INFORMATION TECHNOLOGY - 1.0% | | | |
| Communications Equipment - 0.1% | | | |
| Cisco Systems, Inc. 1.65% 6/15/18 | | 1,200,000 | 1,208,519 |
| Electronic Equipment & Components - 0.5% | | | |
| Amphenol Corp. 1.55% 9/15/17 | | 1,394,000 | 1,390,236 |
| Tyco Electronics Group SA: | | | |
| 2.375% 12/17/18 | | 185,000 | 185,821 |
| 6.55% 10/1/17 | | 2,775,000 | 2,979,487 |
| | | | 4,555,544 |
| IT Services - 0.2% | | | |
| The Western Union Co.: | | | |
| 2.875% 12/10/17 | | 915,000 | 930,840 |
| 3.65% 8/22/18 | | 522,000 | 532,946 |
| | | | 1,463,786 |
| Technology Hardware, Storage & Peripherals - 0.2% | | | |
| Hewlett Packard Enterprise Co. 2.85% 10/5/18 (a) | | 2,000,000 | 2,000,658 |
|
| TOTAL INFORMATION TECHNOLOGY | | | 9,228,507 |
|
| MATERIALS - 0.7% | | | |
| Chemicals - 0.5% | | | |
| Chevron Phillips Chemical Co. LLC / Chevron Phillips Chemical Co. LP 1.7% 5/1/18 (a) | | 1,970,000 | 1,935,789 |
| Ecolab, Inc.: | | | |
| 1.45% 12/8/17 | | 488,000 | 485,559 |
| 1.55% 1/12/18 | | 1,642,000 | 1,634,971 |
| | | | 4,056,319 |
| Metals & Mining - 0.2% | | | |
| Anglo American Capital PLC 1.572% 4/15/16 (a)(b) | | 966,000 | 952,028 |
| Freeport-McMoRan, Inc. 2.3% 11/14/17 | | 549,000 | 502,335 |
| Rio Tinto Finance (U.S.A.) PLC 1.3658% 6/17/16 (b) | | 821,000 | 818,698 |
| | | | 2,273,061 |
|
| TOTAL MATERIALS | | | 6,329,380 |
|
| TELECOMMUNICATION SERVICES - 2.8% | | | |
| Diversified Telecommunication Services - 2.3% | | | |
| AT&T, Inc.: | | | |
| 1.4% 12/1/17 | | 904,000 | 899,628 |
| 2.45% 6/30/20 | | 823,000 | 819,758 |
| 2.95% 5/15/16 | | 986,000 | 989,758 |
| BellSouth Corp. 4.821% 4/26/16 (a)(b) | | 1,500,000 | 1,508,922 |
| British Telecommunications PLC: | | | |
| 1.25% 2/14/17 | | 2,298,000 | 2,295,082 |
| 1.625% 6/28/16 | | 1,515,000 | 1,517,459 |
| 2.35% 2/14/19 | | 1,774,000 | 1,790,793 |
| CenturyLink, Inc. 5.15% 6/15/17 | | 904,000 | 926,600 |
| Deutsche Telekom International Financial BV: | | | |
| 3.125% 4/11/16 (a) | | 993,000 | 995,056 |
| 5.75% 3/23/16 | | 1,642,000 | 1,646,566 |
| Verizon Communications, Inc.: | | | |
| 1.35% 6/9/17 | | 1,279,000 | 1,278,336 |
| 2% 11/1/16 | | 2,239,000 | 2,251,482 |
| 2.5% 9/15/16 | | 3,081,000 | 3,104,785 |
| | | | 20,024,225 |
| Wireless Telecommunication Services - 0.5% | | | |
| America Movil S.A.B. de CV: | | | |
| 1.502% 9/12/16 (b) | | 986,000 | 986,106 |
| 2.375% 9/8/16 | | 1,258,000 | 1,263,462 |
| Vodafone Group PLC: | | | |
| 1.5% 2/19/18 | | 821,000 | 813,202 |
| 1.625% 3/20/17 | | 1,184,000 | 1,188,787 |
| | | | 4,251,557 |
|
| TOTAL TELECOMMUNICATION SERVICES | | | 24,275,782 |
|
| UTILITIES - 2.9% | | | |
| Electric Utilities - 1.9% | | | |
| American Electric Power Co., Inc. 1.65% 12/15/17 | | 1,260,000 | 1,251,339 |
| Duke Energy Corp.: | | | |
| 0.9922% 4/3/17 (b) | | 2,469,000 | 2,450,944 |
| 1.625% 8/15/17 | | 495,000 | 494,581 |
| 2.1% 6/15/18 | | 1,000,000 | 1,002,077 |
| Eversource Energy 1.45% 5/1/18 | | 239,000 | 236,148 |
| Exelon Corp.: | | | |
| 1.55% 6/9/17 | | 155,000 | 154,249 |
| 2.85% 6/15/20 | | 228,000 | 229,935 |
| FirstEnergy Corp. 2.75% 3/15/18 | | 2,632,000 | 2,658,817 |
| NextEra Energy Capital Holdings, Inc. 1.586% 6/1/17 | | 1,500,000 | 1,497,512 |
| Pacific Gas & Electric Co. 5.625% 11/30/17 | | 1,457,000 | 1,554,339 |
| Public Service Electric & Gas Co. 2.3% 9/15/18 | | 1,000,000 | 1,014,802 |
| TECO Finance, Inc. 1.2169% 4/10/18 (b) | | 2,200,000 | 2,168,863 |
| Xcel Energy, Inc. 0.75% 5/9/16 | | 1,807,000 | 1,805,901 |
| | | | 16,519,507 |
| Independent Power and Renewable Electricity Producers - 0.2% | | | |
| Southern Power Co.: | | | |
| 1.5% 6/1/18 | | 1,173,000 | 1,154,680 |
| 1.85% 12/1/17 | | 321,000 | 321,060 |
| | | | 1,475,740 |
| Multi-Utilities - 0.8% | | | |
| Berkshire Hathaway Energy Co. 1.1% 5/15/17 | | 2,150,000 | 2,143,759 |
| Dominion Resources, Inc.: | | | |
| 1.4% 9/15/17 | | 697,000 | 692,487 |
| 1.9% 6/15/18 | | 1,261,000 | 1,254,425 |
| 1.95% 8/15/16 | | 697,000 | 698,757 |
| 2.5% 12/1/19 | | 1,029,000 | 1,036,817 |
| 2.9031% 9/30/66 (b) | | 1,097,000 | 737,240 |
| Wisconsin Energy Corp. 1.65% 6/15/18 | | 456,000 | 455,163 |
| | | | 7,018,648 |
|
| TOTAL UTILITIES | | | 25,013,895 |
|
| TOTAL NONCONVERTIBLE BONDS | | | |
| (Cost $370,359,482) | | | 368,798,933 |
|
| U.S. Government and Government Agency Obligations - 28.3% | | | |
| U.S. Government Agency Obligations - 2.0% | | | |
| Fannie Mae: | | | |
| 1% 2/26/19 | | $10,421,000 | $10,408,161 |
| 1.125% 7/20/18 | | 2,073,000 | 2,081,758 |
| 1.125% 12/14/18 | | 158,000 | 158,522 |
| 1.875% 9/18/18 | | 114,000 | 116,614 |
| Freddie Mac: | | | |
| 0.5% 1/27/17 | | 2,668,000 | 2,661,591 |
| 1% 12/15/17 | | 2,209,000 | 2,213,389 |
|
| TOTAL U.S. GOVERNMENT AGENCY OBLIGATIONS | | | 17,640,035 |
|
| U.S. Treasury Obligations - 26.3% | | | |
| U.S. Treasury Notes: | | | |
| 0.5% 7/31/17 | | 22,000,000 | 21,916,642 |
| 0.75% 2/15/19 (c) | | 96,783,000 | 96,333,149 |
| 0.875% 10/15/17 | | 32,187,500 | 32,228,990 |
| 1% 5/15/18 | | 39,155,000 | 39,297,250 |
| 1.125% 1/15/19 | | 15,658,000 | 15,756,473 |
| 1.375% 2/28/19 | | 13,945,600 | 14,128,092 |
| 1.375% 3/31/20 | | 10,000,000 | 10,088,670 |
|
| TOTAL U.S. TREASURY OBLIGATIONS | | | 229,749,266 |
|
| TOTAL U.S. GOVERNMENT AND GOVERNMENT AGENCY OBLIGATIONS | | | |
| (Cost $247,152,584) | | | 247,389,301 |
|
| U.S. Government Agency - Mortgage Securities - 2.6% | | | |
| Fannie Mae - 1.7% | | | |
| 2.388% 2/1/35 (b) | | 251,024 | 263,177 |
| 2.406% 11/1/34 (b) | | 133,884 | 140,050 |
| 2.409% 10/1/35 (b) | | 285,697 | 299,254 |
| 2.45% 11/1/36 (b) | | 312,284 | 328,530 |
| 2.457% 2/1/44 (b) | | 120,688 | 124,293 |
| 2.467% 5/1/35 (b) | | 222,781 | 234,933 |
| 2.468% 1/1/40 (b) | | 252,080 | 265,227 |
| 2.471% 3/1/40 (b) | | 186,471 | 197,069 |
| 2.489% 12/1/33 (b) | | 127,645 | 134,680 |
| 2.501% 4/1/44 (b) | | 202,633 | 208,545 |
| 2.51% 7/1/35 (b) | | 807,306 | 852,556 |
| 2.523% 10/1/41 (b) | | 345,174 | 365,124 |
| 2.524% 2/1/44 (b) | | 119,090 | 122,605 |
| 2.543% 1/1/44 (b) | | 197,316 | 203,440 |
| 2.557% 3/1/40 (b) | | 134,778 | 142,166 |
| 2.557% 6/1/42 (b) | | 93,416 | 96,229 |
| 2.592% 5/1/44 (b) | | 230,153 | 236,817 |
| 2.595% 4/1/35 (b) | | 78,055 | 82,182 |
| 2.628% 5/1/44 (b) | | 319,327 | 329,243 |
| 2.674% 12/1/34 (b) | | 118,918 | 125,879 |
| 2.68% 9/1/41 (b) | | 488,541 | 517,224 |
| 2.685% 12/1/39 (b) | | 67,329 | 71,194 |
| 2.686% 4/1/44 (b) | | 492,261 | 507,671 |
| 2.689% 2/1/42 (b) | | 569,582 | 592,185 |
| 2.761% 1/1/42 (b) | | 492,164 | 512,197 |
| 2.791% 8/1/41 (b) | | 398,075 | 421,670 |
| 2.951% 11/1/40 (b) | | 62,162 | 64,535 |
| 2.965% 8/1/41 (b) | | 83,465 | 87,313 |
| 2.98% 9/1/41 (b) | | 75,129 | 78,564 |
| 2.991% 10/1/41 (b) | | 39,817 | 41,585 |
| 3.249% 7/1/41 (b) | | 99,639 | 104,101 |
| 3.347% 10/1/41 (b) | | 57,817 | 60,705 |
| 3.5% 1/1/26 to 9/1/29 | | 3,803,095 | 4,049,774 |
| 3.553% 7/1/41 (b) | | 125,862 | 132,354 |
| 4.5% 6/1/19 to 7/1/20 | | 146,719 | 152,083 |
| 5.5% 11/1/17 to 11/1/34 | | 2,417,521 | 2,690,371 |
| 6.5% 6/1/16 | | 224 | 225 |
| 7% 4/1/17 to 11/1/18 | | 2,851 | 2,912 |
|
| TOTAL FANNIE MAE | | | 14,838,662 |
|
| Freddie Mac - 0.9% | | | |
| 2.362% 10/1/42 (b) | | 523,160 | 552,432 |
| 2.413% 4/1/40 (b) | | 144,642 | 152,484 |
| 2.463% 11/1/35 (b) | | 169,307 | 177,223 |
| 2.53% 4/1/40 (b) | | 133,147 | 140,560 |
| 2.576% 8/1/36 (b) | | 88,522 | 93,241 |
| 2.977% 8/1/41 (b) | | 237,825 | 252,061 |
| 3% 8/1/21 | | 628,150 | 655,937 |
| 3.122% 9/1/41 (b) | | 150,070 | 157,785 |
| 3.208% 9/1/41 (b) | | 72,265 | 75,519 |
| 3.216% 4/1/41 (b) | | 72,786 | 76,084 |
| 3.297% 6/1/41 (b) | | 80,099 | 83,711 |
| 3.451% 5/1/41 (b) | | 60,441 | 62,888 |
| 3.5% 8/1/26 | | 1,912,987 | 2,032,549 |
| 3.626% 6/1/41 (b) | | 113,282 | 118,754 |
| 3.706% 5/1/41 (b) | | 93,100 | 97,736 |
| 4% 6/1/24 to 4/1/26 | | 2,216,479 | 2,365,389 |
| 4.5% 8/1/18 to 11/1/18 | | 424,978 | 438,630 |
| 8.5% 5/1/26 to 7/1/28 | | 29,070 | 34,782 |
|
| TOTAL FREDDIE MAC | | | 7,567,765 |
|
| Ginnie Mae - 0.0% | | | |
| 5.5% 6/15/35 | | 235,294 | 265,507 |
| 7% 1/15/25 to 6/15/32 | | 142,602 | 170,027 |
|
| TOTAL GINNIE MAE | | | 435,534 |
|
| TOTAL U.S. GOVERNMENT AGENCY - MORTGAGE SECURITIES | | | |
| (Cost $22,452,375) | | | 22,841,961 |
|
| Asset-Backed Securities - 14.3% | | | |
| Accredited Mortgage Loan Trust: | | | |
| Series 2003-3 Class A1, 5.21% 1/25/34 (AMBAC Insured) | | $203,153 | $196,041 |
| Series 2005-1 Class M1, 1.1266% 4/25/35 (b) | | 69,143 | 61,763 |
| Ally Auto Receivables Trust: | | | |
| Series 2014-SN1 Class A3, 0.75% 2/21/17 | | 643,504 | 643,261 |
| Series 2015-1 Class A3, 1.39% 9/16/19 | | 1,110,000 | 1,111,823 |
| Series 2015-SN1 Class A3, 1.21% 12/20/17 | | 457,000 | 456,857 |
| Ally Master Owner Trust: | | | |
| Series 2012-4 Class A, 1.72% 7/15/19 | | 544,000 | 545,149 |
| Series 2012-5 Class A, 1.54% 9/15/19 | | 2,291,000 | 2,291,580 |
| Series 2014-3 Class A, 1.33% 3/15/19 | | 3,918,000 | 3,916,309 |
| Series 2014-4 Class A2, 1.43% 6/17/19 | | 1,971,000 | 1,970,064 |
| Series 2014-5 Class A2, 1.6% 10/15/19 | | 2,053,000 | 2,054,329 |
| Series 2015-3 Class A, 1.63% 5/15/20 | | 1,570,000 | 1,569,835 |
| American Express Credit Account Master Trust: | | | |
| Series 2014-2 Class A, 1.26% 1/15/20 | | 1,610,000 | 1,614,136 |
| Series 2014-3 Class A, 1.49% 4/15/20 | | 2,462,886 | 2,475,895 |
| Series 2014-4 Class A, 1.43% 6/15/20 | | 2,422,000 | 2,432,247 |
| AmeriCredit Automobile Receivables Trust: | | | |
| Series 2013-5 Class A3, 0.9% 9/10/18 | | 648,057 | 647,324 |
| Series 2014-1 Class A3, 0.9% 2/8/19 | | 597,130 | 595,948 |
| Series 2014-2 Class A3, 0.94% 2/8/19 | | 1,626,000 | 1,623,011 |
| Series 2014-4 Class A3, 1.27% 7/8/19 | | 414,000 | 413,108 |
| Series 2015-2 Class A3, 1.27% 1/8/20 | | 1,500,000 | 1,491,440 |
| Series 2016-1 Class A3, 2.14% 10/8/20 | | 856,000 | 858,896 |
| Ameriquest Mortgage Securities, Inc. pass-thru certificates Series 2004-R2 Class M3, 1.2608% 4/25/34 (b) | | 11,399 | 8,320 |
| Argent Securities, Inc. pass-thru certificates: | | | |
| Series 2003-W7 Class A2, 1.2158% 3/25/34 (b) | | 67,779 | 60,158 |
| Series 2006-W4 Class A2C, 0.5958% 5/25/36 (b) | | 145,128 | 51,441 |
| Bank of America Credit Card Master Trust Series 2015-A2 Class A, 1.36% 9/15/20 | | 1,985,000 | 1,989,706 |
| BMV Vehicle Lease Trust Series 2014-1 Class A3, 0.73% 2/21/17 | | 698,354 | 697,964 |
| BMW Vehicle Lease Trust Series 2015-1 Class A3, 1.24% 12/20/17 | | 1,232,000 | 1,232,467 |
| Capital Auto Receivables Asset Trust: | | | |
| Series 2014-2 Class A2, 0.91% 4/20/17 | | 285,174 | 285,174 |
| Series 2014-3 Class A2, 1.18% 12/20/17 | | 1,204,000 | 1,203,451 |
| Series 2015-1 Class A2, 1.42% 6/20/18 | | 1,209,000 | 1,210,036 |
| Series 2015-2 Class A2, 1.39% 9/20/18 | | 822,000 | 822,637 |
| Capital One Multi-Asset Execution Trust: | | | |
| Series 2014-A5 Class A, 1.48% 7/15/20 | | 1,979,000 | 1,987,938 |
| Series 2015-A1 Class A, 1.39% 1/15/21 | | 1,940,000 | 1,947,289 |
| Series 2015-A5 Class A5, 1.6% 5/17/21 | | 1,500,000 | 1,509,753 |
| Carmax Auto Owner Trust: | | | |
| Series 2014-4 Class A3, 1.25% 11/15/19 | | 1,242,000 | 1,241,187 |
| Series 2015-3 Class A3, 1.63% 5/15/20 | | 761,000 | 764,801 |
| Carrington Mortgage Loan Trust Series 2007-RFC1 Class A3, 0.5758% 12/25/36 (b) | | 228,766 | 155,643 |
| CFC LLC Series 2014-1A Class A, 1.46% 12/17/18 (a) | | 164,614 | 164,428 |
| Chase Issuance Trust: | | | |
| Series 2014-A1 Class A, 1.15% 1/15/19 | | 1,232,000 | 1,234,414 |
| Series 2014-A7 Class A, 1.38% 11/15/19 | | 2,064,000 | 2,072,718 |
| Series 2015-A2, Class A, 1.59% 2/18/20 | | 1,416,000 | 1,425,694 |
| Chrysler Capital Auto Receivables Trust Series 2015-AA Class A3, 1.22% 7/15/19 (a) | | 2,500,000 | 2,494,204 |
| CIT Equipment Collateral: | | | |
| Series 2013-VT1 Class A3, 1.13% 7/20/20 (a) | | 818,252 | 818,323 |
| Series 2014-VT1 Class A3, 1.5% 10/21/19 (a) | | 1,239,653 | 1,235,551 |
| Citibank Credit Card Issuance Trust: | | | |
| Series 2014-A2 Class A2, 1.02% 2/22/19 | | 1,774,000 | 1,773,835 |
| Series 2014-A4 Class A4, 1.23% 4/24/19 | | 1,642,000 | 1,645,227 |
| Series 2014-A8 Class A8, 1.73% 4/9/20 | | 1,585,000 | 1,599,683 |
| Countrywide Home Loans, Inc.: | | | |
| Series 2003-BC1 Class B1, 5.6858% 3/25/32 (b) | | 7,098 | 6,488 |
| Series 2004-2 Class 3A4, 0.9358% 7/25/34 (b) | | 51,255 | 41,443 |
| Series 2004-3 Class M4, 1.8908% 4/25/34 (b) | | 7,947 | 6,960 |
| Series 2004-4 Class M2, 1.2308% 6/25/34 (b) | | 10,245 | 9,264 |
| Dell Equipment Finance Trust: | | | |
| Series 2014-1 Class A3, 0.94% 6/22/20 (a) | | 603,917 | 603,630 |
| Series 2015-1 Class A3, 1.3% 3/23/20 (a) | | 800,000 | 796,870 |
| Series 2015-2 Class A2A, 1.42% 12/22/17 (a) | | 1,000,000 | 998,147 |
| Discover Card Master Trust: | | | |
| Series 2012-A6 Class A6, 1.67% 1/18/22 | | 1,485,000 | 1,494,018 |
| Series 2013-A5 Class A5, 1.04% 4/15/19 | | 359,000 | 359,383 |
| Series 2014-A5 Class A, 1.39% 4/15/20 | | 1,651,000 | 1,657,314 |
| Series 2015-A2 Class A, 1.9% 10/17/22 | | 2,000,000 | 2,008,554 |
| Series 2016-A1 Class A1, 2.1% 7/15/21 | | 1,630,000 | 1,638,228 |
| Enterprise Fleet Financing LLC: | | | |
| Series 2014-1 Class A2, 0.87% 9/20/19 (a) | | 713,439 | 711,074 |
| Series 2014-2 Class A2, 1.05% 3/20/20 (a) | | 1,669,805 | 1,660,982 |
| Series 2015-1 Class A2, 1.3% 9/20/20 (a) | | 1,515,401 | 1,505,294 |
| Fannie Mae Series 2004-T5: | | | |
| Class AB1, 0.6969% 5/28/35 (b) | | 130,399 | 120,283 |
| Class AB3, 1.1189% 5/28/35 (b) | | 55,367 | 48,076 |
| Fieldstone Mortgage Investment Corp. Series 2004-3 Class M5, 2.6015% 8/25/34 (b) | | 36,914 | 34,862 |
| Flagship Credit Auto Trust Series 2016-1 Class A, 2.53% 12/15/20 (a) | | 2,000,000 | 1,995,196 |
| Ford Credit Auto Lease Trust Series 2015-A Class A3, 1.13% 6/15/18 | | 1,500,000 | 1,498,631 |
| Ford Credit Auto Owner Trust Series 2015-C Class A3, 1.41% 2/15/20 | | 1,169,000 | 1,173,236 |
| Ford Credit Floorplan Master Owner Trust: | | | |
| Series 2012-5 Class A, 1.49% 9/15/19 | | 4,516,000 | 4,524,317 |
| Series 2014-1 Class A1, 1.2% 2/15/19 | | 2,677,000 | 2,671,639 |
| Series 2014-4 Class A1, 1.4% 8/15/19 | | 3,614,000 | 3,616,439 |
| Series 2015-4 Class A1, 1.77% 8/15/20 | | 1,580,000 | 1,581,588 |
| Fremont Home Loan Trust: | | | |
| Series 2004-D: | | | |
| Class M4, 1.8515% 11/25/34 (b) | | 85,621 | 9,082 |
| Class M5, 1.9265% 11/25/34 (b) | | 24,561 | 442 |
| Series 2005-A: | | | |
| Class M3, 1.1615% 1/25/35 (b) | | 120,398 | 104,393 |
| Class M4, 1.4465% 1/25/35 (b) | | 44,055 | 23,658 |
| GCO Education Loan Funding Master Trust II Series 2007-1A Class C1L, 1.0091% 2/25/47 (a)(b) | | 127,452 | 112,838 |
| GM Financial Automobile Leasing Trust: | | | |
| Series 2014-1A Class A3, 1.01% 5/22/17 (a) | | 958,542 | 958,295 |
| Series 2014-2A Class A3, 1.22% 1/22/18 (a) | | 1,600,000 | 1,600,061 |
| Series 2015-1 Class A3, 1.53% 9/20/18 | | 1,367,000 | 1,375,704 |
| Series 2015-2 Class A3, 1.68% 12/20/18 | | 1,164,000 | 1,167,452 |
| GMF Floorplan Owner Revolving Trust Series 2015-1 Class A1, 1.65% 5/15/20 (a) | | 1,900,000 | 1,895,666 |
| Home Equity Asset Trust: | | | |
| Series 2003-5 Class A2, 1.1358% 12/25/33 (b) | | 36,254 | 33,534 |
| Series 2004-1 Class M2, 2.1358% 6/25/34 (b) | | 43,293 | 37,672 |
| HSI Asset Securitization Corp. Trust Series 2007-HE1 Class 2A3, 0.6165% 1/25/37 (b) | | 128,988 | 82,715 |
| Hyundai Auto Lease Securitization Trust: | | | |
| Series 2014-B Class A3, 0.98% 11/15/17 (a) | | 1,642,000 | 1,641,120 |
| Series 2015-A Class A3, 1.42% 9/17/18 (a) | | 1,232,000 | 1,234,126 |
| Series 2015-B Class A3, 1.4% 11/15/18 (a) | | 1,479,000 | 1,479,519 |
| Hyundai Auto Receivables Trust Series 2015-C Class A3, 1.46% 2/18/20 | | 1,159,000 | 1,163,133 |
| Hyundai Floorplan Master Owner Trust Series 2013-1A Class A, 0.7805% 5/15/18 (a)(b) | | 1,380,000 | 1,379,177 |
| JPMorgan Mortgage Acquisition Trust Series 2007-CH1 Class AV4, 0.5658% 11/25/36 (b) | | 5,184 | 5,182 |
| KeyCorp Student Loan Trust Series 1999-A Class A2, 0.9331% 12/27/29 (b) | | 8,619 | 8,574 |
| MASTR Asset Backed Securities Trust Series 2007-HE1 Class M1, 0.7265% 5/25/37 (b) | | 39,729 | 1,250 |
| Mercedes Benz Auto Lease Trust Series 2015-B Class A3, 1.34% 7/16/18 | | 800,000 | 800,560 |
| Mercedes-Benz Auto Lease Trust Series 2015-A Class A3, 1.1% 8/15/17 | | 1,631,000 | 1,631,363 |
| Merrill Lynch Mortgage Investors Trust: | | | |
| Series 2006-FM1 Class A2B, 0.5458% 4/25/37 (b) | | 10,603 | 10,542 |
| Series 2006-OPT1 Class A1A, 0.9465% 6/25/35 (b) | | 79,011 | 75,668 |
| Morgan Stanley ABS Capital I Trust: | | | |
| Series 2004-HE6 Class A2, 1.1158% 8/25/34 (b) | | 113,943 | 99,032 |
| Series 2004-NC8 Class M6, 2.3108% 9/25/34 (b) | | 39,499 | 36,416 |
| Series 2005-NC1 Class M1, 1.0958% 1/25/35 (b) | | 31,108 | 27,722 |
| Series 2005-NC2 Class B1, 2.1908% 3/25/35 (b) | | 21,258 | 476 |
| Nationstar HECM Loan Trust Series 2016-1A Class A, 3.1294% 2/25/26 (a) | | 1,000,000 | 999,999 |
| Nissan Auto Lease Trust Series 2014-A Class A3, 0.8% 2/15/17 | | 696,905 | 696,681 |
| Nissan Auto Receivables Owner Trust: | | | |
| Series 2015-C Class A3, 1.37% 5/15/20 | | 1,147,000 | 1,150,512 |
| Series 2016-A Class A3, 1.34% 10/15/20 | | 923,000 | 923,202 |
| Nissan Master Owner Trust Receivables Series 2015-A Class A2, 1.44% 1/15/20 | | 1,642,000 | 1,643,030 |
| Northstar Education Finance, Inc., Delaware Series 2005-1 Class A5, 1.0732% 10/30/45 (b) | | 374,960 | 353,400 |
| Park Place Securities, Inc.: | | | |
| Series 2004-WCW1: | | | |
| Class M3, 2.3015% 9/25/34 (b) | | 654,824 | 596,334 |
| Class M4, 2.6015% 9/25/34 (b) | | 892,159 | 601,916 |
| Series 2005-WCH1 Class M4, 1.6715% 1/25/36 (b) | | 153,762 | 135,046 |
| Salomon Brothers Mortgage Securities VII, Inc. Series 2003-HE1 Class A, 1.2265% 4/25/33 (b) | | 648 | 554 |
| Santander Drive Auto Receivables Trust Series 2014-4 Class B, 1.82% 5/15/19 | | 754,000 | 754,363 |
| Saxon Asset Securities Trust Series 2004-1 Class M1, 1.2308% 3/25/35 (b) | | 91,646 | 84,361 |
| SLM Private Credit Student Loan Trust: | | | |
| Series 2004-A: | | | |
| Class B, 1.092% 6/15/33 (b) | | 169,822 | 160,339 |
| Class C, 1.462% 6/15/33 (b) | | 429,920 | 419,108 |
| Series 2004-B: | | | |
| Class A2, 0.712% 6/15/21 (b) | | 275,845 | 273,857 |
| Class C, 1.382% 9/15/33 (b) | | 526,826 | 495,733 |
| Structured Asset Investment Loan Trust Series 2004-8 Class M5, 2.1608% 9/25/34 (b) | | 5,211 | 4,394 |
| Synchrony Credit Card Master Note Trust: | | | |
| Series 2015-2 Class A, 1.6% 4/15/21 | | 1,580,000 | 1,584,028 |
| Series 2015-3 class A, 1.74% 9/15/21 | | 1,000,000 | 999,940 |
| Terwin Mortgage Trust Series 2003-4HE Class A1, 1.2865% 9/25/34 (b) | | 71,344 | 60,096 |
| Volkswagen Auto Lease Trust: | | | |
| Series 2014-A Class A3, 0.8% 4/20/17 | | 798,916 | 797,220 |
| Series 2015-A Class A3, 1.25% 12/20/17 | | 510,000 | 506,645 |
| Volkswagen Auto Loan Enhanced Trust: | | | |
| Series 2013-2 Class A3, 0.7% 4/20/18 | | 1,044,785 | 1,039,331 |
| Series 2014-1 Class A3, 0.91% 10/22/18 | | 1,032,632 | 1,027,289 |
| Volkswagen Credit Auto Master Trust Series 2014-1A Class A2, 1.4% 7/22/19 (a) | | 1,020,000 | 1,008,550 |
| Volvo Financial Equipment LLC Series 2015-1A Class A3, 1.51% 6/17/19 (a) | | 1,289,000 | 1,291,704 |
| World Omni Auto Receivables Trust Series 2014-B Class A3, 1.14% 1/15/20 | | 1,509,000 | 1,507,645 |
| World Omni Automobile Lease Securitization Trust Series 2015-A Class A3, 1.54% 10/15/18 | | 1,180,000 | 1,182,244 |
| TOTAL ASSET-BACKED SECURITIES | | | |
| (Cost $124,829,779) | | | 124,655,867 |
|
| Collateralized Mortgage Obligations - 0.8% | | | |
| Private Sponsor - 0.2% | | | |
| BCAP LLC II Trust Series 2012-RR10 Class 5A5, 0.6868% 4/26/36 (a)(b) | | 285,466 | 279,063 |
| Credit Suisse Mortgage Trust Series 2012-2R Class 1A1, 2.7362% 5/27/35 (a)(b) | | 487,807 | 500,392 |
| MASTR Adjustable Rate Mortgages Trust Series 2007-3 Class 22A2, 0.6365% 5/25/47 (b) | | 42,964 | 39,407 |
| Merrill Lynch Alternative Note Asset Trust floater Series 2007-OAR1 Class A1, 0.6058% 2/25/37 (b) | | 59,471 | 52,631 |
| Nationstar HECM Loan Trust sequential payer Series 2015-2A Class A, 2.8826% 11/25/25 (a) | | 710,224 | 709,869 |
| RESI Finance LP/RESI Finance DE Corp. floater Series 2003-B Class B5, 2.7735% 6/10/35 (a)(b) | | 21,002 | 18,687 |
| Sequoia Mortgage Trust floater Series 2004-6 Class A3B, 1.675% 7/20/34 (b) | | 2,825 | 2,754 |
|
| TOTAL PRIVATE SPONSOR | | | 1,602,803 |
|
| U.S. Government Agency - 0.6% | | | |
| Fannie Mae: | | | |
| pass-thru certificates Series 2012-127 Class DH, 4% 11/25/27 | | 507,546 | 536,987 |
| planned amortization class Series 2012-94 Class E, 3% 6/25/22 | | 307,558 | 314,929 |
| sequential payer: | | | |
| Series 2001-40 Class Z, 6% 8/25/31 | | 128,719 | 146,533 |
| Series 2009-31 Class A, 4% 2/25/24 | | 55,952 | 57,091 |
| Freddie Mac: | | | |
| planned amortization class Series 3820 Class DA, 4% 11/15/35 | | 417,536 | 437,272 |
| Series 3949 Class MK, 4.5% 10/15/34 | | 316,739 | 343,341 |
| Series 4221-CLS Class GA, 1.4% 7/15/23 | | 1,417,281 | 1,406,561 |
| Ginnie Mae guaranteed REMIC pass-thru certificates Series 2015-H17 Class HA, 2.5% 5/20/65 (d) | | 1,920,609 | 1,960,989 |
|
| TOTAL U.S. GOVERNMENT AGENCY | | | 5,203,703 |
|
| TOTAL COLLATERALIZED MORTGAGE OBLIGATIONS | | | |
| (Cost $6,807,200) | | | 6,806,506 |
|
| Commercial Mortgage Securities - 7.1% | | | |
| Asset Securitization Corp. Series 1997-D5 Class PS1, 1.5885% 2/14/43 (b)(e) | | 145,163 | 1,049 |
| Banc of America Commercial Mortgage Trust: | | | |
| sequential payer Series 2006-4 Class A4, 5.634% 7/10/46 | | 461,879 | 462,751 |
| Series 2006-4 Class A1A, 5.617% 7/10/46 (b) | | 1,421,335 | 1,431,173 |
| Barclays Commercial Mortgage Securities LLC floater Series 2015-RRI Class A, 1.5755% 5/15/32 (a)(b) | | 1,028,000 | 1,011,966 |
| Bayview Commercial Asset Trust: | | | |
| floater: | | | |
| Series 2003-2 Class M1, 1.7108% 12/25/33 (a)(b) | | 3,636 | 3,230 |
| Series 2005-4A: | | | |
| Class A2, 0.8258% 1/25/36 (a)(b) | | 383,000 | 327,037 |
| Class B1, 1.8358% 1/25/36 (a)(b) | | 15,376 | 10,591 |
| Class M1, 0.8858% 1/25/36 (a)(b) | | 120,460 | 95,606 |
| Class M2, 0.9058% 1/25/36 (a)(b) | | 55,680 | 42,875 |
| Class M3, 0.9358% 1/25/36 (a)(b) | | 59,841 | 44,206 |
| Class M4, 1.0458% 1/25/36 (a)(b) | | 30,621 | 22,124 |
| Class M5, 1.0858% 1/25/36 (a)(b) | | 30,621 | 22,182 |
| Class M6, 1.1358% 1/25/36 (a)(b) | | 31,074 | 22,584 |
| Series 2006-3A Class M4, 0.8658% 10/25/36 (a)(b) | | 3,813 | 420 |
| Series 2007-1 Class A2, 0.7058% 3/25/37 (a)(b) | | 183,654 | 155,330 |
| Series 2007-2A: | | | |
| Class A1, 0.7058% 7/25/37 (a)(b) | | 41,423 | 34,766 |
| Class A2, 0.7558% 7/25/37 (a)(b) | | 38,797 | 30,714 |
| Class M1, 0.8058% 7/25/37 (a)(b) | | 13,828 | 10,471 |
| Class M2, 0.8458% 7/25/37 (a)(b) | | 7,759 | 5,423 |
| Class M3, 0.9258% 7/25/37 (a)(b) | | 5,982 | 3,771 |
| Series 2007-3: | | | |
| Class A2, 0.7258% 7/25/37 (a)(b) | | 57,471 | 45,739 |
| Class M1, 0.7458% 7/25/37 (a)(b) | | 43,419 | 32,519 |
| Class M2, 0.7758% 7/25/37 (a)(b) | | 45,649 | 32,555 |
| Class M3, 0.8058% 7/25/37 (a)(b) | | 73,891 | 36,257 |
| Class M4, 0.9358% 7/25/37 (a)(b) | | 116,847 | 56,234 |
| Class M5, 1.0358% 7/25/37 (a)(b) | | 54,108 | 11,371 |
| Series 2007-4A: | | | |
| Class A2, 0.9716% 9/25/37 (a)(b) | | 501,154 | 386,004 |
| Class M1, 1.3716% 9/25/37 (a)(b) | | 62,642 | 15,437 |
| Series 2006-2A Class IO, 0% 7/25/36 (a)(b)(e) | | 3,727,152 | 0 |
| Bear Stearns Commercial Mortgage Securities Trust: | | | |
| sequential payer: | | | |
| Series 2006-PW13 Class A1A, 5.533% 9/11/41 | | 1,252,094 | 1,264,044 |
| Series 2006-PW14 Class A1A, 5.189% 12/11/38 | | 512,932 | 521,494 |
| Series 2006-T22 Class A1A, 5.8216% 4/12/38 (b) | | 17,324 | 17,307 |
| Series 2006-PW12 Class A1A, 5.9065% 9/11/38 (b) | | 591,267 | 591,667 |
| BXHTL Mortgage Trust Series 2015-JWRZ Class A, 1.656% 5/15/29 (a)(b) | | 1,022,000 | 997,759 |
| C-BASS Trust floater Series 2006-SC1 Class A, 0.7058% 5/25/36 (a)(b) | | 23,015 | 22,130 |
| CD Commercial Mortgage Trust Series 2007-CD5 Class A1A, 5.8% 11/15/44 | | 763,344 | 801,068 |
| CDGJ Commercial Mortgage Trust Series 2014-BXCH Class A, 1.827% 12/15/27 (a)(b) | | 2,850,599 | 2,841,237 |
| Citigroup Commercial Mortgage Trust: | | | |
| sequential payer Series 2006-C5 Class A4, 5.431% 10/15/49 | | 463,381 | 468,005 |
| Series 2006-C4 Class A1A, 6.0329% 3/15/49 (b) | | 150,077 | 150,133 |
| Series 2013-GC11 Class A1, 0.754% 4/10/46 | | 306,726 | 304,192 |
| Cobalt CMBS Commercial Mortgage Trust Series 2007-C2 Class A3, 5.484% 4/15/47 | | 828,276 | 849,799 |
| COMM Mortgage Trust: | | | |
| floater Series 2014-KYO Class A, 1.324% 6/11/27 (a)(b) | | 2,052,405 | 2,001,703 |
| Series 2013-CR9 Class A1, 1.344% 7/10/45 | | 164,721 | 164,184 |
| Series 2014-CR15 Class A2, 2.928% 2/10/47 | | 1,530,000 | 1,567,283 |
| COMM Mortgage Trust pass-thru certificates: | | | |
| floater Series 2005-F10A Class J, 1.2805% 4/15/17 (a)(b) | | 16,009 | 15,897 |
| sequential payer: | | | |
| Series 2006-C7 Class A1A, 5.9515% 6/10/46 (b) | | 852,258 | 854,424 |
| Series 2006-C8 Class A1A, 5.292% 12/10/46 | | 1,217,480 | 1,234,874 |
| CSMC Series 2015-TOWN: | | | |
| Class B, 2.327% 3/15/17 (a)(b) | | 180,000 | 173,764 |
| Class C, 2.677% 3/15/17 (a)(b) | | 176,000 | 168,315 |
| Class D, 3.627% 3/15/17 (a)(b) | | 543,000 | 515,042 |
| Freddie Mac: | | | |
| pass-thru certificates Series K708 Class A1, 1.67% 10/25/18 | | 122,344 | 122,453 |
| Series K707 Class A1, 1.615% 9/25/18 | | 821,136 | 825,948 |
| GAHR Commercial Mortgage Trust floater Series 2015-NRF Class AFL1, 1.7255% 12/15/16 (a)(b) | | 2,742,558 | 2,716,322 |
| GE Capital Commercial Mortgage Corp.: | | | |
| sequential payer Series 2007-C1 Class A4, 5.543% 12/10/49 | | 1,727,752 | 1,754,955 |
| Series 2007-C1 Class A1A, 5.483% 12/10/49 (b) | | 2,327,122 | 2,389,163 |
| Greenwich Capital Commercial Funding Corp. Series 2006-GG7 Class A4, 6.0483% 7/10/38 (b) | | 288,186 | 288,895 |
| GS Mortgage Securities Corp. Trust Series 2013-C, 2.974% 1/10/30 (a) | | 290,000 | 290,660 |
| GS Mortgage Securities Trust: | | | |
| floater Series 2014-GSFL Class A, 1.4255% 7/15/31 (a)(b) | | 445,622 | 438,827 |
| sequential payer Series 2006-GG8: | | | |
| Class A1A, 5.547% 11/10/39 | | 777,588 | 786,199 |
| Class A4, 5.56% 11/10/39 | | 1,937,084 | 1,952,704 |
| Series 2013-GC12 Class A1, 0.742% 6/10/46 (b) | | 330,194 | 327,023 |
| Hilton U.S.A. Trust: | | | |
| floater Series 2013-HLF Class AFL, 1.4295% 11/5/30 (a)(b) | | 814,229 | 812,979 |
| Series 2013-HLT Class DFX, 4.4065% 11/5/30 (a) | | 270,000 | 269,155 |
| Hyatt Hotel Portfolio Trust floater Series 2015-HYT Class A, 1.6755% 11/15/29 (a)(b) | | 737,000 | 732,972 |
| JPMorgan Chase Commercial Mortgage Securities Trust: | | | |
| floater: | | | |
| Series 2014-BXH Class A, 1.3305% 4/15/27 (a)(b) | | 1,232,000 | 1,216,839 |
| Series 2014-FL5 Class A, 1.4055% 7/15/31 (a)(b) | | 867,332 | 856,428 |
| sequential payer: | | | |
| Series 2006-CB16 Class A1A, 5.546% 5/12/45 | | 1,461,079 | 1,470,919 |
| Series 2006-LDP8 Class A4, 5.399% 5/15/45 | | 884,468 | 887,218 |
| Series 2007-CB18 Class A4, 5.44% 6/12/47 | | 3,597,130 | 3,669,928 |
| Series 2007-CB19 Class A4, 5.8888% 2/12/49 (b) | | 1,941,673 | 1,996,245 |
| Series 2007-LDPX Class A3, 5.42% 1/15/49 | | 365,338 | 372,505 |
| Series 2011-C3 Class A3, 4.3877% 2/15/46 (a) | | 801,000 | 835,978 |
| Series 2006-LDP7 Class A1A, 6.1056% 4/17/45 (b) | | 1,410,628 | 1,416,649 |
| Series 2013-C13 Class A1, 1.3029% 1/15/46 | | 909,042 | 905,976 |
| LB-UBS Commercial Mortgage Trust: | | | |
| sequential payer: | | | |
| Series 2006-C6 Class A4, 5.372% 9/15/39 | | 345,687 | 348,893 |
| Series 2007-C1 Class A4, 5.424% 2/15/40 | | 1,596,157 | 1,626,695 |
| Series 2007-C7 Class A3, 5.866% 9/15/45 | | 684,748 | 721,341 |
| Lone Star Portfolio Trust floater Series 2015-LSP Class A1A2, 2.227% 9/15/28 (a)(b) | | 1,440,448 | 1,430,566 |
| Merrill Lynch Mortgage Trust Series 2006-C2 Class A1A, 5.739% 8/12/43 (b) | | 1,240,490 | 1,249,162 |
| Merrill Lynch-CFC Commercial Mortgage Trust sequential payer Series 2007-5 Class A4, 5.378% 8/12/48 | | 907,829 | 924,762 |
| Morgan Stanley Capital I Trust: | | | |
| floater: | | | |
| Series 2006-XLF Class C, 1.631% 7/15/19 (a)(b) | | 45,397 | 44,853 |
| Series 2007-XLFA: | | | |
| Class D, 0.6155% 10/15/20 (a)(b) | | 35,345 | 35,347 |
| Class E, 0.6755% 10/15/20 (a)(b) | | 105,926 | 105,932 |
| Class F, 0.7255% 10/15/20 (a)(b) | | 63,569 | 63,572 |
| Class G, 0.7655% 10/15/20 (a)(b) | | 78,581 | 78,585 |
| Class H, 0.8555% 10/15/20 (a)(b) | | 49,464 | 49,514 |
| Class J, 1.0055% 10/15/20 (a)(b) | | 28,557 | 27,649 |
| sequential payer: | | | |
| Series 2007-IQ13 Class A1A, 5.312% 3/15/44 | | 452,123 | 462,190 |
| Series 2007-IQ14 Class A2, 5.61% 4/15/49 | | 267,245 | 267,441 |
| Series 2012-C4 Class A1, 1.085% 3/15/45 | | 138,557 | 138,383 |
| Series 2006-HQ9 Class A4, 5.731% 7/12/44 (b) | | 291,973 | 291,790 |
| Series 2007-T27 Class A1A, 5.8206% 6/11/42 (b) | | 1,343,632 | 1,399,396 |
| SCG Trust Series 2013-SRP1 Class A, 1.8255% 11/15/26 (a)(b) | | 965,000 | 960,681 |
| UBS-Barclays Commercial Mortgage Trust sequential payer Series 2013-C6 Class A1, 0.8022% 4/10/46 | | 280,239 | 277,795 |
| Wachovia Bank Commercial Mortgage Trust: | | | |
| sequential payer: | | | |
| Series 2006-C29: | | | |
| Class A1A, 5.297% 11/15/48 | | 1,988,726 | 2,025,271 |
| Class A4, 5.308% 11/15/48 | | 375,084 | 379,080 |
| Series 2007-C31 Class A4, 5.509% 4/15/47 | | 250,394 | 255,196 |
| Series 2006-C26 Class A1A, 6.009% 6/15/45 (b) | | 996,919 | 998,409 |
| Series 2006-C27 Class A3, 5.765% 7/15/45 (b) | | 567,559 | 566,903 |
| WF-RBS Commercial Mortgage Trust Series 2013-C13 Class A1, 0.778% 5/15/45 | | 192,399 | 190,942 |
| TOTAL COMMERCIAL MORTGAGE SECURITIES | | | |
| (Cost $64,999,114) | | | 62,135,994 |
|
| Municipal Securities - 0.2% | | | |
| Illinois Gen. Oblig. Series 2011, 5.877% 3/1/19 | | | |
| (Cost $1,607,044) | | 1,500,000 | 1,621,365 |
|
| Supranational Obligations - 0.1% | | | |
International Bank for Reconstruction & Development 1% 6/15/18
(Cost $688,133) | | $689,000 | $688,095 |
|
| Bank Notes - 2.7% | | | |
| Bank of America NA: | | | |
| 1.25% 2/14/17 | | $2,529,000 | $2,526,939 |
| 1.75% 6/5/18 | | 1,500,000 | 1,490,535 |
| 5.3% 3/15/17 | | 250,000 | 258,473 |
| Branch Banking & Trust Co. 1.45% 10/3/16 | | 2,463,000 | 2,470,121 |
| Capital One Bank NA: | | | |
| 1.15% 11/21/16 | | 779,000 | 777,925 |
| 1.2% 2/13/17 | | 1,625,000 | 1,619,564 |
| 1.3% 6/5/17 | | 1,232,000 | 1,225,767 |
| Capital One NA: | | | |
| 1.5% 9/5/17 | | 1,000,000 | 992,123 |
| 1.65% 2/5/18 | | 1,232,000 | 1,216,224 |
| Discover Bank 3.1% 6/4/20 | | 750,000 | 745,930 |
| KeyBank NA: | | | |
| 1.65% 2/1/18 | | 735,000 | 732,733 |
| 2.5% 12/15/19 | | 777,000 | 785,674 |
| Manufacturers & Traders Trust Co.: | | | |
| 1.4% 7/25/17 | | 1,642,000 | 1,635,994 |
| 2.3% 1/30/19 | | 1,080,000 | 1,086,348 |
| Marshall & Ilsley Bank 5% 1/17/17 | | 558,000 | 572,674 |
| PNC Bank NA 1.15% 11/1/16 | | 1,281,000 | 1,280,914 |
| Regions Bank 7.5% 5/15/18 | | 250,000 | 275,560 |
| Regions Financial Corp. 2.25% 9/14/18 | | 2,070,000 | 2,061,080 |
| U.S. Bank NA 1.1% 1/30/17 | | 1,782,000 | 1,783,614 |
| TOTAL BANK NOTES | | | |
| (Cost $23,576,863) | | | 23,538,192 |
| | | Shares | Value |
|
| Money Market Funds - 2.4% | | | |
| Fidelity Cash Central Fund, 0.40% (f) | | | |
| (Cost $20,592,376) | | 20,592,376 | 20,592,376 |
| | | Maturity Amount | Value |
|
| Cash Equivalents - 8.9% | | | |
| Investments in repurchase agreements in a joint trading account at 0.4%, dated 2/29/16 due 3/1/16 (Collateralized by U.S. Government Obligations) # (g) | | 74,043,823 | 74,043,000 |
| With Mizuho Securities U.S.A., Inc. at 1.88%, dated 2/19/16 due 8/17/16 (Collateralized by Corporate Obligations valued at $4,322,482, .70% - .78%, 2/25/36 - 4/25/36) | | 4,037,600 | 4,000,000 |
| TOTAL CASH EQUIVALENTS | | | |
| (Cost $78,043,000) | | | 78,043,000 |
| TOTAL INVESTMENT PORTFOLIO - 109.7% | | | |
| (Cost $961,107,950) | | | 957,111,590 |
| NET OTHER ASSETS (LIABILITIES) - (9.7)% | | | (84,344,276) |
| NET ASSETS - 100% | | | $872,767,314 |
Swaps
| Underlying Reference | Rating(1) | Expiration Date | Clearinghouse/Counterparty | Fixed Payment Received/(Paid) | Notional Amount(2) | Value(1) | Upfront Premium Received/(Paid) | Unrealized Appreciation/(Depreciation) |
| Credit Default Swaps | | | | | | | | |
| Sell Protection | | | | | | | | |
| Morgan Stanley ABS Capital I Inc Series 2004-NC8 Class B3 | C | Oct. 2034 | Merrill Lynch International | 4.60% | USD 16,329 | $(1,265) | $0 | $(1,265) |
(1) Ratings are presented for credit default swaps in which the Fund has sold protection on the underlying referenced debt. Ratings for an underlying index represent a weighted average of the ratings of all securities included in the index. The credit rating or value can be measures of the current payment/performance risk. Ratings are from Moody's Investors Service, Inc. Where Moody's® ratings are not available, S&P® ratings are disclosed and are indicated as such. All ratings are as of the report date and do not reflect subsequent changes.
(2) The notional amount of each credit default swap where the Fund has sold protection approximates the maximum potential amount of future payments that the Portfolio could be required to make if a credit event were to occur.
Legend
(a) Security exempt from registration under Rule 144A of the Securities Act of 1933. These securities may be resold in transactions exempt from registration, normally to qualified institutional buyers. At the end of the period, the value of these securities amounted to $126,624,286 or 14.5% of net assets.
(b) Coupon rates for floating and adjustable rate securities reflect the rates in effect at period end.
(c) Security or a portion of the security is on loan at period end.
(d) Represents an investment in an underlying pool of reverse mortgages which typically do not require regular principal and interest payments as repayment is deferred until a maturity event.
(e) Security represents right to receive monthly interest payments on an underlying pool of mortgages or assets. Principal shown is the outstanding par amount of the pool as of the end of the period.
(f) Affiliated fund that is generally available only to investment companies and other accounts managed by Fidelity Investments. The rate quoted is the annualized seven-day yield of the fund at period end. A complete unaudited listing of the fund's holdings as of its most recent quarter end is available upon request. In addition, each Fidelity Central Fund's financial statements are available on the SEC's website or upon request.
(g) Includes investment made with cash collateral received from securities on loan.
Affiliated Central Funds
Information regarding fiscal year to date income earned by the Fund from investments in Fidelity Central Funds is as follows:
| Fund | Income earned |
| Fidelity Cash Central Fund | $36,928 |
Investment Valuation
The following is a summary of the inputs used, as of February 29, 2016, involving the Fund's assets and liabilities carried at fair value. The inputs or methodology used for valuing securities may not be an indication of the risk associated with investing in those securities. For more information on valuation inputs, and their aggregation into the levels used below, please refer to the Investment Valuation section in the accompanying Notes to Financial Statements.
| | Valuation Inputs at Reporting Date: |
| Description | Total | Level 1 | Level 2 | Level 3 |
| Investments in Securities: | | | | |
| Corporate Bonds | $368,798,933 | $-- | $368,798,933 | $-- |
| U.S. Government and Government Agency Obligations | 247,389,301 | -- | 247,389,301 | -- |
| U.S. Government Agency - Mortgage Securities | 22,841,961 | -- | 22,841,961 | -- |
| Asset-Backed Securities | 124,655,867 | -- | 124,366,542 | 289,325 |
| Collateralized Mortgage Obligations | 6,806,506 | -- | 6,806,506 | -- |
| Commercial Mortgage Securities | 62,135,994 | -- | 62,135,574 | 420 |
| Municipal Securities | 1,621,365 | -- | 1,621,365 | -- |
| Supranational Obligations | 688,095 | -- | 688,095 | -- |
| Bank Notes | 23,538,192 | -- | 23,538,192 | -- |
| Money Market Funds | 20,592,376 | 20,592,376 | -- | -- |
| Cash Equivalents | 78,043,000 | -- | 78,043,000 | -- |
| Total Investments in Securities: | $957,111,590 | $20,592,376 | $936,229,469 | $289,745 |
| Derivative Instruments: | | | | |
| Liabilities | | | | |
| Swaps | $(1,265) | $-- | $(1,265) | $-- |
| Total Liabilities | $(1,265) | $-- | $(1,265) | $-- |
| Total Derivative Instruments: | $(1,265) | $-- | $(1,265) | $-- |
Value of Derivative Instruments
The following table is a summary of the Fund's value of derivative instruments by primary risk exposure as of February 29, 2016. For additional information on derivative instruments, please refer to the Derivative Instruments section in the accompanying Notes to Financial Statements.
| Primary Risk Exposure / Derivative Type | Value |
| | Asset | Liability |
| Credit Risk | | |
| Swaps(a) | $0 | $(1,265) |
| Total Credit Risk | 0 | (1,265) |
| Total Value of Derivatives | $0 | $(1,265) |
(a) For bi-lateral over-the-counter (OTC) swaps, reflects gross value which is presented in the Statement of Assets and Liabilities in the bi-lateral OTC swaps, at value line-items.
Other Information
# Additional information on each counterparty to the repurchase agreement is as follows:
| Repurchase Agreement / Counterparty | Value |
| $74,043,000 due 3/01/16 at 0.40% | |
| Commerz Markets LLC | $74,043,000 |
| | $74,043,000 |
Distribution of investments by country or territory of incorporation, as a percentage of Total Net Assets, is as follows (Unaudited):
| United States of America | 86.7% |
| United Kingdom | 3.1% |
| Japan | 2.1% |
| Canada | 2.1% |
| Netherlands | 1.5% |
| Luxembourg | 1.1% |
| Others (Individually Less Than 1%) | 3.4% |
| | 100.0% |
See accompanying notes which are an integral part of the financial statements.
Financial Statements
Statement of Assets and Liabilities
| | | February 29, 2016 (Unaudited) |
| Assets | | |
Investment in securities, at value (including securities loaned of $72,660,696 and repurchase agreements of $78,043,000) — See accompanying schedule:
Unaffiliated issuers (cost $940,515,574) | $936,519,214 | |
| Fidelity Central Funds (cost $20,592,376) | 20,592,376 | |
| Total Investments (cost $961,107,950) | | $957,111,590 |
| Cash | | 900 |
| Receivable for investments sold | | 60,886 |
| Receivable for fund shares sold | | 2,067,053 |
| Interest receivable | | 2,838,304 |
| Distributions receivable from Fidelity Central Funds | | 13,421 |
| Prepaid expenses | | 1,200 |
| Other receivables | | 11 |
| Total assets | | 962,093,365 |
| Liabilities | | |
| Payable for investments purchased | $7,723,656 | |
| Payable for fund shares redeemed | 6,932,428 | |
| Distributions payable | 27,737 | |
| Bi-lateral OTC swaps, at value | 1,265 | |
| Accrued management fee | 220,325 | |
| Distribution and service plan fees payable | 110,508 | |
| Other affiliated payables | 136,913 | |
| Other payables and accrued expenses | 129,319 | |
| Collateral on securities loaned, at value | 74,043,900 | |
| Total liabilities | | 89,326,051 |
| Net Assets | | $872,767,314 |
| Net Assets consist of: | | |
| Paid in capital | | $910,983,328 |
| Undistributed net investment income | | 770,256 |
| Accumulated undistributed net realized gain (loss) on investments | | (34,988,645) |
| Net unrealized appreciation (depreciation) on investments | | (3,997,625) |
| Net Assets | | $872,767,314 |
| Calculation of Maximum Offering Price | | |
| Class A: | | |
| Net Asset Value and redemption price per share ($197,983,338 ÷ 21,248,908 shares) | | $9.32 |
| Maximum offering price per share (100/98.50 of $9.32) | | $9.46 |
| Class T: | | |
| Net Asset Value and redemption price per share ($93,634,545 ÷ 10,040,761 shares) | | $9.33 |
| Maximum offering price per share (100/98.50 of $9.33) | | $9.47 |
| Class B: | | |
| Net Asset Value and offering price per share ($1,379,465 ÷ 148,444 shares)(a) | | $9.29 |
| Class C: | | |
| Net Asset Value and offering price per share ($87,809,597 ÷ 9,471,921 shares)(a) | | $9.27 |
| Class I: | | |
| Net Asset Value, offering price and redemption price per share ($491,960,369 ÷ 52,755,221 shares) | | $9.33 |
(a) Redemption price per share is equal to net asset value less any applicable contingent deferred sales charge.
See accompanying notes which are an integral part of the financial statements.
Statement of Operations
| | | Six months ended February 29, 2016 (Unaudited) |
| Investment Income | | |
| Interest | | $7,656,175 |
| Income from Fidelity Central Funds | | 36,928 |
| Total income | | 7,693,103 |
| Expenses | | |
| Management fee | $1,265,919 | |
| Transfer agent fees | 654,321 | |
| Distribution and service plan fees | 620,499 | |
| Accounting and security lending fees | 151,488 | |
| Custodian fees and expenses | 8,618 | |
| Independent trustees' compensation | 1,726 | |
| Registration fees | 54,276 | |
| Audit | 91,482 | |
| Legal | 1,825 | |
| Miscellaneous | 38,180 | |
| Total expenses before reductions | 2,888,334 | |
| Expense reductions | (1,914) | 2,886,420 |
| Net investment income (loss) | | 4,806,683 |
| Realized and Unrealized Gain (Loss) | | |
| Net realized gain (loss) on: | | |
| Investment securities: | | |
| Unaffiliated issuers | 1,244,026 | |
| Swaps | 505 | |
| Total net realized gain (loss) | | 1,244,531 |
Change in net unrealized appreciation (depreciation) on:
Investment securities | (2,631,438) | |
| Swaps | 1,505 | |
| Total change in net unrealized appreciation (depreciation) | | (2,629,933) |
| Net gain (loss) | | (1,385,402) |
| Net increase (decrease) in net assets resulting from operations | | $3,421,281 |
See accompanying notes which are an integral part of the financial statements.
Statement of Changes in Net Assets
| | Six months ended February 29, 2016 (Unaudited) | Year ended August 31, 2015 |
| Increase (Decrease) in Net Assets | | |
| Operations | | |
| Net investment income (loss) | $4,806,683 | $7,242,950 |
| Net realized gain (loss) | 1,244,531 | 2,488,984 |
| Change in net unrealized appreciation (depreciation) | (2,629,933) | (5,315,199) |
| Net increase (decrease) in net assets resulting from operations | 3,421,281 | 4,416,735 |
| Distributions to shareholders from net investment income | (4,967,506) | (6,546,109) |
| Distributions to shareholders from net realized gain | – | (107,541) |
| Total distributions | (4,967,506) | (6,653,650) |
| Share transactions - net increase (decrease) | 68,551,911 | (168,945,549) |
| Total increase (decrease) in net assets | 67,005,686 | (171,182,464) |
| Net Assets | | |
| Beginning of period | 805,761,628 | 976,944,092 |
| End of period (including undistributed net investment income of $770,256 and undistributed net investment income of $931,079, respectively) | $872,767,314 | $805,761,628 |
See accompanying notes which are an integral part of the financial statements.
Financial Highlights — Fidelity Advisor Short Fixed-Income Fund Class A
| | Six months ended (Unaudited) | Years ended August 31, | | | | |
| | February 29, 2016 | 2015 | 2014 | 2013 | 2012 | 2011 |
| Selected Per–Share Data | | | | | | |
| Net asset value, beginning of period | $9.33 | $9.36 | $9.30 | $9.34 | $9.29 | $9.23 |
| Income from Investment Operations | | | | | | |
| Net investment income (loss)A | .055 | .073 | .070 | .070 | .090 | .134 |
| Net realized and unrealized gain (loss) | (.009) | (.037) | .052 | (.046) | .058 | .062 |
| Total from investment operations | .046 | .036 | .122 | .024 | .148 | .196 |
| Distributions from net investment income | (.056) | (.065) | (.062) | (.064) | (.098) | (.136) |
| Distributions from net realized gain | – | (.001) | – | – | – | – |
| Total distributions | (.056) | (.066) | (.062) | (.064) | (.098) | (.136) |
| Net asset value, end of period | $9.32 | $9.33 | $9.36 | $9.30 | $9.34 | $9.29 |
| Total ReturnB,C,D | .49% | .39% | 1.32% | .25% | 1.61% | 2.14% |
| Ratios to Average Net AssetsE,F | | | | | | |
| Expenses before reductions | .71%G | .70% | .70% | .70% | .70% | .70% |
| Expenses net of fee waivers, if any | .71%G | .70% | .70% | .70% | .70% | .70% |
| Expenses net of all reductions | .71%G | .70% | .70% | .70% | .69% | .70% |
| Net investment income (loss) | 1.19%G | .78% | .74% | .75% | .97% | 1.44% |
| Supplemental Data | | | | | | |
| Net assets, end of period (000 omitted) | $197,983 | $177,996 | $190,596 | $205,581 | $212,725 | $250,546 |
| Portfolio turnover rateH | 130%G | 75%I | 61% | 61% | 75% | 204% |
A Calculated based on average shares outstanding during the period.
B Total returns for periods of less than one year are not annualized.
C Total returns would have been lower if certain expenses had not been reduced during the applicable periods shown.
D Total returns do not include the effect of the sales charges.
E Fees and expenses of any underlying Fidelity Central Funds are not included in the Fund's expense ratio. The Fund indirectly bears its proportionate share of the expenses of any underlying Fidelity Central Funds.
F Expense ratios reflect operating expenses of the class. Expenses before reductions do not reflect amounts reimbursed by the investment adviser or reductions from expense offset arrangements and do not represent the amount paid by the class during periods when reimbursements or reductions occur. Expenses net of fee waivers reflect expenses after reimbursement by the investment adviser but prior to reductions from expense offset arrangements. Expenses net of all reductions represent the net expenses paid by the class.
G Annualized
H Amount does not include the portfolio activity of any underlying Fidelity Central Funds.
I Portfolio turnover rate excludes securities received or delivered in-kind.
See accompanying notes which are an integral part of the financial statements.
Financial Highlights — Fidelity Advisor Short Fixed-Income Fund Class T
| | Six months ended (Unaudited) | Years ended August 31, | | | | |
| | February 29,2016 | 2015 | 2014 | 2013 | 2012 | 2011 |
| Selected Per–Share Data | | | | | | |
| Net asset value, beginning of period | $9.34 | $9.37 | $9.31 | $9.34 | $9.29 | $9.24 |
| Income from Investment Operations | | | | | | |
| Net investment income (loss)A | .055 | .073 | .069 | .069 | .089 | .134 |
| Net realized and unrealized gain (loss) | (.010) | (.037) | .053 | (.036) | .059 | .052 |
| Total from investment operations | .045 | .036 | .122 | .033 | .148 | .186 |
| Distributions from net investment income | (.055) | (.065) | (.062) | (.063) | (.098) | (.136) |
| Distributions from net realized gain | – | (.001) | – | – | – | – |
| Total distributions | (.055) | (.066) | (.062) | (.063) | (.098) | (.136) |
| Net asset value, end of period | $9.33 | $9.34 | $9.37 | $9.31 | $9.34 | $9.29 |
| Total ReturnB,C,D | .49% | .38% | 1.31% | .36% | 1.60% | 2.03% |
| Ratios to Average Net AssetsE,F | | | | | | |
| Expenses before reductions | .72%G | .70% | .71% | .70% | .70% | .70% |
| Expenses net of fee waivers, if any | .72%G | .70% | .71% | .70% | .70% | .70% |
| Expenses net of all reductions | .72%G | .70% | .71% | .70% | .70% | .70% |
| Net investment income (loss) | 1.18%G | .77% | .74% | .74% | .96% | 1.44% |
| Supplemental Data | | | | | | |
| Net assets, end of period (000 omitted) | $93,635 | $95,409 | $103,447 | $127,404 | $140,285 | $163,217 |
| Portfolio turnover rateH | 130%G | 75%I | 61% | 61% | 75% | 204% |
A Calculated based on average shares outstanding during the period.
B Total returns for periods of less than one year are not annualized.
C Total returns would have been lower if certain expenses had not been reduced during the applicable periods shown.
D Total returns do not include the effect of the sales charges.
E Fees and expenses of any underlying Fidelity Central Funds are not included in the Fund's expense ratio. The Fund indirectly bears its proportionate share of the expenses of any underlying Fidelity Central Funds.
F Expense ratios reflect operating expenses of the class. Expenses before reductions do not reflect amounts reimbursed by the investment adviser or reductions from expense offset arrangements and do not represent the amount paid by the class during periods when reimbursements or reductions occur. Expenses net of fee waivers reflect expenses after reimbursement by the investment adviser but prior to reductions from expense offset arrangements. Expenses net of all reductions represent the net expenses paid by the class.
G Annualized
H Amount does not include the portfolio activity of any underlying Fidelity Central Funds.
I Portfolio turnover rate excludes securities received or delivered in-kind.
See accompanying notes which are an integral part of the financial statements.
Financial Highlights — Fidelity Advisor Short Fixed-Income Fund Class B
| | Six months ended (Unaudited) | Years ended August 31, | | | | |
| | February 29, 2016 | 2015 | 2014 | 2013 | 2012 | 2011 |
| Selected Per–Share Data | | | | | | |
| Net asset value, beginning of period | $9.32 | $9.35 | $9.30 | $9.35 | $9.30 | $9.24 |
| Income from Investment Operations | | | | | | |
| Net investment income (loss)A | .019 | .003 | (.007) | (.006) | .015 | .059 |
| Net realized and unrealized gain (loss) | (.022) | (.032) | .058 | (.042) | .059 | .062 |
| Total from investment operations | (.003) | (.029) | .051 | (.048) | .074 | .121 |
| Distributions from net investment income | (.027) | –B | (.001) | (.002) | (.024) | (.061) |
| Distributions from net realized gain | – | (.001) | – | – | – | – |
| Total distributions | (.027) | (.001) | (.001) | (.002) | (.024) | (.061) |
| Net asset value, end of period | $9.29 | $9.32 | $9.35 | $9.30 | $9.35 | $9.30 |
| Total ReturnC,D,E | (.03)% | (.31)% | .55% | (.51)% | .79% | 1.31% |
| Ratios to Average Net AssetsF,G | | | | | | |
| Expenses before reductions | 1.48%H | 1.45% | 1.52% | 1.51% | 1.50% | 1.52% |
| Expenses net of fee waivers, if any | 1.48%H | 1.45% | 1.52% | 1.51% | 1.50% | 1.52% |
| Expenses net of all reductions | 1.48%H | 1.45% | 1.52% | 1.51% | 1.50% | 1.52% |
| Net investment income (loss) | .42%H | .03% | (.07)% | (.06)% | .16% | .63% |
| Supplemental Data | | | | | | |
| Net assets, end of period (000 omitted) | $1,379 | $1,591 | $2,459 | $5,824 | $7,991 | $9,337 |
| Portfolio turnover rateI | 130%H | 75%J | 61% | 61% | 75% | 204% |
A Calculated based on average shares outstanding during the period.
B Amount represents less than $.0005 per share.
C Total returns for periods of less than one year are not annualized.
D Total returns would have been lower if certain expenses had not been reduced during the applicable periods shown.
E Total returns do not include the effect of the contingent deferred sales charge.
F Fees and expenses of any underlying Fidelity Central Funds are not included in the Fund's expense ratio. The Fund indirectly bears its proportionate share of the expenses of any underlying Fidelity Central Funds.
G Expense ratios reflect operating expenses of the class. Expenses before reductions do not reflect amounts reimbursed by the investment adviser or reductions from expense offset arrangements and do not represent the amount paid by the class during periods when reimbursements or reductions occur. Expenses net of fee waivers reflect expenses after reimbursement by the investment adviser but prior to reductions from expense offset arrangements. Expenses net of all reductions represent the net expenses paid by the class.
H Annualized
I Amount does not include the portfolio activity of any underlying Fidelity Central Funds.
J Portfolio turnover rate excludes securities received or delivered in-kind.
See accompanying notes which are an integral part of the financial statements.
Financial Highlights — Fidelity Advisor Short Fixed-Income Fund Class C
| | Six months ended (Unaudited) | Years ended August 31, | | | | |
| | February 29, 2016 | 2015 | 2014 | 2013 | 2012 | 2011 |
| Selected Per–Share Data | | | | | | |
| Net asset value, beginning of period | $9.30 | $9.34 | $9.29 | $9.35 | $9.30 | $9.24 |
| Income from Investment Operations | | | | | | |
| Net investment income (loss)A | .015 | (.006) | (.009) | (.009) | .012 | .056 |
| Net realized and unrealized gain (loss) | (.018) | (.033) | .060 | (.050) | .058 | .062 |
| Total from investment operations | (.003) | (.039) | .051 | (.059) | .070 | .118 |
| Distributions from net investment income | (.027) | – | (.001) | (.001) | (.020) | (.058) |
| Distributions from net realized gain | – | (.001) | – | – | – | – |
| Total distributions | (.027) | (.001) | (.001) | (.001) | (.020) | (.058) |
| Net asset value, end of period | $9.27 | $9.30 | $9.34 | $9.29 | $9.35 | $9.30 |
| Total ReturnB,C,D | (.04)% | (.42)% | .55% | (.63)% | .76% | 1.29% |
| Ratios to Average Net AssetsE,F | | | | | | |
| Expenses before reductions | 1.57%G | 1.55% | 1.54% | 1.54% | 1.54% | 1.54% |
| Expenses net of fee waivers, if any | 1.57%G | 1.55% | 1.54% | 1.54% | 1.54% | 1.54% |
| Expenses net of all reductions | 1.57%G | 1.55% | 1.54% | 1.54% | 1.54% | 1.54% |
| Net investment income (loss) | .33%G | (.07)% | (.10)% | (.10)% | .13% | .61% |
| Supplemental Data | | | | | | |
| Net assets, end of period (000 omitted) | $87,810 | $79,368 | $98,517 | $99,283 | $114,564 | $132,589 |
| Portfolio turnover rateH | 130%G | 75%I | 61% | 61% | 75% | 204% |
A Calculated based on average shares outstanding during the period.
B Total returns for periods of less than one year are not annualized.
C Total returns would have been lower if certain expenses had not been reduced during the applicable periods shown.
D Total returns do not include the effect of the contingent deferred sales charge.
E Fees and expenses of any underlying Fidelity Central Funds are not included in the Fund's expense ratio. The Fund indirectly bears its proportionate share of the expenses of any underlying Fidelity Central Funds.
F Expense ratios reflect operating expenses of the class. Expenses before reductions do not reflect amounts reimbursed by the investment adviser or reductions from expense offset arrangements and do not represent the amount paid by the class during periods when reimbursements or reductions occur. Expenses net of fee waivers reflect expenses after reimbursement by the investment adviser but prior to reductions from expense offset arrangements. Expenses net of all reductions represent the net expenses paid by the class.
G Annualized
H Amount does not include the portfolio activity of any underlying Fidelity Central Funds.
I Portfolio turnover rate excludes securities received or delivered in-kind.
See accompanying notes which are an integral part of the financial statements.
Financial Highlights — Fidelity Advisor Short Fixed-Income Fund Class I
| | Six months ended (Unaudited) | Years ended August 31, | | | | |
| | February 29, 2016 | 2015 | 2014 | 2013 | 2012 | 2011 |
| Selected Per–Share Data | | | | | | |
| Net asset value, beginning of period | $9.34 | $9.37 | $9.31 | $9.34 | $9.29 | $9.24 |
| Income from Investment Operations | | | | | | |
| Net investment income (loss)A | .062 | .089 | .087 | .087 | .106 | .150 |
| Net realized and unrealized gain (loss) | (.009) | (.037) | .053 | (.036) | .058 | .052 |
| Total from investment operations | .053 | .052 | .140 | .051 | .164 | .202 |
| Distributions from net investment income | (.063) | (.081) | (.080) | (.081) | (.114) | (.152) |
| Distributions from net realized gain | – | (.001) | – | – | – | – |
| Total distributions | (.063) | (.082) | (.080) | (.081) | (.114) | (.152) |
| Net asset value, end of period | $9.33 | $9.34 | $9.37 | $9.31 | $9.34 | $9.29 |
| Total ReturnB,C | .57% | .55% | 1.51% | .54% | 1.78% | 2.21% |
| Ratios to Average Net AssetsD,E | | | | | | |
| Expenses before reductions | .56%F | .53% | .51% | .52% | .52% | .53% |
| Expenses net of fee waivers, if any | .56%F | .53% | .51% | .52% | .52% | .53% |
| Expenses net of all reductions | .56%F | .53% | .51% | .52% | .52% | .53% |
| Net investment income (loss) | 1.34%F | .95% | .93% | .93% | 1.14% | 1.62% |
| Supplemental Data | | | | | | |
| Net assets, end of period (000 omitted) | $491,960 | $451,398 | $581,926 | $696,413 | $771,929 | $719,891 |
| Portfolio turnover rateG | 130%F | 75%H | 61% | 61% | 75% | 204% |
A Calculated based on average shares outstanding during the period.
B Total returns for periods of less than one year are not annualized.
C Total returns would have been lower if certain expenses had not been reduced during the applicable periods shown.
D Fees and expenses of any underlying Fidelity Central Funds are not included in the Fund's expense ratio. The Fund indirectly bears its proportionate share of the expenses of any underlying Fidelity Central Funds.
E Expense ratios reflect operating expenses of the class. Expenses before reductions do not reflect amounts reimbursed by the investment adviser or reductions from expense offset arrangements and do not represent the amount paid by the class during periods when reimbursements or reductions occur. Expenses net of fee waivers reflect expenses after reimbursement by the investment adviser but prior to reductions from expense offset arrangements. Expenses net of all reductions represent the net expenses paid by the class.
F Annualized
G Amount does not include the portfolio activity of any underlying Fidelity Central Funds.
H Portfolio turnover rate excludes securities received or delivered in-kind.
See accompanying notes which are an integral part of the financial statements.
Notes to Financial Statements (Unaudited)
For the period ended February 29, 2016
1. Organization.
Fidelity Advisor Short Fixed-Income Fund (the Fund) is a fund of Fidelity Advisor Series II (the Trust) and is authorized to issue an unlimited number of shares. The Trust is registered under the Investment Company Act of 1940, as amended (the 1940 Act), as an open-end management investment company organized as a Massachusetts business trust. The Fund offers Class A, Class T, Class C and Class I shares, each of which, along with Class B shares, has equal rights as to assets and voting privileges. Class B shares are closed to new accounts and additional purchases, except for exchanges and reinvestments. Each class has exclusive voting rights with respect to matters that affect that class. Class B shares will automatically convert to Class A shares after a maximum holding period of seven years from the initial date of purchase.
During the period, the Board of Trustees approved the conversion of all existing Class B shares into Class A shares, effective on or about July 1, 2016, regardless of the length of times shares have been held.
2. Investments in Fidelity Central Funds.
The Fund invests in Fidelity Central Funds, which are open-end investment companies generally available only to other investment companies and accounts managed by the investment adviser and its affiliates. The Fund's Schedule of Investments lists each of the Fidelity Central Funds held as of period end, if any, as an investment of the Fund, but does not include the underlying holdings of each Fidelity Central Fund. As an Investing Fund, the Fund indirectly bears its proportionate share of the expenses of the underlying Fidelity Central Funds.
The Money Market Central Funds seek preservation of capital and current income and are managed by Fidelity Investments Money Management, Inc. (FIMM), an affiliate of the investment adviser. Annualized expenses of the Money Market Central Funds as of their most recent shareholder report date are less than .005%.
A complete unaudited list of holdings for each Fidelity Central Fund is available upon request or at the Securities and Exchange Commission (the SEC) website at www.sec.gov. In addition, the financial statements of the Fidelity Central Funds are available on the SEC website or upon request.
3. Significant Accounting Policies.
The financial statements have been prepared in conformity with accounting principles generally accepted in the United States of America (GAAP), which require management to make certain estimates and assumptions at the date of the financial statements. Actual results could differ from those estimates. Subsequent events, if any, through the date that the financial statements were issued have been evaluated in the preparation of the financial statements. The following summarizes the significant accounting policies of the Fund:
Investment Valuation. Investments are valued as of 4:00 p.m. Eastern time on the last calendar day of the period. The Board of Trustees (the Board) has delegated the day to day responsibility for the valuation of the Fund's investments to the Fidelity Management & Research Company (FMR) Fair Value Committee (the Committee). In accordance with valuation policies and procedures approved by the Board, the Fund attempts to obtain prices from one or more third party pricing vendors or brokers to value its investments. When current market prices, quotations or currency exchange rates are not readily available or reliable, investments will be fair valued in good faith by the Committee, in accordance with procedures adopted by the Board. Factors used in determining fair value vary by investment type and may include market or investment specific events, changes in interest rates and credit quality. The frequency with which these procedures are used cannot be predicted and they may be utilized to a significant extent. The Committee oversees the Fund's valuation policies and procedures and reports to the Board on the Committee's activities and fair value determinations. The Board monitors the appropriateness of the procedures used in valuing the Fund's investments and ratifies the fair value determinations of the Committee.
The Fund categorizes the inputs to valuation techniques used to value its investments into a disclosure hierarchy consisting of three levels as shown below:
- Level 1 – quoted prices in active markets for identical investments
- Level 2 – other significant observable inputs (including quoted prices for similar investments, interest rates, prepayment speeds, etc.)
- Level 3 – unobservable inputs (including the Fund's own assumptions based on the best information available)
Valuation techniques used to value the Fund's investments by major category are as follows:
Debt securities, including restricted securities, are valued based on evaluated prices received from third party pricing vendors or from brokers who make markets in such securities. Corporate bonds, bank notes, municipal securities, supranational obligations and U.S. government and government agency obligations are valued by pricing vendors who utilize matrix pricing which considers yield or price of bonds of comparable quality, coupon, maturity and type or by broker-supplied prices. Asset backed securities, collateralized mortgage obligations, commercial mortgage securities and U.S. government agency mortgage securities are valued by pricing vendors who utilize matrix pricing which considers prepayment speed assumptions, attributes of the collateral, yield or price of bonds of comparable quality, coupon, maturity and type or by broker-supplied prices. Swaps are marked-to-market daily based on valuations from third party pricing vendors, registered derivatives clearing organizations (clearinghouses) or broker-supplied valuations. These pricing sources may utilize inputs such as interest rate curves, credit spread curves, default possibilities and recovery rates. When independent prices are unavailable or unreliable, debt securities and swaps may be valued utilizing pricing methodologies which consider similar factors that would be used by third party pricing vendors. Debt securities and swaps are generally categorized as Level 2 in the hierarchy but may be Level 3 depending on the circumstances.
Investments in open-end mutual funds, including the Fidelity Central Funds, are valued at their closing net asset value (NAV) each business day and are categorized as Level 1 in the hierarchy.
Changes in valuation techniques may result in transfers in or out of an assigned level within the disclosure hierarchy. The aggregate value of investments by input level as of February 29, 2016, is included at the end of the Fund's Schedule of Investments.
Investment Transactions and Income. For financial reporting purposes, the Fund's investment holdings and NAV include trades executed through the end of the last business day of the period. The NAV per share for processing shareholder transactions is calculated as of the close of business of the New York Stock Exchange (NYSE), normally 4:00 p.m. Eastern time and includes trades executed through the end of the prior business day. Gains and losses on securities sold are determined on the basis of identified cost and may include proceeds received from litigation. Income and capital gain distributions from Fidelity Central Funds, if any, are recorded on the ex-dividend date. Interest income is accrued as earned and includes coupon interest and amortization of premium and accretion of discount on debt securities as applicable. Debt obligations may be placed on non-accrual status and related interest income may be reduced by ceasing accruals and writing off interest receivables when the collection of all or a portion of interest has become doubtful based on consistently applied procedures. A debt obligation is removed from non-accrual status when the issuer resumes interest payments or when collectability of interest is reasonably assured.
Class Allocations and Expenses. Investment income, realized and unrealized capital gains and losses, common expenses of the Fund, and certain fund-level expense reductions, if any, are allocated daily on a pro-rata basis to each class based on the relative net assets of each class to the total net assets of the Fund. Each class differs with respect to transfer agent and distribution and service plan fees incurred. Certain expense reductions may also differ by class. For the reporting period, the allocated portion of income and expenses to each class as a percent of its average net assets may vary due to the timing of recording these transactions in relation to fluctuating net assets of the classes. Expenses directly attributable to a fund are charged to that fund. Expenses attributable to more than one fund are allocated among the respective funds on the basis of relative net assets or other appropriate methods. Expense estimates are accrued in the period to which they relate and adjustments are made when actual amounts are known.
Income Tax Information and Distributions to Shareholders. Each year, the Fund intends to qualify as a regulated investment company under Subchapter M of the Internal Revenue Code, including distributing substantially all of its taxable income and realized gains. As a result, no provision for U.S. Federal income taxes is required. The Fund files a U.S. federal tax return, in addition to state and local tax returns as required. The Fund's federal income tax returns are subject to examination by the Internal Revenue Service (IRS) for a period of three fiscal years after they are filed. State and local tax returns may be subject to examination for an additional fiscal year depending on the jurisdiction.
Dividends are declared and recorded daily and paid monthly from net investment income. Distributions from realized gains, if any, are declared and recorded on the ex-dividend date. Income dividends and capital gain distributions are declared separately for each class. Income and capital gain distributions are determined in accordance with income tax regulations, which may differ from GAAP.
Capital accounts within the financial statements are adjusted for permanent book-tax differences. These adjustments have no impact on net assets or the results of operations. Capital accounts are not adjusted for temporary book-tax differences which will reverse in a subsequent period.
Book-tax differences are primarily due to swaps, market discount, redemptions in kind, deferred trustees compensation, capital loss carryforwards and losses deferred due to wash sales.
The federal tax cost of investment securities and unrealized appreciation (depreciation) as of period end were as follows:
| Gross unrealized appreciation | $2,856,552 |
| Gross unrealized depreciation | (6,250,299) |
| Net unrealized appreciation (depreciation) on securities | $(3,393,747) |
| Tax cost | $960,505,337 |
Capital loss carryforwards are only available to offset future capital gains of the Fund to the extent provided by regulations and may be limited. Under the Regulated Investment Company Modernization Act of 2010 (the Act), the Fund is permitted to carry forward capital losses incurred in taxable years beginning after December 22, 2010 for an unlimited period and such capital losses are required to be used prior to any losses that expire. The capital loss carryforward information presented below, including any applicable limitation, is estimated as of prior fiscal period end and is subject to adjustment.
| Fiscal year of expiration | |
| 2017 | $(19,679,244) |
| 2018 | (16,553,917) |
| Total capital loss carryforward | $(36,233,161) |
Repurchase Agreements. Pursuant to an Exemptive Order issued by the SEC, the Fund along with other registered investment companies having management contracts with FMR, or other affiliated entities of FMR, are permitted to transfer uninvested cash balances into joint trading accounts which are then invested in repurchase agreements. The Fund may also invest directly with institutions in repurchase agreements. Repurchase agreements may be collateralized by government or non-government securities. Upon settlement date, collateral is held in segregated accounts with custodian banks and may be obtained in the event of a default of the counterparty. The Fund monitors, on a daily basis, the value of the collateral to ensure it is at least equal to the principal amount of the repurchase agreement (including accrued interest). In the event of a default by the counterparty, realization of the collateral proceeds could be delayed, during which time the value of the collateral may decline.
Restricted Securities. The Fund may invest in securities that are subject to legal or contractual restrictions on resale. These securities generally may be resold in transactions exempt from registration or to the public if the securities are registered. Disposal of these securities may involve time-consuming negotiations and expense, and prompt sale at an acceptable price may be difficult. Information regarding restricted securities is included at the end of the Fund's Schedule of Investments.
4. Derivative Instruments.
Risk Exposures and the Use of Derivative Instruments. The Fund's investment objective allows the Fund to enter into various types of derivative contracts, including swaps. Derivatives are investments whose value is primarily derived from underlying assets, indices or reference rates and may be transacted on an exchange or over-the-counter (OTC). Derivatives may involve a future commitment to buy or sell a specified asset based on specified terms, to exchange future cash flows at periodic intervals based on a notional principal amount, or for one party to make one or more payments upon the occurrence of specified events in exchange for periodic payments from the other party.
The Fund used derivatives to increase returns, to gain exposure to certain types of assets and to manage exposure to certain risks as defined below. The success of any strategy involving derivatives depends on analysis of numerous economic factors, and if the strategies for investment do not work as intended, the Fund may not achieve its objectives.
The Fund's use of derivatives increased or decreased its exposure to the following risk:
| Credit Risk | Credit risk relates to the ability of the issuer of a financial instrument to make further principal or interest payments on an obligation or commitment that it has to the Fund.
|
The Fund is also exposed to additional risks from investing in derivatives, such as liquidity risk and counterparty credit risk. Liquidity risk is the risk that the Fund will be unable to close out the derivative in the open market in a timely manner. Counterparty credit risk is the risk that the counterparty will not be able to fulfill its obligation to the Fund. Derivative counterparty credit risk is managed through formal evaluation of the creditworthiness of all potential counterparties. On certain OTC derivatives such as bi-lateral swaps, the Fund attempts to reduce its exposure to counterparty credit risk by entering into an International Swaps and Derivatives Association, Inc. (ISDA) Master Agreement with each of its counterparties. The ISDA Master Agreement gives the Fund the right to terminate all transactions traded under such agreement upon the deterioration in the credit quality of the counterparty beyond specified levels. The ISDA Master Agreement gives each party the right, upon an event of default by the other party or a termination of the agreement, to close out all transactions traded under such agreement and to net amounts owed under each transaction to one net payable by one party to the other. To mitigate counterparty credit risk on bi-lateral OTC derivatives, the Fund receives collateral in the form of cash or securities once the Fund's net unrealized appreciation on outstanding derivative contracts under an ISDA Master Agreement exceeds certain applicable thresholds, subject to certain minimum transfer provisions. The collateral received is held in segregated accounts with the Fund's custodian bank in accordance with the collateral agreements entered into between the Fund, the counterparty and the Fund's custodian bank. The Fund could experience delays and costs in gaining access to the collateral even though it is held by the Fund's custodian bank. The Fund's maximum risk of loss from counterparty credit risk related to bi-lateral OTC derivatives is generally the aggregate unrealized appreciation and unpaid counterparty payments in excess of any collateral pledged by the counterparty to the Fund. The Fund may be required to pledge collateral for the benefit of the counterparties on bi-lateral OTC derivatives in an amount not less than each counterparty's unrealized appreciation on outstanding derivative contracts, subject to certain minimum transfer provisions, and any such pledged collateral is identified in the Schedule of Investments.
Investing in derivatives may involve greater risks than investing in the underlying assets directly and, to varying degrees, may involve risk of loss in excess of any initial investment and collateral received and amounts recognized in the Statement of Assets and Liabilities. In addition, there may be the risk that the change in value of the derivative contract does not correspond to the change in value of the underlying instrument.
Net Realized Gain (Loss) and Change in Net Unrealized Appreciation (Depreciation) on Derivatives. The table below, which reflects the impacts of derivatives on the financial performance of the Fund, summarizes the net realized gain (loss) and change in net unrealized appreciation (depreciation) for derivatives during the period as presented in the Statement of Operations.
| Primary Risk Exposure / Derivative Type | Net Realized Gain (Loss) | Change in Net Unrealized Appreciation (Depreciation) |
| Credit Risk | | |
| Swaps(a) | $505 | $1,505 |
(a) A summary of the value of derivatives by primary risk exposure as of period end, is included at the end of the Schedule of Investments.
Swaps. A swap is a contract between two parties to exchange future cash flows at periodic intervals based on a notional principal amount. A bi-lateral OTC swap is a transaction between a fund and a dealer counterparty where cash flows are exchanged between the two parties for the life of the swap.
Bi-lateral OTC swaps are marked-to-market daily and changes in value are reflected in the Statement of Assets and Liabilities in the bi-lateral OTC swaps at value line items. Any upfront premiums paid or received upon entering a bi-lateral OTC swap to compensate for differences between stated terms of the swap and prevailing market conditions (e.g. credit spreads, interest rates or other factors) are recorded in net unrealized appreciation (depreciation) in the Statement of Assets and Liabilities and amortized to realized gain or (loss) ratably over the term of the swap. Any unamortized upfront premiums are presented in the Schedule of Investments.
Payments are exchanged at specified intervals, accrued daily commencing with the effective date of the contract and recorded as realized gain or (loss). Some swaps may be terminated prior to the effective date and realize a gain or loss upon termination. The net realized gain (loss) and change in net unrealized appreciation (depreciation) on swaps during the period is included in the Statement of Operations.
Any open swaps at period end are included in the Schedule of Investments under the caption "Swaps" and are representative of volume of activity during the period.
Credit Default Swaps. Credit default swaps enable the Fund to buy or sell protection against specified credit events on a single-name issuer or a traded credit index. Under the terms of a credit default swap the buyer of protection (buyer) receives credit protection in exchange for making periodic payments to the seller of protection (seller) based on a fixed percentage applied to a notional principal amount. In return for these payments, the seller will be required to make a payment upon the occurrence of one or more specified credit events. The Fund enters into credit default swaps as a seller to gain credit exposure to an issuer and/or as a buyer to obtain a measure of protection against defaults of an issuer. Periodic payments are made over the life of the contract by the buyer provided that no credit event occurs.
For credit default swaps on most corporate and sovereign issuers, credit events include bankruptcy, failure to pay or repudiation/moratorium. For credit default swaps on corporate or sovereign issuers, the obligation that may be put to the seller is not limited to the specific reference obligation described in the Schedule of Investments. For credit default swaps on asset-backed securities, a credit event may be triggered by events such as failure to pay principal, maturity extension, rating downgrade or write-down. For credit default swaps on asset-backed securities, the reference obligation described represents the security that may be put to the seller. For credit default swaps on a traded credit index, a specified credit event may affect all or individual underlying securities included in the index.
As a seller, if an underlying credit event occurs, the Fund will pay a net settlement amount of cash equal to the notional amount of the swap less the recovery value of the reference obligation or underlying securities comprising an index. Only in the event of the industry's inability to value the underlying asset will the Fund be required to take delivery of the reference obligation or underlying securities comprising an index and pay an amount equal to the notional amount of the swap.
As a buyer, if an underlying credit event occurs, the Fund will receive a net settlement amount of cash equal to the notional amount of the swap less the recovery value of the reference obligation or underlying securities comprising an index. Only in the event of the industry's inability to value the underlying asset will the Fund be required to deliver the reference obligation or underlying securities comprising an index in exchange for payment of an amount equal to the notional amount of the swap.
Typically, the value of each credit default swap and credit rating disclosed for each reference obligation in the Schedule of Investments, where the Fund is the seller, can be used as measures of the current payment/performance risk of the swap. As the value of the swap changes as a positive or negative percentage of the total notional amount, the payment/performance risk may decrease or increase, respectively. In addition to these measures, the investment adviser monitors a variety of factors including cash flow assumptions, market activity and market sentiment as part of its ongoing process of assessing payment/performance risk.
5. Purchases and Sales of Investments.
Purchases and sales of securities, other than short-term securities and U.S. government securities, aggregated $92,021,474 and $90,665,836, respectively.
6. Fees and Other Transactions with Affiliates.
Management Fee. Fidelity Management & Research Company (the investment adviser) and its affiliates provide the Fund with investment management related services for which the Fund pays a monthly management fee. The management fee is the sum of an individual fund fee rate that is based on an annual rate of .20% of the Fund's average net assets and an annualized group fee rate that averaged .11% during the period. The group fee rate is based upon the average net assets of all the mutual funds advised by the investment adviser, including any mutual funds previously advised by the investment adviser that are currently advised by Fidelity SelectCo, LLC, an affiliate of the investment adviser. The group fee rate decreases as assets under management increase and increases as assets under management decrease. For the reporting period, the total annualized management fee rate was .31% of the Fund's average net assets.
Distribution and Service Plan Fees. In accordance with Rule 12b-1 of the 1940 Act, the Fund has adopted separate Distribution and Service Plans for each class of shares. Certain classes pay Fidelity Distributors Corporation (FDC), an affiliate of the investment adviser, separate Distribution and Service Fees, each of which is based on an annual percentage of each class' average net assets. In addition, FDC may pay financial intermediaries for selling shares of the Fund and providing shareholder support services. For the period, the Distribution and Service Fee rates, total fees and amounts retained by FDC were as follows:
| | Distribution
Fee | Service
Fee | Total Fees | Retained
by FDC |
| Class A | -% | .15% | $135,698 | $– |
| Class T | -% | .15% | 70,384 | 257 |
| Class B | .65% | .25% | 6,425 | 4,644 |
| Class C | .75% | .25% | 407,992 | 38,527 |
| | | | $620,499 | $43,428 |
Sales Load. FDC may receive a front-end sales charge of up to 1.50% for selling Class A and Class T shares, some of which is paid to financial intermediaries for selling shares of the Fund. Depending on the holding period, FDC may receive a contingent deferred sales charges levied on Class A, Class T, Class B and Class C redemptions. The deferred sales charges range from 3.00% to 1.00% for Class B shares, 1.00% for Class C shares, .75% or .50% for certain purchases of Class A shares and .25% for certain purchases of Class T shares.
For the period, sales charge amounts retained by FDC were as follows:
| | Retained
by FDC |
| Class A | $13,328 |
| Class T | 3,490 |
| Class B(a) | 407 |
| Class C(a) | 3,832 |
| | $21,057 |
(a) When Class B and Class C shares are initially sold, FDC pays commissions from its own resources to financial intermediaries through which the sales are made.
Transfer Agent Fees. Fidelity Investments Institutional Operations Company, Inc., (FIIOC), an affiliate of the investment adviser, is the transfer, dividend disbursing and shareholder servicing agent for each class of the Fund. FIIOC receives account fees and asset-based fees that vary according to the account size and type of account of the shareholders of the respective classes of the Fund. FIIOC pays for typesetting, printing and mailing of shareholder reports, except proxy statements.
For the period, transfer agent fees for each class were as follows:
| | Amount | % of
Class-Level Average
Net Assets(a) |
| Class A | $142,680 | .16 |
| Class T | 78,633 | .17 |
| Class B | 1,274 | .18 |
| Class C | 67,758 | .17 |
| Class I | 363,976 | .16 |
| | $654,321 | |
(a) Annualized
Accounting and Security Lending Fees. Fidelity Service Company, Inc. (FSC), an affiliate of the investment adviser, maintains the Fund's accounting records. The accounting fee is based on the level of average net assets for each month. Under a separate contract, FSC administers the security lending program. The security lending fee is based on the number and duration of lending transactions.
Interfund Trades. The Fund may purchase from or sell securities to other Fidelity Funds under procedures adopted by the Board. The procedures have been designed to ensure these interfund trades are executed in accordance with Rule 17a-7 of the 1940 Act. Interfund trades are included within the respective purchases and sales amounts shown in the Purchases and Sales of Investments note.
7. Committed Line of Credit.
The Fund participates with other funds managed by the investment adviser or an affiliate in a $4.25 billion credit facility (the "line of credit") to be utilized for temporary or emergency purposes to fund shareholder redemptions or for other short-term liquidity purposes. The Fund has agreed to pay commitment fees on its pro-rata portion of the line of credit, which amounted to $534 and is reflected in Miscellaneous expenses on the Statement of Operations. During the period, the Fund did not borrow on this line of credit.
8. Security Lending.
The Fund lends portfolio securities from time to time in order to earn additional income. On the settlement date of the loan, the Fund receives collateral (in the form of U.S. Treasury obligations, letters of credit and/or cash) against the loaned securities and maintains collateral in an amount not less than 100% of the market value of the loaned securities during the period of the loan. The market value of the loaned securities is determined at the close of business of the Fund and any additional required collateral is delivered to the Fund on the next business day. The Fund or borrower may terminate the loan at any time, and if the borrower defaults on its obligation to return the securities loaned because of insolvency or other reasons, the Fund may apply collateral received from the borrower against the obligation. The Fund may experience delays and costs in recovering the securities loaned. Any cash collateral received is maintained at the Fund's custodian and/or invested in cash equivalents. The value of loaned securities and cash collateral at period end are disclosed on the Fund's Statement of Assets and Liabilities. Security lending income represents the income earned on investing cash collateral, less rebates paid to borrowers, plus any premium payments received for lending certain types of securities. Security lending income is presented in the Statement of Operations as a component of interest income. Total security lending income during the period amounted to $24,380.
9. Expense Reductions.
Through arrangements with the Fund's custodian, credits realized as a result of certain uninvested cash balances were used to reduce the Fund's expenses. During the period, these credits reduced the Fund's custody expenses by $264.
In addition, during the period the investment adviser reimbursed and/or waived a portion of fund-level operating expenses in the amount of $1,650.
10. Distributions to Shareholders.
Distributions to shareholders of each class were as follows:
| | Six months ended February 29, 2016 | Year ended August 31, 2015 |
| From net investment income | | |
| Class A | $1,089,372 | $1,196,541 |
| Class T | 554,506 | 690,330 |
| Class B | 3,806 | 3 |
| Class C | 230,543 | – |
| Class I | 3,089,279 | 4,659,235 |
| Total | $4,967,506 | $6,546,109 |
| From net realized gain | | |
| Class A | $– | $18,431 |
| Class T | – | 10,934 |
| Class B | – | 215 |
| Class C | – | 9,861 |
| Class I | – | 68,100 |
| Total | $– | $107,541 |
11. Share Transactions.
Share transactions for each class were as follows and may contain automatic conversions between classes or exchanges between affiliated funds:
| | Shares | Shares | Dollars | Dollars |
| | Six months ended February 29, 2016 | Year ended August 31, 2015 | Six months ended February 29, 2016 | Year ended August 31, 2015 |
| Class A | | | | |
| Shares sold | 7,849,506 | 9,536,050 | $73,181,395 | $89,219,339 |
| Reinvestment of distributions | 110,687 | 121,681 | 1,030,552 | 1,138,630 |
| Shares redeemed | (5,780,451) | (10,949,529) | (53,915,300) | (102,439,584) |
| Net increase (decrease) | 2,179,742 | (1,291,798) | $20,296,647 | $(12,081,615) |
| Class T | | | | |
| Shares sold | 1,673,125 | 1,879,243 | $15,611,878 | $17,595,238 |
| Reinvestment of distributions | 55,692 | 69,901 | 518,719 | 654,822 |
| Shares redeemed | (1,900,643) | (2,777,951) | (17,734,399) | (26,009,778) |
| Net increase (decrease) | (171,826) | (828,807) | $(1,603,802) | $(7,759,718) |
| Class B | | | | |
| Shares sold | 32,684 | 42,735 | $303,556 | $399,209 |
| Reinvestment of distributions | 396 | 22 | 3,664 | 205 |
| Shares redeemed | (55,356) | (135,082) | (515,352) | (1,261,842) |
| Net increase (decrease) | (22,276) | (92,325) | $(208,132) | $(862,428) |
| Class C | | | | |
| Shares sold | 2,682,263 | 2,346,637 | $24,881,633 | $21,884,227 |
| Reinvestment of distributions | 21,373 | 928 | 197,485 | 8,636 |
| Shares redeemed | (1,767,467) | (4,360,719) | (16,407,195) | (40,704,289) |
| Net increase (decrease) | 936,169 | (2,013,154) | $8,671,923 | $(18,811,426) |
| Class I | | | | |
| Shares sold | 15,328,987 | 43,630,494 | $143,083,389 | $408,337,380 |
| Reinvestment of distributions | 308,396 | 470,860 | 2,873,079 | 4,410,891 |
| Shares redeemed | (11,199,972) | (57,895,728)(a) | (104,561,193) | (542,178,633)(a) |
| Net increase (decrease) | 4,437,411 | (13,794,374) | $41,395,275 | $(129,430,362) |
(a) Amount includes in-kind redemptions.
12. Other.
The Fund's organizational documents provide former and current trustees and officers with a limited indemnification against liabilities arising in connection with the performance of their duties to the Fund. In the normal course of business, the Fund may also enter into contracts that provide general indemnifications. The Fund's maximum exposure under these arrangements is unknown as this would be dependent on future claims that may be made against the Fund. The risk of material loss from such claims is considered remote.
13. Credit Risk.
The Fund invests a portion of its assets in structured securities of issuers backed by commercial and residential mortgage loans, credit card receivables and automotive loans. The value and related income of these securities is sensitive to changes in economic conditions, including delinquencies and/or defaults.
14. Proposed Reorganization.
The Board of Trustees of the Fund approved an Agreement and Plan of Reorganization (the Agreement) between the Fund and Short Term Bond Fund. The Agreement provides for the transfer of all the assets and the assumption of all the liabilities of the Fund in exchange for corresponding shares of Short Term Bond Fund equal in value to the net assets of the Fund on the day the reorganization is effective. The reorganization does not require shareholder approval and is expected to become effective on or about July 15, 2016. The reorganization is expected to qualify as a tax-free transaction for federal income tax purposes with no gain or loss recognized by the funds or their shareholders.
Shareholder Expense Example
As a shareholder of the Fund, you incur two types of costs: (1) transaction costs, including sales charges (loads) on purchase payments or redemption proceeds, and (2) ongoing costs, including management fees, distribution and/or service (12b-1) fees and other Fund expenses. This Example is intended to help you understand your ongoing costs (in dollars) of investing in the Fund and to compare these costs with the ongoing costs of investing in other mutual funds.
The Example is based on an investment of $1,000 invested at the beginning of the period and held for the entire period (September 1, 2015 to February 29, 2016).
Actual Expenses
The first line of the accompanying table for each class of the Fund provides information about actual account values and actual expenses. You may use the information in this line, together with the amount you invested, to estimate the expenses that you paid over the period. Simply divide your account value by $1,000.00 (for example, an $8,600 account value divided by $1,000.00 = 8.6), then multiply the result by the number in the first line for a class of the Fund under the heading entitled "Expenses Paid During Period" to estimate the expenses you paid on your account during this period. In addition, the Fund, as a shareholder in the underlying Fidelity Central Funds, will indirectly bear its pro-rata share of the fees and expenses incurred by the underlying Fidelity Central Funds. These fees and expenses are not included in the Fund's annualized expense ratio used to calculate the expense estimate in the table below.
Hypothetical Example for Comparison Purposes
The second line of the accompanying table for each class of the Fund provides information about hypothetical account values and hypothetical expenses based on a Class' actual expense ratio and an assumed rate of return of 5% per year before expenses, which is not the Class' actual return. The hypothetical account values and expenses may not be used to estimate the actual ending account balance or expenses you paid for the period. You may use this information to compare the ongoing costs of investing in the Fund and other funds. To do so, compare this 5% hypothetical example with the 5% hypothetical examples that appear in the shareholder reports of the other funds. In addition, the Fund, as a shareholder in the underlying Fidelity Central Funds, will indirectly bear its pro-rata share of the fees and expenses incurred by the underlying Fidelity Central Funds. These fees and expenses are not included in the Fund's annualized expense ratio used to calculate the expense estimate in the table below.
Please note that the expenses shown in the table are meant to highlight your ongoing costs only and do not reflect any transaction costs. Therefore, the second line of the table is useful in comparing ongoing costs only, and will not help you determine the relative total costs of owning different funds. In addition, if these transactional costs were included, your costs would have been higher.
| | Annualized Expense Ratio-A | Beginning
Account Value
September 1, 2015 | Ending
Account Value
February 29, 2016 | Expenses Paid
During Period-B
September 1, 2015
to February 29, 2016 |
| Class A | .71% | | | |
| Actual | | $1,000.00 | $1,004.90 | $3.54 |
| Hypothetical-C | | $1,000.00 | $1,021.33 | $3.57 |
| Class T | .72% | | | |
| Actual | | $1,000.00 | $1,004.90 | $3.59 |
| Hypothetical-C | | $1,000.00 | $1,021.28 | $3.62 |
| Class B | 1.48% | | | |
| Actual | | $1,000.00 | $999.70 | $7.36 |
| Hypothetical-C | | $1,000.00 | $1,017.50 | $7.42 |
| Class C | 1.57% | | | |
| Actual | | $1,000.00 | $999.60 | $7.81 |
| Hypothetical-C | | $1,000.00 | $1,017.06 | $7.87 |
| Class I | .56% | | | |
| Actual | | $1,000.00 | $1,005.70 | $2.79 |
| Hypothetical-C | | $1,000.00 | $1,022.08 | $2.82 |
A Annualized expense ratio reflects expenses net of applicable fee waivers.
B Expenses are equal to each Class' annualized expense ratio, multiplied by the average account value over the period, multiplied by 182/366 (to reflect the one-half year period).
C 5% return per year before expenses
Board Approval of Investment Advisory Contracts and Management Fees
Fidelity Advisor Short Fixed-Income Fund
Each year, the Board of Trustees, including the Independent Trustees (together, the Board), votes on the renewal of the management contract with Fidelity Management & Research Company (FMR) and the sub-advisory agreements (together, the Advisory Contracts) for the fund. The Board, assisted by the advice of fund counsel and Independent Trustees' counsel, requests and considers a broad range of information relevant to the renewal of the Advisory Contracts throughout the year.
The Board meets regularly and, at each of its meetings, covers an extensive agenda of topics and materials and considers factors that are relevant to its annual consideration of the renewal of the fund's Advisory Contracts, including the services and support provided to the fund and its shareholders. The Board has established four standing committees (Committees) — Operations, Audit, Fair Valuation, and Governance and Nominating — each composed of and chaired by Independent Trustees with varying backgrounds, to which the Board has assigned specific subject matter responsibilities in order to enhance effective decision-making by the Board. The Operations Committee, of which all of the Independent Trustees are members, meets regularly throughout the year and considers, among other matters, information specifically related to the annual consideration of the renewal of the fund's Advisory Contracts. The Board, acting directly and through its Committees, requests and receives information concerning the annual consideration of the renewal of the fund's Advisory Contracts. The Board also meets as needed to consider matters specifically related to the Board's annual consideration of the renewal of the Advisory Contracts. Members of the Board may also meet with trustees of other Fidelity funds through ad hoc joint committees to discuss certain matters relevant to all of the Fidelity funds.
At its September 2015 meeting, the Board unanimously determined to renew the fund's Advisory Contracts. In reaching its determination, the Board considered all factors it believed relevant, including (i) the nature, extent, and quality of the services to be provided to the fund and its shareholders (including the investment performance of the fund); (ii) the competitiveness of the fund's management fee and total expense ratio relative to peer funds; (iii) the total costs of the services to be provided by and the profits to be realized by Fidelity from its relationship with the fund; and (iv) the extent to which (if any) economies of scale exist and would be realized as the fund grows, and whether any economies of scale are appropriately shared with fund shareholders.
In considering whether to renew the Advisory Contracts for the fund, the Board reached a determination, with the assistance of fund counsel and Independent Trustees' counsel and through the exercise of its business judgment, that the renewal of the Advisory Contracts was in the best interests of the fund and its shareholders and that the compensation payable under the Advisory Contracts was fair and reasonable. The Board's decision to renew the Advisory Contracts was not based on any single factor, but rather was based on a comprehensive consideration of all the information provided to the Board at its meetings throughout the year. The Board, in reaching its determination to renew the Advisory Contracts, was aware that shareholders of the fund have a broad range of investment choices available to them, including a wide choice among funds offered by Fidelity's competitors, and that the fund's shareholders, who have the opportunity to review and weigh the disclosure provided by the fund in its prospectus and other public disclosures, have chosen to invest in this fund, which is part of the Fidelity family of funds.
Nature, Extent, and Quality of Services Provided. The Board considered Fidelity's staffing as it relates to the fund, including the backgrounds of investment personnel of Fidelity, and also considered the fund's investment objective, strategies, and related investment philosophy. The Independent Trustees also had discussions with senior management of Fidelity's investment operations and investment groups. The Board considered the structure of the portfolio manager compensation program and whether this structure provides appropriate incentives to act in the best interests of the fund. Additionally, the Board considered the portfolio managers' investments, if any, in the funds that they manage.
Resources Dedicated to Investment Management and Support Services. The Board reviewed the general qualifications and capabilities of Fidelity's investment staff, including its size, education, experience, and resources, as well as Fidelity's approach to recruiting, training, managing, and compensating investment personnel. The Board noted that Fidelity has continued to increase the resources devoted to non-U.S. offices, including expansion of Fidelity's global investment organization. The Board also noted that Fidelity's analysts have extensive resources, tools and capabilities that allow them to conduct sophisticated quantitative and fundamental analysis, as well as credit analysis of issuers, counterparties and guarantors. Further, the Board considered that Fidelity's investment professionals have sufficient access to global information and data so as to provide competitive investment results over time, and that those professionals also have access to sophisticated tools that permit them to assess portfolio construction and risk and performance attribution characteristics continuously, as well as to transmit new information and research conclusions rapidly around the world. Additionally, in its deliberations, the Board considered Fidelity's trading, risk management, compliance, and technology and operations capabilities and resources, which are integral parts of the investment management process.
Shareholder and Administrative Services. The Board considered (i) the nature, extent, quality, and cost of advisory, administrative, and shareholder services performed by FMR, the sub-advisers (together with FMR, the Investment Advisers), and their affiliates under the Advisory Contracts and under separate agreements covering transfer agency, pricing and bookkeeping, and securities lending services for the fund; (ii) the nature and extent of the supervision of third party service providers, principally custodians, subcustodians, and pricing vendors; and (iii) the resources devoted to, and the record of compliance with, the fund's compliance policies and procedures.
The Board noted that the growth of fund assets over time across the complex allows Fidelity to reinvest in the development of services designed to enhance the value or convenience of the Fidelity funds as investment vehicles. These services include 24-hour access to account information and market information through telephone representatives and over the Internet, investor education materials and asset allocation tools, and the expanded availability of Fidelity Investor Centers.
Investment in a Large Fund Family. The Board considered the benefits to shareholders of investing in a Fidelity fund, including the benefits of investing in a fund that is part of a large family of funds offering a variety of investment disciplines and providing a large variety of mutual fund investor services. The Board noted that Fidelity had taken, or had made recommendations that resulted in the Fidelity funds taking, a number of actions over the previous year that benefited particular funds, including (i) continuing to dedicate additional resources to investment research and to the support of the senior management team that oversees asset management; (ii) continuing efforts to enhance Fidelity's global research capabilities; (iii) launching new funds and making other enhancements to meet client needs; (iv) reducing management fees and total expenses for certain index funds and diversified international funds; (v) continuing to launch dedicated lower cost underlying funds to meet portfolio construction needs related to expanding underlying fund options for Fidelity funds of funds, specifically for the Freedom Fund product lines; (vi) rationalizing product lines and gaining increased efficiencies through fund mergers; (vii) launching active fixed-income exchange-traded funds; (viii) continuing to develop, acquire and implement systems and technology to improve services to the funds and shareholders, strengthen information security, and increase efficiency; (ix) implementing investment enhancements to further strengthen Fidelity's target date product line to increase investors' probability of success in achieving their goals; (x) modifying the eligibility criteria for certain share classes to accommodate roll-over assets from employer-sponsored retirement plans; (xi) launching a new Class W of the Freedom Index Funds to attract and retain Fidelity record-kept retirement plan assets; and (xii) implementing changes to Fidelity's money market product line in response to recent money market regulatory reforms.
Investment Performance. The Board considered whether the fund has operated in accordance with its investment objective, as well as its record of compliance with its investment restrictions and its performance history.
The Board took into account discussions with representatives of the Investment Advisers about fund investment performance that occur at Board meetings throughout the year. In this regard the Board noted that as part of regularly scheduled fund reviews and other reports to the Board on fund performance, the Board considers annualized return information for the fund for different time periods, measured against a securities market index ("benchmark index") and a peer group of funds with similar objectives ("peer group"), if any. In its evaluation of fund investment performance at meetings throughout the year, the Board gave particular attention to information indicating underperformance of certain Fidelity funds for specific time periods and discussed with the Investment Advisers the reasons for such underperformance.
In addition to reviewing absolute and relative fund performance, the Independent Trustees periodically consider the appropriateness of fund performance metrics in evaluating the results achieved. In general, the Independent Trustees believe that fund performance should be evaluated based on gross performance (before fees and expenses but after transaction costs) compared to appropriate benchmark indices, over appropriate time periods that may include full market cycles, and on net performance (after fees and expenses) compared to peer groups, as applicable, over the same periods, taking into account relevant factors including the following: general market conditions; expectations for interest rate levels and credit conditions; issuer-specific information including credit quality; the potential for incremental return versus the fund's benchmark index weighed against the risks involved in obtaining that incremental return, including the risk of diminished or negative total returns; and fund cash flows and other factors. Depending on the circumstances, the Independent Trustees may be satisfied with a fund's performance notwithstanding that it lags its benchmark index or peer group for certain periods.
The Independent Trustees recognize that shareholders evaluate performance on a net basis over their own holding periods, for which one-, three-, and five-year periods are often used as a proxy. For this reason, the performance information reviewed by the Board also included net cumulative calendar year total return information for the fund and an appropriate benchmark index and peer group for the most recent one-, three-, and five-year periods.
Based on its review, the Board concluded that the nature, extent, and quality of services provided to the fund under the Advisory Contracts should benefit the shareholders of the fund.
Competitiveness of Management Fee and Total Expense Ratio. The Board considered the fund's management fee and total expense ratio compared to "mapped groups" of competitive funds and classes created for the purpose of facilitating the Trustees' competitive analysis of management fees and total expenses. Fidelity creates "mapped groups" by combining similar Lipper investment objective categories that have comparable investment mandates. Combining Lipper investment objective categories aids the Board's management fee and total expense ratio comparisons by broadening the competitive group used for comparison.
Management Fee. The Board considered two proprietary management fee comparisons for the 12-month periods shown in basis points (BP) in the chart below. The group of Lipper funds used by the Board for management fee comparisons is referred to below as the "Total Mapped Group" and, for the reasons explained above, is broader than the Lipper peer group used by the Board for performance comparisons. The Total Mapped Group comparison focuses on a fund's standing in terms of gross management fees before expense reimbursements or caps relative to the total universe of funds with comparable investment mandates, regardless of whether their management fee structures also are comparable. Funds with comparable investment mandates offer exposure to similar types of securities. Funds with comparable management fee structures have similar management fee contractual arrangements (
e.g., flat rate charged for advisory services, all-inclusive fee rate,
etc.). "TMG %" represents the percentage of funds in the Total Mapped Group that had management fees that were lower than the fund's. For example, a hypothetical TMG % of 20% would mean that 80% of the funds in the Total Mapped Group had higher, and 20% had lower, management fees than the fund. The fund's actual TMG %s and the number of funds in the Total Mapped Group are in the chart below. The "Asset-Size Peer Group" (ASPG) comparison focuses on a fund's standing relative to a subset of non-Fidelity funds within the Total Mapped Group that are similar in size and management fee structure. For example, if a fund is in the first quartile of the ASPG, the fund's management fee ranks in the least expensive or lowest 25% of funds in the ASPG. The ASPG represents at least 15% of the funds in the Total Mapped Group with comparable asset size and management fee structures, subject to a minimum of 50 funds (or all funds in the Total Mapped Group if fewer than 50). Additional information, such as the ASPG quartile in which the fund's management fee rate ranked, is also included in the chart and considered by the Board.
Fidelity Advisor Short Fixed-Income Fund
The Board noted that the fund's management fee rate ranked below the median of its Total Mapped Group and below the median of its ASPG for 2014.
The Board noted that, in 2014, the ad hoc Committee on Group Fee was formed by it and other Fidelity fund boards to conduct an in-depth review of the "group fee" component of the management fee of funds with such management fee structures. Committee focus included the mechanics of the group fee, the competitive landscape of group fee structures, Fidelity funds with no group fee component and investment products not included in group fee assets. The Board also considered that, for funds subject to the group fee, FMR agreed to voluntarily waive fees over a specified period of time in amounts designed to account for assets converted from certain funds to certain collective investment trusts.
Based on its review, the Board concluded that the fund's management fee is fair and reasonable in light of the services that the fund receives and the other factors considered.
Total Expense Ratio. In its review of each class's total expense ratio, the Board considered the fund's management fee rate as well as other fund or class expenses, as applicable, such as transfer agent fees, pricing and bookkeeping fees, fund-paid 12b-1 fees, and custodial, legal, and audit fees. The Board also noted that Fidelity may agree to waive fees and expenses from time to time, and the extent to which, if any, it has done so for the fund. As part of its review, the Board also considered the current and historical total expense ratios of each class of the fund compared to competitive fund median expenses. Each class of the fund is compared to those funds and classes in the Total Mapped Group (used by the Board for management fee comparisons) that have a similar sales load structure.
The Board noted that the total expense ratio of each of Class A and Class T ranked below its competitive median for 2014 and the total expense ratio of each of Class B, Class C, and Class I ranked above its competitive median for 2014. The Board considered that, in general, various factors can affect total expense ratios. The Board also considered that the total expense ratio of each of Class B and Class I was above the competitive median because of high transfer agent fees due to small average account size. The Board noted that the total expense ratio of Class C was above the competitive median primarily because of higher 12b-1 fees compared to most competitor funds with Class C. The Board noted that the fund offers multiple classes, each of which has a different sales load and 12b-1 fee structure, and that the multiple structures are intended to offer a range of pricing options for the intermediary market. The Board also noted that the total expense ratios of the classes vary primarily by the level of their 12b-1 fees, although differences in transfer agent fees may also cause expenses to vary from class to class.
Fees Charged to Other Fidelity Clients. The Board also considered Fidelity fee structures and other information with respect to clients of Fidelity, such as other funds advised or subadvised by Fidelity, pension plan clients, and other institutional clients with similar mandates. The Board noted the findings of the 2013 ad hoc joint committee (created with the board of other Fidelity funds), which reviewed and compared Fidelity's institutional investment advisory business with its business of providing services to the Fidelity funds, including the differences in services provided, fees charged, and costs incurred, as well as competition in their respective marketplaces.
Based on its review of total expense ratios and fees charged to other Fidelity clients, the Board concluded that, although in some cases above the median of the universe presented for comparison, the total expense ratio of each class of the fund was reasonable in light of the services that the fund and its shareholders receive and the other factors considered.
Costs of the Services and Profitability. The Board considered the revenues earned and the expenses incurred by Fidelity in conducting the business of developing, marketing, distributing, managing, administering and servicing the fund and servicing the fund's shareholders. The Board also considered the level of Fidelity's profits in respect of all the Fidelity funds.
On an annual basis, Fidelity presents to the Board information about the profitability of its relationship with the fund. Fidelity calculates profitability information for each fund, as well as aggregate profitability information for groups of Fidelity funds and all Fidelity funds, using a series of detailed revenue and cost allocation methodologies which originate with the books and records of Fidelity on which Fidelity's audited financial statements are based. The Audit Committee of the Board reviews any significant changes from the prior year's methodologies.
PricewaterhouseCoopers LLP (PwC), independent registered public accounting firm and auditor to Fidelity and certain Fidelity funds, has been engaged annually by the Board as part of the Board's assessment of Fidelity's profitability analysis. PwC's engagement includes the review and assessment of the methodologies used by Fidelity in determining the revenues and expenses attributable to Fidelity's mutual fund business, and completion of agreed-upon procedures in respect of the mathematical accuracy of fund profitability and its conformity to established allocation methodologies. After considering PwC's reports issued under the engagement and information provided by Fidelity, the Board concluded that while other allocation methods may also be reasonable, Fidelity's profitability methodologies are reasonable in all material respects.
The Board also reviewed Fidelity's non-fund businesses and fall-out benefits related to the mutual fund business as well as cases where Fidelity's affiliates may benefit from or be related to the fund's business.
The Board considered the costs of the services provided by and the profits realized by Fidelity in connection with the operation of the fund and was satisfied that the profitability was not excessive.
Economies of Scale. The Board considered whether there have been economies of scale in respect of the management of the Fidelity funds, whether the Fidelity funds (including the fund) have appropriately benefited from any such economies of scale, and whether there is potential for realization of any further economies of scale. The Board considered the extent to which the fund will benefit from economies of scale as assets grow through increased services to the fund, through waivers or reimbursements, or through fee or expense ratio reductions. The Board also noted that in 2013, it and the boards of other Fidelity funds created an ad hoc committee (the Economies of Scale Committee) to analyze whether Fidelity attains economies of scale in respect of the management and servicing of the Fidelity funds, whether the Fidelity funds have appropriately benefited from such economies of scale, and whether there is potential for realization of any further economies of scale.
The Board recognized that the fund's management contract incorporates a "group fee" structure, which provides for lower group fee rates as total group assets increase, and for higher group fee rates as total group assets decrease (with "group assets" defined to include fund assets under FMR's management plus sector fund assets previously under FMR's management and currently managed by Fidelity SelectCo, LLC). FMR calculates the group fee rates based on a tiered asset "breakpoint" schedule that varies based on asset class. The Board considered that the group fee is designed to deliver the benefits of economies of scale to fund shareholders when total Fidelity fund assets increase, even if assets of any particular fund are unchanged or have declined, because some portion of Fidelity's costs are attributable to services provided to all Fidelity funds, and all funds benefit if those costs can be allocated among more assets. The Board concluded that, given the group fee structure, fund shareholders will benefit from lower management fees as group assets increase at the fund complex level, regardless of whether Fidelity achieves any such economies of scale.
The Board concluded, taking into account the analysis of the Economies of Scale Committee, that economies of scale, if any, are being appropriately shared between fund shareholders and Fidelity.
Additional Information Requested by the Board. In order to develop fully the factual basis for consideration of the Fidelity funds' Advisory Contracts, the Board requested and received additional information on certain topics, including: (i) Fidelity's fund profitability methodology, profitability trends for certain funds, and the impact of certain factors on fund profitability results; (ii) portfolio manager changes that have occurred during the past year and the amount of the investment that each portfolio manager has made in the Fidelity fund(s) that he or she manages; (iii) Fidelity's compensation structure for portfolio managers, research analysts, and other key personnel, including its effects on fund profitability, the rationale for the compensation structure, and the extent to which current market conditions have affected retention and recruitment; (iv) the arrangements with and compensation paid to certain fund sub-advisers on behalf of the Fidelity funds; (v) Fidelity's voluntary waiver of its fees to maintain minimum yields for certain money market funds and classes as well as contractual waivers in place for certain funds; (vi) the methodology with respect to competitive fund data and peer group classifications; (vii) Fidelity's transfer agent fee, expense, and service structures for different funds and classes relative to competitive trends, and the impact of the increased use of omnibus accounts; (viii) Fidelity's long-term expectations for its offerings in the workplace investing channel; (ix) new developments in the retail and institutional marketplaces; and (x) the impact of money market reform on Fidelity's money market funds. In addition, the Board considered its discussions with Fidelity throughout the year regarding enhanced information security initiatives and the funds' fair valuation policies.
Based on its evaluation of all of the conclusions noted above, and after considering all factors it believed relevant, the Board concluded that the advisory fee structures are fair and reasonable, and that the fund's Advisory Contracts should be renewed.
SFII-SANN-0416
1.703633.118
Fidelity® Mortgage Securities Fund
(A Class of Fidelity Advisor® Mortgage Securities Fund)
Semi-Annual Report February 29, 2016 |
|
Contents
To view a fund's proxy voting guidelines and proxy voting record for the 12-month period ended June 30, visit http://www.fidelity.com/proxyvotingresults or visit the Securities and Exchange Commission's (SEC) web site at http://www.sec.gov.
You may also call 1-800-544-8544 to request a free copy of the proxy voting guidelines.
Standard & Poor's, S&P and S&P 500 are registered service marks of The McGraw-Hill Companies, Inc. and have been licensed for use by Fidelity Distributors Corporation.
Other third-party marks appearing herein are the property of their respective owners.
All other marks appearing herein are registered or unregistered trademarks or service marks of FMR LLC or an affiliated company. © 2016 FMR LLC. All rights reserved.
This report and the financial statements contained herein are submitted for the general information of the shareholders of the Fund. This report is not authorized for distribution to prospective investors in the Fund unless preceded or accompanied by an effective prospectus.
A fund files its complete schedule of portfolio holdings with the SEC for the first and third quarters of each fiscal year on Form N-Q. Forms N-Q are available on the SEC’s web site at http://www.sec.gov. A fund's Forms N-Q may be reviewed and copied at the SEC’s Public Reference Room in Washington, DC. Information regarding the operation of the SEC's Public Reference Room may be obtained by calling 1-800-SEC-0330.
For a complete list of a fund's portfolio holdings, view the most recent holdings listing, semiannual report, or annual report on Fidelity's web site at http://www.fidelity.com, http://www.advisor.fidelity.com, or http://www.401k.com, as applicable.
NOT FDIC INSURED •MAY LOSE VALUE •NO BANK GUARANTEE
Neither the Fund nor Fidelity Distributors Corporation is a bank.
Investment Summary (Unaudited)
The information in the following tables is based on the combined investments of the Fund and its pro-rata share of the investments of Fidelity's Fixed-Income Central Funds.
Coupon Distribution as of February 29, 2016
| | % of fund's investments | % of fund's investments 6 months ago |
| Zero coupon bonds | 0.0 | 0.0 |
| 0.01 - 0.99% | 2.0 | 4.1 |
| 1 - 1.99% | 6.5 | 5.4 |
| 2 - 2.99% | 6.4 | 6.5 |
| 3 - 3.99% | 45.1 | 37.7 |
| 4 - 4.99% | 22.6 | 26.6 |
| 5 - 5.99% | 7.5 | 9.2 |
| 6 - 6.99% | 1.8 | 2.1 |
| 7% and above | 1.2 | 1.4 |
Coupon distribution shows the range of stated interest rates on the fund's investments, excluding short-term investments.
Weighted Average Maturity as of February 29, 2016
| | | 6 months ago |
| Years | 4.5 | 5.2 |
This is a weighted average of all the maturities of the securities held in a fund. Weighted Average Maturity (WAM) can be used as a measure of sensitivity to interest rate changes and market changes. Generally, the longer the maturity, the greater the sensitivity to such changes. WAM is based on the dollar-weighted average length of time until principal payments must be paid. Depending on the types of securities held in a fund, certain maturity shortening devices (e.g., demand features, interest rate resets, and call options) may be taken into account when calculating the WAM.
Duration as of February 29, 2016
| | | 6 months ago |
| Years | 3.0 | 3.6 |
Duration is a measure of a security's price sensitivity to changes in interest rates. Duration differs from maturity in that it considers a security's interest payments in addition to the amount of time until the security reaches maturity, and also takes into account certain maturity shortening features (e.g., demand features, interest rate resets, and call options) when applicable. Securities with longer durations generally tend to be more sensitive to interest rate changes than securities with shorter durations. A fund with a longer average duration generally can be expected to be more sensitive to interest rate changes than a fund with a shorter average duration.
Asset Allocation (% of fund's net assets)
| As of February 29, 2016*,** |
| | Mortgage Securities | 82.8% |
| | CMOs and Other Mortgage Related Securities | 25.5% |
| | Asset-Backed Securities | 6.8% |
| | Short-Term Investments and Net Other Assets (Liabilities)*** | (15.1)% |

* Foreign investments - 0.0%
** Futures and Swaps - (5.3)%
*** Short-Term Investments and Net Other Assets (Liabilities) are not included in the pie chart
| As of August 31, 2015*,** |
| | Mortgage Securities | 83.6% |
| | CMOs and Other Mortgage Related Securities | 32.2% |
| | Asset-Backed Securities | 3.5% |
| | Short-Term Investments and Net Other Assets (Liabilities)*** | (19.3)% |

* Foreign investments - 1.0%
** Futures and Swaps - (8.6)%
*** Short-Term Investments and Net Other Assets (Liabilities) are not included in the pie chart
An unaudited holdings listing for the Fund, which presents direct holdings as well as the pro-rata share of any securities and other investments held indirectly through its investment in underlying non-money market Fidelity Central Funds, is available at fidelity.com and/or advisor.fidelity.com, as applicable.
Percentages in the above tables are adjusted for the effect of TBA Sale Commitments.
Percentages shown as 0.0% may reflect amounts less than 0.05%.
Investments February 29, 2016 (Unaudited)
Showing Percentage of Net Assets
| U.S. Government Agency - Mortgage Securities - 88.2% | | | |
| | | Principal Amount (000s) | Value (000s) |
| Fannie Mae - 46.0% | | | |
| 1.814% 9/1/36 (a) | | 86 | 88 |
| 2.07% 4/1/37 (a) | | 104 | 109 |
| 2.108% 3/1/36 (a) | | 129 | 135 |
| 2.26% 1/1/35 (a) | | 176�� | 183 |
| 2.302% 6/1/36 (a) | | 43 | 45 |
| 2.31% 4/1/36 (a) | | 147 | 155 |
| 2.315% 9/1/36 (a) | | 71 | 74 |
| 2.317% 5/1/36 (a) | | 218 | 228 |
| 2.408% 7/1/35 (a) | | 5 | 6 |
| 2.426% 8/1/35 (a) | | 264 | 278 |
| 2.45% 11/1/36 (a) | | 39 | 41 |
| 2.458% 3/1/35 (a) | | 29 | 31 |
| 2.472% 7/1/35 (a) | | 45 | 47 |
| 2.5% 2/1/30 | | 120 | 124 |
| 2.5% 3/1/31 (b) | | 100 | 103 |
| 2.525% 5/1/36 (a) | | 36 | 38 |
| 2.555% 6/1/36 (a) | | 385 | 407 |
| 2.557% 3/1/40 (a) | | 181 | 191 |
| 2.559% 10/1/33 (a) | | 40 | 43 |
| 2.689% 2/1/42 (a) | | 642 | 667 |
| 2.75% 10/1/36 (a) | | 172 | 182 |
| 2.761% 1/1/42 (a) | | 566 | 589 |
| 2.78% 9/1/37 (a) | | 29 | 31 |
| 3% 3/1/31 (b) | | 9,100 | 9,490 |
| 3% 11/1/42 to 3/1/44 | | 44,324 | 45,672 |
| 3% 3/1/46 (b) | | 50,900 | 52,192 |
| 3% 3/1/46 (b) | | 1,000 | 1,025 |
| 3% 3/1/46 (b) | | 700 | 718 |
| 3% 3/1/46 (b) | | 600 | 615 |
| 3.007% 8/1/41 (a) | | 411 | 430 |
| 3.346% 9/1/41 (a) | | 129 | 137 |
| 3.465% 12/1/40 (a) | | 5,394 | 5,666 |
| 3.5% 4/1/29 to 8/1/45 | | 78,604 | 83,098 |
| 3.5% 3/1/46 (b) | | 33,800 | 35,418 |
| 3.5% 3/1/46 (b) | | 20,800 | 21,796 |
| 3.5% 3/1/46 (b) | | 20,700 | 21,691 |
| 3.5% 3/1/46 (b) | | 2,000 | 2,096 |
| 3.5% 3/1/46 (b) | | 7,700 | 8,069 |
| 3.5% 3/1/46 (b) | | 1,000 | 1,048 |
| 3.5% 3/1/46 (b) | | 1,000 | 1,048 |
| 3.5% 3/1/46 (b) | | 1,000 | 1,048 |
| 3.5% 3/1/46 (b) | | 6,000 | 6,287 |
| 3.5% 3/1/46 (b) | | 1,000 | 1,048 |
| 3.5% 3/1/46 (b) | | 7,921 | 8,300 |
| 3.5% 3/1/46 (b) | | 6,679 | 6,999 |
| 4% 11/1/31 to 1/1/46 | | 107,571 | 115,429 |
| 4% 3/1/46 (b) | | 150 | 160 |
| 4% 3/1/46 (b) | | 100 | 107 |
| 4% 3/1/46 (b) | | 4,750 | 5,068 |
| 4% 3/1/46 (b) | | 4,750 | 5,068 |
| 4% 3/1/46 (b) | | 50 | 53 |
| 4% 3/1/46 (b) | | 3,300 | 3,521 |
| 4% 3/1/46 (b) | | 3,300 | 3,521 |
| 4% 3/1/46 (b) | | 1,300 | 1,387 |
| 4.5% 5/1/25 to 4/1/45 | | 41,087 | 44,763 |
| 5% 5/1/20 to 8/1/41 | | 495 | 536 |
| 5.255% 8/1/41 | | 893 | 1,011 |
| 5.5% 2/1/18 to 4/1/39 | | 3,507 | 3,978 |
| 5.565% 8/1/46 (a) | | 44 | 46 |
| 6.5% 3/1/16 to 5/1/38 | | 1,389 | 1,592 |
| 7% 3/1/17 to 5/1/30 | | 913 | 1,062 |
| 7.5% 8/1/22 to 9/1/32 | | 593 | 715 |
| 8% 12/1/29 to 3/1/37 | | 15 | 18 |
| 8.5% 2/1/22 to 3/1/23 | | 56 | 64 |
| 9% 10/1/30 | | 198 | 246 |
| 9.5% 7/1/16 to 8/1/22 | | 4 | 4 |
| | | | 506,035 |
| Freddie Mac - 19.0% | | | |
| 1.945% 3/1/35 (a) | | 89 | 92 |
| 2.154% 8/1/37 (a) | | 77 | 81 |
| 2.175% 6/1/37 (a) | | 29 | 31 |
| 2.21% 3/1/36 (a) | | 230 | 240 |
| 2.246% 5/1/37 (a) | | 74 | 78 |
| 2.362% 10/1/42 (a) | | 596 | 630 |
| 2.372% 11/1/35 (a) | | 264 | 275 |
| 2.481% 5/1/34 (a) | | 6 | 7 |
| 2.51% 6/1/37 (a) | | 21 | 22 |
| 2.54% 6/1/37 (a) | | 271 | 286 |
| 2.562% 6/1/37 (a) | | 464 | 488 |
| 2.595% 4/1/37 (a) | | 9 | 9 |
| 2.668% 4/1/37 (a) | | 96 | 101 |
| 2.698% 6/1/33 (a) | | 708 | 747 |
| 2.795% 7/1/36 (a) | | 73 | 77 |
| 3% 10/1/42 to 1/1/46 | | 37,238 | 38,198 |
| 3.03% 10/1/36 (a) | | 13 | 14 |
| 3.075% 12/1/36 (a) | | 398 | 422 |
| 3.082% 9/1/41 (a) | | 577 | 602 |
| 3.25% 10/1/35 (a) | | 41 | 43 |
| 3.427% 12/1/40 (a) | | 2,450 | 2,563 |
| 3.5% 4/1/42 to 6/1/45 (c) | | 66,999 | 70,339 |
| 4% 2/1/41 to 2/1/46 | | 30,408 | 32,599 |
| 4% 3/1/46 (b) | | 9,300 | 9,910 |
| 4% 3/1/46 (b) | | 4,100 | 4,369 |
| 4.5% 7/1/25 to 8/1/44 | | 10,818 | 11,773 |
| 5% 7/1/33 to 7/1/41 | | 11,164 | 12,438 |
| 5.5% 10/1/17 to 10/1/39 | | 10,414 | 11,714 |
| 6% 5/1/16 to 6/1/39 | | 2,282 | 2,593 |
| 6.5% 7/1/16 to 9/1/39 | | 3,771 | 4,317 |
| 7% 6/1/21 to 9/1/36 | | 1,309 | 1,537 |
| 7.5% 5/1/16 to 7/1/34 | | 1,637 | 1,945 |
| 8% 11/1/16 to 1/1/37 | | 17 | 21 |
| 8.5% 8/1/16 to 9/1/20 | | 1 | 1 |
| 9% 9/1/16 to 5/1/21 | | 5 | 5 |
| 10% 4/1/16 to 12/1/18 | | 0 | 0 |
| | | | 208,567 |
| Ginnie Mae - 23.2% | | | |
| 3% 6/15/42 to 12/20/45 | | 44,519 | 46,174 |
| 3.5% 11/20/41 to 1/20/44 | | 48,738 | 51,564 |
| 3.5% 3/1/46 (b) | | 11,900 | 12,565 |
| 3.5% 3/1/46 (b) | | 12,700 | 13,409 |
| 3.5% 3/1/46 (b) | | 6,100 | 6,441 |
| 3.5% 3/1/46 (b) | | 7,300 | 7,708 |
| 3.5% 3/1/46 (b) | | 1,600 | 1,689 |
| 4% 7/20/33 to 7/20/45 | | 50,826 | 54,466 |
| 4% 3/1/46 (b) | | 1,200 | 1,282 |
| 4% 3/1/46 (b) | | 6,200 | 6,621 |
| 4% 3/1/46 (b) | | 2,200 | 2,350 |
| 4.5% 8/15/33 to 5/20/41 | | 31,098 | 33,988 |
| 5% 9/20/33 to 6/15/41 | | 9,833 | 11,079 |
| 5.5% 10/15/33 to 9/15/39 | | 2,893 | 3,284 |
| 6.5% 10/15/34 to 7/15/36 | | 184 | 217 |
| 7% 2/15/24 to 4/20/32 | | 836 | 996 |
| 7.5% 12/15/21 to 12/15/29 | | 307 | 362 |
| 8% 6/15/21 to 12/15/25 | | 175 | 205 |
| 8.5% 1/15/17 to 10/15/28 | | 139 | 166 |
| 9% 11/20/17 | | 0 | 0 |
| 10.5% 10/20/17 to 2/20/18 | | 1 | 1 |
| | | | 254,567 |
| TOTAL U.S. GOVERNMENT AGENCY - MORTGAGE SECURITIES | | | |
| (Cost $953,105) | | | 969,169 |
|
| Asset-Backed Securities - 6.8% | | | |
| American Credit Acceptance Receivable Trust Series 2016-1A Class A, 2.37% 5/12/20 (d) | | $3,270 | $3,271 |
| American Credit Acceptance Receivables Trust Series 2015-3 Class A, 1.95% 9/12/19 (d) | | 4,058 | 4,048 |
| CFC LLC Series 2014-1A Class A, 1.46% 12/17/18 (d) | | 1,203 | 1,202 |
| Citi Held For Asset Issuance Series 2015-PM33 Class A, 2.56% 5/16/22 (d) | | 1,788 | 1,787 |
| Citi Held For Asset Issuance 2 Series 2015-PM2 Class A, 2% 3/15/22 (d) | | 3,696 | 3,675 |
| CPS Auto Receivables Trust: | | | |
| Series 2013-C Class A, 1.64% 4/16/18 (d) | | 629 | 629 |
| Series 2013-D Class A, 1.54% 7/16/18 (d) | | 1,061 | 1,059 |
| CPS Auto Trust Series 2015-C Class A, 1.77% 6/17/19 (d) | | 8,651 | 8,633 |
| Drive Auto Receivables Trust Series 2015-DA Class A2A, 1.23% 6/15/18 (d) | | 4,782 | 4,778 |
| Exeter Automobile Receivables Trust: | | | |
| Series 2014-2A Class A, 1.06% 8/15/18 (d) | | 679 | 677 |
| Series 2016-1A Class A, 2.8% 7/15/20 (d) | | 5,500 | 5,497 |
| Flagship Credit Auto Trust: | | | |
| Series 2015-3 Class A, 2.34% 10/15/20 (d) | | 2,868 | 2,861 |
| Series 2016-1 Class A, 2.53% 12/15/20 (d) | | 10,800 | 10,774 |
| GSAMP Trust Series 2004-AR1 Class B4, 5.5% 6/25/34 (d) | | 45 | 1 |
| JPMorgan Mortgage Acquisition Trust: | | | |
| Series 2007-CH1 Class AF3, 5.532% 11/25/36 | | 1,084 | 1,103 |
| Series 2007-CH4 Class A3, 0.5458% 2/25/32 (a) | | 1,190 | 1,182 |
| Merrill Lynch Mortgage Investors Trust Series 2006-FF1 Class M2, 0.7258% 8/25/36 (a) | | 5,300 | 5,061 |
| Nationstar HECM Loan Trust: | | | |
| Series 2015-1A Class A, 3.844% 5/25/18 (d) | | 6,679 | 6,646 |
| Series 2016-1A Class A, 3.1294% 2/25/26 (d) | | 2,138 | 2,138 |
| OneMain Financial Issuance Trust Series 2014-1A Class A, 2.43% 6/18/24 (d) | | 1,180 | 1,178 |
| Springcastle SPV Series 2014-AA Class A, 2.7% 5/25/23 (d) | | 6,013 | 5,991 |
| Structured Asset Securities Corp. Series 2005-NC2 Class M3, 0.8565% 5/25/35 (a) | | 1,995 | 1,926 |
| Vericrest Opportunity Loan Trust Series 2014-NP11 Class A1, 3.875% 4/25/55 (d) | | 796 | 792 |
| TOTAL ASSET-BACKED SECURITIES | | | |
| (Cost $75,077) | | | 74,909 |
|
| Collateralized Mortgage Obligations - 12.7% | | | |
| Private Sponsor - 6.1% | | | |
| Banc of America Funding Corp. Series 2015-R3 Class 10A1, 0.5665% 6/27/36 (a)(d) | | 7,033 | 6,744 |
| Banc of America Funding Trust sequential payer Series 2010-R3 Class 1A1, 2.808% 12/26/35 (a)(d) | | 1,352 | 1,369 |
| BCAP LLC II Trust Series 2012-RR10 Class 5A5, 0.6868% 4/26/36 (a)(d) | | 274 | 267 |
| BCAP LLC Trust sequential payer: | | | |
| Series 2010-RR11 Class 6A1, 2.7078% 3/27/36 (a)(d) | | $3,479 | $3,452 |
| Series 2012-RR5 Class 8A5, 0.6021% 7/26/36 (a)(d) | | 908 | 860 |
| Citigroup Mortgage Loan Trust sequential payer: | | | |
| Series 2012-A Class A, 2.5% 6/25/51 (d) | | 3,165 | 3,117 |
| Series 2014-8 Class 2A1, 3.45% 6/27/37 (a)(d) | | 6,623 | 6,629 |
| Credit Suisse Commercial Mortgage Trust: | | | |
| floater Series 2010-15R Class 5A5, 0.7816% 11/26/35 (a)(d) | | 4,976 | 4,930 |
| Series 2014-15R Class 7A3, 1.1596% 10/26/37 (a)(d) | | 2,285 | 2,237 |
| Credit Suisse Mortgage Trust Series 2012-2R Class 1A1, 2.7362% 5/27/35 (a)(d) | | 494 | 507 |
| CSMC: | | | |
| floater Series 2015-1R Class 6A1, 0.7004% 5/27/37 (a)(d) | | 4,408 | 4,035 |
| Series 2011-2R Class 2A1, 2.6521% 7/27/36 (d) | | 3,998 | 3,955 |
| Series 2014-3R Class 2A1, 1.1216% 5/27/37 (a)(d) | | 1,223 | 1,154 |
| Exeter Automobile Receivables Trust Series 2015-2A Class A, 1.54% 11/15/19 (d) | | 6,503 | 6,476 |
| FDIC Trust Series 2013-N1 Class A, 4.5% 10/25/18 (d) | | 181 | 181 |
| First Horizon Mortgage pass-thru Trust Series 2004-AR5 Class 2A1, 2.6557% 10/25/34 (a) | | 320 | 307 |
| JPMorgan Re-REMIC Trust floater Series 2009-5 Class 2A1, 1.9726% 1/26/37 (a)(d) | | 262 | 261 |
| MASTR Adjustable Rate Mortgages Trust Series 2007-3 Class 22A2, 0.6365% 5/25/47 (a) | | 237 | 218 |
| MASTR Alternative Loan Trust Series 2004-6 Class 5A1, 5.4126% 7/25/19 (a) | | 1,150 | 1,158 |
| Merrill Lynch Alternative Note Asset Trust floater Series 2007-OAR1 Class A1, 0.6058% 2/25/37 (a) | | 1,291 | 1,143 |
| Morgan Stanley Re-REMIC Trust Series 2010-R6 Class 1A, 2.6101% 2/26/37 (a)(d) | | 3,048 | 3,061 |
| Nationstar HECM Loan Trust sequential payer Series 2015-2A Class A, 2.8826% 11/25/25 (d) | | 906 | 906 |
| Nomura Resecuritization Trust sequential payer Series 2011-3RA Class 2A1, 2.8917% 3/26/37 (a)(d) | | 2,008 | 1,981 |
| Structured Asset Securities Corp. Series 2003-15A Class 4A, 2.7237% 4/25/33 (a) | | 122 | 118 |
| Thornburg Mortgage Securities Trust floater Series 2003-4 Class A1, 1.0665% 9/25/43 (a) | | 4,121 | 3,949 |
| WaMu Mortgage pass-thru certificates sequential payer: | | | |
| Series 2002-S8 Class 2A7, 5.25% 1/25/18 | | 170 | 171 |
| Series 2003-MS5 Class 1A1, 5% 3/25/18 | | 211 | 214 |
| Wells Fargo Mortgage Backed Securities Trust: | | | |
| Series 2003-I Class A1, 2.6097% 9/25/33 (a) | | 954 | 943 |
| Series 2005-AR10 Class 2A15, 2.7505% 6/25/35 (a) | | 5,237 | 5,332 |
| Series 2005-AR2 Class 1A2, 2.6956% 3/25/35 (a) | | 223 | 205 |
| Series 2006-AR10 Class 3A1, 2.7337% 7/25/36 (a) | | 820 | 803 |
| Wells Fargo Mortgage Loan Trust sequential payer Series 2011-RR4 Class 2A1, 4.3738% 6/27/36 (a)(d) | | 904 | 888 |
| | | | 67,571 |
| U.S. Government Agency - 6.6% | | | |
| Fannie Mae: | | | |
| floater Series 2003-118 Class S, 7.6642% 12/25/33 (a)(e)(f) | | 325 | 75 |
| planned amortization class: | | | |
| Series 1999-17 Class PG, 6% 4/25/29 | | 623 | 682 |
| Series 1999-32 Class PL, 6% 7/25/29 | | 561 | 615 |
| Series 1999-33 Class PK, 6% 7/25/29 | | 359 | 394 |
| Series 2001-52 Class YZ, 6.5% 10/25/31 | | 43 | 50 |
| Series 2005-39 Class TE, 5% 5/25/35 | | 904 | 999 |
| Series 2005-73 Class SA, 16.4169% 8/25/35 (a)(f) | | 69 | 89 |
| Series 2006-105 Class MD, 5.5% 6/25/35 | | 176 | 177 |
| Series 2011-35 Class PA, 4% 2/25/39 | | 293 | 298 |
| sequential payer: | | | |
| Series 2001-20 Class Z, 6% 5/25/31 | | 620 | 680 |
| Series 2001-31 Class ZC, 6.5% 7/25/31 | | 266 | 309 |
| Series 2002-16 Class ZD, 6.5% 4/25/32 | | 89 | 104 |
| Series 2002-74 Class SV, 7.1142% 11/25/32 (a)(e) | | 228 | 43 |
| Series 2012-67 Class AI, 4.5% 7/25/27 (e) | | 816 | 105 |
| Series 06-116 Class SG, 6.2042% 12/25/36 (a)(e)(f) | | 215 | 42 |
| Series 07-40 Class SE, 6.0042% 5/25/37 (a)(e)(f) | | 135 | 23 |
| Series 1993-165 Class SH, 18.5671% 9/25/23 (a)(f) | | 31 | 43 |
| Series 2003-21 Class SK, 7.6642% 3/25/33 (a)(e)(f) | | 101 | 20 |
| Series 2003-35 Class TQ, 7.0642% 5/25/18 (a)(e)(f) | | 35 | 2 |
| Series 2007-57 Class SA, 38.0052% 6/25/37 (a)(f) | | 434 | 929 |
| Series 2007-66 Class SB, 36.9852% 7/25/37 (a)(f) | | 142 | 281 |
| Series 2008-12 Class SG, 5.9142% 3/25/38 (a)(e)(f) | | 725 | 130 |
| Series 2009-114 Class AI, 5% 12/25/23 (e) | | 180 | 6 |
| Series 2009-16 Class SA, 5.8142% 3/25/24 (a)(e)(f) | | 93 | 2 |
| Series 2009-76 Class MI, 5.5% 9/25/24 (e) | | 117 | 5 |
| Series 2009-85 Class IB, 4.5% 8/25/24 (e) | | 81 | 6 |
| Series 2009-93 Class IC, 4.5% 9/25/24 (e) | | 121 | 8 |
| Series 2010-12 Class AI, 5% 12/25/18 (e) | | 407 | 18 |
| Series 2010-135 Class LS, 5.6142% 12/25/40 (a)(e)(f) | | 663 | 119 |
| Series 2010-139 Class NI, 4.5% 2/25/40 (e) | | 853 | 108 |
| Series 2010-23: | | | |
| Class AI, 5% 12/25/18 (e) | | 164 | 7 |
| Class HI, 4.5% 10/25/18 (e) | | 125 | 5 |
| Series 2010-29 Class LI, 4.5% 6/25/19 (e) | | 366 | 14 |
| Series 2010-97 Class CI, 4.5% 8/25/25 (e) | | 263 | 17 |
| Series 2011-67 Class AI, 4% 7/25/26 (e) | | 223 | 23 |
| Series 2011-83 Class DI, 6% 9/25/26 (e) | | 314 | 38 |
| Series 2013-N1 Class A, 6.2842% 6/25/35 (a)(e)(f) | | 689 | 166 |
| Series 2015-70 Class JC, 3% 10/25/45 | | 3,805 | 3,970 |
| Fannie Mae Stripped Mortgage-Backed Securities: | | | |
| Series 339 Class 29, 5.5% 8/25/18 (e) | | 102 | 4 |
| Series 348 Class 14, 6.5% 8/25/34 (a)(e) | | 180 | 39 |
| Series 351: | | | |
| Class 12, 5.5% 4/25/34 (a)(e) | | 122 | 22 |
| Class 13, 6% 3/25/34 (e) | | 163 | 33 |
| Series 359 Class 19, 6% 7/25/35 (a)(e) | | 111 | 20 |
| Series 384 Class 6, 5% 7/25/37 (e) | | 410 | 76 |
| Freddie Mac: | | | |
| planned amortization class: | | | |
| Series 2095 Class PE, 6% 11/15/28 | | 691 | 761 |
| Series 2104 Class PG, 6% 12/15/28 | | 197 | 216 |
| Series 2121 Class MG, 6% 2/15/29 | | 271 | 297 |
| Series 2154 Class PT, 6% 5/15/29 | | 472 | 518 |
| Series 2162 Class PH, 6% 6/15/29 | | 73 | 80 |
| Series 2520 Class BE, 6% 11/15/32 | | 352 | 386 |
| Series 2585 Class KS, 7.173% 3/15/23 (a)(e)(f) | | 33 | 4 |
| Series 2693 Class MD, 5.5% 10/15/33 | | 5,885 | 6,661 |
| Series 2802 Class OB, 6% 5/15/34 | | 1,628 | 1,829 |
| Series 3002 Class NE, 5% 7/15/35 | | 553 | 609 |
| Series 3189 Class PD, 6% 7/15/36 | | 586 | 655 |
| Series 3415 Class PC, 5% 12/15/37 | | 169 | 185 |
| Series 3786 Class HI, 4% 3/15/38 (e) | | 806 | 84 |
| Series 3806 Class UP, 4.5% 2/15/41 | | 1,347 | 1,451 |
| Series 3832 Class PE, 5% 3/15/41 | | 960 | 1,103 |
| Series 70 Class C, 9% 9/15/20 | | 4 | 4 |
| sequential payer: | | | |
| Series 2114 Class ZM, 6% 1/15/29 | | 93 | 102 |
| Series 2135 Class JE, 6% 3/15/29 | | 352 | 385 |
| Series 2274 Class ZM, 6.5% 1/15/31 | | 155 | 180 |
| Series 2281 Class ZB, 6% 3/15/30 | | 130 | 142 |
| Series 2357 Class ZB, 6.5% 9/15/31 | | 311 | 366 |
| Series 2502 Class ZC, 6% 9/15/32 | | 346 | 383 |
| Series 06-3115 Class SM, 6.173% 2/15/36 (a)(e)(f) | | 177 | 31 |
| Series 1658 Class GZ, 7% 1/15/24 | | 420 | 466 |
| Series 2013-4281 Class AI, 4% 12/15/28 (e) | | 1,900 | 203 |
| Series 2380 Class SY, 7.773% 11/15/31 (a)(e)(f) | | 1,278 | 269 |
| Series 2587 Class IM, 6.5% 3/15/33 (e) | | 186 | 38 |
| Series 2844: | | | |
| Class SC, 44.0245% 8/15/24 (a)(f) | | 13 | 23 |
| Class SD, 80.899% 8/15/24 (a)(f) | | 19 | 45 |
| Series 2935 Class ZK, 5.5% 2/15/35 | | 1,540 | 1,763 |
| Series 2947 Class XZ, 6% 3/15/35 | | 645 | 736 |
| Series 3055 Class CS, 6.163% 10/15/35 (a)(e) | | 238 | 44 |
| Series 3244 Class SG, 6.233% 11/15/36 (a)(e)(f) | | 481 | 107 |
| Series 3274 Class SM, 6.003% 2/15/37 (a)(e) | | 278 | 51 |
| Series 3284 Class CI, 5.693% 3/15/37 (a)(e) | | 1,057 | 200 |
| Series 3287 Class SD, 6.323% 3/15/37 (a)(e)(f) | | 686 | 143 |
| Series 3297 Class BI, 6.333% 4/15/37 (a)(e)(f) | | 1,004 | 211 |
| Series 3336 Class LI, 6.153% 6/15/37 (a)(e) | | 449 | 71 |
| Series 3772 Class BI, 4.5% 10/15/18 (e) | | 252 | 11 |
| Series 3949 Class MK, 4.5% 10/15/34 | | 392 | 425 |
| Series 3955 Class YI, 3% 11/15/21 (e) | | 1,435 | 80 |
| Series 4471 Class PA 4% 12/15/40 | | 5,973 | 6,351 |
| Freddie Mac Manufactured Housing participation certificates guaranteed planned amortization class Series 2043 Class CJ, 6.5% 4/15/28 | | 258 | 298 |
| Freddie Mac Multi-family Structured pass-thru certificates Series 4386 Class AZ, 4.5% 11/15/40 | | 3,238 | 3,654 |
| Ginnie Mae guaranteed REMIC pass-thru certificates: | | | |
| floater: | | | |
| Series 2007-37 Class TS, 6.2645% 6/16/37 (a)(e)(f) | | 232 | 40 |
| Series 2010-H17 Class FA, 0.7519% 7/20/60 (a)(g) | | 282 | 277 |
| Series 2010-H18 Class AF, 0.551% 9/20/60 (a)(g) | | 346 | 340 |
| Series 2010-H19 Class FG, 0.551% 8/20/60 (a)(g) | | 401 | 395 |
| Series 2011-H13 Class FA, 0.751% 4/20/61 (a)(g) | | 168 | 167 |
| planned amortization class Series 2011-136 Class WI, 4.5% 5/20/40 (e) | | 523 | 53 |
| sequential payer: | | | |
| Series 2002-24 Class SK, 7.5245% 4/16/32 (a)(e)(f) | | 1,139 | 251 |
| Series 2002-42 Class ZA, 6% 6/20/32 | | 412 | 476 |
| Series 2004-24 Class ZM, 5% 4/20/34 | | 844 | 939 |
| Series 1999-40 Class SE, 8.5195% 11/16/29 (a)(e)(f) | | 194 | 7 |
| Series 2001-3 Class S, 7.6745% 2/16/31 (a)(e) | | 259 | 54 |
| Series 2001-36: | | | |
| Class SB, 7.6745% 12/16/23 (a)(e)(f) | | 660 | 119 |
| Class SP, 8.3245% 9/16/26 (a)(e) | | 458 | 71 |
| Series 2001-38 Class SB, 7.1545% 8/16/31 (a)(e)(f) | | 422 | 85 |
| Series 2001-41 Class SG, 8.3195% 9/16/31 (a)(e) | | 220 | 28 |
| Series 2001-49: | | | |
| Class SC, 7.1745% 12/16/25 (a)(e)(f) | | 869 | 148 |
| Class SL, 7.1745% 5/16/30 (a)(e)(f) | | 1,178 | 233 |
| Class SV, 7.8245% 12/16/28 (a)(e)(f) | | 321 | 21 |
| Series 2001-50: | | | |
| Class SD, 7.768% 11/20/31 (a)(e)(f) | | 609 | 155 |
| Class ST, 7.2745% 8/16/27 (a)(e)(f) | | 261 | 55 |
| Series 2002-5 Class SP, 7.0245% 1/16/32 (a)(e)(f) | | 419 | 74 |
| Series 2004-32 Class GS, 6.0745% 5/16/34 (a)(e)(f) | | 394 | 83 |
| Series 2004-73 Class AL, 6.7695% 8/17/34 (a)(e)(f) | | 149 | 37 |
| Series 2010-98 Class HS, 6.174% 8/20/40 (a)(e) | | 726 | 129 |
| Series 2011-52 Class HI, 7% 4/16/41 (e) | | 1,570 | 360 |
| Series 2012-76 Class GS, 6.2745% 6/16/42 (a)(e)(f) | | 764 | 153 |
| Series 2012-97 Class JS, 5.8245% 8/16/42 (a)(e)(f) | | 2,686 | 489 |
| Series 2013-124: | | | |
| Class ES, 8.0987% 4/20/39 (a)(f) | | 1,482 | 1,641 |
| Class ST, 8.232% 8/20/39 (a)(f) | | 2,784 | 3,216 |
| Series 2013-147 Class A/S, 5.724% 10/20/43 (a)(e) | | 1,258 | 196 |
| Series 2013-160 Class MS, 5.774% 9/20/32 (a)(e)(f) | | 2,211 | 435 |
| Series 2015-H13 Class HA, 2.5% 8/20/64 (g) | | 13,353 | 13,627 |
| Series 2015-H17 Class HA, 2.5% 5/20/65 (g) | | 5,131 | 5,239 |
| Ginnie Mae pass thru certificates Series 2010-85 Class SE, 6.124% 7/20/40 (a)(e) | | 794 | 139 |
| | | | 72,149 |
| TOTAL COLLATERALIZED MORTGAGE OBLIGATIONS | | | |
| (Cost $137,675) | | | 139,720 |
|
| Commercial Mortgage Securities - 12.8% | | | |
| Asset Securitization Corp. Series 1997-D5 Class PS1, 1.5885% 2/14/43 (a)(e) | | 673 | 5 |
| Banc of America Commercial Mortgage Trust: | | | |
| Series 2006-4 Class A1A, 5.617% 7/10/46 (a) | | 2,102 | 2,117 |
| Series 2007-2 Class A4, 5.79% 4/10/49 (a) | | 1,293 | 1,311 |
| Barclays Commercial Mortgage Securities LLC Series 2015-STP Class A, 3.3228% 9/10/28 (d) | | 5,587 | 5,749 |
| Bayview Commercial Asset Trust floater Series 2007-3: | | | |
| Class M1, 0.7458% 7/25/37 (a)(d) | | 38 | 29 |
| Class M2, 0.7758% 7/25/37 (a)(d) | | 40 | 29 |
| Class M3, 0.8058% 7/25/37 (a)(d) | | 65 | 32 |
| CDGJ Commercial Mortgage Trust Series 2014-BXCH Class A, 1.827% 12/15/27 (a)(d) | | 8,859 | 8,830 |
| Citigroup/Deutsche Bank Commercial Mortgage Trust sequential payer: | | | |
| Series 2006-CD3 Class A5, 5.617% 10/15/48 | | 163 | 164 |
| Series 2007-CD4 Class A4, 5.322% 12/11/49 | | 3,940 | 4,026 |
| COMM Mortgage Trust: | | | |
| floater Series 2014-KYO Class A, 1.324% 6/11/27 (a)(d) | | 5,000 | 4,876 |
| Series 2013-CR10 Class XA, 1.1309% 8/10/46 (a)(e) | | 10,374 | 442 |
| Series 2014-CR19 Class XA, 1.4501% 8/10/47 (a)(e) | | 15,637 | 1,054 |
| Series 2014-CR20 Class XA, 1.3593% 11/10/47 (a)(e) | | 13,165 | 923 |
| Series 2014-LC17 Class XA, 1.1645% 10/10/47 (a)(e) | | 14,979 | 739 |
| Series 2014-UBS4 Class XA, 1.4292% 8/10/47 (a)(e) | | 13,158 | 906 |
| Series 2014-UBS6 Class XA, 1.2201% 12/10/47 (a)(e) | | 8,827 | 537 |
| Series 2015-PC1 Class A5, 3.902% 7/10/50 | | 3,400 | 3,598 |
| CSMC Series 2015-TOWN: | | | |
| Class A, 1.677% 3/15/17 (a)(d) | | 7,804 | 7,713 |
| Class B, 2.327% 3/15/17 (a)(d) | | 185 | 179 |
| Class C, 2.677% 3/15/17 (a)(d) | | 180 | 172 |
| Class D, 3.627% 3/15/17 (a)(d) | | 273 | 259 |
| Freddie Mac: | | | |
| sequential payer: | | | |
| Series K030 Class A2, 3.25% 4/25/23 | | 1,640 | 1,764 |
| Series K033 Class A2, 3.06% 7/25/23 | | 8,600 | 9,129 |
| Series K034 Class A2, 3.531% 7/25/23 | | 5,549 | 6,062 |
| Series K035 Class A2, 3.458% 8/25/23 | | 1,022 | 1,111 |
| Series K032 Class A2, 3.31% 5/25/23 | | 1,628 | 1,755 |
| Series K036 Class A2, 3.527% 10/25/23 | | 2,681 | 2,927 |
| Freddie Mac Multi-family Structured pass-thru certificates sequential payer Series K038 Class A2, 3.389% 3/25/24 | | 1,630 | 1,764 |
| GAHR Commercial Mortgage Trust: | | | |
| floater Series 2015-NRF Class AFL1, 1.7255% 12/15/16 (a)(d) | | 12,633 | 12,512 |
| Series 2015-NRF Class AFX, 3.2349% 12/15/19 (d) | | 7,000 | 7,167 |
| GE Capital Commercial Mortgage Corp.: | | | |
| sequential payer Series 2007-C1 Class A4, 5.543% 12/10/49 | | 914 | 928 |
| Series 2007-C1 Class A1A, 5.483% 12/10/49 (a) | | 4,802 | 4,930 |
| GS Mortgage Securities Trust: | | | |
| floater Series 2014-GSFL Class A, 1.4255% 7/15/31 (a)(d) | | 513 | 505 |
| Series 2015-GC34 Class XA, 1.5357% 10/10/48 (a)(e) | | 10,680 | 1,020 |
| Hyatt Hotel Portfolio Trust floater Series 2015-HYT Class A, 1.6755% 11/15/29 (a)(d) | | 844 | 839 |
| JPMorgan Chase Commercial Mortgage Securities Corp. Series 2012-CBX Class XA, 1.9192% 6/15/45 (a)(e) | | 46,578 | 3,011 |
| JPMorgan Chase Commercial Mortgage Securities Trust: | | | |
| floater Series 2014-BXH Class A, 1.3305% 4/15/27 (a)(d) | | 5,000 | 4,938 |
| sequential payer: | | | |
| Series 2006-CB16 Class A1A, 5.546% 5/12/45 | | 1,306 | 1,315 |
| Series 2006-LDP8 Class A1A, 5.397% 5/15/45 | | 930 | 936 |
| Series 2007-LD11 Class A4, 5.9599% 6/15/49 (a) | | 4,140 | 4,223 |
| Series 2007-CB20 Class A1A, 5.746% 2/12/51 | | 2,508 | 2,616 |
| Merrill Lynch-CFC Commercial Mortgage Trust sequential payer Series 2007-6 Class A4, 5.485% 3/12/51 (a) | | 175 | 179 |
| Morgan Stanley BAML Trust Series 2015-C25 Class XA, 1.3069% 10/15/48 (a)(e) | | 13,837 | 1,078 |
| Morgan Stanley Capital I Trust sequential payer Series 2007-IQ15 Class A4, 6.1142% 6/11/49 (a) | | 1,633 | 1,691 |
| SCG Trust Series 2013-SRP1 Class A, 1.8255% 11/15/26 (a)(d) | | 2,783 | 2,771 |
| Wachovia Bank Commercial Mortgage Trust: | | | |
| sequential payer: | | | |
| Series 2006-C29 Class A1A, 5.297% 11/15/48 | | 6,833 | 6,959 |
| Series 2007-C31: | | | |
| Class A4, 5.509% 4/15/47 | | 313 | 319 |
| Class A5, 5.5% 4/15/47 | | 8,506 | 8,754 |
| Series 2007-C32 Class A3, 5.8991% 6/15/49 (a) | | 1,150 | 1,175 |
| Series 2007-C33 Class A4, 6.1491% 2/15/51 (a) | | 1,786 | 1,845 |
| Series 2006-C27 Class A1A, 5.749% 7/15/45 (a) | | 1,771 | 1,779 |
| Wells Fargo Commercial Mortgage Trust Series 2015-C31 Class XA, 1.2791% 11/15/48 (a)(e) | | 11,180 | 865 |
| TOTAL COMMERCIAL MORTGAGE SECURITIES | | | |
| (Cost $141,740) | | | 140,557 |
| | | Shares | Value (000s) |
|
| Fixed-Income Funds - 0.2% | | | |
| Fidelity Mortgage Backed Securities Central Fund (h) | | | |
| (Cost $1,653) | | 15,043 | 1,656 |
| | | Maturity Amount (000s) | Value (000s) |
|
| Cash Equivalents - 3.1% | | | |
| Investments in repurchase agreements in a joint trading account at 0.4%, dated 2/29/16 due 3/1/16 (Collateralized by U.S. Government Obligations) # | | | |
| (Cost $34,343) | | 34,343 | 34,343 |
| TOTAL INVESTMENT PORTFOLIO - 123.8% | | | |
| (Cost $1,343,593) | | | 1,360,354 |
| NET OTHER ASSETS (LIABILITIES) - (23.8)% | | | (261,088) |
| NET ASSETS - 100% | | | $1,099,266 |
| TBA Sale Commitments | | |
| | Principal Amount (000s) | Value (000s) |
| Fannie Mae | | |
| 3.5% 3/1/46 | $(7,700) | $(8,069) |
| 3.5% 3/1/46 | (7,700) | (8,069) |
| 4% 3/1/46 | (100) | (107) |
| 4% 3/1/46 | (100) | (107) |
| 4% 3/1/46 | (5,400) | (5,762) |
| 4% 3/1/46 | (4,750) | (5,068) |
| 4% 3/1/46 | (50) | (53) |
| 4% 3/1/46 | (9,500) | (10,134) |
| 4.5% 3/1/46 | (6,200) | (6,734) |
|
| TOTAL FANNIE MAE | | (44,103) |
|
| Freddie Mac | | |
| 4% 3/1/46 | (719) | (766) |
| 4% 3/1/46 | (481) | (513) |
| 4% 3/1/46 | (3,600) | (3,836) |
|
| TOTAL FREDDIE MAC | | (5,115) |
|
| Ginnie Mae | | |
| 4% 3/1/46 | (5,200) | (5,553) |
| 4% 3/1/46 | (2,200) | (2,350) |
| 4% 3/1/46 | (2,200) | (2,350) |
|
| TOTAL GINNIE MAE | | (10,253) |
|
| TOTAL TBA SALE COMMITMENTS | | |
| (Proceeds $59,497) | | $(59,471) |
Swaps
| Clearinghouse/Counterparty(1) | Expiration Date | Notional Amount (000s) | Payment Received | Payment Paid | Value (000s) | Upfront Premium Received/(Paid) (000s)(2) | Unrealized Appreciation/(Depreciation) (000s) |
| Interest Rate Swaps | | | | | | | |
| LCH | Mar. 2018 | $30,200 | 3-month LIBOR | 1.5% | $(208) | $0 | $(208) |
| LCH | Mar. 2019 | 11,800 | 3-month LIBOR | 1.75% | (161) | 0 | (161) |
| LCH | Mar. 2021 | 13,800 | 3-month LIBOR | 2% | (388) | 0 | (388) |
| LCH | Mar. 2026 | 2,350 | 3-month LIBOR | 2.5% | (137) | 0 | (137) |
| LCH | Mar. 2046 | 830 | 3-month LIBOR | 2.75% | (102) | 0 | (102) |
|
| TOTAL INTEREST RATE SWAPS | | | | | $(996) | $0 | $(996) |
|
(1) Swaps with LCH Clearnet Group (LCH) are centrally cleared over-the-counter (OTC) swaps.
(2) Any premiums for centrally cleared over-the-counter (OTC) swaps are recorded periodically throughout the term of the swap to variation margin and included in unrealized appreciation (depreciation).
For the period, the average monthly notional amount for swaps in the aggregate was $79,203,000.
Values shown as $0 may reflect amounts less than $500.
Legend
(a) Coupon rates for floating and adjustable rate securities reflect the rates in effect at period end.
(b) Security or a portion of the security purchased on a delayed delivery or when-issued basis.
(c) Security or a portion of the security was pledged to cover margin requirements for centrally cleared OTC swaps. At period end, the value of securities pledged amounted to $1,119,000.
(d) Security exempt from registration under Rule 144A of the Securities Act of 1933. These securities may be resold in transactions exempt from registration, normally to qualified institutional buyers. At the end of the period, the value of these securities amounted to $175,247,000 or 15.9% of net assets.
(e) Security represents right to receive monthly interest payments on an underlying pool of mortgages or assets. Principal shown is the outstanding par amount of the pool as of the end of the period.
(f) Coupon is inversely indexed to a floating interest rate multiplied by a specified factor. The price may be considerably more volatile than the price of a comparable fixed rate security.
(g) Represents an investment in an underlying pool of reverse mortgages which typically do not require regular principal and interest payments as repayment is deferred until a maturity event.
(h) Affiliated fund that is generally available only to investment companies and other accounts managed by Fidelity Investments. A complete unaudited schedule of portfolio holdings for each Fidelity Central Fund is filed with the SEC for the first and third quarters of each fiscal year on Form N-Q and is available upon request or at the SEC's website at www.sec.gov. An unaudited holdings listing for the Fund, which presents direct holdings as well as the pro-rata share of securities and other investments held indirectly through its investment in underlying non-money market Fidelity Central Funds, is available at fidelity.com and/or advisor.fidelity.com, as applicable. In addition, each Fidelity Central Fund's financial statements are available on the SEC's website or upon request.
Affiliated Central Funds
Information regarding fiscal year to date income earned by the Fund from investments in Fidelity Central Funds is as follows:
| Fund | Income earned |
| | (Amounts in thousands) |
| Fidelity Mortgage Backed Securities Central Fund | $21 |
| Total | $21 |
Additional information regarding the Fund's fiscal year to date purchases and sales, including the ownership percentage, of the non Money Market Central Funds is as follows:
| Fund (Amounts in thousands) | Value, beginning of period | Purchases | Sales Proceeds | Value, end of period | % ownership, end of period |
| Fidelity Mortgage Backed Securities Central Fund | $1,622 | $21 | $-- | $1,656 | 0.0% |
| Total | $1,622 | $21 | $-- | $1,656 | |
Investment Valuation
The following is a summary of the inputs used, as of February 29, 2016, involving the Fund's assets and liabilities carried at fair value. The inputs or methodology used for valuing securities may not be an indication of the risk associated with investing in those securities. For more information on valuation inputs, and their aggregation into the levels used below, please refer to the Investment Valuation section in the accompanying Notes to Financial Statements.
| | Valuation Inputs at Reporting Date: |
| Description | Total | Level 1 | Level 2 | Level 3 |
| (Amounts in thousands) | | | | |
| Investments in Securities: | | | | |
| U.S. Government Agency - Mortgage Securities | $969,169 | $-- | $969,169 | $-- |
| Asset-Backed Securities | 74,909 | -- | 74,909 | -- |
| Collateralized Mortgage Obligations | 139,720 | -- | 139,720 | -- |
| Commercial Mortgage Securities | 140,557 | -- | 140,557 | -- |
| Fixed-Income Funds | 1,656 | 1,656 | -- | -- |
| Cash Equivalents | 34,343 | -- | 34,343 | -- |
| Total Investments in Securities: | $1,360,354 | $1,656 | $1,358,698 | $-- |
| Derivative Instruments: | | | | |
| Liabilities | | | | |
| Swaps | $(996) | $-- | $(996) | $-- |
| Total Liabilities | $(996) | $-- | $(996) | $-- |
| Total Derivative Instruments: | $(996) | $-- | $(996) | $-- |
| Other Financial Instruments: | | | | |
| TBA Sale Commitments | $(59,471) | $-- | $(59,471) | $-- |
| Total Other Financial Instruments: | $(59,471) | $-- | $(59,471) | $-- |
Value of Derivative Instruments
The following table is a summary of the Fund's value of derivative instruments by primary risk exposure as of February 29, 2016. For additional information on derivative instruments, please refer to the Derivative Instruments section in the accompanying Notes to Financial Statements.
| Primary Risk Exposure / Derivative Type | Value |
| (Amounts in thousands) | Asset | Liability |
| Interest Rate Risk | | |
| Swaps(a) | $0 | $(996) |
| Total Interest Rate Risk | 0 | (996) |
| Total Value of Derivatives | $0 | $(996) |
(a) For centrally cleared OTC swaps, reflects gross cumulative appreciation (depreciation) as presented in the Schedule of Investments. For centrally cleared OTC swaps, only the period end receivable or payable for daily variation margin and net unrealized appreciation (depreciation) are presented in the Statement of Assets and Liabilities
Other Information
# Additional information on each counterparty to the repurchase agreement is as follows:
| Repurchase Agreement / Counterparty | Value |
| $34,343,000 due 3/01/16 at 0.40% | (Amounts in thousands) |
| Commerz Markets LLC | $34,343 |
| | $34,343 |
See accompanying notes which are an integral part of the financial statements.
Financial Statements
Statement of Assets and Liabilities
| Amounts in thousands (except per-share amounts) | | February 29, 2016 (Unaudited) |
| Assets | | |
Investment in securities, at value (including repurchase agreements of $34,343) — See accompanying schedule:
Unaffiliated issuers (cost $1,341,940) | $1,358,698 | |
| Fidelity Central Funds (cost $1,653) | 1,656 | |
| Total Investments (cost $1,343,593) | | $1,360,354 |
| Cash | | 144 |
| Receivable for investments sold | | |
| Regular delivery | | 13,410 |
| Delayed delivery | | 5,112 |
| Receivable for TBA sale commitments | | 59,497 |
| Receivable for fund shares sold | | 1,411 |
| Interest receivable | | 3,141 |
| Distributions receivable from Fidelity Central Funds | | 4 |
| Receivable from investment adviser for expense reductions | | 29 |
| Total assets | | 1,443,102 |
| Liabilities | | |
| Payable for investments purchased | | |
| Regular delivery | $19,449 | |
| Delayed delivery | 263,501 | |
| TBA sale commitments, at value | 59,471 | |
| Payable for fund shares redeemed | 835 | |
| Distributions payable | 126 | |
| Accrued management fee | 281 | |
| Distribution and service plan fees payable | 29 | |
| Payable for daily variation margin for derivative instruments | 11 | |
| Other affiliated payables | 133 | |
| Total liabilities | | 343,836 |
| Net Assets | | $1,099,266 |
| Net Assets consist of: | | |
| Paid in capital | | $1,160,117 |
| Distributions in excess of net investment income | | (2,190) |
| Accumulated undistributed net realized gain (loss) on investments | | (74,452) |
| Net unrealized appreciation (depreciation) on investments | | 15,791 |
| Net Assets | | $1,099,266 |
| Calculation of Maximum Offering Price | | |
| Class A: | | |
| Net Asset Value and redemption price per share ($44,125 ÷ 3,885.80 shares) | | $11.36 |
| Maximum offering price per share (100/96.00 of $11.36) | | $11.83 |
| Class T: | | |
| Net Asset Value and redemption price per share ($24,125 ÷ 2,120.29 shares) | | $11.38 |
| Maximum offering price per share (100/96.00 of $11.38) | | $11.85 |
| Class B: | | |
| Net Asset Value and offering price per share ($714 ÷ 62.89 shares)(a) | | $11.35 |
| Class C: | | |
| Net Asset Value and offering price per share ($18,644 ÷ 1,644.40 shares)(a) | | $11.34 |
| Fidelity Mortgage Securities Fund: | | |
| Net Asset Value, offering price and redemption price per share ($932,567 ÷ 81,918.64 shares) | | $11.38 |
| Class I: | | |
| Net Asset Value, offering price and redemption price per share ($79,091 ÷ 6,972.41 shares) | | $11.34 |
(a) Redemption price per share is equal to net asset value less any applicable contingent deferred sales charge.
See accompanying notes which are an integral part of the financial statements.
Statement of Operations
| Amounts in thousands | | Six months ended February 29, 2016 (Unaudited) |
| Investment Income | | |
| Interest | | $14,700 |
| Income from Fidelity Central Funds | | 21 |
| Total income | | 14,721 |
| Expenses | | |
| Management fee | $1,616 | |
| Transfer agent fees | 575 | |
| Distribution and service plan fees | 161 | |
| Fund wide operations fee | 201 | |
| Independent trustees' compensation | 2 | |
| Miscellaneous | 9 | |
| Total expenses before reductions | 2,564 | |
| Expense reductions | (28) | 2,536 |
| Net investment income (loss) | | 12,185 |
| Realized and Unrealized Gain (Loss) | | |
| Net realized gain (loss) on: | | |
| Investment securities: | | |
| Unaffiliated issuers | 6,193 | |
| Swaps | (2,480) | |
| Total net realized gain (loss) | | 3,713 |
Change in net unrealized appreciation (depreciation) on:
Investment securities | 4,128 | |
| Swaps | 437 | |
| Delayed delivery commitments | (68) | |
| Total change in net unrealized appreciation (depreciation) | | 4,497 |
| Net gain (loss) | | 8,210 |
| Net increase (decrease) in net assets resulting from operations | | $20,395 |
See accompanying notes which are an integral part of the financial statements.
Statement of Changes in Net Assets
| Amounts in thousands | Six months ended February 29, 2016 (Unaudited) | Year ended August 31, 2015 |
| Increase (Decrease) in Net Assets | | |
| Operations | | |
| Net investment income (loss) | $12,185 | $22,215 |
| Net realized gain (loss) | 3,713 | 9,548 |
| Change in net unrealized appreciation (depreciation) | 4,497 | (7,250) |
| Net increase (decrease) in net assets resulting from operations | 20,395 | 24,513 |
| Distributions to shareholders from net investment income | (13,351) | (21,563) |
| Distributions to shareholders from net realized gain | (552) | (244) |
| Total distributions | (13,903) | (21,807) |
| Share transactions - net increase (decrease) | 89,918 | 86,045 |
| Total increase (decrease) in net assets | 96,410 | 88,751 |
| Net Assets | | |
| Beginning of period | 1,002,856 | 914,105 |
| End of period (including distributions in excess of net investment income of $2,190 and distributions in excess of net investment income of $1,024, respectively) | $1,099,266 | $1,002,856 |
See accompanying notes which are an integral part of the financial statements.
Financial Highlights — Fidelity Advisor Mortgage Securities Fund Class A
| | Six months ended February 29, (Unaudited) | Years ended August 31, | | | | |
| | 2016 | 2015 | 2014 | 2013 | 2012 | 2011 |
| Selected Per–Share Data | | | | | | |
| Net asset value, beginning of period | $11.29 | $11.24 | $10.89 | $11.34 | $11.14 | $10.91 |
| Income from Investment Operations | | | | | | |
| Net investment income (loss)A | .115 | .223 | .239 | .169 | .278 | .323 |
| Net realized and unrealized gain (loss) | .089 | .047 | .341 | (.457) | .206 | .235 |
| Total from investment operations | .204 | .270 | .580 | (.288) | .484 | .558 |
| Distributions from net investment income | (.128) | (.217) | (.230) | (.162) | (.284) | (.328) |
| Distributions from net realized gain | (.006) | (.003) | – | – | – | – |
| Total distributions | (.134) | (.220) | (.230) | (.162) | (.284) | (.328) |
| Net asset value, end of period | $11.36 | $11.29 | $11.24 | $10.89 | $11.34 | $11.14 |
| Total ReturnB,C,D | 1.82% | 2.41% | 5.37% | (2.57)% | 4.41% | 5.22% |
| Ratios to Average Net AssetsE,F | | | | | | |
| Expenses before reductions | .80%G | .81% | .81% | .79% | .81% | .82% |
| Expenses net of fee waivers, if any | .80%G | .81% | .81% | .79% | .81% | .82% |
| Expenses net of all reductions | .80%G | .81% | .81% | .79% | .81% | .82% |
| Net investment income (loss) | 2.05%G | 1.97% | 2.15% | 1.51% | 2.48% | 2.96% |
| Supplemental Data | | | | | | |
| Net assets, end of period (in millions) | $44 | $38 | $41 | $50 | $60 | $59 |
| Portfolio turnover rateH | 411%G | 439% | 398% | 474% | 451% | 490% |
A Calculated based on average shares outstanding during the period.
B Total returns for periods of less than one year are not annualized.
C Total returns would have been lower if certain expenses had not been reduced during the applicable periods shown.
D Total returns do not include the effect of the sales charges.
E Fees and expenses of any underlying Fidelity Central Funds are not included in the Fund's expense ratio. The Fund indirectly bears its proportionate share of the expenses of any underlying Fidelity Central Funds. Based on their most recent shareholder report date, the expenses of any underlying non-money market Fidelity Central Funds were less than .005%.
F Expense ratios reflect operating expenses of the class. Expenses before reductions do not reflect amounts reimbursed by the investment adviser or reductions from expense offset arrangements and do not represent the amount paid by the class during periods when reimbursements or reductions occur. Expenses net of fee waivers reflect expenses after reimbursement by the investment adviser but prior to reductions from expense offset arrangements. Expenses net of all reductions represent the net expenses paid by the class.
G Annualized
H Amount does not include the portfolio activity of any underlying Fidelity Central Funds.
See accompanying notes which are an integral part of the financial statements.
Financial Highlights — Fidelity Advisor Mortgage Securities Fund Class T
| | Six months ended February 29, (Unaudited) | Years ended August 31, | | | | |
| | 2016 | 2015 | 2014 | 2013 | 2012 | 2011 |
| Selected Per–Share Data | | | | | | |
| Net asset value, beginning of period | $11.31 | $11.27 | $10.92 | $11.37 | $11.16 | $10.93 |
| Income from Investment Operations | | | | | | |
| Net investment income (loss)A | .115 | .225 | .242 | .173 | .281 | .326 |
| Net realized and unrealized gain (loss) | .089 | .037 | .340 | (.458) | .216 | .235 |
| Total from investment operations | .204 | .262 | .582 | (.285) | .497 | .561 |
| Distributions from net investment income | (.128) | (.219) | (.232) | (.165) | (.287) | (.331) |
| Distributions from net realized gain | (.006) | (.003) | – | – | – | – |
| Total distributions | (.134) | (.222) | (.232) | (.165) | (.287) | (.331) |
| Net asset value, end of period | $11.38 | $11.31 | $11.27 | $10.92 | $11.37 | $11.16 |
| Total ReturnB,C,D | 1.82% | 2.33% | 5.38% | (2.54)% | 4.52% | 5.24% |
| Ratios to Average Net AssetsE,F | | | | | | |
| Expenses before reductions | .80%G | .79% | .79% | .77% | .78% | .79% |
| Expenses net of fee waivers, if any | .80%G | .79% | .79% | .77% | .78% | .79% |
| Expenses net of all reductions | .80%G | .79% | .79% | .77% | .78% | .79% |
| Net investment income (loss) | 2.05%G | 1.98% | 2.17% | 1.53% | 2.50% | 2.99% |
| Supplemental Data | | | | | | |
| Net assets, end of period (in millions) | $24 | $20 | $22 | $26 | $31 | $37 |
| Portfolio turnover rateH | 411%G | 439% | 398% | 474% | 451% | 490% |
A Calculated based on average shares outstanding during the period.
B Total returns for periods of less than one year are not annualized.
C Total returns would have been lower if certain expenses had not been reduced during the applicable periods shown.
D Total returns do not include the effect of the sales charges.
E Fees and expenses of any underlying Fidelity Central Funds are not included in the Fund's expense ratio. The Fund indirectly bears its proportionate share of the expenses of any underlying Fidelity Central Funds. Based on their most recent shareholder report date, the expenses of any underlying non-money market Fidelity Central Funds were less than .005%.
F Expense ratios reflect operating expenses of the class. Expenses before reductions do not reflect amounts reimbursed by the investment adviser or reductions from expense offset arrangements and do not represent the amount paid by the class during periods when reimbursements or reductions occur. Expenses net of fee waivers reflect expenses after reimbursement by the investment adviser but prior to reductions from expense offset arrangements. Expenses net of all reductions represent the net expenses paid by the class.
G Annualized
H Amount does not include the portfolio activity of any underlying Fidelity Central Funds.
See accompanying notes which are an integral part of the financial statements.
Financial Highlights — Fidelity Advisor Mortgage Securities Fund Class B
| | Six months ended February 29, (Unaudited) | Years ended August 31, | | | | |
| | 2016 | 2015 | 2014 | 2013 | 2012 | 2011 |
| Selected Per–Share Data | | | | | | |
| Net asset value, beginning of period | $11.28 | $11.24 | $10.89 | $11.34 | $11.14 | $10.91 |
| Income from Investment Operations | | | | | | |
| Net investment income (loss)A | .076 | .145 | .162 | .090 | .200 | .248 |
| Net realized and unrealized gain (loss) | .088 | .037 | .342 | (.457) | .207 | .235 |
| Total from investment operations | .164 | .182 | .504 | (.367) | .407 | .483 |
| Distributions from net investment income | (.088) | (.139) | (.154) | (.083) | (.207) | (.253) |
| Distributions from net realized gain | (.006) | (.003) | – | – | – | – |
| Total distributions | (.094) | (.142) | (.154) | (.083) | (.207) | (.253) |
| Net asset value, end of period | $11.35 | $11.28 | $11.24 | $10.89 | $11.34 | $11.14 |
| Total ReturnB,C,D | 1.46% | 1.62% | 4.65% | (3.25)% | 3.69% | 4.51% |
| Ratios to Average Net AssetsE,F | | | | | | |
| Expenses before reductions | 1.51%G | 1.50% | 1.50% | 1.50% | 1.50% | 1.50% |
| Expenses net of fee waivers, if any | 1.50%G | 1.50% | 1.50% | 1.50% | 1.50% | 1.50% |
| Expenses net of all reductions | 1.50%G | 1.50% | 1.50% | 1.50% | 1.50% | 1.50% |
| Net investment income (loss) | 1.35%G | 1.28% | 1.46% | .80% | 1.79% | 2.27% |
| Supplemental Data | | | | | | |
| Net assets, end of period (in millions) | $1 | $1 | $1 | $2 | $4 | $5 |
| Portfolio turnover rateH | 411%G | 439% | 398% | 474% | 451% | 490% |
A Calculated based on average shares outstanding during the period.
B Total returns for periods of less than one year are not annualized.
C Total returns would have been lower if certain expenses had not been reduced during the applicable periods shown.
D Total returns do not include the effect of the contingent deferred sales charge.
E Fees and expenses of any underlying Fidelity Central Funds are not included in the Fund's expense ratio. The Fund indirectly bears its proportionate share of the expenses of any underlying Fidelity Central Funds. Based on their most recent shareholder report date, the expenses of any underlying non-money market Fidelity Central Funds were less than .005%.
F Expense ratios reflect operating expenses of the class. Expenses before reductions do not reflect amounts reimbursed by the investment adviser or reductions from expense offset arrangements and do not represent the amount paid by the class during periods when reimbursements or reductions occur. Expenses net of fee waivers reflect expenses after reimbursement by the investment adviser but prior to reductions from expense offset arrangements. Expenses net of all reductions represent the net expenses paid by the class.
G Annualized
H Amount does not include the portfolio activity of any underlying Fidelity Central Funds.
See accompanying notes which are an integral part of the financial statements.
Financial Highlights — Fidelity Advisor Mortgage Securities Fund Class C
| | Six months ended February 29, (Unaudited) | Years ended August 31, | | | | |
| | 2016 | 2015 | 2014 | 2013 | 2012 | 2011 |
| Selected Per–Share Data | | | | | | |
| Net asset value, beginning of period | $11.27 | $11.23 | $10.88 | $11.33 | $11.12 | $10.90 |
| Income from Investment Operations | | | | | | |
| Net investment income (loss)A | .073 | .141 | .160 | .088 | .197 | .244 |
| Net realized and unrealized gain (loss) | .089 | .037 | .342 | (.457) | .217 | .226 |
| Total from investment operations | .162 | .178 | .502 | (.369) | .414 | .470 |
| Distributions from net investment income | (.086) | (.135) | (.152) | (.081) | (.204) | (.250) |
| Distributions from net realized gain | (.006) | (.003) | – | – | – | – |
| Total distributions | (.092) | (.138) | (.152) | (.081) | (.204) | (.250) |
| Net asset value, end of period | $11.34 | $11.27 | $11.23 | $10.88 | $11.33 | $11.12 |
| Total ReturnB,C,D | 1.44% | 1.59% | 4.64% | (3.28)% | 3.76% | 4.39% |
| Ratios to Average Net AssetsE,F | | | | | | |
| Expenses before reductions | 1.55%G | 1.53% | 1.52% | 1.52% | 1.53% | 1.53% |
| Expenses net of fee waivers, if any | 1.54%G | 1.53% | 1.52% | 1.52% | 1.53% | 1.53% |
| Expenses net of all reductions | 1.54%G | 1.53% | 1.52% | 1.52% | 1.53% | 1.53% |
| Net investment income (loss) | 1.31%G | 1.25% | 1.44% | .78% | 1.76% | 2.24% |
| Supplemental Data | | | | | | |
| Net assets, end of period (in millions) | $19 | $16 | $17 | $17 | $18 | $15 |
| Portfolio turnover rateH | 411%G | 439% | 398% | 474% | 451% | 490% |
A Calculated based on average shares outstanding during the period.
B Total returns for periods of less than one year are not annualized.
C Total returns would have been lower if certain expenses had not been reduced during the applicable periods shown.
D Total returns do not include the effect of the contingent deferred sales charge.
E Fees and expenses of any underlying Fidelity Central Funds are not included in the Fund's expense ratio. The Fund indirectly bears its proportionate share of the expenses of any underlying Fidelity Central Funds. Based on their most recent shareholder report date, the expenses of any underlying non-money market Fidelity Central Funds were less than .005%.
F Expense ratios reflect operating expenses of the class. Expenses before reductions do not reflect amounts reimbursed by the investment adviser or reductions from expense offset arrangements and do not represent the amount paid by the class during periods when reimbursements or reductions occur. Expenses net of fee waivers reflect expenses after reimbursement by the investment adviser but prior to reductions from expense offset arrangements. Expenses net of all reductions represent the net expenses paid by the class.
G Annualized
H Amount does not include the portfolio activity of any underlying Fidelity Central Funds.
See accompanying notes which are an integral part of the financial statements.
Financial Highlights — Fidelity Advisor Mortgage Securities Fund
| | Six months ended February 29, (Unaudited) | Years ended August 31, | | | | |
| | 2016 | 2015 | 2014 | 2013 | 2012 | 2011 |
| Selected Per–Share Data | | | | | | |
| Net asset value, beginning of period | $11.31 | $11.27 | $10.92 | $11.37 | $11.17 | $10.94 |
| Income from Investment Operations | | | | | | |
| Net investment income (loss)A | .135 | .264 | .279 | .209 | .318 | .364 |
| Net realized and unrealized gain (loss) | .089 | .037 | .341 | (.458) | .206 | .234 |
| Total from investment operations | .224 | .301 | .620 | (.249) | .524 | .598 |
| Distributions from net investment income | (.148) | (.258) | (.270) | (.201) | (.324) | (.368) |
| Distributions from net realized gain | (.006) | (.003) | – | – | – | – |
| Total distributions | (.154) | (.261) | (.270) | (.201) | (.324) | (.368) |
| Net asset value, end of period | $11.38 | $11.31 | $11.27 | $10.92 | $11.37 | $11.17 |
| Total ReturnB,C | 1.99% | 2.68% | 5.73% | (2.23)% | 4.77% | 5.59% |
| Ratios to Average Net AssetsD,E | | | | | | |
| Expenses before reductions | .45%F | .45% | .45% | .45% | .45% | .45% |
| Expenses net of fee waivers, if any | .45%F | .45% | .45% | .45% | .45% | .45% |
| Expenses net of all reductions | .45%F | .45% | .45% | .45% | .45% | .45% |
| Net investment income (loss) | 2.40%F | 2.33% | 2.51% | 1.85% | 2.84% | 3.33% |
| Supplemental Data | | | | | | |
| Net assets, end of period (in millions) | $933 | $856 | $785 | $778 | $850 | $765 |
| Portfolio turnover rateG | 411%F | 439% | 398% | 474% | 451% | 490% |
A Calculated based on average shares outstanding during the period.
B Total returns for periods of less than one year are not annualized.
C Total returns would have been lower if certain expenses had not been reduced during the applicable periods shown.
D Fees and expenses of any underlying Fidelity Central Funds are not included in the Fund's expense ratio. The Fund indirectly bears its proportionate share of the expenses of any underlying Fidelity Central Funds. Based on their most recent shareholder report date, the expenses of any underlying non-money market Fidelity Central Funds were less than .005%.
E Expense ratios reflect operating expenses of the class. Expenses before reductions do not reflect amounts reimbursed by the investment adviser or reductions from expense offset arrangements and do not represent the amount paid by the class during periods when reimbursements or reductions occur. Expenses net of fee waivers reflect expenses after reimbursement by the investment adviser but prior to reductions from expense offset arrangements. Expenses net of all reductions represent the net expenses paid by the class.
F Annualized
G Amount does not include the portfolio activity of any underlying Fidelity Central Funds.
See accompanying notes which are an integral part of the financial statements.
Financial Highlights — Fidelity Advisor Mortgage Securities Fund Class I
| | Six months ended February 29, (Unaudited) | Years ended August 31, | | | | |
| | 2016 | 2015 | 2014 | 2013 | 2012 | 2011 |
| Selected Per–Share Data | | | | | | |
| Net asset value, beginning of period | $11.27 | $11.23 | $10.88 | $11.33 | $11.13 | $10.90 |
| Income from Investment Operations | | | | | | |
| Net investment income (loss)A | .132 | .256 | .271 | .200 | .311 | .354 |
| Net realized and unrealized gain (loss) | .088 | .038 | .342 | (.456) | .207 | .235 |
| Total from investment operations | .220 | .294 | .613 | (.256) | .518 | .589 |
| Distributions from net investment income | (.144) | (.251) | (.263) | (.194) | (.318) | (.359) |
| Distributions from net realized gain | (.006) | (.003) | – | – | – | – |
| Total distributions | (.150) | (.254) | (.263) | (.194) | (.318) | (.359) |
| Net asset value, end of period | $11.34 | $11.27 | $11.23 | $10.88 | $11.33 | $11.13 |
| Total ReturnB,C | 1.97% | 2.64% | 5.69% | (2.30)% | 4.73% | 5.53% |
| Ratios to Average Net AssetsD,E | | | | | | |
| Expenses before reductions | .51%F | .50% | .51% | .51% | .50% | .53% |
| Expenses net of fee waivers, if any | .50%F | .50% | .51% | .51% | .50% | .53% |
| Expenses net of all reductions | .50%F | .50% | .51% | .51% | .50% | .53% |
| Net investment income (loss) | 2.35%F | 2.28% | 2.45% | 1.79% | 2.79% | 3.24% |
| Supplemental Data | | | | | | |
| Net assets, end of period (in millions) | $79 | $72 | $48 | $34 | $12 | $7 |
| Portfolio turnover rateG | 411%F | 439% | 398% | 474% | 451% | 490% |
A Calculated based on average shares outstanding during the period.
B Total returns for periods of less than one year are not annualized.
C Total returns would have been lower if certain expenses had not been reduced during the applicable periods shown.
D Fees and expenses of any underlying Fidelity Central Funds are not included in the Fund's expense ratio. The Fund indirectly bears its proportionate share of the expenses of any underlying Fidelity Central Funds. Based on their most recent shareholder report date, the expenses of any underlying non-money market Fidelity Central Funds were less than .005%.
E Expense ratios reflect operating expenses of the class. Expenses before reductions do not reflect amounts reimbursed by the investment adviser or reductions from expense offset arrangements and do not represent the amount paid by the class during periods when reimbursements or reductions occur. Expenses net of fee waivers reflect expenses after reimbursement by the investment adviser but prior to reductions from expense offset arrangements. Expenses net of all reductions represent the net expenses paid by the class.
F Annualized
G Amount does not include the portfolio activity of any underlying Fidelity Central Funds.
See accompanying notes which are an integral part of the financial statements.
Notes to Financial Statements (Unaudited)
For the period ended February 29, 2016
(Amounts in thousands except percentages)
1. Organization.
Fidelity Advisor Mortgage Securities Fund (the Fund) is a fund of Fidelity Advisor Series II (the Trust) and is authorized to issue an unlimited number of shares. The Trust is registered under the Investment Company Act of 1940, as amended (the 1940 Act), as an open-end management investment company organized as a Massachusetts business trust. The Fund offers Class A, Class T, Class C, Fidelity Mortgage Securities Fund and Class I shares, each of which, along with Class B shares, has equal rights as to assets and voting privileges. Class B shares are closed to new accounts and additional purchases, except for exchanges and reinvestments. Each class has exclusive voting rights with respect to matters that affect that class. Class B shares will automatically convert to Class A shares after a maximum holding period of seven years from the initial date of purchase.
During the period, the Board of Trustees approved the conversion of all existing Class B shares into Class A shares, effective on or about July 1, 2016, regardless of the length of times shares have been held.
2. Investments in Fidelity Central Funds.
The Fund invests in Fidelity Central Funds, which are open-end investment companies generally available only to other investment companies and accounts managed by the investment adviser and its affiliates. The Fund's Schedule of Investments lists each of the Fidelity Central Funds held as of period end, if any, as an investment of the Fund, but does not include the underlying holdings of each Fidelity Central Fund. As an Investing Fund, the Fund indirectly bears its proportionate share of the expenses of the underlying Fidelity Central Funds.
Based on its investment objective, each Fidelity Central Fund may invest or participate in various investment vehicles or strategies that are similar to those of the Fund. These strategies are consistent with the investment objectives of the Fund and may involve certain economic risks which may cause a decline in value of each of the Fidelity Central Funds and thus a decline in the value of the Fund. The following summarizes the Fund's investment in each non-money market Fidelity Central Fund.
| Fidelity Central Fund | Investment Manager | Investment Objective | Investment Practices | Expense Ratio(a) |
| Fidelity Mortgage Backed Securities Central Fund | Fidelity Investment Money Management, Inc. (FIMM) | Seeks a high level of income by normally investing in investment-grade mortgage-related securities and repurchase agreements for those securities. | Delayed Delivery & When Issued Securities
Repurchase Agreements
Swaps | Less than .005% |
(a) Expenses expressed as a percentage of average net assets and are as of each underlying Central Fund's most recent annual or semi-annual shareholder report.
An unaudited holdings listing for the Fund, which presents direct holdings as well as the pro-rata share of any securities and other investments held indirectly through its investment in underlying non-money market Fidelity Central Funds, is available at fidelity.com and/or advisor.fidelity.com, as applicable. A complete unaudited list of holdings for each Fidelity Central Fund is available upon request or at the Securities and Exchange Commission (the SEC) website at www.sec.gov. In addition, the financial statements of the Fidelity Central Funds which contain the significant accounting policies (including investment valuation policies) of those funds are available on the SEC website or upon request.
3. Significant Accounting Policies.
The financial statements have been prepared in conformity with accounting principles generally accepted in the United States of America (GAAP), which require management to make certain estimates and assumptions at the date of the financial statements. Actual results could differ from those estimates. Subsequent events, if any, through the date that the financial statements were issued have been evaluated in the preparation of the financial statements. The following summarizes the significant accounting policies of the Fund:
Investment Valuation. Investments are valued as of 4:00 p.m. Eastern time on the last calendar day of the period. The Board of Trustees (the Board) has delegated the day to day responsibility for the valuation of the Fund's investments to the Fidelity Management & Research Company (FMR) Fair Value Committee (the Committee). In accordance with valuation policies and procedures approved by the Board, the Fund attempts to obtain prices from one or more third party pricing vendors or brokers to value its investments. When current market prices, quotations or currency exchange rates are not readily available or reliable, investments will be fair valued in good faith by the Committee, in accordance with procedures adopted by the Board. Factors used in determining fair value vary by investment type and may include market or investment specific events, changes in interest rates and credit quality. The frequency with which these procedures are used cannot be predicted and they may be utilized to a significant extent. The Committee oversees the Fund's valuation policies and procedures and reports to the Board on the Committee's activities and fair value determinations. The Board monitors the appropriateness of the procedures used in valuing the Fund's investments and ratifies the fair value determinations of the Committee.
The Fund categorizes the inputs to valuation techniques used to value its investments into a disclosure hierarchy consisting of three levels as shown below:
- Level 1 – quoted prices in active markets for identical investments
- Level 2 – other significant observable inputs (including quoted prices for similar investments, interest rates, prepayment speeds, etc.)
- Level 3 – unobservable inputs (including the Fund's own assumptions based on the best information available)
Valuation techniques used to value the Fund's investments by major category are as follows:
Debt securities, including restricted securities, are valued based on evaluated prices received from third party pricing vendors or from brokers who make markets in such securities. Asset backed securities, collateralized mortgage obligations, commercial mortgage securities and U.S. government agency mortgage securities are valued by pricing vendors who utilize matrix pricing which considers prepayment speed assumptions, attributes of the collateral, yield or price of bonds of comparable quality, coupon, maturity and type or by broker-supplied prices. Brokers which make markets in asset backed securities, collateralized mortgage obligations and commercial mortgage securities may also consider such factors as the structure of the issue, cash flow assumptions, the value of underlying assets as well as any guarantees. Swaps are marked-to-market daily based on valuations from third party pricing vendors, registered derivatives clearing organizations (clearinghouses) or broker-supplied valuations. These pricing sources may utilize inputs such as interest rate curves, credit spread curves, default possibilities and recovery rates. When independent prices are unavailable or unreliable, debt securities and swaps may be valued utilizing pricing methodologies which consider similar factors that would be used by third party pricing vendors. Debt securities and swaps are generally categorized as Level 2 in the hierarchy but may be Level 3 depending on the circumstances.
Investments in open-end mutual funds, including the Fidelity Central Funds, are valued at their closing net asset value (NAV) each business day and are categorized as Level 1 in the hierarchy. Short-term securities with remaining maturities of sixty days or less may be valued at amortized cost, which approximates fair value, and are categorized as Level 2 in the hierarchy.
Changes in valuation techniques may result in transfers in or out of an assigned level within the disclosure hierarchy. The aggregate value of investments by input level as of February 29, 2016 is included at the end of the Fund's Schedule of Investments.
Investment Transactions and Income. For financial reporting purposes, the Fund's investment holdings and NAV include trades executed through the end of the last business day of the period. The NAV per share for processing shareholder transactions is calculated as of the close of business of the New York Stock Exchange (NYSE), normally 4:00 p.m. Eastern time and includes trades executed through the end of the prior business day. Gains and losses on securities sold are determined on the basis of identified cost and may include proceeds received from litigation. Income and capital gain distributions from Fidelity Central Funds, if any, are recorded on the ex-dividend date. Interest income is accrued as earned and includes coupon interest and amortization of premium and accretion of discount on debt securities as applicable.
Class Allocations and Expenses. Investment income, realized and unrealized capital gains and losses, common expenses of the Fund, and certain fund-level expense reductions, if any, are allocated daily on a pro-rata basis to each class based on the relative net assets of each class to the total net assets of the Fund. Each class differs with respect to transfer agent and distribution and service plan fees incurred. Certain expense reductions may also differ by class. For the reporting period, the allocated portion of income and expenses to each class as a percent of its average net assets may vary due to the timing of recording these transactions in relation to fluctuating net assets of the classes. Expenses directly attributable to a fund are charged to that fund. Expenses attributable to more than one fund are allocated among the respective funds on the basis of relative net assets or other appropriate methods. Expense estimates are accrued in the period to which they relate and adjustments are made when actual amounts are known.
Income Tax Information and Distributions to Shareholders. Each year, the Fund intends to qualify as a regulated investment company under Subchapter M of the Internal Revenue Code, including distributing substantially all of its taxable income and realized gains. As a result, no provision for U.S. Federal income taxes is required. The Fund files a U.S. federal tax return, in addition to state and local tax returns as required. The Fund's federal income tax returns are subject to examination by the Internal Revenue Service (IRS) for a period of three fiscal years after they are filed. State and local tax returns may be subject to examination for an additional fiscal year depending on the jurisdiction.
Dividends are declared and recorded daily and paid monthly from net investment income. Distributions from realized gains, if any, are declared and recorded on the ex-dividend date. Income dividends and capital gain distributions are declared separately for each class. Income and capital gain distributions are determined in accordance with income tax regulations, which may differ from GAAP.
Capital accounts within the financial statements are adjusted for permanent book-tax differences. These adjustments have no impact on net assets or the results of operations. Capital accounts are not adjusted for temporary book-tax differences which will reverse in a subsequent period.
Book-tax differences are primarily due to swaps, market discount, partnerships (including allocations from Fidelity Central Funds), deferred trustees compensation, financing transactions, capital loss carryforwards and losses deferred due to wash sales and excise tax regulations.
The federal tax cost of investment securities and unrealized appreciation (depreciation) as of period end were as follows:
| Gross unrealized appreciation | $21,912 |
| Gross unrealized depreciation | (5,152) |
| Net unrealized appreciation (depreciation) on securities | $16,760 |
| Tax cost | $1,343,594 |
Capital loss carryforwards are only available to offset future capital gains of the Fund to the extent provided by regulations and may be limited. Under the Regulated Investment Company Modernization Act of 2010 (the Act), the Fund is permitted to carry forward capital losses incurred in taxable years beginning after December 22, 2010 for an unlimited period and such capital losses are required to be used prior to any losses that expire. The capital loss carryforward information presented below, including any applicable limitation, is estimated as of prior fiscal period end and is subject to adjustment.
| Fiscal year of expiration | |
| 2017 | $(73,463) |
| No expiration | |
| Long-term | (3,849) |
| Total capital loss carryforward | $(77,312) |
Repurchase Agreements. Pursuant to an Exemptive Order issued by the SEC, the Fund along with other registered investment companies having management contracts with FMR, or other affiliated entities of FMR, are permitted to transfer uninvested cash balances into joint trading accounts which are then invested in repurchase agreements. The Fund may also invest directly with institutions in repurchase agreements. Repurchase agreements may be collateralized by government or non-government securities. Upon settlement date, collateral is held in segregated accounts with custodian banks and may be obtained in the event of a default of the counterparty. The Fund monitors, on a daily basis, the value of the collateral to ensure it is at least equal to the principal amount of the repurchase agreement (including accrued interest). In the event of a default by the counterparty, realization of the collateral proceeds could be delayed, during which time the value of the collateral may decline.
Delayed Delivery Transactions and When-Issued Securities. During the period, the Fund transacted in securities on a delayed delivery or when-issued basis. Payment and delivery may take place after the customary settlement period for that security. The price of the underlying securities and the date when the securities will be delivered and paid for are fixed at the time the transaction is negotiated. The securities purchased on a delayed delivery or when-issued basis are identified as such in the Fund's Schedule of Investments. The Fund may receive compensation for interest forgone in the purchase of a delayed delivery or when-issued security. With respect to purchase commitments, the Fund identifies securities as segregated in its records with a value at least equal to the amount of the commitment. Losses may arise due to changes in the value of the underlying securities or if the counterparty does not perform under the contract's terms, or if the issuer does not issue the securities due to political, economic, or other factors.
To-Be-Announced (TBA) Securities and Mortgage Dollar Rolls. During the period, the Fund transacted in TBA securities that involved buying or selling mortgage-backed securities (MBS) on a forward commitment basis. A TBA transaction typically does not designate the actual security to be delivered and only includes an approximate principal amount; however delivered securities must meet specified terms defined by industry guidelines, including issuer, rate and current principal amount outstanding on underlying mortgage pools. The Fund may enter into a TBA transaction with the intent to take possession of or deliver the underlying MBS, or the Fund may elect to extend the settlement by entering into either a mortgage or reverse mortgage dollar roll. Mortgage dollar rolls are transactions where a fund sells TBA securities and simultaneously agrees to repurchase MBS on a later date at a lower price and with the same counterparty. Reverse mortgage dollar rolls involve the purchase and simultaneous agreement to sell TBA securities on a later date at a lower price. Transactions in mortgage dollar rolls and reverse mortgage dollar rolls are accounted for as purchases and sales and may result in an increase to the Fund's portfolio turnover rate.
Purchases and sales of TBA securities involve risks similar to those discussed above for delayed delivery and when-issued securities. Also, if the counterparty in a mortgage dollar roll or a reverse mortgage dollar roll transaction files for bankruptcy or becomes insolvent, the Fund's right to repurchase or sell securities may be limited. Additionally, when a fund sells TBA securities without already owning or having the right to obtain the deliverable securities (an uncovered forward commitment to sell), it incurs a risk of loss because it could have to purchase the securities at a price that is higher than the price at which it sold them. A fund may be unable to purchase the deliverable securities if the corresponding market is illiquid.
TBA securities subject to a forward commitment to sell at period end are included at the end of the Fund's Schedule of Investments under the caption "TBA Sale Commitments." The proceeds and value of these commitments are reflected in the Fund's Statement of Assets and Liabilities as Receivable for TBA sale commitments and TBA sale commitments, at value, respectively.
Restricted Securities. The Fund may invest in securities that are subject to legal or contractual restrictions on resale. These securities generally may be resold in transactions exempt from registration or to the public if the securities are registered. Disposal of these securities may involve time-consuming negotiations and expense, and prompt sale at an acceptable price may be difficult. Information regarding restricted securities is included at the end of the Fund's Schedule of Investments.
4. Derivative Instruments.
Risk Exposures and the Use of Derivative Instruments. The Fund's investment objective allows the Fund to enter into various types of derivative contracts, including swaps. Derivatives are investments whose value is primarily derived from underlying assets, indices or reference rates and may be transacted on an exchange or over-the-counter (OTC). Derivatives may involve a future commitment to buy or sell a specified asset based on specified terms, to exchange future cash flows at periodic intervals based on a notional principal amount, or for one party to make one or more payments upon the occurrence of specified events in exchange for periodic payments from the other party.
The Fund used derivatives to increase returns, to gain exposure to certain types of assets and to manage exposure to certain risks as defined below. The success of any strategy involving derivatives depends on analysis of numerous economic factors, and if the strategies for investment do not work as intended, the Fund may not achieve its objectives.
The Fund's use of derivatives increased or decreased its exposure to the following risk:
| Interest Rate Risk | Interest rate risk relates to the fluctuations in the value of interest-bearing securities due to changes in the prevailing levels of market interest rates. |
The Fund is also exposed to additional risks from investing in derivatives, such as liquidity risk and counterparty credit risk. Liquidity risk is the risk that the Fund will be unable to close out the derivative in the open market in a timely manner. Counterparty credit risk is the risk that the counterparty will not be able to fulfill its obligation to the Fund. Counterparty credit risk related to centrally cleared OTC swaps may be mitigated by the protection provided by the clearinghouse.
Investing in derivatives may involve greater risks than investing in the underlying assets directly and, to varying degrees, may involve risk of loss in excess of any initial investment and collateral received and amounts recognized in the Statement of Assets and Liabilities. In addition, there may be the risk that the change in value of the derivative contract does not correspond to the change in value of the underlying instrument.
Net Realized Gain (Loss) and Change in Net Unrealized Appreciation (Depreciation) on Derivatives. The table below, which reflects the impacts of derivatives on the financial performance of the Fund, summarizes the net realized gain (loss) and change in net unrealized appreciation (depreciation) for derivatives during the period as presented in the Statement of Operations.
| Primary Risk Exposure / Derivative Type | Net Realized Gain (Loss) | Change in Net Unrealized Appreciation (Depreciation) |
| Interest Rate Risk | | |
| Swaps(a) | $(2,480) | $437 |
(a) A summary of the value of derivatives by primary risk exposure as of period end, if any, is included at the end of the Schedule of Investments
Swaps. A swap is a contract between two parties to exchange future cash flows at periodic intervals based on a notional principal amount. A centrally cleared OTC swap is a transaction executed between a fund and a dealer counterparty, then cleared by a futures commission merchant (FCM) through a clearinghouse. Once cleared, the clearinghouse serves as a central counterparty, with whom a fund exchanges cash flows for the life of the transaction, similar to transactions in futures contracts.
Centrally cleared OTC swaps require a fund to deposit either cash or securities (initial margin) with the FCM, at the instruction of and for the benefit of the clearinghouse. Securities deposited to meet initial margin requirements are identified in the Schedule of Investments. Centrally cleared OTC swaps are marked-to-market daily and subsequent payments (variation margin) are made or received depending on the daily fluctuations in the value of the swaps and are recorded as unrealized appreciation or (depreciation). These daily payments, if any, are included in receivable or payable for daily variation margin for derivative instruments in the Statement of Assets and Liabilities. Any premiums for centrally cleared OTC swaps are recorded periodically throughout the term of the swap to variation margin and included in unrealized appreciation (depreciation) in the Statement of Assets and Liabilities. Any premiums are recognized as realized gain (loss) upon termination or maturity of the swap.
Payments are exchanged at specified intervals, accrued daily commencing with the effective date of the contract and recorded as realized gain or (loss). Some swaps may be terminated prior to the effective date and realize a gain or loss upon termination. The net realized gain (loss) and change in net unrealized appreciation (depreciation) on swaps during the period is included in the Statement of Operations.
Any open swaps at period end are included in the Schedule of Investments under the caption "Swaps".
Interest Rate Swaps. Interest rate swaps are agreements between counterparties to exchange cash flows, one based on a fixed rate, and the other on a floating rate. The Fund entered into interest rate swaps to manage its exposure to interest rate changes. Changes in interest rates can have an effect on both the value of bond holdings as well as the amount of interest income earned. In general, the value of bonds can fall when interest rates rise and can rise when interest rates fall.
5. Purchases and Sales of Investments.
Purchases and sales of securities (including the Fixed-Income Central Funds), other than short-term securities and U.S. government securities, aggregated $95,240 and $74,217, respectively.
6. Fees and Other Transactions with Affiliates.
Management Fee. Fidelity Management & Research Company (the investment adviser) and its affiliates provide the Fund with investment management related services for which the Fund pays a monthly management fee. The management fee is the sum of an individual fund fee rate that is based on an annual rate of .20% of the Fund's average net assets and an annualized group fee rate that averaged .11% during the period. The group fee rate is based upon the average net assets of all the mutual funds advised by the investment adviser, including any mutual funds previously advised by the investment adviser that are currently advised by Fidelity SelectCo, LLC, an affiliate of the investment adviser. The group fee rate decreases as assets under management increase and increases as assets under management decrease. For the reporting period, the total annualized management fee rate was .31% of the Fund's average net assets.
Distribution and Service Plan Fees. In accordance with Rule 12b-1 of the 1940 Act, the Fund has adopted separate Distribution and Service Plans for each class of shares. Certain classes pay Fidelity Distributors Corporation (FDC), an affiliate of the investment adviser, separate Distribution and Service Fees, each of which is based on an annual percentage of each class' average net assets. In addition, FDC may pay financial intermediaries for selling shares of the Fund and providing shareholder support services. For the period, the Distribution and Service Fee rates, total fees and amounts retained by FDC were as follows:
| | Distribution
Fee | Service
Fee | Total Fees | Retained
by FDC |
| Class A | -% | .25% | $47 | $–(a) |
| Class T | -% | .25% | 28 | – |
| Class B | .65% | .25% | 3 | 2 |
| Class C | .75% | .25% | 83 | 1 |
| | | | $161 | $3 |
(a) Values shown as $0 may reflect amounts less than $500.
Sales Load. FDC may receive a front-end sales charge of up to 4.00% for selling Class A shares and Class T shares, some of which is paid to financial intermediaries for selling shares of the Fund. Depending on the holding period, FDC may receive contingent deferred sales charges levied on Class A, Class T, Class B, and Class C redemptions. The deferred sales charges range from 5.00% to 1.00% for Class B shares, 1.00% for Class C shares, .75% for certain purchases of Class A shares and .25% for certain purchases of Class T shares.
For the period, sales charge amounts retained by FDC were as follows:
| | Retained
by FDC |
| Class A | $2 |
| Class T | 2 |
| Class B(a) | 1 |
| Class C(a) | 1 |
| | $6 |
(a) When Class B and Class C shares are initially sold, FDC pays commissions from its own resources to financial intermediaries through which the sales are made.
Transfer Agent Fees. Fidelity Investments Institutional Operations Company, Inc., (FIIOC), an affiliate of the investment adviser, is the transfer, dividend disbursing and shareholder servicing agent for each class of the Fund. FIIOC receives account fees and asset-based fees that vary according to the account size and type of account of the shareholders of each respective class of the Fund, with the exception of Fidelity Mortgage Securities Fund. FIIOC receives an asset-based fee of .10% of Fidelity Mortgage Securities Fund's average net assets. FIIOC pays for typesetting, printing and mailing of shareholder reports, except proxy statements. For the period, transfer agent fees for each class were as follows:
| | Amount | % of
Class-Level Average
Net Assets(a) |
| Class A | $37 | .20 |
| Class T | 22 | .20 |
| Class B | 1 | .25 |
| Class C | 15 | .18 |
| Fidelity Mortgage Securities Fund | 444 | .10 |
| Class I | 56 | .15 |
| | $575 | |
(a) Annualized
Fund Wide Operations Fee. Pursuant to the Fund Wide Operations and Expense Agreement (FWOE), the investment adviser has agreed to provide for fund level expenses (which do not include transfer agent, Rule 12b-1 fees, compensation of the independent Trustees, interest (including commitment fees), taxes or extraordinary expenses, if any) in return for a FWOE fee equal to .35% of the Fund's average net assets less the total amount of the management fee. The FWOE paid by the Fund is reduced by an amount equal to the fees and expenses paid to the independent Trustees. For the period, the FWOE fee was equivalent to an annualized rate of .04% of average net assets.
Interfund Trades. The Fund may purchase from or sell securities to other Fidelity Funds under procedures adopted by the Board. The procedures have been designed to ensure these interfund trades are executed in accordance with Rule 17a-7 of the 1940 Act. Interfund trades are included within the respective purchases and sales amounts shown in the Purchases and Sales of Investments note.
7. Committed Line of Credit.
The Fund participates with other funds managed by the investment adviser or an affiliate in a $4.25 billion credit facility (the "line of credit") to be utilized for temporary or emergency purposes to fund shareholder redemptions or for other short-term liquidity purposes. The Fund has agreed to pay commitment fees on its pro-rata portion of the line of credit, which amounted to $1 and is reflected in Miscellaneous expenses on the Statement of Operations. During the period, the Fund did not borrow on this line of credit.
8. Expense Reductions.
During the period the investment adviser reimbursed and/or waived a portion of fund-level operating expenses in the amount of $28.
9. Distributions to Shareholders.
Distributions to shareholders of each class were as follows:
| | Six months ended February 29, 2016 | Year ended August 31, 2015 |
| From net investment income | | |
| Class A | $428 | $748 |
| Class T | 256 | 417 |
| Class B | 6 | 14 |
| Class C | 126 | 202 |
| Fidelity Mortgage Securities Fund | 11,589 | 18,864 |
| Class I | 946 | 1,318 |
| Total | $13,351 | $21,563 |
| From net realized gain | | |
| Class A | $20 | $10 |
| Class T | 13 | 6 |
| Class C | 9 | 5 |
| Fidelity Mortgage Securities Fund | 471 | 210 |
| Class I | 39 | 13 |
| Total | $552 | $244 |
10. Share Transactions.
Share transactions for each class were as follows and may contain automatic conversions between classes or exchanges between affiliated funds:
| | Shares | Shares | Dollars | Dollars |
| | Six months ended February 29, 2016 | Year ended August 31, 2015 | Six months ended February 29, 2016 | Year ended August 31, 2015 |
| Class A | | | | |
| Shares sold | 1,036 | 563 | $11,746 | $6,368 |
| Reinvestment of distributions | 35 | 59 | 399 | 669 |
| Shares redeemed | (577) | (872) | (6,530) | (9,855) |
| Net increase (decrease) | 494 | (250) | $5,615 | $(2,818) |
| Class T | | | | |
| Shares sold | 772 | 285 | $8,778 | $3,225 |
| Reinvestment of distributions | 23 | 36 | 258 | 409 |
| Shares redeemed | (486) | (458) | (5,477) | (5,196) |
| Net increase (decrease) | 309 | (137) | $3,559 | $(1,562) |
| Class B | | | | |
| Shares sold | 10 | 5 | $101 | $68 |
| Reinvestment of distributions | –(a) | 1 | 4 | 9 |
| Shares redeemed | (20) | (55) | (224) | (625) |
| Net increase (decrease) | (10) | (49) | $(119) | $(548) |
| Class C | | | | |
| Shares sold | 464 | 358 | $5,253 | $4,044 |
| Reinvestment of distributions | 10 | 15 | 113 | 166 |
| Shares redeemed | (209) | (502) | (2,363) | (5,678) |
| Net increase (decrease) | 265 | (129) | $3,003 | $(1,468) |
| Fidelity Mortgage Securities Fund | | | | |
| Shares sold | 12,675 | 20,281 | $143,608 | $230,420 |
| Reinvestment of distributions | 1,004 | 1,582 | 11,378 | 17,954 |
| Shares redeemed | (7,440) | (15,790) | (84,239) | (179,084) |
| Net increase (decrease) | 6,239 | 6,073 | $70,747 | $69,290 |
| Class I | | | | |
| Shares sold | 892 | 3,034 | $10,069 | $34,395 |
| Reinvestment of distributions | 85 | 114 | 959 | 1,290 |
| Shares redeemed | (347) | (1,110) | (3,915) | (12,534) |
| Net increase (decrease) | 630 | 2,038 | $7,113 | $23,151 |
(a) Values shown as 0 may reflect amounts less than 500.
11. Other.
The Fund's organizational documents provide former and current trustees and officers with a limited indemnification against liabilities arising in connection with the performance of their duties to the Fund. In the normal course of business, the Fund may also enter into contracts that provide general indemnifications. The Fund's maximum exposure under these arrangements is unknown as this would be dependent on future claims that may be made against the Fund. The risk of material loss from such claims is considered remote.
At the end of the period, the investment adviser or its affiliates were the owners of record of 10% of the total outstanding shares of the Fund.
12. Credit Risk.
The Fund invests a portion of its assets in structured securities of issuers backed by commercial and residential mortgage loans, credit card receivables and automotive loans. The value and related income of these securities is sensitive to changes in economic conditions, including delinquencies and/or defaults.
Shareholder Expense Example
As a shareholder of the Fund, you incur two types of costs: (1) transaction costs, including sales charges (loads) on purchase payments or redemption proceeds, and (2) ongoing costs, including management fees, distribution and/or service (12b-1) fees and other Fund expenses. This Example is intended to help you understand your ongoing costs (in dollars) of investing in the Fund and to compare these costs with the ongoing costs of investing in other mutual funds.
The Example is based on an investment of $1,000 invested at the beginning of the period and held for the entire period (September 1, 2015 to February 29, 2016).
Actual Expenses
The first line of the accompanying table for each class of the Fund provides information about actual account values and actual expenses. You may use the information in this line, together with the amount you invested, to estimate the expenses that you paid over the period. Simply divide your account value by $1,000.00 (for example, an $8,600 account value divided by $1,000.00 = 8.6), then multiply the result by the number in the first line for a class of the Fund under the heading entitled "Expenses Paid During Period" to estimate the expenses you paid on your account during this period. A small balance maintenance fee of $12.00 that is charged once a year may apply for certain accounts with a value of less than $2,000. This fee is not included in the table below. If it was, the estimate of expenses you paid during the period would be higher, and your ending account value lower, by this amount. In addition, the Fund, as a shareholder in the underlying Fidelity Central Funds, will indirectly bear its pro-rata share of the fees and expenses incurred by the underlying Fidelity Central Funds. These fees and expenses are not included in the Fund's annualized expense ratio used to calculate the expense estimate in the table below.
Hypothetical Example for Comparison Purposes
The second line of the accompanying table for each class of the Fund provides information about hypothetical account values and hypothetical expenses based on a Class' actual expense ratio and an assumed rate of return of 5% per year before expenses, which is not the Class' actual return. The hypothetical account values and expenses may not be used to estimate the actual ending account balance or expenses you paid for the period. You may use this information to compare the ongoing costs of investing in the Fund and other funds. To do so, compare this 5% hypothetical example with the 5% hypothetical examples that appear in the shareholder reports of the other funds. A small balance maintenance fee of $12.00 that is charged once a year may apply for certain accounts with a value of less than $2,000. This fee is not included in the table below. If it was, the estimate of expenses you paid during the period would be higher, and your ending account value lower, by this amount. In addition, the Fund, as a shareholder in the underlying Fidelity Central Funds, will indirectly bear its pro-rata share of the fees and expenses incurred by the underlying Fidelity Central Funds. These fees and expenses are not included in the Fund's annualized expense ratio used to calculate the expense estimate in the table below.
Please note that the expenses shown in the table are meant to highlight your ongoing costs only and do not reflect any transaction costs. Therefore, the second line of the table is useful in comparing ongoing costs only, and will not help you determine the relative total costs of owning different funds. In addition, if these transactional costs were included, your costs would have been higher.
| | Annualized Expense Ratio-A | Beginning
Account Value
September 1, 2015 | Ending
Account Value
February 29, 2016 | Expenses Paid
During Period-B
September 1, 2015
to February 29, 2016 |
| Class A | .80% | | | |
| Actual | | $1,000.00 | $1,018.20 | $4.01 |
| Hypothetical-C | | $1,000.00 | $1,020.89 | $4.02 |
| Class T | .80% | | | |
| Actual | | $1,000.00 | $1,018.20 | $4.01 |
| Hypothetical-C | | $1,000.00 | $1,020.89 | $4.02 |
| Class B | 1.50% | | | |
| Actual | | $1,000.00 | $1,014.60 | $7.51 |
| Hypothetical-C | | $1,000.00 | $1,017.40 | $7.52 |
| Class C | 1.54% | | | |
| Actual | | $1,000.00 | $1,014.40 | $7.71 |
| Hypothetical-C | | $1,000.00 | $1,017.21 | $7.72 |
| Fidelity Mortgage Securities Fund | .45% | | | |
| Actual | | $1,000.00 | $1,019.90 | $2.26 |
| Hypothetical-C | | $1,000.00 | $1,022.63 | $2.26 |
| Class I | .50% | | | |
| Actual | | $1,000.00 | $1,019.70 | $2.51 |
| Hypothetical-C | | $1,000.00 | $1,022.38 | $2.51 |
A Annualized expense ratio reflects expenses net of applicable fee waivers.
B Expenses are equal to each Class' annualized expense ratio, multiplied by the average account value over the period, multiplied by 182/366 (to reflect the one-half year period). The fees and expenses of the underlying Fidelity Central Funds in which the Fund invests are not included in each Class' annualized expense ratio. In addition to the expenses noted above, the Fund also indirectly bears its proportional share of the expenses of the underlying Fidelity Central Funds. Annualized expenses of the underlying non-money market Fidelity Central Funds as of their most recent fiscal half year were less than .005%.
C 5% return per year before expenses
Board Approval of Investment Advisory Contracts and Management Fees
Fidelity Advisor Mortgage Securities Fund
Each year, the Board of Trustees, including the Independent Trustees (together, the Board), votes on the renewal of the management contract with Fidelity Management & Research Company (FMR) and the sub-advisory agreements (together, the Advisory Contracts) for the fund. The Board, assisted by the advice of fund counsel and Independent Trustees' counsel, requests and considers a broad range of information relevant to the renewal of the Advisory Contracts throughout the year.
The Board meets regularly and, at each of its meetings, covers an extensive agenda of topics and materials and considers factors that are relevant to its annual consideration of the renewal of the fund's Advisory Contracts, including the services and support provided to the fund and its shareholders. The Board has established four standing committees (Committees) — Operations, Audit, Fair Valuation, and Governance and Nominating — each composed of and chaired by Independent Trustees with varying backgrounds, to which the Board has assigned specific subject matter responsibilities in order to enhance effective decision-making by the Board. The Operations Committee, of which all of the Independent Trustees are members, meets regularly throughout the year and considers, among other matters, information specifically related to the annual consideration of the renewal of the fund's Advisory Contracts. The Board, acting directly and through its Committees, requests and receives information concerning the annual consideration of the renewal of the fund's Advisory Contracts. The Board also meets as needed to consider matters specifically related to the Board's annual consideration of the renewal of the Advisory Contracts. Members of the Board may also meet with trustees of other Fidelity funds through ad hoc joint committees to discuss certain matters relevant to all of the Fidelity funds.
At its September 2015 meeting, the Board unanimously determined to renew the fund's Advisory Contracts. In reaching its determination, the Board considered all factors it believed relevant, including (i) the nature, extent, and quality of the services to be provided to the fund and its shareholders (including the investment performance of the fund); (ii) the competitiveness of the fund's management fee and total expense ratio relative to peer funds; (iii) the total costs of the services to be provided by and the profits to be realized by Fidelity from its relationship with the fund; and (iv) the extent to which (if any) economies of scale exist and would be realized as the fund grows, and whether any economies of scale are appropriately shared with fund shareholders.
In considering whether to renew the Advisory Contracts for the fund, the Board reached a determination, with the assistance of fund counsel and Independent Trustees' counsel and through the exercise of its business judgment, that the renewal of the Advisory Contracts was in the best interests of the fund and its shareholders and that the compensation payable under the Advisory Contracts was fair and reasonable. The Board's decision to renew the Advisory Contracts was not based on any single factor, but rather was based on a comprehensive consideration of all the information provided to the Board at its meetings throughout the year. The Board, in reaching its determination to renew the Advisory Contracts, was aware that shareholders of the fund have a broad range of investment choices available to them, including a wide choice among funds offered by Fidelity's competitors, and that the fund's shareholders, who have the opportunity to review and weigh the disclosure provided by the fund in its prospectus and other public disclosures, have chosen to invest in this fund, which is part of the Fidelity family of funds.
Nature, Extent, and Quality of Services Provided. The Board considered Fidelity's staffing as it relates to the fund, including the backgrounds of investment personnel of Fidelity, and also considered the fund's investment objective, strategies, and related investment philosophy. The Independent Trustees also had discussions with senior management of Fidelity's investment operations and investment groups. The Board considered the structure of the portfolio manager compensation program and whether this structure provides appropriate incentives to act in the best interests of the fund. Additionally, the Board considered the portfolio managers' investments, if any, in the funds that they manage.
Resources Dedicated to Investment Management and Support Services. The Board reviewed the general qualifications and capabilities of Fidelity's investment staff, including its size, education, experience, and resources, as well as Fidelity's approach to recruiting, training, managing, and compensating investment personnel. The Board noted that Fidelity has continued to increase the resources devoted to non-U.S. offices, including expansion of Fidelity's global investment organization. The Board also noted that Fidelity's analysts have extensive resources, tools and capabilities that allow them to conduct sophisticated quantitative and fundamental analysis, as well as credit analysis of issuers, counterparties and guarantors. Further, the Board considered that Fidelity's investment professionals have sufficient access to global information and data so as to provide competitive investment results over time, and that those professionals also have access to sophisticated tools that permit them to assess portfolio construction and risk and performance attribution characteristics continuously, as well as to transmit new information and research conclusions rapidly around the world. Additionally, in its deliberations, the Board considered Fidelity's trading, risk management, compliance, and technology and operations capabilities and resources, which are integral parts of the investment management process.
Shareholder and Administrative Services. The Board considered (i) the nature, extent, quality, and cost of advisory, administrative, and shareholder services performed by FMR, the sub-advisers (together with FMR, the Investment Advisers), and their affiliates under the Advisory Contracts and under separate agreements covering transfer agency, pricing and bookkeeping, and securities lending services for the fund; (ii) the nature and extent of the supervision of third party service providers, principally custodians, subcustodians, and pricing vendors; and (iii) the resources devoted to, and the record of compliance with, the fund's compliance policies and procedures.
The Board noted that the growth of fund assets over time across the complex allows Fidelity to reinvest in the development of services designed to enhance the value or convenience of the Fidelity funds as investment vehicles. These services include 24-hour access to account information and market information through telephone representatives and over the Internet, investor education materials and asset allocation tools, and the expanded availability of Fidelity Investor Centers.
Investment in a Large Fund Family. The Board considered the benefits to shareholders of investing in a Fidelity fund, including the benefits of investing in a fund that is part of a large family of funds offering a variety of investment disciplines and providing a large variety of mutual fund investor services. The Board noted that Fidelity had taken, or had made recommendations that resulted in the Fidelity funds taking, a number of actions over the previous year that benefited particular funds, including (i) continuing to dedicate additional resources to investment research and to the support of the senior management team that oversees asset management; (ii) continuing efforts to enhance Fidelity's global research capabilities; (iii) launching new funds and making other enhancements to meet client needs; (iv) reducing management fees and total expenses for certain index funds and diversified international funds; (v) continuing to launch dedicated lower cost underlying funds to meet portfolio construction needs related to expanding underlying fund options for Fidelity funds of funds, specifically for the Freedom Fund product lines; (vi) rationalizing product lines and gaining increased efficiencies through fund mergers; (vii) launching active fixed-income exchange-traded funds; (viii) continuing to develop, acquire and implement systems and technology to improve services to the funds and shareholders, strengthen information security, and increase efficiency; (ix) implementing investment enhancements to further strengthen Fidelity's target date product line to increase investors' probability of success in achieving their goals; (x) modifying the eligibility criteria for certain share classes to accommodate roll-over assets from employer-sponsored retirement plans; (xi) launching a new Class W of the Freedom Index Funds to attract and retain Fidelity record-kept retirement plan assets; and (xii) implementing changes to Fidelity's money market product line in response to recent money market regulatory reforms.
Investment Performance. The Board considered whether the fund has operated in accordance with its investment objective, as well as its record of compliance with its investment restrictions and its performance history.
The Board took into account discussions with representatives of the Investment Advisers about fund investment performance that occur at Board meetings throughout the year. In this regard the Board noted that as part of regularly scheduled fund reviews and other reports to the Board on fund performance, the Board considers annualized return information for the fund for different time periods, measured against a securities market index ("benchmark index") and a peer group of funds with similar objectives ("peer group"), if any. In its evaluation of fund investment performance at meetings throughout the year, the Board gave particular attention to information indicating underperformance of certain Fidelity funds for specific time periods and discussed with the Investment Advisers the reasons for such underperformance.
In addition to reviewing absolute and relative fund performance, the Independent Trustees periodically consider the appropriateness of fund performance metrics in evaluating the results achieved. In general, the Independent Trustees believe that fund performance should be evaluated based on gross performance (before fees and expenses but after transaction costs) compared to appropriate benchmark indices, over appropriate time periods that may include full market cycles, and on net performance (after fees and expenses) compared to peer groups, as applicable, over the same periods, taking into account relevant factors including the following: general market conditions; expectations for interest rate levels and credit conditions; issuer-specific information including credit quality; the potential for incremental return versus the fund's benchmark index weighed against the risks involved in obtaining that incremental return, including the risk of diminished or negative total returns; and fund cash flows and other factors. Depending on the circumstances, the Independent Trustees may be satisfied with a fund's performance notwithstanding that it lags its benchmark index or peer group for certain periods.
The Independent Trustees recognize that shareholders evaluate performance on a net basis over their own holding periods, for which one-, three-, and five-year periods are often used as a proxy. For this reason, the performance information reviewed by the Board also included net cumulative calendar year total return information for the fund and an appropriate benchmark index and peer group for the most recent one-, three-, and five-year periods.
Based on its review, the Board concluded that the nature, extent, and quality of services provided to the fund under the Advisory Contracts should benefit the shareholders of the fund.
Competitiveness of Management Fee and Total Expense Ratio. The Board considered the fund's management fee and total expense ratio compared to "mapped groups" of competitive funds and classes created for the purpose of facilitating the Trustees' competitive analysis of management fees and total expenses. Fidelity creates "mapped groups" by combining similar Lipper investment objective categories that have comparable investment mandates. Combining Lipper investment objective categories aids the Board's management fee and total expense ratio comparisons by broadening the competitive group used for comparison.
Management Fee. The Board considered two proprietary management fee comparisons for the 12-month periods shown in basis points (BP) in the chart below. The group of Lipper funds used by the Board for management fee comparisons is referred to below as the "Total Mapped Group" and, for the reasons explained above, is broader than the Lipper peer group used by the Board for performance comparisons. The Total Mapped Group comparison focuses on a fund's standing in terms of gross management fees before expense reimbursements or caps relative to the total universe of funds with comparable investment mandates, regardless of whether their management fee structures also are comparable. Funds with comparable investment mandates offer exposure to similar types of securities. Funds with comparable management fee structures have similar management fee contractual arrangements (
e.g., flat rate charged for advisory services, all-inclusive fee rate,
etc.). "TMG %" represents the percentage of funds in the Total Mapped Group that had management fees that were lower than the fund's. For example, a hypothetical TMG % of 20% would mean that 80% of the funds in the Total Mapped Group had higher, and 20% had lower, management fees than the fund. The fund's actual TMG %s and the number of funds in the Total Mapped Group are in the chart below. The "Asset-Size Peer Group" (ASPG) comparison focuses on a fund's standing relative to a subset of non-Fidelity funds within the Total Mapped Group that are similar in size and management fee structure. For example, if a fund is in the first quartile of the ASPG, the fund's management fee ranks in the least expensive or lowest 25% of funds in the ASPG. The ASPG represents at least 15% of the funds in the Total Mapped Group with comparable asset size and management fee structures, subject to a minimum of 50 funds (or all funds in the Total Mapped Group if fewer than 50). Additional information, such as the ASPG quartile in which the fund's management fee rate ranked, is also included in the chart and considered by the Board.
Fidelity Advisor Mortgage Securities Fund
The Board noted that the fund's management fee rate ranked below the median of its Total Mapped Group and below the median of its ASPG for 2014.
The Board noted that, in 2014, the ad hoc Committee on Group Fee was formed by it and other Fidelity fund boards to conduct an in-depth review of the "group fee" component of the management fee of funds with such management fee structures. Committee focus included the mechanics of the group fee, the competitive landscape of group fee structures, Fidelity funds with no group fee component and investment products not included in group fee assets. The Board also considered that, for funds subject to the group fee, FMR agreed to voluntarily waive fees over a specified period of time in amounts designed to account for assets converted from certain funds to certain collective investment trusts.
Based on its review, the Board concluded that the fund's management fee is fair and reasonable in light of the services that the fund receives and the other factors considered.
Total Expense Ratio. In its review of each class's total expense ratio, the Board considered the fund's management fee rate as well as other fund or class expenses, as applicable, such as transfer agent fees, pricing and bookkeeping fees, fund-paid 12b-1 fees, and custodial, legal, and audit fees. The Board also noted that Fidelity may agree to waive fees and expenses from time to time, and the extent to which, if any, it has done so for the fund. As part of its review, the Board also considered the current and historical total expense ratios of each class of the fund compared to competitive fund median expenses. Each class of the fund is compared to those funds and classes in the Total Mapped Group (used by the Board for management fee comparisons) that have a similar sales load structure.
The Board noted that the total expense ratio of each class ranked below its competitive median for 2014.
The Board considered that the current contractual arrangements for the fund have the effect of setting the total "fund-level" (but not "class-level") expenses (including, among certain other "fund-level" expenses, the management fee) for each class at 0.35%. These contractual arrangements may not be increased without the approval of the Board.
The Board recognized that the fund's management contract incorporates a "group fee" structure, which provides for lower group fee rates as total group assets increase, and for higher group fee rates as total group assets decrease (with "group assets" defined to include fund assets under FMR's management plus sector fund assets previously under FMR's management and currently managed by Fidelity SelectCo, LLC). FMR calculates the group fee rates based on a tiered asset "breakpoint" schedule that varies based on asset class. The Board noted, however, that because the current contractual arrangements set the total "fund-level" expenses for each class at 0.35%, increases or decreases in the management fee due to changes in the group fee rate will not impact the total expense ratio.
Fees Charged to Other Fidelity Clients. The Board also considered Fidelity fee structures and other information with respect to clients of Fidelity, such as other funds advised or subadvised by Fidelity, pension plan clients, and other institutional clients with similar mandates. The Board noted the findings of the 2013 ad hoc joint committee (created with the board of other Fidelity funds), which reviewed and compared Fidelity's institutional investment advisory business with its business of providing services to the Fidelity funds, including the differences in services provided, fees charged, and costs incurred, as well as competition in their respective marketplaces.
Based on its review of total expense ratios and fees charged to other Fidelity clients, the Board concluded that the total expense ratio of each class of the fund was reasonable in light of the services that the fund and its shareholders receive and the other factors considered.
Costs of the Services and Profitability. The Board considered the revenues earned and the expenses incurred by Fidelity in conducting the business of developing, marketing, distributing, managing, administering and servicing the fund and servicing the fund's shareholders. The Board also considered the level of Fidelity's profits in respect of all the Fidelity funds.
On an annual basis, Fidelity presents to the Board information about the profitability of its relationship with the fund. Fidelity calculates profitability information for each fund, as well as aggregate profitability information for groups of Fidelity funds and all Fidelity funds, using a series of detailed revenue and cost allocation methodologies which originate with the books and records of Fidelity on which Fidelity's audited financial statements are based. The Audit Committee of the Board reviews any significant changes from the prior year's methodologies.
PricewaterhouseCoopers LLP (PwC), independent registered public accounting firm and auditor to Fidelity and certain Fidelity funds, has been engaged annually by the Board as part of the Board's assessment of Fidelity's profitability analysis. PwC's engagement includes the review and assessment of the methodologies used by Fidelity in determining the revenues and expenses attributable to Fidelity's mutual fund business, and completion of agreed-upon procedures in respect of the mathematical accuracy of fund profitability and its conformity to established allocation methodologies. After considering PwC's reports issued under the engagement and information provided by Fidelity, the Board concluded that while other allocation methods may also be reasonable, Fidelity's profitability methodologies are reasonable in all material respects.
The Board also reviewed Fidelity's non-fund businesses and fall-out benefits related to the mutual fund business as well as cases where Fidelity's affiliates may benefit from or be related to the fund's business.
The Board considered the costs of the services provided by and the profits realized by Fidelity in connection with the operation of the fund and was satisfied that the profitability was not excessive.
Economies of Scale. The Board considered whether there have been economies of scale in respect of the management of the Fidelity funds, whether the Fidelity funds (including the fund) have appropriately benefited from any such economies of scale, and whether there is potential for realization of any further economies of scale. The Board considered the extent to which the fund will benefit from economies of scale as assets grow through increased services to the fund, through waivers or reimbursements, or through fee or expense ratio reductions. The Board also noted that in 2013, it and the boards of other Fidelity funds created an ad hoc committee (the Economies of Scale Committee) to analyze whether Fidelity attains economies of scale in respect of the management and servicing of the Fidelity funds, whether the Fidelity funds have appropriately benefited from such economies of scale, and whether there is potential for realization of any further economies of scale.
The Board concluded, taking into account the analysis of the Economies of Scale Committee, that economies of scale, if any, are being appropriately shared between fund shareholders and Fidelity.
Additional Information Requested by the Board. In order to develop fully the factual basis for consideration of the Fidelity funds' Advisory Contracts, the Board requested and received additional information on certain topics, including: (i) Fidelity's fund profitability methodology, profitability trends for certain funds, and the impact of certain factors on fund profitability results; (ii) portfolio manager changes that have occurred during the past year and the amount of the investment that each portfolio manager has made in the Fidelity fund(s) that he or she manages; (iii) Fidelity's compensation structure for portfolio managers, research analysts, and other key personnel, including its effects on fund profitability, the rationale for the compensation structure, and the extent to which current market conditions have affected retention and recruitment; (iv) the arrangements with and compensation paid to certain fund sub-advisers on behalf of the Fidelity funds; (v) Fidelity's voluntary waiver of its fees to maintain minimum yields for certain money market funds and classes as well as contractual waivers in place for certain funds; (vi) the methodology with respect to competitive fund data and peer group classifications; (vii) Fidelity's transfer agent fee, expense, and service structures for different funds and classes relative to competitive trends, and the impact of the increased use of omnibus accounts; (viii) Fidelity's long-term expectations for its offerings in the workplace investing channel; (ix) new developments in the retail and institutional marketplaces; and (x) the impact of money market reform on Fidelity's money market funds. In addition, the Board considered its discussions with Fidelity throughout the year regarding enhanced information security initiatives and the funds' fair valuation policies.
Based on its evaluation of all of the conclusions noted above, and after considering all factors it believed relevant, the Board concluded that the advisory fee structures are fair and reasonable, and that the fund's Advisory Contracts should be renewed.
Corporate Headquarters
245 Summer St.
Boston, MA 02210
www.fidelity.com
MOR-SANN-0416
1.703537.118
Item 2.
Code of Ethics
Not applicable.
Item 3.
Audit Committee Financial Expert
Not applicable.
Item 4.
Principal Accountant Fees and Services
Not applicable.
Item 5.
Audit Committee of Listed Registrants
Not applicable.
Item 6.
Investments
(a)
Not applicable.
(b)
Not applicable
Item 7.
Disclosure of Proxy Voting Policies and Procedures for Closed-End Management Investment Companies
Not applicable.
Item 8.
Portfolio Managers of Closed-End Management Investment Companies
Not applicable.
Item 9.
Purchase of Equity Securities by Closed-End Management Investment Company and Affiliated Purchasers
Not applicable.
Item 10.
Submission of Matters to a Vote of Security Holders
There were no material changes to the procedures by which shareholders may recommend nominees to the Fidelity Advisor Series II’s Board of Trustees.
Item 11.
Controls and Procedures
(a)(i) The President and Treasurer and the Chief Financial Officer have concluded that the Fidelity Advisor Series II’s (the “Trust”) disclosure controls and procedures (as
defined in Rule 30a-3(c) under the Investment Company Act) provide reasonable assurances that material information relating to the Trust is made known to them by the appropriate persons, based on their evaluation of these controls and procedures as of a date within 90 days of the filing date of this report.
(a)(ii) There was no change in the Trust’s internal control over financial reporting (as defined in Rule 30a-3(d) under the Investment Company Act) that occurred during the second fiscal quarter of the period covered by this report that has materially affected, or is reasonably likely to materially affect, the Trust’s internal control over financial reporting.
Item 12.
Exhibits
| | |
(a) | (1) | Not applicable. |
(a) | (2) | Certification pursuant to Rule 30a-2(a) under the Investment Company Act of 1940 (17 CFR 270.30a-2(a)) is filed and attached hereto as Exhibit 99.CERT. |
(a) | (3) | Not applicable. |
(b) |
| Certification pursuant to Rule 30a-2(b) under the Investment Company Act of 1940 (17 CFR 270.30a-2(b)) is furnished and attached hereto as Exhibit 99.906CERT. |
SIGNATURES
Pursuant to the requirements of the Securities Exchange Act of 1934 and the Investment Company Act of 1940, the registrant has duly caused this report to be signed on its behalf by the undersigned, thereunto duly authorized.
Fidelity Advisor Series II
| |
By: | /s/Stephanie J. Dorsey |
| Stephanie J. Dorsey |
| President and Treasurer |
|
|
Date: | April 25, 2016 |
Pursuant to the requirements of the Securities Exchange Act of 1934 and the Investment Company Act of 1940, this report has been signed below by the following persons on behalf of the registrant and in the capacities and on the dates indicated.
| |
By: | /s/Stephanie J. Dorsey |
| Stephanie J. Dorsey |
| President and Treasurer |
|
|
Date: | April 25, 2016 |
| |
By: | /s/Howard J. Galligan III |
| Howard J. Galligan III |
| Chief Financial Officer |
|
|
Date: | April 25, 2016 |