Fidelity Advisor® Strategic Income Fund
Annual Report
December 31, 2019
Includes Fidelity and Fidelity Advisor share classes

See the inside front cover for important information about access to your fund’s shareholder reports.

Beginning on January 1, 2021, as permitted by regulations adopted by the Securities and Exchange Commission, paper copies of a fund’s shareholder reports will no longer be sent by mail, unless you specifically request paper copies of the reports from the fund or from your financial intermediary, such as a financial advisor, broker-dealer or bank. Instead, the reports will be made available on a website, and you will be notified by mail each time a report is posted and provided with a website link to access the report.
If you already elected to receive shareholder reports electronically, you will not be affected by this change and you need not take any action. You may elect to receive shareholder reports and other communications from a fund electronically, by contacting your financial intermediary. For Fidelity customers, visit Fidelity's web site or call Fidelity using the contact information listed below.
You may elect to receive all future reports in paper free of charge. If you wish to continue receiving paper copies of your shareholder reports, you may contact your financial intermediary or, if you are a Fidelity customer, visit Fidelity’s website, or call Fidelity at the applicable toll-free number listed below. Your election to receive reports in paper will apply to all funds held with the fund complex/your financial intermediary.
| Account Type | Website | Phone Number |
| Brokerage, Mutual Fund, or Annuity Contracts: | fidelity.com/mailpreferences | 1-800-343-3548 |
| Employer Provided Retirement Accounts: | netbenefits.fidelity.com/preferences (choose 'no' under Required Disclosures to continue to print) | 1-800-343-0860 |
| Advisor Sold Accounts Serviced Through Your Financial Intermediary: | Contact Your Financial Intermediary | Your Financial Intermediary's phone number |
| Advisor Sold Accounts Serviced by Fidelity: | institutional.fidelity.com | 1-877-208-0098 |
To view a fund's proxy voting guidelines and proxy voting record for the 12-month period ended June 30, visit http://www.fidelity.com/proxyvotingresults or visit the Securities and Exchange Commission's (SEC) web site at http://www.sec.gov.
You may also call 1-800-544-8544 if you’re an individual investing directly with Fidelity, call 1-800-835-5092 if you’re a plan sponsor or participant with Fidelity as your recordkeeper or call 1-877-208-0098 on institutional accounts or if you’re an advisor or invest through one to request a free copy of the proxy voting guidelines.
Standard & Poor's, S&P and S&P 500 are registered service marks of The McGraw-Hill Companies, Inc. and have been licensed for use by Fidelity Distributors Corporation.
Other third-party marks appearing herein are the property of their respective owners.
All other marks appearing herein are registered or unregistered trademarks or service marks of FMR LLC or an affiliated company. © 2020 FMR LLC. All rights reserved.
This report and the financial statements contained herein are submitted for the general information of the shareholders of the Fund. This report is not authorized for distribution to prospective investors in the Fund unless preceded or accompanied by an effective prospectus.
A fund files its complete schedule of portfolio holdings with the SEC for the first and third quarters of each fiscal year on Form N-PORT. Forms N-PORT are available on the SEC’s web site at http://www.sec.gov. A fund's Forms N-PORT may be reviewed and copied at the SEC’s Public Reference Room in Washington, DC. Information regarding the operation of the SEC's Public Reference Room may be obtained by calling 1-800-SEC-0330.
For a complete list of a fund's portfolio holdings, view the most recent holdings listing, semiannual report, or annual report on Fidelity's web site at http://www.fidelity.com, http://www.institutional.fidelity.com, or http://www.401k.com, as applicable.
NOT FDIC INSURED •MAY LOSE VALUE •NO BANK GUARANTEE
Neither the Fund nor Fidelity Distributors Corporation is a bank.
Fidelity Advisor® Strategic Income Fund
Performance: The Bottom Line
Average annual total return reflects the change in the value of an investment, assuming reinvestment of distributions from dividend income and capital gains (the profits earned upon the sale of securities that have grown in value, if any) and assuming a constant rate of performance each year. The hypothetical investment and the average annual total returns do not reflect the deduction of taxes that a shareholder would pay on fund distributions or the redemption of fund shares. During periods of reimbursement by Fidelity, a fund’s total return will be greater than it would be had the reimbursement not occurred. How a fund did yesterday is no guarantee of how it will do tomorrow.
Average Annual Total Returns
| For the periods ended December 31, 2019 | Past 1 year | Past 5 years | Past 10 years |
| Class A (incl. 4.00% sales charge) | 6.31% | 3.44% | 4.49% |
| Class M (incl. 4.00% sales charge) | 6.32% | 3.43% | 4.50% |
| Class C (incl. contingent deferred sales charge) | 8.94% | 3.52% | 4.15% |
| Fidelity® Strategic Income Fund | 11.04% | 4.54% | 5.17% |
| Class I | 11.00% | 4.53% | 5.17% |
| Class Z | 11.19% | 4.56% | 5.19% |
Class C shares' contingent deferred sales charges included in the past one year, past five years and past ten years total return figures are 1%, 0% and 0%, respectively.
The initial offering of Class Z shares took place on October 2, 2018. Returns prior to October 2, 2018, are those of Class I.
The initial offering of Fidelity® Strategic Income Fund shares took place on April 13, 2018. Returns prior to April 13, 2018 are those of Class I.
$10,000 Over 10 Years
Let's say hypothetically that $10,000 was invested in Fidelity Advisor® Strategic Income Fund - Class A on December 31, 2009, and the current 4.00% sales charge was paid.
The chart shows how the value of your investment would have changed, and also shows how the Bloomberg Barclays U.S. Universal Bond Index performed over the same period.
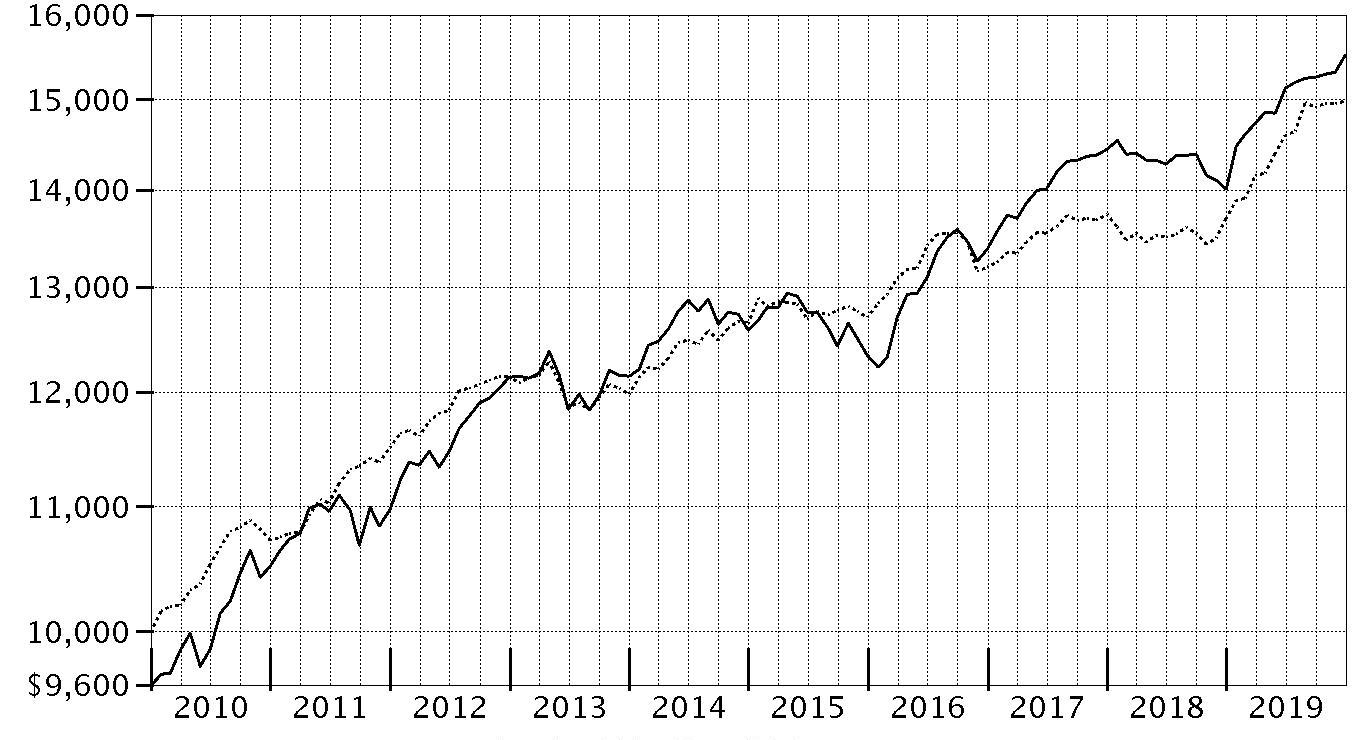
| Period Ending Values |
| $15,517 | Fidelity Advisor® Strategic Income Fund - Class A |
| $14,978 | Bloomberg Barclays U.S. Universal Bond Index |
Fidelity Advisor® Strategic Income Fund
Management's Discussion of Fund Performance
Market Recap: The global economy was sluggish in 2019, but most major economies remained in expansion amid signs that conditions were no longer deteriorating. The U.S. stood firmly in the late-cycle phase throughout the year, whereas recessionary conditions in major European nations, including Germany and Italy, appeared poised for improvement in December. U.S.–China trade-policy uncertainty served as a drag on corporate confidence for most of the period, but the two reportedly reached an agreement to reduce certain U.S. tariffs. Against this backdrop, the Fidelity Strategic Income Composite Index℠ gained 10.53%. All five asset classes represented within the index generated positive returns, led by U.S. high-yield bonds, which, as measured by the ICE BofAML
® U.S. High Yield Constrained Index, gained 14.41% amid a supportive backdrop for riskier assets and resilient corporate fundamentals. Also performing well, emerging-market bonds advanced 13.11%, as reflected by the Bloomberg Barclays Emerging Markets Index, while floating-rate debt, as measured by the S&P/LSTA
® Leveraged Performing Loan Index, rose 8.70% in 2019. Meanwhile, slower global economic growth, coupled with the U.S. Federal Reserve’s dovish shift early in the year, resulted in a 6.83% increase for the Bloomberg Barclays U.S. Government Bond Index. Finally, non-U.S. developed market debt, as measured by the Bloomberg Barclays Global Aggregate Developed Markets GDP Weighted Ex USD Index (Hedged), gained 5.15% this past year.
Comments from Co-Lead Portfolio Manager Adam Kramer: For the year, the fund's share classes (excluding sales charges, if applicable) gained roughly 10% to 11%, outperforming the 9.29% increase in our primary benchmark, the Bloomberg Barclays U.S. Universal Bond Index, with most share classes outperforming the 10.53% advance of the Fidelity Strategic Income Composite Index℠ as well. Relative to this latter index, which, given its mix of investments, we see as a closer match for the fund, the main performance driver was favorable security selection, especially in the high-yield bond subportfolio. Specifically, investments in the technology and energy industries were particularly helpful, while significantly overweighting the banks & thrifts segment of the high yield market also contributed. A combination of favorable security selection and underweighting in the lagging non-U.S. developed-market debt subportfolio also aided the broader fund's relative result. This subportfolio benefited from both credit exposure and allocations to certain out-of-favor areas of the market that were bolstered by tightening credit spreads, including corporate bonds and the debt of peripheral sovereign issuers. In contrast, security selection in emerging-markets debt was the fund's biggest performance challenge this year by far. Relatively limited exposure to longer-duration emerging-markets bonds detracted, as did a significant overweighting in the poor-performing Argentinian market while the subportfolio's large average cash stake also hurt in a rising market.
The views expressed above reflect those of the portfolio manager(s) only through the end of the period as stated on the cover of this report and do not necessarily represent the views of Fidelity or any other person in the Fidelity organization. Any such views are subject to change at any time based upon market or other conditions and Fidelity disclaims any responsibility to update such views. These views may not be relied on as investment advice and, because investment decisions for a Fidelity fund are based on numerous factors, may not be relied on as an indication of trading intent on behalf of any Fidelity fund.
Notes to shareholders: On March 28, 2019, Ario Emami Nejad and Rosie McMellin assumed co-management responsibilities for the fund's developed-market debt subportfolio, succeeding David Simner.
In mid-December, the fund's foreign developed-markets debt subportfolio began hedging its currency exposure and, accordingly, adopted the U.S.-dollar-hedged version of the Bloomberg Barclays Global Aggregate Developed Markets ex USD GDP Weighted Index within the Fidelity Strategic Income Composite Index.
On October 1, 2019, Brian Chang assumed co-management responsibilities for the high-income subportfolio, joining Mark Notkin.
Fidelity Advisor® Strategic Income Fund
Investment Summary (Unaudited)
The information in the following tables is based on the combined investments of the Fund and its pro-rata share of the investments of Fidelity's Fixed-Income Central Funds.
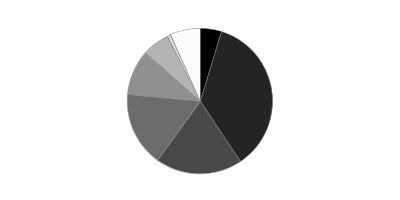
Top Five Holdings as of December 31, 2019
| (by issuer, excluding cash equivalents) | % of fund's net assets |
| U.S. Treasury Obligations | 17.3 |
| German Federal Republic | 2.5 |
| Japan Government | 2.4 |
| Ginnie Mae guaranteed REMIC pass-thru certificates | 1.8 |
| CCO Holdings LLC/CCO Holdings Capital Corp. | 1.7 |
| | 25.7 |
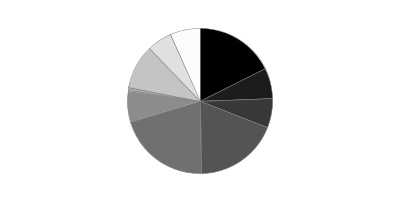
Top Five Market Sectors as of December 31, 2019
| | % of fund's net assets |
| Financials | 11.3 |
| Energy | 8.8 |
| Communication Services | 8.2 |
| Consumer Discretionary | 5.3 |
| Health Care | 5.2 |
Quality Diversification (% of fund's net assets)
| As of December 31, 2019 |
| | U.S. Government and U.S. Government Agency Obligations* | 17.7% |
| | AAA,AA,A | 6.8% |
| | BBB | 6.5% |
| | BB | 18.7% |
| | B | 20.6% |
| | CCC,CC,C | 6.9% |
| | D | 0.8% |
| | Not Rated | 9.9% |
| | Equities | 5.5% |
| | Short-Term Investments and Net Other Assets | 6.6% |
* Includes NCUA Guaranteed Notes
We have used ratings from Moody's Investors Service, Inc. Where Moody's® ratings are not available, we have used S&P® ratings. All ratings are as of the date indicated and do not reflect subsequent changes.
Asset Allocation (% of fund's net assets)
| As of December 31, 2019*,**,***,† |
| | Preferred Securities | 4.8% |
| | Corporate Bonds | 35.8% |
| | U.S. Government and U.S. Government Agency Obligations†† | 19.3% |
| | Foreign Government & Government Agency Obligations | 16.5% |
| | Bank Loan Obligations | 10.1% |
| | Stocks | 6.1% |
| | Other Investments | 0.8% |
| | Short-Term Investments and Net Other Assets (Liabilities) | 6.6% |
* Foreign investments – 32.3%
** Futures and Swaps – 4.6%
*** Written options – (1.2)%
† Forward Currency Contracts – (11.4)%
†† Includes NCUA Guaranteed Notes
An unaudited holdings listing for the Fund, which presents direct holdings as well as the pro-rata share of any securities and other investments held indirectly through its investment in underlying non-money market Fidelity Central Funds, is available at fidelity.com and/or institutional.fidelity.com, as applicable.
Percentages in the above tables are adjusted for the effect of TBA Sale Commitments.
Fidelity Advisor® Strategic Income Fund
Schedule of Investments December 31, 2019
Showing Percentage of Net Assets
| Corporate Bonds - 29.1% | | | |
| | | Principal Amount (000s)(a) | Value (000s) |
| Convertible Bonds - 0.1% | | | |
| CONSUMER DISCRETIONARY - 0.0% | | | |
| Auto Components - 0.0% | | | |
| Exide Technologies 7.25% 4/30/27 pay-in-kind (b)(c) | | $1,267 | $190 |
| ENERGY - 0.1% | | | |
| Oil, Gas & Consumable Fuels - 0.1% | | | |
| Denbury Resources, Inc. 6.375% 12/31/24 (b) | | 24,702 | 16,961 |
|
| TOTAL CONVERTIBLE BONDS | | | 17,151 |
|
| Nonconvertible Bonds - 29.0% | | | |
| COMMUNICATION SERVICES - 5.4% | | | |
| Diversified Telecommunication Services - 1.3% | | | |
| C&W Senior Financing Designated Activity Co. 6.875% 9/15/27 (b) | | 13,810 | 14,767 |
| Frontier Communications Corp. 8.5% 4/1/26 (b) | | 20,255 | 20,508 |
| GCI, Inc. 6.875% 4/15/25 | | 8,000 | 8,360 |
| Sable International Finance Ltd. 5.75% 9/7/27 (b) | | 9,165 | 9,692 |
| SFR Group SA: | | | |
| 5.5% 1/15/28 (b) | | 13,345 | 13,713 |
| 7.375% 5/1/26 (b) | | 62,475 | 67,076 |
| 8.125% 2/1/27 (b) | | 4,495 | 5,062 |
| Sprint Capital Corp.: | | | |
| 6.875% 11/15/28 | | 29,107 | 31,363 |
| 8.75% 3/15/32 | | 17,468 | 21,202 |
| Telenet Finance Luxembourg Notes SARL 5.5% 3/1/28 (b) | | 9,200 | 9,821 |
| U.S. West Communications: | | | |
| 6.875% 9/15/33 | | 4,080 | 4,098 |
| 7.25% 9/15/25 | | 955 | 1,098 |
| UPCB Finance IV Ltd. 5.375% 1/15/25 (b) | | 8,745 | 8,990 |
| Virgin Media Finance PLC 4.875% 2/15/22 | | 10,085 | 10,261 |
| | | | 226,011 |
| Entertainment - 0.5% | | | |
| Lions Gate Entertainment Corp. 5.875% 11/1/24 (b) | | 2,640 | 2,680 |
| Livent, Inc. 9.375% 10/15/04 (d)(e) | | 300 | 0 |
| Netflix, Inc.: | | | |
| 4.375% 11/15/26 | | 3,920 | 4,018 |
| 4.875% 4/15/28 | | 16,980 | 17,637 |
| 5.375% 11/15/29 (b) | | 6,760 | 7,199 |
| 5.875% 11/15/28 | | 38,210 | 42,358 |
| New Cotai LLC/New Cotai Capital Corp. 10.625% 5/1/19 pay-in-kind (b)(c)(d) | | 19,050 | 8,382 |
| | | | 82,274 |
| Media - 3.3% | | | |
| Block Communications, Inc. 6.875% 2/15/25 (b) | | 5,740 | 5,955 |
| CCO Holdings LLC/CCO Holdings Capital Corp.: | | | |
| 4.75% 3/1/30 (b) | | 53,630 | 54,704 |
| 5% 2/1/28 (b) | | 54,720 | 57,419 |
| 5.125% 2/15/23 | | 18,635 | 18,821 |
| 5.125% 5/1/23 (b) | | 10,230 | 10,441 |
| 5.125% 5/1/27 (b) | | 42,005 | 44,315 |
| 5.375% 5/1/25 (b) | | 10,230 | 10,562 |
| 5.375% 6/1/29 (b) | | 31,835 | 33,984 |
| 5.5% 5/1/26 (b) | | 12,355 | 13,019 |
| 5.75% 9/1/23 | | 4,645 | 4,732 |
| 5.75% 1/15/24 | | 1,226 | 1,247 |
| 5.75% 2/15/26 (b) | | 13,895 | 14,660 |
| 5.875% 5/1/27 (b) | | 10,315 | 10,908 |
| Cengage Learning, Inc. 9.5% 6/15/24 (b) | | 5,830 | 5,043 |
| CSC Holdings LLC: | | | |
| 5.375% 2/1/28 (b) | | 13,855 | 14,773 |
| 5.5% 5/15/26 (b) | | 31,192 | 33,024 |
| 5.75% 1/15/30 (b) | | 61,690 | 65,854 |
| 6.5% 2/1/29 (b) | | 15,380 | 17,149 |
| 7.5% 4/1/28 (b) | | 8,475 | 9,577 |
| Getty Images, Inc. 9.75% 3/1/27 (b) | | 12,745 | 12,649 |
| iHeartCommunications, Inc.: | | | |
| 4.75% 1/15/28 (b) | | 4,965 | 5,089 |
| 11.25% 3/1/21 (e) | | 7,710 | 0 |
| LCPR Senior Secured Financing DAC 6.75% 10/15/27 (b) | | 6,785 | 7,192 |
| Nexstar Escrow, Inc. 5.625% 7/15/27 (b) | | 14,270 | 15,038 |
| Outfront Media Capital LLC / Corp. 4.625% 3/15/30 (b) | | 6,620 | 6,736 |
| Quebecor Media, Inc. 5.75% 1/15/23 | | 14,205 | 15,430 |
| Sirius XM Radio, Inc.: | | | |
| 4.625% 5/15/23 (b) | | 4,550 | 4,618 |
| 5% 8/1/27 (b) | | 8,740 | 9,221 |
| 5.375% 4/15/25 (b) | | 8,845 | 9,139 |
| 5.375% 7/15/26 (b) | | 7,940 | 8,434 |
| Tegna, Inc. 5% 9/15/29 (b) | | 7,290 | 7,418 |
| Videotron Ltd. 5.125% 4/15/27 (b) | | 7,325 | 7,838 |
| Ziggo Bond Co. BV 6% 1/15/27 (b) | | 7,930 | 8,366 |
| Ziggo Bond Finance BV 5.875% 1/15/25 (b) | | 825 | 850 |
| Ziggo BV: | | | |
| 4.875% 1/15/30 (b) | | 4,805 | 4,960 |
| 5.5% 1/15/27 (b) | | 15,855 | 16,846 |
| | | | 566,011 |
| Wireless Telecommunication Services - 0.3% | | | |
| Intelsat Jackson Holdings SA: | | | |
| 5.5% 8/1/23 | | 9,170 | 7,877 |
| 8.5% 10/15/24 (b) | | 12,990 | 11,832 |
| 9.75% 7/15/25 (b) | | 22,015 | 20,364 |
| Sprint Corp. 7.625% 3/1/26 | | 3,615 | 3,987 |
| | | | 44,060 |
| TOTAL COMMUNICATION SERVICES | | | 918,356 |
| CONSUMER DISCRETIONARY - 2.5% | | | |
| Auto Components - 0.4% | | | |
| Allison Transmission, Inc.: | | | |
| 5% 10/1/24 (b) | | 7,960 | 8,149 |
| 5.875% 6/1/29 (b) | | 4,830 | 5,289 |
| Exide Technologies: | | | |
| 10.75% 10/31/21 pay-in-kind (b)(c)(e) | | 610 | 567 |
| 11% 10/31/24 pay-in-kind (b)(c)(e) | | 1,560 | 1,014 |
| 11% 10/31/24 pay-in-kind (b)(c)(e) | | 632 | 285 |
| ZF Europe Finance BV: | | | |
| 2% 2/23/26 (Reg. S) | EUR | 33,700 | 38,661 |
| 3% 10/23/29 (Reg. S) | EUR | 12,900 | 15,048 |
| | | | 69,013 |
| Distributors - 0.0% | | | |
| LKQ Corp. 4.75% 5/15/23 | | 2,025 | 2,057 |
| Diversified Consumer Services - 0.1% | | | |
| GEMS MENASA Cayman Ltd. 7.125% 7/31/26 (b) | | 5,300 | 5,585 |
| Service Corp. International 5.125% 6/1/29 | | 3,420 | 3,634 |
| | | | 9,219 |
| Hotels, Restaurants & Leisure - 1.4% | | | |
| 1011778 BC Unlimited Liability Co./New Red Finance, Inc.: | | | |
| 3.875% 1/15/28 (b) | | 5,535 | 5,549 |
| 4.375% 1/15/28 (b) | | 7,575 | 7,594 |
| 5% 10/15/25 (b) | | 39,105 | 40,376 |
| Choice Hotels International, Inc. 5.75% 7/1/22 | | 2,690 | 2,904 |
| FelCor Lodging LP 6% 6/1/25 | | 7,895 | 8,250 |
| Golden Nugget, Inc.: | | | |
| 6.75% 10/15/24 (b) | | 14,400 | 14,904 |
| 8.75% 10/1/25 (b) | | 14,520 | 15,527 |
| Hilton Domestic Operating Co., Inc.: | | | |
| 4.875% 1/15/30 | | 11,025 | 11,680 |
| 5.125% 5/1/26 | | 10,820 | 11,388 |
| Hilton Worldwide Finance LLC/Hilton Worldwide Finance Corp.: | | | |
| 4.625% 4/1/25 | | 11,100 | 11,405 |
| 4.875% 4/1/27 | | 5,210 | 5,536 |
| KFC Holding Co./Pizza Hut Holding LLC: | | | |
| 4.75% 6/1/27 (b) | | 5,590 | 5,883 |
| 5% 6/1/24 (b) | | 6,145 | 6,368 |
| 5.25% 6/1/26 (b) | | 6,145 | 6,483 |
| Marriott Ownership Resorts, Inc. 6.5% 9/15/26 | | 5,580 | 6,075 |
| MCE Finance Ltd.: | | | |
| 4.875% 6/6/25 (b) | | 17,840 | 18,317 |
| 5.25% 4/26/26 (b) | | 7,345 | 7,587 |
| 5.375% 12/4/29 (b) | | 4,785 | 4,909 |
| Merlin Entertainments PLC 5.75% 6/15/26 (b) | | 7,215 | 7,900 |
| Scientific Games Corp.: | | | |
| 7% 5/15/28 (b) | | 4,965 | 5,313 |
| 7.25% 11/15/29 (b) | | 4,965 | 5,399 |
| Six Flags Entertainment Corp.: | | | |
| 4.875% 7/31/24 (b) | | 4,070 | 4,218 |
| 5.5% 4/15/27 (b) | | 2,160 | 2,303 |
| Studio City Co. Ltd. 7.25% 11/30/21 (b) | | 4,230 | 4,321 |
| Viking Cruises Ltd. 5.875% 9/15/27 (b) | | 3,395 | 3,628 |
| Voc Escrow Ltd. 5% 2/15/28 (b) | | 6,285 | 6,584 |
| Wynn Macau Ltd. 5.125% 12/15/29 (b) | | 9,840 | 10,042 |
| Yum! Brands, Inc. 4.75% 1/15/30 (b) | | 6,265 | 6,563 |
| | | | 247,006 |
| Household Durables - 0.2% | | | |
| Lennar Corp. 4.75% 11/29/27 | | 7,175 | 7,731 |
| LGI Homes, Inc. 6.875% 7/15/26 (b) | | 7,205 | 7,547 |
| TRI Pointe Homes, Inc. 5.875% 6/15/24 | | 11,770 | 12,800 |
| William Lyon Homes, Inc.: | | | |
| 5.875% 1/31/25 | | 4,625 | 4,758 |
| 6% 9/1/23 | | 4,385 | 4,571 |
| | | | 37,407 |
| Internet & Direct Marketing Retail - 0.3% | | | |
| Terrier Media Buyer, Inc. 8.875% 12/15/27 (b) | | 22,810 | 24,122 |
| Zayo Group LLC/Zayo Capital, Inc.: | | | |
| 5.75% 1/15/27 (b) | | 19,125 | 19,436 |
| 6% 4/1/23 | | 8,385 | 8,574 |
| 6.375% 5/15/25 | | 1,440 | 1,484 |
| | | | 53,616 |
| Specialty Retail - 0.1% | | | |
| Lithia Motors, Inc. 4.625% 12/15/27 (b) | | 2,870 | 2,950 |
| Penske Automotive Group, Inc. 5.5% 5/15/26 | | 5,975 | 6,259 |
| | | | 9,209 |
| TOTAL CONSUMER DISCRETIONARY | | | 427,527 |
| CONSUMER STAPLES - 1.4% | | | |
| Food & Staples Retailing - 0.1% | | | |
| KeHE Distributors LLC / KeHE Finance Corp. 8.625% 10/15/26 (b) | | 5,880 | 6,159 |
| Performance Food Group, Inc. 5.5% 10/15/27 (b) | | 7,625 | 8,149 |
| | | | 14,308 |
| Food Products - 1.3% | | | |
| CF Industries Holdings, Inc.: | | | |
| 4.95% 6/1/43 | | 35,788 | 37,309 |
| 5.15% 3/15/34 | | 16,088 | 17,978 |
| 5.375% 3/15/44 | | 31,829 | 34,694 |
| JBS Investments II GmbH: | | | |
| 5.75% 1/15/28 (b) | | 6,485 | 6,838 |
| 7% 1/15/26 (b) | | 6,745 | 7,337 |
| JBS U.S.A. LLC/JBS U.S.A. Finance, Inc.: | | | |
| 5.75% 6/15/25 (b) | | 17,240 | 17,843 |
| 6.75% 2/15/28 (b) | | 10,725 | 11,851 |
| JBS U.S.A. Lux SA / JBS Food Co.: | | | |
| 5.5% 1/15/30 (b) | | 12,225 | 13,131 |
| 6.5% 4/15/29 (b) | | 17,835 | 19,820 |
| Lamb Weston Holdings, Inc.: | | | |
| 4.625% 11/1/24 (b) | | 5,230 | 5,550 |
| 4.875% 11/1/26 (b) | | 5,285 | 5,602 |
| Pilgrim's Pride Corp. 5.75% 3/15/25 (b) | | 12,675 | 13,101 |
| Post Holdings, Inc.: | | | |
| 5% 8/15/26 (b) | | 12,030 | 12,707 |
| 5.5% 3/1/25 (b) | | 6,385 | 6,688 |
| 5.5% 12/15/29 (b) | | 9,145 | 9,751 |
| 5.75% 3/1/27 (b) | | 4,885 | 5,239 |
| | | | 225,439 |
| Personal Products - 0.0% | | | |
| First Quality Finance Co., Inc. 5% 7/1/25 (b) | | 2,840 | 2,955 |
| TOTAL CONSUMER STAPLES | | | 242,702 |
| ENERGY - 4.1% | | | |
| Energy Equipment & Services - 0.4% | | | |
| Exterran Energy Solutions LP 8.125% 5/1/25 | | 3,270 | 3,221 |
| Forum Energy Technologies, Inc. 6.25% 10/1/21 | | 10,950 | 9,663 |
| Jonah Energy LLC 7.25% 10/15/25 (b) | | 10,845 | 3,199 |
| Nabors Industries, Inc.: | | | |
| 5.1% 9/15/23 | | 9,472 | 8,505 |
| 5.75% 2/1/25 | | 11,690 | 10,521 |
| Nine Energy Service, Inc. 8.75% 11/1/23 (b) | | 3,620 | 2,932 |
| NuStar Logistics LP 6% 6/1/26 | | 7,285 | 7,704 |
| Oceaneering International, Inc. 6% 2/1/28 | | 350 | 343 |
| SESI LLC 7.75% 9/15/24 | | 4,340 | 2,886 |
| Summit Midstream Holdings LLC 5.75% 4/15/25 | | 3,405 | 2,601 |
| Transocean, Inc.: | | | |
| 7.25% 11/1/25 (b) | | 7,140 | 6,997 |
| 7.5% 1/15/26 (b) | | 7,620 | 7,525 |
| | | | 66,097 |
| Oil, Gas & Consumable Fuels - 3.7% | | | |
| Antero Midstream Partners LP/Antero Midstream Finance Corp. 5.75% 1/15/28 (b) | | 9,040 | 7,865 |
| Antero Resources Corp. 5.625% 6/1/23 (Reg. S) | | 1,645 | 1,320 |
| Antero Resources Finance Corp. 5.375% 11/1/21 | | 1,900 | 1,809 |
| Callon Petroleum Co. 6.125% 10/1/24 | | 2,855 | 2,909 |
| Carrizo Oil & Gas, Inc. 6.25% 4/15/23 | | 5,395 | 5,475 |
| Chesapeake Energy Corp.: | | | |
| 7% 10/1/24 | | 190 | 114 |
| 8% 1/15/25 | | 165 | 98 |
| 11.5% 1/1/25 (b) | | 14,711 | 13,902 |
| Citgo Holding, Inc. 9.25% 8/1/24 (b) | | 16,430 | 17,621 |
| CNX Midstream Partners LP 6.5% 3/15/26 (b) | | 3,935 | 3,630 |
| Comstock Escrow Corp. 9.75% 8/15/26 | | 36,490 | 33,115 |
| Consolidated Energy Finance SA: | | | |
| 3 month U.S. LIBOR + 3.750% 5.6436% 6/15/22 (b)(c)(f) | | 1,820 | 1,805 |
| 6.5% 5/15/26 (b) | | 19,195 | 17,995 |
| 6.875% 6/15/25 (b) | | 6,400 | 6,112 |
| Covey Park Energy LLC 7.5% 5/15/25 (b) | | 6,555 | 5,637 |
| Crestwood Midstream Partners LP/Crestwood Midstream Finance Corp.: | | | |
| 5.625% 5/1/27 (b) | | 11,025 | 11,177 |
| 5.75% 4/1/25 | | 2,960 | 3,027 |
| CVR Refining LLC/Coffeyville Finance, Inc. 6.5% 11/1/22 | | 18,040 | 18,266 |
| DCP Midstream LLC 5.85% 5/21/43 (b)(c) | | 10,780 | 10,025 |
| Denbury Resources, Inc.: | | | |
| 7.75% 2/15/24 (b) | | 26,375 | 23,342 |
| 9% 5/15/21 (b) | | 27,890 | 26,984 |
| 9.25% 3/31/22 (b) | | 4,210 | 3,968 |
| EG Global Finance PLC 8.5% 10/30/25 (b) | | 6,980 | 7,408 |
| Endeavor Energy Resources LP/EER Finance, Inc.: | | | |
| 5.5% 1/30/26 (b) | | 5,820 | 6,009 |
| 5.75% 1/30/28 (b) | | 10,149 | 10,669 |
| Energy Transfer Equity LP 5.5% 6/1/27 | | 12,065 | 12,260 |
| EnLink Midstream Partners LP: | | | |
| 4.15% 6/1/25 | | 3,795 | 3,567 |
| 4.4% 4/1/24 | | 1,990 | 1,930 |
| EP Energy LLC/Everest Acquisition Finance, Inc. 7.75% 5/15/26 (b)(d) | | 55,595 | 39,750 |
| EQT Corp. 3.9% 10/1/27 | | 15,848 | 14,823 |
| Extraction Oil & Gas, Inc. 7.375% 5/15/24 (b) | | 4,315 | 2,697 |
| Genesis Energy LP/Genesis Energy Finance Corp. 6.25% 5/15/26 | | 5,405 | 5,162 |
| Global Partners LP/GLP Finance Corp. 7% 6/15/23 | | 8,125 | 8,369 |
| Hess Infrastructure Partners LP 5.625% 2/15/26 (b) | | 9,140 | 9,514 |
| Hess Midstream Partners LP 5.125% 6/15/28 (b) | | 6,600 | 6,683 |
| Hilcorp Energy I LP/Hilcorp Finance Co.: | | | |
| 5% 12/1/24 (b) | | 7,550 | 7,301 |
| 5.75% 10/1/25 (b) | | 8,135 | 7,932 |
| 6.25% 11/1/28 (b) | | 7,130 | 6,774 |
| Holly Energy Partners LP/Holly Finance Corp. 6% 8/1/24 (b) | | 4,995 | 5,207 |
| Indigo Natural Resources LLC 6.875% 2/15/26 (b) | | 13,168 | 12,378 |
| MPLX LP 6.375% 5/1/24 (b) | | 3,185 | 3,330 |
| Murphy Oil U.S.A., Inc.: | | | |
| 4.75% 9/15/29 | | 4,155 | 4,388 |
| 5.625% 5/1/27 | | 3,665 | 3,931 |
| Newfield Exploration Co. 5.375% 1/1/26 | | 6,813 | 7,383 |
| NGL Energy Partners LP/NGL Energy Finance Corp.: | | | |
| 6.125% 3/1/25 | | 7,455 | 7,026 |
| 7.5% 4/15/26 (b) | | 7,355 | 7,116 |
| NGPL PipeCo LLC: | | | |
| 4.375% 8/15/22 (b) | | 1,800 | 1,869 |
| 4.875% 8/15/27 (b) | | 1,800 | 1,911 |
| PBF Holding Co. LLC/PBF Finance Corp.: | | | |
| 7% 11/15/23 | | 20,663 | 21,438 |
| 7.25% 6/15/25 | | 13,580 | 14,497 |
| PBF Logistics LP/PBF Logistics Finance, Inc. 6.875% 5/15/23 | | 6,110 | 6,293 |
| PDC Energy, Inc. 6.125% 9/15/24 | | 2,480 | 2,511 |
| Range Resources Corp.: | | | |
| 4.875% 5/15/25 | | 5,430 | 4,643 |
| 5% 3/15/23 | | 26,095 | 24,003 |
| Sanchez Energy Corp.: | | | |
| 6.125% 1/15/23 (d) | | 19,995 | 900 |
| 7.25% 2/15/23 (b)(d) | | 14,310 | 9,302 |
| SM Energy Co.: | | | |
| 5.625% 6/1/25 | | 5,060 | 4,803 |
| 6.625% 1/15/27 | | 21,705 | 21,333 |
| 6.75% 9/15/26 | | 3,175 | 3,112 |
| Southern Star Central Corp. 5.125% 7/15/22 (b) | | 4,930 | 4,979 |
| Southwestern Energy Co.: | | | |
| 4.1% 3/15/22 | | 10,780 | 10,551 |
| 6.2% 1/23/25 (c) | | 1,095 | 1,004 |
| 7.5% 4/1/26 | | 12,420 | 11,489 |
| 7.75% 10/1/27 | | 7,830 | 7,252 |
| SRC Energy, Inc. 6.25% 12/1/25 | | 4,370 | 4,403 |
| Sunoco LP/Sunoco Finance Corp.: | | | |
| 4.875% 1/15/23 | | 5,390 | 5,511 |
| 5.5% 2/15/26 | | 6,865 | 7,122 |
| Teine Energy Ltd. 6.875% 9/30/22 (b) | | 8,820 | 8,820 |
| Tennessee Gas Pipeline Co. 7.625% 4/1/37 | | 2,585 | 3,513 |
| Ultra Resources, Inc. 11% 7/12/24 pay-in-kind | | 6,429 | 1,029 |
| Unit Corp. 6.625% 5/15/21 | | 1,660 | 913 |
| W&T Offshore, Inc. 9.75% 11/1/23 (b) | | 24,200 | 23,081 |
| Whiting Petroleum Corp. 6.625% 1/15/26 | | 4,965 | 3,384 |
| | | | 627,469 |
| TOTAL ENERGY | | | 693,566 |
| FINANCIALS - 4.6% | | | |
| Banks - 0.5% | | | |
| Citigroup, Inc. 0.5% 10/8/27 (Reg. S) (c) | EUR | 24,553 | 27,272 |
| Danske Bank A/S 2.5% 6/21/29 (Reg. S) (c) | EUR | 22,065 | 26,005 |
| HBOS PLC 4.5% 3/18/30 (c) | EUR | 12,510 | 16,344 |
| UniCredit SpA 6.95% 10/31/22 (Reg. S) | EUR | 13,154 | 17,212 |
| | | | 86,833 |
| Capital Markets - 0.2% | | | |
| AssuredPartners, Inc. 7% 8/15/25 (b) | | 2,930 | 2,980 |
| Balboa Merger Sub, Inc. 11.375% 12/1/21 (b) | | 15,325 | 15,881 |
| j2 Cloud Services LLC/j2 Global Communications, Inc. 6% 7/15/25 (b) | | 4,875 | 5,168 |
| MSCI, Inc.: | | | |
| 4% 11/15/29 (b) | | 3,780 | 3,832 |
| 5.25% 11/15/24 (b) | | 1,939 | 1,992 |
| 5.75% 8/15/25 (b) | | 5,060 | 5,307 |
| | | | 35,160 |
| Consumer Finance - 2.5% | | | |
| Ally Financial, Inc.: | | | |
| 8% 11/1/31 | | 155,842 | 216,324 |
| 8% 11/1/31 | | 16,761 | 22,969 |
| Navient Corp.: | | | |
| 5.5% 1/25/23 | | 29,395 | 31,379 |
| 5.875% 10/25/24 | | 20,960 | 22,427 |
| 6.125% 3/25/24 | | 10,325 | 11,203 |
| 6.5% 6/15/22 | | 5,655 | 6,129 |
| 7.25% 1/25/22 | | 22,745 | 24,711 |
| 7.25% 9/25/23 | | 3,440 | 3,887 |
| Springleaf Finance Corp.: | | | |
| 5.375% 11/15/29 | | 5,560 | 5,804 |
| 6.625% 1/15/28 | | 4,415 | 4,984 |
| 6.875% 3/15/25 | | 30,605 | 34,813 |
| 7.125% 3/15/26 | | 41,215 | 47,653 |
| | | | 432,283 |
| Disc-Real Estate Inv Trusts - 0.0% | | | |
| The GEO Group, Inc. 5.125% 4/1/23 | | 5,735 | 5,377 |
| Diversified Financial Services - 1.0% | | | |
| Avolon Holdings Funding Ltd.: | | | |
| 5.125% 10/1/23 (b) | | 2,050 | 2,210 |
| 5.25% 5/15/24 (b) | | 11,080 | 12,095 |
| 5.5% 1/15/23 (b) | | 3,275 | 3,531 |
| Enviva Partners LP / Enviva Partners Finance Corp. 6.5% 1/15/26 (b) | | 6,600 | 7,066 |
| Icahn Enterprises LP/Icahn Enterprises Finance Corp.: | | | |
| 5.25% 5/15/27 (b) | | 11,890 | 12,159 |
| 6.25% 5/15/26 | | 14,625 | 15,576 |
| 6.375% 12/15/25 | | 32,405 | 33,985 |
| 6.75% 2/1/24 | | 6,490 | 6,733 |
| James Hardie International Finance Ltd.: | | | |
| 4.75% 1/15/25 (b) | | 5,220 | 5,416 |
| 5% 1/15/28 (b) | | 5,270 | 5,534 |
| KfW 1.125% 5/9/33 (Reg. S) | EUR | 30,350 | 37,786 |
| Park Aerospace Holdings Ltd.: | | | |
| 4.5% 3/15/23 (b) | | 2,670 | 2,795 |
| 5.25% 8/15/22 (b) | | 5,645 | 6,014 |
| 5.5% 2/15/24 (b) | | 490 | 538 |
| Starfruit Finco BV / Starfruit U.S. Holdco LLC 8% 10/1/26 (b) | | 6,567 | 6,961 |
| Tempo Acquisition LLC 6.75% 6/1/25 (b) | | 5,340 | 5,514 |
| | | | 163,913 |
| Insurance - 0.2% | | | |
| Acrisure LLC 10.125% 8/1/26 (b) | | 6,810 | 7,338 |
| Acrisure LLC / Acrisure Finance, Inc.: | | | |
| 7% 11/15/25 (b) | | 10,530 | 10,161 |
| 8.125% 2/15/24 (b) | | 7,875 | 8,564 |
| Alliant Holdings Intermediate LLC 6.75% 10/15/27 (b) | | 3,340 | 3,577 |
| AmWINS Group, Inc. 7.75% 7/1/26 (b) | | 3,600 | 3,978 |
| HUB International Ltd. 7% 5/1/26 (b) | | 6,980 | 7,381 |
| | | | 40,999 |
| Mortgage Real Estate Investment Trusts - 0.1% | | | |
| Starwood Property Trust, Inc. 4.75% 3/15/25 | | 6,855 | 7,232 |
| Thrifts & Mortgage Finance - 0.1% | | | |
| Nationwide Building Society 2% 7/25/29 (Reg. S) (c) | EUR | 13,637 | 15,891 |
| TOTAL FINANCIALS | | | 787,688 |
| HEALTH CARE - 3.7% | | | |
| Health Care Equipment & Supplies - 0.2% | | | |
| Becton Dickinson Euro Finance SARL 1.208% 6/4/26 | EUR | 22,544 | 25,893 |
| Hologic, Inc.: | | | |
| 4.375% 10/15/25 (b) | | 3,700 | 3,820 |
| 4.625% 2/1/28 (b) | | 2,505 | 2,655 |
| NVA Holdings, Inc. 6.875% 4/1/26 (b) | | 3,860 | 4,174 |
| Teleflex, Inc. 4.625% 11/15/27 | | 2,930 | 3,105 |
| | | | 39,647 |
| Health Care Providers & Services - 2.7% | | | |
| BCPE Cycle Merger Sub II, Inc. 10.625% 7/15/27 (b) | | 18,900 | 19,373 |
| Centene Corp.: | | | |
| 4.25% 12/15/27 (b) | | 6,820 | 7,016 |
| 4.625% 12/15/29 (b) | | 23,795 | 25,076 |
| 4.75% 1/15/25 (b) | | 5,425 | 5,635 |
| 5.375% 6/1/26 (b) | | 18,035 | 19,140 |
| Community Health Systems, Inc.: | | | |
| 8% 3/15/26 (b) | | 39,035 | 40,206 |
| 8.125% 6/30/24 (b) | | 41,342 | 33,900 |
| 8.625% 1/15/24 (b) | | 28,810 | 30,539 |
| 9.875% 6/30/23 (b) | | 21,652 | 18,837 |
| Encompass Health Corp. 5.75% 11/1/24 | | 10,048 | 10,161 |
| HCA Holdings, Inc.: | | | |
| 4.75% 5/1/23 | | 11,330 | 12,130 |
| 5.25% 4/15/25 | | 25,000 | 27,946 |
| 5.25% 6/15/26 | | 9,875 | 11,053 |
| 5.375% 2/1/25 | | 14,275 | 15,786 |
| 5.375% 9/1/26 | | 7,690 | 8,565 |
| 5.625% 9/1/28 | | 18,590 | 21,185 |
| 5.875% 5/1/23 | | 11,900 | 13,151 |
| 5.875% 2/15/26 | | 17,697 | 20,124 |
| 5.875% 2/1/29 | | 21,185 | 24,495 |
| Horizon Pharma U.S.A., Inc. 5.5% 8/1/27 (b) | | 7,300 | 7,885 |
| MPH Acquisition Holdings LLC 7.125% 6/1/24 (b) | | 4,280 | 4,141 |
| Polaris Intermediate Corp. 8.5% 12/1/22 pay-in-kind (b)(c) | | 17,655 | 16,441 |
| Tenet Healthcare Corp.: | | | |
| 4.625% 7/15/24 | | 3,640 | 3,726 |
| 4.625% 9/1/24 (b) | | 7,305 | 7,616 |
| 4.875% 1/1/26 (b) | | 18,260 | 19,126 |
| 5.125% 5/1/25 | | 3,640 | 3,749 |
| 5.125% 11/1/27 (b) | | 10,955 | 11,571 |
| 6.25% 2/1/27 (b) | | 11,115 | 11,963 |
| Vizient, Inc. 6.25% 5/15/27 (b) | | 1,690 | 1,808 |
| Wellcare Health Plans, Inc.: | | | |
| 5.25% 4/1/25 | | 5,705 | 5,933 |
| 5.375% 8/15/26 (b) | | 4,655 | 4,958 |
| | | | 463,235 |
| Health Care Technology - 0.1% | | | |
| IMS Health, Inc. 5% 5/15/27 (b) | | 7,290 | 7,712 |
| Life Sciences Tools & Services - 0.1% | | | |
| Avantor, Inc. 6% 10/1/24 (b) | | 7,285 | 7,767 |
| Charles River Laboratories International, Inc. 4.25% 5/1/28 (b) | | 2,045 | 2,083 |
| | | | 9,850 |
| Pharmaceuticals - 0.6% | | | |
| Catalent Pharma Solutions: | | | |
| 4.875% 1/15/26 (b) | | 2,365 | 2,448 |
| 5% 7/15/27 (b) | | 2,295 | 2,404 |
| Mylan NV 3.125% 11/22/28 (Reg. S) | EUR | 21,360 | 27,184 |
| Valeant Pharmaceuticals International, Inc.: | | | |
| 5% 1/30/28 (b) | | 8,220 | 8,437 |
| 5.25% 1/30/30 (b) | | 8,220 | 8,524 |
| 5.5% 11/1/25 (b) | | 18,405 | 19,233 |
| 5.75% 8/15/27 (b) | | 1,925 | 2,089 |
| 7% 1/15/28 (b) | | 14,595 | 16,055 |
| 7.25% 5/30/29 (b) | | 7,295 | 8,335 |
| 8.5% 1/31/27 (b) | | 13,035 | 14,844 |
| | | | 109,553 |
| TOTAL HEALTH CARE | | | 629,997 |
| INDUSTRIALS - 2.4% | | | |
| Aerospace & Defense - 1.5% | | | |
| BBA U.S. Holdings, Inc. 5.375% 5/1/26 (b) | | 2,610 | 2,747 |
| Bombardier, Inc.: | | | |
| 6.125% 1/15/23 (b) | | 6,640 | 6,809 |
| 7.5% 12/1/24 (b) | | 1,850 | 1,944 |
| 7.5% 3/15/25 (b) | | 28,995 | 29,901 |
| 7.875% 4/15/27 (b) | | 20,865 | 21,465 |
| BWX Technologies, Inc. 5.375% 7/15/26 (b) | | 4,990 | 5,289 |
| DAE Funding LLC 4% 8/1/20 (b) | | 3,095 | 3,109 |
| Moog, Inc. 4.25% 12/15/27 (b) | | 2,025 | 2,061 |
| TransDigm UK Holdings PLC 6.875% 5/15/26 | | 21,085 | 22,456 |
| TransDigm, Inc.: | | | |
| 5.5% 11/15/27 (b) | | 57,420 | 58,065 |
| 6.25% 3/15/26 (b) | | 11,120 | 12,039 |
| 6.375% 6/15/26 | | 37,890 | 40,187 |
| 6.5% 5/15/25 | | 9,710 | 10,098 |
| 7.5% 3/15/27 | | 11,028 | 12,062 |
| Wolverine Escrow LLC: | | | |
| 8.5% 11/15/24 (b) | | 8,275 | 8,565 |
| 9% 11/15/26 (b) | | 11,585 | 12,135 |
| 13.125% 11/15/27 (b) | | 6,620 | 6,802 |
| | | | 255,734 |
| Airlines - 0.1% | | | |
| Air Canada 2013-1 Pass Through Trust 5.375% 11/15/22 (b) | | 1,725 | 1,773 |
| Continental Airlines, Inc. pass-thru certificates 6.903% 10/19/23 | | 205 | 215 |
| Delta Air Lines, Inc. pass-thru trust certificates 8.021% 2/10/24 | | 2,392 | 2,615 |
| Hawaiian Airlines pass-thru certificates Series 2013-1 Class B, 4.95% 7/15/23 | | 3,203 | 3,262 |
| U.S. Airways pass-thru certificates: | | | |
| Series 2011-1 Class A, 7.125% 4/22/25 | | 4,904 | 5,505 |
| Series 2012-2 Class B, 6.75% 12/3/22 | | 2,339 | 2,455 |
| Series 2013-1 Class B, 5.375% 5/15/23 | | 3,077 | 3,201 |
| | | | 19,026 |
| Building Products - 0.0% | | | |
| Advanced Drain Systems, Inc. 5% 9/30/27 (b) | | 1,400 | 1,444 |
| Commercial Services & Supplies - 0.3% | | | |
| ADS Waste Holdings, Inc. 5.625% 11/15/24 (b) | | 6,910 | 7,186 |
| Covanta Holding Corp.: | | | |
| 5.875% 3/1/24 | | 5,895 | 6,064 |
| 5.875% 7/1/25 | | 1,995 | 2,105 |
| 6% 1/1/27 | | 7,080 | 7,469 |
| IAA Spinco, Inc. 5.5% 6/15/27 (b) | | 2,830 | 3,007 |
| KAR Auction Services, Inc. 5.125% 6/1/25 (b) | | 6,210 | 6,458 |
| Kissner Holdings LP/Kissner Milling Co. Ltd./BSC Holding, Inc./Kissner U.S.A. 8.375% 12/1/22 (b) | | 6,490 | 6,790 |
| Ritchie Bros. Auctioneers, Inc. 5.375% 1/15/25 (b) | | 2,315 | 2,413 |
| The Brink's Co. 4.625% 10/15/27 (b) | | 7,200 | 7,416 |
| | | | 48,908 |
| Construction & Engineering - 0.1% | | | |
| AECOM 5.125% 3/15/27 | | 7,490 | 8,052 |
| JMC Steel Group, Inc. 9.875% 6/15/23 (b) | | 2,090 | 2,197 |
| Odebrecht Finance Ltd.: | | | |
| 4.375% 4/25/25 (b)(d) | | 7,474 | 339 |
| 5.25% 6/27/29 (b)(d) | | 6,800 | 338 |
| 7.125% 6/26/42 (b)(d) | | 3,310 | 149 |
| | | | 11,075 |
| Electrical Equipment - 0.1% | | | |
| Sensata Technologies BV 5% 10/1/25 (b) | | 8,215 | 8,924 |
| Vertiv Group Corp. 9.25% 10/15/24 (b) | | 4,480 | 4,816 |
| | | | 13,740 |
| Machinery - 0.0% | | | |
| Stevens Holding Co., Inc. 6.125% 10/1/26 (b) | | 1,880 | 2,054 |
| Marine - 0.0% | | | |
| Navios South American Logistics, Inc./Navios Logistics Finance U.S., Inc. 7.25% 5/1/22 (b) | | 7,680 | 7,488 |
| Professional Services - 0.0% | | | |
| ASGN, Inc. 4.625% 5/15/28 (b) | | 5,670 | 5,828 |
| Road & Rail - 0.2% | | | |
| Uber Technologies, Inc.: | | | |
| 7.5% 9/15/27 (b) | | 12,370 | 12,691 |
| 8% 11/1/26 (b) | | 15,060 | 15,700 |
| | | | 28,391 |
| Trading Companies & Distributors - 0.1% | | | |
| FLY Leasing Ltd. 5.25% 10/15/24 | | 5,695 | 5,937 |
| United Rentals North America, Inc.: | | | |
| 3.875% 11/15/27 | | 3,345 | 3,415 |
| 5.5% 5/15/27 | | 4,980 | 5,335 |
| | | | 14,687 |
| TOTAL INDUSTRIALS | | | 408,375 |
| INFORMATION TECHNOLOGY - 0.9% | | | |
| Electronic Equipment & Components - 0.0% | | | |
| MTS Systems Corp. 5.75% 8/15/27 (b) | | 1,905 | 1,991 |
| IT Services - 0.3% | | | |
| Banff Merger Sub, Inc. 9.75% 9/1/26 (b) | | 21,010 | 21,273 |
| Camelot Finance SA 4.5% 11/1/26 (b) | | 6,365 | 6,540 |
| CDW LLC/CDW Finance Corp. 5% 9/1/25 | | 3,980 | 4,159 |
| Fidelity National Information Services, Inc. 1.5% 5/21/27 | EUR | 16,359 | 19,381 |
| Go Daddy Operating Co. LLC / GD Finance Co., Inc. 5.25% 12/1/27 (b) | | 5,665 | 5,962 |
| GTT Communications, Inc. 7.875% 12/31/24 (b) | | 320 | 242 |
| | | | 57,557 |
| Semiconductors & Semiconductor Equipment - 0.1% | | | |
| Qorvo, Inc. 5.5% 7/15/26 | | 3,615 | 3,850 |
| Sensata Technologies UK Financing Co. PLC 6.25% 2/15/26 (b) | | 7,880 | 8,491 |
| | | | 12,341 |
| Software - 0.4% | | | |
| Ascend Learning LLC: | | | |
| 6.875% 8/1/25 (b) | | 7,330 | 7,697 |
| 6.875% 8/1/25 (b) | | 2,480 | 2,604 |
| CDK Global, Inc. 5.875% 6/15/26 | | 2,670 | 2,852 |
| Ensemble S Merger Sub, Inc. 9% 9/30/23 (b) | | 13,310 | 13,676 |
| Fair Isaac Corp. 4% 6/15/28 (b) | | 6,420 | 6,468 |
| JDA Escrow LLC/JDA Bond Finance, Inc. 7.375% 10/15/24 (b) | | 2,820 | 2,929 |
| Nortonlifelock, Inc. 5% 4/15/25 (b) | | 6,360 | 6,495 |
| Open Text Corp. 5.875% 6/1/26 (b) | | 6,000 | 6,420 |
| Parametric Technology Corp. 6% 5/15/24 | | 2,430 | 2,536 |
| Veritas U.S., Inc./Veritas Bermuda Ltd.: | | | |
| 7.5% 2/1/23 (b) | | 9,915 | 9,890 |
| 10.5% 2/1/24 (b) | | 12,470 | 11,535 |
| | | | 73,102 |
| Technology Hardware, Storage & Peripherals - 0.1% | | | |
| NCR Corp.: | | | |
| 5.75% 9/1/27 (b) | | 5,480 | 5,836 |
| 6.125% 9/1/29 (b) | | 5,480 | 5,946 |
| | | | 11,782 |
| TOTAL INFORMATION TECHNOLOGY | | | 156,773 |
| MATERIALS - 1.9% | | | |
| Chemicals - 0.4% | | | |
| Element Solutions, Inc. 5.875% 12/1/25 (b) | | 10,955 | 11,462 |
| LSB Industries, Inc. 9.625% 5/1/23 (b) | | 3,600 | 3,697 |
| Neon Holdings, Inc. 10.125% 4/1/26 (b) | | 7,305 | 7,268 |
| NOVA Chemicals Corp.: | | | |
| 4.875% 6/1/24 (b) | | 9,095 | 9,391 |
| 5.25% 6/1/27 (b) | | 7,795 | 8,009 |
| OCI NV: | | | |
| 5.25% 11/1/24 (b) | | 10,040 | 10,417 |
| 6.625% 4/15/23 (b) | | 3,185 | 3,320 |
| SunCoke Energy Partners LP/SunCoke Energy Partners Finance Corp. 7.5% 6/15/25 (b) | | 5,880 | 5,655 |
| The Chemours Co. LLC 5.375% 5/15/27 | | 1,215 | 1,075 |
| Valvoline, Inc. 5.5% 7/15/24 | | 2,920 | 3,030 |
| | | | 63,324 |
| Construction Materials - 0.0% | | | |
| Summit Materials LLC/Summit Materials Finance Corp. 5.125% 6/1/25 (b) | | 3,060 | 3,144 |
| U.S. Concrete, Inc. 6.375% 6/1/24 | | 3,885 | 4,055 |
| | | | 7,199 |
| Containers & Packaging - 0.4% | | | |
| ARD Finance SA 6.5% 6/30/27 pay-in-kind (b)(c) | | 6,625 | 6,850 |
| Cascades, Inc.: | | | |
| 5.125% 1/15/26 (b) | | 3,310 | 3,401 |
| 5.375% 1/15/28 (b) | | 3,310 | 3,401 |
| Crown Cork & Seal, Inc.: | | | |
| 7.375% 12/15/26 | | 16,535 | 19,635 |
| 7.5% 12/15/96 | | 7,695 | 8,484 |
| Labl Escrow Issuer LLC: | | | |
| 6.75% 7/15/26 (b) | | 11,010 | 11,698 |
| 10.5% 7/15/27 (b) | | 7,340 | 7,503 |
| Trivium Packaging Finance BV: | | | |
| 5.5% 8/15/26 (b) | | 4,195 | 4,420 |
| 8.5% 8/15/27 (b) | | 7,180 | 7,988 |
| | | | 73,380 |
| Metals & Mining - 1.0% | | | |
| Alcoa Nederland Holding BV: | | | |
| 6.125% 5/15/28 (b) | | 2,110 | 2,284 |
| 6.75% 9/30/24 (b) | | 5,350 | 5,629 |
| 7% 9/30/26 (b) | | 4,430 | 4,834 |
| Aleris International, Inc. 6% 6/1/20 (b)(e) | | 63 | 63 |
| Algoma Steel SCA 0% 12/31/23 (e) | | 1,518 | 1,154 |
| ArcelorMittal SA 1.75% 11/19/25 (Reg. S) | EUR | 19,543 | 22,228 |
| Cleveland-Cliffs, Inc.: | | | |
| 4.875% 1/15/24 (b) | | 7,215 | 7,368 |
| 5.75% 3/1/25 | | 1,889 | 1,864 |
| 5.875% 6/1/27 (b) | | 11,010 | 10,570 |
| Commercial Metals Co. 5.75% 4/15/26 | | 5,405 | 5,648 |
| Compass Minerals International, Inc. 6.75% 12/1/27 (b) | | 14,455 | 15,358 |
| First Quantum Minerals Ltd.: | | | |
| 6.5% 3/1/24 (b) | | 4,850 | 4,861 |
| 6.875% 3/1/26 (b) | | 14,330 | 14,478 |
| 7.5% 4/1/25 (b) | | 8,255 | 8,475 |
| FMG Resources (August 2006) Pty Ltd.: | | | |
| 4.5% 9/15/27 (b) | | 5,450 | 5,586 |
| 4.75% 5/15/22 (b) | | 4,780 | 4,935 |
| 5.125% 3/15/23 (b) | | 7,615 | 8,043 |
| 5.125% 5/15/24 (b) | | 5,885 | 6,253 |
| Freeport-McMoRan, Inc. 5.45% 3/15/43 | | 3,585 | 3,710 |
| Infrabuild Australia Pty Ltd. 12% 10/1/24 (b) | | 5,460 | 5,628 |
| Joseph T Ryerson & Son, Inc. 11% 5/15/22 (b) | | 4,505 | 4,753 |
| Kaiser Aluminum Corp. 4.625% 3/1/28 (b) | | 6,615 | 6,787 |
| Mineral Resources Ltd. 8.125% 5/1/27 (b) | | 11,025 | 12,100 |
| Murray Energy Corp.: | | | |
| 11.25% 4/15/21 (b)(d) | | 5,925 | 0 |
| 12% 4/15/24 pay-in-kind (b)(c)(d) | | 6,364 | 0 |
| United States Steel Corp. 6.25% 3/15/26 | | 7,180 | 6,140 |
| | | | 168,749 |
| Paper & Forest Products - 0.1% | | | |
| Boise Cascade Co. 5.625% 9/1/24 (b) | | 1,355 | 1,409 |
| Mercer International, Inc. 7.375% 1/15/25 | | 7,280 | 7,837 |
| NewPage Corp. 3 month U.S. LIBOR + 6.250% 6.7159% 5/1/12 (c)(d)(e)(f) | | 4,230 | 0 |
| | | | 9,246 |
| TOTAL MATERIALS | | | 321,898 |
| REAL ESTATE - 0.6% | | | |
| Equity Real Estate Investment Trusts (REITs) - 0.5% | | | |
| Iron Mountain, Inc. 4.875% 9/15/29 (b) | | 14,590 | 14,821 |
| MPT Operating Partnership LP/MPT Finance Corp.: | | | |
| 4.625% 8/1/29 | | 10,950 | 11,279 |
| 5% 10/15/27 | | 15,435 | 16,361 |
| 5.25% 8/1/26 | | 4,830 | 5,103 |
| 6.375% 3/1/24 | | 2,335 | 2,428 |
| The GEO Group, Inc.: | | | |
| 5.875% 10/15/24 | | 3,710 | 3,367 |
| 6% 4/15/26 | | 5,755 | 5,108 |
| VICI Properties, Inc.: | | | |
| 4.25% 12/1/26 (b) | | 12,650 | 13,030 |
| 4.625% 12/1/29 (b) | | 7,220 | 7,545 |
| | | | 79,042 |
| Real Estate Management & Development - 0.1% | | | |
| Howard Hughes Corp. 5.375% 3/15/25 (b) | | 7,940 | 8,277 |
| Taylor Morrison Communities, Inc./Monarch Communities, Inc.: | | | |
| 5.625% 3/1/24 (b) | | 775 | 837 |
| 5.875% 6/15/27 (b) | | 5,610 | 6,171 |
| | | | 15,285 |
| TOTAL REAL ESTATE | | | 94,327 |
| UTILITIES - 1.5% | | | |
| Electric Utilities - 0.9% | | | |
| Clearway Energy Operating LLC 4.75% 3/15/28 (b) | | 4,055 | 4,111 |
| NextEra Energy Partners LP: | | | |
| 4.25% 9/15/24 (b) | | 4,825 | 5,018 |
| 4.5% 9/15/27 (b) | | 3,355 | 3,498 |
| Pacific Gas & Electric Co.: | | | |
| 3.5% 10/1/20 (d) | | 3,350 | 3,358 |
| 3.75% 8/15/42 (d) | | 6,290 | 6,290 |
| 3.95% 12/1/47 (d) | | 32,835 | 32,582 |
| 4% 12/1/46 (d) | | 14,690 | 14,580 |
| 4.25% 3/15/46 (d) | | 1,475 | 1,490 |
| 4.3% 3/15/45 (d) | | 3,690 | 3,745 |
| 5.8% 3/1/37 (d) | | 7,660 | 7,986 |
| 6.05% 3/1/34 (d) | | 23,455 | 24,569 |
| Vistra Operations Co. LLC: | | | |
| 5% 7/31/27 (b) | | 13,800 | 14,421 |
| 5.5% 9/1/26 (b) | | 9,975 | 10,574 |
| 5.625% 2/15/27 (b) | | 17,455 | 18,393 |
| | | | 150,615 |
| Gas Utilities - 0.2% | | | |
| Southern Natural Gas Co.: | | | |
| 7.35% 2/15/31 | | 14,890 | 19,671 |
| 8% 3/1/32 | | 9,400 | 13,602 |
| | | | 33,273 |
| Independent Power and Renewable Electricity Producers - 0.4% | | | |
| NextEra Energy Partners LP 4.25% 7/15/24 (b) | | 7,335 | 7,638 |
| NRG Energy, Inc.: | | | |
| 5.75% 1/15/28 | | 20,240 | 21,960 |
| 6.625% 1/15/27 | | 15,685 | 17,018 |
| Pattern Energy Group, Inc. 5.875% 2/1/24 (b) | | 3,540 | 3,642 |
| TerraForm Power Operating LLC: | | | |
| 4.25% 1/31/23 (b) | | 3,700 | 3,809 |
| 4.75% 1/15/30 (b) | | 6,690 | 6,807 |
| 5% 1/31/28 (b) | | 3,715 | 3,928 |
| The AES Corp. 4.5% 3/15/23 | | 3,065 | 3,142 |
| | | | 67,944 |
| TOTAL UTILITIES | | | 251,832 |
|
| TOTAL NONCONVERTIBLE BONDS | | | 4,933,041 |
|
| TOTAL CORPORATE BONDS | | | |
| (Cost $4,734,309) | | | 4,950,192 |
|
| U.S. Government and Government Agency Obligations - 16.9% | | | |
| U.S. Government Agency Obligations - 0.1% | | | |
| Private Export Funding Corp. Secured 1.75% 11/15/24 | | 11,520 | 11,428 |
| Tennessee Valley Authority: | | | |
| 5.25% 9/15/39 | | $2,106 | $2,899 |
| 5.375% 4/1/56 | | 3,503 | 5,303 |
|
| TOTAL U.S. GOVERNMENT AGENCY OBLIGATIONS | | | 19,630 |
|
| U.S. Treasury Obligations - 16.5% | | | |
| U.S. Treasury Bonds: | | | |
| 2.375% 11/15/49 | | 21,877 | 21,779 |
| 2.5% 2/15/45 (g)(h)(i) | | 216,056 | 220,172 |
| 2.875% 5/15/49 | | 7,100 | 7,825 |
| 3% 2/15/49 | | 185,540 | 209,074 |
| 4.75% 2/15/37 (g)(h)(j) | | 74,200 | 101,990 |
| 5.25% 2/15/29 (g) | | 5,406 | 6,909 |
| 6.125% 8/15/29 (g)(h) | | 3,663 | 5,018 |
| 7.5% 11/15/24 | | 5,690 | 7,221 |
| U.S. Treasury Notes: | | | |
| 1.375% 2/29/20 | | 10,262 | 10,257 |
| 1.375% 4/30/20 | | 45,349 | 45,306 |
| 1.375% 8/31/23 | | 11,000 | 10,890 |
| 1.5% 4/15/20 | | 64,333 | 64,315 |
| 1.5% 7/15/20 | | 70,638 | 70,594 |
| 1.5% 8/31/21 | | 22,000 | 21,961 |
| 1.5% 9/30/21 | | 124,780 | 124,559 |
| 1.5% 9/30/24 | | 29,190 | 28,919 |
| 1.5% 10/31/24 | | 5,380 | 5,330 |
| 1.625% 6/30/20 | | 1,783 | 1,783 |
| 1.625% 8/31/22 | | 27,162 | 27,171 |
| 1.625% 5/31/23 | | 19,717 | 19,704 |
| 1.625% 9/30/26 | | 87,297 | 86,153 |
| 1.625% 11/30/26 | | 27,482 | 27,101 |
| 1.625% 8/15/29 | | 15,107 | 14,705 |
| 1.75% 7/31/21 | | 9,325 | 9,346 |
| 1.75% 11/15/29 | | 2,500 | 2,460 |
| 1.875% 7/31/22 | | 43,433 | 43,720 |
| 2% 1/31/20 | | 8,000 | 8,002 |
| 2% 9/30/20 | | 25,149 | 25,213 |
| 2% 8/15/25 | | 10,027 | 10,154 |
| 2.125% 12/31/22 | | 3,561 | 3,613 |
| 2.125% 3/31/24 | | 56,643 | 57,647 |
| 2.125% 7/31/24 | | 118,408 | 120,601 |
| 2.125% 5/15/25 (g) | | 17,843 | 18,192 |
| 2.25% 2/29/20 | | 25,500 | 25,523 |
| 2.25% 3/31/21 | | 9,900 | 9,974 |
| 2.25% 7/31/21 | | 52,019 | 52,533 |
| 2.25% 4/30/24 | | 24,428 | 24,994 |
| 2.25% 12/31/24 | | 92,748 | 95,127 |
| 2.25% 3/31/26 | | 34,717 | 35,635 |
| 2.375% 4/15/21 | | 74,550 | 75,259 |
| 2.5% 12/31/20 | | 150,000 | 151,241 |
| 2.5% 1/31/21 | | 42,832 | 43,221 |
| 2.5% 2/28/21 | | 90,000 | 90,868 |
| 2.5% 1/15/22 | | 242,316 | 246,616 |
| 2.5% 1/31/24 | | 10,640 | 10,981 |
| 2.5% 2/28/26 | | 105,297 | 109,615 |
| 2.625% 8/31/20 | | 30,000 | 30,192 |
| 2.625% 12/31/23 | | 69,183 | 71,706 |
| 2.625% 2/15/29 | | 61,489 | 65,119 |
| 2.75% 9/30/20 | | 79,581 | 80,219 |
| 2.75% 6/30/25 | | 61,537 | 64,755 |
| 2.875% 11/30/25 | | 46,425 | 49,273 |
| 3.125% 11/15/28 | | 31,330 | 34,425 |
|
| TOTAL U.S. TREASURY OBLIGATIONS | | | 2,804,960 |
|
| Other Government Related - 0.3% | | | |
| National Credit Union Administration Guaranteed Notes: | | | |
| Series 2010-A1 Class A, 1 month U.S. LIBOR + 0.350% 2.0676% 12/7/20 (NCUA Guaranteed) (c)(f) | | 1,425 | 1,425 |
| Series 2011-R1 Class 1A, 1 month U.S. LIBOR + 0.450% 2.1631% 1/8/20 (NCUA Guaranteed) (c)(f) | | 1,660 | 1,661 |
| National Credit Union Administration Guaranteed Notes Master Trust 3.45% 6/12/21 (NCUA Guaranteed) | | 49,900 | 50,935 |
|
| TOTAL OTHER GOVERNMENT RELATED | | | 54,021 |
|
| TOTAL U.S. GOVERNMENT AND GOVERNMENT AGENCY OBLIGATIONS | | | |
| (Cost $2,781,948) | | | 2,878,611 |
|
| U.S. Government Agency - Mortgage Securities - 1.5% | | | |
| Fannie Mae - 0.3% | | | |
| 12 month U.S. LIBOR + 1.365% 3.693% 10/1/35 (c)(f) | | 29 | 30 |
| 12 month U.S. LIBOR + 1.490% 4.233% 1/1/35 (c)(f) | | 109 | 113 |
| 12 month U.S. LIBOR + 1.553% 4.345% 6/1/36 (c)(f) | | 19 | 19 |
| 12 month U.S. LIBOR + 1.565% 4.69% 3/1/37 (c)(f) | | 44 | 45 |
| 12 month U.S. LIBOR + 1.610% 4.26% 3/1/33 (c)(f) | | 74 | 77 |
| 12 month U.S. LIBOR + 1.640% 4.157% 6/1/47 (c)(f) | | 92 | 97 |
| 12 month U.S. LIBOR + 1.650% 4.346% 11/1/36 (c)(f) | | 18 | 19 |
| 12 month U.S. LIBOR + 1.710% 4.585% 6/1/42 (c)(f) | | 118 | 122 |
| 12 month U.S. LIBOR + 1.730% 4.647% 7/1/35 (c)(f) | | 82 | 86 |
| 12 month U.S. LIBOR + 1.760% 4.705% 2/1/37 (c)(f) | | 283 | 295 |
| 12 month U.S. LIBOR + 1.800% 4.499% 7/1/41 (c)(f) | | 183 | 192 |
| 12 month U.S. LIBOR + 1.800% 4.708% 1/1/42 (c)(f) | | 355 | 367 |
| 12 month U.S. LIBOR + 1.810% 4.537% 7/1/41 (c)(f) | | 106 | 111 |
| 12 month U.S. LIBOR + 1.810% 4.894% 2/1/42 (c)(f) | | 378 | 392 |
| 12 month U.S. LIBOR + 1.818% 4.068% 9/1/41 (c)(f) | | 64 | 67 |
| 12 month U.S. LIBOR + 1.830% 3.907% 10/1/41 (c)(f) | | 57 | 59 |
| 12 month U.S. LIBOR + 1.851% 4.58% 5/1/36 (c)(f) | | 16 | 16 |
| 12 month U.S. LIBOR + 1.885% 4.926% 4/1/36 (c)(f) | | 253 | 266 |
| 12 month U.S. LIBOR + 1.890% 4.768% 8/1/35 (c)(f) | | 101 | 105 |
| 6 month U.S. LIBOR + 1.550% 3.865% 9/1/33 (c)(f) | | 258 | 266 |
| 3% 5/1/33 to 7/1/33 | | 6,557 | 6,760 |
| 3.5% 7/1/32 | | 11,031 | 11,510 |
| 4% 5/1/29 to 12/1/48 | | 6,479 | 6,754 |
| 4.5% 11/1/25 | | 1,217 | 1,264 |
| 5% 2/1/22 to 5/1/22 | | 8 | 8 |
| 5.5% 12/1/39 to 5/1/44 | | 20,569 | 22,948 |
| 6% to 6% 1/1/34 to 6/1/36 | | 2,465 | 2,814 |
| 6.5% 2/1/22 to 8/1/36 | | 3,649 | 4,183 |
| 7.5% 1/1/28 | | 22 | 25 |
|
| TOTAL FANNIE MAE | | | 59,010 |
|
| Freddie Mac - 0.4% | | | |
| 12 month U.S. LIBOR + 1.320% 3.832% 1/1/36 (c)(f) | | 54 | 55 |
| 12 month U.S. LIBOR + 1.600% 4.35% 7/1/35 (c)(f) | | 50 | 53 |
| 12 month U.S. LIBOR + 1.750% 4.006% 9/1/41 (c)(f) | | 976 | 1,011 |
| 12 month U.S. LIBOR + 1.790% 4.109% 4/1/37 (c)(f) | | 62 | 65 |
| 12 month U.S. LIBOR + 1.870% 4.817% 4/1/41 (c)(f) | | 46 | 48 |
| 12 month U.S. LIBOR + 1.880% 3.838% 10/1/41 (c)(f) | | 487 | 505 |
| 12 month U.S. LIBOR + 1.880% 4.13% 9/1/41 (c)(f) | | 77 | 81 |
| 12 month U.S. LIBOR + 1.880% 4.443% 10/1/42 (c)(f) | | 477 | 498 |
| 12 month U.S. LIBOR + 1.910% 4.66% 6/1/41 (c)(f) | | 81 | 84 |
| 12 month U.S. LIBOR + 1.910% 4.734% 6/1/41 (c)(f) | | 157 | 164 |
| 12 month U.S. LIBOR + 1.910% 4.785% 5/1/41 (c)(f) | | 122 | 129 |
| 12 month U.S. LIBOR + 1.910% 4.813% 5/1/41 (c)(f) | | 141 | 147 |
| 12 month U.S. LIBOR + 2.045% 4.784% 7/1/36 (c)(f) | | 92 | 97 |
| 6 month U.S. LIBOR + 1.445% 3.695% 3/1/35 (c)(f) | | 32 | 33 |
| 6 month U.S. LIBOR + 1.660% 3.915% 1/1/37 (c)(f) | | 117 | 122 |
| 6 month U.S. LIBOR + 1.661% 4.199% 2/1/37 (c)(f) | | 54 | 56 |
| 6 month U.S. LIBOR + 1.720% 4.247% 8/1/37 (c)(f) | | 91 | 95 |
| 6 month U.S. LIBOR + 1.740% 3.83% 5/1/37 (c)(f) | | 24 | 25 |
| 6 month U.S. LIBOR + 1.840% 4.078% 10/1/36 (c)(f) | | 251 | 262 |
| 6 month U.S. LIBOR + 1.860% 4.061% 10/1/35 (c)(f) | | 133 | 139 |
| 6 month U.S. LIBOR + 2.010% 4.01% 5/1/37 (c)(f) | | 90 | 94 |
| 6 month U.S. LIBOR + 2.010% 4.203% 5/1/37 (c)(f) | | 120 | 125 |
| 6 month U.S. LIBOR + 2.020% 4.096% 6/1/37 (c)(f) | | 45 | 47 |
| 6 month U.S. LIBOR + 2.040% 4.349% 6/1/37 (c)(f) | | 69 | 72 |
| 6 month U.S. LIBOR + 2.270% 4.488% 10/1/35 (c)(f) | | 20 | 21 |
| U.S. TREASURY 1 YEAR INDEX + 2.035% 4.573% 6/1/33 (c)(f) | | 217 | 228 |
| U.S. TREASURY 1 YEAR INDEX + 2.310% 4.91% 2/1/36 (c)(f) | | 1 | 1 |
| U.S. TREASURY 1 YEAR INDEX + 2.548% 4.956% 7/1/35 (c)(f) | | 163 | 172 |
| 3% 4/1/33 to 11/1/33 | | 20,402 | 21,041 |
| 3.5% 7/1/32 | | 3,945 | 4,118 |
| 4% 8/1/48 to 10/1/48 | | 33,568 | 34,960 |
| 6% 1/1/24 | | 487 | 512 |
| 6.5% 9/1/21 to 3/1/22 | | 102 | 105 |
|
| TOTAL FREDDIE MAC | | | 65,165 |
|
| Ginnie Mae - 0.5% | | | |
| 6% 6/15/36 | | 3,202 | 3,635 |
| 7% 9/15/25 to 8/15/31 | | 8 | 9 |
| 7.5% 2/15/22 to 8/15/28 | | 27 | 30 |
| 8% 12/15/26 | | 0 | 0 |
| 3.5% 8/20/42 to 8/20/47 | | 35,268 | 36,998 |
| 4% 10/20/43 to 7/20/47 | | 16,110 | 16,836 |
| 4.5% 6/20/48 | | 21,239 | 22,375 |
| 4.537% 2/20/62 (c)(k) | | 378 | 381 |
| 4.58% 2/20/62 (c)(k) | | 26 | 26 |
| 5% 4/20/48 | | 810 | 869 |
| 5.025% 1/20/62 (c)(k) | | 277 | 280 |
| 5.47% 8/20/59 (c)(k) | | 8 | 8 |
|
| TOTAL GINNIE MAE | | | 81,447 |
|
| Uniform Mortgage Backed Securities - 0.3% | | | |
| 3% 1/1/50 (l) | | 23,700 | 24,033 |
| 3% 1/1/50 (l) | | 23,700 | 24,033 |
|
| TOTAL UNIFORM MORTGAGE BACKED SECURITIES | | | 48,066 |
|
| TOTAL U.S. GOVERNMENT AGENCY - MORTGAGE SECURITIES | | | |
| (Cost $251,102) | | | 253,688 |
|
| Asset-Backed Securities - 0.1% | | | |
| ALG Student Loan Trust Series 2017-1A Class A3, 3 month U.S. LIBOR + 0.090% 2.0256% 6/28/23(b)(c)(f) | | | |
| (Cost $10,051) | | 10,091 | 10,014 |
|
| Collateralized Mortgage Obligations - 2.1% | | | |
| Private Sponsor - 2.1% | | | |
| Fannie Mae: | | | |
| floater Series 2010-15 Class FJ, 1 month U.S. LIBOR + 0.930% 2.722% 6/25/36 (c)(f) | | 3,387 | 3,425 |
| planned amortization class: | | | |
| Series 2003-70 Class BJ, 5% 7/25/33 | | 357 | 389 |
| Series 2005-19 Class PA, 5.5% 7/25/34 | | 140 | 141 |
| Series 2005-64 Class PX, 5.5% 6/25/35 | | 663 | 703 |
| Series 2005-68 Class CZ, 5.5% 8/25/35 | | 3,595 | 4,037 |
| Series 2010-118 Class PB, 4.5% 10/25/40 | | 3,365 | 3,636 |
| Series 2012-149: | | | |
| Class DA, 1.75% 1/25/43 | | 823 | 813 |
| Class GA, 1.75% 6/25/42 | | 861 | 848 |
| sequential payer: | | | |
| Series 2003-117 Class MD, 5% 12/25/23 | | 447 | 463 |
| Series 2004-91 Class Z, 5% 12/25/34 | | 2,890 | 3,149 |
| Series 2005-117 Class JN, 4.5% 1/25/36 | | 456 | 489 |
| Series 2005-14 Class ZB, 5% 3/25/35 | | 1,129 | 1,231 |
| Series 2006-72 Class CY, 6% 8/25/26 | | 766 | 818 |
| Series 2009-59 Class HB, 5% 8/25/39 | | 1,572 | 1,714 |
| Series 2010-139 Class NI, 4.5% 2/25/40 (m) | | 1,398 | 99 |
| Series 2010-39 Class FG, 1 month U.S. LIBOR + 0.920% 2.712% 3/25/36 (c)(f) | | 2,150 | 2,188 |
| Series 2010-97 Class CI, 4.5% 8/25/25 (m) | | 101 | 1 |
| Series 2011-67 Class AI, 4% 7/25/26 (m) | | 418 | 29 |
| Series 2012-27 Class EZ, 4.25% 3/25/42 | | 5,428 | 5,953 |
| Series 2016-26 Class CG, 3% 5/25/46 | | 7,448 | 7,621 |
| Freddie Mac: | | | |
| floater Series 2711 Class FC, 1 month U.S. LIBOR + 0.900% 2.6398% 2/15/33 (c)(f) | | 1,001 | 1,016 |
| floater planned amortization class Series 2770 Class FH, 1 month U.S. LIBOR + 0.400% 2.1398% 3/15/34 (c)(f) | | 1,362 | 1,361 |
| planned amortization class: | | | |
| Series 2101 Class PD, 6% 11/15/28 | | 36 | 39 |
| Series 2996 Class MK, 5.5% 6/15/35 | | 83 | 90 |
| Series 3415 Class PC, 5% 12/15/37 | | 451 | 492 |
| Series 3857 Class ZP, 5% 5/15/41 | | 2,409 | 2,864 |
| Series 4135 Class AB, 1.75% 6/15/42 | | 651 | 643 |
| sequential payer: | | | |
| Series 2004-2802 Class ZG, 5.5% 5/15/34 | | 5,728 | 6,437 |
| Series 2303 Class ZV, 6% 4/15/31 | | 107 | 118 |
| Series 2877 Class ZD, 5% 10/15/34 | | 3,636 | 3,965 |
| Series 3745 Class KV, 4.5% 12/15/26 | | 4,239 | 4,464 |
| Series 3843 Class PZ, 5% 4/15/41 | | 2,442 | 2,846 |
| Freddie Mac Multi-family Structured pass-thru certificates sequential payer: | | | |
| Series 4335 Class AL, 4.25% 3/15/40 | | 2,055 | 2,124 |
| Series 4341 Class ML, 3.5% 11/15/31 | | 3,993 | 4,180 |
| Ginnie Mae guaranteed REMIC pass-thru certificates: | | | |
| floater: | | | |
| Series 2007-59 Class FC, 1 month U.S. LIBOR + 0.500% 2.2646% 7/20/37 (c)(f) | | 714 | 715 |
| Series 2008-2 Class FD, 1 month U.S. LIBOR + 0.480% 2.2446% 1/20/38 (c)(f) | | 183 | 183 |
| Series 2008-73 Class FA, 1 month U.S. LIBOR + 0.860% 2.6246% 8/20/38 (c)(f) | | 1,228 | 1,244 |
| Series 2008-83 Class FB, 1 month U.S. LIBOR + 0.900% 2.6646% 9/20/38 (c)(f) | | 965 | 983 |
| Series 2009-108 Class CF, 1 month U.S. LIBOR + 0.600% 2.3398% 11/16/39 (c)(f) | | 785 | 788 |
| Series 2009-116 Class KF, 1 month U.S. LIBOR + 0.530% 2.2698% 12/16/39 (c)(f) | | 582 | 584 |
| Series 2010-H17 Class FA, 1 month U.S. LIBOR + 0.330% 2.0295% 7/20/60 (c)(f)(k) | | 5,942 | 5,907 |
| Series 2010-H18 Class AF, 1 month U.S. LIBOR + 0.300% 2.0743% 9/20/60 (c)(f)(k) | | 7,044 | 7,001 |
| Series 2010-H19 Class FG, 1 month U.S. LIBOR + 0.300% 2.0743% 8/20/60 (c)(f)(k) | | 7,512 | 7,467 |
| Series 2010-H27 Series FA, 1 month U.S. LIBOR + 0.380% 2.1543% 12/20/60 (c)(f)(k) | | 2,784 | 2,772 |
| Series 2011-H05 Class FA, 1 month U.S. LIBOR + 0.500% 2.2743% 12/20/60 (c)(f)(k) | | 4,008 | 4,003 |
| Series 2011-H07 Class FA, 1 month U.S. LIBOR + 0.500% 2.2743% 2/20/61 (c)(f)(k) | | 7,979 | 7,973 |
| Series 2011-H12 Class FA, 1 month U.S. LIBOR + 0.490% 2.2643% 2/20/61 (c)(f)(k) | | 9,550 | 9,541 |
| Series 2011-H13 Class FA, 1 month U.S. LIBOR + 0.500% 2.2743% 4/20/61 (c)(f)(k) | | 3,291 | 3,288 |
| Series 2011-H14: | | | |
| Class FB, 1 month U.S. LIBOR + 0.500% 2.2743% 5/20/61 (c)(f)(k) | | 4,302 | 4,296 |
| Class FC, 1 month U.S. LIBOR + 0.500% 2.2743% 5/20/61 (c)(f)(k) | | 3,804 | 3,799 |
| Series 2011-H17 Class FA, 1 month U.S. LIBOR + 0.530% 2.3043% 6/20/61 (c)(f)(k) | | 4,538 | 4,536 |
| Series 2011-H21 Class FA, 1 month U.S. LIBOR + 0.600% 2.3743% 10/20/61 (c)(f)(k) | | 5,065 | 5,071 |
| Series 2012-H01 Class FA, 1 month U.S. LIBOR + 0.700% 2.4743% 11/20/61 (c)(f)(k) | | 4,695 | 4,710 |
| Series 2012-H03 Class FA, 1 month U.S. LIBOR + 0.700% 2.4743% 1/20/62 (c)(f)(k) | | 2,984 | 2,994 |
| Series 2012-H06 Class FA, 1 month U.S. LIBOR + 0.630% 2.4043% 1/20/62 (c)(f)(k) | | 4,495 | 4,502 |
| Series 2012-H07 Class FA, 1 month U.S. LIBOR + 0.630% 2.4043% 3/20/62 (c)(f)(k) | | 2,828 | 2,829 |
| Series 2012-H21 Class DF, 1 month U.S. LIBOR + 0.650% 2.4243% 5/20/61 (c)(f)(k) | | 77 | 78 |
| Series 2013-H19: | | | |
| Class FC, 1 month U.S. LIBOR + 0.600% 2.3743% 8/20/63 (c)(f)(k) | | 845 | 846 |
| Class FD, 1 month U.S. LIBOR + 0.600% 2.3743% 8/20/63 (c)(f)(k) | | 2,136 | 2,137 |
| Series 2015-H13 Class FL, 1 month U.S. LIBOR + 0.280% 2.0543% 5/20/63 (c)(f)(k) | | 364 | 363 |
| Series 2015-H19 Class FA, 1 month U.S. LIBOR + 0.200% 1.9743% 4/20/63 (c)(f)(k) | | 429 | 427 |
| Series 2017-161 Class DF, 1 month U.S. LIBOR + 0.250% 2.0146% 10/20/47 (c)(f) | | 4,692 | 4,646 |
| Series 2018-65 Class DF, 1 month U.S. LIBOR + 0.300% 2.0646% 5/20/48 (c)(f) | | 5,769 | 5,725 |
| Series 2018-77 Class FA, 1 month U.S. LIBOR + 0.300% 2.0646% 6/20/48 (c)(f) | | 6,681 | 6,627 |
| Series 2019-98 Class FC, 1 month U.S. LIBOR + 0.450% 2.2146% 8/20/49 (c)(f) | | 33,972 | 33,845 |
| Series2019-115 Class FA, 1 month U.S. LIBOR + 0.450% 2.2146% 9/20/49 (c)(f) | | 14,506 | 14,470 |
| planned amortization class: | | | |
| Series 2010-31 Class BP, 5% 3/20/40 | | 3,810 | 4,197 |
| Series 2011-136 Class WI, 4.5% 5/20/40 (m) | | 936 | 78 |
| Series 2017-134 Class BA, 2.5% 11/20/46 | | 906 | 914 |
| sequential payer: | | | |
| Series 2011-69 Class GX, 4.5% 5/16/40 | | 9,450 | 10,038 |
| Series 2013-H06 Class HA, 1.65% 1/20/63 (k) | | 626 | 623 |
| Series 2014-H04 Class HA, 2.75% 2/20/64 (k) | | 12,895 | 13,020 |
| Series 2014-H12 Class KA, 2.75% 5/20/64 (k) | | 3,174 | 3,189 |
| Series 2016-H02 Class FM, 1 month U.S. LIBOR + 0.500% 2.2743% 9/20/62 (c)(f)(k) | | 1,778 | 1,778 |
| Series 2016-H04 Class FE, 1 month U.S. LIBOR + 0.650% 2.4243% 11/20/65 (c)(f)(k) | | 313 | 314 |
| Series 2017-139 Class BA, 3% 9/20/47 | | 12,100 | 12,232 |
| Series 2018-H12 Class HA, 3.25% 8/20/68 (k) | | 8,581 | 8,920 |
| Series 2004-22 Class M1, 5.5% 4/20/34 | | 631 | 804 |
| Series 2010-169 Class Z, 4.5% 12/20/40 | | 5,291 | 5,825 |
| Series 2010-H15 Class TP, 5.15% 8/20/60 (k) | | 167 | 169 |
| Series 2010-H16 Class BA, 3.55% 7/20/60 (k) | | 678 | 703 |
| Series 2010-H17 Class XP, 5.31% 7/20/60 (c)(k) | | 250 | 253 |
| Series 2010-H18 Class PL, 5.01% 9/20/60 (c)(k) | | 675 | 678 |
| Series 2010-H22 Class LA, 3.75% 10/20/60 (k) | | 838 | 837 |
| Series 2010-H28 Class KA, 3.75% 12/20/60 (k) | | 3,546 | 3,548 |
| Series 2012-64 Class KI, 3.5% 11/20/36 (m) | | 534 | 18 |
| Series 2013-124: | | | |
| Class ES, 8.667% - 1 month U.S. LIBOR 6.3138% 4/20/39 (c)(n) | | 1,425 | 1,462 |
| Class ST, 8.800% - 1 month U.S. LIBOR 6.4472% 8/20/39 (c)(n) | | 5,077 | 5,253 |
| Series 2013-H07 Class JA, 1.75% 3/20/63 (k) | | 7,154 | 7,132 |
| Series 2013-H08 Class MA, 3% 3/20/63 (k) | | 8,769 | 8,787 |
| Series 2015-H17 Class HA, 2.5% 5/20/65 (k) | | 2,862 | 2,861 |
| Series 2015-H21: | | | |
| Class HA, 2.5% 6/20/63 (k) | | 2,974 | 2,971 |
| Class JA, 2.5% 6/20/65 (k) | | 694 | 694 |
| Series 2015-H30 Class HA, 1.75% 9/20/62 (c)(k) | | 4,384 | 4,368 |
| Series 2016-H13 Class FB, U.S. TREASURY 1 YEAR INDEX + 0.500% 2.07% 5/20/66 (c)(f)(k) | | 10,947 | 10,944 |
| Series 2017-H06 Class FA, U.S. TREASURY 1 YEAR INDEX + 0.350% 1.92% 8/20/66 (c)(f)(k) | | 12,490 | 12,454 |
| Series 2090-118 Class XZ, 5% 12/20/39 | | 11,766 | 13,279 |
| TOTAL COLLATERALIZED MORTGAGE OBLIGATIONS | | | |
| (Cost $360,919) | | | 361,079 |
|
| Commercial Mortgage Securities - 0.2% | | | |
| Freddie Mac: | | | |
| sequential payer: | | | |
| Series 2019-K103 Class A2, 2.651% 12/25/51 | | 7,400 | 7,546 |
| Series K006 Class A2, 4.251% 1/25/20 | | 1,223 | 1,221 |
| Series 2018-K081 Class A2, 3.9% 8/25/28 | | 8,300 | 9,188 |
| Series K086 Class A2, 3.859% 11/25/28 | | 8,000 | 8,840 |
| Series K090 Class A2, 3.422% 2/25/29 | | 8,400 | 9,031 |
| TOTAL COMMERCIAL MORTGAGE SECURITIES | | | |
| (Cost $36,186) | | | 35,826 |
|
| Foreign Government and Government Agency Obligations - 9.9% | | | |
| Australian Commonwealth: | | | |
| 1.75% 11/21/20 | AUD | 76,340 | 53,954 |
| 2.75% 11/21/29 REGS | AUD | 34,500 | 27,274 |
| 3% 3/21/47 | AUD | 13,750 | 11,689 |
| Buoni del Tesoro Poliennali: | | | |
| 3% 8/1/29 | EUR | 42,560 | 54,982 |
| 3.85% 9/1/49 (b) | EUR | 13,250 | 19,234 |
| Canadian Government: | | | |
| 1.5% 9/1/24 | CAD | 134,150 | 102,449 |
| 2.75% 12/1/48 | CAD | 11,950 | 11,252 |
| Danish Kingdom 1.75% 11/15/25 | DKK | 109,900 | 18,599 |
| Dutch Government: | | | |
| 0% 1/15/24(Reg. S) (b) | EUR | 64,600 | 73,829 |
| 0.25% 7/15/29(Reg. S) (b) | EUR | 67,350 | 77,744 |
| French Government 0% 2/25/20 | EUR | 12,500 | 14,032 |
| German Federal Republic: | | | |
| 0% 4/5/24 | EUR | 194,010 | 222,420 |
| 0.25% 2/15/29 | EUR | 164,790 | 192,946 |
| 1.25% 8/15/48 | EUR | 7,660 | 10,786 |
| Israeli State (guaranteed by U.S. Government through Agency for International Development): | | | |
| 5.5% 9/18/23 | | 57,646 | 65,119 |
| 5.5% 12/4/23 | | 19,812 | 22,554 |
| Japan Government: | | | |
| 0.1% 9/20/24 | JPY | 11,947,050 | 111,104 |
| 0.1% 9/20/29 | JPY | 25,185,950 | 234,410 |
| 0.4% 3/20/56 | JPY | 638,000 | 5,801 |
| 0.9% 6/20/22 | JPY | 4,909,650 | 46,334 |
| Jordanian Kingdom 3% 6/30/25 | | 16,691 | 17,513 |
| Kingdom of Norway 3.75% 5/25/21 (b) | NOK | 60,000 | 7,061 |
| New Zealand Government 6% 5/15/21 | NZD | 12,000 | 8,607 |
| Portuguese Republic 2.25% 4/18/34 (b) | EUR | 13,950 | 18,688 |
| Republic of Singapore 3.25% 9/1/20 | SGD | 50,850 | 38,220 |
| Sweden Kingdom 5% 12/1/20 | SEK | 280,600 | 31,414 |
| Switzerland Confederation 2.25% 7/6/20(Reg. S) | CHF | 37,950 | 39,816 |
| Ukraine Government 1.471% 9/29/21 | | 6,753 | 6,726 |
| United Kingdom, Great Britain and Northern Ireland 4.75% 3/7/20 | GBP | 55,400 | 73,917 |
| United Kingdom, Great Britain and Northern Ireland Treasury GILT 2.5% 7/22/65 (Reg. S) | GBP | 39,692 | 75,670 |
| TOTAL FOREIGN GOVERNMENT AND GOVERNMENT AGENCY OBLIGATIONS | | | |
| (Cost $1,665,713) | | | 1,694,144 |
|
| Supranational Obligations - 0.3% | | | |
| European Financial Stability Facility 0.875% 4/10/35 (Reg. S) | EUR | 16,368 | 19,521 |
| European Investment Bank 0.05% 10/13/34 (Reg. S) | EUR | 30,749 | 32,933 |
| TOTAL SUPRANATIONAL OBLIGATIONS | | | |
| (Cost $53,596) | | | 52,454 |
| | | Shares | Value (000s) |
|
| Common Stocks - 5.5% | | | |
| COMMUNICATION SERVICES - 0.6% | | | |
| Interactive Media & Services - 0.2% | | | |
| Alphabet, Inc. Class A (o) | | 18,000 | 24,109 |
| Facebook, Inc. Class A (o) | | 78,700 | 16,153 |
| | | | 40,262 |
| Media - 0.2% | | | |
| Altice U.S.A., Inc. Class A (o) | | 675,200 | 18,460 |
| iHeartMedia, Inc. warrants 5/1/39 (o) | | 26 | 0 |
| Nexstar Broadcasting Group, Inc. Class A | | 137,200 | 16,087 |
| | | | 34,547 |
| Wireless Telecommunication Services - 0.2% | | | |
| T-Mobile U.S., Inc. (o) | | 346,800 | 27,196 |
|
| TOTAL COMMUNICATION SERVICES | | | 102,005 |
|
| CONSUMER DISCRETIONARY - 0.6% | | | |
| Auto Components - 0.1% | | | |
| Chassix Holdings, Inc. warrants 7/29/20 (e)(o) | | 30,337 | 294 |
| Exide Technologies (e)(o) | | 7,093 | 7 |
| Exide Technologies (e)(o) | | 23,645 | 0 |
| Exide Technologies (e)(p) | | 105,497 | 940 |
| UC Holdings, Inc. (e)(o) | | 560,355 | 13,650 |
| | | | 14,891 |
| Hotels, Restaurants & Leisure - 0.4% | | | |
| Boyd Gaming Corp. | | 449,600 | 13,461 |
| Eldorado Resorts, Inc. (o) | | 90,400 | 5,391 |
| Melco Crown Entertainment Ltd. sponsored ADR | | 629,500 | 15,215 |
| MGM Mirage, Inc. | | 241,800 | 8,045 |
| Penn National Gaming, Inc. (o) | | 343,406 | 8,777 |
| Restaurant Brands International, Inc. | | 158,200 | 10,085 |
| Royal Caribbean Cruises Ltd. | | 70,200 | 9,372 |
| Studio City International Holdings Ltd. ADR (o) | | 133,400 | 2,635 |
| | | | 72,981 |
| Internet & Direct Marketing Retail - 0.1% | | | |
| Amazon.com, Inc. (o) | | 4,900 | 9,054 |
|
| TOTAL CONSUMER DISCRETIONARY | | | 96,926 |
|
| CONSUMER STAPLES - 0.2% | | | |
| Food & Staples Retailing - 0.0% | | | |
| Performance Food Group Co. (o) | | 2,900 | 149 |
| Southeastern Grocers, Inc. (e)(o) | | 134,915 | 5,266 |
| | | | 5,415 |
| Food Products - 0.2% | | | |
| Darling International, Inc. (o) | | 489,800 | 13,754 |
| JBS SA | | 2,756,800 | 17,681 |
| Reddy Ice Holdings, Inc. (e)(o) | | 331,236 | 0 |
| Reddy Ice Holdings, Inc. (e) | | 133,255 | 21 |
| | | | 31,456 |
|
| TOTAL CONSUMER STAPLES | | | 36,871 |
|
| ENERGY - 0.0% | | | |
| Energy Equipment & Services - 0.0% | | | |
| Forbes Energy Services Ltd. (o) | | 135,187 | 34 |
| Oil, Gas & Consumable Fuels - 0.0% | | | |
| Chaparral Energy, Inc. Class A (o)(q) | | 108,327 | 191 |
| Goodrich Petroleum Corp. (o) | | 90,737 | 911 |
| Harvest Oil & Gas Corp. | | 193,888 | 1,241 |
| MEG Energy Corp. (o) | | 870,000 | 4,951 |
| Ultra Petroleum Corp. warrants 7/14/25 (o) | | 127,890 | 0 |
| VNR Finance Corp. (e)(o) | | 83,865 | 0 |
| VNR Finance Corp. (b)(e)(o) | | 403,886 | 0 |
| | | | 7,294 |
|
| TOTAL ENERGY | | | 7,328 |
|
| FINANCIALS - 0.3% | | | |
| Banks - 0.2% | | | |
| Bank of America Corp. | | 296,000 | 10,425 |
| JPMorgan Chase & Co. | | 115,500 | 16,101 |
| | | | 26,526 |
| Capital Markets - 0.0% | | | |
| Motors Liquidation Co. GUC Trust (o) | | 5,066 | 45 |
| Penson Worldwide, Inc. Class A (e)(o) | | 7,403,098 | 0 |
| | | | 45 |
| Consumer Finance - 0.1% | | | |
| American Express Co. | | 80,400 | 10,009 |
| OneMain Holdings, Inc. | | 262,600 | 11,069 |
| | | | 21,078 |
|
| TOTAL FINANCIALS | | | 47,649 |
|
| HEALTH CARE - 0.7% | | | |
| Biotechnology - 0.0% | | | |
| Alexion Pharmaceuticals, Inc. (o) | | 67,800 | 7,333 |
| Health Care Providers & Services - 0.3% | | | |
| Cigna Corp. | | 57,400 | 11,738 |
| Humana, Inc. | | 37,500 | 13,745 |
| Rotech Healthcare, Inc. (e)(o) | | 129,242 | 1,339 |
| UnitedHealth Group, Inc. | | 51,300 | 15,081 |
| | | | 41,903 |
| Life Sciences Tools & Services - 0.3% | | | |
| Charles River Laboratories International, Inc. (o) | | 66,800 | 10,204 |
| IQVIA Holdings, Inc. (o) | | 139,300 | 21,523 |
| Thermo Fisher Scientific, Inc. | | 39,200 | 12,735 |
| | | | 44,462 |
| Pharmaceuticals - 0.1% | | | |
| Bausch Health Cos., Inc. (Canada) (o) | | 256,100 | 7,666 |
| Jazz Pharmaceuticals PLC (o) | | 77,000 | 11,495 |
| | | | 19,161 |
|
| TOTAL HEALTH CARE | | | 112,859 |
|
| INDUSTRIALS - 0.8% | | | |
| Airlines - 0.3% | | | |
| Air Canada (o) | | 1,531,900 | 57,227 |
| Commercial Services & Supplies - 0.0% | | | |
| Novus Holdings Ltd. | | 48,111 | 9 |
| Machinery - 0.1% | | | |
| Allison Transmission Holdings, Inc. | | 151,000 | 7,296 |
| Fortive Corp. | | 107,900 | 8,242 |
| | | | 15,538 |
| Marine - 0.0% | | | |
| U.S. Shipping Partners Corp. (e)(o) | | 22,876 | 0 |
| U.S. Shipping Partners Corp. warrants 12/31/29 (e)(o) | | 214,176 | 0 |
| | | | 0 |
| Professional Services - 0.1% | | | |
| ASGN, Inc. (o) | | 101,200 | 7,182 |
| Trading Companies & Distributors - 0.3% | | | |
| Air Lease Corp. Class A | | 222,822 | 10,589 |
| HD Supply Holdings, Inc. (o) | | 358,700 | 14,427 |
| Penhall Acquisition Co.: | | | |
| Class A (e)(o) | | 11,553 | 758 |
| Class B (e)(o) | | 3,850 | 253 |
| United Rentals, Inc. (o) | | 188,670 | 31,464 |
| | | | 57,491 |
| Transportation Infrastructure - 0.0% | | | |
| Tricer Holdco SCA: | | | |
| Class A1 (e)(o)(p) | | 403,760 | 0 |
| Class A2 (e)(o)(p) | | 403,760 | 0 |
| Class A3 (e)(o)(p) | | 403,760 | 0 |
| Class A4 (e)(o)(p) | | 403,760 | 0 |
| Class A5 (e)(o)(p) | | 403,760 | 0 |
| Class A6 (e)(o)(p) | | 403,760 | 0 |
| Class A7 (e)(o)(p) | | 403,760 | 0 |
| Class A8 (e)(o)(p) | | 403,760 | 0 |
| Class A9 (e)(o)(p) | | 403,760 | 0 |
| | | | 0 |
|
| TOTAL INDUSTRIALS | | | 137,447 |
|
| INFORMATION TECHNOLOGY - 2.0% | | | |
| Electronic Equipment & Components - 0.1% | | | |
| CDW Corp. | | 96,400 | 13,770 |
| Zebra Technologies Corp. Class A (o) | | 42,900 | 10,958 |
| | | | 24,728 |
| IT Services - 0.8% | | | |
| EPAM Systems, Inc. (o) | | 101,000 | 21,428 |
| Fiserv, Inc. (o) | | 112,625 | 13,023 |
| Global Payments, Inc. | | 122,500 | 22,364 |
| GoDaddy, Inc. (o) | | 113,400 | 7,702 |
| MasterCard, Inc. Class A | | 114,600 | 34,218 |
| PayPal Holdings, Inc. (o) | | 191,300 | 20,693 |
| Verra Mobility Corp. (o) | | 237,600 | 3,324 |
| Visa, Inc. Class A | | 98,400 | 18,489 |
| | | | 141,241 |
| Semiconductors & Semiconductor Equipment - 0.5% | | | |
| Advanced Micro Devices, Inc. (o) | | 291,300 | 13,359 |
| Broadcom, Inc. | | 23,000 | 7,268 |
| Lam Research Corp. | | 60,200 | 17,602 |
| Microchip Technology, Inc. (q) | | 76,000 | 7,959 |
| Micron Technology, Inc. (o) | | 206,800 | 11,122 |
| ON Semiconductor Corp. (o) | | 460,400 | 11,225 |
| Skyworks Solutions, Inc. | | 71,900 | 8,691 |
| | | | 77,226 |
| Software - 0.6% | | | |
| Adobe, Inc. (o) | | 93,600 | 30,870 |
| Microsoft Corp. | | 191,700 | 30,231 |
| Palo Alto Networks, Inc. (o) | | 42,900 | 9,921 |
| Salesforce.com, Inc. (o) | | 56,400 | 9,173 |
| SS&C Technologies Holdings, Inc. | | 128,139 | 7,868 |
| VMware, Inc. Class A | | 43,200 | 6,557 |
| | | | 94,620 |
|
| TOTAL INFORMATION TECHNOLOGY | | | 337,815 |
|
| MATERIALS - 0.1% | | | |
| Chemicals - 0.1% | | | |
| CF Industries Holdings, Inc. | | 142,800 | 6,817 |
| The Chemours Co. LLC | | 278,110 | 5,031 |
| | | | 11,848 |
| Metals & Mining - 0.0% | | | |
| Aleris Corp. (e)(o) | | 72,811 | 0 |
| Algoma Steel GP (e) | | 151,792 | 3 |
| Algoma Steel SCA (e) | | 151,792 | 27 |
| Elah Holdings, Inc. (o) | | 517 | 32 |
| First Quantum Minerals Ltd. | | 709,700 | 7,198 |
| | | | 7,260 |
|
| TOTAL MATERIALS | | | 19,108 |
|
| REAL ESTATE - 0.0% | | | |
| Equity Real Estate Investment Trusts (REITs) - 0.0% | | | |
| Crown Castle International Corp. | | 62,100 | 8,828 |
| UTILITIES - 0.2% | | | |
| Electric Utilities - 0.0% | | | |
| Portland General Electric Co. | | 13,962 | 779 |
| Independent Power and Renewable Electricity Producers - 0.2% | | | |
| NRG Energy, Inc. | | 329,000 | 13,078 |
| Vistra Energy Corp. | | 984,600 | 22,636 |
| | | | 35,714 |
|
| TOTAL UTILITIES | | | 36,493 |
|
| TOTAL COMMON STOCKS | | | |
| (Cost $706,820) | | | 943,329 |
|
| Nonconvertible Preferred Stocks - 0.0% | | | |
| INDUSTRIALS - 0.0% | | | |
| Transportation Infrastructure - 0.0% | | | |
| Tricer Holdco SCA (e)(o)(p) | | | |
| (Cost $6,908) | | 193,792,711 | 65 |
| | | Principal Amount (000s) | Value (000s) |
|
| Bank Loan Obligations - 2.0% | | | |
| COMMUNICATION SERVICES - 0.1% | | | |
| Diversified Telecommunication Services - 0.1% | | | |
| Connect Finco Sarl Tranche B 1LN, term loan 3 month U.S. LIBOR + 4.500% 2.5723% 12/11/26 (c)(f)(r) | | 5,465 | 5,487 |
| Media - 0.0% | | | |
| LCPR Loan Financing LLC Tranche B 1LN, term loan 3 month U.S. LIBOR + 5.000% 6.7398% 10/22/26 (c)(f)(r) | | 1,285 | 1,299 |
| Nexstar Broadcasting, Inc. Tranche B, term loan 3 month U.S. LIBOR + 2.750% 4.4516% 9/19/26 (c)(f)(r) | | 2,710 | 2,723 |
| | | | 4,022 |
|
| TOTAL COMMUNICATION SERVICES | | | 9,509 |
|
| CONSUMER DISCRETIONARY - 0.2% | | | |
| Diversified Consumer Services - 0.1% | | | |
| KUEHG Corp. Tranche B 2LN, term loan 3 month U.S. LIBOR + 8.250% 10.1946% 8/22/25 (c)(f)(r) | | 3,640 | 3,633 |
| Sotheby's 1LN, term loan 1 month U.S. LIBOR + 5.500% 7.2398% 1/3/27 (c)(f)(r) | | 6,801 | 6,725 |
| | | | 10,358 |
| Hotels, Restaurants & Leisure - 0.0% | | | |
| Travelport Finance Luxembourg SARL Tranche B 2LN, term loan 3 month U.S. LIBOR + 9.000% 10.9446% 5/28/27 (f)(r) | | 11,725 | 9,790 |
| Specialty Retail - 0.1% | | | |
| Wand NewCo 3, Inc. Tranche B 1LN, term loan 3 month U.S. LIBOR + 3.500% 5.2994% 2/5/26 (c)(f)(r) | | 11,064 | 11,144 |
|
| TOTAL CONSUMER DISCRETIONARY | | | 31,292 |
|
| ENERGY - 1.0% | | | |
| Energy Equipment & Services - 0.0% | | | |
| BCP Raptor II LLC Tranche B, term loan 3 month U.S. LIBOR + 4.750% 6.5494% 11/3/25 (c)(f)(r) | | 3,512 | 3,231 |
| Forbes Energy Services LLC Tranche B, term loan 16% 4/13/21 (c)(e)(r) | | 1,315 | 1,324 |
| | | | 4,555 |
| Oil, Gas & Consumable Fuels - 1.0% | | | |
| BCP Raptor LLC Tranche B, term loan 3 month U.S. LIBOR + 4.250% 6.0494% 6/24/24 (c)(f)(r) | | 5,299 | 4,875 |
| California Resources Corp.: | | | |
| Tranche 1LN, term loan 3 month U.S. LIBOR + 10.375% 12.1798% 12/31/21 (c)(f)(r) | | 59,940 | 44,456 |
| Tranche B, term loan 3 month U.S. LIBOR + 4.750% 6.5548% 12/31/22 (c)(f)(r) | | 71,920 | 64,099 |
| Chesapeake Energy Corp. term loan 1 month U.S. LIBOR + 8.000% 9.9278% 6/9/24 (c)(f)(r) | | 25,715 | 26,444 |
| Citgo Holding, Inc. Tranche B 1LN, term loan 3 month U.S. LIBOR + 7.000% 8.7994% 8/1/23 (c)(f)(r) | | 848 | 862 |
| Epic Crude Services LP Tranche B 1LN, term loan 3 month U.S. LIBOR + 5.000% 7.04% 3/1/26 (c)(f)(r) | | 22,150 | 21,209 |
| Sanchez Energy Corp. 1LN, term loan 3 month U.S. LIBOR + 8.000% 2.8571% 5/11/20 (c)(e)(f)(r)(s) | | 6,295 | 6,295 |
| | | | 168,240 |
|
| TOTAL ENERGY | | | 172,795 |
|
| FINANCIALS - 0.0% | | | |
| Capital Markets - 0.0% | | | |
| Citadel Securities LP Tranche B, term loan 3 month U.S. LIBOR + 3.500% 5.2994% 2/27/26 (c)(f)(r) | | 1,831 | 1,835 |
| HEALTH CARE - 0.2% | | | |
| Health Care Providers & Services - 0.2% | | | |
| U.S. Renal Care, Inc. Tranche B 1LN, term loan 3 month U.S. LIBOR + 5.000% 6.8125% 6/13/26 (c)(f)(r) | | 26,474 | 26,209 |
| Pharmaceuticals - 0.0% | | | |
| Valeant Pharmaceuticals International, Inc. Tranche B, term loan 3 month U.S. LIBOR + 3.000% 4.7398% 6/1/25 (c)(f)(r) | | 1,157 | 1,163 |
|
| TOTAL HEALTH CARE | | | 27,372 |
|
| INDUSTRIALS - 0.0% | | | |
| Air Freight & Logistics - 0.0% | | | |
| Dynasty Acquisition Co., Inc.: | | | |
| Tranche B 1LN, term loan 3 month U.S. LIBOR + 4.000% 5.9446% 4/4/26 (c)(f)(r) | | 740 | 744 |
| Tranche B 2LN, term loan 3 month U.S. LIBOR + 4.000% 5.9446% 4/4/26 (c)(f)(r) | | 398 | 400 |
| | | | 1,144 |
| Commercial Services & Supplies - 0.0% | | | |
| Sabert Corp. Tranche B 1LN, term loan 1 month U.S. LIBOR + 4.500% 6.25% 11/25/26 (c)(f)(r) | | 4,850 | 4,888 |
| Construction & Engineering - 0.0% | | | |
| Traverse Midstream Partners Ll Tranche B, term loan 3 month U.S. LIBOR + 4.000% 5.8% 9/27/24 (c)(f)(r) | | 1,773 | 1,592 |
|
| TOTAL INDUSTRIALS | | | 7,624 |
|
| INFORMATION TECHNOLOGY - 0.5% | | | |
| Electronic Equipment & Components - 0.0% | | | |
| Curie Merger Sub LLC 1LN, term loan 3 month U.S. LIBOR + 4.250% 6.1946% 10/28/26 (c)(f)(r) | | 360 | 361 |
| IT Services - 0.1% | | | |
| Camelot Finance SA Tranche B, term loan 3 month U.S. LIBOR + 3.250% 5.0494% 10/31/26 (c)(f)(r) | | 690 | 694 |
| GTT Communications, Inc. Tranche B, term loan 3 month U.S. LIBOR + 2.750% 4.55% 5/31/25 (c)(f)(r) | | 968 | 805 |
| Web.com Group, Inc.: | | | |
| 2LN, term loan 3 month U.S. LIBOR + 7.750% 9.4949% 10/11/26 (c)(f)(r) | | 13,620 | 13,067 |
| Tranche B 1LN, term loan 3 month U.S. LIBOR + 3.750% 5.4949% 10/11/25 (c)(f)(r) | | 6,574 | 6,565 |
| | | | 21,131 |
| Semiconductors & Semiconductor Equipment - 0.0% | | | |
| ON Semiconductor Corp. Tranche B 1LN, term loan 3 month U.S. LIBOR + 2.000% 3.7994% 9/19/26 (c)(f)(r) | | 4,723 | 4,753 |
| Software - 0.4% | | | |
| Boxer Parent Co., Inc. Tranche B, term loan 3 month U.S. LIBOR + 4.250% 6.0494% 10/2/25 (c)(f)(r) | | 21,884 | 21,614 |
| Kronos, Inc. 2LN, term loan 3 month U.S. LIBOR + 8.250% 10.1591% 11/1/24 (c)(f)(r) | | 13,470 | 13,717 |
| Landesk Group, Inc. term loan: | | | |
| 3 month U.S. LIBOR + 4.250% 5.97% 1/20/24 (c)(f)(r) | | 1,992 | 1,989 |
| 3 month U.S. LIBOR + 9.000% 10.72% 1/20/25 (c)(f)(r) | | 6,500 | 6,378 |
| McAfee LLC Tranche B, term loan: | | | |
| 3 month U.S. LIBOR + 3.750% 5.5548% 9/29/24 (c)(f)(r) | | 2,765 | 2,775 |
| 3 month U.S. LIBOR + 8.500% 10.3048% 9/29/25 (c)(f)(r) | | 14,801 | 14,860 |
| | | | 61,333 |
|
| TOTAL INFORMATION TECHNOLOGY | | | 87,578 |
|
| MATERIALS - 0.0% | | | |
| Metals & Mining - 0.0% | | | |
| Murray Energy Corp.: | | | |
| term loan 3 month U.S. LIBOR + 11.000% 13% 7/29/20(c)(f)(r) | | 3,073 | 3,065 |
| Tranche B 2LN, term loan 3 month U.S. LIBOR + 7.250% 0% 10/17/22 (d)(f)(r) | | 14,942 | 3,042 |
| | | | 6,107 |
| TOTAL BANK LOAN OBLIGATIONS | | | |
| (Cost $375,161) | | | 344,112 |
| | | Shares | Value (000s) |
|
| Fixed-Income Funds - 24.3% | | | |
| Fidelity Emerging Markets Debt Central Fund (t) | | 276,815,593 | 2,613,139 |
| Fidelity Floating Rate Central Fund (t) | | 14,958,896 | 1,518,627 |
| TOTAL FIXED-INCOME FUNDS | | | |
| (Cost $4,173,416) | | | 4,131,766 |
| | | Principal Amount (000s) | Value (000s) |
|
| Preferred Securities - 4.3% | | | |
| ENERGY - 0.5% | | | |
| Oil, Gas & Consumable Fuels - 0.5% | | | |
| DCP Midstream Partners LP 7.375% (c)(u) | | 8,965 | 8,458 |
| Energy Transfer Partners LP: | | | |
| 6.25% (c)(u) | | 40,712 | 39,230 |
| 6.625% (c)(u) | | 15,640 | 15,171 |
| MPLX LP 6.875% (c)(u) | | 18,000 | 18,602 |
| Summit Midstream Partners LP 9.5% (c)(u) | | 8,965 | 4,612 |
| | | | 86,073 |
| FINANCIALS - 3.7% | | | |
| Banks - 3.1% | | | |
| Bank of America Corp.: | | | |
| 5.125% (c)(u) | | 22,020 | 23,330 |
| 5.2% (c)(u) | | 48,090 | 50,466 |
| 5.875% (c)(u) | | 60,475 | 68,109 |
| 6.25% (c)(u) | | 18,480 | 20,910 |
| Citigroup, Inc.: | | | |
| 5% (c)(u) | | 36,455 | 38,742 |
| 5.9% (c)(u) | | 25,875 | 28,069 |
| 5.95% (c)(u) | | 46,925 | 50,860 |
| 6.3% (c)(u) | | 4,120 | 4,498 |
| Huntington Bancshares, Inc. 5.7% (c)(u) | | 7,660 | 8,040 |
| JPMorgan Chase & Co.: | | | |
| 3 month U.S. LIBOR + 3.320% 5.4186% (c)(f)(u) | | 30,810 | 31,458 |
| 5% (c)(u) | | 18,675 | 19,813 |
| 5.3% (c)(u) | | 12,280 | 12,482 |
| 6% (c)(u) | | 54,840 | 60,252 |
| 6.125% (c)(u) | | 12,865 | 14,191 |
| 6.75% (c)(u) | | 6,270 | 7,256 |
| Wells Fargo & Co.: | | | |
| 5.875% (c)(u) | | 36,775 | 41,013 |
| 5.9% (c)(u) | | 46,445 | 50,698 |
| | | | 530,187 |
| Capital Markets - 0.6% | | | |
| Goldman Sachs Group, Inc.: | | | |
| 3 month U.S. LIBOR + 3.880% 5.7846% (c)(f)(u) | | 7,010 | 7,100 |
| 4.95% (c)(u) | | 7,885 | 8,219 |
| 5% (c)(u) | | 50,754 | 51,497 |
| 5.375% (c)(u) | | 22,175 | 22,620 |
| | | | 89,436 |
|
| TOTAL FINANCIALS | | | 619,623 |
|
| INDUSTRIALS - 0.1% | | | |
| Construction & Engineering - 0.0% | | | |
| Odebrecht Finance Ltd. 7.5% (b)(d)(u) | | 1,825 | 55 |
| Trading Companies & Distributors - 0.1% | | | |
| AerCap Holdings NV 5.875% 10/10/79 (c) | | 20,060 | 21,743 |
|
| TOTAL INDUSTRIALS | | | 21,798 |
|
| TOTAL PREFERRED SECURITIES | | | |
| (Cost $695,929) | | | 727,494 |
| | | Shares | Value (000s) |
|
| Money Market Funds - 3.7% | | | |
| Fidelity Cash Central Fund 1.58% (v) | | 630,583,799 | 630,710 |
| Fidelity Securities Lending Cash Central Fund 1.58% (v)(w) | | 6,224,581 | 6,225 |
| TOTAL MONEY MARKET FUNDS | | | |
| (Cost $636,892) | | | 636,935 |
| Purchased Swaptions - 0.2% | | | | |
| | | Expiration Date | Notional Amount (000s) | Value (000s) |
| Put Options - 0.1% | | | | |
| Option on an interest rate swap with Bank of America N.A. to pay semi-annually a fixed rate of 1.7375% and receive quarterly a floating rate based on 3-month LIBOR, expiring September 2029 | | 9/20/24 | 55,600 | $1,900 |
| Option on an interest rate swap with Bank of America N.A. to pay semi-annually a fixed rate of 1.785% and receive quarterly a floating rate based on 3-month LIBOR, expiring October 2029 | | 10/24/24 | 13,600 | 453 |
| Option on an interest rate swap with Bank of America N.A. to pay semi-annually a fixed rate of 1.82% and receive quarterly a floating rate based on 3-month LIBOR, expiring October 2029 | | 10/18/24 | 10,900 | 353 |
| Option on an interest rate swap with Bank of America, N.A. to pay semi-annually a fixed rate of 2.3275% and receive quarterly a floating rate based on 3-month LIBOR, expiring June 2029 | | 6/11/24 | 31,200 | 622 |
| Option on an interest rate swap with Bank of America, N.A. to pay semi-annually a fixed rate of 2.58% and receive quarterly a floating rate based on 3-month LIBOR, expiring April 2029 | | 4/25/22 | 30,100 | 320 |
| Option on an interest rate swap with Citibank, N.A. to pay semi-annually a fixed rate of 2.54% and receive quarterly a floating rate based on 3-month LIBOR, expiring April 2029 | | 4/5/22 | 70,200 | 768 |
| Option on an interest rate swap with Goldman Sachs Bank U.S.A. to pay semi-annually a fixed rate of 1.905% and receive quarterly a floating rate based on 3-month LIBOR, expiring October 2029 | | 10/28/24 | 22,300 | 676 |
| Option on an interest rate swap with Goldman Sachs Bank U.S.A. to pay semi-annually a fixed rate of 2.495% and receive quarterly a floating rate based on 3-month LIBOR, expiring October 2027 | | 10/5/20 | 38,200 | 105 |
| Option on an interest rate swap with Goldman Sachs Bank U.S.A. to pay semi-annually a fixed rate of 2.63% and receive quarterly a floating rate based on 3-month LIBOR, expiring April 2029 | | 4/25/22 | 27,700 | 273 |
| Option on an interest rate swap with Goldman Sachs Bank U.S.A. to pay semi-annually a fixed rate of 2.7875% and receive quarterly a floating rate based on 3-month LIBOR, expiring January 2028 | | 1/25/21 | 22,300 | 61 |
| Option on an interest rate swap with Goldman Sachs Bank U.S.A. to pay semi-annually a fixed rate of 2.815% and receive quarterly a floating rate based on 3-month LIBOR, expiring March 2029 | | 3/7/22 | 72,000 | 495 |
| Option on an interest rate swap with JPMorgan Chase Bank N.A. to pay semi-annually a fixed rate of 1.57125% and receive quarterly a floating rate based on 3-month LIBOR, expiring September 2029 | | 9/5/24 | 19,800 | 765 |
| Option on an interest rate swap with JPMorgan Chase Bank, N.A. to pay semi-annually a fixed rate of 2.5575% and receive quarterly a floating rate based on 3-month LIBOR, expiring October 2027 | | 10/6/20 | 19,400 | 46 |
|
| TOTAL PUT OPTIONS | | | | 6,837 |
|
| Call Options - 0.1% | | | | |
| Option on an interest rate swap with Bank of America N.A. to receive semi-annually a fixed rate of 1.7375% and pay quarterly a floating rate based on 3-month LIBOR, expiring September 2029 | | 9/20/24 | 55,600 | 1,119 |
| Option on an interest rate swap with Bank of America N.A. to receive semi-annually a fixed rate of 1.785% and pay quarterly a floating rate based on 3-month LIBOR, expiring October 2029 | | 10/24/24 | 13,600 | 287 |
| Option on an interest rate swap with Bank of America N.A. to receive semi-annually a fixed rate of 1.82% and pay quarterly a floating rate based on 3-month LIBOR, expiring October 2029 | | 10/18/24 | 10,900 | 237 |
| Option on an interest rate swap with Bank of America, N.A. to receive semi-annually a fixed rate of 2.3275% and pay quarterly a floating rate based on 3-month LIBOR, expiring June 2029 | | 6/11/24 | 31,200 | 1,028 |
| Option on an interest rate swap with Bank of America, N.A. to receive semi-annually a fixed rate of 2.58% and pay quarterly a floating rate based on 3-month LIBOR, expiring April 2029 | | 4/25/22 | 30,100 | 1,541 |
| Option on an interest rate swap with Citibank, N.A. to receive semi-annually a fixed rate of 2.54% and pay quarterly a floating rate based on 3-month LIBOR, expiring April 2029 | | 4/5/22 | 70,200 | 3,460 |
| Option on an interest rate swap with Goldman Sachs Bank U.S.A. to receive semi-annually a fixed rate of 1.905% and pay quarterly a floating rate based on 3-month LIBOR, expiring October 2029 | | 10/28/24 | 22,300 | 522 |
| Option on an interest rate swap with Goldman Sachs Bank U.S.A. to receive semi-annually a fixed rate of 2.495% and pay quarterly a floating rate based on 3-month LIBOR, expiring October 2027 | | 10/5/20 | 38,200 | 1,779 |
| Option on an interest rate swap with Goldman Sachs Bank U.S.A. to receive semi-annually a fixed rate of 2.63% and pay quarterly a floating rate based on 3-month LIBOR, expiring April 2029 | | 4/25/22 | 27,700 | 1,485 |
| Option on an interest rate swap with Goldman Sachs Bank U.S.A. to receive semi-annually a fixed rate of 2.7875% and pay quarterly a floating rate based on 3-month LIBOR, expiring January 2028 | | 1/25/21 | 22,300 | 1,429 |
| Option on an interest rate swap with Goldman Sachs Bank U.S.A. to receive semi-annually a fixed rate of 2.815% and pay quarterly a floating rate based on 3-month LIBOR, expiring March 2029 | | 3/7/22 | 72,000 | 4,552 |
| Option on an interest rate swap with JPMorgan Chase Bank N.A. to receive semi-annually a fixed rate of 1.57125% and pay quarterly a floating rate based on 3-month LIBOR, expiring September 2029 | | 9/5/24 | 19,800 | 343 |
| Option on an interest rate swap with JPMorgan Chase Bank, N.A. to receive semi-annually a fixed rate of 2.5575% and pay quarterly a floating rate based on 3-month LIBOR, expiring October 2027 | | 10/6/20 | 19,400 | 975 |
|
| TOTAL CALL OPTIONS | | | | 18,757 |
|
| TOTAL PURCHASED SWAPTIONS | | | | |
| (Cost $25,036) | | | | 25,594 |
| TOTAL INVESTMENT IN SECURITIES - 100.1% | | | | |
| (Cost $16,513,986) | | | | 17,045,303 |
| NET OTHER ASSETS (LIABILITIES) - (0.1)% | | | | (18,381) |
| NET ASSETS - 100% | | | | $17,026,922 |
| TBA Sale Commitments | | |
| | Principal Amount (000s) | Value (000s) |
| Ginnie Mae | | |
| 3.5% 1/1/50 | $(35,000) | $(36,071) |
| Uniform Mortgage Backed Securities | | |
| 3% 1/1/50 | (120,900) | (122,603) |
| 3% 1/1/50 | (31,300) | (31,740) |
| 3% 1/1/50 | (23,700) | (24,033) |
| 3.5% 1/1/50 | (43,100) | (44,337) |
|
| TOTAL UNIFORM MORTGAGE BACKED SECURITIES | | (222,713) |
|
| TOTAL TBA SALE COMMITMENTS | | |
| (Proceeds $258,413) | | $(258,784) |
| Written Swaptions | | | |
| | Expiration Date | Notional Amount | Value (000s) |
| Put Swaptions | | | |
| Option on an interest rate swap with Bank of America N.A. to pay semi-annually a fixed rate of 1.45% and receive quarterly a floating rate based on 3-month LIBOR, expiring September 2029 | 9/4/24 | 20,300 | $(856) |
| Option on an interest rate swap with Bank of America N.A. to pay semi-annually a fixed rate of 1.89% and receive quarterly a floating rate based on 3-month LIBOR, expiring December 2029 | 12/9/24 | 1,800 | (56) |
| Option on an interest rate swap with Bank of America N.A. to pay semi-annually a fixed rate of 1.9% and receive quarterly a floating rate based on 3-month LIBOR, expiring December 2029 | 12/10/24 | 27,500 | (851) |
| Option on an interest rate swap with Bank of America, N.A. to pay semi-annually a fixed rate of 2.26% and receive quarterly a floating rate based on 3-month LIBOR, expiring June 2029 | 5/31/22 | 23,000 | (406) |
| Option on an interest rate swap with Goldman Sachs Bank U.S.A. to pay semi-annually a fixed rate of 1.487% and receive quarterly a floating rate based on 3-month LIBOR, expiring October 2030 | 10/2/20 | 28,100 | (1,338) |
|
| TOTAL PUT SWAPTIONS | | | (3,507) |
|
| Call Swaptions | | | |
| Option on an interest rate swap with Bank of America N.A. to receive semi-annually a fixed rate of 1.45% and pay quarterly a floating rate based on 3-month LIBOR, expiring September 2029 | 9/4/24 | 20,300 | (315) |
| Option on an interest rate swap with Bank of America N.A. to receive semi-annually a fixed rate of 1.89% and pay quarterly a floating rate based on 3-month LIBOR, expiring December 2029 | 12/9/24 | 1,800 | (42) |
| Option on an interest rate swap with Bank of America N.A. to receive semi-annually a fixed rate of 1.9% and pay quarterly a floating rate based on 3-month LIBOR, expiring December 2029 | 12/10/24 | 27,500 | (646) |
| Option on an interest rate swap with Bank of America, N.A. to receive semi-annually a fixed rate of 2.26% and pay quarterly a floating rate based on 3-month LIBOR, expiring June 2029 | 5/31/22 | 23,000 | (858) |
| Option on an interest rate swap with Goldman Sachs Bank U.S.A. to receive semi-annually a fixed rate of 1.487% and pay quarterly a floating rate based on 3-month LIBOR, expiring October 2030 | 10/2/20 | 28,100 | (211) |
|
| TOTAL CALL SWAPTIONS | | | (2,072) |
|
| TOTAL WRITTEN SWAPTIONS | | | $(5,579) |
| Futures Contracts | | | | | |
| | Number of contracts | Expiration Date | Notional Amount (000s) | Value (000s) | Unrealized Appreciation/(Depreciation) (000s) |
| Purchased | | | | | |
| Treasury Contracts | | | | | |
| CBOT 10-Year U.S. Treasury Note Contracts (United States) | 2,209 | March 2020 | $283,684 | $(1,188) | $(1,188) |
| CBOT 2-Year U.S. Treasury Note Contracts (United States) | 1,018 | March 2020 | 219,379 | (166) | (166) |
| CBOT 5-Year U.S. Treasury Note Contracts (United States) | 568 | March 2020 | 67,370 | (76) | (76) |
| CBOT Long Term U.S. Treasury Bond Contracts (United States) | 215 | March 2020 | 33,520 | (550) | (550) |
| CBOT Ultra Long Term U.S. Treasury Bond Contracts (United States) | 434 | March 2020 | 78,839 | (1,842) | (1,842) |
| TOTAL FUTURES CONTRACTS | | | | | $(3,822) |
The notional amount of futures purchased as a percentage of Net Assets is 4.0%
| Forward Foreign Currency Contracts | | | | | | |
| Currency Purchased | Currency Sold | Counterparty | Settlement Date | Unrealized Appreciation/(Depreciation) (000s) |
| EUR | 10,000 | USD | 11,117 | CIBC World Markets | 2/13/20 | $129 |
| EUR | 4,475 | USD | 5,037 | National Australia Bank | 2/13/20 | (4) |
| GBP | 40,649 | USD | 53,197 | JPMorgan Chase Bank, N.A. | 2/13/20 | 710 |
| HKD | 24,552 | USD | 3,150 | Societe Generale SA | 2/13/20 | 0 |
| USD | 93,538 | AUD | 135,615 | BNP Paribas SA | 2/13/20 | (1,728) |
| USD | 113,107 | CAD | 148,669 | Royal Bank Of Canada | 2/13/20 | (1,403) |
| USD | 39,767 | CHF | 38,960 | BNP Paribas SA | 2/13/20 | (607) |
| USD | 18,961 | DKK | 126,618 | Royal Bank Of Canada | 2/13/20 | (100) |
| USD | 13,095 | EUR | 11,730 | BNP Paribas SA | 2/13/20 | (96) |
| USD | 336,590 | EUR | 301,000 | Bank Of America NA | 2/13/20 | (1,917) |
| USD | 357,829 | EUR | 319,703 | Citibank NA | 2/13/20 | (1,711) |
| USD | 335,580 | EUR | 300,000 | Morgan Stanley | 2/13/20 | (1,802) |
| USD | 208,651 | GBP | 156,214 | Royal Bank Of Canada | 2/13/20 | 1,487 |
| USD | 3,148 | HKD | 24,552 | BNP Paribas SA | 2/13/20 | (2) |
| USD | 174,060 | JPY | 19,000,000 | CIBC World Markets | 2/13/20 | (1,212) |
| USD | 186,906 | JPY | 20,389,444 | JPMorgan Chase Bank, N.A. | 2/13/20 | (1,183) |
| USD | 38,132 | JPY | 4,162,897 | JPMorgan Chase Bank, N.A. | 2/13/20 | (270) |
| USD | 7,026 | NOK | 63,311 | CIBC World Markets | 2/13/20 | (187) |
| USD | 8,746 | NZD | 13,246 | National Australia Bank | 2/13/20 | (177) |
| USD | 33,141 | SEK | 309,408 | Morgan Stanley | 2/13/20 | 41 |
| USD | 38,328 | SGD | 51,904 | National Australia Bank | 2/13/20 | (277) |
| TOTAL FORWARD FOREIGN CURRENCY CONTRACTS | | | | | | $(10,309) |
| | | | | | Unrealized Appreciation | 2,367 |
| | | | | | Unrealized Depreciation | (12,676) |
Swaps
| Payment Received | Payment Frequency | Payment Paid | Payment Frequency | Clearinghouse / Counterparty(1) | Maturity Date | Notional Amount (000s) | Value (000s) | Upfront Premium Received/(Paid) (000s)(2) | Unrealized Appreciation/(Depreciation) (000s) |
| Interest Rate Swaps | | | | | | | | | |
| 1.75% | Semi - annual | 3-month LIBOR(3) | Quarterly | LCH | Mar. 2022 | $230,287 | $(167) | $0 | $(167) |
| 1.75% | Semi - annual | 3-month LIBOR(3) | Quarterly | LCH | Mar. 2025 | 90 | 0 | 0 | 0 |
| 3-month LIBOR(3) | Quarterly | 2% | Semi - annual | LCH | Mar. 2027 | 9,745 | 86 | 0 | 86 |
| 3-month LIBOR(3) | Quarterly | 2% | Semi - annual | LCH | Mar. 2030 | 113,350 | 1,665 | 0 | 1,665 |
|
| TOTAL INTEREST RATE SWAPS | | | | | | | $1,584 | $0 | $1,584 |
|
(1) Swaps with LCH Clearnet Group (LCH) are centrally cleared over-the-counter (OTC) swaps.
(2) Any premiums for centrally cleared over-the-counter (OTC) swaps are recorded periodically throughout the term of the swap to variation margin and included in unrealized appreciation (depreciation).
(3) Represents floating rate.
Currency Abbreviations
AUD – Australian dollar
CAD – Canadian dollar
CHF – Swiss franc
DKK – Danish krone
EUR – European Monetary Unit
GBP – British pound
JPY – Japanese yen
NOK – Norwegian krone
NZD – New Zealand dollar
SEK – Swedish krona
SGD – Singapore dollar
Values shown as $0 in the Schedule of Investments may reflect amounts less than $500.
Legend
(a) Amount is stated in United States dollars unless otherwise noted.
(b) Security exempt from registration under Rule 144A of the Securities Act of 1933. These securities may be resold in transactions exempt from registration, normally to qualified institutional buyers. At the end of the period, the value of these securities amounted to $3,023,820,000 or 17.8% of net assets.
(c) Coupon rates for floating and adjustable rate securities reflect the rates in effect at period end.
(d) Non-income producing - Security is in default.
(e) Level 3 security
(f) Coupon is indexed to a floating interest rate which may be multiplied by a specified factor and/or subject to caps or floors.
(g) Security or a portion of the security was pledged to cover margin requirements for futures contracts. At period end, the value of securities pledged amounted to $6,064,000.
(h) Security or a portion of the security was pledged to cover margin requirements for centrally cleared OTC swaps. At period end, the value of securities pledged amounted to $5,384,000.
(i) Security or a portion of the security has been segregated as collateral for mortgage-backed or asset-backed securities purchased on a delayed delivery or when-issued basis. At period end, the value of securities pledged amounted to $300,000.
(j) Security or a portion of the security has been segregated as collateral for open options. At period end, the value of securities pledged amounted to $258,000.
(k) Represents an investment in an underlying pool of reverse mortgages which typically do not require regular principal and interest payments as repayment is deferred until a maturity event.
(l) Security or a portion of the security purchased on a delayed delivery or when-issued basis.
(m) Security represents right to receive monthly interest payments on an underlying pool of mortgages or assets. Principal shown is the outstanding par amount of the pool as of the end of the period.
(n) Coupon is inversely indexed to a floating interest rate multiplied by a specified factor. The price may be considerably more volatile than the price of a comparable fixed rate security.
(o) Non-income producing
(p) Restricted securities - Investment in securities not registered under the Securities Act of 1933 (excluding 144A issues). At the end of the period, the value of restricted securities (excluding 144A issues) amounted to $1,005,000 or 0.0% of net assets.
(q) Security or a portion of the security is on loan at period end.
(r) Remaining maturities of bank loan obligations may be less than the stated maturities shown as a result of contractual or optional prepayments by the borrower. Such prepayments cannot be predicted with certainty.
(s) Position or a portion of the position represents an unfunded loan commitment. At period end, the total principal amount and market value of unfunded commitments totaled $4,497,000 and $4,497,000, respectively.
(t) Affiliated fund that is generally available only to investment companies and other accounts managed by Fidelity Investments. A complete unaudited schedule of portfolio holdings for each Fidelity Central Fund is filed with the SEC for the first and third quarters of each fiscal year on Form N-PORT and is available upon request or at the SEC's website at www.sec.gov. An unaudited holdings listing for the Fund, which presents direct holdings as well as the pro-rata share of securities and other investments held indirectly through its investment in underlying non-money market Fidelity Central Funds, is available at fidelity.com and/or institutional.fidelity.com, as applicable. In addition, each Fidelity Central Fund's financial statements, which are not covered by the Fund's Report of Independent Registered Public Accounting Firm, are available on the SEC's website or upon request.
(u) Security is perpetual in nature with no stated maturity date.
(v) Affiliated fund that is generally available only to investment companies and other accounts managed by Fidelity Investments. The rate quoted is the annualized seven-day yield of the fund at period end. A complete unaudited listing of the fund's holdings as of its most recent quarter end is available upon request. In addition, each Fidelity Central Fund's financial statements, which are not covered by the Fund's Report of Independent Registered Public Accounting Firm, are available on the SEC's website or upon request.
(w) Investment made with cash collateral received from securities on loan.
Additional information on each restricted holding is as follows:
| Security | Acquisition Date | Acquisition Cost (000s) |
| Exide Technologies | 4/30/15 - 6/1/19 | $1,708 |
| Tricer Holdco SCA | 10/16/09 - 12/30/17 | $6,909 |
| Tricer Holdco SCA Class A1 | 10/16/09 - 10/29/09 | $1,100 |
| Tricer Holdco SCA Class A2 | 10/16/09 - 10/29/09 | $1,100 |
| Tricer Holdco SCA Class A3 | 10/16/09 - 10/29/09 | $1,100 |
| Tricer Holdco SCA Class A4 | 10/16/09 - 10/29/09 | $1,100 |
| Tricer Holdco SCA Class A5 | 10/16/09 - 10/29/09 | $1,100 |
| Tricer Holdco SCA Class A6 | 10/16/09 - 10/29/09 | $1,100 |
| Tricer Holdco SCA Class A7 | 10/16/09 - 10/29/09 | $1,100 |
| Tricer Holdco SCA Class A8 | 10/16/09 - 10/29/09 | $1,100 |
| Tricer Holdco SCA Class A9 | 10/16/09 - 10/29/09 | $1,100 |
Affiliated Central Funds
Information regarding fiscal year to date income earned by the Fund from investments in Fidelity Central Funds is as follows:
| Fund | Income earned |
| | (Amounts in thousands) |
| Fidelity Cash Central Fund | $21,113 |
| Fidelity Emerging Markets Debt Central Fund | 104,522 |
| Fidelity Floating Rate Central Fund | 89,283 |
| Fidelity Securities Lending Cash Central Fund | 25 |
| Total | $214,943 |
Amounts in the income column in the above table include any capital gain distributions from underlying funds, which are presented in the corresponding line-item in the Statement of Operations, if applicable.
Fiscal year to date information regarding the Fund’s investments in non-Money Market Central Funds, including the ownership percentage, is presented below.
| Fund (Amounts in thousands) | Value, beginning of period | Purchases(a) | Sales Proceeds | Realized Gain/Loss | Change in Unrealized appreciation (depreciation) | Value, end of period | % ownership, end of period |
| Fidelity Emerging Markets Debt Central Fund | $-- | $2,654,771 | $37,040 | $(729) | $(3,863) | $2,613,139 | 89.0% |
| Fidelity Floating Rate Central Fund | 1,430,579 | 93,987 | 50,332 | (935) | 45,328 | 1,518,627 | 79.6% |
| Total | $1,430,579 | $2,748,758 | $87,372 | $(1,664) | $41,465 | $4,131,766 | |
(a) Includes the value of shares purchased through in-kind transactions, if applicable. See the Notes to Financial Statements for additional details.
Investment Valuation
The following is a summary of the inputs used, as of December 31, 2019, involving the Fund's assets and liabilities carried at fair value. The inputs or methodology used for valuing securities may not be an indication of the risk associated with investing in those securities. For more information on valuation inputs, and their aggregation into the levels used below, please refer to the Investment Valuation section in the accompanying Notes to Financial Statements.
| | Valuation Inputs at Reporting Date: |
| Description | Total | Level 1 | Level 2 | Level 3 |
| (Amounts in thousands) | | | | |
| Investments in Securities: | | | | |
| Equities: | | | | |
| Communication Services | $102,005 | $102,005 | $-- | $-- |
| Consumer Discretionary | 96,926 | 82,035 | -- | 14,891 |
| Consumer Staples | 36,871 | 31,584 | -- | 5,287 |
| Energy | 7,328 | 7,328 | -- | -- |
| Financials | 47,649 | 47,649 | -- | -- |
| Health Care | 112,859 | 111,520 | -- | 1,339 |
| Industrials | 137,512 | 136,436 | -- | 1,076 |
| Information Technology | 337,815 | 337,815 | -- | -- |
| Materials | 19,108 | 19,078 | -- | 30 |
| Real Estate | 8,828 | 8,828 | -- | -- |
| Utilities | 36,493 | 36,493 | -- | -- |
| Corporate Bonds | 4,950,192 | -- | 4,947,109 | 3,083 |
| U.S. Government and Government Agency Obligations | 2,878,611 | -- | 2,878,611 | -- |
| U.S. Government Agency - Mortgage Securities | 253,688 | -- | 253,688 | -- |
| Asset-Backed Securities | 10,014 | -- | 10,014 | -- |
| Collateralized Mortgage Obligations | 361,079 | -- | 361,079 | -- |
| Commercial Mortgage Securities | 35,826 | -- | 35,826 | -- |
| Foreign Government and Government Agency Obligations | 1,694,144 | -- | 1,694,144 | -- |
| Supranational Obligations | 52,454 | -- | 52,454 | -- |
| Bank Loan Obligations | 344,112 | -- | 336,493 | 7,619 |
| Fixed-Income Funds | 4,131,766 | 4,131,766 | -- | -- |
| Preferred Securities | 727,494 | -- | 727,494 | -- |
| Money Market Funds | 636,935 | 636,935 | -- | -- |
| Purchased Swaptions | 25,594 | -- | 25,594 | -- |
| Total Investments in Securities: | $17,045,303 | $5,689,472 | $11,322,506 | $33,325 |
| Derivative Instruments: | | | | |
| Assets | | | | |
| Forward Foreign Currency Contracts | $2,367 | $-- | $2,367 | $-- |
| Swaps | 1,751 | -- | 1,751 | -- |
| Total Assets | $4,118 | $-- | $4,118 | $-- |
| Liabilities | | | | |
| Forward Foreign Currency Contracts | $(12,676) | $-- | $(12,676 ) | $-- |
| Futures Contracts | (3,822) | (3,822) | -- | -- |
| Swaps | (167) | -- | (167) | -- |
| Written Swaptions | (5,579) | -- | (5,579) | -- |
| Total Liabilities | $(22,244) | $(3,822) | $(18,422) | $-- |
| Total Derivative Instruments: | $(18,126) | $(3,822) | $(14,304) | $-- |
| Other Financial Instruments: | | | | |
| TBA Sale Commitments | $(258,784) | $-- | $(258,784) | $-- |
| Total Other Financial Instruments: | $(258,784) | $-- | $(258,784) | $-- |
Value of Derivative Instruments
The following table is a summary of the Fund's value of derivative instruments by primary risk exposure as of December 31, 2019. For additional information on derivative instruments, please refer to the Derivative Instruments section in the accompanying Notes to Financial Statements.
| Primary Risk Exposure / Derivative Type | Value |
| | Asset | Liability |
| (Amounts in thousands) | | |
| Foreign Exchange Risk | | |
| Forward Foreign Currency Contracts(a) | $2,367 | $(12,676) |
| Total Foreign Exchange Risk | 2,367 | (12,676) |
| Interest Rate Risk | | |
| Futures Contracts(b) | 0 | (3,822) |
| Purchased Swaptions(c) | 25,594 | 0 |
| Swaps(d) | 1,751 | (167) |
| Written Swaptions(e) | 0 | (5,579) |
| Total Interest Rate Risk | 27,345 | (9,568) |
| Total Value of Derivatives | $29,712 | $(22,244) |
(a) Gross value is presented in the Statement of Assets and Liabilities in the unrealized appreciation/depreciation on forward foreign currency contracts line-items.
(b) Reflects gross cumulative appreciation (depreciation) on futures contracts as presented in the Schedule of Investments. In the Statement of Assets and Liabilities, the period end daily variation margin is included in receivable or payable for daily variation margin on futures contracts, and the net cumulative appreciation (depreciation) is included in Total accumulated earnings (loss).
(c) Gross value is included in the Statement of Assets and Liabilities in the investments, at value line-item.
(d) For centrally cleared over-the-counter (OTC) swaps, reflects gross cumulative appreciation (depreciation) as presented in the Schedule of Investments. In the Statement of Assets and Liabilities, the period end daily variation margin for centrally cleared OTC swaps is included in receivable or payable for daily variation margin on centrally cleared OTC swaps, and the net cumulative appreciation (depreciation) for centrally cleared OTC swaps is included in net unrealized appreciation (depreciation).
(e) Gross value is presented in the Statement of Assets and Liabilities in the written options, at value line-item.
Other Information
Distribution of investments by country or territory of incorporation, as a percentage of Total Net Assets, is as follows (Unaudited):
| United States of America | 69.1% |
| Canada | 2.8% |
| Netherlands | 2.8% |
| Germany | 2.7% |
| Japan | 2.4% |
| Luxembourg | 2.1% |
| United Kingdom | 1.9% |
| Multi-National | 1.5% |
| Mexico | 1.4% |
| Cayman Islands | 1.2% |
| Argentina | 1.2% |
| Turkey | 1.2% |
| Others (Individually Less Than 1%) | 9.7% |
| | 100% |
The information in the above tables is based on the combined investments of the fund and its pro-rata share of the investments of Fidelity's Fixed-Income Central Funds
See accompanying notes which are an integral part of the financial statements.
Fidelity Advisor® Strategic Income Fund
Financial Statements
Statement of Assets and Liabilities
| Amounts in thousands (except per-share amounts) | | December 31, 2019 |
| Assets | | |
Investment in securities, at value (including securities loaned of $6,082) — See accompanying schedule:
Unaffiliated issuers (cost $11,703,678) | $12,276,602 | |
| Fidelity Central Funds (cost $4,810,308) | 4,768,701 | |
| Total Investment in Securities (cost $16,513,986) | | $17,045,303 |
| Cash | | 22,968 |
| Foreign currency held at value (cost $13) | | 13 |
| Receivable for investments sold | | 3,288 |
| Receivable for premium on written options | | 5,738 |
| Receivable for TBA sale commitments | | 258,413 |
| Unrealized appreciation on forward foreign currency contracts | | 2,367 |
| Receivable for fund shares sold | | 15,697 |
| Dividends receivable | | 643 |
| Interest receivable | | 102,855 |
| Distributions receivable from Fidelity Central Funds | | 1,005 |
| Receivable for daily variation margin on centrally cleared OTC swaps | | 328 |
| Prepaid expenses | | 22 |
| Other receivables | | 442 |
| Total assets | | 17,459,082 |
| Liabilities | | |
| Payable for investments purchased | | |
| Regular delivery | $52,355 | |
| Delayed delivery | 47,993 | |
| TBA sale commitments, at value | 258,784 | |
| Unrealized depreciation on forward foreign currency contracts | 12,676 | |
| Payable for fund shares redeemed | 33,031 | |
| Distributions payable | 2,977 | |
| Accrued management fee | 7,815 | |
| Distribution and service plan fees payable | 1,131 | |
| Payable for daily variation margin on futures contracts | 752 | |
| Written options, at value (premium receivable $5,738) | 5,579 | |
| Other affiliated payables | 1,944 | |
| Other payables and accrued expenses | 898 | |
| Collateral on securities loaned | 6,225 | |
| Total liabilities | | 432,160 |
| Net Assets | | $17,026,922 |
| Net Assets consist of: | | |
| Paid in capital | | $16,494,807 |
| Total accumulated earnings (loss) | | 532,115 |
| Net Assets | | $17,026,922 |
| Net Asset Value and Maximum Offering Price | | |
| Class A: | | |
| Net Asset Value and redemption price per share ($1,918,346 ÷ 156,107 shares)(a) | | $12.29 |
| Maximum offering price per share (100/96.00 of $12.29) | | $12.80 |
| Class M: | | |
| Net Asset Value and redemption price per share ($806,046 ÷ 65,627 shares)(a) | | $12.28 |
| Maximum offering price per share (100/96.00 of $12.28) | | $12.79 |
| Class C: | | |
| Net Asset Value and offering price per share ($678,188 ÷ 55,336 shares)(a) | | $12.26 |
| Fidelity Strategic Income Fund: | | |
| Net Asset Value, offering price and redemption price per share ($8,138,514 ÷ 653,210 shares) | | $12.46 |
| Class I: | | |
| Net Asset Value, offering price and redemption price per share ($4,899,204 ÷ 393,179 shares) | | $12.46 |
| Class Z: | | |
| Net Asset Value, offering price and redemption price per share ($586,624 ÷ 47,060 shares) | | $12.47 |
(a) Redemption price per share is equal to net asset value less any applicable contingent deferred sales charge.
See accompanying notes which are an integral part of the financial statements.
Statement of Operations
| Amounts in thousands | | Year ended December 31, 2019 |
| Investment Income | | |
| Dividends | | $51,776 |
| Interest (including $222 from security lending) | | 481,376 |
| Income from Fidelity Central Funds (including $25 from security lending) | | 199,343 |
| Total income | | 732,495 |
| Expenses | | |
| Management fee | $93,069 | |
| Transfer agent fees | 21,629 | |
| Distribution and service plan fees | 14,494 | |
| Accounting and security lending fees | 1,852 | |
| Custodian fees and expenses | 209 | |
| Independent trustees' fees and expenses | 67 | |
| Registration fees | 393 | |
| Audit | 163 | |
| Legal | (297) | |
| Miscellaneous | 140 | |
| Total expenses before reductions | 131,719 | |
| Expense reductions | (220) | |
| Total expenses after reductions | | 131,499 |
| Net investment income (loss) | | 600,996 |
| Realized and Unrealized Gain (Loss) | | |
| Net realized gain (loss) on: | | |
| Investment securities: | | |
| Unaffiliated issuers | 91,425 | |
| Fidelity Central Funds | (1,664) | |
| Forward foreign currency contracts | (1,369) | |
| Foreign currency transactions | 1,848 | |
| Futures contracts | 56,724 | |
| Swaps | (1,492) | |
| Written options | (1,845) | |
| Capital gain distributions from Fidelity Central Funds | 15,600 | |
| Total net realized gain (loss) | | 159,227 |
| Change in net unrealized appreciation (depreciation) on: | | |
| Investment securities: | | |
| Unaffiliated issuers | 966,817 | |
| Fidelity Central Funds | 41,465 | |
| Forward foreign currency contracts | (10,309) | |
| Assets and liabilities in foreign currencies | 222 | |
| Futures contracts | (23,549) | |
| Swaps | 1,242 | |
| Written options | 159 | |
| Delayed delivery commitments | 35 | |
| Total change in net unrealized appreciation (depreciation) | | 976,082 |
| Net gain (loss) | | 1,135,309 |
| Net increase (decrease) in net assets resulting from operations | | $1,736,305 |
See accompanying notes which are an integral part of the financial statements.
Statement of Changes in Net Assets
| Amounts in thousands | Year ended December 31, 2019 | Year ended December 31, 2018 |
| Increase (Decrease) in Net Assets | | |
| Operations | | |
| Net investment income (loss) | $600,996 | $532,413 |
| Net realized gain (loss) | 159,227 | (69,703) |
| Change in net unrealized appreciation (depreciation) | 976,082 | (899,334) |
| Net increase (decrease) in net assets resulting from operations | 1,736,305 | (436,624) |
| Distributions to shareholders | (718,416) | (525,355) |
| Share transactions - net increase (decrease) | (195,579) | 8,040,478 |
| Total increase (decrease) in net assets | 822,310 | 7,078,499 |
| Net Assets | | |
| Beginning of period | 16,204,612 | 9,126,113 |
| End of period | $17,026,922 | $16,204,612 |
See accompanying notes which are an integral part of the financial statements.
Financial Highlights
Fidelity Advisor Strategic Income Fund Class A
| Years ended December 31, | 2019 | 2018 | 2017 | 2016 | 2015 |
| Selected Per–Share Data | | | | | |
| Net asset value, beginning of period | $11.56 | $12.32 | $11.88 | $11.32 | $11.92 |
| Income from Investment Operations | | | | | |
| Net investment income (loss)A | .412 | .424 | .399 | .428 | .420 |
| Net realized and unrealized gain (loss) | .818 | (.780) | .526 | .516 | (.629) |
| Total from investment operations | 1.230 | (.356) | .925 | .944 | (.209) |
| Distributions from net investment income | (.390) | (.392) | (.382) | (.384) | (.307) |
| Distributions from net realized gain | (.110) | (.012) | (.103) | – | (.007) |
| Tax return of capital | – | – | – | – | (.077) |
| Total distributions | (.500) | (.404) | (.485) | (.384) | (.391) |
| Net asset value, end of period | $12.29 | $11.56 | $12.32 | $11.88 | $11.32 |
| Total ReturnB,C | 10.74% | (2.95)% | 7.87% | 8.42% | (1.84)% |
| Ratios to Average Net AssetsD,E | | | | | |
| Expenses before reductions | .98% | .98% | 1.00% | 1.01% | 1.00% |
| Expenses net of fee waivers, if any | .97% | .98% | .99% | 1.01% | 1.00% |
| Expenses net of all reductions | .97% | .98% | .99% | 1.01% | 1.00% |
| Net investment income (loss) | 3.38% | 3.52% | 3.24% | 3.64% | 3.55% |
| Supplemental Data | | | | | |
| Net assets, end of period (in millions) | $1,918 | $1,631 | $1,921 | $3,098 | $3,274 |
| Portfolio turnover rateF | 138%G | 113%H | 123% | 76% | 88% |
A Calculated based on average shares outstanding during the period.
B Total returns would have been lower if certain expenses had not been reduced during the applicable periods shown.
C Total returns do not include the effect of the sales charges.
D Fees and expenses of any underlying Fidelity Central Funds are not included in the Fund's expense ratio. The Fund indirectly bears its proportionate share of the expenses of any underlying Fidelity Central Funds. Based on their most recent shareholder report date, the expenses of any underlying non-money market Fidelity Central Funds were less than .005%.
E Expense ratios reflect operating expenses of the class. Expenses before reductions do not reflect amounts reimbursed by the investment adviser or reductions from brokerage service arrangements or reductions from other expense offset arrangements and do not represent the amount paid by the class during periods when reimbursements or reductions occur. Expenses net of fee waivers reflect expenses after reimbursement by the investment adviser but prior to reductions from brokerage service arrangements or other expense offset arrangements. Expenses net of all reductions represent the net expenses paid by the class.
F Amount does not include the portfolio activity of any underlying Fidelity Central Funds.
G Portfolio turnover rate excludes securities received or delivered in-kind.
H The portfolio turnover rate does not include the assets acquired in the merger.
See accompanying notes which are an integral part of the financial statements.
Fidelity Advisor Strategic Income Fund Class M
| Years ended December 31, | 2019 | 2018 | 2017 | 2016 | 2015 |
| Selected Per–Share Data | | | | | |
| Net asset value, beginning of period | $11.55 | $12.31 | $11.88 | $11.31 | $11.92 |
| Income from Investment Operations | | | | | |
| Net investment income (loss)A | .412 | .424 | .398 | .428 | .420 |
| Net realized and unrealized gain (loss) | .818 | (.779) | .517 | .526 | (.639) |
| Total from investment operations | 1.230 | (.355) | .915 | .954 | (.219) |
| Distributions from net investment income | (.390) | (.393) | (.382) | (.384) | (.307) |
| Distributions from net realized gain | (.110) | (.012) | (.103) | – | (.007) |
| Tax return of capital | – | – | – | – | (.077) |
| Total distributions | (.500) | (.405) | (.485) | (.384) | (.391) |
| Net asset value, end of period | $12.28 | $11.55 | $12.31 | $11.88 | $11.31 |
| Total ReturnB,C | 10.75% | (2.95)% | 7.78% | 8.52% | (1.93)% |
| Ratios to Average Net AssetsD,E | | | | | |
| Expenses before reductions | .97% | .98% | .99% | 1.01% | 1.00% |
| Expenses net of fee waivers, if any | .97% | .97% | .99% | 1.00% | 1.00% |
| Expenses net of all reductions | .97% | .97% | .99% | 1.00% | 1.00% |
| Net investment income (loss) | 3.39% | 3.52% | 3.24% | 3.64% | 3.55% |
| Supplemental Data | | | | | |
| Net assets, end of period (in millions) | $806 | $755 | $864 | $967 | $1,008 |
| Portfolio turnover rateF | 138%G | 113%H | 123% | 76% | 88% |
A Calculated based on average shares outstanding during the period.
B Total returns would have been lower if certain expenses had not been reduced during the applicable periods shown.
C Total returns do not include the effect of the sales charges.
D Fees and expenses of any underlying Fidelity Central Funds are not included in the Fund's expense ratio. The Fund indirectly bears its proportionate share of the expenses of any underlying Fidelity Central Funds. Based on their most recent shareholder report date, the expenses of any underlying non-money market Fidelity Central Funds were less than .005%.
E Expense ratios reflect operating expenses of the class. Expenses before reductions do not reflect amounts reimbursed by the investment adviser or reductions from brokerage service arrangements or reductions from other expense offset arrangements and do not represent the amount paid by the class during periods when reimbursements or reductions occur. Expenses net of fee waivers reflect expenses after reimbursement by the investment adviser but prior to reductions from brokerage service arrangements or other expense offset arrangements. Expenses net of all reductions represent the net expenses paid by the class.
F Amount does not include the portfolio activity of any underlying Fidelity Central Funds.
G Portfolio turnover rate excludes securities received or delivered in-kind.
H The portfolio turnover rate does not include the assets acquired in the merger.
See accompanying notes which are an integral part of the financial statements.
Fidelity Advisor Strategic Income Fund Class C
| Years ended December 31, | 2019 | 2018 | 2017 | 2016 | 2015 |
| Selected Per–Share Data | | | | | |
| Net asset value, beginning of period | $11.53 | $12.28 | $11.85 | $11.29 | $11.89 |
| Income from Investment Operations | | | | | |
| Net investment income (loss)A | .320 | .334 | .305 | .339 | .331 |
| Net realized and unrealized gain (loss) | .818 | (.770) | .518 | .516 | (.629) |
| Total from investment operations | 1.138 | (.436) | .823 | .855 | (.298) |
| Distributions from net investment income | (.298) | (.302) | (.290) | (.295) | (.236) |
| Distributions from net realized gain | (.110) | (.012) | (.103) | – | (.007) |
| Tax return of capital | – | – | – | – | (.059) |
| Total distributions | (.408) | (.314) | (.393) | (.295) | (.302) |
| Net asset value, end of period | $12.26 | $11.53 | $12.28 | $11.85 | $11.29 |
| Total ReturnB,C | 9.94% | (3.60)% | 7.00% | 7.63% | (2.59)% |
| Ratios to Average Net AssetsD,E | | | | | |
| Expenses before reductions | 1.72% | 1.72% | 1.74% | 1.75% | 1.75% |
| Expenses net of fee waivers, if any | 1.72% | 1.72% | 1.74% | 1.75% | 1.75% |
| Expenses net of all reductions | 1.72% | 1.72% | 1.74% | 1.75% | 1.75% |
| Net investment income (loss) | 2.63% | 2.78% | 2.50% | 2.90% | 2.80% |
| Supplemental Data | | | | | |
| Net assets, end of period (in millions) | $678 | $1,006 | $1,302 | $1,376 | $1,429 |
| Portfolio turnover rateF | 138%G | 113%H | 123% | 76% | 88% |
A Calculated based on average shares outstanding during the period.
B Total returns would have been lower if certain expenses had not been reduced during the applicable periods shown.
C Total returns do not include the effect of the contingent deferred sales charge.
D Fees and expenses of any underlying Fidelity Central Funds are not included in the Fund's expense ratio. The Fund indirectly bears its proportionate share of the expenses of any underlying Fidelity Central Funds. Based on their most recent shareholder report date, the expenses of any underlying non-money market Fidelity Central Funds were less than .005%.
E Expense ratios reflect operating expenses of the class. Expenses before reductions do not reflect amounts reimbursed by the investment adviser or reductions from brokerage service arrangements or reductions from other expense offset arrangements and do not represent the amount paid by the class during periods when reimbursements or reductions occur. Expenses net of fee waivers reflect expenses after reimbursement by the investment adviser but prior to reductions from brokerage service arrangements or other expense offset arrangements. Expenses net of all reductions represent the net expenses paid by the class.
F Amount does not include the portfolio activity of any underlying Fidelity Central Funds.
G Portfolio turnover rate excludes securities received or delivered in-kind.
H The portfolio turnover rate does not include the assets acquired in the merger.
See accompanying notes which are an integral part of the financial statements.
Fidelity Strategic Income Fund
| Years ended December 31, | 2019 | 2018 A |
| Selected Per–Share Data | | |
| Net asset value, beginning of period | $11.72 | $12.38 |
| Income from Investment Operations | | |
| Net investment income (loss)B | .454 | .314 |
| Net realized and unrealized gain (loss) | .827 | (.657) |
| Total from investment operations | 1.281 | (.343) |
| Distributions from net investment income | (.431) | (.317) |
| Distributions from net realized gain | (.110) | – |
| Total distributions | (.541) | (.317) |
| Net asset value, end of period | $12.46 | $11.72 |
| Total ReturnC,D | 11.04% | (2.78)% |
| Ratios to Average Net AssetsE,F | | |
| Expenses before reductions | .68% | .69%G |
| Expenses net of fee waivers, if any | .68% | .68%G |
| Expenses net of all reductions | .68% | .68%G |
| Net investment income (loss) | 3.68% | 3.64%G |
| Supplemental Data | | |
| Net assets, end of period (in millions) | $8,139 | $7,817 |
| Portfolio turnover rateH | 138%I | 113%J |
A For the period April 13, 2018 (commencement of sale of shares) to December 31, 2018.
B Calculated based on average shares outstanding during the period.
C Total returns for periods of less than one year are not annualized.
D Total returns would have been lower if certain expenses had not been reduced during the applicable periods shown.
E Fees and expenses of any underlying Fidelity Central Funds are not included in the Fund's expense ratio. The Fund indirectly bears its proportionate share of the expenses of any underlying Fidelity Central Funds. Based on their most recent shareholder report date, the expenses of any underlying non-money market Fidelity Central Funds were less than .005%.
F Expense ratios reflect operating expenses of the class. Expenses before reductions do not reflect amounts reimbursed by the investment adviser or reductions from brokerage service arrangements or reductions from other expense offset arrangements and do not represent the amount paid by the class during periods when reimbursements or reductions occur. Expense ratios before reductions for start-up periods may not be representative of longer-term operating periods. Expenses net of fee waivers reflect expenses after reimbursement by the investment adviser but prior to reductions from brokerage service arrangements or other expense offset arrangements. Expenses net of all reductions represent the net expenses paid by the class.
G Annualized
H Amount does not include the portfolio activity of any underlying Fidelity Central Funds.
I Portfolio turnover rate excludes securities received or delivered in-kind.
J The portfolio turnover rate does not include the assets acquired in the merger.
See accompanying notes which are an integral part of the financial statements.
Fidelity Advisor Strategic Income Fund Class I
| Years ended December 31, | 2019 | 2018 | 2017 | 2016 | 2015 |
| Selected Per–Share Data | | | | | |
| Net asset value, beginning of period | $11.72 | $12.49 | $12.05 | $11.47 | $12.09 |
| Income from Investment Operations | | | | | |
| Net investment income (loss)A | .449 | .458 | .432 | .463 | .452 |
| Net realized and unrealized gain (loss) | .827 | (.789) | .528 | .535 | (.650) |
| Total from investment operations | 1.276 | (.331) | .960 | .998 | (.198) |
| Distributions from net investment income | (.426) | (.427) | (.417) | (.418) | (.332) |
| Distributions from net realized gain | (.110) | (.012) | (.103) | – | (.007) |
| Tax return of capital | – | – | – | – | (.083) |
| Total distributions | (.536) | (.439) | (.520) | (.418) | (.422) |
| Net asset value, end of period | $12.46 | $11.72 | $12.49 | $12.05 | $11.47 |
| Total ReturnB | 11.00% | (2.71)% | 8.06% | 8.80% | (1.73)% |
| Ratios to Average Net AssetsC,D | | | | | |
| Expenses before reductions | .72% | .73% | .75% | .76% | .78% |
| Expenses net of fee waivers, if any | .72% | .73% | .74% | .76% | .78% |
| Expenses net of all reductions | .72% | .73% | .74% | .76% | .78% |
| Net investment income (loss) | 3.64% | 3.76% | 3.49% | 3.89% | 3.77% |
| Supplemental Data | | | | | |
| Net assets, end of period (in millions) | $4,899 | $4,831 | $5,039 | $2,827 | $2,640 |
| Portfolio turnover rateE | 138%F | 113%G | 123% | 76% | 88% |
A Calculated based on average shares outstanding during the period.
B Total returns would have been lower if certain expenses had not been reduced during the applicable periods shown.
C Fees and expenses of any underlying Fidelity Central Funds are not included in the Fund's expense ratio. The Fund indirectly bears its proportionate share of the expenses of any underlying Fidelity Central Funds. Based on their most recent shareholder report date, the expenses of any underlying non-money market Fidelity Central Funds were less than .005%.
D Expense ratios reflect operating expenses of the class. Expenses before reductions do not reflect amounts reimbursed by the investment adviser or reductions from brokerage service arrangements or reductions from other expense offset arrangements and do not represent the amount paid by the class during periods when reimbursements or reductions occur. Expenses net of fee waivers reflect expenses after reimbursement by the investment adviser but prior to reductions from brokerage service arrangements or other expense offset arrangements. Expenses net of all reductions represent the net expenses paid by the class.
E Amount does not include the portfolio activity of any underlying Fidelity Central Funds.
F Portfolio turnover rate excludes securities received or delivered in-kind.
G The portfolio turnover rate does not include the assets acquired in the merger.
See accompanying notes which are an integral part of the financial statements.
Fidelity Advisor Strategic Income Fund Class Z
| Years ended December 31, | 2019 | 2018 A |
| Selected Per–Share Data | | |
| Net asset value, beginning of period | $11.72 | $12.17 |
| Income from Investment Operations | | |
| Net investment income (loss)B | .461 | .119 |
| Net realized and unrealized gain (loss) | .837 | (.437) |
| Total from investment operations | 1.298 | (.318) |
| Distributions from net investment income | (.438) | (.132) |
| Distributions from net realized gain | (.110) | – |
| Total distributions | (.548) | (.132) |
| Net asset value, end of period | $12.47 | $11.72 |
| Total ReturnC,D | 11.19% | (2.62)% |
| Ratios to Average Net AssetsE,F | | |
| Expenses before reductions | .62% | .62%G |
| Expenses net of fee waivers, if any | .62% | .62%G |
| Expenses net of all reductions | .62% | .62%G |
| Net investment income (loss) | 3.74% | 3.95%G |
| Supplemental Data | | |
| Net assets, end of period (in millions) | $587 | $166 |
| Portfolio turnover rateH | 138%I | 113%J |
A For the period October 2, 2018 (commencement of sale of shares) to December 31, 2018.
B Calculated based on average shares outstanding during the period.
C Total returns for periods of less than one year are not annualized.
D Total returns would have been lower if certain expenses had not been reduced during the applicable periods shown.
E Fees and expenses of any underlying Fidelity Central Funds are not included in the Fund's expense ratio. The Fund indirectly bears its proportionate share of the expenses of any underlying Fidelity Central Funds. Based on their most recent shareholder report date, the expenses of any underlying non-money market Fidelity Central Funds were less than .005%.
F Expense ratios reflect operating expenses of the class. Expenses before reductions do not reflect amounts reimbursed by the investment adviser or reductions from brokerage service arrangements or reductions from other expense offset arrangements and do not represent the amount paid by the class during periods when reimbursements or reductions occur. Expense ratios before reductions for start-up periods may not be representative of longer-term operating periods. Expenses net of fee waivers reflect expenses after reimbursement by the investment adviser but prior to reductions from brokerage service arrangements or other expense offset arrangements. Expenses net of all reductions represent the net expenses paid by the class.
G Annualized
H Amount does not include the portfolio activity of any underlying Fidelity Central Funds.
I Portfolio turnover rate excludes securities received or delivered in-kind.
J The portfolio turnover rate does not include the assets acquired in the merger.
See accompanying notes which are an integral part of the financial statements.
Notes to Financial Statements
For the period ended December 31, 2019
(Amounts in thousands except percentages)
1. Organization.
Fidelity Advisor Strategic Income Fund (the Fund) is a fund of Fidelity Advisor Series II (the Trust) and is authorized to issue an unlimited number of shares. The Trust is registered under the Investment Company Act of 1940, as amended (the 1940 Act), as an open-end management investment company organized as a Massachusetts business trust. The Fund offers Class A, Class M, Class C, Fidelity Strategic Income Fund, Class I and Class Z shares, each of which has equal rights as to assets and voting privileges. Each class has exclusive voting rights with respect to matters that affect that class. Effective March 1, 2019, Class C shares will automatically convert to Class A shares after a holding period of ten years from the initial date of purchase, with certain exceptions. The Fund's investments in emerging markets can be subject to social, economic, regulatory, and political uncertainties and can be extremely volatile.
2. Investments in Fidelity Central Funds.
The Fund invests in Fidelity Central Funds, which are open-end investment companies generally available only to other investment companies and accounts managed by the investment adviser and its affiliates. The Fund's Schedule of Investments lists each of the Fidelity Central Funds held as of period end, if any, as an investment of the Fund, but does not include the underlying holdings of each Fidelity Central Fund. As an Investing Fund, the Fund indirectly bears its proportionate share of the expenses of the underlying Fidelity Central Funds.
Based on its investment objective, each Fidelity Central Fund may invest or participate in various investment vehicles or strategies that are similar to those of the Fund. These strategies are consistent with the investment objectives of the Fund and may involve certain economic risks which may cause a decline in value of each of the Fidelity Central Funds and thus a decline in the value of the Fund. The Money Market Central Funds seek preservation of capital and current income and are managed by Fidelity Investments Money Management, Inc. (FIMM), an affiliate of the investment adviser. Annualized expenses of the Money Market Central Funds as of their most recent shareholder report date ranged from less than .005% to .01%. The following summarizes the Fund's investment in each non-money market Fidelity Central Fund.
| Fidelity Central Fund | Investment Manager | Investment Objective | Investment Practices | Expense Ratio(a) |
| Fidelity Emerging Markets Debt Central Fund | FMR Co., Inc. (FMRC) | Seeks high total return by normally investing in debt securities of issuers in emerging markets and other debt investments that are tied economically to emerging markets. | Foreign Securities
Restricted Securities
| Less than .005% |
| Fidelity Floating Rate Central Fund | FMRC | Seeks a high level of income by normally investing in floating rate loans and other floating rate securities. | Loans & Direct Debt Instruments
Restricted Securities
| Less than .005% |
(a) Expenses expressed as a percentage of average net assets and are as of each underlying Central Fund's most recent annual or semi-annual shareholder report.
An unaudited holdings listing for the Fund, which presents direct holdings as well as the pro-rata share of any securities and other investments held indirectly through its investment in underlying non-money market Fidelity Central Funds, is available at fidelity.com and/or institutional.fidelity.com, as applicable. A complete unaudited list of holdings for each Fidelity Central Fund is available upon request or at the Securities and Exchange Commission (the SEC) website at www.sec.gov. In addition, the financial statements of the Fidelity Central Funds which contain the significant accounting policies (including investment valuation policies) of those funds, which are not covered by the Fund's Report of Independent Registered Public Accounting Firm, are available on the SEC website or upon request.
3. Significant Accounting Policies.
The Fund is an investment company and applies the accounting and reporting guidance of the Financial Accounting Standards Board (FASB) Accounting Standards Codification Topic 946 Financial Services – Investments Companies. The financial statements have been prepared in conformity with accounting principles generally accepted in the United States of America (GAAP), which require management to make certain estimates and assumptions at the date of the financial statements. Actual results could differ from those estimates. Subsequent events, if any, through the date that the financial statements were issued have been evaluated in the preparation of the financial statements. The following summarizes the significant accounting policies of the Fund:
Investment Valuation. Investments are valued as of 4:00 p.m. Eastern time on the last calendar day of the period. The Board of Trustees (the Board) has delegated the day to day responsibility for the valuation of the Fund's investments to the Fair Value Committee (the Committee) established by the Fund's investment adviser. In accordance with valuation policies and procedures approved by the Board, the Fund attempts to obtain prices from one or more third party pricing vendors or brokers to value its investments. When current market prices, quotations or currency exchange rates are not readily available or reliable, investments will be fair valued in good faith by the Committee, in accordance with procedures adopted by the Board. Factors used in determining fair value vary by investment type and may include market or investment specific events, changes in interest rates and credit quality. The frequency with which these procedures are used cannot be predicted and they may be utilized to a significant extent. The Committee oversees the Fund's valuation policies and procedures and reports to the Board on the Committee's activities and fair value determinations. The Board monitors the appropriateness of the procedures used in valuing the Fund's investments and ratifies the fair value determinations of the Committee.
The Fund categorizes the inputs to valuation techniques used to value its investments into a disclosure hierarchy consisting of three levels as shown below:
- Level 1 – quoted prices in active markets for identical investments
- Level 2 – other significant observable inputs (including quoted prices for similar investments, interest rates, prepayment speeds, etc.)
- Level 3 – unobservable inputs (including the Fund's own assumptions based on the best information available)
Valuation techniques used to value the Fund's investments by major category are as follows:
Debt securities, including restricted securities, are valued based on evaluated prices received from third party pricing vendors or from brokers who make markets in such securities. Corporate bonds, bank loan obligations, foreign government and government agency obligations, preferred securities, supranational obligations and U.S. government and government agency obligations are valued by pricing vendors who utilize matrix pricing which considers yield or price of bonds of comparable quality, coupon, maturity and type or by broker-supplied prices. Asset backed securities, collateralized mortgage obligations, commercial mortgage securities and U.S. government agency mortgage securities are valued by pricing vendors who utilize matrix pricing which considers prepayment speed assumptions, attributes of the collateral, yield or price of bonds of comparable quality, coupon, maturity and type or by broker-supplied prices. Swaps are marked-to-market daily based on valuations from third party pricing vendors, registered derivatives clearing organizations (clearinghouses) or broker-supplied valuations. These pricing sources may utilize inputs such as interest rate curves, credit spread curves, default possibilities and recovery rates. When independent prices are unavailable or unreliable, debt securities and swaps may be valued utilizing pricing methodologies which consider similar factors that would be used by third party pricing vendors. For foreign debt securities, when significant market or security specific events arise, valuations may be determined in good faith in accordance with procedures adopted by the Board. Debt securities and swaps are generally categorized as Level 2 in the hierarchy but may be Level 3 depending on the circumstances. The Fund invests a significant portion of its assets in below investment grade securities. The value of these securities can be more volatile due to changes in the credit quality of the issuer and is sensitive to changes in economic, market and regulatory conditions.
Equity securities, including restricted securities, for which market quotations are readily available, are valued at the last reported sale price or official closing price as reported by a third party pricing vendor on the primary market or exchange on which they are traded and are categorized as Level 1 in the hierarchy. In the event there were no sales during the day or closing prices are not available, securities are valued at the last quoted bid price or may be valued using the last available price and are generally categorized as Level 2 in the hierarchy. For foreign equity securities, when market or security specific events arise, comparisons to the valuation of American Depositary Receipts (ADRs), futures contracts, Exchange-Traded Funds (ETFs) and certain indexes as well as quoted prices for similar securities may be used and would be categorized as Level 2 in the hierarchy. For equity securities, including restricted securities, where observable inputs are limited, assumptions about market activity and risk are used and these securities may be categorized as Level 3 in the hierarchy.
The U.S. dollar value of foreign currency contracts is determined using currency exchange rates supplied by a pricing service and are categorized as Level 2 in the hierarchy. Futures contracts are valued at the settlement price established each day by the board of trade or exchange on which they are traded and are categorized as Level 1 in the hierarchy. Options traded over-the-counter are valued using vendor or broker-supplied valuations and are categorized as Level 2 in the hierarchy. Investments in open-end mutual funds, including the Fidelity Central Funds, are valued at their closing net asset value (NAV) each business day and are categorized as Level 1 in the hierarchy.
Changes in valuation techniques may result in transfers in or out of an assigned level within the disclosure hierarchy. The aggregate value of investments by input level as of December 31, 2019 is included at the end of the Fund's Schedule of Investments.
Foreign Currency. Foreign-denominated assets, including investment securities, and liabilities are translated into U.S. dollars at the exchange rates at period end. Purchases and sales of investment securities, income and dividends received and expenses denominated in foreign currencies are translated into U.S. dollars at the exchange rate in effect on the transaction date.
The effects of exchange rate fluctuations on investments are included with the net realized and unrealized gain (loss) on investment securities. Other foreign currency transactions resulting in realized and unrealized gain (loss) are disclosed separately.
Realized gains and losses on foreign currency transactions arise from the disposition of foreign currency, realized changes in the value of foreign currency between the trade and settlement dates on security transactions, and the difference between the amounts of dividends, interest and foreign withholding taxes recorded on transaction date and the U.S. dollar equivalent of the amounts actually received or paid. Unrealized gains and losses on assets and liabilities in foreign currencies arise from changes in the value of foreign currency, and from assets and liabilities denominated in foreign currencies, other than investments, which are held at period end.
Investment Transactions and Income. For financial reporting purposes, the Fund's investment holdings and NAV include trades executed through the end of the last business day of the period. The NAV per share for processing shareholder transactions is calculated as of the close of business of the New York Stock Exchange (NYSE), normally 4:00 p.m. Eastern time and includes trades executed through the end of the prior business day. Gains and losses on securities sold are determined on the basis of identified cost and include proceeds received from litigation. Dividend income is recorded on the ex-dividend date, except for certain dividends from foreign securities where the ex-dividend date may have passed, which are recorded as soon as the Fund is informed of the ex-dividend date. Non-cash dividends included in dividend income, if any, are recorded at the fair market value of the securities received. Income and capital gain distributions from Fidelity Central Funds, if any, are recorded on the ex-dividend date. Certain distributions received by the Fund represent a return of capital or capital gain. The Fund determines the components of these distributions subsequent to the ex-dividend date, based upon receipt of tax filings or other correspondence relating to the underlying investment. These distributions are recorded as a reduction of cost of investments and/or as a realized gain. Interest income is accrued as earned and includes coupon interest and amortization of premium and accretion of discount on debt securities as applicable. Paid in Kind (PIK) income is recorded at the fair market value of the securities received. Investment income is recorded net of foreign taxes withheld where recovery of such taxes is uncertain. Debt obligations may be placed on non-accrual status and related interest income may be reduced by ceasing current accruals and writing off interest receivables when the collection of all or a portion of interest has become doubtful based on consistently applied procedures. A debt obligation is removed from non-accrual status when the issuer resumes interest payments or when collectability of interest is reasonably assured.
Class Allocations and Expenses. Investment income, realized and unrealized capital gains and losses, common expenses of the Fund, and certain fund-level expense reductions, if any, are allocated daily on a pro-rata basis to each class based on the relative net assets of each class to the total net assets of the Fund. Each class differs with respect to transfer agent and distribution and service plan fees incurred. Certain expense reductions may also differ by class. For the reporting period, the allocated portion of income and expenses to each class as a percent of its average net assets may vary due to the timing of recording these transactions in relation to fluctuating net assets of the classes. Expenses directly attributable to a fund are charged to that fund. Expenses attributable to more than one fund are allocated among the respective funds on the basis of relative net assets or other appropriate methods. Expense estimates are accrued in the period to which they relate and adjustments are made when actual amounts are known.
Income Tax Information and Distributions to Shareholders. Each year, the Fund intends to qualify as a regulated investment company under Subchapter M of the Internal Revenue Code, including distributing substantially all of its taxable income and realized gains. As a result, no provision for U.S. Federal income taxes is required. As of December 31, 2019, the Fund did not have any unrecognized tax benefits in the financial statements; nor is the Fund aware of any tax positions for which it is reasonably possible that the total amounts of unrecognized tax benefits will significantly change in the next twelve months. The Fund files a U.S. federal tax return, in addition to state and local tax returns as required. The Fund's federal income tax returns are subject to examination by the Internal Revenue Service (IRS) for a period of three fiscal years after they are filed. State and local tax returns may be subject to examination for an additional fiscal year depending on the jurisdiction. Foreign taxes are provided for based on the Fund's understanding of the tax rules and rates that exist in the foreign markets in which it invests.
Distributions are declared and recorded daily and paid monthly from net investment income. Distributions from realized gains, if any, are declared and recorded on the ex-dividend date. Income and capital gain distributions are declared separately for each class. Income and capital gain distributions are determined in accordance with income tax regulations, which may differ from GAAP. In addition, the Fund claimed a portion of the payment made to redeeming shareholders as a distribution for income tax purposes.
Capital accounts within the financial statements are adjusted for permanent book-tax differences. These adjustments have no impact on net assets or the results of operations. Capital accounts are not adjusted for temporary book-tax differences which will reverse in a subsequent period.
Book-tax differences are primarily due to defaulted bonds, futures contracts, swaps, foreign currency transactions, market discount, partnerships, capital loss carryforwards and losses deferred due to futures contracts, wash sales and excise tax regulations.
As of period end, the cost and unrealized appreciation (depreciation) in securities, and derivatives if applicable, for federal income tax purposes were as follows:
| Gross unrealized appreciation | $826,593 |
| Gross unrealized depreciation | (271,359) |
| Net unrealized appreciation (depreciation) | $555,234 |
| Tax Cost | $16,465,547 |
The tax-based components of distributable earnings as of period end were as follows:
| Undistributed ordinary income | $- |
| Undistributed long-term capital gain | $11,800 |
| Net unrealized appreciation (depreciation) on securities and other investments | $549,953 |
The Fund intends to elect to defer to its next fiscal year $5,563 of capital losses recognized during the period November 1, 2019 to December 31, 2019. The Fund intends to elect to defer to its next fiscal year $949 of ordinary losses recognized during the period November 1, 2019 to December 31, 2019.
The tax character of distributions paid was as follows:
| | December 31, 2019 | December 31, 2018 |
| Ordinary Income | $619,636 | $ 525,355 |
| Long-term Capital Gains | 98,780 | – |
| Total | $718,416 | $ 525,355 |
Delayed Delivery Transactions and When-Issued Securities. During the period, the Fund transacted in securities on a delayed delivery or when-issued basis. Payment and delivery may take place after the customary settlement period for that security. The price of the underlying securities and the date when the securities will be delivered and paid for are fixed at the time the transaction is negotiated. The securities purchased on a delayed delivery or when-issued basis are identified as such in the Fund's Schedule of Investments. The Fund may receive compensation for interest forgone in the purchase of a delayed delivery or when-issued security. With respect to purchase commitments, the Fund identifies securities as segregated in its records with a value at least equal to the amount of the commitment. Losses may arise due to changes in the value of the underlying securities or if the counterparty does not perform under the contract's terms, or if the issuer does not issue the securities due to political, economic, or other factors.
To-Be-Announced (TBA) Securities and Mortgage Dollar Rolls. During the period, the Fund transacted in TBA securities that involved buying or selling mortgage-backed securities (MBS) on a forward commitment basis. A TBA transaction typically does not designate the actual security to be delivered and only includes an approximate principal amount; however delivered securities must meet specified terms defined by industry guidelines, including issuer, rate and current principal amount outstanding on underlying mortgage pools. The Fund may enter into a TBA transaction with the intent to take possession of or deliver the underlying MBS, or the Fund may elect to extend the settlement by entering into either a mortgage or reverse mortgage dollar roll. Mortgage dollar rolls are transactions where a fund sells TBA securities and simultaneously agrees to repurchase MBS on a later date at a lower price and with the same counterparty. Reverse mortgage dollar rolls involve the purchase and simultaneous agreement to sell TBA securities on a later date at a lower price. Transactions in mortgage dollar rolls and reverse mortgage dollar rolls are accounted for as purchases and sales and may result in an increase to the Fund's portfolio turnover rate.
Purchases and sales of TBA securities involve risks similar to those discussed above for delayed delivery and when-issued securities. Also, if the counterparty in a mortgage dollar roll or a reverse mortgage dollar roll transaction files for bankruptcy or becomes insolvent, the Fund's right to repurchase or sell securities may be limited. Additionally, when a fund sells TBA securities without already owning or having the right to obtain the deliverable securities (an uncovered forward commitment to sell), it incurs a risk of loss because it could have to purchase the securities at a price that is higher than the price at which it sold them. A fund may be unable to purchase the deliverable securities if the corresponding market is illiquid.
TBA securities subject to a forward commitment to sell at period end are included at the end of the Fund's Schedule of Investments under the caption "TBA Sale Commitments." The proceeds and value of these commitments are reflected in the Fund's Statement of Assets and Liabilities as Receivable for TBA sale commitments and TBA sale commitments, at value, respectively.
Restricted Securities. The Fund may invest in securities that are subject to legal or contractual restrictions on resale. These securities generally may be resold in transactions exempt from registration or to the public if the securities are registered. Disposal of these securities may involve time-consuming negotiations and expense, and prompt sale at an acceptable price may be difficult. Information regarding restricted securities is included at the end of the Fund's Schedule of Investments.
Loans and Other Direct Debt Instruments. The Fund invests in direct debt instruments which are interests in amounts owed to lenders by corporate or other borrowers. These instruments may be in the form of loans, trade claims or other receivables and may include standby financing commitments such as revolving credit facilities that obligate the Fund to supply additional cash to the borrower on demand. Loans may be acquired through assignment or participation. The Fund also invests in unfunded loan commitments, which are contractual obligations for future funding. Information regarding unfunded commitments is included at the end of the Fund's Schedule of Investments.
4. Derivative Instruments.
Risk Exposures and the Use of Derivative Instruments. The Fund's investment objective allows the Fund to enter into various types of derivative contracts, including futures contracts, forward foreign currency contracts, options and swaps. Derivatives are investments whose value is primarily derived from underlying assets, indices or reference rates and may be transacted on an exchange or over-the-counter (OTC). Derivatives may involve a future commitment to buy or sell a specified asset based on specified terms, to exchange future cash flows at periodic intervals based on a notional principal amount, or for one party to make one or more payments upon the occurrence of specified events in exchange for periodic payments from the other party.
The Fund used derivatives to increase returns, to gain exposure to certain types of assets, to facilitate transactions in foreign-denominated securities, and to manage exposure to certain risks as defined below. The success of any strategy involving derivatives depends on analysis of numerous economic factors, and if the strategies for investment do not work as intended, the Fund may not achieve its objectives.
The Fund's use of derivatives increased or decreased its exposure to the following risk:
| Foreign Exchange Risk | Foreign exchange rate risk relates to fluctuations in the value of an asset or liability due to changes in currency exchange rates. |
| Interest Rate Risk | Interest rate risk relates to the fluctuations in the value of interest-bearing securities due to changes in the prevailing levels of market interest rates. |
The Fund is also exposed to additional risks from investing in derivatives, such as liquidity risk and counterparty credit risk. Liquidity risk is the risk that the Fund will be unable to close out the derivative in the open market in a timely manner. Counterparty credit risk is the risk that the counterparty will not be able to fulfill its obligation to the Fund. Derivative counterparty credit risk is managed through formal evaluation of the creditworthiness of all potential counterparties. On certain OTC derivatives such as forward foreign currency contracts and options the Fund attempts to reduce its exposure to counterparty credit risk by entering into an International Swaps and Derivatives Association, Inc. (ISDA) Master Agreement with each of its counterparties. The ISDA Master Agreement gives the Fund the right to terminate all transactions traded under such agreement upon the deterioration in the credit quality of the counterparty beyond specified levels. The ISDA Master Agreement gives each party the right, upon an event of default by the other party or a termination of the agreement, to close out all transactions traded under such agreement and to net amounts owed under each transaction to one net payable by one party to the other. To mitigate counterparty credit risk on bi-lateral OTC derivatives, the Fund receives collateral in the form of cash or securities once the Fund's net unrealized appreciation on outstanding derivative contracts under an ISDA Master Agreement exceeds certain applicable thresholds, subject to certain minimum transfer provisions. The collateral received is held in segregated accounts with the Fund's custodian bank in accordance with the collateral agreements entered into between the Fund, the counterparty and the Fund's custodian bank. The Fund could experience delays and costs in gaining access to the collateral even though it is held by the Fund's custodian bank. The Fund's maximum risk of loss from counterparty credit risk related to bi-lateral OTC derivatives is generally the aggregate unrealized appreciation and unpaid counterparty payments in excess of any collateral pledged by the counterparty to the Fund. For OTC written options with upfront premiums received, the Fund is obligated to perform and therefore does not have counterparty risk. For OTC written options with premiums to be received at a future date, the maximum risk of loss from counterparty credit risk is the amount of the premium in excess of any collateral pledged by the counterparty. The Fund may be required to pledge collateral for the benefit of the counterparties on bi-lateral OTC derivatives in an amount not less than each counterparty's unrealized appreciation on outstanding derivative contracts, subject to certain minimum transfer provisions, and any such pledged collateral is identified in the Schedule of Investments. Exchange-traded futures contracts are not covered by the ISDA Master Agreement; however counterparty credit risk related to exchange-traded futures contracts may be mitigated by the protection provided by the exchange on which they trade. Counterparty credit risk related to centrally cleared OTC swaps may be mitigated by the protection provided by the clearinghouse.
Investing in derivatives may involve greater risks than investing in the underlying assets directly and, to varying degrees, may involve risk of loss in excess of any initial investment and collateral received and amounts recognized in the Statement of Assets and Liabilities. In addition, there may be the risk that the change in value of the derivative contract does not correspond to the change in value of the underlying instrument.
Net Realized Gain (Loss) and Change in Net Unrealized Appreciation (Depreciation) on Derivatives. The table below, which reflects the impacts of derivatives on the financial performance of the Fund, summarizes the net realized gain (loss) and change in net unrealized appreciation (depreciation) for derivatives during the period as presented in the Statement of Operations.
| Primary Risk Exposure / Derivative Type | Net Realized Gain (Loss) | Change in Net Unrealized Appreciation (Depreciation) |
| Foreign Exchange Risk | | |
| Forward Foreign Currency Contracts | $(1,369) | $(10,309) |
| Total Foreign Exchange Risk | (1,369) | (10,309) |
| Interest Rate Risk | | |
| Futures Contracts | 56,724 | (23,549) |
| Purchased Options | 275 | 1,545 |
| Written Options | (1,845) | 159 |
| Swaps | (1,492) | 1,242 |
| Total Interest Rate Risk | $53,662 | $(20,603) |
| Totals | $52,293 | $(30,912) |
A summary of the value of derivatives by primary risk exposure as of period end, if any, is included at the end of the Schedule of Investments.
Forward Foreign Currency Contracts. Forward foreign currency contracts represent obligations to purchase or sell foreign currency on a specified future date at a price fixed at the time the contracts are entered into. The Fund used forward foreign currency contracts to facilitate transactions in foreign-denominated securities and to manage exposure to certain foreign currencies.
Forward foreign currency contracts are valued daily and fluctuations in exchange rates on open contracts are recorded as unrealized appreciation or (depreciation) and reflected in the Statement of Assets and Liabilities. When the contract is closed, the Fund realizes a gain or loss equal to the difference between the closing value and the value at the time it was opened. Non-deliverable forward foreign currency exchange contracts are settled with the counterparty in cash without the delivery of foreign currency. The net realized gain (loss) and change in net unrealized appreciation (depreciation) on forward foreign currency contracts during the period is presented in the Statement of Operations.
Any open forward foreign currency contracts at period end are presented in the Schedule of Investments under the caption "Forward Foreign Currency Contracts." The contract amount and unrealized appreciation (depreciation) reflects each contract's exposure to the underlying currency at period end and is representative of volume of activity during the period.
Futures Contracts. A futures contract is an agreement between two parties to buy or sell a specified underlying instrument for a fixed price at a specified future date. The Fund used futures contracts to manage its exposure to the bond market and fluctuations in interest rates.
Upon entering into a futures contract, a fund is required to deposit either cash or securities (initial margin) with a clearing broker in an amount equal to a certain percentage of the face value of the contract. Futures contracts are marked-to-market daily and subsequent daily payments (variation margin) are made or received by a fund depending on the daily fluctuations in the value of the futures contracts and are recorded as unrealized appreciation or (depreciation). This receivable and/or payable, if any, is included in daily variation margin on futures contracts in the Statement of Assets and Liabilities. Realized gain or (loss) is recorded upon the expiration or closing of a futures contract. The net realized gain (loss) and change in net unrealized appreciation (depreciation) on futures contracts during the period is presented in the Statement of Operations.
Any open futures contracts at period end are presented in the Schedule of Investments under the caption "Futures Contracts". The notional amount at value reflects each contract's exposure to the underlying instrument or index at period end and is representative of volume of activity during the period. Securities deposited to meet initial margin requirements are identified in the Schedule of Investments.
Options. Options give the purchaser the right, but not the obligation, to buy (call) or sell (put) an underlying security or financial instrument at an agreed exercise or strike price between or on certain dates. Options obligate the seller (writer) to buy (put) or sell (call) an underlying instrument at the exercise or strike price or cash settle an underlying derivative instrument if the holder exercises the option on or before the expiration date. The Fund uses OTC options, such as swaptions, which are options where the underlying instrument is a swap, to manage its exposure to fluctuations in interest rates.
Upon entering into an options contract, a fund will pay or receive a premium. Premiums paid on purchased options are reflected as cost of investments and premiums received on written options are reflected as a liability on the Statement of Assets and Liabilities. Certain options may be purchased or written with premiums to be paid or received on a future date. Options are valued daily and any unrealized appreciation (depreciation) is reflected on the Statement of Assets and Liabilities. When an option is exercised, the cost or proceeds of the underlying instrument purchased or sold is adjusted by the amount of the premium. When an option is closed the Fund will realize a gain or loss depending on whether the proceeds or amount paid for the closing sale transaction is greater or less than the premium received or paid. When an option expires, gains and losses are realized to the extent of premiums received and paid, respectively. The net realized and unrealized gains (losses) on purchased options are included in the Statement of Operations in net realized gain (loss) and change in net unrealized appreciation (depreciation) on investment securities. The net realized gain (loss) and change in net unrealized appreciation (depreciation) on written options are presented in the Statement of Operations.
Any open options at period end are presented in the Schedule of Investments under the captions "Purchased Options," "Purchased Swaptions," "Written Options" and "Written Swaptions," as applicable, and are representative of volume of activity during the period.
Writing puts and buying calls tend to increase exposure to the underlying instrument while buying puts and writing calls tend to decrease exposure to the underlying instrument. For purchased options, risk of loss is limited to the premium paid, and for written options, risk of loss is the change in value in excess of the premium received.
Swaps. A swap is a contract between two parties to exchange future cash flows at periodic intervals based on a notional principal amount. A centrally cleared OTC swap is a transaction executed between a fund and a dealer counterparty, then cleared by a futures commission merchant (FCM) through a clearinghouse. Once cleared, the clearinghouse serves as a central counterparty, with whom a fund exchanges cash flows for the life of the transaction, similar to transactions in futures contracts.
Centrally cleared OTC swaps require a fund to deposit either cash or securities (initial margin) with the FCM, at the instruction of and for the benefit of the clearinghouse. Securities deposited to meet initial margin requirements are identified in the Schedule of Investments. Centrally cleared OTC swaps are marked-to-market daily and subsequent payments (variation margin) are made or received depending on the daily fluctuations in the value of the swaps and are recorded as unrealized appreciation or (depreciation). These daily payments, if any, are included in receivable or payable for daily variation margin on centrally cleared OTC swaps in the Statement of Assets and Liabilities. Any premiums for centrally cleared OTC swaps are recorded periodically throughout the term of the swap to variation margin and included in unrealized appreciation (depreciation) in the Statement of Assets and Liabilities. Any premiums are recognized as realized gain (loss) upon termination or maturity of the swap.
Payments are exchanged at specified intervals, accrued daily commencing with the effective date of the contract and recorded as realized gain or (loss). Some swaps may be terminated prior to the effective date and realize a gain or loss upon termination. The net realized gain (loss) and change in net unrealized appreciation (depreciation) on swaps during the period is presented in the Statement of Operations.
Any open swaps at period end are included in the Schedule of Investments under the caption "Swaps" and are representative of volume of activity during the period.
Interest Rate Swaps. Interest rate swaps are agreements between counterparties to exchange cash flows, one based on a fixed rate, and the other on a floating rate. The Fund entered into interest rate swaps to manage its exposure to interest rate changes. Changes in interest rates can have an effect on both the value of bond holdings as well as the amount of interest income earned. In general, the value of bonds can fall when interest rates rise and can rise when interest rates fall.
5. Purchases and Sales of Investments.
Purchases and sales of securities (including the Fixed-Income Central Funds), other than short-term securities, in-kind transactions and U.S. government securities, aggregated $10,233,828 and $10,454,510, respectively.
6. Fees and Other Transactions with Affiliates.
Management Fee. Fidelity Management & Research Company (the investment adviser) and its affiliates provide the Fund with investment management related services for which the Fund pays a monthly management fee. The management fee is the sum of an individual fund fee rate that is based on an annual rate of .45% of the Fund's average net assets and an annualized group fee rate that averaged .10% during the period. The group fee rate is based upon the average net assets of all the mutual funds advised by the investment adviser, including any mutual funds previously advised by the investment adviser that are currently advised by Fidelity SelectCo, LLC, an affiliate of the investment adviser. The group fee rate decreases as assets under management increase and increases as assets under management decrease. For the reporting period, the total annual management fee rate was .55% of the Fund's average net assets.
Distribution and Service Plan Fees. In accordance with Rule 12b-1 of the 1940 Act, the Fund has adopted separate Distribution and Service Plans for each class of shares. Certain classes pay Fidelity Distributors Corporation (FDC), an affiliate of the investment adviser, separate Distribution and Service Fees, each of which is based on an annual percentage of each class' average net assets. In addition, FDC may pay financial intermediaries for selling shares of the Fund and providing shareholder support services. For the period, the Distribution and Service Fee rates, total fees and amounts retained by FDC were as follows:
| | Distribution Fee | Service Fee | Total Fees | Retained by FDC |
| Class A | -% | .25% | $4,615 | $73 |
| Class M | -% | .25% | 1,980 | 17 |
| Class C | .75% | .25% | 7,899 | 572 |
| | | | $14,494 | $662 |
Sales Load. FDC may receive a front-end sales charge of up to 4.00% for selling Class A shares and Class M shares, some of which is paid to financial intermediaries for selling shares of the Fund. Depending on the holding period, FDC may receive contingent deferred sales charges levied on Class A, Class M and Class C redemptions. The deferred sales charges are 1.00% for Class C shares, 1.00% for certain purchases of Class A shares and .25% for certain purchases of Class M shares.
For the period, sales charge amounts retained by FDC were as follows:
| | Retained by FDC |
| Class A | $170 |
| Class M | 29 |
| Class C(a) | 40 |
| | $239 |
(a) When Class C shares are initially sold, FDC pays commissions from its own resources to financial intermediaries through which the sales are made.
Transfer Agent Fees. Fidelity Investments Institutional Operations Company, Inc., (FIIOC), an affiliate of the investment adviser, is the transfer, dividend disbursing and shareholder servicing agent for each class of the Fund. FIIOC receives account fees and asset-based fees that vary according to the account size and type of account of the shareholders of the respective classes of the Fund, except for Class Z. FIIOC receives an asset-based fee of Class Z's average net assets. FIIOC pays for typesetting, printing and mailing of shareholder reports, except proxy statements.
For the period, transfer agent fees for each class were as follows:
| | Amount | % of Class-Level Average Net Assets |
| Class A | $2,904 | .16 |
| Class M | 1,200 | .15 |
| Class C | 1,214 | .15 |
| Fidelity Strategic Income Fund | 8,794 | .11 |
| Class I | 7,312 | .15 |
| Class Z | 205 | .05 |
| | $21,629 | |
Accounting and Security Lending Fees. Fidelity Service Company, Inc. (FSC), an affiliate of the investment adviser, maintains the Fund's accounting records. The accounting fee is based on the level of average net assets for each month. Prior to April 1, 2019, FSC had a separate agreement with the Fund for administration of the security lending program, based on the number and duration of lending transactions. For the period, the total fees paid for accounting and administration of securities lending were equivalent to the following annual rates:
| | % of Average Net Assets |
| Fidelity Advisor Strategic Income Fund | .01 |
Brokerage Commissions. A portion of portfolio transactions were placed with brokerage firms which are affiliates of the investment adviser. Brokerage commissions are included in net realized gain (loss) and change in net unrealized appreciation (depreciation) in the Statement of Operations. The commissions paid to these affiliated firms were as follows:
| | Amount |
| Fidelity Advisor Strategic Income Fund | $11 |
Interfund Trades. The Fund may purchase from or sell securities to other Fidelity Funds under procedures adopted by the Board. The procedures have been designed to ensure these interfund trades are executed in accordance with Rule 17a-7 of the 1940 Act. Interfund trades are included within the respective purchases and sales amounts shown in the Purchases and Sales of Investments note.
Other. During the period, the investment adviser reimbursed the Fund for certain losses in the amount of $189.
Affiliated Exchanges In-Kind. During the period, the Fund completed an exchange in-kind with Fidelity Emerging Markets Debt Central Fund. The Fund delivered investments, including accrued interest, valued at $ 2,529,799, (which included $23,124 of unrealized depreciation), in exchange for 268,001 shares of the Central Fund. The Fund generally did not recognize gain or loss for federal income tax purposes.
7. Committed Line of Credit.
The Fund participates with other funds managed by the investment adviser or an affiliate in a $4.25 billion credit facility (the "line of credit") to be utilized for temporary or emergency purposes to fund shareholder redemptions or for other short-term liquidity purposes. The Fund has agreed to pay commitment fees on its pro-rata portion of the line of credit, which amounted to $45 and is reflected in Miscellaneous expenses on the Statement of Operations. During the period, the Fund did not borrow on this line of credit.
8. Security Lending.
The Fund lends portfolio securities from time to time in order to earn additional income. For equity securities, lending agents are used, including National Financial Services (NFS), an affiliate of the Fund. Pursuant to a securities lending agreement, NFS will receive a fee, which is capped at 9.9% of daily lending revenue, for its services as lending agent. The Fund may lend securities to certain qualified borrowers, including NFS. On the settlement date of the loan, the Fund receives collateral (in the form of U.S. Treasury obligations, letters of credit and/or cash) against the loaned securities and maintains collateral in an amount not less than 100% of the market value of the loaned securities during the period of the loan. The market value of the loaned securities is determined at the close of business of the Fund and any additional required collateral is delivered to the Fund on the next business day. The Fund or borrower may terminate the loan at any time, and if the borrower defaults on its obligation to return the securities loaned because of insolvency or other reasons, the Fund may apply collateral received from the borrower against the obligation. The Fund may experience delays and costs in recovering the securities loaned. Any cash collateral received is maintained at the Fund's custodian and/or invested in cash equivalents and/or the Fidelity Securities Lending Cash Central Fund. The value of loaned securities and cash collateral at period end are disclosed on the Fund's Statement of Assets and Liabilities. Total fees paid by the Fund to NFS, as lending agent, amounted to $1. Security lending income represents the income earned on investing cash collateral, less rebates paid to borrowers and any lending agent fees associated with the loan, plus any premium payments received for lending certain types of securities. Total security lending income during the period is presented in the Statement of Operations as a component of interest income. Net income from the Fidelity Securities Lending Cash Central Fund during the period is presented in the Statement of Operations as a component of income from Fidelity Central Funds. During the period, there were no securities loaned to NFS.
9. Expense Reductions.
Commissions paid to certain brokers with whom the investment adviser, or its affiliates, places trades on behalf of the Fund include an amount in addition to trade execution, which may be rebated back to the Fund to offset certain expenses. This amount totaled $60 for the period. In addition, through arrangements with the Fund's custodian and each class' transfer agent, credits realized as a result of certain uninvested cash balances were used to reduce the Fund's expenses. During the period, custodian credits reduced the Fund's expenses by $43. During the period, transfer agent credits reduced each class' expenses as noted in the table below.
| | Expense reduction |
| Class C | $8 |
| Class Z | –(a) |
| | $8 |
(a) In the amount of less than five hundred dollars.
In addition, during the period the investment adviser or an affiliate reimbursed and/or waived a portion of fund-level operating expenses in the amount of $82 and a portion of class-level operating expenses as follows:
| | Amount |
| Class A | $2 |
| Class M | 1 |
| Class C | 1 |
| Fidelity Strategic Income Fund | 8 |
| Class I | 5 |
| | $17 |
In addition, during the period, the investment adviser or an affiliate reimbursed the Fund $10 for an operational error which is included in the accompanying Statement of Operations.
10. Distributions to Shareholders.
Distributions to shareholders of each class were as follows:
| | Year ended
December 31, 2019 | Year ended
December 31, 2018(a) |
| Distributions to shareholders | | |
| Class A | $76,009 | $60,174 |
| Class M | 32,492 | 27,451 |
| Class C | 25,288 | 30,587 |
| Fidelity Strategic Income Fund | 353,007 | 217,922 |
| Class I | 211,541 | 188,008 |
| Class Z | 20,079 | 1,213 |
| Total | $718,416 | $525,355 |
(a) Distributions for Fidelity Strategic Income Fund are for the period April 13, 2018 (commencement of sale of shares) to December 31, 2018. Distributions for Class Z are for the period October 2, 2018 (commencement of sale of shares) to December 31, 2018.
11. Share Transactions.
Share transactions for each class were as follows and may contain automatic conversions between classes or exchanges between affiliated funds:
| | Shares | Shares | Dollars | Dollars |
| | Year ended December 31, 2019 | Year ended December 31, 2018(a) | Year ended December 31, 2019 | Year ended December 31, 2018(a) |
| Class A | | | | |
| Shares sold | 43,566 | 20,485 | $528,485 | $247,229 |
| Reinvestment of distributions | 5,960 | 4,818 | 72,944 | 57,680 |
| Shares redeemed | (34,497) | (40,154) | (420,095) | (483,015) |
| Net increase (decrease) | 15,029 | (14,851) | $181,334 | $(178,106) |
| Class M | | | | |
| Shares sold | 9,378 | 8,367 | $113,952 | $100,834 |
| Reinvestment of distributions | 2,601 | 2,238 | 31,804 | 26,771 |
| Shares redeemed | (11,692) | (15,457) | (142,125) | (185,766) |
| Net increase (decrease) | 287 | (4,852) | $3,631 | $(58,161) |
| Class C | | | | |
| Shares sold | 7,648 | 9,451 | $92,857 | $114,292 |
| Reinvestment of distributions | 1,951 | 2,427 | 23,766 | 28,975 |
| Shares redeemed | (41,561) | (30,574) | (501,565) | (366,646) |
| Net increase (decrease) | (31,962) | (18,696) | $(384,942) | $(223,379) |
| Fidelity Strategic Income Fund | | | | |
| Shares sold | 100,407 | 120,847 | $1,238,415 | $1,465,475 |
| Issued in exchange for the shares of Fidelity Strategic Income Fund | – | 699,236 | – | 8,586,618
|
| Reinvestment of distributions | 24,054 | 17,984 | 298,403 | 217,097 |
| Shares redeemed | (138,469) | (170,849) | (1,706,366) | (2,060,934) |
| Net increase (decrease) | (14,008) | 667,218 | $(169,548) | $8,208,256 |
| Class I | | | | |
| Shares sold | 115,327 | 142,304 | $1,420,553 | $1,738,031 |
| Reinvestment of distributions | 15,859 | 14,287 | 196,642 | 173,297 |
| Shares redeemed | (150,285) | (147,928) | (1,848,390) | (1,787,845) |
| Net increase (decrease) | (19,099) | 8,663 | $(231,195) | $123,483 |
| Class Z | | | | |
| Shares sold | 40,054 | 14,833 | $493,698 | $176,701 |
| Reinvestment of distributions | 1,315 | 85 | 16,369 | 1,001 |
| Shares redeemed | (8,437) | (790) | (104,926) | (9,317) |
| Net increase (decrease) | 32,932 | 14,128 | $405,141 | $168,385 |
(a) Share transactions for Fidelity Strategic Income Fund are for the period April 13, 2018 (commencement of sale of shares) to December 31, 2018. Share transactions for Class Z are for the period October 2, 2018 (commencement of sale of shares) to December 31, 2018.
12. Other.
The Fund's organizational documents provide former and current trustees and officers with a limited indemnification against liabilities arising in connection with the performance of their duties to the Fund. In the normal course of business, the Fund may also enter into contracts that provide general indemnifications. The Fund's maximum exposure under these arrangements is unknown as this would be dependent on future claims that may be made against the Fund. The risk of material loss from such claims is considered remote.
Effective January 1, 2020, following any required regulatory notices and approvals:
Investment advisers Fidelity Investments Money Management, Inc., FMR Co., Inc., and Fidelity SelectCo, LLC, merged with and into Fidelity Management & Research Company. In connection with the merger transactions, the resulting, merged investment adviser was then redomiciled from Massachusetts to Delaware, changed its corporate structure from a corporation to a limited liability company, and changed its name to "Fidelity Management & Research Company LLC".
Broker-dealer Fidelity Distributors Corporation merged with and into Fidelity Investments Institutional Services Company, Inc. ("FIISC"). FIISC was then redomiciled from Massachusetts to Delaware, changed its corporate structure from a corporation to a limited liability company, and changed its name to "Fidelity Distributors Company LLC".
Fidelity Investments Institutional Operations Company, Inc. (FIIOC) converted from a Massachusetts corporation to a Massachusetts LLC, and changed its name to "Fidelity Investments Institutional Operations Company LLC".
13. Credit Risk.
The Fund's relatively large investment in countries with limited or developing capital markets may involve greater risks than investments in more developed markets and the prices of such investments may be volatile. The yields of emerging market debt obligations reflect, among other things, perceived credit risk. The consequences of political, social or economic changes in these markets may have disruptive effects on the market prices of the Fund's investments and the income they generate, as well as the Fund's ability to repatriate such amounts.
14. Prior Fiscal Year Merger Information.
On April 27, 2018, the Fund acquired all of the assets and assumed all of the liabilities of Fidelity Strategic Income Fund ("Target Fund") pursuant to Agreements and Plans of Reorganization approved by the Board of Trustees ("The Board"). The acquisition was accomplished by an exchange of shares of the Fund for corresponding shares then outstanding of the Target Fund at its net asset value on the acquisition date. In addition, the Board approved the creation of an additional class of shares that commenced sale of shares on April 13, 2018. The reorganization provides shareholders of the Target Fund access to a larger portfolio with a similar investment objective. The reorganization qualified as a tax-free reorganization for federal income tax purposes with no gain or loss recognized to the funds or their shareholders. The Target Fund's net assets of $8,586,618, including securities and derivatives of $8,042,146 and unrealized appreciation of $83,150, were combined with the Fund's net assets of $9,167,312 for total net assets after the acquisition of $17,753,930.
Pro forma results of operations of the combined entity for the entire period ended December 31, 2018, as though the acquisition had occurred as of the beginning of the year (rather than on the actual acquisition date), are as follows:
| Net investment income (loss) | $637,988 |
| Total net realized gain (loss) | (19,160) |
| Total change in net unrealized appreciation (depreciation) | (1,119,312) |
| Net increase (decrease) in net assets resulting from operations | $(500,484) |
Because the combined investment portfolios have been managed as a single portfolio since the acquisition was completed, it is not practicable to separate the amounts of revenue and earnings of the Target Funds that has been included in the Fund's Statement of Operations since April 27, 2018.
15. Litigation.
The Fund, the Target Fund and other entities managed by FMR or its affiliates were named as defendants in a lawsuit filed in the United States Bankruptcy Court for the Southern District of New York in 2009. The lawsuit was brought by creditors of Motors Liquidation Company (f/k/a General Motors), which went through Chapter 11 bankruptcy proceedings in 2009, and is captioned Official Committee of Unsecured Creditors of Motors Liquidation Company v. JPMorgan Chase Bank, N.A., et al., Adversary No. 09-00504 (REG). The plaintiffs sought an order that the Fund and other defendants return proceeds received in 2009 in full payment of the principal and interest on General Motors secured debt. The plaintiffs contended that the Fund and the other defendants were not secured creditors at the time of the 2009 payments and, thus, were not entitled to payment in full. In May 2019, the parties reached a settlement that has been approved by the Bankruptcy Court. Under the terms of the settlement, the Fund will not be required to return any of the proceeds received in 2009, and will be entitled to recover a portion of the legal costs incurred in defending the case.
Report of Independent Registered Public Accounting Firm
To the Trustees of Fidelity Advisor Series II and Shareholders of Fidelity Advisor Strategic Income Fund:
Opinion on the Financial Statements and Financial Highlights
We have audited the accompanying statement of assets and liabilities of Fidelity Advisor Strategic Income Fund (the "Fund"), a fund of Fidelity Advisor Series II, including the schedule of investments, as of December 31, 2019, the related statement of operations for the year then ended, the statement of changes in net assets for each of the two years in the period then ended, the financial highlights for each of the five years in the period then ended, and the related notes. In our opinion, the financial statements and financial highlights present fairly, in all material respects, the financial position of the Fund as of December 31, 2019, and the results of its operations for the year then ended, the changes in its net assets for each of the two years in the period then ended, and the financial highlights for each of the five years in the period then ended, in conformity with accounting principles generally accepted in the United States of America.
Basis for Opinion
These financial statements and financial highlights are the responsibility of the Fund's management. Our responsibility is to express an opinion on the Fund's financial statements and financial highlights based on our audits. We are a public accounting firm registered with the Public Company Accounting Oversight Board (United States) (PCAOB) and are required to be independent with respect to the Fund in accordance with the U.S. federal securities laws and the applicable rules and regulations of the Securities and Exchange Commission and the PCAOB.
We conducted our audits in accordance with the standards of the PCAOB. Those standards require that we plan and perform the audit to obtain reasonable assurance about whether the financial statements and financial highlights are free of material misstatement, whether due to error or fraud. The Fund is not required to have, nor were we engaged to perform, an audit of its internal control over financial reporting. As part of our audits we are required to obtain an understanding of internal control over financial reporting but not for the purpose of expressing an opinion on the effectiveness of the Fund’s internal control over financial reporting. Accordingly, we express no such opinion.
Our audits included performing procedures to assess the risks of material misstatement of the financial statements and financial highlights, whether due to error or fraud, and performing procedures that respond to those risks. Such procedures included examining, on a test basis, evidence regarding the amounts and disclosures in the financial statements and financial highlights. Our audits also included evaluating the accounting principles used and significant estimates made by management, as well as evaluating the overall presentation of the financial statements and financial highlights. Our procedures included confirmation of securities owned as of December 31, 2019, by correspondence with the custodians, brokers and agent banks; when replies were not received from brokers or agent banks, we performed other auditing procedures. We believe that our audits provide a reasonable basis for our opinion.
/s/ Deloitte & Touche LLP
Boston, Massachusetts
February 14, 2020
We have served as the auditor of one or more of the Fidelity investment companies since 1999.
Trustees and Officers
The Trustees, Members of the Advisory Board (if any), and officers of the trust and fund, as applicable, are listed below. The Board of Trustees governs the fund and is responsible for protecting the interests of shareholders. The Trustees are experienced executives who meet periodically throughout the year to oversee the fund's activities, review contractual arrangements with companies that provide services to the fund, oversee management of the risks associated with such activities and contractual arrangements, and review the fund's performance. Each of the Trustees oversees 277 funds.
The Trustees hold office without limit in time except that (a) any Trustee may resign; (b) any Trustee may be removed by written instrument, signed by at least two-thirds of the number of Trustees prior to such removal; (c) any Trustee who requests to be retired or who has become incapacitated by illness or injury may be retired by written instrument signed by a majority of the other Trustees; and (d) any Trustee may be removed at any special meeting of shareholders by a two-thirds vote of the outstanding voting securities of the trust. Each Trustee who is not an interested person (as defined in the Investment Company Act of 1940 (1940 Act)) of the trust and the fund is referred to herein as an Independent Trustee. Each Independent Trustee shall retire not later than the last day of the calendar year in which his or her 75th birthday occurs. The Independent Trustees may waive this mandatory retirement age policy with respect to individual Trustees. Officers and Advisory Board Members hold office without limit in time, except that any officer or Advisory Board Member may resign or may be removed by a vote of a majority of the Trustees at any regular meeting or any special meeting of the Trustees. Except as indicated, each individual has held the office shown or other offices in the same company for the past five years.
The fund's Statement of Additional Information (SAI) includes more information about the Trustees. To request a free copy, call Fidelity at 1-800-544-8544 if you’re an individual investing directly with Fidelity, call 1-800-835-5092 if you’re a plan sponsor or participant with Fidelity as your recordkeeper or call 1-877-208-0098 on institutional accounts or if you’re an advisor or invest through one.
Experience, Skills, Attributes, and Qualifications of the Trustees. The Governance and Nominating Committee has adopted a statement of policy that describes the experience, qualifications, attributes, and skills that are necessary and desirable for potential Independent Trustee candidates (Statement of Policy). The Board believes that each Trustee satisfied at the time he or she was initially elected or appointed a Trustee, and continues to satisfy, the standards contemplated by the Statement of Policy. The Governance and Nominating Committee also engages professional search firms to help identify potential Independent Trustee candidates who have the experience, qualifications, attributes, and skills consistent with the Statement of Policy. From time to time, additional criteria based on the composition and skills of the current Independent Trustees, as well as experience or skills that may be appropriate in light of future changes to board composition, business conditions, and regulatory or other developments, have also been considered by the professional search firms and the Governance and Nominating Committee. In addition, the Board takes into account the Trustees' commitment and participation in Board and committee meetings, as well as their leadership of standing and ad hoc committees throughout their tenure.
In determining that a particular Trustee was and continues to be qualified to serve as a Trustee, the Board has considered a variety of criteria, none of which, in isolation, was controlling. The Board believes that, collectively, the Trustees have balanced and diverse experience, qualifications, attributes, and skills, which allow the Board to operate effectively in governing the fund and protecting the interests of shareholders. Information about the specific experience, skills, attributes, and qualifications of each Trustee, which in each case led to the Board's conclusion that the Trustee should serve (or continue to serve) as a trustee of the fund, is provided below.
Board Structure and Oversight Function. Abigail P. Johnson is an interested person and currently serves as Chairman. The Trustees have determined that an interested Chairman is appropriate and benefits shareholders because an interested Chairman has a personal and professional stake in the quality and continuity of services provided to the fund. Independent Trustees exercise their informed business judgment to appoint an individual of their choosing to serve as Chairman, regardless of whether the Trustee happens to be independent or a member of management. The Independent Trustees have determined that they can act independently and effectively without having an Independent Trustee serve as Chairman and that a key structural component for assuring that they are in a position to do so is for the Independent Trustees to constitute a substantial majority for the Board. The Independent Trustees also regularly meet in executive session. Arthur E. Johnson serves as Chairman of the Independent Trustees and as such (i) acts as a liaison between the Independent Trustees and management with respect to matters important to the Independent Trustees and (ii) with management prepares agendas for Board meetings.
James C. Curvey is an interested person and currently serves as Chairman. The Trustees have determined that an interested Chairman is appropriate and benefits shareholders because an interested Chairman has a personal and professional stake in the quality and continuity of services provided to the fund. Independent Trustees exercise their informed business judgment to appoint an individual of their choosing to serve as Chairman, regardless of whether the Trustee happens to be independent or a member of management. The Independent Trustees have determined that they can act independently and effectively without having an Independent Trustee serve as Chairman and that a key structural component for assuring that they are in a position to do so is for the Independent Trustees to constitute a substantial majority for the Board. The Independent Trustees also regularly meet in executive session. Ned C. Lautenbach serves as Chairman of the Independent Trustees and as such (i) acts as a liaison between the Independent Trustees and management with respect to matters important to the Independent Trustees and (ii) with management prepares agendas for Board meetings.
Fidelity® funds are overseen by different Boards of Trustees. The fund's Board oversees Fidelity's investment-grade bond, money market, asset allocation and certain equity funds, and other Boards oversee Fidelity's high income and other equity funds. The asset allocation funds may invest in Fidelity® funds that are overseen by such other Boards. The use of separate Boards, each with its own committee structure, allows the Trustees of each group of Fidelity® funds to focus on the unique issues of the funds they oversee, including common research, investment, and operational issues. On occasion, the separate Boards establish joint committees to address issues of overlapping consequences for the Fidelity® funds overseen by each Board.
Fidelity® funds are overseen by different Boards of Trustees. The fund's Board oversees Fidelity's high income and certain equity funds, and other Boards oversee Fidelity's investment-grade bond, money market, asset allocation, and other equity funds. The asset allocation funds may invest in Fidelity® funds overseen by the fund's Board. The use of separate Boards, each with its own committee structure, allows the Trustees of each group of Fidelity® funds to focus on the unique issues of the funds they oversee, including common research, investment, and operational issues. On occasion, the separate Boards establish joint committees to address issues of overlapping consequences for the Fidelity® funds overseen by each Board.
The Trustees operate using a system of committees to facilitate the timely and efficient consideration of all matters of importance to the Trustees, the fund, and fund shareholders and to facilitate compliance with legal and regulatory requirements and oversight of the fund's activities and associated risks. The Board, acting through its committees, has charged FMR and its affiliates with (i) identifying events or circumstances the occurrence of which could have demonstrably adverse effects on the fund's business and/or reputation; (ii) implementing processes and controls to lessen the possibility that such events or circumstances occur or to mitigate the effects of such events or circumstances if they do occur; and (iii) creating and maintaining a system designed to evaluate continuously business and market conditions in order to facilitate the identification and implementation processes described in (i) and (ii) above. Because the day-to-day operations and activities of the fund are carried out by or through FMR, its affiliates, and other service providers, the fund's exposure to risks is mitigated but not eliminated by the processes overseen by the Trustees. While each of the Board's committees has responsibility for overseeing different aspects of the fund's activities, oversight is exercised primarily through the Operations and Audit Committees. While each of the Board's committees has responsibility for overseeing different aspects of the fund's activities, oversight is exercised primarily through the Operations, Audit, and Compliance Committees. In addition, an ad hoc Board committee of Independent Trustees has worked with FMR to enhance the Board's oversight of investment and financial risks, legal and regulatory risks, technology risks, and operational risks, including the development of additional risk reporting to the Board. Appropriate personnel, including but not limited to the fund's Chief Compliance Officer (CCO), FMR's internal auditor, the independent accountants, the fund's Treasurer and portfolio management personnel, make periodic reports to the Board's committees, as appropriate, including an annual review of Fidelity's risk management program for the Fidelity® funds. The responsibilities of each standing committee, including their oversight responsibilities, are described further under "Standing Committees of the Trustees."
Interested Trustees*:
Correspondence intended for a Trustee who is an interested person may be sent to Fidelity Investments, 245 Summer Street, Boston, Massachusetts 02210.
Name, Year of Birth; Principal Occupations and Other Relevant Experience+
James C. Curvey (1935)
Year of Election or Appointment: 2007
Trustee
Chairman of the Board of Trustees
Mr. Curvey also serves as Trustee of other Fidelity® funds. Mr. Curvey is Vice Chairman (2007-present) and Director of FMR LLC (diversified financial services company). In addition, Mr. Curvey is an Overseer Emeritus for the Boston Symphony Orchestra, a Director of Artis-Naples, and a Trustee of Brewster Academy in Wolfeboro, New Hampshire. Previously, Mr. Curvey served as a Director of Fidelity Research & Analysis Co. (investment adviser firm, 2009-2018), Director of Fidelity Investments Money Management, Inc. (investment adviser firm, 2009-2014) and a Director of FMR and FMR Co., Inc. (investment adviser firms, 2007-2014).
Abigail P. Johnson (1961)
Year of Election or Appointment: 2009
Trustee
Chairman of the Board of Trustees
Ms. Johnson also serves as Trustee of other Fidelity® funds. Ms. Johnson serves as Chairman (2016-present), Chief Executive Officer (2014-present), and Director (2007-present) of FMR LLC (diversified financial services company), President of Fidelity Financial Services (2012-present) and President of Personal, Workplace and Institutional Services (2005-present). Ms. Johnson is Chairman and Director of Fidelity Management & Research Company LLC (investment adviser firm, 2011-present). Previously, Ms. Johnson served as Chairman and Director of FMR Co., Inc. (investment adviser firm, 2011-2019), Vice Chairman (2007-2016) and President (2013-2016) of FMR LLC, President and a Director of Fidelity Management & Research Company (2001-2005), a Trustee of other investment companies advised by Fidelity Management & Research Company, Fidelity Investments Money Management, Inc. (investment adviser firm), and FMR Co., Inc. (2001-2005), Senior Vice President of the Fidelity® funds (2001-2005), and managed a number of Fidelity® funds. Ms. Abigail P. Johnson and Mr. Arthur E. Johnson are not related.
Jennifer Toolin McAuliffe (1959)
Year of Election or Appointment: 2016
Trustee
Ms. McAuliffe also serves as Trustee of other Fidelity® funds. Ms. McAuliffe previously served as a Member of the Advisory Board of certain Fidelity® funds (2016) and as Co-Head of Fixed Income of Fidelity Investments Limited (now known as FIL Limited (FIL)) (diversified financial services company). Earlier roles at FIL included Director of Research for FIL’s credit and quantitative teams in London, Hong Kong and Tokyo. Ms. McAuliffe also was the Director of Research for taxable and municipal bonds at Fidelity Investments Money Management, Inc. Ms. McAuliffe is also a director or trustee of several not-for-profit entities.
* Determined to be an “Interested Trustee” by virtue of, among other things, his or her affiliation with the trust or various entities under common control with FMR.
+ The information includes the Trustee's principal occupation during the last five years and other information relating to the experience, attributes, and skills relevant to the Trustee's qualifications to serve as a Trustee, which led to the conclusion that the Trustee should serve as a Trustee for the fund.
Independent Trustees:
Correspondence intended for an Independent Trustee may be sent to Fidelity Investments, P.O. Box 55235, Boston, Massachusetts 02205-5235.
Name, Year of Birth; Principal Occupations and Other Relevant Experience+
Elizabeth S. Acton (1951)
Year of Election or Appointment: 2016
Trustee
Ms. Acton also serves as Trustee of other Fidelity® funds. Prior to her retirement in April 2012, Ms. Acton was Executive Vice President, Finance (2011-2012), Executive Vice President, Chief Financial Officer (2002-2011), and Treasurer (2004-2005) of Comerica Incorporated (financial services). Prior to joining Comerica, Ms. Acton held a variety of positions at Ford Motor Company (1983-2002), including Vice President and Treasurer (2000-2002) and Executive Vice President and Chief Financial Officer of Ford Motor Credit Company (1998-2000). Ms. Acton currently serves as a member of the Board of Directors and Audit and Finance Committees of Beazer Homes USA, Inc. (homebuilding, 2012-present). Previously, Ms. Acton served as a Member of the Advisory Board of certain Fidelity® funds (2013-2016).
Ann E. Dunwoody (1953)
Year of Election or Appointment: 2018
Trustee
General Dunwoody also serves as Trustee of other Fidelity® funds. General Dunwoody (United States Army, Retired) was the first woman in U.S. military history to achieve the rank of four-star general and prior to her retirement in 2012 held a variety of positions within the U.S. Army, including Commanding General, U.S. Army Material Command (2008-2012). She is the President of First to Four LLC (leadership and mentoring services, 2012-present). She also serves as a member of the Board of Directors and Nominating and Corporate Governance Committee of L3 Technologies, Inc. (communication, electronic, sensor, and aerospace systems, 2013-present), Board of Directors and Nomination and Corporate Governance Committees of Kforce Inc. (professional staffing services, 2016-present) and Board of Directors of Automattic Inc. (software engineering, 2018-present). Previously, General Dunwoody served as a Member of the Advisory Board of certain Fidelity® funds (2018), a member of the Board of Directors and Audit and Sustainability and Corporate Responsibility Committees of Republic Services, Inc. (waste collection, disposal and recycling, 2013-2016). Ms. Dunwoody also serves on several boards for non-profit organizations, including as a member of the Board of Directors, Chair of the Nomination and Governance Committee and member of the Audit Committee of Logistics Management Institute (consulting non-profit, 2012-present), a member of the Board of Directors of the Army Historical Foundation (2015-present), a member of the Council of Trustees for the Association of the United States Army (advocacy non-profit, 2013-present) and a member of the Board of Trustees of Florida Institute of Technology (2015-present) and ThanksUSA (military family education non-profit, 2014-present).
Dennis J. Dirks (1948)
Year of Election or Appointment: 2007
Trustee
Mr. Dirks also serves as Trustee of other Fidelity® funds. Prior to his retirement in May 2003, Mr. Dirks was Chief Operating Officer and a member of the Board of The Depository Trust & Clearing Corporation (DTCC). He also served as President, Chief Operating Officer, and Board member of The Depository Trust Company (DTC) and President and Board member of the National Securities Clearing Corporation (NSCC). In addition, Mr. Dirks served as Chief Executive Officer and Board member of the Government Securities Clearing Corporation, Chief Executive Officer and Board member of the Mortgage-Backed Securities Clearing Corporation, as a Trustee and a member of the Finance Committee of Manhattan College (2005-2008), as a Trustee and a member of the Finance Committee of AHRC of Nassau County (2006-2008), as a member of the Independent Directors Council (IDC) Governing Council (2010-2015), and as a member of the Board of Directors for The Brookville Center for Children’s Services, Inc. (2009-2017). Mr. Dirks is a member of the Finance Committee (2016-present) and Board of Directors (2017-present) and is Treasurer (2018-present) of the Asolo Repertory Theatre.
John Engler (1948)
Year of Election or Appointment: 2016
Trustee
Mr. Engler also serves as Trustee of other Fidelity® funds. He serves on the board of directors for Universal Forest Products (manufacturer and distributor of wood and wood-alternative products, 2003-present) and K12 Inc. (technology-based education company, 2012-present). Previously, Mr. Engler served as interim president of Michigan State University (2018-2019), a Member of the Advisory Board of certain Fidelity® funds (2014-2016), president of the Business Roundtable (2011-2017), a trustee of The Munder Funds (2003-2014), president and CEO of the National Association of Manufacturers (2004-2011), member of the Board of Trustees of the Annie E. Casey Foundation (2004-2015), and as governor of Michigan (1991-2003). He is a past chairman of the National Governors Association.
Robert F. Gartland (1951)
Year of Election or Appointment: 2010
Trustee
Mr. Gartland also serves as Trustee of other Fidelity® funds. Mr. Gartland is Chairman and an investor in Gartland & Mellina Group Corp. (consulting, 2009-present). Previously, Mr. Gartland served as a partner and investor of Vietnam Partners LLC (investments and consulting, 2008-2011). Prior to his retirement, Mr. Gartland held a variety of positions at Morgan Stanley (financial services, 1979-2007), including Managing Director (1987-2007), and Chase Manhattan Bank (1975-1978).
Donald F. Donahue (1950)
Year of Election or Appointment: 2018
Trustee
Mr. Donahue also serves as a Trustee of other Fidelity® funds. Mr. Donahue is President and Chief Executive Officer of Miranda Partners, LLC (risk consulting for the financial services industry, 2012-present). Previously, Mr. Donahue served as a Member of the Advisory Board of certain Fidelity® funds (2015-2018) and Chief Executive Officer (2006-2012), Chief Operating Officer (2003-2006), and Managing Director, Customer Marketing and Development (1999-2003) of The Depository Trust & Clearing Corporation (financial markets infrastructure). Mr. Donahue serves as a Member (2007-present) and Co-Chairman (2016-present) of the Board of Directors of United Way of New York, Member of the Board of Directors of NYC Leadership Academy (2012-present) and Member of the Board of Advisors of Ripple Labs, Inc. (financial services, 2015-present). He also served as Chairman (2010-2012) and Member of the Board of Directors (2012-2013) of Omgeo, LLC (financial services), Treasurer of United Way of New York (2012-2016), and Member of the Board of Directors of XBRL US (financial services non-profit, 2009-2012) and the International Securities Services Association (2009-2012).
Arthur E. Johnson (1947)
Year of Election or Appointment: 2008
Trustee
Chairman of the Independent Trustees
Mr. Johnson also serves as Trustee of other Fidelity® funds. Mr. Johnson serves as a member of the Board of Directors of Eaton Corporation plc (diversified power management, 2009-present) and Booz Allen Hamilton (management consulting, 2011-present). Prior to his retirement, Mr. Johnson served as Senior Vice President of Corporate Strategic Development of Lockheed Martin Corporation (defense contractor, 1999-2009). Mr. Johnson previously served as Vice Chairman (2015-2018) of the Independent Trustees of certain Fidelity® funds and on the Board of Directors of IKON Office Solutions, Inc. (1999-2008), AGL Resources, Inc. (holding company, 2002-2016), and Delta Airlines (2005-2007). Mr. Arthur E. Johnson is not related to Ms. Abigail P. Johnson.
Michael E. Kenneally (1954)
Year of Election or Appointment: 2009
Trustee
Vice Chairman of the Independent Trustees
Mr. Kenneally also serves as Trustee of other Fidelity® funds. Prior to his retirement, Mr. Kenneally served as Chairman and Global Chief Executive Officer of Credit Suisse Asset Management. Before joining Credit Suisse, he was an Executive Vice President and Chief Investment Officer for Bank of America Corporation. Earlier roles at Bank of America included Director of Research, Senior Portfolio Manager and Research Analyst, and Mr. Kenneally was awarded the Chartered Financial Analyst (CFA) designation in 1991.
Marie L. Knowles (1946)
Year of Election or Appointment: 2001
Trustee
Ms. Knowles also serves as Trustee of other Fidelity® funds. Prior to Ms. Knowles' retirement in June 2000, she served as Executive Vice President and Chief Financial Officer of Atlantic Richfield Company (ARCO) (diversified energy, 1996-2000). From 1993 to 1996, she was a Senior Vice President of ARCO and President of ARCO Transportation Company (pipeline and tanker operations). Ms. Knowles currently serves as a Director and Chairman of the Audit Committee of McKesson Corporation (healthcare service, since 2002). Ms. Knowles is a member of the Board of the Santa Catalina Island Company (real estate, 2009-present). Ms. Knowles is a Member of the Investment Company Institute Board of Governors and a Member of the Governing Council of the Independent Directors Council (2014-present). She also serves as a member of the Advisory Board for the School of Engineering of the University of Southern California. Previously, Ms. Knowles served as a Director of Phelps Dodge Corporation (copper mining and manufacturing, 1994-2007), URS Corporation (engineering and construction, 2000-2003) and America West (airline, 1999-2002). Ms. Knowles previously served as Chairman (2015-2018) and Vice Chairman (2012-2015) of the Independent Trustees of certain Fidelity® funds.
Alan J. Lacy (1953)
Year of Election or Appointment: 2008
Trustee
Mr. Lacy also serves as Trustee of other Fidelity® funds. Mr. Lacy serves as a Director of Bristol-Myers Squibb Company (global pharmaceuticals, 2008-present). He is a Trustee of the California Chapter of The Nature Conservancy (2015-present) and a Director of the Center for Advanced Study in the Behavioral Sciences at Stanford University (2015-present). In addition, Mr. Lacy served as Senior Adviser (2007-2014) of Oak Hill Capital Partners, L.P. (private equity) and also served as Chief Executive Officer (2005) and Vice Chairman (2005-2006) of Sears Holdings Corporation (retail) and Chief Executive Officer and Chairman of the Board of Sears, Roebuck and Co. (retail, 2000-2005). Previously, Mr. Lacy served as Chairman (2014-2017) and a member (2010-2017) of the Board of Directors of Dave & Buster’s Entertainment, Inc. (restaurant and entertainment complexes), as Chairman (2008-2011) and a member (2006-2015) of the Board of Trustees of the National Parks Conservation Association, and as a member of the Board of Directors for The Hillman Companies, Inc. (hardware wholesalers, 2010-2014), Earth Fare, Inc. (retail grocery, 2010-2014), and The Western Union Company (global money transfer, 2006-2011).
Ned C. Lautenbach (1944)
Year of Election or Appointment: 2007
Trustee
Chairman of the Independent Trustees
Mr. Lautenbach also serves as Trustee of other Fidelity® funds. Mr. Lautenbach currently serves as Chair (2018-present) and Member (2013-present) of the Board of Governors, State University System of Florida and is a member of the Council on Foreign Relations (1994-present). He is also a member and has most recently served as Chairman of the Board of Directors of Artis-Naples (2012-present). Previously, Mr. Lautenbach served as a member and then Lead Director of the Board of Directors of Eaton Corporation (diversified industrial, 1997-2016). He was also a Partner and Advisory Partner at Clayton, Dubilier & Rice, LLC (private equity investment, 1998-2010), as well as a Director of Sony Corporation (2006-2007). In addition, Mr. Lautenbach also had a 30-year career with IBM (technology company) during which time he served as Senior Vice President and a member of the Corporate Executive Committee (1968-1998).
Joseph Mauriello (1944)
Year of Election or Appointment: 2008
Trustee
Mr. Mauriello also serves as Trustee of other Fidelity® funds. Prior to his retirement in January 2006, Mr. Mauriello served in numerous senior management positions including Deputy Chairman and Chief Operating Officer (2004-2005), and Vice Chairman of Financial Services (2002-2004) of KPMG LLP US (professional services, 1965-2005). Mr. Mauriello currently serves as a member of the Independent Directors Council (IDC) Governing Council (2015-present). Previously, Mr. Mauriello served as a member of the Board of Directors of XL Group plc. (global insurance and re-insurance, 2006-2018).
Mark A. Murray (1954)
Year of Election or Appointment: 2016
Trustee
Mr. Murray also serves as Trustee of other Fidelity® funds. Mr. Murray is Vice Chairman (2013-present) of Meijer, Inc. (regional retail chain). Previously, Mr. Murray served as a Member of the Advisory Board of certain Fidelity® funds (2016) and as Co-Chief Executive Officer (2013-2016) and President (2006-2013) of Meijer, Inc. Mr. Murray serves as a member of the Board of Directors and Nuclear Review and Public Policy and Responsibility Committees of DTE Energy Company (diversified energy company, 2009-present). Mr. Murray also serves as a member of the Board of Directors of Spectrum Health (not-for-profit health system, 2015-present). Mr. Murray previously served as President of Grand Valley State University (2001-2006), Treasurer for the State of Michigan (1999-2001), Vice President of Finance and Administration for Michigan State University (1998-1999), and a member of the Board of Directors and Audit Committee and Chairman of the Nominating and Corporate Governance Committee of Universal Forest Products, Inc. (manufacturer and distributor of wood and wood-alternative products, 2004-2016). Mr. Murray is also a director or trustee of many community and professional organizations.
Cornelia M. Small (1944)
Year of Election or Appointment: 2007
Trustee
Ms. Small also serves as Trustee of other Fidelity® funds. Ms. Small is a member of the Board of Directors (2009-present) and Chair of the Investment Committee (2010-present) of the Teagle Foundation. Ms. Small also serves on the Investment Committee of the Berkshire Taconic Community Foundation (2008-present). Previously, Ms. Small served as Chairperson (2002-2008) and a member of the Investment Committee and Chairperson (2008-2012) and a member of the Board of Trustees of Smith College. In addition, Ms. Small served as Chief Investment Officer, Director of Global Equity Investments, and a member of the Board of Directors of Scudder, Stevens & Clark and Scudder Kemper Investments.
Garnett A. Smith (1947)
Year of Election or Appointment: 2018
Trustee
Mr. Smith also serves as Trustee of other Fidelity® funds. Prior to Mr. Smith's retirement, he served as Chairman and Chief Executive Officer of Inbrand Corp. (manufacturer of personal absorbent products, 1990-1997). He also served as President (1986-1990) of Inbrand Corp. Prior to his employment with Inbrand Corp., he was employed by a retail fabric chain and North Carolina National Bank. In addition, Mr. Smith served as a Member of the Advisory Board of certain Fidelity® funds (2012-2013) and as a board member of the Jackson Hole Land Trust (2009-2012).
David M. Thomas (1949)
Year of Election or Appointment: 2008
Trustee
Mr. Thomas also serves as Trustee of other Fidelity® funds. Mr. Thomas serves as Non-Executive Chairman of the Board of Directors of Fortune Brands Home and Security (home and security products, 2011-present) and as a member of the Board of Directors (2004-present) and Presiding Director (2013-present) of Interpublic Group of Companies, Inc. (marketing communication). Previously, Mr. Thomas served as Executive Chairman (2005-2006) and Chairman and Chief Executive Officer (2000-2005) of IMS Health, Inc. (pharmaceutical and healthcare information solutions), a Director of Fortune Brands, Inc. (consumer products, 2000-2011), and a member of the Board of Trustees of the University of Florida (2013-2018).
Michael E. Wiley (1950)
Year of Election or Appointment: 2018
Trustee
Mr. Wiley also serves as Trustee or Member of the Advisory Board of other Fidelity® funds. Mr. Wiley serves as a Director of High Point Resources (exploration and production, 2005-present). Previously, Mr. Wiley served as a Director of Andeavor Corporation (independent oil refiner and marketer, 2005-2018), a Director of Andeavor Logistics LP (natural resources logistics, 2015-2018), a Director of Post Oak Bank (privately-held bank, 2004-2018), a Director of Asia Pacific Exploration Consolidated (international oil and gas exploration and production, 2008-2013), a member of the Board of Trustees of the University of Tulsa (2000-2006; 2007-2010), a Senior Energy Advisor of Katzenbach Partners, LLC (consulting, 2006-2007), an Advisory Director of Riverstone Holdings (private investment), a Director of Spinnaker Exploration Company (exploration and production, 2001-2005) and Chairman, President, and CEO of Baker Hughes, Inc. (oilfield services, 2000-2004).
+ The information includes the Trustee's principal occupation during the last five years and other information relating to the experience, attributes, and skills relevant to the Trustee's qualifications to serve as a Trustee, which led to the conclusion that the Trustee should serve as a Trustee for the fund.
Advisory Board Members and Officers:
Correspondence intended for a Member of the Advisory Board (if any) may be sent to Fidelity Investments, P.O. Box 55235, Boston, Massachusetts 02205-5235. Correspondence intended for an officer or Peter S. Lynch may be sent to Fidelity Investments, 245 Summer Street, Boston, Massachusetts 02210. Correspondence intended for an officer may be sent to Fidelity Investments, 245 Summer Street, Boston, Massachusetts 02210. Officers appear below in alphabetical order.
Name, Year of Birth; Principal Occupation
Vicki L. Fuller (1957)
Year of Election or Appointment: 2018
Member of the Advisory Board
Ms. Fuller also serves as Member of the Advisory Board of other Fidelity® funds. Ms. Fuller serves as a member of the Board of Directors, Audit Committee, and Nominating and Governance Committee of The Williams Companies, Inc. (natural gas infrastructure, 2018-present). Previously, Ms. Fuller served as the Chief Investment Officer of the New York State Common Retirement Fund (2012-2018) and held a variety of positions at AllianceBernstein L.P. (global asset management, 1985-2012), including Managing Director (2006-2012) and Senior Vice President and Senior Portfolio Manager (2001-2006).
Patricia L. Kampling (1959)
Year of Election or Appointment: 2020
Member of the Advisory Board
Ms. Kampling also serves as Member of the Advisory Board of other Fidelity® funds. Prior to her retirement, Ms. Kampling served as Chairman of the Board and Chief Executive Officer (2012-2019), President and Chief Operating Officer (2011-2012) and Executive Vice President and Chief Financial Officer (2010-2011) of Alliant Energy Corporation. Ms. Kampling currently serves as a member of the Board, Compensation Committee and Executive Committee and as Chair of the Audit Committee of Briggs & Stratton Corporation (manufacturing, 2011-present) and as a member of the Board, Audit, Finance and Risk Committee and Safety, Environmental, Technology and Operations Committee of American Water Works Company, Inc. (utilities company, 2019-present). In addition, Ms. Kampling currently serves as a member of the Board of the Nature Conservancy, Wisconsin Chapter (2019-present). Previously, Ms. Kampling served as a member of the Board of Interstate Power and Light Company (2012-2019) and Wisconsin Power and Light Company (2012-2019) (each a subsidiary of Alliant Energy Corporation) and as a member of the Board and Workforce Development Committee of the Business Roundtable (2018-2019).
Peter S. Lynch (1944)
Year of Election or Appointment: 2003
Member of the Advisory Board
Mr. Lynch also serves as Member of the Advisory Board of other Fidelity® funds. Mr. Lynch is Vice Chairman and a Director of Fidelity Management & Research Company LLC (investment adviser firm). In addition, Mr. Lynch serves as a Trustee of Boston College and as the Chairman of the Inner-City Scholarship Fund. Previously, Mr. Lynch served as Vice Chairman and a Director of FMR Co., Inc. (investment adviser firm) and on the Special Olympics International Board of Directors (1997-2006).
Susan Tomasky (1953)
Year of Election or Appointment: 2020
Member of the Advisory Board
Ms. Tomasky also serves as Member of the Advisory Board of other Fidelity® funds. Prior to her retirement, Ms. Tomasky served in various executive officer positions at American Electric Power Company, Inc. (1998-2011), including most recently as President of AEP Transmission (2007-2011). Ms. Tomasky currently serves as a member of the Board and Sustainability Committee and as Chair of the Audit Committee of Marathon Petroleum Corporation (2018-present) and as a member of the Board, Corporate Governance Committee and Organization and Compensation Committee and as Chair of the Audit Committee of Public Service Enterprise Group, Inc. (utilities company, 2012-present). In addition, Ms. Tomasky currently serves as a member of the Board of the Columbus Regional Airport Authority (2007-present), as a member of the Board of the Royal Shakespeare Company – America (2009-present), as a member of the Board of the Columbus Association for the Performing Arts (2011-present) and as a member of the Board of Kenyon College (2016-present). Previously, Ms. Tomasky served as a member of the Board (2011-2019) and as Lead Independent Director (2015-2018) of Andeavor Corporation (previously Tesoro Corporation) (independent oil refiner and marketer) and as a member of the Board of Summit Midstream Partners LP (energy, 2012-2018).
Elizabeth Paige Baumann (1968)
Year of Election or Appointment: 2017
Anti-Money Laundering (AML) Officer
Ms. Baumann also serves as AML Officer of other funds. She is Chief AML Officer (2012-present) and Senior Vice President (2014-present) of FMR LLC (diversified financial services company) and is an employee of Fidelity Investments. Previously, Ms. Baumann served as AML Officer of the funds (2012-2016), and Vice President (2007-2014) and Deputy Anti-Money Laundering Officer (2007-2012) of FMR LLC.
Craig S. Brown (1977)
Year of Election or Appointment: 2019
Assistant Treasurer
Mr. Brown also serves as Assistant Treasurer of other funds. Mr. Brown is an employee of Fidelity Investments (2013-present).
John J. Burke III (1964)
Year of Election or Appointment: 2018
Chief Financial Officer
Mr. Burke also serves as Chief Financial Officer of other funds. Mr. Burke serves as Head of Investment Operations for Fidelity Fund and Investment Operations (2018-present) and is an employee of Fidelity Investments (1998-present). Previously Mr. Burke served as head of Asset Management Investment Operations (2012-2018).
William C. Coffey (1969)
Year of Election or Appointment: 2019
Assistant Secretary
Mr. Coffey also serves as Assistant Secretary of other funds. He is Senior Vice President and Deputy General Counsel of FMR LLC (diversified financial services company, 2010-present), and is an employee of Fidelity Investments. Previously, Mr. Coffey served as Secretary and CLO of certain funds (2018-2019); CLO, Secretary, and Senior Vice President of Fidelity Management & Research Company and FMR Co., Inc. (investment adviser firms, 2018-2019); Secretary of Fidelity SelectCo, LLC and Fidelity Investments Money Management, Inc. (investment adviser firms, 2018-2019); CLO of Fidelity Management & Research (Hong Kong) Limited, FMR Investment Management (UK) Limited, and Fidelity Management & Research (Japan) Limited (investment adviser firms, 2018-2019); and Assistant Secretary of certain funds (2009-2018).
Timothy M. Cohen (1969)
Year of Election or Appointment: 2018
Vice President
Mr. Cohen also serves as Vice President of other funds. Mr. Cohen serves as Co-Head of Equity (2018-present), a Director of Fidelity Management & Research (Japan) Limited (investment adviser firm, 2016-present), and is an employee of Fidelity Investments. Previously, Mr. Cohen served as Executive Vice President of Fidelity SelectCo, LLC (2019), Head of Global Equity Research (2016-2018), Chief Investment Officer - Equity and a Director of Fidelity Management & Research (U.K.) Inc. (investment adviser firm, 2013-2015) and as a Director of Fidelity Management & Research (Hong Kong) Limited (investment adviser firm, 2017).
Jonathan Davis (1968)
Year of Election or Appointment: 2010
Assistant Treasurer
Mr. Davis also serves as Assistant Treasurer of other funds. Mr. Davis serves as Assistant Treasurer of FMR Capital, Inc. (2017-present) and is an employee of Fidelity Investments. Previously, Mr. Davis served as Vice President and Associate General Counsel of FMR LLC (diversified financial services company, 2003-2010).
Laura M. Del Prato (1964)
Year of Election or Appointment: 2018
Assistant Treasurer
President and Treasurer
Ms. Del Prato also serves as an officer of other funds. Ms. Del Prato is an employee of Fidelity Investments (2017-present). Prior to joining Fidelity Investments, Ms. Del Prato served as a Managing Director and Treasurer of the JPMorgan Mutual Funds (2014-2017). Prior to JPMorgan, Ms. Del Prato served as a partner at Cohen Fund Audit Services (accounting firm, 2012-2013) and KPMG LLP (accounting firm, 2004-2012).
Colm A. Hogan (1973)
Year of Election or Appointment: 2020
Year of Election or Appointment: 2016
Assistant Treasurer
Mr. Hogan also serves as an officer of other funds. Mr. Hogan serves as Assistant Treasurer of FMR Capital, Inc. (2017-present) and is an employee of Fidelity Investments (2005-present). Previously, Mr. Hogan served as Deputy Treasurer of certain Fidelity® funds (2016-2020) and Assistant Treasurer of certain Fidelity® funds (2016-2018).
Pamela R. Holding (1964)
Year of Election or Appointment: 2018
Vice President
Ms. Holding also serves as Vice President of other funds. Ms. Holding serves as Co-Head of Equity (2018-present) and is an employee of Fidelity Investments (2013-present). Previously, Ms. Holding served as Executive Vice President of Fidelity SelectCo, LLC (2019) and as Chief Investment Officer of Fidelity Institutional Asset Management (2013-2018).
Cynthia Lo Bessette (1969)
Year of Election or Appointment: 2019
Secretary and Chief Legal Officer (CLO)
Ms. Lo Bessette also serves as an officer of other funds. Ms. Lo Bessette serves as CLO, Secretary, and Senior Vice President of Fidelity Management & Research Company LLC (investment adviser firm, 2019-present); and CLO of Fidelity Management & Research (Hong Kong) Limited, FMR Investment Management (UK) Limited, and Fidelity Management & Research (Japan) Limited (investment adviser firms, 2019-present). She is a Senior Vice President and Deputy General Counsel of FMR LLC (diversified financial services company, 2019-present), and is an employee of Fidelity Investments. Previously, Ms. Lo Bessette served as CLO, Secretary, and Senior Vice President of FMR Co., Inc. (investment adviser firm, 2019); Secretary of Fidelity SelectCo, LLC and Fidelity Investments Money Management, Inc. (investment adviser firms, 2019). Prior to joining Fidelity Investments, Ms. Lo Bessette was Executive Vice President, General Counsel (2016-2019) and Senior Vice President, Deputy General Counsel (2015-2016) of OppenheimerFunds (investment management company) and Deputy Chief Legal Officer (2013-2015) of Jennison Associates LLC (investment adviser firm).
Chris Maher (1972)
Year of Election or Appointment: 2020
Year of Election or Appointment: 2013
Assistant Treasurer
Deputy Treasurer
Mr. Maher also serves as an officer of other funds. Mr. Maher serves as Assistant Treasurer of FMR Capital, Inc. (2017-present), and is an employee of Fidelity Investments (2008-present). Previously, Mr. Maher served as Assistant Treasurer of certain funds (2013-2020); Vice President of Asset Management Compliance (2013), Vice President of the Program Management Group of FMR (investment adviser firm, 2010-2013), and Vice President of Valuation Oversight (2008-2010).
John B. McGinty, Jr. (1962)
Year of Election or Appointment: 2016
Chief Compliance Officer
Mr. McGinty also serves as Chief Compliance Officer of other funds. Mr. McGinty is Senior Vice President of Asset Management Compliance for Fidelity Investments and is an employee of Fidelity Investments (2016-present). Mr. McGinty previously served as Vice President, Senior Attorney at Eaton Vance Management (investment management firm, 2015-2016), and prior to Eaton Vance as global CCO for all firm operations and registered investment companies at GMO LLC (investment management firm, 2009-2015). Before joining GMO LLC, Mr. McGinty served as Senior Vice President, Deputy General Counsel for Fidelity Investments (2007-2009).
Jason P. Pogorelec (1975)
Year of Election or Appointment: 2015
Assistant Secretary
Mr. Pogorelec also serves as Assistant Secretary of other funds. Mr. Pogorelec serves as Vice President, Associate General Counsel (2010-present) and is an employee of Fidelity Investments (2006-present).
Kenneth B. Robins (1969)
Year of Election or Appointment: 2016
Chief Compliance Officer
Mr. Robins also serves as an officer of other funds. Mr. Robins serves as Compliance Officer of Fidelity Management & Research Company LLC (investment adviser firm, 2016-present) and is an employee of Fidelity Investments (2004-present). Previously, Mr. Robins served as Compliance Officer of FMR Co., Inc. (investment adviser firm, 2016-2019), as Executive Vice President of Fidelity Investments Money Management, Inc. (investment adviser firm, 2013-2016) and served in other fund officer roles.
Stacie M. Smith (1974)
Year of Election or Appointment: 2016
Year of Election or Appointment: 2013
President and Treasurer
Assistant Treasurer
Ms. Smith also serves as an officer of other funds. Ms. Smith serves as Assistant Treasurer of FMR Capital, Inc. (2017-present), is an employee of Fidelity Investments (2009-present), and has served in other fund officer roles. Prior to joining Fidelity Investments, Ms. Smith served as Senior Audit Manager of Ernst & Young LLP (accounting firm, 1996-2009). Previously, Ms. Smith served as Assistant Treasurer (2013-2019) and Deputy Treasurer (2013-2016) of certain Fidelity® funds.
Marc L. Spector (1972)
Year of Election or Appointment: 2016
Assistant Treasurer
Deputy Treasurer
Mr. Spector also serves as an officer of other funds. Mr. Spector serves as Assistant Treasurer of FMR Capital, Inc. (2017-present) and is an employee of Fidelity Investments (2016-present). Prior to joining Fidelity Investments, Mr. Spector served as Director at the Siegfried Group (accounting firm, 2013-2016), and prior to Siegfried Group as audit senior manager at Deloitte & Touche (accounting firm, 2005-2013).
Jim Wegmann (1979)
Year of Election or Appointment: 2019
Assistant Treasurer
Mr. Wegmann also serves as Assistant Treasurer of other funds. Mr. Wegmann is an employee of Fidelity Investments (2011-present).
Vadim Zlotnikov (1962)
Year of Election or Appointment: 2019
Vice President
Mr. Zlotnikov also serves as Vice President of other funds. Mr. Zlotnikov serves as President and Chief Investment Officer of Global Asset Allocation and is an employee of Fidelity Investments (2018-present). Prior to joining Fidelity Investments, Mr. Zlotnikov served as Co-Head of Multi-Asset Solutions, Chief Market Strategist, and CIO of Systematic Strategies with AllianceBernstein (investment adviser firm, 2013-2018).
Shareholder Expense Example
As a shareholder of the Fund, you incur two types of costs: (1) transaction costs, including sales charges (loads) on purchase payments or redemption proceeds, and (2) ongoing costs, including management fees, distribution and/or service (12b-1) fees and other Fund expenses. This Example is intended to help you understand your ongoing costs (in dollars) of investing in the Fund and to compare these costs with the ongoing costs of investing in other mutual funds.
The Example is based on an investment of $1,000 invested at the beginning of the period and held for the entire period (July 1, 2019 to December 31, 2019).
Actual Expenses
The first line of the accompanying table for each class of the Fund provides information about actual account values and actual expenses. You may use the information in this line, together with the amount you invested, to estimate the expenses that you paid over the period. Simply divide your account value by $1,000.00 (for example, an $8,600 account value divided by $1,000.00 = 8.6), then multiply the result by the number in the first line for a class of the Fund under the heading entitled "Expenses Paid During Period" to estimate the expenses you paid on your account during this period. In addition, the Fund, as a shareholder in the underlying Fidelity Central Funds, will indirectly bear its pro-rata share of the fees and expenses incurred by the underlying Fidelity Central Funds. These fees and expenses are not included in the Fund's annualized expense ratio used to calculate the expense estimate in the table below.
Hypothetical Example for Comparison Purposes
The second line of the accompanying table for each class of the Fund provides information about hypothetical account values and hypothetical expenses based on a Class' actual expense ratio and an assumed rate of return of 5% per year before expenses, which is not the Class' actual return. The hypothetical account values and expenses may not be used to estimate the actual ending account balance or expenses you paid for the period. You may use this information to compare the ongoing costs of investing in the Fund and other funds. To do so, compare this 5% hypothetical example with the 5% hypothetical examples that appear in the shareholder reports of the other funds. In addition, the Fund, as a shareholder in the underlying Fidelity Central Funds, will indirectly bear its pro-rata share of the fees and expenses incurred by the underlying Fidelity Central Funds. These fees and expenses are not included in the Fund's annualized expense ratio used to calculate the expense estimate in the table below.
Please note that the expenses shown in the table are meant to highlight your ongoing costs only and do not reflect any transaction costs. Therefore, the second line of the table is useful in comparing ongoing costs only, and will not help you determine the relative total costs of owning different funds. In addition, if these transactional costs were included, your costs would have been higher.
| | Annualized Expense Ratio-A | Beginning
Account Value
July 1, 2019 | Ending
Account Value
December 31, 2019 | Expenses Paid
During Period-B
July 1, 2019
to December 31, 2019 |
| Class A | .96% | | | |
| Actual | | $1,000.00 | $1,025.60 | $4.90 |
| Hypothetical-C | | $1,000.00 | $1,020.37 | $4.89 |
| Class M | .96% | | | |
| Actual | | $1,000.00 | $1,024.80 | $4.90 |
| Hypothetical-C | | $1,000.00 | $1,020.37 | $4.89 |
| Class C | 1.70% | | | |
| Actual | | $1,000.00 | $1,021.80 | $8.66 |
| Hypothetical-C | | $1,000.00 | $1,016.64 | $8.64 |
| Fidelity Strategic Income Fund | .66% | | | |
| Actual | | $1,000.00 | $1,026.90 | $3.37 |
| Hypothetical-C | | $1,000.00 | $1,021.88 | $3.36 |
| Class I | .71% | | | |
| Actual | | $1,000.00 | $1,026.70 | $3.63 |
| Hypothetical-C | | $1,000.00 | $1,021.63 | $3.62 |
| Class Z | .61% | | | |
| Actual | | $1,000.00 | $1,027.20 | $3.12 |
| Hypothetical-C | | $1,000.00 | $1,022.13 | $3.11 |
A Annualized expense ratio reflects expenses net of applicable fee waivers.
B Expenses are equal to each Class' annualized expense ratio, multiplied by the average account value over the period, multiplied by 184/365 (to reflect the one-half year period). In addition to the expenses noted above, the Fund also indirectly bears its proportional share of the expenses of the underlying Fidelity Central Funds. Annualized expenses of the underlying non-money market Fidelity Central Funds as of their most recent fiscal half year were less than .005%.
C 5% return per year before expenses
Fidelity® Strategic Income Fund
Distributions (Unaudited)
The Board of Trustees of Fidelity Advisor Strategic Income Fund voted to pay to shareholders of record at the opening of business on record date, the following distributions per share derived from capital gains realized from sales of portfolio securities:
| | Pay Date | Record Date | Capital Gains |
| Fidelity Advisor Strategic Income Fund | | | |
| Class A | 02/10/2020 | 02/07/2020 | $0.010 |
| Class M | 02/10/2020 | 02/07/2020 | $0.010 |
| Class C | 02/10/2020 | 02/07/2020 | $0.010 |
| Fidelity Strategic Income Fund | 02/10/2020 | 02/07/2020 | $0.010 |
| Class I | 02/10/2020 | 02/07/2020 | $0.010 |
| Class Z | 02/10/2020 | 02/07/2020 | $0.010 |
|
The fund hereby designates as a capital gain dividend with respect to the taxable year ended December 31, 2019, $120,721,528, or, if subsequently determined to be different, the net capital gain of such year.
A total of 8.98% of the dividends distributed during the fiscal year was derived from interest on U.S. Government securities which is generally exempt from state income tax.
The fund designates $395,215,808 of distributions paid during the period January 1, 2019 to December 31, 2019 as qualifying to be taxed as interest-related dividends for nonresident alien shareholders.
The fund will notify shareholders in January 2020 of amounts for use in preparing 2019 income tax returns.
Board Approval of Investment Advisory Contracts and Management Fees
Fidelity Advisor Strategic Income Fund
Each year, the Board of Trustees, including the Independent Trustees (together, the Board), votes on the renewal of the management contract with Fidelity Management & Research Company (FMR) and the sub-advisory agreements (together, the Advisory Contracts) for the fund. FMR and the sub-advisers are referred to herein as the Investment Advisers. The Board, assisted by the advice of fund counsel and Independent Trustees' counsel, requests and considers a broad range of information relevant to the renewal of the Advisory Contracts throughout the year.
The Board meets regularly and, at each of its meetings, covers an extensive agenda of topics and materials and considers factors that are relevant to its annual consideration of the renewal of the fund's Advisory Contracts, including the services and support provided to the fund and its shareholders. The Board has established four standing committees (Committees) — Operations, Audit, Fair Valuation, and Governance and Nominating — each composed of and chaired by Independent Trustees with varying backgrounds, to which the Board has assigned specific subject matter responsibilities in order to enhance effective decision-making by the Board. The Operations Committee, of which all of the Independent Trustees are members, meets regularly throughout the year and considers, among other matters, information specifically related to the annual consideration of the renewal of the fund's Advisory Contracts. The Board, acting directly and through its Committees, requests and receives information concerning the annual consideration of the renewal of the fund's Advisory Contracts. The Board also meets as needed to review matters specifically related to the Board's annual consideration of the renewal of the Advisory Contracts. Members of the Board may also meet with trustees of other Fidelity funds through joint ad hoc committees to discuss certain matters relevant to all of the Fidelity funds.
At its September 2019 meeting, the Board unanimously determined to renew the fund's Advisory Contracts. In reaching its determination, the Board considered all factors it believed relevant, including (i) the nature, extent, and quality of the services provided to the fund and its shareholders (including the investment performance of the fund); (ii) the competitiveness of the fund's management fee and total expense ratio relative to peer funds; (iii) the total costs of the services provided by and the profits realized by Fidelity from its relationships with the fund; and (iv) the extent to which, if any, economies of scale exist and are realized as the fund grows, and whether any economies of scale are appropriately shared with fund shareholders.
In considering whether to renew the Advisory Contracts for the fund, the Board reached a determination, with the assistance of fund counsel and Independent Trustees' counsel and through the exercise of its business judgment, that the renewal of the Advisory Contracts was in the best interests of the fund and its shareholders and that the compensation payable under the Advisory Contracts was fair and reasonable. The Board's decision to renew the Advisory Contracts was not based on any single factor, but rather was based on a comprehensive consideration of all the information provided to the Board at its meetings throughout the year. The Board, in reaching its determination to renew the Advisory Contracts, was aware that shareholders of the fund have a broad range of investment choices available to them, including a wide choice among funds offered by Fidelity's competitors, and that the fund's shareholders, who have the opportunity to review and weigh the disclosure provided by the fund in its prospectus and other public disclosures, have chosen to invest in this fund, which is part of the Fidelity family of funds.
Approval of Amended and Restated Advisory Contracts. At its September 2019 meeting, the Board also unanimously determined to approve an amended and restated management contract and sub-advisory agreements (Amended and Restated Contracts) in connection with an upcoming consolidation of certain of Fidelity's advisory businesses. The Board considered that, on or about January 1, 2020, Fidelity Investments Money Management, Inc. (FIMM) and FMR Co., Inc. (FMRC) expect to merge with and into FMR and, after the merger, FMR expects to redomicile as a Delaware limited liability company. The Board also approved the termination of the sub-advisory agreements with FIMM and FMRC upon the completion of the merger. The Board noted that references to FMR in the Amended and Restated Contracts would be updated to reflect FMR's new form of organization and domicile and considered that the definition of "group assets" for purposes of the fund's group fee would be modified to avoid double-counting assets once the reorganization is complete. The Board also noted Fidelity's assurance that neither the planned consolidation nor the Amended and Restated Contracts will change the investment processes, the level or nature of services provided, the resources and personnel allocated, trading and compliance operations, or any fees paid by the fund.
Nature, Extent, and Quality of Services Provided. The Board considered Fidelity's staffing as it relates to the fund, including the backgrounds of investment personnel of Fidelity, and also considered the fund's investment objective, strategies, and related investment philosophy. The Independent Trustees also had discussions with senior management of Fidelity's investment operations and investment groups. The Board considered the structure of the investment personnel compensation program and whether this structure provides appropriate incentives to act in the best interests of the fund. Additionally, the Board considered the portfolio managers' investments, if any, in the funds that they manage.
Resources Dedicated to Investment Management and Support Services. The Board reviewed the general qualifications and capabilities of Fidelity's investment staff, including its size, education, experience, and resources, as well as Fidelity's approach to recruiting, managing, and compensating investment personnel. The Board noted that Fidelity has continued to increase the resources devoted to non-U.S. offices, including expansion of Fidelity's global investment organization. The Board also noted that Fidelity's analysts have extensive resources, tools and capabilities that allow them to conduct sophisticated quantitative and fundamental analysis, as well as credit analysis of issuers, counterparties and guarantors. Further, the Board considered that Fidelity's investment professionals have sufficient access to global information and data so as to provide competitive investment results over time, and that those professionals also have access to sophisticated tools that permit them to assess portfolio construction and risk and performance attribution characteristics continuously, as well as to transmit new information and research conclusions rapidly around the world. Additionally, in its deliberations, the Board considered Fidelity's trading, risk management, compliance, and technology and operations capabilities and resources, which are integral parts of the investment management process.
Shareholder and Administrative Services. The Board considered (i) the nature, extent, quality, and cost of advisory, administrative, and shareholder services performed by the Investment Advisers and their affiliates under the Advisory Contracts and under separate agreements covering transfer agency, pricing and bookkeeping, and securities lending services for the fund; (ii) the nature and extent of the supervision of third party service providers, principally custodians, subcustodians, and pricing vendors; and (iii) the resources devoted to, and the record of compliance with, the fund's compliance policies and procedures. The Board also reviewed the allocation of fund brokerage, including allocations to brokers affiliated with the Investment Advisers, the use of brokerage commissions to pay fund expenses, and the use of "soft" commission dollars to pay for research services.
The Board noted that the growth of fund assets over time across the complex allows Fidelity to reinvest in the development of services designed to enhance the value and convenience of the Fidelity funds as investment vehicles. These services include 24-hour access to account information and market information over the Internet and through telephone representatives, investor education materials and asset allocation tools, and the expanded availability of Fidelity Investor Centers.
Investment in a Large Fund Family. The Board considered the benefits to shareholders of investing in a Fidelity fund, including the benefits of investing in a fund that is part of a large family of funds offering a variety of investment disciplines and providing a large variety of mutual fund investor services. The Board noted that Fidelity had taken, or had made recommendations that resulted in the Fidelity funds taking, a number of actions over the previous year that benefited particular funds, including: (i) continuing to dedicate additional resources to Fidelity's investment research process, which includes meetings with management of issuers of securities in which the funds invest, and to the support of the senior management team that oversees asset management; (ii) continuing efforts to enhance Fidelity's global research capabilities; (iii) launching new funds with innovative structures, strategies and pricing and making other enhancements to meet client needs; (iv) launching new share classes of existing funds; (v) eliminating purchase minimums and broadening eligibility requirements for certain funds and share classes; (vi) reducing management fees and total expenses for certain target date funds and index funds; (vii) lowering expense caps for certain existing funds and classes, and converting certain voluntary expense caps to contractual caps, to reduce expenses borne by shareholders; (viii) rationalizing product lines and gaining increased efficiencies from fund mergers, liquidations, and share class consolidations; (ix) continuing to develop, acquire and implement systems and technology to improve services to the funds and shareholders, strengthen information security, and increase efficiency; and (x) continuing to implement enhancements to further strengthen Fidelity's product line to increase investors' probability of success in achieving their investment goals, including retirement income goals.
Investment Performance. The Board considered whether the fund has operated in accordance with its investment objective, as well as its record of compliance with its investment restrictions and its performance history. The Board noted that there were portfolio management changes for the fund in November 2018 and March 2019.
The Board took into account discussions that occur at Board meetings throughout the year with representatives of the Investment Advisers about fund investment performance. In this regard the Board noted that as part of regularly scheduled fund reviews and other reports to the Board on fund performance, the Board considers annualized return information for the fund for different time periods, measured against one or more appropriate securities market indices, including a customized blended index that reflects the respective weights of the fund's asset classes (each a benchmark index) and a peer group of funds with similar objectives (peer group), if any. In its evaluation of fund investment performance at meetings throughout the year, the Board gave particular attention to information indicating underperformance of certain Fidelity funds for specific time periods and discussed with the Investment Advisers the reasons for such underperformance.
In addition to reviewing absolute and relative fund performance, the Independent Trustees periodically consider the appropriateness of fund performance metrics in evaluating the results achieved. In general, the Independent Trustees believe that fund performance should be evaluated based on gross performance (before fees and expenses but after transaction costs) compared to appropriate benchmark indices, over appropriate time periods that may include full market cycles, and on net performance (after fees and expenses) compared to peer groups, as applicable, over the same periods, taking into account relevant factors including the following: general market conditions; expectations for interest rate levels and credit conditions; issuer-specific information including credit quality; and fund cash flows and other factors. Depending on the circumstances, the Independent Trustees may be satisfied with a fund's performance notwithstanding that it lags its benchmark index or peer group for certain periods.
The Independent Trustees recognize that shareholders evaluate performance on a net basis over their own holding periods, for which one-, three-, and five-year periods are often used as a proxy. For this reason, the performance information reviewed by the Board also included net cumulative calendar year total return information for the fund and an appropriate benchmark index and peer group for the most recent one-, three-, and five-year periods.
Based on its review, the Board concluded that the nature, extent, and quality of services provided to the fund under the Advisory Contracts should continue to benefit the shareholders of the fund.
Competitiveness of Management Fee and Total Expense Ratio. The Board considered the fund's management fee and total expense ratio compared to "mapped groups" of competitive funds and classes created for the purpose of facilitating the Trustees' competitive analysis of management fees and total expenses. Fidelity creates "mapped groups" by combining similar Lipper investment objective categories that have comparable investment mandates. Combining Lipper investment objective categories aids the Board's management fee and total expense ratio comparisons by broadening the competitive group used for comparison.
Management Fee. The Board considered two proprietary management fee comparisons for the 12-month periods shown in basis points (BP) in the chart below. The group of Lipper funds used by the Board for management fee comparisons is referred to below as the "Total Mapped Group." The Total Mapped Group comparison focuses on a fund's standing in terms of gross management fees before expense reimbursements or caps relative to the total universe of funds with comparable investment mandates, regardless of whether their management fee structures also are comparable. Funds with comparable investment mandates offer exposure to similar types of securities. Funds with comparable management fee structures have similar management fee contractual arrangements (
e.g., flat rate charged for advisory services, all-inclusive fee rate,
etc.). "TMG %" represents the percentage of funds in the Total Mapped Group that had management fees that were lower than the fund's. For example, a hypothetical TMG % of 20% would mean that 80% of the funds in the Total Mapped Group had higher, and 20% had lower, management fees than the fund. The fund's actual TMG %s and the number of funds in the Total Mapped Group are in the chart below. The "Asset-Size Peer Group" (ASPG) comparison focuses on a fund's standing relative to a subset of non-Fidelity funds within the Total Mapped Group that are similar in size and management fee structure. For example, if a fund is in the first quartile of the ASPG, the fund's management fee ranks in the least expensive or lowest 25% of funds in the ASPG. The ASPG represents at least 15% of the funds in the Total Mapped Group with comparable asset size and management fee structures, subject to a minimum of 50 funds (or all funds in the Total Mapped Group if fewer than 50). Additional information, such as the ASPG quartile in which the fund's management fee rate ranked, is also included in the chart and was considered by the Board.
Fidelity Advisor Strategic Income Fund
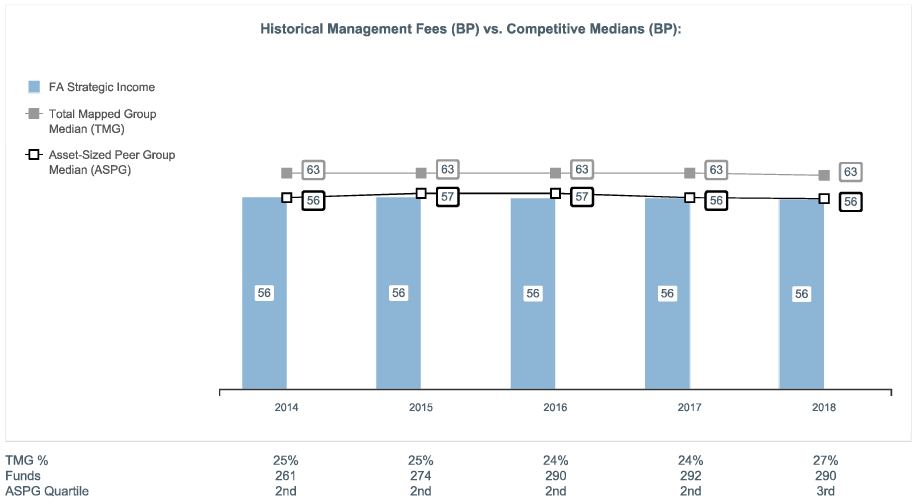
The Board noted that the fund's management fee rate ranked below the median of its Total Mapped Group and equal to the median of its ASPG for 2018.
The Board noted that it and the boards of other Fidelity funds formed an ad hoc Committee on Group Fee, which meets periodically, to conduct an in-depth review of the "group fee" component of the management fee of funds with such management fee structures. The Committee's focus included the mechanics of the group fee, the competitive landscape of group fee structures, Fidelity funds with no group fee component and investment products not included in group fee assets. The Board also considered that, for funds subject to the group fee, FMR agreed to voluntarily waive fees over a specified period of time in amounts designed to account for assets converted from certain funds to certain collective investment trusts.
Based on its review, the Board concluded that the fund's management fee is fair and reasonable in light of the services that the fund receives and the other factors considered.
Total Expense Ratio. In its review of each class's total expense ratio, the Board considered the fund's management fee rate as well as other fund or class expenses, as applicable, such as transfer agent fees, pricing and bookkeeping fees, fund-paid 12b-1 fees, and custodial, legal, and audit fees. The Board also noted that Fidelity may agree to waive fees or reimburse expenses from time to time, and the extent to which, if any, it has done so for the fund. As part of its review, the Board also considered the current and historical total expense ratios of each class of the fund compared to competitive fund median expenses. Each class of the fund is compared to those funds and classes in the Total Mapped Group (used by the Board for management fee comparisons) that have a similar sales load structure.
The Board noted that the total expense ratio of each of Class A, Class M, Class Z, and the retail class ranked below the competitive median for 2018, the total expense ratio of Class C ranked equal to the competitive median for 2018, and the total expense ratio of Class I ranked above the competitive median for 2018. The Board considered that, in general, various factors can affect total expense ratios. The Board noted that the total expense ratio of Class I was above median due to higher transfer agent fees as a result of being primarily composed of omnibus assets, which pay a higher flat asset-based transfer agent fee. The Board noted that the fund offers multiple classes, each of which has a different sales load and 12b-1 fee structure, and that the multiple structures are intended to offer a range of pricing options for the intermediary market. The Board also noted that the total expense ratios of the classes vary primarily by the level of their 12b-1 fees, although differences in transfer agent fees may also cause expenses to vary from class to class.
Fees Charged to Other Fidelity Clients. The Board also considered Fidelity fee structures and other information with respect to clients of Fidelity, such as other funds advised or subadvised by Fidelity, pension plan clients, and other institutional clients with similar mandates. The Board noted that a joint ad hoc committee created by it and the boards of other Fidelity funds periodically reviews and compares Fidelity's institutional investment advisory business with its business of providing services to the Fidelity funds and also noted the most recent findings of the committee. The Board noted that the committee's review included a consideration of the differences in services provided, fees charged, and costs incurred, as well as competition in the markets serving the different categories of clients.
Based on its review of total expense ratios and fees charged to other Fidelity clients, the Board concluded that the total expense ratio of each class of the fund was reasonable in light of the services that the fund and its shareholders receive and the other factors considered.
Costs of the Services and Profitability. The Board considered the revenues earned and the expenses incurred by Fidelity in conducting the business of developing, marketing, distributing, managing, administering and servicing the fund and servicing the fund's shareholders. The Board also considered the level of Fidelity's profits in respect of all the Fidelity funds.
On an annual basis, Fidelity presents to the Board information about the profitability of its relationships with the fund. Fidelity calculates profitability information for each fund, as well as aggregate profitability information for groups of Fidelity funds and all Fidelity funds, using a series of detailed revenue and cost allocation methodologies which originate with the books and records of Fidelity on which Fidelity's audited financial statements are based. The Audit Committee of the Board reviews any significant changes from the prior year's methodologies and the full Board approves such changes.
PricewaterhouseCoopers LLP (PwC), auditor to Fidelity and certain Fidelity funds, has been engaged annually by the Board as part of the Board's assessment of Fidelity's profitability analysis. PwC's engagement includes the review and assessment of the methodologies used by Fidelity in determining the revenues and expenses attributable to Fidelity's mutual fund business, and completion of agreed-upon procedures in respect of the mathematical accuracy of the fund profitability information and its conformity to established allocation methodologies. After considering PwC's reports issued under the engagement and information provided by Fidelity, the Board concluded that while other allocation methods may also be reasonable, Fidelity's profitability methodologies are reasonable in all material respects.
The Board also reviewed Fidelity’s non-fund businesses and potential indirect benefits such businesses may have received as a result of their association with Fidelity’s mutual fund business (i.e., fall-out benefits) as well as cases where Fidelity’s affiliates may benefit from the funds’ business. The Board noted that changes to fall-out benefits year-over-year reflect business developments at Fidelity’s various businesses. The Board considered that a joint ad hoc committee created by it and the boards of other Fidelity funds had recently been established, and meets periodically, to evaluate potential fall-out benefits. The Board noted that the committee was expected to, among other things: (i) discuss the legal framework surrounding potential fall-out benefits; (ii) review the Board’s responsibilities and approach to potential fall-out benefits; and (iii) review practices employed by competitor funds regarding the review of potential fall-out benefits. The Board noted that it would consider the committee’s findings in connection with future consideration of contract renewals.
The Board considered the costs of the services provided by and the profits realized by Fidelity in connection with the operation of the fund and was satisfied that the profitability was not excessive.
Economies of Scale. The Board considered whether there have been economies of scale in respect of the management of the Fidelity funds, whether the Fidelity funds (including the fund) have appropriately benefited from any such economies of scale, and whether there is potential for realization of any further economies of scale. The Board considered the extent to which the fund will benefit from economies of scale as assets grow through increased services to the fund, through waivers or reimbursements, or through fee or expense ratio reductions. The Board also noted that a committee (the Economies of Scale Committee) created by it and the boards of other Fidelity funds periodically analyzes whether Fidelity attains economies of scale in respect of the management and servicing of the Fidelity funds, whether the Fidelity funds have appropriately benefited from such economies of scale, and whether there is potential for realization of any further economies of scale.
The Board recognized that the fund's management contract incorporates a "group fee" structure, which provides for lower group fee rates as total "group assets" increase, and for higher group fee rates as total "group assets" decrease ("group assets" as defined in the management contract). FMR calculates the group fee rates based on a tiered asset "breakpoint" schedule that varies based on asset class. The Board considered that the group fee is designed to deliver the benefits of economies of scale to fund shareholders when total Fidelity fund assets increase, even if assets of any particular fund are unchanged or have declined, because some portion of Fidelity's costs are attributable to services provided to all Fidelity funds, and all funds benefit if those costs can be allocated among more assets. The Board concluded that, given the group fee structure, fund shareholders will benefit from lower management fees as "group assets" increase at the fund complex level, regardless of whether Fidelity achieves any such economies of scale.
The Board concluded, taking into account the analysis of the Economies of Scale Committee, that economies of scale, if any, are being appropriately shared between fund shareholders and Fidelity.
Additional Information Requested by the Board. In order to develop fully the factual basis for consideration of the Fidelity funds' advisory contracts, the Board requested and received additional information on certain topics, including: (i) Fidelity's fund profitability methodology, profitability trends for certain funds, the allocation of various costs to different funds, and the impact of certain factors on fund profitability results; (ii) portfolio manager changes that have occurred during the past year and the amount of the investment that each portfolio manager has made in the Fidelity fund(s) that he or she manages; (iii) Fidelity's compensation structure for portfolio managers, research analysts, and other key personnel, including its effects on fund profitability, the rationale for the compensation structure, and the extent to which current market conditions have affected retention and recruitment; (iv) the arrangements with and compensation paid to certain fund sub-advisers on behalf of the Fidelity funds and the treatment of such compensation within Fidelity's fund profitability methodology; (v) the practices of certain sub-advisers regarding their receipt of research from broker-dealers that execute the funds' portfolio transactions; (vi) the terms of Fidelity's voluntary expense limitation agreements; (vii) the methodology with respect to competitive fund data and peer group classifications; (viii) Fidelity's transfer agent fee, expense, and service structures for different funds and classes relative to competitive trends, and the impact of the increased use of omnibus accounts; (ix) new developments in the retail and institutional marketplaces and the competitive positioning of the funds relative to other investment products and services; (x) the impact on fund profitability of recent changes in total net assets for Fidelity's money market funds, anticipated changes to the competitive landscape for money market funds, and the level of investor comfort with gates, fees, and floating NAVs; (xi) the funds' share class structures and distribution channels; and (xii) explanations regarding the relative total expense ratios of certain funds and classes, total expense competitive trends and methodologies for total expense competitive comparisons, and actions that might be taken by Fidelity to reduce total expense ratios for certain classes. In addition, the Board considered its discussions with Fidelity throughout the year regarding enhanced information security initiatives and the funds' fair valuation policies.
Based on its evaluation of all of the conclusions noted above, and after considering all factors it believed relevant, the Board concluded that the advisory fee arrangements are fair and reasonable, and that the fund's Advisory Contracts should be renewed and the fund's Amended and Restated Contracts should be approved.
The following are the financial statements for the Fidelity® Emerging Markets Debt Central Fund as of December 31, 2019 which is a direct investment of Fidelity® Strategic Income Fund.
Fidelity® Emerging Markets Debt Central Fund
Performance: The Bottom Line
Average annual total return reflects the change in the value of an investment, assuming reinvestment of distributions from dividend income and capital gains (the profits earned upon the sale of securities that have grown in value, if any) and assuming a constant rate of performance each year. The hypothetical investment and the average annual total returns do not reflect the deduction of taxes that a shareholder would pay on fund distributions or the redemption of fund shares. During periods of reimbursement by Fidelity, a fund’s total return will be greater than it would be had the reimbursement not occurred. How a fund did yesterday is no guarantee of how it will do tomorrow.
Average Annual Total Returns
| For the periods ended December 31, 2019 | Past 1 year | Past 5 years | Life of fundA |
| Fidelity® Emerging Markets Debt Central Fund | 10.48% | 6.88% | 6.56% |
A From March 17, 2011
$10,000 Over Life of Fund
Let's say hypothetically that $10,000 was invested in Fidelity® Emerging Markets Debt Central Fund on March 17, 2011, when the fund started.
The chart shows how the value of your investment would have changed, and also shows how the Bloomberg Barclays Emerging Markets Aggregate USD Bond Index performed over the same period.
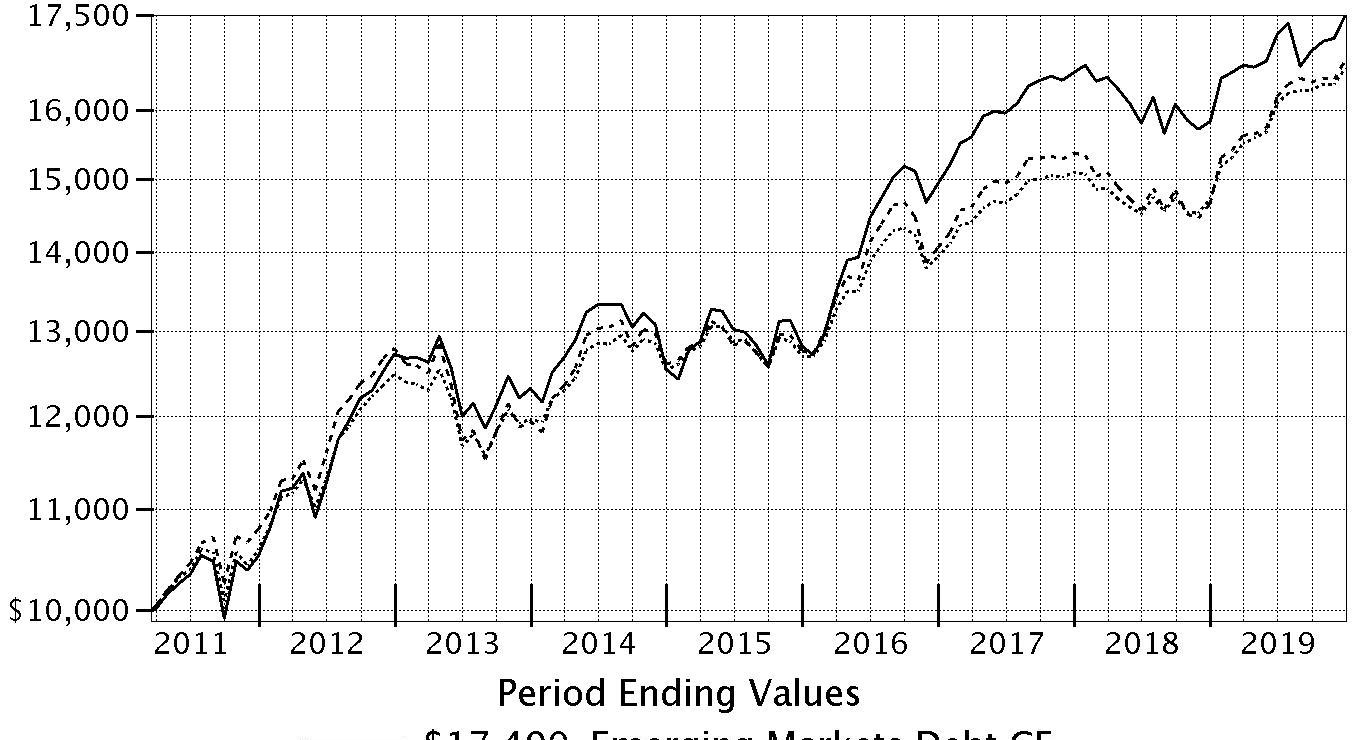
| Period Ending Values |
| $17,490 | Fidelity® Emerging Markets Debt Central Fund |
| $16,647 | Bloomberg Barclays Emerging Markets Aggregate USD Bond Index |
| $16,778 | J.P. Morgan Emerging Markets Bond Index Global |
Fidelity® Emerging Markets Debt Central Fund
Management's Discussion of Fund Performance
Market Recap: Emerging-markets debt gained 14.42% in 2019, as measured by the J.P. Morgan Emerging Markets Bond Index Global. The asset class reacted favorably to the U.S. Federal Reserve's shift away from its monetary tightening bias, and its move to cut interest rates three times in 2019. In addition, the U.S. and China reportedly reached an agreement late in the year to reduce certain U.S. tariffs, providing a tactical boost to sentiment after sustained escalation the past two years. These factors helped support a generally "risk on" environment, with all but a few of the index's country components gaining for the year. Ukraine (+32%) was a standout, as the bond market here continued to attract investors due to the nation’s high real interest rates and policy momentum driven by President Volodymyr Zelensky, who took office in May. Improved oil prices boosted oil-sensitive credits and markets, including Mexico (+21%), where bonds of Pemex, the country’s state-owned oil company, gained. Mexico was the index’s largest country component in 2019, at 11%, on average. Conversely, Lebanon (-36%) and Argentina (-24%) fared worst. Lebanon’s economy remained in jeopardy and its political future uncertain, as the country’s prime minister, Saad Hariri, resigned in late October amid mass antigovernment protests. Political and economic woes also weighed on Argentina, although this market recovered late in the year as a newly elected government took shape.
Comments from Co-Portfolio Managers Timothy Gill and Jonathan Kelly: For the year, the fund gained 10.48%, lagging the 13.11% advance of the benchmark Bloomberg Barclays Emerging Markets Aggregate USD Bond Index. The fund’s underperformance of the benchmark was primarily due to an overweighting in Argentina, which significantly lagged the broader market for the year. The fund’s cash position of roughly 9%, on average, weighed on relative performance amid the strong market backdrop. Choices in Kazakhstan and the United States hurt, as did positioning in Indonesia and picks in Brazil. Our overweighting in Venezuela also notably detracted, although we had strong bond choices there. Conversely, we benefited from an underweighting in China, where the nation’s generally higher-quality bonds underperformed due to investors’ appetite for riskier bond categories. Security selection in Russia also helped. An overweighting in Ukraine helped, although the negative of choices among bonds there somewhat offset this positive. Bond choices in Mexico were another positive.
The views expressed above reflect those of the portfolio manager(s) only through the end of the period as stated on the cover of this report and do not necessarily represent the views of Fidelity or any other person in the Fidelity organization. Any such views are subject to change at any time based upon market or other conditions and Fidelity disclaims any responsibility to update such views. These views may not be relied on as investment advice and, because investment decisions for a Fidelity fund are based on numerous factors, may not be relied on as an indication of trading intent on behalf of any Fidelity fund.
Note to shareholders: As part of a regular review of its organizational structure, Fidelity has decided to merge certain entities to streamline operations, increase efficiency, simplify reporting, and reduce legal, compliance, and accounting complexity and costs. In separate events, Fidelity has merged four of its investment advisers and two of its broker-dealers.
Effective on or about January 1, 2020, following any required regulatory notices and approvals:
Investment advisers Fidelity Investments Money Management, Inc., FMR Co., Inc., and Fidelity SelectCo, LLC, merged with and into Fidelity Management & Research Company. In connection with the merger transactions, the resulting, merged investment adviser was then redomiciled from Massachusetts to Delaware, changed its corporate structure from a corporation to a limited liability company, and changed its name to “Fidelity Management & Research Company LLC”.
Broker-dealer Fidelity Distributors Corporation merged with and into Fidelity Investments Institutional Services Company, Inc. (“FIISC”). FIISC was then redomiciled from Massachusetts to Delaware, changed its corporate structure from a corporation to a limited liability company, and changed its name to “Fidelity Distributors Company LLC”.
These mergers are not expected to affect fund shareholders or Fidelity clients, nor are they expected to result in any changes to the day-to-day management of Fidelity’s brokerage services, the Fidelity funds, their investment policies and practices, their portfolio management teams, or the funds’ expenses.
On April 15, 2019, the fund changed its benchmark from the J.P. Morgan Emerging Markets Bond Index Global to the Bloomberg Barclays Emerging Markets Aggregate USD Bond Index.
Fidelity® Emerging Markets Debt Central Fund
Investment Summary (Unaudited)
Top Five Countries as of December 31, 2019
| (excluding cash equivalents) | % of fund's net assets |
| Mexico | 8.9 |
| Argentina | 7.5 |
| Turkey | 6.8 |
| United States of America | 6.4 |
| Ukraine | 4.9 |
Percentages are adjusted for the effect of futures contracts, if applicable.
Top Five Holdings as of December 31, 2019
| (by issuer, excluding cash equivalents) | % of fund's net assets |
| Ukraine Government | 4.8 |
| Turkish Republic | 4.6 |
| U.S. Treasury Obligations | 4.4 |
| Petroleos Mexicanos | 4.0 |
| Ministry of Finance of the Russian Federation | 3.8 |
| | 21.6 |
Asset Allocation (% of fund's net assets)
| As of December 31, 2019 |
| | Corporate Bonds | 38.2% |
| | Government Obligations | 44.7% |
| | Supranational Obligations | 0.2% |
| | Preferred Securities | 2.6% |
| | Short-Term Investments and Net Other Assets (Liabilities) | 14.3% |

Fidelity® Emerging Markets Debt Central Fund
Schedule of Investments December 31, 2019
Showing Percentage of Net Assets
| Nonconvertible Bonds - 38.2% | | | |
| | | Principal Amount(a) | Value |
| Argentina - 2.5% | | | |
| Aeropuertos Argentina 2000 SA 6.875% 2/1/27 (b) | | $14,790,000 | $14,175,291 |
| Banco Macro SA 6.75% 11/4/26 (b)(c) | | 11,510,000 | 8,722,422 |
| Cablevision SA 6.5% 6/15/21 (b) | | 2,466,000 | 2,364,278 |
| Inversiones y Representaciones SA 11.5% 7/20/20 (Reg. S) | | 65,000 | 62,969 |
| Pampa Holding SA: | | | |
| 7.375% 7/21/23 (b) | | 4,260,000 | 3,995,081 |
| 7.5% 1/24/27 (b) | | 2,185,000 | 1,856,567 |
| Pan American Energy LLC 7.875% 5/7/21 (b) | | 1,307,333 | 1,358,810 |
| Transportadora de Gas del Sur SA 6.75% 5/2/25 (b) | | 5,965,000 | 5,239,880 |
| YPF SA: | | | |
| 8.5% 3/23/21 (b) | | 6,777,000 | 6,709,230 |
| 8.5% 6/27/29 (b) | | 2,750,000 | 2,482,734 |
| 8.75% 4/4/24 (b) | | 27,910,000 | 27,107,588 |
|
| TOTAL ARGENTINA | | | 74,074,850 |
|
| Austria - 0.2% | | | |
| ESAL GmbH 6.25% 2/5/23 (b) | | 1,289,000 | 1,301,890 |
| JBS Investments II GmbH 7% 1/15/26 (b) | | 5,370,000 | 5,841,647 |
|
| TOTAL AUSTRIA | | | 7,143,537 |
|
| Azerbaijan - 0.1% | | | |
| Southern Gas Corridor CJSC 6.875% 3/24/26 (b) | | 3,570,000 | 4,246,738 |
| Bahrain - 0.3% | | | |
| The Oil and Gas Holding Co.: | | | |
| 7.5% 10/25/27 (b) | | 5,365,000 | 6,184,839 |
| 7.625% 11/7/24 (b) | | 2,690,000 | 3,121,241 |
|
| TOTAL BAHRAIN | | | 9,306,080 |
|
| Belarus - 0.0% | | | |
| Development Bank of the Republic of Belarus 6.75% 5/2/24 (b) | | 1,300,000 | 1,369,063 |
| Bermuda - 0.6% | | | |
| Digicel Group Ltd. 6.75% 3/1/23 (b) | | 4,120,000 | 2,392,175 |
| GeoPark Ltd. 6.5% 9/21/24 (b) | | 800,000 | 833,750 |
| Qtel International Finance Ltd.: | | | |
| 3.25% 2/21/23 (b) | | 9,635,000 | 9,803,613 |
| 3.75% 6/22/26 (b) | | 1,225,000 | 1,289,313 |
| 5% 10/19/25 (b) | | 2,880,000 | 3,204,000 |
|
| TOTAL BERMUDA | | | 17,522,851 |
|
| Brazil - 0.3% | | | |
| Globo Comunicacao e Participacoes SA: | | | |
| 4.843% 6/8/25 (b) | | 5,045,000 | 5,215,269 |
| 4.875% 4/11/22 (b) | | 3,540,000 | 3,672,750 |
|
| TOTAL BRAZIL | | | 8,888,019 |
|
| British Virgin Islands - 1.4% | | | |
| 1MDB Global Investments Ltd. 4.4% 3/9/23 | | 31,500,000 | 30,614,063 |
| Central American Bottling Corp. 5.75% 1/31/27 (b) | | 1,295,000 | 1,367,439 |
| Gold Fields Orogen Holding BVI Ltd.: | | | |
| 4.875% 10/7/20 (b) | | 2,637,000 | 2,676,555 |
| 5.125% 5/15/24 (b) | | 1,235,000 | 1,318,363 |
| Sinopec Group Overseas Development Ltd. 3.68% 8/8/49 (b) | | 3,915,000 | 4,022,663 |
|
| TOTAL BRITISH VIRGIN ISLANDS | | | 39,999,083 |
|
| Canada - 1.0% | | | |
| First Quantum Minerals Ltd. 7.25% 4/1/23 (b) | | 20,970,000 | 21,714,435 |
| Frontera Energy Corp. 9.7% 6/25/23 (b) | | 6,430,000 | 6,747,481 |
|
| TOTAL CANADA | | | 28,461,916 |
|
| Cayman Islands - 0.8% | | | |
| Banco Do Brasil SA: | | | |
| 4.625% 1/15/25 (b) | | 2,150,000 | 2,246,750 |
| 4.875% 4/19/23 (b) | | 1,290,000 | 1,356,113 |
| Comcel Trust 6.875% 2/6/24 (b) | | 11,400,000 | 11,727,750 |
| Itau Unibanco Holding SA 5.125% 5/13/23 (Reg. S) | | 2,735,000 | 2,885,425 |
| Lamar Funding Ltd. 3.958% 5/7/25(b) | | 625,000 | 609,375 |
| NagaCorp Ltd. 9.375% 5/21/21 (b) | | 1,535,000 | 1,626,333 |
| Odebrecht Finance Ltd.: | | | |
| 4.375% 4/25/25 (b)(d) | | 11,075,000 | 501,836 |
| 7.125% 6/26/42 (b)(d) | | 14,263,000 | 641,835 |
| Shimao Property Holdings Ltd. 4.75% 7/3/22 | | 1,790,000 | 1,828,597 |
| Sparc Em Spc 0% 12/5/22 (b) | | 678,510 | 651,376 |
|
| TOTAL CAYMAN ISLANDS | | | 24,075,390 |
|
| Colombia - 0.3% | | | |
| Banco de Bogota SA 6.25% 5/12/26 (b) | | 1,250,000 | 1,401,172 |
| Colombia Telecomunicaciones SA 5.375% 9/27/22 (b) | | 7,958,000 | 8,030,119 |
|
| TOTAL COLOMBIA | | | 9,431,291 |
|
| Curacao - 0.1% | | | |
| Teva Pharmaceutical Finance Co. BV: | | | |
| 2.95% 12/18/22 | | 3,125,000 | 2,984,375 |
| 3.65% 11/10/21 | | 1,030,000 | 1,008,113 |
|
| TOTAL CURACAO | | | 3,992,488 |
|
| Dominican Republic - 0.1% | | | |
| Banco de Reservas de La Republica Dominicana 7% 2/1/23 (b) | | 2,475,000 | 2,601,844 |
| Georgia - 0.6% | | | |
| Georgia Bank Joint Stock Co. 6% 7/26/23 (b) | | 10,095,000 | 10,599,750 |
| Georgian Oil & Gas Corp. 6.75% 4/26/21 (b) | | 5,263,000 | 5,447,205 |
| JSC Georgian Railway 7.75% 7/11/22 (b) | | 1,290,000 | 1,412,550 |
| TBC Bank JSC 5.75% 6/19/24 (b) | | 1,445,000 | 1,488,802 |
|
| TOTAL GEORGIA | | | 18,948,307 |
|
| Indonesia - 0.8% | | | |
| Delta Merlin Dunia Tekstil PT 8.625% 3/12/24(b)(d) | | 1,970,000 | 147,750 |
| PT Adaro Indonesia 4.25% 10/31/24 (b) | | 10,460,000 | 10,329,250 |
| PT Bukit Makmur Mandiri Utama 7.75% 2/13/22 (b) | | 12,515,000 | 12,937,381 |
|
| TOTAL INDONESIA | | | 23,414,381 |
|
| Ireland - 1.0% | | | |
| Alfa Bond Issuance PLC 5.95% 4/15/30 (b)(c) | | 2,605,000 | 2,634,306 |
| Bonitron Designated Activity Co. 8.75% 10/30/22 (b) | | 8,445,000 | 8,999,203 |
| Borets Finance DAC 6.5% 4/7/22 (b) | | 5,620,000 | 5,825,481 |
| C&W Senior Financing Designated Activity Co. 6.875% 9/15/27 (b) | | 1,950,000 | 2,085,194 |
| CBOM Finance PLC 5.55% 2/14/23 (b) | | 3,990,000 | 4,112,194 |
| Celtic Resources Holdings DAC 4.125% 10/9/24 (b) | | 3,700,000 | 3,810,771 |
| MTS International Funding Ltd. 5% 5/30/23 (b) | | 1,465,000 | 1,565,719 |
|
| TOTAL IRELAND | | | 29,032,868 |
|
| Kazakhstan - 0.2% | | | |
| BTA Bank JSC 5.5% 12/21/22 (b) | | 5,707,147 | 5,757,085 |
| KazMunaiGaz National Co. 4.75% 4/24/25 (b) | | 1,325,000 | 1,447,977 |
|
| TOTAL KAZAKHSTAN | | | 7,205,062 |
|
| Korea (South) - 0.3% | | | |
| Export-Import Bank of Korea 6.2% 8/7/21 (b) | INR | 284,300,000 | 3,962,217 |
| POSCO 4% 8/1/23 (b) | | 3,155,000 | 3,299,598 |
|
| TOTAL KOREA (SOUTH) | | | 7,261,815 |
|
| Luxembourg - 2.2% | | | |
| CSN Resources SA: | | | |
| 6.5% 7/21/20 (b) | | 7,478,000 | 7,583,159 |
| 7.625% 2/13/23 (b) | | 19,000,000 | 20,270,625 |
| Millicom International Cellular SA: | | | |
| 6% 3/15/25 (b) | | 4,210,000 | 4,366,559 |
| 6.625% 10/15/26 (Reg. S) | | 1,475,000 | 1,628,953 |
| Petrobras International Finance Co. Ltd. 6.875% 1/20/40 | | 7,773,000 | 9,087,123 |
| Rumo Luxembourg Sarl 7.375% 2/9/24 (b) | | 15,810,000 | 17,030,334 |
| Usiminas International SARL 5.875% 7/18/26 (b) | | 3,005,000 | 3,128,956 |
|
| TOTAL LUXEMBOURG | | | 63,095,709 |
|
| Mauritius - 0.4% | | | |
| HTA Group Ltd. 9.125% 3/8/22 (b) | | 7,440,000 | 7,679,475 |
| MTN (Mauritius) Investments Ltd.: | | | |
| 5.373% 2/13/22 (b) | | 1,400,000 | 1,445,500 |
| 6.5% 10/13/26 (b) | | 2,670,000 | 2,953,688 |
|
| TOTAL MAURITIUS | | | 12,078,663 |
|
| Mexico - 7.2% | | | |
| America Movil S.A.B. de CV 6.45% 12/5/22 | MXN | 224,420,000 | 11,487,319 |
| Axtel S.A.B. de CV 6.375% 11/14/24 (b) | | 3,725,000 | 3,929,875 |
| BBVA Bancomer SA 7.25% 4/22/20 (b) | | 2,600,000 | 2,619,500 |
| Braskem Idesa SAPI 7.45% 11/15/29 (b) | | 4,600,000 | 4,887,500 |
| CEMEX S.A.B. de CV 7.75% 4/16/26 (b) | | 2,630,000 | 2,873,275 |
| Credito Real S.A.B. de CV 9.5% 2/7/26 (b) | | 3,775,000 | 4,310,578 |
| Elementia S.A.B. de CV 5.5% 1/15/25 (b) | | 4,230,000 | 4,282,875 |
| Metalsa SA de CV 4.9% 4/24/23 (b) | | 10,737,000 | 11,119,506 |
| Pemex Project Funding Master Trust: | | | |
| 6.625% 6/15/35 | | 21,800,000 | 22,301,400 |
| 6.625% 6/15/38 | | 25,000 | 24,898 |
| 8.625% 2/1/22 | | 1,575,000 | 1,740,375 |
| 8.625% 12/1/23 (c) | | 930,000 | 1,036,885 |
| Petroleos Mexicanos: | | | |
| 3 month U.S. LIBOR + 3.650% 5.5384% 3/11/22 (c)(e) | | 4,025,000 | 4,193,587 |
| 3.5% 1/30/23 | | 13,620,000 | 13,700,869 |
| 4.875% 1/24/22 | | 3,850,000 | 3,990,766 |
| 4.875% 1/18/24 | | 26,725,000 | 28,141,425 |
| 5.375% 3/13/22 | | 1,500,000 | 1,571,250 |
| 6.5% 6/2/41 | | 5,910,000 | 5,858,288 |
| 6.75% 9/21/47 | | 26,042,000 | 26,269,868 |
| 7.69% 1/23/50 (b) | | 30,929,000 | 33,889,215 |
| TV Azteca SA de CV 8.25% 8/9/24 (Reg. S) | | 26,115,000 | 23,315,798 |
|
| TOTAL MEXICO | | | 211,545,052 |
|
| Mongolia - 0.3% | | | |
| Development Bank of Mongolia 7.25% 10/23/23(b) | | 1,930,000 | 2,042,181 |
| Trade and Development Bank of Mongolia LLC 9.375% 5/19/20 (b) | | 7,403,000 | 7,541,806 |
|
| TOTAL MONGOLIA | | | 9,583,987 |
|
| Morocco - 0.1% | | | |
| OCP SA 6.875% 4/25/44 (b) | | 1,260,000 | 1,605,319 |
| Netherlands - 4.5% | | | |
| Cimpor Financial Operations BV 5.75% 7/17/24 (b) | | 10,725,000 | 8,898,398 |
| GTH Finance BV 7.25% 4/26/23 (b) | | 9,140,000 | 10,284,419 |
| IHS Netherlands Holdco BV 7.125% 3/18/25 (b) | | 8,445,000 | 8,803,913 |
| Metinvest BV 7.75% 4/23/23 (b) | | 17,130,000 | 17,965,088 |
| Nostrum Oil & Gas Finance BV 8% 7/25/22 (b) | | 30,870,000 | 14,007,263 |
| Petrobras Global Finance BV: | | | |
| 5.093% 1/15/30 (b) | | 7,021,000 | 7,508,960 |
| 5.999% 1/27/28 | | 3,737,000 | 4,255,509 |
| 6.25% 3/17/24 | | 9,840,000 | 11,026,950 |
| 6.9% 3/19/49 | | 2,160,000 | 2,535,300 |
| 8.75% 5/23/26 | | 16,145,000 | 20,738,253 |
| SABIC Capital II BV 4% 10/10/23 (b) | | 9,280,000 | 9,760,241 |
| VTR Finance BV 6.875% 1/15/24 (b) | | 16,415,000 | 16,856,153 |
|
| TOTAL NETHERLANDS | | | 132,640,447 |
|
| Nigeria - 0.1% | | | |
| Fidelity Bank PLC 10.5% 10/16/22 (b) | | 3,485,000 | 3,901,022 |
| Paraguay - 0.1% | | | |
| Telefonica Celular del Paraguay SA 5.875% 4/15/27 (b) | | 2,585,000 | 2,776,452 |
| Peru - 0.4% | | | |
| Alicorp SA 6.875% 4/17/27 (b) | PEN | 1,645,000 | 535,879 |
| Telefonica del Peru SA 7.375% 4/10/27 (b) | PEN | 30,265,000 | 9,763,272 |
|
| TOTAL PERU | | | 10,299,151 |
|
| Saudi Arabia - 1.8% | | | |
| Saudi Arabian Oil Co.: | | | |
| 2.875% 4/16/24 (b) | | 2,290,000 | 2,321,488 |
| 3.5% 4/16/29 (b) | | 16,095,000 | 16,688,503 |
| 4.25% 4/16/39 (b) | | 16,825,000 | 17,981,719 |
| 4.375% 4/16/49 (b) | | 13,200,000 | 14,520,000 |
|
| TOTAL SAUDI ARABIA | | | 51,511,710 |
|
| Singapore - 0.8% | | | |
| Indika Energy Capital II Pte. Ltd. 6.875% 4/10/22 (b) | | 14,210,000 | 14,756,197 |
| Medco Strait Services Pte. Ltd. 8.5% 8/17/22 (b) | | 3,615,000 | 3,845,456 |
| TBG Global Pte. Ltd. 5.25% 2/10/22 (Reg. S) | | 5,650,000 | 5,708,930 |
|
| TOTAL SINGAPORE | | | 24,310,583 |
|
| South Africa - 1.7% | | | |
| Eskom Holdings SOC Ltd.: | | | |
| 5.75% 1/26/21 (b) | | 32,900,000 | 32,941,125 |
| 5.75% 1/26/21 (Reg. S) | | 7,270,000 | 7,279,088 |
| 6.75% 8/6/23 (b) | | 5,575,000 | 5,672,563 |
| 7.125% 2/11/25 (b) | | 4,770,000 | 4,871,363 |
|
| TOTAL SOUTH AFRICA | | | 50,764,139 |
|
| Togo - 0.1% | | | |
| Ecobank Transnational, Inc. 9.5% 4/18/24 (b) | | 3,860,000 | 4,314,756 |
| Tunisia - 0.2% | | | |
| Banque Centrale de Tunisie 5.75% 1/30/25 (b) | | 5,675,000 | 5,281,297 |
| Turkey - 2.0% | | | |
| Akbank TAS 7.2% 3/16/27 (b)(c) | | 5,465,000 | 5,326,667 |
| Petkim Petrokimya Holding A/S 5.875% 1/26/23 (b) | | 13,125,000 | 13,149,609 |
| T.C. Ziraat Bankasi A/S 5.125% 5/3/22 (b) | | 6,135,000 | 6,110,077 |
| Turk Sise ve Cam Fabrikalari A/S: | | | |
| 4.25% 5/9/20 (b) | | 205,000 | 204,488 |
| 6.95% 3/14/26 (b) | | 2,595,000 | 2,753,944 |
| Turk Telekomunikasyon A/S 6.875% 2/28/25 (b) | | 2,600,000 | 2,775,500 |
| Turkiye Garanti Bankasi A/S 6.125% 5/24/27 (b)(c) | | 5,905,000 | 5,585,761 |
| Turkiye Is Bankasi A/S: | | | |
| 5% 4/30/20 (b) | | 2,800,000 | 2,804,900 |
| 5.5% 4/21/22 (b) | | 3,815,000 | 3,853,150 |
| Turkiye Vakiflar Bankasi TAO 5.75% 1/30/23 (b) | | 17,010,000 | 16,754,850 |
|
| TOTAL TURKEY | | | 59,318,946 |
|
| Ukraine - 0.1% | | | |
| Naftogaz of Ukraine NJSC 7.625% 11/8/26 (b) | | 1,955,000 | 1,986,769 |
| United Arab Emirates - 0.5% | | | |
| ADES International Holding Ltd. 8.625% 4/24/24 (b) | | 6,360,000 | 6,610,425 |
| DP World Ltd. 5.625% 9/25/48 (b) | | 2,475,000 | 2,859,398 |
| Oztel Holdings SPC Ltd. 5.625% 10/24/23 (b) | | 3,445,000 | 3,670,002 |
|
| TOTAL UNITED ARAB EMIRATES | | | 13,139,825 |
|
| United Kingdom - 3.0% | | | |
| Biz Finance PLC 9.625% 4/27/22 (b) | | 5,092,917 | 5,347,563 |
| DTEK Finance PLC 10.75% 12/31/24 pay-in-kind (c) | | 28,105,000 | 28,509,009 |
| NAK Naftogaz Ukraine 7.375% 7/19/22 (Reg. S) | | 2,170,000 | 2,251,374 |
| Oschadbank Via SSB #1 PLC 9.375% 3/10/23 (b) | | 2,682,750 | 2,827,786 |
| Polyus Finance PLC 5.25% 2/7/23 (b) | | 2,755,000 | 2,937,519 |
| Tullow Oil PLC 6.25% 4/15/22 (b) | | 14,665,000 | 13,221,414 |
| Ukraine Railways via Shortline PLC 9.875% 9/15/21 (b) | | 4,111,600 | 4,265,785 |
| Vedanta Resources Finance II PLC 9.25% 4/23/26 (b) | | 4,220,000 | 4,205,143 |
| Vedanta Resources PLC: | | | |
| 6.375% 7/30/22 (b) | | 24,040,000 | 23,536,663 |
| 8.25% 6/7/21 (b) | | 985,000 | 1,022,861 |
|
| TOTAL UNITED KINGDOM | | | 88,125,117 |
|
| United States of America - 2.0% | | | |
| Azul Investments LLP 5.875% 10/26/24 (b) | | 7,295,000 | 7,561,723 |
| CEMEX Finance LLC 6% 4/1/24 (b) | | 1,485,000 | 1,523,981 |
| Citgo Holding, Inc. 9.25% 8/1/24 (b) | | 5,435,000 | 5,829,038 |
| Citgo Petroleum Corp. 6.25% 8/15/22 (b) | | 14,355,000 | 14,552,381 |
| Kosmos Energy Ltd. 7.125% 4/4/26 (b) | | 11,545,000 | 11,783,116 |
| Stillwater Mining Co. 6.125% 6/27/22 (b) | | 15,870,000 | 16,227,075 |
|
| TOTAL UNITED STATES OF AMERICA | | | 57,477,314 |
|
| Venezuela - 0.1% | | | |
| Petroleos de Venezuela SA: | | | |
| 5.375% 4/12/27 (d) | | 5,000,000 | 387,500 |
| 5.5% 4/12/37 (d) | | 330,000 | 25,575 |
| 6% 5/16/24 (b)(d) | | 9,685,000 | 750,588 |
| 6% 11/15/26 (b)(d) | | 12,130,000 | 940,075 |
| 9.75% 5/17/35 (b)(d) | | 1,315,000 | 101,913 |
| 12.75% 2/17/22 (b)(d) | | 1,310,000 | 101,525 |
|
| TOTAL VENEZUELA | | | 2,307,176 |
|
| TOTAL NONCONVERTIBLE BONDS | | | |
| (Cost $1,132,138,689) | | | 1,123,039,017 |
|
| Government Obligations - 44.7% | | | |
| Angola - 0.2% | | | |
| Angola Republic 9.5% 11/12/25 (b) | | 4,090,000 | 4,778,909 |
| Argentina - 5.0% | | | |
| Argentine Republic: | | | |
| 5.625% 1/26/22 | | 37,185,000 | 19,324,580 |
| 6.875% 4/22/21 | | 61,925,000 | 33,187,930 |
| 7.5% 4/22/26 | | 62,225,000 | 32,143,102 |
| 8.75% 5/7/24 | | 2,341,854 | 900,017 |
| Buenos Aires Province: | | | |
| 10.875% 1/26/21 (b) | | 9,533,333 | 6,578,000 |
| 10.875% 1/26/21 (Reg. S) | | 13,750,667 | 9,487,960 |
| City of Buenos Aires: | | | |
| 7.5% 6/1/27 (Reg. S) | | 1,299,000 | 1,253,535 |
| 8.95% 2/19/21 (b) | | 5,715,100 | 5,743,676 |
| Mendoza Province 8.375% 5/19/24 (b) | | 965,000 | 656,200 |
| Province of Santa Fe 7% 3/23/23 (b) | | 15,350,000 | 12,280,000 |
| Provincia de Cordoba: | | | |
| 7.125% 6/10/21 (b) | | 24,110,000 | 18,263,325 |
| 7.45% 9/1/24 (b) | | 9,360,000 | 6,451,380 |
|
| TOTAL ARGENTINA | | | 146,269,705 |
|
| Azerbaijan - 0.1% | | | |
| Azerbaijan Republic 4.75% 3/18/24 (b) | | 4,080,000 | 4,365,600 |
| Bahamas (Nassau) - 0.1% | | | |
| Bahamian Republic 6% 11/21/28 (b) | | 2,245,000 | 2,497,563 |
| Bahrain - 0.1% | | | |
| Bahrain Kingdom 5.5% 3/31/20 (b) | | 2,300,000 | 2,311,500 |
| Barbados - 0.0% | | | |
| Barbados Government: | | | |
| 6.5% 2/1/21 (b) | | 705,000 | 681,206 |
| 6.5% 10/1/29 (b) | | 315,000 | 307,814 |
|
| TOTAL BARBADOS | | | 989,020 |
|
| Belarus - 0.5% | | | |
| Belarus Republic: | | | |
| 6.875% 2/28/23 (b) | | 11,650,000 | 12,440,016 |
| 7.625% 6/29/27 (b) | | 1,290,000 | 1,464,150 |
|
| TOTAL BELARUS | | | 13,904,166 |
|
| Bermuda - 0.4% | | | |
| Bermuda Government: | | | |
| 3.717% 1/25/27 (b) | | 3,310,000 | 3,485,844 |
| 4.75% 2/15/29 (b) | | 6,745,000 | 7,642,928 |
|
| TOTAL BERMUDA | | | 11,128,772 |
|
| Bolivia - 0.0% | | | |
| Plurinational State of Bolivia 5.95% 8/22/23 (b) | | 1,175,000 | 1,260,555 |
| Brazil - 1.5% | | | |
| Brazilian Federative Republic: | | | |
| 4.75% 1/14/50 | | 10,515,000 | 10,445,995 |
| 5.625% 1/7/41 | | 2,595,000 | 2,906,400 |
| 5.625% 2/21/47 | | 3,940,000 | 4,459,588 |
| 8.25% 1/20/34 | | 15,410,000 | 21,280,247 |
| 10% 1/1/23 | BRL | 20,840,000 | 5,759,998 |
|
| TOTAL BRAZIL | | | 44,852,228 |
|
| Cameroon - 0.6% | | | |
| Cameroon Republic 9.5% 11/19/25 (b) | | 15,715,000 | 17,610,622 |
| Costa Rica - 0.2% | | | |
| Costa Rican Republic 4.25% 1/26/23 (b) | | 5,330,000 | 5,374,972 |
| Dominican Republic - 0.9% | | | |
| Dominican Republic: | | | |
| 5.95% 1/25/27 (b) | | 2,545,000 | 2,808,248 |
| 6% 7/19/28 (b) | | 3,585,000 | 3,984,952 |
| 6.4% 6/5/49 (b) | | 2,910,000 | 3,186,450 |
| 6.85% 1/27/45 (b) | | 2,530,000 | 2,887,363 |
| 6.875% 1/29/26 (b) | | 4,240,000 | 4,853,475 |
| 7.45% 4/30/44 (b) | | 7,275,000 | 8,782,289 |
|
| TOTAL DOMINICAN REPUBLIC | | | 26,502,777 |
|
| Egypt - 3.2% | | | |
| Arab Republic of Egypt: | | | |
| 5.577% 2/21/23 (b) | | 1,390,000 | 1,452,203 |
| 6.125% 1/31/22 (b) | | 16,495,000 | 17,134,181 |
| 6.2004% 3/1/24 (b) | | 3,195,000 | 3,442,613 |
| 7.0529% 1/15/32 (b) | | 1,665,000 | 1,745,648 |
| 7.5% 1/31/27 (b) | | 35,555,000 | 39,588,270 |
| 7.6003% 3/1/29 (b) | | 15,420,000 | 16,860,806 |
| 7.903% 2/21/48 (b) | | 4,290,000 | 4,493,775 |
| 8.5% 1/31/47 (b) | | 7,395,000 | 8,210,761 |
| 8.7002% 3/1/49 (b) | | 1,150,000 | 1,284,047 |
|
| TOTAL EGYPT | | | 94,212,304 |
|
| El Salvador - 1.0% | | | |
| El Salvador Republic: | | | |
| 5.875% 1/30/25 (Reg.S) | | 9,840,000 | 10,384,275 |
| 6.375% 1/18/27 (b) | | 8,380,000 | 8,953,506 |
| 7.1246% 1/20/50 (b) | | 2,835,000 | 3,023,705 |
| 7.625% 9/21/34 (b) | | 2,100,000 | 2,323,125 |
| 7.65% 6/15/35 (Reg. S) | | 1,480,000 | 1,686,738 |
| 7.75% 1/24/23 (b) | | 1,975,000 | 2,169,414 |
|
| TOTAL EL SALVADOR | | | 28,540,763 |
|
| Ghana - 0.3% | | | |
| Ghana Republic: | | | |
| 7.875% 3/26/27 (b) | | 3,340,000 | 3,490,300 |
| 8.125% 1/18/26 (b) | | 4,130,000 | 4,453,947 |
|
| TOTAL GHANA | | | 7,944,247 |
|
| Guatemala - 0.1% | | | |
| Guatemalan Republic 4.9% 6/1/30 (b) | | 1,355,000 | 1,454,084 |
| Indonesia - 1.9% | | | |
| Indonesian Republic: | | | |
| 4.35% 1/11/48 | | 5,270,000 | 5,811,822 |
| 5.125% 1/15/45 (b) | | 7,585,000 | 9,056,964 |
| 5.25% 1/17/42 (b) | | 4,340,000 | 5,224,275 |
| 5.95% 1/8/46 (b) | | 3,500,000 | 4,652,813 |
| 6.75% 1/15/44 (b) | | 2,700,000 | 3,877,875 |
| 7.75% 1/17/38 (b) | | 8,860,000 | 13,312,150 |
| 8.5% 10/12/35 (b) | | 110,000 | 173,053 |
| 8.5% 10/12/35 (Reg. S) | | 8,855,000 | 13,930,783 |
|
| TOTAL INDONESIA | | | 56,039,735 |
|
| Iraq - 1.1% | | | |
| Republic of Iraq 5.8% 1/15/28 (Reg. S) | | 32,530,000 | 31,920,063 |
| Ivory Coast - 0.5% | | | |
| Ivory Coast 5.75% 12/31/32 | | 13,338,000 | 13,333,832 |
| Jamaica - 0.1% | | | |
| Jamaican Government: | | | |
| 6.75% 4/28/28 | | 725,000 | 860,484 |
| 7.875% 7/28/45 | | 1,995,000 | 2,698,238 |
|
| TOTAL JAMAICA | | | 3,558,722 |
|
| Jordan - 0.1% | | | |
| Jordanian Kingdom 6.125% 1/29/26 (b) | | 2,455,000 | 2,632,988 |
| Kazakhstan - 0.0% | | | |
| Kazakhstan Republic 6.5% 7/21/45 (b) | | 825,000 | 1,214,813 |
| Kenya - 0.1% | | | |
| Republic of Kenya 6.875% 6/24/24 (b) | | 3,790,000 | 4,094,384 |
| Lebanon - 0.9% | | | |
| Lebanese Republic: | | | |
| 5.8% 4/14/20 | | 8,557,000 | 6,963,259 |
| 6.15% 6/19/20 | | 1,910,000 | 1,497,559 |
| 6.375% 3/9/20 | | 22,303,000 | 19,319,974 |
|
| TOTAL LEBANON | | | 27,780,792 |
|
| Mexico - 1.7% | | | |
| United Mexican States: | | | |
| 5.75% 10/12/10 | | 8,745,000 | 10,340,963 |
| 6.05% 1/11/40 | | 23,540,000 | 30,609,356 |
| 6.5% 6/9/22 | MXN | 188,715,000 | 9,931,055 |
|
| TOTAL MEXICO | | | 50,881,374 |
|
| Mongolia - 0.1% | | | |
| Mongolian People's Republic 8.75% 3/9/24 (b) | | 1,300,000 | 1,479,563 |
| Morocco - 0.3% | | | |
| Moroccan Kingdom: | | | |
| 4.25% 12/11/22 (b) | | 6,725,000 | 7,090,672 |
| 5.5% 12/11/42 (b) | | 850,000 | 1,039,922 |
|
| TOTAL MOROCCO | | | 8,130,594 |
|
| Nigeria - 0.8% | | | |
| Republic of Nigeria: | | | |
| 6.375% 7/12/23 (b) | | 2,475,000 | 2,641,289 |
| 6.5% 11/28/27 (b) | | 5,445,000 | 5,562,408 |
| 6.75% 1/28/21 (b) | | 1,125,000 | 1,167,539 |
| 7.625% 11/21/25 (b) | | 11,800,000 | 13,039,000 |
|
| TOTAL NIGERIA | | | 22,410,236 |
|
| Oman - 0.5% | | | |
| Sultanate of Oman: | | | |
| 3.875% 3/8/22 (b) | | 5,765,000 | 5,844,269 |
| 4.75% 6/15/26 (b) | | 4,325,000 | 4,391,227 |
| 5.375% 3/8/27 (b) | | 1,105,000 | 1,140,567 |
| 5.625% 1/17/28 (b) | | 600,000 | 621,000 |
| 6.75% 1/17/48 (b) | | 3,105,000 | 3,127,317 |
|
| TOTAL OMAN | | | 15,124,380 |
|
| Pakistan - 0.3% | | | |
| Islamic Republic of Pakistan 8.25% 4/15/24 (b) | | 1,300,000 | 1,446,250 |
| The Third Pakistan International Sukuk Co. Ltd.: | | | |
| 5.5% 10/13/21 (b) | | 2,925,000 | 2,983,500 |
| 5.625% 12/5/22 (b) | | 2,005,000 | 2,052,619 |
|
| TOTAL PAKISTAN | | | 6,482,369 |
|
| Papua New Guinea - 0.1% | | | |
| Papua New Guinea 8.375% 10/4/28 (b) | | 3,640,000 | 3,849,300 |
| Paraguay - 0.0% | | | |
| Republic of Paraguay 5.4% 3/30/50 (b) | | 790,000 | 908,006 |
| Peru - 0.4% | | | |
| Peruvian Republic 4% 3/7/27 (f)(g) | | 10,956,000 | 10,972,716 |
| Qatar - 1.5% | | | |
| State of Qatar: | | | |
| 4% 3/14/29 (b) | | 4,435,000 | 4,957,498 |
| 4.817% 3/14/49 (b) | | 12,100,000 | 14,966,188 |
| 5.103% 4/23/48 (b) | | 12,105,000 | 15,554,925 |
| 9.75% 6/15/30 (b) | | 4,350,000 | 7,147,594 |
|
| TOTAL QATAR | | | 42,626,205 |
|
| Romania - 0.1% | | | |
| Romanian Republic 5.125% 6/15/48 (b) | | 3,280,000 | 3,763,800 |
| Russia - 3.8% | | | |
| Ministry of Finance of the Russian Federation: | | | |
| 5.1% 3/28/35 (b) | | 26,000,000 | 31,070,000 |
| 5.1% 3/28/35(Reg. S) | | 8,200,000 | 9,799,000 |
| 5.25% 6/23/47 (b) | | 28,800,000 | 36,000,000 |
| 5.25% 6/23/47(Reg. S) | | 3,600,000 | 4,500,000 |
| 5.625% 4/4/42 (b) | | 3,825,000 | 5,015,530 |
| 5.875% 9/16/43 (b) | | 1,195,000 | 1,614,370 |
| 7.25% 5/10/34 | RUB | 449,775,000 | 7,796,644 |
| 7.6% 7/20/22 | RUB | 424,870,000 | 7,159,016 |
| 8.15% 2/3/27 | RUB | 461,745,000 | 8,317,789 |
|
| TOTAL RUSSIA | | | 111,272,349 |
|
| Rwanda - 0.2% | | | |
| Rwanda Republic 6.625% 5/2/23 (b) | | 5,505,000 | 5,880,028 |
| Saudi Arabia - 0.4% | | | |
| Kingdom of Saudi Arabia: | | | |
| 4.5% 10/26/46 (b) | | 3,860,000 | 4,274,950 |
| 4.625% 10/4/47 (b) | | 3,705,000 | 4,169,978 |
| 5.25% 1/16/50 (b) | | 3,765,000 | 4,685,072 |
|
| TOTAL SAUDI ARABIA | | | 13,130,000 |
|
| South Africa - 0.0% | | | |
| South African Republic 4.875% 4/14/26 | | 840,000 | 874,650 |
| Sri Lanka - 0.3% | | | |
| Democratic Socialist Republic of Sri Lanka: | | | |
| 5.75% 4/18/23 (b) | | 3,050,000 | 3,017,421 |
| 6.25% 10/4/20 (b) | | 3,795,000 | 3,844,809 |
| 6.25% 7/27/21 (b) | | 1,630,000 | 1,655,978 |
| 6.85% 3/14/24 (b) | | 1,495,000 | 1,515,914 |
|
| TOTAL SRI LANKA | | | 10,034,122 |
|
| Turkey - 4.8% | | | |
| Export Credit Bank of Turkey 5.375% 2/8/21 (b) | | 4,590,000 | 4,655,981 |
| Turkish Republic: | | | |
| 3.25% 3/23/23 | | 5,105,000 | 4,907,181 |
| 5.125% 3/25/22 | | 46,445,000 | 47,533,555 |
| 5.625% 3/30/21 | | 9,055,000 | 9,318,161 |
| 5.75% 5/11/47 | | 7,890,000 | 6,977,719 |
| 6.25% 9/26/22 | | 49,755,000 | 51,978,427 |
| 6.35% 8/10/24 | | 3,290,000 | 3,439,078 |
| 7.25% 12/23/23 | | 8,080,000 | 8,728,925 |
| 7.375% 2/5/25 | | 3,980,000 | 4,349,394 |
|
| TOTAL TURKEY | | | 141,888,421 |
|
| Ukraine - 4.8% | | | |
| Ukraine Government: | | | |
| 7.375% 9/25/32 (b) | | 4,610,000 | 4,916,853 |
| 7.75% 9/1/20 (b) | | 37,950,000 | 38,993,625 |
| 7.75% 9/1/21 (b) | | 65,047,000 | 68,787,203 |
| 7.75% 9/1/22 (b) | | 8,012,000 | 8,612,900 |
| 7.75% 9/1/23 (b) | | 4,065,000 | 4,405,444 |
| 7.75% 9/1/24 (b) | | 7,595,000 | 8,267,158 |
| 7.75% 9/1/26 (b) | | 2,780,000 | 3,030,200 |
| 7.75% 9/1/27 (b) | | 2,935,000 | 3,206,488 |
|
| TOTAL UKRAINE | | | 140,219,871 |
|
| United Arab Emirates - 0.2% | | | |
| Emirate of Abu Dhabi 3.125% 9/30/49 (b) | | 7,425,000 | 7,241,695 |
| United States of America - 4.4% | | | |
| U.S. Treasury Bonds 3% 2/15/48 | | 6,002,000 | 6,739,416 |
| U.S. Treasury Notes: | | | |
| 2% 11/15/26 | | 103,626,000 | 104,703,333 |
| 2.375% 5/15/29 | | 16,450,000 | 17,084,569 |
|
| TOTAL UNITED STATES OF AMERICA | | | 128,527,318 |
|
| Uruguay - 0.0% | | | |
| Banco Central del Uruguay: | | | |
| value recovery A rights 1/2/21 (f)(h) | | 1,000,000 | 10 |
| value recovery B rights 1/2/21 (f)(h) | | 1,500,000 | 15 |
|
| TOTAL URUGUAY | | | 25 |
|
| Venezuela - 0.2% | | | |
| Venezuelan Republic: | | | |
| oil recovery warrants 4/15/20 (f)(h) | | 2,504 | 2,504 |
| 9.25% 9/15/27 (d) | | 32,390,000 | 3,724,850 |
| 11.95% 8/5/31 (Reg. S) (d) | | 14,080,000 | 1,619,200 |
| 12.75% 8/23/22 (d) | | 2,705,000 | 311,075 |
|
| TOTAL VENEZUELA | | | 5,657,629 |
|
| Vietnam - 0.9% | | | |
| Vietnamese Socialist Republic: | | | |
| 6 month U.S. LIBOR + 0.813% 2.8476% 3/13/28 (c)(e) | | 1,040,000 | 1,046,657 |
| 5.5% 3/12/28 | | 24,486,566 | 24,211,093 |
|
| TOTAL VIETNAM | | | 25,257,750 |
|
| TOTAL GOVERNMENT OBLIGATIONS | | | |
| (Cost $1,335,121,077) | | | 1,311,185,517 |
|
| Supranational Obligations - 0.2% | | | |
| European Bank for Reconstruction & Development 6% 5/4/20 (Reg. S) | | | |
| (Cost $6,545,269) | | INR 423,400,000 | 5,911,935 |
|
| Preferred Securities - 2.6% | | | |
| Cayman Islands - 1.6% | | | |
| Banco Do Brasil SA: | | | |
| 6.25% (b)(c)(i) | | 6,700,000 | 6,896,023 |
| 9% (b)(c)(i) | | 3,275,000 | 3,744,775 |
| Banco Mercantil del Norte SA 7.625% (b)(c)(i) | | 2,830,000 | 3,080,871 |
| Cosan Overseas Ltd. 8.25% (i) | | 23,191,000 | 24,320,774 |
| Itau Unibanco Holding SA: | | | |
| 5.5% 8/6/22 (b) | | 5,655,000 | 6,101,714 |
| 6.125% (b)(c)(i) | | 1,525,000 | 1,598,253 |
| Odebrecht Finance Ltd.: | | | |
| 7.5% (b)(d)(i) | | 21,825,000 | 653,113 |
| 7.5% (Reg. S) (d)(i) | | 500,000 | 14,963 |
|
| TOTAL CAYMAN ISLANDS | | | 46,410,486 |
|
| Colombia - 0.2% | | | |
| Colombia Telecomunicaciones SA 8.5% (b)(c)(i) | | 5,440,000 | 5,615,941 |
| Georgia - 0.0% | | | |
| Georgia Bank Joint Stock Co. 11.125% (Reg. S) (c)(i) | | 1,300,000 | 1,353,581 |
| Ireland - 0.7% | | | |
| Alfa Bond Issuance PLC 8% (Reg. S) (c)(i) | | 10,537,000 | 10,813,707 |
| Tinkoff Credit Systems 9.25% (Reg. S) (c)(i) | | 9,739,000 | 10,180,332 |
|
| TOTAL IRELAND | | | 20,994,039 |
|
| United Arab Emirates - 0.1% | | | |
| NBK Tier 1 Financing 2 Ltd. 4.5% (b)(c)(i) | | 2,890,000 | 2,891,667 |
| TOTAL PREFERRED SECURITIES | | | |
| (Cost $87,758,727) | | | 77,265,714 |
| | | Shares | Value |
|
| Money Market Funds - 12.8% | | | |
| Fidelity Cash Central Fund 1.58% (j) | | | |
| (Cost $376,248,708) | | 376,173,965 | 376,249,200 |
| TOTAL INVESTMENT IN SECURITIES - 98.5% | | | |
| (Cost $2,937,812,470) | | | 2,893,651,383 |
| NET OTHER ASSETS (LIABILITIES) - 1.5% | | | 42,602,298 |
| NET ASSETS - 100% | | | $2,936,253,681 |
Currency Abbreviations
BRL – Brazilian real
INR – Indian rupee
MXN – Mexican peso
PEN – Peruvian new sol
RUB – Russian ruble
Categorizations in the Schedule of Investments are based on country or territory of incorporation.
Legend
(a) Amount is stated in United States dollars unless otherwise noted.
(b) Security exempt from registration under Rule 144A of the Securities Act of 1933. These securities may be resold in transactions exempt from registration, normally to qualified institutional buyers. At the end of the period, the value of these securities amounted to $1,541,824,327 or 52.5% of net assets.
(c) Coupon rates for floating and adjustable rate securities reflect the rates in effect at period end.
(d) Non-income producing - Security is in default.
(e) Coupon is indexed to a floating interest rate which may be multiplied by a specified factor and/or subject to caps or floors.
(f) Level 3 security
(g) Security initially issued at one coupon which converts to a higher coupon at a specified date. The rate shown is the rate at period end.
(h) Quantity represents share amount.
(i) Security is perpetual in nature with no stated maturity date.
(j) Affiliated fund that is generally available only to investment companies and other accounts managed by Fidelity Investments. The rate quoted is the annualized seven-day yield of the fund at period end. A complete unaudited listing of the fund's holdings as of its most recent quarter end is available upon request. In addition, each Fidelity Central Fund's financial statements, which are not covered by the Fund's Report of Independent Registered Public Accounting Firm, are available on the SEC's website or upon request.
Affiliated Central Funds
Information regarding fiscal year to date income earned by the Fund from investments in Fidelity Central Funds is as follows:
| Fund | Income earned |
| Fidelity Cash Central Fund | $4,960,813 |
| Total | $4,960,813 |
Amounts in the income column in the above table include any capital gain distributions from underlying funds, which are presented in the corresponding line-item in the Statement of Operations, if applicable.
Investment Valuation
The following is a summary of the inputs used, as of December 31, 2019, involving the Fund's assets and liabilities carried at fair value. The inputs or methodology used for valuing securities may not be an indication of the risk associated with investing in those securities. For more information on valuation inputs, and their aggregation into the levels used below, please refer to the Investment Valuation section in the accompanying Notes to Financial Statements.
| | Valuation Inputs at Reporting Date: |
| Description | Total | Level 1 | Level 2 | Level 3 |
| Investments in Securities: | | | | |
| Corporate Bonds | $1,123,039,017 | $-- | $1,123,039,017 | $-- |
| Government Obligations | 1,311,185,517 | -- | 1,300,210,272 | 10,975,245 |
| Supranational Obligations | 5,911,935 | -- | 5,911,935 | -- |
| Preferred Securities | 77,265,714 | -- | 77,265,714 | -- |
| Money Market Funds | 376,249,200 | 376,249,200 | -- | -- |
| Total Investments in Securities: | $2,893,651,383 | $376,249,200 | $2,506,426,938 | $10,975,245 |
Other Information
The composition of credit quality ratings as a percentage of Total Net Assets is as follows (Unaudited):
| U.S. Government and U.S. Government Agency Obligations | 4.4% |
| AAA,AA,A | 8.1% |
| BBB | 8.7% |
| BB | 15.7% |
| B | 21.8% |
| CCC,CC,C | 17.8% |
| Not Rated | 9.2% |
| Short-Term Investments and Net Other Assets | 14.3% |
| | 100% |
We have used ratings from Moody's Investors Service, Inc. Where Moody's® ratings are not available, we have used S&P® ratings. All ratings are as of the date indicated and do not reflect subsequent changes.
See accompanying notes which are an integral part of the financial statements.
Fidelity® Emerging Markets Debt Central Fund
Financial Statements
Statement of Assets and Liabilities
| | | December 31, 2019 |
| Assets | | |
Investment in securities, at value — See accompanying schedule:
Unaffiliated issuers (cost $2,561,563,762) | $2,517,402,183 | |
| Fidelity Central Funds (cost $376,248,708) | 376,249,200 | |
| Total Investment in Securities (cost $2,937,812,470) | | $2,893,651,383 |
| Cash | | 768,563 |
| Foreign currency held at value (cost $453) | | 460 |
| Receivable for investments sold | | 229,037 |
| Receivable for fund shares sold | | 545,578 |
| Interest receivable | | 44,084,359 |
| Distributions receivable from Fidelity Central Funds | | 496,585 |
| Total assets | | 2,939,775,965 |
| Liabilities | | |
| Payable for investments purchased | $3,365,959 | |
| Payable for fund shares redeemed | 108,933 | |
| Distributions payable | 14,250 | |
| Other payables and accrued expenses | 33,142 | |
| Total liabilities | | 3,522,284 |
| Net Assets | | $2,936,253,681 |
| Net Assets consist of: | | |
| Paid in capital | | $2,970,806,542 |
| Total accumulated earnings (loss) | | (34,552,861) |
| Net Assets | | $2,936,253,681 |
| Net Asset Value, offering price and redemption price per share ($2,936,253,681 ÷ 311,071,439 shares) | | $9.44 |
See accompanying notes which are an integral part of the financial statements.
Statement of Operations
| | | Year ended December 31, 2019 |
| Investment Income | | |
| Dividends | | $4,672,621 |
| Interest | | 119,111,438 |
| Income from Fidelity Central Funds | | 4,960,813 |
| Income before foreign taxes withheld | | 128,744,872 |
| Less foreign taxes withheld | | (66,969) |
| Total income | | 128,677,903 |
| Expenses | | |
| Custodian fees and expenses | $54,531 | |
| Independent trustees' fees and expenses | 9,751 | |
| Legal | 209 | |
| Total expenses before reductions | 64,491 | |
| Expense reductions | (18,161) | |
| Total expenses after reductions | | 46,330 |
| Net investment income (loss) | | 128,631,573 |
| Realized and Unrealized Gain (Loss) | | |
| Net realized gain (loss) on: | | |
| Investment securities: | | |
| Unaffiliated issuers | 18,879,405 | |
| Foreign currency transactions | (255,589) | |
| Total net realized gain (loss) | | 18,623,816 |
| Change in net unrealized appreciation (depreciation) on: | | |
| Investment securities: | | |
| Unaffiliated issuers | (11,382,012) | |
| Assets and liabilities in foreign currencies | 15,643 | |
| Total change in net unrealized appreciation (depreciation) | | (11,366,369) |
| Net gain (loss) | | 7,257,447 |
| Net increase (decrease) in net assets resulting from operations | | $135,889,020 |
See accompanying notes which are an integral part of the financial statements.
Statement of Changes in Net Assets
| | Year ended December 31, 2019 | Year ended December 31, 2018 |
| Increase (Decrease) in Net Assets | | |
| Operations | | |
| Net investment income (loss) | $128,631,573 | $7,730,297 |
| Net realized gain (loss) | 18,623,816 | (2,696,380) |
| Change in net unrealized appreciation (depreciation) | (11,366,369) | (11,168,125) |
| Net increase (decrease) in net assets resulting from operations | 135,889,020 | (6,134,208) |
| Distributions to shareholders | (135,285,645) | (7,559,273) |
| Share transactions | | |
| Proceeds from sales of shares | 2,746,218,804 | 10,922,043 |
| Reinvestment of distributions | 135,271,409 | 7,559,250 |
| Cost of shares redeemed | (74,335,058) | (9,430,277) |
| Net increase (decrease) in net assets resulting from share transactions | 2,807,155,155 | 9,051,016 |
| Total increase (decrease) in net assets | 2,807,758,530 | (4,642,465) |
| Net Assets | | |
| Beginning of period | 128,495,151 | 133,137,616 |
| End of period | $2,936,253,681 | $128,495,151 |
| Other Information | | |
| Shares | | |
| Sold | 290,519,318 | 1,127,992 |
| Issued in reinvestment of distributions | 14,388,766 | 796,396 |
| Redeemed | (7,945,966) | (988,322) |
| Net increase (decrease) | 296,962,118 | 936,066 |
See accompanying notes which are an integral part of the financial statements.
Financial Highlights
Fidelity Emerging Markets Debt Central Fund
| | | | | | |
| Years ended December 31, | 2019 | 2018 | 2017 | 2016 | 2015 |
| Selected Per–Share Data | | | | | |
| Net asset value, beginning of period | $9.11 | $10.11 | $9.81 | $9.04 | $9.47 |
| Income from Investment Operations | | | | | |
| Net investment income (loss)A | .582 | .564 | .686 | .754 | .744 |
| Net realized and unrealized gain (loss) | .353 | (1.013) | .370 | .707 | (.526) |
| Total from investment operations | .935 | (.449) | 1.056 | 1.461 | .218 |
| Distributions from net investment income | (.548) | (.551) | (.730) | (.691) | (.648) |
| Distributions from net realized gain | (.057) | – | (.026) | – | – |
| Total distributions | (.605) | (.551) | (.756) | (.691) | (.648) |
| Net asset value, end of period | $9.44 | $9.11 | $10.11 | $9.81 | $9.04 |
| Total ReturnB | 10.48% | (4.52)% | 10.99% | 16.50% | 2.26% |
| Ratios to Average Net AssetsC,D | | | | | |
| Expenses before reductions | - %E | .01% | .01% | .01% | .01% |
| Expenses net of fee waivers, if any | - %E | .01% | .01% | .01% | .01% |
| Expenses net of all reductions | - %E | - %E | .01% | .01% | .01% |
| Net investment income (loss) | 6.23% | 5.91% | 6.76% | 7.80% | 7.89% |
| Supplemental Data | | | | | |
| Net assets, end of period (000 omitted) | $2,936,254 | $128,495 | $133,138 | $116,523 | $103,080 |
| Portfolio turnover rateF | 72%G | 40% | 57% | 48% | 39% |
A Calculated based on average shares outstanding during the period.
B Total returns would have been lower if certain expenses had not been reduced during the applicable periods shown.
C Fees and expenses of any underlying Fidelity Central Funds are not included in the Fund's expense ratio. The Fund indirectly bears its proportionate share of the expenses of any underlying Fidelity Central Funds.
D Expense ratios reflect operating expenses of the Fund. Expenses before reductions do not reflect amounts reimbursed by the investment adviser or reductions from expense offset arrangements and do not represent the amount paid by the Fund during periods when reimbursements or reductions occur. Expenses net of fee waivers reflect expenses after reimbursement by the investment adviser but prior to reductions from expense offset arrangements. Expenses net of all reductions represent the net expenses paid by the Fund.
E Amount represents less than .005%.
F Amount does not include the portfolio activity of any underlying Fidelity Central Funds.
G Portfolio turnover rate excludes securities received or delivered in-kind.
See accompanying notes which are an integral part of the financial statements.
Notes to Financial Statements
For the period ended December 31, 2019
1. Organization.
Fidelity Emerging Markets Debt Central Fund (the Fund) is a non-diversified fund of Fidelity Hanover Street Trust (the Trust) and is authorized to issue an unlimited number of shares. Shares of the Fund are only offered to other investment companies and accounts managed by Fidelity Management & Research Company (FMR), or its affiliates (the Investing Funds). The Trust is registered under the Investment Company Act of 1940, as amended (the 1940 Act), as an open-end management investment company organized as a Massachusetts business trust.
2. Investments in Fidelity Central Funds.
The Fund invests in Fidelity Central Funds, which are open-end investment companies generally available only to other investment companies and accounts managed by the investment adviser and its affiliates. The Fund's Schedule of Investments lists each of the Fidelity Central Funds held as of period end, if any, as an investment of the Fund, but does not include the underlying holdings of each Fidelity Central Fund. As an Investing Fund, the Fund indirectly bears its proportionate share of the expenses of the underlying Fidelity Central Funds.
The Money Market Central Funds seek preservation of capital and current income and are managed by Fidelity Investments Money Management, Inc. (FIMM), an affiliate of the investment adviser. Annualized expenses of the Money Market Central Funds as of their most recent shareholder report date ranged from less than .005% to .01%.
A complete unaudited list of holdings for each Fidelity Central Fund is available upon request or at the Securities and Exchange Commission (the SEC) website at www.sec.gov. In addition, the financial statements of the Fidelity Central Funds, which are not covered by the Fund's Report of Independent Registered Public Accounting Firm, are available on the SEC website or upon request.
3. Significant Accounting Policies.
The Fund is an investment company and applies the accounting and reporting guidance of the Financial Accounting Standards Board (FASB) Accounting Standards Codification Topic 946 Financial Services – Investments Companies. The financial statements have been prepared in conformity with accounting principles generally accepted in the United States of America (GAAP), which require management to make certain estimates and assumptions at the date of the financial statements. Actual results could differ from those estimates. Subsequent events, if any, through the date that the financial statements were issued have been evaluated in the preparation of the financial statements. The following summarizes the significant accounting policies of the Fund:
Investment Valuation. Investments are valued as of 4:00 p.m. Eastern time on the last calendar day of the period. The Board of Trustees (the Board) has delegated the day to day responsibility for the valuation of the Fund's investments to the Fair Value Committee (the Committee) established by the Fund's investment adviser. In accordance with valuation policies and procedures approved by the Board, the Fund attempts to obtain prices from one or more third party pricing vendors or brokers to value its investments. When current market prices, quotations or currency exchange rates are not readily available or reliable, investments will be fair valued in good faith by the Committee, in accordance with procedures adopted by the Board. Factors used in determining fair value vary by investment type and may include market or investment specific events, changes in interest rates and credit quality. The frequency with which these procedures are used cannot be predicted and they may be utilized to a significant extent. The Committee oversees the Fund's valuation policies and procedures and reports to the Board on the Committee's activities and fair value determinations. The Board monitors the appropriateness of the procedures used in valuing the Fund's investments and ratifies the fair value determinations of the Committee.
The Fund categorizes the inputs to valuation techniques used to value its investments into a disclosure hierarchy consisting of three levels as shown below:
- Level 1 – quoted prices in active markets for identical investments
- Level 2 – other significant observable inputs (including quoted prices for similar investments, interest rates, prepayment speeds, etc.)
- Level 3 – unobservable inputs (including the Fund's own assumptions based on the best information available)
Valuation techniques used to value the Fund's investments by major category are as follows:
Debt securities, including restricted securities, are valued based on evaluated prices received from third party pricing vendors or from brokers who make markets in such securities. Corporate bonds, foreign government and government agency obligations, preferred securities, supranational obligations and U.S. government and government agency obligations are valued by pricing vendors who utilize matrix pricing which considers yield or price of bonds of comparable quality, coupon, maturity and type or by broker-supplied prices. When independent prices are unavailable or unreliable, debt securities may be valued utilizing pricing methodologies which consider similar factors that would be used by third party pricing vendors. For foreign debt securities, when significant market or security specific events arise, valuations may be determined in good faith in accordance with procedures adopted by the Board. Debt securities are generally categorized as Level 2 in the hierarchy but may be Level 3 depending on the circumstances. The Fund invests a significant portion of its assets in below investment grade securities. The value of these securities can be more volatile due to changes in the credit quality of the issuer and is sensitive to changes in economic, market and regulatory conditions.
Investments in open-end mutual funds, including the Fidelity Central Funds, are valued at their closing net asset value (NAV) each business day and are categorized as Level 1 in the hierarchy.
Changes in valuation techniques may result in transfers in or out of an assigned level within the disclosure hierarchy. The aggregate value of investments by input level as of December 31, 2019 is included at the end of the Fund's Schedule of Investments.
Foreign Currency. The Fund may use foreign currency contracts to facilitate transactions in foreign-denominated securities. Gains and losses from these transactions may arise from changes in the value of the foreign currency or if the counterparties do not perform under the contracts' terms.
Foreign-denominated assets, including investment securities, and liabilities are translated into U.S. dollars at the exchange rates at period end. Purchases and sales of investment securities, income and dividends received and expenses denominated in foreign currencies are translated into U.S. dollars at the exchange rate in effect on the transaction date.
The effects of exchange rate fluctuations on investments are included with the net realized and unrealized gain (loss) on investment securities. Other foreign currency transactions resulting in realized and unrealized gain (loss) are disclosed separately.
Investment Transactions and Income. For financial reporting purposes, the Fund's investment holdings and NAV include trades executed through the end of the last business day of the period. The NAV per share for processing shareholder transactions is calculated as of the close of business of the New York Stock Exchange (NYSE), normally 4:00 p.m. Eastern time and includes trades executed through the end of the prior business day. Gains and losses on securities sold are determined on the basis of identified cost and include proceeds received from litigation. Dividend income is recorded on the ex-dividend date. Income and capital gain distributions from Fidelity Central Funds, if any, are recorded on the ex-dividend date. Interest income is accrued as earned and includes coupon interest and amortization of premium and accretion of discount on debt securities as applicable. Paid in Kind (PIK) income is recorded at the fair market value of the securities received. Investment income is recorded net of foreign taxes withheld where recovery of such taxes is uncertain. Debt obligations may be placed on non-accrual status and related interest income may be reduced by ceasing current accruals and writing off interest receivables when the collection of all or a portion of interest has become doubtful based on consistently applied procedures. A debt obligation is removed from non-accrual status when the issuer resumes interest payments or when collectability of interest is reasonably assured.
Expenses. Expenses directly attributable to a fund are charged to that fund. Expenses attributable to more than one fund are allocated among the respective funds on the basis of relative net assets or other appropriate methods. Expense estimates are accrued in the period to which they relate and adjustments are made when actual amounts are known.
Income Tax Information and Distributions to Shareholders. Each year, the Fund intends to qualify as a regulated investment company under Subchapter M of the Internal Revenue Code, including distributing substantially all of its taxable income and realized gains. As a result, no provision for U.S. Federal income taxes is required. As of December 31, 2019, the Fund did not have any unrecognized tax benefits in the financial statements; nor is the Fund aware of any tax positions for which it is reasonably possible that the total amounts of unrecognized tax benefits will significantly change in the next twelve months. The Fund files a U.S. federal tax return, in addition to state and local tax returns as required. The Fund's federal income tax returns are subject to examination by the Internal Revenue Service (IRS) for a period of three fiscal years after they are filed. State and local tax returns may be subject to examination for an additional fiscal year depending on the jurisdiction. Foreign taxes are provided for based on the Fund's understanding of the tax rules and rates that exist in the foreign markets in which it invests.
Distributions are declared and recorded daily and paid monthly from net investment income. Distributions from realized gains, if any, are declared and recorded on the ex-dividend date. Income and capital gain distributions are determined in accordance with income tax regulations, which may differ from GAAP.
Capital accounts within the financial statements are adjusted for permanent book-tax differences. These adjustments have no impact on net assets or the results of operations. Capital accounts are not adjusted for temporary book-tax differences which will reverse in a subsequent period.
Book-tax differences are primarily due to foreign currency transactions, market discount, capital loss carryforwards and losses deferred due to wash sales.
As of period end, the cost and unrealized appreciation (depreciation) in securities, and derivatives if applicable, for federal income tax purposes were as follows:
| Gross unrealized appreciation | $138,544,383 |
| Gross unrealized depreciation | (173,911,714) |
| Net unrealized appreciation (depreciation) | $(35,367,331) |
| Tax Cost | $2,929,018,714 |
The tax-based components of distributable earnings as of period end were as follows:
| Undistributed ordinary income | $799,269 |
| Net unrealized appreciation (depreciation) on securities and other investments | $(35,352,187) |
The tax character of distributions paid was as follows:
| | December 31, 2019 | December 31, 2018 |
| Ordinary Income | $127,917,322 | $ 7,559,273 |
| Long-term Capital Gains | 7,368,323 | – |
| Total | $135,285,645 | $ 7,559,273 |
Restricted Securities. The Fund may invest in securities that are subject to legal or contractual restrictions on resale. These securities generally may be resold in transactions exempt from registration or to the public if the securities are registered. Disposal of these securities may involve time-consuming negotiations and expense, and prompt sale at an acceptable price may be difficult. Information regarding restricted securities is included at the end of the Fund's Schedule of Investments.
4. Purchases and Sales of Investments.
Purchases and sales of securities, other than short-term securities, U.S. government securities and in-kind transactions, aggregated $1,149,963,186 and $1,029,187,180, respectively.
5. Fees and Other Transactions with Affiliates.
Management Fee and Expense Contract. FMR Co., Inc. (the investment adviser), an affiliate of FMR, provides the Fund with investment management services. The Fund does not pay any fees for these services. Pursuant to the Fund's management contract with the investment adviser, FMR pays the investment adviser a portion of the management fees it receives from the Investing Funds. In addition, under an expense contract, FMR also pays all other expenses of the Fund, excluding custody fees, the compensation of the independent Trustees, and certain miscellaneous expenses such as proxy and shareholder meeting expenses.
Interfund Trades. The Fund may purchase from or sell securities to other Fidelity Funds under procedures adopted by the Board. The procedures have been designed to ensure these interfund trades are executed in accordance with Rule 17a-7 of the 1940 Act. Interfund trades are included within the respective purchases and sales amounts shown in the Purchases and Sales of Investments note.
Affiliated Exchange In-Kind. During the period, Fidelity Advisor Strategic Income Fund (the Investing Fund) completed an exchange in-kind transaction with the Fund. The Investing Fund delivered investments, including accrued interest valued at $2,529,798,896 (which included $23,123,655 of unrealized depreciation), in exchange for 268,001,366 shares of the Fund. The value of investments delivered from the Investing Fund is included in proceeds from sales of shares in the accompanying Statements of Changes in Net Assets. This transaction was treated as a tax free exchange with carry forward basis for book and tax.
6. Expense Reductions.
Through arrangements with the Fund's custodian, credits realized as a result of certain uninvested cash balances were used to reduce the Fund's expenses by $18,161.
7. Other.
The Fund's organizational documents provide former and current trustees and officers with a limited indemnification against liabilities arising in connection with the performance of their duties to the Fund. In the normal course of business, the Fund may also enter into contracts that provide general indemnifications. The Fund's maximum exposure under these arrangements is unknown as this would be dependent on future claims that may be made against the Fund. The risk of material loss from such claims is considered remote.
At the end of the period, mutual funds managed by FMR or its affiliates were the owners of record of all of the outstanding shares of the Fund.
Effective January 1, 2020, following any required regulatory notices and approvals:
Investment advisers Fidelity Investments Money Management, Inc., FMR Co., Inc., and Fidelity SelectCo, LLC, merged with and into Fidelity Management & Research Company. In connection with the merger transactions, the resulting, merged investment adviser was then redomiciled from Massachusetts to Delaware, changed its corporate structure from a corporation to a limited liability company, and changed its name to "Fidelity Management & Research Company LLC".
8. Credit Risk.
The Fund's relatively large investment in countries with limited or developing capital markets may involve greater risks than investments in more developed markets and the prices of such investments may be volatile. The yields of emerging market debt obligations reflect, among other things, perceived credit risk. The consequences of political, social or economic changes in these markets may have disruptive effects on the market prices of the Fund's investments and the income they generate, as well as the Fund's ability to repatriate such amounts.
Report of Independent Registered Public Accounting Firm
To the Board of Trustees of Fidelity Hanover Street Trust and Shareholders of Fidelity Emerging Markets Debt Central Fund:
Opinion on the Financial Statements
We have audited the accompanying statement of assets and liabilities, including the schedule of investments, of Fidelity Emerging Markets Debt Central Fund (one of the funds constituting Fidelity Hanover Street Trust, referred to hereafter as the “Fund”) as of December 31, 2019, the related statement of operations for the year ended December 31, 2019, the statement of changes in net assets for each of the two years in the period ended December 31, 2019, including the related notes, and the financial highlights for each of the five years in the period ended December 31, 2019 (collectively referred to as the “financial statements”). In our opinion, the financial statements present fairly, in all material respects, the financial position of the Fund as of December 31, 2019, the results of its operations for the year then ended, the changes in its net assets for each of the two years in the period ended December 31, 2019 and the financial highlights for each of the five years in the period ended December 31, 2019 in conformity with accounting principles generally accepted in the United States of America.
Basis for Opinion
These financial statements are the responsibility of the Fund’s management. Our responsibility is to express an opinion on the Fund’s financial statements based on our audits. We are a public accounting firm registered with the Public Company Accounting Oversight Board (United States) (PCAOB) and are required to be independent with respect to the Fund in accordance with the U.S. federal securities laws and the applicable rules and regulations of the Securities and Exchange Commission and the PCAOB.
We conducted our audits of these financial statements in accordance with the standards of the PCAOB. Those standards require that we plan and perform the audit to obtain reasonable assurance about whether the financial statements are free of material misstatement, whether due to error or fraud.
Our audits included performing procedures to assess the risks of material misstatement of the financial statements, whether due to error or fraud, and performing procedures that respond to those risks. Such procedures included examining, on a test basis, evidence regarding the amounts and disclosures in the financial statements. Our audits also included evaluating the accounting principles used and significant estimates made by management, as well as evaluating the overall presentation of the financial statements. Our procedures included confirmation of securities owned as of December 31, 2019 by correspondence with the custodian and brokers; when replies were not received from brokers, we performed other auditing procedures. We believe that our audits provide a reasonable basis for our opinion.
PricewaterhouseCoopers LLP
Boston, Massachusetts
February 14, 2020
We have served as the auditor of one or more investment companies in the Fidelity group of funds since 1932.
Trustees and Officers
The Trustees, Members of the Advisory Board (if any), and officers of the trust and fund, as applicable, are listed below. The Board of Trustees governs the fund and is responsible for protecting the interests of shareholders. The Trustees are experienced executives who meet periodically throughout the year to oversee the fund's activities, review contractual arrangements with companies that provide services to the fund, oversee management of the risks associated with such activities and contractual arrangements, and review the fund's performance. Except for Michael E. Wiley, each of the Trustees oversees 302 funds. Mr. Wiley oversees 199 funds.
The Trustees hold office without limit in time except that (a) any Trustee may resign; (b) any Trustee may be removed by written instrument, signed by at least two-thirds of the number of Trustees prior to such removal; (c) any Trustee who requests to be retired or who has become incapacitated by illness or injury may be retired by written instrument signed by a majority of the other Trustees; and (d) any Trustee may be removed at any special meeting of shareholders by a two-thirds vote of the outstanding voting securities of the trust. Each Trustee who is not an interested person (as defined in the Investment Company Act of 1940 (1940 Act)) of the trust and the fund is referred to herein as an Independent Trustee. Each Independent Trustee shall retire not later than the last day of the calendar year in which his or her 75th birthday occurs. The Independent Trustees may waive this mandatory retirement age policy with respect to individual Trustees. Officers and Advisory Board Members hold office without limit in time, except that any officer or Advisory Board Member may resign or may be removed by a vote of a majority of the Trustees at any regular meeting or any special meeting of the Trustees. Except as indicated, each individual has held the office shown or other offices in the same company for the past five years.
The fund’s Statement of Additional Information (SAI) includes more information about the Trustees. To request a free copy, call Fidelity at 1-800-544-8544.
Experience, Skills, Attributes, and Qualifications of the Trustees. The Governance and Nominating Committee has adopted a statement of policy that describes the experience, qualifications, attributes, and skills that are necessary and desirable for potential Independent Trustee candidates (Statement of Policy). The Board believes that each Trustee satisfied at the time he or she was initially elected or appointed a Trustee, and continues to satisfy, the standards contemplated by the Statement of Policy. The Governance and Nominating Committee also engages professional search firms to help identify potential Independent Trustee candidates who have the experience, qualifications, attributes, and skills consistent with the Statement of Policy. From time to time, additional criteria based on the composition and skills of the current Independent Trustees, as well as experience or skills that may be appropriate in light of future changes to board composition, business conditions, and regulatory or other developments, have also been considered by the professional search firms and the Governance and Nominating Committee. In addition, the Board takes into account the Trustees' commitment and participation in Board and committee meetings, as well as their leadership of standing and ad hoc committees throughout their tenure.
In determining that a particular Trustee was and continues to be qualified to serve as a Trustee, the Board has considered a variety of criteria, none of which, in isolation, was controlling. The Board believes that, collectively, the Trustees have balanced and diverse experience, qualifications, attributes, and skills, which allow the Board to operate effectively in governing the fund and protecting the interests of shareholders. Information about the specific experience, skills, attributes, and qualifications of each Trustee, which in each case led to the Board's conclusion that the Trustee should serve (or continue to serve) as a trustee of the fund, is provided below.
Board Structure and Oversight Function. James C. Curvey is an interested person and currently serves as Chairman. The Trustees have determined that an interested Chairman is appropriate and benefits shareholders because an interested Chairman has a personal and professional stake in the quality and continuity of services provided to the fund. Independent Trustees exercise their informed business judgment to appoint an individual of their choosing to serve as Chairman, regardless of whether the Trustee happens to be independent or a member of management. The Independent Trustees have determined that they can act independently and effectively without having an Independent Trustee serve as Chairman and that a key structural component for assuring that they are in a position to do so is for the Independent Trustees to constitute a substantial majority for the Board. The Independent Trustees also regularly meet in executive session. Ned C. Lautenbach serves as Chairman of the Independent Trustees and as such (i) acts as a liaison between the Independent Trustees and management with respect to matters important to the Independent Trustees and (ii) with management prepares agendas for Board meetings.
Fidelity® funds are overseen by different Boards of Trustees. The fund's Board oversees Fidelity's high income and certain equity funds, and other Boards oversee Fidelity's investment-grade bond, money market, asset allocation, and other equity funds. The asset allocation funds may invest in Fidelity® funds overseen by the fund's Board. The use of separate Boards, each with its own committee structure, allows the Trustees of each group of Fidelity® funds to focus on the unique issues of the funds they oversee, including common research, investment, and operational issues. On occasion, the separate Boards establish joint committees to address issues of overlapping consequences for the Fidelity® funds overseen by each Board.
The Trustees operate using a system of committees to facilitate the timely and efficient consideration of all matters of importance to the Trustees, the fund, and fund shareholders and to facilitate compliance with legal and regulatory requirements and oversight of the fund's activities and associated risks. The Board, acting through its committees, has charged FMR and its affiliates with (i) identifying events or circumstances the occurrence of which could have demonstrably adverse effects on the fund's business and/or reputation; (ii) implementing processes and controls to lessen the possibility that such events or circumstances occur or to mitigate the effects of such events or circumstances if they do occur; and (iii) creating and maintaining a system designed to evaluate continuously business and market conditions in order to facilitate the identification and implementation processes described in (i) and (ii) above. Because the day-to-day operations and activities of the fund are carried out by or through FMR, its affiliates, and other service providers, the fund's exposure to risks is mitigated but not eliminated by the processes overseen by the Trustees. While each of the Board's committees has responsibility for overseeing different aspects of the fund's activities, oversight is exercised primarily through the Operations, Audit, and Compliance Committees. Appropriate personnel, including but not limited to the fund's Chief Compliance Officer (CCO), FMR's internal auditor, the independent accountants, the fund's Treasurer and portfolio management personnel, make periodic reports to the Board's committees, as appropriate, including an annual review of Fidelity's risk management program for the Fidelity® funds. The responsibilities of each standing committee, including their oversight responsibilities, are described further under "Standing Committees of the Trustees."
Interested Trustees*:
Correspondence intended for a Trustee who is an interested person may be sent to Fidelity Investments, 245 Summer Street, Boston, Massachusetts 02210.
Name, Year of Birth; Principal Occupations and Other Relevant Experience+
James C. Curvey (1935)
Year of Election or Appointment: 2007
Trustee
Chairman of the Board of Trustees
Mr. Curvey also serves as Trustee of other Fidelity® funds. Mr. Curvey is Vice Chairman (2007-present) and Director of FMR LLC (diversified financial services company). In addition, Mr. Curvey is an Overseer Emeritus for the Boston Symphony Orchestra, a Director of Artis-Naples, and a Trustee of Brewster Academy in Wolfeboro, New Hampshire. Previously, Mr. Curvey served as a Director of Fidelity Research & Analysis Co. (investment adviser firm, 2009-2018), Director of Fidelity Investments Money Management, Inc. (investment adviser firm, 2009-2014) and a Director of FMR and FMR Co., Inc. (investment adviser firms, 2007-2014).
* Determined to be an “Interested Trustee” by virtue of, among other things, his or her affiliation with the trust or various entities under common control with FMR.
+ The information includes the Trustee's principal occupation during the last five years and other information relating to the experience, attributes, and skills relevant to the Trustee's qualifications to serve as a Trustee, which led to the conclusion that the Trustee should serve as a Trustee for the fund.
Independent Trustees:
Correspondence intended for an Independent Trustee may be sent to Fidelity Investments, P.O. Box 55235, Boston, Massachusetts 02205-5235.
Name, Year of Birth; Principal Occupations and Other Relevant Experience+
Dennis J. Dirks (1948)
Year of Election or Appointment: 2007
Trustee
Mr. Dirks also serves as Trustee of other Fidelity® funds. Prior to his retirement in May 2003, Mr. Dirks was Chief Operating Officer and a member of the Board of The Depository Trust & Clearing Corporation (DTCC). He also served as President, Chief Operating Officer, and Board member of The Depository Trust Company (DTC) and President and Board member of the National Securities Clearing Corporation (NSCC). In addition, Mr. Dirks served as Chief Executive Officer and Board member of the Government Securities Clearing Corporation, Chief Executive Officer and Board member of the Mortgage-Backed Securities Clearing Corporation, as a Trustee and a member of the Finance Committee of Manhattan College (2005-2008), as a Trustee and a member of the Finance Committee of AHRC of Nassau County (2006-2008), as a member of the Independent Directors Council (IDC) Governing Council (2010-2015), and as a member of the Board of Directors for The Brookville Center for Children’s Services, Inc. (2009-2017). Mr. Dirks is a member of the Finance Committee (2016-present) and Board of Directors (2017-present) and is Treasurer (2018-present) of the Asolo Repertory Theatre.
Donald F. Donahue (1950)
Year of Election or Appointment: 2018
Trustee
Mr. Donahue also serves as a Trustee of other Fidelity® funds. Mr. Donahue is President and Chief Executive Officer of Miranda Partners, LLC (risk consulting for the financial services industry, 2012-present). Previously, Mr. Donahue served as a Member of the Advisory Board of certain Fidelity® funds (2015-2018) and Chief Executive Officer (2006-2012), Chief Operating Officer (2003-2006), and Managing Director, Customer Marketing and Development (1999-2003) of The Depository Trust & Clearing Corporation (financial markets infrastructure). Mr. Donahue serves as a Member (2007-present) and Co-Chairman (2016-present) of the Board of Directors of United Way of New York, Member of the Board of Directors of NYC Leadership Academy (2012-present) and Member of the Board of Advisors of Ripple Labs, Inc. (financial services, 2015-present). He also served as Chairman (2010-2012) and Member of the Board of Directors (2012-2013) of Omgeo, LLC (financial services), Treasurer of United Way of New York (2012-2016), and Member of the Board of Directors of XBRL US (financial services non-profit, 2009-2012) and the International Securities Services Association (2009-2012).
Alan J. Lacy (1953)
Year of Election or Appointment: 2008
Trustee
Mr. Lacy also serves as Trustee of other Fidelity® funds. Mr. Lacy serves as a Director of Bristol-Myers Squibb Company (global pharmaceuticals, 2008-present). He is a Trustee of the California Chapter of The Nature Conservancy (2015-present) and a Director of the Center for Advanced Study in the Behavioral Sciences at Stanford University (2015-present). In addition, Mr. Lacy served as Senior Adviser (2007-2014) of Oak Hill Capital Partners, L.P. (private equity) and also served as Chief Executive Officer (2005) and Vice Chairman (2005-2006) of Sears Holdings Corporation (retail) and Chief Executive Officer and Chairman of the Board of Sears, Roebuck and Co. (retail, 2000-2005). Previously, Mr. Lacy served as Chairman (2014-2017) and a member (2010-2017) of the Board of Directors of Dave & Buster’s Entertainment, Inc. (restaurant and entertainment complexes), as Chairman (2008-2011) and a member (2006-2015) of the Board of Trustees of the National Parks Conservation Association, and as a member of the Board of Directors for The Hillman Companies, Inc. (hardware wholesalers, 2010-2014), Earth Fare, Inc. (retail grocery, 2010-2014), and The Western Union Company (global money transfer, 2006-2011).
Ned C. Lautenbach (1944)
Year of Election or Appointment: 2007
Trustee
Chairman of the Independent Trustees
Mr. Lautenbach also serves as Trustee of other Fidelity® funds. Mr. Lautenbach currently serves as Chair (2018-present) and Member (2013-present) of the Board of Governors, State University System of Florida and is a member of the Council on Foreign Relations (1994-present). He is also a member and has most recently served as Chairman of the Board of Directors of Artis-Naples (2012-present). Previously, Mr. Lautenbach served as a member and then Lead Director of the Board of Directors of Eaton Corporation (diversified industrial, 1997-2016). He was also a Partner and Advisory Partner at Clayton, Dubilier & Rice, LLC (private equity investment, 1998-2010), as well as a Director of Sony Corporation (2006-2007). In addition, Mr. Lautenbach also had a 30-year career with IBM (technology company) during which time he served as Senior Vice President and a member of the Corporate Executive Committee (1968-1998).
Joseph Mauriello (1944)
Year of Election or Appointment: 2008
Trustee
Mr. Mauriello also serves as Trustee of other Fidelity® funds. Prior to his retirement in January 2006, Mr. Mauriello served in numerous senior management positions including Deputy Chairman and Chief Operating Officer (2004-2005), and Vice Chairman of Financial Services (2002-2004) of KPMG LLP US (professional services, 1965-2005). Mr. Mauriello currently serves as a member of the Independent Directors Council (IDC) Governing Council (2015-present). Previously, Mr. Mauriello served as a member of the Board of Directors of XL Group plc. (global insurance and re-insurance, 2006-2018).
Cornelia M. Small (1944)
Year of Election or Appointment: 2007
Trustee
Ms. Small also serves as Trustee of other Fidelity® funds. Ms. Small is a member of the Board of Directors (2009-present) and Chair of the Investment Committee (2010-present) of the Teagle Foundation. Ms. Small also serves on the Investment Committee of the Berkshire Taconic Community Foundation (2008-present). Previously, Ms. Small served as Chairperson (2002-2008) and a member of the Investment Committee and Chairperson (2008-2012) and a member of the Board of Trustees of Smith College. In addition, Ms. Small served as Chief Investment Officer, Director of Global Equity Investments, and a member of the Board of Directors of Scudder, Stevens & Clark and Scudder Kemper Investments.
Garnett A. Smith (1947)
Year of Election or Appointment: 2018
Trustee
Mr. Smith also serves as Trustee of other Fidelity® funds. Prior to Mr. Smith's retirement, he served as Chairman and Chief Executive Officer of Inbrand Corp. (manufacturer of personal absorbent products, 1990-1997). He also served as President (1986-1990) of Inbrand Corp. Prior to his employment with Inbrand Corp., he was employed by a retail fabric chain and North Carolina National Bank. In addition, Mr. Smith served as a Member of the Advisory Board of certain Fidelity® funds (2012-2013) and as a board member of the Jackson Hole Land Trust (2009-2012).
David M. Thomas (1949)
Year of Election or Appointment: 2008
Trustee
Mr. Thomas also serves as Trustee of other Fidelity® funds. Mr. Thomas serves as Non-Executive Chairman of the Board of Directors of Fortune Brands Home and Security (home and security products, 2011-present) and as a member of the Board of Directors (2004-present) and Presiding Director (2013-present) of Interpublic Group of Companies, Inc. (marketing communication). Previously, Mr. Thomas served as Executive Chairman (2005-2006) and Chairman and Chief Executive Officer (2000-2005) of IMS Health, Inc. (pharmaceutical and healthcare information solutions), a Director of Fortune Brands, Inc. (consumer products, 2000-2011), and a member of the Board of Trustees of the University of Florida (2013-2018).
Michael E. Wiley (1950)
Year of Election or Appointment: 2018
Trustee
Mr. Wiley also serves as Trustee or Member of the Advisory Board of other Fidelity® funds. Mr. Wiley serves as a Director of High Point Resources (exploration and production, 2005-present). Previously, Mr. Wiley served as a Director of Andeavor Corporation (independent oil refiner and marketer, 2005-2018), a Director of Andeavor Logistics LP (natural resources logistics, 2015-2018), a Director of Post Oak Bank (privately-held bank, 2004-2018), a Director of Asia Pacific Exploration Consolidated (international oil and gas exploration and production, 2008-2013), a member of the Board of Trustees of the University of Tulsa (2000-2006; 2007-2010), a Senior Energy Advisor of Katzenbach Partners, LLC (consulting, 2006-2007), an Advisory Director of Riverstone Holdings (private investment), a Director of Spinnaker Exploration Company (exploration and production, 2001-2005) and Chairman, President, and CEO of Baker Hughes, Inc. (oilfield services, 2000-2004).
+ The information includes the Trustee's principal occupation during the last five years and other information relating to the experience, attributes, and skills relevant to the Trustee's qualifications to serve as a Trustee, which led to the conclusion that the Trustee should serve as a Trustee for the fund.
Advisory Board Members and Officers:
Correspondence intended for a Member of the Advisory Board (if any) may be sent to Fidelity Investments, P.O. Box 55235, Boston, Massachusetts 02205-5235. Correspondence intended for an officer or Peter S. Lynch may be sent to Fidelity Investments, 245 Summer Street, Boston, Massachusetts 02210. Officers appear below in alphabetical order.
Name, Year of Birth; Principal Occupation
Vicki L. Fuller (1957)
Year of Election or Appointment: 2018
Member of the Advisory Board
Ms. Fuller also serves as Member of the Advisory Board of other Fidelity® funds. Ms. Fuller serves as a member of the Board of Directors, Audit Committee, and Nominating and Governance Committee of The Williams Companies, Inc. (natural gas infrastructure, 2018-present). Previously, Ms. Fuller served as the Chief Investment Officer of the New York State Common Retirement Fund (2012-2018) and held a variety of positions at AllianceBernstein L.P. (global asset management, 1985-2012), including Managing Director (2006-2012) and Senior Vice President and Senior Portfolio Manager (2001-2006).
Patricia L. Kampling (1959)
Year of Election or Appointment: 2020
Member of the Advisory Board
Ms. Kampling also serves as Member of the Advisory Board of other Fidelity® funds. Prior to her retirement, Ms. Kampling served as Chairman of the Board and Chief Executive Officer (2012-2019), President and Chief Operating Officer (2011-2012) and Executive Vice President and Chief Financial Officer (2010-2011) of Alliant Energy Corporation. Ms. Kampling currently serves as a member of the Board, Compensation Committee and Executive Committee and as Chair of the Audit Committee of Briggs & Stratton Corporation (manufacturing, 2011-present) and as a member of the Board, Audit, Finance and Risk Committee and Safety, Environmental, Technology and Operations Committee of American Water Works Company, Inc. (utilities company, 2019-present). In addition, Ms. Kampling currently serves as a member of the Board of the Nature Conservancy, Wisconsin Chapter (2019-present). Previously, Ms. Kampling served as a member of the Board of Interstate Power and Light Company (2012-2019) and Wisconsin Power and Light Company (2012-2019) (each a subsidiary of Alliant Energy Corporation) and as a member of the Board and Workforce Development Committee of the Business Roundtable (2018-2019).
Peter S. Lynch (1944)
Year of Election or Appointment: 2003
Member of the Advisory Board
Mr. Lynch also serves as Member of the Advisory Board of other Fidelity® funds. Mr. Lynch is Vice Chairman and a Director of Fidelity Management & Research Company LLC (investment adviser firm). In addition, Mr. Lynch serves as a Trustee of Boston College and as the Chairman of the Inner-City Scholarship Fund. Previously, Mr. Lynch served as Vice Chairman and a Director of FMR Co., Inc. (investment adviser firm) and on the Special Olympics International Board of Directors (1997-2006).
Susan Tomasky (1953)
Year of Election or Appointment: 2020
Member of the Advisory Board
Ms. Tomasky also serves as Member of the Advisory Board of other Fidelity® funds. Prior to her retirement, Ms. Tomasky served in various executive officer positions at American Electric Power Company, Inc. (1998-2011), including most recently as President of AEP Transmission (2007-2011). Ms. Tomasky currently serves as a member of the Board and Sustainability Committee and as Chair of the Audit Committee of Marathon Petroleum Corporation (2018-present) and as a member of the Board, Corporate Governance Committee and Organization and Compensation Committee and as Chair of the Audit Committee of Public Service Enterprise Group, Inc. (utilities company, 2012-present). In addition, Ms. Tomasky currently serves as a member of the Board of the Columbus Regional Airport Authority (2007-present), as a member of the Board of the Royal Shakespeare Company – America (2009-present), as a member of the Board of the Columbus Association for the Performing Arts (2011-present) and as a member of the Board of Kenyon College (2016-present). Previously, Ms. Tomasky served as a member of the Board (2011-2019) and as Lead Independent Director (2015-2018) of Andeavor Corporation (previously Tesoro Corporation) (independent oil refiner and marketer) and as a member of the Board of Summit Midstream Partners LP (energy, 2012-2018).
Elizabeth Paige Baumann (1968)
Year of Election or Appointment: 2017
Anti-Money Laundering (AML) Officer
Ms. Baumann also serves as AML Officer of other funds. She is Chief AML Officer (2012-present) and Senior Vice President (2014-present) of FMR LLC (diversified financial services company) and is an employee of Fidelity Investments. Previously, Ms. Baumann served as AML Officer of the funds (2012-2016), and Vice President (2007-2014) and Deputy Anti-Money Laundering Officer (2007-2012) of FMR LLC.
Craig S. Brown (1977)
Year of Election or Appointment: 2019
Assistant Treasurer
Mr. Brown also serves as Assistant Treasurer of other funds. Mr. Brown is an employee of Fidelity Investments (2013-present).
John J. Burke III (1964)
Year of Election or Appointment: 2018
Chief Financial Officer
Mr. Burke also serves as Chief Financial Officer of other funds. Mr. Burke serves as Head of Investment Operations for Fidelity Fund and Investment Operations (2018-present) and is an employee of Fidelity Investments (1998-present). Previously Mr. Burke served as head of Asset Management Investment Operations (2012-2018).
William C. Coffey (1969)
Year of Election or Appointment: 2019
Assistant Secretary
Mr. Coffey also serves as Assistant Secretary of other funds. He is Senior Vice President and Deputy General Counsel of FMR LLC (diversified financial services company, 2010-present), and is an employee of Fidelity Investments. Previously, Mr. Coffey served as Secretary and CLO of certain funds (2018-2019); CLO, Secretary, and Senior Vice President of Fidelity Management & Research Company and FMR Co., Inc. (investment adviser firms, 2018-2019); Secretary of Fidelity SelectCo, LLC and Fidelity Investments Money Management, Inc. (investment adviser firms, 2018-2019); CLO of Fidelity Management & Research (Hong Kong) Limited, FMR Investment Management (UK) Limited, and Fidelity Management & Research (Japan) Limited (investment adviser firms, 2018-2019); and Assistant Secretary of certain funds (2009-2018).
Timothy M. Cohen (1969)
Year of Election or Appointment: 2018
Vice President
Mr. Cohen also serves as Vice President of other funds. Mr. Cohen serves as Co-Head of Equity (2018-present), a Director of Fidelity Management & Research (Japan) Limited (investment adviser firm, 2016-present), and is an employee of Fidelity Investments. Previously, Mr. Cohen served as Executive Vice President of Fidelity SelectCo, LLC (2019), Head of Global Equity Research (2016-2018), Chief Investment Officer - Equity and a Director of Fidelity Management & Research (U.K.) Inc. (investment adviser firm, 2013-2015) and as a Director of Fidelity Management & Research (Hong Kong) Limited (investment adviser firm, 2017).
Jonathan Davis (1968)
Year of Election or Appointment: 2010
Assistant Treasurer
Mr. Davis also serves as Assistant Treasurer of other funds. Mr. Davis serves as Assistant Treasurer of FMR Capital, Inc. (2017-present) and is an employee of Fidelity Investments. Previously, Mr. Davis served as Vice President and Associate General Counsel of FMR LLC (diversified financial services company, 2003-2010).
Laura M. Del Prato (1964)
Year of Election or Appointment: 2018
Assistant Treasurer
Ms. Del Prato also serves as an officer of other funds. Ms. Del Prato is an employee of Fidelity Investments (2017-present). Prior to joining Fidelity Investments, Ms. Del Prato served as a Managing Director and Treasurer of the JPMorgan Mutual Funds (2014-2017). Prior to JPMorgan, Ms. Del Prato served as a partner at Cohen Fund Audit Services (accounting firm, 2012-2013) and KPMG LLP (accounting firm, 2004-2012).
Colm A. Hogan (1973)
Year of Election or Appointment: 2020
Assistant Treasurer
Mr. Hogan also serves as an officer of other funds. Mr. Hogan serves as Assistant Treasurer of FMR Capital, Inc. (2017-present) and is an employee of Fidelity Investments (2005-present). Previously, Mr. Hogan served as Deputy Treasurer of certain Fidelity® funds (2016-2020) and Assistant Treasurer of certain Fidelity® funds (2016-2018).
Pamela R. Holding (1964)
Year of Election or Appointment: 2018
Vice President
Ms. Holding also serves as Vice President of other funds. Ms. Holding serves as Co-Head of Equity (2018-present) and is an employee of Fidelity Investments (2013-present). Previously, Ms. Holding served as Executive Vice President of Fidelity SelectCo, LLC (2019) and as Chief Investment Officer of Fidelity Institutional Asset Management (2013-2018).
Cynthia Lo Bessette (1969)
Year of Election or Appointment: 2019
Secretary and Chief Legal Officer (CLO)
Ms. Lo Bessette also serves as an officer of other funds. Ms. Lo Bessette serves as CLO, Secretary, and Senior Vice President of Fidelity Management & Research Company LLC (investment adviser firm, 2019-present); and CLO of Fidelity Management & Research (Hong Kong) Limited, FMR Investment Management (UK) Limited, and Fidelity Management & Research (Japan) Limited (investment adviser firms, 2019-present). She is a Senior Vice President and Deputy General Counsel of FMR LLC (diversified financial services company, 2019-present), and is an employee of Fidelity Investments. Previously, Ms. Lo Bessette served as CLO, Secretary, and Senior Vice President of FMR Co., Inc. (investment adviser firm, 2019); Secretary of Fidelity SelectCo, LLC and Fidelity Investments Money Management, Inc. (investment adviser firms, 2019). Prior to joining Fidelity Investments, Ms. Lo Bessette was Executive Vice President, General Counsel (2016-2019) and Senior Vice President, Deputy General Counsel (2015-2016) of OppenheimerFunds (investment management company) and Deputy Chief Legal Officer (2013-2015) of Jennison Associates LLC (investment adviser firm).
Chris Maher (1972)
Year of Election or Appointment: 2020
Deputy Treasurer
Mr. Maher also serves as an officer of other funds. Mr. Maher serves as Assistant Treasurer of FMR Capital, Inc. (2017-present), and is an employee of Fidelity Investments (2008-present). Previously, Mr. Maher served as Assistant Treasurer of certain funds (2013-2020); Vice President of Asset Management Compliance (2013), Vice President of the Program Management Group of FMR (investment adviser firm, 2010-2013), and Vice President of Valuation Oversight (2008-2010).
Kenneth B. Robins (1969)
Year of Election or Appointment: 2016
Chief Compliance Officer
Mr. Robins also serves as an officer of other funds. Mr. Robins serves as Compliance Officer of Fidelity Management & Research Company LLC (investment adviser firm, 2016-present) and is an employee of Fidelity Investments (2004-present). Previously, Mr. Robins served as Compliance Officer of FMR Co., Inc. (investment adviser firm, 2016-2019), as Executive Vice President of Fidelity Investments Money Management, Inc. (investment adviser firm, 2013-2016) and served in other fund officer roles.
Stacie M. Smith (1974)
Year of Election or Appointment: 2016
President and Treasurer
Ms. Smith also serves as an officer of other funds. Ms. Smith serves as Assistant Treasurer of FMR Capital, Inc. (2017-present), is an employee of Fidelity Investments (2009-present), and has served in other fund officer roles. Prior to joining Fidelity Investments, Ms. Smith served as Senior Audit Manager of Ernst & Young LLP (accounting firm, 1996-2009). Previously, Ms. Smith served as Assistant Treasurer (2013-2019) and Deputy Treasurer (2013-2016) of certain Fidelity® funds.
Marc L. Spector (1972)
Year of Election or Appointment: 2016
Assistant Treasurer
Mr. Spector also serves as an officer of other funds. Mr. Spector serves as Assistant Treasurer of FMR Capital, Inc. (2017-present) and is an employee of Fidelity Investments (2016-present). Prior to joining Fidelity Investments, Mr. Spector served as Director at the Siegfried Group (accounting firm, 2013-2016), and prior to Siegfried Group as audit senior manager at Deloitte & Touche (accounting firm, 2005-2013).
Jim Wegmann (1979)
Year of Election or Appointment: 2019
Assistant Treasurer
Mr. Wegmann also serves as Assistant Treasurer of other funds. Mr. Wegmann is an employee of Fidelity Investments (2011-present).
Shareholder Expense Example
As a shareholder of the Fund, you incur two types of costs: (1) transaction costs and (2) ongoing costs, including other Fund expenses. This Example is intended to help you understand your ongoing costs (in dollars) of investing in the Fund and to compare these costs with the ongoing costs of investing in other mutual funds.
The Example is based on an investment of $1,000 invested at the beginning of the period and held for the entire period (July 1, 2019 to December 31, 2019).
Actual Expenses
The first line of the accompanying table provides information about actual account values and actual expenses. You may use the information in this line, together with the amount you invested, to estimate the expenses that you paid over the period. Simply divide your account value by $1,000.00 (for example, an $8,600 account value divided by $1,000.00 = 8.6), then multiply the result by the number in the first line under the heading entitled "Expenses Paid During Period" to estimate the expenses you paid on your account during this period. In addition, the Fund, as a shareholder in the underlying Fidelity Central Funds, will indirectly bear its pro-rata share of the fees and expenses incurred by the underlying Fidelity Central Funds. These fees and expenses are not included in the Fund's annualized expense ratio used to calculate the expense estimate in the table below.
Hypothetical Example for Comparison Purposes
The second line of the accompanying table provides information about hypothetical account values and hypothetical expenses based on the Fund's actual expense ratio and an assumed rate of return of 5% per year before expenses, which is not the Fund's actual return. The hypothetical account values and expenses may not be used to estimate the actual ending account balance or expenses you paid for the period. You may use this information to compare the ongoing costs of investing in the Fund and other funds. To do so, compare this 5% hypothetical example with the 5% hypothetical examples that appear in the shareholder reports of the other funds. In addition, the Fund, as a shareholder in the underlying Fidelity Central Funds, will indirectly bear its pro-rata share of the fees and expenses incurred by the underlying Fidelity Central Funds. These fees and expenses are not included in the Fund's annualized expense ratio used to calculate the expense estimate in the table below.
Please note that the expenses shown in the table are meant to highlight your ongoing costs only and do not reflect any transaction costs. Therefore, the second line of the table is useful in comparing ongoing costs only, and will not help you determine the relative total costs of owning different funds.
| | Annualized Expense Ratio-A | Beginning
Account Value
July 1, 2019 | Ending
Account Value
December 31, 2019 | Expenses Paid
During Period-B
July 1, 2019
to December 31, 2019 |
| Actual | .0039% | $1,000.00 | $1,018.10 | $.02 |
| Hypothetical-C | | $1,000.00 | $1,025.19 | $.02 |
A Annualized expense ratio reflects expenses net of applicable fee waivers.
B Expenses are equal to the Fund's annualized expense ratio, multiplied by the average account value over the period, multiplied by 184/365 (to reflect the one-half year period).
C 5% return per year before expenses
Distributions (Unaudited)
A total of 2.55% of the dividends distributed during the fiscal year was derived from interest on U.S. Government securities which is generally exempt from state income tax.
The fund hereby designates as a capital gain dividend with respect to the taxable year ended December,31 2019, $7,285,405, or, if subsequently determined to be different, the net capital gain of such year.
The fund will notify shareholders in January 2020 of amounts for use in preparing 2019 income tax returns.
Board Approval of Investment Advisory Contracts
Fidelity Emerging Markets Debt Central Fund
At its November 2019 meeting, the Board of Trustees, including the Independent Trustees (together, the Board), voted to approve an amended and restated management contract and amended and restated sub-advisory agreements (together, the Amended and Restated Contracts) for the fund, effective January 1, 2020, for a one month period through January 31, 2020, in connection with an upcoming consolidation of certain of Fidelity's advisory businesses.
The Board considered that, on or about January 1, 2020, each of FMR Co., Inc. (FMRC), Fidelity Investments Money Management, Inc. (FIMM), and SelectCo, LLC (SelectCo) will merge with and into Fidelity Management & Research Company (FMR) and that, after the merger, FMR will redomicile as a Delaware limited liability company. The Board also approved the termination of the sub-advisory agreement with FMRC upon the completion of the merger. The Board noted that the Amended and Restated Contracts would be updated to reflect the renamed adviser, Fidelity Management & Research Company LLC and its new form of organization and domicile. The Board also noted that the Amended and Restated Contracts will not change the investment processes, the level or nature of services provided, the resources and personnel allocated, trading and compliance operations, or any fees or expenses paid by the fund.
The Board concluded that the fund's Amended and Restated Contracts are fair and reasonable, and that the fund's Advisory Contracts should be approved through January 31, 2020.
In connection with its consideration of future renewals of the fund's Amended and Restated Contracts, the Board will consider: (i) the nature, extent and quality of services provided to the fund, including shareholder and administrative services and investment performance; (ii) the competitiveness of the management fee and total expenses for the fund; (iii) the costs of the services and profitability, including the revenues earned and the expenses incurred in conducting the business of developing, marketing, distributing, managing, administering, and servicing the fund and its shareholders, to the extent applicable; and (iv) whether there have been economies of scale in respect of the Fidelity funds, whether the Fidelity funds (including the fund) have appropriately benefited from any such economies of scale, and whether there is the potential for realization of any further economies.
Based on its evaluation of all of the conclusions noted above, and after considering all factors it believed relevant, the Board ultimately concluded that the fund's management fee structure is fair and reasonable, and that the continuation of the fund's Amended and Restated Contracts should be approved.

SI-ANN-0220
1.540220.122