| For immediate release | Exhibit 99-1 |
| April 24, 2007 | (publié également en français) |
Petro-Canada Delivers Strong First Quarter Earnings: Upstream Production Grows
Highlights
| · | Production of more than 400,000 barrels of oil equivalent per day (boe/d) net |
| · | Construction of the Edmonton refinery conversion project 23% complete at the end of the first quarter of 2007 |
| · | Strong petroleum product demand and refining margins bolster Downstream results |
Calgary - Petro-Canada announced today first quarter operating earnings from continuing operations adjusted for unusual items of $580 million ($1.17/share), compared with $486 million ($0.95/share) in the first quarter of 2006. First quarter 2007 cash flow from continuing operations was $1,166 million ($2.35/share), compared with $857 million ($1.67/share) in the same quarter of last year. Cash flow is before changes in non-cash working capital.
Net earnings from continuing operations were $590 million ($1.19/share) in the first quarter of 2007, compared with $54 million ($0.11/share) in the same period of 2006. Net earnings include unrealized gains or losses on derivative contracts, and gains or losses on foreign currency translation and disposal of assets.
“We broke through the 400,000 barrel per day mark, consistent with our target of increasing production by 15% in 2007,” said Ron Brenneman, president and chief executive officer. “At the same time, we continued to advance our five major projects and saw early exploration success in the North Sea.”
First Quarter Results
| | Three months ended March 31, | |
(millions of Canadian dollars, except per share and share amounts) | 2007 | | 2006 | |
Consolidated Results | | | | |
Operating earnings adjusted for unusual items (1) | $ | 580 | | $ | 504 | |
| Net earnings | | 590 | | | 206 | |
| Cash flow | $ | 1,166 | | $ | 874 | |
Results from Continuing Operations (2) | | | | | | |
Operating earnings from continuing operations adjusted for unusual items (1) | $ | 580 | | $ | 486 | |
| - $/share | | 1.17 | | | 0.95 | |
| Net earnings from continuing operations | | 590 | | | 54 | |
| - $/share | | 1.19 | | | 0.11 | |
| Cash flow from continuing operations | | 1,166 | | | 857 | |
| - $/share | | 2.35 | | | 1.67 | |
Dividends - $/share | | 0.13 | | | 0.10 | |
| Share buyback program | | 87 | | | 476 | |
| - millions of shares | | 2.0 | | | 8.8 | |
| Capital expenditures for continuing operations | $ | 733 | | $ | 767 | |
Weighted-average common shares outstanding (millions of shares) | | 497.0 | | | 512.9 | |
| (1) | Operating earnings adjusted for unusual items (which represent net earnings, excluding gains or losses on foreign currency translation and on disposal of assets and the unrealized gains or losses associated with the Buzzard derivative contracts) are used by the Company to evaluate operating performance. |
| (2) | On January 31, 2006, Petro-Canada closed the sale of its mature Syrian producing assets. These assets and associated results are reported as discontinued operations and are excluded from continuing operations. |
Operating Highlights
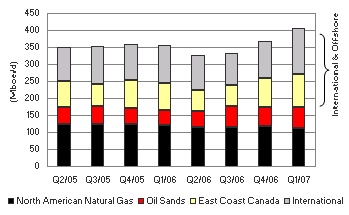
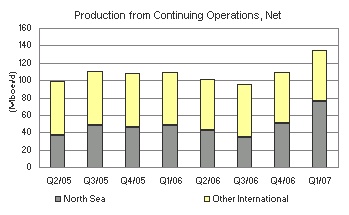
First quarter production from continuing operations averaged 405,000 boe/d net to Petro-Canada in 2007, up from 355,000 boe/d net in the same quarter of 2006. Higher volumes reflected the addition of North Sea projects (Buzzard, De Ruyter and L5b-C) and higher East Coast Canada and Oil Sands production. This was partially offset by natural declines in the North American Natural Gas business.
In the Downstream, strong North American petroleum product demand and refining margins, combined with solid execution, delivered excellent first quarter results.
“The Downstream had a very good quarter,” said Brenneman. “We’ve been improving the fundamentals of this business for several years so that, when the business environment is strong, it shows up on our bottom line.”
| Three months ended March 31, | |
| | 2007 | | 2006 | |
Upstream - Consolidated (1) | | | | |
| Production before royalties | | | | |
Crude oil and natural gas liquids (NGL) production net (thousands of barrels/day - Mb/d) | 280.4 | | 245.6 | |
Natural gas production net, excluding injectants (millions of cubic feet/day - MMcf/d) | 748 | | 787 | |
Total production net (thousands of barrels of oil equivalent/day - Mboe/d) (2) | 405 | | 377 | |
| Average realized prices | | | | |
Crude oil and NGL ($/barrel - $/bbl) | 63.46 | | 64.82 | |
Natural gas ($/thousand cubic feet - $/Mcf) | 7.32 | | 8.68 | |
Upstream - Continuing Operations | | | | |
| Production from continuing operations before royalties | | | | |
Crude oil and NGL production, net (Mb/d) | 280.4 | | 225.0 | |
Natural gas production, net, excluding injectants (MMcf/d) | 748 | | 779 | |
Total production, net (Mboe/d) (2) | 405 | | 355 | |
| Average realized prices from continuing operations | | | | |
Crude oil and NGL ($/bbl) | 63.46 | | 64.18 | |
Natural gas ($/Mcf) | 7.32 | | 8.69 | |
Downstream | | | | |
Petroleum product sales (thousands of cubic metres/day - m3/d) | 53.0 | | 49.9 | |
Average refinery utilization (%) | 96 | | 98 | |
Downstream earnings from operations after-tax (cents/litre) | 3.8 | | 1.6 | |
| (1) | Includes discontinued operations. |
| (2) | Total production includes natural gas converted at six Mcf of natural gas for one bbl of oil. |
Outlook
Operational Updates
| · | Buzzard on plan, ramping up to full production by mid-2007 |
| · | Lubricants plant planned catalyst changeout to be completed in the second quarter of 2007 |
| · | Terra Nova 10-day maintenance turnaround scheduled for the second quarter of 2007 |
| · | Syncrude Coker 8-3 maintenance turnaround of about 30 days planned for the second quarter of 2007 |
| · | White Rose planned 14-day maintenance turnaround to be completed in the third quarter of 2007 |
Major Project Milestones
| · | Edmonton refinery conversion project construction on track for startup in the third quarter of 2008 |
| · | Montreal coker investment decision expected in the fourth quarter of 2007 |
| · | Syria gas development front-end engineering and design (FEED) to be completed early in 2008 |
| · | MacKay River expansion regulatory decision anticipated in the third quarter of 2007 |
| · | Fort Hills design basis available in July 2007 |
Petro-Canada is one of Canada’s largest oil and gas companies, operating in both the upstream and downstream sectors of the industry in Canada and internationally. The Company creates value by responsibly developing energy resources and providing world class petroleum products and services. Petro-Canada is proud to be a National Partner to the Vancouver 2010 Olympic and Paralympic Winter Games. Petro-Canada’s common shares trade on the Toronto Stock Exchange (TSX) under the symbol PCA and on the New York Stock Exchange (NYSE) under the symbol PCZ.
| For more information, please contact: | |
| INVESTOR AND ANALYST INQUIRIES | MEDIA AND GENERAL INQUIRIES |
| | |
| Gordon Ritchie | Michelle Harries |
| Investor Relat | Corporate Communications |
| 403-296-7691 | 403-296-3648 |
| |
|
MANAGEMENT’S DISCUSSION AND ANALYSIS
The Management’s Discussion and Analysis (MD&A), dated April 24, 2007, is set out in pages 4 to 26 and should be read in conjunction with the unaudited Consolidated Financial Statements of the Company for the three months ended March 31, 2007; the MD&A for the year ended December 31, 2006; the audited Consolidated Financial Statements for the year ended December 31, 2006 and the Company’s 2006 Annual Information Form (AIF) dated March 22, 2007. Amounts are in Canadian dollars unless otherwise specified.
NON-GAAP MEASURES
Cash flow, which is expressed as cash flow from operating activities before changes in non-cash working capital, is used by the Company to analyse operating performance, leverage and liquidity. Operating earnings represent net earnings, excluding gains or losses on foreign currency translation and disposal of assets and unrealized gains or losses on the mark-to-market valuation of the derivative contracts associated with the Buzzard acquisition. Operating earnings are used by the Company to evaluate operating performance. Cash flow and operating earnings do not have a standardized meaning prescribed by Canadian generally accepted accounting principles (GAAP) and, therefore, may not be comparable with the calculations of similar measures for other companies. For reconciliation of the operating earnings and cash flow amounts to the associated GAAP measure, refer to the tables on pages 10 and 26, respectively, of this MD&A.
LEGAL NOTICE - FORWARD-LOOKING INFORMATION
This quarterly report contains forward-looking information. You can usually identify this information by such words as "plan," "anticipate," "forecast," "believe," "target," "intend," "expect," "estimate," "budget" or other similar wording suggesting future outcomes or statements about an outlook. Below are examples of references to forward-looking information:
· business strategies and goals · outlook (including operational updates and strategic milestones) · future capital, exploration and other expenditures · future resource purchases and sales · construction and repair activities · refinery turnarounds · anticipated refining margins · future oil and gas production levels and the sources of their growth · project development, and expansion schedules and results · future results of exploration activities and dates by which certain areas may be developed or may come on-stream | · retail throughputs · pre-production and operating costs · reserves and resources estimates · royalties and taxes payable · production life-of-field estimates · natural gas export capacity · future financing and capital activities (including purchases of Petro-Canada common shares under the Company's normal course issuer bid (NCIB) program) · contingent liabilities (including potential exposure to losses related to retail licensee agreements) · environmental matters · future regulatory approvals |
Such forward-looking information is subject to known and unknown risks and uncertainties. Other factors may cause actual results, levels of activity and achievements to differ materially from those expressed or implied by such information. Such factors include, but are not limited to,
· industry capacity · imprecise reserves estimates of recoverable quantities of oil, natural gas and liquids from resource plays, and other sources not currently classified as reserves · the effects of weather and climate conditions · the results of exploration and development drilling, and related activities · the ability of suppliers to meet commitments · decisions or approvals from administrative tribunals · risks attendant with domestic and international oil and gas operations · expected rates of return | · general economic, market and business conditions · competitive action by other companies · fluctuations in oil and gas prices · refining and marketing margins · the ability to produce and transport crude oil and natural gas to markets · fluctuations in interest rates and foreign currency exchange rates · actions by governmental authorities (including changes in taxes, royalty rates and resource-use strategies) · changes in environmental and other regulations · international political events · nature and scope of actions by stakeholders and/or the general public |
Many of these and other similar factors are beyond the control of Petro-Canada. Petro-Canada discusses these factors in greater detail in filings with the Canadian provincial securities commissions and the United States (U.S.) Securities and Exchange Commission (SEC).
We caution readers that this list of important factors affecting forward-looking information is not exhaustive. Furthermore, the forward-looking information in this quarterly report is made as of April 24, 2007 and, except as required by applicable law, Petro-Canada does not update it publicly or revise it. This cautionary statement expressly qualifies the forward-looking information in this quarterly report.
Petro-Canada disclosure of reserves
Petro-Canada's qualified reserves evaluators prepare the reserves estimates the Company uses. The Canadian provincial securities commissions do not consider our reserves staff and management as independent of the Company. Petro-Canada has obtained an exemption from certain Canadian reserves disclosure requirements that allows the Company to make disclosure in accordance with SEC standards. This exemption allows comparisons with U.S. and other international issuers.
As a result, Petro-Canada formally discloses its reserves data and other oil and gas data using U.S. requirements and practices, and these may differ from Canadian domestic standards and practices. Note that when we use the term barrel of oil equivalent (boe) in this quarterly report, it may be misleading, particularly if used in isolation. A boe conversion ratio of six Mcf to one bbl is based on an energy equivalency conversion method. This method primarily applies at the burner tip and does not represent a value equivalency at the wellhead.
To disclose reserves in SEC filings, oil and gas companies must prove they are economically and legally producible under existing economic and operating conditions. Proof comes from actual production or conclusive formation tests. The use of terms such as "probable," "possible," "recoverable," or "potential reserves and resources" in this quarterly report does not meet the SEC guidelines for SEC filings.
The table below describes the industry definitions that we currently use:
Definitions Petro-Canada uses | | Reference |
| Proved oil and gas reserves (includes both proved developed and proved undeveloped) | | U.S. SEC reserves definition (Accounting Rules Regulation S-X 210.4-10, U.S. Financial Accounting Standards Board Statement No.-69) |
| Unproved reserves, probable and possible reserves | | CIM (Petroleum Society) definitions (Canadian Oil and Gas Evaluation Handbook, Vol. 1 Section 5) |
| Contingent and prospective resources | | Society of Petroleum Engineers, World Petroleum Congress and American Association of Petroleum Geologist definitions (approved February 2000) |
There is no certainty that it will be economically viable or technically feasible to produce any portion of the resources. For use in this quarterly report, "total resources" means reserves plus resources.
SEC regulations do not define proved reserves from our oil sands mining operations as an oil and gas activity. These reserves are classified as a mining activity and are estimated in accordance with SEC Industry Guide 7. For internal management purposes, Petro-Canada views these reserves and their development as part of the Company's total exploration and production operations.
Throughout this quarterly report, total Company reserves, total Company production, total Company reserves replacement and total Company reserves life index (RLI) are calculated using the sum of oil and gas activities, and oil sands mining activities. Before royalties, oil sands mining 2006 year-end proved reserves were 345 million barrels (MMbbls) and oil sands mining annual 2006 production was 11 MMbbls.
BUSINESS ENVIRONMENT
Market prices shown below influence average prices realized for crude oil, NGL, natural gas and petroleum products in the table on page 24.
UPSTREAM
Crude Oil
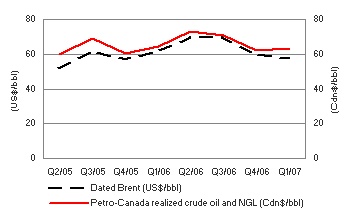
| Concern about a slowing U.S. economy, warmer than normal temperatures in early 2007 and high levels of crude inventories led to weaker oil prices in the first quarter of 2007. The price of Dated Brent averaged $57.75 US/bbl in the first quarter of 2007, down 6% from $61.75 US/bbl in the first quarter of 2006. During the first quarter of 2007, the Canadian dollar averaged $0.85 US, down from $0.87 US in the first quarter of 2006. As a result, Petro-Canada’s corporate-wide realized Canadian dollar prices for crude oil and NGL from continuing operations decreased 1%, from $64.18/bbl in the first quarter of 2006 to $63.46/bbl in the first quarter of 2007. |
In the first quarter of 2007, the spread between Dated Brent and Mexican Maya narrowed to $12.39 US/bbl, compared with $14.08 US/bbl in the first quarter of 2006. In Canada, the spread between Edmonton Light and Western Canada Select (WCS) also decreased to $18.16/bbl in the first quarter of 2007, compared with $29.29/bbl in the first quarter of 2006.
Natural Gas
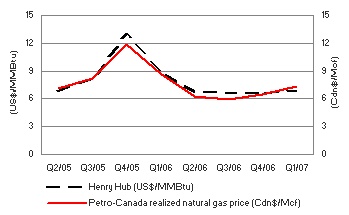
| North American natural gas prices were lower in the first quarter of 2007, compared with the first quarter of 2006, reflecting high levels of natural gas in storage and warmer than normal weather in early 2007. In the first quarter of 2007, NYMEX Henry Hub natural gas prices averaged $6.96 US/million British thermal units (MMBtu), down 23% from $9.08 US/MMBtu in the first quarter of 2006. Petro-Canada’s realized Canadian dollar prices for its North American Natural Gas business averaged $7.39/Mcf in the first quarter of 2007, down 15% from $8.69/Mcf in the first quarter of 2006, reflecting market price trends. |
DOWNSTREAM
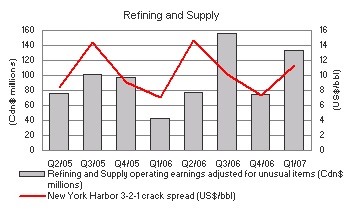
| New York Harbor 3-2-1 refinery crack spreads averaged $11.35 US/bbl in the first quarter of 2007, up nearly 60% from $7.08 US/bbl in the first quarter of 2006. The gain in the 3-2-1 crack spread reflected continuing strength in U.S. demand and a substantial increase in gasoline cracks caused by a large drop in U.S. gasoline inventories. Also contributing to the improved refinery margins was the sustained strength in distillate crack spreads as a result of growth in on-road diesel demand. |
The average market prices for the periods stated were:
| | Three months ended March 31, | |
| | 2007 | 2006 | |
Dated Brent at Sullom Voe (US$/bbl) | 57.75 | 61.75 | |
West Texas Intermediate (WTI) at Cushing (US$/bbl) | 58.16 | 63.48 | |
Dated Brent-Maya FOB price differential (US$/bbl) | 12.39 | 14.08 | |
Edmonton Light (Cdn$/bbl) | 67.79 | 69.50 | |
Edmonton Light/WCS FOB price differential (Cdn$/bbl) | 18.16 | 29.29 | |
Natural gas at Henry Hub (US$/MMBtu) | 6.96 | 9.08 | |
Natural gas at AECO (Cdn$/Mcf) | 7.77 | 9.67 | |
New York Harbor 3-2-1 crack spread (US$/bbl) | 11.35 | 7.08 | |
Exchange rate (US cents/Cdn$) | 85.4 | 86.6 | |
| Average realized prices from continuing operations | | | |
Crude oil and NGL ($/bbl) | 63.46 | 64.18 | |
Natural gas ($/Mcf) | 7.32 | 8.69 | |
The following table shows the estimated after-tax effects that changes in certain factors would have had on Petro-Canada’s 2006 net earnings from continuing operations had these changes occurred. Amounts are in Canadian dollars unless otherwise specified.
| | | | Annual net earnings impact | | Annual net earnings impact | |
Factor (1), (2) | Change (+) | | (millions of dollars) | | ($/share) (3) | |
Upstream | | | | | | |
Price received for crude oil and NGL(4) | $ | 1.00/bbl | | $ | 39 | | $ | 0.08 | |
| Price received for natural gas | $ | 0.25/Mcf | | | 32 | | | 0.06 | |
Exchange rate: Cdn$/US$ refers to impact on upstream earnings from continuing operations (5) | $ | 0.01 | | | (33 | ) | | (0.07 | ) |
| Crude oil and NGL production | | 1,000 b/d | | | 9 | | | 0.02 | |
| Natural gas production | | 10 MMcf/d | | | 9 | | | 0.02 | |
Downstream | | | | | | | | | |
| New York Harbor 3-2-1 crack spread | $ | 0.10 US/bbl | | | 5 | | | 0.01 | |
| Light/heavy crude price differential | $ | 1.00 US/bbl | | | 6 | | | 0.01 | |
Corporate | | | | | | | | | |
Exchange rate: Cdn$/US$ refers to impact of the revaluation of U.S. dollar-denominated, long-term debt (6) | $ | 0.01 | | $ | 14 | | $ | 0.03 | |
| (1) | The impact of a change in one factor may be compounded or offset by changes in other factors. This table does not consider the impact of any inter-relationship among the factors. |
| (2) | The impact of these factors is illustrative. |
| (3) | Per share amounts are based on the number of shares outstanding at December 31, 2006. |
| (4) | This sensitivity is based upon an equivalent change in the price of WTI and Dated Brent. |
| (5) | A strengthening Canadian dollar versus the U.S. dollar has a negative effect on upstream earnings from continuing operations. |
| (6) | A strengthening Canadian dollar versus the U.S. dollar has a positive effect on corporate earnings with respect to the Company’s U.S. denominated debt. The impact refers to gains or losses on $1.4 billion US of the Company’s U.S. denominated long-term debt and interest costs on U.S. denominated debt. Gains or losses on $1.1 billion US of the Company’s U.S. denominated long-term debt, associated with the self-sustaining International business segment and the U.S. Rockies operations included in the North American Natural Gas business segment are deferred and included as part of shareholders’ equity. |
BUSINESS STRATEGY
Petro-Canada's strategy is to create shareholder value by improving the profitability of the base business and by delivering long-term, profitable growth.
In 2007, upstream production from continuing operations is expected to grow in the range of 10% to 20% consistent with guidance, compared with 2006, as new projects come on-stream. For the longer term, Petro-Canada’s capital program anticipates that five major projects, undertaken over the next several years, will add significantly to earnings and operating cash flow. The Edmonton refinery is being converted to process 100% bitumen-based feedstock with expected completion in the third quarter of 2008 and an investment decision on a new coker at the Montreal refinery is expected to be made in the fourth quarter of 2007. In addition, the Company is advancing two major Oil Sands developments (the MacKay River in situ expansion and the integrated Fort Hills mine/upgrader) and a natural gas development in Syria.
Strategic Priorities | Quarterly Progress |
DELIVERING PROFITABLE GROWTH WITH A FOCUS ON OPERATED, LONG-LIFE ASSETS | · achieved first production from the Buzzard field in the United Kingdom (U.K.) sector of the North Sea · participated in one oil discovery and drilled two natural gas discoveries in the North Sea · advanced construction of the Edmonton refinery conversion project, which is now 23% complete and on track for planned startup in the third quarter of 2008 |
DRIVING FOR FIRST QUARTILE OPERATION OF OUR ASSETS | · achieved 92% reliability at Terra Nova · operated MacKay River at 99% reliability · maintained reliability above 98% at Western Canada natural gas processing facilities · delivered a combined reliability index of about 96 at the Edmonton and Montreal refineries and the lubricants plant · grew convenience store sales by 10% and same-store sales by 8%, compared with the first quarter of 2006 |
MAINTAINING FINANCIAL DISCIPLINE AND FLEXIBILITY | · ended the quarter with debt levels at 20.1% of total capital and a ratio of 0.7 times debt-to-cash flow · repurchased two million common shares at an average price of $43.63/share for a total cost of $87 million |
CONTINUING TO WORK AT BEING A RESPONSIBLE COMPANY | · accumulated more than one million hours of work without a lost-time incident on the Hanze platform in the Netherlands sector of the North Sea |
STRATEGIC MILESTONES
| Q2 2007 | Q3 2007 | Q4 2007 |
| ▼ | ▼ | ▼ |
| | | |
§ anticipate a regulatory decision on the Gros-Cacouna re-gasification project § continue to ramp up Buzzard production § complete the integration of the Montreal refinery and the ParaChem Chemicals L.P. petrochemicals plant | § make available Fort Hills design basis and preliminary cost estimate § expect to receive a regulatory decision on the MacKay River expansion project | § double U.S. Rockies production to 100 million cubic feet equivalent/day (MMcfe/d) by year end § complete MacKay River capacity upgrade and tie-in fourth well pad § make investment decision on potential 25,000 barrels/day (b/d) coker at Montreal refinery § achieve first production at Saxon in the U.K. sector of the North Sea |
ANALYSIS OF CONSOLIDATED EARNINGS AND CASH FLOW
Earnings Analysis
During the first quarter of 2006, Petro-Canada closed the sale of the Company’s mature producing assets in Syria. These assets and associated results are reported as discontinued operations and are excluded from continuing operations.
| | Three months ended March 31, | |
(millions of Canadian dollars, except per share amounts) | | 2007 | | | ($/share) | | | 2006 | | | ($/share) | |
Net earnings | $ | 590 | | $ | 1.19 | | $ | 206 | | $ | 0.40 | |
| Net earnings from discontinued operations | | - | | | | | | 152 | | | | |
Net earnings from continuing operations | $ | 590 | | $ | 1.19 | | $ | 54 | | $ | 0.11 | |
Foreign currency translation gain (loss) (1) | | 16 | | | | | | (1 | ) | | | |
Unrealized loss on Buzzard derivative contracts (2) | | (60 | ) | | | | | (149 | ) | | | |
| Gain on asset sales | | 41 | | | | | | 2 | | | | |
Operating earnings from continuing operations | $ | 593 | | | | | $ | 202 | | | | |
| Stock-based compensation recovery (expense) | | 8 | | | | | | (42 | ) | | | |
| Income tax adjustments | | - | | | | | | (242 | ) | | | |
| Insurance proceeds | | 5 | | | | | | - | | | | |
Operating earnings from continuing operations adjusted for unusual items | $ | 580 | | $ | 1.17 | | $ | 486 | | $ | 0.95 | |
| Operating earnings from discontinued operations adjusted for unusual items | | - | | | | | | 18 | | | | |
Operating earnings adjusted for unusual items | $ | 580 | | $ | 1.17 | | $ | 504 | | $ | 0.98 | |
| (1) | Foreign currency translation reflects gains or losses on U.S. dollar-denominated long-term debt not associated with the self-sustaining International business unit and the U.S. Rockies operations included in the North American Natural Gas business unit. |
| (2) | As part of its acquisition of an interest in the Buzzard field in the U.K. sector of the North Sea in June 2004, the Company entered into derivative contracts for half of its share of estimated production for 3 1/2 years, starting July 1, 2007. |
In the first quarter of 2007, operating earnings from continuing operations included an $8 million recovery related to the mark-to-market valuation of stock-based compensation and $5 million of insurance proceeds related to the Scott platform fire. In the first quarter of 2006, operating earnings from continuing operations included a $242 million charge for the U.K. supplemental corporate tax rate adjustment and a $42 million charge related to the mark-to-market valuation of stock-based compensation.
Earnings Variances
Q1/07 VERSUS Q1/06 FACTOR ANALYSIS
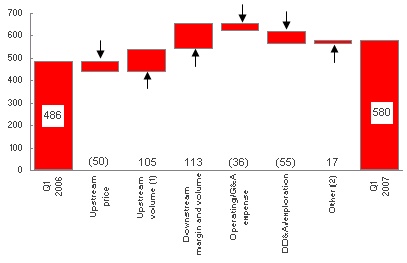
Operating Earnings from Continuing Operations Adjusted for Unusual Items
(millions of Canadian dollars, after-tax)
| Operating earnings from continuing operations adjusted for unusual items increased to $580 million ($1.17/share) in the first quarter of 2007, compared with $486 million ($0.95/share) in the first quarter of 2006. Higher upstream production and Downstream refining margins were partially offset by lower realized natural gas, crude oil and NGL prices, and increased depreciation, depletion, amortization (DD&A) and exploration expenses. |
| (1) | Upstream volumes include the portion of DD&A expense associated with changes in upstream production levels. |
| (2) | Other mainly includes interest expense, foreign exchange, changes in effective tax rates and upstream inventory movements. |
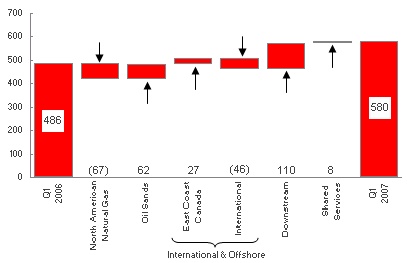
Operating Earnings from Continuing Operations Adjusted for Unusual Items by Segment
(millions of Canadian dollars, after-tax)
| Operating earnings from continuing operations adjusted for unusual items on a segmented basis increased 19% to $580 million in the first quarter of 2007, compared with $486 million in the first quarter of 2006. The increase in first quarter operating earnings from continuing operations, adjusted for unusual items, reflected higher Downstream, Oil Sands and East Coast Canada operating earnings adjusted for unusual items and lower Shared Services costs. The results were partially offset by lower North American Natural Gas and International operating earnings adjusted for unusual items. |
Net earnings in the first quarter of 2007 were $590 million ($1.19/share), compared with $206 million ($0.40/share) during the same period in 2006. Net earnings include net earnings from discontinued operations, gains or losses on foreign currency translation, unrealized gains or losses on Buzzard derivative contracts, and gains or losses on asset sales. Net earnings in the first quarter of 2007 were higher than in the first quarter of 2006 due to the U.K. supplemental corporate tax rate adjustment in the first quarter of 2006, foreign currency translation gains, lower unrealized losses on the Buzzard hedge and higher gains on asset sales compared with the same period in the prior year.
During the first quarter of 2007, cash flow from continuing operations was $1,166 million ($2.35/share), up from $857 million ($1.67/share) in the same quarter of 2006. The increase in cash flow reflected higher operating earnings from continuing operations.
| | Three months ended | |
(millions of Canadian dollars, except per share amounts) | | March 31 2007 | | | Dec. 31 2006 | | | Sept. 30 2006 | | | June 30 2006 | | | March 31 2006 | | | Dec. 31 2005 | | | Sept. 30 2005 | | | June 30 2005 | |
Total revenue from continuing operations | $ | 4,841 | | $ | 4,550 | | $ | 5,201 | | $ | 4,730 | | $ | 4,188 | | $ | 4,838 | | $ | 4,721 | | $ | 3,945 | |
| | | | | | | | | | | | | | | | | | | | | | | | | |
Net earnings from continuing operations | $ | 590 | | $ | 384 | | $ | 678 | | $ | 472 | | $ | 54 | | $ | 668 | | $ | 593 | | $ | 322 | |
Per share - basic | | 1.19 | | | 0.77 | | | 1.36 | | | 0.93 | | | 0.11 | | | 1.29 | | | 1.14 | | | 0.62 | |
| - diluted | | 1.18 | | | 0.76 | | | 1.34 | | | 0.92 | | | 0.10 | | | 1.28 | | | 1.13 | | | 0.61 | |
| | | | | | | | | | | | | | | | | | | | | | | | | |
Net earnings | $ | 590 | | $ | 384 | | $ | 678 | | $ | 472 | | $ | 206 | | $ | 714 | | $ | 614 | | $ | 345 | |
Per share - basic | | 1.19 | | | 0.77 | | | 1.36 | | | 0.93 | | | 0.40 | | | 1.38 | | | 1.19 | | | 0.66 | |
| - diluted | | 1.18 | | | 0.76 | | | 1.34 | | | 0.92 | | | 0.40 | | | 1.36 | | | 1.17 | | | 0.66 | |
UPSTREAM
Production from Continuing Operations
Petro-Canada converts volumes of natural gas to oil equivalent at a rate of six Mcf of natural gas to one bbl of oil. Production volumes disclosed refer to net working interest before royalties, unless otherwise specified.
| In the first quarter of 2007, production from continuing operations increased for the third consecutive quarter. In the first quarter of 2007, production averaged 405,000 boe/d net to Petro-Canada, up from 355,000 boe/d net in the same quarter of 2006. Higher volumes reflected the addition of North Sea projects (Buzzard, De Ruyter and L5b-C) and higher East Coast Canada and Oil Sands production. This was partially offset by natural declines in the North American Natural Gas business. |
North American Natural Gas
| | Three months ended March 31, | |
(millions of Canadian dollars) | | 2007 | | | 2006 | |
Net earnings | $ | 112 | | $ | 139 | |
| Gain on sale of assets | | 40 | | | - | |
Operating earnings and operating earnings adjusted for unusual items | $ | 72 | | $ | 139 | |
| Cash flow from operating activities before changes in non-cash working capital | $ | 197 | | $ | 264 | |
Lower natural gas prices and anticipated volume declines lowered North American Natural Gas operating earnings in the first quarter of 2007, compared with the same period in the prior year.
In the first quarter of 2007, North American Natural Gas contributed $72 million of operating earnings adjusted for unusual items, compared with $139 million in the first quarter of 2006. A decline in realized prices and volumes, combined with higher operating costs and increased DD&A and exploration expenses, contributed to lower operating earnings. Increased operating costs largely reflected industry-wide cost pressures.
Net earnings for North American Natural Gas were $112 million in the first quarter of 2007, down from $139 million in the first quarter of 2006. Net earnings in the first quarter of 2007 included a $40 million gain on the sale of the Brazeau and West Pembina assets.
North American Natural Gas Production and Pricing
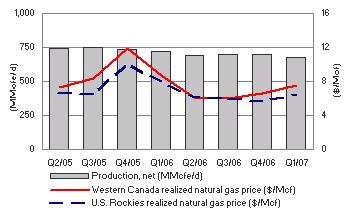
| In the first quarter of 2007, North American Natural Gas production declined by 6%, compared with the same period in 2006. Lower production reflected the sale of the Brazeau and West Pembina assets and anticipated natural declines in Western Canada, partially offset by higher natural gas production in the U.S. Rockies. Realized natural gas prices in Western Canada and U.S. Rockies decreased 14% and 19%, respectively, in the first quarter of 2007, compared with the same quarter of 2006, consistent with market price trends. |
| | First Quarter 2007 | | First Quarter 2006 | |
Production net (MMcfe/d) (1) | | | | |
Western Canada | | 608 | | | 674 | |
U.S. Rockies | | 71 | | | 49 | |
| Total North American Natural Gas production net | | 679 | | | 723 | |
Western Canada realized natural gas price (Cdn$/Mcf) (1) | $ | 7.49 | | $ | 8.74 | |
U.S. Rockies realized natural gas price (Cdn$/Mcf) (1) | $ | 6.45 | | $ | 7.95 | |
(1) For North American Natural Gas crude oil and NGL production and average realized prices, refer to the charts on pages 23 and 24, respectively.
Petro-Canada-operated gas plants and facilities in Western Canada delivered 98% reliability in the first quarter of 2007. The Company completed its North American winter drilling program, which involved the drilling of a total of 139 gross wells. As a result, the business saw strong initial flow rates from two development wells and an exploration discovery at Narraway, as well as successful multi-well programs in Gilby, Kobes, Medicine Hat and the Denver-Julesburg Basin.
U.S. Rockies production increased to 71 MMcfe/d in the first quarter of 2007, an increase of 45% compared with the same quarter of 2006. This was largely due to the ramp up of production from the Wild Turkey field. U.S. Rockies production is expected to increase to 100 MMcfe/d by the end of 2007.
Scheduled Turnarounds
No significant turnarounds are planned at the Company’s natural gas processing facilities for 2007.
Other Developments
Drilling operations are nearing completion on a partner-operated three-well exploration program in the National Petroleum Reserve-Alaska (NPR-A).
Oil Sands
| | Three months ended March 31, | |
(millions of Canadian dollars) | 2007 | | 2006 | |
Net earnings (loss), operating earnings (loss) and operating earnings (loss) adjusted for unusual items (1) | $ | 43 | | $ | (19 | ) |
| Cash flow from operating activities before changes in non-cash working capital | $ | 115 | | $ | 29 | |
| (1) | Oil Sands bitumen inventory movements increased net earnings by $3 million before-tax ($2 million after-tax) for the three months ended March 31, 2007. The same factor had no effect on net earnings before-tax (nil million after-tax) for the three months ended March 31, 2006. |
The first quarter saw increased production at both Syncrude and MacKay River. Bitumen prices remained strong throughout the first quarter of 2007, contributing to a record first quarter operating earnings.
Oil Sands recorded operating earnings adjusted for unusual items of $43 million in the first quarter of 2007, up from an operating loss of $19 million in the first quarter of 2006. Strong realized prices for MacKay River bitumen, along with higher volumes at Syncrude and MacKay River, resulted in increased operating earnings adjusted for unusual items.
In the first quarter of 2007, Oil Sands net earnings were $43 million, up from a net loss of $19 million in the first quarter of 2006.
Oil Sands Production and Pricing
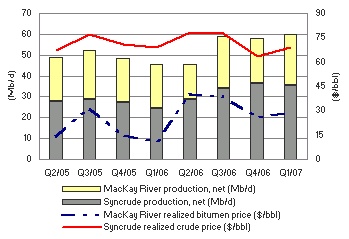
| Syncrude production was up 44% in the first quarter of 2007, compared with the first quarter of 2006, reflecting the Stage III expansion operations and increased production from Coker 8-1, which underwent a 45-day turnaround in the first quarter of 2006. These factors were in part offset by the acceleration of a portion of the planned turnaround of Coker 8-2 (originally scheduled for the fall of 2007). Syncrude realized prices were 1% lower in the first quarter of 2007, compared with the first quarter of 2006. MacKay River production was up 16% in the first quarter of 2007, compared with the same period of 2006, due to additional production from the third well pad. MacKay River realized bitumen prices more than doubled in the first quarter of 2007, compared with the first quarter of 2006. |
| | First Quarter 2007 | | First Quarter 2006 | |
Production net (b/d) | | | | |
Syncrude | 35,500 | | 24,600 | |
MacKay River | 24,200 | | 20,800 | |
| Total Oil Sands production net | 59,700 | | 45,400 | |
Syncrude realized crude price ($/bbl) | $ | 68.79 | | $ | 69.29 | |
MacKay River realized bitumen price ($/bbl) | $ | 29.08 | | $ | 11.24 | |
Fort Hills Project
The Fort Hills partnership independent reserves evaluator, Sproule Associates Limited, completed its audit and issued a report effective December 31, 2006, increasing the contingent resources estimate for the Fort Hills project to 4.7 billion gross barrels of bitumen (2.6 billion barrels net). This increased estimate was reflected in Petro-Canada’s 2006 year-end resource estimates.
In the first quarter of 2007, the Company completed its winter drilling to further delineate the leases and began site clearing. In July, the Company expects to complete and make available the design basis and preliminary cost estimates for the Fort Hills integrated mine and upgrader project.
MacKay River Expansion Project
Work continued on the design basis memorandum for the proposed MacKay River in situ expansion project, which is targeting first production in late 2010 and capacity of an additional 40,000 b/d to follow. A regulatory decision on the proposed project is anticipated in the third quarter of 2007, with project sanction expected in 2008.
Scheduled Turnarounds
In the second quarter of 2007, Syncrude is planning an approximately 30-day maintenance turnaround on Coker 8-3 to increase the throughput on this unit up to full design capacity. When Coker 8-3 is brought back into service, Syncrude will be able to run the other two cokers at reduced rates. As a consequence, the balance of the planned turnaround on Coker 8-2 which was planned for the fall of 2007 may be deferred into 2008.
International and Offshore
In the first quarter of 2007, the Company combined its East Coast Canada and International businesses under one management structure. The change is intended to leverage and grow the capabilities of similar operations. The combined East Coast Canada and International operations are now referred to as International and Offshore.
East Coast Canada
| | Three months ended March 31, | |
(millions of Canadian dollars) | 2007 | | 2006 | |
Net earnings, operating earnings and operating earnings adjusted for unusual items (1) | $ | 256 | | $ | 229 | |
| Cash flow from operating activities before changes in non-cash working capital | $ | 357 | | $ | 292 | |
| (1) | East Coast Canada crude oil inventory movements increased net earnings by $23 million before-tax ($16 million after-tax) for the three months ended March 31, 2007. The same factor increased net earnings by $12 million before-tax ($7 million after-tax) for the three months ended March 31, 2006. |
White Rose and Terra Nova operated reliably in the quarter, while Hibernia advanced and successfully completed its planned maintenance turnaround.
In the first quarter of 2007, East Coast Canada contributed $256 million of operating earnings adjusted for unusual items, up from $229 million in the first quarter of 2006. Higher volumes at White Rose and Terra Nova, and lower Terra Nova royalties, were partially offset by lower realized prices, lower production at Hibernia, and increased DD&A and exploration expenses.
Net earnings for East Coast Canada were $256 million in the first quarter of 2007, up from $229 million in the first quarter of 2006.
East Coast Canada Production and Pricing
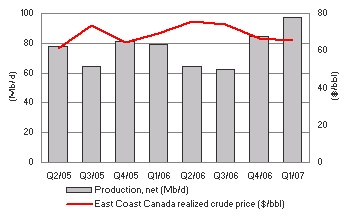
| In the first quarter of 2007, East Coast Canada production increased 23%, compared with the same period in 2006. Solid operations at Terra Nova and stronger volumes at White Rose were partially offset by lower volumes at Hibernia where the earlier than expected planned maintenance turnaround was completed. The planned turnaround at Hibernia was originally scheduled for the third quarter of 2007. During the first quarter of 2007, East Coast Canada realized crude prices decreased 5%, compared with the first quarter of 2006. |
| | First Quarter 2007 | | First Quarter 2006 | |
Production net (b/d) | | | | |
Terra Nova | | 41,100 | | | 26,100 | |
Hibernia | | 22,100 | | | 35,800 | |
White Rose | | 34,100 | | | 17,500 | |
| Total East Coast Canada production net | | 97,300 | | | 79,400 | |
Average realized crude price ($/bbl) | $ | 65.76 | | $ | 69.21 | |
The Terra Nova Floating Production Storage and Offloading (FPSO) vessel operated reliably in the first quarter of 2007. In December 2006, the Terra Nova FPSO encountered a mechanical issue in a swivel on the turret system that supports water injection to the reservoir. Without water injection, production from the reservoir would be reduced. An interim repair was completed in late December and production returned to normal rates in excess of 100,000 b/d gross (34,000 b/d net). Petro-Canada and the original equipment manufacturer continue to monitor the temporary repair, while developing plans for a full repair of the swivel. Full repair of the swivel requires dismantling and reassembly of the upper turret, and will be planned as part of the next scheduled turnaround in either 2008 or 2009.
During the first quarter of 2007, the SeaRose FPSO in the White Rose field continued to operate reliably, in excess of design capacity, at 124,000 b/d gross (34,100 b/d net). Drilling of a seventh production well in the White Rose field commenced and, when completed, will be tied into the SeaRose FPSO.
Scheduled Turnarounds
Early in 2007, Hibernia encountered a mechanical failure on one of the platform’s main power generators, thereby reducing production. To mitigate the impact of the main power generator repair on production, the operator advanced the planned third quarter turnaround, which was successfully completed on March 7, 2007.
In the second quarter of 2007, the Terra Nova FPSO will take a required regulatory turnaround for the testing of emergency systems. This turnaround will be extended to 10 days to complete other minor repairs. This turnaround is not expected to impact forecast Terra Nova production for the year. At White Rose, a 14-day planned turnaround to complete regulatory inspections, a flare-tip changeout and minor modifications is scheduled to start in early July. No additional turnaround activity is planned for Hibernia in 2007.
East Coast Canada Royalties
In the first quarter of 2007, East Coast Canada royalties averaged 10%, unchanged from the first quarter of 2006. Terra Nova production was subject to a basic royalty of 5% of gross revenues until mid-February, when the rate reverted back to the higher Tier 1 royalty. Tier 1 royalties are 30% of net field revenue. The lower royalty payable in January and February at Terra Nova reflected the netting of 2006 turnaround costs against gross revenues. In the first quarter of 2007, production from White Rose and Hibernia continued to be subject to basic royalties of 1% and 5% of gross field revenue, respectively.
Other Developments
At the end of March 2007, White Rose was granted regulatory approval to increase the annual average oil production from the White Rose field to 125,000 b/d from the current approved limit of 100,000 b/d. A further increase to 137,000 b/d is possible, pending regulator acceptance of performance testing results.
The Hibernia operator is working to respond to questions raised by the Government of Newfoundland and Labrador regarding its application for the development of the Hibernia Southern Extension.
International
For reporting purposes, Petro-Canada has consolidated its International activities into two regions: North Sea (U.K., the Netherlands and Norway) and Other International (Trinidad and Tobago, Libya, Syria and Venezuela) to better reflect existing production and exploration interests.
| | Three months ended March 31, | |
(millions of Canadian dollars) | 2007 | | 2006 | |
Net earnings (loss) from continuing operations (1) | $ | 9 | | $ | (281 | ) |
| Unrealized loss on Buzzard derivative contracts | | (60 | ) | | (149 | ) |
Operating earnings (loss) from continuing operations | $ | 69 | | $ | (132 | ) |
| Scott insurance proceeds | | 5 | | | - | |
| Income tax adjustments | | - | | | (242 | ) |
Operating earnings from continuing operations adjusted for unusual items | $ | 64 | | $ | 110 | |
| Cash flow from continuing operating activities before changes in non-cash working capital | $ | 222 | | $ | 211 | |
| (1) | International crude oil inventory movements decreased net earnings from continuing operations by $45 million before-tax ($28 million after-tax) for the three months ended March 31, 2007. The same factor decreased the net loss from continuing operations by $36 million before-tax (nil million after-tax) for the three months ended March 31, 2006. |
North Sea production increased as Buzzard came on-stream in the first quarter of 2007. At the same time, Petro-Canada achieved exploration success by participating in the drilling of one oil discovery and drilling two natural gas discoveries in the North Sea. Financially, the positive impact of higher production was more than offset by a one-time item and a large timing difference between sales and production.
International contributed $64 million of operating earnings from continuing operations, adjusted for unusual items, in the first quarter of 2007, down from $110 million recorded in the first quarter of 2006. Operating earnings from continuing operations adjusted for unusual items were negatively affected by a large timing difference between sales and production and one-time costs for a successful well workover in the North Sea. The combined impact of these factors reduced operating earnings from continuing operations adjusted for unusual items by $51 million in the first quarter of 2007, compared with the first quarter of 2006. The positive impact of increased production in the quarter was further offset by lower realized prices.
In the first quarter of 2007, International had net earnings from continuing operations of $9 million, compared with a net loss of $281 million in the first quarter of 2006. Net earnings from continuing operations in the first quarter of 2007 included a $60 million unrealized loss on the Buzzard derivative contracts and $5 million in insurance proceeds from the Scott platform fire. Net earnings from continuing operations in the first quarter of 2006 included a $242 million charge for the U.K. supplemental corporate tax rate adjustment and a $149 million unrealized loss on the derivative contracts associated with Buzzard.
International Production and Pricing
| International production from continuing operations increased 23% in the first quarter of 2007, compared with the first quarter of 2006. In the first quarter of 2007, production from the U.K. and the Netherlands sectors of the North Sea increased by 59%, reflecting the addition of Buzzard, De Ruyter and L5b-C, partially offset by anticipated natural declines. Other International production decreased by 4% in the first quarter of 2007, compared with the first quarter of 2006, largely due to an Organization of the Petroleum Exporting Countries (OPEC) quota in Libya, equipment maintenance and natural production declines. |
| | First Quarter 2007 | | First Quarter 2006 | |
Production from continuing operations net (boe/d) | | | | |
U.K. sector of the North Sea | | 50,200 | | | 32,800 | |
The Netherlands sector of the North Sea | | 25,600 | | | 15,000 | |
North Sea | | 75,800 | | | 47,800 | |
Other International | | 59,000 | | | 61,700 | |
| Total International production net | | 134,800 | | | 109,500 | |
Average realized crude oil and NGL prices from continuing operations ($/bbl) | $ | 67.89 | | $ | 71.28 | |
Average realized natural gas price from continuing operations ($/Mcf) | $ | 7.00 | | $ | 8.69 | |
International operations' realized commodity prices from continuing operations remained strong as crude oil and NGL realized prices decreased 5% in the first quarter of 2007, compared with the same period in 2006. Realized prices from continuing operations for natural gas decreased 19% in the first quarter of 2007, compared with the same period in the prior year.
North Sea
In the U.K. sector of the North Sea, Buzzard achieved first oil on January 7, 2007, on schedule and on budget. Production from the Buzzard field averaged approximately 83,900 b/d gross (25,100 b/d net) in the first quarter of 2007. The field is expected to ramp up to peak production by mid-2007. On the exploration front, the partner-operated Golden Eagle prospect on Licence P928 was drilled to a depth of approximately 2,286 metres and encountered 37 metres of net pay. The well tested at more than 4,000 b/d of light crude oil. The well was sidetracked to appraise the accumulation and the Company is currently working with its partners to prepare a development plan. Petro-Canada holds a 25% working interest in the Golden Eagle discovery.
In the Netherlands sector of the North Sea, the Petro-Canada-operated De Ruyter facility continued to operate at 27,000 b/d gross (about 14,600 b/d net) in the first quarter of 2007, which was the rated production capacity of platform facilities. The Company drilled two successful exploration wells (van Nes and van Brakel) near De Ruyter, in which Petro-Canada is operator with a 50% and 60% working interest, respectively. Van Nes was drilled to a depth of 2,048 metres and encountered 38 metres of net gas pay, while the van Brakel well was drilled to a depth of 1,598 metres and encountered 24 metres of net gas pay. Both van Nes and van Brakel have been suspended as gas discoveries and the Company is presently assessing its development options.
In Norway, the Company was awarded seven additional production licences in the 2006 Awards in Predefined Areas (APA) round. Petro-Canada is operator of two of the seven licences.
Other International
Production in Libya averaged 46,500 boe/d in the first quarter of 2007, down from 50,700 boe/d in the same quarter of 2006. The application of an OPEC quota, equipment maintenance and production decline constrained production in the first quarter of 2007. In January 2007, the National Oil Corporation of Libya (NOC) announced an OPEC quota on the Company’s joint venture fields, which represents a 6% reduction in production. In the first quarter of 2007, the NOC renamed all of the joint ventures operating in Libya. Petro-Canada’s joint venture name has been changed from Veba Oil Operations (VOO) to Harouge Oil Operation (HOO).
In Syria, the Company is preparing to commence a two-well program on Block II. The first well is expected to spud in the second quarter of 2007. The Zotti exploration well in Algeria was abandoned as a dry hole in the first quarter of 2007.
Trinidad and Tobago offshore gas production averaged 75 MMcf/d in the first quarter of 2007, compared with 66 MMcf/d in the first quarter of 2006. Increased production reflected the Company’s ability to take advantage of short-term opportunities to supply additional volumes into the Atlantic liquefied natural gas (LNG) trains. The Company continued to define well locations for its exploration drilling plans on Blocks 1a, 1b and 22 by conducting environmental and well site surveys in the first quarter of 2007.
Ebla Gas Project
In the first quarter of 2007, a project team was formed in Damascus to lead the development and production of 80 MMcf/d of natural gas in Syria, with first gas anticipated in 2010. The evaluation of drilling rig bids and facility studies is underway. A seismic program is planned to start and the FEED contract is expected to be awarded in the second quarter of 2007.
Discontinued Operations
On January 31, 2006, Petro-Canada completed the sale of the Company’s mature producing assets in Syria to a joint venture of companies owned by India’s Oil and Natural Gas Corporation Limited and the China National Petroleum Corporation for net proceeds of $640 million. The sale resulted in a gain on disposal of $134 million recorded in the first quarter of 2006. This sale aligned with Petro-Canada’s strategy to increase the proportion of long-life and operated assets within its asset portfolio. Petro-Canada’s activities in Syria remain an important part of the Other International producing region, with an active exploration program in Block II and the addition of the Ebla natural gas project in Syria during 2006.
Discontinued Operations | Three months ended March 31, | |
(millions of Canadian dollars, unless otherwise noted) | 2007 | | 2006 | |
Net earnings from discontinued operations | $ | - | | $ | 152 | |
| Gain on sale of assets | | - | | | 134 | |
Operating earnings from discontinued operations | $ | - | | $ | 18 | |
| Cash flow from operating activities before changes in non-cash working capital | $ | - | | $ | 17 | |
Production net (boe/d) | | - | | | 22,000 | |
Average realized crude oil and NGL price ($/bbl) | $ | - | | $ | 71.84 | |
Average realized natural gas price ($/Mcf) | $ | - | | $ | 7.94 | |
DOWNSTREAM
| | Three months ended March 31, | |
(millions of Canadian dollars) | 2007 | | 2006 | |
Net earnings | $ | 184 | | $ | 75 | |
| Gain on sale of assets | | 1 | | | 2 | |
Operating earnings and operating earnings adjusted for unusual items | $ | 183 | | $ | 73 | |
| Cash flow from operating activities before changes in non-cash working capital | $ | 282 | | $ | 135 | |
Solid execution allowed the Downstream business to capture the benefits of strong continent-wide refining margins and higher petroleum product demand to deliver its highest operating earnings in a single quarter.
In the first quarter of 2007, the Downstream business contributed $183 million of operating earnings adjusted for unusual items, up considerably from $73 million in the same quarter of 2006. The increase in operating earnings reflected higher realized margins in almost all areas of the business. This was partially offset by higher DD&A expense.
The Downstream business recorded net earnings of $184 million in the first quarter of 2007, compared with $75 million in the same quarter of 2006.
Downstream Operating Earnings Adjusted For Unusual Items
| | First Quarter 2007 | | First Quarter 2006 | |
Refining and Supply operating earnings adjusted for unusual items (millions of Canadian dollars) | $ | 134 | | $ | 43 | |
New York Harbor 3-2-1 crack spread (US$/bbl) | $ | 11.35 | | $ | 7.08 | |
Marketing operating earnings (loss) adjusted for unusual items (millions of Canadian dollars) | $ | 49 | | $ | 30 | |
The average New York Harbor 3-2-1 refinery crack spread was $11.35 US/bbl in the first quarter of 2007, the highest level seen in a first quarter, up nearly 60% from $7.08 US/bbl in the first quarter of 2006. The gain in the 3-2-1 crack spread reflected continuing strength in U.S. demand and a substantial increase in gasoline cracks caused by a large decline in U.S. gasoline inventories. The average international light/heavy crude price differential was $12.39 US/bbl in the first quarter of 2007, compared with $14.08 US/bbl in the first quarter of 2006.
In the first quarter of 2007, total sales of refined petroleum products increased, compared with the same period last year, reflecting increased industry demand and colder winter weather in Eastern Canada.
Refining and Supply contributed first quarter 2007 operating earnings adjusted for unusual items of $134 million, up significantly compared with $43 million in the same quarter of 2006. Results reflected higher gasoline, distillate, lubricant and petrochemical margins. These factors were partially offset by slightly lower refinery yields. In 2006, Refining and Supply operating earnings adjusted for unusual items were reduced by the impact of the lubricants fire.
Marketing contributed first quarter 2007 operating earnings adjusted for unusual items of $49 million, compared with $30 million in the same quarter of 2006. In the first quarter of 2007, Marketing results reflect increased fuel, lubricants and non-petroleum sales and margin. Marketing margins continue to be impacted by strong competition in several major markets in Canada.
Downstream Turnaround Activity
In the second quarter of 2007, the Montreal and Edmonton refineries have planned routine maintenance on units within the refineries, none of which are expected to be significant. The lubricants plant has a planned 22-day turnaround scheduled for the second quarter of 2007.
Edmonton Refinery Conversion Project
At the Edmonton refinery, the Company is investing to convert the facility to run bitumen-based feedstock. The refinery conversion program will enable Petro-Canada to directly upgrade 26,000 b/d of bitumen and process 48,000 b/d of sour synthetic crude oil, replacing the conventional light crude feedstock refined today.
At the end of the first quarter of 2007, Petro-Canada had completed 23% of the construction and all the major vessels and modules were on site. Of the estimated $2 billion investment, approximately 55% had been committed to the end of the first quarter of 2007. The project remains on track for startup in the third quarter of 2008.
CORPORATE
Shared Services | Three months ended March 31, | |
(millions of Canadian dollars) | 2007 | | 2006 | |
Net loss | $ | (14 | ) | $ | (89 | ) |
| Foreign currency translation gain (loss) | | 16 | | | (1 | ) |
Operating loss | $ | (30 | ) | $ | (88 | ) |
| Stock-based compensation recovery (expense) | | 8 | | | (42 | ) |
Operating loss adjusted for unusual items | $ | (38 | ) | $ | (46 | ) |
| Cash flow from operating activities before changes in non-cash working capital | $ | (7 | ) | $ | (74 | ) |
Shared Services recorded an operating loss adjusted for unusual items of $38 million in the first quarter of 2007, compared with a loss of $46 million for the same period in 2006. The first quarter 2007 operating loss included an $8 million recovery related to the mark-to-market valuation of stock-based compensation, compared with a $42 million charge in the first quarter of 2006.
Interest expense was $42 million before-tax during the first quarter of 2007, down from $45 million in the first quarter of the prior year.
In the first quarter of 2007, Shared Services recorded a net loss of $14 million, compared with a loss of $89 million in the first quarter of 2006. The net loss from Shared Services included gains and losses on foreign currency translation related to long-term debt.
Cash flow was affected by two items that typically cause differences between earnings and cash flow. Tax deferrals resulting from the Company's upstream partnership increased cash flow by about $10 million in the quarter, compared with a decrease of $15 million in the same period last year. The inventory valuation method prescribed for income tax purposes in the Downstream business did not impact first quarter 2007 cash flow, compared with a decrease of $15 million in the first quarter of 2006.
LIQUIDITY AND CAPITAL RESOURCES
Summary of Cash Flows
| | Three months ended March 31, | |
(millions of Canadian dollars) | 2007 | | 2006 | |
Cash flow from continuing operating activities | $ | 1,166 | | $ | 886 | |
| Decrease in non-cash working capital related to continuing operating activities | | - | | | (29 | ) |
Cash flow from continuing operations | $ | 1,166 | | $ | 857 | |
| Cash flow from discontinued operating activities | | - | | | 15 | |
| Increase in non-cash working capital related to discontinued operating activities | | - | | | 2 | |
Cash flow | $ | 1,166 | | $ | 874 | |
| Net cash inflows (outflows) from: | | | | | | |
Investing activities before changes in non-cash working capital | | (651 | ) | | (123 | ) |
Financing activities before changes in non-cash working capital | | (148 | ) | | (506 | ) |
| (Increase) decrease in non-cash working capital | | (59 | ) | | 39 | |
| Increase in cash and cash equivalents | $ | 308 | | $ | 284 | |
Cash and cash equivalents | $ | 807 | | $ | 1,073 | |
Petro-Canada’s financing strategy is designed to maintain financial strength and flexibility to support profitable growth in all business environments. Two key measures that Petro-Canada uses to measure the Company’s overall financial strength are debt-to-cash flow and debt-to-debt plus equity. Petro-Canada’s debt-to-cash flow from continuing operations ratio, a key short-term leverage measure, was 0.7 times at March 31, 2007. This is within the Company’s target range of no more than 2.0 times. Debt-to-debt plus equity, the long-term measure for capital structure, was 20.1% at March 31, 2007, below the Company's target range of 25% to 35%.
Financial Ratios | March 31, 2007 | December 31, 2006 | March 31, 2006 |
Debt-to-cash flow (1) (times) | 0.7 | 0.8 | 0.8 |
Debt-to-debt plus equity (%) | 20.1 | 21.7 | 23.9 |
| (1) | From continuing operations. |
Operating Activities
Excluding cash and cash equivalents and the current portion of long-term debt, the operating working capital deficiency was $1,016 million at the end of the first quarter of 2007, relatively unchanged compared with an operating working capital deficiency of $1,014 million at December 31, 2006.
Investing Activities
| | Three months ended March 31, | |
(millions of Canadian dollars) | 2007 | | 2006 | |
Upstream | | | | |
North American Natural Gas | $ | 205 | | $ | 213 | |
Oil Sands | | 90 | | | 119 | |
International and Offshore | | | | | | |
East Coast Canada | | 38 | | | 53 | |
International (1) | | 157 | | | 121 | |
| | | 490 | | | 506 | |
Downstream | | | | | | |
Refining and Supply | | 205 | | | 237 | |
Sales and Marketing | | 14 | | | 8 | |
Lubricants | | 2 | | | 6 | |
| | | 221 | | | 251 | |
| Shared Services | | 5 | | | 1 | |
Total property, plant and equipment and exploration | | 716 | | | 758 | |
| Deferred charges and other assets | | 17 | | | 9 | |
Total continuing operations | | 733 | | | 767 | |
| Discontinued operations | | - | | | 1 | |
Total | $ | 733 | | $ | 768 | |
| (1) | International excludes capital expenditures related to the mature Syrian producing assets, which were sold by the Company in January 2006. |
Financing Activities
At the end of the first quarter of 2007, the Company’s syndicated committed credit facilities totalled $2,200 million. The Company also had bilateral demand credit facilities of $1,001 million. A total of $1,543 million of the credit facilities was used for letters of credit and overdraft coverage as at March 31, 2007. The syndicated facilities also provide liquidity support to Petro-Canada’s commercial paper program. No commercial paper was outstanding at the end of the first quarter of 2007.
As at March 31, 2007, the Company’s unsecured long-term debt securities were rated Baa2 by Moody’s Investors Service, BBB by Standard & Poor’s and A (low) by Dominion Bond Rating Service. The Company’s long-term debt ratings remain unchanged from year-end 2006.
Returning Cash to Shareholders
Petro-Canada’s priority uses of cash are to fund the capital program and profitable growth opportunities, and to return cash to shareholders through dividends and a share buyback program. Petro-Canada’s current NCIB program, which extends to June 21, 2007, entitles the Company to purchase up to 5% of its outstanding common shares, subject to certain conditions. The level of activity in the NCIB program in 2006 reflected the use of proceeds from the sale of the mature Syrian assets to buy back shares.
| | Shares Repurchased | | Average Price | | Total Cost ($ millions) | |
Period | 2007 | | 2006 | | 2007 | | 2006 | | 2007 | | 2006 | |
| First quarter | | 2,000,000 | | | 8,786,800 | | $ | 43.63 | | $ | 54.14 | | $ | 87 | | $ | 476 | |
Contingent Liabilities and Contractual Obligations
Contractual obligations are summarized in the Company’s 2006 annual MD&A and contingent liabilities are disclosed in Note 25 of the 2006 annual Consolidated Financial Statements. Total contractual obligations at December 31, 2006, including supply purchase agreements, as disclosed in footnote two to the table on page 17 of the 2006 annual MD&A, contracted at market prices where the product could reasonably be re-sold into the market, were $29.6 billion. During the first quarter of 2007, total contractual obligations decreased by approximately $2 billion due to lower supply purchase agreement volumes in the Downstream.
Off Balance Sheet
The Company has certain retail licensee agreements that qualify as variable interest entities as described in Note 26 to the 2006 annual Consolidated Financial Statements. These entities are not consolidated as Petro-Canada is not the primary beneficiary and the Company’s maximum exposure to losses from these arrangements is not expected to be material.
RISK
Derivative Contracts
As part of its acquisition of an interest in the Buzzard field in the U.K. sector of the North Sea, Petro-Canada entered into a series of derivative contracts relating to the future sale of crude oil based on Brent crude oil prices. As a result of the increase in Brent crude oil prices in the first quarter of 2007, compared with the fourth quarter of 2006, the mark-to-market unrealized loss associated with these derivative contracts was $60 million after-tax in the first quarter of 2007. This compares with an unrealized loss of $149 million after-tax in the first quarter of 2006.
As at March 31, 2007, there was no material change in the Company’s risks or risk management activities since December 31, 2006. Petro-Canada’s risk management activities are conducted in accordance with the policies and guidelines established by the Board of Directors. Readers should refer to Petro-Canada’s 2006 AIF and the risk management section of the 2006 annual MD&A.
SHAREHOLDER INFORMATION
As at March 31, 2007, Petro-Canada’s outstanding common shares totalled 495.8 million and averaged 497.0 million during the first quarter of 2007. This figure compares with outstanding common shares of 507.5 million as at March 31, 2006 and average shares outstanding of 512.9 million for the quarter ended March 31, 2006.
Petro-Canada will hold a conference call to discuss these results with investors on Tuesday, April 24, 2007 at 9:00 a.m. eastern daylight time (EDT). To participate, please call 1-866-898-9626 (toll-free in North America), 800-8989-6323 (toll-free internationally) or 416-340-2216 at 8:55 a.m. Media are invited to listen to the call by dialing 1-866-540-8136 (toll-free in North America) or 416-340-8010 and are invited to ask questions at the end of the call. Those who are unable to listen to the call live may listen to a recording of the call approximately one hour after its completion by dialing 1-800-408-3053 (toll-free in North America) or 416-695-5800 (pass code number 3215986#). A live audio broadcast of the conference call will be available on Petro-Canada's website at http://www.petro-canada.ca/en/investors/845.aspx on April 24, 2007 at 9:00 a.m. EDT. Approximately one hour after the call, a recording will be available on Petro-Canada’s website.
SELECT OPERATING DATA
March 31, 2007
| | Three months ended March 31, | |
| | 2007 | | 2006 | |
Before Royalties | | | | |
Crude oil and NGL production net (Mb/d) | | | | |
North American Natural Gas (1) | | 12.4 | | | 14.7 | |
| Oil Sands | | 59.7 | | | 45.4 | |
International and Offshore | | | | | | |
| East Coast Canada | | 97.3 | | | 79.4 | |
| International | | | | | | |
North Sea | | 64.5 | | | 34.8 | |
Other International (2) | | 46.5 | | | 50.7 | |
| | | 280.4 | | | 225.0 | |
Natural gas production net, excluding injectants (MMcf/d) | | | | | | |
North American Natural Gas (1) | | 605 | | | 635 | |
| International | | | | | | |
North Sea | | 68 | | | 78 | |
Other International (2) | | 75 | | | 66 | |
| | | 748 | | | 779 | |
Total production from continuing operations (Mboe/d) net before royalties (3) | | 405 | | | 355 | |
| Discontinued operations | | | | | | |
Crude oil and NGL production net (Mb/d) | | - | | | 20.6 | |
Natural gas production net, excluding injectants (MMcf/d) | | - | | | 8 | |
Total production from discontinued operations (Mboe/d) net before royalties (3) | | - | | | 22 | |
Total production (Mboe/d) net before royalties (3) | | 405 | | | 377 | |
After Royalties | | | | | | |
Crude oil and NGL production net (Mb/d) | | | | | | |
North American Natural Gas (1) | | 9.5 | | | 11.3 | |
| Oil Sands | | 55.2 | | | 42.8 | |
International and Offshore | | | | | | |
| East Coast Canada | | 87.2 | | | 71.1 | |
| International | | | | | | |
North Sea | | 64.5 | | | 34.8 | |
Other International (2) | | 41.3 | | | 45.7 | |
| | | 257.7 | | | 205.7 | |
Natural gas production net, excluding injectants (MMcf/d) | | | | | | |
North American Natural Gas (1) | | 477 | | | 487 | |
| International | | | | | | |
North Sea | | 68 | | | 78 | |
Other International (2) | | 50 | | | 32 | |
| | | 595 | | | 597 | |
Total production from continuing operations (Mboe/d) net after royalties (3) | | 357 | | | 305 | |
| Discontinued operations | | | | | | |
Crude oil and NGL production net (Mb/d) | | - | | | 5.4 | |
Natural gas production net, excluding injectants (MMcf/d) | | - | | | 1 | |
Total production from discontinued operations (Mboe/d) net after royalties (3) | | - | | | 6 | |
Total production (Mboe/d) net after royalties (3) | | 357 | | | 311 | |
Petroleum product sales (thousands of m3/d) | | | | | | |
| Gasoline | | 22.8 | | | 22.4 | |
| Distillates | | 22.7 | | | 21.1 | |
| Other, including petrochemicals | | 7.5 | | | 6.4 | |
| | | 53.0 | | | 49.9 | |
Crude oil processed by Petro-Canada (thousands of m3/d) | | 38.9 | | | 39.5 | |
Average refinery utilization (%) | | 96 | | | 98 | |
Downstream operating earnings from continuing operations after-tax (cents/litre) | | 3.8 | | | 1.6 | |
| | | | | | | |
| (1) | North American Natural Gas includes Western Canada and U.S. Rockies. |
| (2) | Other International excludes production relating to the Syrian producing assets, which were sold in January 2006 and reported as discontinued operations. |
| (3) | Natural gas converted at six Mcf of natural gas to one bbl of oil. |
AVERAGE PRICE REALIZED
March 31, 2007
| | Three months ended March 31, | |
| | 2007 | | 2006 | |
Crude oil and NGL ($/bbl) | | | | |
North American Natural Gas (1) | | 58.04 | | | 62.15 | |
| Oil Sands | | 52.69 | | | 42.69 | |
International and Offshore | | | | | | |
| East Coast Canada | | 65.76 | | | 69.21 | |
| International | | | | | | |
North Sea | | 68.75 | | | 71.25 | |
Other International | | 66.68 | | | 71.29 | |
| Total crude oil and NGL from continuing operations | | 63.46 | | | 64.18 | |
| Discontinued operations | | - | | | 71.84 | |
| Total crude oil and NGL | | 63.46 | | | 64.82 | |
Natural gas ($/Mcf) | | | | | | |
North American Natural Gas (1) | | 7.39 | | | 8.69 | |
| International | | | | | | |
North Sea | | 8.56 | | | 10.24 | |
Other International | | 4.89 | | | 6.32 | |
| Total natural gas from continuing operations | | 7.32 | | | 8.69 | |
| Discontinued operations | | - | | | 7.94 | |
| Total natural gas | | 7.32 | | | 8.68 | |
| (1) | North American Natural Gas includes Western Canada and the U.S. Rockies. |
EFFECTIVE ROYALTY RATES
March 31, 2007
| | Three months ended March 31, |
(% of sales revenues) | 2007 | 2006 |
| North American Natural Gas | 21% | 23% |
| Oil Sands | 8% | 6% |
International and Offshore | | |
| East Coast Canada | 10% | 10% |
| International | | |
| North Sea | - | - |
| Other International | 16% | 17% |
| Total continuing operations | 12% | 14% |
| Discontinued operations | -% | 74% |
| Total | 12% | 17% |
SHARE INFORMATION
March 31, 2007
| | Three months ended March 31, |
| | 2007 | 2006 |
Weighted-average common shares outstanding (millions) | 497.0 | 512.9 |
Weighted-average diluted common shares outstanding (millions) | 502.0 | 519.8 |
Net earnings - basic ($/share) | 1.19 | 0.40 |
- diluted ($/share) | 1.18 | 0.40 |
| Operating earnings from continuing operations adjusted for unusual items | | |
- basic ($/share) | 1.17 | |
- diluted ($/share) | 1.16 | 0.93 |
Cash flow ($/share) | 2.35 | 1.70 |
Dividends ($/share) | 0.13 | 0.10 |
| Toronto Stock Exchange: | | |
Share price (1) - High | 47.56 | 58.59 |
- - Low | 41.02 | 48.00 |
- - Close at March 30 | 45.15 | 55.38 |
Shares traded (millions) | 163.3 | 140.3 |
| New York Stock Exchange: | | |
Share price (2) - High | 40.03 | 51.08 |
| - Low | 34.91 | 41.20 |
| - Close at March 30 | 39.21 | 47.59 |
Shares traded (millions) | 43.9 | 33.8 |
| (1) | Share price is in Canadian dollars and represents the closing price. |
| (2) | Share price is in U.S. dollars and represents the closing price. |
SELECT FINANCIAL DATA
March 31, 2007
(unaudited, millions of Canadian dollars)
| | Three months ended March 31, | |
| | 2007 | | 2006 | |
| Earnings | | | | |
| Upstream | | | | |
| North American Natural Gas | $ | 72 | | $ | 139 | |
| Oil Sands | | 43 | | | (19 | ) |
International and Offshore | | | | | | |
| East Coast Canada | | 256 | | | 229 | |
| International | | 69 | | | (132 | ) |
| Downstream | | 183 | | | 73 | |
| Shared Services | | (30 | ) | | (88 | ) |
| Operating earnings from continuing operations | $ | 593 | | $ | 202 | |
| Foreign currency translation gain (loss) | | 16 | | | (1 | ) |
| Unrealized loss on Buzzard derivative contracts | | (60 | ) | | (149 | ) |
| Gain on asset sales | | 41 | | | 2 | |
| Discontinued operations | | - | | | 152 | |
| Net earnings | $ | 590 | | $ | 206 | |
| | | | | | | |
| Cash flow | | | | | | |
| Cash flow from continuing operating activities | $ | 1,166 | | $ | 886 | |
| Decrease in non-cash working capital related to continuing operating activities | | - | | | (29 | ) |
| Cash flow from continuing operations | $ | 1,166 | | $ | 857 | |
| | | | | | | |
Average capital employed (1) | | | | | | |
| Upstream | $ | 8,040 | | $ | 7,955 | |
| Downstream | | 4,437 | | | 3,685 | |
| Shared Services | | 429 | | | 234 | |
| Total Company | $ | 12,906 | | $ | 11,874 | |
| | | | | | | |
Return on capital employed (1) (%) | | | | | | |
| Upstream | | 21.5 | | | 21.6 | |
| Downstream | | 13.1 | | | 10.2 | |
| Total Company | | 17.3 | | | 16.8 | |
| | | | | | | |
Operating return on capital employed (1) (%) | | | | | | |
| Upstream | | 22.7 | | | 24.7 | |
| Downstream | | 12.9 | | | 9.7 | |
| Total Company | | 17.8 | | | 18.0 | |
| | | | | | | |
Return on equity (1) (%) | | 21.1 | | | 21.0 | |
| | | | | | | |
| Debt | | 2,751 | | | 2,909 | |
Cash and cash equivalents (1) | | 807 | | | 1,073 | |
Debt-to-cash flow (2) (times) | | 0.7 | | | 0.8 | |
Debt-to-debt plus equity (%) | | 20.1 | | | 23.9 | |
| | | | | | | |
(1) Includes discontinued operations.
(2) From continuing operations.
CONSOLIDATED STATEMENT OF EARNINGS (unaudited)
For the periods ended March 31
(millions of Canadian dollars, except per share amounts)
| | Three months ended March31, | |
| | 2007 | | 2006 | |
| Revenue | | | | |
| Operating | $ | 4,867 | | $ | 4,415 | |
Investment and other income (expense) (Note 5) | | (26 | ) | | (227 | ) |
| | | 4,841 | | | 4,188 | |
| Expenses | | | | | | |
| Crude oil and product purchases | | 2,308 | | | 2,100 | |
| Operating, marketing and general | | 827 | | | 821 | |
| Exploration | | 142 | | | 97 | |
| Depreciation, depletion and amortization | | 441 | | | 335 | |
| Unrealized (gain) loss on translation of foreign currency denominated long-term debt | | (17 | ) | | 2 | |
| Interest | | 42 | | | 45 | |
| | | 3,743 | | | 3,400 | |
| | | | | | | |
| Earnings from continuing operations before income taxes | | 1,098 | | | 788 | |
| | | | | | | |
| Provision for income taxes | | | | | | |
| Current | | 491 | | | 532 | |
Future (Note 6) | | 17 | | | 202 | |
| | | 508 | | | 734 | |
| | | | | | | |
| Net earnings from continuing operations | | 590 | | | 54 | |
| | | | | | | |
Net earnings from discontinued operations (Note 4) | | - | | | 152 | |
| | | | | | | |
| Net earnings | $ | 590 | | $ | 206 | |
| | | | | | | |
Earnings per share from continuing operations (Note 7) | | | | | | |
| Basic | $ | 1.19 | | $ | 0.11 | |
| Diluted | $ | 1.18 | | $ | 0.10 | |
| | | | | | | |
Earnings per share (Note 7) | | | | | | |
| Basic | $ | 1.19 | | $ | 0.40 | |
| Diluted | $ | 1.18 | | $ | 0.40 | |
CONSOLIDATED STATEMENT OF COMPREHENSIVE INCOME (unaudited) (Note 3)
For the periods ended March 31
(millions of Canadian dollars)
| | Three months ended March 31, | |
| | 2007 | | 2006 | |
| | | | | |
| Net earnings | $ | 590 | | $ | 206 | |
| Other comprehensive income, net of tax | | | | | | |
| Change in foreign currency translation adjustment | | 7 | | | 55 | |
| Comprehensive income | $ | 597 | | $ | 261 | |
See accompanying Notes to Consolidated Financial Statements
CONSOLIDATED STATEMENT OF CASH FLOWS (unaudited)
For the periods ended March 31
(millions of Canadian dollars)
| | Three months ended March 31, | |
| | 2007 | | 2006 | |
| | | | | |
| Operating activities | | | | |
| Net earnings | $ | 590 | | $ | 206 | |
| Less: Net earnings from discontinued operations | | - | | | 152 | |
| Net earnings from continuing operations | | 590 | | | 54 | |
| Items not affecting cash flow from continuing operating activities: | | | | | | |
| Depreciation, depletion and amortization | | 441 | | | 335 | |
| Future income taxes | | 17 | | | 202 | |
| Accretion of asset retirement obligations | | 17 | | | 13 | |
| Unrealized (gain) loss on translation of foreign currency denominated long-term debt | | (17 | ) | | 2 | |
| Gain on disposal of assets | | (62 | ) | | (2 | ) |
Unrealized loss associated with the Buzzard derivative contracts (Note 12) | | 88 | | | 219 | |
| Other | | - | | | 6 | |
| Exploration expenses | | 92 | | | 28 | |
| Decrease in non-cash working capital related to continuing operating activities | | - | | | 29 | |
| Cash flow from continuing operating activities | | 1,166 | | | 886 | |
Cash flow from discontinued operating activities (Note 4) | | - | | | 15 | |
| Cash flow from operating activities | | 1,166 | | | 901 | |
| | | | | | | |
| Investing activities | | | | | | |
| Expenditures on property, plant and equipment and exploration | | (716 | ) | | (759 | ) |
Proceeds from sale of assets (Note 4) | | 82 | | | 645 | |
| Increase in other assets | | (17 | ) | | (9 | ) |
| (Increase) decrease in non-cash working capital related to investing activities | | (59 | ) | | 12 | |
| Cash flow from investing activities | | (710 | ) | | (111 | ) |
| | | | | | | |
| Financing activities | | | | | | |
| Repayment of long-term debt | | (2 | ) | | (2 | ) |
Proceeds from issue of common shares (Note 9) | | 6 | | | 22 | |
Purchase of common shares (Note 9) | | (87 | ) | | (476 | ) |
| Dividends on common shares | | (65 | ) | | (50 | ) |
| Cash flow from financing activities | | (148 | ) | | (506 | ) |
| | | | | | | |
| Increase in cash and cash equivalents | | 308 | | | 284 | |
| Cash and cash equivalents at beginning of period | | 499 | | | 789 | |
| Cash and cash equivalents at end of period | $ | 807 | | $ | 1,073 | |
See accompanying Notes to Consolidated Financial Statements
CONSOLIDATED BALANCE SHEET (unaudited)
As at March 31, 2007
(millions of Canadian dollars)
| | March 31, | | December 31, | |
| | 2007 | | 2006 | |
| Assets | | | | |
| Current assets | | | | |
| Cash and cash equivalents | $ | 807 | | $ | 499 | |
| Accounts receivable | | 1,560 | | | 1,600 | |
| Inventories | | 686 | | | 632 | |
| Future income taxes | | 162 | | | 95 | |
| | | 3,215 | | | 2,826 | |
| | | | | | | |
| Property, plant and equipment, net | | 18,661 | | | 18,577 | |
| Goodwill | | 803 | | | 801 | |
Other assets (Note 3) | | 371 | | | 442 | |
| | $ | 23,050 | | $ | 22,646 | |
| | | | | | | |
| Liabilities and shareholders' equity | | | | | | |
| Current liabilities | | | | | | |
Accounts payable and accrued liabilities (Note 12) | $ | 3,380 | | $ | 3,319 | |
| Income taxes payable | | 44 | | | 22 | |
Current portion of long-term debt (Note 8) | | 6 | | | 7 | |
| | | 3,430 | | | 3,348 | |
| | | | | | | |
Long-term debt (Notes 3 and 8) | | 2,745 | | | 2,887 | |
Other liabilities (Note 12) | | 1,754 | | | 1,826 | |
| Asset retirement obligations | | 1,168 | | | 1,170 | |
| Future income taxes | | 3,050 | | | 2,974 | |
| | | | | | | |
| Shareholders' equity | | | | | | |
Common shares (Note 9) | | 1,368 | | | 1,366 | |
Contributed surplus (Note 9) | | 389 | | | 469 | |
| Retained earnings | | 9,090 | | | 8,557 | |
Accumulated other comprehensive income (Note 3) | | | | | | |
| Foreign currency translation adjustment | | 56 | | | 49 | |
| | | 10,903 | | | 10,441 | |
| | $ | 23,050 | | $ | 22,646 | |
CONSOLIDATED STATEMENT OF RETAINED EARNINGS (unaudited)
For the periods ended March 31
(millions of Canadian dollars)
| | Three months ended March 31, | |
| | 2007 | | 2006 | |
| | | | | |
| Retained earnings at beginning of period | $ | 8,557 | | $ | 7,018 | |
Cumulative effect of adopting new accounting standards (Note 3) | | 8 | | | - | |
| Net earnings | | 590 | | | 206 | |
| Dividends on common shares | | (65 | ) | | (50 | ) |
| Retained earnings at end of period | $ | 9,090 | | $ | 7,174 | |
See accompanying Notes to Consolidated Financial Statements
NOTES TO CONSOLIDATED FINANCIAL STATEMENTS (unaudited)
(millions of Canadian dollars)
1. SEGMENTED INFORMATION FROM CONTINUING OPERATIONS (Note 4)
Three months ended March 31,
| | Upstream | | | | | | | | | | | | | |
| | | | | | | | | | International and Offshore | | | | | | | | | | | | | |
| | North American Natural Gas | | Oil Sands | | East Coast Canada | | International | | Downstream | | Shared Services | | Consolidated | |
| | 2007 | | 2006 | | 2007 | | 2006 | | 2007 | | 2006 | | 2007 | | 2006 | | 2007 | | 2006 | | 2007 | | 2006 | | 2007 | | 2006 | |
| | | | | | | | | | | | | | | | | | | | | | | | | | | | | |
Revenue | | | | | | | | | | | | | | | | | | | | | | | | | | | | |
| Sales to customers | $ | 349 | | $ | 451 | | $ | 166 | | $ | 116 | | $ | 601 | | $ | 388 | | $ | 664 | | $ | 704 | | $ | 3,087 | | $ | 2,756 | | $ | - | | $ | - | | $ | 4,867 | | $ | 4,415 | |
Investment and other Income (expense) (1) | | 61 | | | (1 | ) | | (2 | ) | | | | | - | | | (4 | ) | | (90 | ) | | (223 | ) | | (3 | ) | | (3 | ) | | 8 | | | 4 | | | (26 | ) | | (227 | ) |
| Inter-segment sales | | 85 | | | 95 | | | 222 | | | 155 | | | 129 | | | 122 | | | - | | | - | | | 4 | | | 4 | | | - | | | - | | | | | | | |
| Segmented revenue | | 495 | | | 545 | | | 386 | | | 271 | | | 730 | | | 506 | | | 574 | | | 481 | | | 3,088 | | | 2,757 | | | 8 | | | 4 | | | 4,841 | | | 4,188 | |
Expenses | | | | | | | | | | | | | | | | | | | | | | | | | | | | | | | | | | | | | | | | | | |
| Crude oil and product purchases | | 41 | | | 70 | | | 130 | | | 111 | | | 176 | | | 45 | | | - | | | - | | | 1,958 | | | 1,872 | | | 3 | | | 2 | | | 2,308 | | | 2,100 | |
| Inter-segment transactions | | 2 | | | 2 | | | 4 | | | 11 | | | 2 | | | 2 | | | - | | | - | | | 432 | | | 361 | | | - | | | - | | | | | | | |
| Operating, marketing and general | | 124 | | | 105 | | | 131 | | | 135 | | | 59 | | | 47 | | | 162 | | | 90 | | | 352 | | | 354 | | | (1 | ) | | 90 | | | 827 | | | 821 | |
| Exploration | | 56 | | | 48 | | | 19 | | | 6 | | | 4 | | | (1 | ) | | 63 | | | 44 | | | - | | | - | | | - | | | - | | | 142 | | | 97 | |
| Depreciation, depletion and amortization | | 108 | | | 100 | | | 39 | | | 37 | | | 103 | | | 65 | | | 118 | | | 80 | | | 69 | | | 53 | | | 4 | | | - | | | 441 | | | 335 | |
| Unrealized (gain) loss on translation of foreign currency denominated long-term debt | | - | | | - | | | - | | | - | | | - | | | - | | | - | | | - | | | - | | | - | | | (17 | ) | | 2 | | | (17 | ) | | 2 | |
| Interest | | - | | | - | | | - | | | - | | | - | | | - | | | - | | | - | | | - | | | - | | | 42 | | | 45 | | | 42 | | | 45 | |
| | | 331 | | | 325 | | | 323 | | | 300 | | | 344 | | | 158 | | | 343 | | | 214 | | | 2,811 | | | 2,640 | | | 31 | | | 139 | | | 3,743 | | | 3,400 | |
Earnings (loss) from continuing operations before income taxes | | 164 | | | 220 | | | 63 | | | (29 | ) | | 386 | | | 348 | | | 231 | | | 267 | | | 277 | | | 117 | | | (23 | ) | | (135 | ) | | 1,098 | | | 788 | |
Provision for income taxes | | | | | | | | | | | | | | | | | | | | | | | | | | | | | | | | | | | | | | | | | | |
| Current | | 61 | | | 84 | | | 6 | | | (15 | ) | | 138 | | | 124 | | | 258 | | | 360 | | | 56 | | | 36 | | | (28 | ) | | (57 | ) | | 491 | | | 532 | |
Future (Note 6) | | (9 | ) | | (3 | ) | | 14 | | | 5 | | | (8 | ) | | (5 | ) | | (36 | ) | | 188 | | | 37 | | | 6 | | | 19 | | | 11 | | | 17 | | | 202 | |
| | | 52 | | | 81 | | | 20 | | | (10 | ) | | 130 | | | 119 | | | 222 | | | 548 | | | 93 | | | 42 | | | (9 | ) | | (46 | ) | | 508 | | | 734 | |
Net earnings (loss) from continuing operations | $ | 112 | | $ | 139 | | $ | 43 | | $ | (19 | ) | $ | 256 | | $ | 229 | | $ | 9 | | $ | (281 | ) | $ | 184 | | $ | 75 | | $ | (14 | ) | $ | (89 | ) | $ | 590 | | $ | 54 | |
Expenditures on property, plant and equipment and exploration from continuing operations (2) | $ | 205 | | $ | 213 | | $ | 90 | | $ | 119 | | $ | 38 | | $ | 53 | | $ | 157 | | $ | 121 | | $ | 221 | | $ | 251 | | $ | 5 | | $ | 1 | | $ | 716 | | $ | 758 | |
Cash flow from continuing operating activities | $ | 159 | | $ | 241 | | $ | 69 | | $ | 53 | | $ | 481 | | $ | 346 | | $ | 277 | | $ | 303 | | $ | 214 | | $ | 15 | | $ | (34 | ) | $ | (72 | ) | $ | 1,166 | | $ | 886 | |
Total assets from continuing operations | $ | 4,121 | | $ | 3,759 | | $ | 2,967 | | $ | 2,671 | | $ | 2,327 | | $ | 2,432 | | $ | 6,220 | | $ | 5,244 | | $ | 6,894 | | $ | 5,863 | | $ | 521 | | $ | 766 | | $ | 23,050 | | $ | 20,735 | |
| (1) | Investment and other income for the International segment includes unrealized losses relating to the Buzzard derivative contracts of $88 million for the three months ended March 31, 2007 ($219 million for the three months ended March 31, 2006) (Notes 5 and 12). |
| (2) | Consolidated expenditures include capitalized interest in the amount of $6 million for the three months ended March 31, 2007 ($7 million for the three months ended March 31, 2006). |
NOTES TO CONSOLIDATED FINANCIAL STATEMENTS (unaudited)
(millions of Canadian dollars, unless otherwise stated)
The note disclosure requirements for annual financial statements provide additional disclosure to that required for interim financial statements. Accordingly, these interim Consolidated Financial Statements should be read in conjunction with the December 31, 2006 audited Consolidated Financial Statements. The interim Consolidated Financial Statements are presented in accordance with Canadian generally accepted accounting principles and follow the accounting policies summarized in the notes to the annual Consolidated Financial Statements, except for changes as described in Note 3.
| 3. | CHANGES IN ACCOUNTING POLICIES |
The Company adopted Canadian Institute of Chartered Accountants (CICA) Handbook Section 1530, Comprehensive Income; Section 3855, Financial Instruments - Recognition and Measurement; Section 3861, Financial Instruments - Presentation and Disclosure; and Section 3865, Hedges on January 1, 2007.
As a result of adopting CICA Section 1530, Comprehensive Income, a new Statement of Comprehensive Income forms part of the Company’s consolidated financial statements. Gains and losses from the translation into Canadian dollars of assets and liabilities, including associated long-term debt, of the Company’s self-sustaining foreign operations are now presented as a separate component of other comprehensive income (loss) in the Consolidated Statement of Comprehensive Income. Accumulated other comprehensive income (loss) is presented as a separate component of shareholders’ equity in the Consolidated Balance Sheet. Previously, these gains and losses were deferred and included in the foreign currency translation adjustment as part of shareholders’ equity.
As a result of adopting CICA Section 3855, Financial Instruments - Recognition and Measurement, long-term debt is measured at fair value when initially recognized and, after initial recognition, at amortized cost using the effective interest method. Transaction costs and premiums or discounts directly attributable to the issuance of long-term debt are now added to the fair value on initial recognition. Previously, these amounts were deferred and amortized using the straight line method over the term of the debt. Unamortized amounts were separately presented in other assets on the Consolidated Balance Sheet. In accordance with the transitional provisions, prior periods have not been restated as a result of adopting this new accounting standard. To recognize the cumulative prior period effect, the following balance sheet categories were impacted on January 1, 2007:
| | Increase / (Decrease | ) |
| Other assets | $ | (101 | ) |
| Long-term debt | | (112 | ) |
| Future income taxes liability | | 3 | |
| Retained earnings | | 8 | |
There is no other material impact on the Consolidated Financial Statements for adoption of these new standards.
NOTES TO CONSOLIDATED FINANCIAL STATEMENTS (unaudited)
(millions of Canadian dollars, unless otherwise stated)
| 4. | DISCONTINUED OPERATIONS |
On January 31, 2006, the Company completed the sale of its producing assets in Syria for net proceeds of $640 million, resulting in a gain on disposal of $134 million.
The accounting for discontinued operations results in a reduction of the Consolidated Statement of Earnings balances as follows:
| | Three months ended March 31, | |
| | 2007 | | 2006 | |
Revenue (1) | $ | - | | $ | 168 | |
| Expenses | | | | | | |
| Operating, marketing and general | | - | | | 6 | |
| | | - | | | 6 | |
| Earnings from discontinued operations before income taxes | | - | | | 162 | |
| Provision for income taxes | | - | | | 10 | |
| Net earnings from discontinued operations | $ | - | | $ | 152 | |
| (1) | Revenue includes the gain on disposal of $134 million. |
| 5. | INVESTMENT AND OTHER INCOME (EXPENSE) |
Investment and other income (expense) includes net losses on derivative contracts (Note 12) of $94 million for the three months ended March 31, 2007 ($224 million for the three months ended March 31, 2006) and net gains on disposal of assets of $62 million for the three months ended March 31, 2007 ($2 million for the three months ended March 31, 2006).
The provision for future income taxes for the three months ended March 31, 2006 includes a $242 million charge due to the enacted increase in the U.K. supplemental corporate income tax rate. The adjustment was allocated to the Company’s International business segment.
The following table provides the common shares used in calculating earnings per share amounts:
| | Three months ended March 31, |
(millions) | 2007 | | 2006 | |
| Weighted-average number of common shares outstanding - basic | 497.0 | | 512.9 | |
| Effect of dilutive stock options | 5.0 | | 6.9 | |
| Weighted-average number of common shares outstanding - diluted | 502.0 | | 519.8 | |
| | Maturity | | March 31, 2007(Note 3) | | December 31, 2006 | |
Debentures and notes 5.95% unsecured senior notes ($600 million US) | | 2035 | | $ | 675 | | $ | 699 | |
5.35% unsecured senior notes ($300 million US) | | 2033 | | | 297 | | | 349 | |
7.00% unsecured debentures ($250 million US) | | 2028 | | | 278 | | | 291 | |
7.875% unsecured debentures ($275 million US) | | 2026 | | | 312 | | | 321 | |
9.25% unsecured debentures ($300 million US) | | 2021 | | | 343 | | | 349 | |
5.00% unsecured senior notes ($400 million US) | | 2014 | | | 456 | | | 466 | |
4.00% unsecured senior notes ($300 million US) | | 2013 | | | 323 | | | 349 | |
| Capital leases | | 2007-2017 | | | 67 | | | 70 | |
| | | | | | 2,751 | | | 2,894 | |
| Current portion | | | | | (6 | ) | | (7 | ) |
| | | | | $ | 2,745 | | $ | 2,887 | |
NOTES TO CONSOLIDATED FINANCIAL STATEMENTS (unaudited)
(millions of Canadian dollars, unless otherwise stated)
Changes in common shares and contributed surplus were as follows:
| | Shares | | Amount | | Contributed Surplus | |
| Balance at December 31, 2006 | | 497,538,385 | | $ | 1,366 | | $ | 469 | |
| Issued under employee stock option and share purchase plans | | 289,640 | | | 8 | | | 1 | |
| Repurchased under normal course issuer bid | | (2,000,000 | ) | | (6 | ) | | (81 | ) |
| Balance at March 31, 2007 | | 495,828,025 | | $ | 1,368 | | $ | 389 | |
In June 2006, the Company renewed its normal course issuer bid (NCIB) program to repurchase up to 25 million of its outstanding common shares during the period from June 22, 2006 to June 21, 2007, subject to certain conditions. During the three months ended March 31, 2007, the Company purchased 2,000,000 common shares at a cost of $87 million (8,786,800 common shares at a cost of $476 million during the three months ended March 31, 2006). The excess of the purchase price over the carrying amount of the shares purchased was recorded as a reduction of contributed surplus.
| 10. | STOCK-BASED COMPENSATION |
The total stock-based compensation (recovery) expense recorded was $(14) million for the three months ended March 31, 2007 ($65 million for the three months ended March 31, 2006).
| | (a) | Stock Option and Performance Share Unit (PSU) Plans |
Changes in the number of outstanding stock options and PSUs were as follows:
| | Stock Options | | PSUs | |
| | Number | | Weighted-Average Exercise Price | | Number | |
| Balance at December 31, 2006 | | 20,714,733 | | $ | 31 | | | 1,482,986 | |
| Granted | | 3,295,300 | | | 44 | | | 238,734 | |
| Exercised for common shares | | (289,640 | ) | | 21 | | | n/a | |
| Surrendered for cash payment | | (30,350 | ) | | 31 | | | n/a | |
| Cancelled/Expired | | (127,750 | ) | | 43 | | | (538,928 | ) |
| Balance at March 31, 2007 | | 23,562,293 | | $ | 33 | | | 1,182,792 | |
| | (b) | Stock Appreciation Rights (SAR) |
Commencing 2007, the Company approved the issuance of SARs to certain employees, which entitle the holder to receive a cash payment equal to the difference between the stated exercise price and the market price of the Company’s common shares on date of surrender. The vesting period and other terms are similar to the terms of the Company’s existing stock option plan. At the time of grant the exercise price approximates the market price. The following SARs have been granted:
| | SARs | |
| | Number | | Weighted-Average Exercise Price | |
| Balance at December 31, 2006 | | - | | $ | - | |
| Granted | | 3,578,500 | | | 44 | |
| Cancelled | | (11,500 | ) | | 44 | |
| Balance at March 31, 2007 | | 3,567,000 | | $ | 44 | |
NOTES TO CONSOLIDATED FINANCIAL STATEMENTS (unaudited)
(millions of Canadian dollars, unless otherwise stated)
| 11. | EMPLOYEE FUTURE BENEFITS |
The Company maintains pension plans with defined benefit and defined contribution provisions and provides certain health care and life insurance benefits to its qualifying retirees. The expenses associated with these plans are as follows:
| | Three months ended March 31, | |
| | 2007 | | 2006 | |
| Pension Plans: | | | | |
| Defined benefit plans | | | | |
Employer current service cost | $ | 10 | | $ | 10 | |
Interest cost | | 22 | | | 21 | |
Expected return on plan assets | | (28 | ) | | (25 | ) |
Amortization of transitional asset | | (1 | ) | | (2 | ) |
Amortization of net actuarial losses | | 11 | | | 13 | |
| | | 14 | | | 17 | |
| | | | | | | |
| Defined contribution plans | | 4 | | | 4 | |
| | $ | 18 | | $ | 21 | |
| | | | | | | |
| Other post-retirement plans: | | | | | | |
Employer current service cost | $ | 1 | | $ | 1 | |
Interest cost | | 3 | | | 3 | |
Amortization of transitional obligation | | 2 | | | 1 | |
| | $ | 6 | | $ | 5 | |
The Company expects to contribute $115 million to its pension plans in 2007.
| 12. | FINANCIAL INSTRUMENTS AND DERIVATIVES |
Investment and other income includes unrealized gains and losses on the outstanding derivative contracts associated with the 2004 acquisition of an interest in the Buzzard field in the U.K. sector of the North Sea. These contracts resulted in unrealized losses of $88 million for the three months ended March 31, 2007 ($219 million for the three months ended March 31, 2006).
Investment and other income includes unrealized losses on all derivative contracts of $81 million for the three months ended March 31, 2007 ($219 million for the three months ended March 31, 2006). As at March 31, 2007, accounts receivable, accounts payable and other liabilities include $4 million, $368 million, and $1,202 million, respectively, relating to unrealized mark-to-market amounts on derivative contracts.