EXHIBIT 99.1
April 29, 2008 & #160; (publié également en français)
For the three months ended March 31, 2008
MANAGEMENT’S DISCUSSION AND ANALYSIS
The Management’s Discussion and Analysis (MD&A), dated April 29, 2008, is set out in pages 1 to 22 and should be read in conjunction with the unaudited Consolidated Financial Statements of the Company for the three months ended March 31, 2008; the MD&A for the year ended December 31, 2007; the audited Consolidated Financial Statements for the year ended December 31, 2007, and the Company’s 2007 Annual Information Form (AIF), dated March 17, 2008. Amounts are in Canadian (Cdn) dollars unless otherwise specified.
LEGAL NOTICE – FORWARD-LOOKING INFORMATION
This quarterly report contains forward-looking information. You can usually identify this information by such words as "plan," "anticipate," "forecast," "believe," "target," "intend," "expect," "estimate," "budget" or other terms that suggest future outcomes or references to outlooks. Listed below are examples of references to forward-looking information:
· business strategies and goals · future investment decisions · outlook (including operational updates and strategic milestones) · future capital, exploration and other expenditures · future cash flows · future resource purchases and sales · construction and repair activities · turnarounds at refineries and other facilities · anticipated refining margins · future oil and natural gas production levels and the sources of their growth · project development, and expansion schedules and results · future exploration activities and results, and dates by which certain areas may be developed or come on-stream | · retail throughputs · pre-production and operating costs · reserves and resources estimates · royalties and taxes payable · production life-of-field estimates · natural gas export capacity · future financing and capital activities (including purchases of Petro-Canada common shares under the Company’s normal course issuer bid (NCIB) program) · contingent liabilities (including potential exposure to losses related to retail licensee agreements) · environmental matters · future regulatory approvals · expected rates of return |
Such forward-looking information is subject to known and unknown risks and uncertainties. Other factors may cause actual results, levels of activity and achievements to differ materially from those expressed or implied by such information. Such factors include, but are not limited to:
· industry capacity · imprecise reserves estimates of recoverable quantities of oil, natural gas and liquids from resource plays, and other sources not currently classified as reserves · the effects of weather and climate conditions · the results of exploration and development drilling, and related activities · the ability of suppliers to meet commitments · decisions or approvals from administrative tribunals · risks associated with domestic and international oil and natural gas operations · general economic, market and business conditions | · competitive action by other companies · fluctuations in oil and natural gas prices · refining and marketing margins · the ability to produce and transport crude oil and natural gas to markets · fluctuations in interest rates and foreign currency exchange rates · actions by governmental authorities (including changes in taxes, royalty rates and resource-use strategies) · changes in environmental and other regulations · international political events · nature and scope of actions by stakeholders and/or the general public |
Many of these and other similar factors are beyond the control of Petro-Canada. Petro-Canada discusses these factors in greater detail in filings with the Canadian provincial securities commissions and the United States (U.S.) Securities and Exchange Commission (SEC).
Readers are cautioned that this list of important factors affecting forward-looking information is not exhaustive. Furthermore, the forward-looking information in this quarterly report is made as of April 29, 2008 and, except as required by applicable law, will not be publicly updated or revised. This cautionary statement expressly qualifies the forward-looking information in this quarterly report.
Management's Discussion and Analysis
PETRO-CANADA
Petro-Canada disclosure of reserves
Petro-Canada's qualified reserves evaluators prepare the reserves estimates the Company uses. The Canadian provincial securities commissions do not consider Petro-Canada’s reserves staff and management as independent of the Company. Petro-Canada has obtained an exemption from certain Canadian reserves disclosure requirements that allows Petro-Canada to make disclosure in accordance with SEC standards where noted in this quarterly report. This exemption allows comparisons with U.S. and other international issuers.
As a result, Petro-Canada formally discloses its proved reserves data using U.S. requirements and practices, and these may differ from Canadian domestic standards and practices. The use of the terms such as "probable," "possible," ”resources” and “life-of-field production” in this quarterly report does not meet the SEC guidelines for SEC filings. To disclose reserves in SEC filings, oil and natural gas companies must prove they are economically and legally producible under existing economic and operating conditions. Note that when the term barrels of oil equivalent (boe) is used in this quarterly report, it may be misleading, particularly if used in isolation. A boe conversion ratio of six thousand cubic feet (Mcf) to one barrel (bbl) is based on an energy equivalency conversion method. This method primarily applies at the burner tip and does not represent a value equivalency at the wellhead.
The table below describes the industry definitions that Petro-Canada currently uses:
| Definitions Petro-Canada uses | Reference |
| Proved oil and natural gas reserves (includes both proved developed and proved undeveloped) | SEC reserves definition (Accounting Rules Regulation S-X 210.4-10, U.S. Financial Accounting Standards Board (FASB) Statement No. 69) SEC Guide 7 for Oilsands Mining |
| | |
| Unproved reserves, probable and possible reserves | Canadian Securities Administrators: Canadian Oil and Gas Evaluation (COGE) Handbook, Vol. 1 Section 5 prepared by the Society of Petroleum Evaluation Engineers (SPEE) and the Canadian Institute of Mining Metallurgy and Petroleum (CIM) |
| | |
| Contingent and Prospective Resources | Petroleum Resources Management System: Society of Petroleum Engineers, SPEE, World Petroleum Congress and American Association of Petroleum Geologist definitions (approved March 2007) Canadian Securities Administrators: COGE Handbook Vol. 1 Section 5 |
Although the Society of Petroleum Engineers resource classification has categories of 1C, 2C, 3C for Contingent Resources, and low, best and high estimates for Prospective Resources, Petro-Canada will only refer to the 2C for Contingent Resources and the risked (an assessment of the probability of discovering the resources) best estimate for Prospective Resources when referencing resources in this quarterly report. Canadian Oil Sands represents approximately 71% of Petro-Canada’s total for Contingent and Prospective Resources. The balance of Petro-Canada’s resources is spread out across the business, most notably in the North American frontier and International areas. Also, when Petro-Canada references resources for the Company, Contingent Resources are approximately 53% and risked Prospective Resources are approximately 47% of the Company’s total resources.
Cautionary statement: In the case of discovered resources or a subcategory of discovered resources other than reserves, there is no certainty that it will be commercially viable to produce any portion of the resources. In the case of undiscovered resources or a subcategory of undiscovered resources, there is no certainty that any portion of the resources will be discovered. If discovered, there is no certainty that it will be commercially viable to produce any portion of the resources.
For movement of resources to reserves categories, all projects must have an economic depletion plan and may require
| · | additional delineation drilling and/or new technology for oil sands mining, in situ and conventional Contingent and risked Prospective Resources prior to project sanction and regulatory approvals; and |
| · | exploration success with respect to conventional risked Prospective Resources prior to project sanction and regulatory approvals. |
Reserves and resources information contained in this quarterly report is as at December 31, 2007.
Management's Discussion and Analysis
PETRO-CANADA
BUSINESS ENVIRONMENT
Market prices shown below influence average prices realized for crude oil, natural gas liquids (NGL), natural gas and petroleum products in the table on page 20.
UPSTREAM
Crude Oil
| The price of Dated Brent averaged $96.90 US/bbl in the first quarter of 2008, up nearly 68% compared with $57.75 US/bbl in the first quarter of 2007. Geopolitics combined with speculation led to record high oil prices during the quarter.
During the first quarter of 2008, the Canadian dollar averaged approximately $1.00 US, up from about $0.85 US in the first quarter of 2007.
As a result, Petro-Canada’s corporate-wide realized Canadian dollar prices for crude oil and NGL averaged $93.38/bbl in the first quarter of 2008, up 48% compared with $62.98/bbl in the first quarter of 2007.
|
In the first quarter of 2008, the spread between Dated Brent and Mexican Maya widened to $15.77 US/bbl, compared with $12.39 US/bbl in the first quarter of 2007. Reflecting widening international differentials, the spread, in Canada, between Edmonton Light and Western Canada Select (WCS) widened to $21.61/bbl in the first quarter of 2008, compared with $18.16/bbl in the first quarter of 2007.
Natural Gas
| North American natural gas prices at the Henry Hub were higher in the first quarter of 2008, compared with the first quarter of 2007, due to colder winter weather conditions. In the first quarter of 2008, NYMEX Henry Hub natural gas prices averaged $8.09 US/million British thermal units (MMBtu), up 16% from $6.96 US/MMBtu in the first quarter of 2007. However, the gain in Henry Hub natural gas prices was offset by the strong appreciation of the Canadian dollar during the first quarter of 2008. Petro-Canada’s realized Canadian dollar prices for its North American Natural Gas business averaged $7.51/Mcf in the first quarter of 2008, up 2% from $7.39/Mcf in the first quarter of 2007. |
Management's Discussion and Analysis
PETRO-CANADA
DOWNSTREAM
| New York Harbor 3-2-1 refinery crack spreads averaged $8.06 US/bbl in the first quarter of 2008, down 28% compared with an average of $11.25 US/bbl in the first quarter of 2007. Weak gasoline spreads more than offset gains by strong heating oil crack spreads compared with the first quarter of 2007. The strong performance of heating oil cracks was partly due to colder temperatures than in the first quarter of 2007. |
| 1 | On January 1, 2007, the New York Harbor 3-2-1 crack spread calculation changed. It is now based on Reformulated Gasoline Blendstock for Oxygenate Blending (RBOB) gasoline (the base for blending gasoline with 10% denatured ethanol) as opposed to conventional gasoline. Due to this change in specification, 2007 and 2008 crack spread values are not directly comparable to 2006 values. |
The average market prices for the periods stated were:
| | Three months ended March 31, |
| | 2008 | 2007 |
Dated Brent at Sullom Voe (US$/bbl) | 96.90 | 57.75 |
West Texas Intermediate (WTI) at Cushing (US$/bbl) | 97.90 | 58.16 |
Dated Brent/Maya FOB price differential (US$/bbl) | 15.77 | 12.39 |
Edmonton Light (Cdn$/bbl) | 98.08 | 67.79 |
Edmonton Light/WCS FOB price differential (Cdn$/bbl) | 21.61 | 18.16 |
Natural gas at Henry Hub (US$/MMBtu) | 8.09 | 6.96 |
Natural gas at AECO (Cdn$/Mcf) | 7.44 | 7.77 |
New York Harbor 3-2-1 crack spread (US$/bbl) | 8.06 | 11.25 |
Exchange rate (US cents/Cdn$) | 99.6 | 85.4 |
| Average realized prices | | |
Crude oil and NGL ($/bbl) | 93.38 | 62.98 |
Natural gas ($/Mcf) | 7.59 | 7.32 |
Management's Discussion and Analysis
PETRO-CANADA
The following table shows the estimated after-tax effects that changes in certain factors would have had on Petro-Canada’s 2007 net earnings had these changes occurred. Amounts are in Canadian dollars unless otherwise specified.
Factor 1, 2 | Change (+) | | Annual net earnings impact | | | Annual net earnings impact | |
| | | | (millions of dollars) | | | ($/share) 3 | |
| Upstream | | | | | | | |
Price received for crude oil and NGL 4 | $1.00/bbl | | $ | 52 | | | $ | 0.11 | |
| Price received for natural gas | $0.25/Mcf | | | 30 | | | | 0.06 | |
Exchange rate: US$/Cdn$ refers to impact on upstream net earnings 5 | $0.01 | | | (40 | ) | | | (0.08 | ) |
| Crude oil and NGL production | 1,000 barrels/day (b/d) | | | 10 | | | | 0.02 | |
| Natural gas production | 10 million cubic feet/day (MMcf/d) | | | 7 | | | | 0.01 | |
| Downstream | | | | | | | | | |
| New York Harbor 3-2-1 crack spread | $1.00 US/bbl | | | 22 | | | | 0.05 | |
| Chicago 3-2-1 crack spread | $1.00 US/bbl | | | 24 | | | | 0.05 | |
| Seattle 3-2-1 crack spread | $1.00 US/bbl | | | 7 | | | | 0.01 | |
| WTI/Dated Brent price differential | $1.00 US/bbl | | | 25 | | | | 0.05 | |
| Dated Brent/Maya FOB price differential | $1.00 US/bbl | | | 6 | | | | 0.01 | |
| Edmonton Light/Synthetic price differential | $1.00 Cdn/bbl | | | 13 | | | | 0.03 | |
Exchange rate: US$/Cdn$ refers to impact on Downstream cracking margins and crude price differentials 6 | $0.01 | | | (11 | ) | | | (0.02 | ) |
| Natural gas fuel cost – AECO natural gas price | $1.00 Cdn/Mcf | | | (11 | ) | | | (0.02 | ) |
| Asphalt – % of Maya crude oil price | 1% | | | 2 | | | | – | |
| Heavy fuel oil (HFO) – % of WTI crude oil price | 1% | | | 2 | | | | – | |
| Corporate | | | | | | | | | |
Exchange rate: US$/Cdn$ refers to impact of the revaluation of U.S. dollar-denominated, long-term debt 7 | $0.01 | | $ | 10 | | | $ | 0.02 | |
| 1 | The impact of a change in one factor may be compounded or offset by changes in other factors. This table does not consider the impact of any inter-relationship among the factors. |
| 2 | The impact of these factors is illustrative. |
| 3 | Per share amounts are based on the number of shares outstanding as at December 31, 2007. |
| 4 | This sensitivity is based upon an equivalent change in the price of WTI and Dated Brent, excluding the derivative contracts associated with the Buzzard acquisition that were closed out in the fourth quarter of 2007. |
| 5 | A strengthening Canadian dollar compared with the U.S. dollar has a negative effect on upstream net earnings. |
| 6 | A strengthening Canadian dollar compared with the U.S. dollar has a negative effect on Downstream cracking margins and crude price differentials. |
| 7 | A strengthening Canadian dollar versus the U.S. dollar has a positive effect on corporate earnings with respect to the Company’s U.S. denominated debt. The impact refers to gains or losses on $1.4 billion US of the Company’s U.S. denominated long-term debt and interest costs on U.S. denominated debt. Gains or losses on $1.1 billion US of the Company’s U.S. denominated long-term debt, associated with the self-sustaining International business segment and the U.S. Rockies operations included in the North American Natural Gas business unit, are deferred and included as part of shareholders’ equity. |
Management's Discussion and Analysis
PETRO-CANADA
BUSINESS STRATEGY
Petro-Canada's strategy is to create shareholder value by delivering long-term, profitable growth and improving the profitability of the base business.
Petro-Canada’s capital program supports bringing on seven major projects over the next several years. For the remainder of 2008, the Company expects to complete the project to convert the Edmonton refinery to process lower cost, oil sands-based feedstock and to make final investment decisions (FID) on the Fort Hills mine and upgrader and Montreal coker project. The Company and its partners also plan to advance the following upstream projects: the MacKay River in situ expansion, extension of the White Rose field off the East Coast of Canada, the Syria Elba gas project and development of the Libya concessions. The Company anticipates upstream production will significantly increase again as these big projects come on-stream. These projects are expected to add significant earnings and cash flow.
Petro-Canada continually works to strengthen its base business by improving the safety, reliability and efficiency of its operations and is focused on delivering upstream production in line with guidance.
| Strategic Priorities | Quarterly Progress |
DELIVERING PROFITABLE GROWTH WITH A FOCUS ON OPERATED, LONG-LIFE ASSETS | · advanced construction of the Edmonton refinery conversion project, which was 79% complete at the end of the first quarter of 2008 and on track for startup in the fourth quarter of 2008 · completed front-end engineering and design (FEED), made FID and awarded Syria Ebla gas engineering, procurement and construction (EPC) contract · received regulatory approval for the MacKay River 40,000 b/d expansion project · drilled two natural gas discoveries, one in the Alaska Foothills and one offshore Trinidad and Tobago |
DRIVING FOR FIRST QUARTILE OPERATION OF OUR ASSETS | · achieved 87% facility reliability at Terra Nova · maintained reliability around 99% at Western Canada natural gas processing facilities · operated MacKay River at 94% reliability · delivered a combined reliability index of 99 at all three of the Downstream production facilities · grew convenience store sales by 6% and same-store sales by 4%, compared with the first quarter of 2007 |
MAINTAINING FINANCIAL DISCIPLINE AND FLEXIBILITY | · ended the quarter with debt levels at 18.9% of total capital and a ratio of 0.9 times debt-to-cash flow from operating activities · filed shelf prospectus enabling Company to access up to $4 billion US in debt · increased the Company’s syndicated committed credit facilities to approximately $3.6 billion from $2.2 billion |
CONTINUING TO WORK AT BEING A RESPONSIBLE COMPANY | · experienced total recordable injury frequency (TRIF) of 1.03 in the first quarter of 2008, compared with 0.89 in the same period in 2007, due to a rise in contractor injuries · completed a process safety gap analysis and determined priority areas for enhancing current practices · initiated online, Company-wide Total Loss Management (TLM) training |
STRATEGIC MILESTONES
| Q2 2008 | Q3 2008 | Q4 2008 |
| ▼ | ▼ | ▼ |
| | | |
| | | |
· commence regulatory hearing on the Fort Hills Sturgeon County Upgrader application · anticipate final ratification of Libya Concession Development agreement · anticipate regulatory approvals for North Amethyst portion of the White Rose Extensions · make FID on potential 25,000 b/d coker at Montreal refinery, subject to labour dispute resolution | · anticipate receipt of a regulatory decision on the Fort Hills mine plan amendment application | · complete and start-up Edmonton refinery conversion project · anticipate receipt of a regulatory decision on the Fort Hills Sturgeon County Upgrader · make a FID on the Fort Hills integrated mine/upgrader project |
Management's Discussion and Analysis
PETRO-CANADA
ANALYSIS OF CONSOLIDATED EARNINGS
Earnings Variances
| | Q1/08 VERSUS Q1/07 FACTOR ANALYSIS |
| | (millions of Canadian dollars, after-tax) |
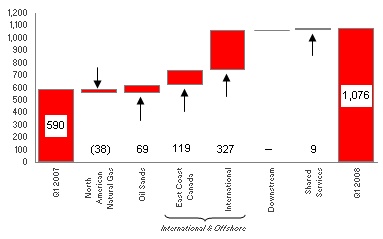
| Net earnings increased to $1,076 million ($2.22/share) in the first quarter of 2008, compared with $590 million ($1.19/share) in the first quarter of 2007. Strong realized crude oil and natural gas prices, higher upstream production, improved Downstream margin and volume3 and lower other expenses contributed to higher net earnings. These factors were partially offset by increased exploration and depreciation, depletion and amortization (DD&A) expenses. |
| 1 | Upstream volumes included the portion of DD&A expense associated with changes in upstream production levels. |
| 2 | Other mainly included the change in fair value of the Buzzard derivative contracts (applies to 2007 and prior only), foreign currency translation, interest expense, changes in effective tax rates, gain on sale of assets, insurance proceeds and upstream inventory movements. |
| 3 | Downstream margin and volume included the positive impact on realized margins from escalating crude oil feedstock costs while using a FIFO inventory valuation methodology. |
| (millions of Canadian dollars, after-tax) |
| Net earnings on a segmented basis increased 82% to $1,076 million in the first quarter of 2008, compared with $590 million in the first quarter of 2007. The increase in first quarter net earnings reflected higher International, East Coast Canada and Oil Sands net earnings combined with lower Shared Services costs. The results were partially offset by lower North American Natural Gas net earnings. |
During the first quarter of 2008, cash flow from operating activities was $1,435 million ($2.96/share), up from $1,166 million ($2.35/share) in the same quarter of 2007. The increase in cash flow from operating activities primarily reflected higher net earnings.
Quarterly Financial Information
| | | Three months ended | |
| (millions of Canadian dollars, except per share amounts) | | March 31 2008 | | | Dec. 31 2007 | | | Sept. 30 2007 | | | June 30 2007 | | | March 31 2007 | | | Dec. 31 2006 | | | Sept. 30 2006 | | | June 30 2006 | |
| Total revenue | | $ | 6,586 | | | $ | 5,434 | | | $ | 5,497 | | | $ | 5,478 | | | $ | 4,841 | | | $ | 4,550 | | | $ | 5,201 | | | $ | 4,730 | |
| | | | | | | | | | | | | | | | | | | | | | | | | | | | | | | | | |
| Net earnings | | $ | 1,076 | | | $ | 522 | | | $ | 776 | | | $ | 845 | | | $ | 590 | | | $ | 384 | | | $ | 678 | | | $ | 472 | |
Per share – basic | | | 2.22 | | | | 1.08 | | | | 1.59 | | | | 1.71 | | | | 1.19 | | | | 0.77 | | | | 1.36 | | | | 0.93 | |
– diluted | | | 2.20 | | | | 1.07 | | | | 1.58 | | | | 1.70 | | | | 1.18 | | | | 0.76 | | | | 1.34 | | | | 0.92 | |
Management's Discussion and Analysis
PETRO-CANADA
UPSTREAM
Production
Petro-Canada converts volumes of natural gas to oil equivalent at a rate of six Mcf of natural gas to one bbl of oil. Production volumes disclosed refer to net working interest before royalties, unless otherwise specified.
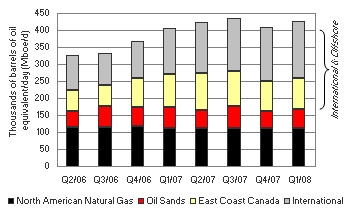
| In the first quarter of 2008, production averaged 427,000 barrels of oil equivalent per day (boe/d) net to Petro-Canada, up from 405,000 boe/d net in the same quarter of 2007. Higher volumes reflected increased International production, partially offset by lower East Coast Canada and Oil Sands production and declining production in the North American Natural Gas business. |
Exploration Update
In the first quarter of 2008, Petro-Canada and its partners finished operations on seven of the up to 17 wells planned for the year. Two of the wells (Gubik-3 in the Alaska Foothills and Sancoche on Block 22 offshore Trinidad and Tobago) were completed as natural gas discoveries. The Company and its partners will complete further appraisal work before considering development options. Offshore Trinidad and Tobago, the Cassra-2 appraisal well confirmed Contingent resources in the range of 0.6 trillion cubic feet (Tcf) to 1.3 Tcf in the Cassra-1 discovery. Drilling of the Chandler-1 well in the Alaska Foothills has been suspended, as planned, for re-entry next season, the Maria well in the U.K. sector of the North Sea was a non-commercial discovery and two wells (Kwijika in the Northwest Territories and Gemini in the U.K. sector of the North Sea) were dry and abandoned.
North American Natural Gas
North American Natural Gas facilities continued to operate reliably in the first quarter of 2008, enabling the business to capture the value of higher natural gas prices.
| | | Three months ended March 31, | |
| (millions of Canadian dollars) | | 2008 | | | 2007 | |
| Net earnings | | $ | 74 | | | $ | 112 | |
| Cash flow from operating activities | | $ | 199 | | | $ | 159 | |
North American Natural Gas recorded net earnings of $74 million in the first quarter of 2008, compared with net earnings of $112 million in the first quarter of 2007. Lower volumes and higher DD&A costs were partially offset by higher realized prices and lower exploration expenses.
Net earnings in the first quarter of 2008 included a DD&A charge of $24 million after-tax for accumulated project development costs relating to the proposed liquefied natural gas (LNG) regasification facility at Gros-Cacouna, Quebec, which has been postponed due to global LNG business conditions. Net earnings in the first quarter of 2007 included a $40 million gain on the sale of the Brazeau and West Pembina assets.
Management's Discussion and Analysis
PETRO-CANADA
North American Natural Gas Production and Pricing
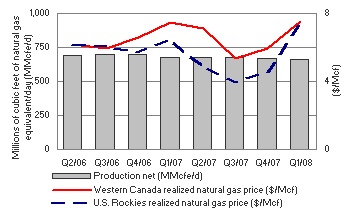
| In the first quarter of 2008, North American Natural Gas production declined by 2%, compared with the same period in 2007. Lower production reflected anticipated natural declines in Western Canada. This was partially offset by higher natural gas production in the U.S. Rockies. Realized natural gas prices in Western Canada and U.S. Rockies increased 1% and 14%, respectively, in the first quarter of 2008, compared with the same quarter of 2007, consistent with market price trends. |
| | | First Quarter 2008 | | First Quarter 2007 | |
Production net (MMcfe/d) 1 | | | | | |
Western Canada | | | 561 | | | 608 | |
U.S. Rockies | | | 104 | | | 71 | |
| Total North American Natural Gas production net | | | 665 | | | 679 | |
Western Canada realized natural gas price (Cdn$/Mcf) 1 | | $ | 7.53 | | $ | 7.49 | |
U.S. Rockies realized natural gas price (Cdn$/Mcf) 1 | | $ | 7.38 | | $ | 6.45 | |
| | 1 | For North American Natural Gas crude oil and NGL production and average realized prices, refer to the charts on pages 19 and 20, respectively. |
Petro-Canada operated gas plants and facilities in Western Canada delivered about 99% reliability in the first quarter of 2008. The Company completed its North American winter drilling program, which involved the drilling of a total of 97 gross exploration and development wells.
Scheduled Turnarounds
The Company has a number of planned turnarounds at its Western Canada natural gas processing facilities in the second quarter of 2008. The cumulative impact of these turnarounds on production in the second quarter of 2008 is expected to be a reduction of about 15 MMcfe/d.
Oil Sands
Although severe winter weather reduced production in the first quarter of 2008, financial results were strong due to high realized crude and bitumen prices.
| | | Three months ended March 31, | |
| (millions of Canadian dollars) | | 2008 | | | 2007 | |
Net earnings 1 | | $ | 112 | | | $ | 43 | |
| Cash flow from operating activities | | $ | 166 | | | $ | 69 | |
| 1 | Oil Sands bitumen inventory movements increased net earnings by $3 million before-tax ($2 million after-tax) for the three months ended March 31, 2008. The same factor increased net earnings by $3 million before-tax ($2 million after-tax) for the three months ended March 31, 2007. |
In the first quarter of 2008, Oil Sands net earnings were $112 million, up from $43 million in the first quarter of 2007. Higher realized prices and lower exploration and DD&A expenses were partially offset by lower volumes and higher operating costs. Higher operating costs reflected the cold weather freeze-ups at Syncrude and cleaning of the high temperature separator (HTS) at MacKay River.
Management's Discussion and Analysis
PETRO-CANADA
Oil Sands Production and Pricing
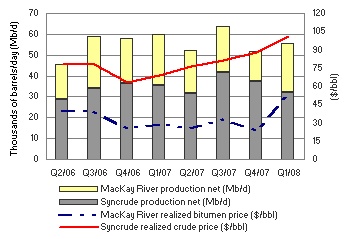
| Syncrude production was down 10% in the first quarter of 2008, compared with the first quarter of 2007, reflecting severe winter weather. Syncrude realized prices were 47% higher in the first quarter of 2008, compared with the first quarter of 2007. MacKay River production was down 3% in the first quarter of 2008, compared with the same period of 2007, due to preventive maintenance and repairs to process equipment. MacKay River realized bitumen prices increased 80% in the first quarter of 2008, compared with the first quarter of 2007, due to higher WTI prices. |
| | | First Quarter 2008 | | | First Quarter 2007 | |
Production net (b/d) | | | | | | |
Syncrude | | | 32,000 | | | | 35,500 | |
MacKay River | | | 23,500 | | | | 24,200 | |
| Total Oil Sands production net | | | 55,500 | | | | 59,700 | |
Syncrude realized crude price ($/bbl) | | $ | 101.27 | | | $ | 68.79 | |
MacKay River realized bitumen price ($/bbl) | | $ | 52.43 | | | $ | 29.08 | |
In January 2008, Syncrude suspended all production from the facility following several instrument freeze-ups as a result of extremely cold weather conditions. Partial production resumed within three days of the freeze up.
In the first quarter of 2008, MacKay River production continued to increase steadily, compared with the fourth quarter of 2007. Increased production reflected repairs to the damaged steam header line and the cleaning of the HTS late in the fourth quarter of 2007. The second HTS was cleaned in the first quarter of 2008. MacKay River reliability averaged 94% in the first quarter of 2008, with production averaging 25,000 b/d in March 2008 as the plant continued to ramp up.
Fort Hills Project
The first phase of the Fort Hills project is planned to produce 140,000 b/d gross of synthetic crude oil (84,000 b/d net). Associated bitumen production is expected to be about 160,000 b/d gross (96,000 b/d net). First bitumen production is expected to begin in the fourth quarter of 2011, with first synthetic crude oil production from the Sturgeon Upgrader anticipated in the second quarter of 2012. The preliminary capital cost estimate for the mine and upgrading components of the first phase of Fort Hills is $14.1 billion gross ($8.5 billion net). The project is currently in the FEED stage. FEED is expected to be completed in the third quarter of 2008, producing a definitive cost estimate and the basis upon which the FID on the project will be made.
Petro-Canada and its partners in the Fort Hills project have ordered long-lead items such as coke drums, fractionating columns, reactors, crushers and breakers, cable shovels and 400-tonne haul trucks. The regulatory hearing date for the Sturgeon Upgrader has been set for June 2008. As well, the partnership expects approval for an amendment to the approved mine plan, which incorporates improvements identified through the mine plan optimization process, in the third quarter of 2008.
On March 10, 2008, the federal government issued an update on the regulatory framework for industrial greenhouse gas (GHG) emissions. The detail and timing of regulations is not yet known.
MacKay River Expansion Project
In the first quarter of 2008, the Company received regulatory approval for the proposed MacKay River 40,000 b/d in situ expansion project. Petro-Canada continues to refine the design for the project, to evaluate opportunities for integration with the Fort Hills project and to pursue cost-saving opportunities associated with using foreign EPC contractors. FID is expected in the first quarter of 2009.
Management's Discussion and Analysis
PETRO-CANADA
Scheduled Turnarounds
A planned 45-day Coker 8-1 turnaround at Syncrude began on April 3, 2008 and is ongoing. A major two-week turnaround is planned for MacKay River in early May 2008.
Other Developments
Petro-Canada and its partners in Syncrude remain in negotiations with the Government of Alberta regarding the province’s desire for Syncrude to move to the New Alberta Royalty Framework in advance of the expiry of its existing royalty agreement in 2016.
International & Offshore
East Coast Canada
North Amethyst portion of the White Rose Extensions received regulatory and government approval to proceed in April 2008.
| | | Three months ended March 31, | |
| (millions of Canadian dollars) | | 2008 | | | 2007 | |
Net earnings 1 | | $ | 375 | | | $ | 256 | |
| Cash flow from operating activities | | $ | 485 | | | $ | 481 | |
| 1 | East Coast Canada crude oil inventory movements decreased net earnings by $6 million before-tax ($4 million after-tax) for the three months ended March 31, 2008. The same factor increased net earnings by $23 million before-tax ($16 million after-tax) for the three months ended March 31, 2007. |
Net earnings for East Coast Canada were $375 million in the first quarter of 2008, up from $256 million in the first quarter of 2007. Higher realized prices, increased volumes at Hibernia and lower operating, DD&A and exploration expenses were partially offset by lower production at White Rose and Terra Nova and higher royalty payments.
Net earnings in the first quarter of 2008 included $29 million in insurance proceeds related to Terra Nova.
East Coast Canada Production and Pricing
| In the first quarter of 2008, East Coast Canada production decreased 5%, compared with the same period in 2007. White Rose volumes were lower due to the advancement of the planned maintenance turnaround from the third quarter of 2008 into the first quarter of 2008 and Terra Nova’s production was down slightly. Partially offsetting these factors was higher Hibernia production due to the positive impact of well workovers and strong reliability. Hibernia production in the first quarter of 2007 reflected the impact of a maintenance turnaround. Hibernia production for the remainder of 2008 is expected to reflect anticipated natural declines and increasing water production. During the first quarter of 2008, East Coast Canada realized crude prices increased 49%, compared with the first quarter of 2007. |
| | | First Quarter 2008 | | First Quarter 2007 | |
Production net (b/d) | | | | | |
Terra Nova | | | 40,100 | | | 41,100 | |
Hibernia | | | 26,600 | | | 22,100 | |
White Rose | | | 25,400 | | | 34,100 | |
| Total East Coast Canada production net | | | 92,100 | | | 97,300 | |
Average realized crude price ($/bbl) | | $ | 97.70 | | $ | 65.76 | |
The Terra Nova Floating Production Storage and Offloading (FPSO) vessel operated at 87% facility reliability in the first quarter of 2008. Performance of the Terra Nova FPSO swivel was unchanged in the first quarter of 2008. Plans are being developed for the repair or replacement of the swivel if performance deteriorates.
During the first quarter of 2008, production at White Rose was reduced due to a separator blockage. The planned 2008 two-week turnaround was advanced to the first quarter to clear the separator blockage and complete other planned maintenance. The planned turnaround was completed in February and production has returned to normal operating levels.
Management's Discussion and Analysis
PETRO-CANADA
Scheduled Turnarounds
Terra Nova is expected to commence its planned 16-day maintenance turnaround mid-June 2008. No major turnaround activity is planned for White Rose or Hibernia in the second quarter of 2008.
White Rose Extensions Development
Early in the second quarter of 2008, the partners received regulatory approval for the North Amethyst development and the Company approved the project to proceed. FEED for the North Amethyst portion of the project is complete and detailed design is underway. The partners expect to re-enter the North Amethyst glory hole in the fourth quarter of 2008. North Amethyst is the first of three extensions to the original White Rose field, with first oil from North Amethyst expected in late 2009 or early 2010.
East Coast Canada Royalties
In the first quarter of 2008, East Coast Canada royalties averaged 22% of gross revenue, compared with 10% in the first quarter of 2007. The lower royalties paid in the first quarter of 2007 related primarily to the netting of 2006 Terra Nova turnaround costs against gross revenues. Terra Nova production was subject to Tier I royalties of 30% of net revenue. White Rose production was subject to a Tier I royalty of 20% of net revenue during the first quarter of 2008. White Rose Tier II royalty, which is an incremental 10% of net revenue, was triggered late in the first quarter of 2008. Royalties in the first quarter of 2007 were lower due to White Rose production being subject to basic royalties of 1% of gross revenue. Production from Hibernia continued to be subject to basic royalties of 5% of gross revenue.
Other Developments
In the first quarter of 2008, Petro-Canada, Husky Energy and StatoilHydro reached an agreement to share the Henry Goodrich harsh environment semi-submersible drilling rig. The signing of this agreement enables the Company to participate in the drilling of the Primrose and North Mara prospects as well as drill two additional Terra Nova development wells between 2008 and 2010.
International
Strong financial quarter due to higher production and realized prices. In addition, the business completed FEED, made the FID and awarded the EPC contract for the Syria Ebla gas project in the first quarter of 2008.
| | | Three months ended March 31, | |
| (millions of Canadian dollars) | | 2008 | | | 2007 | |
Net earnings 1, 2 | | $ | 336 | | | $ | 9 | |
| Cash flow from operating activities | | $ | 506 | | | $ | 277 | |
| 1 | International crude oil inventory movements increased net earnings by $34 million before-tax ($25 million after-tax) for the three months ended March 31, 2008. The same factor decreased net earnings by $45 million before-tax ($28 million after-tax) for the three months ended March 31, 2007. |
| 2 | During the fourth quarter of 2007, the Company entered into derivative contracts to close out the hedged portion of its Buzzard production from January 1, 2008 to December 31, 2010. |
In the first quarter of 2008, International delivered net earnings of $336 million, compared with $9 million in the first quarter of 2007. Higher realized prices, increased production volumes and lower operating expenses combined with the benefit associated with settling the Buzzard derivative contracts in the fourth quarter of 2007 were partially offset by increased exploration and DD&A expenses. Higher exploration expenses were due to partial well write-offs in Trinidad and Tobago and unsuccessful wells drilled in the U.K. sector of the North Sea. Increased DD&A expense related primarily to increased production from the North Sea.
Net earnings in the first quarter of 2007 included a $60 million unrealized loss on the Buzzard derivative contracts and $5 million in insurance proceeds from the Scott platform fire.
Management's Discussion and Analysis
PETRO-CANADA
International Production and Pricing
| International production increased 25% in the first quarter of 2008, compared with the first quarter of 2007. In the first quarter of 2008, production from the North Sea increased by 41%, reflecting the ramp up of production from Buzzard. These additions were partially offset by anticipated natural declines. Other International production increased slightly in the first quarter of 2008, compared with the first quarter of 2007. |
| | | First Quarter 2008 | | First Quarter 2007 | |
Production net (boe/d) | | | | | |
U.K. sector of the North Sea | | | 84,300 | | | 50,200 | |
The Netherlands sector of the North Sea | | | 22,800 | | | 25,600 | |
North Sea | | | 107,100 | | | 75,800 | |
Other International | | | 61,100 | | | 59,000 | |
| Total International production net | | | 168,200 | | | 134,800 | |
Average realized crude oil and NGL prices ($/bbl) | | $ | 95.90 | | $ | 66.67 | |
Average realized natural gas price ($/Mcf) | | $ | 7.99 | | $ | 7.00 | |
International operations’ realized crude oil and NGL prices increased 44% in the first quarter of 2008, compared with the same period in 2007. Realized prices for natural gas increased 14% in the first quarter of 2008, compared with the same period in the prior year.
North Sea
Buzzard production averaged approximately 212,700 boe/d gross (63,600 boe/d net) from 11 production wells in the first quarter of 2008, up compared with the same quarter of 2007. The Frigg transportation system, which transports Buzzard's natural gas production to market, has a planned maintenance shutdown in June 2008. The Buzzard drilling jack-up rig is expected to undergo planned maintenance and recertification at the same time. Neither of these planned maintenance activities are expected to materially impact production for the year. Work on detailed engineering and ordering of long-lead items for the fourth platform is underway to treat higher than expected hydrogen sulphide content in some Buzzard wells.
In the Netherlands sector of the North Sea, the Petro-Canada operated De Ruyter facility continued to perform well, delivering 24,400 boe/d gross (13,200 boe/d net) of production in the first quarter of 2008.
In the first quarter of 2008, the Company was awarded four additional production licences in the 2007 Awards in Predefined Areas (APA) round in Norway. In January 2008, the Company relinquished one licence, PL365 from the 2005 APA round. Petro-Canada is operator on five of the 17 licences it holds in Norway.
Other International
Production in Libya averaged 49,800 boe/d in the first quarter of 2008, up from 46,500 boe/d in the same quarter of 2007 due to improved production performance at the En Naga and Ghani fields. The 2D and 3D seismic acquisition on Block 137 in the Sirte Basin in Libya commenced in the first quarter of 2008.
Trinidad and Tobago offshore gas production averaged 68 MMcf/d in the first quarter of 2008, down compared with 75 MMcf/d in the first quarter of 2007, reflecting lower contracted capacity at the Atlantic LNG terminal.
Syria Ebla Gas Project
In the first quarter of 2008, Petro-Canada completed FEED, made the FID on the Ebla gas project and awarded the lump sum EPC contract for the gas processing plant and gathering facilities to Petrofac. Petrofac also purchased a 10% working interest in the project, reducing Petro-Canada’s working interest in the Ebla gas project to 90%. The first development well spudded in February 2008 and drilling continues. When completed, the Ebla gas project is expected to produce 80 MMcf/d of natural gas, with first gas anticipated in 2010.
Management's Discussion and Analysis
PETRO-CANADA
Libya Concession Development
In December 2007, Petro-Canada signed binding heads of agreement with the Libya National Oil Corporation (NOC) to convert its existing Participation Agreements and old Exploration Production Sharing Agreements (EPSA) to six new EPSA IV agreements. Under the new 30-year agreements, Petro-Canada will pay 50% of all development capital and will initially receive a 12% entitlement share of production. The Company estimates that there are gross Contingent and Prospective Resources of almost two billion barrels of oil associated with the redevelopment program. Upon final government ratification of the new EPSA IV agreements, the Company will also pay a phased signature bonus of $1 billion US.
The agreement will enable Petro-Canada to design and implement jointly with the NOC the redevelopment of major fields and exploration programs in the Sirte Basin. Petro-Canada’s Libya concessions currently produce approximately 100,000 b/d gross (50,000 b/d net) on an annual average basis. Under the new agreements, production from the redevelopment program is expected to double over the next five to seven years. The Company also proposes to invest $460 million US over the next seven years on an exploration program in the Sirte region, one of the world’s most prolific basins. Success from this exploration program could materially add to reserves and production.
DOWNSTREAM
The Downstream delivered reliable operations and increased higher value retail and lubricants sales volumes in the first quarter of 2008.
| | | Three months ended March 31, | |
| (millions of Canadian dollars) | | 2008 | | | 2007 | |
| Net earnings | | $ | 184 | | | $ | 184 | |
Cash flow from (used in) operating activities 1 | | $ | (16 | ) | | $ | 214 | |
| 1 | Cash flow from (used in) operating activities in the first quarter of 2008 was used to increase inventories at the Edmonton refinery to support planned maintenance activities and seasonal demand. |
The Downstream business recorded net earnings of $184 million in the first quarter of 2008, flat compared with $184 million in the same quarter of 2007. The net earnings reflected the positive impact from escalating crude oil feedstock costs while using a FIFO inventory valuation methodology, improved refinery yields and higher distillate cracking margins. These factors were offset by lower gasoline cracking margins, lower realized refining margins for lubricants, petrochemical and asphalt products, increased operating costs and negative foreign exchange impacts on cracking margins. Higher operating costs in the first quarter of 2008, compared with the prior year, included higher planned shutdown and maintenance costs as a result of advancing part of the planned Montreal refinery turnaround into the first quarter of 2008, the addition of environmental costs for the Quebec green levy and one-time items.
Downstream Net Earnings
| | | First Quarter 2008 | | | First Quarter 2007 | |
Refining and Supply net earnings (millions of Canadian dollars) | | $ | 124 | | | $ | 134 | |
New York Harbor 3-2-1 crack spread (US$/bbl) | | $ | 8.06 | | | $ | 11.25 | |
| Chicago 3-2-1 crack spread (US$/bbl) | | $ | 7.04 | | | $ | 11.89 | |
| Seattle 3-2-1 crack spread (US$/bbl) | | $ | 9.53 | | | $ | 20.11 | |
Marketing net earnings (millions of Canadian dollars) | | $ | 60 | | | $ | 50 | |
The average New York Harbor 3-2-1 refinery crack spread was $8.06 US/bbl in the first quarter of 2008, down from $11.25 US/bbl in the first quarter of 2007. The average international light/heavy crude price differential was $15.77 US/bbl in the first quarter of 2008, compared with $12.39 US/bbl in the first quarter of 2007.
Management's Discussion and Analysis
PETRO-CANADA
In the first quarter of 2008, total sales of refined petroleum products were relatively flat at 4.7 billion litres, compared with the same period last year. Retail and lubricants volumes increased, while lower margin wholesale and Refining and Supply volumes decreased.
Refining and Supply contributed first quarter 2008 net earnings of $124 million, down from $134 million in the same quarter of 2007. Results reflected lower gasoline cracking margins, lower lubricants, petrochemical and asphalt margins, negative foreign exchange impacts and increased operating costs. Higher operating costs in the first quarter of 2008, compared with the prior year, were due to higher shutdown and maintenance costs as a result of advancing part of the planned Montreal refinery turnaround into the first quarter of 2008, the addition of environmental costs for the Quebec green levy and one-time items. These factors were partially offset by the positive impact from escalating crude oil feedstock costs while using a FIFO inventory valuation methodology, improved refinery yields and higher distillate cracking margins.
Marketing contributed first quarter 2008 net earnings of $60 million, up compared with $50 million in the same quarter of 2007. In the first quarter of 2008, Marketing results reflected higher fuel margins and increased sales volumes, partially offset by higher operating costs.
Downstream Turnaround Activity
No major turnarounds are planned at the Company’s Downstream facilities in the second quarter of 2008; however, in August, the Edmonton refinery is expected to begin its planned two-month turnaround to tie-in the refinery conversion project (RCP) and to complete routine maintenance on other units within the refinery. Increased expenses are expected to be about $20 million after-tax. Parts of the refinery will continue to operate under modified operations to limit the shortfall in light oil production. It is anticipated that production through this planned turnaround will be approximately 30% of normal levels over the 62-day duration. This means that the refining margin will be maintained on that volume, while the marketing margin will be retained on all sales volume. The Company intends to mitigate the impact of lost production on customers by drawing down pre-built inventory, entering time trades and purchasing additional finished product.
Edmonton Refinery Conversion Project
At the Edmonton refinery, the Company is investing to convert the facility to run oil sands-based feedstock. The refinery conversion project will enable Petro-Canada to directly upgrade up to 26,000 b/d of bitumen and process up to 48,000 b/d of sour synthetic crude oil, replacing the more expensive conventional light crude feedstock currently refined.
At the end of the first quarter of 2008, Petro-Canada had completed 79% of the construction and the project is now entering the ramp down phase. Approximately 94% of the estimated $2.2 billion in project costs were committed as at March 31, 2008. The project is anticipated to start up in the fourth quarter of 2008.
Change in Accounting for Inventory and Crude Oil and Product Purchases
On January 1, 2008, Petro-Canada adopted the “first-in, first-out” (FIFO) method for valuing its crude oil and refined product inventories. The change is due to the “last-in, first-out” (LIFO) method no longer being permitted under Canadian generally accepted accounting principles (GAAP). As a result of changing from the LIFO inventory costing method to FIFO, a one-time adjustment to increase inventories by $812 million, future income tax liabilities by $256 million and retained earnings by $556 million was recorded. This adjustment occurred on January 1, 2008 and increased the Company’s working capital and Downstream capital employed values. A second impact relates to reported cost of crude oil and product purchases. The change in methodology reflects historic crude oil prices at the time the crude oil is purchased. Reported operating revenues continue to reflect current market prices when the crude oil is refined and sold. As a result of the lag between when crude oil is purchased and when product is sold, and fluctuating crude oil prices, future reported Downstream earnings may be more volatile.
CORPORATE
| Shared Services and Eliminations | | Three months ended March 31, | |
| (millions of Canadian dollars) | | 2008 | | | 2007 | |
| Net loss | | $ | (5 | ) | | $ | (14 | ) |
| Cash flow from (used in) operating activities | | $ | 95 | | | $ | (34 | ) |
Shared Services and Eliminations recorded a net loss of $5 million in the first quarter of 2008, compared with a net loss of $14 million for the same period in 2007. The decrease in the net loss, compared with the first quarter of 2007, was due to a recovery related to the mark-to-market valuation of stock-based compensation, partially offset by a foreign currency translation loss on long-term debt. Net earnings in the first quarter of 2008 included a $68 million recovery related to the mark-to-market valuation of stock-based compensation and a $48 million foreign currency translation loss on long-term debt, compared with an $8 million recovery and a $16 million gain, respectively, in the first quarter of 2007.
Management's Discussion and Analysis
PETRO-CANADA
Interest expense was $48 million before-tax during the first quarter of 2008, up from $42 million in the first quarter of the prior year. The Company capitalized $13 million of interest expense during the quarter, compared with $6 million in the first quarter of 2007.
Cash flow from operating activities was affected by tax deferrals resulting from the Company’s upstream partnership. These deferrals decreased cash flow from operating activities by about $1 million in the quarter, compared with an increase of $10 million in the same period last year. On January 1, 2008, the Company adopted the FIFO costing method for valuing its Downstream inventories, which is consistent with the method prescribed for income tax purposes, thereby eliminating the difference in earnings and cash flow from operating activities.
LIQUIDITY AND CAPITAL RESOURCES
Summary of Cash Flows
| | | Three months ended March 31, | |
| (millions of Canadian dollars) | | 2008 | | | 2007 | |
| Cash flow from operating activities | | $ | 1,435 | | | $ | 1,166 | |
| Net cash (outflows) inflows from: | | | | | | | | |
Investing activities | | | (970 | ) | | | (710 | ) |
Financing activities | | | (434 | ) | | | (148 | ) |
| Increase in cash and cash equivalents | | | 31 | | | | 308 | |
| Cash and cash equivalents | | $ | 262 | | | $ | 807 | |
Petro-Canada’s financing strategy is designed to maintain financial strength and flexibility to support profitable growth in all business environments. Two key measures that Petro-Canada uses to measure the Company’s overall financial strength are debt-to-cash flow from operating activities and debt-to-debt plus equity. Petro-Canada’s debt-to-cash flow from operating activities ratio, a key short-term leverage measure, was 0.9 times at March 31, 2008. This was within the Company’s target range of no more than 2.0 times. Debt-to-debt plus equity, the long-term measure for capital structure, was 18.9% at March 31, 2008, below the Company’s target range of 25% to 35%.
| Financial Ratios | March 31, 2008 | December 31, 2007 | March 31, 2007 |
Debt-to-cash flow from operating activities (times) | 0.9 | 1.0 | 0.7 |
Debt-to-debt plus equity (%) | 18.9 | 22.5 | 20.1 |
Operating Activities
Excluding cash and cash equivalents, the current portion of long-term debt and short-term notes payable, the operating working capital surplus was $608 million at the end of the first quarter of 2008, compared with an operating working capital deficiency of $565 million at December 31, 2007. The working capital surplus primarily resulted from the adoption of the FIFO inventory valuation method in the Downstream, which increased inventory by $812 million.
Management's Discussion and Analysis
PETRO-CANADA
Investing Activities
| | | Three months ended March 31, | |
| (millions of Canadian dollars) | | 2008 | | | 2007 | |
| Upstream | | | | | | |
North American Natural Gas | | $ | 167 | | | $ | 205 | |
Oil Sands | | | 178 | | | | 90 | |
International & Offshore | | | | | | | | |
East Coast Canada | | | 38 | | | | 38 | |
International | | | 251 | | | | 157 | |
| | | | 634 | | | | 490 | |
| Downstream | | | | | | | | |
Refining and Supply | | | 352 | | | | 205 | |
Sales and Marketing | | | 23 | | | | 14 | |
Lubricants | | | 3 | | | | 2 | |
| | | | 378 | | | | 221 | |
| Shared Services | | | 4 | | | | 5 | |
| Total property, plant and equipment | | | | | | | | |
| and exploration | | | 1,016 | | | | 716 | |
| Other assets | | | – | | | | 17 | |
| Total | | $ | 1,016 | | | $ | 733 | |
Financing Activities
In the first quarter of 2008, Petro-Canada increased its syndicated committed credit facilities from $2,200 million to $3,570 million. At March 31, 2008, the Company’s available bilateral demand credit facilities totalled $1,519 million. A total of $970 million of the credit facilities was used for Bankers’ Acceptances, London Inter-Bank Offered Rate (LIBOR) loans, letters of credit and overdraft coverage. As at March 31, 2008, there was $300 million outstanding in Bankers’ Acceptances under the syndicated credit facilities and $431 million outstanding in Bankers’ Acceptances and LIBOR loans under the demand credit facilities. The syndicated facilities also may be used to provide liquidity support to a commercial paper program. No commercial paper was outstanding at March 31, 2008.
On March 31, 2008, Petro-Canada filed a final shelf prospectus for the offering of up to $4 billion US of debt securities with the securities commission or equivalent regulatory authority in each of the provinces and territories of Canada. On April 1, 2008, the same document was filed with the SEC. These filings will provide Petro-Canada with flexibility in issuing debt securities in one or more tranches over the next 25 months.
As at March 31, 2008, the Company’s unsecured long-term debt securities were rated Baa2 by Moody’s Investors Service, BBB by Standard & Poor’s and A (low) by Dominion Bond Rating Service. The Company’s long-term debt ratings remain unchanged from year-end 2007.
For 2008 and beyond, spending on future large projects may result in annual capital expenditures exceeding operating cash flow. The Company anticipates that additional funding requirements will be met by external financing and that additional financial leverage can be managed in the context of Petro-Canada’s target ranges.
Returning Cash to Shareholders
Petro-Canada’s priority uses of cash are to fund the capital program and profitable growth opportunities, and to return cash to shareholders through dividends and a share buyback program. Petro-Canada’s current NCIB program, which extends to June 21, 2008, entitles the Company to purchase up to 5% of its outstanding common shares, subject to certain conditions.
In the first quarter of 2008, the Company did not repurchase any of its shares, compared with 2.0 million repurchased in the first quarter of 2007. Future share repurchases will depend on excess cash available after consideration of the Company’s priority uses of cash.
| | Shares Repurchased | | | Average Price | | | Total Cost ($ millions) | |
| Period | 2008 | | | 2007 | | | 2008 | | | 2007 | | | 2008 | | | 2007 | |
| First quarter | | – | | | | 2,000,000 | | | $ | – | | | $ | 43.63 | | | $ | – | | | $ | 87 | |
Management's Discussion and Analysis
PETRO-CANADA
Contingent Liabilities and Contractual Obligations
Contractual obligations are summarized in the Company’s 2007 annual MD&A and contingent liabilities are disclosed in Note 24 of the 2007 annual Consolidated Financial Statements. Total contractual obligations at March 31, 2008 were $32.2 billion, which is relatively unchanged from December 31, 2007.
The Company has certain retail licensee agreements that qualify as variable interest entities as described in Note 25 to the 2007 annual Consolidated Financial Statements. These entities were not consolidated as Petro-Canada is not the primary beneficiary and the Company’s maximum exposure to losses from these arrangements was not expected to be material.
RISK
As at March 31, 2008, there were no material changes in the Company’s risks or risk management activities since December 31, 2007. Petro-Canada’s risk management activities are conducted in accordance with the policies and guidelines established by the Board of Directors. Readers should refer to Petro-Canada’s 2007 AIF and the risk management section of the 2007 annual MD&A for further discussion of risks relating to Petro-Canada’s business.
SHAREHOLDER INFORMATION
As at March 31, 2008, Petro-Canada’s outstanding common shares totalled 483.6 million and averaged 484.0 million during the first quarter of 2008. This figure compared with outstanding common shares of 495.8 million as at March 31, 2007 and average shares outstanding of 497.0 million for the quarter ended March 31, 2007.
Petro-Canada will hold a conference call to discuss these results with investors on Tuesday, April 29, 2008 at 9:00 a.m. eastern daylight time (EDT). To participate, please call 1-866-898-9626 (toll-free in North America), 00-800-8989-6323 (toll-free internationally), or 416-340-2216 at 8:55 a.m. EDT. Media are invited to listen to the call by dialing 1-866-540-8136 (toll-free in North America) or 416-340-8010. Media are invited to ask questions at the end of the call. A live audio broadcast of the conference call will be available on Petro-Canada's website at http://www.petro-canada.ca/en/investors/845.aspx on April 29, 2008 at 9:00 a.m. EDT. Those who are unable to listen to the call live may listen to a recording of the call approximately one hour after its completion by dialing 1-800-408-3053 (toll-free in North America) or 416-695-5800 (pass code number 3255820#). Approximately one hour after the call, a recording will be available on Petro-Canada’s website.
Management's Discussion and Analysis
PETRO-CANADA
SELECT UPSTREAM OPERATING DATA
March 31, 2008
| | Three months ended March 31, |
| | 2008 | 2007 |
| Before Royalties | | |
Crude oil and NGL production net (Mb/d) | | |
North American Natural Gas 1 | 13.1 | 12.4 |
| Oil Sands | 55.5 | 59.7 |
| International & Offshore | | |
| East Coast Canada | 92.1 | 97.3 |
| International | | |
| North Sea | 97.4 | 64.5 |
| Other International | 49.8 | 46.5 |
| | 307.9 | 280.4 |
Natural gas production net, excluding injectants (MMcf/d) | | |
North American Natural Gas 1 | 586 | 605 |
| International | | |
| North Sea | 58 | 68 |
| Other International | 68 | 75 |
| | 712 | 748 |
Total production (Mboe/d) net before royalties 2 | 427 | 405 |
| After Royalties | | |
Crude oil and NGL production net (Mb/d) | | |
North American Natural Gas 1 | 10.0 | 9.5 |
| Oil Sands | 50.6 | 55.2 |
| International & Offshore | | |
| East Coast Canada | 72.1 | 87.2 |
| International | | |
| North Sea | 97.4 | 64.5 |
| Other International | 45.8 | 41.3 |
| | 275.9 | 257.7 |
Natural gas production net, excluding injectants (MMcf/d) | | |
North American Natural Gas 1 | 466 | 477 |
| International | | |
| North Sea | 58 | 68 |
| Other International | 68 | 75 |
| | 592 | 620 |
Total production (Mboe/d) net after royalties 2 | 375 | 361 |
| 1 | North American Natural Gas included Western Canada and U.S. Rockies. |
| 2 | Natural gas converted at six Mcf of natural gas to one bbl of oil. |
Management's Discussion and Analysis
PETRO-CANADA
AVERAGE UPSTREAM PRICE REALIZED
March 31, 2008
| | | Three months ended March 31, | |
| | | 2008 | | | 2007 | |
Crude oil and NGL ($/bbl) | | | | | | |
North American Natural Gas 1 | | | 89.23 | | | | 58.04 | |
| Oil Sands | | | 80.61 | | | | 52.69 | |
| International & Offshore | | | | | | | | |
| East Coast Canada | | | 97.70 | | | | 65.76 | |
| International | | | | | | | | |
North Sea | | | 94.31 | | | | 66.67 | |
| Other International | | | 99.13 | | | | 66.68 | |
| Total crude oil and NGL | | | 93.38 | | | | 62.98 | |
Natural gas ($/Mcf) | | | | | | | | |
North American Natural Gas 1 | | | 7.51 | | | | 7.39 | |
| International | | | | | | | | |
| North Sea | | | 10.77 | | | | 8.56 | |
| Other International | | | 4.95 | | | | 4.89 | |
| Total natural gas | | | 7.59 | | | | 7.32 | |
| 1 | North American Natural Gas included Western Canada and the U.S. Rockies. |
EFFECTIVE ROYALTY RATES
March 31, 2008
| | | Three months ended March 31, | |
| (% of sales revenues) | | 2008 | | | 2007 | |
| North American Natural Gas | | | 21 | % | | | 21 | % |
| Oil Sands | | | 9 | % | | | 8 | % |
| International & Offshore | | | | | | | | |
| East Coast Canada | | | 22 | % | | | 10 | % |
| International | | | | | | | | |
| North Sea | | | – | | | | – | |
| Other International | | | 7 | % | | | 9 | % |
| Total | | | 12 | % | | | 11 | % |
Management's Discussion and Analysis
PETRO-CANADA
SELECT DOWNSTREAM OPERATING DATA
March 31, 2008
| | Three months ended March 31, | |
| | 2008 | | | 2007 | |
Petroleum product sales (thousands of cubic metres/day – m3/d) | | | | | |
| Gasoline | | | | | |
Eastern Canada | | 12.8 | | | | 13.2 | |
Western Canada | | 10.8 | | | | 9.6 | |
| | | 23.6 | | | | 22.8 | |
| Distillates | | | | | | | |
Eastern Canada | | 8.9 | | | | 10.0 | |
Western Canada | | 10.8 | | | | 12.7 | |
| | | 19.7 | | | | 22.7 | |
| Other, including petrochemicals | | 8.9 | | | | 7.5 | |
| Total petroleum product sales | | 52.2 | | | | 53.0 | |
Crude oil processed by Petro-Canada (thousands of m3/d) | | | | | | | |
Eastern Canada | | 19.7 | | | | 19.4 | |
Western Canada | | 21.1 | | | | 19.5 | |
| Total crude oil processed by Petro-Canada | | 40.8 | | | | 38.9 | |
Average refinery utilization (%) | | 101 | | | | 96 | |
Downstream net earnings after-tax (cents/litre) | | 3.9 | | | | 3.8 | |
AVERAGE DOWNSTREAM PRICES
March 31, 2008
| | Three months ended March 31, | |
| | 2008 | | | 2007 | |
Rack prices (Canadian cents per litre) | | | | | |
| Gasoline | | | | | |
Eastern Canada | | 70.82 | | | | 58.48 | |
Western Canada | | 70.15 | | | | 56.93 | |
| Distillates | | | | | | | |
Eastern Canada | | 81.62 | | | | 59.55 | |
Western Canada | | 80.61 | | | | 64.48 | |
Pump prices (Canadian cents per litre, excluding taxes) | | | | | | | |
| Gasoline | | | | | | | |
Eastern Canada | | 76.23 | | | | 59.94 | |
Western Canada | | 80.02 | | | | 68.11 | |
Management's Discussion and Analysis
PETRO-CANADA
March 31, 2008
| | Three months ended March 31, | |
| | 2008 | | | 2007 | |
Weighted-average common shares outstanding (millions) | | 484.0 | | | | 497.0 | |
Weighted-average diluted common shares outstanding (millions) | | 488.0 | | | | 502.0 | |
Net earnings – basic ($/share) | | 2.22 | | | | 1.19 | |
– diluted ($/share) | | 2.20 | | | | 1.18 | |
Cash flow from operating activities ($/share) | | 2.96 | | | | 2.35 | |
Dividends ($/share) | | 0.13 | | | | 0.13 | |
| Toronto Stock Exchange: | | | | | | | |
Share price 1 – High | | 55.35 | | | | 47.56 | |
– Low | | 42.77 | | | | 41.02 | |
– Close at March 31 | | 44.72 | | | | 45.15 | |
Shares traded (millions) | | 155.9 | | | | 163.3 | |
| New York Stock Exchange: | | | | | | | |
Share price 2 – High | | 55.99 | | | | 40.03 | |
– Low | | 41.95 | | | | 34.91 | |
– Close at March 31 | | 43.41 | | | | 39.21 | |
Shares traded (millions) | | 86.0 | | | | 43.9 | |
| 1 | Share price is in Canadian dollars and represents the closing price. |
| 2 | Share price is in U.S. dollars and represents the closing price. |
SELECT FINANCIAL DATA
March 31, 2008
(unaudited, millions of Canadian dollars)
| | Three months ended March 31, | |
| | 2008 | | | 2007 | |
| | | | | | |
| Net earnings (loss) | | | | | |
| Upstream | | | | | |
| North American Natural Gas | $ | 74 | | | $ | 112 | |
| Oil Sands | | 112 | | | | 43 | |
| International & Offshore | | | | | | | |
| East Coast Canada | | 375 | | | | 256 | |
| International | | 336 | | | | 9 | |
| Downstream | | 184 | | | | 184 | |
| Shared Services | | (5 | ) | | | (14 | ) |
| Net earnings | $ | 1,076 | | | $ | 590 | |
| | | | | | | | |
| Cash flow from operating activities | $ | 1,435 | | | $ | 1,166 | |
| | | | | | | | |
| Average capital employed | | | | | | | |
| Upstream | $ | 9,103 | | | $ | 8,040 | |
| Downstream | | 5,862 | | | | 4,437 | |
| Shared Services | | 275 | | | | 429 | |
| Total Company | $ | 15,240 | | | $ | 12,906 | |
| | | | | | | | |
Return on capital employed (%) | | | | | | | |
| Upstream | | 28.4 | | | | 21.5 | |
| Downstream | | 10.7 | | | | 13.1 | |
| Total Company | | 21.9 | | | | 17.3 | |
| | | | | | | | |
Return on equity (%) | | 26.2 | | | | 21.1 | |
| | | | | | | | |
| Debt | $ | 3,176 | | | $ | 2,751 | |
| Cash and cash equivalents | $ | 262 | | | $ | 807 | |
Debt-to-cash flow from operating activities (times) | | 0.9 | | | | 0.7 | |
Debt-to-debt plus equity (%) | | 18.9 | | | | 20.1 | |
| | | | | | | | |
CONSOLIDATED STATEMENT OF EARNINGS (unaudited)
For the periods ended March 31
(millions of Canadian dollars, except per share amounts)
| | Three months ended March 31, | |
| | 2008 | | | 2007 | |
| | | | | | |
| Revenue | | | | | |
| Operating | $ | 6,617 | | | $ | 4,867 | |
Investment and other income (expense) (Note 4) | | (31 | ) | | | (26 | ) |
| | | 6,586 | | | | 4,841 | |
| Expenses | | | | | | | |
| Crude oil and product purchases | | 2,963 | | | | 2,308 | |
| Operating, marketing and general | | 843 | | | | 827 | |
| Exploration | | 143 | | | | 142 | |
| Depreciation, depletion and amortization | | 523 | | | | 441 | |
Unrealized (gain) loss on translation of foreign currency denominated long-term debt | | 55 | | | | (17 | ) |
| Interest | | 48 | | | | 42 | |
| | | 4,575 | | | | 3,743 | |
| | | | | | | | |
| Earnings before income taxes | | 2,011 | | | | 1,098 | |
| | | | | | | | |
| Provision for income taxes | | | | | | | |
| Current | | 844 | | | | 491 | |
| Future | | 91 | | | | 17 | |
| | | 935 | | | | 508 | |
| | | | | | | | |
| Net earnings | $ | 1,076 | | | $ | 590 | |
| | | | | | | | |
Earnings per share (Note 5) | | | | | | | |
| Basic | $ | 2.22 | | | $ | 1.19 | |
| Diluted | $ | 2.20 | | | $ | 1.18 | |
CONSOLIDATED STATEMENT OF COMPREHENSIVE INCOME (unaudited)
For the periods ended March 31
(millions of Canadian dollars)
| | Three months ended March 31, | |
| | 2008 | | | 2007 | |
| | | | | | |
| Net earnings | $ | 1,076 | | | $ | 590 | |
| Other comprehensive income, net of tax | | | | | | | |
| Change in foreign currency translation adjustment | | 207 | | | | 7 | |
| Comprehensive income | $ | 1,283 | | | $ | 597 | |
| | See accompanying Notes to Consolidated Financial Statements |
CONSOLIDATED STATEMENT OF CASH FLOWS (unaudited) |
For the periods ended March 31
(millions of Canadian dollars)
| | Three months ended March 31, | |
| | 2008 | | | 2007 | |
| | | | | | |
| Operating activities | | | | | |
| Net earnings | $ | 1,076 | | | $ | 590 | |
| Items not affecting cash flow from operating activities: | | | | | | | |
| Depreciation, depletion and amortization | | 523 | | | | 441 | |
| Future income taxes | | 91 | | | | 17 | |
| Accretion of asset retirement obligations | | 19 | | | | 17 | |
| Unrealized (gain) loss on translation of foreign currency denominated long-term debt | | 55 | | | | (17 | ) |
Gain on sale of assets (Note 4) | | (4 | ) | | | (62 | ) |
Unrealized losses related to Buzzard derivative contracts (Note 4) | | - | | | | 88 | |
| Other | | 11 | | | | - | |
| Exploration expenses | | 81 | | | | 92 | |
| Increase in non-cash working capital related to operating activities | | (417 | ) | | | - | |
| Cash flow from operating activities | | 1,435 | | | | 1,166 | |
| | | | | | | | |
| Investing activities | | | | | | | |
| Expenditures on property, plant and equipment and exploration | | (1,016 | ) | | | (716 | ) |
| Proceeds from sale of assets | | 12 | | | | 82 | |
| Increase in other assets | | - | | | | (17 | ) |
| (Increase) decrease in non-cash working capital related to investing activities | | 34 | | | | (59 | ) |
| Cash flow used in investing activities | | (970 | ) | | | (710 | ) |
| | | | | | | | |
| Financing activities | | | | | | | |
Increase in short-term notes payable (Note 6) | | 322 | | | | - | |
Repayment of long-term debt (Note 6) | | (696 | ) | | | (2 | ) |
Proceeds from issue of common shares (Note 7) | | 3 | | | | 6 | |
Purchase of common shares (Note 7) | | - | | | | (87 | ) |
| Dividends on common shares | | (63 | ) | | | (65 | ) |
| Cash flow used in financing activities | | (434 | ) | | | (148 | ) |
| | | | | | | | |
| Increase in cash and cash equivalents | | 31 | | | | 308 | |
| Cash and cash equivalents at beginning of period | | 231 | | | | 499 | |
| Cash and cash equivalents at end of period | $ | 262 | | | $ | 807 | |
| | See accompanying Notes to Consolidated Financial Statements |
CONSOLIDATED BALANCE SHEET (unaudited)
As at March 31, 2008
(millions of Canadian dollars)
| | March 31, 2008 | | | December 31, 2007 | |
| Assets | | | | | |
| Current assets | | | | | |
| Cash and cash equivalents | $ | 262 | | | $ | 231 | |
| Accounts receivable | | 2,608 | | | | 1,973 | |
| Income taxes receivable | | - | | | | 280 | |
Inventories (Note 3) | | 1,856 | | | | 668 | |
| Future income taxes | | 24 | | | | 26 | |
| | | 4,750 | | | | 3,178 | |
| | | | | | | | |
| Property, plant and equipment, net | | 20,145 | | | | 19,497 | |
| Goodwill | | 809 | | | | 731 | |
| Other assets | | 425 | | | | 446 | |
| | $ | 26,129 | | | $ | 23,852 | |
| | | | | | | | |
| Liabilities and shareholders' equity | | | | | | | |
| Current liabilities | | | | | | | |
| Accounts payable and accrued liabilities | $ | 3,802 | | | $ | 3,512 | |
| Income taxes payable | | 78 | | | | - | |
Short-term notes payable (Note 6) | | 431 | | | | 109 | |
| Current portion of long-term debt | | 2 | | | | 2 | |
| | | 4,313 | | | | 3,623 | |
| | | | | | | | |
Long-term debt (Note 6) | | 2,743 | | | | 3,339 | |
| Other liabilities | | 683 | | | | 717 | |
| Asset retirement obligations | | 1,267 | | | | 1,234 | |
Future income taxes (Note 3) | | 3,474 | | | | 3,069 | |
| | | | | | | | |
| Shareholders' equity | | | | | | | |
Common shares (Note 7) | | 1,368 | | | | 1,365 | |
Contributed surplus (Note 7) | | 24 | | | | 24 | |
| Retained earnings | | 12,261 | | | | 10,692 | |
| Accumulated other comprehensive income | | | | | | | |
| Foreign currency translation adjustment | | (4 | ) | | | (211 | ) |
| | | 13,649 | | | | 11,870 | |
| | $ | 26,129 | | | $ | 23,852 | |
CONSOLIDATED STATEMENT OF RETAINED EARNINGS (unaudited)
For the periods ended March 31
(millions of Canadian dollars)
| | Three months ended March 31, | |
| | 2008 | | | 2007 | |
| | | | | | |
| Retained earnings at beginning of period | $ | 10,692 | | | $ | 8,565 | |
Cumulative effect of adopting new accounting standards (Note 3) | | 556 | | | | - | |
| Net earnings | | 1,076 | | | | 590 | |
| Dividends on common shares | | (63 | ) | | | (65 | ) |
| Retained earnings at end of period | $ | 12,261 | | | $ | 9,090 | |
| | See accompanying Notes to Consolidated Financial Statements |
NOTES TO CONSOLIDATED FINANCIAL STATEMENTS (unaudited)
(millions of Canadian dollars)
1. SEGMENTED INFORMATION FROM OPERATIONS
Three months ended March 31,
| | | Upstream | | | | | | | | | | | | | | | | | |
| | | | | | | | | | | International & Offshore | | | | | | | | | | | | | | | | | |
| | | North American Natural Gas | | Oil Sands | | East Coast Canada | | International | | Downstream | | Shared Services | | Eliminations 4 | | Consolidated | |
| | | | | | | | | | | | | | | | | | | | | | | | | | | | | | | | | | |
| | | 2008 | | 2007 | | 2008 | | 2007 | | 2008 | | 2007 | | 2008 | | 2007 | | 2008 | | 2007 | | 2008 | | 2007 | | 2008 | | 2007 | | 2008 | | 2007 | |
| | | | | | | | | | | | | | | | | | | | | | | | | | | | | | | | | | |
| Revenue | | | | | | | | | | | | | | | | | | | | | | | | | | | | | | | | | |
| Sales to customers | | $ | 430 | | $ | 349 | | $ | 345 | | $ | 166 | | $ | 682 | | $ | 601 | | $ | 1,394 | | $ | 664 | | $ | 3,766 | | $ | 3,087 | | $ | - | | $ | - | | $ | - | | $ | - | | $ | 6,617 | | $ | 4,867 | |
Investment and other income (expense) 1 | | | 3 | | | 61 | | | 2 | | | (2 | ) | | 1 | | | - | | | (31 | ) | | (90 | ) | | (8 | ) | | (3 | ) | | 2 | | | 8 | | | - | | | - | | | (31 | ) | | (26 | ) |
| Inter-segment sales | | | 99 | | | 85 | | | 297 | | | 222 | | | 204 | | | 129 | | | - | | | - | | | 4 | | | 4 | | | - | | | - | | | (604 | ) | | (440 | ) | | - | | | - | |
| Segmented revenue | | | 532 | | | 495 | | | 644 | | | 386 | | | 887 | | | 730 | | | 1,363 | | | 574 | | | 3,762 | | | 3,088 | | | 2 | | | 8 | | | (604 | ) | | (440 | ) | | 6,586 | | | 4,841 | |
| Expenses | | | | | | | | | | | | | | | | | | | | | | | | | | | | | | | | | | | | | | | | | | | | | | | | | |
Crude oil and product purchases2 | | | 93 | | | 41 | | | 248 | | | 130 | | | 188 | | | 176 | | | - | | | - | | | 2,439 | | | 1,958 | | | - | | | - | | | (5 | ) | | 3 | | | 2,963 | | | 2,308 | |
| Inter-segment transactions | | | 2 | | | 2 | | | 8 | | | 4 | | | 2 | | | 2 | | | - | | | - | | | 592 | | | 432 | | | - | | | - | | | (604 | ) | | (440 | ) | | - | | | - | |
| Operating, marketing and general | | | 128 | | | 124 | | | 204 | | | 131 | | | 57 | | | 59 | | | 130 | | | 162 | | | 404 | | | 352 | | | (80 | ) | | (1 | ) | | - | | | - | | | 843 | | | 827 | |
| Exploration | | | 50 | | | 56 | | | 5 | | | 19 | | | - | | | 4 | | | 88 | | | 63 | | | - | | | - | | | - | | | - | | | - | | | - | | | 143 | | | 142 | |
| Depreciation, depletion and amortization | | | 154 | | | 108 | | | 27 | | | 39 | | | 97 | | | 103 | | | 170 | | | 118 | | | 75 | | | 69 | | | - | | | 4 | | | - | | | - | | | 523 | | | 441 | |
| Unrealized (gain) loss on translation of foreign currency denominated long-term debt | | | - | | | - | | | - | | | - | | | - | | | - | | | - | | | - | | | - | | | - | | | 55 | | | (17 | ) | | - | | | - | | | 55 | | | (17 | ) |
| Interest | | | - | | | - | | | - | | | - | | | - | | | - | | | - | | | - | | | - | | | - | | | 48 | | | 42 | | | - | | | - | | | 48 | | | 42 | |
| | | | 427 | | | 331 | | | 492 | | | 323 | | | 344 | | | 344 | | | 388 | | | 343 | | | 3,510 | | | 2,811 | | | 23 | | | 28 | | | (609 | ) | | (437 | ) | | 4,575 | | | 3,743 | |
| Earnings (loss) before income taxes | | | 105 | | | 164 | | | 152 | | | 63 | | | 543 | | | 386 | | | 975 | | | 231 | | | 252 | | | 277 | | | (21 | ) | | (20 | ) | | 5 | | | (3 | ) | | 2,011 | | | 1,098 | |
| Provision for income taxes | | | | | | | | | | | | | | | | | | | | | | | | | | | | | | | | | | | | | | | | | | | | | | |
| Current | | | 27 | | | 61 | | | 15 | | | 6 | | | 177 | | | 138 | | | 647 | | | 258 | | | 23 | | | 56 | | | (47 | ) | | (27 | ) | | 2 | | | (1 | ) | | 844 | | | 491 | |
| Future | | | 4 | | | (9 | ) | | 25 | | | 14 | | | (9 | ) | | (8 | ) | | (8 | ) | | (36 | ) | | 45 | | | 37 | | | 34 | | | 19 | | | - | | | - | | | 91 | | | 17 | |
| | | | 31 | | | 52 | | | 40 | | | 20 | | | 168 | | | 130 | | | 639 | | | 222 | | | 68 | | | 93 | | | (13 | ) | | (8 | ) | | 2 | | | (1 | ) | | 935 | | | 508 | |
| Net earnings (loss) | | $ | 74 | | $ | 112 | | $ | 112 | | $ | 43 | | $ | 375 | | $ | 256 | | $ | 336 | | $ | 9 | | $ | 184 | | $ | 184 | | $ | (8 | ) | $ | (12 | ) | $ | 3 | | $ | (2 | ) | $ | 1,076 | | $ | 590 | |
Expenditures on property, plant and equipment and exploration 3 | | $ | 167 | | $ | 205 | | $ | 178 | | $ | 90 | | $ | 38 | | $ | 38 | | $ | 251 | | $ | 157 | | $ | 378 | | $ | 221 | | $ | 4 | | $ | 5 | | $ | - | | $ | - | | $ | 1,016 | | $ | 716 | |
| Cash flow from (used in) operating activities | | $ | 199 | | $ | 159 | | $ | 166 | | $ | 69 | | $ | 485 | | $ | 481 | | $ | 506 | | $ | 277 | | $ | (16 | ) | $ | 214 | | $ | 95 | | $ | (34 | ) | $ | - | | $ | - | | $ | 1,435 | | $ | 1,166 | |
| Total assets | | $ | 4,179 | | $ | 4,121 | | $ | 3,936 | | $ | 2,967 | | $ | 2,352 | | $ | 2,327 | | $ | 6,058 | | $ | 6,220 | | $ | 9,677 | | $ | 6,894 | | $ | 37 | | $ | 523 | | $ | (110 | ) | $ | (2 | ) | $ | 26,129 | | $ | 23,050 | |
| 1 | Investment and other income (expense) for the International segment includes unrealized losses related to the Buzzard derivative contracts of $nil for the three months ended March 31, 2008 ($88 million for the three months ended March 31, 2007) (Note 4). |
| 2 | Downstream crude oil and product purchases accounts for substantially all of the Downstream inventories recognized as an expense during the period. |
| 3 | Consolidated expenditures include capitalized interest in the amount of $13 million for the three months ended March 31, 2008 ($6 million for the three months ended March 31, 2007). |
| 4 | Eliminations relate to sales between segments recorded at transfer prices based on current market prices, and to unrealized inter-segment profits in inventories. Prior period figures have been reclassified to conform to the current period’s presentation. |
NOTES TO CONSOLIDATED FINANCIAL STATEMENTS (unaudited)
| (millions of Canadian dollars, unless otherwise stated) |
The note disclosure requirements for annual financial statements provide additional disclosure to that required for interim financial statements. Accordingly, these interim Consolidated Financial Statements should be read in conjunction with the December 31, 2007 audited Consolidated Financial Statements. The interim Consolidated Financial Statements are presented in accordance with Canadian generally accepted accounting principles and follow the accounting policies summarized in the notes to the annual Consolidated Financial Statements, except for changes as described in Note 3.
| 3. | CHANGES IN ACCOUNTING POLICIES |
The Company adopted Canadian Institute of Chartered Accountants (CICA) Handbook Section 1535, Capital Disclosures; Section 3031, Inventories; Section 3862, Financial Instruments – Disclosures; and Section 3863, Financial Instruments – Presentation on January 1, 2008.
As a result of adopting CICA Section 1535, Capital Disclosures, the Company now discloses details about its capital management (Note 10).
As a result of adopting CICA Section 3031, Inventories, the Company now assigns costs to its crude oil and refined petroleum products inventories on a “first-in, first-out” (FIFO) basis. Previously, costs were assigned to these inventories on a “last-in, first-out” (LIFO) basis. In accordance with the transitional provisions of this new accounting standard, the Company has elected to adjust 2008 opening retained earnings by the difference in the measurement of 2008 opening inventory and not restate prior period amounts. As such, the following balance sheet categories were impacted on January 1, 2008:
| | Increase | |
| Inventories | $ | 812 | |
| Future income taxes liability | | 256 | |
| Retained earnings | | 556 | |
As a result of adopting CICA Section 3862, Financial Instruments – Disclosures, the Company has expanded its financial risks and financial instruments disclosures (Note 11).
There is no other material impact on the Consolidated Financial Statements from adoption of these new standards.
| 4. | INVESTMENT AND OTHER INCOME (EXPENSE) |
Investment and other income (expense) for the three months ended March 31, 2008 included foreign exchange losses of $22 million and losses on Downstream derivative contracts of $13 million, which were partially offset by net gains on sales of assets of $4 million. For the three months ended March 31, 2007, investment and other income (expense) included unrealized losses related to the Buzzard derivative contracts of $88 million, partially offset by net gains on sales of assets of $62 million.
| | The following table provides the number of common shares used in calculating earnings per share amounts: |
| | Three months ended March 31, | |
| (millions) | 2008 | | | 2007 | |
| Weighted-average number of common shares outstanding – basic | | 484.0 | | | | 497.0 | |
| Effect of dilutive stock options | | 4.0 | | | | 5.0 | |
| Weighted-average number of common shares outstanding – diluted | | 488.0 | | | | 502.0 | |
NOTES TO CONSOLIDATED FINANCIAL STATEMENTS (unaudited)
| (millions of Canadian dollars, unless otherwise stated) |
| | Maturity | | March 31, 2008 | | December 31, 2007 | |
Debentures and notes 5.95% unsecured senior notes ($600 million US) | 2035 | | $ | 601 | | $ | 577 | |
5.35% unsecured senior notes ($300 million US) | 2033 | | | 260 | | | 248 | |
7.00% unsecured debentures ($250 million US) | 2028 | | | 247 | | | 237 | |
7.875% unsecured debentures ($275 million US) | 2026 | | | 278 | | | 267 | |
9.25% unsecured debentures ($300 million US) | 2021 | | | 306 | | | 294 | |
5.00% unsecured senior notes ($400 million US) | 2014 | | | 407 | | | 391 | |
4.00% unsecured senior notes ($300 million US) | 2013 | | | 288 | | | 275 | |
| Syndicated credit facilities | 2012 | | | 300 | | | 995 | |
| Capital leases | 2008-2022 | | | 58 | | | 57 | |
| | | | | 2,745 | | | 3,341 | |
| Current portion | | | | (2 | ) | | (2 | ) |
| | | | $ | 2,743 | | $ | 3,339 | |
At March 31, 2008, the Company had in place revolving, committed syndicated credit facilities totaling $3,570 million (December 31, 2007 - $2,200 million) which mature in 2012 and revolving bilateral demand credit facilities of $1,519 million (December 31, 2007 - $1,500 million). At March 31, 2008, a total of $970 million of the credit facilities was used for Bankers’ Acceptances, London Inter-Bank Offered Rate (LIBOR) loans, letters of credit and overdraft coverage.
At March 31, 2008, the Company had drawn on its syndicated credit facilities for $300 million (December 31, 2007 - $995 million) in the form of Canadian dollar Bankers’ Acceptances and on its demand credit facilities for $363 million (December 31, 2007 - $109 million) and $68 million (December 31, 2007 - $nil) in the form of Canadian dollar Bankers’ Acceptances and LIBOR loans, respectively. The weighted-average interest rate for Bankers’ Acceptances outstanding was 4.11% for the syndicated credit facilities and 4.15% for the demand credit facilities. The weighted-average interest rate for the LIBOR loans was 5.14%. These interest rates are fixed over the terms of Bankers' Acceptances and LIBOR loans, all of which are 30 days or less.
On March 31, 2008, the Company filed a final shelf prospectus for the offering of up to $4 billion US of debt securities with the securities commission or equivalent regulatory authority in each of the provinces and territories of Canada. On April 1, 2008, the same was filed with the United States Securities and Exchange Commission. No debt has been issued to date.
Changes in common shares and contributed surplus were as follows:
| | Shares | | Amount | | Contributed Surplus | |
| Balance at December 31, 2007 | | 483,459,119 | | | 1,365 | | | 24 | |
| Issued under employee stock option and share purchase plans | | 180,633 | | | 3 | | | - | |
| Repurchased under normal course issuer bid | | - | | | - | | | - | |
| Balance at March 31, 2008 | | 483,639,752 | | | 1,368 | | | 24 | |
The Company has in place a normal course issuer bid (NCIB) program for the repurchase of its outstanding common shares. This program was renewed in June 2007 to repurchase up to 25 million outstanding common shares during the period from June 22, 2007 to June 21, 2008, subject to certain conditions. During the three months ended March 31, 2008, the Company did not repurchase any common shares. For the three months ended March 31, 2007, the Company repurchased 2,000,000 common shares at a cost of $87 million. The excess of the purchase price over the carrying amount of the shares repurchased was recorded as an $81 million reduction of contributed surplus.
NOTES TO CONSOLIDATED FINANCIAL STATEMENTS (unaudited)
| (millions of Canadian dollars, unless otherwise stated) |
| 8. | STOCK-BASED COMPENSATION |
The total stock-based compensation recovery recorded was $97 million for the three months ended March 31, 2008 ($14 million for the three months ended March 31, 2007).
(a) Stock Options and Performance Share Units (PSUs)
Changes in the number of outstanding stock options and PSUs were as follows:
| | Stock Options | | PSUs | |
| | Number | | | Weighted-Average Exercise Price | | Number | |
| Balance at December 31, 2007 | | 21,035,064 | | | | 34 | | | 1,166,044 | |
| Granted | | 3,452,700 | | | | 47 | | | 237,288 | |
| Exercised for common shares | | (180,633 | ) | | | 17 | | | n/a | |
| Surrendered for cash payment | | (90,625 | ) | | | 31 | | | n/a | |
| Cancelled/Expired | | (35,360 | ) | | | 46 | | | (584,139 | ) |
| Balance at March 31, 2008 | | 24,181,146 | | | | 36 | | | 819,193 | |
| (b) | Stock Appreciation Rights (SARs) |
Changes in the number of outstanding SARs were as follows:
| | SARs | |
| | Number | | | Weighted-Average Exercise Price | |
| Balance at December 31, 2007 | | 3,659,450 | | | | 44 | |
| Granted | | 3,912,480 | | | | 47 | |
| Exercised | | (11,255 | ) | | | 44 | |
| Cancelled | | (63,754 | ) | | | 46 | |
| Balance at March 31, 2008 | | 7,496,921 | | | | 46 | |
NOTES TO CONSOLIDATED FINANCIAL STATEMENTS (unaudited)
| (millions of Canadian dollars, unless otherwise stated) |
| 9. | EMPLOYEE FUTURE BENEFITS |
The Company maintains pension plans with defined benefit and defined contribution provisions and provides certain health care and life insurance benefits to its qualifying retirees. The expenses associated with these plans are as follows:
| | Three months ended March 31, | |
| | 2008 | | 2007 | |
| Pension Plans: | | | | |
| Defined benefit plans | | | | |
Employer current service cost | $ | 11 | | $ | 10 | |
Interest cost | | 23 | | | 22 | |
Expected return on plan assets | | (28 | ) | | (28 | ) |
Amortization of transitional asset | | (1 | ) | | (1 | ) |
Amortization of net actuarial losses | | 12 | | | 11 | |
| | | 17 | | | 14 | |
| | | | | | | |
| Defined contribution plans | | 5 | | | 4 | |
| | $ | 22 | | $ | 18 | |
| | | | | | | |
| Other post-retirement plans: | | | | | | |
Employer current service cost | $ | 1 | | $ | 1 | |
Interest cost | | 3 | | | 3 | |
Amortization of transitional obligation | | 1 | | | 1 | |
Amortization of net actuarial losses | | 1 | | | 1 | |
| | $ | 6 | | $ | 6 | |
The Company expects to contribute $58 million to its pension plans in 2008.
The Company’s capital management strategy is designed to maintain financial strength and flexibility to support profitable growth in all business environments. The Company’s capital consists of debt, which is comprised of long-term debt and short-term notes payable, and shareholders’ equity. The Company measures financial strength and flexibility using two key measures: debt-to-cash flow from operating activities, the key short-term measure, and debt-to-debt plus equity, the key long-term measure. These are calculated as follows:
| | March 31, 2008 | | December 31, 2007 | |
| Long-term debt (non-current portion) | $ | 2,743 | | $ | 3,339 | |
| Add: Current portion of long-term debt | | 2 | | | 2 | |
| Total long-term debt | | 2,745 | | | 3,341 | |
| Add: Short-term notes payable | | 431 | | | 109 | |
| Debt (A) | $ | 3,176 | | $ | 3,450 | |
| Shareholders’ equity | | 13,649 | | | 11,870 | |
| Debt plus equity (B) | $ | 16,825 | | $ | 15,320 | |
| | | | | | | |
Cash flow from operating activities (C)1 | $ | 3,608 | | $ | 3,339 | |
| | | | | | | |
Debt-to-cash flow from operating activities (A/C) (times) | | 0.9 | | | 1.0 | |
Debt-to-debt plus equity (A/B) (%) | | 18.9 | | | 22.5 | |
| 1 | Cash flow from operating activities is on a 12-month rolling basis. |
At March 31, 2008, the debt-to-cash flow from operating activities ratio was within the Company's target range of no more than 2.0 times. Debt-to-debt plus equity was below the target range of 25% to 35%, providing the financial flexibility to fund the Company's capital program and profitable growth opportunities. The Company may exceed target ranges for short periods of time, but always with the goal to return back within the target ranges.
NOTES TO CONSOLIDATED FINANCIAL STATEMENTS (unaudited)
| (millions of Canadian dollars, unless otherwise stated) |
10. CAPITAL MANAGEMENT, continued |
Financial covenants associated with the Company's various bank and debt arrangements are reviewed regularly and controls are in place to maintain compliance with these covenants. The Company complied with all covenants for the three months ended March 31, 2008.
The Company’s priority uses of cash are to fund the capital program and profitable growth opportunities, and then to return cash to shareholders through dividends and a share buyback program.
The Company regularly reviews its dividend strategy to ensure the alignment of the dividend policy with shareholder expectations, and financial and growth objectives. The Company renewed its NCIB program for the repurchase of its common shares from June 22, 2007 to June 21, 2008, entitling the Company to purchase up to 5% of its outstanding common shares, subject to certain conditions (Note 7). Due to an increasing capital program, share buybacks are expected to be lower in this and future years, compared with 2006 and 2007.
The Company’s capital management strategy has not changed from the prior period.
| 11. FINANCIAL RISKS AND FINANCIAL INSTRUMENTS |
Financial Risks
The Company is exposed to a number of financial risks in the normal course of its business operations, including market risks resulting from fluctuations in commodity prices, interest rates and foreign currency exchange rates, as well as credit risks and liquidity risks. The nature of the financial risks and the Company's strategy for managing these risks has not changed significantly from the prior period.
(a) Market Risks
The Company monitors its exposure to market fluctuations and may use derivative contracts to manage these risks, as it considers appropriate. The Company does not use derivative contracts for speculative purposes.
Commodity Price Risk
The Company is exposed to commodity price risk as fluctuations in crude oil or natural gas prices could have a materially adverse effect on its financial condition, as well as on the value and amount of the Company’s reserves. Prices for crude oil and natural gas fluctuate in response to changes in supply and demand, market uncertainty and a variety of other factors beyond the Company’s control.
The margins realized for the Company’s refined products are also affected by factors such as crude oil price fluctuations due to the impact on refinery feedstock costs, third-party refined product purchases and the demand for refined petroleum products. The Company’s ability to maintain product margins in an environment of higher feedstock costs depends on its ability to pass higher costs on to customers. The Company enters into derivative contracts to reduce exposure in its Downstream operations to these margin fluctuations, including margins on fixed-price product sales, and short-term price fluctuations on the purchase of foreign and domestic crude oil and refined petroleum products. The Company’s exposure to these margin fluctuations is limited. As such, the fair value of the outstanding derivative contracts is not material.
Interest Rate Risk
The Company is exposed to interest rate risk as changes in market interest rates affect the fair values of fixed-interest rate liabilities and the cash flows of both floating-interest rate liabilities and future borrowings. Notes, debentures, and capital leases all bear interest at fixed rates. Drawings on the syndicated and demand credit facilities and obligations under the securitization program all bear interest at floating rates. The Company regularly reviews the mix of floating and fixed rate debt for consistency with its financing objectives.
Foreign Currency Exchange Risk
Due to the fact that energy commodity prices are primarily in U.S. dollars, the Company’s revenues, crude oil and product purchases, and associated accounts receivable, accounts payable and accrued liabilities, and off-balance sheet commitments are affected by the Cdn/U.S. dollar exchange rate. These U.S. dollar denominated accounts receivable and accounts payable and accrued liabilities account for a significant portion of the Company’s total accounts receivable and accounts payable and accrued liabilities.
NOTES TO CONSOLIDATED FINANCIAL STATEMENTS (unaudited)
| (millions of Canadian dollars, unless otherwise stated) |
11. FINANCIAL RISKS AND FINANCIAL INSTRUMENTS, continued |
The majority of the Company’s foreign currency exchange risk arises from long-term debt, the majority of which is in the form of U.S. dollar denominated debentures and notes. This exposure mitigates the foreign currency exchange risk arising from U.S. dollar denominated revenues.
Substantially all of the Company’s cash and cash equivalents are denominated in Canadian dollars.
The Company’s International business segment and the U.S. Rockies operations included in the North American Natural Gas business segment expose the Company to fluctuations in foreign currency exchange rates, predominantly U.S. dollars.
(b) Credit Risk
The Company is exposed to credit risk from its counterparties’ abilities to fulfill their obligations to the Company. The Company manages this risk through the establishment of credit policies and limits, which are applied in the selection of counterparties. The Company ensures that it has no significant concentrations of credit risk and ensures that no customers represent more than 10% of the Company’s consolidated revenues for any period.
The Company’s maximum exposure to credit risk at March 31, 2008 is equal to the carrying amount of its financial assets recorded on the Consolidated Balance Sheet and $480 million of outstanding accounts receivable sold under the Company’s securitization program, which has been derecognized from the Consolidated Balance Sheet. The Company carries adequate provisions for expected losses arising from credit risk associated with all financial assets, including the derecognized securitized receivables. These provisions are not material.
(c) Liquidity Risk
The Company is exposed to liquidity risk from the potential inability to generate or obtain sufficient cash and cash equivalents in a timely and cost-effective manner to discharge its financial liabilities as they come due. The Company manages liquidity risk by forecasting cash flows to identify financing requirements, by maintaining committed and demand credit facilities, and by maintaining access to additional financing at competitive rates through capital markets and highly rated financial institutions. Any debt issued by the Company is managed in accordance with specified liquidity and maturity profiles.
Financial Instruments
Excluding debentures, senior notes and capital leases which are recorded as long-term debt, the fair values of financial instruments equals or approximates their carrying amount. The fair value of debentures, senior notes and capital leases was $2,571 million at March 31, 2008 (December 31, 2007 - $2,500 million) compared with a carrying amount of $2,445 million (December 31, 2007 - $2,346 million). The fair values of debentures, senior notes and capital leases are based on publicly quoted market values for instruments with similar terms and risks.