Exhibit 99.1
; 
For immediate release
July 24, 2008 (publié également en français)
Reliable Operations Deliver Strong Second Quarter Results
Highlights
| · | Strong production in line with guidance due to successful turnarounds and reliable operations |
| · | Final Libya agreements signed, adding reserves and extending terms by an expected 30 years |
| · | Edmonton refinery conversion project 92% complete and on track for startup in the fourth quarter of 2008 |
| · | On July 23, 2008, declared a 54% increase in the quarterly dividend commencing on October 1, 2008 |
Calgary – Petro-Canada announced today second quarter operating earnings of $1,151 million ($2.38/share), up 43% from $805 million ($1.63/share) in the second quarter of 2007. Second quarter 2008 cash flow from operating activities before changes in non-cash working capital was $1,979 million ($4.09/share), up 47% from $1,350 million ($2.74/share) in the same quarter of last year.
Net earnings were $1,498 million ($3.10/share) in the second quarter of 2008, compared with $845 million ($1.71/share) in the same quarter of 2007.
“We had another strong quarter, both operationally and financially,” said Ron Brenneman, president and chief executive officer. “As we head into the second half of the year, we will continue to execute on our priorities – to deliver value today and realize the benefits of our long-term strategy.”
Second Quarter Results
| | Three months ended June 30, | | Six months ended June 30, | |
| (millions of Canadian dollars, except as noted) | 2008 | | 2007 | | 2008 | | 2007 | |
| Consolidated Results | | | | | | | | |
Operating earnings 1 | $ | 1,151 | | $ | 805 | | $ | 2,097 | | $ | 1,385 | |
| – $/share | | 2.38 | | | 1.63 | | | 4.33 | | | 2.80 | |
| Net earnings | | 1,498 | | | 845 | | | 2,574 | | | 1,435 | |
| – $/share | | 3.10 | | | 1.71 | | | 5.32 | | | 2.90 | |
Cash flow from operating activities before changes in non-cash working capital 2 | | 1,979 | | | 1,350 | | | 3,831 | | | 2,516 | |
| – $/share | | 4.09 | | | 2.74 | | | 7.92 | | | 5.08 | |
| Dividends – $/share | | 0.13 | | | 0.13 | | | 0.26 | | | 0.26 | |
| Share buyback program | | – | | | 428 | | | – | | | 515 | |
| – millions of shares | | – | | | 8.0 | | | – | | | 10.0 | |
| Capital expenditures | $ | 2,141 | | $ | 783 | | $ | 3,157 | | $ | 1,516 | |
Weighted-average common shares outstanding (millions of shares) | | 483.8 | | | 493.1 | | | 483.8 | | | 495.1 | |
Total production net before royalties (thousands of barrels of oil equivalent/day – Mboe/d) 3 | | 414 | | | 425 | | | 421 | | | 415 | |
Operating return on capital employed (%) 4 | | | | | | | | | | | | |
| Upstream | | | | | | | | 35.1 | | | 24.3 | |
Downstream 4 | | | | | | | | 3.3 | | | 14.9 | |
Total Company 4 | | | | | | | | 20.6 | | | 19.7 | |
| 1 | Operating earnings (which represent net earnings, excluding gains or losses on foreign currency translation of long-term debt and on sale of assets, excluding the change in fair value of the Buzzard derivative contracts (applies to 2007 and prior only), including the Downstream estimated current cost of supply adjustment and excluding mark-to-market valuations of stock-based compensation, the Libya Exploration and Production Sharing Agreements (EPSA) ratification adjustment, income tax adjustments, asset impairment and insurance proceeds - see page 2 NON-GAAP MEASURES) are used by the Company to evaluate operating performance. |
| 2 | From operating activities before changes in non-cash working capital (see page 2 NON-GAAP MEASURES). |
| 3 | Total production includes natural gas converted at six thousand cubic feet (Mcf) of natural gas for one barrel (bbl) of oil. |
| 4 | Returns calculated on a 12-month rolling basis. In 2008, Downstream and Total Company operating return on capital employed includes the Downstream estimated current cost of supply adjustment. |
NON-GAAP MEASURES
Cash flow and cash flow from operating activities before changes in non-cash working capital are commonly used in the oil and gas industry and by Petro-Canada to assist management and investors in analyzing operating performance, leverage and liquidity. In addition, the Company’s capital budget was prepared using anticipated cash flow from operating activities before changes in non-cash working capital, as the timing of collecting receivables or making payments is not considered relevant for capital budgeting purposes. Operating earnings represent net earnings, excluding gains or losses on foreign currency translation of long-term debt and sale of assets, excluding the change in fair value of derivative contracts associated with the Buzzard acquisition (applies to 2007 and prior only), including the Downstream estimated current cost of supply adjustment and excluding mark-to-market valuations of stock-based compensation, the Libya EPSA ratification adjustment, income tax adjustments, asset impairment charges, and insurance proceeds and surcharges. Operating earnings are used by the Company to evaluate operating performance. Cash flow, cash flow from operating activities before changes in non-cash working capital and operating earnings do not have standardized meanings prescribed by Canadian generally accepted accounting principles (GAAP) and, therefore, may not be comparable with the calculations of similar measures for other companies. For a reconciliation of cash flow and cash flow from operating activities before changes in non-cash working capital to the associated GAAP measures, refer to the table on page 4. For a reconciliation of operating earnings to the associated GAAP measures, refer to the table below.
On January 1, 2008, the Company adopted Canadian Institute of Chartered Accountants (CICA) Section 3031, Inventories, and now assigns costs for its crude oil and refined petroleum products inventories on a “first-in, first-out” (FIFO) basis whereas, previously, these costs were assigned on a “last-in, first-out” (LIFO) basis. To facilitate a better understanding of the Company’s Downstream performance, operating earnings for 2008 onward are being presented on an estimated current cost of supply basis, which is a non-GAAP measure. On this basis, cost of sales is determined by estimating the current cost of supply for all volumes sold in the period after making allowance for the estimated tax effect, instead of using a FIFO basis for valuing inventories. Operating earnings calculated on this basis do not represent the application of a LIFO basis of valuing inventories, used prior to 2008, and, therefore, the Downstream estimated current cost of supply adjustment does not have comparatives.
| | Three months ended June 30, | | Six months ended June 30, | |
| (millions of Canadian dollars, except per share amounts) | 2008 | | ($/share) | | 2007 | | ($/share) | | 2008 | | ($/share) | | 2007 | | ($/share) | |
| Net earnings | $ | 1,498 | | $ | 3.10 | | $ | 845 | | $ | 1.71 | | $ | 2,574 | | $ | 5.32 | | $ | 1,435 | | $ | 2.90 | |
Foreign currency translation gain (loss) on long-term debt 1 | | (13 | ) | | | | | 104 | | | | | | (61 | ) | | | | | 120 | | | | |
Change in fair value of Buzzard derivative contracts 2 | | – | | | | | | (28 | ) | | | | | – | | | | | | (88 | ) | | | |
Gain (loss) on sale of assets 3 | | (99 | ) | | | | | 6 | | | | | | (96 | ) | | | | | 47 | | | | |
| Downstream estimated current cost of supply adjustment | | 299 | | | | | | – | | | | | | 422 | | | | | | – | | | | |
| Mark-to-market valuation of stock-based compensation | | (117 | ) | | | | | (97 | ) | | | | | (49 | ) | | | | | (89 | ) | | | |
Libya EPSA ratification adjustment 4 | | 47 | | | | | | – | | | | | | – | | | | | | – | | | | |
Income tax adjustments 5 | | 230 | | | | | | 48 | | | | | | 256 | | | | | | 48 | | | | |
Asset impairment charge 6 | | – | | | | | | – | | | | | | (24 | ) | | | | | – | | | | |
| Insurance proceeds net of surcharges | | – | | | | | | 7 | | | | | | 29 | | | | | | 12 | | | | |
| Operating earnings | $ | 1,151 | | $ | 2.38 | | $ | 805 | | $ | 1.63 | | $ | 2,097 | | $ | 4.33 | | $ | 1,385 | | $ | 2.80 | |
| 1 | Foreign currency translation reflected gains or losses on United States (U.S.) dollar-denominated long-term debt not associated with the self-sustaining International business unit and the U.S. Rockies operations included in the North American Natural Gas business unit. |
| 2 | During the fourth quarter of 2007, the Company entered into derivative contracts to close out the hedged portion of its Buzzard production from January 1, 2008 to December 31, 2010. |
| 3 | In the second quarter of 2008, the North American Natural Gas business unit completed the sale of its Minehead assets in Western Canada, resulting in a loss on sale of $153 million before-tax ($112 million after-tax). The sale of these assets is aligned with the business unit’s strategy to continuously optimize the assets in its portfolio. |
| 4 | On June 19, 2008, the Company signed six new EPSAs with the Libya National Oil Corporation (NOC) to replace existing concession agreements and one EPSA. The new EPSAs were ratified as of the signing, with an effective date of January 1, 2008. Net earnings for the three months ended June 30, 2008 included a $47 million after-tax adjustment to recognize incremental earnings on the new EPSAs relating to the period from January 1 to March 31, 2008, which could not be recognized until ratification on June 19, 2008. Net earnings and operating earnings for the three and six months ended June 30, 2008 did not include amortization or interest expenses on the $1 billion US signing bonus, which could not be recognized until the agreements were ratified. The Company estimates amortization and interest expenses on the signing bonus to be approximately $7 million per month beginning July 1, 2008. |
| 5 | In the second quarter of 2008, the International business segment recorded a $230 million future income tax recovery due to the ratification of the Libya EPSAs. |
| 6 | In the first quarter of 2008, the North American Natural Gas business unit recorded a depreciation, depletion and amortization (DD&A) charge of $35 million before-tax ($24 million after-tax) for accumulated project development costs relating to the proposed liquefied natural gas (LNG) regasification facility at Gros-Cacouna, Quebec, which has been postponed due to global LNG business conditions. |
Earnings Variances
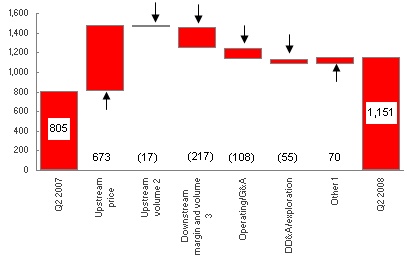
| Q2/08 VERSUS Q2/07 FACTOR ANALYSIS |
| (millions of Canadian dollars, after-tax) |
| Operating earnings increased 43% to $1,151 million ($2.38/share) in the second quarter of 2008, compared with $805 million ($1.63/share) in the second quarter of 2007. The increase in second quarter operating earnings reflected the positive impact of higher realized upstream prices ($673 million) and lower other expenses1 ($70 million). The gains were partially offset by lower upstream production2 ($(17) million), lower Downstream margins3 ($(217) million), higher operating, general and administrative (G&A) expenses ($(108) million) and higher DD&A and exploration expenses ($(55) million). |
| 1 | Other mainly included interest expense, foreign exchange, changes in effective tax rates and upstream inventory movements. |
| 2 | Upstream volumes included the portion of DD&A expense associated with changes in upstream production levels. |
| 3 | Downstream margin included the estimated current cost of supply adjustment. |
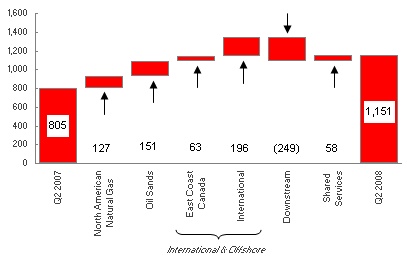
| Operating Earnings by Segment |
| (millions of Canadian dollars, after-tax) |
| The increase in second quarter operating earnings on a segmented basis reflected higher North American Natural Gas ($127 million), Oil Sands ($151 million), East Coast Canada ($63 million) and International ($196 million) operating earnings and lower Shared Services costs ($58 million). The results were partially offset by lower Downstream operating earnings ($(249) million). |
Net earnings in the second quarter of 2008 were $1,498 million ($3.10/share), compared with $845 million ($1.71/share) during the same period in 2007. Net earnings in the second quarter of 2008 were higher than in the second quarter of 2007 due to higher operating earnings, a future income tax recovery due to the ratification of the Libya EPSAs, the positive impact on Downstream realized margins from escalating crude oil feedstock costs while using a FIFO inventory valuation methodology and the benefit associated with settling the Buzzard derivative contracts in the fourth quarter of 2007. These factors were partially offset by losses on foreign currency translation of long-term debt and losses on sale of assets.
| | Three months ended June 30, | | Six months ended June 30, | |
| (millions of Canadian dollars) | 2008 | | 2007 | | 2008 | | 2007 | |
| Cash flow from operating activities | $ | 2,479 | | $ | 1,435 | | $ | 3,914 | | $ | 2,601 | |
| Decrease in non-cash working capital related to operating activities | | (500 | ) | | (85 | ) | | (83 | ) | | (85 | ) |
| Cash flow from operating activities before changes in non-cash working capital | $ | 1,979 | | $ | 1,350 | | $ | 3,831 | | $ | 2,516 | |
During the second quarter of 2008, cash flow from operating activities before changes in non-cash working capital was $1,979 million ($4.09/share), up from $1,350 million ($2.74/share) in the same quarter of 2007. The increase in cash flow from operating activities before changes in non-cash working capital reflected higher net earnings.
2008 Consolidated Net Production and Capital Expenditure Outlooks
The Company updates its annual production and capital and exploration expenditure outlooks at mid-year. Full-year upstream production is expected to be in the 400,000 barrels of oil equivalent per day (boe/d) to 420,000 boe/d range in 2008, slightly higher than the 390,000 boe/d to 420,000 boe/d production outlook previously provided. The 2008 capital and exploration expenditure program is expected to be $6,155 million, up $870 million from the prior guidance of $5,285 million. The increase primarily reflects increased costs for the Edmonton refinery conversion project in the Downstream and the accrual for the full impact of the $1 billion US Libya EPSA ratification signing bonus in the International segment. About half of the Libya signing bonus was paid in July 2008, with the remainder to be paid from 2009 to 2013. These factors were partially offset by lower upstream capital spending.
Operating Highlights
Second quarter production averaged 414,000 boe/d net to Petro-Canada in 2008, down 3% from 425,000 boe/d net in the same quarter of 2007. Lower volumes reflected decreased North American Natural Gas and East Coast Canada production, partially offset by increased Oil Sands and International production.
The Downstream delivered reliable operations, while managing through a weaker business environment in the second quarter of 2008.
| | Three months ended June 30, | | Six months ended June 30, | |
| | 2008 | | 2007 | | 2008 | | 2007 | |
| Upstream – Consolidated | | | | | | | | |
| Production before royalties | | | | | | | | |
Crude oil and natural gas liquids (NGL) production net (thousands of barrels/day – Mb/d) | | 296 | | | 304 | | | 303 | | | 292 | |
Natural gas production net, excluding injectants (millions of cubic feet/day – MMcf/d) | | 705 | | | 721 | | | 709 | | | 734 | |
Total production net (Mboe/d) 1 | | 414 | | | 425 | | | 421 | | | 415 | |
| Average realized prices | | | | | | | | | | | | |
Crude oil and NGL ($/barrel – $/bbl) | | 117.22 | | | 70.14 | | | 104.67 | | | 66.73 | |
Natural gas ($/thousand cubic feet – $/Mcf) | | 9.55 | | | 6.79 | | | 8.56 | | | 7.06 | |
| Downstream | | | | | | | | | | | | |
Petroleum product sales (thousands of cubic metres/day – m3/d) | | 51.8 | | | 51.7 | | | 52.0 | | | 52.4 | |
Average refinery utilization (%) | | 96 | | | 102 | | | 99 | | | 99 | |
Downstream operating earnings after-tax (cents/litre) 2 | | – | | | 5.3 | | | 0.6 | | | 4.6 | |
| 1 | Total production includes natural gas converted at six Mcf of natural gas for one bbl of oil. |
| 2 | In 2008, Downstream operating earnings after-tax includes the Downstream estimated current cost of supply adjustment. |
BUSINESS STRATEGY
Petro-Canada's strategy is to create shareholder value by delivering long-term, profitable growth and improving the profitability of the base business.
Petro-Canada’s capital program supports bringing on seven major projects over the next several years to deliver long-term profitable growth. For the remainder of 2008, the Company expects to complete the project to convert the Edmonton refinery to process lower cost, oil sands-based feedstock and commence startup, and to make the final investment decisions (FID) on the Fort Hills mining and upgrading project and Montreal coker project. These projects are expected to add significant earnings and cash flow.
Petro-Canada continually works to strengthen its base business by improving the safety, reliability and efficiency of its operations. For the remainder of 2008, the Company is focused on delivering upstream production in line with guidance.
Outlook
Operational Updates
| · | The Downstream is expected to commence its planned two-month turnaround in August to tie-in the Edmonton refinery conversion project and to complete maintenance on other units within the refinery. |
| · | Syncrude is expected to commence its planned 45-day Coker 8-2 maintenance turnaround in the third quarter of 2008. |
| · | Buzzard is expected to commence its planned maintenance turnarounds for a total of nine-days in the third quarter of 2008. |
Major Project Milestones
| · | The Edmonton refinery conversion project construction was 92% complete at the end of the second quarter and on track for startup in the fourth quarter of 2008. The capital cost estimate was revised from $2.2 billion to $2.5 billion to reflect additional work and rework combined with lower than expected labour productivity. |
| · | The Montreal coker investment decision is deferred until resolution of the labour dispute. |
| · | The North Amethyst portion of the White Rose Extensions received regulatory and government approval to proceed in April 2008. The project was advanced with completion of front-end engineering and design (FEED) for the North Amethyst portion and commencement of the detailed design. |
| · | The Syria Ebla gas development project continues with the engineering, procurement and construction (EPC) team fully mobilized. Contracts for long-lead items are currently being awarded and detailed engineering work is commencing. First gas is expected in 2010. |
| · | The Company signed six new EPSAs with the Libya NOC in the second quarter of 2008, with commercial terms including the signing bonus, identical to the heads of agreement executed in the fourth quarter of 2007. |
| · | The MacKay River expansion project received regulatory approval in the first quarter of 2008. The project continues with design refinement, and the FID is expected in the first quarter of 2009. |
| · | The Fort Hills project FEED is on track for completion in the third quarter of 2008. The upgrader regulatory hearing was wrapped up in early July and a decision is expected in the fourth quarter of 2008. A decision on the proposed amendment to the approved mine plan is expected in the third quarter of 2008. The FID is expected during the fourth quarter of 2008. |
BUSINESS UNIT RESULTS
UPSTREAM
North American Natural Gas
| | | Three months ended June 30, | | Six months ended June 30, | |
| (millions of Canadian dollars) | | 2008 | | 2007 | | 2008 | | 2007 | |
| Net earnings | | $ | 100 | | $ | 81 | | $ | 174 | | $ | 193 | |
Gain (loss) on sale of assets 1 | | | (106 | ) | | 1 | | | (104 | ) | | 41 | |
| Income tax adjustments | | | – | | | 1 | | | – | | | 1 | |
Asset impairment charge 2 | | | – | | | – | | | (24 | ) | | – | |
| Operating earnings | | $ | 206 | | $ | 79 | | $ | 302 | | $ | 151 | |
| Cash flow from operating activities before changes in non-cash working capital | | $ | 404 | | $ | 220 | | $ | 668 | | $ | 417 | |
| 1 | In the second quarter of 2008, the North American Natural Gas business unit completed the sale of its Minehead assets in Western Canada, resulting in a loss on sale of $153 million before-tax ($112 million after-tax). The sale of these assets is aligned with the business unit’s strategy to continuously optimize the assets in its portfolio. |
| 2 | In the first quarter of 2008, the North American Natural Gas business unit recorded a DD&A charge of $35 million before-tax ($24 million after-tax) for accumulated project development costs relating to the proposed LNG regasification facility at Gros-Cacouna, Quebec, which has been postponed due to global LNG business conditions. |
In the second quarter of 2008, North American Natural Gas contributed $206 million of operating earnings, compared with $79 million in the second quarter of 2007. Higher realized prices and lower exploration expenses were partially offset by lower volumes and higher operating and DD&A expenses.
Net earnings in the second quarter of 2008 of $100 million included a net loss on the sale of assets of $106 million. The main contributing factor was the sale of its Minehead assets in Western Canada for a loss of $153 million before-tax ($112 million after-tax).
North American Natural Gas production averaged 660 million cubic feet of oil equivalent/day (MMcfe/d) in the second quarter of 2008, down 2% from 675 MMcfe/d in the same quarter of 2007. Lower production reflected anticipated natural declines and scheduled turnarounds in Western Canada, largely offset by higher natural gas production in the U.S. Rockies.
Oil Sands
| | | Three months ended June 30, | | Six months ended June 30, | |
| (millions of Canadian dollars) | | 2008 | | 2007 | | 2008 | | 2007 | |
Net earnings 1 | | $ | 177 | | $ | 34 | | $ | 289 | | $ | 77 | |
| Gain on sale of assets | | | – | | | 1 | | | – | | | 1 | |
| Income tax adjustments | | | – | | | 7 | | | 2 | | | 7 | |
| Operating earnings | | $ | 177 | | $ | 26 | | $ | 287 | | $ | 69 | |
| Cash flow from operating activities before changes in non-cash working capital | | $ | 231 | | $ | 99 | | $ | 399 | | $ | 214 | |
| 1 | Oil Sands bitumen inventory movements increased net earnings by $18 million before-tax ($12 million after-tax) and $21 million before-tax ($14 million after-tax) for the three and six months ended June 30, 2008, respectively. The same factor increased net earnings by $1 million before-tax ($1 million after-tax) and $4 million before-tax ($3 million after-tax) for the three and six months ended June 30, 2007, respectively. |
Oil Sands delivered operating earnings of $177 million in the second quarter of 2008, up from $26 million in the second quarter of 2007. Higher realized prices and production, and lower exploration and DD&A expenses were partially offset by higher operating costs.
Oil Sands production averaged 53,900 barrels/day (b/d) in the second quarter of 2008, up 3% from 52,400 b/d in the second quarter of 2007. Increased production primarily reflected increased reliability at MacKay River. This was partially offset by planned preventative maintenance at MacKay River, a planned 45-day turnaround of Coker 8-1 at Syncrude and reliability issues with the sulphur plants at Syncrude. Production in the second quarter of 2007 was reduced by a turnaround of Coker 8-3 at Syncrude.
International & Offshore
East Coast Canada
| | Three months ended June 30, | | Six months ended June 30, | |
| (millions of Canadian dollars) | 2008 | | 2007 | | 2008 | | 2007 | |
Net earnings 1 | $ | 385 | | $ | 334 | | $ | 760 | | $ | 590 | |
| Terra Nova insurance proceeds | | – | | | 7 | | | 29 | | | 7 | |
| Income tax adjustments | | – | | | 5 | | | 2 | | | 5 | |
| Operating earnings | $ | 385 | | $ | 322 | | $ | 729 | | $ | 578 | |
| Cash flow from operating activities before changes in non-cash working capital | $ | 464 | | $ | 420 | | $ | 930 | | $ | 777 | |
| 1 | East Coast Canada crude oil inventory movements decreased net earnings by $57 million before-tax ($39 million after-tax) and $63 million before-tax ($43 million after-tax) for the three and six months ended June 30, 2008, respectively. The same factor increased net earnings by $2 million before-tax ($1 million after-tax) and $25 million before-tax ($17 million after-tax) for the three and six months ended June 30, 2007, respectively. |
In the second quarter of 2008, East Coast Canada contributed $385 million of operating earnings, up from $322 million in the second quarter of 2007. Higher realized prices and lower operating, DD&A and exploration expenses were partially offset by lower production and higher royalty payments.
Net earnings in the second quarter of 2007 included $7 million in insurance proceeds related to Terra Nova and a $5 million future income tax recovery.
East Coast Canada production averaged 90,400 b/d in the second quarter of 2008, down 17% from 108,400 b/d in the same period in 2007. Terra Nova’s production was lower due to a 16-day maintenance turnaround that was planned for July, but advanced to June. The turnaround was completed two days ahead of schedule and on budget. Hibernia production was lower due to anticipated natural declines, partially offset by the positive impact of recent well workovers and strong reliability. White Rose production was lower due to the impact of unplanned shutdowns as a result of ice conditions at the beginning of the second quarter of 2008.
International
| | Three months ended June 30, | | Six months ended June 30, | |
| (millions of Canadian dollars) | 2008 | | 2007 | | 2008 | | 2007 | |
Net earnings 1 | $ | 672 | | $ | 195 | | $ | 1,008 | | $ | 204 | |
Change in fair value of Buzzard derivative contracts 2 | | – | | | (28 | ) | | – | | | (88 | ) |
Libya EPSA ratification adjustment 3 | | 47 | | | – | | | – | | | – | |
| Gain on sale of assets | | 6 | | | – | | | 6 | | | – | |
| Scott insurance proceeds | | – | | | – | | | – | | | 5 | |
Income tax adjustments 4 | | 230 | | | 30 | | | 230 | | | 30 | |
| Operating earnings | $ | 389 | | $ | 193 | | $ | 772 | | $ | 257 | |
| Cash flow from operating activities before changes in non-cash working capital | $ | 635 | | $ | 417 | | $ | 1,191 | | $ | 639 | |
| 1 | International crude oil inventory movements increased (decreased) net earnings by $42 million before-tax ($(14) million after-tax) and $76 million before-tax ($11 million after-tax) for the three and six months ended June 30, 2008, respectively. The same factor increased (decreased) net earnings by $15 million before-tax ($21 million after-tax) and $(30) million before-tax ($(7) million after-tax) for the three and six months ended June 30, 2007, respectively. |
| 2 | During the fourth quarter of 2007, the Company entered into derivative contracts to close out the hedged portion of its Buzzard production from January 1, 2008 to December 31, 2010. |
| 3 | On June 19, 2008, the Company signed six new EPSAs with the Libya NOC to replace existing concession agreements and one EPSA. The new EPSAs were ratified as of the signing, with an effective date of January 1, 2008. Net earnings for the three months ended June 30, 2008 included a $47 million after-tax adjustment to recognize incremental earnings on the new EPSAs relating to the period from January 1 to March 31, 2008, which could not be recognized until ratification on June 19, 2008. Net earnings and operating earnings for the three and six months ended June 30, 2008 did not include amortization or interest expenses on the $1 billion US signing bonus, which could not be recognized until the agreements were ratified. The Company estimates amortization and interest expenses on the signing bonus to be approximately $7 million per month beginning July 1, 2008. |
| 4 | In the second quarter of 2008, the International business unit recorded a $230 million future income tax recovery due to the ratification of the Libya EPSAs. |
International contributed $389 million of operating earnings in the second quarter of 2008, up from $193 million recorded in the second quarter of 2007. Higher realized prices, increased production volumes, the Libya EPSA ratification adjustment and lower operating and DD&A expenses were partially offset by increased exploration expense. Higher exploration expenses were due to well write-offs in the Netherlands, Syria, and Trinidad and Tobago. Lower operating and DD&A expenses were primarily due to the Libya EPSA ratification adjustment, partially offset by increased production from the North Sea.
Net earnings in the second quarter of 2008 include a future income tax recovery due to the ratification of the Libya EPSAs of $230 million, the Libya EPSA ratification adjustment of $47 million and a gain on sale of mature assets in the Netherlands of $6 million. Net earnings in the second quarter of 2007 included a future income tax recovery of $30 million and an unrealized loss on the Buzzard derivative contracts of $28 million.
International production averaged 159,500 boe/d in the second quarter of 2008, up 5% from 151,200 boe/d in the second quarter of 2007. Increased production primarily reflected higher production from Buzzard, partially offset by anticipated natural declines in the other North Sea assets.
Exploration Update
In the first half of 2008, Petro-Canada and its partners finished operations on 10 of the up to 17 wells planned for the year. Three of the wells were completed as natural gas discoveries (Gubik-3 in the Alaska Foothills, Sancoche on Block 22 offshore Trinidad and Tobago, and van Ghent in the Netherlands sector of the North Sea). One appraisal well offshore Trinidad and Tobago (Cassra-2) confirmed Contingent Resources in the range of 0.6 trillion cubic feet (Tcf) to 1.3 Tcf in the earlier Cassra-1 discovery. Two wells were completed as non-commercial discoveries (Maria in the United Kingdom (U.K.) sector of the North Sea and L5a-11 in the Netherlands sector of the North Sea). Drilling of the Chandler-1 well in the Alaska Foothills was suspended, as planned, for re-entry next season. Three wells were dry and abandoned (Kwijika in the Northwest Territories, Gemini in the U.K. sector of the North Sea, and Tegu in Block 1a offshore Trinidad and Tobago).
DOWNSTREAM
| | Three months ended June 30, | | Six months ended June 30, | |
| (millions of Canadian dollars) | 2008 | | 2007 | | 2008 | | 2007 | |
| Net earnings | $ | 300 | | $ | 259 | | $ | 484 | | $ | 443 | |
| Gain on sale of assets | | 1 | | | 4 | | | 2 | | | 5 | |
Downstream estimated current cost of supply adjustment 1 | | 299 | | | – | | | 422 | | | – | |
| Income tax adjustments | | – | | | 6 | | | 2 | | | 6 | |
| Operating earnings | $ | – | | $ | 249 | | $ | 58 | | $ | 432 | |
| Cash flow from operating activities before changes in non-cash working capital | $ | 433 | | $ | 391 | | $ | 741 | | $ | 673 | |
| 1 | On January 1, 2008, the Company adopted CICA Section 3031, Inventories, and now assigns costs for its crude oil and refined petroleum products inventories on a FIFO basis whereas, previously, these costs were assigned on a LIFO basis. To facilitate a better understanding of the Company’s Downstream performance, operating earnings for 2008 onward are being presented on an estimated current cost of supply basis, which is a non-GAAP measure (see page 2 NON-GAAP MEASURES). On this basis, cost of sales is determined by estimating the current cost of supply for all volumes sold in the period after making allowance for the estimated tax effect, instead of using a FIFO basis for valuing inventories. Operating earnings calculated on this basis do not represent the application of a LIFO basis of valuing inventories, used prior to 2008, and, therefore, the Downstream estimated current cost of supply adjustment does not have comparatives. |
In the second quarter of 2008, the Downstream business contributed $nil operating earnings, down significantly from $249 million in the same quarter of 2007, reflecting a weak business environment.
Refining and Supply recorded a second quarter 2008 operating loss of $16 million, down significantly compared with operating earnings of $217 million in the same quarter of 2007. Results reflected four key items discussed in order of impact. First Refining and Supply results were impacted by lower gasoline cracking margins. Second, results were impacted by a decrease in realized refining margins for asphalt and heavy fuel oil, light oil, lubricants, liquid petroleum gases and petrochemical products. Third, results were impacted by lower refinery yields associated with crude availability and quality issues at Edmonton, and planned turnaround activity and partial unit shutdown at Montreal. Last, results were impacted by increased operating costs primarily associated with environmental costs for the Quebec green levy and Alberta greenhouse gases legislation, and turnaround costs at Montreal. These four key items were partially offset by favourable crude price differentials, lower costs for other feedstock and higher distillate cracking margins.
Marketing contributed second quarter 2008 operating earnings of $16 million, compared with $32 million in the same quarter of 2007. In the second quarter of 2008, Marketing results reflected increased operating costs due to higher fuel costs associated with delivery and card fees, partially offset by higher non-petroleum revenue.
CORPORATE
| Shared Services and Eliminations | Three months ended June 30, | | Six months ended June 30, | |
| (millions of Canadian dollars) | 2008 | | 2007 | | 2008 | | 2007 | |
| Net loss | $ | (136 | ) | $ | (58 | ) | $ | (141 | ) | $ | (72 | ) |
| Foreign currency translation gain (loss) on long-term debt | | (13 | ) | | 104 | | | (61 | ) | | 120 | |
Stock-based compensation expense 1 | | (117 | ) | | (97 | ) | | (49 | ) | | (89 | ) |
| Income tax adjustments | | – | | | (1 | ) | | 20 | | | (1 | ) |
| Operating loss | $ | (6 | ) | $ | (64 | ) | $ | (51 | ) | $ | (102 | ) |
| Cash flow used in operating activities before changes in non-cash working capital | $ | (188 | ) | $ | (197 | ) | $ | (98 | ) | $ | (204 | ) |
| 1 | Reflects the change in the mark-to-market valuation of stock-based compensation. |
Shared Services and Eliminations recorded an operating loss of $6 million in the second quarter of 2008, compared with a loss of $64 million for the same period in 2007. The decrease in operating loss was due to foreign exchange gains on U.S. dollar cash balances held during the second quarter of 2008.
Petro-Canada regularly reviews its dividend strategy to ensure the alignment of its dividend policy with shareholder expectations, and financial and growth objectives. Consistent with this objective, on July 23, 2008, the Company declared a 54% increase in its quarterly dividend to $0.20/share, commencing with the dividend payable on October 1, 2008.
Petro-Canada is one of Canada’s largest oil and gas companies, operating in both the upstream and downstream sectors of the industry in Canada and internationally. The Company creates value by responsibly developing energy resources and providing world class petroleum products and services. Petro-Canada is proud to be a National Partner to the Vancouver 2010 Olympic and Paralympic Winter Games. Petro-Canada’s common shares trade on the Toronto Stock Exchange (TSX) under the symbol PCA and on the New York Stock Exchange (NYSE) under the symbol PCZ.
The full text of Petro-Canada's second quarter release, including Management’s Discussion and Analysis (MD&A), can be accessed on Petro-Canada's website at http://www.petro-canada.ca/en/investors/845.aspx and will be available through SEDAR at http://www.sedar.com.
Petro-Canada will hold a conference call to discuss these results with investors on Thursday, July 24, 2008 at 9:00 a.m. eastern daylight time (EDT). To participate, please call 1-866-898-9626 (toll-free in North America), 00-800-8989-6323 (toll-free internationally), or 416-340-2216 at 8:55 a.m. EDT. Media are invited to listen to the call by dialing 1-866-540-8136 (toll-free in North America) or 416-340-8010. Media are invited to ask questions at the end of the call. A live audio broadcast of the conference call will be available on Petro-Canada's website at http://www.petro-canada.ca/en/investors/845.aspx on July 24, 2008 at 9:00 a.m. EDT. Those who are unable to listen to the call live may listen to a recording of the call approximately one hour after its completion by dialing 1-800-408-3053 (toll-free in North America) or 416-695-5800 (pass code number 3264059#). Approximately one hour after the call, a recording will be available on Petro-Canada’s website.
LEGAL NOTICE – FORWARD-LOOKING INFORMATION
This news release contains forward-looking information. You can usually identify this information by such words as "plan," "anticipate," "forecast," "believe," "target," "intend," "expect," "estimate," "budget" or other terms that suggest future outcomes or references to outlooks. Listed below are examples of references to forward-looking information:
· business strategies and goals · future investment decisions · outlook (including operational updates and strategic milestones) · future capital, exploration and other expenditures · future cash flows · future resource purchases and sales · construction and repair activities · turnarounds at refineries and other facilities · anticipated refining margins · future oil and natural gas production levels and the sources of their growth · project development, and expansion schedules and results · future exploration activities and results, and dates by which certain areas may be developed or come on-stream | · retail throughputs · pre-production and operating costs · reserves and resources estimates · royalties and taxes payable · production life-of-field estimates · natural gas export capacity · future financing and capital activities (including purchases of Petro-Canada common shares under the Company's normal course issuer bid (NCIB) program) · contingent liabilities (including potential exposure to losses related to retail licensee agreements) · environmental matters · future regulatory approvals · expected rates of return |
Such forward-looking information is subject to known and unknown risks and uncertainties. Other factors may cause actual results, levels of activity and achievements to differ materially from those expressed or implied by such information. Such factors include, but are not limited to:
· industry capacity · imprecise reserves estimates of recoverable quantities of oil, natural gas and liquids from resource plays, and other sources not currently classified as reserves · the effects of weather and climate conditions · the results of exploration and development drilling, and related activities · the ability of suppliers to meet commitments · decisions or approvals from administrative tribunals · risks associated with domestic and international oil and natural gas operations · general economic, market and business conditions | · competitive action by other companies · fluctuations in oil and natural gas prices · refining and marketing margins · the ability to produce and transport crude oil and natural gas to markets · fluctuations in interest rates and foreign currency exchange rates · actions by governmental authorities (including changes in taxes, royalty rates and resource-use strategies) · changes in environmental and other regulations · international political events · nature and scope of actions by stakeholders and/or the general public |
Many of these and other similar factors are beyond the control of Petro-Canada. Petro-Canada discusses these factors in greater detail in filings with the Canadian provincial securities commissions and the U.S. Securities and Exchange Commission (SEC).
Readers are cautioned that this list of important factors affecting forward-looking information is not exhaustive. Furthermore, the forward-looking information in this news release is made as of July 24, 2008 and, except as required by applicable law, will not be publicly updated or revised. This cautionary statement expressly qualifies the forward-looking information in this news release.
Petro-Canada disclosure of reserves
Petro-Canada's qualified reserves evaluators prepare the reserves estimates the Company uses. The Canadian provincial securities commissions do not consider Petro-Canada’s reserves staff and management as independent of the Company. Petro-Canada has obtained an exemption from certain Canadian reserves disclosure requirements that allows Petro-Canada to make disclosure in accordance with SEC standards where noted in this news release. This exemption allows comparisons with U.S. and other international issuers.
As a result, Petro-Canada formally discloses its proved reserves data using U.S. requirements and practices, and these may differ from Canadian domestic standards and practices. The use of the terms such as "probable," "possible," ”resources” and “life-of-field production” in this news release does not meet the SEC guidelines for SEC filings. To disclose reserves in SEC filings, oil and natural gas companies must prove they are economically and legally producible under existing economic and operating conditions. Note that when the term barrel of oil equivalent (boe) is used in this news release, it may be misleading, particularly if used in isolation. A boe conversion ratio of six Mcf to one bbl is based on an energy equivalency conversion method. This method primarily applies at the burner tip and does not represent a value equivalency at the wellhead.
The table below describes the industry definitions that Petro-Canada currently uses:
| Definitions Petro-Canada uses | Reference |
| Proved oil and natural gas reserves (includes both proved developed and proved undeveloped) | SEC reserves definition (Accounting Rules Regulation S-X 210.4-10, U.S. Financial Accounting Standards Board (FASB) Statement No. 69) SEC Guide 7 for Oilsands Mining |
| Unproved reserves, probable and possible reserves | Canadian Securities Administrators: Canadian Oil and Gas Evaluation (COGE) Handbook, Vol. 1 Section 5 prepared by the Society of Petroleum Evaluation Engineers (SPEE) and the Canadian Institute of Mining Metallurgy and Petroleum (CIM) |
| Contingent and Prospective Resources | Petroleum Resources Management System: Society of Petroleum Engineers, SPEE, World Petroleum Congress and American Association of Petroleum Geologist definitions (approved March 2007) Canadian Securities Administrators: COGE Handbook Vol. 1 Section 5 |
Although the Society of Petroleum Engineers resource classification has categories of 1C, 2C, 3C for Contingent Resources, and low, best and high estimates for Prospective Resources, Petro-Canada will only refer to the 2C for Contingent Resources and the risked (an assessment of the probability of discovering the resources) best estimate for Prospective Resources when referencing resources in this news release. Canadian Oil Sands represents approximately 71% of Petro-Canada’s total for Contingent and Prospective Resources. The balance of Petro-Canada’s resources is spread out across the business, most notably in the North American frontier and International areas. Also, when Petro-Canada references resources for the Company, Contingent Resources are approximately 53% and risked Prospective Resources are approximately 47% of the Company’s total resources.
Cautionary statement: In the case of discovered resources or a subcategory of discovered resources other than reserves, there is no certainty that it will be commercially viable to produce any portion of the resources. In the case of undiscovered resources or a subcategory of undiscovered resources, there is no certainty that any portion of the resources will be discovered. If discovered, there is no certainty that it will be commercially viable to produce any portion of the resources.
For movement of resources to reserves categories, all projects must have an economic depletion plan and may require
| · | additional delineation drilling and/or new technology for oil sands mining, in situ and conventional Contingent and risked Prospective Resources prior to project sanction and regulatory approvals; and |
| · | exploration success with respect to conventional risked Prospective Resources prior to project sanction and regulatory approvals. |
Reserves and resources information contained in this news release is as at December 31, 2007.
For more information, please contact:
| INVESTOR AND ANALYST INQUIRIES | MEDIA AND GENERAL INQUIRIES |
| | |
Ken Hall Investor Relations 403-296-7859 e-mail: investor@petro-canada.ca | Andrea Ranson Corporate Communications 403-296-4610 e-mail: corpcomm@petro-canada.ca |
| | |
Lisa McMahon Investor Relations 403-296-3764 e-mail: investor@petro-canada.ca | |
| | |
| www.petro-canada.ca |