EXHIBIT 99.1
October 23, 2008 (publié également en français)
For the nine months ended September 30, 2008
MANAGEMENT’S DISCUSSION AND ANALYSIS
The Management’s Discussion and Analysis (MD&A), dated October 23, 2008, is set out in pages 1 to 22 and should be read in conjunction with the unaudited Consolidated Financial Statements of the Company for the three months ended March 31, 2008, the three and six months ended June 30, 2008, and the three and nine months ended September 30, 2008; the MD&A for the year ended December 31, 2007; the audited Consolidated Financial Statements for the year ended December 31, 2007, and the Company’s 2007 Annual Information Form (AIF), dated March 17, 2008. Amounts are in Canadian (Cdn) dollars unless otherwise specified.
LEGAL NOTICE – FORWARD-LOOKING INFORMATION
This quarterly report contains forward-looking information. You can usually identify this information by such words as "plan," "anticipate," "forecast," "believe," "target," "intend," "expect," "estimate," "budget" or other terms that suggest future outcomes or references to outlooks. Listed below are examples of references to forward-looking information:
· business strategies and goals · future investment decisions · outlook (including operational updates and strategic milestones) · future capital, exploration and other expenditures · future cash flows · future resource purchases and sales · construction and repair activities · turnarounds at refineries and other facilities · anticipated refining margins · future oil and natural gas production levels and the sources of their growth · project development, and expansion schedules and results · future exploration activities and results, and dates by which certain areas may be developed or come on-stream | · retail throughputs · pre-production and operating costs · reserves and resources estimates · royalties and taxes payable · production life-of-field estimates · natural gas export capacity · future financing and capital activities (including purchases of Petro-Canada common shares under the Company's normal course issuer bid (NCIB) program) · contingent liabilities (including potential exposure to losses related to retail licensee agreements) · environmental matters · future regulatory approvals · expected rates of return |
Such forward-looking information is subject to known and unknown risks and uncertainties. Other factors may cause actual results, levels of activity and achievements to differ materially from those expressed or implied by such information. Such factors include, but are not limited to:
· industry capacity · imprecise reserves estimates of recoverable quantities of oil, natural gas and liquids from resource plays, and other sources not currently classified as reserves · the effects of weather and climate conditions · the results of exploration and development drilling, and related activities · the ability of suppliers to meet commitments · decisions or approvals from administrative tribunals · risks associated with domestic and international oil and natural gas operations · general economic, market and business conditions | · competitive action by other companies · fluctuations in oil and natural gas prices · refining and marketing margins · the ability to produce and transport crude oil and natural gas to markets · fluctuations in interest rates and foreign currency exchange rates · actions by governmental authorities (including changes in taxes, royalty rates and resource-use strategies) · changes in environmental and other regulations · international political events · nature and scope of actions by stakeholders and/or the general public |
Many of these and other similar factors are beyond the control of Petro-Canada. Petro-Canada discusses these factors in greater detail in filings with the Canadian provincial securities commissions and the United States (U.S.) Securities and Exchange Commission (SEC).
Readers are cautioned that this list of important factors affecting forward-looking information is not exhaustive. Furthermore, the forward-looking information in this quarterly report is made as of October 23, 2008 and, except as required by applicable law, will not be publicly updated or revised. This cautionary statement expressly qualifies the forward-looking information in this quarterly report.
Management's Discussion and Analysis
PETRO-CANADA
Petro-Canada disclosure of reserves
Petro-Canada's qualified reserves evaluators prepare the reserves estimates the Company uses. The Canadian provincial securities commissions do not consider Petro-Canada’s reserves staff and management as independent of the Company. Petro-Canada has obtained an exemption from certain Canadian reserves disclosure requirements that allows Petro-Canada to make disclosure in accordance with SEC standards where noted in this quarterly report. This exemption allows comparisons with U.S. and other international issuers.
As a result, Petro-Canada formally discloses its proved reserves data using U.S. requirements and practices, and these may differ from Canadian domestic standards and practices. The use of the terms such as "probable," "possible,” “resources” and “life-of-field production” in this quarterly report does not meet the SEC guidelines for SEC filings. To disclose reserves in SEC filings, oil and gas companies must prove they are economically and legally producible under existing economic and operating conditions. Note that when the term barrel of oil equivalent (boe) is used in this quarterly report, it may be misleading, particularly if used in isolation. A boe conversion ratio of six thousand cubic feet (Mcf) to one barrel (bbl) is based on an energy equivalency conversion method. This method primarily applies at the burner tip and does not represent a value equivalency at the wellhead.
The table below describes the industry definitions that Petro-Canada currently uses:
| Definitions Petro-Canada uses | | Reference |
| | | |
| Proved oil and natural gas reserves (includes both proved developed and proved undeveloped) | | SEC reserves definition (Accounting Rules Regulation S-X 210.4-10, U.S. Financial Accounting Standards Board (FASB) Statement No. 69) SEC Guide 7 for Oilsands Mining |
| | | |
| Unproved reserves, probable and possible reserves | | Canadian Securities Administrators: Canadian Oil and Gas Evaluation (COGE) Handbook, Vol. 1 Section 5 prepared by the Society of Petroleum Evaluation Engineers (SPEE) and the Canadian Institute of Mining Metallurgy and Petroleum (CIM) |
| | | |
| Contingent and Prospective Resources | | Petroleum Resources Management System: Society of Petroleum Engineers, SPEE, World Petroleum Congress and American Association of Petroleum Geologist definitions (approved March 2007) Canadian Securities Administrators: COGE Handbook Vol. 1 Section 5 |
Although the Society of Petroleum Engineers resource classification has categories of 1C, 2C, 3C for Contingent Resources, and low, best and high estimates for Prospective Resources, Petro-Canada will only refer to the 2C for Contingent Resources and the risked (an assessment of the probability of discovering the resources) best estimate for Prospective Resources when referencing resources in this quarterly report. Canadian Oil Sands represents approximately 71% of Petro-Canada’s total for Contingent and Prospective Resources. The balance of Petro-Canada’s resources is spread out across the business, most notably in the North American frontier and International areas. Also, when Petro-Canada references resources for the Company, Contingent Resources are approximately 53% and risked Prospective Resources are approximately 47% of the Company’s total resources.
Cautionary statement: In the case of discovered resources or a subcategory of discovered resources other than reserves, there is no certainty that it will be commercially viable to produce any portion of the resources. In the case of undiscovered resources or a subcategory of undiscovered resources, there is no certainty that any portion of the resources will be discovered. If discovered, there is no certainty that it will be commercially viable to produce any portion of the resources.
For movement of resources to reserves categories, all projects must have an economic depletion plan and may require
| · | additional delineation drilling and/or new technology for oil sands mining, in situ and conventional Contingent and risked Prospective Resources prior to project sanction and regulatory approvals; and |
| · | exploration success with respect to conventional risked Prospective Resources prior to project sanction and regulatory approvals. |
Reserves and resources information contained in this quarterly report is as at December 31, 2007.
Management's Discussion and Analysis
PETRO-CANADA
BUSINESS ENVIRONMENT
Market prices shown below influence average prices realized for crude oil and natural gas liquids (NGL), natural gas and petroleum products in the tables on pages 20 and 21.
UPSTREAM
Crude Oil
| The price of Dated Brent averaged $114.78 US/bbl in the third quarter of 2008, up 53% compared with $74.87 US/bbl in the third quarter of 2007. Concern about global oil demand outpacing supply gains, combined with geopolitics and speculation, led to record high oil prices in July 2008. However, financial market distress and an outflow of investment funds from commodity markets resulted in steep price declines through August and September 2008. During the third quarter of 2008, the Canadian dollar averaged $0.96 US, relatively unchanged from the third quarter of 2007. As a result, Petro-Canada’s corporate-wide realized Canadian dollar prices for crude oil and NGL increased 54%, from $74.32/bbl in the third quarter of 2007 to $114.11/bbl in the third quarter of 2008. |
In the third quarter of 2008, the spread between Dated Brent and Mexican Maya narrowed to $8.34 US/bbl, compared with $11.80 US/bbl in the third quarter of 2007. In Canada, the spread between Edmonton Light and Western Canada Select (WCS) narrowed to $18.34/bbl in the third quarter of 2008, compared with $24.35/bbl in the third quarter of 2007.
Natural Gas
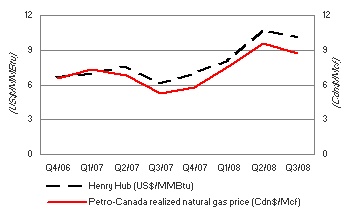
| North American natural gas prices at the Henry Hub were higher in the third quarter of 2008, compared with the third quarter of 2007, reflecting favourable weather and partly in response to record oil prices. In the third quarter of 2008, NYMEX Henry Hub natural gas prices averaged $10.09 US/million British thermal units (MMBtu), up 65% from $6.13 US/MMBtu in the third quarter of 2007. Gains in Canadian gas prices were similar. Petro-Canada’s realized Canadian dollar prices for its North American Natural Gas business averaged $8.41/Mcf in the third quarter of 2008, up 63% from $5.17/Mcf in the third quarter of 2007. |
Management's Discussion and Analysis
PETRO-CANADA
DOWNSTREAM
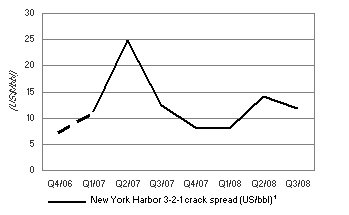
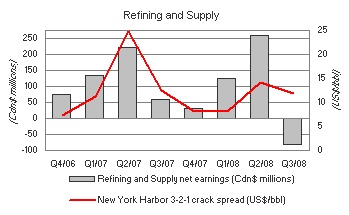
| New York Harbor 3-2-1 refinery crack spreads averaged $11.82 US/bbl in the third quarter of 2008, down 5% compared with an average of $12.41 US/bbl in the third quarter of 2007. Weaker gasoline cracks resulted from declining demand and greater ethanol penetration, although shortages due to hurricanes Gustav and Ike caused a temporary increase to margins. Heating oil crack spreads rose, compared with the third quarter of 2007, due to continued growth in global distillate demand, especially diesel products. |
| 1 | On January 1, 2007, the New York Harbor 3-2-1 crack spread calculation changed. It is now based on Reformulated Gasoline Blendstock for Oxygenate Blending (RBOB) gasoline (the base for blending gasoline with 10% denatured ethanol) as opposed to conventional gasoline. Due to this change in specification, 2007 and 2008 crack spread values are not directly comparable to 2006 values. |
The average market prices for the periods stated were:
| | | Three months ended September 30, | | Nine months ended September 30, | |
| | | 2008 | | 2007 | | 2008 | | 2007 | |
Dated Brent at Sullom Voe (US$/bbl) | | 114.78 | | | 74.87 | | | 111.02 | | | 67.13 | |
West Texas Intermediate (WTI) at Cushing (US$/bbl) | | 117.98 | | | 75.38 | | | 113.29 | | | 66.19 | |
Dated Brent/Maya FOB price differential (US$/bbl) | | 8.34 | | | 11.80 | | | 14.16 | | | 12.55 | |
Edmonton Light (Cdn$/bbl) | | 122.31 | | | 80.22 | | | 115.71 | | | 73.42 | |
Edmonton Light/WCS FOB price differential (Cdn$/bbl) | | 18.34 | | | 24.35 | | | 21.05 | | | 21.54 | |
Natural gas at Henry Hub (US$/MMBtu) | | 10.09 | | | 6.13 | | | 9.66 | | | 6.88 | |
Natural gas at AECO (Cdn$/Mcf) | | 9.64 | | | 5.85 | | | 8.94 | | | 7.10 | |
New York Harbor 3-2-1 crack spread (US$/bbl) | | 11.82 | | | 12.41 | | | 11.32 | | | 16.14 | |
Exchange rate (US cents/Cdn$) | | 96.0 | | | 95.7 | | | 98.2 | | | 90.5 | |
| Average realized prices | | | | | | | | | | | | |
Crude oil and NGL ($/barrel – $/bbl) | | 114.11 | | | 74.32 | | | 107.85 | | | 69.42 | |
Natural gas ($/thousand cubic feet – $/Mcf) | | 8.68 | | | 5.28 | | | 8.60 | | | 6.47 | |
Management's Discussion and Analysis
PETRO-CANADA
The following table shows the estimated after-tax effects that changes in certain factors would have had on Petro-Canada’s 2007 net earnings had these changes occurred. Amounts are in Canadian dollars unless otherwise specified.
Factor 1, 2 | | Change (+) | | | Annual net earnings impact | | | Annual net earnings impact | |
| | | | | | (millions of dollars) | | | ($/share) 3 | |
| Upstream | | | | | | | | | |
Price received for crude oil and NGL 4 | | $1.00/bbl | | | $ | 52 | | | $ | 0.11 | |
| Price received for natural gas | | $0.25/Mcf | | | | 30 | | | | 0.06 | |
Exchange rate: US$/Cdn$ refers to impact on upstream earnings5 | | $0.01 | | | | (40 | ) | | | (0.08 | ) |
Crude oil and NGL production (barrels/day – b/d) | | 1,000 b/d | | | | 10 | | | | 0.02 | |
Natural gas production (million cubic feet/day – MMcf/d) | | 10 MMcf/d | | | | 7 | | | | 0.01 | |
| Downstream | | | | | | | | | | | |
| New York Harbor 3-2-1 crack spread | | $1.00 US/bbl | | | | 22 | | | | 0.05 | |
| Chicago 3-2-1 crack spread | | $1.00 US/bbl | | | | 24 | | | | 0.05 | |
| Seattle 3-2-1 crack spread | | $1.00 US/bbl | | | | 7 | | | | 0.01 | |
| WTI/Dated Brent price differential | | $1.00 US/bbl | | | | 25 | | | | 0.05 | |
| Dated Brent/Maya FOB price differential | | $1.00 US/bbl | | | | 6 | | | | 0.01 | |
| Edmonton Light/Synthetic price differential | | $1.00 Cdn/bbl | | | | 13 | | | | 0.03 | |
Exchange rate: US$/Cdn$ refers to impact on Downstream cracking margins and crude price differentials 6 | | $0.01 | | | | (11 | ) | | | (0.02 | ) |
| Natural gas fuel cost – AECO natural gas price | | $1.00 Cdn/Mcf | | | | (11 | ) | | | (0.02 | ) |
| Asphalt – % of Maya crude oil price | | 1% | | | | 2 | | | | – | |
| Heavy fuel oil (HFO) – % of WTI crude oil price | | 1% | | | | 2 | | | | – | |
| Corporate | | | | | | | | | | | | |
Exchange rate: US$/Cdn$ refers to impact of the revaluation of U.S. dollar-denominated long-term debt 7 | | $ | 0.01 | | | $ | 10 | | | $ | 0.02 | |
| 1 | The impact of a change in one factor may be compounded or offset by changes in other factors. This table does not consider the impact of any inter-relationship among the factors. |
| 2 | The impact of these factors is illustrative. |
| 3 | Per share amounts are based on the number of shares outstanding as at December 31, 2007. |
| 4 | This sensitivity is based upon an equivalent change in the price of WTI and Dated Brent, excluding the derivative contracts associated with the Buzzard acquisition that were closed out in the fourth quarter of 2007. |
| 5 | A strengthening Canadian dollar compared with the U.S. dollar has a negative effect on upstream net earnings. |
| 6 | A strengthening Canadian dollar compared with the U.S. dollar has a negative effect on Downstream cracking margins and crude price differentials. |
| 7 | A strengthening Canadian dollar versus the U.S. dollar has a positive effect on corporate earnings with respect to the Company’s U.S. denominated debt. The impact refers to gains or losses on $1.4 billion US of the Company’s U.S. denominated long-term debt and interest costs on U.S. denominated debt. Gains or losses on $1.1 billion US of the Company’s U.S. denominated long-term debt, associated with the self-sustaining International business segment and the U.S. Rockies operations included in the North American Natural Gas business unit, are deferred and included as part of shareholders’ equity. |
Management's Discussion and Analysis
PETRO-CANADA
BUSINESS STRATEGY
Petro-Canada's strategy is to create shareholder value by delivering long-term, profitable growth and improving the profitability of the base business.
Petro-Canada’s capital program supports bringing on seven major projects over the next several years to deliver long-term profitable growth. For the remainder of 2008, the Company expects to start up the project to convert the Edmonton refinery to process lower cost, oil sands-based feedstock, and to make a final investment decision (FID) on the Fort Hills mining and upgrading project. An investment decision on the Montreal coker project is pending resolution of the labour dispute. The Company and its partners also plan to advance the following upstream projects: the MacKay River in situ expansion, the extension of the White Rose field off the East Coast of Canada, the Syria Ebla gas project and the developments associated with the new Libya Exploration and Production Sharing Agreements (EPSAs). The Company anticipates upstream production will significantly increase as these big projects come on-stream. These projects are expected to add significant earnings and cash flow.
Petro-Canada continually works to strengthen its base business by improving the safety, reliability and efficiency of its operations. For the remainder of 2008, the Company is focused on delivering upstream production in line with guidance.
| Strategic Priorities | Quarterly Update |
DELIVERING PROFITABLE GROWTH WITH A FOCUS ON OPERATED, LONG-LIFE ASSETS | · completed construction of the Edmonton refinery conversion project (RCP), with the refinery on track for startup
in the fourth quarter of 2008 · executed formal agreements with the Government of Newfoundland and Labrador to allow development activities for the Hebron offshore oil project to proceed · released updated cost information for the Fort Hills project, which suggested estimated all-in capital costs of $18.8 billion (including third party costs) for the project, as currently conceived, have increased in the range of 50% from the initial Design Basis Memorandum announced in June 2007 |
DRIVING FOR FIRST QUARTILE OPERATION OF OUR ASSETS | · achieved 89% facility reliability at Terra Nova · maintained reliability at 99% for Western Canada natural gas processing facilities · operated MacKay River at 98% reliability · delivered a combined reliability index of 88 at all three Downstream production facilities · saw convenience store sales increase by 1.4% and same-store sales decline by 0.8%, compared with the third
quarter of 2007 |
MAINTAINING FINANCIAL DISCIPLINE AND FLEXIBILITY | · declared a 54% increase in the quarterly dividend to $0.20/share commencing on October 1, 2008 · effectively unwound Petro-Canada’s $480 million accounts receivable securitization program due to it no longer being a cost-effective means of borrowing · ended the quarter with debt levels at 20.4% of total capital and a ratio of 0.9 times debt-to-cash flow from
operating activities |
CONTINUING TO WORK AT BEING A RESPONSIBLE COMPANY | · experienced total recordable injury frequency (TRIF) of 0.67 in the first nine months of 2008, an improvement from a TRIF of 0.87 for the full year in 2007 · experienced a contractor work-related fatality at the Edmonton RCP in September 2008 |
STRATEGIC MILESTONES
| Q4 2008 | Q1 2009 | Q2 2009 |
| ▼ | ▼ | ▼ |
| | | |
· commence startup of the Edmonton RCP project · anticipate receipt of a decision on the Fort Hills mine plan amendment application · anticipate receipt of a regulatory decision on the Fort Hills Sturgeon Upgrader · expect to make FID on the Fort Hills integrated mining and upgrading project · expect to make FID on potential 25,000 b/d coker at Montreal refinery, subject to labour dispute resolution | · expect to make FID on the MacKay River expansion
project | · plan to commence Libya exploration drilling program |
Management's Discussion and Analysis
PETRO-CANADA
ANALYSIS OF CONSOLIDATED EARNINGS
Earnings Variances
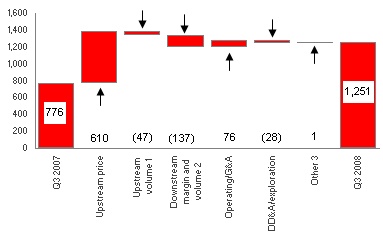
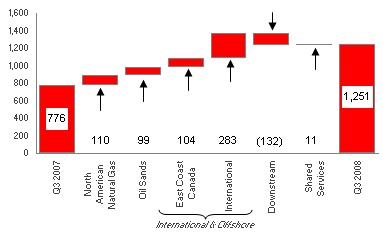
| | Q3/08 VERSUS Q3/07 FACTOR ANALYSIS |
| | (millions of Canadian dollars, after-tax) |
| Net earnings increased 61% to $1,251 million ($2.58/share) in the third quarter of 2008, compared with $776 million ($1.59/share) in the third quarter of 2007. Strong realized crude oil and natural gas prices and lower operating, general and administrative (G&A) and other3 expenses contributed to higher net earnings. These factors were partially offset by lower upstream volumes1, decreased Downstream margins2 and increased depreciation, depletion and amortization (DD&A) and exploration expenses. |
| 1 | Upstream volumes included the portion of DD&A expense associated with changes in upstream production levels. |
| 2 | Downstream margin and volume included the impact on realized margins from fluctuating crude oil feedstock costs while using a “first-in, first-out” (FIFO) inventory valuation methodology. |
| 3 | Other mainly included the change in fair value of the Buzzard derivative contracts (applies to 2007 and prior only), foreign currency translation, interest expense, changes in effective tax rates, gain on sale of assets, insurance proceeds and upstream inventory movements. |
| (millions of Canadian dollars, after-tax) |
| The increase in third quarter net earnings on a segmented basis reflected higher North American Natural Gas, Oil Sands, East Coast Canada, International and Shared Services net earnings, partially offset by a net loss in the Downstream. |
During the third quarter of 2008, cash flow from operating activities was $1,279 million ($2.64/share), down 5% from $1,340 million ($2.75/share) in the same quarter of 2007. The decrease in cash flow from operating activities primarily reflected cash remittances under the accounts receivable securitization program, partially offset by higher net earnings.
Management's Discussion and Analysis
PETRO-CANADA
Quarterly Financial Information
| | | Three months ended | |
| (millions of Canadian dollars, except per share amounts) | | Sept. 30 2008 | | | June 30 2008 | | | March 31 2008 | | | Dec. 31 2007 | | | Sept. 30 2007 | | | June 30 2007 | | | March 31 2007 | | | Dec. 31 2006 | |
| Total revenue | | $ | 8,286 | | | $ | 7,646 | | | $ | 6,586 | | | $ | 5,434 | | | $ | 5,497 | | | $ | 5,478 | | | $ | 4,841 | | | $ | 4,550 | |
| | | | | | | | | | | | | | | | | | | | | | | | | | | | | | | | | |
| Net earnings | | $ | 1,251 | | | $ | 1,498 | | | $ | 1,076 | | | $ | 522 | | | $ | 776 | | | $ | 845 | | | $ | 590 | | | $ | 384 | |
| Per share – basic | | | 2.58 | | | | 3.10 | | | | 2.22 | | | | 1.08 | | | | 1.59 | | | | 1.71 | | | | 1.19 | | | | 0.77 | |
– diluted | | | 2.56 | | | | 3.07 | | | | 2.20 | | | | 1.07 | | | | 1.58 | | | | 1.70 | | | | 1.18 | | | | 0.76 | |
UPSTREAM
Production
Petro-Canada converts volumes of natural gas to oil equivalent at a rate of six Mcf of natural gas to one bbl of oil. Production volumes disclosed refer to net working interest before royalties, unless otherwise specified.
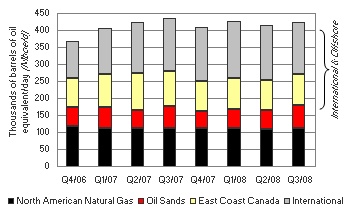
| In the third quarter of 2008, production averaged 424,000 barrels of oil equivalent per day (boe/d) net to Petro-Canada, down from 436,000 boe/d net in the same quarter of 2007. Lower volumes reflected decreased East Coast Canada and International production, partially offset by increased Oil Sands production. North American Natural Gas production was relatively unchanged. |
Exploration Update
For the first nine months of 2008, Petro-Canada and its partners finished operations on 14 of the up to 17 wells planned for the year. Three of the wells were completed as natural gas discoveries (Gubik-3 in the Alaska Foothills, Sancoche on Block 22 offshore Trinidad and Tobago, and van Ghent in the Netherlands sector of the North Sea). One well was completed as an oil discovery (Pink in the United Kingdom (U.K.) sector of the North Sea). Two successful appraisal wells were completed (Cassra-2 on Block 22 offshore Trinidad and Tobago, and Farigh 14-12 in Libya). Two wells were completed as non-commercial discoveries (Maria in the U.K. sector of the North Sea and L5a-11 in the Netherlands sector of the North Sea). Drilling of the Chandler-1 well in the Alaska Foothills was suspended, as planned, for re-entry next season. Five wells were dry and abandoned (Kwijika in the Northwest Territories, Gemini in the U.K. sector of the North Sea, Tegu in Block 1a offshore Trinidad and Tobago, Bene on Block 22 offshore Trinidad and Tobago, and Trow in the Norwegian sector of the North Sea).
North American Natural Gas
North American Natural Gas facilities continued to operate reliably in the third quarter of 2008, enabling the business to capture the value of higher natural gas, crude oil and sulphur prices.
| | | Three months ended September 30, | | | Nine months ended September 30, | |
| (millions of Canadian dollars) | | 2008 | | | 2007 | | | 2008 | | | 2007 | |
| Net earnings | | $ | 165 | | | $ | 55 | | | $ | 339 | | | $ | 248 | |
| Cash flow from operating activities | | $ | 269 | | | $ | 155 | | | $ | 847 | | | $ | 561 | |
North American Natural Gas recorded net earnings of $165 million in the third quarter of 2008, compared with net earnings of $55 million in the third quarter of 2007. Higher realized prices and lower exploration expenses were partially offset by higher operating and DD&A expenses.
Management's Discussion and Analysis
PETRO-CANADA
North American Natural Gas Production and Pricing
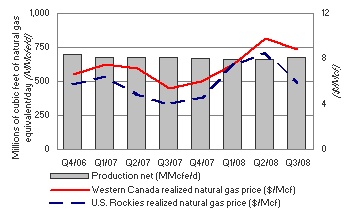
| In the third quarter of 2008, North American Natural Gas production was relatively unchanged, compared with the same period in 2007. Production reflected higher natural gas production in the U.S. Rockies and strong performance in Western Canada. Realized natural gas prices in Western Canada and the U.S. Rockies increased 65% and 49%, respectively, in the third quarter of 2008, compared with the same quarter of 2007, consistent with market price trends. |
| | | Third Quarter 2008 | | | Third Quarter 2007 | |
Production net (MMcfe/d) 1 | | | | | | |
Western Canada | | | 572 | | | | 586 | |
U.S. Rockies | | | 102 | | | | 89 | |
| Total North American Natural Gas production net | | | 674 | | | | 675 | |
Western Canada realized natural gas price (Cdn$/Mcf) 1 | | $ | 8.81 | | | $ | 5.35 | |
U.S. Rockies realized natural gas price (Cdn$/Mcf) 1 | | $ | 5.89 | | | $ | 3.96 | |
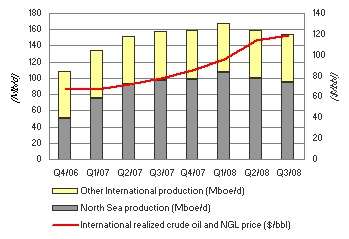
| | 1 | For North American Natural Gas crude oil and NGL and natural gas production and average realized prices, refer to the charts on pages 19 and 20, respectively. |
Petro-Canada operated gas plants and facilities in Western Canada delivered 99% reliability in the third quarter of 2008.
Scheduled Turnarounds
No major turnarounds are planned for the remainder of 2008.
Oil Sands
Financial results were strong due to increased reliability and capability at MacKay River and high realized crude oil and bitumen prices.
| | | Three months ended September 30, | | | Nine months ended September 30, | |
| (millions of Canadian dollars) | | 2008 | | | 2007 | | | 2008 | | | 2007 | |
| Net earnings | | $ | 209 | | | $ | 110 | | | $ | 498 | | | $ | 187 | |
| Cash flow from operating activities | | $ | 77 | | | $ | 176 | | | $ | 405 | | | $ | 405 | |
In the third quarter of 2008, Oil Sands net earnings were $209 million, up from $110 million in the third quarter of 2007. Higher realized prices and production were partially offset by higher operating costs. Net earnings in the third quarter of 2008 included a $38 million before-tax ($26 million after-tax) write-down of crude oil inventory purchased for line fill for the Edmonton RCP.
Management's Discussion and Analysis
PETRO-CANADA
Oil Sands Production and Pricing
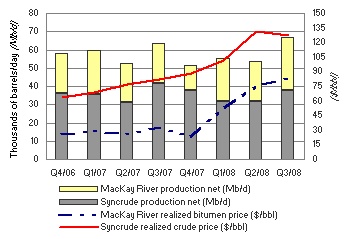
| Syncrude production was down 9% in the third quarter of 2008, compared with the third quarter of 2007. In the third quarter of 2008, production was impacted by a planned 45-day turnaround of Coker 8-2 that began in early September. Syncrude realized prices were 56% higher in the third quarter of 2008, compared with the third quarter of 2007. MacKay River production was up 32% in the third quarter of 2008, compared with the same period of 2007, due to increased reliability and capability. MacKay River realized bitumen prices increased 157% in the third quarter of 2008, compared with the third quarter of 2007, due to higher WTI prices combined with a narrowing of the light/heavy crude price differential. |
| | Third Quarter 2008 | | | Third Quarter 2007 | |
Production net (b/d) | | | | | | |
Syncrude | | | 37,900 | | | | 41,800 | |
MacKay River | | | 29,000 | | | | 22,000 | |
| Total Oil Sands production net | | | 66,900 | | | | 63,800 | |
Syncrude realized crude price ($/bbl) | | $ | 127.24 | | | $ | 81.77 | |
MacKay River realized bitumen price ($/bbl) | | $ | 83.51 | | | $ | 32.48 | |
The planned 45-day turnaround of Coker 8-2 at Syncrude began on September 5, 2008 and is on schedule for completion in October 2008. Syncrude resolved operational issues with the sulphur plants in July 2008.
In the third quarter of 2008, operations at MacKay River continued to be strong, with reliability averaging 98%. As a result of improving reliability, MacKay River achieved an average monthly production record of 29,700 b/d in September 2008.
Fort Hills Project
The first phase of the Fort Hills project is planned to produce 140,000 b/d gross of synthetic crude oil (84,000 b/d net). Associated bitumen production is expected to be about 160,000 b/d gross (96,000 b/d net). First bitumen production is expected to begin in the fourth quarter of 2011, with first synthetic crude oil production from the Sturgeon Upgrader anticipated in the second quarter of 2012. The estimated all-in capital costs for the Fort Hills project, as currently conceived, are expected to increase by approximately 50% from the initial estimate of $18.8 billion (including third party costs) announced in June 2007. The partners are looking at different configurations and timing options to arrive at the best project combination. In the near-term, the partners contemplate making an investment decision only with respect to the mining portion of the project and deferring a decision to construct the upgrader portion, which would substantially reduce project costs prior to first oil. The partners remain committed to mine production in 2011.
Petro-Canada and its partners in the Fort Hills project have ordered long-lead items, such as coke drums, fractionating columns, reactors, crushers and breakers, cable shovels, 400-tonne haul trucks and materials for construction camps. The preliminary regulatory hearing for the Sturgeon Upgrader was completed in early July 2008. In August 2008, the Energy Resources Conservation Board (ERCB) requested additional information on the proposal to construct one or more work camps for the Fort Hills Sturgeon Upgrader site. After reviewing responses from various interested parties, the ERCB has decided to resume the hearing for the proposed upgrader to address additional information regarding work camps only. This hearing took place in October 2008. A final regulatory decision covering all aspects of the upgrader is anticipated in the fourth quarter of 2008. The partnership anticipates receiving a regulatory decision on an amendment to the approved mine plan, which incorporates improvements identified through the mine plan optimization process, in the fourth quarter of 2008. With a definitive cost estimate, upgrader regulatory approval and partner approvals in place, a decision on how best to proceed is expected by year-end 2008.
MacKay River Expansion Project
In the first quarter of 2008, the Company received regulatory approval for the proposed MacKay River 40,000 b/d in situ expansion project. Petro-Canada continues to refine the design for the project, to evaluate opportunities for integration with the Fort Hills project and to pursue cost-saving opportunities associated with using international engineering, procurement and construction contractors. At the end of the third quarter of 2008, the Company was receiving and reviewing lump sum construction bid contracts. FID is expected in the first quarter of 2009.
Management's Discussion and Analysis
PETRO-CANADA
Scheduled Turnarounds
There are no major turnarounds planned at Syncrude or MacKay River for the remainder of 2008.
Other Developments
Petro-Canada and its partners in Syncrude remain in negotiations with the Government of Alberta regarding the province’s desire for Syncrude to move to the New Alberta Royalty Framework in advance of the expiry of Syncrude’s existing royalty agreement in 2016.
International & Offshore
East Coast Canada
The White Rose Extensions project advanced with completion of FEED for the North Amethyst portion and commencement of the detailed design.
| | | Three months ended September 30, | | | Nine months ended September 30, | |
| (millions of Canadian dollars) | | 2008 | | | 2007 | | | 2008 | | | 2007 | |
Net earnings 1 | | $ | 397 | | | $ | 293 | | | $ | 1,157 | | | $ | 883 | |
| Cash flow from operating activities | | $ | 348 | | | $ | 403 | | | $ | 1,503 | | | $ | 1,230 | |
| 1 | East Coast Canada crude oil inventory movements increased (decreased) net earnings by $3 million before-tax ($2 million after-tax) and $(60) million before-tax ($(41) million after-tax) for the three and nine months ended September 30, 2008, respectively. The same factor increased net earnings by $23 million before-tax ($15 million after-tax) and $48 million before-tax ($32 million after-tax) for the three and nine months ended September 30, 2007, respectively. |
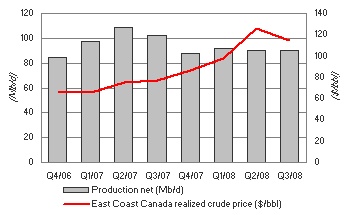
Net earnings for East Coast Canada were $397 million in the third quarter of 2008, up from $293 million in the third quarter of 2007. Higher realized prices were partially offset by lower production and higher royalty payments.
East Coast Canada Production and Pricing
| In the third quarter of 2008, East Coast Canada production decreased 11%, compared with the same period in 2007. Terra Nova’s production was lower due to a planned overhaul of one of the main power generators, seal repairs in a gas lift riser and natural declines. White Rose volumes were lower due to the impact of an unplanned shutdown in September 2008 as a result of tanker offloading issues. These reductions were partially offset by slightly higher Hibernia production due to the positive impact of recent well workovers and strong reliability, which offset natural declines. During the third quarter of 2008, East Coast Canada realized crude prices increased 49%, compared with the third quarter of 2007. |
| | Third Quarter 2008 | | | Third Quarter 2007 | |
Production net (b/d) | | | | | | |
Terra Nova | | | 33,900 | | | | 44,300 | |
Hibernia | | | 28,900 | | | | 27,900 | |
White Rose | | | 27,800 | | | | 29,900 | |
| Total East Coast Canada production net | | | 90,600 | | | | 102,100 | |
Average realized crude price ($/bbl) | | $ | 114.76 | | | $ | 76.83 | |
Management's Discussion and Analysis
PETRO-CANADA
The Terra Nova Floating Production, Storage and Offloading (FPSO) vessel operated at 89% facility reliability in the third quarter of 2008. During the third quarter of 2008, one of the two main power generators on the FPSO was taken out of service for a planned major overhaul. This decreased the power available on the platform and, as a result, reduced production. Performance of the Terra Nova FPSO swivel was unchanged in the third quarter of 2008. All equipment and materials are in place to repair the swivel, if necessary.
Scheduled Turnarounds
No major turnarounds are planned for the remainder of 2008.
White Rose Extensions Development
Early in the second quarter of 2008, the partners received regulatory approval for the North Amethyst development, and the Company approved the project to proceed. FEED for the North Amethyst portion of the project is complete and fabrication is underway. North Amethyst drilling is expected to begin in the fourth quarter of 2008. Engineering and procurement on the project continue to advance, and the project is on schedule to deliver first oil in late 2009 or early 2010. North Amethyst is the first of three identified extensions to the original White Rose field.
Hebron
During the third quarter of 2008, the Hebron partners reached an agreement with the provincial government on commercial terms that will allow development activities to proceed for Hebron. The partners also agreed to transfer operatorship from Chevron Canada Ltd. to ExxonMobil.
East Coast Canada Royalties
In the third quarter of 2008, East Coast Canada royalties averaged 25% of gross revenue, compared with 18% in the third quarter of 2007. Terra Nova production was subject to Tier I royalties of 30% of net revenue and a Tier II royalty of an incremental 12.5% of net revenue, which was triggered during the second quarter of 2008. White Rose production was subject to a Tier I royalty of 20% of net revenue and a Tier II royalty of an incremental 10% of net revenue, which was triggered during the first quarter of 2008. Production from Hibernia continued to be subject to basic royalties of 5% of gross revenue.
International
The business had a strong financial quarter due to the robust operating performance at Buzzard and higher realized prices.
| | | Three months ended September 30, | | | Nine months ended September 30, | |
| (millions of Canadian dollars) | | 2008 | | | 2007 | | | 2008 | | | 2007 | |
Net earnings 1, 2 | | $ | 483 | | | $ | 200 | | | $ | 1,491 | | | $ | 404 | |
| Cash flow from operating activities | | $ | 543 | | | $ | 455 | | | $ | 2,080 | | | $ | 1,088 | |
| 1 | International crude oil inventory movements increased net earnings by $12 million before-tax ($7 million after-tax) and by $88 million before-tax ($18 million after-tax) for the three and nine months ended September 30, 2008, respectively. The same factor increased net earnings by $58 million before-tax ($13 million after-tax) and $28 million before-tax ($6 million after-tax) for the three and nine months ended September 30, 2007, respectively. |
| 2 | During the fourth quarter of 2007, the Company entered into derivative contracts to close out the hedged portion of its Buzzard production from January 1, 2008 to December 31, 2010. |
In the third quarter of 2008, International delivered net earnings of $483 million, compared with $200 million in the third quarter of 2007. The increase in net earnings was due to higher realized prices, foreign exchange gains and lower operating and DD&A expenses, partially offset by lower production and increased exploration expenses. Increased exploration expenses were due to well write-offs in Trinidad and Tobago, and Norway. Net earnings in the third quarter of 2007 included a $70 million unrealized gain and an $87 million realized loss on the Buzzard derivative contracts.
Management's Discussion and Analysis
PETRO-CANADA
International Production and Pricing
| International production decreased 2% in the third quarter of 2008, compared with the third quarter of 2007. In the third quarter of 2008, production from the North Sea decreased by 3%, reflecting natural declines in several North Sea assets and a planned turnaround on the Triton facility in August. These factors were partially offset by higher Buzzard production due to strong operating performance and the weather-related deferral of a seven- to nine-day turnaround planned for August. Other International production decreased 1% in the third quarter of 2008, compared with the third quarter of 2007. |
| | Third Quarter 2008 | | | Third Quarter 2007 | |
Production net (boe/d) | | | | | | |
U.K. sector of the North Sea | | | 75,000 | | | | 75,200 | |
The Netherlands sector of the North Sea | | | 19,700 | | | | 22,100 | |
North Sea | | | 94,700 | | | | 97,300 | |
Other International | | | 59,400 | | | | 59,900 | |
| Total International production net | | | 154,100 | | | | 157,200 | |
Average realized crude oil and NGL prices ($/bbl) | | $ | 118.78 | | | $ | 77.33 | |
Average realized natural gas price ($/Mcf) | | $ | 10.60 | | | $ | 5.91 | |
International operations’ realized crude oil and NGL prices increased 54% in the third quarter of 2008, compared with the same period in 2007. Realized prices for natural gas increased 79% in the third quarter of 2008, compared with the same period in the prior year.
North Sea
Buzzard production averaged 204,300 boe/d gross (61,100 boe/d net) from 11 production wells in the third quarter of 2008, up compared with the same quarter of 2007. The Frigg transportation system, which transports Buzzard's natural gas production to market, completed a planned maintenance turnaround in early July 2008. During this period of reduced pipeline availability, the Buzzard drilling jack-up rig was demobilized from the platform for planned maintenance and recertification. Buzzard had planned to commence a further turnaround in August for the reinstallation of the jack-up rig, but weather delayed this turnaround until early in the fourth quarter of 2008. Work on detailed engineering and ordering of long-lead items is underway for the fourth platform, which is being built to treat higher than expected hydrogen sulphide content in some Buzzard wells.
In the Netherlands sector of the North Sea, the Petro-Canada operated De Ruyter and Hanze facilities continued to perform well, delivering 26,700 boe/d gross (13,700 boe/d net) of production in the third quarter of 2008.
In the third quarter of 2008, the Company completed a sales and purchase agreement with Bayerngas Norge AS for the sale of all the Company’s interests in Denmark for net proceeds of $140 million, resulting in a $107 million ($82 million after-tax) gain on the sale of these assets. The sale of all of Petro-Canada’s interests in Denmark is consistent with the International & Offshore business unit strategy to optimize the portfolio by reducing participation in countries where the Company cannot foresee developing a material position.
Other International
Production in Libya averaged 49,600 boe/d in the third quarter of 2008, up slightly from 49,100 boe/d in the same quarter of 2007 due to improved production performance at the Amal field.
Trinidad and Tobago offshore gas production averaged 59 MMcf/d in the third quarter of 2008, down compared with 65 MMcf/d in the third quarter of 2007. The decrease was due to increased downtime for maintenance at Atlantic LNG facilities and lower deliveries to allow rebalancing of mutual aid provided to other suppliers earlier in the year.
Management's Discussion and Analysis
PETRO-CANADA
Syria Ebla Gas Project
Detailed engineering continues on the Syria Ebla gas project and field construction commenced in July 2008. The project was 35% complete at the end of the third quarter of 2008. An appraisal well was drilled and tested in the third quarter of 2008, resulting in better than expected production rates. A second rig was mobilized and 3D seismic operations began in August 2008. When completed, the Ebla gas project is expected to produce 80 MMcf/d of natural gas, with first gas anticipated in 2010.
Libya EPSAs
In June 2008, Petro-Canada signed six new EPSAs with the Libya National Oil Corporation (NOC) to replace existing concession agreements and one EPSA. The new EPSAs were ratified as of the signing, with an effective date of January 1, 2008. The commercial terms of the new agreements, including the signing bonus, match those announced when the heads of agreement were completed in December 2007. Under the new agreements, Petro-Canada will pay 50% of all development capital and will initially receive a 12% entitlement1 share of production. The Company will continue to report production on a before royalty working interest basis. The Company estimates there are gross Contingent and Prospective Resources2 of almost two billion barrels of oil associated with the redevelopment program. Following ratification of the new agreements, a payment of $500 million US, representing 50% of the signature bonus, was made to the Libya NOC in July 2008, with the remainder to be paid between 2009 and 2013.
The agreements will enable Petro-Canada to design and implement jointly with the NOC the redevelopment of major fields. Petro-Canada’s Libya EPSAs currently produce approximately 100,000 b/d gross (50,000 b/d net) on an annual average basis. Under the new agreements, production from the redevelopment program is expected to double over the next five to seven years.
The Company also proposes to invest $460 million US over the next seven years on a 100%-operated exploration program in the Sirte region, one of the world’s most prolific basins. Success from this exploration program could materially add to reserves and production.
Work has now commenced on implementing the projects associated with the new EPSAs, with a focus on preparing the Amal field development program, capturing early opportunities to increase production and initiating the new exploration program. Seismic operations have commenced with three seismic crews deployed by the end of the third quarter of 2008, and the Company expects to be drilling Petro-Canada’s first operated exploration well in the second quarter of 2009.
Scheduled Turnarounds
Due to weather delays in the third quarter of 2008, Buzzard is expected to commence its planned maintenance turnarounds of seven to nine days in the fourth quarter of 2008.
DOWNSTREAM
The Downstream successfully completed construction of the Edmonton RCP. Marketing performance was strong in the quarter, offset by lower Refining and Supply earnings.
| | Three months ended September 30, | | | Nine months ended September 30, | |
| (millions of Canadian dollars) | | 2008 | | | 2007 | | | 2008 | | | 2007 | |
| Net earnings (loss) | | $ | (27 | ) | | $ | 105 | | | $ | 457 | | | $ | 548 | |
| Cash flow from (used in) operating activities | | $ | (89 | ) | | $ | 215 | | | $ | (64 | ) | | $ | 749 | |
The Downstream business recorded a net loss of $27 million in the third quarter of 2008, down from net earnings of $105 million in the same quarter of 2007. The net loss reflected the negative impact from declining crude oil feedstock costs while using a FIFO inventory valuation methodology. Also negatively impacting earnings were lower refinery yields, increased operating costs, higher fuel costs and lower gasoline cracking margins. These factors were partially offset by an increase in realized refining margins, higher distillate cracking margins and higher marketing margins.
1 Entitlement refers to Petro-Canada’s share of production after royalties and local taxes.
2 The resource number quoted does not include reserves and is approximately 75% Contingent Resources and 25% risked Prospective Resources.
Management's Discussion and Analysis
PETRO-CANADA
Downstream Net Earnings
| | Third Quarter 2008 | | | Third Quarter 2007 | |
Refining and Supply net earnings (loss) (millions of Canadian dollars) | | $ | (81 | ) | | $ | 58 | |
New York Harbor 3-2-1 crack spread (US$/bbl) | | $ | 11.82 | | | $ | 12.41 | |
Chicago 3-2-1 crack spread (US$/bbl) | | $ | 16.44 | | | $ | 17.91 | |
Seattle 3-2-1 crack spread (US$/bbl) | | $ | 14.70 | | | $ | 14.55 | |
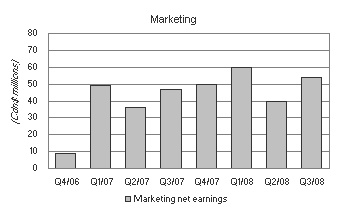
Marketing net earnings (millions of Canadian dollars) | | $ | 54 | | | $ | 47 | |
The average New York Harbor 3-2-1 refinery crack spread was $11.82 US/bbl in the third quarter of 2008, down from $12.41 US/bbl in the third quarter of 2007. The average international light/heavy crude price differential was $8.34 US/bbl in the third quarter of 2008, compared with $11.80 US/bbl in the third quarter of 2007.
In the third quarter of 2008, total sales of refined petroleum products decreased 2% to 4.8 billion litres, compared with the same period last year. The decrease reflected lower Marketing sales and reduced low-margin Refining and Supply sales, partially offset by higher lubricants sales volumes.
Refining and Supply recorded a net loss of $81 million in the third quarter 2008, down from net earnings of $58 million in the same quarter of 2007. Results were negatively impacted by the following five items, listed in order of impact. First, costs of sales were higher while using a FIFO inventory valuation methodology in a declining crude oil feedstock cost environment. Second, refinery yields in Edmonton were lower due to operational upsets and planned turnaround activity for the RCP. Third, operating costs increased because of maintenance and repair activity, planned turnarounds and environmental costs associated with the Quebec green levy. Fourth, fuel costs were higher. Fifth, gasoline cracking margins were lower. These factors were partially offset by higher realized refining margins for asphalt, lubricants and petrochemical and light oil products, and by higher distillate cracking margins.
Marketing contributed third quarter 2008 net earnings of $54 million, up compared with $47 million in the same quarter of 2007. In the third quarter of 2008, Marketing results reflected higher fuel margins, an increase in lubricants sales volumes and rising non-petroleum revenue. These factors were partially offset by increased operating expenses due to higher fuel costs associated with delivery and card fees.
Downstream Turnaround Activity
No major turnarounds are planned for the remainder of 2008.
Edmonton Refinery Conversion Project (RCP)
At the Edmonton refinery, the Company has invested to convert the facility to run oil sands-based feedstock. The RCP will enable Petro-Canada to directly upgrade up to 26,000 b/d of bitumen and process up to 48,000 b/d of sour synthetic crude oil, replacing the more expensive conventional light crude feedstock currently refined.
At the end of the third quarter of 2008, Petro-Canada had completed construction of the RCP and the refinery is on track for startup in the fourth quarter of 2008. During the turnaround period, the refinery operated under modified operations at approximately 35% of normal levels to limit the shortfall in light oil production. To accommodate the turnaround, the Company mitigated the impact of lost production on customers by entering time trades and purchasing additional finished product. Expenses associated with the turnaround are expected to be about $20 million after-tax.
Management's Discussion and Analysis
PETRO-CANADA
Change in Accounting for Inventory and Crude Oil and Product Purchases
On January 1, 2008, Petro-Canada adopted the FIFO method for valuing its crude oil and refined product inventories. The change is due to the “last-in, first-out” (LIFO) method no longer being permitted under Canadian generally accepted accounting principles (GAAP). As a result of changing from the LIFO inventory costing method to FIFO, a one-time adjustment to increase inventories by $812 million, future income tax liabilities by $256 million and retained earnings by $556 million was recorded. This adjustment occurred on January 1, 2008 and increased the Company’s working capital and Downstream capital employed values. A second impact relates to reported cost of crude oil and product purchases. The change in methodology reflects historic crude oil prices at the time the crude oil is purchased. Reported operating revenues continue to reflect current market prices when the crude oil is refined and sold. As a result of the lag between when crude oil is purchased and when product is sold, and fluctuating crude oil prices, future reported Downstream earnings may be more volatile.
CORPORATE
| Shared Services and Eliminations | | Three months ended September 30, | | | Nine months ended September 30, | |
| (millions of Canadian dollars) | | 2008 | | | 2007 | | | 2008 | | | 2007 | |
| Net earnings (loss) | | $ | 24 | | | $ | 13 | | | $ | (117 | ) | | $ | (59 | ) |
| Cash flow from (used in) operating activities | | $ | 131 | | | $ | (64 | ) | | $ | 422 | | | $ | (92 | ) |
Shared Services and Eliminations recorded net earnings of $24 million in the third quarter of 2008, compared with $13 million for the same period in 2007. Net earnings in the third quarter of 2008 included a $160 million recovery related to the mark-to-market valuation of stock-based compensation and an $18 million recovery related to the Downstream’s expected future margins for inventory purchased for line fill for the Edmonton RCP, partially offsetting inventory write-downs in Oil Sands. These factors were partially offset by a $103 million foreign currency translation loss on long-term debt and foreign exchange gains from transacting in U.S. dollars during the third quarter of 2008. The net loss in the third quarter of 2007 included a $10 million charge related to the mark-to-market valuation of stock-based compensation and a $78 million foreign currency translation gain on long-term debt.
Interest expense was $61 million before-tax during the third quarter of 2008, up from $39 million in the third quarter of the prior year. The Company capitalized $17 million of interest expense during the quarter, compared with $8 million in the third quarter of 2007.
Cash flow from operating activities was affected by tax deferrals, resulting from the Company’s upstream partnership. These deferrals increased cash flow from operating activities by about $70 million in the quarter, compared with an increase of $3 million in the same period last year. On January 1, 2008, the Company adopted the FIFO costing method for valuing its Downstream inventories, which is consistent with the method prescribed for income tax purposes, thereby eliminating the difference in earnings and cash flow from operating activities.
LIQUIDITY AND CAPITAL RESOURCES
Summary of Cash Flows
| | | Three months ended September 30, | | | Nine months ended September 30, | |
| (millions of Canadian dollars) | | 2008 | | | 2007 | | | 2008 | | | 2007 | |
| Cash flow from operating activities | | $ | 1,279 | | | $ | 1,340 | | | $ | 5,193 | | | $ | 3,941 | |
| Net cash (outflows) inflows from: | | | | | | | | | | | | | | | | |
Investing activities | | | (1,503 | ) | | | (877 | ) | | | (3,674 | ) | | | (2,450 | ) |
Financing activities | | | (96 | ) | | | (277 | ) | | | 171 | | | | (900 | ) |
| Increase (decrease) in cash and cash equivalents | | | (320 | ) | | | 186 | | | | 1,690 | | | | 591 | |
| Cash and cash equivalents | | $ | 1,921 | | | $ | 1,090 | | | $ | 1,921 | | | $ | 1,090 | |
Petro-Canada’s financing strategy is designed to maintain financial strength and flexibility to support profitable growth in all business environments. Two key measures that Petro-Canada uses to measure the Company’s overall financial strength are debt-to-cash flow from operating activities and debt-to-debt plus equity. Petro-Canada’s debt-to-cash flow from operating activities ratio, a key short-term leverage measure, was 0.9 times at September 30, 2008. This was within the Company’s target range of no more than 2.0 times. Debt-to-debt plus equity, the long-term measure for capital structure, was 20.4% at September 30, 2008, below the Company’s target range of 25% to 35%.
Management's Discussion and Analysis
PETRO-CANADA
| Financial Ratios | September 30, 2008 | December 31, 2007 | September 30, 2007 |
Debt-to-cash flow from operating activities (times) 1 | 0.9 | 1.0 | 0.5 |
Debt-to-debt plus equity (%) | 20.4 | 22.5 | 17.1 |
| 1 | Calculated on a 12-month rolling basis. |
Operating Activities
The operating working capital surplus was $501 million at the end of the third quarter of 2008, excluding cash and cash equivalents, the current portion of long-term debt and short-term notes payable, compared with an operating working capital deficiency of $565 million at December 31, 2007. The operating working capital surplus at September 30, 2008 primarily resulted from the increase in inventories due to the adoption of the FIFO method for valuing its inventories, the increase to accounts receivable due to the effective unwinding of the accounts receivable securitization program and the decrease in accounts payable and accrued liabilities due to the recovery related to the mark-to-mark valuation of stock-based compensation.
Investing Activities
| | | Three months ended September 30, | | | Nine months ended September 30, | |
| (millions of Canadian dollars) | | 2008 | | | 2007 | | | 2008 | | | 2007 | |
| Upstream | | | | | | | | | | | | |
North American Natural Gas | | $ | 199 | | | $ | 176 | | | $ | 457 | | | $ | 497 | |
Oil Sands | | | 286 | | | | 101 | | | | 689 | | | | 297 | |
International & Offshore | | | | | | | | | | | | | | | | |
East Coast Canada | | | 112 | | | | 40 | | | | 194 | | | | 126 | |
International | | | 283 | | | | 209 | | | | 1,803 | | | | 538 | |
| | | | 880 | | | | 526 | | | | 3,143 | | | | 1,458 | |
| Downstream | | | | | | | | | | | | | | | | |
Refining and Supply | | | 499 | | | | 312 | | | | 1,318 | | | | 809 | |
Sales and Marketing | | | 49 | | | | 68 | | | | 104 | | | | 104 | |
Lubricants | | | 4 | | | | 8 | | | | 11 | | | | 15 | |
| | | | 552 | | | | 388 | | | | 1,433 | | | | 928 | |
| Shared Services and Eliminations | | | 7 | | | | 5 | | | | 20 | | | | 17 | |
| Total property, plant and equipment and exploration | | | 1,439 | | | | 919 | | | | 4,596 | | | | 2,403 | |
| Other assets | | | – | | | | 73 | | | | – | | | | 105 | |
| Total | | $ | 1,439 | | | $ | 992 | | | $ | 4,596 | | | $ | 2,508 | |
Financing Activities
At the end of the third quarter of 2008, the Company’s syndicated committed credit facilities and bilateral demand facilities totalled $3,570 million and $842 million, respectively, of which $292 million was used for letters of credit and overdraft coverage. The syndicated facilities also may be used to provide liquidity support to a commercial paper program. No commercial paper was outstanding at September 30, 2008.
During the first nine months of 2008, the Company issued $600 million US of 10-year notes and $900 million US of 30-year notes under its previously filed base shelf prospectus. The base shelf prospectus provides for the offering of up to $4 billion US of debt securities in Canada or the U.S. over the course of a 25-month period from the date of issue, March 31, 2008.
During the third quarter of 2008, Petro-Canada’s $480 million accounts receivable securitization program was effectively unwound as it was no longer a cost-effective means of borrowing.
Current credit ratings for the Company’s unsecured long-term debt are Baa2, with a stable outlook by Moody’s Investors Service, BBB with a stable outlook by Standard & Poor’s and A (low) under review with negative implications by Dominion Bond Rating Service.
The Company’s financial capacity and flexibility have not been significantly impacted by the recent turmoil in the financial markets due to Petro-Canada’s continuing ability to generate strong cash flow, existing cash balances, significant credit facility capacity and lack of near-term refinancing requirements. For 2009 and beyond, spending on future large projects may result in annual capital expenditures exceeding operating cash flow. The Company anticipates that additional funding requirements will be met by external financing and that additional financial leverage can be managed in the context of Petro-Canada’s target ranges.
Management's Discussion and Analysis
PETRO-CANADA
Returning Cash to Shareholders
Petro-Canada’s priority uses of cash are to fund the capital program and profitable growth opportunities, and to return cash to shareholders through dividends and a share buyback program.
Petro-Canada regularly reviews its dividend strategy to ensure the alignment of dividend policy with shareholder expectations, and financial and growth objectives. Consistent with this objective, on July 24, 2008, the Company declared a 54% increase in its quarterly dividend to $0.20/share, commencing with the dividend payable on October 1, 2008.
Petro-Canada’s current NCIB program entitles the Company to repurchase up to 5% of its outstanding common shares from June 22, 2008 to June 21, 2009, subject to certain conditions. In the third quarter of 2008, the Company did not repurchase any of its shares, compared with 4.0 million in the same period last year. Future share repurchases will depend on excess cash available after consideration of the Company’s priority uses of cash.
| | | Shares Repurchased | | | Average Price | | | Total Cost ($ millions) | |
| Period | | 2008 | | | 2007 | | | 2008 | | | 2007 | | | 2008 | | | 2007 | |
| First quarter | | | – | | | | 2,000,000 | | | $ | – | | | $ | 43.63 | | | $ | – | | | $ | 87 | |
| Second quarter | | | – | | | | 8,000,000 | | | $ | – | | | $ | 53.44 | | | $ | – | | | $ | 428 | |
| Third quarter | | | – | | | | 3,998,000 | | | $ | – | | | $ | 55.15 | | | $ | – | | | $ | 220 | |
| Year-to-date | | | – | | | | 13,998,000 | | | $ | – | | | $ | 52.53 | | | $ | – | | | $ | 735 | |
Contingent Liabilities and Contractual Obligations
Contractual obligations are summarized in the Company’s 2007 annual MD&A and contingent liabilities are disclosed in Note 24 of the 2007 annual Consolidated Financial Statements. Total contractual obligations at September 30, 2008 were $40.7 billion. During the third quarter of 2008, contractual obligations increased by $1.3 billion primarily due to increased product purchase commitments.
The Company has certain retail licensee agreements that qualify as variable interest entities, as described in Note 25 to the 2007 annual Consolidated Financial Statements. These entities were not consolidated as Petro-Canada is not the primary beneficiary and the Company’s maximum exposure to losses from these arrangements was not expected to be material.
RISK
As at September 30, 2008, there were no material changes in the Company’s risks or risk management activities since December 31, 2007. Petro-Canada’s risk management activities are conducted in accordance with the policies and guidelines established by the Board of Directors. Readers should refer to Petro-Canada’s 2007 AIF and the risk management section of the 2007 annual MD&A for further discussion of risks relating to Petro-Canada’s business.
INTERNATIONAL FINANCIAL REPORTING STANDARDS
In 2006, Canada’s Accounting Standards Board ratified a strategic plan that will result in Canadian GAAP, as currently used by the Company, being converged with International Financial Reporting Standards (IFRS) over a transitional period, with a changeover date for the fiscal year beginning on January 1, 2011. The Company completed the scoping phase of its IFRS changeover plan, including a detailed timeline for assessing resources and training and analyzing key differences. The Company is in the process of assessing the impact on accounting policies, data systems, internal controls over financial reporting and business activities.
SHAREHOLDER INFORMATION
As at September 30, 2008, Petro-Canada’s outstanding common shares totalled 484.4 million and averaged 484.4 million during the third quarter of 2008. These figures compare with outstanding common shares of 485.2 million as at September 30, 2007 and average shares outstanding of 487.6 million for the quarter ended September 30, 2007.
Petro-Canada will hold a conference call to discuss these results with investors on Thursday, October 23, 2008 at 9:00 a.m. eastern daylight time (EDT). To participate, please call 1-866-898-9626 (toll-free in North America), 00-800-8989-6323 (toll-free internationally), or 416-340-2216 at 8:55 a.m. EDT. Media are invited to listen to the call by dialing 1-866-540-8136 (toll-free in North America) or 416-340-8010. Media are invited to ask questions at the end of the call. A live audio broadcast of the conference call will be available on Petro-Canada's website at http://www.petro-canada.ca/en/investors/845.aspx on October 23, 2008 at 9:00 a.m. EDT. Those who are unable to listen to the call live may listen to a recording of the call approximately one hour after its completion by dialing 1-800-408-3053 (toll-free in North America) or 416-695-5800 (pass code number 3269226#). Approximately one hour after the call, a recording will be available on Petro-Canada’s website.
Management's Discussion and Analysis
PETRO-CANADA
SELECT UPSTREAM OPERATING DATA
September 30, 2008
| | Three months ended September 30, | Nine months ended September 30, |
| | 2008 | 2007 | 2008 | 2007 |
| Before Royalties | | | | |
Crude oil and NGL production net (Mb/d) | | | | |
| North American Natural Gas | 13.0 | 12.6 | 13.1 | 12.5 |
| Oil Sands | 66.9 | 63.8 | 58.8 | 58.6 |
| International & Offshore | | | | |
| East Coast Canada | 90.6 | 102.1 | 91.1 | 102.6 |
| International | | | | |
| North Sea | 85.7 | 87.5 | 90.9 | 79.0 |
| Other International | 49.6 | 49.1 | 49.9 | 47.3 |
| | 305.8 | 315.1 | 303.8 | 300.0 |
Natural gas production net, excluding injectants (MMcf/d) | | | | |
| North American Natural Gas | 596 | 599 | 588 | 601 |
| International | | | | |
| North Sea | 54 | 59 | 57 | 58 |
| Other International | 59 | 65 | 64 | 71 |
| | 709 | 723 | 709 | 730 |
Total production (Mboe/d) net before royalties 1 | 424 | 436 | 422 | 422 |
| After Royalties | | | | |
Crude oil and NGL production net (Mb/d) | | | | |
| North American Natural Gas | 10.0 | 10.1 | 10.1 | 9.9 |
| Oil Sands | 60.2 | 57.1 | 53.3 | 53.3 |
| International & Offshore | | | | |
| East Coast Canada | 67.7 | 83.7 | 68.6 | 88.4 |
| International | | | | |
| North Sea | 85.7 | 87.5 | 90.9 | 79.0 |
| Other International | 28.3 | 44.9 | 30.9 | 42.7 |
| | 251.9 | 283.3 | 253.8 | 273.3 |
Natural gas production net, excluding injectants (MMcf/d) | | | | |
| North American Natural Gas | 466 | 476 | 463 | 473 |
| International | | | | |
| North Sea | 54 | 59 | 57 | 58 |
| Other International | 59 | 43 | 64 | 67 |
| | 579 | 578 | 584 | 598 |
Total production (Mboe/d) net after royalties 1 | 348 | 380 | 351 | 373 |
| 1 | Natural gas converted at six Mcf of natural gas to one bbl of oil. |
Management's Discussion and Analysis
PETRO-CANADA
AVERAGE UPSTREAM PRICE REALIZED
September 30, 2008
| | Three months ended September 30, | Nine months ended September 30, |
| | 2008 | 2007 | 2008 | 2007 |
Crude oil and NGL ($/bbl) | | | | |
| North American Natural Gas | 105.31 | 69.98 | 102.19 | 63.97 |
| Oil Sands | 108.25 | 64.80 | 99.69 | 58.21 |
| International & Offshore | | | | |
| East Coast Canada | 114.76 | 76.83 | 112.85 | 72.83 |
| International | | | | |
North Sea | 117.87 | 77.19 | 108.04 | 71.88 |
| Other International | 126.47 | 77.59 | 115.03 | 73.32 |
| Total crude oil and NGL | 114.11 | 74.32 | 107.85 | 69.42 |
Natural gas ($/Mcf) | | | | |
| North American Natural Gas | 8.41 | 5.17 | 8.52 | 6.47 |
| International | | | | |
| North Sea | 12.01 | 6.87 | 11.30 | 7.70 |
| Other International | 7.85 | 4.19 | 5.88 | 4.60 |
| Total natural gas | 8.68 | 5.28 | 8.60 | 6.47 |
EFFECTIVE ROYALTY RATES
September 30, 2008
| | Three months ended September 30, | Nine months ended September 30, |
| (% of sales revenues) | 2008 | 2007 | 2008 | 2007 |
| North American Natural Gas | 22% | 20% | 21% | 21% |
| Oil Sands | 10% | 10% | 9% | 9% |
| International & Offshore | | | | |
| East Coast Canada | 25% | 18% | 25% | 14% |
| International | | | | |
| North Sea | – | – | – | – |
Other International 1 | 36% | 13% | 31% | 9% |
| Total | 18% | 13% | 17% | 12% |
| 1 | Royalty rates reflect a portion of the NOC's take under the new Libya EPSAs and should be read in conjunction with the Libya EPSAs Fact Sheet referenced in the December 10, 2007 press release announcing the signing of the binding heads of agreement with the NOC. |
Management's Discussion and Analysis
PETRO-CANADA
SELECT DOWNSTREAM OPERATING DATA
September 30, 2008
| | Three months ended September 30, | | Nine months ended September 30, | |
| | 2008 | | 2007 | | 2008 | | 2007 | |
Petroleum product sales (thousands of cubic metres/day – m3/d) | | | | | | | | |
| Gasoline | | | | | | | | |
| Eastern Canada | | 13.5 | | 14.6 | | 13.2 | | 13.9 | |
| Western Canada | | 9.6 | | 11.0 | | 10.1 | | 10.4 | |
| | | 23.1 | | 25.6 | | 23.3 | | 24.3 | |
| Distillate | | | | | | | | | |
| Eastern Canada | | 8.1 | | 7.5 | | 8.4 | | 8.5 | |
| Western Canada | | 10.6 | | 10.6 | | 10.2 | | 11.0 | |
| | | 18.7 | | 18.1 | | 18.6 | | 19.5 | |
| Other, including petrochemicals | | 10.9 | | 9.9 | | 10.3 | | 9.0 | |
| Total petroleum product sales | | 52.7 | | 53.6 | | 52.2 | | 52.8 | |
Crude oil processed by Petro-Canada (thousands of m3/d) | | | | | | | | | |
| Eastern Canada | | 19.8 | | 19.8 | | 19.6 | | 19.8 | |
| Western Canada | | 10.3 | | 20.4 | | 17.1 | | 20.3 | |
| Total crude oil processed by Petro-Canada | | 30.1 | | 40.2 | | 36.7 | | 40.1 | |
Average refinery utilization (%) | | 75 | | 99 | | 90 | | 99 | |
Downstream net earnings (loss) after-tax (cents/litre) | | (0.6 | ) | 2.1 | | 3.2 | | 3.8 | |
AVERAGE DOWNSTREAM PRICES
September 30, 2008
| | Three months ended September 30, | Nine months ended September 30, |
| | 2008 | 2007 | 2008 | 2007 |
Rack prices (Canadian cents/litre) | | | | |
| Gasoline | | | | |
| Eastern Canada | 89.59 | 63.78 | 83.01 | 63.93 |
| Western Canada | 92.43 | 67.09 | 84.20 | 65.67 |
| Distillate | | | | |
| Eastern Canada | 101.01 | 64.45 | 93.67 | 62.50 |
| Western Canada | 99.56 | 65.47 | 93.84 | 65.04 |
Pump prices (Canadian cents/litre, excluding taxes) | | | | |
| Gasoline | | | | |
| Eastern Canada | 96.21 | 68.90 | 88.85 | 67.87 |
| Western Canada | 103.85 | 76.54 | 94.47 | 76.02 |
Management's Discussion and Analysis
PETRO-CANADA
September 30, 2008
| | Three months ended September 30, | Nine months ended September 30, |
| | 2008 | 2007 | 2008 | 2007 |
Weighted-average common shares outstanding (millions) | 484.4 | 487.6 | 484.0 | 491.6 |
Weighted-average diluted common shares outstanding (millions) | 487.9 | 492.6 | 488.0 | 496.7 |
Net earnings – basic ($/share) | 2.58 | 1.59 | 7.90 | 4.50 |
– diluted ($/share) | 2.56 | 1.58 | 7.84 | 4.45 |
Cash flow from operating activities ($/share) | 2.64 | 2.75 | 10.73 | 8.02 |
Dividends ($/share) | 0.20 | 0.13 | 0.46 | 0.39 |
| Toronto Stock Exchange: | | | | |
Share price 1 – High | 55.75 | 61.25 | 60.00 | 61.25 |
– Low | 33.70 | 50.97 | 33.70 | 41.02 |
– Close at September 30 | 35.40 | 57.07 | 35.40 | 57.07 |
Shares traded (millions) | 166.5 | 111.0 | 469.2 | 399.3 |
| New York Stock Exchange: | | | | |
Share price 2 – High | 56.90 | 58.41 | 61.03 | 58.41 |
– Low | 32.35 | 47.51 | 32.35 | 34.91 |
– Close at September 30 | 33.35 | 57.39 | 33.35 | 57.39 |
Shares traded (millions) | 135.4 | 47.9 | 310.3 | 129.6 |
| 1 | Share prices are in Canadian dollars and represent the closing price. |
| 2 | Share prices are in U.S. dollars and represent the closing price. |
SELECT FINANCIAL DATA
September 30, 2008
(unaudited, millions of Canadian dollars)
| | | Three months ended September 30, | | | Nine months ended September 30, | |
| | | 2008 | | | 2007 | | | 2008 | | | 2007 | |
| | | | | | | | | | | | | |
| Net earnings (loss) | | | | | | | | | | | | |
| Upstream | | | | | | | | | | | | |
| North American Natural Gas | | $ | 165 | | | $ | 55 | | | $ | 339 | | | $ | 248 | |
| Oil Sands | | | 209 | | | | 110 | | | | 498 | | | | 187 | |
| International & Offshore | | | | | | | | | | | | | | | | |
| East Coast Canada | | | 397 | | | | 293 | | | | 1,157 | | | | 883 | |
| International | | | 483 | | | | 200 | | | | 1,491 | | | | 404 | |
| Downstream | | | (27 | ) | | | 105 | | | | 457 | | | | 548 | |
| Shared Services and Eliminations | | | 24 | | | | 13 | | | | (117 | ) | | | (59 | ) |
| Net earnings | | $ | 1,251 | | | $ | 776 | | | $ | 3,825 | | | $ | 2,211 | |
| | | | | | | | | | | | | | | | | |
| Cash flow from operating activities | | $ | 1,279 | | | $ | 1,340 | | | $ | 5,193 | | | $ | 3,941 | |
| | | | | | | | | | | | | | | | | |
Average capital employed 1 | | | | | | | | | | | | | | | | |
| Upstream | | | | | | | | | | $ | 9,457 | | | $ | 7,967 | |
| Downstream | | | | | | | | | | | 6,787 | | | | 4,910 | |
| Shared Services and Eliminations | | | | | | | | | | | 748 | | | | 398 | |
| Total Company | | | | | | | | | | $ | 16,992 | | | $ | 13,275 | |
| | | | | | | | | | | | | | | | | |
Return on capital employed (%) 1 | | | | | | | | | | | | | | | | |
| Upstream | | | | | | | | | | | 41.0 | | | | 26.7 | |
| Downstream | | | | | | | | | | | 7.9 | | | | 12.9 | |
| Total Company | | | | | | | | | | | 26.4 | | | | 20.3 | |
| | | | | | | | | | | | | | | | | |
Return on equity (%) 1 | | | | | | | | | | | 32.1 | | | | 24.2 | |
| | | | | | | | | | | | | | | | | |
| Debt | | | | | | | | | | $ | 4,098 | | | $ | 2,367 | |
| Cash and cash equivalents | | | | | | | | | | $ | 1,921 | | | $ | 1,090 | |
Debt-to-cash flow from operating activities (times) 1 | | | | | | | | | | | 0.9 | | | | 0.5 | |
Debt-to-debt plus equity (%) | | | | | | | | | | | 20.4 | | | | 17.1 | |
| | | | | | | | | | | | | | | | | |
| 1 | Calculated on a 12-month rolling basis. |
CONSOLIDATED STATEMENT OF EARNINGS (unaudited)
For the periods ended September 30
(millions of Canadian dollars, except per share amounts)
| | | Three months ended September 30, | | | Nine months ended September 30, | |
| | | 2008 | | | 2007 | | | 2008 | | | 2007 | |
| | | | | | | | | | | | | |
| Revenue | | | | | | | | | | | | |
| Operating | | $ | 8,068 | | | $ | 5,549 | | | $ | 22,451 | | | $ | 15,945 | |
Investment and other income (expense) (Notes 4 and 6) | | | 218 | | | | (52 | ) | | | 67 | | | | (129 | ) |
| | | | 8,286 | | | | 5,497 | | | | 22,518 | | | | 15,816 | |
| Expenses | | | | | | | | | | | | | | | | |
| Crude oil and product purchases | | | 4,518 | | | | 2,562 | | | | 11,256 | | | | 7,392 | |
| Operating, marketing and general | | | 741 | | | | 919 | | | | 2,676 | | | | 2,732 | |
| Exploration | | | 143 | | | | 65 | | | | 471 | | | | 307 | |
| Depreciation, depletion and amortization | | | 513 | | | | 498 | | | | 1,508 | | | | 1,455 | |
| Unrealized (gain) loss on translation of foreign currency denominated long-term debt | | | 119 | | | | (93 | ) | | | 189 | | | | (234 | ) |
| Interest | | | 61 | | | | 39 | | | | 156 | | | | 122 | |
| | | | 6,095 | | | | 3,990 | | | | 16,256 | | | | 11,774 | |
| | | | | | | | | | | | | | | | | |
| Earnings before income taxes | | | 2,191 | | | | 1,507 | | | | 6,262 | | | | 4,042 | |
| | | | | | | | | | | | | | | | | |
| Provision for income taxes | | | | | | | | | | | | | | | | |
| Current | | | 808 | | | | 607 | | | | 2,465 | | | | 1,704 | |
Future (Note 5) | | | 132 | | | | 124 | | | | (28 | ) | | | 127 | |
| | | | 940 | | | | 731 | | | | 2,437 | | | | 1,831 | |
| | | | | | | | | | | | | | | | | |
| Net earnings | | $ | 1,251 | | | $ | 776 | | | $ | 3,825 | | | $ | 2,211 | |
| | | | | | | | | | | | | | | | | |
Earnings per share (Note 7) | | | | | | | | | | | | | | | | |
| Basic | | $ | 2.58 | | | $ | 1.59 | | | $ | 7.90 | | | $ | 4.50 | |
| Diluted | | $ | 2.56 | | | $ | 1.58 | | | $ | 7.84 | | | $ | 4.45 | |
CONSOLIDATED STATEMENT OF COMPREHENSIVE INCOME (unaudited)
For the periods ended September 30
(millions of Canadian dollars)
| | | Three months ended September 30, | | | Nine months ended September 30, | |
| | | 2008 | | | 2007 | | | 2008 | | | 2007 | |
| | | | | | | | | | | | | |
| Net earnings | | $ | 1,251 | | | $ | 776 | | | $ | 3,825 | | | $ | 2,211 | |
| Other comprehensive income, net of tax | | | | | | | | | | | | | | | | |
Change in foreign currency translation adjustment | | | (196 | ) | | | (60 | ) | | | (38 | ) | | | (256 | ) |
| Comprehensive income | | $ | 1,055 | | | $ | 716 | | | $ | 3,787 | | | $ | 1,955 | |
| | See accompanying Notes to Consolidated Financial Statements |
CONSOLIDATED STATEMENT OF CASH FLOWS (unaudited) |
For the periods ended September 30
(millions of Canadian dollars)
| | | Three months ended September 30, | | | Nine months ended September 30, | |
| | | 2008 | | | 2007 | | | 2008 | | | 2007 | |
| | | | | | | | | | | | | |
| Operating activities | | | | | | | | | | | | |
| Net earnings | | $ | 1,251 | | | $ | 776 | | | $ | 3,825 | | | $ | 2,211 | |
| Items not affecting cash flow from operating activities: | | | | | | | | | | | | | | | | |
| Depreciation, depletion and amortization | | | 513 | | | | 498 | | | | 1,508 | | | | 1,455 | |
Future income taxes (Note 5) | | | 132 | | | | 124 | | | | (28 | ) | | | 127 | |
| Accretion of asset retirement obligations | | | 20 | | | | 16 | | | | 57 | | | | 50 | |
| Unrealized (gain) loss on translation of foreign currency denominated long-term debt | | | 119 | | | | (93 | ) | | | 189 | | | | (234 | ) |
(Gain) loss on sale of assets (Notes 4 and 6) | | | (121 | ) | | | (8 | ) | | | 9 | | | | (78 | ) |
| Unrealized (gain) loss related to Buzzard derivative contracts | | | - | | | | (107 | ) | | | - | | | | 21 | |
| Other | | | 102 | | | | 3 | | | | 69 | | | | 10 | |
| Exploration expenses | | | 100 | | | | 20 | | | | 318 | | | | 183 | |
(Increase) decrease in non-cash working capital related to operating activities (Note 8) | | | (837 | ) | | | 111 | | | | (754 | ) | | | 196 | |
| Cash flow from operating activities | | | 1,279 | | | | 1,340 | | | | 5,193 | | | | 3,941 | |
| | | | | | | | | | | | | | | | | |
| Investing activities | | | | | | | | | | | | | | | | |
| Expenditures on property, plant and equipment and exploration | | | (1,439 | ) | | | (919 | ) | | | (4,596 | ) | | | (2,403 | ) |
Proceeds from sale of assets (Note 6) | | | 188 | | | | 83 | | | | 233 | | | | 177 | |
| Increase in other assets | | | - | | | | (73 | ) | | | - | | | | (105 | ) |
| (Increase) decrease in non-cash working capital related to investing activities | | | (252 | ) | | | 32 | | | | 689 | | | | (119 | ) |
| Cash flow used in investing activities | | | (1,503 | ) | | | (877 | ) | | | (3,674 | ) | | | (2,450 | ) |
| | | | | | | | | | | | | | | | | |
| Financing activities | | | | | | | | | | | | | | | | |
Decrease in short-term notes payable (Note 9) | | | - | | | | - | | | | (109 | ) | | | - | |
Proceeds from issue of long-term debt (Note 9) | | | - | | | | - | | | | 1,482 | | | | - | |
Repayment of long-term debt (Note 9) | | | - | | | | (3 | ) | | | (996 | ) | | | (6 | ) |
Proceeds from issue of common shares (Note 10) | | | 1 | | | | 9 | | | | 17 | | | | 33 | |
Purchase of common shares (Note 10) | | | - | | | | (220 | ) | | | - | | | | (735 | ) |
Dividends on common shares (Note 13) | | | (97 | ) | | | (63 | ) | | | (223 | ) | | | (192 | ) |
| Cash flow from (used in) financing activities | | | (96 | ) | | | (277 | ) | | | 171 | | | | (900 | ) |
| | | | | | | | | | | | | | | | | |
| Increase (decrease) in cash and cash equivalents | | | (320 | ) | | | 186 | | | | 1,690 | | | | 591 | |
| Cash and cash equivalents at beginning of period | | | 2,241 | | | | 904 | | | | 231 | | | | 499 | |
| Cash and cash equivalents at end of period | | $ | 1,921 | | | $ | 1,090 | | | $ | 1,921 | | | $ | 1,090 | |
| | See accompanying Notes to Consolidated Financial Statements |
CONSOLIDATED BALANCE SHEET (unaudited)
As at September 30, 2008
(millions of Canadian dollars)
| | September 30, 2008 | | December 31, 2007 | |
| Assets | | | | | | |
| Current assets | | | | | | |
| Cash and cash equivalents | | $ | 1,921 | | | $ | 231 | |
| Accounts receivable | | | 3,804 | | | | 1,973 | |
| Income taxes receivable | | | - | | | | 280 | |
Inventories (Note 3) | | | 2,105 | | | | 668 | |
| Future income taxes | | | 44 | | | | 26 | |
| | | | 7,874 | | | | 3,178 | |
| | | | | | | | | |
Property, plant and equipment, net (Notes 5 and 6) | | | 22,056 | | | | 19,497 | |
| Goodwill | | | 747 | | | | 731 | |
| Other assets | | | 402 | | | | 446 | |
| | | $ | 31,079 | | | $ | 23,852 | |
| | | | | | | | | |
| Liabilities and shareholders' equity | | | | | | | | |
| Current liabilities | | | | | | | | |
| Accounts payable and accrued liabilities | | $ | 4,177 | | | $ | 3,512 | |
| Income taxes payable | | | 1,275 | | | | - | |
Short-term notes payable (Note 9) | | | - | | | | 109 | |
Current portion of long-term debt (Note 9) | | | 2 | | | | 2 | |
| | | | 5,454 | | | | 3,623 | |
| | | | | | | | | |
Long-term debt (Note 9) | | | 4,096 | | | | 3,339 | |
| Other liabilities | | | 896 | | | | 717 | |
| Asset retirement obligations | | | 1,357 | | | | 1,234 | |
Future income taxes (Notes 3 and 5) | | | 3,269 | | | | 3,069 | |
| | | | | | | | | |
| Shareholders' equity | | | | | | | | |
Common shares (Note 10) | | | 1,384 | | | | 1,365 | |
Contributed surplus (Note 10) | | | 22 | | | | 24 | |
| Retained earnings | | | 14,850 | | | | 10,692 | |
| Accumulated other comprehensive income | | | | | | | | |
Foreign currency translation adjustment | | | (249 | ) | | | (211 | ) |
| | | | 16,007 | | | | 11,870 | |
| | | $ | 31,079 | | | $ | 23,852 | |
CONSOLIDATED STATEMENT OF RETAINED EARNINGS (unaudited)
For the periods ended September 30
(millions of Canadian dollars)
| | | Three months ended September 30, | | | Nine months ended September 30, | |
| | | 2008 | | | 2007 | | | 2008 | | | 2007 | |
| | | | | | | | | | | | | |
| Retained earnings at beginning of period | | $ | 13,696 | | | $ | 9,826 | | | $ | 10,692 | | | $ | 8,565 | |
Cumulative effect of adopting new accounting standards (Note 3) | | | - | | | | - | | | | 556 | | | | - | |
| Net earnings | | | 1,251 | | | | 776 | | | | 3,825 | | | | 2,211 | |
Dividends on common shares (Note 13) | | | (97 | ) | | | (63 | ) | | | (223 | ) | | | (192 | ) |
Excess cost for normal course issuer bid (Note 10) | | | - | | | | (209 | ) | | | - | | | | (254 | ) |
| Retained earnings at end of period | | $ | 14,850 | | | $ | 10,330 | | | $ | 14,850 | | | $ | 10,330 | |
| | See accompanying Notes to Consolidated Financial Statements |
NOTES TO CONSOLIDATED FINANCIAL STATEMENTS (unaudited)
(millions of Canadian dollars)
1. SEGMENTED INFORMATION
Three months ended September 30,
| | | Upstream | | | | | | | | | | | | | | | | | |
| | | | | | | | | | | International & Offshore | | | | | | | | | | | | | | | | | |
| | | North American Natural Gas | | Oil Sands | | East Coast Canada | | International | | Downstream | | Shared Services | | Eliminations4 | | Consolidated | |
| | | 2008 | | 2007 | | 2008 | | 2007 | | 2008 | | 2007 | | 2008 | | 2007 | | 2008 | | 2007 | | 2008 | | 2007 | | 2008 | | 2007 | | 2008 | | 2007 | |
| | | | | | | | | | | | | | | | | | | | | | | | | | | | | | | | | | |
| Revenue | | | | | | | | | | | | | | | | | | | | | | | | | | | | | | | | | |
| Sales to customers | | $ | 508 | | $ | 308 | | $ | 748 | | $ | 145 | | $ | 681 | | $ | 671 | | $ | 1,352 | | $ | 1,079 | | $ | 4,779 | | $ | 3,346 | | $ | - | | $ | - | | $ | - | | $ | - | | $ | 8,068 | | $ | 5,549 | |
Investment and other income (expense) 1 | | | 14 | | | 1 | | | - | | | (3 | ) | | 9 | | | (5 | ) | | 136 | | | (34 | ) | | 50 | | | (3 | ) | | 9 | | | (8 | ) | | - | | | - | | | 218 | | | (52 | ) |
| Inter-segment sales | | | 120 | | | 70 | | | 445 | | | 316 | | | 302 | | | 114 | | | - | | | - | | | 4 | | | 5 | | | - | | | - | | | (871 | ) | | (505 | ) | | - | | | - | |
| Segmented revenue | | | 642 | | | 379 | | | 1,193 | | | 458 | | | 992 | | | 780 | | | 1,488 | | | 1,045 | | | 4,833 | | | 3,348 | | | 9 | | | (8 | ) | | (871 | ) | | (505 | ) | | 8,286 | | | 5,497 | |
| Expenses | | | | | | | | | | | | | | | | | | | | | | | | | | | | | | | | | | | | | | | | | | | | | | | | | |
Crude oil and product purchases2 | | | 126 | | | 62 | | | 644 | | | 112 | | | 239 | | | 158 | | | - | | | - | | | 3,511 | | | 2,229 | | | - | | | - | | | (2 | ) | | 1 | | | 4,518 | | | 2,562 | |
| Inter-segment transactions | | | 2 | | | 2 | | | 13 | | | 1 | | | 3 | | | 2 | | | - | | | - | | | 851 | | | 500 | | | - | | | - | | | (869 | ) | | (505 | ) | | - | | | - | |
| Operating, marketing and general | | | 134 | | | 124 | | | 203 | | | 149 | | | 68 | | | 68 | | | 99 | | | 144 | | | 443 | | | 390 | | | (206 | ) | | 44 | | | - | | | - | | | 741 | | | 919 | |
| Exploration | | | 20 | | | 25 | | | 3 | | | 1 | | | - | | | 5 | | | 120 | | | 34 | | | - | | | - | | | - | | | - | | | - | | | - | | | 143 | | | 65 | |
| Depreciation, depletion and amortization | | | 124 | | | 108 | | | 32 | | | 33 | | | 102 | | | 105 | | | 174 | | | 180 | | | 81 | | | 72 | | | - | | | - | | | - | | | - | | | 513 | | | 498 | |
| Unrealized (gain) loss on translation of foreign currency denominated long-term debt | | | - | | | - | | | - | | | - | | | - | | | - | | | - | | | - | | | - | | | - | | | 119 | | | (93 | ) | | - | | | - | | | 119 | | | (93 | ) |
| Interest | | | - | | | - | | | - | | | - | | | - | | | - | | | - | | | - | | | - | | | - | | | 61 | | | 39 | | | - | | | - | | | 61 | | | 39 | |
| | | | 406 | | | 321 | | | 895 | | | 296 | | | 412 | | | 338 | | | 393 | | | 358 | | | 4,886 | | | 3,191 | | | (26 | ) | | (10 | ) | | (871 | ) | | (504 | ) | | 6,095 | | | 3,990 | |
| Earnings (loss) before income taxes | | | 236 | | | 58 | | | 298 | | | 162 | | | 580 | | | 442 | | | 1,095 | | | 687 | | | (53 | ) | | 157 | | | 35 | | | 2 | | | - | | | (1 | ) | | 2,191 | | | 1,507 | |
| Provision for income taxes | | | | | | | | | | | | | | | | | | | | | | | | | | | | | | | | | | | | | | | | | | | | | | | | | |
| Current | | | 33 | | | 55 | | | 49 | | | 5 | | | 185 | | | 163 | | | 645 | | | 379 | | | (76 | ) | | 40 | | | (28 | ) | | (35 | ) | | - | | | - | | | 808 | | | 607 | |
| Future | | | 38 | | | (52 | ) | | 40 | | | 47 | | | (2 | ) | | (14 | ) | | (33 | ) | | 108 | | | 50 | | | 12 | | | 62 | | | 23 | | | (23 | ) | | - | | | 132 | | | 124 | |
| | | | 71 | | | 3 | | | 89 | | | 52 | | | 183 | | | 149 | | | 612 | | | 487 | | | (26 | ) | | 52 | | | 34 | | | (12 | ) | | (23 | ) | | - | | | 940 | | | 731 | |
| Net earnings (loss) | | $ | 165 | | $ | 55 | | $ | 209 | | $ | 110 | | $ | 397 | | $ | 293 | | $ | 483 | | $ | 200 | | $ | (27 | ) | $ | 105 | | $ | 1 | | $ | 14 | | $ | 23 | | $ | (1 | ) | $ | 1,251 | | $ | 776 | |
Expenditures on property, plant and equipment and exploration 3 | | $ | 199 | | $ | 176 | | $ | 286 | | $ | 101 | | $ | 112 | | $ | 40 | | $ | 283 | | $ | 209 | | $ | 552 | | $ | 388 | | $ | 7 | | $ | 5 | | $ | - | | $ | - | | $ | 1,439 | | $ | 919 | |
| Cash flow from (used in) operating activities | | $ | 269 | | $ | 155 | | $ | 77 | | $ | 176 | | $ | 348 | | $ | 403 | | $ | 543 | | $ | 455 | | $ | (89 | ) | $ | 215 | | $ | 131 | | $ | (64 | ) | $ | - | | $ | - | | $ | 1,279 | | $ | 1,340 | |
| Total assets | | $ | 4,197 | | $ | 3,986 | | $ | 4,693 | | $ | 3,121 | | $ | 2,193 | | $ | 2,333 | | $ | 7,641 | | $ | 5,661 | | $ | 11,315 | | $ | 7,668 | | $ | 1,090 | | $ | 871 | | $ | (50 | ) | $ | (8 | ) | $ | 31,079 | | $ | 23,632 | |
| 1 | Investment and other income (expense) for the International segment includes unrealized gains related to the Buzzard derivative contracts of $nil for the three months ended September 30, 2008 ($107 million for the three months ended September 30, 2007) (Note 4). |
| 2 | Downstream crude oil and product purchases account for substantially all of the Downstream inventories recognized as an expense during the period. |
| 3 | Consolidated expenditures include capitalized interest in the amount of $17 million for the three months ended September 30, 2008 ($8 million for the three months ended September 30, 2007). |
| 4 | Eliminations relate to sales between segments recorded at transfer prices based on current market prices, and to unrealized inter-segment profits and losses on inventories. Prior period figures have been reclassified to conform to the current period’s presentation. |
NOTES TO CONSOLIDATED FINANCIAL STATEMENTS (unaudited)
(millions of Canadian dollars)
1. SEGMENTED INFORMATION
Nine months ended September 30,
| | | Upstream | | | | | | | | | | | | | | | | | |
| | | | | | | | | | | International & Offshore | | | | | | | | | | | | | | | | | |
| | | North American Natural Gas | | Oil Sands | | East Coast Canada | | International | | Downstream | | Shared Services | | Eliminations4 | | Consolidated | |
| | | 2008 | | 2007 | | 2008 | | 2007 | | 2008 | | 2007 | | 2008 | | 2007 | | 2008 | | 2007 | | 2008 | | 2007 | | 2008 | | 2007 | | 2008 | | 2007 | |
| | | | | | | | | | | | | | | | | | | | | | | | | | | | | | | | | | |
| Revenue | | | | | | | | | | | | | | | | | | | | | | | | | | | | | | | | | |
| Sales to customers | | $ | 1,519 | | $ | 1,016 | | $ | 1,682 | | $ | 458 | | $ | 2,183 | | $ | 2,052 | | $ | 4,041 | | $ | 2,654 | | $ | 13,026 | | $ | 9,765 | | $ | - | | $ | - | | $ | - | | $ | - | | $ | 22,451 | | $ | 15,945 | |
Investment and other income (expense) 1 | | | (129 | ) | | 66 | | | (1 | ) | | (3 | ) | | 7 | | | (11 | ) | | 133 | | | (163 | ) | | 18 | | | (7 | ) | | 39 | | | (11 | ) | | - | | | - | | | 67 | | | (129 | ) |
| Inter-segment sales | | | 346 | | | 238 | | | 1,123 | | | 759 | | | 614 | | | 352 | | | - | | | - | | | 12 | | | 12 | | | - | | | - | | | (2,095 | ) | | (1,361 | ) | | - | | | - | |
| Segmented revenue | | | 1,736 | | | 1,320 | | | 2,804 | | | 1,214 | | | 2,804 | | | 2,393 | | | 4,174 | | | 2,491 | | | 13,056 | | | 9,770 | | | 39 | | | (11 | ) | | (2,095 | ) | | (1,361 | ) | | 22,518 | | | 15,816 | |
| Expenses | | | | | | | | | | | | | | | | | | | | | | | | | | | | | | | | | | | | | | | | | | | | | | | | | |
Crude oil and product purchases2 | | | 357 | | | 165 | | | 1,403 | | | 366 | | | 649 | | | 545 | | | - | | | - | | | 8,892 | | | 6,308 | | | - | | | - | | | (45 | ) | | 8 | | | 11,256 | | | 7,392 | |
| Inter-segment transactions | | | 5 | | | 6 | | | 27 | | | 11 | | | 7 | | | 6 | | | - | | | - | | | 2,054 | | | 1,338 | | | - | | | - | | | (2,093 | ) | | (1,361 | ) | | - | | | - | |
| Operating, marketing and general | | | 394 | | | 368 | | | 577 | | | 436 | | | 180 | | | 186 | | | 341 | | | 421 | | | 1,257 | | | 1,100 | | | (73 | ) | | 221 | | | - | | | - | | | 2,676 | | | 2,732 | |
| Exploration | | | 91 | | | 122 | | | 8 | | | 25 | | | - | | | 14 | | | 372 | | | 146 | | | - | | | - | | | - | | | - | | | - | | | - | | | 471 | | | 307 | |
| Depreciation, depletion and amortization | | | 396 | | | 325 | | | 85 | | | 112 | | | 284 | | | 319 | | | 509 | | | 478 | | | 233 | | | 213 | | | 1 | | | 8 | | | - | | | - | | | 1,508 | | | 1,455 | |
| Unrealized (gain) loss on translation of foreign currency denominated long-term debt | | | - | | | - | | | - | | | - | | | - | | | - | | | - | | | - | | | - | | | - | | | 189 | | | (234 | ) | | - | | | - | | | 189 | | | (234 | ) |
| Interest | | | - | | | - | | | - | | | - | | | - | | | - | | | - | | | - | | | - | | | - | | | 156 | | | 122 | | | - | | | - | | | 156 | | | 122 | |
| | | | 1,243 | | | 986 | | | 2,100 | | | 950 | | | 1,120 | | | 1,070 | | | 1,222 | | | 1,045 | | | 12,436 | | | 8,959 | | | 273 | | | 117 | | | (2,138 | ) | | (1,353 | ) | | 16,256 | | | 11,774 | |
| Earnings (loss) before income taxes | | | 493 | | | 334 | | | 704 | | | 264 | | | 1,684 | | | 1,323 | | | 2,952 | | | 1,446 | | | 620 | | | 811 | | | (234 | ) | | (128 | ) | | 43 | | | (8 | ) | | 6,262 | | | 4,042 | |
| Provision for income taxes | | | | | | | | | | | | | | | | | | | | | | | | | | | | | | | | | | | | | | | | | | | | | | | | | |
| Current | | | 93 | | | 157 | | | 119 | | | (5 | ) | | 547 | | | 488 | | | 1,805 | | | 1,005 | | | 14 | | | 157 | | | (113 | ) | | (95 | ) | | - | | | (3 | ) | | 2,465 | | | 1,704 | |
Future (Note 5) | | | 61 | | | (71 | ) | | 87 | | | 82 | | | (20 | ) | | (48 | ) | | (344 | ) | | 37 | | | 149 | | | 106 | | | 62 | | | 21 | | | (23 | ) | | - | | | (28 | ) | | 127 | |
| | | | 154 | | | 86 | | | 206 | | | 77 | | | 527 | | | 440 | | | 1,461 | | | 1,042 | | | 163 | | | 263 | | | (51 | ) | | (74 | ) | | (23 | ) | | (3 | ) | | 2,437 | | | 1,831 | |
| Net earnings (loss) | | $ | 339 | | $ | 248 | | $ | 498 | | $ | 187 | | $ | 1,157 | | $ | 883 | | $ | 1,491 | | $ | 404 | | $ | 457 | | $ | 548 | | $ | (183 | ) | $ | (54 | ) | $ | 66 | | $ | (5 | ) | $ | 3,825 | | $ | 2,211 | |
Expenditures on property, plant and equipment and exploration 3 | | $ | 457 | | $ | 497 | | $ | 689 | | $ | 297 | | $ | 194 | | $ | 126 | | $ | 1,803 | | $ | 538 | | $ | 1,433 | | $ | 928 | | $ | 20 | | $ | 17 | | $ | - | | $ | - | | $ | 4,596 | | $ | 2,403 | |
| Cash flow from (used in) operating activities | | $ | 847 | | $ | 561 | | $ | 405 | | $ | 405 | | $ | 1,503 | | $ | 1,230 | | $ | 2,080 | | $ | 1,088 | | $ | (64 | ) | $ | 749 | | $ | 422 | | $ | (92 | ) | $ | - | | $ | - | | $ | 5,193 | | $ | 3,941 | |
| Total assets | | $ | 4,197 | | $ | 3,986 | | $ | 4,693 | | $ | 3,121 | | $ | 2,193 | | $ | 2,333 | | $ | 7,641 | | $ | 5,661 | | $ | 11,315 | | $ | 7,668 | | $ | 1,090 | | $ | 871 | | $ | (50 | ) | $ | (8 | ) | $ | 31,079 | | $ | 23,632 | |
| 1 | Investment and other income (expense) for the International segment includes unrealized losses related to the Buzzard derivative contracts of $nil for the nine months ended September 30, 2008 ($21 million for the nine months ended September 30, 2007) (Note 4). |
| 2 | Downstream crude oil and product purchases account for substantially all of the Downstream inventories recognized as an expense during the period. |
| 3 | Consolidated expenditures include capitalized interest in the amount of $45 million for the nine months ended September 30, 2008 ($21 million for the nine months ended September 30, 2007). |
| 4 | Eliminations relate to sales between segments recorded at transfer prices based on current market prices, and to unrealized inter-segment profits and losses on inventories. Prior period figures have been reclassified to conform to the current period’s presentation. |
NOTES TO CONSOLIDATED FINANCIAL STATEMENTS (unaudited)
| (millions of Canadian dollars, unless otherwise stated) |
The note disclosure requirements for annual financial statements provide additional disclosure to that required for interim financial statements. Accordingly, these interim Consolidated Financial Statements should be read in conjunction with the December 31, 2007 audited Consolidated Financial Statements. The interim Consolidated Financial Statements are presented in accordance with Canadian generally accepted accounting principles (GAAP) and follow the accounting policies summarized in the notes to the annual Consolidated Financial Statements, except for changes as described in Note 3.
| 3. | CHANGES IN ACCOUNTING POLICIES |
In 2006, Canada’s Accounting Standards Board ratified a strategic plan that will result in Canadian GAAP, as currently used by the Company, being converged with International Financial Reporting Standards (IFRS) over a transitional period, with a changeover date for the fiscal year beginning on January 1, 2011. The Company has completed the scoping phase of its IFRS changeover plan, including a detailed timeline for assessing resources and training and analyzing key differences. The Company is in the process of assessing the impact on accounting policies, data systems, internal controls over financial reporting, and business activities.
The Company adopted Canadian Institute of Chartered Accountants (CICA) Handbook Section 1535, Capital Disclosures; Section 3031, Inventories; Section 3862, Financial Instruments – Disclosures; and Section 3863, Financial Instruments – Presentation on January 1, 2008.
As a result of adopting CICA Section 1535, Capital Disclosures, the Company now discloses details about its capital management (Note 13).
As a result of adopting CICA Section 3031, Inventories, the Company now assigns costs to its crude oil and refined petroleum products inventories on a “first-in, first-out” (FIFO) basis. Previously, costs were assigned to these inventories on a “last-in, first-out” (LIFO) basis. In accordance with the transitional provisions of this new accounting standard, the Company has elected to adjust 2008 opening retained earnings by the difference in the measurement of 2008 opening inventory and not restate prior period amounts. As such, the following balance sheet categories were impacted on January 1, 2008:
| | | Increase | |
| Inventories | | $ | 812 | |
| Future income taxes liability | | | 256 | |
| Retained earnings | | | 556 | |
As a result of adopting CICA Section 3862, Financial Instruments – Disclosures, the Company has expanded its financial risks and financial instruments disclosures (Note 14).
There is no other material impact on the Consolidated Financial Statements from adoption of these new standards.
| 4. | INVESTMENT AND OTHER INCOME (EXPENSE) |
Investment and other income (expense) consists of the following amounts:
| | | Three months ended September 30, | | | Nine months ended September 30, | |
| | | 2008 | | | 2007 | | | 2008 | | | 2007 | |
| Foreign exchange gains (losses) | | $ | 26 | | | $ | (33 | ) | | $ | 46 | | | $ | (59 | ) |
| Gain (loss) on Downstream derivative contracts | | | 51 | | | | (6 | ) | | | 7 | | | | (19 | ) |
Net losses related to Buzzard derivative contracts1 | | | - | | | | (24 | ) | | | - | | | | (152 | ) |
Gain (loss) on sale of assets (Note 6) | | | 121 | | | | 8 | | | | (9 | ) | | | 78 | |
| Other | | | 20 | | | | 3 | | | | 23 | | | | 23 | |
| Total investment and other income (expense) | | $ | 218 | | | $ | (52 | ) | | $ | 67 | | | $ | (129 | ) |
| | 1 | Net losses related to Buzzard derivative contracts include unrealized gains (losses) of 107 million and $(21) million for the three and nine months ended September 30, 2007, respectively and realized gains (losses) of $(131) million for both the three and nine months ended September 30, 2007. |
NOTES TO CONSOLIDATED FINANCIAL STATEMENTS (unaudited)
| (millions of Canadian dollars, unless otherwise stated) |
| 5. | LIBYA EXPLORATION AND PRODUCTION SHARING AGREEMENTS |
On June 19, 2008, the Company signed six new Exploration and Production Sharing Agreements (EPSAs) with the Libya National Oil Corporation (NOC) to convert its existing concession agreements and old EPSA into new EPSA IV agreements. The new EPSAs were ratified as of the signing with an effective date of January 1, 2008. The new EPSAs will have an expected duration of 30 years and will enable the Company to implement jointly with the NOC the redevelopment of major fields and conduct a 100% operated exploration program in the Libyan Sirte Basin.
The Company agreed to pay a signature bonus of $1 billion US in several installments with the first installment of $500 million US paid on July 17, 2008 and the remaining installments to be paid through 2013. This cost was discounted to $951 million based on this payout schedule using the Company's estimated cost of debt at the time of acquisition.
Net earnings for the nine months ended September 30, 2008 include a $230 million future income tax recovery, which the Company recognized on ratification of the new EPSAs on June 19, 2008.
In August 2008, the Company completed the sale of its pre-development assets in Denmark, which are part of the Company’s International business segment, for net proceeds of $140 million, resulting in a gain on sale of $107 million ($82 million after-tax).
In June 2008, the Company completed the sale of its Minehead assets in Western Canada, which are part of the Company’s North American Natural Gas business segment, resulting in a loss on sale of $153 million ($112 million after-tax).
The gains and losses on the sales of these assets are included in investment and other income (expense) in the Consolidated Statement of Earnings.
The following table provides the number of common shares used in calculating earnings per share amounts:
| | Three months ended September 30, | Nine months ended September 30, |
| (millions) | 2008 | 2007 | 2008 | 2007 |
Weighted-average number of common shares outstanding – basic | 484.4 | 487.6 | 484.0 | 491.6 |
| Effect of dilutive stock options | 3.5 | 5.0 | 4.0 | 5.1 |
Weighted-average number of common shares
outstanding – diluted | 487.9 | 492.6 | 488.0 | 496.7 |
On June 24, 2004, the Company entered into a securitization program, expiring on June 24, 2009, to sell an undivided interest of eligible accounts receivable to a third party on a revolving and fully serviced basis. From June 24, 2004 until June 30, 2008, the Company sold outstanding receivables under the program ($480 million outstanding receivables sold at June 30, 2008). During the three months ended September 30, 2008, the Company suspended all sales of receivables to the program and remitted all funds for receivables previously sold. At September 30, 2008, there were no outstanding receivables sold under the program.
NOTES TO CONSOLIDATED FINANCIAL STATEMENTS (unaudited)
(millions of Canadian dollars, unless otherwise stated)
| | | Maturity | | | September 30, 20088 | | | December 31, 2007 | |
| Debentures and notes | | | | | | | | | |
6.80% unsecured senior notes ($900 million US) | | 2038 | | | $ | 942 | | | $ | - | |
5.95% unsecured senior notes ($600 million US) | | 2035 | | | | 620 | | | | 577 | |
5.35% unsecured senior notes ($300 million US) | | 2033 | | | | 271 | | | | 248 | |
7.00% unsecured debentures ($250 million US) | | 2028 | | | | 255 | | | | 237 | |
7.875% unsecured debentures ($275 million US) | | 2026 | | | | 287 | | | | 267 | |
9.25% unsecured debentures ($300 million US) | | 2021 | | | | 315 | | | | 294 | |
6.05% unsecured debentures ($600 million US) | | 2018 | | | | 630 | | | | - | |
5.00% unsecured senior notes ($400 million US) | | 2014 | | | | 420 | | | | 391 | |
4.00% unsecured senior notes ($300 million US) | | 2013 | | | | 300 | | | | 275 | |
| Syndicated credit facilities | | 2013 | | | | - | | | | 995 | |
| Capital leases | | 2008-2022 | | | | 58 | | | | 57 | |
| | | | | | | 4,098 | | | | 3,341 | |
| Current portion | | | | | | | (2 | ) | | | (2 | ) |
| | | | | | | $ | 4,096 | | | $ | 3,339 | |
On March 31, 2008, the Company filed a final shelf prospectus for the offering of up to $4 billion US of debt securities with the securities commission or equivalent regulatory authority in each of the provinces and territories of Canada. On April 1, 2008, the same was filed with the United States Securities and Exchange Commission. In May 2008, the Company completed a public offering of debt securities under this prospectus in the form of $600 million US 6.05% 10-year unsecured senior notes due May 15, 2018 and $900 million US 6.80% 30-year unsecured senior notes due May 15, 2038. The net proceeds of this offering were used to repay the Company’s short-term notes payable and indebtedness outstanding under its syndicated credit facilities. The balance was added to the Company’s working capital to fund future capital expenditures.
At September 30, 2008, the Company had in place revolving, committed syndicated credit facilities totalling $3,570 million (December 31, 2007 – $2,200 million) which mature in 2013 and revolving bilateral demand credit facilities of $842 million (December 31, 2007 – $1,500 million). As of September 30, 2008, the Company had repaid all amounts previously drawn on its syndicated and demand credit facilities. A total of $293 million of the credit facilities was used for letters of credit and overdraft coverage.
Changes in common shares and contributed surplus were as follows:
| | | Shares | | | Amount | | | Contributed Surplus | |
| Balance at December 31, 2007 | | | 483,459,119 | | | $ | 1,365 | | | $ | 24 | |
| Issued under employee stock option and share purchase plans | | | 980,748 | | | | 19 | | | | (2 | ) |
| Repurchased under normal course issuer bid | | | - | | | | - | | | | - | |
| Balance at September 30, 2008 | | | 484,439,867 | | | $ | 1,384 | | | $ | 22 | |
The Company has a normal course issuer bid (NCIB) program for the repurchase of its outstanding common shares. This program was renewed in June 2008 to repurchase up to 24 million outstanding common shares during the period from June 22, 2008 to June 21, 2009, subject to certain conditions. During the three and nine months ended September 30, 2008, the Company did not repurchase any common shares. For the three and nine months ended September 30, 2007, the Company repurchased 3,998,000 common shares at a cost of $220 million and 13,998,000 common shares at a cost of $735 million. The excess of the purchase price over the carrying amount of the shares repurchased was recorded as a $nil and $442 million reduction of contributed surplus and a $209 million and $254 million reduction of retained earnings for the three and nine months ended September 30, 2007, respectively.
NOTES TO CONSOLIDATED FINANCIAL STATEMENTS (unaudited)
| (millions of Canadian dollars, unless otherwise stated) |
| 11. | STOCK-BASED COMPENSATION |
The total stock-based compensation expense (recovery) recorded was $(233) million and $(141) million for the three and nine months ended September 30, 2008, respectively, ($24 million and $163 million for the three and nine months ended September 30, 2007, respectively).
| (a) | Stock Options and Performance Share Units (PSUs) |
Changes in the number of outstanding stock options and PSUs were as follows:
| | | Stock Options | | | PSUs | |
| | | Number | | | Weighted-Average Exercise Price | | | Number | |
| Balance at December 31, 2007 | | | 21,035,064 | | | $ | 34 | | | | 1,166,044 | |
| Granted | | | 3,486,200 | | | | 47 | | | | 249,575 | |
| Exercised for common shares | | | (980,748 | ) | | | 18 | | | | n/a | |
| Surrendered for cash payment | | | (891,604 | ) | | | 35 | | | | n/a | |
| Cancelled/Expired | | | (230,510 | ) | | | 47 | | | | (590,398 | ) |
| Balance at September 30, 2008 | | | 22,418,402 | | | $ | 37 | | | | 825,221 | |
| (b) | Stock Appreciation Rights (SARs) |
Changes in the number of outstanding SARs were as follows:
| | | SARs | |
| | | Number | | | Weighted-Average Exercise Price | |
| Balance at December 31, 2007 | | | 3,659,450 | | | $ | 44 | |
| Granted | | | 4,061,330 | | | | 47 | |
| Exercised | | | (139,680 | ) | | | 44 | |
| Cancelled | | | (276,152 | ) | | | 47 | |
| Balance at September 30, 2008 | | | 7,304,948 | | | $ | 46 | |
NOTES TO CONSOLIDATED FINANCIAL STATEMENTS (unaudited)
| (millions of Canadian dollars, unless otherwise stated) |
| 12. | EMPLOYEE FUTURE BENEFITS |
The Company maintains pension plans with defined benefit and defined contribution provisions and provides certain health care and life insurance benefits to its qualifying retirees. The expenses associated with these plans are as follows:
| | | Three months ended September 30, | | | Nine months ended September 30, | |
| | | 2008 | | | 2007 | | | 2008 | | | 2007 | |
| Pension Plans: | | | | | | | | | | | | |
| Defined benefit plans | | | | | | | | | | | | |
Employer current service cost | | $ | 11 | | | $ | 10 | | | $ | 32 | | | $ | 30 | |
Interest cost | | | 23 | | | | 22 | | | | 70 | | | | 66 | |
Expected return on plan assets | | | (28 | ) | | | (27 | ) | | | (83 | ) | | | (83 | ) |
Amortization of transitional asset | | | (1 | ) | | | (1 | ) | | | (4 | ) | | | (4 | ) |
Amortization of net actuarial losses | | | 12 | | | | 11 | | | | 36 | | | | 33 | |
| | | | 17 | | | | 15 | | | | 51 | | | | 42 | |
| | | | | | | | | | | | | | | | | |
| Defined contribution plans | | | 6 | | | | 5 | | | | 17 | | | | 14 | |
| | | $ | 23 | | | $ | 20 | | | $ | 68 | | | $ | 56 | |
| | | | | | | | | | | | | | | | | |
| Other post-retirement plans: | | | | | | | | | | | | | | | | |
Employer current service cost | | $ | 1 | | | $ | 1 | | | $ | 4 | | | $ | 4 | |
Interest cost | | | 3 | | | | 3 | | | | 10 | | | | 9 | |
Amortization of transitional obligation | | | 1 | | | | 1 | | | | 2 | | | | 2 | |
Amortization of net actuarial losses | | | 1 | | | | 1 | | | | 2 | | | | 2 | |
| | | $ | 6 | | | $ | 6 | | | $ | 18 | | | $ | 17 | |
The Company expects to contribute $60 million to its pension plans in 2008.
The Company’s capital management strategy is designed to maintain financial strength and flexibility to support profitable growth in all business environments. The Company’s capital consists of debt, which is comprised of long-term debt and short-term notes payable, and shareholders’ equity. The Company measures financial strength and flexibility using two key measures: debt-to-cash flow from operating activities, the key short-term measure, and debt-to-debt plus equity, the key long-term measure. These are calculated as follows:
| | | September 30, 2008 | | | December 31, 2007 | |
| Long-term debt | | $ | 4,096 | | | $ | 3,339 | |
| Add: Current portion of long-term debt | | | 2 | | | | 2 | |
| Total long-term debt | | | 4,098 | | | | 3,341 | |
| Add: Short-term notes payable | | | - | | | | 109 | |
| Debt (A) | | $ | 4,098 | | | $ | 3,450 | |
| Shareholders’ equity | | | 16,007 | | | | 11,870 | |
| Debt plus equity (B) | | $ | 20,105 | | | $ | 15,320 | |
| | | | | | | | | |
Cash flow from operating activities (C)1 | | $ | 4,591 | | | $ | 3,339 | |
| | | | | | | | | |
Debt-to-cash flow from operating activities (A/C) (times) | | | 0.9 | | | | 1.0 | |
Debt-to-debt plus equity (A/B) (%) | | | 20.4 | | | | 22.5 | |
| | 1 | Cash flow from operating activities is on a 12-month rolling basis. |
At September 30, 2008, the debt-to-cash flow from operating activities ratio was within the Company's target range of no more than 2.0 times. Debt-to-debt plus equity was below the target range of 25% to 35%, providing the financial flexibility to fund the Company's capital program and profitable growth opportunities. The Company may exceed target ranges for short periods of time, but always with the goal to return back within the target ranges.
NOTES TO CONSOLIDATED FINANCIAL STATEMENTS (unaudited)
| (millions of Canadian dollars, unless otherwise stated) |
| 13. | CAPITAL MANAGEMENT, continued |
Financial covenants associated with the Company's various bank and debt arrangements are reviewed regularly and controls are in place to maintain compliance with these covenants. The Company complied with all covenants for the three and nine months ended September 30, 2008.
The Company’s priority uses of cash are to fund the capital program and profitable growth opportunities, and then to return cash to shareholders through dividends and a share buyback program.
The Company regularly reviews its dividend strategy to ensure the alignment of the dividend policy with shareholder expectations, and financial and growth objectives. Consistent with this objective, on July 23, 2008 the Company declared a 54% increase in its quarterly dividend to $0.20 per share commencing with the dividend paid on October 1, 2008. In June 2008 the Company renewed its NCIB program for the repurchase of its common shares from June 22, 2008 to June 21, 2009 entitling the Company to purchase up to 5% of its outstanding common shares, subject to certain conditions (Note 10). Due to an increasing capital program share buybacks are expected to be lower in this and future years compared with 2006 and 2007.
The Company’s capital management strategy has not changed from the prior period.
| 14. | FINANCIAL RISKS AND FINANCIAL INSTRUMENTS |
Financial Risks
The Company is exposed to a number of financial risks in the normal course of its business operations, including market risks resulting from fluctuations in commodity prices, interest rates and foreign currency exchange rates, as well as credit risks and liquidity risks. The nature of the financial risks and the Company’s strategy for managing these risks has not changed significantly from the prior period.
(a) Market Risks
The Company monitors its exposure to market fluctuations and may use derivative contracts to manage these risks as it considers appropriate. The Company does not use derivative contracts for speculative purposes.
Commodity Price Risk
The Company is exposed to commodity price risk as fluctuations in crude oil or natural gas prices could have a materially adverse effect on its financial condition, as well as on the value and amount of the Company’s reserves. Prices for crude oil and natural gas fluctuate in response to changes in supply and demand, market uncertainty and a variety of other factors beyond the Company’s control.
The margins realized for the Company’s refined products are also affected by factors such as crude oil price fluctuations due to the impact on refinery feedstock costs, third-party refined product purchases and the demand for refined petroleum products. The Company’s ability to maintain product margins in an environment of higher feedstock costs depends on its ability to pass higher costs on to customers. The Company enters into derivative contracts to reduce exposure in its Downstream operations to these margin fluctuations, including margins on fixed-price product sales, and short-term price fluctuations on the purchase of foreign and domestic crude oil and refined petroleum products. The Company’s exposure to these margin fluctuations is limited. As such, the fair value of the outstanding derivative contracts is not material.
Interest Rate Risk
The Company is exposed to interest rate risk as changes in market interest rates affect the fair values of fixed-interest rate liabilities and the cash flows of both floating-interest rate liabilities and future borrowings. Notes, debentures and capital leases all bear interest at fixed rates. Drawings on the syndicated and demand credit facilities bear interest at floating rates. The Company regularly reviews the mix of floating and fixed-rate debt for consistency with its financing objectives.
NOTES TO CONSOLIDATED FINANCIAL STATEMENTS (unaudited)
| (millions of Canadian dollars, unless otherwise stated) |
| 14. | FINANCIAL RISKS AND FINANCIAL INSTRUMENTS, continued |
Foreign Currency Exchange Risk
The Company’s functional currency is Canadian dollars while crude oil, one of the Company’s primary products, is priced by reference to U.S. dollar benchmark prices. Therefore, Cdn/U.S. dollar exchange rate fluctuations can have a significant impact on the Company’s revenues, crude oil and product purchases, capital expenditures, long-term debt, and associated accounts receivable, accounts payable and off-balance sheet commitments.
The Company is also exposed to foreign currency exchange risk from its self-sustaining foreign operations whose functional currency is different from the Company’s functional currency. Gains and losses from the translation of financial instruments within these self-sustaining foreign operations into Canadian dollars are presented as a separate component of other comprehensive income (loss) in the Consolidated Statement of Comprehensive Income.
The Company’s outstanding U.S. dollar-denominated long-term debt (Note 9) partially mitigates the exposure to Cdn/U.S. dollar exchange rate fluctuations created from its U.S. dollar-denominated cash flows and other associated financial instruments.
At any time, the Company may also hold a material amount of U.S. dollar cash and cash equivalents to meet immediate capital and/or operating funding requirements. These can create additional exposure to foreign currency exchange risk. At September 30, 2008, the Company holds U.S. dollar cash and cash equivalents of approximately $645 million US.
(b) Credit Risk
The Company is exposed to credit risk from its counterparties’ abilities to fulfil their obligations to the Company. The Company manages this risk through the establishment of credit policies and limits, which are applied in the selection of counterparties. The Company ensures that it has no significant concentrations of credit risk and ensures that no customers represent more than 10% of the Company’s consolidated revenues for any period.
The Company’s maximum exposure to credit risk at September 30, 2008 is equal to the carrying amount of its financial assets recorded on the Consolidated Balance Sheet. The Company carries adequate provisions for expected losses arising from credit risk associated with all financial assets, including any derecognized securitized receivables. These provisions are not material.
(c) Liquidity Risk
The Company is exposed to liquidity risk from the potential inability to generate or obtain sufficient cash and cash equivalents in a timely and cost-effective manner to discharge its financial liabilities as they come due. The Company manages liquidity risk by forecasting cash flows to identify financing requirements, by maintaining committed and demand credit facilities, and by maintaining access to additional financing at competitive rates through capital markets and highly rated financial institutions. Any debt issued by the Company is managed in accordance with specified liquidity and maturity profiles.
The Company’s financial capacity and flexibility has not been significantly impacted by the recent turmoil in the financial markets due to the Company’s continuing ability to generate strong cash flow, existing cash balances, significant credit facility capacity and lack of near-term refinancing commitments. For 2009 and beyond, spending on future large projects may result in annual capital expenditures exceeding operating cash flow. The Company anticipates that additional funding requirements will be met by external financing and that additional financial leverage can be managed in the context of the Company’s capital management strategy (Note 13).
Financial Instruments
Excluding debentures, senior notes and capital leases, which are recorded as long-term debt, the fair values of financial instruments equals or approximates their carrying amount. The fair value of debentures, senior notes and capital leases was $3,608 million at September 30, 2008 (December 31, 2007 – $2,500 million), compared with a carrying amount of $4,098 million at September 30, 2008 (December 31, 2007 – $2,346 million). The fair values of debentures, senior notes and capital leases are based on publicly quoted market values for instruments with similar terms and risks.