January 29, 2009 (publié également en français)
For the year ended December 31, 2008
MANAGEMENT’S DISCUSSION AND ANALYSIS
The Management’s Discussion and Analysis (MD&A), dated January 29, 2009, is set out in pages 1 to 26 and should be read in conjunction with the unaudited Consolidated Financial Statements of the Company for the year ended December 31, 2008; the MD&A for the three months ended March 31, 2008, the six months ended June 30, 2008 and the nine months ended September 30, 2008; the MD&A for the year ended December 31, 2007; the audited Consolidated Financial Statements for the year ended December 31, 2007, and the Company’s 2007 Annual Information Form (AIF), dated March 17, 2008. Amounts are in Canadian (Cdn) dollars unless otherwise specified.
LEGAL NOTICE – FORWARD-LOOKING INFORMATION
This quarterly report contains forward-looking information. You can usually identify this information by such words as "plan," "anticipate," "forecast," "believe," "target," "intend," "expect," "estimate," "budget" or other terms that suggest future outcomes or references to outlooks. Listed below are examples of references to forward-looking information:
· business strategies and goals · future investment decisions · outlook (including operational updates and strategic milestones) · future capital, exploration and other expenditures · future cash flows · future resource purchases and sales · construction and repair activities · turnarounds at refineries and other facilities · anticipated refining margins · future oil and natural gas production levels and the sources of their growth · project development, and expansion schedules and results · future exploration activities and results, and dates by which certain areas may be developed or come on-stream | · retail throughputs · pre-production and operating costs · reserves and resources estimates · royalties and taxes payable · production life-of-field estimates · natural gas export capacity · future financing and capital activities (including purchases of Petro-Canada common shares under the Company's normal course issuer bid (NCIB) program) · contingent liabilities (including potential exposure to losses related to retail licensee agreements) · environmental matters · future regulatory approvals · expected rates of return |
Such forward-looking information is subject to known and unknown risks and uncertainties. Other factors may cause actual results, levels of activity and achievements to differ materially from those expressed or implied by such information. Such factors include, but are not limited to:
· industry capacity · imprecise reserves estimates of recoverable quantities of oil, natural gas and liquids from resource plays, and other sources not currently classified as reserves · the effects of weather and climate conditions · the results of exploration and development drilling, and related activities · the ability of suppliers to meet commitments · decisions or approvals from administrative tribunals · risks associated with domestic and international oil and natural gas operations · general economic, market and business conditions | · competitive action by other companies · fluctuations in oil and natural gas prices · refining and marketing margins · the ability to produce and transport crude oil and natural gas to markets · fluctuations in interest rates and foreign currency exchange rates · actions by governmental authorities (including changes in taxes, royalty rates and resource-use strategies) · changes in environmental and other regulations · international political events · nature and scope of actions by stakeholders and/or the general public |
Many of these and other similar factors are beyond the control of Petro-Canada. Petro-Canada discusses these factors in greater detail in filings with the Canadian provincial securities commissions and the United States (U.S.) Securities and Exchange Commission (SEC).
Readers are cautioned that this list of important factors affecting forward-looking information is not exhaustive. Furthermore, the forward-looking information in this quarterly report is made as of January 29, 2009 and, except as required by applicable law, will not be publicly updated or revised. This cautionary statement expressly qualifies the forward-looking information in this quarterly report.
Management's Discussion and Analysis
PETRO-CANADA
Petro-Canada disclosure of reserves
Petro-Canada's qualified reserves evaluators prepare the reserves estimates the Company uses. The Canadian provincial securities commissions do not consider Petro-Canada’s reserves staff and management as independent of the Company. Petro-Canada has obtained an exemption from certain Canadian reserves disclosure requirements that allows Petro-Canada to make disclosure in accordance with SEC standards where noted in this quarterly report. This exemption allows comparisons with U.S. and other international issuers.
As a result, Petro-Canada formally discloses its proved reserves data using U.S. requirements and practices, and these may differ from Canadian domestic standards and practices. The use of the terms such as “probable,” “possible,” “resources” and “life-of-field production” in this quarterly report does not meet the SEC guidelines for SEC filings. To disclose reserves in SEC filings, oil and gas companies must prove they are economically and legally producible under existing economic and operating conditions. Note that when the term barrel of oil equivalent (boe) is used in this quarterly report, it may be misleading, particularly if used in isolation. A boe conversion ratio of six thousand cubic feet (Mcf) to one barrel (bbl) is based on an energy equivalency conversion method. This method primarily applies at the burner tip and does not represent a value equivalency at the wellhead.
The table below describes the industry definitions that Petro-Canada currently uses:
| Definitions Petro-Canada uses | | Reference |
| | | |
| Proved oil and natural gas reserves (includes both proved developed and proved undeveloped) | | SEC reserves definition (Accounting Rules Regulation S-X 210.4-10, U.S. Financial Accounting Standards Board (FASB) Statement No. 69) SEC Guide 7 for Oil sands Mining |
| | | |
| Unproved reserves, probable and possible reserves | | Canadian Securities Administrators: Canadian Oil and Gas Evaluation (COGE) Handbook, Vol. 1 Section 5 prepared by the Society of Petroleum Evaluation Engineers (SPEE) and the Canadian Institute of Mining Metallurgy and Petroleum (CIM) |
| | | |
| Contingent and Prospective Resources | | Petroleum Resources Management System: Society of Petroleum Engineers, SPEE, World Petroleum Congress and American Association of Petroleum Geologist definitions (approved March 2007) Canadian Securities Administrators: COGE Handbook Vol. 1 Section 5 |
Although the Society of Petroleum Engineers resource classification has categories of 1C, 2C, 3C for Contingent Resources, and low, best and high estimates for Prospective Resources, Petro-Canada will only refer to the 2C for Contingent Resources and the risked (an assessment of the probability of discovering the resources) best estimate for Prospective Resources when referencing resources in this quarterly report. Canadian Oil Sands represents approximately 68% of Petro-Canada’s total for Contingent and Prospective Resources. The balance of Petro-Canada’s resources is spread out across the business, most notably in the North American frontier and International areas. Also, when Petro-Canada references resources for the Company, Contingent Resources are approximately 70% and risked Prospective Resources are approximately 30% of the Company’s total resources.
Cautionary statement: In the case of discovered resources or a subcategory of discovered resources other than reserves, there is no certainty that it will be commercially viable to produce any portion of the resources. In the case of undiscovered resources or a subcategory of undiscovered resources, there is no certainty that any portion of the resources will be discovered. If discovered, there is no certainty that it will be commercially viable to produce any portion of the resources.
For movement of resources to reserves categories, all projects must have an economic depletion plan and may require
| · | additional delineation drilling and/or new technology for oil sands mining, in situ and conventional Contingent and risked Prospective Resources prior to project sanction and regulatory approvals; and |
| · | exploration success with respect to conventional risked Prospective Resources prior to project sanction and regulatory approvals. |
Reserves and resources information contained in this quarterly report is as at December 31, 2008.
Management's Discussion and Analysis
PETRO-CANADA
BUSINESS ENVIRONMENT
Market prices shown below influence average prices realized for crude oil and natural gas liquids (NGL), natural gas and petroleum products in the tables on pages 24 and 25.
UPSTREAM
Crude Oil
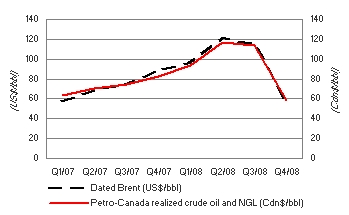
| The price of Dated Brent averaged $54.91 US/barrel (US/bbl) in the fourth quarter of 2008, down 38% compared with $88.69 US/bbl in the fourth quarter of 2007. Uncertainty stemming from the unfolding global economic crisis depressed consumer and business spending in the fourth quarter of 2008. World crude oil demand growth decelerated sharply, resulting in higher inventories and a weak pricing environment. During the fourth quarter of 2008, the Canadian dollar averaged $0.83 US, down from $1.02 US in the fourth quarter of 2007. As a result, Petro-Canada’s corporate-wide realized Canadian dollar prices for crude oil and NGL decreased 30%, from $82.71/bbl in the fourth quarter of 2007 to $58.25/bbl in the fourth quarter of 2008. |
In the fourth quarter of 2008, the spread between Dated Brent and Mexican Maya narrowed to $10.10 US/bbl, compared with $13.03 US/bbl in the fourth quarter of 2007. In Canada, the spread between Edmonton Light and Western Canada Select (WCS) narrowed to $16.48/bbl in the fourth quarter of 2008, compared with $31.66/bbl in the fourth quarter of 2007.
Natural Gas
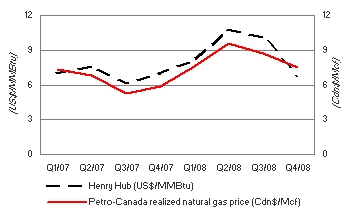
| North American natural gas prices at the Henry Hub were lower in the fourth quarter of 2008, compared with the fourth quarter of 2007, reflecting strong growth in U.S. domestic production and weaker industrial demand. Downward price pressure was mitigated somewhat by higher heating demand. In the fourth quarter of 2008, NYMEX Henry Hub natural gas prices averaged $6.82 US/million British thermal units (MMBtu), down 3% from $7.03 US/MMBtu in the fourth quarter of 2007. Canadian natural gas prices were higher than in the fourth quarter of 2007 due to the decline in the Canadian dollar in the fourth quarter of 2008. Petro-Canada’s realized Canadian dollar prices for its North American Natural Gas business averaged $6.61/Mcf in the fourth quarter of 2008, up 14% from $5.78/Mcf in the fourth quarter of 2007. |
Management's Discussion and Analysis
PETRO-CANADA
DOWNSTREAM
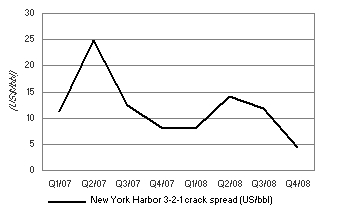
| New York Harbor 3-2-1 refinery crack spreads averaged $4.36 US/bbl in the fourth quarter of 2008, down 47% compared with an average of $8.18 US/bbl in the fourth quarter of 2007. Gasoline crack spreads were negative in the quarter due to declining motor vehicle use and higher ethanol supply. Partially offsetting these weak margins were higher heating oil crack spreads, compared with the fourth quarter of 2007. Heating oil inventories and refinery output were well below their five-year averages heading into this winter. |
The average market prices for the periods stated were:
| | Three months ended December 31, | Year ended December 31, |
| | 2008 | 2007 | 2008 | 2007 |
Dated Brent at Sullom Voe (US$/bbl) | 54.91 | 88.69 | 96.99 | 72.52 |
West Texas Intermediate (WTI) at Cushing (US$/bbl) | 58.74 | 90.68 | 99.65 | 72.31 |
Dated Brent/Maya FOB price differential (US$/bbl) | 10.10 | 13.03 | 13.15 | 12.67 |
Edmonton Light (Cdn$/bbl) | 64.22 | 87.11 | 102.83 | 76.84 |
Edmonton Light/WCS FOB price differential (Cdn$/bbl) | 16.48 | 31.66 | 19.91 | 24.07 |
Natural gas at Henry Hub (US$/MMBtu) | 6.82 | 7.03 | 8.95 | 6.92 |
Natural gas at AECO (Cdn$/Mcf) | 7.08 | 6.26 | 8.47 | 6.89 |
New York Harbor 3-2-1 crack spread (US$/bbl) | 4.36 | 8.18 | 9.58 | 14.15 |
Exchange rate (US cents/Cdn$) | 82.5 | 101.9 | 93.8 | 93.1 |
| Average realized prices | | | | |
Crude oil and NGL ($/barrel – $/bbl) | 58.25 | 82.71 | 95.63 | 72.66 |
Natural gas ($/thousand cubic feet – $/Mcf) | 7.53 | 5.88 | 8.34 | 6.32 |
Management's Discussion and Analysis
PETRO-CANADA
The following table shows the estimated after-tax effects that changes in certain factors would have had on Petro-Canada’s 2008 net earnings had these changes occurred. Amounts are in Canadian dollars unless otherwise specified.
Factor 1, 2 | Change (+) | | | Annual net earnings impact | | | Annual net earnings impact | |
| | | | | (millions of dollars) | | | ($/share) 3 | |
| Upstream | | | | | | | | |
Price received for crude oil and NGL 4 | $1.00/bbl | | | $ | 54 | | | $ | 0.11 | |
| Price received for natural gas | $0.25/Mcf | | | | 30 | | | | 0.06 | |
Exchange rate: US$/Cdn$ refers to impact on upstream earnings5 | $0.01 | | | | (60 | ) | | | (0.12 | ) |
Crude oil and NGL production (barrels/day – b/d) | 1,000 b/d | | | | 15 | | | | 0.03 | |
Natural gas production (million cubic feet/day – MMcf/d) | 10 MMcf/d | | | | 11 | | | | 0.02 | |
| Downstream | | | | | | | | | | | |
| New York Harbor 3-2-1 crack spread | $1.00 US/bbl | | | | 22 | | | | 0.05 | |
| Chicago 3-2-1 crack spread | $1.00 US/bbl | | | | 20 | | | | 0.04 | |
| Seattle 3-2-1 crack spread | $1.00 US/bbl | | | | 9 | | | | 0.02 | |
| WTI/Dated Brent price differential | $1.00 US/bbl | | | | 25 | | | | 0.05 | |
| Dated Brent/Maya FOB price differential | $1.00 US/bbl | | | | 5 | | | | 0.01 | |
| WTI/Synthetic price differential | $1.00 US/bbl | | | | 14 | | | | 0.03 | |
Exchange rate: US$/Cdn$ refers to impact on Downstream cracking margins and crude price differentials 6 | $0.01 | | | | (11 | ) | | | (0.02 | ) |
| Natural gas fuel cost – AECO natural gas price | $1.00 Cdn/Mcf | | | | (10 | ) | | | (0.02 | ) |
| Asphalt – % of Maya crude oil price | | 1 | % | | | 2 | | | | – | |
| Heavy fuel oil (HFO) – % of WTI crude oil price | | 1 | % | | | 2 | | | | – | |
| Corporate | | | | | | | | | | | |
Exchange rate: US$/Cdn$ refers to impact of the revaluation of U.S. dollar-denominated long-term debt 7 | $0.01 | | | $ | 31 | | | $ | 0.06 | |
| 1 | The impact of a change in one factor may be compounded or offset by changes in other factors. This table does not consider the impact of any inter-relationship among the factors. |
| 2 | The impact of these factors is illustrative. |
| 3 | Per share amounts are based on the number of shares outstanding as at December 31, 2008. |
| 4 | This sensitivity is based upon an equivalent change in the price of WTI and Dated Brent. |
| 5 | A strengthening Canadian dollar compared with the U.S. dollar has a negative effect on upstream net earnings. |
| 6 | A strengthening Canadian dollar compared with the U.S. dollar has a negative effect on Downstream cracking margins and crude price differentials. |
| 7 | A strengthening Canadian dollar versus the U.S. dollar has a positive effect on corporate earnings with respect to the Company’s U.S. dollar-denominated debt. The impact refers to gains or losses on $2.9 billion US of the Company’s U.S. denominated long-term debt and interest costs on U.S. dollar-denominated debt. Gains or losses on $1.1 billion US of the Company’s U.S. denominated long-term debt, associated with the self-sustaining International business segment and the U.S. Rockies operations included in the North American Natural Gas business unit, are deferred and included as part of shareholders’ equity. |
Management's Discussion and Analysis
PETRO-CANADA
BUSINESS STRATEGY
Petro-Canada's strategy is to create shareholder value by delivering long-term, profitable growth and improving the profitability of the base business.
Petro-Canada’s capital program supports bringing on six major projects over the next several years to deliver long-term profitable growth. The Company anticipates upstream production will significantly increase when these major growth projects come on-stream. The Company and its partners plan to advance the following upstream projects: the extension of the White Rose field off the East Coast of Canada, the Syria Ebla gas project and the developments associated with the new Libya Exploration and Production Sharing Agreements (EPSAs) which have been sanctioned by the Company. The other three projects, MacKay River expansion, Fort Hills mining project and the Montreal coker, are not sanctioned and are on hold until commodity prices and financial markets strengthen.
Petro-Canada continually works to strengthen its base business by improving the safety, reliability and efficiency of its operations and is focused on delivering upstream production in line with guidance.
| Strategic Priorities | Quarterly Update |
| DELIVERING PROFITABLE GROWTH WITH A FOCUS ON OPERATED, LONG-LIFE ASSETS | · continued ramp up of the Edmonton refinery conversion project (RCP) · deferred the final investment decision (FID) on the mining portion of the Fort Hills project until costs can be reduced and commodity prices and financial markets recover · received approval for the amendment to the Fort Hills mine plan · reached a Syncrude royalty agreement, along with its partners, with the Province of Alberta |
| DRIVING FOR FIRST QUARTILE OPERATION OF OUR ASSETS | · achieved 90% facility reliability at Terra Nova · maintained reliability at 99% for Western Canada natural gas processing facilities · operated MacKay River at 97% reliability in 2008, an improvement compared with 87% in 2007 · delivered a combined reliability index of 86 for 2008 at all three Downstream production facilities · saw convenience store sales decline by 2% and same-store sales decline by 4%, compared with the fourth quarter of 2007 |
| MAINTAINING FINANCIAL DISCIPLINE AND FLEXIBILITY | · ended the year with debt levels at 23.5% of total capital and a ratio of 0.7 times debt-to-cash flow from operating activities · maintained adequate liquidity via year-end cash balance of $1.4 billion and unutilized credit facility capacity of $4.7 billion |
| CONTINUING TO WORK AT BEING A RESPONSIBLE COMPANY | · experienced total recordable injury frequency (TRIF) in 2008 of 0.73, an improvement of 16% from a TRIF of 0.87 in 2007 · environmental exceedances increased from 21 in 20071 to 42 in 2008 · enhanced process safety through the development of company wide standards |
| 1 | A review of 2007 exceedances resulted in a restatement to 21 from the 16 exceedances previously reported. |
STRATEGIC MILESTONES
| Q1 2009 | Q2 2009 | Q3 2009 |
| ▼ | ▼ | ▼ |
· received regulatory approval for the Fort Hills Sturgeon Upgrader in January 2009 · plan to recommence Terra Nova development drilling · Startup of the NCMA Phase 3C Poinsettia platform in Trinidad and Tobago | · plan to commence Libya exploration drilling program | · plan to commence drilling offshore exploration wells in East Coast Canada, Norway and the UKCS, with the latter dependent on rig availability |
Management's Discussion and Analysis
PETRO-CANADA
ANALYSIS OF CONSOLIDATED EARNINGS
Earnings Variances
Q4/08 VERSUS Q4/07 FACTOR ANALYSIS
Net Earnings (Loss)
(millions of Canadian dollars, after-tax)
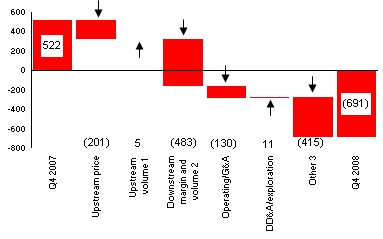
| The Company recorded a net loss of $691 million ($(1.43)/share) in the fourth quarter of 2008, compared with net earnings of $522 million ($1.08/share) in the fourth quarter of 2007. Higher operating, general and administrative (G&A) and other3 expenses, along with lower upstream realized prices and decreased Downstream margins2, resulted in a net loss in the fourth quarter of 2008. These factors were partially offset by higher upstream volumes1 and lower depreciation, depletion and amortization (DD&A) and exploration expenses. |
| 1 | Upstream volumes included the portion of DD&A expense associated with changes in upstream production levels. |
| 2 | Downstream margin and volume included the impact on realized margins from fluctuating crude oil feedstock costs while using a “first-in, first-out” (FIFO) inventory valuation methodology. |
| 3 | Other mainly included the change in fair value of the Buzzard derivative contracts (applies to 2007 and prior only) ($226 million), foreign currency translation ($(415) million), interest expense ($(31) million), changes in effective tax rates ($(181) million), insurance proceeds and premium surcharges ($(45) million), upstream inventory movements ($108 million) and charges due to the deferral of the Fort Hills FID ($(92) million). |
Net Earnings (Loss) by Segment
(millions of Canadian dollars, after-tax)
| The net loss in the fourth quarter of 2008, compared with net earnings in the fourth quarter of 2007, on a segmented basis reflected net losses in the Downstream, Oil Sands and Shared Services and Eliminations as well as decreased net earnings in East Coast Canada. These factors were partially offset by increased net earnings in International and North American Natural Gas. |
During the fourth quarter of 2008, cash flow from (used in) operating activities was $1,329 million ($2.74/share), up considerably from $(602) million ($(1.24)/share) in the same quarter of 2007. Cash flow used in operating activities in the fourth quarter of 2007 reflected the payment of $1,145 million after-tax to settle the Buzzard derivative contracts. The increase in cash flow from (used in) operating activities in the fourth quarter of 2008 reflected the release of funds previously invested in non-cash working capital due to the decline in the price of crude oil and refined petroleum products.
Management's Discussion and Analysis
PETRO-CANADA
Quarterly Financial Information
| | Three months ended | |
| (millions of Canadian dollars, except per share amounts) | Dec. 31 2008 | | | Sept. 30 2008 | | | June 30 2008 | | | March 31 2008 | | | Dec. 31 2007 | | | Sept. 30 2007 | | | June 30 2007 | | | March 31 2007 | |
| Total revenue | $ | 5,267 | | | $ | 8,286 | | | $ | 7,646 | | | $ | 6,586 | | | $ | 5,434 | | | $ | 5,497 | | | $ | 5,478 | | | $ | 4,841 | |
| | | | | | | | | | | | | | | | | | | | | | | | | | | | | | | | |
| Net earnings (loss) | $ | (691 | ) | | $ | 1,251 | | | $ | 1,498 | | | $ | 1,076 | | | $ | 522 | | | $ | 776 | | | $ | 845 | | | $ | 590 | |
| Per share – basic | | (1.43 | ) | | | 2.58 | | | | 3.10 | | | | 2.22 | | | | 1.08 | | | | 1.59 | | | | 1.71 | | | | 1.19 | |
– diluted | | (1.43 | ) | | | 2.56 | | | | 3.07 | | | | 2.20 | | | | 1.07 | | | | 1.58 | | | | 1.70 | | | | 1.18 | |
UPSTREAM
Production
Petro-Canada converts volumes of natural gas to oil equivalent at a rate of six Mcf of natural gas to one bbl of oil. Production volumes disclosed refer to net working interest before royalties, unless otherwise specified.
| In the fourth quarter of 2008, production averaged 409,000 barrels of oil equivalent per day (boe/d) net to Petro-Canada, relatively unchanged compared with 410,000 boe/d net in the same quarter of 2007. Volumes reflected decreased International production and relatively unchanged North American Natural Gas production, offset by increased East Coast Canada and Oil Sands production. |
Exploration Update
For 2008, Petro-Canada and its partners finished operations on 16 wells. Four of the wells were completed as natural gas discoveries (Gubik-3 in the Alaska Foothills, Zandolle East on Block 1a offshore Trinidad and Tobago, Sancoche on Block 22 offshore Trinidad and Tobago, and van Ghent in the Netherlands sector of the North Sea). One well was completed as an oil discovery (Pink in the United Kingdom (U.K.) sector of the North Sea). One successful natural gas appraisal well was completed (Cassra-2 on Block 22 offshore Trinidad and Tobago), and there was one successful oil appraisal well (Farigh 14-12 in Libya). One well was completed as a non-commercial oil discovery (Maria in the U.K. sector of the North Sea) and one well as a non-commercial natural gas discovery (L5a-11 in the Netherlands sector of the North Sea). Drilling of the Chandler-1 well in the Alaska Foothills was suspended, as planned, for re-entry next season. Four wells were dry and abandoned (Kwijika in the Northwest Territories, Tegu in Block 1a offshore Trinidad and Tobago, Bene on Block 22 offshore Trinidad and Tobago, and Trow in the Norwegian sector of the North Sea).
Two of the completed wells were from the 2007 exploration program. Gemini, in the U.K. sector of the North Sea, was dry and abandoned, and the Poinsettia-2 appraisal well (on the NCMA Block in Trinidad and Tobago) was completed as a natural gas discovery.
At year-end 2008, operations continued on one well (L6-7 in the Netherlands sector of the North Sea).
In 2008, the Company invested $541 million on exploration and new ventures expenditures, including G&A, geological and geophysical exploration expenses. Expenditures increased by 70%, compared with $319 million spent in 2007. The increase in 2008 spending, compared with 2007, reflected the expanded scope of the Company’s exploration program and higher costs for rigs and services.
Management's Discussion and Analysis
PETRO-CANADA
| | 2008 Results 1 | 2009 Outlook 2 |
| (number of wells) | Discoveries – Oil | Discoveries – Natural Gas | Still being evaluated | Dry and abandoned | |
| North Sea | 2 | 2 | – | 2 | 4 |
| Syria | – | – | – | – | – |
| Libya | 1 | – | – | – | 4 |
| Trinidad and Tobago | – | 4 | – | 2 | – |
| Alaska | – | 1 | 1 | – | 3 |
| Northwest Territories | – | – | – | 1 | – |
| East Coast Canada | – | – | – | – | 1 |
| Total | 3 | 7 | 1 | 5 | 12 |
| 1 | Includes the dry and abandoned well Gemini (in the U.K sector of the North Sea) and the gas discovery well Poinsettia-2 (on the NCMA Block in Trinidad and Tobago) from the 2007 exploration program, which were completed in the first quarter of 2008. |
| 2 | The 2009 Outlook was previously released on December 11, 2008. |
In the fourth quarter of 2008, the Company did not complete any exploration wells.
In 2009, the Company expects to drill up to 12 wells focused in the North Sea, Libya, East Coast Canada and the Alaska Foothills. In the North Sea, Petro-Canada and its partners plan to drill up to four wells. Up to another four wells are planned as part of the ongoing drilling program in Libya, and the Company and its partners will continue to develop longer term supply opportunities in the frontier area of Alaska, where up to three wells are planned. In East Coast Canada, the Company and its partners also plan to drill one well.
2009 Upstream Consolidated Production Outlook
Subsequent to the release of the 2009 guidance on December 11, 2008, the Company is reducing 2009 production guidance as a result of cutbacks to 2009 planned capital expenditures that are affecting near-term production as well as OPEC quota restraints in Libya. Revised production guidance is now expected to be in the range of 345,000 boe/d to 385,000 boe/d. The production guidance range has been expanded to reflect market uncertainty in the current environment and the potential impact on near-term production if low commodity prices persist or worsen and further reductions to capital expenditures are needed.
| (thousands of boe/d) | 2009 Outlook (+/-) As at December 11, 2008 | 2009 Outlook (+/-) As at January 29, 2009 |
| Production guidance range | 360 – 395 | 345 – 385 |
In 2008, production of crude oil, NGL and natural gas averaged 418,000 boe/d net which was at the high end of our 2008 guidance. Upstream production for 2009 is expected to decrease from 2008, primarily due to natural declines in Western Canada, East Coast Canada and International, OPEC quota restraints in Libya, and large facility turnarounds in East Coast Canada and International. These turnarounds are being undertaken to enhance production growth in the future and maintain reliable operations. Partially offsetting these decreases are additional volumes from Oil Sands and base business investments, which moderate the natural declines. With deferred production from turnarounds back on-stream at the end of 2009, the exit rate is expected to be closer to the high end of the range.
Factors that may impact production during 2009 include reservoir performance, drilling results, facility reliability, changes in OPEC production quotas and the successful execution of planned turnarounds.
| (thousands of boe/d) | 2008 Outlook (+/-) As at July 24, 2008 | 2008 Actual | 2009 Outlook (+/-) As at December 11, 2008 | 2009 Outlook (+/-) As at January 29, 2009 |
| North American Natural Gas | | | | |
| Natural gas | 94 | 98 | 84 | 81 |
| Liquids | 12 | 13 | 14 | 14 |
| Oil Sands | | | | |
| Syncrude | 35 | 35 | 38 | 38 |
| MacKay River | 25 | 25 | 27 | 27 |
| International & Offshore | | | | |
| East Coast Canada | 87 | 90 | 68 | 68 |
| International | | | | |
| North Sea | 94 | 98 | 85 | 85 |
| Other International | 58 | 59 | 59 | 52 |
Management's Discussion and Analysis
PETRO-CANADA
North American Natural Gas
North American Natural Gas facilities continued to operate reliably in the fourth quarter of 2008.
| | | Three months ended December 31, | | | Year ended December 31, | |
| (millions of Canadian dollars) | | 2008 | | | 2007 | | | 2008 | | | 2007 | |
| Net earnings (loss) | | $ | 5 | | | $ | (57 | ) | | $ | 344 | | | $ | 191 | |
| Cash flow from operating activities | | $ | 208 | | | $ | 164 | | | $ | 1,055 | | | $ | 725 | |
North American Natural Gas recorded net earnings of $5 million in the fourth quarter of 2008, compared with a net loss of $57 million in the fourth quarter of 2007. Higher realized natural gas prices and lower exploration and DD&A expenses were partially offset by higher operating expenses and lower realized crude oil and liquids prices. DD&A expense in the fourth quarter of 2008 included a charge of $41 million ($28 million after-tax) for costs related to a discontinued pilot project in northern British Columbia. DD&A expense in the fourth quarter of 2007 included a charge of $150 million before-tax ($97 million after-tax) related to the impairment of coal bed methane (CBM) assets in the U.S. Rockies due to probable reserves reductions combined with lower prices.
North American Natural Gas Production and Pricing
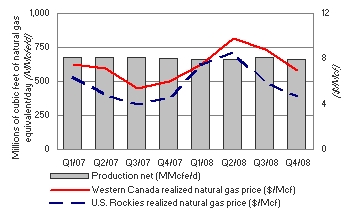
| In the fourth quarter of 2008, North American Natural Gas production was relatively unchanged, compared with the same period in 2007. Production reflected higher natural gas production in the U.S. Rockies and strong performance in Western Canada, which significantly offset natural decline rates. Realized natural gas prices in Western Canada and the U.S. Rockies increased 16% and 1%, respectively, in the fourth quarter of 2008, compared with the same quarter of 2007, consistent with market price trends. |
| | Fourth quarter 2008 | | | Fourth quarter 2007 | |
Production net (MMcfe/d) 1 | | | | | |
| Western Canada | | 557 | | | | 574 | |
| U.S. Rockies | | 105 | | | | 95 | |
| Total North American Natural Gas production net | | 662 | | | | 669 | |
Western Canada realized natural gas price (Cdn$/Mcf) 1 | $ | 6.93 | | | $ | 5.96 | |
U.S. Rockies realized natural gas price (Cdn$/Mcf) 1 | $ | 4.64 | | | $ | 4.58 | |
| 1 | For North American Natural Gas crude oil and NGL and natural gas production and average realized prices, refer to the charts on pages 23 and 24, respectively. |
Petro-Canada operated gas plants and facilities in Western Canada delivered 99% reliability in the fourth quarter of 2008.
Scheduled Turnarounds
No major turnarounds are planned at the Company’s natural gas processing facilities in the first quarter of 2009.
Oil Sands
Increased reliability and capacity at MacKay River were offset by charges due to the deferral of the Fort Hills FID.
| | | Three months ended December 31, | | | Year ended December 31, | |
| (millions of Canadian dollars) | | 2008 | | | 2007 | | | 2008 | | | 2007 | |
| Net earnings (loss) | | $ | (164 | ) | | $ | 129 | | | $ | 334 | | | $ | 316 | |
| Cash flow from operating activities | | $ | 217 | | | $ | 107 | | | $ | 622 | | | $ | 512 | |
Management's Discussion and Analysis
PETRO-CANADA
In the fourth quarter of 2008, Oil Sands recorded a net loss of $164 million, compared with net earnings of $129 million in the fourth quarter of 2007. Lower Syncrude realized prices, higher operating costs and losses on sales of crude oil inventories were partially offset by higher production, higher MacKay River realized prices and lower DD&A expenses. The net loss in the fourth quarter of 2008 included expenses of $216 million before-tax ($156 million after-tax) to reflect costs incurred terminating certain goods and services agreements and DD&A charges on certain property, plant and equipment due to the deferral of the FID on the mining and upgrading portions of the Fort Hills project.
Net earnings in the fourth quarter of 2007 included a $55 million positive adjustment related to income tax rate adjustments.
Oil Sands Production and Pricing
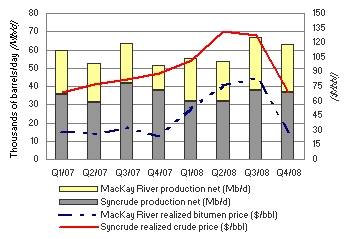
| Syncrude production was down 2% in the fourth quarter of 2008, compared with the fourth quarter of 2007. In the fourth quarter of 2008, production was impacted by the completion of a planned turnaround of Coker 8-2 and bitumen production constraints. Syncrude realized prices were 22% lower in the fourth quarter of 2008, compared with the fourth quarter of 2007. MacKay River production was up 86% in the fourth quarter of 2008, compared with the same period of 2007, due to increased reliability and capability. Production in the fourth quarter of 2007 was reduced due to operational upsets. MacKay River realized bitumen prices increased 18% in the fourth quarter of 2008, compared with the fourth quarter of 2007, due to a narrowing of the light/heavy crude price differential. |
| | Fourth quarter 2008 | | | Fourth quarter 2007 | |
Production net (b/d) | | | | | |
| Syncrude | | 36,900 | | | | 37,600 | |
| MacKay River | | 26,200 | | | | 14,100 | |
| Total Oil Sands production net | | 63,100 | | | | 51,700 | |
Syncrude realized crude price ($/bbl) | $ | 69.07 | | | $ | 88.01 | |
MacKay River realized bitumen price ($/bbl) | $ | 28.41 | | | $ | 24.13 | |
The planned 45-day turnaround of Coker 8-2 at Syncrude began on September 5, 2008 and was completed in late October 2008. Syncrude’s production is being negatively impacted by lower than planned bitumen production. Initiatives are being put in place to resolve the current constraints, but they are expected to continue to impact production in the first quarter of 2009.
In the fourth quarter of 2008, operations at MacKay River continued to be strong, with reliability averaging 98%. This is a large improvement over the fourth quarter of 2007, when operational upsets occurred. MacKay River exited 2008 with production levels at approximately 30,000 b/d.
Fort Hills Project
During the quarter, the Fort Hills Energy Limited Partnership announced that the preliminary results from the front-end engineering and design (FEED) work suggest that estimated costs for its Fort Hills project had risen considerably and that it will defer the FID on the mining portion of the project until costs can be reduced and commodity prices and financial markets recover. The Sturgeon Upgrader portion of the project was put on hold and a decision on whether to proceed with the upgrader will be made at a later date.
Activities during the quarter focused on opportunities for improvement in all areas, including capital and operating cost reductions, efficiencies on project execution and the overall project schedule for bitumen production. It is anticipated that the re-scoping and revision of the cost estimates will be completed sometime in the third quarter of 2009. Once this work is complete, the Fort Hills partnership will develop a definitive cost estimate. While new orders for equipment and services have been put on hold, some long-lead equipment currently on order remains on order, with plans to take delivery and put into storage. Some existing equipment supply and service agreements have been terminated or suspended.
Management's Discussion and Analysis
PETRO-CANADA
The Partnership is deferring the upgrader at this time to reduce overall cost exposure on the project. The Partnership remains committed to retention of the leases and are holding discussions with the Government of Alberta on the current lease term.
The regulatory hearing for the Sturgeon Upgrader was completed in early July 2008. In August 2008, the Energy Resources Conservation Board (ERCB) requested additional information on the proposal to construct one or more work camps for the Fort Hills Sturgeon Upgrader site. After reviewing responses from various interested parties, the ERCB decided to resume the hearing for the proposed upgrader to address additional information regarding work camps only. This hearing took place in October 2008. Regulatory approval for the Sturgeon Upgrader was received from the ERCB in January 2009. In the fourth quarter of 2008, the Partnership received regulatory approval for an amendment to the approved mine plan, which incorporates improvements identified through the mine plan optimization process.
MacKay River Expansion Project
In the first quarter of 2008, the Company received regulatory approval for the proposed MacKay River 40,000 b/d in situ expansion project. Petro-Canada continues to pursue cost-saving opportunities associated with using international engineering, procurement and construction contractors. At the end of the fourth quarter of 2008, the Company was receiving and reviewing lump sum construction bid contracts.
Scheduled Turnarounds
There are no major turnarounds planned at Syncrude or MacKay River in the first quarter of 2009.
Other Developments
Petro-Canada and its partners in Syncrude reached a royalty agreement with the Government of Alberta to amend the existing Syncrude Crown agreement.
International & Offshore
East Coast Canada
The White Rose Extensions project advanced with the drilling of a pilot well in North Amethyst and a delineation well in West White Rose, as well as procurement and fabrication for the North Amethyst portion of the field.
| | | Three months ended December 31, | | | Year ended December 31, | |
| (millions of Canadian dollars) | | 2008 | | | 2007 | | | 2008 | | | 2007 | |
Net earnings 1 | | $ | 211 | | | $ | 346 | | | $ | 1,368 | | | $ | 1,229 | |
| Cash flow from operating activities | | $ | 347 | | | $ | 261 | | | $ | 1,850 | | | $ | 1,491 | |
| 1 | East Coast Canada crude oil inventory movements increased net earnings by $86 million before-tax ($59 million after-tax) and $26 million before-tax ($17 million after-tax) for the three months and year ended December 31, 2008, respectively. The same factor increased (decreased) net earnings by $(30) million before-tax ($(20) million after-tax) and $18 million before-tax ($12 million after-tax) for the three months and year ended December 31, 2007, respectively. |
Net earnings for East Coast Canada were $211 million in the fourth quarter of 2008, down from $346 million in the fourth quarter of 2007. Lower realized prices and higher royalty payments, operating costs and DD&A expenses were partially offset by increased production and foreign exchange gains.
Management's Discussion and Analysis
PETRO-CANADA
East Coast Canada Production and Pricing
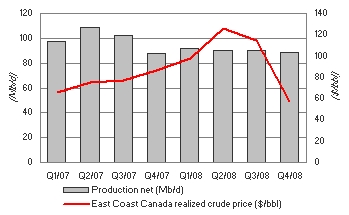
| In the fourth quarter of 2008, East Coast Canada production increased 1%, compared with the same period in 2007. Hibernia production was higher due to the positive impact of recent well workovers, strong reliability and the addition of two new production wells, which offset natural declines. White Rose production was lower due to the shut in of a production well due to a subsea gas leak. Terra Nova production was slightly lower due to natural declines and the completion of a planned overhaul of one of the main power generators. During the fourth quarter of 2008, East Coast Canada realized crude prices decreased 34%, compared with the fourth quarter of 2007. |
| | Fourth quarter 2008 | | | Fourth quarter 2007 | |
Production net (b/d) | | | | | |
| Terra Nova | | 30,900 | | | | 31,600 | |
| Hibernia | | 28,300 | | | | 24,800 | |
| White Rose | | 29,500 | | | | 31,000 | |
| Total East Coast Canada production net | | 88,700 | | | | 87,400 | |
Average realized crude price ($/bbl) | $ | 57.19 | | | $ | 86.45 | |
The Terra Nova Floating Production, Storage and Offloading (FPSO) vessel operated at 90% facility reliability in the fourth quarter of 2008. Performance of the Terra Nova FPSO swivel was unchanged in the fourth quarter of 2008. All equipment and materials are in place to replace the swivel, if necessary.
Scheduled Turnarounds
Hibernia plans to commence a 21-day turnaround in the first quarter of 2009.
White Rose Extensions Development
Early in the second quarter of 2008, the partners received regulatory approval for the North Amethyst development, and the Company internally approved the project to proceed. FEED for the North Amethyst portion of the project is complete. A pilot well was drilled in North Amethyst in the fourth quarter of 2008. Further development drilling will commence in the first quarter of 2009. Procurement and fabrication for the project continued to advance, and it is on schedule to deliver first oil in late 2009 or early 2010. North Amethyst is the first of three identified extensions to the original White Rose field. A delineation well was also drilled in West White Rose to aid in development planning.
Hebron
During the third quarter of 2008, the Hebron partners reached an agreement with the provincial government on commercial terms that will allow development activities to proceed for Hebron. The transfer of operatorship from Chevron Canada Ltd. to ExxonMobil Canada became effective at the beginning of the fourth quarter of 2008.
East Coast Canada Royalties
In the fourth quarter of 2008, East Coast Canada royalties averaged 22% of gross revenue, compared with 17% in the fourth quarter of 2007. Terra Nova production was subject to Tier I royalties of 30% of net revenue and a Tier II royalty of an incremental 12.5% of net revenue, which was triggered during the second quarter of 2008. White Rose production was subject to a Tier I royalty of 20% of net revenue and a Tier II royalty of an incremental 10% of net revenue, which was triggered during the first quarter of 2008. Production from Hibernia continued to be subject to basic royalties of 5% of gross revenue however, provincial government royalty rates are expected to increase from 5% of gross to 30% of net revenue in the future. In addition, Hibernia production will be subject to a federal government net profits interest of up to 10% of net revenue commencing in the first quarter of 2009.
Management's Discussion and Analysis
PETRO-CANADA
International
The business had a strong financial quarter with robust operating performance at Buzzard.
| | | Three months ended December 31, | | | Year ended December 31, | |
| (millions of Canadian dollars) | | 2008 | | | 2007 | | | 2008 | | | 2007 | |
Net earnings (loss) 1, 2 | | $ | 193 | | | $ | (30 | ) | | $ | 1,684 | | | $ | 374 | |
| Cash flow from (used in) operating activities | | $ | 300 | | | $ | (868 | ) | | $ | 2,380 | | | $ | 220 | |
| 1 | International crude oil inventory movements increased net earnings by $66 million before-tax ($35 million after-tax) and by $154 million before-tax ($53 million after-tax) for the three months and year ended December 31, 2008, respectively. The same factor increased the net loss by $58 million before-tax ($20 million after-tax) and decreased net earnings by $30 million before-tax ($14 million after-tax) for the three months and year ended December 31, 2007, respectively. |
| 2 | During the fourth quarter of 2007, the Company entered into derivative contracts to close out the hedged portion of its Buzzard production from January 1, 2008 to December 31, 2010, resulting in a reduction in cash flow of $1,145 million after-tax. |
In the fourth quarter of 2008, International delivered net earnings of $193 million, compared with a net loss of $30 million in the fourth quarter of 2007. The increase in net earnings was due to higher natural gas prices, lower exploration and DD&A expenses and foreign currency translation gains, partially offset by lower crude oil prices, lower production and higher operating, marketing and general expenses. The net loss in the fourth quarter of 2007 included a $383 million before-tax ($226 million after-tax) realized loss on the Buzzard derivative contracts.
International Production and Pricing
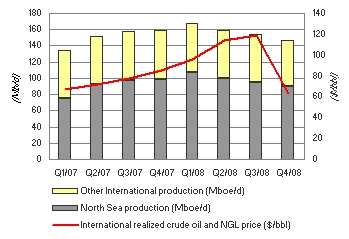
| International production decreased 8% in the fourth quarter of 2008, compared with the fourth quarter of 2007. In the fourth quarter of 2008, production from the North Sea decreased by 8%, reflecting natural declines in several North Sea assets and an unplanned shutdown of the Triton facility in December. These factors were partially offset by higher Buzzard production due to strong operating performance. Other International production decreased 8% in the fourth quarter of 2008, compared with the fourth quarter of 2007. |
| | Fourth quarter 2008 | | | Fourth quarter 2007 | |
Production net (boe/d) | | | | | |
| U.K. sector of the North Sea | | 71,400 | | | | 74,800 | |
| The Netherlands sector of the North Sea | | 18,800 | | | | 23,400 | |
| North Sea | | 90,200 | | | | 98,200 | |
| Other International | | 56,300 | | | | 61,000 | |
| Total International production net | | 146,500 | | | | 159,200 | |
Average realized crude oil and NGL prices ($/bbl) | $ | 63.56 | | | $ | 85.40 | |
Average realized natural gas price ($/Mcf) | $ | 13.77 | | | $ | 6.48 | |
International operations realized crude oil and NGL prices decreased 26% in the fourth quarter of 2008, compared with the same period in 2007. Realized prices for natural gas increased 113% in the fourth quarter of 2008, compared with the same period in the prior year. The increase in realized gas prices is due to strong Netherlands gas prices, which are linked largely to crude oil prices, and to a revenue adjustment in Trinidad and Tobago on NCMA to reflect an adjustment to our production entitlement.
North Sea
Buzzard production averaged 200,800 boe/d gross (60,000 boe/d net) in the fourth quarter of 2008, up compared with the same quarter of 2007. Buzzard had planned to commence a turnaround in August for maintenance work and the reinstallation of the jack-up rig, but weather delayed the rig reinstallation until the first quarter of 2009. Buzzard shut down for seven days in late October 2008 to complete several scheduled repairs. Work on detailed engineering and ordering of long-lead items is underway for the fourth platform, which is being built to treat higher than expected hydrogen sulphide content in some Buzzard wells.
Management's Discussion and Analysis
PETRO-CANADA
In the Netherlands sector of the North Sea, the Petro-Canada operated De Ruyter and Hanze facilities continued to perform well, delivering 24,400 boe/d gross (12,500 boe/d net) of production in the fourth quarter of 2008.
Other International
Production in Libya averaged 45,400 boe/d in the fourth quarter of 2008, down from 49,000 boe/d in the same quarter of 2007 due to pressure surveys, compressor maintenance and low reservoir pressure in several fields.
Trinidad and Tobago offshore gas production averaged 66 MMcf/d in the fourth quarter of 2008, down compared with 72 MMcf/d in the fourth quarter of 2007. The decrease was due to maintenance at Atlantic LNG facilities and several short shutdowns for the tie-in of the new Poinsettia facility.
Syria Ebla Gas Project
Detailed engineering continues on the Syria Ebla gas project and field construction commenced in July 2008. The project was 50% complete at the end of 2008 and is on plan. The drilling program is proceeding and results have been inline with expectations. The 3D seismic acquisition of the Ash Shaer fields continues. When completed, the Ebla gas project is expected to produce 80 MMcf/d of natural gas, with first gas anticipated in 2010.
Libya Exploration and Production Sharing Agreements (EPSAs)
In June 2008, Petro-Canada signed six new EPSAs with the Libya National Oil Corporation (NOC) to replace existing concession agreements and one EPSA. The new EPSAs were ratified as of the signing, with an effective date of January 1, 2008. The commercial terms of the new agreements, including the signing bonus, match those announced when the heads of agreement was completed in December 2007. Under the new agreements, Petro-Canada will pay 50% of all development capital and will initially receive a 12% entitlement1 share of production. The Company will continue to report production on a before royalty working interest basis. The Company estimates there are gross Contingent and Prospective Resources2 of almost two billion barrels of oil associated with the redevelopment program. Following ratification of the new agreements, a payment of $500 million US, representing 50% of the signature bonus, was made to the Libya NOC in July 2008, with the remainder to be paid between 2009 and 2013.
The agreements will enable Petro-Canada to design and implement jointly with the NOC the redevelopment of major fields. Petro-Canada’s Libya EPSAs currently produce approximately 100,000 b/d gross (50,000 b/d working interest) on an annual average basis. Under the new agreements, production from the redevelopment program is expected to double over the next five to seven years.
The Company also proposes to invest $460 million US over the next seven years on a 100%-operated exploration program in the Sirte region, one of the world’s most prolific basins. Success from this exploration program could materially add to reserves and production.
Work has now commenced on implementing the projects associated with the new EPSAs, with a focus on preparing the Amal field development program and initiating the new exploration program. Seismic operations have commenced with four seismic crews deployed by the end of the fourth quarter of 2008, and the Company expects to be drilling Petro-Canada’s first operated exploration well in the second quarter of 2009.
In early January 2009, the NOC advised the Company that production from Petro-Canada’s Libya EPSAs will be limited to 85,000 b/d gross (42,500 b/d net) due to the quota agreed to by OPEC producers in December 2008.
Scheduled Turnarounds
Buzzard is expected to commence a four-day shutdown for the reinstallation of the jack-up rig in the first quarter of 2009.
Reserves
Petro-Canada's qualified reserves evaluators prepare the reserves estimates used by the Company. The Canadian provincial securities commissions do not consider Petro-Canada’s reserves staff and management as independent of the Company. Petro-Canada has obtained an exemption from certain Canadian reserves disclosure requirements that allows Petro-Canada to make disclosure in accordance with SEC standards where noted in this quarterly report. This exemption allows comparisons with U.S. and other international issuers.
| 1 | Entitlement refers to Petro-Canada’s share of production after royalties and local taxes. |
| 2 | The resources number quoted does not include reserves and is approximately 60% Contingent Resources and 40% risked Prospective Resources. Contingent Resources are subject to field development plan approvals. Risked Prospective Resources are subject to exploration success. Petro-Canada’s resources in Libya are largely oil. |
Management's Discussion and Analysis
PETRO-CANADA
As a result, Petro-Canada formally discloses its proved reserves data using U.S. requirements and practices, and these may differ from Canadian domestic standards and practices. The use of the terms such as "probable," "possible," ”resources” and “life-of-field production” in this quarterly report does not meet the SEC guidelines for SEC filings. To disclose reserves in SEC filings, oil and gas companies must prove they are economically and legally producible under existing economic and operating conditions. Note that when the term boe is used in this quarterly report, it may be misleading, particularly if used in isolation. A boe conversion ratio of six Mcf to one bbl is based on an energy equivalency conversion method. This method primarily applies at the burner tip and does not represent a value equivalency at the wellhead.
The Company's reserves data and reserves quantities are determined by Petro-Canada's staff of qualified reserves evaluators using corporate-wide policies, procedures and practices. These reserves policies, procedures and practices conform to the requirements in Canada, as well as with the U.S. SEC and the Association of Professional Engineers, Geologists and Geophysicists of Alberta's Standard of Practice for the Evaluation of Oil and Gas Reserves for Public Disclosure. Petro-Canada also employs independent third parties to evaluate, audit and/or review its reserves processes and estimates. In 2008, 49% of North American (excluding Oil Sands) and 60% of International proved reserves were audited by independent reserves evaluators. Also in 2008, 100% of Oil Sands bitumen proved resources were audited and 100% of Oil Sands mining proved reserves were reviewed by independent reserves evaluators. The independent reserves evaluators concluded that the Company's year-end reserves estimates were reasonable.
The following table does not conform to SEC standards and is for supplemental general information. Working interest reserves before royalties and million barrels of oil equivalent (MMboe) do not conform to SEC standards.
December 31, 2008 Consolidated Reserves – for Oil and Gas Activities | Proved liquids | | Proved gas | | 2008 Proved reserves additions liquids 1 | | 2008 Proved reserves additions gas 1 | | Proved 2 | | 2008 Proved reserves additions 1 | |
(working interest before royalties) | (Millions of barrels – MMbbls) | | (Billion cubic feet – Bcf) | | (MMbbls) | | (Bcf) | | (MMboe) | | (MMboe) | |
| North American Natural Gas | | 42 | | | 1,274 | | | 2 | | | 9 | | | 254 | | | 3 | |
Oil Sands 3 | | 258 | | | – | | | (9 | ) | | – | | | 258 | | | (9 | ) |
| International & Offshore | | | | | | | | | | | | | | | | | | |
| East Coast Canada | | 81 | | | – | | | 14 | | | – | | | 81 | | | 14 | |
| International | | 290 | | | 220 | | | 89 | | | (16 | ) | | 327 | | | 87 | |
| Total | | 671 | | | 1,494 | | | 96 | | | (7 | ) | | 920 | | | 95 | |
| Production net | | (97 | ) | | (258 | ) | | | | | | | | (140 | ) | | | |
| 1 | Proved reserves additions are the sum of revisions of previous estimates, net purchases/sales, and discoveries, extensions and improved recovery. |
| 2 | At year-end 2008, 54% of proved reserves were classified as proved developed reserves. Of the total proved undeveloped reserves, 96% were associated with large projects currently producing or under active development, including Buzzard, Syncrude, MacKay River, Hibernia, Terra Nova, White Rose, and Trinidad and Tobago natural gas. |
| 3 | Oil Sands proved reserves excluded reserves from Syncrude, which is considered a mining activity by the SEC. |
The following table does not conform to SEC standards and is for supplemental general information. Working interest reserves before royalties does not conform to SEC standards.
December 31, 2008 Reserves – for Syncrude Mining Operation | Proved liquids | | 2008 Proved reserves additions liquids 1 | |
| (working interest before royalties) | (MMbbls) | | (MMbbls) | |
| Reserves of synthetic crude oil | | 366 | | | 29 | |
| Production net | | (13 | ) | | | |
| 1 | Proved reserves additions are the sum of revisions of previous estimates, net purchases/sales, and discoveries, extensions and improved recovery. |
Management's Discussion and Analysis
PETRO-CANADA
The following table and the accompanying narrative do not conform to SEC standards and are for supplemental general information. Working interest reserves before royalties, MMboe and combining oil and gas and oil sands mining activities together do not conform to SEC standards.
December 31, 2008 Consolidated Reserves – for Oil and Gas and Oil Sands Mining Activities | Proved liquids | | Proved gas | | 2008 Proved reserves additions liquids 1 | | 2008 Proved reserves additions gas 1 | | Proved 2 | | 2008 Proved reserves additions 1 | |
| (working interest before royalties) | (MMbbls) | | (Bcf) | | (MMbbls) | | (Bcf) | | (MMboe) | | (MMboe) | |
| North American Natural Gas | | 42 | | | 1,274 | | | 2 | | | 9 | | | 254 | | | 3 | |
Oil Sands 3 | | 624 | | | – | | | 20 | | | – | | | 624 | | | 20 | |
| International & Offshore | | | | | | | | | | | | | | | | | | |
| East Coast Canada | | 81 | | | – | | | 14 | | | – | | | 81 | | | 14 | |
| International | | 290 | | | 220 | | | 89 | | | (16 | ) | | 327 | | | 87 | |
| Total | | 1,037 | | | 1,494 | | | 125 | | | (7 | ) | | 1,286 | | | 124 | |
| Production net | | (110 | ) | | (258 | ) | | | | | | | | (153 | ) | | | |
| 1 | Proved reserves additions are the sum of revisions of previous estimates, net purchases/sales, and discoveries, extensions and improved recovery. |
| 2 | At year-end 2008, 54% of proved reserves were classified as proved developed reserves. Of the total proved undeveloped reserves, 96% were associated with large projects currently producing or under active development, including Buzzard, Syncrude, MacKay River, Hibernia, Terra Nova, White Rose, and Trinidad and Tobago natural gas. |
| 3 | Oil Sands proved reserves included reserves from Syncrude and MacKay River. |
In 2008, proved reserves additions totalled 124 MMboe, excluding 2008 production of 153 MMboe net. As a result, total proved reserves decreased from 1,315 MMboe at year-end 2007 to 1,286 MMboe at year-end 2008. This decrease included a (37) MMboe revision associated with lower 2008 year-end crude oil prices compared with 2007 year-end prices. The majority of the lower year-end prices negatively impacted the North American Natural Gas and International business units and is reflected in the volume numbers listed below.
The North American Natural Gas business added 3 MMboe of proved reserves additions in 2008. Reserves additions were due to exploration and development activity, partially offset by technical revisions related to reservoir performance and the year-end price impact.
In 2008, 20 MMbbls of proved reserves were added in Oil Sands. At Syncrude, 29 MMbbls were added to proved reserves as a result of a planned mine extension. At MacKay River, delineation drilling resulted in a revision of (9) MMbbls of proved reserves.
In East Coast Canada, a total of 14 MMbbls were added to proved reserves during 2008, due to ongoing development well drilling and production performance at White Rose, Terra Nova and Hibernia.
International proved reserves increased by 87 MMboe in 2008, due primarily to the signing of the Libya EPSAs and development activities at Buzzard, partially offset by the year-end price impact.
DOWNSTREAM
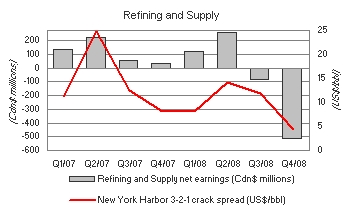
The Downstream successfully brought online the Edmonton RCP. Marketing performance was strong in the quarter, offset by lower Refining and Supply earnings.
| | | Three months ended December 31, | | | Year ended December 31, | |
| (millions of Canadian dollars) | | 2008 | | | 2007 | | | 2008 | | | 2007 | |
| Net earnings (loss) | | $ | (457 | ) | | $ | 81 | | | $ | – | | | $ | 629 | |
| Cash flow from operating activities | | $ | 528 | | | $ | 245 | | | $ | 464 | | | $ | 994 | |
The Downstream business recorded a net loss of $457 million in the fourth quarter of 2008, down significantly from net earnings of $81 million in the same quarter of 2007. The net loss reflected the negative impact from declining crude oil feedstock costs while using a FIFO inventory valuation methodology. Also negatively impacting earnings were lower refinery yields, lower gasoline cracking margins and increased operating costs. These factors were partially offset by an increase in realized refining margins, higher marketing margins, positive foreign exchange impacts, and higher distillate cracking margins.
Management's Discussion and Analysis
PETRO-CANADA
Downstream Net Earnings
| | | Fourth quarter 2008 | | | Fourth quarter 2007 | |
Refining and Supply net earnings (loss) (millions of Canadian dollars) | | $ | (509 | ) | | $ | 31 | |
New York Harbor 3-2-1 crack spread (US$/bbl) | | $ | 4.36 | | | $ | 8.18 | |
Chicago 3-2-1 crack spread (US$/bbl) | | $ | 5.25 | | | $ | 8.45 | |
Seattle 3-2-1 crack spread (US$/bbl) | | $ | 5.23 | | | $ | 11.12 | |
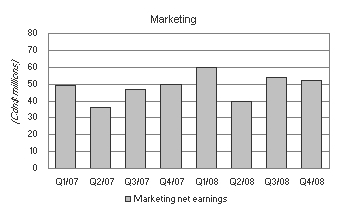
Marketing net earnings (millions of Canadian dollars) | | $ | 52 | | | $ | 50 | |
The average New York Harbor 3-2-1 refinery crack spread was $4.36 US/bbl in the fourth quarter of 2008, down from $8.18 US/bbl in the fourth quarter of 2007. The average international light/heavy crude price differential was $10.10 US/bbl in the fourth quarter of 2008, compared with $13.03 US/bbl in the fourth quarter of 2007.
In the fourth quarter of 2008, total sales of refined petroleum products decreased 3% to 4.9 billion litres, compared with the same period last year. The decrease reflected lower wholesale sales and lubricants sales volumes, partially offset by higher retail and Refining and Supply sales volumes.
Refining and Supply recorded a net loss of $509 million in the fourth quarter of 2008, down significantly from net earnings of $31 million in the same quarter of 2007. Results were negatively impacted by the following five items, listed in order of impact. First, costs of sales were higher while using a FIFO inventory valuation methodology in a declining crude oil feedstock cost environment. Second, refinery yields in Edmonton were lower due to the ramp up activity for the RCP. Third, gasoline cracking margins were lower. Fourth, there were negative inventory impacts as a result of mix, net build in inventory and a net realizable value adjustment at our petrochemical joint venture. Fifth, operating costs increased because of maintenance and repair activity, higher salaries and wages and planned turnaround costs. These factors were partially offset by an increase in realized refining margins for lubricants, asphalt and HFO, positive foreign exchange impacts, as well as higher distillate cracking margins.
Marketing contributed fourth quarter 2008 net earnings of $52 million, up compared with $50 million in the same quarter of 2007. In the fourth quarter of 2008, Marketing results reflected higher fuel margins. These factors were partially offset by the negative impact of higher costs of sales in the Lubricants business while using a FIFO inventory valuation methodology in a declining crude oil feedstock cost environment and by increased operating expenses for product distribution and commissions.
Downstream Turnaround Activity
No major turnarounds are planned for the first quarter of 2009.
Edmonton Refinery Conversion Project (RCP)
At the Edmonton refinery, the Company converted the facility to run oil sands-based feedstock. The RCP enables Petro-Canada to directly upgrade up to 26,000 b/d of bitumen and process up to 48,000 b/d of sour synthetic crude oil, replacing the more expensive conventional light crude feedstock previously refined.
The Edmonton RCP was brought on-line and began the ramp up process in the fourth quarter of 2008. Ramp up of production is expected to continue in the first quarter of 2009.
Management's Discussion and Analysis
PETRO-CANADA
Change in Accounting for Inventory and Crude Oil and Product Purchases
On January 1, 2008, Petro-Canada adopted the FIFO method for valuing its crude oil and refined product inventories. The change is due to the “last-in, first-out” (LIFO) method no longer being permitted under Canadian generally accepted accounting principles (GAAP). As a result of changing from the LIFO inventory costing method to FIFO, a one-time adjustment to increase inventories by $812 million, future income tax liabilities by $256 million and retained earnings by $556 million was recorded. This adjustment occurred on January 1, 2008 and increased the Company’s working capital and Downstream capital employed values. A second impact relates to reported cost of crude oil and product purchases. The change in methodology reflects historic crude oil prices at the time the crude oil is purchased. Reported operating revenues continue to reflect current market prices when the crude oil is refined and sold. As a result of the lag between when crude oil is purchased and when product is sold, and fluctuating crude oil prices, future reported Downstream earnings may be more volatile.
CORPORATE
| Shared Services and Eliminations | | Three months ended December 31, | | | Year ended December 31, | |
| (millions of Canadian dollars) | | 2008 | | | 2007 | | | 2008 | | | 2007 | |
| Net earnings (loss) | | $ | (479 | ) | | $ | 53 | | | $ | (596 | ) | | $ | (6 | ) |
| Cash flow from (used in) operating activities | | $ | (271 | ) | | $ | (511 | ) | | $ | 151 | | | $ | (603 | ) |
Shared Services and Eliminations recorded a net loss of $479 million in the fourth quarter of 2008, compared with net earnings of $53 million for the same period in 2007. The net loss in the fourth quarter of 2008 included a $442 million foreign currency translation loss on long-term debt, partially offset by the realization of $39 million of profits on inter-segment sales of crude oil previously eliminated, $27 million foreign exchange gains on U.S. dollar cash balances and a $15 million recovery related to the mark-to-market valuation of stock-based compensation. Net earnings in the fourth quarter of 2007 included a $45 million recovery related to the mark-to-market valuation of stock-based compensation, $39 million foreign currency translation gains on U.S. dollar cash and other financial instruments and $10 million foreign currency translation gains on long-term debt.
Interest expense was $86 million before-tax during the fourth quarter of 2008, up from $43 million in the fourth quarter of the prior year. The Company capitalized $14 million of interest expense during the quarter, compared with $9 million in the fourth quarter of 2007.
Cash flow from operating activities was affected by tax deferrals, resulting from the Company’s upstream partnership. These deferrals decreased cash flow from operating activities by about $109 million in the quarter, compared with an increase of $18 million in the same period last year. On January 1, 2008, the Company adopted the FIFO costing method for valuing its Downstream inventories, which is consistent with the method prescribed for income tax purposes, thereby eliminating the difference in earnings and cash flow from operating activities.
LIQUIDITY AND CAPITAL RESOURCES
Summary of Cash Flows
| | | Three months ended December 31, | | | Year ended December 31, | |
| (millions of Canadian dollars) | | 2008 | | | 2007 | | | 2008 | | | 2007 | |
| Cash flow from operating activities | | $ | 1,329 | | | $ | (602 | ) | | $ | 6,522 | | | $ | 3,339 | |
| Net cash (outflows) inflows from: | | | | | | | | | | | | | | | | |
| Investing activities | | | (1,710 | ) | | | (1,197 | ) | | | (5,384 | ) | | | (3,647 | ) |
| Financing activities | | | (95 | ) | | | 940 | | | | 76 | | | | 40 | |
| Increase (decrease) in cash and cash equivalents | | | (476 | ) | | | (859 | ) | | | 1,214 | | | | (268 | ) |
| Cash and cash equivalents | | $ | 1,445 | | | $ | 231 | | | $ | 1,445 | | | $ | 231 | |
Petro-Canada’s financing strategy is designed to maintain financial strength and flexibility to support profitable growth in all business environments. Two key measures that Petro-Canada uses to measure the Company’s overall financial strength are debt-to-cash flow from operating activities and debt-to-debt plus equity. Petro-Canada’s debt-to-cash flow from operating activities ratio, a key short-term leverage measure, was 0.7 times at December 31, 2008. This was within the Company’s target range of no more than 2.0 times. Debt-to-debt plus equity, the long-term measure for capital structure, was 23.5% at December 31, 2008, below the Company’s target range of 25% to 35%.
Management's Discussion and Analysis
PETRO-CANADA
| Financial Ratios | December 31, 2008 | December 31, 2007 |
Debt-to-cash flow from operating activities (times) | 0.7 | 1.0 |
Debt-to-debt plus equity (%) | 23.5 | 22.5 |
Operating Activities
The operating working capital deficiency was $46 million at the end of 2008, excluding cash and cash equivalents, the current portion of long-term debt and short-term notes payable, compared with an operating working capital deficiency of $565 million at December 31, 2007. The decrease in operating working capital deficiency at December 31, 2008 primarily resulted from the increase in inventories due to the adoption of the FIFO method for valuing inventories, the increase to accounts receivable due to the effective unwinding of the accounts receivable securitization program and the decrease in accounts payable and accrued liabilities due to the recovery related to the mark-to-market valuation of stock-based compensation.
Investing Activities
| | Three months ended December 31, | | | Year ended December 31, | | | Outlook | |
| (millions of Canadian dollars) | 2008 | | | 2007 | | | 2008 | | | 2007 | | | | 2009 | 1 |
| Upstream | | | | | | | | | | | | | | | |
| North American Natural Gas | $ | 566 | | | $ | 369 | | | $ | 1,023 | | | $ | 866 | | | $ | 580 | |
| Oil Sands | | 374 | | | | 482 | | | | 1,063 | | | | 779 | | | | 985 | |
| International & Offshore | | | | | | | | | | | | | | | | | | | |
| East Coast Canada | | 82 | | | | 33 | | | | 276 | | | | 159 | | | | 530 | |
| International | | 312 | | | | 224 | | | | 2,115 | | | | 762 | | | | 1,270 | |
| | | 1,334 | | | | 1,108 | | | | 4,477 | | | | 2,566 | | | | 3,365 | |
| Downstream | | | | | | | | | | | | | | | | | | | |
| Refining and Supply | | 333 | | | | 405 | | | | 1,651 | | | | 1,214 | | | | 460 | |
| Sales and Marketing | | 52 | | | | 51 | | | | 156 | | | | 155 | | | | 70 | |
| Lubricants | | 16 | | | | 12 | | | | 27 | | | | 27 | | | | 30 | |
| | | 401 | | | | 468 | | | | 1,834 | | | | 1,396 | | | | 560 | |
| Shared Services and Eliminations | | 13 | | | | 9 | | | | 33 | | | | 26 | | | | 35 | |
| Total property, plant and equipment and exploration | | 1,748 | | | | 1,585 | | | | 6,344 | | | | 3,988 | | | | 3,960 | |
| Other assets | | 29 | | | | 16 | | | | 29 | | | | 121 | | | | – | |
| Total Capital Expenditures | $ | 1,777 | | | $ | 1,601 | | | $ | 6,373 | | | $ | 4,109 | | | $ | 3,960 | |
| 1 | The 2009 Outlook was previously released on December 11, 2008. |
Outlook – Capital Expenditures
For 2009, the Company expects to cover its capital program with cash flow and, if necessary, from available credit facilities. On December 11, 2008 the Company released an outlook for 2009 planned capital expenditures totalling $3,960 million. Subsequent to the release of this guidance, as a result of persistently low commodity prices, the Company plans to further reduce 2009 planned capital expenditures to approximate cash flow from operating activities in order to limit draws on cash balances and available credit facilities in 2009.
Financing Activities
At the end of the fourth quarter of 2008, the Company’s syndicated committed credit facilities and bilateral demand facilities totalled $3,570 million and $777 million, respectively, of which $348 million was used for letters of credit and overdraft coverage. Subsequent to December 31, 2008, the Company’s liquidity was increased by $244 million through the addition of a bilateral committed credit facility. The syndicated facilities, which are in place until 2013, may also be used to provide liquidity support to a commercial paper program. The Company does not have any plans to issue commercial paper in the near term and no commercial paper was outstanding at December 31, 2008.
During the second quarter of 2008, the Company issued $600 million US of 10-year notes and $900 million US of 30-year notes under its previously filed base shelf prospectus. The base shelf prospectus provides for the offering of up to $4 billion US of debt securities in Canada or the U.S. over the course of a 25-month period from the date of issue, March 31, 2008.
During the third quarter of 2008, Petro-Canada’s $480 million accounts receivable securitization program was effectively unwound as it was no longer a cost-effective means of borrowing.
Management's Discussion and Analysis
PETRO-CANADA
At December 31, 2008, the credit ratings for the Company’s unsecured long-term debt are Baa2, with a stable outlook, by Moody’s Investors Service, BBB with a stable outlook by Standard & Poor’s and A (low) with a negative trend by Dominion Bond Rating Service (DBRS). The Company’s short-term debt securities are rated R-1 (low) with a negative trend by DBRS.
The Company’s financial capacity and flexibility remain strong despite the recent turmoil in financial markets. This is due to the Company’s ability to generate cash flow, having access to existing cash balances and significant credit facility capacity, and requiring no near-term refinancing. For 2009, the Company expects to cover its capital program with cash flow and, if necessary, from available credit facilities. The Company will monitor energy and financial markets through the year and take advantage of the flexibility in its capital program to pace projects and adjust capital expenditures accordingly.
Returning Cash to Shareholders
Petro-Canada’s priority uses of cash are to fund the capital program and profitable growth opportunities, and to return cash to shareholders through dividends and a share buyback program.
Petro-Canada regularly reviews its dividend strategy to ensure the alignment of dividend policy with shareholder expectations, and financial and growth objectives. Consistent with this objective, on July 24, 2008, the Company declared a 54% increase in its quarterly dividend to $0.20/share, commencing with the dividend payable on October 1, 2008. Total dividends paid in the fourth quarter of 2008 were $97 million ($0.20 per share), compared with $63 million ($0.13 per share) in the same period last year.
Petro-Canada’s current NCIB program entitles the Company to repurchase up to 5% of its outstanding common shares from June 22, 2008 to June 21, 2009, subject to certain conditions. In the fourth quarter of 2008, the Company did not repurchase any of its shares, compared with 2.0 million in the same period last year. Future share repurchases will depend on excess cash available after consideration of the Company’s priority uses of cash.
| | Shares Repurchased | | | Average Price | | | Total Cost ($ millions) | |
| Period | 2008 | | 2007 | | | 2008 | | | 2007 | | | 2008 | | | 2007 | |
| Fourth quarter | | – | | | 2,000,000 | | | $ | – | | | $ | 51.70 | | | $ | – | | | $ | 104 | |
| Year-to-date | | – | | | 15,998,000 | | | $ | – | | | $ | 52.42 | | | $ | – | | | $ | 839 | |
Contingent Liabilities and Contractual Obligations
Contractual obligations are summarized in the Company’s 2007 annual MD&A and contingent liabilities are disclosed in Note 24 of the 2007 annual Consolidated Financial Statements. Total contractual obligations at December 31, 2008 were $37.0 billion. During the fourth quarter of 2008, contractual obligations decreased by $3.7 billion primarily due to decreased product purchase commitments.
The Company has certain retail licensee agreements that qualify as variable interest entities, as described in Note 25 to the 2007 annual Consolidated Financial Statements. These entities were not consolidated as Petro-Canada is not the primary beneficiary and the Company’s maximum exposure to losses from these arrangements was not expected to be material.
RISK
As at December 31, 2008, there were no material changes in the Company’s risks or risk management activities since December 31, 2007. Petro-Canada’s risk management activities are conducted in accordance with the policies and guidelines established by the Board of Directors. Readers should refer to Petro-Canada’s 2007 AIF and the risk management section of the 2007 annual MD&A for further discussion of risks relating to Petro-Canada’s business.
INTERNATIONAL FINANCIAL REPORTING STANDARDS (IFRS)
During 2008, the Canadian Accounting Standards Board (AcSB) confirmed that publicly accountable enterprises will be required to adopt International Financial Reporting Standards (IFRS) in place of Canadian GAAP for interim and annual reporting purposes. The required changeover date is for fiscal years beginning on or after January 1, 2011.
The Company has commenced the process to transition from current Canadian GAAP to IFRS. It has established a project plan and a project team. The project team is led by finance management and includes representatives from various areas of the organization as necessary to plan for and achieve a smooth transition to IFRS.
Management's Discussion and Analysis
PETRO-CANADA
The project plan consists of three phases: initiation, detailed assessment and design and implementation. The Company has completed the first phase, which involved the development of a detailed timeline for assessing resources and training and the completion of a high level review of the major differences between current Canadian GAAP and IFRS. Education and training sessions for employees throughout the organization and discussions with the Company’s external auditors have commenced and will continue throughout the subsequent phases. Regular reporting is provided to the Company’s senior executive management and to the Audit, Finance and Risk Committee of the Board of Directors.
The Company is currently engaged in the detailed assessment and design phase of the project. The detailed assessment and design phase involves establishing work teams to complete a comprehensive analysis of the impact of the IFRS differences identified in the initial scoping assessment. In addition, an initial evaluation of IFRS 1 transition exemptions and an analysis of financial systems will be performed.
During the implementation phase, the Company will execute the required changes to business processes, financial systems, accounting policies, disclosure controls and internal controls over financial reporting.
At this time, the impact on financial statements is not reasonably determinable.
SHAREHOLDER INFORMATION
As at December 31, 2008, Petro-Canada’s outstanding common shares totalled 484.6 million and averaged 484.4 million during the fourth quarter of 2008. These figures compare with outstanding common shares of 483.5 million as at December 31, 2007 and average shares outstanding of 484.6 million for the quarter ended December 31, 2007.
Petro-Canada will hold a conference call to discuss these results with investors on Thursday, January 29, 2009 at 9:00 a.m. eastern standard time (EST). To participate, please call 1-866-898-9626 (toll-free in North America), 00-800-8989-6323 (toll-free internationally), or 416-340-2216 at 8:55 a.m. EST. Media are invited to listen to the call by dialing 1-866-540-8136 (toll-free in North America) or 416-340-8010. Media are invited to ask questions at the end of the call. A live audio broadcast of the conference call will be available on Petro-Canada's website at http://www.petro-canada.ca/en/investors/845.aspx on January 29, 2009 at 9:00 a.m. EST. Those who are unable to listen to the call live may listen to a recording of the call on Petro-Canada’s website approximately one hour after its completion by dialing 1-800-408-3053 (toll-free in North America) or 416-695-5800 (pass code number 3278221#).
Management's Discussion and Analysis
PETRO-CANADA
SELECT UPSTREAM OPERATING DATA
December 31, 2008
| | Three months ended December 31, | | Year ended December 31, | |
| | 2008 | | 2007 | | 2008 | | 2007 | |
| Before Royalties | | | | | | | | |
Crude oil and NGL production net (Mb/d) | | | | | | | | |
| North American Natural Gas | | 13.7 | | | 12.5 | | | 13.1 | | | 12.5 | |
| Oil Sands | | 63.1 | | | 51.7 | | | 59.9 | | | 56.9 | |
| International & Offshore | | | | | | | | | | | | |
| East Coast Canada | | 88.7 | | | 87.4 | | | 90.5 | | | 98.7 | |
| International | | | | | | | | | | | | |
| North Sea | | 81.2 | | | 88.4 | | | 88.4 | | | 81.3 | |
| Other International | | 45.4 | | | 49.0 | | | 48.8 | | | 47.7 | |
| | | 292.1 | | | 289.0 | | | 300.7 | | | 297.1 | |
Natural gas production net, excluding injectants (MMcf/d) | | | | | | | | | | | | |
| North American Natural Gas | | 579 | | | 594 | | | 586 | | | 599 | |
| International | | | | | | | | | | | | |
| North Sea | | 54 | | | 59 | | | 56 | | | 58 | |
| Other International | | 66 | | | 72 | | | 64 | | | 71 | |
| | | 699 | | | 725 | | | 706 | | | 728 | |
Total production (thousands of barrels of oil equivalent/day - Mboe/d) net before royalties 1 | | 409 | | | 410 | | | 418 | | | 418 | |
| After Royalties | | | | | | | | | | | | |
Crude oil and NGL production net (Mb/d) | | | | | | | | | | | | |
| North American Natural Gas | | 9.9 | | | 9.5 | | | 9.9 | | | 9.5 | |
| Oil Sands | | 59.9 | | | 45.3 | | | 54.7 | | | 51.2 | |
| International & Offshore | | | | | | | | | | | | |
| East Coast Canada | | 69.4 | | | 72.8 | | | 68.6 | | | 84.4 | |
| International | | | | | | | | | | | | |
| North Sea | | 81.2 | | | 88.4 | | | 88.4 | | | 81.3 | |
| Other International | | 30.6 | | | 45.2 | | | 31.0 | | | 43.4 | |
| | | 251.0 | | | 261.2 | | | 252.6 | | | 269.8 | |
Natural gas production net, excluding injectants (MMcf/d) | | | | | | | | | | | | |
| North American Natural Gas | | 479 | | | 462 | | | 466 | | | 471 | |
| International | | | | | | | | | | | | |
| North Sea | | 54 | | | 59 | | | 56 | | | 58 | |
| Other International | | 54 | | | 56 | | | 63 | | | 65 | |
| | | 587 | | | 577 | | | 585 | | | 594 | |
Total production (Mboe/d) net after royalties 1 | | 349 | | | 357 | | | 350 | | | 369 | |
| | | | | | | | | | | | | |
| 1 | Natural gas converted at six Mcf of natural gas to one bbl of oil. |
Management's Discussion and Analysis
PETRO-CANADA
AVERAGE UPSTREAM PRICE REALIZED
December 31, 2008
| | Three months ended December 31, | | Year ended December 31, | |
| | 2008 | | 2007 | | 2008 | | 2007 | |
Crude oil and NGL ($/bbl) | | | | | | | | |
| North American Natural Gas | | 57.01 | | | 77.54 | | | 90.37 | | | 67.37 | |
| Oil Sands | | 52.21 | | | 70.48 | | | 87.10 | | | 61.02 | |
| International & Offshore | | | | | | | | | | | | |
| East Coast Canada | | 57.19 | | | 86.45 | | | 99.13 | | | 75.87 | |
| International | | | | | | | | | | | | |
North Sea | | 63.47 | | | 83.71 | | | 97.76 | | | 75.12 | |
| Other International | | 64.12 | | | 88.53 | | | 101.97 | | | 77.26 | |
| Total crude oil and NGL | | 58.25 | | | 82.71 | | | 95.63 | | | 72.66 | |
Natural gas ($/Mcf) | | | | | | | | | | | | |
| North American Natural Gas | | 6.61 | | | 5.78 | | | 8.05 | | | 6.30 | |
| International | | | | | | | | | | | | |
| North Sea | | 14.83 | | | 8.63 | | | 12.15 | | | 7.94 | |
| Other International | | 11.95 | | | 3.65 | | | 7.15 | | | 4.34 | |
| Total natural gas | | 7.53 | | | 5.88 | | | 8.34 | | | 6.32 | |
EFFECTIVE ROYALTY RATES
December 31, 2008
| | | Three months ended December 31, | | | Year ended December 31, | |
| (% of sales revenues) | | 2008 | | | 2007 | | | 2008 | | | 2007 | |
| North American Natural Gas | | | 19 | % | | | 22 | % | | | 21 | % | | | 22 | % |
Oil Sands 1 | | | 5 | % | | | 12 | % | | | 9 | % | | | 10 | % |
| International & Offshore | | | | | | | | | | | | | | | | |
| East Coast Canada | | | 22 | % | | | 17 | % | | | 24 | % | | | 15 | % |
| International | | | | | | | | | | | | | | | | |
| North Sea | | | – | | | | – | | | | – | | | | – | |
Other International 2 | | | 30 | % | | | 11 | % | | | 30 | % | | | 9 | % |
| Total | | | 15 | % | | | 13 | % | | | 16 | % | | | 12 | % |
| 1 | Decreased royalty rates in the fourth quarter of 2008 reflect lower than anticipated crude oil prices. |
| 2 | Increased royalty rates reflect a portion of the NOC’s take under the new Libya EPSAs and should be read in conjunction with the Libya EPSAs Fact Sheet, referenced in the December 10, 2007 press release announcing the signing of the binding heads of agreement with the NOC. |
Management's Discussion and Analysis
PETRO-CANADA
SELECT DOWNSTREAM OPERATING DATA
December 31, 2008
| | Three months ended December 31, | | Year ended December 31, | |
| | 2008 | | 2007 | | 2008 | | 2007 | |
Petroleum product sales (thousands of cubic metres/day – m3/d) | | | | | | | | |
| Gasoline | | | | | | | | |
| Eastern Canada | | 13.8 | | | 13.7 | | | 13.4 | | | 13.8 | |
| Western Canada | | 9.8 | | | 9.9 | | | 10.0 | | | 10.3 | |
| | | 23.6 | | | 23.6 | | | 23.4 | | | 24.1 | |
| Distillate | | | | | | | | | | | | |
| Eastern Canada | | 10.1 | | | 9.4 | | | 8.9 | | | 8.8 | |
| Western Canada | | 9.6 | | | 11.4 | | | 10.0 | | | 11.1 | |
| | | 19.7 | | | 20.8 | | | 18.9 | | | 19.9 | |
| Other, including petrochemicals | | 9.5 | | | 10.1 | | | 10.1 | | | 9.3 | |
| Total petroleum product sales | | 52.8 | | | 54.5 | | | 52.4 | | | 53.3 | |
Crude oil processed by Petro-Canada (thousands of m3/d) | | | | | | | | | | | | |
| Eastern Canada | | 20.0 | | | 19.4 | | | 19.7 | | | 19.7 | |
| Western Canada | | 13.9 | | | 20.7 | | | 16.3 | | | 20.4 | |
| Total crude oil processed by Petro-Canada | | 33.9 | | | 40.1 | | | 36.0 | | | 40.1 | |
Average refinery utilization (%) | | 84 | | | 99 | | | 89 | | | 99 | |
Downstream net earnings (loss) after-tax (cents/litre) | | (9.4 | ) | | 1.6 | | | – | | | 3.2 | |
AVERAGE DOWNSTREAM PRICES
December 31, 2008
| | Three months ended December 31, | | Year ended December 31, | |
| | 2008 | | 2007 | | 2008 | | | 2007 | |
Rack prices (Canadian cents/litre) | | | | | | | | | |
| Gasoline | | | | | | | | | |
| Eastern Canada | | 50.53 | | | 65.43 | | | 74.99 | | | | 63.68 | |
| Western Canada | | 52.64 | | | 63.50 | | | 76.31 | | | | 65.10 | |
| Distillate | | | | | | | | | | | | | |
| Eastern Canada | | 68.40 | | | 58.95 | | | 88.03 | | | | 64.84 | |
| Western Canada | | 72.61 | | | 75.05 | | | 88.63 | | | | 68.76 | |
Pump prices (Canadian cents/litre, excluding taxes) | | | | | | | | | | | | | |
| Gasoline | | | | | | | | | | | | | |
| Eastern Canada | | 58.26 | | | 70.82 | | | 80.94 | | | | 68.62 | |
| Western Canada | | 64.30 | | | 72.93 | | | 86.79 | | | | 75.25 | |
Management's Discussion and Analysis
PETRO-CANADA
December 31, 2008
| | Three months ended December 31, | | Year ended December 31, | |
| | 2008 | | 2007 | | 2008 | | 2007 | |
Weighted-average common shares outstanding (millions) | | 484.4 | | | 484.6 | | | 484.1 | | | 489.0 | |
Weighted-average diluted common shares outstanding (millions) | | 484.4 | | | 489.2 | | | 487.7 | | | 494.0 | |
Net earnings (loss) – basic ($/share) | | (1.43 | ) | | 1.08 | | | 6.47 | | | 5.59 | |
– diluted ($/share) | | (1.43 | ) | | 1.07 | | | 6.43 | | | 5.53 | |
Cash flow from (used in) operating activities ($/share) | | 2.74 | | | (1.24 | ) | | 13.47 | | | 6.83 | |
Dividends ($/share) | | 0.20 | | | 0.13 | | | 0.66 | | | 0.52 | |
| Toronto Stock Exchange: | | | | | | | | | | | | |
Share price 1 – High | | 35.23 | | | 56.60 | | | 60.00 | | | 61.25 | |
– Low | | 20.83 | | | 48.30 | | | 20.83 | | | 41.02 | |
– Close at December 31 | | 26.72 | | | 53.25 | | | 26.72 | | | 53.25 | |
Shares traded (millions) | | 179.6 | | | 133.0 | | | 648.8 | | | 532.3 | |
| New York Stock Exchange: | | | | | | | | | | | | |
Share price 2 – High | | 33.18 | | | 59.87 | | | 61.03 | | | 59.87 | |
– Low | | 16.43 | | | 48.03 | | | 16.43 | | | 34.91 | |
– Close at December 31 | | 21.89 | | | 53.62 | | | 21.89 | | | 53.62 | |
Shares traded (millions) | | 201.1 | | | 64.4 | | | 511.4 | | | 194.0 | |
| 1 | Share prices are in Canadian dollars and represent the closing price. |
| 2 | Share prices are in U.S. dollars and represent the closing price. |
SELECT FINANCIAL DATA
December 31, 2008
(unaudited, millions of Canadian dollars)
| | | Three months ended December 31, | | | Year ended December 31, | |
| | | 2008 | | | 2007 | | | 2008 | | | 2007 | |
| | | | | | | | | | | | | |
| Net earnings (loss) | | | | | | | | | | | | |
| Upstream | | | | | | | | | | | | |
| North American Natural Gas | | $ | 5 | | | $ | (57 | ) | | $ | 344 | | | $ | 191 | |
| Oil Sands | | | (164 | ) | | | 129 | | | | 334 | | | | 316 | |
| International & Offshore | | | | | | | | | | | | | | | | |
| East Coast Canada | | | 211 | | | | 346 | | | | 1,368 | | | | 1,229 | |
| International | | | 193 | | | | (30 | ) | | | 1,684 | | | | 374 | |
| Downstream | | | (457 | ) | | | 81 | | | | - | | | | 629 | |
| Shared Services and Eliminations | | | (479 | ) | | | 53 | | | | (596 | ) | | | (6 | ) |
| Net earnings (loss) | | $ | (691 | ) | | $ | 522 | | | $ | 3,134 | | | $ | 2,733 | |
| | | | | | | | | | | | | | | | | |
| Cash flow from (used in) operating activities | | $ | 1,329 | | | $ | (602 | ) | | $ | 6,522 | | | $ | 3,339 | |
| | | | | | | | | | | | | | | | | |
Average capital employed 1 | | | | | | | | | | | | | | | | |
| Upstream | | | | | | | | | | $ | 10,594 | | | $ | 8,943 | |
| Downstream | | | | | | | | | | | 6,694 | | | | 5,136 | |
| Shared Services and Eliminations | | | | | | | | | | | 484 | | | | 249 | |
| Total Company | | | | | | | | | | $ | 17,772 | | | $ | 14,328 | |
| | | | | | | | | | | | | | | | | |
Return on capital employed (%) 1 | | | | | | | | | | | | | | | | |
| Upstream | | | | | | | | | | | 35.2 | | | | 23.6 | |
| Downstream | | | | | | | | | | | 0.0 | | | | 12.2 | |
| Total Company | | | | | | | | | | | 18.6 | | | | 19.8 | |
| | | | | | | | | | | | | | | | | |
Return on equity (%) 1 | | | | | | | | | | | 22.9 | | | | 24.5 | |
| | | | | | | | | | | | | | | | | |
| Debt | | | | | | | | | | $ | 4,749 | | | $ | 3,450 | |
| Cash and cash equivalents | | | | | | | | | | $ | 1,445 | | | $ | 231 | |
Debt-to-cash flow from operating activities (times) 1 | | | | | | | | | | | 0.7 | | | | 1.0 | |
Debt-to-debt plus equity (%) | | | | | | | | | | | 23.5 | | | | 22.5 | |
| | | | | | | | | | | | | | | | | |
| 1 | Calculated on a 12-month rolling basis. |
CONSOLIDATED STATEMENT OF EARNINGS (unaudited)
For the periods ended December 31
(millions of Canadian dollars, except per share amounts)
| | | Three months ended December 31, | | | Year ended December 31, | |
| | | 2008 | | | 2007 | | | 2008 | | | 2007 | |
| | | | | | | | | | | | | |
| Revenue | | | | | | | | | | | | |
| Operating | | $ | 5,134 | | | $ | 5,765 | | | $ | 27,585 | | | $ | 21,710 | |
Investment and other income (expense) (Notes 5 and 7) | | | 133 | | | | (331 | ) | | | 200 | | | | (460 | ) |
| | | | 5,267 | | | | 5,434 | | | | 27,785 | | | | 21,250 | |
| | | | | | | | | | | | | | | | | |
| Expenses | | | | | | | | | | | | | | | | |
| Crude oil and product purchases | | | 3,251 | | | | 2,899 | | | | 14,507 | | | | 10,291 | |
Operating, marketing and general (Note 6) | | | 1,201 | | | | 820 | | | | 3,877 | | | | 3,552 | |
| Exploration | | | 116 | | | | 183 | | | | 587 | | | | 490 | |
Depreciation, depletion and amortization (Notes 6 and 8) | | | 647 | | | | 636 | | | | 2,155 | | | | 2,091 | |
| Unrealized (gain) loss on translation of foreign currency denominated long-term debt | | | 475 | | | | (12 | ) | | | 664 | | | | (246 | ) |
| Interest | | | 86 | | | | 43 | | | | 242 | | | | 165 | |
| | | | 5,776 | | | | 4,569 | | | | 22,032 | | | | 16,343 | |
| | | | | | | | | | | | | | | | | |
| Earnings (loss) before income taxes | | | (509 | ) | | | 865 | | | | 5,753 | | | | 4,907 | |
| | | | | | | | | | | | | | | | | |
| Provision for income taxes | | | | | | | | | | | | | | | | |
| Current | | | 164 | | | | 93 | | | | 2,629 | | | | 1,797 | |
| | | 18 | | | | 250 | | | | (10 | ) | | | 377 | |
| | | | 182 | | | | 343 | | | | 2,619 | | | | 2,174 | |
| | | | | | | | | | | | | | | | | |
| Net earnings (loss) | | $ | (691 | ) | | $ | 522 | | | $ | 3,134 | | | $ | 2,733 | |
| | | | | | | | | | | | | | | | | |
Earnings per share (Note 9) | | | | | | | | | | | | | | | | |
| Basic | | $ | (1.43 | ) | | $ | 1.08 | | | $ | 6.47 | | | $ | 5.59 | |
| Diluted | | $ | (1.43 | ) | | $ | 1.07 | | | $ | 6.43 | | | $ | 5.53 | |
CONSOLIDATED STATEMENT OF COMPREHENSIVE INCOME (unaudited)
For the periods ended December 31
(millions of Canadian dollars)
| | | Three months ended December 31, | | | Year ended December 31, | |
| | | 2008 | | | 2007 | | | 2008 | | | 2007 | |
| | | | | | | | | | | | | |
| Net earnings (loss) | | $ | (691 | ) | | $ | 522 | | | $ | 3,134 | | | $ | 2,733 | |
| Other comprehensive income (loss), net of tax | | | | | | | | | | | | | | | | |
| Change in foreign currency translation adjustment | | | 252 | | | | (4 | ) | | | 214 | | | | (260 | ) |
| Comprehensive income (loss) | | $ | (439 | ) | | $ | 518 | | | $ | 3,348 | | | $ | 2,473 | |
| | See accompanying Notes to Consolidated Financial Statements |
CONSOLIDATED STATEMENT OF CASH FLOWS (unaudited) |
For the periods ended December 31
(millions of Canadian dollars)
| | | Three months ended December 31, | | | Year ended December 31, | |
| | | 2008 | | | 2007 | | | 2008 | | | 2007 | |
| | | | | | | | | | | | | |
| Operating activities | | | | | | | | | | | | |
| Net earnings | | $ | (691 | ) | | $ | 522 | | | $ | 3,134 | | | $ | 2,733 | |
| Items not affecting cash flow from operating activities: | | | | | | | | | | | | | | | | |
Depreciation, depletion and amortization (Notes 6 and 8) | | | 647 | | | | 636 | | | | 2,155 | | | | 2,091 | |
Future income taxes (Note 10) | | | 18 | | | | 250 | | | | (10 | ) | | | 377 | |
| Accretion of asset retirement obligations | | | 22 | | | | 20 | | | | 79 | | | | 70 | |
| Unrealized (gain) loss on translation of foreign currency denominated long-term debt | | | 475 | | | | (12 | ) | | | 664 | | | | (246 | ) |
Gain on sale of assets (Notes 5 and 7) | | | (13 | ) | | | (3 | ) | | | (4 | ) | | | (81 | ) |
| Other | | | 22 | | | | (1 | ) | | | 91 | | | | 9 | |
| Exploration expenses | | | 51 | | | | 107 | | | | 369 | | | | 290 | |
Settlement of Buzzard derivative contracts (Note 17) | | | - | | | | (1,502 | ) | | | - | | | | (1,481 | ) |
| (Increase) decrease in non-cash working capital related to operating activities | | | 798 | | | | (619 | ) | | | 44 | | | | (423 | ) |
| Cash flow from (used in) operating activities | | | 1,329 | | | | (602 | ) | | | 6,522 | | | | 3,339 | |
| | | | | | | | | | | | | | | | | |
| Investing activities | | | | | | | | | | | | | | | | |
Expenditures on property, plant and equipment and exploration (Note 10) | | | (1,748 | ) | | | (1,585 | ) | | | (6,344 | ) | | | (3,988 | ) |
Proceeds from sale of assets (Note 7) | | | 17 | | | | 6 | | | | 250 | | | | 183 | |
| Increase in other assets | | | (29 | ) | | | (16 | ) | | | (29 | ) | | | (121 | ) |
| Decrease in non-cash working capital related to investing activities | | | 50 | | | | 398 | | | | 739 | | | | 279 | |
| Cash flow used in investing activities | | | (1,710 | ) | | | (1,197 | ) | | | (5,384 | ) | | | (3,647 | ) |
| | | | | | | | | | | | | | | | | |
| Financing activities | | | | | | | | | | | | | | | | |
Increase (decrease) in short-term notes payable (Note 12) | | | - | | | | 109 | | | | (109 | ) | | | 109 | |
Proceeds from issue of long-term debt (Note 12) | | | - | | | | 995 | | | | 1,482 | | | | 995 | |
Repayment of long-term debt (Note 12) | | | (2 | ) | | | (1 | ) | | | (998 | ) | | | (7 | ) |
Proceeds from issue of common shares (Note 13) | | | 4 | | | | 4 | | | | 21 | | | | 37 | |
Purchase of common shares (Note 13) | | | - | | | | (104 | ) | | | - | | | | (839 | ) |
Dividends on common shares (Note 16) | | | (97 | ) | | | (63 | ) | | | (320 | ) | | | (255 | ) |
| Cash flow from (used in) financing activities | | | (95 | ) | | | 940 | | | | 76 | | | | 40 | |
| | | | | | | | | | | | | | | | | |
| Increase (decrease) in cash and cash equivalents | | | (476 | ) | | | (859 | ) | | | 1,214 | | | | (268 | ) |
| Cash and cash equivalents at beginning of period | | | 1,921 | | | | 1,090 | | | | 231 | | | | 499 | |
| Cash and cash equivalents at end of period | | $ | 1,445 | | | $ | 231 | | | $ | 1,445 | | | $ | 231 | |
| | See accompanying Notes to Consolidated Financial Statements |
CONSOLIDATED BALANCE SHEET (unaudited)
As at December 31, 2008
(millions of Canadian dollars)
| | December 31, 2008 | | | December 31, 2007 | |
| Assets | | | | | |
| Current assets | | | | | |
| Cash and cash equivalents | $ | 1,445 | | | $ | 231 | |
Accounts receivable (Note 11) | | 2,844 | | | | 1,973 | |
| Income taxes receivable | | - | | | | 280 | |
| | 1,289 | | | | 668 | |
| Future income taxes | | 25 | | | | 26 | |
| | | 5,603 | | | | 3,178 | |
| | | | | | | | |
Property, plant and equipment, net (Notes 7 and 10) | | 23,485 | | | | 19,497 | |
| Goodwill | | 852 | | | | 731 | |
| Other assets | | 437 | | | | 446 | |
| | $ | 30,377 | | | $ | 23,852 | |
| | | | | | | | |
| Liabilities and shareholders' equity | | | | | | | |
| Current liabilities | | | | | | | |
| Accounts payable and accrued liabilities | $ | 3,186 | | | $ | 3,512 | |
| Income taxes payable | | 1,018 | | | | - | |
Short-term notes payable (Note 12) | | - | | | | 109 | |
Current portion of long-term debt (Note 12) | | 3 | | | | 2 | |
| | | 4,207 | | | | 3,623 | |
| | | | | | | | |
| | 4,746 | | | | 3,339 | |
Other liabilities (Note 10) | | 1,240 | | | | 717 | |
| Asset retirement obligations | | 1,527 | | | | 1,234 | |
Future income taxes (Notes 4 and 10) | | 3,182 | | | | 3,069 | |
| | | | | | | | |
| Shareholders' equity | | | | | | | |
| | 1,388 | | | | 1,365 | |
Contributed surplus (Note 13) | | 22 | | | | 24 | |
| Retained earnings | | 14,062 | | | | 10,692 | |
| Accumulated other comprehensive income (loss) | | | | | | | |
| Foreign currency translation adjustment | | 3 | | | | (211 | ) |
| | | 15,475 | | | | 11,870 | |
| | $ | 30,377 | | | $ | 23,852 | |
CONSOLIDATED STATEMENT OF RETAINED EARNINGS (unaudited)
For the periods ended December 31
(millions of Canadian dollars)
| | | Three months ended December 31, | | | Year ended December 31, | |
| | | 2008 | | | 2007 | | | 2008 | | | 2007 | |
| | | | | | | | | | | | | |
| Retained earnings at beginning of period | | $ | 14,850 | | | $ | 10,330 | | | $ | 10,692 | | | $ | 8,565 | |
Cumulative effect of adopting new accounting standards (Note 4) | | | - | | | | - | | | | 556 | | | | - | |
| Net earnings (loss) | | | (691 | ) | | | 522 | | | | 3,134 | | | | 2,733 | |
Dividends on common shares (Note 16) | | | (97 | ) | | | (63 | ) | | | (320 | ) | | | (255 | ) |
Excess cost for normal course issuer bid (Note 13) | | | - | | | | (97 | ) | | | - | | | | (351 | ) |
| Retained earnings at end of period | | $ | 14,062 | | | $ | 10,692 | | | $ | 14,062 | | | $ | 10,692 | |
| | See accompanying Notes to Consolidated Financial Statements |
NOTES TO CONSOLIDATED FINANCIAL STATEMENTS (unaudited)
(millions of Canadian dollars)
1. SEGMENTED INFORMATION
Three months ended December 31,
| | | Upstream | | | | | | | | | | | | | | | | | |
| | | | | | | | | | | International & Offshore | | | | | | | | | | | | | | | | | |
| | | North American Natural Gas | | Oil Sands | | East Coast Canada | | International | | Downstream | | Shared Services | | Eliminations4 | | Consolidated | |
| | | 2008 | | 2007 | | 2008 | | 2007 | | 2008 | | 2007 | | 2008 | | 2007 | | 2008 | | 2007 | | 2008 | | 2007 | | 2008 | | 2007 | | 2008 | | 2007 | |
| | | | | | | | | | | | | | | | | | | | | | | | | | | | | | | | | | |
| Revenue | | | | | | | | | | | | | | | | | | | | | | | | | | | | | | | | | |
| Sales to customers | $ | 412 | | $ | 331 | | $ | 233 | | $ | 153 | | $ | 422 | | $ | 656 | | $ | 851 | | $ | 1,043 | | $ | 3,216 | | $ | 3,582 | | $ | - | | $ | - | | $ | - | | $ | - | | $ | 5,134 | | $ | 5,765 | |
Investment and other income (expense)1 | | 8 | | | - | | | 11 | | | 1 | | | 13 | | | (7 | ) | | 31 | | | (386 | ) | | 20 | | | (5 | ) | | 50 | | | 66 | | | - | | | - | | | 133 | | | (331 | ) |
| Inter-segment sales | | 75 | | | 86 | | | 387 | | | 306 | | | 175 | | | 125 | | | 12 | | | - | | | 3 | | | 6 | | | - | | | - | | | (652 | ) | | (523 | ) | | - | | | - | |
| Segmented revenue | | 495 | | | 417 | | | 631 | | | 460 | | | 610 | | | 774 | | | 894 | | | 657 | | | 3,239 | | | 3,583 | | | 50 | | | 66 | | | (652 | ) | | (523 | ) | | 5,267 | | | 5,434 | |
| Expenses | | | | | | | | | | | | | | | | | | | | | | | | | | | | | | | | | | | | | | | | | | | | | | | | |
Crude oil and product purchases2 | | 104 | | | 75 | | | 393 | | | 158 | | | 121 | | | 191 | | | - | | | - | | | 2,688 | | | 2,479 | | | - | | | - | | | (55 | ) | | (4 | ) | | 3,251 | | | 2,899 | |
| Inter-segment transactions | | 2 | | | 4 | | | 13 | | | 2 | | | 1 | | | 2 | | | - | | | - | | | 638 | | | 515 | | | - | | | - | | | (654 | ) | | (523 | ) | | - | | | - | |
| Operating, marketing and general | | 151 | | | 123 | | | 336 | | | 159 | | | 74 | | | 42 | | | 119 | | | 105 | | | 504 | | | 425 | | | 17 | | | (34 | ) | | - | | | - | | | 1,201 | | | 820 | |
| Exploration | | 56 | | | 70 | | | 5 | | | 3 | | | 1 | | | (1 | ) | | 54 | | | 111 | | | - | | | - | | | - | | | - | | | - | | | - | | | 116 | | | 183 | |
| Depreciation, depletion and amortization | | 179 | | | 259 | | | 117 | | | 37 | | | 105 | | | 91 | | | 154 | | | 162 | | | 92 | | | 86 | | | - | | | 1 | | | - | | | - | | | 647 | | | 636 | |
| Unrealized loss (gain) on translation of foreign currency denominated long-term debt | | - | | | - | | | - | | | - | | | - | | | - | | | - | | | - | | | - | | | - | | | 475 | | | (12 | ) | | - | | | - | | | 475 | | | (12 | ) |
| Interest | | - | | | - | | | - | | | - | | | - | | | - | | | - | | | - | | | - | | | - | | | 86 | | | 43 | | | - | | | - | | | 86 | | | 43 | |
| | | 492 | | | 531 | | | 864 | | | 359 | | | 302 | | | 325 | | | 327 | | | 378 | | | 3,922 | | | 3,505 | | | 578 | | | (2 | ) | | (709 | ) | | (527 | ) | | 5,776 | | | 4,569 | |
| Earnings (loss) before income taxes | | 3 | | | (114 | ) | | (233 | ) | | 101 | | | 308 | | | 449 | | | 567 | | | 279 | | | (683 | ) | | 78 | | | (528 | ) | | 68 | | | 57 | | | 4 | | | (509 | ) | | 865 | |
| Provision for income taxes | | | | | | | | | | | | | | | | | | | | | | | | | | | | | | | | | | | | | | | | | | | | | | | | |
| Current | | 25 | | | 26 | | | (22 | ) | | (8 | ) | | 100 | | | 165 | | | 358 | | | (157 | ) | | (308 | ) | | 75 | | | 11 | | | (8 | ) | | - | | | - | | | 164 | | | 93 | |
| Future | | (27 | ) | | (83 | ) | | (47 | ) | | (20 | ) | | (3 | ) | | (62 | ) | | 16 | | | 466 | | | 82 | | | (78 | ) | | (21 | ) | | 26 | | | 18 | | | 1 | | | 18 | | | 250 | |
| | | (2 | ) | | (57 | ) | | (69 | ) | | (28 | ) | | 97 | | | 103 | | | 374 | | | 309 | | | (226 | ) | | (3 | ) | | (10 | ) | | 18 | | | 18 | | | 1 | | | 182 | | | 343 | |
| Net earnings (loss) | $ | 5 | | $ | (57 | ) | $ | (164 | ) | $ | 129 | | $ | 211 | | $ | 346 | | $ | 193 | | $ | (30 | ) | $ | (457 | ) | $ | 81 | | $ | (518 | ) | $ | 50 | | $ | 39 | | $ | 3 | | $ | (691 | ) | $ | 522 | |
Expenditures on property, plant and equipment and exploration 3 | $ | 566 | | $ | 369 | | $ | 374 | | $ | 482 | | $ | 82 | | $ | 33 | | $ | 312 | | $ | 224 | | $ | 401 | | $ | 468 | | $ | 13 | | $ | 9 | | $ | - | | $ | - | | $ | 1,748 | | $ | 1,585 | |
| Cash flow from (used in) operating activities | $ | 208 | | $ | 164 | | $ | 217 | | $ | 107 | | $ | 347 | | $ | 261 | | $ | 300 | | $ | (868 | ) | $ | 528 | | $ | 245 | | $ | (271 | ) | $ | (511 | ) | $ | - | | $ | - | | $ | 1,329 | | $ | (602 | ) |
| Total assets | $ | 4,605 | | $ | 4,119 | | $ | 4,566 | | $ | 3,659 | | $ | 2,149 | | $ | 2,345 | | $ | 8,277 | | $ | 5,180 | | $ | 10,057 | | $ | 7,989 | | $ | 734 | | $ | 563 | | $ | (11 | ) | $ | (3 | ) | $ | 30,377 | | $ | 23,852 | |
| 1 | Investment and other income (expense) for the International segment includes losses on the Buzzard derivative contracts of $nil for the three months ended December 31, 2008 ($383 million for the three months ended December 31, 2007) (Notes 5 and 17). |
| 2 | Downstream crude oil and product purchases account for substantially all of the Downstream inventories recognized as an expense during the period. |
| 3 | Consolidated expenditures include capitalized interest in the amount of $14 million for the three months ended December 31, 2008 ($9 million for the three months ended December 31, 2007). |
| 4 | Eliminations relates to sales between segments recorded at transfer prices based on current market prices, and to unrealized inter-segment profits and losses on inventories. These figures were previously included in Shared Services. |
NOTES TO CONSOLIDATED FINANCIAL STATEMENTS (unaudited)
(millions of Canadian dollars)
1. SEGMENTED INFORMATION
Year ended December 31,
| | | Upstream | | | | | | | | | | | | | | | | | |
| | | | | | | | | | | | International & Offshore | | | | | | | | | | | | | | | | | |
| | | North American Natural Gas | | Oil Sands | | | East Coast Canada | | International | | Downstream | | Shared Services | | Eliminations4 | | Consolidated | |
| | | 2008 | | 2007 | | 2008 | | 2007 | | | 2008 | | 2007 | | 2008 | | 2007 | | 2008 | | 2007 | | 2008 | | 2007 | | 2008 | | 2007 | | 2008 | | 2007 | |
| | | | | | | | | | | | | | | | | | | | | | | | | | | | | | | | | | | |
| Revenue | | | | | | | | | | | | | | | | | | | | | | | | | | | | | | | | | |
| Sales to customers | $ | 1,931 | | $ | 1,347 | | $ | 1,915 | | $ | 611 | | | $ | 2,605 | | $ | 2,708 | | $ | 4,892 | | $ | 3,697 | | $ | 16,242 | | $ | 13,347 | | $ | - | | $ | - | | $ | - | | $ | - | | $ | 27,585 | | $ | 21,710 | |
Investment and other (income) expense1 | | (121 | ) | | 66 | | | 10 | | | (2 | ) | | | 20 | | | (18 | ) | | 164 | | | (549 | ) | | 38 | | | (12 | ) | | 89 | | | 55 | | | - | | | - | | | 200 | | | (460 | ) |
| Inter-segment sales | | 421 | | | 324 | | | 1,510 | | | 1,065 | | | | 789 | | | 477 | | | 12 | | | - | | | 15 | | | 18 | | | - | | | - | | | (2,747 | ) | | (1,884 | ) | | - | | | - | |
| Segmented revenue | | 2,231 | | | 1,737 | | | 3,435 | | | 1,674 | | | | 3,414 | | | 3,167 | | | 5,068 | | | 3,148 | | | 16,295 | | | 13,353 | | | 89 | | | 55 | | | (2,747 | ) | | (1,884 | ) | | 27,785 | | | 21,250 | |
| Expenses | | | | | | | | | | | | | | | | | | | | | | | | | | | | | | | | | | | | | | | | | | | | | | | | | |
Crude oil and product purchases2 | | 461 | | | 240 | | | 1,796 | | | 524 | | | | 770 | | | 736 | | | - | | | - | | | 11,580 | | | 8,787 | | | - | | | - | | | (100 | ) | | 4 | | | 14,507 | | | 10,291 | |
| Inter-segment transactions | | 7 | | | 10 | | | 40 | | | 13 | | | | 8 | | | 8 | | | - | | | - | | | 2,692 | | | 1,853 | | | - | | | - | | | (2,747 | ) | | (1,884 | ) | | - | | | - | |
| Operating, marketing and general | | 545 | | | 491 | | | 913 | | | 595 | | | | 254 | | | 228 | | | 460 | | | 526 | | | 1,761 | | | 1,525 | | | (56 | ) | | 187 | | | - | | | - | | | 3,877 | | | 3,552 | |
| Exploration | | 147 | | | 192 | | | 13 | | | 28 | | | | 1 | | | 13 | | | 426 | | | 257 | | | - | | | - | | | - | | | - | | | - | | | - | | | 587 | | | 490 | |
| Depreciation, depletion and amortization | | 575 | | | 584 | | | 202 | | | 149 | | | | 389 | | | 410 | | | 663 | | | 640 | | | 325 | | | 299 | | | 1 | | | 9 | | | - | | | - | | | 2,155 | | | 2,091 | |
| Unrealized loss (gain) on translation of foreign currency denominated long-term debt | | - | | | - | | | - | | | - | | | | - | | | - | | | - | | | - | | | - | | | - | | | 664 | | | (246 | ) | | - | | | - | | | 664 | | | (246 | ) |
| Interest | | - | | | - | | | - | | | - | | | | - | | | - | | | - | | | - | | | - | | | - | | | 242 | | | 165 | | | - | | | - | | | 242 | | | 165 | |
| | | | 1,735 | | | 1,517 | | | 2,964 | | | 1,309 | | | | 1,422 | | | 1,395 | | | 1,549 | | | 1,423 | | | 16,358 | | | 12,464 | | | 851 | | | 115 | | | (2,847 | ) | | (1,880 | ) | | 22,032 | | | 16,343 | |
| Earnings (loss) before income taxes | | 496 | | | 220 | | | 471 | | | 365 | | | | 1,992 | | | 1,772 | | | 3,519 | | | 1,725 | | | (63 | ) | | 889 | | | (762 | ) | | (60 | ) | | 100 | | | (4 | ) | | 5,753 | | | 4,907 | |
| Provision for income taxes | | | | | | | | | | | | | | | | | | | | | | | | | | | | | | | | | | | | | | | | | | | | | | | | | |
| Current | | 118 | | | 183 | | | 97 | | | (13 | ) | | | 647 | | | 653 | | | 2,163 | | | 848 | | | (294 | ) | | 232 | | | (102 | ) | | (106 | ) | | - | | | - | | | 2,629 | | | 1,797 | |
| Future | | 34 | | | (154 | ) | | 40 | | | 62 | | | | (23 | ) | | (110 | ) | | (328 | ) | | 503 | | | 231 | | | 28 | | | 41 | | | 49 | | | (5 | ) | | (1 | ) | | (10 | ) | | 377 | |
| | | | 152 | | | 29 | | | 137 | | | 49 | | | | 624 | | | 543 | | | 1,835 | | | 1,351 | | | (63 | ) | | 260 | | | (61 | ) | | (57 | ) | | (5 | ) | | (1 | ) | | 2,619 | | | 2,174 | |
| Net earnings (loss) | $ | 344 | | $ | 191 | | $ | 334 | | $ | 316 | | | $ | 1,368 | | $ | 1,229 | | $ | 1,684 | | $ | 374 | | $ | - | | $ | 629 | | $ | (701 | ) | $ | (3 | ) | $ | 105 | | $ | (3 | ) ) | $ | 3,134 | | $ | 2,733 | |
Expenditures on property, plant and equipment and exploration 3 | $ | 1,023 | | $ | 866 | | $ | 1,063 | | $ | 779 | | | $ | 276 | | $ | 159 | | $ | 2,115 | | $ | 762 | | $ | 1,834 | | $ | 1,396 | | $ | 33 | | $ | 26 | | $ | - | | $ | - | | $ | 6,344 | | $ | 3,988 | |
| Cash flow from (used in) operating activities | $ | 1,055 | | $ | 725 | | $ | 622 | | $ | 512 | | | $ | 1,850 | | $ | 1,491 | | $ | 2,380 | | $ | 220 | | $ | 464 | | $ | 994 | | $ | 151 | | $ | (603 | ) | $ | - | | $ | - | | $ | 6,522 | | $ | 3,339 | |
| Total assets | | $ | 4,605 | | $ | 4,119 | | $ | 4,566 | | $ | 3,659 | | | $ | 2,149 | | $ | 2,345 | | $ | 8,277 | | $ | 5,180 | | $ | 10,057 | | $ | 7,989 | | $ | 734 | | $ | 563 | | $ | (11 | ) | $ | (3 | ) | $ | 30,377 | | $ | 23,852 | |
| 1 | Investment and other income (expense) for the International segment includes losses on the Buzzard derivative contracts of $nil for the year ended December 31, 2008 ($535 million for the year ended December 31, 2007) (Notes 5 and 17). |
| 2 | Downstream crude oil and product purchases account for substantially all of the Downstream inventories recognized as an expense during the period. |
| 3 | Consolidated expenditures include capitalized interest in the amount of $37 million for the year ended December 31, 2008 ($30 million for the year ended December 31, 2007). |
| 4 | Eliminations relates to sales between segments recorded at transfer prices based on current market prices, and to unrealized inter-segment profits and losses on inventories. These figures were previously included in Shared Services. |
NOTES TO CONSOLIDATED FINANCIAL STATEMENTS (unaudited)
| (millions of Canadian dollars, unless otherwise stated) |
The note disclosure requirements for annual financial statements provide additional disclosure to that required for interim financial statements. Accordingly, these interim Consolidated Financial Statements should be read in conjunction with the December 31, 2007 audited Consolidated Financial Statements. The interim Consolidated Financial Statements are presented in accordance with Canadian generally accepted accounting principles (GAAP) and follow the accounting policies summarized in the notes to the annual Consolidated Financial Statements, except for changes as described in Note 4.
| 3. | INTERNATIONAL FINANCIAL REPORTING STANDARDS |
During 2008, the Canadian Accounting Standards Board (AcSB) confirmed that publicly accountable enterprises will be required to adopt International Financial Reporting Standards (IFRS) in place of Canadian GAAP for interim and annual reporting purposes. The required changeover date is for fiscal years beginning on or after January 1, 2011. At this time, the impact on the Company’s Consolidated Financial Statements is not reasonably determinable.
| 4. | CHANGES IN ACCOUNTING POLICIES |
On January 1, 2008, the Company adopted Canadian Institute of Chartered Accountants (CICA) Handbook Section 1535, Capital Disclosures; Section 3031, Inventories; Section 3862, Financial Instruments – Disclosure; and Section 3863, Financial Instruments – Presentation.
As a result of adopting CICA Section 1535, Capital Disclosures, the Company now discloses details about its capital management strategy (Note 16).
As a result of adopting CICA Section 3031, Inventories, the Company now assigns costs to its crude oil and refined petroleum products inventories on a “first-in, first-out” (FIFO) basis. Previously, costs were assigned to these inventories on a “last-in, first-out” (LIFO) basis. In accordance with the transitional provisions of this new accounting standard, the Company has elected to adjust 2008 opening retained earnings by the difference in the measurement of 2008 opening inventory and has not restated prior period amounts. As such, the following balance sheet categories were impacted on January 1, 2008:
| | Increase | |
| Inventories | $ | 812 | |
| Future income taxes liability | | 256 | |
| Retained earnings | | 556 | |
As a result of adopting CICA Section 3862, Financial Instruments – Disclosures, the Company has expanded its financial risks and financial instruments disclosures (Note 17).
There is no other material impact on the Consolidated Financial Statements from adoption of these new standards.
| 5. | INVESTMENT AND OTHER INCOME (EXPENSE) |
Investment and other income (expense) consist of the following amounts:
| | Three months ended December 31, | | | Year ended December 31, | |
| | 2008 | | | 2007 | | | 2008 | | | 2007 | |
| Foreign exchange gains (losses) | $ | 82 | | | $ | 49 | | | $ | 128 | | | $ | (10 | ) |
Gain on sale of assets (Note 7) | | 13 | | | | 3 | | | | 4 | | | | 81 | |
Losses related to Buzzard derivative contracts (Note 17) | | - | | | | (383 | ) | | | - | | | | (535 | ) |
| Gain (loss) on Downstream derivative contracts | | 17 | | | | (7 | ) | | | 24 | | | | (26 | ) |
| Other | | 21 | | | | 7 | | | | 44 | | | | 30 | |
| Total investment and other income (expense) | $ | 133 | | | $ | (331 | ) | | $ | 200 | | | $ | (460 | ) |
NOTES TO CONSOLIDATED FINANCIAL STATEMENTS (unaudited)
| (millions of Canadian dollars, unless otherwise stated) |
In November 2008, the Company and its partners, UTS Energy Corporation (UTS) and Teck Cominco Limited (Teck), announced that the preliminary results from the Fort Hills project front-end engineering and design (FEED) work suggest that estimated costs have risen considerably and, therefore, a final investment decision on both the mining and upgrading portions of the project will be deferred until a cost estimate consistent with the current market environment can be established. As a result, the Company has recognized an $87 million ($64 million after-tax) impairment charge on certain property, plant and equipment and expenses of $129 million ($92 million after-tax) to reflect the termination or suspension of some agreements for the receipt of goods and services.
The impairment charge is included in depreciation, depletion and amortization, and the service agreement termination expenses are included in operating, marketing and general expenses, both in the Consolidated Statement of Earnings.
In August 2008, the Company completed the sale of its pre-development assets in Denmark, which are part of the Company’s International business segment, for net proceeds of $140 million, resulting in a gain on sale of $107 million ($82 million after-tax).
In June 2008, the Company completed the sale of its Minehead assets in Western Canada, which are part of the Company’s North American Natural Gas business segment, resulting in a loss on sale of $153 million ($112 million after-tax).
The gains and losses on the sales of these assets are included in investment and other income (expense) in the Consolidated Statement of Earnings.
In December 2007, the Company recognized a $150 million ($97 million after-tax) impairment expense due to a write-down of its coal bed methane assets in the U.S. Rockies’ Powder River Basin. The assets have been written down to management’s best estimate of fair value based on a discounted future cash flow valuation. These assets form part of the Company’s North American Natural Gas business segment.
The impairment expense is included in depreciation, depletion and amortization in the Consolidated Statement of Earnings.
The following table provides the number of common shares used in calculating earnings per share amounts:
| | Three months ended December 31, | | Year ended December 31, | |
| (millions) | 2008 | | 2007 | | 2008 | | 2007 | |
| Weighted-average number of common shares outstanding – basic | | 484.4 | | | 484.6 | | | 484.1 | | | 489.0 | |
| Effect of dilutive stock options | | 0.0 | 1 | | 4.6 | | | 3.6 | | | 5.0 | |
| Weighted-average number of common shares outstanding – diluted | | 484.4 | | | 489.2 | | | 487.7 | | | 494.0 | |
| 1 | 1.6 million stock options were excluded from the diluted earnings per share calculation for the three months ended December 31, 2008 because their impact was anti-dilutive. |
NOTES TO CONSOLIDATED FINANCIAL STATEMENTS (unaudited)
| (millions of Canadian dollars, unless otherwise stated) |
| 10. | LIBYA EXPLORATION AND PRODUCTION SHARING AGREEMENTS |
On June 19, 2008 the Company signed six new Exploration and Production Sharing Agreements (EPSAs) with the Libya National Oil Corporation (NOC) to convert its existing concession agreements and old EPSA into new EPSA IV agreements. The new EPSAs were ratified as of the signing, with an effective date of January 1, 2008. Earnings on properties covered by the old agreements were adjusted based on the financial terms of the new EPSAs for the period from January 1, 2008 until ratification. The new EPSAs have an expected duration of 30 years and enable the Company to implement jointly with the NOC the redevelopment of major fields and conduct a 100% operated exploration program in the Libyan Sirte Basin.
As part of the ratification, the Company agreed to pay a signature bonus of $1 billion US in several installments with the first installment of $500 million US paid on July 17, 2008 and the remaining installments to be paid through 2013. This cost was discounted to $954 million based on this payout schedule using the Company’s estimated cost of debt at the time of acquisition. At December 31, 2008, $554 million of the discounted signature bonus cost was outstanding, with $30 million recorded in accounts payable and accrued liabilities and $524 million recorded in other liabilities.
Net earnings for the year ended December 31, 2008 includes a $230 million future income tax recovery, which the company recognized on ratification of the new EPSAs on June 19, 2008.
| 11. | SECURITIZATION PROGRAM |
On June 24, 2004, the Company entered into a securitization program, expiring on June 24, 2009, to sell an undivided interest of eligible accounts receivable up to $500 million to a third party on a revolving and fully serviced basis. The service liability has been estimated to be insignificant.
During the year ended December 31, 2008, the Company suspended all sales of receivables to the program and remitted all funds for receivables previously sold. As at December 31, 2008, there were no outstanding receivables sold under this program. As at December 31, 2007, $480 million of outstanding accounts receivable had been sold under the program for net proceeds of $479 million.
| | | Maturity | | | December 31, 2008 | | | December 31, 2007 | |
| Debentures and notes | | | | | | | | | |
| 6.80% unsecured senior notes ($900 million US) | | 2038 | | | $ | 1,090 | | | $ | - | |
| 5.95% unsecured senior notes ($600 million US) | | 2035 | | | | 719 | | | | 577 | |
| 5.35% unsecured senior notes ($300 million US) | | 2033 | | | | 320 | | | | 248 | |
| 7.00% unsecured debentures ($250 million US) | | 2028 | | | | 296 | | | | 237 | |
| 7.875% unsecured debentures ($275 million US) | | 2026 | | | | 332 | | | | 267 | |
| 9.25% unsecured debentures ($300 million US) | | 2021 | | | | 365 | | | | 294 | |
| 6.05% unsecured debentures ($600 million US) | | 2018 | | | | 729 | | | | - | |
| 5.00% unsecured senior notes ($400 million US) | | 2014 | | | | 485 | | | | 391 | |
| 4.00% unsecured senior notes ($300 million US) | | 2013 | | | | 351 | | | | 275 | |
| Syndicated credit facilities | | 2013 | | | | - | | | | 995 | |
| Capital leases | | 2008-2022 | | | | 62 | | | | 57 | |
| | | | | | | 4,749 | | | | 3,341 | |
| Current portion | | | | | | (3 | ) | | | (2 | ) |
| | | | | | | $ | 4,746 | | | $ | 3,339 | |
Interest on long-term debt and short-term notes payable, net of capitalized interest, was $83 million and $234 million for the three months and year ended December 31, 2008, respectively ($34 million and $151 million for the three months and year ended December 31, 2007, respectively). Interest is paid semi-annually. All debentures and notes are repayable in full upon maturity.
During the year, the Company filed a final shelf prospectus for the offering of up to $4 billion US of debt securities with the securities commission or equivalent regulatory authority in each of the provinces and territories of Canada and the United States. The Company completed a public offering of debt securities under this prospectus in the form of $600 million US 6.05% 10-year unsecured senior notes due May 15, 2018 and $900 million US 6.80% 30-year unsecured senior notes due May 15, 2038. The net proceeds of this offering were used to repay the Company’s short-term notes payable and indebtedness outstanding under its syndicated credit facilities. The balance was added to the Company’s working capital to fund future capital expenditures.
NOTES TO CONSOLIDATED FINANCIAL STATEMENTS (unaudited)
| (millions of Canadian dollars, unless otherwise stated) |
12. LONG-TERM DEBT, continued |
At December 31, 2008, the Company had in place revolving, committed syndicated credit facilities totaling $3,570 million (December 31, 2007 - $2,200 million), which mature in 2013, and revolving bilateral demand credit facilities of $777 million (December 31, 2007 - $1,500 million). During 2008, the Company had drawings on its syndicated credit facilities and its demand credit facilities in the form of Canadian dollar Bankers’ Acceptances. However, as of December 31, 2008, the Company had repaid all amounts previously drawn on its syndicated and demand credit facilities. A total of $348 million of the credit facilities was used for letters of credit and overdraft coverage.
Subsequent to December 31, 2008, the Company put in place a bilateral committed credit facility in the amount of $244 million.
Changes in common shares and contributed surplus were as follows:
| | | Shares | | | Amount | | | Contributed Surplus | |
| Balance at December 31, 2007 | | | 483,459,119 | | | $ | 1,365 | | | $ | 24 | |
| Issued under employee stock option and share purchase plans | | | 1,138,348 | | | | 23 | | | | (2 | ) |
| Balance at December 31, 2008 | | | 484,597,467 | | | | 1,388 | | | | 22 | |
The Company has a normal course issuer bid (NCIB) program for the repurchase of its outstanding common shares. This program was renewed in June 2008 to repurchase up to 24 million outstanding common shares during the period from June 22, 2008 to June 21, 2009, subject to certain conditions. During the three months and year ended December 31, 2008, the Company did not repurchase any common shares. During the three months and year ended December 31, 2007, the Company repurchased 2,000,000 common shares at a cost of $104 million and 15,998,000 common shares at a cost of $839 million, respectively. The excess of the purchase price over the carrying amount of the shares purchased was recorded as a $nil and $444 million reduction of contributed surplus and $97 million and $351 million reduction of retained earnings for the three months and year ended December 31, 2007, respectively.
| 14. | STOCK-BASED COMPENSATION |
The total stock-based compensation (recovery) expense recorded was $(20) million and $(161) million for the three months and year ended December 31, 2008, respectively, ($(68) million and $95 million for the three months and year ended December 31, 2007, respectively).
Changes in the number of outstanding stock options were as follows:
| | Stock Options | |
| | Number | | | Weighted-Average Exercise Price | |
| Balance at December 31, 2007 | | 21,035,064 | | | $ | 34 | |
| Granted | | 3,486,200 | | | | 47 | |
| Exercised for common shares | | (1,138,348 | ) | | | 17 | |
| Surrendered for cash payment | | (897,604 | ) | | | 35 | |
| Forfeited | | (347,410 | ) | | | 47 | |
| Expired | | (4,000 | ) | | | 13 | |
| Balance at December 31, 2008 | | 22,133,902 | | | $ | 37 | |
NOTES TO CONSOLIDATED FINANCIAL STATEMENTS (unaudited)
| (millions of Canadian dollars, unless otherwise stated) |
14. STOCK-BASED COMPENSATION, continued |
| (b) | Performance Share Units (PSUs) |
Changes in the number of outstanding PSUs were as follows:
| | PSUs | |
| | Number | |
| Balance at December 31, 2007 | | 1,166,044 | |
| Granted | | 254,169 | |
| Redeemed | | (584,137 | ) |
| Forfeited | | (7,704 | ) |
| Balance at December 31, 2008 | | 828,372 | |
| (c) | Stock Appreciation Rights (SARs) |
Changes in the number of outstanding SARs were as follows:
| | SARs | |
| | Number | | | Weighted-Average Exercise Price | |
| Balance at December 31, 2007 | | 3,659,450 | | | $ | 44 | |
| Granted | | 4,107,330 | | | | 47 | |
| Exercised | | (139,680 | ) | | | 44 | |
| Forfeited | | (419,746 | ) | | | 47 | |
| Expired | | - | | | | - | |
| Balance at December 31, 2008 | | 7,207,354 | | | $ | 46 | |
| 15. | EMPLOYEE FUTURE BENEFITS |
The Company maintains pension plans with defined benefit and defined contribution provisions and provides certain health care and life insurance benefits to its qualifying retirees. The expenses associated with these plans are as follows:
| | Three months ended December 31, | | | Year ended December 31, | |
| | 2008 | | | 2007 | | | 2008 | | | 2007 | |
| Pension Plans: | | | | | | | | | | | |
| Defined benefit plans | | | | | | | | | | | |
| Employer current service cost | $ | 8 | | | $ | 13 | | | $ | 40 | | | $ | 43 | |
| Interest cost | | 25 | | | | 24 | | | | 95 | | | | 90 | |
| Expected return on plan assets | | (28 | ) | | | (29 | ) | | | (111 | ) | | | (112 | ) |
| Amortization of transitional asset | | (3 | ) | | | (2 | ) | | | (7 | ) | | | (6 | ) |
| Amortization of net actuarial losses | | 13 | | | | 11 | | | | 49 | | | | 44 | |
| | | 15 | | | | 17 | | | | 66 | | | | 59 | |
| | | | | | | | | | | | | | | | |
| Defined contribution plans | | 10 | | | | 8 | | | | 27 | | | | 22 | |
| | $ | 25 | | | $ | 25 | | | $ | 93 | | | $ | 81 | |
| | | | | | | | | | | | | | | | |
| Other post-retirement plans: | | | | | | | | | | | | | | | |
| Employer current service cost | $ | 2 | | | $ | 1 | | | $ | 6 | | | $ | 5 | |
| Interest cost | | 3 | | | | 3 | | | | 13 | | | | 12 | |
| Amortization of transitional obligation | | - | | | | - | | | | 2 | | | | 2 | |
| Amortization of net actuarial losses | | - | | | | - | | | | 2 | | | | 2 | |
| | $ | 5 | | | $ | 4 | | | $ | 23 | | | $ | 21 | |
The Company contributed $67 million to its pension plans in 2008.
NOTES TO CONSOLIDATED FINANCIAL STATEMENTS (unaudited)
| (millions of Canadian dollars, unless otherwise stated) |
The Company’s capital management strategy is designed to maintain financial strength and flexibility to support profitable growth in all business environments. The Company’s capital consists of debt, which is comprised of long-term debt and short-term notes payable, and shareholders’ equity. The Company measures financial strength and flexibility using two key measures: debt-to-cash flow from operating activities, the key short-term measure, and debt-to-debt plus equity, the key long-term measure. These are calculated as follows:
| | December 31, 2008 | | | December 31, 2007 | |
| Long-term debt | $ | 4,746 | | | $ | 3,339 | |
| Add: Current portion of long-term debt | | 3 | | | | 2 | |
| Total long-term debt | | 4,749 | | | | 3,341 | |
| Add: Short-term notes payable | | - | | | | 109 | |
| Debt (A) | $ | 4,749 | | | $ | 3,450 | |
| Shareholders’ equity | | 15,475 | | | | 11,870 | |
| Debt plus equity (B) | $ | 20,224 | | | $ | 15,320 | |
| | | | | | | | |
| Cash flow from operating activities (C) | $ | 6,522 | | | $ | 3,339 | |
| | | | | | | | |
Debt-to-cash flow from operating activities (A/C) (times) | | 0.7 | | | | 1.0 | |
Debt-to-debt plus equity (A/B) (%) | | 23.5 | | | | 22.5 | |
At December 31, 2008, the debt-to-cash flow from operating activities ratio was within the Company's target range of no more than 2.0 times. Debt-to-debt plus equity was below the target range of 25% to 35%, providing the financial flexibility to fund the Company's capital program and profitable growth opportunities. The Company may exceed target ranges for short periods of time, but always with the goal to return back within the target ranges.
Financial covenants associated with the Company's various banking and debt arrangements are reviewed regularly and controls are in place to maintain compliance with these covenants. The Company complied with all financial covenants for the three months and year ended December 31, 2008.
The Company’s priority uses of cash are to fund the capital program and profitable growth opportunities, and then to return cash to shareholders through dividends and a share buyback program.
The Company regularly reviews its dividend strategy to ensure the alignment of the dividend policy with shareholder expectations, and financial and growth objectives. Consistent with this objective, on July 23, 2008, the Company declared a 54% increase in its quarterly dividend to $0.20 per share commencing with the dividend paid on October 1, 2008. In June 2008, the Company renewed its NCIB program for the repurchase of its common shares from June 22, 2008 to June 21, 2009, entitling the Company to purchase up to 5% of its outstanding common shares, subject to certain conditions (Note 13). Due to an increasing capital program, the Company did not repurchase any of its shares in 2008.
Given the recent turmoil in financial markets, the Company continues to monitor its capital management strategy, and make adjustments as appropriate. The Company’s capital management strategy has not changed significantly from the prior period.
NOTES TO CONSOLIDATED FINANCIAL STATEMENTS (unaudited)
| (millions of Canadian dollars, unless otherwise stated) |
| 17. | FINANCIAL RISKS AND FINANCIAL INSTRUMENTS |
Financial Risks
The Company is exposed to a number of financial risks in the normal course of its business operations, including market risks resulting from fluctuations in commodity prices, interest rates and foreign currency exchange rates, as well as credit risks and liquidity risks.
(a) Market Risks
The Company monitors its exposure to market fluctuations and may use derivative contracts to manage these risks as it considers appropriate. The Company does not use derivative contracts for speculative purposes.
Commodity Price Risk
The Company is exposed to commodity price risk as fluctuations in crude oil or natural gas prices could have a materially adverse effect on its financial condition, as well as on the value and amount of the Company’s reserves. Prices for crude oil and natural gas fluctuate in response to changes in supply and demand, market uncertainty and a variety of other factors beyond the Company’s control.
The margins realized from the Company’s refined products are also affected by factors such as crude oil price fluctuations due to the impact on refinery feedstock costs, third-party refined product purchases and the demand for refined petroleum products. The Company’s ability to maintain product margins in an environment of higher feedstock costs depends on its ability to pass higher costs on to customers. The Company enters into derivative contracts to reduce exposure in its Downstream operations to these margin fluctuations, including margins on fixed price product sales, and short-term price fluctuations on the purchase of foreign and domestic crude oil and refined petroleum products. The Company’s exposure to these margin fluctuations is limited. As such, the fair value and commodity price risk of the outstanding derivative contracts are not significant.
Interest Rate Risk
The Company is exposed to interest rate risk as changes in market interest rates affect the fair values of fixed-interest rate liabilities and the cash flows of both floating-interest rate liabilities and future borrowings. Notes, debentures and capital leases all bear interest at fixed rates. Drawings on the syndicated and demand credit facilities bear interest at floating rates. The Company regularly reviews the mix of floating and fixed-rate debt for consistency with its financing objectives. Interest rate risk from the Company’s financial instruments is not significant.
Foreign Currency Exchange Risk
The Company’s functional currency is Canadian (Cdn) dollars, while crude oil, one of the Company’s primary products, is priced by reference to U.S. dollar benchmark prices. Therefore, Cdn/U.S. dollar exchange rate fluctuations can have a significant impact on the Company’s revenues, crude oil and product purchases, capital expenditures, long-term debt, cash and cash equivalents, accounts receivable, accounts payable and off-balance sheet commitments.
The Company is also exposed to foreign currency exchange risk from its self-sustaining foreign operations whose functional currency is different from the Company’s functional currency. Gains and losses from the translation of financial instruments within these self-sustaining foreign operations into Canadian dollars are presented as a separate component of other comprehensive income (loss) in the Consolidated Statement of Comprehensive Income.
NOTES TO CONSOLIDATED FINANCIAL STATEMENTS (unaudited)
| (millions of Canadian dollars, unless otherwise stated) |
| FINANCIAL RISKS AND FINANCIAL INSTRUMENTS, continued |
The Company’s outstanding U.S. dollar-denominated long-term debt (Note 12) partially mitigates the exposure to Cdn/U.S. dollar exchange rate fluctuations created from its U.S. dollar-denominated cash flows and other associated financial instruments. In addition, the Company may hold a significant amount of U.S. dollar cash and cash equivalents to meet immediate capital and/or operating funding requirements, and may have significant accounts receivable, other assets, accounts payable and accrued liabilities and other liabilities balances denominated in U.S. dollars. These can create additional exposure to foreign currency exchange risk. At December 31, 2008, the Company had the following U.S. dollar denominated financial instruments: | | December 31, 2008 | |
| Cash and cash equivalents | $US | 473 | |
| Accounts receivable | | 1,287 | |
| Other assets | | 11 | |
| Accounts payable and accrued liabilities | | (338 | ) |
| Long-term debt | | (3,953 | ) |
| Other liabilities | | (493 | ) |
| | $US | (3,013 | ) |
The Company does not have significant financial instruments denominated in other foreign currencies.
(b) Credit Risk
The Company is exposed to credit risk from its counterparties’ abilities to fulfill their obligations to the Company. The Company manages this risk through the establishment of credit policies and limits, which are applied in the selection of counterparties. The Company ensures that it has no significant concentrations of credit risk and ensures that no customers represent more than 10% of the Company’s consolidated revenues for any period.
The Company’s maximum exposure to credit risk at December 31, 2008 is equal to the carrying amount of its financial assets recorded on the Consolidated Balance Sheet. The Company carries sufficient provisions to cover its expected losses arising from credit risk associated with all financial assets, including any derecognized securitized receivables. These provisions are not significant.
(c) Liquidity Risk
The Company is exposed to liquidity risk from the potential inability to generate or obtain sufficient cash and cash equivalents in a timely and cost-effective manner to discharge its financial liabilities as they come due. The Company manages liquidity risk by forecasting cash flows to identify financing requirements, by maintaining committed and demand credit facilities, and by maintaining access to additional financing at competitive rates through capital markets and highly rated financial institutions. Any debt issued by the Company is managed in accordance with specified liquidity and maturity profiles.
The liquidity risk associated with the Company’s financial liabilities has not been significantly impacted by the recent turmoil in the financial markets due to the Company’s continuing ability to generate cash flow, existing cash balances, significant credit facility capacity and lack of near-term refinancing commitments. For 2009 and beyond, spending on future large projects may result in annual capital expenditures exceeding operating cash flow. The Company anticipates that additional funding requirements will be met by existing cash balances and external financing as needed and that additional financial leverage can be managed in the context of the Company’s capital management strategy (Note 16). NOTES TO CONSOLIDATED FINANCIAL STATEMENTS (unaudited)
| (millions of Canadian dollars, unless otherwise stated) |
| FINANCIAL RISKS AND FINANCIAL INSTRUMENTS, continued |
Derivative Contracts
During 2004, the Company entered into a series of derivative contracts for the future sale of Dated Brent crude oil in connection with its acquisition of an interest in the Buzzard field in the U.K. sector of the North Sea. Some derivative contracts matured from July 1, 2007 to December 31, 2007. All remaining outstanding derivative contracts were settled in December 2007. This resulted in the following:
| | | Three months ended December 31, 2007 | | | Year ended December 31, 2007 | |
| Unrealized losses at beginning of period | | $ | (1,502 | ) | | $ | (1,481 | ) |
Net losses during current period (Note 5) | | | (383 | ) | | | (535 | ) |
Maturities1 | | | 160 | | | | 291 | |
Settlement2 | | | 1,725 | | | | 1,725 | |
| | | $ | - | | | $ | - | |
| 1 | Derivative contracts that matured from July 1, 2007 to December 31, 2007 resulted in realized losses of $160 million ($106 million after-tax) and $291 million ($193 million after-tax) for the three months and year ended December 31, 2007, respectively. |
| 2 | All remaining outstanding derivative contracts were settled, which resulted in realized losses of $1,725 million ($1,145 million after-tax). |
Financial Instruments
Excluding debentures, senior notes and capital leases, which are recorded as long-term debt, the fair values of financial instruments equals or approximates their carrying amount. The fair value of debentures, senior notes and capital leases was $3,868 million at December 31, 2008 (December 31, 2007 – $2,500 million), compared with a carrying amount of $4,749 million at December 31, 2008 (December 31, 2007 – $2,346 million). The fair values of debentures, senior notes and capital leases are based on publicly quoted market values for instruments with similar terms and risks.
– 40 –