Exhibit 99.1
For immediate release
January 29, 2009 (publié également en français)
Strong Balance Sheet and Liquidity Position Petro-Canada Well for 2009
Highlights
| · | Achieved 2008 priorities by delivering production at the high end of guidance and progressing major projects |
| · | Replaced 149% of proved plus probable reserves over five years |
| · | Ended 2008 with strong liquidity and financial flexibility as well as low debt levels |
Calgary – Petro-Canada announced today fourth quarter operating earnings of $518 million ($1.07/share), up slightly from $513 million ($1.06/share) in the fourth quarter of 2007. Fourth quarter 2008 cash flow from operating activities before changes in non-cash working capital was $531 million ($1.10/share), up significantly from $17 million ($0.04/share) in the same quarter of last year.
Net losses were $691 million ($(1.43)/share) in the fourth quarter of 2008, compared with net earnings of $522 million ($1.08/share) in the same quarter of 2007.
In 2008, operating earnings were $3,857 million ($7.97/share), up 53% compared with $2,528 million ($5.17/share) in 2007. Cash flow from operating activities before changes in non-cash working capital for 2008 was $6,478 million ($13.38/share), up 72% from $3,762 million ($7.69/share) in the previous year.
Net earnings for the full year in 2008 were $3,134 million ($6.47/share), up 15% compared with $2,733 million ($5.59/share) in 2007.
“Petro-Canada had exceptional financial results in 2008, leaving us in excellent shape going into 2009,” said Ron Brenneman, president and chief executive officer.
“Our production came in at the high-end of our guidance range, largely due to strong reliability at most of our major facilities,” added Brenneman. “For 2009, we’ve already reduced capital spending in the first quarter from what we anticipated in mid-December. This combined with OPEC quota reductions in Libya have led us to trim our 2009 production guidance somewhat.”
The Company is in a strong liquidity position with a year-end cash balance of $1.4 billion and unutilized credit facility capacity of $4.7 billion. Both debt ratios that Petro-Canada uses to measure overall financial strength are well below the Company’s target ranges.
“We’re actively managing our spending and have both the financial strength and flexibility for these challenging times,” said Harry Roberts, executive vice-president and chief financial officer. “This approach preserves our current growth projects and may allow us to access additional opportunities.”
Fourth Quarter Results
| | Three months ended December 31, | | | Year ended December 31, | |
| (millions of Canadian dollars, except as noted) | 2008 | | | 2007 | | | 2008 | | | 2007 | |
| Consolidated Results | | | | | | | | | | | |
Operating earnings 1 | $ | 518 | | | $ | 513 | | | $ | 3,857 | | | $ | 2,528 | |
| – $/share | | 1.07 | | | | 1.06 | | | | 7.97 | | | | 5.17 | |
| Net earnings (loss) | | (691 | ) | | | 522 | | | | 3,134 | | | | 2,733 | |
| – $/share | | (1.43 | ) | | | 1.08 | | | | 6.47 | | | | 5.59 | |
Cash flow from operating activities before changes in non-cash working capital 2 | | 531 | | | | 17 | | | | 6,478 | | | | 3,762 | |
| – $/share | | 1.10 | | | | 0.04 | | | | 13.38 | | | | 7.69 | |
| Dividends – $/share | | 0.20 | | | | 0.13 | | | | 0.66 | | | | 0.52 | |
| Share buyback program | | – | | | | 104 | | | | – | | | | 839 | |
| – millions of shares | | – | | | | 2.0 | | | | – | | | | 16.0 | |
| Capital expenditures | $ | 1,777 | | | $ | 1,601 | | | $ | 6,373 | | | $ | 4,109 | |
Weighted-average common shares outstanding (millions of shares) | | 484.4 | | | | 484.6 | | | | 484.1 | | | | 489.0 | |
Total production net before royalties (thousands of barrels of oil equivalent/day – Mboe/d) 3 | | 409 | | | | 410 | | | | 418 | | | | 418 | |
Operating return on capital employed (%) | | | | | | | | | | | | | | | |
| Upstream | | | | | | | | | | 35.1 | | | | 23.6 | |
Downstream 4 | | | | | | | | | | 3.8 | | | | 11.4 | |
Total Company 4 | | | | | | | | | | 22.6 | | | | 18.4 | |
| 1 | Operating earnings (which represent net earnings (loss), excluding gains or losses on foreign currency translation of long-term debt and on sale of assets, excluding the change in fair value of the Buzzard derivative contracts (applies to 2007 and prior only), including the Downstream estimated current cost of supply adjustment and excluding mark-to-market valuations of stock-based compensation, income tax adjustments, asset impairment, insurance proceeds and premium surcharges, purchased crude oil inventory write-downs and charges due to the deferral of the Fort Hills final investment decision (FID) – see page 3 NON-GAAP MEASURES) are used by the Company to evaluate operating performance. |
| 2 | From operating activities before changes in non-cash working capital (see page 3 NON-GAAP MEASURES). |
| 3 | Total production includes natural gas converted at six thousand cubic feet (Mcf) of natural gas for one barrel (bbl) of oil. |
| 4 | In 2008, Downstream and Total Company operating return on capital employed includes the Downstream estimated current cost of supply adjustment. |
NON-GAAP MEASURES
Cash flow and cash flow from operating activities before changes in non-cash working capital are commonly used in the oil and gas industry and by Petro-Canada to assist management and investors in analyzing operating performance, leverage and liquidity. In addition, the Company’s capital budget was prepared using anticipated cash flow from operating activities before changes in non-cash working capital, as the timing of collecting receivables or making payments is not considered relevant for capital budgeting purposes. Operating earnings represent net earnings (loss), excluding gains or losses on foreign currency translation of long-term debt and sale of assets, excluding the change in fair value of derivative contracts associated with the Buzzard acquisition (applies to 2007 and prior only), including the Downstream estimated current cost of supply adjustment and excluding mark-to-market valuations of stock-based compensation, income tax adjustments, asset impairment charges, insurance proceeds and premium surcharges, purchased crude oil inventory write-downs, and charges due to the deferral of the Fort Hills FID. Operating earnings are used by the Company to evaluate operating performance. Cash flow, cash flow from operating activities before changes in non-cash working capital and operating earnings do not have standardized meanings prescribed by Canadian generally accepted accounting principles (GAAP) and, therefore, may not be comparable with the calculations of similar measures for other companies. For a reconciliation of cash flow and cash flow from operating activities before changes in non-cash working capital to the associated GAAP measures, refer to the table on page 5. For a reconciliation of operating earnings to the associated GAAP measures, refer to the table below.
On January 1, 2008, the Company adopted Canadian Institute of Chartered Accountants (CICA) Section 3031, Inventories, and now assigns costs for its crude oil and refined petroleum products inventories on a “first-in, first-out” (FIFO) basis whereas, previously, these costs were assigned on a “last-in, first-out” (LIFO) basis. To facilitate a better understanding of the Company’s Downstream performance, operating earnings for 2008 onward are being presented on an estimated current cost of supply basis, which is a non-GAAP measure. On this basis, cost of sales is determined by estimating the current cost of supply for all volumes sold in the period after making allowance for the estimated tax effect, instead of using a FIFO basis for valuing inventories. Operating earnings calculated on this basis do not represent the application of a LIFO basis of valuing inventories, used prior to 2008, and, therefore, the Downstream estimated current cost of supply adjustment does not have comparatives.
| | | Three months ended December 31, | | | Year ended December 31, | |
| (millions of Canadian dollars, except per share amounts) | | 2008 | | | ($/share) | | | 2007 | | | ($/share) | | | 2008 | | | ($/share) | | | 2007 | | | ($/share) | |
| Net earnings (loss) | | $ | (691 | ) | | $ | (1.43 | ) | | $ | 522 | | | $ | 1.08 | | | $ | 3,134 | | | $ | 6.47 | | | $ | 2,733 | | | $ | 5.59 | |
Foreign currency translation gain (loss) on long-term debt 1 | | | (442 | ) | | | | | | | 10 | | | | | | | | (606 | ) | | | | | | | 208 | | | | | |
Change in fair value of Buzzard derivative contracts 2 | | | – | | | | | | | | (120 | ) | | | | | | | – | | | | | | | | (138 | ) | | | | |
Gain on sale of assets 3 | | | 9 | | | | | | | | 3 | | | | | | | | 4 | | | | | | | | 58 | | | | | |
| Downstream estimated current cost of supply adjustment | | | (549 | ) | | | | | | | – | | | | | | | | (255 | ) | | �� | | | | | – | | | | | |
| Mark-to-market valuation of stock-based compensation | | | 15 | | | | | | | | 45 | | | | | | | | 126 | | | | | | | | (54 | ) | | | | |
Income tax adjustments 4 | | | (38 | ) | | | | | | | 143 | | | | | | | | 215 | | | | | | | | 191 | | | | | |
Asset impairment charge 5 | | | (28 | ) | | | | | | | (97 | ) | | | | | | | (52 | ) | | | | | | | (97 | ) | | | | |
| Insurance proceeds and premium surcharges | | | (20 | ) | | | | | | | 25 | | | | | | | | 9 | | | | | | | | 37 | | | | | |
Purchased crude oil inventory write-downs 6 | | | – | | | | | | | | – | | | | | | | | (8 | ) | | | | | | | – | | | | | |
Charges due to the deferral of the Fort Hills FID 7 | | | (156 | ) | | | | | | | – | | | | | | | | (156 | ) | | | | | | | – | | | | | |
| Operating earnings | | $ | 518 | | | $ | 1.07 | | | $ | 513 | | | $ | 1.06 | | | $ | 3,857 | | | $ | 7.97 | | | $ | 2,528 | | | $ | 5.17 | |
| 1 | Foreign currency translation reflected gains or losses on United States (U.S.) dollar-denominated long-term debt not associated with the self-sustaining International business unit and the U.S. Rockies operations included in the North American Natural Gas business unit. |
| 2 | During the fourth quarter of 2007, the Company entered into derivative contracts to close out the hedged portion of its Buzzard production from January 1, 2008 to December 31, 2010. |
| 3 | In the third quarter of 2008, the International & Offshore business unit completed the sale of its Denmark assets in the International segment, resulting in a gain on sale of $107 million before-tax ($82 million after-tax). In the second quarter of 2008, the North American Natural Gas business unit completed the sale of its Minehead assets in Western Canada, resulting in a loss on sale of $153 million before-tax ($112 million after-tax). In addition to the sale of these assets, there were additional, less significant, asset sales resulting in gains of $50 million before-tax ($34 million after-tax) for the year ended December 31, 2008. The sale of these assets is aligned with the business units’ strategies to continuously optimize the assets in their portfolios. |
| 4 | In the second quarter of 2008, the International business segment recorded a $230 million future income tax recovery due to the ratification of the Libya Exploration and Production Sharing Agreements (EPSAs). |
| 5 | In the fourth quarter of 2008, the North American Natural Gas business unit recorded a depreciation, depletion and amortization (DD&A) charge of $41 million before-tax ($28 million after-tax) for costs related to a discontinued pilot project in northern British Columbia. In the first quarter of 2008, the North American Natural Gas business unit recorded a DD&A charge of $35 million before-tax ($24 million after-tax) for accumulated project development costs relating to the proposed liquefied natural gas (LNG) re-gasification facility at Gros-Cacouna, Quebec, which has been postponed due to global LNG business conditions. In the fourth quarter of 2007, the North American Natural Gas business unit recorded a charge of $150 million before-tax ($97 million after-tax) for the impairment of coal bed methane (CBM) assets in the U.S. Rockies due to probable reserves reductions combined with lower prices. |
| 6 | In the third quarter of 2008, the Oil Sands business unit recorded a $38 million before-tax ($26 million after-tax) charge for the write-down of crude oil inventory purchased for line fill for the Edmonton refinery conversion project (RCP). Partially offsetting this write-down, Shared Services and Eliminations recorded a $26 million before-tax ($18 million after-tax) recovery to recognize the Downstream's expected future margins from refining this crude oil inventory and selling the refined petroleum products. As a result, the Company recorded a net write-down of $12 million before-tax ($8 million after-tax). |
| 7 | In the fourth quarter of 2008, the Company and its partners announced the deferral of the FID on the mining and upgrading portions of the Fort Hills project. As a result, the Oil Sands business unit recorded expenses of $216 million before-tax ($156 million after-tax) to reflect costs incurred terminating certain goods and services agreements and DD&A charges on certain property, plant and equipment. |
Earnings Variances
| Q4/08 VERSUS Q4/07 FACTOR ANALYSIS |
| (millions of Canadian dollars, after-tax) |
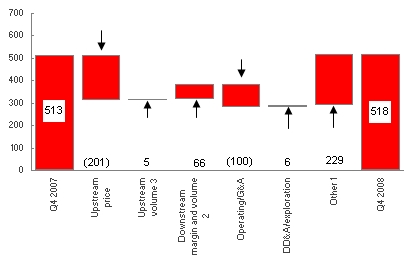 | Operating earnings increased 1% to $518 million ($1.07/share) in the fourth quarter of 2008, compared with $513 million ($1.06/share) in the fourth quarter of 2007. The increase in fourth quarter operating earnings reflected the positive impact of lower other expenses1 ($229 million), higher Downstream margins2 ($66 million), lower DD&A and exploration expenses ($6 million) and increased upstream production3 ($5 million). The gains were largely offset by lower realized upstream prices ($(201) million) and higher operating, general and administrative (G&A) expenses ($(100) million). |
| 1 | Other mainly included interest expense ($(31) million), foreign exchange ($37 million), the realized losses on the Buzzard derivative contracts (applies to 2007 and prior only) ($106 million) and upstream inventory movements ($108 million). |
| 2 | Downstream margin included the estimated current cost of supply adjustment. |
| 3 | Upstream volumes included the portion of DD&A expense associated with changes in upstream production levels. |
| | Operating Earnings by Segment |
| | (millions of Canadian dollars, after-tax) |
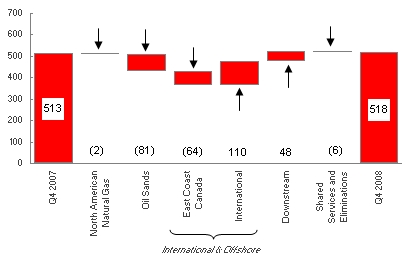
| The increase in fourth quarter operating earnings on a segmented basis reflected higher International ($110 million) and Downstream ($48 million) operating earnings. The results were largely offset by a decrease of net earnings to an operating loss in Oil Sands ($(81) million) and lower East Coast Canada ($(64) million) and North American Natural Gas ($(2) million) operating earnings as well as higher Shared Services and Eliminations costs ($(6) million). |
Net losses in the fourth quarter of 2008 were $691 million ($(1.43)/share), compared with net earnings of $522 million ($1.08/share) during the same period in 2007. Net losses in the fourth quarter of 2008 reflected losses on foreign currency translation of long-term debt, the negative impact from declining crude oil feedstock costs while using a FIFO inventory valuation methodology and charges due to the deferral of the Fort Hills FID. Net earnings in the fourth quarter of 2007 included charges associated with settling the Buzzard derivative contracts.
| | | Three months ended December 31, | | | Year ended December 31, | |
| (millions of Canadian dollars) | | 2008 | | | 2007 | | | 2008 | | | 2007 | |
| Cash flow from (used in) operating activities | | $ | 1,329 | | | $ | (602 | ) | | $ | 6,522 | | | $ | 3,339 | |
| Increase (decrease) in non-cash working capital related to operating activities | | | (798 | ) | | | 619 | | | | (44 | ) | | | 423 | |
| Cash flow from operating activities before changes in non-cash working capital | | $ | 531 | | | $ | 17 | | | $ | 6,478 | | | $ | 3,762 | |
During the fourth quarter of 2008, cash flow from operating activities before changes in non-cash working capital was $531 million ($1.10/share). While this represents a significant increase from the same quarter in 2007, where cash flow from operating activities before changes in non-cash working capital was $17 million ($0.04/share), the increase was significantly mitigated by lower prices for crude oil and refined petroleum products; the deferral of the FID on the Fort Hills project, where approximately $118 million of the $156 million charges represent a reduction in cash flow from operating activities before changes in non-cash working capital; and the impact of declining crude prices in the Downstream. The impact of declining crude prices in the Downstream reduced cash flow from operating activities before changes in non-cash working capital during the fourth quarter of 2008 by an amount approximately equal to the current cost of supply adjustment of $549 million. The fourth quarter of 2007 included a $1,145 million cash payment to enter into derivative contracts to close out the hedged portion of Petro-Canada’s Buzzard production.
2009 Upstream Consolidated Production Outlook
Subsequent to the release of the 2009 guidance on December 11, 2008, the Company is reducing 2009 production guidance as a result of cutbacks to 2009 planned capital expenditures that are affecting near-term production as well as OPEC quota restraints in Libya. Revised production guidance is now expected to be in the range of 345,000 barrels of oil equivalent/day (boe/d) to 385,000 boe/d. The production guidance range has been expanded to reflect market uncertainty in the current environment and the potential impact on near term production if low commodity prices persist or worsen and further reductions to capital expenditures are needed.
| (thousands of boe/d) | 2009 Outlook (+/-) As at December 11, 2008 | 2009 Outlook (+/-) As at January 29, 2009 |
| Production guidance range | 360 – 395 | 345 – 385 |
In 2008, production of crude oil, NGL and natural gas averaged 418,000 boe/d net which was at the high end of our 2008 guidance. Upstream production for 2009 is expected to decrease from 2008, primarily due to natural declines in Western Canada, East Coast Canada and International, OPEC quota restraints in Libya, and large facility turnarounds in East Coast Canada and International. These turnarounds are being undertaken to enhance production growth in the future and maintain reliable operations. Partially offsetting these decreases are additional volumes from Oil Sands and base business investments, which moderate the natural declines. With deferred production from turnarounds back on-stream at the end of 2009, the exit rate is expected to be closer to the high end of the range.
Factors that may impact production during 2009 include reservoir performance, drilling results, facility reliability, changes in OPEC production quotas and the successful execution of planned turnarounds.
| (thousands of boe/d) | 2008 Outlook (+/-) As at July 24, 2008 | 2008 Actual | 2009 Outlook (+/-) As at December 11, 2008 | 2009 Outlook (+/-) As at January 29, 2009 |
| North American Natural Gas | | | | |
| Natural gas | 94 | 98 | 84 | 81 |
| Liquids | 12 | 13 | 14 | 14 |
| Oil Sands | | | | |
| Syncrude | 35 | 35 | 38 | 38 |
| MacKay River | 25 | 25 | 27 | 27 |
| International & Offshore | | | | |
| East Coast Canada | 87 | 90 | 68 | 68 |
| International | | | | |
| North Sea | 94 | 98 | 85 | 85 |
| Other International | 58 | 59 | 59 | 52 |
Operating Highlights
Fourth quarter production averaged 409,000 boe/d net to Petro-Canada in 2008, relatively unchanged compared with 410,000 boe/d net in the same quarter of 2007. Volumes reflected decreased International production and relatively unchanged North American Natural Gas production, offset by increased East Coast Canada and Oil Sands production.
In 2008, production of crude oil, natural gas liquids (NGL) and natural gas averaged 418,000 boe/d net, at the high end of our 2008 guidance and unchanged from 418,000 boe/d in 2007.
In the Downstream, the Edmonton RCP continued to ramp up, and strong marketing performance was partially offset by lower Refining and Supply earnings.
| | Three months ended December 31, | Year ended December 31, |
| | 2008 | 2007 | 2008 | 2007 |
| Upstream – Consolidated | | | | |
| Production before royalties | | | | |
Crude oil and NGL production net (thousands of barrels/day – Mb/d) | 292 | 289 | 301 | 297 |
Natural gas production net, excluding injectants (millions of cubic feet/day – MMcf/d) | 699 | 725 | 706 | 728 |
Total production net (Mboe/d) 1 | 409 | 410 | 418 | 418 |
| Average realized prices | | | | |
Crude oil and NGL ($/barrel – $/bbl) | 58.25 | 82.71 | 95.63 | 72.66 |
Natural gas ($/thousand cubic feet – $/Mcf) | 7.53 | 5.88 | 8.34 | 6.32 |
| Downstream | | | | |
Petroleum product sales (thousands of cubic metres/day – m3/d) | 52.8 | 54.5 | 52.4 | 53.3 |
Average refinery utilization (%) 2 | 84 | 99 | 89 | 99 |
Downstream operating earnings after-tax (cents/litre) 3 | 2.0 | 1.0 | 1.3 | 3.0 |
| 1 | Total production includes natural gas converted at six Mcf of natural gas for one bbl of oil. |
| 2 | In 2008, Downstream average refinery utilization was impacted by turnaround activity associated with the Edmonton RCP and subsequent ramp up. |
| 3 | In 2008, Downstream operating earnings after-tax includes the Downstream estimated current cost of supply adjustment. |
BUSINESS STRATEGY
Petro-Canada's strategy is to create shareholder value by delivering long-term, profitable growth and improving the profitability of the base business.
Petro-Canada’s capital program supports bringing on six major projects over the next several years to deliver long-term profitable growth. The Company anticipates upstream production will significantly increase when these major growth projects come on-stream. The major projects, Syria Ebla gas, Libya EPSAs development and the White Rose Extensions, are proceeding on schedule and have been sanctioned by the Company. The other three projects, MacKay River expansion, Fort Hills mining project and the Montreal coker, are not sanctioned and are on hold until commodity prices and financial markets strengthen.
Petro-Canada continually works to strengthen its base business by improving the safety, reliability and efficiency of its operations and is focused on delivering upstream production in line with guidance.
Outlook
Operational Updates
| · | Hibernia to commence planned 21-day turnaround in the first quarter of 2009. |
| · | Buzzard to commence a planned four-day turnaround in the first quarter of 2009. |
Major Project Milestones
| · | Construction of the Edmonton RCP was completed at the end of the third quarter and the refinery continued to ramp up in the fourth quarter of 2008. |
| · | Procurement and fabrication of the North Amethyst portion of the White Rose Extensions project is being advanced, with the project on schedule to deliver first oil in late 2009 or early 2010. |
| · | The Syria Ebla gas project is on plan and was 50% complete at the end of 2008, with first gas still expected in mid-2010. The drilling program is proceeding and results have been inline with expectations. The 3D seismic acquisition of the Ash Shaer fields continues. |
| · | Following the signing of the new Libya EPSAs, work has commenced with a focus on preparing the Amal field development program and initiating the new exploration program. Seismic operations continued with a fourth seismic crew deployed in the fourth quarter of 2008. |
| · | To preserve its strong liquidity position, the three unsanctioned growth projects (Montreal coker, MacKay River expansion and Fort Hills mining project) are on hold until commodity prices and financial markets strengthen. The Company is reworking these projects’ costs to take advantage of the current market environment. |
| · | The regulatory approval for the amendment to the Fort Hills approved mine plan was received in the fourth quarter of 2008. Regulatory approval for the Sturgeon Upgrader was received in January 2009. The upgrader portion of the project was put on hold and a decision on whether to proceed with the upgrader will be made at a later date. |
BUSINESS UNIT RESULTS
UPSTREAM
North American Natural Gas
| | | Three months ended December 31, | | | Year ended December 31, | |
| (millions of Canadian dollars) | | 2008 | | | 2007 | | | 2008 | | | 2007 | |
| Net earnings (loss) | | $ | 5 | | | $ | (57 | ) | | $ | 344 | | | $ | 191 | |
Gain (loss) on sale of assets 1 | | | 4 | | | | – | | | | (91 | ) | | | 41 | |
| Income tax adjustments | | | – | | | | 7 | | | | – | | | | 8 | |
| Insurance premium surcharges | | | (2 | ) | | | – | | | | (2 | ) | | | – | |
Asset impairment charge 2 | | | (28 | ) | | | (97 | ) | | | (52 | ) | | | (97 | ) |
| Operating earnings | | $ | 31 | | | $ | 33 | | | $ | 489 | | | $ | 239 | |
| Cash flow from operating activities before changes in non-cash working capital | | $ | 205 | | | $ | 173 | | | $ | 1,209 | | | $ | 720 | |
| 1 | In the second quarter of 2008, the North American Natural Gas business unit completed the sale of its Minehead assets in Western Canada, resulting in a loss on sale of $153 million before-tax ($112 million after-tax). The sale of these assets is aligned with the business unit’s strategy to continuously optimize the assets in its portfolio. |
| 2 | In the fourth quarter of 2008, the North American Natural Gas business unit recorded a DD&A charge of $41 million before-tax ($28 million after-tax) for costs related to a discontinued pilot project in northern British Columbia. In the first quarter of 2008, the North American Natural Gas business unit recorded a DD&A charge of $35 million before-tax ($24 million after-tax) for accumulated project development costs relating to the proposed LNG re-gasification facility at Gros-Cacouna, Quebec, which has been postponed due to global LNG business conditions. In the fourth quarter of 2007, the North American Natural Gas business unit recorded a charge of $150 million before-tax ($97 million after-tax) for the impairment of CBM assets in the U.S. Rockies due to probable reserves reductions combined with lower prices. |
In the fourth quarter of 2008, North American Natural Gas contributed $31 million of operating earnings, compared with $33 million in the fourth quarter of 2007. Higher realized natural gas prices and lower exploration expenses were offset by higher operating and DD&A expenses and lower realized crude oil and liquids prices.
North American Natural Gas production averaged 662 million cubic feet of gas equivalent/day (MMcfe/d) in the fourth quarter of 2008, relatively unchanged from 669 MMcfe/d in the same quarter of 2007. Production reflected higher natural gas production in the U.S. Rockies and strong performance in Western Canada, which significantly offset natural decline rates.
Oil Sands
| | | Three months ended December 31, | | | Year ended December 31, | |
| (millions of Canadian dollars) | | 2008 | | | 2007 | | | 2008 | | | 2007 | |
| Net earnings (loss) | | $ | (164 | ) | | $ | 129 | | | $ | 334 | | | $ | 316 | |
| Gain on sale of assets | | | 3 | | | | – | | | | 3 | | | | 1 | |
| Insurance premium recoveries (surcharges) | | | (3 | ) | | | 1 | | | | (3 | ) | | | 1 | |
| Income tax adjustments | | | – | | | | 55 | | | | 2 | | | | 62 | |
Purchased crude oil inventory write-downs 1 | | | – | | | | – | | | | (26 | ) | | | – | |
Charges due to the deferral of the Fort Hills FID 2 | | | (156 | ) | | | – | | | | (156 | ) | | | – | |
| Operating earnings (loss) | | $ | (8 | ) | | $ | 73 | | | $ | 514 | | | $ | 252 | |
| Cash flow from (used in) operating activities before changes in non-cash working capital | | $ | (90 | ) | | $ | 149 | | | $ | 594 | | | $ | 555 | |
| 1 | In the third quarter of 2008, Oil Sands recorded a $38 million before-tax ($26 million after-tax) write-down of crude oil inventory purchased for line fill for the Edmonton RCP. This write-down was partially offset by a recovery of $26 million before-tax ($18 million after-tax) recorded in Shared Services and Eliminations. |
| 2 | In the fourth quarter of 2008, the Company and its partners announced the deferral of the FID on the mining and upgrading portions of the Fort Hills project. As a result, the Oil Sands business unit recorded expenses of $216 million before-tax ($156 million after-tax) to reflect costs incurred terminating certain goods and services agreements and DD&A charges on certain property, plant and equipment. |
Oil Sands had an operating loss of $8 million in the fourth quarter of 2008, compared with operating earnings of $73 million in the fourth quarter of 2007. Lower realized Syncrude prices, higher operating costs and losses on the sale of crude oil inventories were partially offset by increased production, higher realized MacKay River prices and lower DD&A expenses.
Oil Sands production averaged 63,100 barrels/day (b/d) in the fourth quarter of 2008, up 22% from 51,700 b/d in the fourth quarter of 2007. Increased production primarily reflected increased reliability and capacity at MacKay River, partially offset by the completion of a planned 45-day turnaround of Coker 8-2 and bitumen production constraints at Syncrude.
International & Offshore
East Coast Canada
| | | Three months ended December 31, | | | Year ended December 31, | |
| (millions of Canadian dollars) | | 2008 | | | 2007 | | | 2008 | | | 2007 | |
Net earnings 1 | | $ | 211 | | | $ | 346 | | | $ | 1,368 | | | $ | 1,229 | |
| Insurance premium recoveries (surcharges) | | | (3 | ) | | | 1 | | | | (3 | ) | | | 1 | |
| Terra Nova insurance proceeds | | | – | | | | 20 | | | | 29 | | | | 27 | |
| Income tax adjustments | | | – | | | | 47 | | | | 2 | | | | 52 | |
| Operating earnings | | $ | 214 | | | $ | 278 | | | $ | 1,340 | | | $ | 1,149 | |
| Cash flow from operating activities before changes in non-cash working capital | | $ | 315 | | | $ | 378 | | | $ | 1,746 | | | $ | 1,542 | |
| 1 | East Coast Canada crude oil inventory movements increased net earnings by $86 million before-tax ($59 million after-tax) and $26 million before-tax ($17 million after-tax) for the three months and year ended December 31, 2008, respectively. The same factor increased (decreased) net earnings by $(30) million before-tax ($(20) million after-tax) and $18 million before-tax ($12 million after-tax) for the three months and year ended December 31, 2007, respectively. |
In the fourth quarter of 2008, East Coast Canada contributed $214 million of operating earnings, down from $278 million in the fourth quarter of 2007. Lower realized prices and higher royalty payments, operating costs and DD&A expenses were partially offset by increased production and foreign exchange gains.
East Coast Canada production averaged 88,700 b/d in the fourth quarter of 2008, up 1% from 87,400 b/d in the same period in 2007. Hibernia production was higher due to the positive impact of recent well workovers, strong reliability and the addition of two new production wells, which offset natural declines. White Rose production was lower due to the shut in of a production well due to a subsea gas leak. Terra Nova’s production was slightly lower due to natural declines and the completion of a planned overhaul of one of the main power generators.
International
| | | Three months ended December 31, | | | Year ended December 31, | |
| (millions of Canadian dollars) | | 2008 | | | 2007 | | | 2008 | | | 2007 | |
Net earnings (loss) 1 | | $ | 193 | | | $ | (30 | ) | | $ | 1,684 | | | $ | 374 | |
Change in fair value of Buzzard derivative contracts 2 | | | – | | | | (120 | ) | | | – | | | | (138 | ) |
Gain on sale of assets 3 | | | – | | | | 2 | | | | 88 | | | | 9 | |
| Insurance premium recoveries (surcharges) | | | (4 | ) | | | 1 | | | | (4 | ) | | | 1 | |
| Scott insurance proceeds | | | – | | | | – | | | | – | | | | 5 | |
Income tax adjustments 4 | | | – | | | | – | | | | 227 | | | | 30 | |
| Operating earnings | | $ | 197 | | | $ | 87 | | | $ | 1,373 | | | $ | 467 | |
| Cash flow from (used in) operating activities before changes in non-cash working capital | | $ | 392 | | | $ | (842 | ) | | $ | 2,236 | | | $ | 185 | |
| 1 | International crude oil inventory movements increased net earnings by $66 million before-tax ($35 million after-tax) and $154 million before-tax ($53 million after-tax) for the three months and year ended December 31, 2008, respectively. The same factor increased the net loss by $58 million before-tax ($20 million after-tax) and decreased net earnings by $30 million before-tax ($14 million after-tax) for the three months and year ended December 31, 2007, respectively. |
| 2 | During the fourth quarter of 2007, the Company entered into derivative contracts to close out the hedged portion of its Buzzard production from January 1, 2008 to December 31, 2010, resulting in an after-tax charge to net earnings of $120 million and a reduction in cash flow of $1,145 million after-tax. |
| 3 | In the third quarter of 2008, the International & Offshore business unit completed the sale of its Denmark assets in the International segment, resulting in a gain on sale of $107 million before-tax ($82 million after-tax). |
| 4 | In the second quarter of 2008, the International business unit recorded a $230 million future income tax recovery due to the ratification of the Libya EPSAs. |
International contributed $197 million of operating earnings in the fourth quarter of 2008, up from $87 million in the fourth quarter of 2007. Foreign exchange gains, higher realized natural gas prices, lower exploration and DD&A expenses and the absence of expenses associated with settling the Buzzard derivative contracts relative to the fourth quarter of 2007 were partially offset by lower realized crude oil prices, decreased production volumes and increased operating expenses.
International production averaged 146,500 boe/d in the fourth quarter of 2008, down 8% from 159,200 boe/d in the fourth quarter of 2007. Decreased production primarily reflected natural declines in several North Sea assets and an unplanned shutdown of the Triton facility in December. These factors were partially offset by higher Buzzard production due to strong operating performance.
Exploration Update
For the year ended December 31, 2008, Petro-Canada and its partners finished operations on 16 wells. Four of the wells were completed as natural gas discoveries (Gubik-3 in the Alaska Foothills, Zandolie East on Block 1a offshore Trinidad and Tobago, Sancoche on Block 22 offshore Trinidad and Tobago, and van Ghent in the Netherlands sector of the North Sea). One well was completed as an oil discovery (Pink in the United Kingdom (U.K.) sector of the North Sea). One successful natural gas appraisal well was completed (Cassra 2 on Block 22 offshore Trinidad and Tobago), and there was one successful oil appraisal well (Farigh 14-12 in Libya). One well was completed as a non-commercial oil discovery (Maria in the U.K. sector of the North Sea) and one well as a non-commercial natural gas discovery (L5a-11 in the Netherlands sector of the North Sea). Drilling of the Chandler-1 well in the Alaska Foothills was suspended, as planned, for re-entry next season. Four wells were dry and abandoned (Kwijika in the Northwest Territories, Tegu on Block 1a offshore Trinidad and Tobago, Bene on Block 22 offshore Trinidad and Tobago, and Trow in the Norwegian sector of the North Sea).
Two of the completed wells were from the 2007 exploration program. Gemini, in the U.K. sector of the North Sea, was dry and abandoned, and the Poinsettia-2 appraisal well (on the NCMA Block in Trinidad and Tobago) was completed as a natural gas discovery.
At year-end 2008, operations continued on one well (L6-7 in the Netherlands sector of the North Sea).
| | 2008 Results 1 | 2009 Outlook 2 |
| (number of wells) | Discoveries – Oil | Discoveries – Natural Gas | Still being evaluated | Dry and abandoned | |
| North Sea | 2 | 2 | – | 2 | 4 |
| Syria | – | – | – | – | – |
| Libya | 1 | – | – | – | 4 |
| Trinidad and Tobago | – | 4 | – | 2 | – |
| Alaska | – | 1 | 1 | – | 3 |
| Northwest Territories | – | – | – | 1 | – |
| East Coast Canada | – | – | – | – | 1 |
| Total | 3 | 7 | 1 | 5 | 12 |
| 1 | Includes the dry and abandoned well Gemini (in the U.K sector of the North Sea) and the natural gas discovery well Poinsettia-2 (on the NCMA Block in Trinidad and Tobago) from the 2007 exploration program, which were completed in the first quarter of 2008. |
| 2 | The 2009 Outlook was previously released on December 11, 2008. |
In the fourth quarter of 2008, the Company did not complete any exploration wells.
In 2009, the Company expects to drill up to 12 wells focused in the North Sea, Libya, East Coast Canada and the Alaska Foothills. In the North Sea, Petro-Canada and its partners plan to drill up to four wells. Up to another four wells are planned as part of the ongoing drilling program in Libya, and the Company and its partners will continue to develop longer term supply opportunities in the frontier area of Alaska, where three wells are planned. In East Coast Canada, the Company and its partners also plan to drill one well.
Reserves
Petro-Canada's objective is to replace reserves over time through exploration, development and acquisition. The Company believes that the combination of proved plus probable reserves provides the best perspective of Petro-Canada’s reserves.
The following table and the accompanying narrative do not conform to U.S. Securities and Exchange Commission (SEC) standards and are for supplemental general information. Working interest reserves before royalties, million barrels of oil equivalent (MMboe), reserves life index (RLI), reserves replacement, probable reserves and combining proved and probable reserves do not conform to SEC standards.
| Consolidated Reserves – for Oil and Gas Activities | | Proved + Probable 2008 | | | Proved + Probable 2004 – 2008 | |
| (working interest before royalties) | | (MMboe) | | | (MMboe) | |
| Opening balance | | | 2,409 | | | | 2,092 | |
| Net additions | | | | | | | | |
| North American Natural Gas | | | 1 | | | | 81 | |
| Oil Sands | | | 9 | | | | 556 | |
| International & Offshore | | | | | | | | |
| East Coast Canada | | | 4 | | | | 121 | |
| International | | | 192 | | | | 365 | |
| Production | | | (153 | ) | | | (753 | ) |
| Ending Balance | | | 2,462 | | | | 2,462 | |
In 2008, the Company replaced 135%1 of production on a proved plus probable basis. Proved plus probable reserves additions totalled 206 MMboe, excluding 2008 production of 153 MMboe net. As a result, total proved plus probable reserves increased from 2,409 MMboe at year-end 2007 to 2,462 MMboe at year-end 2008. The proved plus probable RLI was 16.11 at year-end 2008, compared with 15.81 at year-end 2007.
Petro-Canada’s overall objective is to replace proved plus probable reserves on a rolling five-year basis. Petro-Canada’s proved plus probable reserves replacement on a consolidated basis was 149%1 over the last five years.
Further detail on Petro-Canada’s reserves and the basis for their estimation is provided in the Management’s Discussion and Analysis (MD&A) for the three months and year ended December 31, 2008.
1 | Reserves replacement and RLI are non-standardized measures and may not be comparable to similar measures of other companies. They are illustrative only. For purposes of these calculations, Petro-Canada has added together data from its oil and gas activities, and oil sands mining activities. Reserves replacement percentage is calculated by dividing the change in reserves for the period stated, before deducting production, by the total production for the same period. |
DOWNSTREAM
| | | Three months ended December 31, | | | Year ended December 31, | |
| (millions of Canadian dollars) | | 2008 | | | 2007 | | | 2008 | | | 2007 | |
| Net earnings (loss) | | $ | (457 | ) | | $ | 81 | | | $ | – | | | $ | 629 | |
| Gain on sale of assets | | | 2 | | | | 1 | | | | 4 | | | | 7 | |
| Insurance premium recoveries (surcharges) | | | (8 | ) | | | 2 | | | | (8 | ) | | | 2 | |
Downstream estimated current cost of supply adjustment 1 | | | (549 | ) | | | – | | | | (255 | ) | | | – | |
| Income tax adjustments | | | – | | | | 28 | | | | 2 | | | | 34 | |
| Operating earnings | | $ | 98 | | | $ | 50 | | | $ | 257 | | | $ | 586 | |
| Cash flow from (used in) operating activities before changes in non-cash working capital | | $ | (294 | ) | | $ | 88 | | | $ | 558 | | | $ | 948 | |
| 1 | On January 1, 2008, the Company adopted CICA Section 3031, Inventories, and now assigns costs for its crude oil and refined petroleum products inventories on a FIFO basis whereas, previously, these costs were assigned on a LIFO basis. To facilitate a better understanding of the Company’s Downstream performance, operating earnings for 2008 onward are being presented on an estimated current cost of supply basis, which is a non-GAAP measure (see page 3 NON-GAAP MEASURES). On this basis, cost of sales is determined by estimating the current cost of supply for all volumes sold in the period after making allowance for the estimated tax effect, instead of using a FIFO basis for valuing inventories. Operating earnings calculated on this basis do not represent the application of a LIFO basis of valuing inventories, used prior to 2008, and, therefore, the Downstream estimated current cost of supply adjustment does not have comparatives. |
In the fourth quarter of 2008, the Downstream business contributed $98 million of operating earnings, up from $50 million in the same quarter of 2007.
Refining and Supply recorded fourth quarter 2008 operating earnings of $3 million, down compared with operating earnings of $20 million in the same quarter of 2007. Lower operating earnings reflected four key items discussed in order of impact. First, refinery yields in Edmonton were lower due to the ramp up activity for the RCP. Second, gasoline cracking margins were lower. Third, there were negative inventory impacts as a result of mix, net build in inventory and a net realizable value adjustment at our petrochemical joint venture. Fourth, operating costs increased because of maintenance and repair activity, higher salaries and wages, and planned turnaround costs. These four key items were partially offset by an increase in realized refining margins for lubricants, asphalt and heavy fuel oil, positive foreign exchange impacts, as well as higher distillate cracking margins.
Marketing contributed fourth quarter 2008 operating earnings of $95 million, up significantly compared with $30 million in the same quarter of 2007. In the fourth quarter of 2008, Marketing results reflected higher fuel margins, partially offset by higher operating expenses for product distribution and commissions.
CORPORATE
| Shared Services and Eliminations | | Three months ended December 31, | | | Year ended December 31, | |
| (millions of Canadian dollars) | | 2008 | | | 2007 | | | 2008 | | | 2007 | |
| Net earnings (loss) | | $ | (479 | ) | | $ | 53 | | | $ | (596 | ) | | $ | (6 | ) |
| Foreign currency translation gain (loss) on long-term debt | | | (442 | ) | | | 10 | | | | (606 | ) | | | 208 | |
Stock-based compensation recovery (expense) 1 | | | 15 | | | | 45 | | | | 126 | | | | (54 | ) |
| Income tax adjustments | | | (38 | ) | | | 6 | | | | (18 | ) | | | 5 | |
Purchased crude oil inventory write-downs 2 | | | – | | | | – | | | | 18 | | | | – | |
| Operating loss | | $ | (14 | ) | | $ | (8 | ) | | $ | (116 | ) | | $ | (165 | ) |
| Cash flow from (used in) operating activities before changes in non-cash working capital | | $ | 3 | | | $ | 71 | | | $ | 135 | | | $ | (188 | ) |
| 1 | Reflected the change in the mark-to-market valuation of stock-based compensation. |
| 2 | In the third quarter of 2008, Shared Services and Eliminations recorded a $26 million before-tax ($18 million after-tax) recovery for the write-down of crude oil inventory purchased for line fill for the Edmonton RCP. The recovery recognized the Downstream’s expected future margins from refining this crude oil inventory and selling the refined petroleum products, and partially offsets write-downs of $38 million before-tax ($26 million after-tax) recorded in Oil Sands. |
Shared Services and Eliminations recorded an operating loss of $14 million in the fourth quarter of 2008, compared with a loss of $8 million for the same period in 2007. The increase in operating loss was due to higher interest expense and lower foreign exchange gains from transacting in U.S. dollars during the fourth quarter of 2008, partially offset by the realization of profits on inter-segment sales of crude oil previously eliminated.
The Company’s financial capacity and flexibility remain strong despite the recent turmoil in the financial markets. This is due to Petro-Canada’s ability to generate cash flow, having access to existing cash balances and significant credit facility capacity, and requiring no near-term refinancing. For 2009, the Company expects to cover its capital program with cash flow and, if necessary, from cash balances and available credit facilities. The Company will monitor energy and financial markets through the year and take advantage of the flexibility in its capital program to pace projects and adjust capital expenditures as necessary.
Petro-Canada is one of Canada’s largest oil and gas companies, operating in both the upstream and downstream sectors of the industry in Canada and internationally. The Company creates value by responsibly developing energy resources and providing world class petroleum products and services. Petro-Canada is proud to be a National Partner to the Vancouver 2010 Olympic and Paralympic Winter Games. Petro-Canada’s common shares trade on the Toronto Stock Exchange (TSX) under the symbol PCA and on the New York Stock Exchange (NYSE) under the symbol PCZ.
The full text of Petro-Canada's fourth quarter release, including MD&A, can be accessed on Petro-Canada's website at http://www.petro-canada.ca/en/investors/845.aspx and will be available through SEDAR at http://www.sedar.com.
Petro-Canada will hold a conference call to discuss these results with investors on Thursday, January 29, 2009 at 9:00 a.m. eastern standard time (EST). To participate, please call 1-866-898-9626 (toll-free in North America), 00-800-8989-6323 (toll-free internationally), or 416-340-2216 at 8:55 a.m. EST. Media are invited to listen to the call by dialing 1-866-540-8136 (toll-free in North America) or 416-340-8010. Media are invited to ask questions at the end of the call. A live audio broadcast of the conference call will be available on Petro-Canada's website at http://www.petro-canada.ca/en/investors/845.aspx on January 29, 2009 at 9:00 a.m. EST. Those who are unable to listen to the call live may listen to a recording of the call on Petro-Canada’s website approximately one hour after its completion by dialing 1-800-408-3053 (toll-free in North America) or 416-695-5800 (pass code number 3278221#).
LEGAL NOTICE – FORWARD-LOOKING INFORMATION
This news release contains forward-looking information. You can usually identify this information by such words as "plan," "anticipate," "forecast," "believe," "target," "intend," "expect," "estimate," "budget", or other terms that suggest future outcomes or references to outlooks. Listed below are examples of references to forward-looking information:
· business strategies and goals · future investment decisions · outlook (including operational updates and strategic milestones) · future capital, exploration and other expenditures · future cash flows · future resource purchases and sales · construction and repair activities · turnarounds at refineries and other facilities · anticipated refining margins · future oil and natural gas production levels and the sources of their growth · project development, and expansion schedules and results · future exploration activities and results, and dates by which certain areas may be developed or come on-stream | · retail throughputs · pre-production and operating costs · reserves and resources estimates · royalties and taxes payable · production life-of-field estimates · natural gas export capacity · future financing and capital activities (including purchases of Petro-Canada common shares under the Company's normal course issuer bid (NCIB) program) · contingent liabilities (including potential exposure to losses related to retail licensee agreements) · environmental matters · future regulatory approvals · expected rates of return |
Such forward-looking information is subject to known and unknown risks and uncertainties. Other factors may cause actual results, levels of activity and achievements to differ materially from those expressed or implied by such information. Such factors include, but are not limited to:
· industry capacity · imprecise reserves estimates of recoverable quantities of oil, natural gas and liquids from resource plays, and other sources not currently classified as reserves · the effects of weather and climate conditions · the results of exploration and development drilling, and related activities · the ability of suppliers to meet commitments · decisions or approvals from administrative tribunals · risks associated with domestic and international oil and natural gas operations · general economic, market and business conditions | · competitive action by other companies · fluctuations in oil and natural gas prices · refining and marketing margins · the ability to produce and transport crude oil and natural gas to markets · fluctuations in interest rates and foreign currency exchange rates · actions by governmental authorities (including changes in taxes, royalty rates and resource-use strategies) · changes in environmental and other regulations · international political events · nature and scope of actions by stakeholders and/or the general public |
Many of these and other similar factors are beyond the control of Petro-Canada. Petro-Canada discusses these factors in greater detail in filings with the Canadian provincial securities commissions and the SEC.
Readers are cautioned that this list of important factors affecting forward-looking information is not exhaustive. Furthermore, the forward-looking information in this news release is made as of January 29, 2009 and, except as required by applicable law, will not be publicly updated or revised. This cautionary statement expressly qualifies the forward-looking information in this news release.
Petro-Canada disclosure of reserves
Petro-Canada's qualified reserves evaluators prepare the reserves estimates the Company uses. The Canadian provincial securities commissions do not consider Petro-Canada’s reserves staff and management as independent of the Company. Petro-Canada has obtained an exemption from certain Canadian reserves disclosure requirements that allows Petro-Canada to make disclosure in accordance with SEC standards where noted in this news release. This exemption allows comparisons with U.S. and other international issuers.
As a result, Petro-Canada formally discloses its proved reserves data using U.S. requirements and practices, and these may differ from Canadian domestic standards and practices. The use of the terms such as "probable," "possible,” “resources” and “life-of-field production” in this news release does not meet the SEC guidelines for SEC filings. To disclose reserves in SEC filings, oil and natural gas companies must prove they are economically and legally producible under existing economic and operating conditions. Note that when the term barrel of oil equivalent (boe) is used in this news release, it may be misleading, particularly if used in isolation. A boe conversion ratio of six Mcf to one bbl is based on an energy equivalency conversion method. This method primarily applies at the burner tip and does not represent a value equivalency at the wellhead.
The table below describes the industry definitions that Petro-Canada currently uses:
| Definitions Petro-Canada uses | Reference |
| | |
| Proved oil and natural gas reserves (includes both proved developed and proved undeveloped) | SEC reserves definition (Accounting Rules Regulation S-X 210.4-10, U.S. Financial Accounting Standards Board (FASB) Statement No. 69) SEC Guide 7 for Oil sands Mining |
| | |
| Unproved reserves, probable and possible reserves | Canadian Securities Administrators: Canadian Oil and Gas Evaluation (COGE) Handbook, Vol. 1 Section 5 prepared by the Society of Petroleum Evaluation Engineers (SPEE) and the Canadian Institute of Mining Metallurgy and Petroleum (CIM) |
| | |
| Contingent and Prospective Resources | Petroleum Resources Management System: Society of Petroleum Engineers, SPEE, World Petroleum Congress and American Association of Petroleum Geologist definitions (approved March 2007) Canadian Securities Administrators: COGE Handbook Vol. 1 Section 5 |
Although the Society of Petroleum Engineers resource classification has categories of 1C, 2C, 3C for Contingent Resources, and low, best and high estimates for Prospective Resources, Petro-Canada will only refer to the 2C for Contingent Resources and the risked (an assessment of the probability of discovering the resources) best estimate for Prospective Resources when referencing resources in this news release. Canadian Oil Sands represents approximately 68% of Petro-Canada’s total for Contingent and Prospective Resources. The balance of Petro-Canada’s resources is spread out across the business, most notably in the North American frontier and International areas. Also, when Petro-Canada references resources for the Company, Contingent Resources are approximately 70% and risked Prospective Resources are approximately 30% of the Company’s total resources.
Cautionary statement: In the case of discovered resources or a subcategory of discovered resources other than reserves, there is no certainty that it will be commercially viable to produce any portion of the resources. In the case of undiscovered resources or a subcategory of undiscovered resources, there is no certainty that any portion of the resources will be discovered. If discovered, there is no certainty that it will be commercially viable to produce any portion of the resources.
For movement of resources to reserves categories, all projects must have an economic depletion plan and may require
| · | additional delineation drilling and/or new technology for oil sands mining, in situ and conventional Contingent and risked Prospective Resources prior to project sanction and regulatory approvals; and |
| · | exploration success with respect to conventional risked Prospective Resources prior to project sanction and regulatory approvals. |
Reserves and resources information contained in this news release is as at December 31, 2008.
For more information, please contact:
| INVESTOR AND ANALYST INQUIRIES | MEDIA AND GENERAL INQUIRIES |
| | |
Ken Hall Investor Relations 403-296-7859 email: investor@petro-canada.ca | Andrea Ranson Corporate Communications 403-296-4610 email: corpcomm@petro-canada.ca |
| | |
Lisa McMahon Investor Relations 403-296-3764 email: investor@petro-canada.ca | |
| | |
| www.petro-canada.ca |