QuickLinks -- Click here to rapidly navigate through this document
Exhibit 99.5
| Legal Notice – Forward-Looking Information | 1 |
| About Petro-Canada | 3 |
| Message from the President | 4 |
| Management's Discussion and Analysis | 6 |
| | Business Environment | 6 |
| | | | Business Environment in 2007 | 7 |
| | | | Competitive Conditions | 8 |
| | | | Outlook for Business Environment in 2008 | 8 |
| | | | Economic Sensitivities | 9 |
| | Business Strategy | 10 |
| | | | Value Proposition and Strategy | 10 |
| | | | Execution of the Strategy in 2007 | 10 |
| | | | Improving Base Business Profitability | 10 |
| | | | Long-Term Profitable Growth | 11 |
| | | | Following our Principles for Responsible Investment and Operations | 13 |
| | | | Business Strategy Looking Forward | 16 |
| | Risk Management | 17 |
| | Consolidated Financial Results | 21 |
| | | | Analysis of Consolidated Earnings and Cash Flow | 21 |
| | | | Consolidated Financial Results | 21 |
| | | | Quarterly Information | 22 |
| | Liquidity and Capital Resources | 23 |
| | | | Operating Activities | 24 |
| | | | Investing Activities | 24 |
| | | | Financing Activities and Dividends | 25 |
| | Upstream | 27 |
| | | | North American Natural Gas | 27 |
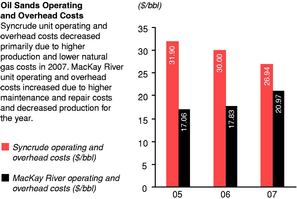
| | | | Oil Sands | 31 |
| | | | International & Offshore | 36 |
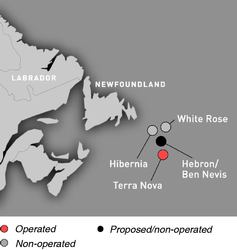
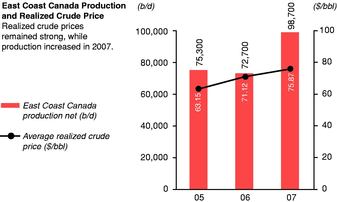
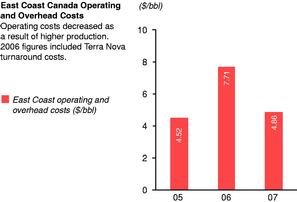
| | | | | | East Coast Canada | 36 |
| | | | | | International | 41 |
| | | | Upstream Production | 48 |
| | | | Reserves Summary | 50 |
| | | | Downstream | 52 |
| | | | Shared Services | 57 |
| | | | Financial Reporting | 58 |
| Management, Audit, Finance and Risk Committee, and Auditor Reports | 61 |
| Consolidated Financial Statements and Notes | 65 |
| Reserves of Crude Oil, Natural Gas Liquids, Natural Gas, Bitumen and Synthetic Crude Oil | 100 |
| Quarterly Financial and Stock Trading Information | 105 |
| Three-Year Financial and Operating Summary | 107 |
| Investor Information | 111 |
| Glossary of Terms and Ratios | 112 |
Cover Design: Bhandari & Plater Inc.; Inside: Platinum Creative Solutions Inc.; Photography: James Labounty; Cover photos (employees and their business units from left to right): Hubert Hu, East Coast Canada; Jennifer Young, North American Natural Gas; Kim James, Oil Sands; David Kennedy, North American Natural Gas; Nicole Simon-Thompson, International
This report was printed on paper that is acid-free and recyclable. Inks are based on linseed oil and contain no heavy metals. The printing process was alcohol-free. Volatile organic compounds associated with printing were reduced by 50% to 75% from the levels that would have been produced using traditional inks and processes.
| Legal Notice – Forward-Looking Information |
|
This annual report contains forward-looking information. You can usually identify this information by such words as "plan," "anticipate," "forecast," "believe," "target," "intend," "expect," "estimate," "budget " or other terms that suggest future outcomes or references to outlooks. Listed below are examples of references to forward-looking information:
- •
- business strategies and goals
- •
- future investment decisions
- •
- outlook (including operational updates and strategic milestones)
- •
- future capital, exploration and other expenditures
- •
- future cash flows
- •
- future resource purchases and sales
- •
- construction and repair activities
- •
- turnarounds at refineries and other facilities
- •
- anticipated refining margins
- •
- future oil and natural gas production levels and the sources of their growth
- •
- project development, and expansion schedules and results
- •
- future exploration activities and results, and dates by which certain areas may be developed or come on-stream
- •
- retail throughputs
- •
- pre-production and operating costs
- •
- reserves and resources estimates
- •
- royalties and taxes payable
- •
- production life-of-field estimates
- •
- natural gas export capacity
- •
- future financing and capital activities (including purchases of Petro-Canada common shares under the Company's normal course issuer bid (NCIB) program)
- •
- contingent liabilities (including potential exposure to losses related to retail licensee agreements)
- •
- environmental matters
- •
- future regulatory approvals
- •
- expected rates of return
Such forward-looking information is subject to known and unknown risks and uncertainties. Other factors may cause actual results, levels of activity and achievements to differ materially from those expressed or implied by such information. Such factors include, but are not limited to:
- •
- industry capacity
- •
- imprecise reserves estimates of recoverable quantities of oil, natural gas and liquids from resource plays, and other sources not currently classified as reserves
- •
- the effects of weather and climate conditions
- •
- the results of exploration and development drilling, and related activities
- •
- the ability of suppliers to meet commitments
- •
- decisions or approvals from administrative tribunals
- •
- risks associated with domestic and international oil and natural gas operations
- •
- general economic, market and business conditions
- •
- competitive action by other companies
- •
- fluctuations in oil and natural gas prices
- •
- refining and marketing margins
- •
- the ability to produce and transport crude oil and natural gas to markets
- •
- fluctuations in interest rates and foreign currency exchange rates
- •
- actions by governmental authorities (including changes in taxes, royalty rates and resource-use strategies)
- •
- changes in environmental and other regulations
- •
- international political events
- •
- nature and scope of actions by stakeholders and/or the general public
Many of these and other similar factors are beyond the control of Petro-Canada. Petro-Canada discusses these factors in greater detail in filings with the Canadian provincial securities commissions and the United States (U.S.) Securities and Exchange Commission (SEC).
Readers are cautioned that this list of important factors affecting forward-looking information is not exhaustive. Furthermore, the forward-looking information in this annual report is made as of February 29, 2008 and, except as required by applicable law, will not be publicly updated or revised. This cautionary statement expressly qualifies the forward-looking information in this annual report.
2007 Annual Report PETRO-CANADA 1
Petro-Canada disclosure of reserves
Petro-Canada's qualified reserves evaluators prepare the reserves estimates the Company uses. The Canadian provincial securities commissions do not consider Petro-Canada's reserves staff and management as independent of the Company. Petro-Canada has obtained an exemption from certain Canadian reserves disclosure requirements that allows Petro-Canada to make disclosure in accordance with SEC standards where noted in this annual report. This exemption allows comparisons with U.S. and other international issuers.
As a result, Petro-Canada formally discloses its proved reserves data using U.S. requirements and practices, and these may differ from Canadian domestic standards and practices. The use of the terms such as "probable," "possible," "resources" and "life-of-field production" in this annual report does not meet the SEC guidelines for SEC filings. To disclose reserves in SEC filings, oil and gas companies must prove they are economically and legally producible under existing economic and operating conditions. Note that when the term barrels of oil equivalent (boe) is used in this annual report, it may be misleading, particularly if used in isolation. A boe conversion ratio of six thousand cubic feet (Mcf) to one barrel (bbl) is based on an energy equivalency conversion method. This method primarily applies at the burner tip and does not represent a value equivalency at the wellhead. The table below describes the industry definitions that Petro-Canada currently uses:
|
Definitions Petro-Canada uses
| | Reference
|
|---|
|
|
|
Proved oil and natural gas reserves (includes both proved developed and proved undeveloped) |
|
SEC reserves definition (Accounting Rules Regulation S-X 210.4-10, U.S. Financial Accounting Standards Board (FASB) Statement No. 69)
SEC Guide 7 for Oilsands Mining |
Unproved reserves, probable and possible reserves |
|
Canadian Securities Administrators: Canadian Oil and Gas Evaluation (COGE) Handbook, Vol. 1 Section 5 prepared by the Society of Petroleum Evaluation Engineers (SPEE) and the Canadian Institute of Mining Metallurgy and Petroleum (CIM) |
Contingent and Prospective Resources |
|
Petroleum Resources Management System: Society of Petroleum Engineers, SPEE, World Petroleum Congress and American Association of Petroleum Geologist definitions (approved March 2007)
Canadian Securities Administrators: COGE Handbook Vol. 1 Section 5 |
|
Although the Society of Petroleum Engineers resource classification has categories of 1C, 2C, 3C for Contingent Resources, and low, best and high estimates for Prospective Resources, Petro-Canada will only refer to the 2C for Contingent Resources and the risked (an assessment of the probability of discovering the resources) best estimate for Prospective Resources when referencing resources in this annual report. Canadian Oil Sands represents approximately 71% of Petro-Canada's total for Contingent and Prospective Resources. The balance of Petro-Canada's resources is spread out across the business, most notably in the North American frontier and International areas. Also, when Petro-Canada references resources for the Company, Contingent Resources are approximately 53% and risked Prospective Resources are approximately 47% of the Company's total resources.
Cautionary statement: In the case of discovered resources or a subcategory of discovered resources other than reserves, there is no certainty that it will be commercially viable to produce any portion of the resources. In the case of undiscovered resources or a subcategory of undiscovered resources, there is no certainty that any portion of the resources will be discovered. If discovered, there is no certainty that it will be commercially viable to produce any portion of the resources.
For movement of resources to reserves categories, all projects must have an economic depletion plan and may require
- •
- additional delineation drilling and/or new technology for oil sands mining,in situ and conventional Contingent and risked Prospective Resources prior to project sanction and regulatory approvals; and
- •
- exploration success with respect to conventional risked Prospective Resources prior to project sanction and regulatory approvals.
Reserves and resources information contained in this annual report is as at December 31, 2007.
2 PETRO-CANADA 2007 Annual Report
Petro-Canada is one of Canada's largest oil and gas companies, operating in both the upstream and the downstream sectors of the industry in Canada and internationally. The Company creates value by responsibly developing energy resources and providing world class petroleum products and services. Petro-Canada is proud to be a National Partner to the Vancouver 2010 Olympic and Paralympic Winter Games. Petro-Canada's common shares trade on the Toronto Stock Exchange (TSX) under the symbol PCA and on the New York Stock Exchange (NYSE) under the symbol PCZ.
With a market capitalization of approximately $22.1 billion1, Petro-Canada is a mid-sized energy company. Our roots are in Canada, a country rich in resources and part of the large and growing North American market.
In 2007, we continued to execute our strategy by building a diversified portfolio, both in Canada and internationally, and by advancing our major growth projects while strengthening the safety, reliability and efficiency of our operations. Our focus on pursuing future profitable growth while running the base business profitably led to the 2007 annual report theme "Opportunities Tomorrow. Performance Today."
This annual report provides details of Petro-Canada's operational and financial capabilities. The Report to the Community, which the Company will publish mid-2008, will elaborate on Petro-Canada's commitment to corporate responsibility objectives and performance.
Financial and Operating Highlights
The reserves information in the following table does not conform to SEC standards and is for supplemental general information.2
| | 2007
| | 2006
| | 2005
| | 2004
| | 2003
|
|---|
|
| Net earnings from continuing operations($ millions) | | 2,733 | | 1,588 | | 1,693 | | 1,698 | | 1,535 |
| Cash flow from continuing operating activities($ millions) 1 | | 3,339 | | 3,608 | | 3,783 | | 3,928 | | 2,896 |
| Expenditures on property, plant and equipment and exploration from continuing operations($ millions) | | 3,988 | | 3,434 | | 3,560 | | 3,893 | | 2,142 |
| Debt-to-debt plus equity(%) 2 | | 22.5 | | 21.7 | | 23.5 | | 22.8 | | 22.7 |
| Debt-to-cash flow from continuing operating activities(times) | | 1.0 | | 0.8 | | 0.8 | | 0.8 | | 0.7 |
| Operating return on capital employed(%) 2 | | 18.9 | | 15.0 | | 19.8 | | 18.8 | | 16.1 |
Upstream proved reserves before royalties
(millions of barrels of oil equivalent – MMboe) 3 | | 1,315 | | 1,274 | | 1,232 | | 1,213 | | 1,220 |
|
- 1
- Cash flow from continuing operating activities in 2007 was reduced by the payment of $1,145 million after-tax to settle the Buzzard derivative contracts.
- 2
- Includes results from discontinued operations.
- 3
- Oil Sands mining activities have been included in these proved reserves totals.
- 1
- As of February 14, 2008.
- 2
- The reporting of working interest reserves before royalty, MMboe and combining oil and gas and oil sands mining activities together does not conform to SEC standards.
2007 Annual Report PETRO-CANADA 3
| Message from the President |
|
Petro-Canada is entering a period of unprecedented growth. And we're ready for it.
Our focus has been and continues to be pursuing future profitable growth, while maintaining safe, reliable and efficient day-to-day operations. The strategic path that we are on led to this year's annual report theme "Opportunities Tomorrow. Performance Today."
At the beginning of last year, we set two key objectives for ourselves – to increase upstream production by 15% and to advance five major projects. Through a focus on execution, we surpassed our production target, achieving a 21% increase in upstream production in 2007. This was in no small part due to the fact that we operated our facilities safely and reliably.
While I'm proud that our total recordable injury frequency was first quartile, we were reminded that we must continue to be vigilant about our safety performance. I am sad to report that we had two contractor fatalities during the year. We take these tragedies very seriously and we remain committed to achieving our goal of Zero-Harm.
From an operational perspective, our facilities ran reliably last year, contributing to our strong production growth. Western Canada natural gas processing facilities operated at reliability rates of 99%. Terra Nova performance significantly improved, coming in at 86%. This was a strong performance, given the facility's design capacity. The one facility that came in below expectations was our Oil Sands' MacKay Riverin situ operations with reliability of 87%. However, with the mechanical upgrades we made in 2007, I believe we can get this facility back on track. In the Downstream, our two refineries and lubricants plant had a combined reliability index of 92.
Concerning our second priority, not only did we advance our five major projects over the year, but we grew our portfolio by adding two more (the Libya Concession Development and partner-operated White Rose Extensions) and executing our largest exploration program ever.
In the Downstream, we completed more than 60% of the Edmonton refinery conversion and the project is on track for startup in the fourth quarter of 2008. We also moved closer to making a final investment decision to build a new coker in Montreal.
In the Oil Sands, we began front-end engineering design for our Fort Hills Oil Sands project. In addition, we received final approval of our commercial application for the MacKay River expansion from the Alberta Energy and Utilities Board.
Internationally, we agreed to a deal to further develop our Libya asset base and continued plans to bring natural gas production from our Syria project. Finally, we signed a binding agreement with the Newfoundland and Labrador government and our partner to develop the White Rose Extensions in our East Coast Canada business.
Looking to the future, not only does Petro-Canada have a remarkable resource base of approximately 15 billion barrels of oil equivalent, but we also have solid plans to develop these resources. This plan has already started to unfold through our projects, exploration program and strong operational performance. For 2008, we remain focused on delivering profitable, long-term growth and improving our base business performance.
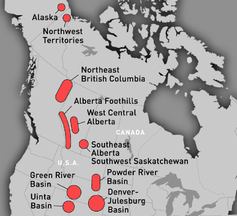
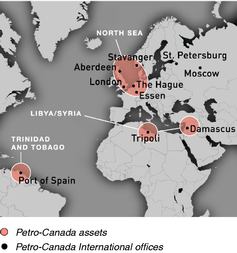
Once again, we have set priorities. From a growth perspective, we are advancing seven major projects. We will also be drilling up to 17 exploration wells in our core areas: the North Sea, Trinidad and Tobago, Libya, the Northwest Territories and the Alaska Foothills.
Operationally, we are focusing on delivering production in line with guidance and operating our facilities safely and reliably. We will continue to aim for first quartile safety performance. From a reliability perspective, we intend to maintain our record established in 2007, with significant improvements targeted at MacKay River.
In the course of advancing our growth projects and striving for first quartile operations, we must never lose sight of our commitment to carry out our business in a responsible and ethical way. We continue to use our Principles for Responsible Investment and Operations to guide our actions in the areas of business conduct, community participation, environmental protection, and working conditions and human rights.
4 PETRO-CANADA Message from the President
In 2007, we made progress in this area on several fronts. For our employees, we enhanced communication of our Business Code of Conduct and training on our Privacy Policies. More than 5,500 employees supported the Code of Conduct by signing an understanding of the Code and more than 3,800 employees were trained on our Privacy Policies. In our International and Offshore business, we provided in-class training on our anti-bribery and corruption policy.
For our communities, we developed policy and guidelines on how to better engage and work with our stakeholders. Through our community partnerships program, we invested nearly $15 million to support community initiatives. Included in this was an investment of more than $2.4 million in educational organizations to support the development of youth. Our Petro-Canada Emerging Leaders Awards Program is now established at five Canadian post-secondary institutions, providing annual awards to top students in studies related to our business needs.
We are also a proud National Partner to the Vancouver 2010 Olympic and Paralympic Games. Our commitment includes support of athletes and coaches through several programs, such as Fuelling Athlete and Coaching Excellence (FACE).
For the environment, we took steps to minimize the impact of our operations. Last year, we reduced our environmental exceedances by more than 30%. Additionally, we strengthened our environmental stewardship, especially concerning the use of water in our operations. First, we signed a Memorandum of Agreement to use treated waste water as industrial process water at the Fort Hills Sturgeon Upgrader. Second, we developed principles for the responsible management of water use across the Company.
And finally, for our future, we continue to build organizational capability. In 2007, we made great strides in the attraction and retention of employees. We hired more than 860 new employees and reduced our attrition rate, continuing to come in below the industry average.
Our proposition for investors continues to be to deliver integrated value from a diverse resource base. Our future is stronger than ever with the high quality suite of long-term opportunities we have assembled. Our commitment is to execute and deliver on these opportunities by focusing on our performance today.
As we move forward into 2008, I am excited about the opportunities our future holds for us. Although no path is without its challenges, I am confident in the abilities of our people and the strength of our strategy to lead us to success.

Ron Brenneman
President and Chief Executive Officer
Message from the President PETRO-CANADA 5
| Management's Discussion and Analysis |
|
This Management's Discussion and Analysis (MD&A), dated effective as of February 14, 2008, should be read in conjunction with the audited Consolidated Financial Statements and Notes for the year ended December 31, 2007, included within this 2007 annual report and the 2007 Annual Information Form (AIF). Financial data have been prepared in accordance with Canadian generally accepted accounting principles (GAAP), unless otherwise specified. All dollar values are Canadian (Cdn) dollars, unless otherwise indicated. All oil and natural gas production and reserves volumes are stated before deduction of royalties, unless otherwise indicated. Graphs accompanying the text portray performance of the Company within its "value drivers," which are the key measures of performance in each segment of Petro-Canada's business. A glossary of financial terms and ratios can be found on page 112 of this report.
BUSINESS ENVIRONMENT
The major economic factors influencing Petro-Canada's upstream financial performance include crude oil and natural gas prices and foreign exchange, particularly the Cdn dollar/U.S. dollar rates. Crude oil and natural gas prices are affected by a number of factors, including supply and demand balance, weather and political events. Factors influencing Downstream financial performance include the level and volatility of crude oil prices, industry refining margins, levels of crude oil price differentials, demand for refined petroleum products, the degree of market competition and foreign exchange, particularly the Cdn dollar/U.S. dollar rates.
Business Environment in 2007
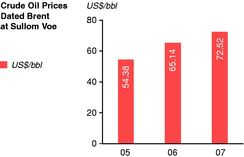
The year 2007 saw the highest oil price on record, with a near doubling of prices. The price of North Sea Brent (Dated Brent) opened the year at lows near $51 US/bbl and closed at a record $96 US/bbl. North American natural gas prices at the Henry Hub were much less volatile, averaging around $7 US/million British thermal units (MMBtu) for most of the year.
On an annual average basis, the price of Dated Brent reached $72.52 US/bbl, the highest annual average ever and almost 11% above the 2006 average. Strong oil prices in 2007 were driven by continued demand growth in China, geopolitical tensions and speculation. In 2007, the international light/heavy crude (Dated Brent/Mexican Maya) price differentials averaged $12.67 US/bbl, narrower than the $13.94 US/bbl posted in 2006. Canadian light/heavy crude (Edmonton Light/Western Canada Select (WCS)) spreads widened in 2007 to $24.07 Cdn/bbl from $22.40 Cdn/bbl in 2006. Canadian heavy crudes sold at a larger discount to light crude prices, compared with international heavy crudes, due to Canadian heavy crude oil production growing at a faster rate than North American investment to convert refineries to process heavy feedstock. |
|
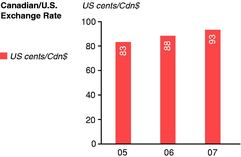 |
The appreciation of the Cdn dollar during 2007 reduced the impact of international prices on Canadian crude oil and natural gas prices. The Cdn dollar averaged 93 cents US in 2007, compared with 88 cents US in 2006.
6 PETRO-CANADA Management's Discussion and Analysis
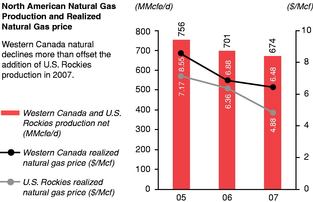
North American natural gas prices were lower in 2007, compared with 2006 due to continuing high levels of natural gas in storage and lower weather-related demand. Henry Hub prices averaged $6.92 US/MMBtu in 2007, 5% lower than in 2006. In 2007, the Canadian natural gas price at the AECO-C hub fell in line with U.S. prices and averaged 5% below its 2006 level.
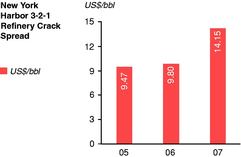
In the downstream sector, in 2007, refined petroleum product sales in Canada increased by about 3%, compared with declines of 1% in the past two years. The positive impact of improved product sales on industry margins during 2007 was partially offset by a stronger Cdn dollar and its impact on cracking margins and crude differentials and narrower international light/heavy crude price differentials. The New York Harbor 3-2-1 crack spread, an indicator of overall refining margins, averaged $14.15 US/bbl in 2007, compared with $9.80 US/bbl in 2006. Logistical bottlenecks associated with the replacement of Methyl Tertiary Butyl Ether (MTBE) with ethanol in gasoline blending in the U.S. and a busy schedule of refinery turnarounds helped to improve gasoline margins in early 2007, compared with 2006. Distillate margins continued to be strong, largely reflecting the penetration of ultra-low sulphur on-road diesel in the market since June 2006. |
|

 |
Commodity Price Indicators and Exchange Rates
(averages for the years indicated) | | | |
2007 | |
2006 | |
2005 |
|
| Crude oil price indicators(per bbl) | | | | | | | | |
| | Dated Brent at Sullom Voe | | US$ | | 72.52 | | 65.14 | | 54.38 |
| | West Texas Intermediate (WTI) at Cushing | | US$ | | 72.31 | | 66.22 | | 56.56 |
| | WTI/Dated Brent price differential | | US$ | | (0.21 | ) | 1.08 | | 2.18 |
| | Dated Brent/Mexican Maya price differential | | US$ | | 12.67 | | 13.94 | | 13.52 |
| | Edmonton Light | | Cdn$ | | 76.84 | | 73.23 | | 69.22 |
| | Edmonton Light/WCS (heavy) price differential | | Cdn$ | | 24.07 | | 22.40 | | 25.27 |
| Natural gas price indicators | | | | | | | | |
| | Henry Hub(per MMBtu) | | US$ | | 6.92 | | 7.26 | | 8.55 |
| | AECO-C spot(per Mcf) | | Cdn$ | | 6.89 | | 7.28 | | 8.84 |
| | Henry Hub/AECO basis differential(per MMBtu) | | US$ | | 0.80 | | 1.09 | | 1.53 |
| New York Harbor 3-2-1 refinery crack spread(per bbl)1 | | US$ | | 14.15 | | 9.80 | | 9.47 |
| US$/Cdn$ exchange rate | | US$ | | 0.93 | | 0.88 | | 0.83 |
|
- 1
- On January 1, 2007, the New York Harbor 3-2-1 crack spread calculation changed. It is now based on Reformulated Gasoline Blendstock for Oxygenate Blending (RBOB) gasoline (the base for blending gasoline with 10% denatured ethanol) as opposed to conventional gasoline. Due to this change in specification, the 2007 crack spread values are not directly comparable to 2005 or 2006 values.
Competitive Conditions
It is increasingly challenging for the energy sector to find new sources of oil and natural gas. Petro-Canada is well positioned to successfully increase production of oil and natural gas and compete for new opportunities that could complement existing upstream resources. The Company has an estimated 15 billion boe of resources from which to develop new production, with approximately 71% of the resources located in Alberta's oil sands. With upstream business operations in Canada and internationally, the Company has the flexibility to pursue a wide range of opportunities. While the Company has significant operational scope, as measured by production levels, it remains a mid-sized global company. This means Petro-Canada has the operational capability and balance
Management's Discussion and Analysis PETRO-CANADA 7
sheet strength to invest in large projects, but smaller investments can also have a meaningful impact on the Company's production levels and financial returns.
Petro-Canada is well positioned to compete in the petroleum product refining and marketing business in Canada. The Company accounts for 13% of the total refining capacity and has a 16% share of the petroleum products market in Canada. With a network of more than 1,300 retail service stations, Petro-Canada has the highest gasoline sales per site in Canada among national integrated oil companies. The Company also has Canada's largest commercial road transport network, with 229 locations, as well as a robust bulk fuel sales channel.
The Company's strong financial position, track record of successfully executing large capital projects and depth of management experience should enable it to continue to compete effectively in the current business environment.
Outlook for Business Environment in 2008
Prices for energy commodities are expected to remain volatile in 2008, reflecting the unpredictable nature of weather, the level of industry inventories, and political, fiscal and natural developments. 2008 is expected to be a challenging year for the petroleum industry worldwide. Concern about the risk of a U.S. recession spreading to other regions of the world has put a lid on potential further increases in international oil prices. For the first time in several years, questions are being raised about the ability of China to maintain both the extraordinary economic and oil demand growth rates, which have been sustaining the oil price increases of recent years, should its key export markets go into economic decline. Also clouding the 2008 outlook is the continuing rise of nationalism in key resource-rich countries, aggravated by the tightening of fiscal and royalty regimes in countries both inside and outside of the Organization of the Petroleum Exporting Countries (OPEC).
Demand for natural gas would remain challenged in 2008 should a recession take hold in North America. Notwithstanding the fact that, with the exception of coal, natural gas during 2007 was the cheapest of all fuels available for industrial and power generation applications. The 2007-08 heating season demand for the fuel is anticipated to improve relative to the 2006-07 heating season due to colder temperatures. Concern about faltering production growth in North America, especially in Canada, and the lack of competitive prices to attract liquefied natural gas (LNG) supplies will temper any downward price pressures arising from softer demand.
Barring refinery mishaps or accidents of nature, 2008 refining margins in the downstream are expected to be weaker than in 2007. A North American recession would also serve to dampen refined product demand growth. Lower anticipated light crude oil price levels in 2008 are also likely to compress current light/heavy crude price differentials and negatively affect refining margins in 2008.
Finally, we expect a continuation of Cdn dollar strength during 2008. A strong dollar will continue to erode gains as a result of any strength in commodity prices.
8 PETRO-CANADA Management's Discussion and Analysis
Economic Sensitivities
The following table illustrates the estimated after-tax effects that changes in certain factors would have had on Petro-Canada's 2007 net earnings from continuing operations had these changes occurred.
Sensitivities Affecting Net Earnings
| Factor1,2 | | | Change (+) | | | Annual Net Earnings Impact | | | Annual Net Earnings Impact | |
| |
| | | | (millions of
Canadian dollars |
) | | ($/share) 3 | |
| Upstream | | | | | | | | | | |
| Price received for crude oil and liquids4 | | $ | 1.00/bbl | | $ | 52 | | $ | 0.11 | |
| Price received for natural gas | | $ | 0.25/Mcf | | | 30 | | | 0.06 | |
| Exchange rate: US$/Cdn$ refers to impact on upstream earnings from continuing operations5 | | $ | 0.01 | | | (40 | ) | | (0.08 | ) |
| Crude oil and liquids production(barrels/day – b/d) | | | 1,000 b/d | | | 10 | | | 0.02 | |
| Natural gas production(million cubic feet/day – MMcf/d) | | | 10 MMcf/d | | | 7 | | | 0.01 | |
| |
| Downstream | | | | | | | | | | |
| New York Harbor 3-2-1 crack spread6 | | $ | 1.00 US/bbl | | | 22 | | | 0.05 | |
| Chicago 3-2-1 crack spread | | $ | 1.00 US/bbl | | | 24 | | | 0.05 | |
| Seattle 3-2-1 crack spread | | $ | 1.00 US/bbl | | | 7 | | | 0.01 | |
| Dated Brent/Maya FOB price differential | | $ | 1.00 US/bbl | | | 6 | | | 0.01 | |
| Edmonton Light/Synthetic price differential | | $ | 1.00 Cdn/bbl | | | 13 | | | 0.03 | |
| Exchange rate: US$/Cdn$ refers to impact on downstream cracking margins and crude price differentials7 | | $ | 0.01 | | | (11 | ) | | (0.02 | ) |
| |
| Corporate | | | | | | | | | | |
| Exchange rate: US$/Cdn$ refers to impact of the revaluation of U.S. dollar-denominated, long-term debt8 | | $ | 0.01 | | $ | 10 | | $ | 0.02 | |
| |
- 1
- The impact of a change in one factor may be compounded or offset by changes in other factors. This table does not consider the impact of any inter-relationship among the factors.
- 2
- The impact of these factors is illustrative.
- 3
- Per share amounts are based on the number of shares outstanding at December 31, 2007.
- 4
- This sensitivity is based upon an equivalent change in the price of WTI and Dated Brent, excluding the derivative contracts associated with the Buzzard acquisition that were closed out in the fourth quarter of 2007.
- 5
- A strengthening Cdn dollar compared with the U.S. dollar has a negative effect on upstream earnings from continuing operations.
- 6
- On January 1, 2007, the New York Harbor 3-2-1 crack spread calculation changed. It is now based on RBOB gasoline (the base for blending gasoline with 10% denatured ethanol) as opposed to conventional gasoline. Due to this change in specification, the 2007 crack spread values are not directly comparable to 2006 values.
- 7
- A strengthening Cdn dollar compared with the U.S. dollar has a negative effect on downstream cracking margins and crude price differentials.
- 8
- A strengthening Cdn dollar versus the U.S. dollar has a positive effect on corporate earnings because the Company holds U.S. dollar denominated debt. The impact refers to gains or losses on $1.4 billion US of the Company's U.S. dollar denominated long-term debt and interest costs on U.S. dollar denominated debt. Gains or losses on $1.1 billion US of the Company's U.S. dollar denominated long-term debt, associated with the self-sustaining International business segment and the U.S. Rockies operations included in the North American Natural Gas business segment, are deferred and included as part of shareholders' equity.
Management's Discussion and Analysis PETRO-CANADA 9
BUSINESS STRATEGY
Value Proposition and Strategy
The value proposition Petro-Canada offers to its investors can best be summarized as "Integrated Value from a Diversified Resource Base." The Company's business strategy continues to be:
- •
- taking a disciplined approach to profitable growth
- .
- leveraging existing assets
- .
- accessing new opportunities with a focus on long-life assets
- .
- building a balanced exploration program
- •
- improving the profitability of the base business
- .
- meeting annual production guidance
- .
- selecting the right assets to develop and then driving for first quartile performance1
The Company believes its structure and scope strategically position Petro-Canada to deliver long-term shareholder value. With a base in Canada, Petro-Canada is situated in a stable, resource-rich and demand-driven market. An ever-increasing international presence and integration across businesses provide the Company access to more value-adding growth opportunities and an ability to better manage risk through having a diversified portfolio. As a mid-sized global company, even smaller sized investments can have a material impact. The Company remains committed to developing energy resources responsibly and providing growth opportunities for employees.
Execution of the Strategy in 2007
Improving Base Business Profitability
For 2007, Petro-Canada focused on two areas to deliver improved base business profitability – increasing upstream production by 15% compared with 2006, and continuing to improve our safety and reliability performance while prudently managing costs. Safety, reliability and cost management are measures that are constantly tracked, reported and improved upon.
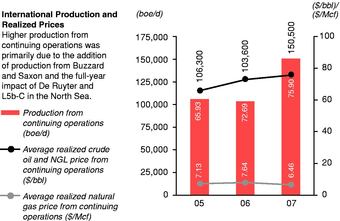
Through a focus on execution, the Company achieved a 21% increase in upstream production from continuing operations in 2007. This strong production growth was largely due to the successful startup of the partner-operated Buzzard facility, full-year production from Syncrude Stage III and White Rose and improved reliability at key operated facilities.
Western Canada natural gas processing facilities operated at reliability rates of 99%. The two Downstream refineries and lubricants plant had a combined reliability index of 92. Terra Nova significantly improved its facility reliability, operating at 86% in 2007. The facility that did not meet expectations was the Oil Sands' MacKay Riverin situ operation with reliability of 87%. The Company has a continued focus to improve facility reliability in 2008.
Corporate-wide, Petro-Canada views safety as an indicator of operational excellence. The Company has a Zero-Harm philosophy. This means that the Company believes that work-related injuries and illnesses are foreseeable and preventable. The Company is committed to maintaining a first quartile safety record. In 2007, Petro-Canada achieved a Total Recordable Injury Frequency of 0.86, a slight increase over the previous year, but still one of the best safety records in the sector.
Managing costs is another key to improving base business profitability. Efforts are constantly made across the Company to responsibly manage expenses and improve efficiencies.
- 1
- References to first quartile operations in this report do not refer to industry-wide benchmarks or externally known measures. The Company has a variety of internal metrics that define and track first quartile operational performance.
10 PETRO-CANADA Management's Discussion and Analysis
Maintaining Financial Discipline and Flexibility
| PRIORITY | | 2007 GOALS | | 2007 RESULTS | | 2008 GOALS |
|
| Fund Capital Expenditures with Cash Flow and Debt As Required | | • fund $4.1 billion capital expenditure program from expected cash flow, cash on hand and accessing balance sheet strength, as needed
• manage operating and capital costs within budgets
• maintain investment grade credit ratings | | • funded 2007 expenditure program out of a combination of cash flow and cash on hand
• 2007 operating and capital costs were in line with budget
• maintained investment grade credit ratings of Baa2 from Moody's Investors Service, BBB from Standard & Poor's (S&P) and A (low) from Dominion Bond Rating Service | | • fund $5.3 billion capital expenditure program through a combination of cash flow and access capital markets, as needed
• prioritize execution of projects
• maintain investment grade credit ratings |
|
| Fund Profitable Growth | | • invest in additional growth opportunities when there is a strong business case | | • extended Libya concessions and increased Fort Hills ownership by 5%
• finished 2007 strong, with debt levels at 22.5% of total capital and a ratio of debt-to-cash flow from continuing operating activities of 1.0 times
• settled Buzzard derivative contracts for $1,145 million after-tax | | • identify and invest in long-life assets |
|
| Return Cash to Shareholders | | • buy back shares when appropriate, although likely at lower levels than 2006
• regularly review the dividend strategy to align with financial and growth objectives, and shareholder expectations | | • renewed NCIB program in June 2007, entitling the Company to purchase up to 5% of the outstanding common shares, subject to certain conditions
• purchased 16 million common shares at an average price of $52.42/share for a total cost of $839 million
• increased quarterly dividend by 30% to $0.13/share, effective April 1, 2007 | | • regularly review the dividend strategy to align with financial and growth objectives, and shareholder expectations
• buy back shares when appropriate, with priority to first fund profitable growth |
|
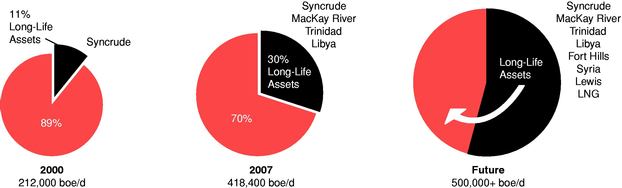
Long-Term Profitable Growth
Adding new material opportunities is fundamental to long-term growth. In 2007, one of Petro-Canada's priorities was to advance its five major growth projects. Highlights included completing 61% of the Edmonton refinery conversion and advancing the Montreal coker project toward a final investment decision. The Company also moved to front-end engineering and design (FEED) on the Fort Hills mining and upgrading project, and received a recommendation of approval from the Energy Resources Conservation Board and Alberta Environment for its regulatory permit for expansion of the MacKay River facility. Internationally, Petro-Canada advanced plans on the Syria Ebla gas project with FEED expected to be completed in early 2008. In addition to advancing these projects, in 2007, the Company added two more growth projects: the Libya Concession Development and partner-operated White Rose Extensions.
In pursuing these growth projects, Petro-Canada is seeking to increase the relative proportion of long-life resources in the portfolio as a means to deliver sustainable cash flow and earnings. In the upstream, we define long-life assets as those projects that have more than 10 years of sustainable production and cash flow. In the Downstream, refineries and gasoline stations share the same characteristic of having a long contributing life. These kinds of assets provide sustainable cash flow and make the Company less dependent on exploration success for growth. It is also efficient to expand long-life assets from existing infrastructure.
Management's Discussion and Analysis PETRO-CANADA 11
Long-Life Production (%)
In 2007, about 30% of Petro-Canada's production came from assets considered long-life. Successful execution of our business strategy will mean a higher proportion of long-life resources in the future.
Along with long-life assets, the Company pursues profitable growth through a balanced exploration program that provides a balanced risk/reward profile and that collectively adds to reserves over time. In 2007, Petro-Canada and its partners executed one of the Company's most significant exploration programs, drilling 15 wells.
Seven of these wells were completed as discoveries. Three wells were shut-in and are awaiting evaluation. Five wells were abandoned as dry holes or non-commercial discoveries and were written off.
At year-end 2007, operations continued on four additional wells.
This table represents exploration in International, East Coast Canada, Alaska and the Northwest Territories (NWT) (does not include Western Canada and U.S. Rockies).
| | |
2007 Results | |
2008 Outlook |
| | |
|
| (number of wells) | | Discoveries –
Oil | | Discoveries –
Natural Gas | | Still Being
Evaluated | | Dry and
Abandoned | | |
|
| North Sea | | 2 | | 2 | | – | | 2 | | 6 |
| Syria | | – | | – | | 1 | | 1 | | – |
| Libya | | 1 | | – | | – | | – | | 3 |
| Trinidad and Tobago | | – | | 2 | | – | | 1 | | 5 |
| Alaska, NWT | | – | | – | | 2 | | 1 | | 3 |
|
| Total | | 3 | | 4 | | 3 | | 5 | | 17 |
|
12 PETRO-CANADA Management's Discussion and Analysis
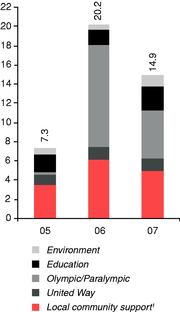
Cash and In-Kind Contributions of Nearly $15 Million in 2007
Years ended December 31 (unaudited)
(millions of Canadian dollars)
- 1
- The total includes community partnership funding, as well as other community support in the form of equipment, property and cash donations from various operating budgets.
Following our Principles for Responsible Investment and Operations
Our principles guide our actions and track our performance in the areas of business conduct, community support, environment, working conditions and human rights.
There is a growing concern about the impact the energy sector has on the environment. The Company shares this concern and actively seeks to minimize the impact of Petro-Canada's operations on land, water and air. The Company's areas of focus are use of water, greenhouse gas (GHG) emissions and air emissions management.
The Company has more than 5,600 employees and many contractors working on Petro-Canada's behalf. These people deserve respectful and meaningful employment. In 2007, Petro-Canada recruited more than 860 new employees. The Company is committed to providing them with a safe and attractive place to work where they can learn and make a difference.
Management's Discussion and Analysis PETRO-CANADA 13
Following our Principles for Responsible Investment and Operations
| PRIORITY | | PRINCIPLES | | 2007 GOALS | | 2007 RESULTS | | 2008 GOALS |
|
Business Conduct |
|
• comply with applicable laws and regulations
• apply our Code of Business Conduct wherever we operate
• seek contractors, suppliers and agents whose practices are consistent with our principles |
|
• improve training for Code of Business Conduct and Privacy Policies
• strengthen leaders' understanding of their roles in sustaining a culture of integrity
• improve pre-selection and communication of Code of Conduct expectations with contractors |
|
• 5,522, or 98% of employees, and 906 contractors completed an interactive Code of Conduct refresher
• developed interactive, web-based privacy training and deployed it to 3,885 employees
• conducted workshops on how to deal with bribery and corruption in most International offices
• developed safety pre-selection criteria for contractors
• strengthened our Total Loss Management (TLM) framework by introducing a consistent and robust method to assess environment and social risks |
|
• update our Code of Conduct and introduce interactive web-based training on the new Code of Conduct
• continue to strengthen our communication of Code of Conduct expectations with an increasing contractor workforce
• improve new employee orientation process across the Company to emphasize Zero-Harm and TLM culture and principles
• implement online TLM training to strengthen employee understanding |
|
Community |
|
• strive within our sphere of influence to ensure a fair share of benefits to stakeholders impacted by our activities
• conduct meaningful and transparent consultation with all stakeholders
• endeavour to integrate our activities with, and participate in, local communities as good corporate citizens |
|
• develop Stakeholder Engagement Policy and improve training and capability development
• increase Aboriginal community participation in business opportunities to provide goods and services
• better measure the socio-economic impact on the communities in which we operate
• assess the effectiveness of key community partnership initiatives |
|
• developed a Stakeholder and Community Engagement Policy, training program and appointed a senior manager to support its delivery and integration
• developed and implemented Aboriginal procurement guidelines
• piloted a World Business Council for Sustainable Development tool to improve social investment decisions in the context of our impact on a community
• implemented the London Benchmarking Group framework for measuring the impacts of community partnership investments |
|
• improve the consistency and capability relative to engaging with stakeholders
• solicit feedback from external stakeholders regarding the effectiveness of the Company's interactions
• initiate and implement a social investment program that is integral to the Libya Concession Development
• introduce a number of new key community partnerships in our education, environment and local community support areas
• advance Olympic initiatives in anticipation of the 2010 Winter Olympics |
|
14 PETRO-CANADA Management's Discussion and Analysis
Following our Principles for Responsible Investment and Operations (continued)
| PRIORITY | | PRINCIPLES | | 2007 GOALS | | 2007 RESULTS | | 2008 GOALS |
|
Environment |
|
• conduct our activities with sound environmental management and conservation practices
• strive to minimize the environmental impact of our operations
• work diligently to prevent any risk to community health and safety from our operations or our products
• seek opportunities to transfer expertise in environmental protection to host communities |
|
• strengthen environmental stewardship by developing specific commitments and indicators for air, land and water management
• complete first phase of the environmental management system to steward performance against principles and indicators
• improve method to capture and report environmental expenditures
• submit environmental impact assessment in support of drilling programs offshore Trinidad and Tobago |
|
• developed a set of Water Principles to guide operations in managing this key risk
• signed Memorandum of Agreement (MOA) to use treated waste water as the industrial process water at the Fort Hills Sturgeon Upgrader
• environmental expenditure reporting methodology still in progress
• incorporated cost of carbon into business plan
• completed first emissions offset trade on surplus credits from North Sea operations
• participated in Alberta's first emissions credit auction
• completed first phase of environmental information management system for air and GHG emissions
• lowered environmental exceedances from 241 in 2006 to 16 in 2007, partially due to change in asset mix
• submitted environmental impact assessment supporting drilling programs offshore Trinidad and Tobago |
|
• integrate Water Principles into the environmental stewardship process
• pilot carbon intensity performance measures
• continue to review internal and external GHG mitigation opportunities
• meet 2008 auditable emissions reporting requirements
• commence development of second phase of environmental information management system for water and waste management
• advance major water-related community partnership projects |
|
- 1
- 2006 environmental exceedances included the Brazeau and West Pembina assets, which were sold in the first quarter of 2007.
Management's Discussion and Analysis PETRO-CANADA 15
Following our Principles for Responsible Investment and Operations (continued)
| PRIORITY | | PRINCIPLES | | 2007 GOALS | | 2007 RESULTS | | 2008 GOALS |
|
Working Conditions and Human Rights |
|
• provide a healthy, safe and secure work environment
• honour internationally accepted labour standards prohibiting child labour, forced labour and discrimination in employment
• respect freedom of association and expression in the workplace
• not be complicit in human rights abuses
• support and respect the protection of human rights within our sphere of influence |
|
• sustain and further improve safety
• develop health performance metrics to address and mitigate the impact of employee illness
• enhance the social risk impact assessment process in the project management model |
|
• achieved total recordable injury frequency (TRIF) of 0.86 in 2007, compared with 0.85 in 2006
• experienced two contractor fatalities in 2007
• continued to evolve Company's internal health metrics
• developed guidelines for an early phase social risk assessment in our international operations
• conducted a corporate-wide process safety review to assess opportunities to strengthen TLM framework
• hired 862 new employees and delivered a low voluntary turnover rate of 4.3%
• finalized pandemic planning based on emergency response exercises |
|
• establish enterprise wide contractor engagement process for selection, performance monitoring and management
• attract 925 new employees
• develop capability in managing the social issues of a temporary foreign workforce
• pilot a social risk assessment that will apply to new operations
• enhance management, systems and work processes related to process safety
• strengthen process for communicating and learning from internal high potential and serious events |
|
Business Strategy Looking Forward
Striving to ensure that existing facilities run safely, reliably and efficiently through excellent execution will continue to be a key focus for Petro-Canada. This same focus on execution will apply to the advancement of seven major projects over the next several years. Capital expenditures are expected to increase to between $6 billion and $7 billion per year for the next several years, reflecting spending on these major projects. In 2008, growth highlights are expected to include the Edmonton refinery conversion project coming on-stream and final investment decisions on the Montreal coker, the Fort Hills mining and upgrading project, and the Syria gas project. The Company also plans on drilling up to 17 exploration wells in the North Sea, offshore Trinidad and Tobago, Libya, the NWT and the Alaska Foothills.
Major Project
| Target On-Stream Date
|
|---|
|
| Edmonton Refinery Conversion | 2008 |
| Libya Concession Development | 2008 |
| White Rose Extensions | 2009 |
| Syria Ebla Gas Development | 2010 |
| Montreal Refinery Coker | 2010 |
| MacKay River Expansion | 2011 |
| Fort Hills – Phase I | 2011 / 2012 |
|
16 PETRO-CANADA Management's Discussion and Analysis
RISK MANAGEMENT
Risks Relating to Petro-Canada's Business
Petro-Canada's results are impacted by several risks and management's strategies for handling these risks. Management believes each major risk requires a unique response based on Petro-Canada's business strategy and financial tolerance. Some risks can be effectively managed through internal controls, business processes, insurance and hedging. Hedging is used in limited circumstances, mainly to mitigate Downstream risks associated with refinery feedstock costs. Petro-Canada's business risks include, but are not limited to, the following items. These risks could have a material adverse effect on the Company's business, financial conditions, and results of operations.
A substantial or extended decline in crude oil or natural gas prices could have a material adverse effect on Petro-Canada.
The Company's financial condition depends substantially on the market prices of crude oil and natural gas. Fluctuations in crude oil or natural gas prices could have a material adverse effect on Petro-Canada's financial condition, as well as the value and amount of the Company's reserves. Prices for crude oil and natural gas fluctuate in response to changes in the supply of and demand for crude oil and natural gas, market uncertainty and a variety of other factors beyond Petro-Canada's control. These factors include, but are not limited to, the actions of OPEC, world economic conditions, government regulation, political developments, the foreign supply of oil, the price of foreign imports, the availability of alternate fuel sources and weather conditions. Canadian natural gas prices are primarily affected by North American supply and demand, weather conditions, the level of industry inventories, political events, and, to a lesser extent, the price of alternate sources of energy.
Any substantial or extended decline in the prices of crude oil or natural gas could result in a delay or cancellation of existing or future drilling, development or construction programs, curtailment in production at some properties and unused long-term transportation commitments.
The margins realized for Petro-Canada's refined products are also affected by factors such as crude oil price fluctuations due to the impact on refinery feedstock costs, third-party refined product purchases and the demand for refined petroleum products. The Company's ability to maintain product margins in an environment of higher feedstock costs depends upon its ability to pass higher costs on to customers.
Factors that affect Petro-Canada's ability to execute projects could adversely affect business results.
Petro-Canada manages a variety of projects to support continuing operations and future growth. Significant project cost over-runs could make certain projects uneconomic. The Company's ability to execute projects depends upon numerous factors, some of which extend beyond Petro-Canada's control. These factors include, but are not limited to: changes in project scope, labour availability and productivity, staff resourcing, availability and cost of material and services, design and/or construction errors, delays in regulatory approvals and access to capital funding.
As a result, Petro-Canada may not be able to execute projects on time, on budget or at all.
A failure to acquire or find additional reserves would cause a decline in Petro-Canada's reserves and production levels.
The Company's future oil and natural gas reserves and production and, therefore, cash flows are highly dependent upon success in exploiting Petro-Canada's current reserves base and acquiring or discovering additional reserves. Without reserves additions through exploration, acquisition or development activities, Petro-Canada's reserves and production will decline over time. Exploring for, developing or acquiring reserves is capital intensive. To the extent cash flows from operations are insufficient to fund the Company's capital expenditures and external sources of capital become limited or unavailable, Petro-Canada's ability to make the necessary capital investments to maintain oil and natural gas reserves will be impaired. Costs to find and develop or acquire additional reserves also depend on success rates, which vary over time.
Management's Discussion and Analysis PETRO-CANADA 17
Petro-Canada's oil and natural gas reserves data and future net revenue estimates are subject to variability.
There are many uncertainties inherent in estimating quantities of oil and natural gas reserves, including many factors beyond the Company's control. Estimates of economically recoverable oil and natural gas reserves are based upon a number of variables and assumptions. These include geoscientific interpretation, commodity prices, operating and capital costs and historical production from properties. These estimates have some degree of uncertainty and reserves classifications are best estimates. For these reasons, estimates of the economically recoverable oil and natural gas reserves attributed to properties and classification of reserves based on recovery risk may vary substantially. Petro-Canada's actual production, revenues, taxes and development and operating expenditures related to reserves may vary materially from estimates.
Petro-Canada's operations are subject to physical damage, business interruption and casualty losses.
Petro-Canada is subject to the operating risks associated with exploring for and producing oil and natural gas, as well as operating midstream and downstream facilities. These risks include blowouts, explosions, fires, gaseous leaks, equipment failures, migration of harmful substances, adverse weather conditions and oil spills. These risks could cause personal injury, could result in damage or destruction to oil and natural gas wells, formations, production facilities, other property and equipment, and the environment, and could interrupt operations. In addition, Petro-Canada's operations are subject to the risks related to transporting, processing and storing of oil, natural gas and other related products, drilling of oil and natural gas wells, and operating and developing oil and natural gas properties.
Changes in governmental regulation affecting the oil and natural gas industry could have a material adverse impact on Petro-Canada.
The petroleum industry is subject to regulation and intervention by governments, including the awarding of exploration and production interests, the imposition of specific drilling obligations, environmental protection controls, regulation of the development and abandonment of fields (including restrictions on production) and, possibly, expropriation or cancellation of contract rights. As well, governments may regulate or intervene on prices, taxes, royalties and the exportation of oil and natural gas. Regulations may be changed in response to economic or political conditions. New regulations or changes to existing regulations that affect the oil and natural gas industry could reduce demand for natural gas or crude oil, and increase Petro-Canada's costs.
Fluctuations in exchange rates create foreign currency exposure.
Due to the fact that energy commodity prices are primarily in U.S. dollars, Petro-Canada's revenue stream is affected by the Cdn/U.S. dollar exchange rate. The Company's net earnings are negatively affected by a strengthening Cdn dollar. Petro-Canada is also exposed to fluctuations in other foreign currencies, such as the euro and British pounds sterling.
Petro-Canada's foreign operations may expose the Company to risks, which could negatively affect results of operations.
The Company has operations in a number of countries with different political, economic and social systems. As a result, Petro-Canada's operations and related assets are subject to a number of risks, which may include, among other things, currency restrictions and exchange rate fluctuations, loss of revenue, property and equipment as a result of expropriation, nationalization, war, insurrection and geopolitical and other political risks, increases in taxes and governmental royalties, renegotiation of contracts with governmental entities and quasi-governmental agencies, changes in laws and policies governing operations of foreign-based companies, economic and legal sanctions (such as restrictions against countries that the U.S. government may deem to sponsor terrorism) and other uncertainties arising from foreign government sovereignty over Petro-Canada's international operations. If a dispute arises in Petro-Canada's foreign operations, the Company may be subject to the exclusive jurisdiction of foreign courts or may not be able to subject foreign persons to the jurisdiction of a court in the U.S. or Canada.
18 PETRO-CANADA Management's Discussion and Analysis
The Company has operations in Libya, which is a member of OPEC. Petro-Canada may operate in other OPEC-member countries in the future. Production in those countries may be constrained by OPEC quotas.
Petro-Canada is subject to environmental legislation in all jurisdictions where it operates. Changes in this legislation could negatively affect the Company's results of operations.
Petro-Canada is subject to environmental regulation under a variety of Canadian, U.S. and other foreign, federal, provincial, territorial, state and municipal laws and regulations. This is collectively referred to below as environmental legislation.
Environmental legislation imposes, among other things, restrictions, liabilities and obligations in connection with the generation, handling, use, storage, transportation, treatment and disposal of hazardous and non-hazardous substances, including natural resources and waste, and in connection with spills, releases and emissions of various substances to the environment. Environmental legislation requires that wells, facility sites and other properties associated with Petro-Canada's operations be operated, maintained, abandoned and reclaimed to the satisfaction of applicable regulatory authorities. Certain types of operations, including exploration and development projects, and changes to certain existing projects, may require submitting and seeking the approval of environmental impact assessments or permit applications. Complying with environmental legislation can require significant expenditures, including costs for cleanup and damages due to contaminated properties. Failure to comply with environmental legislation may result in fines and penalties. Petro-Canada is also exposed to civil liability for environmental matters, including private parties commencing actions, new theories of liability and new heads of damages. Although it is not expected that the costs of complying with environmental legislation or dealing with environmental civil liabilities, as they are known today, will have a material adverse effect on Petro-Canada's financial condition or results of operations, no assurance can be made that the costs of complying with future environmental legislation will not have a material effect.
The Kyoto Protocol, effective in Canada since 2005, requires signatory nations to reduce their emissions of carbon dioxide and other greenhouse gases (collectively, GHG). The details of the implementation of a federal GHG emissions reduction program in Canada have not been finalized. Depending on the specifics of the regulations, compliance options currently being considered include reduction of GHG emissions from operations, the purchase of emission-trading credits, or the purchase of other types of offsets. As of December 31, 2007, the only financial GHG obligations in Canada impacting Petro-Canada's operations were the Specified Gas Emitters Regulation in Alberta and the Green Tax in Quebec. It is premature to predict what impact changes to federal or provincial regulations will have on the Canadian oil and natural gas industry, but Petro-Canada will most likely face increased capital and operating costs in order to comply with GHG emissions targets and/or reductions which costs may be material.
Petro-Canada's oil and natural gas production and refining operations impact communities and surrounding environments.
Those impacted by Petro-Canada's operations can become concerned over the use of resources, such as land and water, the perceived or real threat to human health, the potential impact on biodiversity, and/or possible societal changes to surrounding communities. The Company must secure and maintain formal regulatory approvals and licences in order to conduct operations. In addition, broader societal acceptance of Petro-Canada's activities is necessary for resource development. An inability for the Company to secure local community support, necessary regulatory approvals and licences, and broader societal acceptance can result in projects being delayed or stopped, resulting in higher project costs. Lack of local community and stakeholder support can lead to pressure to limit or shut down operations.
Counterparties exposure.
Petro-Canada is exposed to credit risk, and operational risk associated with counterparties' abilities to fulfil their obligations to the Company.
Management's Discussion and Analysis PETRO-CANADA 19
Petro-Canada does not operate all of its properties and assets.
Other companies operate some of the assets in which Petro-Canada has interests. As a result, the Company has limited ability to exercise influence over operations of these assets or their associated costs. The risks associated with assets operated by others depend upon a number of factors that may be outside of Petro-Canada's control, including the timing and amount of capital expenditures, the operator's expertise and financial resources, the approval of other participants, the selection of technology and risk management practices applied to the assets.
Marketing of production could adversely affect Petro-Canada's business.
The Company's ability to market its oil and natural gas depends on numerous factors. These include, but are not limited to, availability of processing capacity, availability and proximity of pipeline capacity, supply of and demand for oil and natural gas, availability of alternative fuel sources, effects of weather, availability of drilling and related equipment and accidental events. These factors could cause Petro-Canada to be unable to market all of the oil and natural gas that the Company produces.
20 PETRO-CANADA Management's Discussion and Analysis
CONSOLIDATED FINANCIAL RESULTS
Analysis of Consolidated Earnings and Cash Flow
Consolidated Financial Results
On January 31, 2006, Petro-Canada closed the sale of the Company's producing assets in Syria. These assets and associated results are reported as discontinued operations and are excluded from continuing operations.
(millions of Canadian dollars, unless otherwise indicated) | | | 2007 | | | 2006 | | | 2005 |
|
| Net earnings | | $ | 2,733 | | $ | 1,740 | | $ | 1,791 |
| Net earnings from discontinued operations | | | – | | | 152 | | | 98 |
|
| Net earnings from continuing operations | | $ | 2,733 | | $ | 1,588 | | $ | 1,693 |
|
| Earnings per share from continuing operations(dollars) | | – basic | | $ | 5.59 | | $ | 3.15 | | $ | 3.27 |
| | | – diluted | | | 5.53 | | | 3.11 | | | 3.22 |
| Earnings per share(dollars) | | – basic | | $ | 5.59 | | $ | 3.45 | | $ | 3.45 |
| | | – diluted | | | 5.53 | | | 3.41 | | | 3.41 |
| Cash flow from continuing operating activities1 | | | 3,339 | | | 3,608 | | | 3,783 |
| Cash flow from continuing operating activities per share(dollars) | | | 6.83 | | | 7.16 | | | 7.30 |
| Debt | | | 3,450 | | | 2,894 | | | 2,913 |
| Cash and cash equivalents 2 | | | 231 | | | 499 | | | 789 |
| Average capital employed 2 | | $ | 14,328 | | $ | 12,868 | | $ | 11,860 |
| Return on capital employed(%) 2 | | | 19.8 | | | 14.3 | | | 16.0 |
| Return on equity(%) 2 | | | 24.5 | | | 17.5 | | | 19.7 |
|
- 1
- Cash flow from continuing operating activities in 2007 was reduced by the payment of $1,145 million after-tax to settle the Buzzard derivative contracts.
- 2
- Includes discontinued operations.
2007 Compared with 2006
Net earnings from continuing operations increased 72% to $2,733 million in 2007, compared with $1,588 million in 2006. Higher upstream production and realized crude oil prices, strong Down-stream refining margins, foreign currency translation gains, tax adjustments and lower other expenses contributed to the increase. These factors were partially offset by declining realized natural gas prices, higher exploration and depreciation, depletion and amortization (DD&A) expenses and increased operating and general and administrative (G&A) expenses.
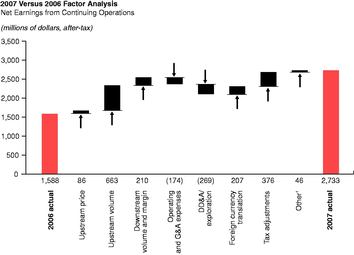
- 1
- Other mainly includes interest expense, changes in effective tax rates, gain on sale of assets, insurance proceeds, amounts related to the derivative contracts associated with Buzzard and upstream inventory levels.
Management's Discussion and Analysis PETRO-CANADA 21
In 2007, net earnings from continuing operations included a number of unusual items: net losses on the Buzzard derivative contracts of $331 million, a foreign currency translation gain on long-term debt of $208 million, a $191 million income tax recovery, a $97 million charge for asset impairment, a gain on sale of assets of $58 million, a $54 million charge related to the mark-to-market of stock-based compensation, $30 million in insurance proceeds and a $7 million insurance premium recovery.
In 2006, net earnings from continuing operations included a number of unusual items: a $240 million loss on the Buzzard derivative contracts, a $185 million income tax charge, $37 million in insurance proceeds, a $31 million charge related to the mark-to-market of stock-based compensation, a $29 million insurance premium surcharge, a $25 million gain on the sale of assets and a $1 million gain in foreign currency translation.
Quarterly Information
Consolidated Quarterly Financial Results
| | | |
2007 | | |
2006 |
| | |
|
| (millions of Canadian dollars, unless otherwise indicated) | | | Quarter 1 | | | Quarter 2 | | | Quarter 3 | | | Quarter 4 | | | Quarter 1 | | | Quarter 2 | | | Quarter 3 | | | Quarter 4 |
|
| Total revenue from continuing operations | | $ | 4,841 | | $ | 5,478 | | $ | 5,497 | | $ | 5,434 | | $ | 4,188 | | $ | 4,730 | | $ | 5,201 | | $ | 4,550 |
| Net earnings from continuing operations | | | 590 | | | 845 | | | 776 | | | 522 | | | 54 | | | 472 | | | 678 | | | 384 |
| Cash flow from (used in) continuing operating activities1 | | | 1,166 | | | 1,435 | | | 1,340 | | | (602 | ) | | 886 | | | 799 | | | 959 | | | 964 |
| Earnings per share from continuing operations(dollars) | | | | | | | | | | | | | | | | | | | | | | | | |
| | – basic | | $ | 1.19 | | $ | 1.71 | | $ | 1.59 | | $ | 1.08 | | $ | 0.11 | | $ | 0.93 | | $ | 1.36 | | $ | 0.77 |
| | – diluted | | $ | 1.18 | | $ | 1.70 | | $ | 1.58 | | $ | 1.07 | | $ | 0.10 | | $ | 0.92 | | $ | 1.34 | | $ | 0.76 |
| Earnings per share(dollars) | | | | | | | | | | | | | | | | | | | | | | | | |
| | – basic | | $ | 1.19 | | $ | 1.71 | | $ | 1.59 | | $ | 1.08 | | $ | 0.40 | | $ | 0.93 | | $ | 1.36 | | $ | 0.77 |
| | – diluted | | $ | 1.18 | | $ | 1.70 | | $ | 1.58 | | $ | 1.07 | | $ | 0.40 | | $ | 0.92 | | $ | 1.34 | | $ | 0.76 |
|
- 1
- Cash flow from (used in) continuing operating activities in the fourth quarter of 2007 was significantly reduced due to the payment of $1,145 million after-tax to settle the Buzzard derivative contracts.
Revenue and net earnings variances from quarter to quarter resulted mainly from fluctuations in commodity prices and refinery cracking margins, the impact on production and processed volumes from maintenance and other shutdowns at major facilities, and the level of exploration drilling activity. For further analysis of quarterly results, refer to Petro-Canada's quarterly reports to shareholders available on the Company's website at www.petro-canada.ca.
22 PETRO-CANADA Management's Discussion and Analysis
LIQUIDITY AND CAPITAL RESOURCES
Summary of Cash Flows
(millions of Canadian dollars) | | | 2007 | | | 2006 | | | 2005 | |
| |
| Cash flow from continuing operating activities | | $ | 3,339 | | $ | 3,608 | | $ | 3,783 | |
| Cash flow from discontinued operating activities | | | – | | | 15 | | | 204 | |
| Net cash inflows (outflows) from: | | | | | | | | | | |
| | – investing activities | | | (3,647 | ) | | (2,738 | ) | | (3,358 | ) |
| | – financing activities | | | 40 | | | (1,175 | ) | | (10 | ) |
| |
| Increase (decrease) in cash and cash equivalents | | $ | (268 | ) | $ | (290 | ) | $ | 619 | |
| |
| Cash and cash equivalents at end of year | | $ | 231 | | $ | 499 | | $ | 789 | |
| |
| Cash and cash equivalents – discontinued operations | | $ | – | | $ | – | | $ | 68 | |
| |
In 2007, cash flow from continuing operating activities was $3,339 million ($6.83/share), compared with $3,608 million ($7.16/share) in 2006. The decrease in cash flow was primarily due to the $1,145 million after-tax payment to settle the Buzzard derivative contracts, partially offset by higher net earnings from continuing operations.
Financial Ratios
| | | 2007 | | 2006 | | 2005 |
|
| Interest coverage from continuing operations(times)1 | | | | | | |
| | Net earnings basis | | 26.0 | | 19.2 | | 17.9 |
| | EBITDAX basis | | 39.2 | | 27.0 | | 25.4 |
| | Cash flow basis | | 27.2 | | 27.1 | | 29.9 |
| Debt-to-cash flow from continuing operating activities(times) | | 1.0 | | 0.8 | | 0.8 |
| Debt-to-debt plus equity(%) | | 22.5 | | 21.7 | | 23.5 |
|
- 1
- Refer to the Glossary of Terms and Ratios on page 112 for methods of calculation.
Petro-Canada's financing strategy is designed to maintain financial strength and flexibility to support profitable growth in all business environments. Two key measures that Petro-Canada uses to measure the Company's overall financial strength are debt-to-cash flow from continuing operating activities and debt-to-debt plus equity. Petro-Canada's debt-to-cash flow from continuing operating activities ratio, the key short-term measure, was 1.0 times at December 31, 2007 and 0.8 times at year-end 2006. This was well within the Company's target range of no more than 2.0 times. Debt-to-debt plus equity, the long-term measure
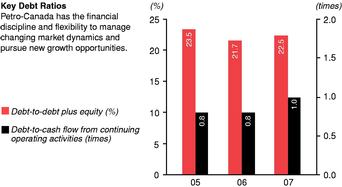
for capital structure, was 22.5% at year-end 2007, up from 21.7% at year-end 2006. This was below the target range of 25% to 35% for both years, providing the financial flexibility to fund the Company's capital program and profitable growth opportunities. In the future, from time to time, Petro-Canada may exceed target ranges for short periods of time, but always with the goal to return back within the target ranges. Financial covenants associated with the Company's various debt arrangements are reviewed regularly and controls are in place to maintain compliance with these covenants.
Management's Discussion and Analysis PETRO-CANADA 23
Operating Activities
Excluding cash and cash equivalents, short-term notes payable and the current portion of long-term debt, the operating working capital deficiency, including discontinued operations, was $565 million at December 31, 2007, compared with an operating working capital deficiency, including discontinued operations, of $1,014 million at December 31, 2006. The working capital deficiency was lower primarily due to an increase in accounts receivable and income taxes receivable, partially offset by an increase in accounts payable.
Investing Activities
Capital and Exploration Expenditures
(millions of Canadian dollars) | | | 2008
Outlook | | | 2007 | | | 2006 | | | 2005 |
|
| Upstream | | | | | | | | | | | | |
| North American Natural Gas | | $ | 675 | | $ | 866 | | $ | 788 | | $ | 713 |
| Oil Sands | | | 1,520 | | | 779 | | | 377 | | | 772 |
| International & Offshore | | | | | | | | | | | | |
| East Coast Canada | | | 295 | | | 159 | | | 256 | | | 314 |
| International1 | | | 1,635 | | | 762 | | | 760 | | | 696 |
|
| | | $ | 4,125 | | $ | 2,566 | | $ | 2,181 | | $ | 2,495 |
|
| Downstream | | | | | | | | | | | | |
| Refining and Supply | | $ | 950 | | $ | 1,214 | | $ | 1,038 | | $ | 883 |
| Sales and Marketing | | | 150 | | | 155 | | | 142 | | | 108 |
| Lubricants | | | 25 | | | 27 | | | 49 | | | 62 |
|
| | | $ | 1,125 | | $ | 1,396 | | $ | 1,229 | | $ | 1,053 |
|
| Shared Services | | $ | 35 | | $ | 26 | | $ | 24 | | $ | 12 |
|
| Total property, plant and equipment and exploration | | $ | 5,285 | | $ | 3,988 | | $ | 3,434 | | $ | 3,560 |
| Other assets | | | – | | | 121 | | | 50 | | | 70 |
|
| Total continuing operations | | $ | 5,285 | | $ | 4,109 | | $ | 3,484 | | $ | 3,630 |
|
| Discontinued operations | | $ | – | | $ | – | | $ | 1 | | $ | 46 |
|
| Total | | $ | 5,285 | | $ | 4,109 | | $ | 3,485 | | $ | 3,676 |
|
- 1
- International excludes capital expenditures related to the Syrian producing assets, which were sold in 2006 and are reflected as discontinued operations.
Capital and exploration expenditures were $4,109 million in 2007, up 18% compared with $3,485 million in 2006, mainly reflecting higher investment in Oil Sands and the Edmonton refinery conversion project.
In 2008, spending on new growth projects is expected to increase substantially. Two-thirds of planned capital expenditures support delivering profitable new growth and funding exploration and new ventures. This is up by more than $1 billion, compared with the same categories in 2007. The remaining one-third of 2008 planned capital expenditures is directed toward replacing reserves in core areas, enhancing existing assets, improving base business profitability and complying with new regulations.
2008 Capital Program from Continuing Operations
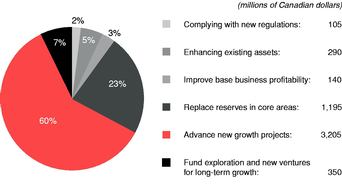
24 PETRO-CANADA Management's Discussion and Analysis
Financing Activities and Dividends
Sources of Capital Employed
(millions of Canadian dollars) | | | 2007 | | | 2006 | | | 2005 |
|
| Short-term notes payable | | $ | 109 | | $ | – | | $ | – |
| Long-term debt, including current portion | | | 3,341 | | | 2,894 | | | 2,913 |
| Shareholders' equity | | | 11,870 | | | 10,441 | | | 9,488 |
|
| Total | | $ | 15,320 | | $ | 13,335 | | $ | 12,401 |
|
Total debt increased to $3,450 million at December 31, 2007, compared with $2,894 million at the previous year end. The increase in debt occurred to fund operations after available cash balances were used to settle the Buzzard derivative contracts. The increase was partially offset by the impact of a strengthening Cdn dollar.
2007 Financing Activities
At December 31, 2007, Petro-Canada's syndicated committed credit facilities totalled $2,200 million and the Company's bilateral demand credit facilities totalled $1,500 million. A total of $1,372 million of the credit facilities was used for Bankers' Acceptances, letters of credit and overdraft coverage. As at December 31, 2007, there was $1,104 million in Bankers' Acceptances outstanding.
As at December 31, 2007, the Company's unsecured long-term debt securities are rated Baa2 by Moody's Investors Service, BBB by S&P and A (low) by Dominion Bond Rating Service. The Company's long-term debt ratings remained unchanged from year-end 2006. Petro-Canada's short-term debt securities are rated R-1 (low) by Dominion Bond Rating Service. This rating remains unchanged from year-end 2006.
As the Company moves into 2008 and beyond, spending on future large projects will likely result in annual capital expenditures exceeding operating cash flow. The Company anticipates that additional funding requirements will be met by external financing. As financial leverage is expected to increase over time, it will be managed in the context of Petro-Canada's target ranges.
Returning Cash to Shareholders
Petro-Canada's priority uses of cash are to fund the capital program and profitable growth opportunities, and then to return cash to shareholders through dividends and a share buyback program.
Petro-Canada regularly reviews its dividend strategy to ensure the alignment of the dividend policy with shareholder expectations, and financial and growth objectives. Total dividends paid in 2007 were $255 million ($0.52 per share), compared with $201 million ($0.40 per share) in 2006.
Petro-Canada renewed its NCIB program for the repurchase of its common shares from June 22, 2007 to June 21, 2008, entitling the Company to purchase up to 5% of its outstanding common shares, subject to certain conditions. Due to an increasing capital program, share buybacks are expected to be lower in future years, compared with 2006 and 2007.
| | Shares Repurchased
| | Average Price
| | Total Cost
|
|---|
| | |
|
| Period | | 2007 | | 2006 | | | 2007 | | | 2006 | | | 2007 | | | 2006 |
|
| Full year | | 15,998,000 | | 19,778,400 | | $ | 52.42 | | $ | 51.10 | | $ | 839 million | | $ | 1,011 million |
|
Management's Discussion and Analysis PETRO-CANADA 25
Off Balance Sheet
The Company has certain retail licensee and wholesale marketing agreements that would constitute variable interest entities as described in Note 25 to the Consolidated Financial Statements. These entities are not consolidated because Petro-Canada is not the primary beneficiary and, therefore, consolidation is not required. The Company's maximum exposure to losses from these arrangements would not be material. Other off balance sheet activities are limited to the accounts receivable securitization program, which does not meet the criteria for consolidation.
Pension Plans
At year-end 2007, Petro-Canada's defined benefit pension plans were under funded by $282 million, compared with an under funded position of $300 million at year-end 2006. For both the defined benefit and defined contribution pension plans, the Company made cash contributions of $121 million and recorded a pension expense of $81 million before-tax in 2007. This compares with $114 million of cash contributions and $91 million before-tax of pension expense in 2006. The Company expects to make pension contributions of approximately $58 million in 2008.
Contractual Obligations – Summary
| | Payments due by period
|
|---|
| | |
|
| (millions of Canadian dollars) | | | Total | | | 2008 | | | 2009-2010 | | | 2011-2012 | | | 2013 and
thereafter |
|
| Unsecured debentures and senior notes1 | | $ | 6,269 | | $ | 1,257 | | $ | 298 | | $ | 298 | | $ | 4,416 |
| Capital lease obligations1 | | | 114 | | | 9 | | | 20 | | | 19 | | | 66 |
| Operating leases | | | 1,250 | | | 427 | | | 441 | | | 251 | | | 131 |
| Transportation agreements | | | 1,557 | | | 227 | | | 303 | | | 235 | | | 792 |
| Product purchase/delivery obligations | | | 15,119 | | | 3,967 | | | 4,165 | | | 1,967 | | | 5,020 |
| Exploration work commitments2 | | | 103 | | | 82 | | | 20 | | | 1 | | | – |
| Asset retirement obligations | | | 4,136 | | | 50 | | | 79 | | | 66 | | | 3,941 |
| Other long-term obligations3,4 | | | 3,191 | | | 295 | | | 1,256 | | | 417 | | | 1,223 |
|
| Total contractual obligations | | $ | 31,739 | | $ | 6,314 | | $ | 6,582 | | $ | 3,254 | | $ | 15,589 |
|
- 1
- Obligations include related interest. Amounts due in 2008 include $1 billion due under a revolving committed credit facility maturing in 2012. For further details, see Note 17 to the 2007 Consolidated Financial Statements.
- 2
- Excludes other amounts related to the Company's expected future capital spending. Capital spending plans are reviewed and revised annually to reflect Petro-Canada's strategy, operating performance and economic conditions. For further information regarding future capital spending plans, refer to the business segment and investing activities discussions of the 2007 MD&A.
- 3
- Includes processing agreement with Suncor Energy Inc., receivables securitization program, pension funding obligations for the periods prior to the Company's next required pension plan valuation and other obligations. Pension obligations beyond the next required pension valuation date were excluded due to the uncertainty as to the amount or timing of these obligations.
- 4
- Petro-Canada is involved in litigation and claims associated with normal operations. Management is of the opinion that any resulting settlements would not materially affect the financial position of the Company. The table excludes amounts for these contingencies due to the uncertainty as to the amount or timing of any settlements.
Total contractual obligations of $29.6 billion at December 31, 2006 included $11.4 billion of supply purchase agreements contracted at market prices where the product could reasonably be re-sold into the market1. During 2007, Petro-Canada's total contractual obligations increased by $2.1 billion, mainly due to additional product purchase obligations, issuances of Bankers' Acceptances and an increase in the estimate of asset retirement obligations, partially offset by gains on the translation of foreign currency denominated unsecured debentures and senior notes.
- 1
- As disclosed in footnote 2 to the table on page 17 of the 2006 annual MD&A.
26 PETRO-CANADA Management's Discussion and Analysis
UPSTREAM
Petro-Canada's upstream operations consisted of three business units in 2007: North American Natural Gas, with current production in Western Canada and the U.S. Rockies; Oil Sands with operations in northeast Alberta; and International & Offshore. International & Offshore has two segments: East Coast Canada, with three major developments offshore Newfoundland and Labrador; and International, where the Company is active in two core areas: North Sea and Other International. The diverse asset base provides a balanced portfolio and a platform for long-term growth.
North American Natural Gas
Business Summary and Strategy
North American Natural Gas explores for and produces natural gas, crude oil and natural gas liquids (NGL) in Western Canada and the U.S. Rockies. This business also markets natural gas in North America and has established resources in the NWT and Alaska.
The North American Natural Gas strategy is to be a significant market participant by accessing new and diverse natural gas supply sources in North America. Key features of the strategy include:
- •
- optimizing core properties in Western Canada and developing coal bed methane (CBM) and tight gas in the U.S. Rockies
- •
- targeting 50% to 60% reserves replacement
- •
- focused exploration activity in Western Canada, with increasing emphasis in the U.S.
- •
- building the northern resource base for long-term growth
North American Natural Gas Financial Results
(millions of Canadian dollars) | | | 2007 | | | 2006 | | | 2005 |
|
| Net earnings | | $ | 191 | | $ | 405 | | $ | 674 |
|
| Cash flow from continuing operating activities | | $ | 725 | | $ | 651 | | $ | 1,219 |
| Expenditures on property, plant and equipment and exploration | | $ | 866 | | $ | 788 | | $ | 713 |
| Total assets | | $ | 4,119 | | $ | 4,151 | | $ | 3,763 |
|
2007 Compared with 2006
North American Natural Gas contributed $191 million of net earnings, down considerably from $405 million in 2006. Weak natural gas prices, lower Western Canada production, increased operating costs, higher exploration expenses and increased DD&A expenses were partially offset by higher U.S. Rockies production.
Net earnings in 2007 included a $97 million charge related to the impairment of CBM assets in the U.S. Rockies, a $41 million gain on sale of assets and an $8 million income tax recovery. Net earnings in 2006 included a $6 million income tax recovery.
Oil and natural gas production averaged 674 million cubic feet of oil equivalent/day (MMcfe/d) in 2007, down from 701 MMcfe/d in 2006, as natural declines in Western Canada were partially offset by U.S. Rockies production growth. Natural gas commodity prices declined over the course of 2007. The North American realized natural gas price averaged $6.30/Mcf in 2007, down 8% from $6.85/Mcf in 2006.
Management's Discussion and Analysis PETRO-CANADA 27
2007 Operating Review and Strategic Initiatives
The North American Natural Gas business is selectively investing to optimize the existing core assets in Western Canada and the U.S. Rockies, with focused exploration in these basins, and building the northern resource base for the longer term.
2007 Operating Review
|
|
|
2007 |
|
|
2006 |
|
|
2005 |
|
| Production net(MMcfe/d) | | | | | | | | | |
| | Western Canada | | | 590 | | | 646 | | | 704 |
| | U.S. Rockies | | | 84 | | | 55 | | | 52 |
|
| Total North American Natural Gas production net | | | 674 | | | 701 | | | 756 |
|
| Western Canada realized natural gas price($/Mcf) | | $ | 6.48 | | $ | 6.88 | | $ | 8.55 |
| U.S. Rockies realized natural gas price($/Mcf) | | $ | 4.88 | | $ | 6.36 | | $ | 7.17 |
|
Western Canada operating and overhead costs
(dollars/thousand cubic feet of oil equivalent – $/Mcfe) | | $ | 1.50 | | $ | 1.31 | | $ | 1.10 |
| U.S. Rockies operating and overhead costs ($/Mcfe) | | $ | 2.21 | | $ | 2.29 | | $ | 1.84 |
|
Western Canada
Western Canada natural gas production averaged 590 MMcfe/d in 2007, down 9% from 646 MMcfe/d in 2006. Exploration and development drilling activity in Western Canada resulted in 395 successful wells (gross), for an overall success rate of 93% in 2007. Western Canada realized natural gas price was $6.48/Mcf in 2007, compared with $6.88/Mcf in 2006. Western Canada operating and overhead costs were $1.50/Mcfe in 2007, up from $1.31/Mcfe in the previous year. The operating and overhead cost increase in Western Canada reflected general industry-wide cost pressures for materials, fuel and labour, combined with lower production.
U.S. Rockies
U.S. Rockies natural gas production averaged 84 MMcfe/d in 2007, up 53% from 55 MMcfe/d in 2006. Exit volumes for the year exceeded 100 MMcfe/d, a doubling of production from 2004 acquisition levels. The increase reflected the ramp up of production from the Wild Turkey and other CBM fields in the Powder River Basin and increased drilling activity in the Denver-Julesburg Basin. Exploration and development drilling activity in the U.S. Rockies during 2007 resulted in 150 gross wells, down from 280 wells in 2006. U.S. Rockies realized natural gas price was $4.88/Mcf in 2007, down from $6.36/Mcf in 2006 due to pipeline constraints. Late in 2007, the initial expansion of the Fort Union gas gathering system was completed, helping to reduce curtailments in the Powder River Basin. The completion of the Rockies Express pipeline expansion is expected to alleviate additional U.S. Rockies pipeline
28 PETRO-CANADA Management's Discussion and Analysis
constraints when it comes on-stream in 2008. U.S. Rockies operating and overhead costs were $2.21/Mcfe in 2007, down compared with $2.29/Mcfe in 2006 due to higher production.
2007 Strategic Initiatives
In Western Canada, the Company continued its planned shallow tight gas drilling program in the Medicine Hat area, drilling more than 300 wells in 2007. The business expects to drill another 360 wells in 2008. In the other core areas of British Columbia (BC) and Alberta, the Company continued to optimize existing fields with the drilling of more than 100 exploration and development wells in 2007. As part of the Company's ongoing optimization of its portfolio of assets, Petro-Canada completed the sale of its 31% working interest in the Brazeau plant and 7% of its 10% working interest in the West Pembina plant in early 2007.
During 2007, the Company advanced its exploration activities in Alaska by participating with FEX L.P. in three exploration wells on jointly held acreage in the National Petroleum Reserve – Alaska (NPR-A). The Company is positioning for 2008 exploratory drilling in the Alaska Foothills and the NWT.
One NPR-A well was abandoned, having failed to encounter reservoir quality sands in the primary target. Two wells have been suspended, with plans for future testing, having encountered several hydrocarbon bearing zones.
In the Alaska Foothills, the Company and its joint venture partners implemented pre-drill operations in 2007 for a two-well program in 2008, both wells targeting natural gas. In the Canadian North, the Company completed preparations to drill one well, also targeting natural gas, in the NWT.
In June 2007, the Quebec government granted a decree approving the proposal to construct the Gros-Cacouna LNG re-gasification terminal. The National Energy Board (NEB) approved an application by TransCanada PipeLines Limited for a natural gas pipeline receipt point at Gros-Cacouna, Quebec, as well as a rolled-in toll methodology for the proposed project.
In February 2008, Gazprom (the potential anchor supply for the proposed project) decided not to pursue a Baltic LNG project with Petro-Canada. As a result, the Company and its partner are reviewing the long-term outlook for the Gros-Cacouna project.
The Company sees long-term potential for the development of Arctic island natural resources discovered in the 1970s and 1980s. In January 2008, a small team was formed to look at the feasibility of developing the Company's assets in this region. The two largest assets Petro-Canada holds in the region are the Drake and Hecla fields on Melville Island.
Capital expenditures in 2007 totalled $866 million, with $533 million for exploration and development of natural gas in Western Canada, $210 million for other natural gas opportunities in North America and $123 million for U.S. Rockies exploration and development.
Outlook
Production expectations in 2008
- •
- production is expected to average about 630 MMcfe/d net of natural gas, crude oil and NGL
Action plans in 2008
- •
- drill approximately 400 gross wells in Western Canada and approximately 300 gross wells in the U.S. Rockies
- •
- advance long-term opportunities in Northern Canada and Alaska
Capital spending plans in 2008
- •
- approximately $415 million for replacing reserves in Western Canada core areas
- •
- approximately $190 million for growth opportunities in the U.S. Rockies
- •
- approximately $70 million directed to exploration in the Far North
The Company plans to continue selectively investing in core assets in Western Canada to optimize existing fields, with about 360 wells planned to continue the drilling program in the Medicine Hat area and more than 50 exploration and development wells in other BC and Alberta areas. As part of this activity, the Company is seeking regulatory approval in 2008 to proceed with a multi-well development program in the Sullivan field. The development of CBM and tight gas in the U.S. Rockies will continue, with the drilling of about 300 development wells, along with an increasing focus on exploration. The reduced spending and natural production declines in Western Canada are expected to result in approximately a 7% drop in production in 2008, compared with 2007.
The Company will also continue to advance long-term supply opportunities. In the Alaska Foothills and NWT, the Company plans to start testing its exploration lands by drilling up to three wells in early 2008.
Management's Discussion and Analysis PETRO-CANADA 29
Link to Petro-Canada's Corporate and Strategic Priorities
The North American Natural Gas business is aligned with Petro-Canada's strategic priorities as outlined by its progress in 2007 and goals for 2008.
| PRIORITY | | 2007 GOALS | | 2007 RESULTS | | 2008 GOALS |
|
Delivering Profitable Growth with a Focus on Operated, Long-Life Assets |
|
• transition further into unconventional gas plays
• optimize opportunities around core assets
• double U.S. Rockies production to 100 MMcfe/d net by year-end 2007
• shift focus from developing around existing production to exploring in new areas
• receive regulatory decision for the LNG facility at Gros-Cacouna
• advance exploration prospects in the Mackenzie Delta/Corridor1 and Alaska |
|
• 26% of 2007 production was unconventional, compared with 22% in 2006
• drilled 427 gross wells in Western Canada focused on the Company's core assets, including 312 wells in the Medicine Hat region
• exited 2007 having achieved 100 MMcfe/d net production from the U.S. Rockies
• drilled 150 gross wells and continued to increase CBM well de-watering in the U.S. Rockies
• exploration activity in 2007 continued exploration shift to the U.S.
• received provincial regulatory approval to construct the proposed LNG re-gasification terminal at Gros-Cacouna
• NEB approved application for new pipeline receipt point at Gros-Cacouna and reaffirmed rolled-in tolling methodology for the proposed pipeline expansion
• participated in three Alaska NPR-A wells, with plans to test two of the wells that encountered hydrocarbons |
|
• continue to selectively optimize Western Canada core assets
• continue U.S. Rockies CBM and tight natural gas development
• target 50% to 60% reserves replacement from these core assets
• focus exploration activity in Western Canada, with increasing emphasis on the U.S.
• advance exploration prospects in the NWT and Alaska
• initiate an Arctic LNG feasibility study |
|
| Driving for First Quartile Operation of Our Assets | | • sustain reliability performance
• continue to leverage costs through strategic alliances and preferred suppliers | | • maintained reliability of 99% at Western Canada natural gas processing facilities
• delivered value to the organization through preferred supplier relationships, while continuing to ensure competitive supply costs through selective bidding | | • continue to focus on safety and reliability performance
• continue to leverage costs through strategic alliances and preferred suppliers |
|
Continuing to Work at Being a Responsible Company |
|
• continue to focus on TRIF and maintain low regulatory exceedances
• complete the roll out of behaviour-based safety for employees and contractors
• drive for continuous improvement in contractor safety performance
• proactively remediate and reclaim old sites |
|
• TRIF increased to 1.54, compared with 1.42 in 2006 due mostly to the addition of select U.S. contractors to the TRIF calculation
• completed the roll out of behaviour-based safety for employees and contractors
• improved Western Canada contractor injury frequency
• recorded three regulatory compliance exceedances in 2007, compared with nine in 2006
• established a program for risk assessment and managing the reclamation of old sites |
|
• continue to focus on TRIF and maintain low regulatory exceedances
• conduct internal stakeholder engagement training for project managers and other key business roles
• strengthen approach to investigating and learning from events |
|
- 1
- Mackenzie Delta/Corridor is also referred to as Northwest Territories (NWT) in this document.
30 PETRO-CANADA Management's Discussion and Analysis
Oil Sands
Business Summary and Strategy
Petro-Canada has approximately 1.21 billion barrels of Oil Sands proved plus probable reserves and more than 10.42 billion barrels of Contingent and Prospective Resources. The Company's major Oil Sands interests include a 12% ownership in the Syncrude joint venture (an oil sands mining operation and upgrading facility), 100% ownership of the MacKay Riverin situ bitumen development (a steam-assisted gravity drainage (SAGD) operation), a 60% ownership in and operatorship of the proposed Fort Hills oil sands mining and upgrading project, and extensive oil sands acreage considered prospective forin situ development of bitumen resources.
- 1
- These reserves numbers represent the sum of oil sands mining and oil and gas activities, including probable reserves, and are presented before royalties. Reporting reserves in this manner does not conform to SEC standards and is for general supplemental information only.
- 2
- 45% of total Oil Sands resources are risked Prospective Resources and 55% are Contingent Resources.
The Oil Sands strategy for profitable growth includes:
- •
- integrated development of reserves to maximize financial returns
- •
- disciplined capital investment to optimize the value created by long-life projects
- •
- a staged approach to development of capital-intensive oil sands projects to allow rigorous cost management and the opportunity to benefit from evolving technology
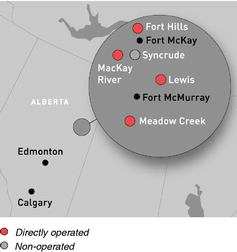
The Company has chosen to participate in the full oil sands value chain due to its resource potential and strong position with bitumen upgrading capacity. Petro-Canada has processing capacity through Syncrude and Suncor Energy Inc. (starting in 2008). The Company is also converting the conventional crude oil train at its Edmonton refinery to refine oil sands-based feedstock from northern Alberta, which is expected to start up at the end of 2008. This conversion, along with the existing synthetic crude supply, will result in the refinery running on an exclusive diet of oil sands-based feedstock. This connection between resource and upgrading capacity should provide more economic certainty in a business where volatile light/heavy differentials affect bitumen pricing.
Oil Sands Financial Results
(millions of Canadian dollars) | | | 2007 | | | 2006 | | | 2005 |
|
| Net earnings | | $ | 316 | | $ | 245 | | $ | 115 |
|
| Cash flow from continuing operating activities | | $ | 512 | | $ | 499 | | $ | 340 |
| Expenditures on property, plant and equipment and exploration | | $ | 779 | | $ | 377 | | $ | 772 |
| Total assets | | $ | 3,659 | | $ | 2,885 | | $ | 2,623 |
|
2007 Compared with 2006
Oil Sands contributed a record $316 million of net earnings, up 29% from $245 million in 2006. Higher realized prices and production at Syncrude were partially offset by lower production and increased operating costs at MacKay River.
Net earnings in 2007 included a $62 million income tax recovery. Net earnings in 2006 included a $44 million income tax recovery and $12 million of Syncrude insurance proceeds related to the 2005 hydrogen plant fire.
Management's Discussion and Analysis PETRO-CANADA 31
Record prices and production at Syncrude were highlights of 2007 performance. Syncrude realized price for synthetic crude oil averaged $79.20/bbl in 2007, up from $72.13/bbl in 2006. MacKay River realized price for bitumen averaged $28.23/bbl in 2007, compared with $28.93/bbl in 2006. Oil Sands production averaged 56,900 b/d net in 2007, compared with 52,200 b/d net in 2006.
2007 Operating Review and Strategic Initiatives
In 2007, Oil Sands delivered a record $316 million in net earnings. Oil Sands' strategic progress included completing the Fort Hills design basis and preliminary capital cost estimate, finalizing an agreement to earn an additional 5% of the Fort Hills project, continuing to ramp up the Syncrude Stage III expansion and beginning steaming the fourth well pad at MacKay River.
2007 Operating Review
|
|
|
2007 |
|
|
2006 |
|
|
2005 |
|
| Production net(b/d) | | | | | | | | | |
| | Syncrude | | | 36,600 | | | 31,000 | | | 25,700 |
| | MacKay River | | | 20,300 | | | 21,200 | | | 21,300 |
|
| Total Oil Sands production net | | | 56,900 | | | 52,200 | | | 47,000 |
|
| Syncrude realized crude price($/bbl) | | $ | 79.20 | | $ | 72.13 | | $ | 70.41 |
| MacKay River realized bitumen price($/bbl) | | $ | 28.23 | | $ | 28.93 | | $ | 18.53 |
|
| Syncrude operating and overhead costs($/bbl) | | $ | 26.94 | | $ | 30.00 | | $ | 31.90 |
| MacKay River operating and overhead costs($/bbl) | | $ | 20.97 | | $ | 17.83 | | $ | 17.06 |
|
Syncrude's production and unit operating costs were positively affected by the full-year impact of the Stage III expansion, which started up in 2006. Syncrude's production averaged 305,000 b/d gross (36,600 b/d net) in 2007, compared with 258,300 b/d gross (31,000 b/d net) in 2006. Ramp up of Stage III was hampered by Coker 8-3 related incidents in the fourth quarter of 2007. Average unit operating and overhead costs in 2007 decreased compared with 2006. Lower unit operating costs were mainly due to higher production and lower natural gas costs. Syncrude reached royalty payout in the second quarter of 2006 and shifted to a royalty rate of 25% of net operating revenues from 1% of gross revenues. The total royalty paid in 2007 equated to a rate of 15% of gross revenues. Petro-Canada and its partners in Syncrude remain in negotiations with the Government of Alberta regarding the province's desire for Syncrude to move to the New Alberta Royalty Framework recommendations in advance of the expiry of its existing royalty agreement in 2016.
MacKay River's production decreased slightly and unit operating costs increased considerably in 2007. Production averaged 20,300 b/d in 2007, down 4% compared with 21,200 b/d in 2006. Lower production reflected unplanned outages and reduced throughputs resulting from damage to a steam header. MacKay River reliability averaged 87% in 2007, down from 92% in 2006,
32 PETRO-CANADA Management's Discussion and Analysis
reflecting water treatment issues and several unplanned outages in the year. Unit operating and overhead costs increased by 18% in 2007, averaging $20.97/bbl, compared with $17.83/bbl in 2006. Higher unit operating costs were due to higher maintenance and repair costs and decreased production for the year, partially offset by lower natural gas costs.
2007 Strategic Initiatives
In April 2007, Syncrude joint venture owners initiated implementation of the Management Services Agreement with Imperial Oil Resources.
At MacKay River, the Company completed the MacKay River plant capacity upgrade and began steaming the fourth well pad. Production from the new well pad commenced in January 2008 and will ramp up throughout 2008.
The time frame for completion of FEED for the MacKay River expansion project was extended by one year due to cost pressures, including increased royalties. The economics forin situ oil sands projects are challenging, so the Company is proceeding at a measured pace. Currently, Petro-Canada is evaluating opportunities for integration with the Fort Hills project and pursuing cost-saving opportunities associated with using foreign engineering, procurement and construction (EPC) contractors. A final investment decision is now expected in the first quarter of 2009.
Based on the progress of the MacKay River expansion project in 2007, proved plus probable reserves increased from 3101 million barrels (MMbbls) to 5981 MMbbls. In addition, assessment of the newly acquired lands in the MacKay River area and the results of the 2006-07 delineation drilling and seismic programs resulted in overallin situ Contingent and risked Prospective Resources estimates before royalties, increasing from approximately 6.9 billion barrels to approximately 8.2 billion barrels.
- 1
- The reporting of before royalty reserves information does not conform to SEC standards and is for general supplemental information only.
In June 2007, Petro-Canada and its partners in the Fort Hills integrated mine and upgrader project completed and announced the design basis and preliminary cost estimate for the project. The first phase of the project is planned to produce 140,000 b/d gross of synthetic crude oil (84,000 b/d net). Associated bitumen production is expected to be about 160,000 b/d gross (96,000 b/d net). First bitumen production is expected to begin in the fourth quarter of 2011, with first synthetic crude oil production from the Sturgeon Upgrader anticipated in the second quarter of 2012. The preliminary capital cost estimate for the mine and upgrading components of the first phase of the Fort Hills Project is $14.1 billion gross ($8.5 billion net).
In November 2007, Petro-Canada and its partners in the Fort Hills project finalized the agreement for the Company to earn an additional 5% working interest in the project in return for funding $375 million of partnership expenditures. This brings Petro-Canada's total stake in the Fort Hills project to 60%. The partnership also entered into a MOA with Sturgeon County and the Alberta Capital Region Wastewater Commission (ACRWC) to use treated waste water from the ACRWC as industrial process water at the Fort Hills Sturgeon Upgrader. Also in November 2007, Petro-Canada entered into an agreement, subject to the final investment decision, with Enbridge Inc., to develop pipeline and terminalling facilities to meet the requirements of Phase 1 and subsequent phases of the project.
Oil Sands capital expenditures of $779 million in 2007 included $531 million for the Fort Hills integrated mining and upgrading project, $95 million for the MacKay River expansion, $87 million for MacKay River, $58 million at the Syncrude operations and $8 million for other Oil Sands projects.
Management's Discussion and Analysis PETRO-CANADA 33
Outlook
Production expectations in 2008
- •
- Petro-Canada's share of Syncrude production is expected to average 35,000 b/d net
- •
- MacKay River bitumen production is expected to average 25,000 b/d net, which includes a major 10- to 15-day planned maintenance turnaround
Growth plans
- •
- work to improve reliability at Syncrude and MacKay River
- •
- advance MacKay River expansion project to enable a final investment decision in the first quarter of 2009
- •
- advance the Fort Hills oil sands mining and upgrading project to final investment decision
- •
- progress SAGD technology through research and development
Capital spending plans in 2008
- •
- approximately $1,311 million for new growth opportunities, the majority of which is to advance the Fort Hills project and the MacKay River expansion
- •
- approximately $147 million to enhance existing operations, comply with regulations and improve the base business profitability at Syncrude and MacKay River
- •
- approximately $62 million to replace reserves through ongoing pad development at MacKay River
Oil Sands production is expected to increase to 60,000 b/d net in 2008, compared with actual production of 56,900 b/d net in 2007. Higher expected production in 2008 is due to higher volumes anticipated at both Syncrude and MacKay River, partially offset by a major 10- to 15-day planned turnaround scheduled for May 2008 at MacKay River. The total Syncrude royalty payable in 2008 is expected to equate to a rate of between 14% and 17% of gross revenue, depending on crude oil prices. The total MacKay River royalty payable in 2008 is expected to be 1% of gross revenue.
In 2008, the Company expects to complete the Fort Hills mine, extraction and upgrading FEED, which establishes detailed cost estimates and a more detailed project schedule and workforce plan. Petro-Canada expects to receive a regulatory decision on the filed commercial application for the Sturgeon Upgrader by mid-2008. The Company also expects to make a final investment decision on the Fort Hills project in the third quarter of 2008.
The Oil Sands business has a capital program of about $1,520 million in 2008. Capital for new growth opportunities of $1,311 million includes funding the preliminary engineering and design for the Fort Hills project (forecast to be $1,165 million) and the FEED for the MacKay River expansion (forecast to be $90 million). With the initial phase of the Fort Hills project and the MacKay River expansion, Petro-Canada's production is expected to grow to more than 190,000 b/d net. Beyond that, the Company has the potential to grow the Oil Sands business to approximately 300,000 b/d net over the next decade. Petro-Canada is focused on resolving the challenges associated with the implementation of its Oil Sands strategy, including capital cost pressures, skilled labour shortages, and environmental and stakeholder issues. As an experienced and responsible operator, Petro-Canada is well positioned to meet these challenges.
34 PETRO-CANADA Management's Discussion and Analysis
Link to Petro-Canada's Corporate and Strategic Priorities
The Oil Sands business is aligned with Petro-Canada's strategic priorities as outlined by its progress in 2007 and goals for 2008.
| PRIORITY | | 2007 GOALS | | 2007 RESULTS | | 2008 GOALS |
|
Delivering Profitable Growth with a Focus on Operated, Long-Life Assets |
|
• complete Fort Hills design basis and initial cost estimate, and start FEED
• receive regulatory decision on MacKay River expansion project
• continue ramp up of Syncrude Stage III expansion
• complete MacKay River water handling capacity upgrade and tie-in a fourth well pad so that production can increase in 2008 |
|
• completed Fort Hills design basis, with Phase 1 estimated to cost $14.1 billion gross ($8.5 billion net)
• signed MOA for an additional 5% interest in the Fort Hills project
• Energy Resources Conservation Board and Alberta Environment recommended approval of MacKay River expansion to cabinet
• Syncrude achieved record production of 305,000 b/d gross (36,600 b/d net)
• completed MacKay River capacity upgrade and started steaming the fourth well pad |
|
• complete Fort Hills FEED and make final investment decision in the third quarter of 2008
• order long-lead items for Fort Hills project
• continue to ramp up Syncrude Stage III expansion
• receive regulatory decision on MacKay River expansion project
• continue to advance MacKay River expansion project in preparation for the final investment decision in the first quarter of 2009
• receive regulatory decision on the Sturgeon County Upgrader |
|
| Driving for First Quartile Operation of Our Assets | | • decrease MacKay River non-fuel unit operating costs by 10%, compared with 2006
• decrease Syncrude non-fuel unit operating costs by 10%, compared with 2006
• sustain MacKay River reliability at greater than 90% | | • saw MacKay River non-fuel unit operating costs increase by 26%, compared with 2006, as a result of higher maintenance costs and lower production
• saw Syncrude non-fuel unit operating costs decrease by 8%, compared with 2006
• achieved 87% reliability at MacKay River | | • ramp up MacKay River production to hit 30,000 b/d and increase reliability to greater than 90%
• commence shipping MacKay River bitumen to the Edmonton refinery after it has been upgraded into synthetic crude oil at Suncor
• decrease Syncrude non-fuel unit operating costs by 10%, compared with 2007 |
|
Continuing to Work at Being a Responsible Company |
|
• maintain focus on TLM and Zero-Harm
• ensure regulators, First Nations and other key stakeholders affected by major projects are properly consulted and engaged |
|
• TRIF increased to 0.75, compared with 0.58 in 2006 due to more complex work, increased drilling activities and a larger number of new workers
• followed through with effective stakeholder interactions, expediting the commercial application process for the MacKay River expansion
• recorded one compliance exceedance for 2007, compared with five in 2006
• signed MOA to use treated waste water as the industrial process water at the Fort Hills Sturgeon Upgrader |
|
• drive for continuous improvement in safety
• continue relevant and transparent engagement with key stakeholders to obtain approval for the Sturgeon Upgrader and Fort Hills mine expansion
• develop capability in managing the social issues of a temporary foreign workforce
• pursue research on practical solutions for tailings management |
|
Management's Discussion and Analysis PETRO-CANADA 35
International & Offshore
In the first quarter of 2007, the Company combined its East Coast Canada and International businesses under one management structure. The change leverages and grows the capabilities of similar operations. The combined East Coast Canada and International operations are now referred to as International & Offshore.
East Coast Canada
Business Summary and Strategy
Petro-Canada is positioned in every major producing oil development off Canada's east coast. The Company holds a 20% interest in Hibernia, a 27.5% interest in White Rose1 and a 23.9% interest in Hebron, and is the operator with a 34% interest in Terra Nova.
The East Coast Canada strategy is to improve reliability and sustain profitable production well into the next decade leveraging the existing infrastructure. Key features of the strategy include:
- •
- delivering top quartile operating performance
- •
- sustaining profitable production through reservoir extensions and add-ons
- •
- pursuing high potential development projects
- 1
- Petro-Canada's working interest in the White Rose Extensions will be 26.125% after the Provincial Energy Corporation acquires its 5% working interest effective with the signing of the final project agreements. There is no change to the White Rose 27.5% working interest for the original field development as the Provincial Energy Corporation is not a partner.
East Coast Canada Financial Results
(millions of Canadian dollars) | | | 2007 | | | 2006 | | | 2005 |
|
| Net earnings | | $ | 1,229 | | $ | 934 | | $ | 775 |
|
| Cash flow from continuing operating activities | | $ | 1,491 | | $ | 1,129 | | $ | 1,002 |
| Expenditures on property, plant and equipment and exploration | | $ | 159 | | $ | 256 | | $ | 314 |
| Total assets | | $ | 2,345 | | $ | 2,465 | | $ | 2,442 |
|
2007 Compared with 2006
East Coast Canada contributed a record $1,229 million of net earnings, up 32% from $934 million in 2006. Strong realized prices and higher production were partially offset by increased DD&A expenses.
Net earnings in 2007 included a $52 million income tax recovery and $27 million of insurance proceeds related to mechanical failures on the Terra Nova Floating Production Storage and Offloading (FPSO) vessel. Net earnings in 2006 included a $37 million income tax recovery, $22 million of insurance proceeds related to mechanical failures on the Terra Nova FPSO vessel and a $9 million insurance premium surcharge.
36 PETRO-CANADA Management's Discussion and Analysis
In 2007, realized crude oil prices remained strong, while production increased. East Coast Canada realized crude prices averaged $75.87/bbl in 2007, up from $71.12/bbl in 2006. East Coast oil production averaged 98,700 b/d in 2007, up from 72,700 b/d in 2006. Higher Terra Nova and White Rose production was partially offset by natural declines at Hibernia.
2007 Operating Review and Strategic Initiatives
In 2007, East Coast Canada delivered record net earnings of $1,229 million. Terra Nova delivered solid production with facility reliability averaging 86%; White Rose ramped up production, averaging 117,500 b/d gross (32,300 b/d net), while natural reservoir declines reduced Hibernia production.
2007 Operating Review
|
|
|
2007 |
|
|
2006 |
|
|
2005 |
|
| Production net(b/d) | | | | | | | | | |
| | Hibernia | | | 26,900 | | | 35,700 | | | 39,800 |
| | Terra Nova | | | 39,500 | | | 12,800 | | | 33,700 |
| | White Rose | | | 32,300 | | | 24,200 | | | 1,800 |
|
| Total East Coast Canada production net | | | 98,700 | | | 72,700 | | | 75,300 |
|
| Average realized crude price($/bbl) | | $ | 75.87 | | $ | 71.12 | | $ | 63.15 |
|
| Operating and overhead costs($/bbl) | | $ | 4.86 | | $ | 7.71 | | $ | 4.52 |
|
Hibernia production averaged 134,500 b/d gross (26,900 b/d net) in 2007, down from 178,500 b/d gross (35,700 b/d net) in 2006, reflecting natural reservoir declines. Early in 2007, Hibernia experienced a mechanical failure on one of the platform's main power generators, thereby reducing production. The main power generator was repaired as part of a planned Hibernia 30-day turnaround completed in the first quarter of 2007. The total royalty paid at Hibernia in 2007 equated to a rate of 5% of gross revenues.
At Terra Nova, production averaged 116,200 b/d gross (39,500 b/d net), up considerably from 37,600 b/d gross (12,800 b/d net) in 2006. Terra Nova production was lower in 2006 due to a planned maintenance turnaround. The Terra Nova FPSO operated at 86% facility reliability in 2007 and achieved a cumulative production milestone of 200 MMbbls by mid-year. In December 2006, the Terra Nova FPSO experienced a mechanical issue in a swivel connection on the turret system that supports water injection to the reservoir. A repair was completed in December 2006 and production returned to normal rates in excess of 100,000 b/d gross (34,000 b/d net). Performance of the water injection swivel was unchanged throughout 2007. Plans have been developed and parts have been sourced for the repair or replacement of the swivel in the event that performance deteriorates. The total royalty paid at Terra Nova in 2007 equated to a rate of 25% of gross revenues.
Management's Discussion and Analysis PETRO-CANADA 37
White Rose operated reliably in 2007, ramping up production to average 117,500 b/d gross (32,300 b/d net), compared with 88,000 b/d gross (24,200 b/d net) in 2006. A scheduled 16-day turnaround was completed at White Rose in the third quarter of 2007. In 2007, White Rose achieved simple and tier one payout, thereby increasing royalties to 20% of net revenues. The total royalty paid in 2007 equated to a rate of 10% of gross revenues.
East Coast Canada operating and overhead costs averaged $4.86/bbl in 2007, compared with $7.71/bbl in 2006. Unit operating costs for East Coast Canada decreased as a result of higher production in the year. Unit operating costs in 2006 reflected costs for the Terra Nova dry dock turnaround.
2007 Strategic Initiatives
In January 2007, the Government of Newfoundland and Labrador rejected the decision report of the Canada-Newfoundland and Labrador Offshore Petroleum Board (C-NLOPB) to approve the development of the Hibernia Southern Extension. During 2007, the operator continued to address requests for additional information by the Government of Newfoundland and Labrador regarding the Hibernia Southern Extension development plan amendment (DPA) application.
In August 2007, the Hebron partners signed a non-binding memorandum of understanding (MOU) with the Government of Newfoundland and Labrador related to the fiscal and other terms for the future development of the Hebron/Ben Nevis offshore field.
In September 2007, the Government of Newfoundland and Labrador approved the C-NLOPB recommendation to permit development of the South White Rose Extension. Shortly thereafter, the White Rose partners reached an agreement in principle with the province on fiscal and other terms for the White Rose Extensions development, incorporating the South White Rose Extension, North Amethyst and West White Rose satellite fields. In December 2007, Petro-Canada and its partners signed a formal agreement with the Province of Newfoundland and Labrador for the development of these oilfields. The Company anticipates North Amethyst will be developed initially, with first oil targeted for late 2009. The development of the West White Rose satellite is expected to follow. FEED for the North Amethyst portion of the project is complete and detailed design is underway, with necessary long-lead equipment and drilling commitments in place. The partners' objective is to achieve a timely regulatory decision and to facilitate making the final investment decision for North Amethyst in the first half of 2008.
Capital expenditures for exploration and development of crude oil offshore Canada's East Coast were $159 million in 2007, including $89 million related to the development of the White Rose oilfield, $48 million for Hibernia development drilling and $22 million for Terra Nova and other development drilling.
Outlook
Production expectations in 2008
- •
- East Coast production is expected to average 85,000 b/d net, reflecting 16-day planned turnarounds at both Terra Nova and White Rose
Growth plans
- •
- achieve greater than 90% reliability at Terra Nova
- •
- begin development drilling in the North Amethyst satellite field of White Rose
- •
- advance Hibernia Southern Extension development plan discussions with the Government of Newfoundland and Labrador to facilitate project planning and approvals
- •
- achieve binding formal agreements and re-establish the Hebron project team with the goal of submitting the project for regulatory approval in the 2010 time frame
- •
- advance White Rose Extensions development toward final investment decision in 2008
Capital spending plans in 2008
- •
- approximately $295 million is expected to be spent primarily on advancing the White Rose Extensions developments and drilling to replace reserves at Hibernia and White Rose
38 PETRO-CANADA Management's Discussion and Analysis
East Coast Canada production is expected to be 85,000 b/d in 2008, compared with actual production of 98,700 b/d in 2007. The 2008 production estimate reflects natural declines at Hibernia and Terra Nova, while White Rose volumes are expected to come off plateau. Terra Nova and White Rose have planned maintenance turnarounds of 16 days each. White Rose has advanced its planned 2008 turnaround from the summer of 2008 to January 2008 to facilitate required cleaning and inspection of the low pressure separator. The Terra Nova turnaround is planned in the summer of 2008. There is no major turnaround planned for Hibernia in 2008.
Beyond 2008, the East Coast Canada business intends to offset natural declines in the main reservoirs and sustain profitable production by adding production from reservoir extensions and satellite tie-ins. The Hebron project remains a significant resource the Company would like to see developed, subject to the conclusion of definitive project agreements with the provincial government.
Management's Discussion and Analysis PETRO-CANADA 39
Link to Petro-Canada's Corporate and Strategic Priorities
The East Coast Canada business is aligned with Petro-Canada's strategic priorities as outlined by its progress in 2007 and goals for 2008.
| PRIORITY | | 2007 GOALS | | 2007 RESULTS | | 2008 GOALS |
|
Delivering Profitable Growth with a Focus on Operated, Long-Life Assets |
|
• advance in-field Hibernia growth prospects
• delineate West White Rose
• progress development plans for South White Rose Extension, North Amethyst and West White Rose prospects |
|
• continued to address questions raised by the Government of Newfoundland and Labrador relative to the DPA application for the Hibernia Southern Extension
• drilled two delineation wells at West White Rose
• White Rose received regulatory approval for the development of the Southern Extension and completed a formal binding agreement for the overall White Rose Extensions development
• signed MOU with the Government of Newfoundland and Labrador for the development of Hebron |
|
• advance White Rose Extensions development toward regulatory approval and final investment decision in 2008, with first oil targeted for late 2009
• commence development drilling for the White Rose Extensions project
• achieve binding formal agreements and re-establish the Hebron project team, with the goal of submitting the project for regulatory approval in the 2010 time frame
• advance in-field Hibernia Southern Extension growth project |
|
Driving for First Quartile Operation of Our Assets |
|
• work toward improving Terra Nova reliability to the 90% range
• conduct 30-day turnaround scheduled at Hibernia for regulatory compliance
• complete 16-day turnaround at White Rose
• receive regulatory approval to increase annual production from SeaRose FPSO at White Rose |
|
• achieved 86% reliability at Terra Nova
• completed Terra Nova Phase 1 drilling
• Hibernia and White Rose successfully completed their planned turnarounds
• White Rose granted regulatory approval to increase the daily oil production rate to 140,000 b/d gross (38,500 b/d net) and to increase the annual oil production rate to 50 MMbbls
• decreased overall operating and overhead costs, compared with 2006 |
|
• achieve and maintain greater than 90% reliability at Terra Nova
• finalize Terra Nova swivel repair plans
• complete 16-day turnarounds at Terra Nova and partner-operated White Rose |
|
Continuing to Work at Being a Responsible Company |
|
• further reduce TRIF
• apply lessons learned from oily water discharge to prevent future incidents
• maintain zero regulatory exceedances |
|
• TRIF decreased to 0.51, compared with 1.38 in 2006
• achieved zero regulatory compliance exceedances for a second year in a row
• completed loss containment analysis and action plan
• increased process safety focus |
|
• continue to reduce injuries and illnesses through implementation of Exposure Based Safety program and First Aid reduction initiatives
• enhance focus on process safety management
• continue to implement loss containment improvement plan
• continue to enhance produced water management
• integrate stakeholder management process and tools and streamline with regulatory processes and requirements |
|
40 PETRO-CANADA Management's Discussion and Analysis
International
For reporting purposes, Petro-Canada has consolidated its International activities into two core areas: the North Sea (the United Kingdom (U.K.), the Netherlands and Norway sectors) and Other International areas (Libya, Syria, offshore Trinidad and Tobago and Venezuela1). This change better reflects existing production and exploration interests.
- 1
- The Company completed the sale of its Venezuelan assets and closed the local office in 2007.
Business Summary and Strategy
International production and exploration interests are currently focused in two core areas. In the North Sea, production comes from the U.K. and the Netherlands sectors, with exploration activities extending into Denmark and Norway. The Other International region provides crude oil production from assets in Libya, natural gas production from operations offshore Trinidad and Tobago, and exploration and development activity in Syria.
The International strategy is to access a sizable resource base using a three-fold approach:
- •
- optimize and leverage existing assets
- •
- seek out new, long-life opportunities
- •
- execute a substantial and balanced exploration program
In 2005, Petro-Canada reached an agreement to sell the Company's mature producing assets in Syria. The sale was closed on January 31, 2006. These assets and associated results are reported as discontinued operations and excluded from continuing operations. Sale proceeds were used to buy back shares under the NCIB program.
International Financial Results
(millions of Canadian dollars) | | | 2007 | | | 2006 | | | 2005 | |
| |
| Net earnings (loss) from continuing operations | | $ | 374 | | $ | (206 | ) | $ | (109 | ) |
| |
| Cash flow from continuing operating activities 1 | | $ | 220 | | $ | 840 | | $ | 722 | |
| Expenditures on property, plant and equipment and exploration from continuing operations | | $ | 762 | | $ | 760 | | $ | 696 | |
| Total assets from continuing operations | | $ | 5,180 | | $ | 6,031 | | $ | 4,856 | |
| |
- 1
- International cash flow from continuing operating activities in 2007 was reduced by the payment of $1,145 million after-tax to settle the Buzzard derivative contracts.
2007 Compared with 2006
International contributed a record $374 million of net earnings, up 282% from a net loss of $206 million in 2006. Higher realized prices and production were partially offset by higher exploration, DD&A expenses and increased losses on the derivative contracts associated with the Buzzard acquisition.
Net earnings from continuing operations in 2007 included net losses on the derivative contracts associated with the Buzzard acquisition of $331 million, a $30 million income tax recovery, a $9 million gain on the sale of non-core assets and $5 million in insurance proceeds from the Scott platform fire. Net loss from continuing operations in 2006 included a $242 million charge for the
Management's Discussion and Analysis PETRO-CANADA 41
U.K. supplemental corporate tax rate adjustment, a $240 million net loss on the Buzzard derivative contracts, a $12 million gain on the sale of non-core assets, an $8 million insurance premium surcharge and $3 million in insurance proceeds from the Scott platform fire.
Late in 2007, the Company entered into derivative contracts to close out the hedged portion of its Buzzard production from January 1, 2008 to December 31, 2010. Under the terms of the contracts, the Company repurchased 30,688,000 bbls of Dated Brent crude oil at an average price of approximately $85.79 US/bbl, resulting in a reduction in cash flow of $1,145 million after-tax.
International production from continuing operations averaged 150,500 boe/d net in 2007, compared with 103,600 boe/d net in 2006. The significant increase was primarily due to additional North Sea production. International crude oil and liquids realized prices from continuing operations averaged $75.90/bbl and natural gas realized prices averaged $6.46/Mcf in 2007, compared with $72.69/bbl and $7.64/Mcf, respectively, in 2006. Operating and overhead costs from continuing operations averaged $9.12/boe in 2007, up 20% compared with $7.61/boe in 2006, due to higher operating costs in Libya.
International capital expenditures from continuing operations in 2007 were $762 million, with $395 million directed to the North Sea region, primarily for the Saxon development, and $367 million invested in Other International and other capital projects.
2007 Operating Review and Strategic Initiatives
In 2007, the International business strengthened its production profile by delivering first production from Buzzard and Saxon in the North Sea.
2007 Operating Review
|
|
|
2007 |
|
|
2006 |
|
|
2005 |
|
| Production from continuing operations net(boe/d) | | | | | | | | | |
| | North Sea | | | 91,000 | | | 43,700 | | | 44,600 |
| | Other International | | | 59,500 | | | 59,900 | | | 61,700 |
|
| Total International production net | | | 150,500 | | | 103,600 | | | 106,300 |
|
| Average realized crude oil and NGL price from continuing | | | | | | | | | |
| | operations($/bbl) | | $ | 75.90 | | $ | 72.69 | | $ | 65.93 |
| Average realized natural gas price from continuing operations($/Mcf) | | $ | 6.46 | | $ | 7.64 | | $ | 7.13 |
| Operating and overhead costs from continuing operations($/boe) | | $ | 9.12 | | $ | 7.61 | | $ | 7.60 |
|
42 PETRO-CANADA Management's Discussion and Analysis
North Sea
Petro-Canada's North Sea production averaged 91,000 boe/d net in 2007, compared with 43,700 boe/d net in 2006. The addition of production from Buzzard and Saxon and a full year of production from De Ruyter and L5b-C were partially offset by natural declines. North Sea crude oil and liquids realized prices averaged $75.12/bbl and natural gas averaged $7.94/Mcf in 2007, compared with $72.67/bbl and $8.91/Mcf, respectively, in 2006.
During 2007, Petro-Canada continued to leverage its existing infrastructure through concentric development near core areas and through new discoveries.
In the U.K. sector of the North Sea, the Buzzard development, in which the Company has a 29.9% interest, achieved first oil in January 2007. The field ramped up to peak production of 220,000 boe/d gross (65,700 boe/d net) in July 2007. In 2006, a rig was secured to complete a 12-month program of development, infill and exploration drilling, which began in early 2007. This program included completing the Saxon project, 100% owned and operated by Petro-Canada. The Saxon development was tied back to the Triton area infrastructure and came on-stream in November 2007.
Following the discovery in 2005 on the Petro-Canada operated 13/27a Block (90% working interest), the Company farmed into adjacent Blocks 13/26a and 13/26b in September 2006, obtaining a 27.5% non-operated working interest. An appraisal well was drilled during 2007 on Block 13/26a, which encountered hydrocarbons. This well did not confirm the commerciality of the original Block 13/27a discovery.
On Block 13/21b, Petro-Canada, as operator with a 50% working interest in the Block, drilled a successful exploration well late in 2007. The Company and its partners will complete further appraisal work before considering development options. In late 2006, the Golden Eagle discovery was made on the non-operated Block 20/1 North located near the Buzzard field. The Company has a 25% working interest in this licence and work is ongoing to assess the possible development of the discovery. In early 2007, Petro-Canada was awarded Block 13/24d in the U.K. 24th licensing round. The Company is operator with a 90% working interest.
In the Netherlands sector of the North Sea, the Company drilled two successful exploration wells in 2007, van Nes and van Brakel, near De Ruyter, in which Petro-Canada is operator with a 50% and 60% working interest, respectively. Both van Nes and van Brakel have been suspended as gas discoveries and the Company is assessing its development options. The De Ruyter and L5b-C developments achieved first production in 2006. De Ruyter, a Petro-Canada operated oil development, delivered 25,200 boe/d gross (13,600 boe/d net) in 2007. The Company has a 54.07% working interest in De Ruyter.
In 2007, the Company was awarded nine additional production licences in the 2006 Awards in Predefined Areas (APA) round in Norway. Petro-Canada is operator of five of the 14 licences in Norway.
Other International
Libya
In 2007, Petro-Canada's production from continuing operations in Libya averaged 47,700 boe/d net, down 3% from 49,400 boe/d net in 2006. Libyan crude oil and liquids realized prices from continuing operations averaged $77.26/bbl in 2007, compared with $72.70/bbl in 2006.
In the first quarter of 2007, the National Oil Corporation (NOC) of Libya renamed all of the joint ventures operating in Libya. Petro-Canada's joint venture name has been changed from Veba Oil Operations (VOO) to Harouge Oil Operation (HOO).
In late 2007, Petro-Canada signed binding heads of agreement with the NOC to convert its old Exploration and Production Sharing Agreements (EPSA), except for its exploration licence on Block 137, into six EPSA IV agreements. Once ratified, the EPSAs will run for 30 years and enable the Company and NOC to jointly design and implement the redevelopment of more than 20 major fields and continue exploration in the Sirte Basin. Under the terms of the agreements, Petro-Canada is required to pay a signature bonus of $1 billion. Petro-Canada and NOC will each pay one-half of development expenditures, which are expected to total up to
Management's Discussion and Analysis PETRO-CANADA 43
$7 billion US gross. As operator, the Company has also committed to fully fund an exploration program at an estimated cost of $460 million US over a five- to seven-year period.
In 2007, preparations continued for exploration activities on Block 137 in the Sirte Basin, where Petro-Canada is the operator with a 50% working interest. In the third quarter of 2007, the Company completed an environmental impact assessment and Petro-Canada expects to begin 2D and 3D seismic acquisition early in 2008.
In 2007, 14 wells were drilled in the producing fields in Libya (six development wells, six water supply wells and two injector wells). Twelve of the wells were completed. A further two exploration wells were drilled, one of which was a discovery.
Syria
In 2007, the Company commenced the FEED and undertook 2D and 3D seismic operations for the Ebla gas project. When completed, the Ebla gas project is expected to produce an estimated 80 MMcf/d of natural gas from the Ash Shaer and Cherrife natural gas fields, with first gas anticipated in 2010. In December 2007, the Company exercised its option to purchase the remaining 10% interest in the Ebla gas Production Sharing Contracts (PSC).
On Block II, the Company drilled two exploration wells in 2007. The Al Houlou well was plugged and abandoned as a dry hole, while the Al Dahramat well has been suspended and is pending further testing.
Trinidad and Tobago
In 2007, Petro-Canada's share of Trinidad and Tobago offshore production averaged 71 MMcf/d net, up from 63 MMcf/d net in 2006. Increased production reflected the ability to take advantage of short-term opportunities to supply additional volumes to the Atlantic LNG trains. Trinidad and Tobago realized prices for natural gas averaged $4.34/Mcf in 2007, compared with $5.13/Mcf in 2006.
In 2007, Petro-Canada completed and received approval of its environmental impact assessments for the drilling programs on Blocks 1a, 1b and 22 in advance of the arrival of the contracted drilling rigs. In the third quarter of 2007, the Company drilled and completed the successful Zandolie West exploration well on Block 1a. The Anole well on Block 1b was abandoned as a dry hole and a second well on Block 1a, Zandolie East, was spud in December 2007. On Block 22 offshore Trinidad and Tobago, Petro-Canada, as operator with a 90% working interest in the Block, drilled the Cassra-1 well in 430 metres of water and reached a depth of 1,712 metres below sea level. The well was completed as a discovery and the Company and its partners expect to complete further appraisal work before considering development options. The Company continues to develop its 17.3% working interest in the North Coast Marine Area (NCMA-1) asset.
Other
In Algeria, Petro-Canada was the operator and had a 100% working interest in the Zotti Block. The Zotti exploration well in Algeria was abandoned as a dry hole in the first quarter of 2007. At the end of 2007, the Company closed its operations in Algeria.
In Tunisia during 2007, the Company focused on exploration of the offshore, non-operated Cap Serrat and Bechateur permits (33% working interest).
In Morocco, Petro-Canada extended its reconnaissance licence on the Bas Draa Block. A gravity magnetic survey was completed in July 2007.
In Western Venezuela, Petro-Canada held a 50% working interest in the La Ceiba Block that straddles the eastern shores of Lake Maracaibo. In 2007, the Company disposed of its interest in the La Ceiba project, completing a settlement with the Venezuelan Ministry for Energy and Petroleum to compensate Petro-Canada for its working interest in La Ceiba. At the end of 2007, Petro-Canada closed its office in Venezuela.
44 PETRO-CANADA Management's Discussion and Analysis
Outlook
Production expectations in 2008
- •
- North Sea oil and gas production to average 93,000 boe/d net
- •
- Other International oil and gas production to average 57,000 boe/d net
Growth plans
- •
- execute the exploration program offshore Trinidad and Tobago, North Sea and Libya
- •
- advance natural gas development in Syria
- •
- continue to pursue new business opportunities in LNG
Capital spending plans in 2008
- •
- approximately $986 million, primarily for new growth projects in Syria and Libya
- •
- approximately $366 million for reserves replacement spending in core areas, primarily at Buzzard, Guillemot West and on the producing fields offshore Trinidad and Tobago
- •
- approximately $283 million for exploration
International production from continuing operations is expected to be 150,000 boe/d net in 2008, similar to production levels of 150,500 boe/d net in 2007. Production in 2008 reflects the full-year contributions from Buzzard and Saxon. These projects are expected to offset the 15% to 20% natural declines in the North Sea.
The Company continued its discussions on importing gas from Russia to North America through a joint LNG project with OAO «Gazprom» (Gazprom). In February 2008, Petro-Canada was informed that Gazprom had decided not to pursue this project and instead wanted to focus on other projects.
Management's Discussion and Analysis PETRO-CANADA 45
Link to Petro-Canada's Corporate and Strategic Priorities
The International business is aligned with Petro-Canada's strategic priorities as outlined by its progress in 2007 and goals for 2008.
| PRIORITY | | 2007 GOALS | | 2007 RESULTS | | 2008 GOALS |
|
Delivering Profitable Growth with a Focus on Operated, Long-Life Assets |
|
• ramp up Buzzard and L5b-C to full production
• achieve first production at Saxon in the U.K. sector of the North Sea by year end
• participate in up to a 17-well exploration drilling program, (depending on rig arrival dates) with balanced risk profile over the next 18 months
• commence field appraisal and project design activities on the Syria Ebla gas project
• establish a Libyan exploration program on the newly acquired Sirte exploration block
• actively pursue LNG supply opportunities |
|
• Buzzard achieved first production early in 2007 and reached plateau production of 200,000 boe/d gross (59,800 boe/d net) in August 2007
• compressor problems and export line repairs prevented L5b-C from ramping up to full production in 2007
• achieved first oil at Saxon in November 2007
• drilled 15 exploration wells, with seven wells suspended as discoveries, five wells abandoned as dry holes and three wells being evaluated
• commenced FEED and undertook 2D and 3D seismic on the Syria Ebla gas project
• signed binding heads of agreement for a long-term redevelopment of the Libya concessions and a seven-year exploration program in the Sirte Basin
• continued negotiations with Gazprom for base load supply to proposed Gros-Cacouna re-gasification facility1 |
|
• evaluate 2007 exploration results and deliver 2008 exploration program
• award EPC contract for Syria Ebla gas project and finalize commercial agreements
• develop a transition plan for the Libya Concession Development project
• develop a detailed exploration program in Libya
• spud first well for the Syria Ebla gas project
• evaluate opportunities to commercialize Trinidad and Tobago gas discoveries, subject to exploration results |
|
| Driving for First Quartile Operation of Our Assets | | • maintain excellent reliability at De Ruyter platform
• optimize production capacity on Triton area assets by implementing recommendations from de-bottlenecking study | | • delivered 87% production efficiency at De Ruyter
• reviewed options for the purchase of Triton de-bottlenecking equipment prior to making the investment decision | | • maintain excellent production efficiency at the operated De Ruyter and Hanze platforms
• deliver plateau level production at Buzzard while the enhancement program is implemented |
|
Continuing to Work at Being a Responsible Company |
|
• maintain focus on TRIF, and increase leadership visibility of Zero-Harm effort
• reduce oil in produced water at Triton
• collaborate with local stakeholders in Trinidad and Tobago to minimize impact of offshore drilling |
|
• TRIF increased to 1.42, compared with 0.80 in 2006 due to the impact of new contractor seismic and drilling operations
• achieved zero regulatory compliance exceedances for a second year in a row
• implemented new technology that reduced oil in produced water at Triton by 26% in 2007 to 18.8 milligrams (mg)/litre from 25.3 mg/litre in 2006
• completed environmental impact assessments on Block 137 in Libya, Block 2 and the Ebla gas project in Syria and on Blocks 1a, 1b and 22 offshore Trinidad and Tobago
• proactively managed environmental and fisheries issues in Trinidad and Tobago and endangered species issues in Syria |
|
• continue to work with contractors to reduce injuries and illnesses
• continue to improve TLM systems and processes in Libya
• complete the environmental impact assessment for the Ebla gas project in Syria
• continue to develop stakeholder management processes to maintain positive outcomes with key stakeholders |
|
- 1
- In February 2008, Petro-Canada was informed that Gazprom had decided not to pursue this project and instead wanted to focus on other projects.
46 PETRO-CANADA Management's Discussion and Analysis
Discontinued Operations
On January 31, 2006, Petro-Canada completed the sale of the Company's producing assets in Syria to a joint venture of companies owned by India's Oil and Natural Gas Corporation Limited and the China National Petroleum Corporation for net proceeds of $640 million. The sale resulted in a gain on disposal of $134 million recorded in the first quarter of 2006. This sale aligned with Petro-Canada's strategy to increase the proportion of long-life and operated assets within its portfolio. Petro-Canada's activities in Syria remain part of the Other International producing region, with an active exploration program in Block II and the addition of the Ebla gas project in Syria during 2006.
Producing assets in Syria are presented as discontinued operations in the Consolidated Financial Statements. Petro-Canada's net earnings from discontinued operations in 2006 were $152 million and included a gain on disposal of $134 million. Summary information is presented below. Additional information concerning Petro-Canada's discontinued operations can be found in Note 4 to the Consolidated Financial Statements.
Discontinued Financial Results
| (millions of Canadian dollars, unless otherwise noted) | | | 2007 | | | 2006 | | | 2005 |
|
| Net earnings from discontinued operations | | $ | – | | $ | 152 | | $ | 98 |
|
| Cash flow from discontinued operating activities | | $ | – | | $ | 15 | | $ | 204 |
| Expenditures on property, plant and equipment and exploration | | $ | – | | $ | 1 | | $ | 46 |
| Total assets | | $ | – | | $ | – | | $ | 648 |
|
| Total volumes(boe/d) | | | | | | | | | |
| | – net before royalties | | | – | | | 5,500 | | | 70,100 |
| | – net after royalties | | | – | | | 1,400 | | | 21,000 |
|
| Average realized crude oil and NGL price($/bbl) | | $ | – | | $ | 71.84 | | $ | 61.82 |
|
| Average realized natural gas price($/Mcf) | | $ | – | | $ | 7.94 | | $ | 6.43 |
|
Management's Discussion and Analysis PETRO-CANADA 47
Upstream Production
2007 Compared with 2006
In 2007, Petro-Canada's production from continuing operations of crude oil, NGL and natural gas averaged 418,400 boe/d net, up 21% from 345,400 boe/d net in 2006.
| |
| |
| | International & Offshore
| |
|
|---|
| | | | | | |
| | |
2007 Average Daily Production Volumes Net
| | North American Natural Gas
| | Oil Sands
| | East
Coast Canada
| | International
| | Total
|
|---|
|
| Crude oil, NGL and bitumen(b/d) | | | | | | | | | | |
| | – net before royalties | | 12,500 | | 20,300 | | 98,700 | | 129,000 | | 260,500 |
| | – net after royalties | | 9,500 | | 20,100 | | 84,400 | | 124,700 | | 238,700 |
| Synthetic crude oil(b/d) | | | | | | | | | | |
| | – net before royalties | | – | | 36,600 | | – | | – | | 36,600 |
| | – net after royalties | | – | | 31,100 | | – | | – | | 31,100 |
| Natural gas(MMcf/d) | | | | | | | | | | |
| | – net before royalties | | 599 | | – | | – | | 129 | | 728 |
| | – net after royalties | | 471 | | – | | – | | 123 | | 594 |
|
| Continuing operations(boe/d) | | | | | | | | | | |
| | – net before royalties | | 112,300 | | 56,900 | | 98,700 | | 150,500 | | 418,400 |
| | – net after royalties | | 88,000 | | 51,200 | | 84,400 | | 145,200 | | 368,800 |
|
| Discontinued operations(boe/d) | | | | | | | | | | |
| | – net before royalties | | – | | – | | – | | – | | – |
| | – net after royalties | | – | | – | | – | | – | | – |
|
| Total volumes(boe/d) | | | | | | | | | | |
| | – net before royalties | | 112,300 | | 56,900 | | 98,700 | | 150,500 | | 418,400 |
| | – net after royalties | | 88,000 | | 51,200 | | 84,400 | | 145,200 | | 368,800 |
|
| |
| |
| | International & Offshore
| |
|
|---|
| | | | | | |
| | |
2006 Average Daily Production Volumes Net
| | North American Natural Gas
| | Oil Sands
| | East
Coast Canada
| | International
| | Total
|
|---|
|
| Crude oil, NGL and bitumen(b/d) | | | | | | | | | | |
| | – net before royalties | | 14,200 | | 21,200 | | 72,700 | | 82,600 | | 190,700 |
| | – net after royalties | | 10,800 | | 20,800 | | 68,500 | | 77,900 | | 178,000 |
| Synthetic crude oil(b/d) | | | | | | | | | | |
| | – net before royalties | | – | | 31,000 | | – | | – | | 31,000 |
| | – net after royalties | | – | | 28,000 | | – | | – | | 28,000 |
| Natural gas(MMcf/d) | | | | | | | | | | |
| | – net before royalties | | 616 | | – | | – | | 126 | | 742 |
| | – net after royalties | | 489 | | – | | – | | 95 | | 584 |
|
| Continuing operations(boe/d) | | | | | | | | | | |
| | – net before royalties | | 116,900 | | 52,200 | | 72,700 | | 103,600 | | 345,400 |
| | – net after royalties | | 92,300 | | 48,800 | | 68,500 | | 93,700 | | 303,300 |
|
| Discontinued operations(boe/d) | | | | | | | | | | |
| | – net before royalties | | – | | – | | – | | 5,500 | | 5,500 |
| | – net after royalties | | – | | – | | – | | 1,400 | | 1,400 |
|
| Total volumes(boe/d) | | | | | | | | | | |
| | – net before royalties | | 116,900 | | 52,200 | | 72,700 | | 109,100 | | 350,900 |
| | – net after royalties | | 92,300 | | 48,800 | | 68,500 | | 95,100 | | 304,700 |
|
48 PETRO-CANADA Management's Discussion and Analysis
2008 Production Outlook
Upstream production is expected to decrease slightly in 2008, primarily due to natural declines in East Coast Canada and Western Canada. Offsetting these decreases is the expectation of additional volumes from the full-year impact of Buzzard and Saxon in the North Sea and higher planned Oil Sands production. Production is expected to average in the range of 390,000 boe/d to 420,000 boe/d in 2008.
Factors that may impact production during 2008 include reservoir performance, drilling results, facility reliability and the successful execution of planned turnarounds.
Production from Continuing Operations
2007 upstream production increased 21%, compared with 2006 due to the addition of North Sea projects (Buzzard and Saxon). In 2008, upstream production is expected to decrease slightly, primarily due to natural declines in East Coast Canada and Western Canada.
(thousands of bbls of oil equivalent/day –
Mboe/d, net before royalties)
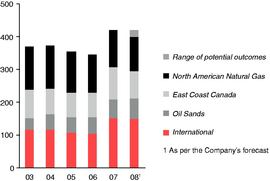
Consolidated Production from Continuing Operations Net
| | 2007 Outlook (+/-) | | 2007 Actual | | 2008 Outlook (+/-) |
| (thousands of boe/d) | As at July 26, 2007 | | | | |
|
| North American Natural Gas | | | | | |
| | Natural gas | 97 | | 100 | | 93 |
| | Liquids | 13 | | 12 | | 12 |
|
| Oil Sands | | | | | |
| | Syncrude | 34 | | 37 | | 35 |
| | MacKay River | 24 | | 20 | | 25 |
|
| International & Offshore | | | | | |
| East Coast Canada | 95 | | 99 | | 85 |
|
| International | | | | | |
| | North Sea | 90 | | 91 | | 93 |
| | Other International | 57 | | 59 | | 57 |
|
| Total continuing operations | 400 – 420 | | 418 | | 390 – 420 |
|
Management's Discussion and Analysis PETRO-CANADA 49
Reserves Summary
The Company's reserves data and reserves quantities are determined by Petro-Canada's staff of qualified reserves evaluators using corporate-wide policies, procedures and practices. These reserves policies, procedures and practices conform with the SEC standards, as well as with the requirements in Canada, and the Association of Professional Engineers, Geologists and Geophysicists of Alberta's Standard of Practice for the Evaluation of Oil and Gas Reserves for Public Disclosure. Petro-Canada also employs independent third parties to evaluate, audit and/or review its reserves processes and estimates. In 2007, 33% of North American (excluding Oil Sands) and 42% of International proved reserves were assessed by independent reserves evaluators. The independent reserves evaluators concluded that the Company's year-end reserves estimates were reasonable.
Petro-Canada's proved reserves table that conforms to SEC standards for Oil and Gas activities can be found on page 101.
The following table and the accompanying narrative do not conform to SEC standards and are for supplemental general information. The reporting of working interest reserves before royalties and MMboe do not conform to SEC standards.
December 31, 2007
Consolidated Reserves –
for Oil and Gas Activities
(working interest before royalties) | Proved liquids
(MMbbls) | | Proved gas
(Billion cubic
feet – Bcf) | | 2007 Proved reserves additions liquids1
(MMbbls) | | 2007 Proved reserves additions
gas1
(Bcf) | | Proved2
(MMboe) | | 2007 Proved reserves additions1
(MMboe) |
|
| North American Natural Gas | 45 | | 1,479 | | 3 | | 53 | | 291 | | 11 |
| Oil Sands3 | 276 | | – | | 127 | | – | | 276 | | 127 |
International & Offshore |
|
|
|
|
|
|
|
|
|
|
|
| East Coast Canada | 100 | | – | | 13 | | – | | 100 | | 13 |
| International | 251 | | 280 | | 20 | | 27 | | 298 | | 25 |
|
| Total | 672 | | 1,759 | | 163 | | 80 | | 965 | | 176 |
|
| Production net | 96 | | 266 | | | | | | 140 | | |
|
- 1
- Proved reserves additions are the sum of revisions of previous estimates, net purchases/sales, and discoveries, extensions and improved recovery.
- 2
- At year-end 2007, 57% of proved reserves were classified as proved developed reserves. Of the total proved undeveloped reserves, 95% were associated with large projects currently producing or under active development, including Buzzard, Syncrude, MacKay River, Hibernia, Terra Nova, White Rose and Trinidad and Tobago natural gas.
- 3
- Oil Sands proved reserves excluded reserves from Syncrude, which is considered a mining activity by the SEC.
At year-end 2007, the Company had 965 MMboe of proved reserves from oil and gas activities, compared with 929 MMboe at the end of 2006.
December 31, 2007
Reserves – for Syncrude Mining Operation | Proved Liquids | | 2007 Proved reserves
additions liquids1 |
| (working interest before royalties) | (MMbbls) | | (MMbbls) |
|
| Reserves of synthetic crude oil | 350 | | 18 |
| Production net | 13 | | |
|
- 1
- Proved reserves additions are the sum of revisions of previous estimates, net purchases/sales, and discoveries, extensions and improved recovery.
At year-end 2007, the Company had 350 MMbbls of proved reserves from oil sands mining operations, compared with 345 MMbbls at year-end 2006.
50 PETRO-CANADA Management's Discussion and Analysis
The following table and the accompanying narrative do not conform to SEC standards and are for supplemental general information.1
December 31, 2007
Consolidated Reserves –
for Oil and Gas and Oil Sands Mining Activities | Proved liquids | | Proved gas | | 2007 Proved reserves additions liquids1 | | 2007 Proved reserves additions
gas1 | | Proved2 | | 2007 Proved reserves additions1 |
| (working interest before royalties) | (MMbbls) | | (Bcf) | | (MMbbls) | | (Bcf) | | (MMboe) | | (MMboe) |
|
| North American Natural Gas | 45 | | 1,479 | | 3 | | 53 | | 291 | | 11 |
| Oil Sands3 | 626 | | – | | 145 | | – | | 626 | | 145 |
| International & Offshore | | | | | | | | | | | |
| East Coast Canada | 100 | | – | | 13 | | – | | 100 | | 13 |
| International | 251 | | 280 | | 20 | | 27 | | 298 | | 25 |
|
| Total | 1,022 | | 1,759 | | 181 | | 80 | | 1,315 | | 194 |
|
| Production net | 109 | | 266 | | | | | | 153 | | |
|
- 1
- Proved reserves additions are the sum of revisions of previous estimates, net purchases/sales, and discoveries, extensions and improved recovery.
- 2
- At year-end 2007, 57% of proved reserves were classified as proved developed reserves. Of the total proved undeveloped reserves, 95% were associated with large projects currently producing or under active development, including Buzzard, Syncrude, MacKay River, Hibernia, Terra Nova, White Rose and Trinidad and Tobago natural gas.
- 3
- Oil Sands proved reserves included reserves from Syncrude and MacKay River.
Petro-Canada's objective is to replace reserves over time through exploration, development and acquisition. The Company believes that, due to the specific nature of its upstream portfolio and attributes of its probable reserves, the combination of proved plus probable reserves provides the best perspective of Petro-Canada's reserves.
In 2007, total consolidated proved reserves for oil and gas and oil sands mining activities was 1,315 MMboe, compared with 1,274 MMboe in 2006.
The North American Natural Gas business added 11 MMboe of proved reserves additions in 2007. Reserves additions were due to exploration and development activity, partially offset by technical revisions related to reservoir performance of some Western Canada pools.
In 2007, 145 MMbbls of proved reserves were added in Oil Sands2. At MacKay River, demonstrated performance, delineation drilling and progress with regulatory approval for an expanded development area resulted in the addition of 127 MMbbls of proved reserves. At Syncrude, 18 MMbbls were added to proved reserves as a result of optimizing the Aurora North mine plan.
In East Coast Canada, a total of 13 MMbbls were added to proved reserves during 2007. This was due to ongoing development well drilling and production performance at White Rose, Terra Nova and Hibernia.
International proved reserves increased by 25 MMboe in 2007, due primarily to development drilling at Buzzard and the startup of Saxon in the U.K. North Sea.
Further detail on Petro-Canada's reserves is provided in the reserves table at the end of this report (see pages 100 to 104).
- 1
- The reporting of working interest reserves before royalties, MMboe and combining oil and gas and oil sands mining activities together do not conform to SEC standards.
- 2
- Oil Sands proved reserves include reserves from Syncrude and MacKay River. Syncrude is an oil sands mining operation. Oil sands mining is not an oil and gas activity as defined by the SEC. The oil sands mining proved reserves are estimated in accordance with the SEC Industry Guide 7.
Management's Discussion and Analysis PETRO-CANADA 51
Downstream
Business Summary and Strategy
Petro-Canada has the second largest Downstream business and is the "brand of choice" in Canada. In 2007, Petro-Canada accounted for approximately 13% of the total refining capacity in Canada and about 16% of total petroleum products sold in Canada.
Downstream operations include two refineries – one in Edmonton and one in Montreal - with a total daily rated capacity of 40,500 cubic metres/day (m3/d) (255,000 b/d), a lubricants plant that is the largest producer of lubricant base stocks in Canada, a network of more than 1,300 retail service stations, Canada's largest national commercial road transport network of 229 locations and a robust bulk fuel sales channel.
The strategy in the Downstream business is to increase the profitability of the base business through effective capital investment and disciplined management of controllable factors. In 2008, planned Downstream capital investment focuses
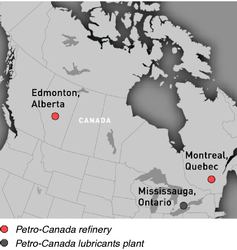
on growth projects. The Downstream business goal is to deliver superior returns and growth, including a 12% return on capital employed (ROCE) based on a mid-cycle business environment. Key features of the strategy include:
- •
- achieving and maintaining first quartile operating performance in all areas
- •
- managing and reducing costs, with a specific focus on reducing feedstock costs
- •
- growing revenue
The trend toward increased heavy crude production globally has resulted in an increased need for refining capacity that can process this feedstock. In addition, the present excess supply of domestic heavy crudes has led to a widening in light/heavy crude price differentials. As a result, Petro-Canada is converting the conventional crude oil train at its Edmonton refinery to refine oil sands-based feedstock and the Company is considering construction of a 25,000 b/d coker at its Montreal refinery.
Downstream Financial Results
(millions of Canadian dollars) | | | 2007 | | | 2006 | | | 2005 |
|
| Net earnings | | $ | 629 | | $ | 473 | | $ | 415 |
|
| Cash flow from continuing operating activities | | $ | 994 | | $ | 835 | | $ | 663 |
| Expenditures on property, plant and equipment | | $ | 1,396 | | $ | 1,229 | | $ | 1,053 |
| Total assets | | $ | 7,989 | | $ | 6,649 | | $ | 5,609 |
|
52 PETRO-CANADA Management's Discussion and Analysis
2007 Compared with 2006
Downstream contributed a record $629 million of net earnings, up 33% from $473 million in 2006. Solid reliability at the Edmonton and Montreal refineries allowed Petro-Canada to maximize the benefits of unprecedented light oil refining margins.
Net earnings in 2007 included a $34 million income tax recovery and a $7 million gain on the sale of assets. Net earnings in 2006 included a $41 million income tax recovery, a $10 million gain on the sale of assets and an $8 million insurance premium surcharge.
Refining and Supply contributed 2007 net earnings of $446 million, compared with $338 million in 2006. Higher 2007 net earnings reflected favourable realized refining margins.
Total sales of refined products increased by 1%, compared with 2006. The increased volumes were mainly due to an increase in higher value retail and wholesale volume, partially offset by lower refining and supply sales.
In 2007, marketing contributed net earnings of $183 million, compared with $135 million in 2006. Improved margins were partially offset by increased costs related to higher fuel prices.
Total Downstream operating, marketing, and G&A unit costs of 7.8 cents/litre in 2007 were flat, compared with 2006.
2007 Operating Review and Strategic Initiatives
In 2007, the Downstream delivered record net earnings for the fourth year in a row of $629 million due to solid execution of its strategies and management of controllables. These factors provided the opportunity to capture the unprecedented light oil business environment experienced earlier in the year. Petro-Canada is well positioned with the supply capability to optimize profitability within a range of future business environment scenarios.
Refining and Supply
In 2007, the business processed an average of 40,100 m3/d of crude oil, up from 37,800 m3/d in 2006. The overall utilization rate at Petro-Canada's two refineries averaged 99% in 2007, up from 93% in 2006. The increase reflected fewer planned maintenance turnarounds at the Edmonton and Montreal refineries, compared with the turnaround activity in 2006 related to completion of the ultra-low sulphur diesel projects.
Overall plant reliability is a critical component of success in the refining business. For the third year in a row, solid operational performance at both refineries resulted in an overall reliability index of more than 90. In 2007, the overall refinery reliability index was 92. This is down slightly from 2006 due to unplanned outages at the Edmonton refinery.
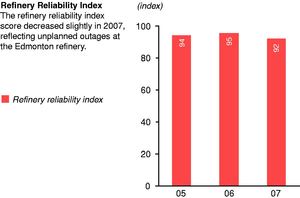
Looking forward, Petro-Canada is well positioned to take advantage of the trend toward increased production of cheaper, heavier crudes. At the Edmonton refinery in 2007, the Company continued construction of new crude and vacuum units, and expanded coker and sulphur capacity. This is part of the refinery conversion project to upgrade and refine oil sands-based feedstock. This project is estimated to cost $2.2 billion and come on-stream in 2008. At its Montreal refinery, the Company furthered work to evaluate the feasibility of adding a 25,000 b/d coker to the refinery. An investment decision on a new coker at the Montreal refinery is expected to be made in the second quarter of 2008.
Management's Discussion and Analysis PETRO-CANADA 53
Marketing
Total Downstream sales increased to an average 53,300 m3/d in 2007, compared with 52,500 m3/d in 2006. Higher volumes were mainly due to an increase in higher value retail and wholesale volume, partially offset by lower refinery and supply sales.
In the retail business, Petro-Canada completed the core of its re-imaging program, contributing to industry-leading throughputs. Within the Company's network, annual gasoline sales from re-imaged sites averaged just under seven million litres per site. The Company has extended the re-imaging program to independent retailers and, to date, nearly 60% of these retailers have chosen to participate.
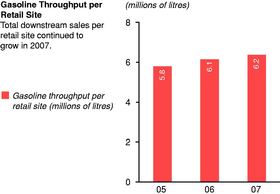
Petro-Canada continued to leverage its position as a market innovator with the advancement of new offerings such as Neighbours and Glide Autowash. Neighbours is a new retail concept that combines fresh food and coffee, with convenience products and services and fuel at a single location. Glide Autowash is a completely re-engineered, high quality car wash offer that allows consumers to choose between the touchless or cloth wash at the same facility. In 2007, the Company continued to focus on expanding its non-petroleum revenue base, as evidenced by the 9% year-over-year sales growth of its convenience store business and 7% increase in same-store sales, compared with 2006.
In 2007, the wholesale PETRO-PASS network, which includes 229 truck stop facilities, continued to be the leading national marketer of fuel in the commercial road transport segment in Canada. The distribution network was upgraded during the year.
Lubricants
Overall sales of lubricants totalled 778 million litres in 2007, an increase of 8% compared with sales volumes of 722 million litres in 2006. The increase in sales volumes was primarily due to higher base oil, white oil and commercial and industrial product sales, partially offset by lower process fluid sales.
Sales into high margin product segments grew to 562 million litres, a 3% increase compared with 2006. High margin product segments now represent 72% of total sales. Over the past five years, sales of high margin products have grown by approximately 18%.
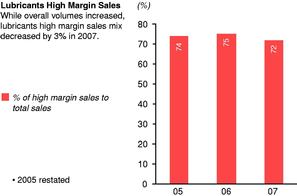
Lubricants is positioned for profitable future growth as tougher product performance and environmental standards increase global demand for higher quality base oils and finished products like those produced at the Mississauga lubricants plant. In 2007, Petro-Canada received international recognition for its new food grade lubricant, PURITY™ with MICROL™1 by winning the International Stevie Award® for Best New Product. This prestigious award recognizes outstanding performance in the workplace worldwide.
- 1
- MICROL is an antimicrobial product protection agent.
Downstream capital expenditure of $1,396 million in 2007 included $1,214 million in Refining and Supply, predominantly associated with the Edmonton refinery conversion project of $959 million and $97 million for the advancing of the potential 25,000 b/d Montreal coker, $155 million in Sales and Marketing and $27 million in Lubricants.
54 PETRO-CANADA Management's Discussion and Analysis
Outlook
Growth plans
- •
- drive for first quartile refinery safety and reliability
- •
- complete Edmonton refinery conversion project to process oil sands-based feedstock and startup in the fourth quarter of 2008
- •
- make investment decision for a coker at the Montreal refinery
- •
- increase service station network effectiveness, with a focus on increasing non-petroleum revenue
- •
- build wholesale volumes primarily through the commercial road transport and bulk fuels sales channels
- •
- increase sales of high quality, higher margin lubricants through expansion into new markets and introduction of new products
Capital spending plans in 2008
- •
- approximately $767 million focused on new growth projects, such as the Edmonton refinery conversion and the possible Montreal coker
- •
- approximately $138 million to improve profitability in the base business
- •
- approximately $136 million to enhance existing operations
- •
- approximately $84 million for regulatory compliance projects
Downstream investment is focused on growth and improving base business profitability. The Edmonton refinery conversion project is expected to add earnings and cash flow starting in late 2008.
The Downstream business will have a capital program of approximately $1,125 million in 2008. The majority of capital spending is forecasted for new growth project funding of $767 million. This capital will be directed toward completing the Edmonton refinery conversion project and advancing the potential 25,000 b/d Montreal coker.
Approximately $138 million is planned to be invested to improve the profitability of the Downstream's base business. This includes a number of high return refining projects and the continued development of the retail and wholesale network. A further $136 million is forecast to be directed to the enhancement of existing operations. This includes reliability and safety improvements at Downstream facilities, as well as site enhancement within the wholesale and retail networks.
Approximately $84 million is expected to be invested in regulatory compliance, relatively flat compared with the estimated $70 million invested in 2007.
Based on the current mid-cycle business environment, the Downstream business delivered a mid-cycle ROCE of just under 11% in 2007. Over time, it is anticipated that improvement in the base business and the refinery conversion projects will help drive the mid-cycle ROCE to the target of 12%.
Management's Discussion and Analysis PETRO-CANADA 55
Link to Petro-Canada's Corporate and Strategic Priorities
The Downstream business is aligned with Petro-Canada's strategic priorities as outlined by its progress in 2007 and goals for 2008.
| PRIORITY | | 2007 GOALS | | 2007 RESULTS | | 2008 GOALS |
|
Delivering Profitable Growth with a Focus on Operated, Long-Life Assets |
|
• continue the Edmonton refinery conversion project to enable the planned startup in 2008
• complete Montreal coker feasibility study for investment decision in 2007
• continue to invest in smaller scale refinery yield and reliability improvement projects
• continue to integrate the Montreal refinery and the ParaChem Chemicals L.P. plant |
|
• advanced construction of the Edmonton refinery conversion project, which was 61% complete at year-end 2007 and on track for planned startup in 2008
• completed FEED for proposed 25,000 b/d Montreal coker
• invested $41 million in smaller scale refinery yield and reliability improvement projects in 2007
• completed tunnel and pipelines and captured synergies between ParaChem plant and the Montreal refinery |
|
• advance Montreal coker, with final investment decision expected in the second quarter of 2008
• complete Edmonton refinery conversion project for startup in the fourth quarter of 2008
• continue to invest in smaller scale refinery yield and reliability improvement projects
• selectively invest in retail and wholesale assets |
|
Driving for First Quartile Operation of Our Assets |
|
• continue to focus on safety and refinery reliability
• increase retail non-petroleum revenue
• grow high margin lubricants sales volume |
|
• achieved a combined reliability index of 92 at the Company's two refineries
• grew convenience store sales by 9% and same-store sales by 7%, compared with 2006
• increased high margin lubricants sales volume by 3% in 2007 |
|
• continue to focus on safety and refinery reliability, with increased focus on process safety
• reduce feedstock costs
• increase retail non-petroleum revenue
• grow high margin lubricants sales volume |
|
Continuing to Work at Being a Responsible Company |
|
• maintain focus on TRIF and regulatory compliance exceedances
• meet provincial ethanol regulations
• continue to focus on community relations, including establishment of Community Liaison Committee in Montreal
• continue to look for partnerships with Aboriginal communities on retail opportunities |
|
• TRIF decreased to 0.64, compared with 0.80 in 2006
• recorded 12 regulatory compliance exceedances in 2007, compared with 10 in 2006
• complied with provincial ethanol regulations in Ontario and Saskatchewan
• established Montreal Liaison Committee and held an open house for the community
• grew retail business with Aboriginal communities in 2007 |
|
• maintain focus on TRIF and regulatory compliance exceedances
• assess highest risk retail sites for safety and security enhancements
• assess water use at retail and wholesale facilities and review our current management activities in high risk areas |
|
56 PETRO-CANADA Management's Discussion and Analysis
Shared Services
Shared Services includes investment income, interest expense, foreign currency translation and general corporate revenue and expenses.
Shared Services Financial Results
(millions of Canadian dollars) | | | 2007 | | | 2006 | | | 2005 | |
| |
| Net loss | | $ | (6 | ) | $ | (263 | ) | $ | (177 | ) |
| |
| Cash flow used in continuing operating activities | | $ | (603 | ) | $ | (346 | ) | $ | (163 | ) |
| |
2007 Compared with 2006
Shared Services recorded a net loss of $6 million in 2007, compared with a loss of $263 million in 2006.
The 2007 net loss included a $208 million foreign currency translation gain on long-term debt, a $54 million charge related to the mark-to-market valuation of stock-based compensation and a $5 million income tax recovery. The 2006 net loss included a $71 million charge for income tax adjustments, a $31 million charge related to the mark-to-market valuation of stock-based compensation and a $1 million foreign currency translation gain on long-term debt.
Fourth Quarter 2007
For a discussion and analysis of the Company's Fourth Quarter 2007 performance and results, see Petro-Canada's MD&A for that period, which is incorporated herein, by reference.
Management's Discussion and Analysis PETRO-CANADA 57
Financial Reporting
Critical Accounting Estimates
The preparation of the Company's financial statements requires management to adopt accounting policies that involve the use of significant estimates and assumptions. These estimates and assumptions are developed based on the best available information and are believed by management to be reasonable under the existing circumstances. New events or additional information may result in the revision of these estimates over time. The Audit, Finance and Risk Committee of the Board of Directors regularly reviews the Company's critical accounting policies and any significant changes thereto. A summary of the significant accounting policies used by Petro-Canada can be found in Note 1 to the 2007 Consolidated Financial Statements. The following discussion outlines what management believes to be the most critical accounting policies involving the use of significant estimates or assumptions.
Property, Plant and Equipment/Depreciation, Depletion and Amortization
Investments in exploration and development activities, includingin situ oil sands activities, are accounted for under the successful efforts method. Under this method, the acquisition costs of unproved acreage; the costs of exploratory wells pending determination of proved reserves; and the costs of wells, which are assigned proved reserves and development costs, including costs of all wells, are capitalized. The cost of unsuccessful wells and all other exploration costs, including geological and geophysical costs, are charged to earnings as incurred. Acquisition, exploration and development of oil sands mining activities are capitalized when costs are recoverable and directly result in an identifiable future benefit. Capitalized costs of oil and gas producing properties, includingin situ oil sands properties and oil sands mining properties, are depreciated and depleted using the unit of production method based upon estimated reserves (see Estimated Oil and Gas Reserves discussion on page 59). Reserves estimates can have a significant impact on net earnings, because they are a key component in the calculation of depreciation and depletion related to the capitalized costs of property, plant and equipment. A revision in reserves estimates could result in a higher or lower depreciation and depletion charge to net earnings. A downward revision in reserves could result in a write-down of oil and gas producing properties as part of the impairment assessment (see Asset Impairment discussion below).
Asset Retirement Obligations
The Company currently records the obligation for estimated asset retirement costs at fair value when incurred. Factors that can affect the fair values of the obligations include the expected costs to be incurred, the useful lives of the assets and discount rates applied. Cost estimates are influenced by factors such as the number and type of assets subject to asset retirement obligations, the extent of work required and changes in environmental legislation. A revision to the estimated costs to be incurred, useful lives of the assets or discount rates applied could result in an increase or decrease in the total obligation, which would change the amount of amortization and accretion expense recognized in net earnings over time.
Asset Impairment
Producing properties and significant unproved properties are assessed annually, or as economic events dictate, for potential impairment. Impairment is assessed by comparing the estimated net undiscounted future cash flows to the carrying value of the asset. The cash flows used in the impairment assessment require management to make assumptions and estimates about recoverable reserves (see Estimated Oil and Gas Reserves discussion on page 59), future commodity prices and operating costs. Changes in any of the assumptions, such as a downward revision in reserves, a decrease in future commodity prices or an increase in operating costs, could result in an impairment of an asset's carrying value.
58 PETRO-CANADA Management's Discussion and Analysis
Purchase Price Allocation
Business acquisitions are accounted for by the purchase method of accounting. Under this method, the purchase price is allocated to the assets acquired and the liabilities assumed based on the fair value at the time of the acquisition. The excess purchase price over the fair value of identifiable assets and liabilities acquired is goodwill. The determination of fair value often requires management to make assumptions and estimates about future events. The assumptions and estimates with respect to determining the fair value of property, plant and equipment acquired generally require the most judgment and include estimates of reserves acquired (see Estimated Oil and Gas Reserves discussion below), future commodity prices and discount rates. Changes in any of the assumptions or estimates used in determining the fair value of acquired assets and liabilities could impact the amounts assigned to assets, liabilities and goodwill in the purchase price allocation. Future net earnings can be affected as a result of changes in future depreciation and depletion, asset impairment or goodwill impairment.
Goodwill Impairment
Goodwill is subject to impairment tests annually, or as economic events dictate, by comparing the fair value of the reporting unit to its carrying value, including goodwill. If the fair value of the reporting unit is less than its carrying value, a goodwill impairment loss is recognized as the excess of the carrying value of the goodwill over the fair value of the goodwill. The determination of fair value requires management to make assumptions and estimates about recoverable reserves (see Estimated Oil and Gas Reserves discussion below), future commodity prices, operating costs, production profiles and discount rates. Changes in any of these assumptions, such as a downward revision in reserves, a decrease in future commodity prices, an increase in operating costs or an increase in discount rates, could result in an impairment of all or a portion of the goodwill carrying value in future periods.
Estimated Oil and Gas Reserves
Reserves estimates, although not reported as part of the Company's Consolidated Financial Statements, can have a significant effect on net earnings as a result of their impact on depreciation and depletion rates, asset impairments and goodwill impairments (see discussion of these items above and on page 58). The Company's staff of qualified reserves evaluators performs internal evaluations on all of its oil and gas reserves on an annual basis using corporate-wide policies, procedures and practices. Independent qualified petroleum reservoir engineering consultants also conduct annual evaluations, technical audits and/or reviews of a significant portion of the Company's reserves and audit the Company's reserves policies, procedures and practices. In addition, the Company's contract internal auditors test the non-engineering management control processes used in establishing reserves. However, the estimation of reserves is an inherently complex process requiring significant judgment. Estimates of economically recoverable oil and gas reserves are based upon a number of variables and assumptions, such as geoscientific interpretation, economic conditions, commodity prices, operating and capital costs, and production forecasts, all of which may vary considerably from actual results. These estimates are expected to be revised upward or downward over time as additional information, such as reservoir performance, becomes available or as economic conditions change.
Employee Future Benefits
The Company maintains defined benefit pension plans and provides certain post-retirement benefits to qualifying retirees. The cost of pension and other post-retirement benefits are actuarially determined by an independent actuary using the projected benefit method, pro-rated based on service. The determination of these costs requires management to estimate or make assumptions regarding the expected plan investment performance, salary escalation, retirement ages of employees, expected health care costs, employee turnover and discount rates. Changes in these estimates or assumptions could result in an increase or decrease to the accrued benefit obligation and the related costs for both pensions and other post-retirement benefits.
Management's Discussion and Analysis PETRO-CANADA 59
Income Taxes
The Company follows the liability method of accounting for income taxes, whereby future income taxes are recognized based on the differences between the carrying amounts of assets and liabilities reported in the financial statements and their respective tax bases. The determination of the income tax provision is an inherently complex process requiring management to interpret continually changing regulations and to make certain judgments. While income tax filings are subject to audits and reassessments, management believes adequate provision has been made for all income tax obligations. However, changes in the interpretations or judgments may result in an increase or decrease in the Company's income tax provision in the future.
Contingencies
The Company is involved in litigation and claims in the normal course of operations. Management is of the opinion that any resulting settlements would not materially affect the financial position of the Company as at December 31, 2007. However, the determination of contingent liabilities relating to litigation and claims is a complex process that involves judgments as to the outcomes and interpretation of laws and regulations. Changes in the judgments or interpretations may result in an increase or decrease in the Company's contingent liabilities in the future.
Share Data
The authorized share capital of Petro-Canada consists of an unlimited number of common shares and an unlimited number of preferred shares issuable in series designated as either senior preferred shares or junior preferred shares. As at February 29, 2008, there were 483,637,000 common shares outstanding and no preferred shares outstanding. For details of the Company's share capital and stock options outstanding at December 31, 2007, refer to Notes 20 and 21 of the 2007 Consolidated Financial Statements.
Additional Information
Copies of this MD&A and the following Consolidated Financial Statements, as well as the Company's latest AIF and Management Proxy Circular, may be obtained from the Company's website at www.petro-canada.ca or by mail upon request from the Corporate Secretary, 150 - 6 Avenue S.W., Calgary, Alberta, T2P 3E3. Other disclosure documents, and any reports, statements or other information filed by Petro-Canada with the Canadian provincial securities commissions or other similar regulatory authorities, are accessible through the Internet on the Canadian System for Electronic Document Analysis and Retrieval, which is commonly known by the acronym SEDAR, and located at www.sedar.com. SEDAR is the Canadian equivalent of the U.S. SEC's Electronic Data Gathering, Analysis, and Retrieval System, which is commonly known by the acronym EDGAR, and located at www.sec.gov.
60 PETRO-CANADA Management's Discussion and Analysis
| Management, Audit, Finance and Risk Committee, and Auditor Reports |
|
Management's Responsibility for the Financial Statements and Report on Internal Control over Financial Reporting
The preparation and presentation of the Company's Consolidated Financial Statements and the overall quality of the Company's financial reporting are the responsibility of management. The financial statements have been prepared in accordance with Canadian generally accepted accounting principles (GAAP) and necessarily include estimates, which are based on management's best judgments. Information contained elsewhere in the Annual Report is consistent, where applicable, with that contained in the financial statements.
Management is also responsible for establishing and maintaining a system of internal controls over financial reporting to provide reasonable assurance that assets are safeguarded and that reliable financial information is produced for preparation of financial statements. Management conducted an evaluation of the effectiveness of the system of internal control over financial reporting based on the framework in Internal Control – Integrated Framework issued by the Committee of Sponsoring Organizations of the Treadway Commission. Based on this evaluation, management concluded that the Company's system of internal control over financial reporting was effective as at December 31, 2007.
Due to its inherent limitations, internal control over financial reporting may not prevent or detect misstatements on a timely basis. Also, projections of any evaluation of the effectiveness of internal control over financial reporting to future periods are subject to the risk that the controls may become inadequate because of changes in conditions, or that the degree of compliance with the policies or procedures may deteriorate.
Deloitte & Touche LLP, the Company's Independent Registered Chartered Accountants, expressed an unqualified opinion on the effectiveness of the Company's internal control over financial reporting as of December 31, 2007. Deloitte & Touche LLP also audited the Company's Consolidated Financial Statements for the year ended December 31, 2007.
The Board of Directors is responsible for overseeing management's performance of its responsibilities for financial reporting and internal control. The Board of Directors exercises this responsibility with the assistance of the Audit, Finance and Risk Committee of the Board of Directors.
| |  |
| Ron A. Brenneman | | E. F. H. Roberts |
| President and Chief Executive Officer | | Executive Vice-President and Chief Financial Officer |
| February 14, 2008 | | February 14, 2008 |
2007 Annual Report PETRO-CANADA 61
Audit, Finance and Risk Committee of the Board of Directors
The Audit, Finance and Risk Committee (the Committee), which is composed of not fewer than three (currently five) independent directors, assists the Board of Directors in the discharge of its responsibility for overseeing management's performance of the financial reporting and internal control responsibilities. The Committee reviews the annual and quarterly Consolidated Financial Statements, accounting policies and the overall quality of the Company's financial reporting, and the financial information contained in prospectuses and in reports filed with regulatory authorities, as required. The Committee also reviews and makes recommendations to the Board of Directors regarding financial matters and oversees the process that management has in place to identify business risks. The Committee members are all independent pursuant to National Instrument 52-110 (NI 52-110), NYSE Corporate Governance Standards and the Sarbanes-Oxley Act of 2002 (SOX), and are financially literate, with one member who has been recognized as a "financial expert" in accordance with SOX requirements.
With respect to the external auditors, the Committee reviews and approves the terms of engagement, the scope and plan for the external audit, and reviews the results of the audit and the Reports of the Independent Registered Chartered Accountants. The external auditors report to the Committee. The Committee discusses the external auditors' independence from management and the Company with the auditors and receives written confirmation of their independence. The Committee also recommends to the Board of Directors the external auditors to be appointed by the shareholders and approves in advance fees for the external auditors' services.
With respect to the contract auditor's engagement to provide internal audit services, the Committee reviews the engagement contract, reviews and approves the scope and plan for the internal audit, receives periodic reports and reviews significant findings and recommendations. The contract auditor reports to the Committee.
Senior management, the external auditors and the contract auditor attend all Audit, Finance and Risk Committee meetings and each is provided with the opportunity to meet privately with the Committee.

Paul D. Melnuk
Chairman of the Audit, Finance and Risk Committee
February 14, 2008
62 PETRO-CANADA 2007 Annual Report
Report of Independent Registered Chartered Accountants
To the Board of Directors and Shareholders of Petro-Canada:
We have audited the internal control over financial reporting of Petro-Canada and subsidiaries (the "Company") as of December 31, 2007, based on criteria established in Internal Control – Integrated Framework issued by the Committee of Sponsoring Organizations of the Treadway Commission. The Company's management is responsible for maintaining effective internal control over financial reporting and for its assessment of the effectiveness of internal control over financial reporting, included in the accompanying Management's Responsibility for the Financial Statements and Report on Internal Control over Financial Reporting. Our responsibility is to express an opinion on the Company's internal control over financial reporting based on our audit.
We conducted our audit in accordance with the standards of the Public Company Accounting Oversight Board (United States). Those standards require that we plan and perform the audit to obtain reasonable assurance about whether effective internal control over financial reporting was maintained in all material respects. Our audit included obtaining an understanding of internal control over financial reporting, assessing the risk that a material weakness exists, testing and evaluating the design and operating effectiveness of internal control based on the assessed risk, and performing such other procedures as we considered necessary in the circumstances. We believe that our audit provides a reasonable basis for our opinion.
A company's internal control over financial reporting is a process designed by, or under the supervision of, the company's principal executive and principal financial officers, or persons performing similar functions, and effected by the company's board of directors, management, and other personnel to provide reasonable assurance regarding the reliability of financial reporting and the preparation of financial statements for external purposes in accordance with generally accepted accounting principles. A company's internal control over financial reporting includes those policies and procedures that (1) pertain to the maintenance of records that, in reasonable detail, accurately and fairly reflect the transactions and dispositions of the assets of the company; (2) provide reasonable assurance that transactions are recorded as necessary to permit preparation of financial statements in accordance with generally accepted accounting principles, and that receipts and expenditures of the company are being made only in accordance with authorizations of management and directors of the company; and (3) provide reasonable assurance regarding prevention or timely detection of unauthorized acquisition, use, or disposition of the company's assets that could have a material effect on the financial statements.
Because of the inherent limitations of internal control over financial reporting, including the possibility of collusion or improper management override of controls, material misstatements due to error or fraud may not be prevented or detected on a timely basis. Also, projections of any evaluation of the effectiveness of the internal control over financial reporting to future periods are subject to the risk that the controls may become inadequate because of changes in conditions, or that the degree of compliance with the policies or procedures may deteriorate.
In our opinion, the Company maintained, in all material respects, effective internal control over financial reporting as of December 31, 2007, based on the criteria established in Internal Control – Integrated Framework issued by the Committee of Sponsoring Organizations of the Treadway Commission.
We have also audited, in accordance with Canadian generally accepted auditing standards and the standards of the Public Company Accounting Oversight Board (United States), the Consolidated Financial Statements as at and for the year ended December 31, 2007 of the Company and our report dated February 14, 2008 expressed an unqualified opinion on those financial statements and included a separate report titled Comments by Independent Registered Chartered Accountants on Canada-United States of America Reporting Difference referring to changes in accounting principles.

Independent Registered Chartered Accountants
Calgary, Canada
February 14, 2008
2007 Annual Report PETRO-CANADA 63
Report of Independent Registered Chartered Accountants
To the Board of Directors and Shareholders of Petro-Canada:
We have audited the accompanying Consolidated Balance Sheet of Petro-Canada and subsidiaries (the "Company") as at December 31, 2007 and 2006, and the related Consolidated Statements of Earnings, Comprehensive Income, Retained Earnings and Cash Flows for each of the three years in the period ended December 31, 2007. These financial statements are the responsibility of the Company's management. Our responsibility is to express an opinion on these financial statements based on our audits.
With respect to the financial statements for the years ended December 31, 2007 and 2006, we conducted our audits in accordance with Canadian generally accepted auditing standards and the standards of the Public Company Accounting Oversight Board (United States). With respect to the financial statements for the year ended December 31, 2005, we conducted our audit in accordance with Canadian generally accepted auditing standards. These standards require that we plan and perform the audit to obtain reasonable assurance about whether the financial statements are free of material misstatement. An audit includes examining, on a test basis, evidence supporting the amounts and disclosures in the financial statements. An audit also includes assessing the accounting principles used and significant estimates made by management, as well as evaluating the overall financial statement presentation. We believe that our audits provide a reasonable basis for our opinion.
In our opinion, these Consolidated Financial Statements present fairly, in all material respects, the financial position of Petro-Canada and subsidiaries as at December 31, 2007 and 2006 and the results of their operations and their cash flows for each of the three years in the period ended December 31, 2007 in conformity with Canadian generally accepted accounting principles.
We have also audited, in accordance with the standards of the Public Company Accounting Oversight Board (United States), the Company's internal control over financial reporting as of December 31, 2007, based on the criteria established in Internal Control – Integrated Framework issued by the Committee of Sponsoring Organizations of the Treadway Commission and our report dated February 14, 2008 expressed an unqualified opinion on the Company's internal control over financial reporting.
Independent Registered Chartered Accountants
Calgary, Canada
February 14, 2008
Comments by Independent Registered Chartered Accountants on Canada-United States of America Reporting Difference
The standards of the Public Company Accounting Oversight Board (United States) require the addition of an explanatory paragraph when there are changes in accounting principles that have a material effect on the comparability of the Company's financial statements, such as the changes described in Note 2 to the Consolidated Financial Statements. Although we conducted our audits in accordance with both Canadian generally accepted auditing standards and the standards of the Public Company Accounting Oversight Board (United States), our report to the board of directors and shareholders on the Consolidated Financial Statements of Petro-Canada, dated February 14, 2008, is expressed in accordance with Canadian reporting standards which do not require a reference to such changes in accounting principles in the auditors' report when the change is properly accounted for and adequately disclosed in the financial statements.
Independent Registered Chartered Accountants
Calgary, Canada
February 14, 2008
64 PETRO-CANADA 2007 Annual Report
| Consolidated Statement of Earnings |
|
(stated in millions of Canadian dollars, except per share amounts)
| For the years ended December 31, | | | 2007 | | | 2006 | | | 2005 | |
| |
| Revenue | | | | | | | | | | |
| Operating | | $ | 21,710 | | $ | 18,911 | | $ | 17,585 | |
| Investment and other income (expense)(Note 5) | | | (460 | ) | | (242 | ) | | (806 | ) |
| |
| | | | 21,250 | | | 18,669 | | | 16,779 | |
| |
Expenses |
|
|
|
|
|
|
|
|
|
|
| Crude oil and product purchases | | | 10,291 | | | 9,649 | | | 8,846 | |
| Operating, marketing and general | | | 3,552 | | | 3,180 | | | 2,962 | |
| Exploration(Note 14) | | | 490 | | | 339 | | | 271 | |
| Depreciation, depletion and amortization(Notes 6 and 14) | | | 2,091 | | | 1,365 | | | 1,222 | |
| Unrealized gain on translation of foreign currency denominated long-term debt | | | (246 | ) | | (1 | ) | | (88 | ) |
| Interest | | | 165 | | | 165 | | | 164 | |
| |
| | | | 16,343 | | | 14,697 | | | 13,377 | |
| |
| Earnings from Continuing Operations Before Income Taxes | | | 4,907 | | | 3,972 | | | 3,402 | |
| |
Provision for Income Taxes(Note 7) |
|
|
|
|
|
|
|
|
|
|
| Current | | | 1,797 | | | 2,073 | | | 1,794 | |
| Future | | | 377 | | | 311 | | | (85 | ) |
| |
| | | | 2,174 | | | 2,384 | | | 1,709 | |
| |
| Net Earnings from Continuing Operations | | | 2,733 | | | 1,588 | | | 1,693 | |
| |
| Net Earnings from Discontinued Operations(Note 4) | | | – | | | 152 | | | 98 | |
| |
| Net Earnings | | $ | 2,733 | | $ | 1,740 | | $ | 1,791 | |
| |
Earnings per Share from Continuing Operations(Note 8) |
|
|
|
|
|
|
|
|
|
|
| Basic | | $ | 5.59 | | $ | 3.15 | | $ | 3.27 | |
| |
| Diluted | | $ | 5.53 | | $ | 3.11 | | $ | 3.22 | |
| |
Earnings per Share(Note 8) |
|
|
|
|
|
|
|
|
|
|
| Basic | | $ | 5.59 | | $ | 3.45 | | $ | 3.45 | |
| |
| Diluted | | $ | 5.53 | | $ | 3.41 | | $ | 3.41 | |
| |
| Consolidated Statement of Comprehensive Income(Note 2) |
|
(stated in millions of Canadian dollars)
For the years ended December 31, | | | 2007 | | | 2006 | | | 2005 | |
| |
| Net earnings | | $ | 2,733 | | $ | 1,740 | | $ | 1,791 | |
| Other comprehensive income, net of tax | | | | | | | | | | |
| | Change in foreign currency translation adjustment | | | (260 | ) | | 363 | | | (588 | ) |
| |
| Comprehensive income | | $ | 2,473 | | $ | 2,103 | | $ | 1,203 | |
| |
See accompanying Notes to Consolidated Financial Statements
2007 Annual Report PETRO-CANADA 65
| Consolidated Statement of Cash Flows |
|
(stated in millions of Canadian dollars)
| For the years ended December 31, | | | 2007 | | | 2006 | | | 2005 | |
| |
| Operating Activities | | | | | | | | | | |
| Net earnings | | $ | 2,733 | | $ | 1,740 | | $ | 1,791 | |
| Less: Net earnings from discontinued operations | | | – | | | 152 | | | 98 | |
| |
| Net earnings from continuing operations | | | 2,733 | | | 1,588 | | | 1,693 | |
| Items not affecting cash flow from continuing operating activities: | | | | | | | | | | |
| | Depreciation, depletion and amortization | | | 2,091 | | | 1,365 | | | 1,222 | |
| | Future income taxes | | | 377 | | | 311 | | | (85 | ) |
| | Accretion of asset retirement obligations(Note 19) | | | 70 | | | 54 | | | 50 | |
| | Unrealized gain on translation of foreign currency denominated long-term debt | | | (246 | ) | | (1 | ) | | (88 | ) |
| | Gain on sale of assets(Note 5) | | | (81 | ) | | (30 | ) | | (48 | ) |
| | Unrealized losses related to Buzzard derivative contracts(Note 23) | | | – | | | 259 | | | 889 | |
| | Other | | | 9 | | | 18 | | | 14 | |
| Settlement of Buzzard derivative contracts(Note 23) | | | (1,481 | ) | | – | | | – | |
| Exploration expenses(Note 14) | | | 290 | | | 123 | | | 140 | |
| Proceeds from sale of accounts receivable(Note 10) | | | – | | | – | | | 80 | |
Increase in non-cash working capital related to continuing
operating activities(Note 9) | | | (423 | ) | | (79 | ) | | (84 | ) |
| |
| Cash flow from continuing operating activities | | | 3,339 | | | 3,608 | | | 3,783 | |
| |
| Cash flow from discontinued operating activities(Note 4) | | | – | | | 15 | | | 204 | |
| |
| Cash flow from operating activities | | | 3,339 | | | 3,623 | | | 3,987 | |
| |
Investing Activities |
|
|
|
|
|
|
|
|
|
|
| Expenditures on property, plant and equipment and exploration(Note 14) | | | (3,988 | ) | | (3,435 | ) | | (3,606 | ) |
| Proceeds from sale of assets(Note 4) | | | 183 | | | 688 | | | 81 | |
| Increase in other assets | | | (121 | ) | | (50 | ) | | (70 | ) |
| Decrease in non-cash working capital related to investing activities(Note 9) | | | 279 | | | 59 | | | 237 | |
| |
| Cash flow used in investing activities | | | (3,647 | ) | | (2,738 | ) | | (3,358 | ) |
| |
Financing Activities |
|
|
|
|
|
|
|
|
|
|
| Increase (decrease) in short-term notes payable(Note 17) | | | 109 | | | – | | | (303 | ) |
| Proceeds from issue of long-term debt(Note 17) | | | 995 | | | – | | | 762 | |
| Repayment of long-term debt | | | (7 | ) | | (7 | ) | | (6 | ) |
| Proceeds from issue of common shares(Note 20) | | | 37 | | | 44 | | | 64 | |
| Purchase of common shares(Note 20) | | | (839 | ) | | (1,011 | ) | | (346 | ) |
| Dividends on common shares | | | (255 | ) | | (201 | ) | | (181 | ) |
| |
| Cash flow from (used in) financing activities | | | 40 | | | (1,175 | ) | | (10 | ) |
| |
| Increase (Decrease) in Cash and Cash Equivalents | | | (268 | ) | | (290 | ) | | 619 | |
| Cash and Cash Equivalents at Beginning of Year | | | 499 | | | 789 | | | 170 | |
| |
| Cash and Cash Equivalents at End of Year(Note 12) | | $ | 231 | | $ | 499 | | $ | 789 | |
| |
| Cash and Cash Equivalents – Discontinued Operations(Note 4) | | $ | – | | $ | – | | $ | 68 | |
| |
| Cash and Cash Equivalents – Continuing Operations | | $ | 231 | | $ | 499 | | $ | 721 | |
| |
See accompanying Notes to Consolidated Financial Statements
66 PETRO-CANADA 2007 Annual Report
| Consolidated Balance Sheet |
|
(stated in millions of Canadian dollars)
| As at December 31, | | | 2007 | | | 2006 |
|
| Assets | | | | | | |
| Current Assets | | | | | | |
| Cash and cash equivalents(Note 12) | | $ | 231 | | $ | 499 |
| Accounts receivable(Note 10) | | | 1,973 | | | 1,600 |
| Income taxes receivable | | | 280 | | | – |
| Inventories(Note 13) | | | 668 | | | 632 |
| Future income taxes(Note 7) | | | 26 | | | 95 |
|
| | | | 3,178 | | | 2,826 |
| Property, Plant and Equipment, Net(Note 14) | | | 19,497 | | | 18,577 |
| Goodwill(Note 15) | | | 731 | | | 801 |
| Other Assets(Notes 2 and 16) | | | 446 | | | 442 |
|
| | | $ | 23,852 | | $ | 22,646 |
|
Liabilities and Shareholders' Equity |
|
|
|
|
|
|
| Current Liabilities | | | | | | |
| Accounts payable and accrued liabilities | | $ | 3,512 | | $ | 3,319 |
| Income taxes payable | | | – | | | 22 |
| Short-term notes payable(Note 17) | | | 109 | | | – |
| Current portion of long-term debt(Note 17) | | | 2 | | | 7 |
|
| | | | 3,623 | | | 3,348 |
Long-Term Debt(Notes 2 and 17) |
|
|
3,339 |
|
|
2,887 |
| Other Liabilities(Note 18) | | | 717 | | | 1,826 |
| Asset Retirement Obligations(Note 19) | | | 1,234 | | | 1,170 |
| Future Income Taxes(Note 7) | | | 3,069 | | | 2,974 |
Commitments and Contingent Liabilities(Note 24) |
|
|
|
|
|
|
Shareholders' Equity |
|
|
|
|
|
|
| Common shares(Note 20) | | | 1,365 | | | 1,366 |
| Contributed surplus(Note 20) | | | 24 | | | 469 |
| Retained earnings | | | 10,692 | | | 8,557 |
| Accumulated other comprehensive income(Note 2) | | | | | | |
| | Foreign currency translation adjustment | | | (211 | ) | | 49 |
|
| | | | 11,870 | | | 10,441 |
|
| | | $ | 23,852 | | $ | 22,646 |
|
| Consolidated Statement of Retained Earnings |
|
(stated in millions of Canadian dollars)
| For the years ended December 31, | | | 2007 | | | 2006 | | | 2005 | |
| |
| Retained Earnings at Beginning of Year | | $ | 8,557 | | $ | 7,018 | | $ | 5,408 | |
| Cumulative effect of adopting new accounting standards(Note 2) | | | 8 | | | – | | | – | |
| Net earnings | | | 2,733 | | | 1,740 | | | 1,791 | |
| Dividends on common shares | | | (255 | ) | | (201 | ) | | (181 | ) |
| Excess cost for normal course issuer bid(Note 20) | | | (351 | ) | | – | | | – | |
| |
| Retained Earnings at End of Year | | $ | 10,692 | | $ | 8,557 | | $ | 7,018 | |
| |
See accompanying Notes to Consolidated Financial Statements
Approved on behalf of the Board of Directors
 | |  |
| Ron A. Brenneman | | Brian F. MacNeill |
| Director | | Director |
2007 Annual Report PETRO-CANADA 67
| Notes to Consolidated Financial Statements |
|
(stated in millions of Canadian dollars, unless otherwise stated)
Note 1 Summary of Significant Accounting Policies
- a)
- Basis of Presentation
The Consolidated Financial Statements include the accounts of Petro-Canada and all subsidiary companies (the "Company") and are prepared in accordance with Canadian generally accepted accounting principles (GAAP). Differences between Canadian and United States GAAP are explained in Note 26.
Substantially all of the Company's exploration and development activities are conducted jointly with others. Only the Company's proportionate interests in such activities are reflected in the Consolidated Financial Statements.
The preparation of the Consolidated Financial Statements requires management to make estimates and assumptions that affect the reported amounts of assets, liabilities, revenues, expenses and the disclosure of contingencies. Such estimates primarily relate to unsettled transactions and events as of the date of the financial statements. Accordingly, actual results may differ from estimated amounts as future confirming events occur. Significant estimates used in the preparation of the financial statements include, but are not limited to, asset retirement obligations, income taxes, employee future benefits, the estimates of oil and natural gas reserves and related depreciation, depletion and amortization, and the valuation of goodwill.
- b)
- Revenue Recognition
Revenue from the sale of crude oil, natural gas, natural gas liquids, purchased products and refined petroleum products is recorded when title passes to the customer. Revenue represents the Company's share and is recorded net of royalty payments to governments and other mineral interest owners. Inter-segment sales are accounted for at market values and included, for segmented reporting, in revenues of the segment making the transfer and expenses of the segment receiving the transfer; these amounts are eliminated on consolidation.
International operations conducted pursuant to exploration and production-sharing agreements (EPSAs) are reflected in the Consolidated Financial Statements based on the Company's working interest in such operations. Under the EPSAs, the Company and other non-governmental partners pay all operating and capital costs for exploring and developing the concessions. Each EPSA establishes specific terms for the Company to recover these costs (Cost Recovery Oil) and to share in the production profits (Profit Oil). Cost Recovery Oil is determined in accordance with a formula that is generally limited to a specified percentage of production during each fiscal year. Profit Oil is that portion of production remaining after deducting Cost Recovery Oil and is shared between the joint venture partners and the government of each country. Cost Recovery Oil and Profit Oil are reported as sales revenue. Profit Oil that is attributable to the government includes an amount in respect of all deemed income taxes payable by the Company under the laws of the respective country. All other government stakes, other than income taxes, are considered to be royalty interests.
- c)
- Transportation Costs
Transportation costs incurred to transport crude oil, natural gas and refined petroleum products to customers, which are included in operating, marketing and general expenses, are recognized when the product is delivered and the service is provided.
- d)
- Foreign Currency Translation
Monetary assets and liabilities are translated into Canadian dollars at rates of exchange in effect at the balance sheet date. With the exception of items pertaining to self-sustaining operations, all property, plant and equipment and related depreciation, depletion and amortization are translated at rates of exchange in effect when the assets were acquired. All other assets, liabilities, revenue and expense items are translated into Canadian dollars at rates of exchange in effect at the respective transaction dates. The resulting exchange gains or losses are included in earnings.
68 PETRO-CANADA Notes to Consolidated Financial Statements
The Company's International business segment and the U.S. Rockies upstream operations included in the North American Natural Gas business segment are operated on a self-sustaining basis. Assets and liabilities of these operations, including associated long-term debt, are translated into Canadian dollars at period end exchange rates, while revenues and expenses are converted using average rates for the period. Gains and losses from the translation into Canadian dollars are presented as a separate component of other comprehensive income (loss) in the Consolidated Statement of Comprehensive Income.
- e)
- Income Taxes
The Company follows the liability method of accounting for income taxes. Under this method, future income taxes are recognized, using substantively enacted income tax rates, based on the temporary differences between the carrying amounts of assets and liabilities reported in the financial statements and their respective tax bases. The effect of a change in income tax rates on future income tax assets and liabilities is recognized in income in the period the change occurs.
- f)
- Earnings Per Share
Basic earnings per share are calculated by dividing the net earnings available to common shareholders by the weighted-average number of common shares outstanding. Diluted earnings per share reflect the potential dilution that would occur if stock options, excluding stock options with a cash payment alternative, were exercised. The treasury stock method is used in calculating diluted earnings per share, which assumes that any proceeds received from the exercise of in-the-money stock options would be used to purchase common shares at the average market price for the period. A liability and expense is recorded for stock options with a cash payment alternative. Accordingly, the potential common shares associated with these stock options are not included in the calculation of diluted earnings per share.
- g)
- Cash and Cash Equivalents
Cash and cash equivalents are comprised of cash in banks, less outstanding cheques, and short-term investments with a maturity of 90 days or less when purchased.
- h)
- Sale of Accounts Receivable
The transfers of accounts receivable are accounted for as sales, other than the retained interest, when the Company has surrendered control over the transferred receivables and received proceeds. Gains or losses are recognized as other income or expenses and are dependent upon the purchase discount as well as the previous carrying amount of the receivables transferred, which is allocated between the receivables sold and the retained interest, based on their relative fair values at the date of the transfer. Fair value is determined based on the present value of future expected cash flows.
- i)
- Inventories
Inventories are stated at the lower of cost and net realizable value. Cost of crude oil and refined petroleum products is determined primarily on a "last-in, first-out" (LIFO) basis. Cost of other inventory is determined primarily on an average cost basis. Costs include direct and indirect expenditures incurred in bringing an item or product to its existing condition and location.
- j)
- Investments
Investments in companies over which the Company has significant influence are accounted for using the equity method. All other long-term investments are classified as available-for-sale financial assets and are measured at fair value. Gains or losses arising from a change in the fair value of these investments are recognized directly in other comprehensive income on the Consolidated Statement of Comprehensive Income.
Notes to Consolidated Financial Statements PETRO-CANADA 69
- k)
- Property, Plant and Equipment
Investments in exploration and development activities, includingin situ oil sands activities, are accounted for using the successful efforts method. Under this method, the acquisition cost of unproved acreage is capitalized. Costs of exploratory wells are initially capitalized pending determination of proved reserves. Costs of wells which are assigned proved reserves remain capitalized, while costs of unsuccessful wells are charged to earnings. All other exploration costs, including geological and geophysical costs, are charged to earnings as incurred. Development costs, including the cost of all wells, are capitalized.
Acquisition, exploration and development of oil sands mining activities are capitalized when costs are recoverable and directly result in an identifiable future benefit.
The interest cost of debt attributable to the construction of major new facilities is capitalized during the construction period until the facilities are substantially complete. The amount of interest capitalized for the period is the product of the average accumulated capitalized costs, the Company's average corporate debt to equity ratio, and the weighted-average interest rate applicable to all borrowings outstanding during the period. Capitalized interest cannot exceed the actual interest incurred.
Producing properties and significant unproved properties, including oil sands properties (both mining andin situ), are assessed annually, at minimum, or as economic events dictate, for potential impairment. Impairment is assessed by comparing the estimated net undiscounted future cash flows to the carrying value of the asset. If required, the amount by which the carrying value of the asset exceeds its fair value is recorded as an impairment in depreciation, depletion and amortization.
Maintenance and repair costs, including planned major maintenance, are expensed as incurred and improvements that increase capacity or extend the useful lives of assets are capitalized.
- l)
- Depreciation, Depletion and Amortization
Depreciation and depletion of capitalized costs of oil and gas producing properties, includingin situ oil sands properties, are calculated using the unit of production method. Development and exploration drilling and equipment costs of oil and gas producing properties, including wells, gathering facilities, and central processing facilities ofin situ oil sands activities, are depleted over the remaining proved developed reserves; proved property acquisition costs over the remaining proved reserves.
Depreciation and depletion of capitalized costs of oil sands mining properties are calculated using the unit of production method. Acquisition costs are depleted over proved and probable reserves. All other oil sands mining assets, including extraction and upgrading facilities, are depleted over proved reserves.
Depreciation of other plant and equipment is provided on either the unit of production method or the straight line method, as appropriate. Straight line depreciation is based on the estimated service lives of the related assets, which range from three to 25 years.
Costs associated with significant development projects are not depleted until commencement of commercial production.
Depreciation, depletion and amortization rates for all capitalized costs associated with all of the Company's activities are reviewed, at least annually, or when events or conditions occur which impact capitalized costs, reserves or estimated service lives.
- m)
- Asset Retirement Obligations
The fair values of estimated asset retirement obligations are recorded as liabilities when incurred and the associated cost is capitalized as part of the cost of the related asset. Over time, the liabilities are accreted for the change in their present value and the initial capitalized costs are depreciated over the useful lives of the related assets. The associated accretion is recorded in operating expense and the depreciation is included in depreciation, depletion and amortization expense. Changes in the estimated obligation resulting from revisions to the estimated timing or amount of undiscounted cash flows are recognized as a change in the asset retirement obligation and related asset. Actual expenditures incurred are charged against the accumulated obligation.
70 PETRO-CANADA Notes to Consolidated Financial Statements
- n)
- Goodwill
Acquisitions are accounted for using the purchase method. Under this method, identifiable assets and liabilities are recorded at fair value as of the date of acquisition. Goodwill, which is not amortized, is the excess of the purchase price over such fair value and is assigned to the appropriate reporting units.
The carrying value of goodwill is assessed for impairment annually at year end, or more frequently as economic events dictate, by comparing the fair value of the reporting unit to its carrying value, including goodwill. If the fair value of the reporting unit is less than its carrying value, a goodwill impairment is recognized as the excess of the carrying value of the goodwill over the fair value of the goodwill.
- o)
- Stock-Based Compensation
The Company maintains stock option, share appreciation rights (SARs), performance share units (PSUs) and deferred share units (DSUs) plans as described in Note 21.
The Company accounts for stock options granted prior to 2003 based on the intrinsic value at the grant date, which does not result in a charge to earnings because the exercise price was equal to the market price at grant date.
Stock options granted in 2003 are accounted for using the fair value method. Fair values are determined, at the grant date, using the Black-Scholes option-pricing model. The compensation expense associated with these options is charged to earnings over the vesting period with a corresponding increase in contributed surplus. On the exercise of stock options, consideration paid and the associated contributed surplus is credited to common shares.
Stock options granted subsequent to 2003, all of which provide the holder the right to exercise the stock option or surrender the option for a cash payment, are accounted for based on the intrinsic value at each period end. A liability and expense are recorded over the vesting period in the amount by which the then current market price exceeds the option exercise price. When stock options are surrendered for cash, the cash settlement paid reduces the outstanding liability. When stock options are exercised for common shares, consideration paid by the stock option holder and the previously recognized liability associated with the stock options are recorded as common shares.
SARs, which entitle the holder to receive a cash payment equal to the difference between the stated exercise price and the market price of the Company's shares on the date of surrender, are accounted for based on the intrinsic value at each period. A liability and expense are recorded over the vesting period in the amount by which the then current market price exceeds the exercise price of the SARs.
The compensation cost for a stock-based award that is attributable to an employee who is eligible to retire at the grant date is recognized on the grant date if the employee can retire from the Company at any point and the ability to exercise the award does not depend on continued service. The compensation expense associated with stock-based awards granted to employees who will become eligible to retire during the vesting period is recognized over the period from the grant date to the date the employee becomes eligible to retire.
PSUs are accounted for on a mark-to-market basis over the term of the PSUs, whereby a liability and expense are recorded based on the number of PSUs outstanding, the current market price of the Company's shares and the Company's current total shareholder return relative to the selected industry peer group. DSUs are accounted for on a mark-to-market basis, whereby a liability and expense are recorded each period based on the number of DSUs outstanding and the current market price of the Company's shares.
Notes to Consolidated Financial Statements PETRO-CANADA 71
- p)
- Employee Future Benefits
The Company's employee future benefit programs consist of both defined benefit and defined contribution pension plans, as well as other post-retirement benefits as described in Note 22.
The costs of pensions and other post-retirement benefits are actuarially determined using the projected benefit method pro-rated based on service and using management's best estimate of expected plan investment performance, discount rates, salary escalation, retirement ages of employees and expected health care costs. For the purpose of calculating the expected return on plan assets, those assets are measured at fair value. The accrued benefit obligation is discounted using a market rate of interest at the end of the year on high quality corporate debt instruments. The excess of the cumulative unamortized net actuarial gain or loss over 10% of the greater of the accrued benefit obligation and the fair value of plan assets at the beginning of the year is amortized over the average remaining service life of active employees.
Company contributions to the defined contribution plan are expensed as incurred.
- q)
- Financial Instruments
All financial instruments are initially recognized at fair value on the balance sheet. The Company has classified each financial instrument into one of the following categories: held-for-trading financial assets and liabilities, loans and receivables, held-to-maturity financial assets and other financial liabilities. Subsequent measurement of financial instruments is based on their classification.
Held-for-trading financial assets and liabilities are subsequently measured at fair value with changes in those fair values recognized in net earnings.
Loans and receivables, held-to-maturity financial assets and other financial liabilities are subsequently measured at amortized cost using the effective interest method.
The Company classifies cash and cash equivalents as held-for-trading financial assets, accounts receivable as loans and receivables, and accounts payable and accrued liabilities, short-term notes payable and long-term debt as other financial liabilities.
The Company combines transaction costs and premiums or discounts directly attributable to the issuance of long-term debt with the fair value of the debt and amortizes these amounts to earnings using the effective interest method.
The Company classifies financial instruments that are derivative contracts as held-for-trading financial assets and liabilities unless designated as effective hedges.
- r)
- Hedging and Derivatives
The Company may use derivative contracts to manage its exposure to market risks resulting from fluctuations in foreign exchange rates, interest rates and commodity prices. These derivative contracts are not used for speculative purposes and a system of controls is maintained that includes a policy covering the authorization, reporting and monitoring of derivative activity.
Derivative contracts that are not designated as hedges for accounting purposes are recorded on the Consolidated Balance Sheet at fair value with any resulting gain or loss recognized in investment and other income (expense) on the Consolidated Statement of Earnings.
The Company formally documents all derivative contracts designated as hedges, the risk management objective and the strategy for undertaking the hedge.
72 PETRO-CANADA Notes to Consolidated Financial Statements
For designated cash flow hedges, the portion of the gain (loss) on the hedging item that is deemed to be effective is recognized as other comprehensive income (loss), net of tax, in the Consolidated Statement of Comprehensive Income, and is then reclassified to the Consolidated Statement of Earnings in the same period or periods during which the hedged item affects net earnings. The portion of the gain (loss) that is deemed to be ineffective is recognized immediately in net earnings on the Consolidated Statement of Earnings in the period in which it occurs.
For designated fair value hedges, both the hedging item and the underlying hedged item are measured at fair value. Changes in the fair value of both items are recognized immediately in net earnings on the Consolidated Statement of Earnings in the period in which they occur.
The Company assesses, both at inception and over the term of the hedging relationship, whether the derivative contracts used in the hedging transactions are highly effective in offsetting changes in the fair value or cash flows of hedged items. If a derivative contract ceases to be effective or is terminated, hedge accounting is discontinued. Any gains (losses) relating to terminated cash flow hedges included in other comprehensive income are typically reclassified to net earnings on the Consolidated Statement of Earnings in the period in which the cash flow hedge is terminated.
Note 2 Changes in Accounting Policies
The Company adopted Canadian Institute of Chartered Accountants (CICA) Handbook Section 1506,Accounting Changes; Section 1530,Comprehensive Income; Section 3855,Financial Instruments – Recognition and Measurement; Section 3861,Financial Instruments – Presentation and Disclosure; Section 3865,Hedges; and Emerging Issues Committee (EIC) Abstract 160,Stripping Costs Incurred in the Production Phase of a Mining Operation, on January 1, 2007.
As a result of adopting CICA Section 1530,Comprehensive Income, a new Statement of Comprehensive Income forms part of the Company's Consolidated Financial Statements. Gains and losses from the translation into Canadian dollars of assets and liabilities, including associated long-term debt, of the Company's self-sustaining foreign operations are now presented as a separate component of other comprehensive income (loss) in the Consolidated Statement of Comprehensive Income. Accumulated other comprehensive income (loss) is presented as a separate component of shareholders' equity in the Consolidated Balance Sheet. Previously, these gains and losses were deferred and included in the foreign currency translation adjustment as part of shareholders' equity.
As a result of adopting CICA Section 3855,Financial Instruments – Recognition and Measurement, long-term debt is measured at fair value when initially recognized and, after initial recognition, at amortized cost using the effective interest method. Transaction costs and premiums or discounts directly attributable to the issuance of long-term debt are now added to the fair value on initial recognition. Previously, these amounts were deferred and amortized using the straight line method over the term of the debt. Unamortized amounts were separately presented in other assets on the Consolidated Balance Sheet. In accordance with the transitional provisions, prior periods have not been restated as a result of adopting this new accounting standard, with the exception of amounts related to foreign currency translation adjustments. To recognize the cumulative prior period effect, the following balance sheet categories were impacted on January 1, 2007:
| | | | Increase (Decrease) | |
| |
| Other assets | | $ | (101 | ) |
| Long-term debt | | | (112 | ) |
| Future income taxes liability | | | 3 | |
| Retained earnings | | | 8 | |
| |
There is no other material impact on the Consolidated Financial Statements for adoption of these new standards.
Notes to Consolidated Financial Statements PETRO-CANADA 73
Note 3 Segmented Information from Continuing Operations
The Company is an integrated oil and gas company with activities spanning both the upstream and downstream sectors of the industry. The Company conducts its business through five major operating business segments along with Shared Services. Upstream activities are conducted through four business segments, which include North American Natural Gas, Oil Sands, East Coast Canada and International. Downstream operations comprise the fifth business segment.
Upstream operations include the exploration, development, production, transportation and marketing of crude oil, natural gas and natural gas liquids and oil sands. The North American Natural Gas segment includes activity in Western Canada, the U.S. Rockies, the Mackenzie Delta/Corridor, and Alaska. The Oil Sands segment includes interests in the Syncrude oil sands mining operation, the MacKay Riverin situ oil sands operation, and the Fort Hills oil sands mining and upgrading project. The East Coast Canada segment comprises activity offshore Newfoundland and Labrador, and includes interests in the Hibernia, Terra Nova, and White Rose oilfield operations. The International segment includes activity in the United Kingdom (U.K.), the Netherlands, Trinidad and Tobago, Libya, Norway and Syria. The producing assets in Syria, previously included in the International segment, have been accounted for as a discontinued operation (Note 4).
The Downstream business segment includes the purchase and sale of crude oil, the refining of crude oil products and the distribution and marketing of these and other purchased products.
Financial information by business segment is presented in the following table as though each segment was a separate business entity. Inter-segment transfers of products, which are accounted for at market value, are eliminated on consolidation. Shared Services includes investment income, interest expense, unrealized gains or losses on foreign currency denominated long-term debt and general corporate revenue and expenses. Shared Services assets are principally cash and cash equivalents and other general corporate assets.
74 PETRO-CANADA Notes to Consolidated Financial Statements
| | Upstream
| |
|---|
| | North American Natural Gas
| | Oil Sands
| |
|---|
| | | | 2007 | | | 2006 | | | 2005 | | | 2007 | | | 2006 | | | 2005 | |
| |
| Revenue1 | | | | | | | | | | | | | | | | | | | |
| Sales to customers | | $ | 1,347 | | $ | 1,504 | | $ | 2,073 | | $ | 611 | | $ | 592 | | $ | 749 | |
| Investment and other income (expense)2 | | | 66 | | | 6 | | | 21 | | | (2 | ) | | – | | | 4 | |
| Inter-segment sales | | | 324 | | | 349 | | | 345 | | | 1,065 | | | 822 | | | 660 | |
| |
| Segmented revenue | | | 1,737 | | | 1,859 | | | 2,439 | | | 1,674 | | | 1,414 | | | 1,413 | |
| |
Expenses |
|
|
|
|
|
|
|
|
|
|
|
|
|
|
|
|
|
|
|
| Crude oil and product purchases | | | 240 | | | 256 | | | 466 | | | 524 | | | 425 | | | 571 | |
| Inter-segment transactions | | | 10 | | | 5 | | | 7 | | | 13 | | | 31 | | | 80 | |
| Operating, marketing and general | | | 491 | | | 462 | | | 426 | | | 595 | | | 508 | | | 423 | |
| Exploration | | | 192 | | | 150 | | | 118 | | | 28 | | | 21 | | | 32 | |
| Depreciation, depletion and amortization (Note 6) | | | 584 | | | 402 | | | 364 | | | 149 | | | 128 | | | 133 | |
| Unrealized gain on translation of foreign currency denominated long-term debt | | | – | | | – | | | – | | | – | | | – | | | – | |
| Interest | | | – | | | – | | | – | | | – | | | – | | | – | |
| |
| | | | 1,517 | | | 1,275 | | | 1,381 | | | 1,309 | | | 1,113 | | | 1,239 | |
| |
| Earnings (loss) from continuing operations before income taxes | | | 220 | | | 584 | | | 1,058 | | | 365 | | | 301 | | | 174 | |
| |
Provision for income taxes |
|
|
|
|
|
|
|
|
|
|
|
|
|
|
|
|
|
|
|
| Current | | | 183 | | | 351 | | | 311 | | | (13 | ) | | (53 | ) | | (45 | ) |
| Future(Note 7) | | | (154 | ) | | (172 | ) | | 73 | | | 62 | | | 109 | | | 104 | |
| |
| | | | 29 | | | 179 | | | 384 | | | 49 | | | 56 | | | 59 | |
| |
| Net earnings (loss) from continuing operations | | $ | 191 | | $ | 405 | | $ | 674 | | $ | 316 | | $ | 245 | | $ | 115 | |
| |
Capital and exploration expenditures from continuing operations |
|
|
|
|
|
|
|
|
|
|
|
|
|
|
|
|
|
|
|
| Property, plant and equipment and exploration expenditures(Note 14) | | $ | 866 | | $ | 788 | | $ | 713 | | $ | 779 | | $ | 377 | | $ | 772 | |
| Other assets | | | 7 | | | 5 | | | 7 | | | 69 | | | 1 | | | 1 | |
| |
| | | $ | 873 | | $ | 793 | | $ | 720 | | $ | 848 | | $ | 378 | | $ | 773 | |
| |
| Cash flow from (used in) continuing operating activities | | $ | 725 | | $ | 651 | | $ | 1,219 | | $ | 512 | | $ | 499 | | $ | 340 | |
| |
| Total assets from continuing operations | | $ | 4,119 | | $ | 4,151 | | $ | 3,763 | | $ | 3,659 | | $ | 2,885 | | $ | 2,623 | |
| |
Notes to Consolidated Financial Statements PETRO-CANADA 75
| | Upstream
| |
|---|
| | International & Offshore
| |
|---|
| | East Coast Canada
| | International
| |
|---|
| | | | 2007 | | | 2006 | | | 2005 | | | 2007 | | | 2006 | | | 2005 | |
| |
| Revenue1 | | | | | | | | | | | | | | | | | | | |
| Sales to customers | | $ | 2,708 | | $ | 2,004 | | $ | 1,284 | | $ | 3,697 | | $ | 2,464 | | $ | 2,183 | |
| Investment and other income (expense)2 | | | (18 | ) | | – | | | (2 | ) | | (549 | ) | | (283 | ) | | (851 | ) |
| Inter-segment sales | | | 477 | | | 298 | | | 346 | | | – | | | – | | | – | |
| |
| Segmented revenue | | | 3,167 | | | 2,302 | | | 1,628 | | | 3,148 | | | 2,181 | | | 1,332 | |
| |
Expenses |
|
|
|
|
|
|
|
|
|
|
|
|
|
|
|
|
|
|
|
| Crude oil and product purchases | | | 736 | | | 452 | | | 48 | | | – | | | – | | | – | |
| Inter-segment transactions | | | 8 | | | 9 | | | 6 | | | – | | | – | | | – | |
| Operating, marketing and general | | | 228 | | | 245 | | | 158 | | | 526 | | | 350 | | | 364 | |
| Exploration | | | 13 | | | 12 | | | 4 | | | 257 | | | 156 | | | 117 | |
| Depreciation, depletion and amortization (Note 6) | | | 410 | | | 237 | | | 259 | | | 640 | | | 323 | | | 249 | |
| Unrealized gain on translation of foreign currency denominated long-term debt | | | – | | | – | | | – | | | – | | | – | | | – | |
| Interest | | | – | | | – | | | – | | | – | | | – | | | – | |
| |
| | | | 1,395 | | | 955 | | | 475 | | | 1,423 | | | 829 | | | 730 | |
| |
| Earnings (loss) from continuing operations before income taxes | | | 1,772 | | | 1,347 | | | 1,153 | | | 1,725 | | | 1,352 | | | 602 | |
| |
Provision for income taxes |
|
|
|
|
|
|
|
|
|
|
|
|
|
|
|
|
|
|
|
| Current | | | 653 | | | 434 | | | 361 | | | 848 | | | 1,248 | | | 1,015 | |
| Future(Note 7) | | | (110 | ) | | (21 | ) | | 17 | | | 503 | | | 310 | | | (304 | ) |
| |
| | | | 543 | | | 413 | | | 378 | | | 1,351 | | | 1,558 | | | 711 | |
| |
| Net earnings (loss) from continuing operations | | $ | 1,229 | | $ | 934 | | $ | 775 | | $ | 374 | | $ | (206 | ) | $ | (109 | ) |
| |
Capital and exploration expenditures from continuing operations |
|
|
|
|
|
|
|
|
|
|
|
|
|
|
|
|
|
|
|
| Property, plant and equipment and exploration expenditures(Note 14) | | $ | 159 | | $ | 256 | | $ | 314 | | $ | 762 | | $ | 760 | | $ | 696 | |
| Other assets | | | 2 | | | – | | | 1 | | | – | | | – | | | – | |
| |
| | | $ | 161 | | $ | 256 | | $ | 315 | | $ | 762 | | $ | 760 | | $ | 696 | |
| |
| Cash flow from (used in) continuing operating activities | | $ | 1,491 | | $ | 1,129 | | $ | 1,002 | | $ | 220 | | $ | 840 | | $ | 722 | |
| |
| Total assets from continuing operations | | $ | 2,345 | | $ | 2,465 | | $ | 2,442 | | $ | 5,180 | | $ | 6,031 | | $ | 4,856 | |
| |
76 PETRO-CANADA Notes to Consolidated Financial Statements
| | Downstream
| | Shared Services
| |
|---|
| | | | 2007 | | | 2006 | | | 2005 | | | 2007 | | | 2006 | | | 2005 | |
| |
| Revenue1 | | | | | | | | | | | | | | | | | | | |
| Sales to customers | | $ | 13,347 | | $ | 12,347 | | $ | 11,296 | | $ | – | | $ | – | | $ | – | |
| Investment and other income (expense)2 | | | (12 | ) | | 19 | | | 43 | | | 55 | | | 16 | | | (21 | ) |
| Inter-segment sales | | | 18 | | | 15 | | | 13 | | | – | | | – | | | – | |
| |
| Segmented revenue | | | 13,353 | | | 12,381 | | | 11,352 | | | 55 | | | 16 | | | (21 | ) |
| |
Expenses |
|
|
|
|
|
|
|
|
|
|
|
|
|
|
|
|
|
|
|
| Crude oil and product purchases | | | 8,787 | | | 8,517 | | | 7,762 | | | 4 | | | (1 | ) | | (1 | ) |
| Inter-segment transactions | | | 1,853 | | | 1,439 | | | 1,271 | | | – | | | – | | | – | |
| Operating, marketing and general | | | 1,525 | | | 1,495 | | | 1,436 | | | 187 | | | 120 | | | 155 | |
| Exploration | | | – | | | – | | | – | | | – | | | – | | | – | |
| Depreciation, depletion and amortization (Note 6) | | | 299 | | | 262 | | | 216 | | | 9 | | | 13 | | | 1 | |
| Unrealized gain on translation of foreign currency denominated long-term debt | | | – | | | – | | | – | | | (246 | ) | | (1 | ) | | (88 | ) |
| Interest | | | – | | | – | | | – | | | 165 | | | 165 | | | 164 | |
| |
| | | | 12,464 | | | 11,713 | | | 10,685 | | | 119 | | | 296 | | | 231 | |
| |
| Earnings (loss) from continuing operations before income taxes | | | 889 | | | 668 | | | 667 | | | (64 | ) | | (280 | ) | | (252 | ) |
| |
Provision for income taxes |
|
|
|
|
|
|
|
|
|
|
|
|
|
|
|
|
|
|
|
| Current | | | 232 | | | 141 | | | 264 | | | (106 | ) | | (48 | ) | | (112 | ) |
| Future(Note 7) | | | 28 | | | 54 | | | (12 | ) | | 48 | | | 31 | | | 37 | |
| |
| | | | 260 | | | 195 | | | 252 | | | (58 | ) | | (17 | ) | | (75 | ) |
| |
| Net earnings (loss) from continuing operations | | $ | 629 | | $ | 473 | | $ | 415 | | $ | (6 | ) | $ | (263 | ) | $ | (177 | ) |
| |
Capital and exploration expenditures from continuing operations |
|
|
|
|
|
|
|
|
|
|
|
|
|
|
|
|
|
|
|
| Property, plant and equipment and exploration expenditures(Note 14) | | $ | 1,396 | | $ | 1,229 | | $ | 1,053 | | $ | 26 | | $ | 24 | | $ | 12 | |
| Other assets | | | 30 | | | 22 | | | 33 | | | 13 | | | 22 | | | 28 | |
| |
| | | $ | 1,426 | | $ | 1,251 | | $ | 1,086 | | $ | 39 | | $ | 46 | | $ | 40 | |
| |
| Cash flow from (used in) continuing operating activities | | $ | 994 | | $ | 835 | | $ | 663 | | $ | (603 | ) | $ | (346 | ) | $ | (163 | ) |
| |
| Total assets from continuing operations | | $ | 7,989 | | $ | 6,649 | | $ | 5,609 | | $ | 560 | | $ | 465 | | $ | 714 | |
| |
Notes to Consolidated Financial Statements PETRO-CANADA 77
| | Consolidated
| |
|---|
| | | | 2007 | | | 2006 | | | 2005 | |
| |
| Revenue1 | | | | | | | | | | |
| Sales to customers | | $ | 21,710 | | $ | 18,911 | | $ | 17,585 | |
| Investment and other income (expense)2 | | | (460 | ) | | (242 | ) | | (806 | ) |
| Inter-segment sales | | | – | | | – | | | – | |
| |
| Segmented revenue | | | 21,250 | | | 18,669 | | | 16,779 | |
| |
Expenses |
|
|
|
|
|
|
|
|
|
|
| Crude oil and product purchases | | | 10,291 | | | 9,649 | | | 8,846 | |
| Inter-segment transactions | | | – | | | – | | | – | |
| Operating, marketing and general | | | 3,552 | | | 3,180 | | | 2,962 | |
| Exploration | | | 490 | | | 339 | | | 271 | |
| Depreciation, depletion and amortization(Note 6) | | | 2,091 | | | 1,365 | | | 1,222 | |
| Unrealized gain on translation of foreign currency denominated long-term debt | | | (246 | ) | | (1 | ) | | (88 | ) |
| Interest | | | 165 | | | 165 | | | 164 | |
| |
| | | | 16,343 | | | 14,697 | | | 13,377 | |
| |
| Earnings (loss) from continuing operations before income taxes | | | 4,907 | | | 3,972 | | | 3,402 | |
| |
Provision for income taxes |
|
|
|
|
|
|
|
|
|
|
| Current | | | 1,797 | | | 2,073 | | | 1,794 | |
| Future(Note 7) | | | 377 | | | 311 | | | (85 | ) |
| |
| | | | 2,174 | | | 2,384 | | | 1,709 | |
| |
| Net earnings (loss) from continuing operations | | $ | 2,733 | | $ | 1,588 | | $ | 1,693 | |
| |
Capital and exploration expenditures from continuing operations |
|
|
|
|
|
|
|
|
|
|
| Property, plant and equipment and exploration expenditures(Note 14) | | $ | 3,988 | | $ | 3,434 | | $ | 3,560 | |
| Other assets | | | 121 | | | 50 | | | 70 | |
| |
| | | $ | 4,109 | | $ | 3,484 | | $ | 3,630 | |
| |
| Cash flow from (used in) continuing operating activities | | $ | 3,339 | | $ | 3,608 | | $ | 3,783 | |
| |
| Total assets from continuing operations | | $ | 23,852 | | $ | 22,646 | | $ | 20,007 | |
| |
- 1
- There were no customers that represented 10% or more of the Company's consolidated revenues for the periods presented.
- 2
- Investment and other income (expense) for the International segment includes $535 million (2006 – $259 million; 2005 – $889 million) of losses relating to the Buzzard derivative contracts (Note 23).
Geographic Information from Continuing Operations
| | |
2007
| |
2006
| |
2005
|
| | | | Revenues | | | Total Assets | | | Revenues | | | Total Assets | | | Revenues | | | Total Assets |
|
| Canada | | $ | 17,897 | | $ | 17,020 | | $ | 16,295 | | $ | 14,736 | | $ | 15,302 | | $ | 14,261 |
| Foreign1 | | | 3,353 | | | 6,832 | | | 2,374 | | | 7,910 | | | 1,477 | | | 5,746 |
|
| | | $ | 21,250 | | $ | 23,852 | | $ | 18,669 | | $ | 22,646 | | $ | 16,779 | | $ | 20,007 |
|
- 1
- Foreign total assets include $3,185 million relating to assets in the U.K. (2006 – $3,692 million; 2005 – $2,964 million).
78 PETRO-CANADA Notes to Consolidated Financial Statements
Note 4 Discontinued Operations
On January 31, 2006, the Company completed the sale of its producing assets in Syria for net proceeds of $640 million, resulting in a gain on sale of $134 million.
The accounting for discontinued operations results in a reduction of the Consolidated Statement of Earnings balances as follows:
| | | | 2007 | | | 2006 | | | 2005 |
|
| Revenue1 | | $ | – | | $ | 168 | | $ | 464 |
| Expenses | | | | | | | | | |
| Operating, marketing and general | | | – | | | 6 | | | 104 |
| Depreciation, depletion and amortization | | | – | | | – | | | 145 |
|
| | | | – | | | 6 | | | 249 |
|
| Earnings from discontinued operations before income taxes | | | – | | | 162 | | | 215 |
| Provision for income taxes | | | – | | | 10 | | | 117 |
|
| Net earnings from discontinued operations | | $ | – | | $ | 152 | | $ | 98 |
|
- 1
- 2006 revenue includes the gain on sale of $134 million.
Note 5 Investment and Other Income (Expense)
Investment and other income (expense) includes net losses related to the Buzzard derivative contracts (Note 23) of $535 million (2006 – $259 million; 2005 – $889 million) and net gains on sales of assets of $81 million (2006 – $30 million; 2005 – $48 million) for the year ended December 31, 2007.
Note 6 Asset Write-Downs
In 2007, the Company recognized a $150 million ($97 million after-tax) impairment expense due to a write-down of its coal bed methane assets in the U.S. Rockies' Powder River Basin. The assets have been written down to management's best estimate of fair value based on a discounted future cash flow valuation. These assets form part of the Company's North American Natural Gas business segment. The impairment expense is included in depreciation, depletion and amortization in the Consolidated Statement of Earnings.
Notes to Consolidated Financial Statements PETRO-CANADA 79
Note 7 Income Taxes
The computation of the provision for income taxes is as follows:
| | | | 2007 | | | 2006 | | | 2005 | |
| |
| Earnings from continuing operations before income taxes | | $ | 4,907 | | $ | 3,972 | | $ | 3,402 | |
| Add (deduct): | | | | | | | | | | |
| | Non-deductible royalties and other payments to provincial governments, net | | | – | | | 61 | | | 393 | |
| | Resource allowance | | | – | | | (158 | ) | | (413 | ) |
| | Non-taxable foreign exchange | | | (126 | ) | | (1 | ) | | (45 | ) |
| | Other | | | (26 | ) | | (24 | ) | | 5 | |
| |
| Earnings from continuing operations as adjusted before income taxes | | $ | 4,755 | | $ | 3,850 | | $ | 3,342 | |
| |
| Canadian federal income tax rate | | | 38.0% | | | 38.0% | | | 38.0% | |
| |
| Income tax on earnings from continuing operations as adjusted at Canadian federal income tax rate | | $ | 1,807 | | $ | 1,463 | | $ | 1,270 | |
| Provincial income taxes | | | 372 | | | 295 | | | 325 | |
| Federal – abatement and other credits | | | (446 | ) | | (262 | ) | | (378 | ) |
| Current income tax increase due to provincial reassessments | | | – | | | 70 | | | – | |
| Future income tax increase (decrease) due to Canadian federal and provincial rate changes | | | (155 | ) | | (63 | ) | | 6 | |
| Future income tax increase (decrease) due to foreign rate changes | | | (36 | ) | | 242 | | | – | |
| Higher foreign income tax rates | | | 622 | | | 627 | | | 482 | |
| Income tax credits and other | | | 10 | | | 12 | | | 4 | |
| |
| Provision for income taxes | | $ | 2,174 | | $ | 2,384 | | $ | 1,709 | |
| |
| Effective income tax rate on earnings from continuing operations before income taxes | | | 44.3% | | | 60.0% | | | 50.2% | |
| |
The provision for income taxes is comprised of:
| | | | 2007 | | | 2006 | | | 2005 | |
| |
| Current | | | | | | | | | | |
| | Canadian | | $ | 257 | | $ | 801 | | $ | 769 | |
| | Foreign | | | 1,541 | | | 1,272 | | | 1,025 | |
| Future | | | | | | | | | | |
| | Canadian | | | 443 | | | 62 | | | (113 | ) |
| | Foreign | | | (67 | ) | | 249 | | | 28 | |
| |
| Total provision for income taxes | | $ | 2,174 | | $ | 2,384 | | $ | 1,709 | |
| |
80 PETRO-CANADA Notes to Consolidated Financial Statements
The provisions for current and future income taxes include tax recoveries (expenses), which are largely due to reductions in the Canadian federal and provincial income tax rates. These amounts have been allocated to the business segments as follows:
| | | | 2007 | | | 2006 | | | 2005 | |
| |
| North American Natural Gas | | $ | 8 | | $ | 6 | | $ | (2 | ) |
| Oil Sands | | | 62 | | | 44 | | | – | |
| International & Offshore | | | | | | | | | | |
| | East Coast Canada | | | 52 | | | 37 | | | (2 | ) |
| | International1 | | | 30 | | | (306 | ) | | – | |
| Downstream | | | 34 | | | 41 | | | (2 | ) |
| Shared Services2 | | | 5 | | | (71 | ) | | – | |
| |
| Total provision for income taxes | | $ | 191 | | $ | (249 | ) | $ | (6 | ) |
| |
- 1
- Included in the International's $30 million (2006 – $(306) million; 2005 – $29 million) income tax recovery (expense) is a $36 million (2006 – $(242) million; 2005 – $nil) reduction (increase) in the future income tax provision due to increases in the U.K. supplemental corporate income tax rate and the resulting impact of qualifying capital expenditures being deducted at the increased rate.
- 2
- Included in the Shared Services' $71 million tax expense for 2006 is a $70 million increase in the provision for current income taxes due to the Quebec government enacting retroactive tax legislation.
The following table summarizes the temporary differences that give rise to the net future income tax assets and liabilities:
| | | | 2007 | | | 2006 | |
| |
| Future income tax liabilities | | | | | | | |
| | Property, plant and equipment | | $ | 3,626 | | $ | 3,919 | |
| | Partnership income1 | | | 362 | | | 367 | |
| | Other assets | | | 78 | | | 75 | |
| Future income tax assets | | | | | | | |
| | Asset retirement obligations and other liabilities | | | (495 | ) | | (1,010 | ) |
| | Inventories | | | (256 | ) | | (212 | ) |
| | Other | | | (272 | ) | | (260 | ) |
| |
| Future income tax liability | | | 3,043 | | | 2,879 | |
| Less: Current future income tax asset | | | (26 | ) | | (95 | ) |
| |
| Net future income tax liability | | $ | 3,069 | | $ | 2,974 | |
| |
- 1
- Taxable income for certain Canadian upstream activities is generated by a partnership and the related taxes will be included in current income taxes in the next year.
Deferred distribution taxes associated with International business operations have not been recorded. Based on current plans, repatriation of funds in excess of foreign reinvestment will not result in material additional income tax expense.
Complex income tax issues, which involve interpretations of continually changing regulations, are encountered in computing the provision for income taxes. Management believes that adequate provisions have been made for all such outstanding issues and that the resolution of these issues would not materially affect the financial position or results of operations of the Company.
Notes to Consolidated Financial Statements PETRO-CANADA 81
Note 8 Earnings per Share
The weighted-average number of common shares outstanding used in the calculations of basic and diluted earnings per share from continuing operations and earnings per share, assuming that all dilutive outstanding stock options were exercised, was:
(millions) | | 2007 | | 2006 | | 2005 |
|
| Weighted-average number of common shares outstanding – basic | | 489.0 | | 503.9 | | 518.4 |
| Effect of dilutive stock options | | 5.0 | | 6.0 | | 7.0 |
|
| Weighted-average number of common shares outstanding – diluted | | 494.0 | | 509.9 | | 525.4 |
|
There were no stock options excluded from the diluted earnings per share from continuing operations and earnings per share calculations. Stock options are excluded when the exercise price exceeds the average share price in a respective period.
Note 9 Cash Flow Information
Changes in Non-Cash Working Capital
Non-cash working capital is comprised of current assets and current liabilities, other than cash and cash equivalents and the current portion of long-term debt.
The (increase) decrease in non-cash working capital is comprised of:
| | | | 2007 | | | 2006 | | | 2005 | |
| |
| Operating activities from continuing operations | | | | | | | | | | |
| Accounts receivable | | $ | (373 | ) | $ | 17 | | $ | (563 | ) |
| Inventories | | | (36 | ) | | (36 | ) | | (18 | ) |
| Accounts payable and accrued liabilities | | | 77 | | | 365 | | | 662 | |
| Income taxes payable | | | (302 | ) | | (60 | ) | | (190 | ) |
| Current portion of long-term liabilities and other | | | 211 | | | (365 | ) | | 25 | |
| |
| | | $ | (423 | ) | $ | (79 | ) | $ | (84 | ) |
| |
Investing activities |
|
|
|
|
|
|
|
|
|
|
| Accounts payable and accrued liabilities | | $ | 120 | | $ | 138 | | $ | (12 | ) |
| Other liabilities | | | 159 | | | (79 | ) | | 249 | |
| |
| | | $ | 279 | | $ | 59 | | $ | 237 | |
| |
Cash Payments
Cash payments from continuing operations for interest and income taxes were as follows:
| | | | 2007 | | | 2006 | | | 2005 |
|
| Interest | | $ | 186 | | $ | 194 | | $ | 186 |
| Income taxes | | $ | 2,074 | | $ | 2,149 | | $ | 1,972 |
|
Note 10 Securitization Program
Under the Company's securitization program, the Company can sell an undivided interest of eligible accounts receivable up to $500 million to a third party, on a revolving and fully serviced basis. The service liability has been estimated to be insignificant. The Company also retains an interest in the transferred accounts receivable equal to the required reserves amount.
82 PETRO-CANADA Notes to Consolidated Financial Statements
As at December 31, 2007, $480 million (December 31, 2006 – $480 million) of outstanding accounts receivable had been sold under the program for net proceeds of $479 million.
The securitization program expires on June 24, 2009.
Note 11 Fort Hills Oil Sands Mining and Upgrading Project
In June 2005, the Company acquired, for $300 million, a 60% interest in the Fort Hills oil sands mining and upgrading project which was previously wholly owned by UTS Energy Corporation (UTS). As part of the acquisition, Petro-Canada became the project operator. To pay for the investment, Petro-Canada will fund a portion of UTS's share of the next $2.5 billion of development capital. The acquisition cost has been discounted using an estimated payout pattern for the development capital funding and the Company's estimated cost of debt at the time of acquisition.
In November 2005, the Company and UTS finalized agreements with Teck Cominco Limited (Teck Cominco), whereby Teck Cominco acquired a 15% interest in the Fort Hills oil sands mining and upgrading project with Petro-Canada and UTS holding interests of 55% and 30%, respectively.
On November 23, 2007, the Company finalized an agreement to acquire an additional 5% working interest in the Fort Hills oil sands mining and upgrading project, bringing the Company's total working interest to 60%. To pay for this incremental investment, the Company will fund an additional $375 million of expenditures in excess of its working interest. The acquisition cost has been discounted to $347 million using an estimated payout pattern for the funding and the Company's estimated cost of debt at the time of acquisition. The discounted value of the acquisition cost was recorded as $329 million in other liabilities (Note 18) and $18 million in accounts payable and accrued liabilities.
Note 12 Cash and Cash Equivalents
| | | | 2007 | | | 2006 |
|
| Cash | | $ | 47 | | $ | 42 |
| Short-term investments | | | 184 | | | 457 |
|
| | | $ | 231 | | $ | 499 |
|
Note 13 Inventories
| | | | 2007 | | | 2006 |
|
| Crude oil, refined products and merchandise | | $ | 484 | | $ | 455 |
| Materials and supplies | | | 184 | | | 177 |
|
| | | $ | 668 | | $ | 632 |
|
Notes to Consolidated Financial Statements PETRO-CANADA 83
Note 14 Property, Plant and Equipment
| | |
2007
| |
2006
| |
2007
| |
2006
|
| | | | Cost | | Accumulated Depreciation, Depletion and Amortization | | | Net | | | Cost | | Accumulated Depreciation, Depletion and Amortization | | | Net | | | Expenditures
on Property, Plant
and Equipment1,2 |
|
| North American Natural Gas | | $ | 7,310 | | $ 3,536 | | $ | 3,774 | | $ | 6,942 | | $ 3,189 | | $ | 3,753 | | $ | 736 | | $ | 707 |
| Oil Sands | | | 4,359 | | 1,011 | | | 3,348 | | | 3,598 | | 908 | | | 2,690 | | | 759 | | | 370 |
| International & Offshore | | | | | | | | | | | | | | | | | | | | | | |
| | East Coast Canada | | | 4,059 | | 2,003 | | | 2,056 | | | 3,874 | | 1,594 | | | 2,280 | | | 155 | | | 248 |
| | International1 | | | 5,689 | | 1,605 | | | 4,084 | | | 5,863 | | 1,123 | | | 4,740 | | | 626 | | | 733 |
| Downstream | | | 9,174 | | 3,000 | | | 6,174 | | | 7,850 | | 2,770 | | | 5,080 | | | 1,396 | | | 1,229 |
| Shared Services | | | 542 | | 481 | | | 61 | | | 495 | | 461 | | | 34 | | | 26 | | | 24 |
|
| | | $ | 31,133 | | $11,636 | | $ | 19,497 | | $ | 28,622 | | $10,045 | | $ | 18,577 | | $ | 3,698 | | $ | 3,311 |
|
- 1
- Expenditures are from continuing operations and exclude $nil (2006 – $1 million) relating to discontinued operations (Note 4).
- 2
- Exploration expenses, excluding general and administrative and geological and geophysical expenses, of $290 million (2006 – $123 million; 2005 – $140 million) are reported in expenditures on property, plant and equipment and exploration under investing activities in the Consolidated Statement of Cash Flows.
Property, plant and equipment net cost includes asset retirement costs of $591 million (2006 – $609 million).
Interest capitalized during 2007 amounted to $30 million (2006 – $51 million; 2005 – $35 million).
Costs of $21 million (2006 – $211 million) relating to North American Natural Gas operations, $1,039 million (2006 – $152 million) relating to Oil Sands operations, $120 million (2006 – $62 million) relating to East Coast Canada operations, $323 million (2006 – $2,934 million) relating to the International operations, and $2,151 million (2006 – $1,044 million) relating to Downstream operations are currently not being depleted or depreciated.
Capital leases at a net cost of $56 million (2006 – $60 million) and $21 million (2006 – $23 million) are included in the assets of East Coast Canada and Oil Sands, respectively (Note 17).
Note 15 Goodwill
The following table summarizes the changes in goodwill:
| | |
2007
| |
2006
|
| | | | North American Natural Gas | | | International | | | Total | | | North American Natural Gas | | | International | | | Total |
|
| Goodwill at beginning of year | | $ | 169 | | $ | 632 | | $ | 801 | | $ | 170 | | $ | 567 | | $ | 737 |
| Foreign exchange | | | (25 | ) | | (45 | ) | | (70 | ) | | (1 | ) | | 65 | | | 64 |
|
| Goodwill at end of year | | $ | 144 | | $ | 587 | | $ | 731 | | $ | 169 | | $ | 632 | | $ | 801 |
|
84 PETRO-CANADA Notes to Consolidated Financial Statements
Note 16 Other Assets
| | | | 2007 | | | 2006 |
|
| Investments | | $ | 81 | | $ | 82 |
| Accrued pension asset(Note 22) | | | 168 | | | 128 |
| Deferred financing costs1 | | | – | | | 101 |
| Other long-term assets | | | 197 | | | 131 |
|
| | | $ | 446 | | $ | 442 |
|
- 1
- Deferred financing costs have been reclassified to long-term debt in accordance with the adoption of CICA 3855,Financial Instruments – Recognition and Measurement (see Note 2). In accordance with the transitional provisions of this new standard, 2006 comparative figures have not been restated.
Note 17 Long-Term Debt
| | | Maturity | | | 20073 | | | 2006 | |
| |
| Debentures and notes | | | | | | | | | |
| | 5.95% unsecured senior notes ($600 million US) | | 2035 | | $ | 577 | | $ | 699 | |
| | 5.35% unsecured senior notes ($300 million US)1 | | 2033 | | | 248 | | | 349 | |
| | 7.00% unsecured debentures ($250 million US) | | 2028 | | | 237 | | | 291 | |
| | 7.875% unsecured debentures ($275 million US) | | 2026 | | | 267 | | | 321 | |
| | 9.25% unsecured debentures ($300 million US) | | 2021 | | | 294 | | | 349 | |
| | 5.00% unsecured senior notes ($400 million US) | | 2014 | | | 391 | | | 466 | |
| | 4.00% unsecured senior notes ($300 million US)1 | | 2013 | | | 275 | | | 349 | |
| Syndicated credit facilities | | 2012 | | | 995 | | | – | |
| Capital leases(Note 14) 2 | | 2008-2022 | | | 57 | | | 70 | |
| |
| | | | | | 3,341 | | | 2,894 | |
| Current portion | | | | | (2 | ) | | (7 | ) |
| |
| | | | | $ | 3,339 | | $ | 2,887 | |
| |
- 1
- In anticipation of issuing these senior notes, the Company entered into interest rate derivatives which resulted in effective interest rates of 6.073% for the 5.35% notes due in 2033 and 4.838% for the 4.00% notes due in 2013. These derivatives were settled in 2003.
- 2
- The Company is party to one transportation and one time charter agreement that are accounted for as capital leases and have implicit rates of interest of 14.65% and 11.90%, respectively. The aggregate remaining repayments under the transportation and time charter agreements are $57 million, including the following amounts in the next five years: 2008 – $2 million; 2009 – $3 million; 2010 – $3 million; 2011 – $3 million; and 2012 – $4 million.
- 3
- Deferred financing costs have been reclassified from other assets in accordance with the adoption of CICA 3855 – Financial Instruments – Recognition and Measurement (see Note 2). In accordance with the transitional provisions of this new standard, 2006 comparative figures have not been restated.
Interest on long-term debt, net of capitalized interest, was $151 million in 2007 (2006 – $152 million; 2005 – $146 million). Interest is paid semi-annually. All debentures and notes are repayable in full upon maturity.
Except as discussed in footnote 1 above, the fixed interest rate on all debentures and notes approximates the effective interest rate.
At December 31, 2007, the Company had in place syndicated credit facilities totalling $2,200 million (December 31, 2006 – $2,200 million), maturing in 2012. The syndicated facilities are unsecured, committed revolving facilities for general corporate purposes that bear interest at either the lenders' rates for Canadian prime loans, U.S. base rate loans, Bankers' Acceptances rates or at London Inter-Bank Offered Rate (LIBOR) plus applicable margins. The Company also has revolving bilateral demand credit facilities of $1,500 million at December 31, 2007 (December 31, 2006 – $829 million).
A total of $1,372 million of the credit facilities was used for Bankers' Acceptances, letters of credit and overdraft coverage at December 31, 2007.
Notes to Consolidated Financial Statements PETRO-CANADA 85
At December 31, 2007, the Company had drawn on its syndicated credit facilities and its demand credit facilities for $995 million and $109 million, respectively, in the form of Canadian dollar Bankers' Acceptances. The weighted-average interest rate for Bankers' Acceptances outstanding was 5.13% for the syndicated credit facilities and 4.99% for the demand credit facilities.
Note 18 Other Liabilities
| | | | 2007 | | | 2006 |
|
| Post-retirement benefits(Note 22) | | $ | 193 | | $ | 182 |
| Unrealized losses related to Buzzard derivative contracts(Note 23) | | | – | | | 1,252 |
| Fort Hills purchase obligation(Note 11) | | | 329 | | | 170 |
| Other long-term liabilities | | | 195 | | | 222 |
|
| | | $ | 717 | | $ | 1,826 |
|
Note 19 Asset Retirement Obligations
Asset retirement obligations are recorded for obligations where the Company will be required to retire tangible long-lived assets such as well sites, offshore production platforms, natural gas processing plants and marketing sites.
The following table summarizes the changes in the asset retirement obligations:
| | | | 2007 | | | 2006 | |
| |
| Asset retirement obligations at beginning of year | | $ | 1,237 | | $ | 962 | |
| Obligations incurred | | | 74 | | | 95 | |
| Changes in estimates | | | 5 | | | 138 | |
| Obligations settled | | | (56 | ) | | (55 | ) |
| Accretion expense | | | 70 | | | 54 | |
| Foreign exchange | | | (47 | ) | | 43 | |
| |
| Asset retirement obligations at end of year | | | 1,283 | | | 1,237 | |
| Less: Current portion | | | (49 | ) | | (67 | ) |
| |
| | | $ | 1,234 | | $ | 1,170 | |
| |
In determining the fair value of the asset retirement obligations, the estimated cash flows of new obligations incurred during the year have been discounted at 6.5% (2006 – 5.5%). The total undiscounted amount of the estimated cash flows required to settle the obligations is $4,136 million (2006 – $3,481 million). The obligations will be settled on an ongoing basis over the useful lives of the operating assets, which extend up to 50 years in the future. The current portion of asset retirement obligations is included in accounts payable and accrued liabilities.
86 PETRO-CANADA Notes to Consolidated Financial Statements
Note 20 Shareholders' Equity
Authorized
The authorized share capital is comprised of an unlimited number of:
- a)
- Preferred shares issuable in series designated as Senior Preferred Shares
- b)
- Preferred shares issuable in series designated as Junior Preferred Shares
- c)
- Common shares without par value
Issued and Outstanding
Changes in common shares and contributed surplus were as follows:
| | | 2007
| | 2006
| |
| | | Shares | | | Amount | | | Contributed Surplus | | Shares | | | Amount | | | Contributed Surplus | |
| |
| Balance at beginning of year | | 497,538,385 | | $ | 1,366 | | $ | 469 | | 515,138,904 | | $ | 1,362 | | $ | 1,422 | |
| Issued under employee stock-option and share purchase plans | | 1,918,734 | | | 43 | | | (1 | ) | 2,177,881 | | | 57 | | | 5 | |
| Repurchased under normal course issuer bid | | (15,998,000 | ) | | (44 | ) | | (444 | ) | (19,778,400 | ) | | (53 | ) | | (958 | ) |
| |
| Balance at end of year | | 483,459,119 | | $ | 1,365 | | $ | 24 | | 497,538,385 | | $ | 1,366 | | $ | 469 | |
| |
In June 2007, the Company renewed its normal course issuer bid to repurchase up to 25 million of its outstanding common shares during the period from June 22, 2007 to June 21, 2008, subject to certain conditions. During 2007, the Company purchased 15,998,000 common shares at an average price of $52.42 per common share for a total cost of $839 million (2006 – 19,778,400 common shares at an average price of $51.10 per common share for a total cost of $1,011 million). The excess of the purchase price over the carrying amount of the shares purchased was recorded as a $444 million (2006 – $958 million) reduction of contributed surplus and a $351 million (2006 – $nil) reduction of retained earnings.
Note 21 Stock-Based Compensation
Stock Options
The Company maintains a stock option plan whereby options can be granted to officers and certain employees for up to 44 million common shares. Stock options have a term of 10 years if granted prior to 2004 and seven years if granted subsequent to 2003. All stock options vest over periods of up to four years and are exercisable at the market prices for the shares on the dates that the options were granted.
In 2004, the Company amended the option plan to provide the holder of stock options granted subsequent to 2003 the alternative to exercise these options as a cash payment alternative (CPA). Where the CPA is chosen, vested options can be surrendered for cancellation in return for a direct cash payment from the Company based on the excess of the then current market price over the option exercise price.
Notes to Consolidated Financial Statements PETRO-CANADA 87
Changes in the number of outstanding stock options were as follows:
| | | 2007
| |
| | | Number | | | Weighted-Average
Exercise Price
(dollars |
) |
| |
| Balance at beginning of year | | 20,714,733 | | $ | 31 | |
| Granted | | 3,347,800 | | | 44 | |
| Exercised for common shares | | (1,918,734 | ) | | 19 | |
| Surrendered for cash payment | | (800,685 | ) | | 34 | |
| Cancelled | | (308,050 | ) | | 44 | |
| |
| Balance at end of year | | 21,035,064 | | $ | 34 | |
| |
| | |
2006
| |
2005
| |
| | | Number | | | Weighted-Average
Exercise Price
(dollars |
) | Number | | | Weighted-Average
Exercise Price
(dollars |
) |
| |
| Balance at beginning of year | | 18,361,617 | | $ | 24 | | 18,074,698 | | $ | 21 | |
| Granted | | 4,911,600 | | | 52 | | 4,185,800 | | | 35 | |
| Exercised for common shares | | (2,177,881 | ) | | 20 | | (3,544,282 | ) | | 18 | |
| Surrendered for cash payment | | (119,710 | ) | | 31 | | (47,551 | ) | | 29 | |
| Cancelled | | (260,893 | ) | | 41 | | (307,048 | ) | | 29 | |
| |
| Balance at end of year | | 20,714,733 | | $ | 31 | | 18,361,617 | | $ | 24 | |
| |
The following stock options were outstanding as at December 31, 2007:
Options Outstanding
| | Options Exercisable
| |
Range of Exercise Prices
(dollars) | | Number | | Weighted-Average Life
(years |
) | | Weighted-Average Exercise Price
(dollars |
) | Number | | | Weighted-Average Exercise Price
(dollars |
) |
| |
| $ 8 to 17 | | 2,927,149 | | 2.9 | | $ | 14 | | 2,927,149 | | $ | 14 | |
| 18 to 23 | | 1,619,550 | | 3.3 | | | 19 | | 1,619,550 | | | 19 | |
| 24 to 27 | | 2,718,440 | | 4.9 | | | 26 | | 2,718,440 | | | 26 | |
| 28 to 32 | | 2,516,465 | | 3.1 | | | 29 | | 1,759,165 | | | 29 | |
| 33 to 42 | | 3,415,325 | | 4.1 | | | 35 | | 1,581,225 | | | 35 | |
| 43 to 57 | | 7,838,135 | | 5.5 | | | 49 | | 1,232,810 | | | 52 | |
| |
| $ 8 to 57 | | 21,035,064 | | 4.4 | | $ | 34 | | 11,838,339 | | $ | 26 | |
| |
During 2007, the Company recorded compensation expense of $1 million (2006 – $10 million; 2005 – $10 million) relating to the 2003 stock options and $69 million (2006 – $31 million; 2005 – $69 million) relating to options with a CPA.
88 PETRO-CANADA Notes to Consolidated Financial Statements
Stock Appreciation Rights (SARs)
Commencing 2007, the Company approved the issuance of SARs to certain employees, which entitle the holder to receive a cash payment equal to the difference between the stated exercise price and the market price of the Company's common shares on date of surrender. The vesting period and other terms are similar to the terms of the Company's existing stock option plan. At the time of grant, the exercise price approximated the market price. The following SARs have been granted:
| | | 2007
|
| | | Number | | | Weighted-Average
Exercise Price
(dollars) |
|
| Balance at beginning of year | | – | | $ | – |
| Granted | | 3,786,500 | | | 44 |
| Cancelled | | (127,050 | ) | | 44 |
|
| Balance at end of year | | 3,659,450 | | $ | 44 |
|
During 2007, the Company recorded compensation expense of $17 million relating to SARs.
Performance Share Units (PSUs)
The Company maintains a plan for PSUs for officers and other senior management employees. Under this plan, notional share units are awarded and settled in cash at the end of a three-year period based upon the Company's share price at that time, the value of notional dividends applied during the period and the Company's total shareholder return relative to a peer group of North American industry competitors.
Changes in the number of outstanding PSUs were as follows:
| | | 2007 Number | | 2006 Number | |
| |
| Balance at beginning of year | | 1,482,986 | | 1,158,967 | |
| Granted | | 247,476 | | 385,632 | |
| Exercised | | – | | – | |
| Cancelled1 | | (564,418 | ) | (61,613 | ) |
| |
| Balance at end of year | | 1,166,044 | | 1,482,986 | |
| |
- 1
- Cancelled PSUs are those that expired during the period, for which no cash settlement has been made.
PSUs have a three-year performance period, such that those outstanding at the end of 2007 are related to PSUs issued in 2005, 2006 and 2007 (2005 grant – 582,716; 2006 grant – 349,771; 2007 grant – 233,557). During 2007, the Company recorded compensation (recovery) expense relating to PSUs of $4 million (2006 – $(4) million; 2005 – $7 million).
Deferred Share Units (DSUs)
The Company maintains a plan for DSUs whereby executive officers are awarded DSUs and/or can elect to receive all or a portion of their annual incentive compensation in the form of DSUs. Under this plan, notional share units are issued for the elected amount, which is based on the then current market price of the Company's common shares. Upon termination or retirement, the units are settled in cash, which includes an amount for the value of notional dividends earned over the period the units were outstanding.
Notes to Consolidated Financial Statements PETRO-CANADA 89
The Company's Board of Directors receives a portion of their compensation in the form of DSUs and can also elect to receive all or a portion of their remaining compensation in the form of DSUs. Under the director program, notional share units are issued and settled in cash or common shares, including the value of notional dividends, upon ceasing to be a director.
During 2007, the Company recorded compensation expense relating to DSUs of $4 million (2006 – $2 million; 2005 – $13 million).
Note 22 Employee Future Benefits
The Company maintains pension plans with defined benefit and defined contribution provisions and provides certain health care and life insurance benefits to its qualifying retirees. The actuarially determined cost of these benefits is accrued over the estimated service life of employees. The defined benefit provisions are generally based upon years of service and average salary during the final years of employment. Certain defined benefit options require employee contributions and the balance of the funding for the registered plans is provided by the Company, based upon the advice of an independent actuary. The accrued benefit obligations and the fair value of plan assets are measured for accounting purposes at December 31 of each year. The most recent actuarial valuation of the pension plan for funding purposes was as of December 31, 2004 and the next required valuation will be as of December 31, 2007.
The defined contribution plan provides for an annual contribution of 5% to 8% of each participating employee's pensionable earnings.
Benefit Plan Expense
| | |
Pension Plans
| |
Other Post-Retirement Plans
| |
| | | | 2007 | | | 2006 | | | 2005 | | | 2007 | | | 2006 | | | 2005 | |
| |
| (a) Defined benefit plans | | | | | | | | | | | | | | | | | | | |
| Employer current service cost | | $ | 43 | | $ | 40 | | $ | 36 | | $ | 5 | | $ | 4 | | $ | 4 | |
| Interest cost | | | 90 | | | 86 | | | 86 | | | 12 | | | 11 | | | 12 | |
| Actual return on plan assets | | | (8 | ) | | (154 | ) | | (133 | ) | | – | | | – | | | – | |
| Actuarial losses (gains) | | | (42 | ) | | 43 | | | 155 | | | 13 | | | – | | | 19 | |
| |
| Elements of employee future benefit plan expense before adjustments to recognize the long-term nature of employee future benefit plan expense | | | 83 | | | 15 | | | 144 | | | 30 | | | 15 | | | 35 | |
| Difference between actual and expected return on plan assets | | | (104 | ) | | 55 | | | 45 | | | – | | | – | | | – | |
| Difference between actual and recognized actuarial losses in year | | | 86 | | | 8 | | | (121 | ) | | (11 | ) | | 2 | | | (19 | ) |
| Amortization of transitional (asset) obligation | | | (6 | ) | | (5 | ) | | (6 | ) | | 2 | | | 2 | | | 2 | |
| |
| | | | 59 | | | 73 | | | 62 | | | 21 | | | 19 | | | 18 | |
| (b) Defined contribution plans | | | 22 | | | 18 | | | 16 | | | | | | | | | | |
| |
| Total expense | | $ | 81 | | $ | 91 | | $ | 78 | | $ | 21 | | $ | 19 | | $ | 18 | |
| |
90 PETRO-CANADA Notes to Consolidated Financial Statements
Benefit Plan Funding
| | |
Pension Plans
| |
Other Post-Retirement Plans
|
| | | | 2007 | | | 2006 | | | 2005 | | | 2007 | | | 2006 | | | 2005 |
|
| Defined contribution | | $ | 22 | | $ | 18 | | $ | 16 | | | | | | | | | |
| | | | | | | | | |
| Defined benefit | | $ | 99 | | $ | 96 | | $ | 96 | | $ | 10 | | $ | 10 | | $ | 9 |
|
Financial Status of Defined Benefit Plans
| | |
Pension Plans
| |
Other Post-Retirement Plans
| |
| | | | 2007 | | | 2006 | | | 2007 | | | 2006 | |
| |
| Fair value of plan assets | | $ | 1,502 | | $ | 1,486 | | $ | – | | $ | – | |
| Accrued benefit obligation | | | 1,784 | | | 1,786 | | | 255 | | | 235 | |
| |
| Funded status – plan deficit1 | | | (282 | ) | | (300 | ) | | (255 | ) | | (235 | ) |
| Unamortized transitional (asset) obligation | | | (12 | ) | | (18 | ) | | 11 | | | 13 | |
| Unamortized net actuarial losses | | | 462 | | | 446 | | | 51 | | | 40 | |
| |
| Accrued benefit asset (liability) | | $ | 168 | | $ | 128 | | $ | (193 | ) | $ | (182 | ) |
| |
- 1
- The pension and other post-retirement plans included in the financial status information are not fully funded.
Reconciliation of Plan Assets
| | |
Pension Plans
| |
Other Post-Retirement Plans
| |
| | | | 2007 | | | 2006 | | | 2007 | | | 2006 | |
| |
| Fair value of plan assets at beginning of year | | $ | 1,486 | | $ | 1,303 | | $ | – | | $ | – | |
| Contributions | | | 99 | | | 96 | | | 9 | | | 10 | |
| Benefits paid | | | (83 | ) | | (77 | ) | | (9 | ) | | (10 | ) |
| Actual gain on plan assets | | | 8 | | | 154 | | | – | | | – | |
| Other | | | (8 | ) | | 10 | | | – | | | – | |
| |
| Fair value of plan assets at end of year | | $ | 1,502 | | $ | 1,486 | | $ | – | | $ | – | |
| |
Reconciliation of Accrued Benefit Obligation
| | |
Pension Plans
| |
Other Post-Retirement Plans
| |
| | | | 2007 | | | 2006 | | | 2007 | | | 2006 | |
| |
| Accrued benefit obligation at beginning of year | | $ | 1,786 | | $ | 1,681 | | $ | 235 | | $ | 230 | |
| Current service cost | | | 43 | | | 40 | | | 5 | | | 4 | |
| Interest cost | | | 90 | | | 86 | | | 12 | | | 11 | |
| Benefits paid | | | (83 | ) | | (77 | ) | | (9 | ) | | (10 | ) |
| Actuarial losses (gains) | | | (42 | ) | | 43 | | | 12 | | | – | |
| Other | | | (10 | ) | | 13 | | | – | | | – | |
| |
| Accrued benefit obligation at end of year | | $ | 1,784 | | $ | 1,786 | | $ | 255 | | $ | 235 | |
| |
Notes to Consolidated Financial Statements PETRO-CANADA 91
Defined Benefit and Other Post-Retirement Plans Assumptions
| | | 2007 | | 2006 | | 2005 |
|
| Year-end obligation discount rate1 | | 5.3% | | 5.0% | | 5.0% |
| Accrued benefit obligation discount rate1 | | 5.3% | | 5.0% | | 5.7% |
| Long-term rate of return on plan assets | | 7.5% | | 7.5% | | 7.5% |
| Rate of compensation increase, excluding merit increases | | 3.3% | | 3.0% | | 3.1% |
|
- 1
- Assumption used in both pension and other post-retirement plans.
Assumed Health and Dental Care Cost Trend Rates at December 31 are as follows:
| | | 2007 | | 2006 |
|
| Dental care cost trend rate1 | | 4.0% | | 3.5% |
| Health care cost trend rate | | 8.0% | | 8.0% |
| Health care cost trend rate declines to | | 4.5% | | 4.5% |
| Year that health care cost trend rate reaches the rate which it is expected to remain at | | 2017 | | 2014 |
|
- 1
- Dental care cost trend rate assumed to remain constant.
Sensitivity Analysis
Assumed health care cost trend rates have a significant effect on the amounts reported for the health care plans. A one-percentage-point change in assumed health care cost trend rates would have the following effects for 2007:
| | | | Increase | | | Decrease | |
| |
| Total of service and interest cost | | $ | 3 | | $ | (2 | ) |
| Accrued benefit obligation | | $ | 30 | | $ | (26 | ) |
| |
The Plan Assets consist of:
| | |
Percentage of Plan Assets
at December 31,
|
| Asset Category | | 2007 | | 2006 |
|
| Equity | | 61% | | 62% |
| Bonds | | 39% | | 38% |
|
| | | 100% | | 100% |
|
Note 23 Financial Instruments and Derivatives
The Company is exposed to market risks resulting from fluctuations in commodity prices, foreign exchange rates and interest rates in the normal course of its business operations. The Company monitors its exposure to market fluctuations and may use derivative contracts to manage these risks, as it considers appropriate. The Company does not use derivative contracts for speculative purposes.
92 PETRO-CANADA Notes to Consolidated Financial Statements
Crude Oil and Products
During 2004, the Company entered into a series of derivative contracts for the future sale of Dated Brent crude oil in connection with its acquisition of an interest in the Buzzard field in the U.K. sector of the North Sea. Some derivative contracts matured from July 1, 2007 to December 31, 2007. All remaining outstanding derivative contracts were settled. This resulted in the following:
| | | | 2007 | |
| |
| Unrealized losses at beginning of year | | $ | (1,481 | ) |
| Net losses during current year(Note 5) | | | (535 | ) |
| Maturities1 | | | 291 | |
| Settlement2 | | | 1,725 | |
| |
| | | $ | – | |
| |
- 1
- Derivative contracts that matured from July 1, 2007 to December 31, 2007 resulted in realized losses of $291 million ($193 million after-tax).
- 2
- All remaining outstanding derivative contracts were settled, which resulted in realized losses of $1,725 million ($1,145 million after-tax).
The Company enters into forward contracts and options to reduce exposure to Downstream margin fluctuations, including margins on fixed-price product sales, and short-term price fluctuations on the purchase of foreign and domestic crude oil and refined petroleum products.
The Company's outstanding derivative contracts and their related fair values at December 31, 2007 were as follows:
| | | Quantity
(MMbbls) | | Maturity | | | Average
Price
(US$/bbl) | | | Fair Value | |
| |
| Crude oil purchases | | 0.8 | | 2008 | | $ | 95.43 | | $ | (1 | ) |
| Crude oil sales | | 0.8 | | 2008 | | $ | 95.72 | | $ | 2 | |
| |
| | | | | | | | | | $ | 1 | |
| |
The fair value positions of outstanding derivative contracts were included in the Consolidated Balance Sheet as follows:
| | | | December 31,
2007 | | | December 31,
2006 |
|
| Accounts receivable | | $ | 1 | | $ | – |
| Accounts payable and accrued liabilities | | | – | | | 233 |
| Other liabilities | | | – | | | 1,252 |
|
The fair value of these derivative contracts is based on quotes provided by brokers, which represents an approximation of amounts that would be received or paid to counterparties to settle these instruments prior to maturity. The Company plans to hold all derivative contracts outstanding at December 31, 2007 to maturity.
Derivative contracts and financial instruments involve a degree of credit risk. The Company manages this risk through the establishment of credit policies and limits, which are applied in the selection of counterparties. Market risk relating to changes in value or settlement cost of the Company's derivative contracts is essentially offset by gains or losses on the underlying transaction.
In addition to the derivative contracts described above, the Consolidated Balance Sheet includes other items considered to be financial instruments, such as cash and cash equivalents, accounts receivable, accounts payable and accrued liabilities, the Fort
Notes to Consolidated Financial Statements PETRO-CANADA 93
Hills purchase obligation and long-term debt. The fair values of these other financial instruments included in the Consolidated Balance Sheet are as follows:
| | |
2007
| |
2006
| |
| | | | Carrying Amount | | | Fair Value | | | Carrying Amount | | | Fair Value | |
| |
| Held-for-trading financial assets: | | | | | | | | | | | | | |
| | Cash and cash equivalents | | $ | 231 | | $ | 231 | | $ | 499 | | $ | 499 | |
| Loans and receivables: | | | | | | | | | | | | | |
| | Accounts receivable1 | | | 1,931 | | | 1,931 | | | 1,566 | | | 1,566 | |
| | Other long-term assets | | | 197 | | | 197 | | | 131 | | | 131 | |
| Other financial liabilities (not held-for-trading): | | | | | | | | | | | | | |
| | Accounts payable and accrued liabilities | | | (3,512 | ) | | (3,512 | ) | | (3,319 | ) | | (3,319 | ) |
| | Short-term notes payable | | | (109 | ) | | (109 | ) | | – | | | – | |
| | Long-term debt | | | (3,341 | ) | | (3,495 | ) | | (2,894 | ) | | (2,959 | ) |
| | Fort Hills purchase obligation | | | (329 | ) | | (329 | ) | | (170 | ) | | (170 | ) |
| |
| | | $ | (4,932 | ) | $ | (5,086 | ) | $ | (4,187 | ) | $ | (4,252 | ) |
| |
- 1
- Accounts receivable on the Consolidated Balance Sheet as at December 31, 2007 include $42 million (December 31, 2006 – $34 million) of prepaid expenses.
Excluding long-term debt, the fair value of financial instruments approximates their carrying amount due to their short maturity. The fair value of long-term debt is based on publicly quoted market values.
94 PETRO-CANADA Notes to Consolidated Financial Statements
Note 24 Commitments and Contingent Liabilities
Commitments
| | | | 2008 | | | 2009 | | | 2010 | | | 2011 | | | 2012 | | | Thereafter | | | Total |
|
| Operating leases | | $ | 427 | | $ | 193 | | $ | 248 | | $ | 101 | | $ | 150 | | $ | 131 | | $ | 1,250 |
| Transportation agreements | | | 227 | | | 165 | | | 138 | | | 119 | | | 116 | | | 792 | | | 1,557 |
| Product purchase / delivery obligations | | | 3,967 | | | 2,691 | | | 1,474 | | | 1,051 | | | 916 | | | 5,020 | | | 15,119 |
| Exploration work commitments | | | 82 | | | 8 | | | 12 | | | 1 | | | – | | | – | | | 103 |
| Other long-term obligations | | | 36 | | | 214 | | | 226 | | | 210 | | | 206 | | | 1,223 | | | 2,115 |
|
| | | $ | 4,739 | | $ | 3,271 | | $ | 2,098 | | $ | 1,482 | | $ | 1,388 | | $ | 7,166 | | $ | 20,144 |
|
Contingent Liabilities
The Company is involved in litigation and claims in the normal course of operations. In addition, the Company may provide indemnifications, in the normal course of operations, that are often standard contractual terms to counterparties in certain transactions, such as purchase and sale agreements. The terms of these indemnifications will vary based upon the contract, the nature of which prevents the Company from making a reasonable estimate of the maximum potential amounts that may be required to be paid. Management is of the opinion that any resulting settlements relating to the litigation matters or indemnifications would not materially affect the financial position or results of operations of the Company.
Note 25 Variable Interest Entities
Accounting Guideline 15 (AcG 15),Consolidation of Variable Interest Entities (VIEs), provides criteria for the identification of VIEs and further criteria for determining what entity, if any, should consolidate them. Entities in which equity investors do not have the characteristic of a controlling financial interest or do not have sufficient equity at risk for the entity to finance its activities without additional subordinated financial support are subject to consolidation by a company if that company is deemed the primary beneficiary. The primary beneficiary is the party that is subject to a majority of the risk of loss from the VIEs' activities, or is entitled to receive a majority of the VIEs' residual returns, or both. The Company has determined that certain retail licensee and wholesale marketer agreements would constitute VIEs, even though the Company has no ownership in these entities. The Company, however, is not the primary beneficiary and, therefore, consolidation is not required. In certain of the retail licensee arrangements, the Company has provided loan guarantees. Management is of the opinion that the Company's maximum exposure to loss from these arrangements would not be material.
Notes to Consolidated Financial Statements PETRO-CANADA 95
Note 26 Generally Accepted Accounting Principles in the United States
The application of United States GAAP would have the following effects on net earnings as reported:
| | | Notes | | | 2007 | | | 2006 | | | 2005 | |
| |
Net earnings from continuing operations, as reported in the
Consolidated Statement of Earnings | | | | $ | 2,733 | | $ | 1,588 | | $ | 1,693 | |
| Adjustments, before income taxes | | | | | | | | | | | | |
| | Accounting for income taxes | | (a) | | | 14 | | | 8 | | | 117 | |
| | Capitalization of interest and related amortization | | (c) | | | 19 | | | 47 | | | 46 | |
| | Stock-based compensation | | (f) | | | (31 | ) | | (24 | ) | | – | |
| | Other | | (b) | | | (6 | ) | | – | | | 1 | |
| | Income taxes on above items | | | | | 3 | | | (10 | ) | | (15 | ) |
| |
| Net earnings from continuing operations, as adjusted before cumulative effect of change in accounting policy | | | | | 2,732 | | | 1,609 | | | 1,842 | |
| |
| Net earnings from discontinued operations | | | | | – | | | 152 | | | 98 | |
| |
| Net earnings, as adjusted before cumulative effect of change in accounting policy | | | | | 2,732 | | | 1,761 | | | 1,940 | |
| |
| Cumulative effect of change in accounting policy, net of income taxes | | (f) | | | – | | | (14 | ) | | – | |
| |
| Net earnings, as adjusted | | | | $ | 2,732 | | $ | 1,747 | | $ | 1,940 | |
| |
| Earnings from continuing operations, as adjusted before cumulative effect of change in accounting policy per share | | | | | | | | | | | | |
| | Basic | | | | $ | 5.59 | | $ | 3.19 | | $ | 3.55 | |
| |
| | Diluted | | | | $ | 5.53 | | $ | 3.16 | | $ | 3.51 | |
| |
| Earnings, as adjusted before cumulative effect of change in accounting policy per share | | | | | | | | | | | | |
| | Basic | | | | $ | 5.59 | | $ | 3.49 | | $ | 3.74 | |
| |
| | Diluted | | | | $ | 5.53 | | $ | 3.45 | | $ | 3.69 | |
| |
| Earnings, as adjusted per share | | | | | | | | | | | | |
| | Basic | | | | $ | 5.59 | | $ | 3.47 | | $ | 3.74 | |
| |
| | Diluted | | | | $ | 5.53 | | $ | 3.43 | | $ | 3.69 | |
| |
The application of United States GAAP would have the following effects on comprehensive income as reported:
| | | Notes | | | 2007 | | | 2006 | | | 2005 | |
| |
Comprehensive income, net of tax, as reported in the
Consolidated Statement of Comprehensive Income | | | | $ | 2,473 | | $ | 2,103 | | $ | 1,203 | |
| Adjustments to net earnings, net of tax | | | | | (1 | ) | | 7 | | | 149 | |
| Adjustments to other comprehensive income, net of tax | | | | | | | | | | | | |
| | Additional pension liability | | (e) | | | (52 | ) | | 42 | | | (65 | ) |
| | Unrealized loss on translation of foreign currency denominated additional capitalized interest | | (c) | | | (20 | ) | | 6 | | | – | |
| |
| Comprehensive income, net of tax, as adjusted | | | | $ | 2,400 | | $ | 2,158 | | $ | 1,287 | |
| |
96 PETRO-CANADA Notes to Consolidated Financial Statements
The application of United States GAAP would have the following effects on the Consolidated Balance Sheet as reported:
| | | | | December 31, 2007
| | December 31, 2006
| |
| | |
Notes | | | As
Reported | | | United
States
GAAP | | | As
Reported | | | United
States
GAAP | |
| |
| Current assets | | | | $ | 3,178 | | $ | 3,178 | | $ | 2,826 | | $ | 2,826 | |
| Property, plant and equipment, net | | (a, b, c) | | | 19,497 | | | 20,112 | | | 18,577 | | | 19,209 | |
| Goodwill | | (a) | | | 731 | | | 710 | | | 801 | | | 780 | |
| Other assets | | (e, g) | | | 446 | | | 384 | | | 442 | | | 314 | |
| Current liabilities | | (f) | | | 3,623 | | | 3,705 | | | 3,348 | | | 3,375 | |
| Long-term debt | | (g) | | | 3,339 | | | 3,445 | | | 2,887 | | | 2,887 | |
| Other liabilities | | (e, f) | | | 717 | | | 1,056 | | | 1,826 | | | 2,200 | |
| Asset retirement obligations | | | | | 1,234 | | | 1,234 | | | 1,170 | | | 1,170 | |
| Future income taxes | | (a, b, c, e, f) | | | 3,069 | | | 3,068 | | | 2,974 | | | 2,977 | |
| Common shares | | | | | 1,365 | | | 1,365 | | | 1,366 | | | 1,366 | |
| Contributed surplus | | (d) | | | 24 | | | 795 | | | 469 | | | 1,591 | |
| Retained earnings | | (d) | | | 10,692 | | | 10,316 | | | 8,557 | | | 7,831 | |
| Accumulated other comprehensive income (loss) | | (e) | | $ | (211 | ) | $ | (600 | ) | $ | 49 | | $ | (268 | ) |
| |
The Company's Consolidated Financial Statements have been prepared in accordance with Canadian GAAP, which differ in some respects from those applicable in the United States. The following are the significant differences in accounting principles as they pertain to the accompanying Consolidated Financial Statements:
- a)
- Income Taxes
The liability method followed by the Company differs from United States GAAP due to the application of transitional provisions upon adoption and the use of substantively enacted versus enacted rates. The Company has adopted the Financial Accounting Standards Board (FASB) Interpretation No. 48 – Accounting for Uncertainty in Income Taxes – an Interpretation of FASB Statement No. 109 for the year ended December 31, 2007. This Interpretation prescribes a recognition threshold and measurement attribute for the financial statement recognition and measurement of a tax position taken or expected to be taken in a tax return. The Interpretation requires the Company to determine whether it is more-likely-than-not that a tax position will be sustained upon examination, including resolution of any related appeals or litigation processes, based on the technical merits of the position. Only tax positions that meet the more-likely-than-not recognition threshold are measured to determine the amount of benefit to recognize in the financial statements. The tax position is measured at the largest amount of benefit that is greater than 50% likely of being realized upon ultimate settlement. The Interpretation also provides guidance on derecognition, classification, interest and penalties, accounting in interim periods, disclosure and transition. This Interpretation has been applied prospectively, with no adjustment to prior periods. As at December 31, 2007, there are no United States GAAP differences as a result of adopting this Interpretation.
- b)
- Property, Plant and Equipment
Under Canadian GAAP, exploration costs for mining properties are capitalized when such costs have the characteristics of property, plant and equipment. Under United States GAAP, exploration costs for mining properties, including costs directly associated with establishing proved and probable reserves (collectively "reserves") as defined by SEC Industry Guide 7, are expensed until proved and probable reserves have been established by a feasibility study. Costs of upgrading resources to reserves in close proximity to areas where reserves have been established may either be capitalized or expensed until proved and probable reserves have been established by a feasibility study. For United States GAAP purposes, we have elected to expense these costs until proved and probable reserves have been established by a feasibility study.
Notes to Consolidated Financial Statements PETRO-CANADA 97
- c)
- Interest Capitalization
The Company capitalizes interest attributable to the construction of major new facilities under both Canadian and United States GAAP, but uses different capitalization methodologies under each. Under United States GAAP, the amount of interest capitalized for the period is the product of the average accumulated capitalized costs and the weighted-average interest rate applicable to all borrowings outstanding during the period. However, under Canadian GAAP, the amount of interest capitalized is calculated using the same formula except that the average accumulated capitalized costs are first multiplied by the Company's average corporate debt to equity ratio.
- d)
- Contributed Surplus
In prior years, the Company transferred $1,122 million from contributed surplus to the accumulated deficit. United States GAAP does not permit these transfers. As a result of this difference, under United States GAAP, the excess of the purchase price over the carrying amount of shares repurchased under the Company's normal course issuer bid has been recorded as a reduction of contributed surplus. Under Canadian GAAP, this excess cost has been recorded as a reduction of both contributed surplus and retained earnings.
- e)
- Pensions and Other Post-Retirement Benefits
United States GAAP requires the Company to recognize the overfunded or underfunded status of its defined benefit post-retirement plans, measured as the difference between the fair value of plan assets and the benefit obligation, as an asset or liability on its balance sheet. Changes to the funding status in the year are recorded through other comprehensive income, net of tax. Canadian GAAP currently does not require the Company to recognize the funded status of these plans in the Consolidated Balance Sheet.
- f)
- Stock-Based Compensation
United States GAAP requires compensation costs related to share-based awards classified as liabilities to be recognized as an expense at fair value with re-measurement to fair value each period. Under Canadian GAAP, the Company recognizes compensation cost for stock options, which provide the holder the right to exercise the stock option or surrender the option for cash payment based on the intrinsic value at each period end.
- g)
- Deferred Financing Costs
The Company adopted CICA 3855,Financial Instruments – Recognition and Measurement on January 1, 2007. As a result, transaction costs and premiums or discounts directly attributable to the issuance of long-term debt are now added to the fair value of the debt upon initial recognition. Previously, these amounts were deferred and presented as assets. This is still the prescribed treatment under United States GAAP.
- h)
- Cash Flow Information
The application of United States GAAP would not have a material effect on cash flow from total operating, investing, or financing activities on the Consolidated Statement of Cash Flows.
Note 27 Recent Accounting Pronouncements
Canadian
Convergence of Canadian GAAP with International Financial Reporting Standards
In 2006, Canada's Accounting Standards Board (AcSB) ratified a strategic plan that will result in Canadian GAAP, as used by public companies, being converged with International Financial Reporting Standards over a transitional period. The AcSB has developed
98 PETRO-CANADA Notes to Consolidated Financial Statements
and published a detailed implementation plan, with a changeover date for fiscal years beginning on or after January 1, 2011. This convergence initiative is in its early stages as of the date of these annual Consolidated Financial Statements. Accordingly, it would be premature to assess the impact of the initiative on the Company at this time.
Financial Instruments – Disclosures and Presentation
The AcSB has issued CICA Handbook Sections 3862 and 3863,Financial Instruments – Disclosures, andFinancial Instruments – Presentation. Section 3862 requires entities to provide disclosures in their financial statements that enable users to evaluate the significance of financial instruments to the entity's financial position and performance. It also requires that entities disclose the nature and extent of risks arising from financial instruments and how the entity manages those risks. Section 3863 establishes standards for presentation of financial instruments and non-financial derivatives and deals with the classification of financial instruments, from the perspective of the issuer, between liabilities and equity, the classification of related interest, dividends, losses and gains, and the circumstances in which financial assets and financial liabilities are offset.
These standards are both effective for fiscal years beginning on or after October 1, 2007.
Capital Disclosures
The AcSB has issued CICA Handbook Section 1535,Capital Disclosures, which requires entities to disclose their objectives, policies and processes for managing capital and whether they are in compliance with any externally imposed capital requirements. This standard is effective for fiscal years beginning on or after October 1, 2007.
Inventories
The AcSB has issued CICA Handbook Section 3031,Inventories. This new standard provides considerable guidance when determining the cost of inventory. Where costs of inventory items cannot be specifically identified, costs must be assigned consistently on either a "first-in, first-out" (FIFO) or weighted-average cost basis. A "last-in, first-out" (LIFO) cost basis is no longer acceptable. The standard is effective for fiscal years beginning on or after January 1, 2008. The Company is adopting this standard prospectively. Converting the cost of crude oil and refined petroleum products from a LIFO to FIFO costing basis will increase January 1, 2008 inventories by $812 million, future income tax liabilities by $256 million, and retained earnings by $556 million.
United States
Fair Value Measurements
The FASB issued Statement 157,Fair Value Measurements. This Statement defines fair value, establishes a framework for measured fair value in GAAP and expands disclosures about fair value measurements. This Statement applies under other accounting pronouncements that require or permit fair value measurements. This Statement is effective for fiscal years beginning after November 15, 2007. The Company is in the process of assessing the impact of this Statement.
Fair Value Option for Financial Assets and Financial Liabilities
The FASB issued Statement 159,Fair Value Option for Financial Assets and Financial Liabilities. This Standard allows for the elective measurement of eligible financial instruments and certain other items at fair value in order to mitigate the volatility in net earnings without having to apply detailed and complex hedge accounting rules. This Statement is effective for fiscal years beginning after November 15, 2007. The Company does not expect there to be any material impact on the Consolidated Financial Statements upon adoption of this Standard.
Business Combinations
The FASB issued Revised Statement 141R,Business Combinations. This Standard mandates that all future business combinations be accounted for as a purchase by one party of another; that all assets, liabilities (including liabilities related to contingent consideration) and non-controlling interest of the acquiree be recorded at their fair value; and that all acquisition costs be expensed. This Standard will likely impact future Consolidated Financial Statements should the Company engage in business combinations.
Notes to Consolidated Financial Statements PETRO-CANADA 99
Reserves of Crude Oil, Natural Gas Liquids, Natural Gas, Bitumen and Synthetic Crude Oil – Before Royalties
The table below shows, for the years indicated, Petro-Canada's estimates of proved reserves, before royalties for Oil and Gas activities. The reporting of working interest reserves before royalties does not conform to SEC standards and is for general supplemental information.
| | |
Oil and Gas Activities1, 2, 3, 4, 5
| |
| | |
International
| |
North America
| | | | | |
| | | | | | |
Other International
| | | | | |
North American Natural Gas
| | | | | | | | | | | | | |
| | |
North Sea6
| |
North Africa/Near
East7, 8, 9, 10, 11
| |
Northern Latin
America7, 12
| |
Subtotal
| |
Western Canada17
| |
U.S. Rockies
| |
East
Coast
| |
Oil
Sands17
| |
Subtotal
| |
Total
| |
| | |
Crude
oil &
NGL | |
Natural
gas | |
Crude
oil &
NGL | |
Natural
gas | |
Natural
gas | |
Crude
oil &
NGL | |
Natural
gas | |
Crude
oil &
NGL | |
Natural
gas | |
Crude
oil &
NGL | |
Natural
gas | |
Crude
oil &
NGL | |
Bitumen | |
Crude oil,
NGL &
bitumen | |
Natural
gas | |
Crude oil,
NGL &
bitumen | |
Natural
gas | |
| |
| Beginning of year 2006 | | 143 | | 115 | | 200 | | 16 | | 239 | | 343 | | 370 | | 42 | | 1,729 | | 7 | | 96 | | 132 | | – | | 181 | | 1,825 | | 524 | | 2,195 | |
| Revisions of previous estimates14 | | 13 | | (6 | ) | (2 | ) | – | | (1 | ) | 11 | | (7 | ) | 1 | | (47 | ) | 2 | | 64 | | 18 | | 165 | | 186 | | 17 | | 197 | | 10 | |
| Sale of reserves in place | | – | | (2 | ) | (46 | ) | (15 | ) | – | | (46 | ) | (17 | ) | – | | (1 | ) | – | | – | | – | | – | | – | | (1 | ) | (46 | ) | (18 | ) |
| Purchase of reserves in place | | – | | – | | – | | – | | – | | – | | – | | – | | 1 | | – | | – | | – | | – | | – | | 1 | | – | | 1 | |
| Discoveries, extensions and improved recovery | | – | | – | | – | | – | | – | | – | | – | | – | | 27 | | – | | – | | – | | – | | – | | 27 | | – | | 27 | |
| Production net | | (12 | ) | (23 | ) | (18 | ) | – | | (23 | ) | (30 | ) | (46 | ) | (4 | ) | (209 | ) | (1 | ) | (15 | ) | (27 | ) | (8 | ) | (40 | ) | (224 | ) | (70 | ) | (270 | ) |
| |
| End of year 2006 | | 144 | | 84 | | 134 | | 1 | | 215 | | 278 | | 300 | | 39 | | 1,500 | | 8 | | 145 | | 123 | | 157 | | 327 | | 1,645 | | 605 | | 1,945 | |
| Revisions of previous estimates14 | | 7 | | 16 | | (9 | ) | (1 | ) | – | | (2 | ) | 15 | | (1 | ) | (90 | ) | 1 | | 10 | | 7 | | 72 | | 79 | | (80 | ) | 77 | | (65 | ) |
| Sale of reserves in place | | – | | – | | – | | – | | – | | – | | – | | (1 | ) | (11 | ) | – | | – | | – | | – | | (1 | ) | (11 | ) | (1 | ) | (11 | ) |
| Purchase of reserves in place | | – | | – | | – | | – | | – | | – | | – | | – | | 1 | | – | | – | | – | | – | | – | | 1 | | – | | 1 | |
| Discoveries, extensions and improved recovery | | 19 | | 12 | | 3 | | – | | – | | 22 | | 12 | | 1 | | 102 | | 3 | | 41 | | 6 | | 55 | | 65 | | 143 | | 87 | | 155 | |
| Production net | | (30 | ) | (21 | ) | (17 | ) | – | | (26 | ) | (47 | ) | (47 | ) | (4 | ) | (194 | ) | (1 | ) | (25 | ) | (36 | ) | (8 | ) | (49 | ) | (219 | ) | (96 | ) | (266 | ) |
| |
| End of year 2007 | | 140 | | 91 | | 111 | | – | | 189 | | 251 | | 280 | | 34 | | 1,308 | | 11 | | 171 | | 100 | | 276 | | 421 | | 1,479 | | 672 | | 1,759 | |
| |
Proved undeveloped reserves |
|
|
|
|
|
|
|
|
|
|
|
|
|
|
|
|
|
|
|
|
|
|
|
|
|
|
|
|
|
|
|
|
|
|
|
| Beginning of year 2006 | | 95 | | 14 | | 22 | | – | | 178 | | 117 | | 192 | | 1 | | 132 | | 3 | | 30 | | 43 | | – | | 47 | | 162 | | 164 | | 354 | |
| |
| End of year 2006 | | 42 | | 3 | | 3 | | – | | 138 | | 45 | | 141 | | – | | 56 | | 4 | | 36 | | 33 | | 129 | | 166 | | 92 | | 211 | | 233 | |
| |
| End of year 2007 | | 20 | | 2 | | 2 | | – | | 138 | | 22 | | 140 | | 1 | | 69 | | 6 | | 46 | | 29 | | 230 | | 266 | | 115 | | 288 | | 255 | |
| |
See footnotes on page 104.
100 PETRO-CANADA 2007 Annual Report
Reserves of Crude Oil, Natural Gas Liquids, Natural Gas, and Bitumen – After Royalties
The table below shows, for the years indicated, Petro-Canada's estimates of proved reserves, after royalties for Oil and Gas activities in accordance with SEC standards for oil and gas activities.
| | |
Oil and Gas Activities1, 2, 3, 4, 5 | |
| | |
| |
| | |
International | |
North America | | | | | |
| | |
| | | | | |
| | | | | | |
Other International | | | | | |
North American Natural Gas | | | | | | | | | | | | | |
| | | | | | |
| | | | | |
| | | | | | | | | | | | | |
| | |
North Sea6 | |
North Africa/Near
East7, 8, 9, 10, 11 | |
Northern Latin
America7, 12 | |
Subtotal | |
Western Canada17 | |
U.S. Rockies | |
East
Coast | |
Oil
Sands17 | |
Subtotal | |
Total | |
| | |
| |
| | |
Crude
oil &
NGL | |
Natural
gas | |
Crude
oil &
NGL | |
Natural
gas | |
Natural
gas | |
Crude
oil &
NGL | |
Natural
gas | |
Crude
oil &
NGL | |
Natural
gas | |
Crude
oil &
NGL | |
Natural
gas | |
Crude
oil &
NGL | |
Bitumen | |
Crude oil,
NGL &
bitumen | |
Natural
gas | |
Crude oil,
NGL &
bitumen | |
Natural
gas | |
| |
| Beginning of year 2006 | | 142 | | 115 | | 152 | | 5 | | 203 | | 294 | | 323 | | 34 | | 1,339 | | 5 | | 79 | | 113 | | – | | 152 | | 1,418 | | 446 | | 1,741 | |
| Revisions of previous estimates14 | | 13 | | (6 | ) | 28 | | 10 | | (2 | ) | 41 | | 2 | | 1 | | (43 | ) | 2 | | 55 | | 10 | | 159 | | 172 | | 12 | | 213 | | 14 | |
| Sale of reserves in place | | – | | (2 | ) | (42 | ) | (15 | ) | – | | (42 | ) | (17 | ) | – | | (1 | ) | – | | – | | – | | – | | – | | (1 | ) | (42 | ) | (18 | ) |
| Purchase of reserves in place | | – | | – | | – | | – | | – | | – | | – | | – | | 1 | | – | | – | | – | | – | | – | | 1 | | – | | 1 | |
| Discoveries, extensions and improved recovery | | – | | – | | – | | – | | – | | – | | – | | – | | 21 | | – | | – | | – | | – | | – | | 21 | | – | | 21 | |
| Production net | | (12 | ) | (23 | ) | (16 | ) | – | | (12 | ) | (28 | ) | (35 | ) | (3 | ) | (166 | ) | (1 | ) | (12 | ) | (25 | ) | (8 | ) | (37 | ) | (178 | ) | (65 | ) | (213 | ) |
| |
| End of year 2006 | | 143 | | 84 | | 122 | | – | | 189 | | 265 | | 273 | | 32 | | 1,151 | | 6 | | 122 | | 98 | | 151 | | 287 | | 1,273 | | 552 | | 1,546 | |
| Revisions of previous estimates14 | | 7 | | 16 | | (7 | ) | – | | – | | – | | 16 | | (1 | ) | (70 | ) | 1 | | 8 | | 2 | | 55 | | 57 | | (62 | ) | 57 | | (46 | ) |
| Sale of reserves in place | | – | | – | | – | | – | | – | | – | | – | | (1 | ) | (8 | ) | – | | – | | – | | – | | (1 | ) | (8 | ) | (1 | ) | (8 | ) |
| Purchase of reserves in place | | – | | – | | – | | – | | – | | – | | – | | – | | 1 | | – | | – | | – | | – | | – | | 1 | | – | | 1 | |
| Discoveries, extensions and improved recovery | | 20 | | 12 | | 2 | | – | | – | | 22 | | 12 | | – | | 77 | | 3 | | 34 | | 4 | | 48 | | 55 | | 111 | | 77 | | 123 | |
| Production net | | (30 | ) | (21 | ) | (16 | ) | – | | (24 | ) | (46 | ) | (45 | ) | (3 | ) | (151 | ) | (1 | ) | (21 | ) | (31 | ) | (7 | ) | (42 | ) | (172 | ) | (88 | ) | (217 | ) |
| |
| End of year 2007 | | 140 | | 91 | | 101 | | – | | 165 | | 241 | | 256 | | 27 | | 1,000 | | 9 | | 143 | | 73 | | 247 | | 356 | | 1,143 | | 597 | | 1,399 | |
| |
Proved undeveloped reserves |
|
|
|
|
|
|
|
|
|
|
|
|
|
|
|
|
|
|
|
|
|
|
|
|
|
|
|
|
|
|
|
|
|
|
|
| Beginning of year 2006 | | 95 | | 14 | | 15 | | – | | 151 | | 110 | | 165 | | 1 | | 99 | | 3 | | 25 | | 33 | | – | | 37 | | 124 | | 147 | | 289 | |
| |
| End of year 2006 | | 42 | | 4 | | 2 | | – | | 121 | | 44 | | 125 | | – | | 42 | | 4 | | 30 | | 24 | | 124 | | 152 | | 72 | | 196 | | 197 | |
| |
| End of year 2007 | | 20 | | 2 | | 2 | | – | | 121 | | 22 | | 123 | | – | | 52 | | 5 | | 38 | | 20 | | 201 | | 226 | | 90 | | 248 | | 213 | |
| |
See footnotes on page 104.
2007 Annual Report PETRO-CANADA 101
| Reserves of Synthetic Crude Oil |
|
The table below shows, for the years indicated, Petro-Canada's estimates of proved reserves for Oil Sands Mining activities in accordance with SEC Industry Guide 7.
Proved Developed and Undeveloped Reserves
(Synthetic crude oil in MMbbls)
| | | Syncrude Mining Operation1,2,3,4,5,13,16,17
| |
| | |
Before Royalties | |
After Royalties | |
| |
| Beginning of year 2006 | | 342 | | 287 | |
| Revisions of previous estimates14 | | 14 | | 12 | |
| Sale of reserves in place | | – | | – | |
| Purchase of reserves in place | | – | | – | |
| Discoveries, extensions and improved recovery | | – | | – | |
| Production net | | (11 | ) | (10 | ) |
| |
| End of year 2006 | | 345 | | 289 | |
| Revisions of previous estimates14 | | 18 | | 11 | |
| Sale of reserves in place | | – | | – | |
| Purchase of reserves in place | | – | | – | |
| Discoveries, extensions and improved recovery | | – | | – | |
| Production net | | (13 | ) | (11 | ) |
| |
| End of year 2007 | | 350 | | 289 | |
| |
Proved undeveloped reserves |
|
|
|
|
|
| Beginning of year 2006 | | 209 | | 173 | |
| |
| End of year 2006 | | 219 | | 182 | |
| |
| End of year 2007 | | 238 | | 197 | |
| |
See footnotes on page 104.
102 PETRO-CANADA 2007 Annual Report
| Reserves of Crude Oil, Natural Gas Liquids, Natural Gas, Bitumen and Synthetic Crude Oil |
|
The table below shows, for the years indicated, Petro-Canada's estimates of proved reserves for Oil and Gas activities and Oil Sands Mining activities. The reporting of working interest reserves before royalties, MMboe and combining oil and gas and oil sands mining activities together does not conform to SEC standards, and is for general supplemental information.
Proved Developed and Undeveloped Reserves
| |
Oil and Gas Activities and Oil Sands Mining
| |
|---|
| | |
Natural Gas
(Bcf) | |
Crude Oil & NGLs
(MMbbls) | |
Crude Oil,
Natural Gas & NGLs
(MMboe) | |
| | | Before
Royalties | | After
Royalties | | Before
Royalties | | After
Royalties | | Before
Royalties | | After
Royalties | |
| |
| Beginning of year 2006 | | 2,195 | | 1,741 | | 866 | | 733 | | 1,232 | | 1,023 | |
| Revisions of previous estimates14 | | 10 | | 14 | | 211 | | 225 | | 213 | | 228 | |
| Sale of reserves in place | | (18 | ) | (18 | ) | (46 | ) | (42 | ) | (49 | ) | (45 | ) |
| Purchase of reserves in place | | 1 | | 1 | | – | | – | | – | | – | |
| Discoveries, extensions and improved recovery | | 27 | | 21 | | – | | – | | 4 | | 4 | |
| Production net | | (270 | ) | (213 | ) | (81 | ) | (75 | ) | (126 | ) | (111 | ) |
| |
| End of year 2006 | | 1,945 | | 1,546 | | 950 | | 841 | | 1,274 | | 1,099 | |
| Revisions of previous estimates14 | | (65 | ) | (46 | ) | 95 | | 68 | | 84 | | 60 | |
| Sale of reserves in place | | (11 | ) | (8 | ) | (1 | ) | (1 | ) | (3 | ) | (2 | ) |
| Purchase of reserves in place | | 1 | | 1 | | – | | – | | – | | – | |
| Discoveries, extensions and improved recovery | | 155 | | 123 | | 87 | | 77 | | 113 | | 97 | |
| Production net | | (266 | ) | (217 | ) | (109 | ) | (99 | ) | (153 | ) | (135 | ) |
| |
| End of year 2007 | | 1,759 | | 1,399 | | 1,022 | | 886 | | 1,315 | | 1,119 | |
| |
Proved undeveloped reserves15 |
|
|
|
|
|
|
|
|
|
|
|
|
|
| Beginning of year 2006 | | 354 | | 289 | | 373 | | 320 | | 432 | | 368 | |
| |
| End of year 2006 | | 233 | | 197 | | 430 | | 378 | | 469 | | 411 | |
| |
| End of year 2007 | | 255 | | 213 | | 526 | | 445 | | 569 | | 481 | |
| |
See footnotes on page 104.
2007 Annual Report PETRO-CANADA 103
- 1
- In order to harmonize its oil and gas disclosure in both Canada and the U.S., Petro-Canada applied for, and received, certain exemptions to reserves disclosure requirements as set out in NI 51-101. These exemptions permit Petro-Canada to use its own staff of qualified reserves evaluators to prepare the Company's reserves estimates and to use SEC and FASB standards when preparing and reporting reserves. Such reserves information may differ from reserves information prepared in accordance with Canadian disclosure standards under NI 51-101. These differences relate to the SEC requirement for disclosure only of proved reserves calculated at constant year-end prices and costs while NI 51-101 requires disclosure of proved plus probable reserves at forecast prices and costs. In addition, the definition of proved reserves differs between SEC and NI 51-101 requirements. However, this difference should not be material. The COGE Handbook (the source document for reserves definitions under NI 51-101) supports this view.
- 2
- Petro-Canada employs the services of independent third-party evaluators/auditors to assess its reserves policies, procedures and practices and its reserves estimates.
- 3
- Proved reserves before royalties are Petro-Canada's working interest reserves before the deduction of Crown or other royalties. Such royalties are subject to change by legislation or regulation and can also vary depending on production rates, selling prices and timing of initial production. Reserves quantities after royalty also reflect net overriding royalty interests paid and received.
- 4
- Proved reserves are the estimated quantities of crude oil, natural gas and NGL, which geological and engineering data demonstrate with reasonable certainty to be recoverable in future years from known reservoirs under existing economic and operating conditions. Proved developed reserves are those proved reserves that are expected to be recovered from existing wells or facilities. Proved undeveloped reserves are proved reserves which are not recoverable from existing wells or facilities, but which are expected to be recovered through additional development drilling or through the upgrading of existing or additional new facilities.
- 5
- Unproved reserves are based on geological and/or engineering data similar to that used in estimates of proved reserves, but technical, contractual, economic or regulatory uncertainties preclude such reserves being classified as proved. Unproved reserves may be further classified as probable reserves and possible reserves.
- 6
- Reserves in the North Sea are subject to a conventional royalty and tax regime. No royalty is payable on reserves in the U.K. sector. Royalty is payable on onshore reserves in the Netherlands.
- 7
- Proved reserves include quantities of crude oil and natural gas, which will be produced under arrangements, which involve the Company or its subsidiaries in upstream risks and rewards, but which do not transfer title of the product to those companies.
- 8
- In Petro-Canada's PSCs, after royalty proved reserves have been determined using the economic interest method and include the Company's share of future cost recovery and Profit Oil after foreign governments' royalty interest, and include reserves relating to income tax payable. Under this method, reported reserves will increase as oil prices decrease (and vice versa) since the barrels necessary to achieve cost recovery change with the prevailing oil prices. Three per cent of Petro-Canada's total proved reserves before and after royalty are held under PSCs.
- 9
- Reserves in Syria are held under PSCs with the Syrian government and are calculated as per footnote 8.
- 10
- With the exception of the En Naga field, reserves in Libya were held under a concession and subject to a royalty and tax regime. The En Naga field is held under a PSC with the Libyan government, with reserves being calculated as per footnote 8.
- 11
- The volume of proved oil and gas reserves before royalties reported above held under PSCs in the North Africa/Near East region at the end of 2007 was 8 MMbbls of crude oil and NGL and zero Bcf of natural gas. At year-end 2006, the volume was 10 MMbbls of crude oil and NGL and zero Bcf of natural gas. The after royalty reserves volume at year-end 2007 was 7 MMbbls of crude oil and NGL and zero Bcf of natural gas and year-end 2006 was 7 MMbbls of crude oil and NGL and zero Bcf of natural gas.
- 12
- Natural gas reserves offshore Trinidad and Tobago are held under a PSC with the applicable government and are calculated as per footnote 8. The volume of proved natural gas reserves before royalties reported above held under PSCs offshore Trinidad and Tobago at the end of 2007 was 189 Bcf. At year-end 2006, the volume was 215 Bcf. The after royalty reserves volume at year-end 2007 was 165 Bcf and year-end 2006 was 189 Bcf.
- 13
- SEC regulations do not define proved reserves of synthetic crude oil from oil sands mining operations as an oil and gas activity. These reserves are classified as a mining activity and are estimated in accordance with SEC Industry Guide 7. Petro-Canada views these reserves as an integral part of the Company's business. Proved reserves of synthetic crude oil are based on high geological certainty and application of proven or piloted technology. For proved reserves, drill-hole spacing is less than 500 metres and appropriate co-owner and regulatory approvals are in place. Syncrude proved oil sands mining reserves have been determined using SEC year-end prices in the economics.
- 14
- Revisions include changes in previous estimates, either upward or downward, resulting from new information (except an increase in acreage) normally obtained from drilling or production history or resulting from a change in economic factors.
- 15
- Proved undeveloped crude oil and NGL proved reserves represent approximately 43% of Petro-Canada's total crude oil and NGL proved reserves. The vast majority of these oil and NGL reserves are associated with large development projects currently producing or under active development, including Buzzard, MacKay River, Syncrude, White Rose, Terra Nova and Hibernia. Proved undeveloped gas reserves represent approximately 14% of total proved natural gas reserves. These reserves typically will be developed through tie-in of existing wells, drilling of additional wells or addition of compression facilities. Fifty-four per cent of the proved undeveloped gas reserves are associated with the currently producing NCMA-1 development offshore Trinidad and Tobago. Generally, the Company plans to develop proved undeveloped natural gas reserves in the next few years.
- 16
- For internal management purposes, we view the oil sands mining reserves as part of the Company's total exploration and production operations.
- 17
- Proved reserves in Alberta were calculated using the existing Alberta royalty regime at December 31, 2007. Petro-Canada has run sensitivities using guidelines from the New Alberta Royalty Framework for both its Oil Sands and conventional oil and gas activities and determined that there was no impact on proved reserves before royalties. The impact on proved reserves after royalties was not material.
104 PETRO-CANADA 2007 Annual Report
| Quarterly Financial and Stock Trading Information |
|
(unaudited, stated in millions of Canadian dollars, unless otherwise indicated)
| | | | First
Quarter
| | | Second
Quarter
| | | Third
Quarter
| | | Fourth
Quarter
2007 | | | First
Quarter
| | | Second
Quarter
| | | Third
Quarter
| | | Fourth
Quarter
2006 | |
| |
| Revenue | | | | | | | | | | | | | | | | | | | | | | | | | |
| Operating | | $ | 4,867 | | $ | 5,529 | | $ | 5,549 | | $ | 5,765 | | $ | 4,415 | | $ | 4,836 | | $ | 5,065 | | $ | 4,595 | |
| Investment and other income (expense) | | | (26 | ) | | (51 | ) | | (52 | ) | | (331 | ) | | (227 | ) | | (106 | ) | | 136 | | | (45 | ) |
| |
| | | | 4,841 | | | 5,478 | | | 5,497 | | | 5,434 | | | 4,188 | | | 4,730 | | | 5,201 | | | 4,550 | |
| |
Expenses |
|
|
|
|
|
|
|
|
|
|
|
|
|
|
|
|
|
|
|
|
|
|
|
|
|
| Crude oil and product purchases | | | 2,308 | | | 2,522 | | | 2,562 | | | 2,899 | | | 2,100 | | | 2,578 | | | 2,745 | | | 2,226 | |
| Operating, marketing and general | | | 827 | | | 986 | | | 919 | | | 820 | | | 821 | | | 782 | | | 742 | | | 835 | |
| Exploration | | | 142 | | | 100 | | | 65 | | | 183 | | | 97 | | | 78 | | | 57 | | | 107 | |
| Depreciation, depletion and amortization | | | 441 | | | 516 | | | 498 | | | 636 | | | 335 | | | 312 | | | 311 | | | 407 | |
| Unrealized (gain) loss on translation of foreign currency denominated long-term debt | | | (17 | ) | | (124 | ) | | (93 | ) | | (12 | ) | | 2 | | | (73 | ) | | 1 | | | 69 | |
| Interest | | | 42 | | | 41 | | | 39 | | | 43 | | | 45 | | | 42 | | | 41 | | | 37 | |
| |
| | | | 3,743 | | | 4,041 | | | 3,990 | | | 4,569 | | | 3,400 | | | 3,719 | | | 3,897 | | | 3,681 | |
| |
| Earnings from continuing operations before income taxes | | | 1,098 | | | 1,437 | | | 1,507 | | | 865 | | | 788 | | | 1,011 | | | 1,304 | | | 869 | |
| Provision for income taxes | | | 508 | | | 592 | | | 731 | | | 343 | | | 734 | | | 539 | | | 626 | | | 485 | |
| |
| Net earnings from continuing operations | | | 590 | | | 845 | | | 776 | | | 522 | | | 54 | | | 472 | | | 678 | | | 384 | |
| |
| Net earnings from discontinued operations | | | – | | | – | | | – | | | – | | | 152 | | | – | | | – | | | – | |
| |
| Net earnings | | $ | 590 | | $ | 845 | | $ | 776 | | $ | 522 | | $ | 206 | | $ | 472 | | $ | 678 | | $ | 384 | |
| |
| Cash flow from (used in) continuing operating activities1 | | $ | 1,166 | | $ | 1,435 | | $ | 1,340 | | $ | (602 | ) | $ | 886 | | $ | 799 | | $ | 959 | | $ | 964 | |
| |
Net Earnings |
|
|
|
|
|
|
|
|
|
|
|
|
|
|
|
|
|
|
|
|
|
|
|
|
|
| Upstream | | | | | | | | | | | | | | | | | | | | | | | | | |
| | North American Natural Gas | | $ | 112 | | $ | 81 | | $ | 55 | | $ | (57 | ) | $ | 139 | | $ | 97 | | $ | 78 | | $ | 91 | |
| | Oil Sands | | | 43 | | | 34 | | | 110 | | | 129 | | | (19 | ) | | 101 | | | 108 | | | 55 | |
| | International & Offshore | | | | | | | | | | | | | | | | | | | | | | | | | |
| | | East Coast Canada | | | 256 | | | 334 | | | 293 | | | 346 | | | 229 | | | 254 | | | 190 | | | 261 | |
| | | International | | | 9 | | | 195 | | | 200 | | | (30 | ) | | (281 | ) | | (63 | ) | | 139 | | | (1 | ) |
| Downstream | | | 184 | | | 259 | | | 105 | | | 81 | | | 75 | | | 139 | | | 176 | | | 83 | |
| Shared Services | | | (14 | ) | | (58 | ) | | 13 | | | 53 | | | (89 | ) | | (56 | ) | | (13 | ) | | (105 | ) |
| |
| Discontinued operations | | | – | | | – | | | – | | | – | | | 152 | | | – | | | – | | | – | |
| |
| Net earnings | | $ | 590 | | $ | 845 | | $ | 776 | | $ | 522 | | $ | 206 | | $ | 472 | | $ | 678 | | $ | 384 | |
| |
- 1
- Cash flow from (used in) continuing operating activities in the fourth quarter of 2007 was significantly reduced due to the payment of $1,145 million after-tax to settle the Buzzard derivative contracts.
2007 Annual Report PETRO-CANADA 105
| Quarterly Financial and Stock Trading Informationcontinued |
|
| | | | First
Quarter
| | | Second
Quarter
| | | Third
Quarter
| | | Fourth
Quarter
2007 | | | First
Quarter
| | | Second
Quarter
| | | Third
Quarter
| | | Fourth
Quarter
2006 |
|
| Share Information(dollars per share) | | | | | | | | | | | | | | | | | | | | | | | | |
| Earnings from continuing operations | | | | | | | | | | | | | | | | | | | | | | | | |
| | – basic | | $ | 1.19 | | $ | 1.71 | | $ | 1.59 | | $ | 1.08 | | $ | 0.11 | | $ | 0.93 | | $ | 1.36 | | $ | 0.77 |
| | – diluted | | | 1.18 | | | 1.70 | | | 1.58 | | | 1.07 | | | 0.10 | | | 0.92 | | | 1.34 | | | 0.76 |
| Earnings | | | | | | | | | | | | | | | | | | | | | | | | |
| | – basic | | | 1.19 | | | 1.71 | | | 1.59 | | | 1.08 | | | 0.40 | | | 0.93 | | | 1.36 | | | 0.77 |
| | – diluted | | | 1.18 | | | 1.70 | | | 1.58 | | | 1.07 | | | 0.40 | | | 0.92 | | | 1.34 | | | 0.76 |
| Cash flow from (used in) continuing operating activities1 | | | 2.35 | | | 2.91 | | | 2.75 | | | (1.24 | ) | | 1.73 | | | 1.58 | | | 1.92 | | | 1.94 |
| Dividends | | | 0.13 | | | 0.13 | | | 0.13 | | | 0.13 | | | 0.10 | | | 0.10 | | | 0.10 | | | 0.10 |
| Toronto Stock Exchange | | | | | | | | | | | | | | | | | | | | | | | | |
| | Share price2 | | | | | | | | | | | | | | | | | | | | | | | | |
| | – high | | | 47.56 | | | 57.20 | | | 61.25 | | | 56.60 | | | 58.59 | | | 57.80 | | | 53.30 | | | 51.70 |
| | – low | | | 41.02 | | | 45.10 | | | 50.97 | | | 48.30 | | | 48.00 | | | 46.11 | | | 42.38 | | | 41.91 |
| | – close(end of period) | | $ | 45.15 | | $ | 56.75 | | $ | 57.07 | | $ | 53.25 | | $ | 55.38 | | $ | 52.96 | | $ | 45.01 | | $ | 47.75 |
| | Shares traded(millions) | | | 163.3 | | | 125.0 | | | 111.0 | | | 133.0 | | | 140.3 | | | 124.2 | | | 111.1 | | | 108.7 |
| New York Stock Exchange | | | | | | | | | | | | | | | | | | | | | | | | |
| | Share price3 | | | | | | | | | | | | | | | | | | | | | | | | |
| | – high | | | 40.03 | | | 53.27 | | | 58.41 | | | 59.87 | | | 51.08 | | | 51.11 | | | 48.24 | | | 45.48 |
| | – low | | | 34.91 | | | 38.91 | | | 47.51 | | | 48.03 | | | 41.20 | | | 41.31 | | | 37.78 | | | 37.37 |
| | – close(end of period) | | $ | 39.21 | | $ | 53.16 | | $ | 57.39 | | $ | 53.62 | | $ | 47.59 | | $ | 47.41 | | $ | 40.33 | | $ | 41.04 |
| | Shares traded(millions) | | | 43.9 | | | 37.8 | | | 47.9 | | | 64.4 | | | 33.8 | | | 38.2 | | | 32.3 | | | 34.2 |
|
- 1
- Cash flow from (used in) continuing operating activities per share in the fourth quarter of 2007 was significantly reduced due to the payment of $1,145 million after-tax to settle the Buzzard derivative contracts.
- 2
- Per share amounts are quoted in Cdn dollars and represent the closing price.
- 3
- Per share amounts are quoted in U.S. dollars and represent the closing price.
106 PETRO-CANADA 2007 Annual Report
| Three-Year Financial and Operating Summary |
|
(stated in millions of Canadian dollars, unless otherwise indicated)
| | | | 2007 | | | 2006 | | | 2005 |
|
| Consolidated | | | | | | | | | |
| Revenue | | $ | 21,250 | | $ | 18,669 | | $ | 16,779 |
| Expenses | | | 16,343 | | | 14,697 | | | 13,377 |
| Provision for income taxes | | | 2,174 | | | 2,384 | | | 1,709 |
|
| Net earnings from continuing operations | | | 2,733 | | | 1,588 | | | 1,693 |
|
| Net earnings from discontinued operations | | | – | | | 152 | | | 98 |
|
| Net earnings | | $ | 2,733 | | $ | 1,740 | | $ | 1,791 |
|
| Cash flow from continuing operating activities1 | | | 3,339 | | | 3,608 | | | 3,783 |
| Total assets | | | 23,852 | | | 22,646 | | | 20,655 |
| Average capital employed | | | 14,328 | | | 12,868 | | | 11,860 |
| Return on capital employed(%) | | | 19.8 | | | 14.3 | | | 16.0 |
| Debt | | | 3,450 | | | 2,894 | | | 2,913 |
| Debt-to-debt plus equity(%) | | | 22.5 | | | 21.7 | | | 23.5 |
| Debt-to-cash flow from continuing operating activities(times)2 | | | 1.0 | | | 0.8 | | | 0.8 |
| Expenditures on property, plant and equipment and exploration from continuing operations | | | 3,988 | | | 3,434 | | | 3,560 |
| Employees | | | 5,603 | | | 5,156 | | | 4,816 |
Shareholders' Data |
|
|
|
|
|
|
|
|
|
| Weighted-average number of common shares outstanding(millions) | | | 489.0 | | | 503.9 | | | 518.4 |
| Weighted-average number of diluted common shares outstanding(millions) | | | 494.0 | | | 509.9 | | | 525.4 |
| Shares outstanding at year end(millions) | | | 483.5 | | | 497.5 | | | 515.1 |
| Toronto Stock Exchange | | | | | | | | | |
| Share price(dollars)3 | | | | | | | | | |
| | – at year end | | | 53.25 | | | 47.75 | | | 46.65 |
| | – range during the year | | | 41.02-61.25 | | | 41.91-58.59 | | | 29.51-50.80 |
| Shares traded(millions) | | | 532.3 | | | 484.3 | | | 575.9 |
| New York Stock Exchange | | | | | | | | | |
| Share price(dollars)4 | | | | | | | | | |
| | – at year end | | | 53.62 | | | 41.04 | | | 40.09 |
| | – range during the year | | | 34.91-59.87 | | | 37.37-51.11 | | | 24.15-43.47 |
| Shares traded(millions) | | | 194.0 | | | 138.5 | | | 105.7 |
| Book value per share(dollars) | | | 24.55 | | | 20.99 | | | 18.41 |
|
- 1
- Cash flow from continuing operating activities in 2007 was reduced due to the payment of $1,145 million after-tax to settle the Buzzard derivative contracts.
- 2
- From continuing operations.
- 3
- Per share amounts are quoted in Cdn dollars on a post-stock dividend basis, reflecting the stock dividend declared in July 2005, and represent the closing price.
- 4
- Per share amounts are quoted in U.S. dollars and represent the closing price.
2007 Annual Report PETRO-CANADA 107
| Three-Year Financial and Operating Summarycontinued |
|
(stated in millions of Canadian dollars, unless otherwise indicated)
| | | | 2007 | | | 2006 | | | 2005 |
|
| North American Natural Gas | | | | | | | | | |
| Net earnings | | $ | 191 | | $ | 405 | | $ | 674 |
|
| Cash flow from continuing operating activities | | | 725 | | | 651 | | | 1,219 |
| Expenditures on property, plant and equipment and exploration | | | 866 | | | 788 | | | 713 |
| Daily production, net(before/after royalties) | | | | | | | | | |
| | – crude oil and liquids(thousands of barrels – Mbbls) | | | 12.5/9.5 | | | 14.2/10.8 | | | 14.7/11.2 |
| | – natural gas(millions of cubic feet – MMcf) | | | 599/471 | | | 616/489 | | | 668/512 |
| Proved reserves(before/after royalties)1 | | | | | | | | | |
| | – crude oil and liquids(MMbbls) | | | 45/36 | | | 47/38 | | | 49/39 |
| | – natural gas(Bcf) | | | 1,479/1,143 | | | 1,645/1,273 | | | 1,825/1,418 |
| Oil and gas landholdings(gross/net) (millions of acres) | | | 13.9/10.8 | | | 16.6/11.6 | | | 16.7/12.2 |
| Wells drilled(gross/net) | | | | | | | | | |
| | – oil | | | 133/118 | | | 78/71 | | | 4/2 |
| | – natural gas | | | 410/297 | | | 569/427 | | | 714/468 |
| | – dry | | | 37/27 | | | 29/25 | | | 25/18 |
|
| Total | | | 580/442 | | | 676/523 | | | 743/488 |
|
Oil Sands |
|
|
|
|
|
|
|
|
|
| Net earnings | | $ | 316 | | $ | 245 | | $ | 115 |
|
| Cash flow from continuing operating activities | | | 512 | | | 499 | | | 340 |
| Expenditures on property, plant and equipment and exploration | | | 779 | | | 377 | | | 772 |
| Daily production, net(before/after royalties) | | | | | | | | | |
| | – bitumen(Mbbls) | | | 20.3/20.1 | | | 21.2/20.8 | | | 21.3/21.1 |
| | – synthetic crude oil(Mbbls) | | | 36.6/31.1 | | | 31.0/28.0 | | | 25.7/25.4 |
| Proved reserves(before/after royalties) | | | | | | | | | |
| | – bitumen(MMbbls)1 | | | 276/247 | | | 157/151 | | | 0/0 |
| | – synthetic crude oil(MMbbls)2 | | | 350/289 | | | 345/289 | | | 342/287 |
| Oil and gas landholdings(gross/net) (millions of acres) | | | 0.8/0.5 | | | 0.8/0.5 | | | 0.7/0.4 |
| Wells drilled(gross/net) | | | | | | | | | |
| | – oil sands – bitumen | | | 19/19 | | | 0/0 | | | 46/46 |
| | – dry | | | 0/0 | | | 0/0 | | | 0/0 |
|
| Total | | | 19/19 | | | 0/0 | | | 46/46 |
|
- 1
- Reporting before royalty reserves does not conform to SEC standards and is for supplemental general information.
- 2
- Synthetic crude oil production is an oil sands mining activity.
108 PETRO-CANADA 2007 Annual Report
| Three-Year Financial and Operating Summarycontinued |
|
(stated in millions of Canadian dollars, unless otherwise indicated)
| | | | 2007 | | | 2006 | | | 2005 | |
| |
| International & Offshore | | | | | | | | | | |
| |
East Coast Canada |
|
|
|
|
|
|
|
|
|
|
| Net earnings | | $ | 1,229 | | $ | 934 | | $ | 775 | |
| |
| Cash flow from continuing operating activities | | | 1,491 | | | 1,129 | | | 1,002 | |
| Expenditures on property, plant and equipment and exploration | | | 159 | | | 256 | | | 314 | |
| Daily production, net(before/after royalties) | | | | | | | | | | |
| | – crude oil and liquids(Mbbls) | | | 98.7/84.4 | | | 72.7/68.5 | | | 75.3/69.6 | |
| Proved reserves(before/after royalties)1 | | | | | | | | | | |
| | – crude oil and liquids(MMbbls) | | | 100/73 | | | 123/98 | | | 132/113 | |
| Oil and gas landholdings(gross/net) (millions of acres) | | | 1.2/0.3 | | | 2.1/0.7 | | | 2.5/0.9 | |
| Wells drilled(gross/net) | | | | | | | | | | |
| | – oil | | | 9/2 | | | 13/4 | | | 15/4 | |
| | – dry | | | 0/0 | | | 0/0 | | | 0/0 | |
| |
| Total | | | 9/2 | | | 13/4 | | | 15/4 | |
| |
International (from continuing operations) |
|
|
|
|
|
|
|
|
|
|
| Net earnings (loss) | | $ | 374 | | $ | (206 | ) | $ | (109 | ) |
| |
| Cash flow from continuing operating activities2 | | | 220 | | | 840 | | | 722 | |
| Expenditures on property, plant and equipment and exploration | | | 762 | | | 760 | | | 696 | |
| Daily production, net(before/after royalties) | | | | | | | | | | |
| | – crude oil and liquids(Mbbls) | | | 129.0/124.7 | | | 82.6/77.9 | | | 83.5/77.7 | |
| | – natural gas(MMcf) | | | 129/123 | | | 126/95 | | | 138/95 | |
| Proved reserves(before/after royalties)1,3 | | | | | | | | | | |
| | – crude oil and liquids(MMbbls) | | | 251/241 | | | 278/265 | | | 343/294 | |
| | – natural gas(Bcf) | | | 280/256 | | | 300/273 | | | 370/323 | |
| Oil and gas landholdings(gross/net) (millions of acres) | | | 32.3/23.5 | | | 31.1/23.5 | | | 30.0/22.2 | |
| Wells drilled(gross/net) | | | | | | | | | | |
| | – oil | | | 20/9 | | | 24/9 | | | 17/9 | |
| | – natural gas | | | 3/2 | | | 9/1 | | | 1/0 | |
| | – dry | | | 3/3 | | | 4/1 | | | 4/2 | |
| |
| Total | | | 26/14 | | | 37/11 | | | 22/11 | |
| |
- 1
- Reporting before royalty reserves does not conform to SEC standards and is for supplemental general information.
- 2
- International cash flow from continuing operating activities in 2007 was reduced by the payment of $1,145 million after-tax to settle the Buzzard derivative contracts.
- 3
- 2005 amounts include the mature Syrian producing assets, which were sold on January 31, 2006.
2007 Annual Report PETRO-CANADA 109
| Three-Year Financial and Operating Summarycontinued |
|
(stated in millions of Canadian dollars, unless otherwise indicated)
| | | | 2007 | | | 2006 | | | 2005 |
|
| Downstream | | | | | | | | | |
| Net earnings | | $ | 629 | | $ | 473 | | $ | 415 |
|
| Cash flow from continuing operating activities | | | 994 | | | 835 | | | 663 |
| Expenditures on property, plant and equipment | | | 1,396 | | | 1,229 | | | 1,053 |
| Petroleum product sales(thousands of m3/d) | | | 53.3 | | | 52.5 | | | 52.8 |
| Retail outlets at year end | | | 1,313 | | | 1,312 | | | 1,323 |
| Refinery crude capacity at year end(thousands of m3/d) | | | 40.5 | | | 40.5 | | | 40.5 |
| Average refinery utilization(%) | | | 99 | | | 93 | | | 96 |
|
Discontinued Operations |
|
|
|
|
|
|
|
|
|
| Net earnings from discontinued operations | | $ | – | | $ | 152 | | $ | 98 |
|
| Cash flow from discontinued operating activities | | | – | | | 15 | | | 204 |
| Expenditures on property, plant and equipment and exploration | | | – | | | 1 | | | 46 |
| Daily production, net(before/after royalties) | | | | | | | | | |
| | – crude oil and liquids(Mbbls) | | | – / – | | | 5.2/1.4 | | | 65.9/20.3 |
| | – natural gas(MMcf) | | | – / – | | | 2/ – | | | 25/4 |
| Proved reserves(before/after royalties)1 | | | | | | | | | |
| | – crude oil and liquids(MMbbls) | | | 0/0 | | | 0/0 | | | 44/15 |
| | – natural gas(Bcf) | | | 0/0 | | | 0/0 | | | 15/5 |
| Oil and gas landholdings(gross/net) (millions of acres) | | | 0/0 | | | 0/0 | | | 0.5/0.2 |
| Wells drilled(gross/net) | | | | | | | | | |
| | – oil | | | 0/0 | | | 0/0 | | | 44/15 |
| | – natural gas | | | 0/0 | | | 0/0 | | | 0/0 |
| | – dry | | | 0/0 | | | 0/0 | | | 5/2 |
|
| Total | | | 0/0 | | | 0/0 | | | 49/17 |
|
- 1
- Reporting before royalty reserves does not conform to SEC standards and is for supplemental general information.
110 PETRO-CANADA 2007 Annual Report
Executive
Leadership Team*
RON A. BRENNEMAN
President and
Chief Executive Officer
NEIL J. CAMARTA
Senior Vice-President,
Oil Sands
BORIS J. JACKMAN
Executive Vice-President,
Downstream
PETER S. KALLOS
Executive Vice-President,
International & Offshore
E.F.H. ROBERTS
Executive Vice-President and
Chief Financial Officer |
|
KATHLEEN E. SENDALL
Senior Vice-President,
North American Natural Gas
ANDREW STEPHENS
Senior Vice-President,
Corporate Relations
Associate Members
SCOTT R. MILLER
Vice-President,
General Counsel
M.A. (GRETA) RAYMOND
Vice-President,
Environment, Safety and
Social Responsibility
Board of Directors*
RON A. BRENNEMAN
President and
Chief Executive Officer,
Petro-Canada |
|
GAIL COOK-BENNETT
Chairperson,
Canada Pension Plan
Investment Board
RICHARD J. CURRIE, O.C.
Chairman of the Board,
BCE Inc.
CLAUDE FONTAINE, Q.C.
Counsel,
Ogilvy Renault LLP
PAUL HASELDONCKX
Corporate Director
THOMAS E. KIERANS, O.C.
Chairman,
Canadian Journalism Foundation
BRIAN F. MACNEILL, C.M.
Chairman of the Board,
Petro-Canada
MAUREEN MCCAW
Corporate Director |
|
PAUL D. MELNUK
Chairman and
Chief Executive Officer,
Thermadyne Holdings Corporation
and Managing Partner,
FTL Capital Partners
GUYLAINE SAUCIER, F.C.A., C.M.
Corporate Director
JAMES W. SIMPSON
Corporate Director
DANIEL VALOT
Corporate Director
Secretary to the
Board of Directors
HUGH L. HOOKER
Chief Compliance Officer,
Corporate Secretary and
Associate General Counsel,
Petro-Canada |
* As of December 31, 2007.
Please see the 2008 Management Proxy Circular for additional information about Petro-Canada's senior officers, Board of Directors and governance practices. The Management Proxy Circular contains disclosure on executive compensation and contracts, reports of Board of Directors' Committees and a description of each Committee's responsibilities, a Statement of Corporate Governance Practices and detail on Directors' business backgrounds, tenure, Committee membership, remuneration and share ownership. The Management Proxy Circular is available for viewing on the Company's website at www.petro-canada.ca or by contacting Investor Relations.
OUTSTANDING SHARES
At December 31, 2007,
Petro-Canada's public float was
483,459,119 shares.
TRANSFER AGENT AND REGISTRAR
In Canada:
CIBC Mellon Trust Company
Telephone: 416-643-5500
Fax: 416-643-5501
E-mail: inquiries@cibcmellon.com
Website: www.cibcmellon.com
In the United States:
The Bank of New York Mellon
Telephone: 1-800-387-0825
DUPLICATE REPORTS
Shareholders with more than one unregistered account may receive duplicate materials. To eliminate duplicate mailings, contact your broker. Registered shareholders should contact the transfer agent and registrar. |
|
ANNUAL MEETING
The Annual Meeting of Shareholders of Petro-Canada will be held at 11:00 a.m. (MDT) on Tuesday, April 29, 2008, in Macleod Hall D at the Telus Convention Centre, 120 – 9 Avenue S.E., Calgary, Alberta.
STOCK EXCHANGE LISTINGS AND SYMBOLS
Toronto: PCA
New York: PCZ
DIVIDENDS
Petro-Canada's Board of Directors approves a quarterly dividend of $0.13 ($0.52 per annum) per common share. The Board of Directors regularly reviews the dividend strategy to ensure alignment with shareholders' expectations and financial and growth objectives. |
|
ON THE WEBSITE
Petro-Canada's website,
www.petro-canada.ca, contains a variety of corporate and investor information, including
• Statistical Supplement
• Annual Information Form
• Quarterly Reports
• Management Proxy Circular
• Corporate Governance Practices (including the Company's Corporate Governance Handbook)
• Presentations and webcasts
• Dividend History
• Petro-Canada's Code of Business Conduct
• Petro-Canada's Principles for
Responsible Investment and
Operations
• Report to the Community |
|
INVESTOR INQUIRIES
Telephone: 403-296-4040
Fax: 403-296-3061
E-mail: investor@petro-canada.ca
MEDIA INQUIRIES
Corporate Communications
Telephone: 403-296-6795
GENERAL INQUIRIES
Petro-Canada
P.O. Box 2844
Calgary, Alberta, Canada T2P 3E3
Telephone: 403-296-8000
Fax: 403-296-3030
Website: www.petro-canada.ca
WE WOULD LIKE YOUR FEEDBACK
We invite your comments on
our Annual Report. Please e-mail
your comments to
aranson@petro-canada.ca. |
2007 Annual Report PETRO-CANADA 111
| Glossary of Terms and Ratios |
|
| |
| |
|
|---|
TERMS
Barrel of Oil Equivalent
Natural gas production is converted using six thousand cubic feet of gas for one barrel of oil.
Capital Employed
Total of shareholders' equity and debt.
Debt
Short-term notes payable and long-term debt, including current portion.
Life-of-Field Production
The estimated volume of hydrocarbons to be recovered from a reservoir or field in the period from start of production to abandonment. Typically, it refers to the estimated proved plus probable reserves.
|
|
RATIOS
Return on Capital Employed
Net earnings plus after-tax interest expense divided by average capital employed. Measures net earnings relative to the capital employed in the Company.
Cash Flow Return on Capital Employed
Cash flow from continuing operating activities plus after-tax interest expense divided by average capital employed. Measures cash flow generated relative to the asset base.
Return on Equity
Net earnings divided by average shareholders' equity. Measures the return earned by shareholders on their investment in the Company.
Debt-to-Cash Flow From Continuing Operating Activities
Debt divided by cash flow from continuing operating activities. Indicates the Company's ability to discharge its outstanding debt.
Debt-to-Debt Plus Equity
Debt divided by debt plus equity. Indicates the relative amount of debt in the Company's capital structure. Measures financial strength.
Book Value Per Share
Total shareholders' equity divided by the number of shares outstanding at year end. |
|
Interest Coverage
Measures the Company's ability to cover interest charges on debt.
Net Earnings Basis
Net earnings from continuing operations before interest expense and income taxes divided by interest expense plus capitalized interest.
EBITDAX Basis
Net earnings from continuing operations before interest expense, provision for income taxes, depreciation, depletion and amortization and exploration expenses divided by interest expense plus capitalized interest.
Cash Flow Basis
Cash flow from continuing operating activities before interest expense and current income taxes divided by interest expense plus capitalized interest.
CONVERSION FACTORS
To conform with common usage, imperial units of measurement are used in this report to describe exploration and production, while metric units are used for refining and marketing. Dollars are Canadian unless otherwise stated.
1 cubic metre (liquids) = 6.29 barrels
1 cubic metre (natural gas) = 35.30 cubic feet
1 litre = 0.22 imperial gallons
1 hectare = 2.47 acres
1 cubic metre = 1,000 litres |
112 PETRO-CANADA 2007 Annual Report
QuickLinks