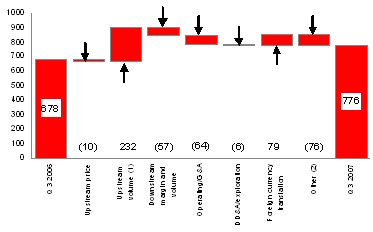
(millions of Canadian dollars, after-tax)
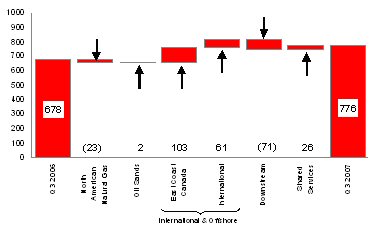
| | Net earnings from continuing operations increased to $776 million ($1.59/share) in the third quarter of 2007, compared with $678 million ($1.36/share) in the third quarter of 2006. Higher upstream production, gains on foreign currency translation and stronger realized crude oil prices contributed to higher net earnings from continuing operations. These factors were offset by higher other expenses, which includes the realized loss and lower unrealized mark-to-market gains on the derivative contracts associated with Buzzard, increased operating and general and administrative (G&A) expenses, decreased Downstream refining margins, weaker realized natural gas prices and increased depreciation, depletion and amortization (DD&A), and exploration expenses. |
| (1) | Upstream volumes include the portion of DD&A expense associated with changes in upstream production levels. |
| (2) | Other mainly includes interest expense, changes in effective tax rates, gain on sale of assets, insurance proceeds, amounts related to the derivative contracts associated with Buzzard and upstream inventory movements. |
Net Earnings from Continuing Operations by Segment
(millions of Canadian dollars, after-tax)
| | Net earnings from continuing operations on a segmented basis increased 14% to $776 million in the third quarter of 2007, compared with $678 million in the third quarter of 2006. The increase in third quarter net earnings from continuing operations reflected higher East Coast Canada, International and Oil Sands net earnings. Shared Services recorded net earnings in the third quarter of 2007 due to gains in foreign currency translation. The results were partially offset by lower Downstream and North American Natural Gas net earnings. |
During the third quarter of 2007, cash flow from continuing operating activities was $1,340 million ($2.75/share), up from $959 million ($1.92/share) in the same quarter of 2006. The increase in cash flow from continuing operating activities primarily reflects higher net earnings.
MANAGEMENT’S DISCUSSION AND ANALYSIS
PETRO-CANADA
Quarterly Financial Information
| | | Three months ended | |
(millions of Canadian dollars, except per share amounts) | | Sept. 30 2007 | | | June 30 2007 | | | March 31 2007 | | | Dec. 31 2006 | | | Sept. 30 2006 | | | June 30 2006 | | | March 31 2006 | | | Dec. 31 2005 | |
Total revenue from continuing operations | | $ | 5,497 | | | $ | 5,478 | | | $ | 4,841 | | | $ | 4,550 | | | $ | 5,201 | | | $ | 4,730 | | | $ | 4,188 | | | $ | 4,838 | |
| | | | | | | | | | | | | | | | | | | | | | | | | | | | | | | | | |
Net earnings from continuing operations | | $ | 776 | | | $ | 845 | | | $ | 590 | | | $ | 384 | | | $ | 678 | | | $ | 472 | | | $ | 54 | | | $ | 668 | |
| Per share – basic | | | 1.59 | | | | 1.71 | | | | 1.19 | | | | 0.77 | | | | 1.36 | | | | 0.93 | | | | 0.11 | | | | 1.29 | |
| – diluted | | | 1.58 | | | | 1.70 | | | | 1.18 | | | | 0.76 | | | | 1.34 | | | | 0.92 | | | | 0.10 | | | | 1.28 | |
| | | | | | | | | | | | | | | | | | | | | | | | | | | | | | | | | |
Net earnings | | $ | 776 | | | $ | 845 | | | $ | 590 | | | $ | 384 | | | $ | 678 | | | $ | 472 | | | $ | 206 | | | $ | 714 | |
| Per share – basic | | | 1.59 | | | | 1.71 | | | | 1.19 | | | | 0.77 | | | | 1.36 | | | | 0.93 | | | | 0.40 | | | | 1.38 | |
| – diluted | | | 1.58 | | | | 1.70 | | | | 1.18 | | | | 0.76 | | | | 1.34 | | | | 0.92 | | | | 0.40 | | | | 1.36 | |
UPSTREAM
Production from Continuing Operations
Petro-Canada converts volumes of natural gas to oil equivalent at a rate of six Mcf of natural gas to one bbl of oil. Production volumes disclosed refer to net working interest before royalties, unless otherwise specified.
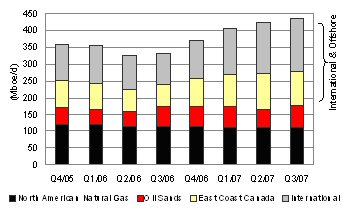
| | In the third quarter of 2007, production from continuing operations increased for the fifth consecutive quarter, averaging 436,000 boe/d net to Petro-Canada, up significantly from 333,000 boe/d net in the same quarter of 2006. Higher volumes reflected the addition of North Sea projects (Buzzard, De Ruyter and L5b-C) and higher East Coast Canada and Oil Sands production. This was slightly offset by declines in the North American Natural Gas business. Production in the third quarter of 2006 was reduced by the shutdown of Terra Nova for a planned maintenance turnaround. |
North American Natural Gas
| | | Three months ended September 30, | | | Nine months ended September 30, | |
(millions of Canadian dollars) | | 2007 | | | 2006 | | | 2007 | | | 2006 | |
Net earnings | | $ | 55 | | | $ | 78 | | | $ | 248 | | | $ | 314 | |
| Cash flow from continuing operating activities | | $ | 155 | | | $ | 135 | | | $ | 561 | | | $ | 543 | |
North American Natural Gas facilities continued to operate reliably in the third quarter of 2007.
Net earnings for North American Natural Gas were $55 million in the third quarter of 2007, down from $78 million in the third quarter of 2006. Lower volumes and realized prices combined with increased operating expenses and DD&A expense was partially offset by lower exploration expense.
MANAGEMENT’S DISCUSSION AND ANALYSIS
PETRO-CANADA
North American Natural Gas Production and Pricing
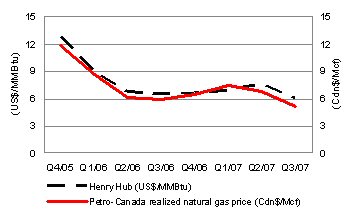
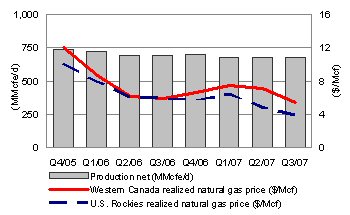
| | In the third quarter of 2007, North American Natural Gas production declined by 3%, compared with the same period in 2006. Lower production reflected the sale of the Brazeau and West Pembina assets and anticipated natural declines in Western Canada. These factors were partially offset by higher natural gas production in the U.S. Rockies. Realized natural gas prices in Western Canada decreased by 10% in the third quarter of 2007, compared with the same quarter of 2006, consistent with market price trends. U.S. Rockies realized natural gas prices decreased 34% in the third quarter of 2007, compared with the third quarter of 2006, reflecting ongoing pipeline constraints. |
| | | Third Quarter 2007 | | | Third Quarter 2006 | |
Production net (MMcfe/d) (1) | | | | | | |
| Western Canada | | | 586 | | | | 639 | |
U.S. Rockies | | | 89 | | | | 57 | |
| Total North American Natural Gas production net | | | 675 | | | | 696 | |
Western Canada realized natural gas price (Cdn$/Mcf) (1) | | $ | 5.35 | | | $ | 5.97 | |
U.S. Rockies realized natural gas price (Cdn$/Mcf) (1) | | $ | 3.96 | | | $ | 6.03 | |
| (1) | For North American Natural Gas crude oil and NGL production and average realized prices, refer to the charts on pages 19 and 20, respectively. |
Petro-Canada operated gas plants and facilities in Western Canada delivered about 99% reliability in the third quarter of 2007. The Company completed its summer drilling program, where 108 wells were drilled in Western Canada and the U.S. Rockies.
| U.S. Rockies production increased to 89 MMcfe/d in the third quarter of 2007, an increase of 56% compared with the same quarter of 2006. This was due to the ramp up of production from the Wild Turkey and other coal bed methane fields in the Powder River basin and increased drilling activity in the Denver-Julesburg basin. U.S. Rockies production is targeted to increase to 100 MMcfe/d by the end of 2007; however, the Company continues to face ongoing pipeline constraints. |
Scheduled Turnarounds
No major turnarounds are planned at the Company’s natural gas processing facilities for 2007.
Other Developments
In September 2007, the Alberta Royalty Review Panel delivered its final report and recommendations to the Government of Alberta. The government has announced that it intends to provide a formal response to the report in October. The Company is assessing the impacts of various scenarios on Alberta operations through its business planning process in both the North American Natural Gas and Oil Sands businesses. All major investment decisions will be subject to the final outcome of the Company’s analysis of the Alberta royalty review.
Oil Sands
| | | Three months ended September 30, | | | Nine months ended September 30, | |
(millions of Canadian dollars) | | 2007 | | | 2006 | | | 2007 | | | 2006 | |
Net earnings (1) | | $ | 110 | | | $ | 108 | | | $ | 187 | | | $ | 190 | |
| Cash flow from continuing operating activities | | $ | 176 | | | $ | 193 | | | $ | 405 | | | $ | 300 | |
| (1) | Oil Sands bitumen inventory movements increased net earnings by $2 million before-tax ($1 million after-tax) and $6 million before-tax ($4 million after-tax) for the three and nine months ended September 30, 2007, respectively. The same factor decreased net earnings by $5 million before-tax ($3 million after-tax) and $3 million before-tax ($2 million after-tax) for the three and nine months ended September 30, 2006, respectively. |
In September 2007, Petro-Canada signed a memorandum of agreement to secure an additional 5% working interest in the Fort Hills project that, when finalized, would bring the Company’s total stake to 60%.MANAGEMENT’S DISCUSSION AND ANALYSIS
PETRO-CANADA
In the third quarter of 2007, Oil Sands net earnings were $110 million, up from $108 million in the third quarter of 2006. Higher realized prices and volumes at Syncrude were partially offset by lower realized prices and volumes for MacKay River bitumen, and higher operating costs at Syncrude due primarily to increased production. Net earnings in the third quarter of 2006 included $12 million of Syncrude insurance proceeds related to the 2005 hydrogen plant fire.
Oil Sands Production and Pricing
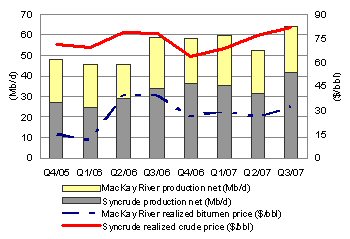
| | Syncrude delivered record production, up 23% in the third quarter of 2007 compared with the third quarter of 2006, reflecting the Stage III expansion. Syncrude realized prices were 5% higher in the third quarter of 2007, compared with the third quarter of 2006. MacKay River production was down 12% in the third quarter of 2007, compared with the same period of 2006, due primarily to water treatment issues following planned maintenance on the co-generation unit. MacKay River realized bitumen prices were 17% lower in the third quarter of 2007, compared with the third quarter of 2006. |
| | | Third Quarter 2007 | | Third Quarter 2006 |
Production net (b/d) | | | | | | |
Syncrude | | | 41,800 | | | | 34,000 | |
MacKay River | | | 22,000 | | | | 25,000 | |
| Total Oil Sands production net | | | 63,800 | | | | 59,000 | |
Syncrude realized crude price ($/bbl) | | $ | 81.77 | | | $ | 77.91 | |
MacKay River realized bitumen price ($/bbl) | | $ | 32.48 | | | $ | 39.13 | |
In the third quarter of 2007, the Company completed the MacKay River plant capacity upgrade and began steaming the fourth well pad. Production from the new well pad is expected to commence around year end, with ramp up throughout 2008.
In October 2007, the steam header line feeding high pressure steam to pads 22 and 23 at the MacKay River in situ facility was damaged, resulting in the termination of steam injection to these pads. The Company is presently assessing the situation and expects repairs, followed by ramp up to normal service, to be approximately eight weeks. As a result, production from the MacKay River facility is expected to average 20,000 b/d in the fourth quarter of 2007 and 21,500 b/d for the year ending December 31, 2007, down from the Company's guidance of 24,000 b/d provided on July 26, 2007. This decrease in production at MacKay River is not expected to impact the Company's overall production from continuing operations guidance range of 400,000 boe/d to 420,000 boe/d for 2007.
On October 1, 2007, Syncrude’s Coker 8-3 was taken off-line. This unit is now back online and continues to have operating constraints which are being largely offset by swinging additional feed to Cokers 8-1 and 8-2. The Company does not expect any impact to its production guidance for Syncrude for the year.
Fort Hills Project
In September 2007, Petro-Canada and its partners in the Fort Hills integrated mine and upgrader project signed an MOA for the Company to earn an additional 5% working interest in the project in return for funding $375 million of partnership expenditures. This transaction is expected to be finalized in the fourth quarter of 2007, and will bring Petro-Canada’s total stake in the Fort Hills project to 60%. The partnership also entered into a memorandum of agreement with Sturgeon County and the Alberta Capital Region Wastewater Commission (ACRWC) to use treated waste water from the ACRWC as industrial process water at the Fort Hills Sturgeon Upgrader.
The first phase of the Fort Hills project is planned to produce 140,000 b/d gross of synthetic crude oil (84,000(1) b/d net). Associated bitumen production is expected to be about 160,000 b/d gross (96,000(1) b/d net). First bitumen production is expected to begin in the fourth quarter of 2011, with first synthetic crude oil production from the Sturgeon Upgrader anticipated in the second quarter of 2012. The preliminary capital cost estimate for the mine and upgrading components of the first phase of Fort Hills is $14.1 billion gross ($8.5(1) billion net). The project is currently in the FEED stage. FEED is
| (1) | Approximate ownership amount after closing of MOA executed September 19, 2007. |
MANAGEMENT’S DISCUSSION AND ANALYSIS
PETRO-CANADA
expected to be completed in the third quarter of 2008, producing a definitive cost estimate and the basis upon which the final go-ahead decision on the project will be made.
MacKay River Expansion Project
In August, the proposed MacKay River 40,000 b/d in situ expansion project moved into FEED. The project is targeting first production in late 2010. A regulatory decision on the proposed project is now anticipated in the fourth quarter of 2007, with a project sanction decision expected in 2008.
Scheduled Turnarounds
No major turnarounds are planned at Syncrude or MacKay River for the remainder of 2007.
Other Developments
In September 2007, the Alberta Royalty Review Panel delivered its final report and recommendations to the Government of Alberta. The government has announced that it intends to provide a formal response to the report in October. The Company is assessing the impacts of various scenarios on Alberta operations through its business planning process in both the North American Natural Gas and Oil Sands businesses. All major investment decisions will be subject to the final outcome of the Company’s analysis of the Alberta royalty review.
International & Offshore
In the first quarter of 2007, the Company combined its East Coast Canada and International businesses under one management structure. The change leverages and grows the capabilities of similar operations. The combined East Coast Canada and International operations are now referred to as International & Offshore.
East Coast Canada
| | | Three months ended September 30, | | | Nine months ended September 30, | |
(millions of Canadian dollars) | | 2007 | | | 2006 | | | 2007 | | | 2006 | |
Net earnings (1) | | $ | 293 | | | $ | 190 | | | $ | 883 | | | $ | 673 | |
| Cash flow from continuing operating activities | | $ | 403 | | | $ | 232 | | | $ | 1,230 | | | $ | 837 | |
| (1) | East Coast Canada crude oil inventory movements increased net earnings by $23 million before-tax ($15 million after-tax) and $48 million before-tax ($32 million after-tax) for the three and nine months ended September 30, 2007, respectively. The same factor decreased net earnings by $12 million before-tax ($7 million after-tax) and increased net earnings by $13 million before-tax ($9 million after-tax) for the three and nine months ended September 30, 2006, respectively. |
East Coast Canada production delivered strong net earnings for the quarter.
Net earnings for East Coast Canada were $293 million in the third quarter of 2007, up from $190 million in the third quarter of 2006. Higher realized prices, increased volumes at Terra Nova and White Rose, and lower operating expenses were partially offset by lower production at Hibernia and increased DD&A expense.
East Coast Canada Production and Pricing
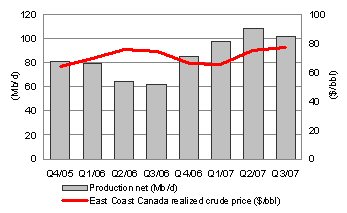
| In the third quarter of 2007, East Coast Canada production increased 64%, compared with the same period in 2006. Solid operations at Terra Nova and stronger volumes at White Rose contributed to the increase. Hibernia production was lower in the third quarter of 2007, compared with the third quarter of 2006, due to anticipated natural declines and increasing water production. Terra Nova had no production in the third quarter of 2006 due to a planned maintenance turnaround. During the third quarter of 2007, East Coast Canada realized crude prices increased slightly, compared with the third quarter of 2006. |
MANAGEMENT’S DISCUSSION AND ANALYSIS
PETRO-CANADA
| | | Third Quarter 2007 | | Third Quarter 2006 |
Production net (b/d) | | | | | | |
Terra Nova | | | 44,300 | | | | – | |
Hibernia | | | 27,900 | | | | 33,500 | |
White Rose | | | 29,900 | | | | 28,800 | |
| Total East Coast Canada production net | | | 102,100 | | | | 62,300 | |
Average realized crude price ($/bbl) | | $ | 76.83 | | | $ | 74.26 | |
The Terra Nova Floating Production Storage and Offloading (FPSO) vessel operated at 90% facility reliability in the third quarter of 2007 and achieved a cumulative production milestone of 200 million barrels in July. Performance of the Terra Nova FPSO swivel was unchanged in the third quarter of 2007. Plans are being developed for the repair or replacement of the swivel if performance deteriorates.
In September 2007, the gas turbine that drives the starboard main power generator (MPG) on the Terra Nova FPSO sustained damage requiring shutdown of that generator for inspection and repair. This work is expected to take up to 10 weeks. The Company does not expect this repair to impact its production guidance for East Coast Canada for the year.
During the third quarter of 2007, the SeaRose FPSO in the White Rose field continued to operate reliably, producing at 108,700 b/d gross (29,900 b/d net). A scheduled 16-day turnaround was completed at White Rose in the third quarter of 2007.
In September, the Government of Newfoundland and Labrador approved the Canada-Newfoundland and Labrador Offshore Petroleum Board’s (C-NLOPB) recommendation to permit development of the South White Rose Extension. Shortly thereafter, the White Rose partners reached an agreement in principle with the province on fiscal and other terms for the White Rose Expansion development, incorporating the South White Rose Extension, North Amethyst and West White Rose satellite fields. The White Rose partners continue to work with the province to develop a binding agreement and, in turn, a set of formal agreements.
Scheduled Turnarounds
No major turnaround activity is planned for Terra Nova, White Rose or Hibernia for the remainder of 2007.
East Coast Canada Royalties
In the third quarter of 2007, East Coast Canada royalties averaged 18%, up from 3% in the third quarter of 2006. Royalties in the third quarter of 2006 were down due to the Terra Nova turnaround. Terra Nova production was subject to Tier I royalties of 30% of net revenue, or approximately 25% of gross revenues in the third quarter of 2007. In the third quarter of 2007, White Rose incurred a Tier I royalty of 20% of net revenue (subject to government assessment), thereby increasing the effective royalty rates from 5% to 16% of gross revenues. In the third quarter of 2007, production from Hibernia continued to be subject to basic royalties of 5% of gross revenue.
Other Developments
In August, the Hebron partners signed a non-binding memorandum of understanding with the Government of Newfoundland and Labrador related to the fiscal and other terms for the future development of the Hebron/Ben Nevis offshore oilfield.
International
For reporting purposes, Petro-Canada has consolidated its International activities into two regions: North Sea (the U.K., the Netherlands and Norway sectors) and Other International (Trinidad and Tobago, Libya, Syria and Venezuela). This change better reflects existing production and exploration interests.
| | | Three months ended September 30, | | | Nine months ended September 30, | |
(millions of Canadian dollars) | | 2007 | | | 2006 | | | 2007 | | | 2006 | |
Net earnings (loss) from continuing operations (1) | | $ | 200 | | | $ | 139 | | | $ | 404 | | | $ | (205 | ) |
| Cash flow from continuing operating activities | | $ | 455 | | | $ | 180 | | | $ | 1,088 | | | $ | 669 | |
| (1) | International crude oil inventory movements increased net earnings from continuing operations by $58 million before-tax ($13 million after-tax) and $28 million before-tax ($6 million after-tax) for the three and nine months ended September 30, 2007, respectively. The same factor decreased the net earnings from continuing operations by $2 million before-tax ($3 million after-tax) and decreased the net loss from continuing operations by $35 million before-tax ($(3) million after-tax) for the three and nine months ended September 30, 2006, respectively. |
MANAGEMENT’S DISCUSSION AND ANALYSIS
PETRO-CANADA
Buzzard achieved plateau production in August 2007, contributing to the strong net earnings for the quarter.
In the third quarter of 2007, International had net earnings from continuing operations of $200 million, compared with $139 million in the third quarter of 2006. Higher volumes from the North Sea were partially offset by higher operating costs and increased exploration and DD&A expenses. Higher exploration expenses related to the Company’s drilling program, primarily in Syria, and seismic costs in Norway. Higher operating costs and increased DD&A expenses related primarily to the addition of North Sea projects (Buzzard, De Ruyter and L5b-C). Net earnings from continuing operations in the third quarter of 2007 included a $70 million unrealized gain and an $87 million realized loss on the Buzzard derivative contracts. The net earnings from continuing operations in the third quarter of 2006 included a $79 million unrealized gain on the derivative contracts associated with Buzzard.
International Production and Pricing
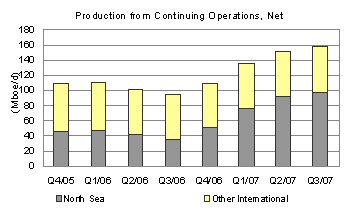
| International production from continuing operations increased 65% in the third quarter of 2007, compared with the third quarter of 2006. In the third quarter of 2007, production from the U.K. and the Netherlands sectors of the North Sea increased by 180%, reflecting the addition of production from Buzzard, De Ruyter and L5b-C, partially offset by anticipated natural declines. Other International production was relatively unchanged in the third quarter of 2007, compared with the third quarter of 2006. |
| | | Third Quarter 2007 | | | Third Quarter 2006 | |
Production from continuing operations net (boe/d) | | | | | | |
U.K. sector of the North Sea | | | 75,200 | | | | 24,400 | |
The Netherlands sector of the North Sea | | | 22,100 | | | | 10,400 | |
North Sea | | | 97,300 | | | | 34,800 | |
Other International | | | 59,900 | | | | 60,400 | |
| Total International production net | | | 157,200 | | | | 95,200 | |
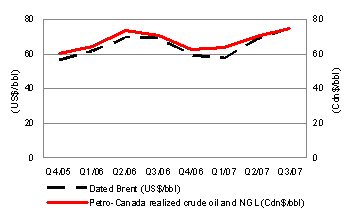
Average realized crude oil and NGL prices from continuing operations ($/bbl) | | $ | 77.33 | | | $ | 75.46 | |
Average realized natural gas price from continuing operations ($/Mcf) | | $ | 5.91 | | | $ | 6.68 | |
International operations’ realized crude oil and NGL prices increased 2% in the third quarter of 2007, compared with the same period in 2006. Realized prices from continuing operations for natural gas decreased 12% in the third quarter of 2007, compared with the same period in the prior year.
North Sea
In the U.K. sector of the North Sea, Buzzard production averaged approximately 176,600 boe/d gross (52,800 boe/d net) in the third quarter of 2007. The field has 10 production wells and achieved plateau production of 200,000 boe/d gross (59,800 boe/d net) during the third quarter of 2007. The partners continue to evaluate solutions to address the elevated levels of hydrogen sulphide (H2S) in some of the producing wells. A decision on the appropriate solution required for the long term is expected around year end.
In the Netherlands sector of the North Sea, production from the Petro-Canada operated De Ruyter facility continued at the rated platform capacity of 27,000 b/d gross (about 14,600 b/d net) in the third quarter of 2007. The Hanze platform successfully completed its planned shutdown in July.
Other International
Production in Libya averaged 49,100 boe/d in the third quarter of 2007, down slightly from 49,700 boe/d in the same quarter of 2006.
Preparations continued for exploration activities on Block 137 in the Sirte basin in Libya, including the completion of an environmental impact assessment in the third quarter of 2007.
MANAGEMENT’S DISCUSSION AND ANALYSIS
PETRO-CANADA
Trinidad and Tobago offshore gas production averaged 65 MMcf/d in the third quarter of 2007, flat compared with 64 MMcf/d in the third quarter of 2006. In the third quarter of 2007, Petro-Canada completed and received approval of its environmental impact assessments for the drilling programs on Blocks 1a, 1b and 22 in advance of the arrival of the contracted drilling rigs. The Company drilled the Zandolie West exploration well on Block 1a. The well has been completed and the results are being evaluated. Drilling of the Anole well on Block 1b is currently underway and a second well on Block 1a, Zandolie East, is expected to be drilled later this year. The Company continued to prepare for exploration drilling on Block 22, with operations expected to begin in the fourth quarter of 2007.
In the third quarter of 2007, the settlement with the Venezuelan government for the sale of Petro-Canada’s interest in the La Ceiba project was completed.
Ebla Gas Project
In the third quarter of 2007, Petro-Canada continued to advance FEED and undertook 2D and 3D seismic operations. The first well is expected to spud late in the fourth quarter of 2007. When completed, the Ebla gas project in Syria is expected to produce 80 MMcf/d of natural gas, with first gas anticipated in 2010.
Discontinued Operations
On January 31, 2006, Petro-Canada completed the sale of the Company’s mature producing assets in Syria to a joint venture of companies owned by India’s Oil and Natural Gas Corporation Limited and the China National Petroleum Corporation for net proceeds of $640 million. The sale resulted in a gain on disposal of $134 million recorded in the first quarter of 2006. This sale aligned with Petro-Canada’s strategy to focus on long-life and operated assets within its asset portfolio. Petro-Canada’s activities in Syria remain an important part of the Company’s international portfolio, with an active exploration program in Block II and the addition of the Ebla natural gas project in Syria during 2006.
Discontinued Operations | | Three months ended September 30, | | | Nine months ended September 30, | |
(millions of Canadian dollars) | | 2007 | | | 2006 | | | 2007 | | | 2006 | |
Net earnings from discontinued operations | | $ | – | | | $ | – | | | $ | – | | | $ | 152 | |
| Cash flow from discontinued operating activities | | $ | – | | | $ | – | | | $ | – | | | $ | 15 | |
Production net (boe/d) | | | – | | | | – | | | | – | | | | 7,000 | |
Average realized crude oil and NGL price ($/bbl) | | $ | – | | | $ | – | | | $ | – | | | $ | 71.84 | |
| Average realized natural gas price ($/Mcf) | | $ | – | | | $ | – | | | $ | – | | | $ | 7.94 | |
DOWNSTREAM
| | | Three months ended September 30, | | | Nine months ended September 30, | |
(millions of Canadian dollars) | | 2007 | | | 2006 | | | 2007 | | | 2006 | |
Net earnings | | $ | 105 | | | $ | 176 | | | $ | 548 | | | $ | 390 | |
| Cash flow from continuing operating activities | | $ | 215 | | | $ | 229 | | | $ | 749 | | | $ | 521 | |
The Downstream had a solid quarter despite the impact of a less favourable business environment.
The Downstream business recorded net earnings of $105 million in the third quarter of 2007, down compared with $176 million in the same quarter of 2006. The decrease in net earnings reflected less favourable crude price differentials, lower asphalt and petrochemical margins, negative foreign exchange impacts, and increased operating costs reflecting higher repair, maintenance and shutdown expenses. This was partially offset by stronger retail margins, higher refinery yields and higher gasoline and distillate cracking margins.
MANAGEMENT’S DISCUSSION AND ANALYSIS
PETRO-CANADA
Downstream Net Earnings
| | | Third Quarter 2007 | | | Third Quarter 2006 | |
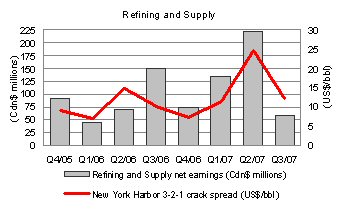
Refining and Supply net earnings (millions of Canadian dollars) | | $ | 58 | | | $ | 150 | |
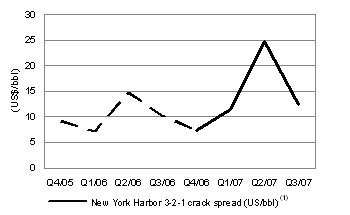
New York Harbor 3-2-1 crack spread (US$/bbl) (1) | | $ | 12.41 | | | $ | 10.18 | |
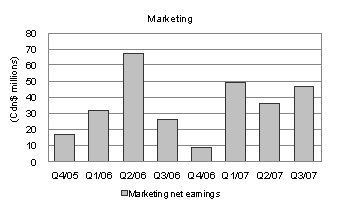
Marketing net earnings (millions of Canadian dollars) | | $ | 47 | | | $ | 26 | |
The average New York Harbor 3-2-1 refinery crack spread (1) was $12.41 US/bbl in the third quarter of 2007, up from $10.18 US/bbl in the third quarter of 2006. The average international light/heavy crude price differential was $11.80 US/bbl in the third quarter of 2007, compared with $13.99 US/bbl in the third quarter of 2006.
In the third quarter of 2007, total sales of refined petroleum products decreased 1% to 4.9 billion litres, compared with the same period last year. The decrease reflects lower Refining and Supply low-margin sales volumes, partially offset by higher Retail and Wholesale volumes.
Refining and Supply contributed third quarter 2007 net earnings of $58 million, down significantly compared with $150 million in the same quarter of 2006. Results reflected less favourable crude price differentials, lower asphalt and petrochemical margins, and negative foreign exchange impacts. This was partially offset by higher refinery yields and higher cracking margins.
Marketing contributed third quarter 2007 net earnings of $47 million, up compared with $26 million in the same quarter of 2006. In the third quarter of 2007, Marketing results reflected increased fuel and non-petroleum margins.
Downstream Turnaround Activity
No major turnarounds are planned at the Company’s Downstream facilities for the remainder of 2007.
Edmonton Refinery Conversion Project
At the Edmonton refinery, the Company is investing to convert the facility to run bitumen-based feedstock. It is expected that the refinery conversion program will enable Petro-Canada to directly upgrade up to 26,000 b/d of bitumen and process up to 48,000 b/d of sour synthetic crude oil, replacing the conventional light crude feedstock refined today.
At the end of the third quarter of 2007, Petro-Canada had completed 46% of the construction and all the major vessels and modules were on site. Of the estimated $2 billion investment, approximately 77% had been committed at the end of the third quarter of 2007. The project is anticipated to start up in the fourth quarter of 2008.
(1) | On January 1, 2007, the New York Harbor 3-2-1 crack spread calculation changed and it is now based on RBOB gasoline (the base for blending gasoline with 10% denatured ethanol) as opposed to conventional gasoline. Due to this change in specification, the 2007 crack spread values are not directly comparable to 2006 values. |
MANAGEMENT’S DISCUSSION AND ANALYSIS
PETRO-CANADA
CORPORATE
Shared Services | | Three months ended September 30, | | | Nine months ended September 30, | |
(millions of Canadian dollars) | | 2007 | | | 2006 | | | 2007 | | | 2006 | |
Net earnings (loss) | | $ | 13 | | | $ | (13 | ) | | $ | (59 | ) | | $ | (158 | ) |
| Cash flow from continuing operating activities | | $ | (64 | ) | | $ | (10 | ) | | $ | (92 | ) | | $ | (226 | ) |
Shared Services recorded net earnings of $13 million in the third quarter of 2007, compared with a net loss of $13 million for the same period in 2006. The third quarter 2007 net earnings included a $10 million charge related to the mark-to-market valuation of stock-based compensation and a $78 million foreign currency translation gain, compared with a $31 million recovery and a $1 million loss, respectively, in the third quarter of 2006.
Interest expense was $39 million before-tax during the third quarter of 2007, down from $41 million in the third quarter of the prior year. The Company capitalized $8 million of interest expense during the quarter, compared with $10 million in the third quarter of 2006.
Cash flow from continuing operating activities was affected by two items that typically cause differences between earnings and cash flow from continuing operating activities. Tax deferrals resulting from the Company's upstream partnership increased cash flow from continuing operating activities by about $3 million in the quarter, compared with a decrease of $10 million in the same period last year. The inventory valuation method prescribed for income tax purposes in the Downstream business decreased cash flow from continuing operating activities by $17 million in the third quarter of 2007, compared with an increase of $36 million in the third quarter of 2006.
LIQUIDITY AND CAPITAL RESOURCES
Summary of Cash Flows
| | | Three months ended September 30, | | | Nine months ended September 30, | |
(millions of Canadian dollars) | | 2007 | | | 2006 | | | 2007 | | | 2006 | |
| Cash flow from continuing operating activities | | $ | 1,340 | | | $ | 959 | | | $ | 3,941 | | | $ | 2,644 | |
| Cash flow from discontinued operating activities | | | – | | | | – | | | | – | | | | 15 | |
| Net cash outflows from: | | | | | | | | | | | | | | | | |
Investing activities | | | (877 | ) | | | (738 | ) | | | (2,450 | ) | | | (1,688 | ) |
Financing activities | | | (277 | ) | | | (182 | ) | | | (900 | ) | | | (1,080 | ) |
| Increase (decrease) in cash and cash equivalents | | | 186 | | | | 39 | | | | 591 | | | | (109 | ) |
Cash and cash equivalents | | $ | 1,090 | | | $ | 680 | | | $ | 1,090 | | | $ | 680 | |
Petro-Canada’s financing strategy is designed to maintain financial strength and flexibility to support profitable growth in all business environments. Two key measures that Petro-Canada uses to measure the Company’s overall financial strength are debt-to-cash flow from continuing operating activities and debt-to-debt plus equity. Petro-Canada’s debt-to-cash flow from continuing operating activities ratio, a key short-term leverage measure, was 0.5 times at September 30, 2007. This is within the Company’s target range of no more than 2.0 times. Debt-to-debt plus equity, the long-term measure for capital structure, was 17.1% at September 30, 2007, below the Company's target range of 25% to 35%.
Financial Ratios | | September 30, 2007 | December 31, 2006 | September 30, 2006 |
Debt-to-cash flow from continuing operating activities (times) | | | 0.5 | | | | 0.8 | | | | 0.7 | |
Debt-to-debt plus equity (%) | | | 17.1 | | | | 21.7 | | | | 21.9 | |
Operating Activities
Excluding cash and cash equivalents and the current portion of long-term debt, the operating working capital deficiency was $1,277 million at the end of the third quarter of 2007, compared with an operating working capital deficiency of $1,014 million at December 31, 2006. The working capital deficiency was higher primarily due to an increase in accounts payable.
MANAGEMENT’S DISCUSSION AND ANALYSIS
PETRO-CANADA
Investing Activities
| | | Three months ended September 30, | | | Nine months ended September 30, | |
(millions of Canadian dollars) | | 2007 | | | 2006 | | | 2007 | | | 2006 | |
Upstream | | | | | | | | | | | | |
North American Natural Gas | | $ | 176 | | | $ | 151 | | | $ | 497 | | | $ | 485 | |
Oil Sands | | | 101 | | | | 93 | | | | 297 | | | | 288 | |
International & Offshore | | | | | | | | | | | | | | | | |
East Coast Canada | | | 40 | | | | 54 | | | | 126 | | | | 188 | |
International (1) | | | 209 | | | | 171 | | | | 538 | | | | 467 | |
| | | | 526 | | | | 469 | | | | 1,458 | | | | 1,428 | |
Downstream | | | | | | | | | | | | | | | | |
Refining and Supply | | | 312 | | | | 242 | | | | 809 | | | | 717 | |
Sales and Marketing | | | 68 | | | | 42 | | | | 104 | | | | 74 | |
Lubricants | | | 8 | | | | 6 | | | | 15 | | | | 44 | |
| | | | 388 | | | | 290 | | | | 928 | | | | 835 | |
| Shared Services | | | 5 | | | | 9 | | | | 17 | | | | 15 | |
Total property, plant and equipment | | | | | | | | | | | | | | | | |
and exploration | | | 919 | | | | 768 | | | | 2,403 | | | | 2,278 | |
| Other assets | | | 73 | | | | 9 | | | | 105 | | | | 41 | |
Total continuing operations | | | 992 | | | | 777 | | | | 2,508 | | | | 2,319 | |
| Discontinued operations | | | – | | | | – | | | | – | | | | 1 | |
Total | | $ | 992 | | | $ | 777 | | | $ | 2,508 | | | $ | 2,320 | |
| (1) | International excludes capital expenditures related to the mature Syrian producing assets, which were sold by the Company in January 2006. |
Financing Activities
At the end of the third quarter of 2007, the Company’s syndicated committed credit facilities totalled $2,200 million. The Company also had bilateral demand credit facilities of $953 million. A total of $1,589 million of the credit facilities was used for letters of credit and overdraft coverage as at September 30, 2007. The syndicated facilities also provide liquidity support to Petro-Canada’s commercial paper program. No commercial paper was outstanding at the end of the third quarter of 2007.
As at September 30, 2007, the Company’s unsecured long-term debt securities were rated Baa2 by Moody’s Investors Service, BBB by Standard & Poor’s and A (low) by Dominion Bond Rating Service. The Company’s long-term debt ratings remain unchanged from year-end 2006.
Returning Cash to Shareholders
Petro-Canada’s priority uses of cash are to fund the capital program and profitable growth opportunities, and to return cash to shareholders through dividends and a share buyback program. Petro-Canada renewed its NCIB program for the repurchase of its common shares from June 22, 2007 to June 21, 2008, entitling the Company to purchase up to 5% of its outstanding common shares, subject to certain conditions.
In the third quarter of 2007, the Company repurchased 4.0 million shares, compared with 2.9 million in the same period last year. The level of activity in the NCIB program in the third quarter of 2007 reflected the use of cash generated by high commodity prices in excess of capital expenditures. The level of activity in the NCIB program during the first two quarters of 2006 reflected the use of proceeds from the sale of the mature Syrian assets to buy back shares. Future share repurchases will be dependent on excess cash available after consideration of the Company’s priority uses of cash.
| | | Shares Repurchased | | | Average Price | | | Total Cost ($ millions) | |
Period | | 2007 | | | 2006 | | | 2007 | | | 2006 | | | 2007 | | | 2006 | |
| First quarter | | | 2,000,000 | | | | 8,786,800 | | | $ | 43.63 | | | $ | 54.14 | | | $ | 87 | | | $ | 476 | |
| Second quarter | | | 8,000,000 | | | | 7,100,000 | | | $ | 53.44 | | | $ | 49.32 | | | $ | 428 | | | $ | 350 | |
| Third quarter | | | 3,998,000 | | | | 2,891,600 | | | $ | 55.15 | | | $ | 46.51 | | | $ | 220 | | | $ | 135 | |
| Year to date | | | 13,998,000 | | | | 18,778,400 | | | $ | 52.53 | | | $ | 51.14 | | | $ | 735 | | | $ | 961 | |
MANAGEMENT’S DISCUSSION AND ANALYSIS
PETRO-CANADA
Contingent Liabilities and Contractual Obligations
Contractual obligations are summarized in the Company’s 2006 annual MD&A and contingent liabilities are disclosed in Note 25 of the 2006 annual Consolidated Financial Statements. Total contractual obligations at September 30, 2007 were $26.2 billion. During the third quarter of 2007, total contractual obligations decreased by approximately $0.4 billion due to the strengthening Canadian dollar.
Off Balance Sheet
The Company has certain retail licensee agreements that qualify as variable interest entities as described in Note 26 to the 2006 annual Consolidated Financial Statements. These entities are not consolidated as Petro-Canada is not the primary beneficiary and the Company’s maximum exposure to losses from these arrangements is not expected to be material.
RISK
Derivative Contracts
As part of its acquisition of an interest in the Buzzard field in the U.K. sector of the North Sea, Petro-Canada entered into a series of derivative contracts relating to the future sale of crude oil based on Brent crude oil prices. As a result of the strengthening of the Canadian dollar relative to the U.S. dollar, partially offset by the increase in Brent crude oil prices in the third quarter of 2007 compared with the second quarter of 2007, the mark-to-market unrealized gain associated with these derivative contracts was $70 million after-tax in the third quarter of 2007. This compares with an unrealized gain of $79 million after-tax in the third quarter of 2006.
In the third quarter of 2007, the Company recorded a realized loss on these derivative contracts of $87 million after-tax.
As at September 30, 2007, there was no material change in the Company’s risks or risk management activities since December 31, 2006. Petro-Canada’s risk management activities are conducted in accordance with the policies and guidelines established by the Board of Directors. Readers should refer to Petro-Canada’s 2006 AIF and the risk management section of the 2006 annual MD&A.
SHAREHOLDER INFORMATION
As at September 30, 2007, Petro-Canada’s outstanding common shares totalled 485.2 million and averaged 487.6 million during the third quarter of 2007. This figure compares with outstanding common shares of 498.2 million as at September 30, 2006 and average shares outstanding of 500.1 million for the quarter ended September 30, 2006.
Petro-Canada will hold a conference call to discuss these results with investors on Thursday, October 25, 2007 at 9:00 a.m. eastern daylight time (EDT). To participate, please call 1-866-898-9626 (toll-free in North America), 00-800-8989-6323 (toll-free internationally), or 416-340-2216 at 8:55 a.m. EDT. Media are invited to listen to the call by dialing 1-866-540-8136 (toll-free in North America) or 416-340-8010 and are invited to ask questions at the end of the call. Those who are unable to listen to the call live may listen to a recording of the call approximately one hour after its completion by dialing 1-800-408-3053 (toll-free in North America) or 416-695-5800 (pass code number 3237855#). A live audio broadcast of the conference call will be available on Petro-Canada's website at http://www.petro-canada.ca/en/investors/845.aspx on October 25, 2007 at 9:00 a.m. EDT. Approximately one hour after the call, a recording will be available on Petro-Canada’s website.
MANAGEMENT’S DISCUSSION AND ANALYSIS
PETRO-CANADA
SELECT OPERATING DATA
September 30, 2007
| | | Three months ended September 30, | | | Nine months ended September 30, | |
| | | 2007 | | | 2006 | | | 2007 | | | 2006 | |
Before Royalties | | | | | | | | | | | | |
Crude oil and NGL production net (Mb/d) | | | | | | | | | | | | |
North American Natural Gas (1) | | | 12.6 | | | | 14.2 | | | | 12.5 | | | | 14.3 | |
| Oil Sands | | | 63.8 | | | | 59.0 | | | | 58.6 | | | | 50.1 | |
International & Offshore | | | | | | | | | | | | | | | | |
| East Coast Canada | | | 102.1 | | | | 62.3 | | | | 102.6 | | | | 68.6 | |
| International | | | | | | | | | | | | | | | | |
| North Sea | | | 87.5 | | | | 26.5 | | | | 79.0 | | | | 30.8 | |
Other International (2) | | | 49.1 | | | | 49.7 | | | | 47.3 | | | | 50.1 | |
| | | | 315.1 | | | | 211.7 | | | | 300.0 | | | | 213.9 | |
| | | | | | | | | | | | | | | | | |
Natural gas production net, excluding injectants (MMcf/d) | | | | | | | | | | | | | | | | |
North American Natural Gas (1) | | | 599 | | | | 611 | | | | 601 | | | | 617 | |
| International | | | | | | | | | | | | | | | | |
| North Sea | | | 59 | | | | 50 | | | | 58 | | | | 64 | |
Other International (2) | | | 65 | | | | 64 | | | | 71 | | | | 62 | |
| | | | 723 | | | | 725 | | | | 730 | | | | 743 | |
| | | | | | | | | | | | | | | | | |
Total production from continuing operations (Mboe/d) net before royalties (3) | | | 436 | | | | 333 | | | | 422 | | | | 338 | |
| Discontinued operations | | | | | | | | | | | | | | | | |
Crude oil and NGL production net (Mb/d) | | | – | | | | – | | | | – | | | | 6.8 | |
Natural gas production net, excluding injectants (MMcf/d) | | | – | | | | – | | | | – | | | | 3 | |
Total production from discontinued operations (Mboe/d) net before royalties (3) | | | – | | | | – | | | | – | | | | 7 | |
Total production (Mboe/d) net before royalties (3) | | | 436 | | | | 333 | | | | 422 | | | | 345 | |
After Royalties | | | | | | | | | | | | | | | | |
Crude oil and NGL production net (Mb/d) | | | | | | | | | | | | | | | | |
North American Natural Gas (1) | | | 10.1 | | | | 11.0 | | | | 9.9 | | | | 10.9 | |
| Oil Sands | | | 57.1 | | | | 54.1 | | | | 53.3 | | | | 46.3 | |
International & Offshore | | | | | | | | | | | | | | | | |
| East Coast Canada | | | 83.7 | | | | 60.4 | | | | 88.4 | | | | 63.9 | |
| International | | | | | | | | | | | | | | | | |
| North Sea | | | 87.5 | | | | 26.5 | | | | 79.0 | | | | 30.8 | |
Other International (2) | | | 44.9 | | | | 44.9 | | | | 42.7 | | | | 45.3 | |
| | | | 283.3 | | | | 196.9 | | | | 273.3 | | | | 197.2 | |
| | | | | | | | | | | | | | | | | |
Natural gas production net, excluding injectants (MMcf/d) | | | | | | | | | | | | | | | | |
North American Natural Gas (1) | | | 476 | | | | 509 | | | | 473 | | | | 493 | |
| International | | | | | | | | | | | | | | | | |
| North Sea | | | 59 | | | | 50 | | | | 58 | | | | 64 | |
Other International (2) | | | 32 | | | | 34 | | | | 40 | | | | 32 | |
| | | | 567 | | | | 593 | | | | 571 | | | | 589 | |
| | | | | | | | | | | | | | | | | |
Total production from continuing operations (Mboe/d) net after royalties (3) | | | 378 | | | | 296 | | | | 368 | | | | 295 | |
| Discontinued operations | | | | | | | | | | | | | | | | |
Crude oil and NGL production net (Mb/d) | | | – | | | | – | | | | – | | | | 1.8 | |
Natural gas production net, excluding injectants (MMcf/d) | | | – | | | | – | | | | – | | | | 1 | |
Total production from discontinued operations (Mboe/d) net after royalties (3) | | | – | | | | – | | | | – | | | | 2 | |
Total production (Mboe/d) net after royalties (3) | | | 378 | | | | 296 | | | | 368 | | | | 297 | |
Petroleum product sales (thousands of m3/d) | | | | | | | | | | | | | | | | |
| Gasoline | | | 25.6 | | | | 25.7 | | | | 24.3 | | | | 24.5 | |
| Distillates | | | 18.1 | | | | 18.5 | | | | 19.5 | | | | 19.3 | |
| Other, including petrochemicals | | | 9.9 | | | | 10.2 | | | | 9.0 | | | | 8.2 | |
| | | | 53.6 | | | | 54.4 | | | | 52.8 | | | | 52.0 | |
| | | | | | | | | | | | | | | | | |
Crude oil processed by Petro-Canada (thousands of m3/d) | | | 40.2 | | | | 41.1 | | | | 40.1 | | | | 37.7 | |
Average refinery utilization (%) | | | 99 | | | | 101 | | | | 99 | | | | 93 | |
Downstream net earnings after-tax (cents/litre) | | | 2.1 | | | | 3.5 | | | | 3.8 | | | | 2.7 | |
| | | | | | | | | | | | | | | | | |
| (1) | North American Natural Gas includes Western Canada and U.S. Rockies. |
| (2) | Other International excludes production relating to the mature Syrian producing assets, which were sold in January 2006 and reported as discontinued operations. |
| (3) | Natural gas converted at six Mcf of natural gas to one bbl of oil. |
MANAGEMENT’S DISCUSSION AND ANALYSIS
PETRO-CANADA
AVERAGE PRICE REALIZED
September 30, 2007
| | | Three months ended September 30, | | | Nine months ended September 30, | |
| | | 2007 | | | 2006 | | | 2007 | | | 2006 | |
Crude oil and NGL ($/bbl) | | | | | | | | | | | | |
North American Natural Gas (1) | | | 69.98 | | | | 69.25 | | | | 63.97 | | | | 67.10 | |
| Oil Sands | | | 64.80 | | | | 61.46 | | | | 58.21 | | | | 56.62 | |
International & Offshore | | | | | | | | | | | | | | | | |
| East Coast Canada | | | 76.83 | | | | 74.26 | | | | 72.83 | | | | 73.12 | |
| International | | | | | | | | | | | | | | | | |
North Sea (2) | | | 77.19 | | | | 76.46 | | | | 71.88 | | | | 74.48 | |
| Other International | | | 77.59 | | | | 74.92 | | | | 73.32 | | | | 74.49 | |
| Total crude oil and NGL from continuing operations | | | 74.32 | | | | 70.76 | | | | 69.42 | | | | 69.33 | |
| Discontinued operations | | | – | | | | – | | | | – | | | | 71.84 | |
| Total crude oil and NGL | | | 74.32 | | | | 70.76 | | | | 69.42 | | | | 69.40 | |
Natural gas ($/Mcf) | | | | | | | | | | | | | | | | |
North American Natural Gas (1) | | | 5.17 | | | | 5.97 | | | | 6.47 | | | | 6.96 | |
| International | | | | | | | | | | | | | | | | |
| North Sea | | | 6.87 | | | | 8.19 | | | | 7.70 | | | | 9.00 | |
| Other International | | | 4.19 | | | | 4.46 | | | | 4.60 | | | | 5.28 | |
| Total natural gas from continuing operations | | | 5.28 | | | | 6.06 | | | | 6.47 | | | | 7.07 | |
| Discontinued operations | | | – | | | | – | | | | – | | | | 7.94 | |
| Total natural gas | | | 5.28 | | | | 6.06 | | | | 6.47 | | | | 7.07 | |
| (1) | North American Natural Gas includes Western Canada and the U.S. Rockies. |
| (2) | North Sea average realized prices do not include the impact of the derivative contracts associated with the Company’s acquisition of an interest in the Buzzard field. If you include the impact of the derivative contracts associated with Buzzard, the average realized price for North Sea crude oil and NGL would be $60.83/bbl and $65.78/bbl for the three and nine months ended September 30, 2007, respectively. |
EFFECTIVE ROYALTY RATES
September 30, 2007
| | | Three months ended September 30, | | | Nine months ended September 30, | |
(% of sales revenues) | | 2007 | | 2006 | | 2007 | | 2006 |
| North American Natural Gas | | | 20 | % | | | 17 | % | | | 21 | % | | | 21 | % |
| Oil Sands | | | 10 | % | | | 8 | % | | | 9 | % | | | 7 | % |
International & Offshore | | | | | | | | | | | | | | | | |
| East Coast Canada | | | 18 | % | | | 3 | % | | | 14 | % | | | 7 | % |
| International | | | | | | | | | | | | | | | | |
| North Sea | | | – | | | | – | | | | – | | | | – | |
| Other International | | | 16 | % | | | 16 | % | | | 17 | % | | | 16 | % |
| Total continuing operations | | | 13 | % | | | 11 | % | | | 13 | % | | | 13 | % |
| Discontinued operations | | | – | | | | – | | | | – | | | | 74 | % |
| Total | | | 13 | % | | | 11 | % | | | 13 | % | | | 14 | % |
MANAGEMENT’S DISCUSSION AND ANALYSIS
PETRO-CANADA
SHARE INFORMATION
September 30, 2007
| | | Three months ended September 30, | | | Nine months ended September 30, | |
| | | 2007 | | | 2006 | | | 2007 | | | 2006 | |
Weighted-average common shares outstanding (millions) | | | 487.6 | | | | 500.1 | | | | 491.6 | | | | 505.9 | |
Weighted-average diluted common shares outstanding (millions) | | | 492.6 | | | | 505.8 | | | | 496.7 | | | | 512.0 | |
Net earnings – basic ($/share) | | | 1.59 | | | | 1.36 | | | | 4.50 | | | | 2.68 | |
– diluted ($/share) | | | 1.58 | | | | 1.34 | | | | 4.45 | | | | 2.65 | |
Cash flow from continuing operating activities ($/share) | | | 2.75 | | | | 1.92 | | | | 8.02 | | | | 5.23 | |
Dividends ($/share) | | | 0.13 | | | | 0.10 | | | | 0.39 | | | | 0.30 | |
| Toronto Stock Exchange: | | | | | | | | | | | | | | | | |
Share price (1) – High | | | 61.25 | | | | 53.30 | | | | 61.25 | | | | 58.59 | |
– Low | | | 50.97 | | | | 42.38 | | | | 41.02 | | | | 42.38 | |
– Close at September 28 | | | 57.07 | | | | 45.01 | | | | 57.07 | | | | 45.01 | |
Shares traded (millions) | | | 111.0 | | | | 111.1 | | | | 399.3 | | | | 375.6 | |
| New York Stock Exchange: | | | | | | | | | | | | | | | | |
Share price (2) – High | | | 58.41 | | | | 48.24 | | | | 58.41 | | | | 51.11 | |
– Low | | | 47.51 | | | | 37.78 | | | | 34.91 | | | | 37.78 | |
– Close at September 28 | | | 57.39 | | | | 40.33 | | | | 57.39 | | | | 40.33 | |
Shares traded (millions) | | | 47.9 | | | | 32.3 | | | | 129.6 | | | | 104.3 | |
| (1) | Share price is in Canadian dollars and represents the closing price. |
| (2) | Share price is in U.S. dollars and represents the closing price. |
MANAGEMENT’S DISCUSSION AND ANALYSIS
PETRO-CANADA
SELECT FINANCIAL DATA
September 30, 2007
(unaudited, millions of Canadian dollars)
| | | Three months ended September 30, | | | Nine months ended September 30, | |
| | | 2007 | | | 2006 | | | 2007 | | | 2006 | |
| | | | | | | | | | | | | |
| Net earnings | | | | | | | | | | | | |
| Upstream | | | | | | | | | | | | |
| North American Natural Gas | | $ | 55 | | | $ | 78 | | | $ | 248 | | | $ | 314 | |
| Oil Sands | | | 110 | | | | 108 | | | | 187 | | | | 190 | |
International & Offshore | | | | | | | | | | | | | | | | |
| East Coast Canada | | | 293 | | | | 190 | | | | 883 | | | | 673 | |
| International | | | 200 | | | | 139 | | | | 404 | | | | (205 | ) |
| Downstream | | | 105 | | | | 176 | | | | 548 | | | | 390 | |
| Shared Services | | | 13 | | | | (13 | ) | | | (59 | ) | | | (158 | ) |
| Discontinued operations | | | – | | | | – | | | | – | | | | 152 | |
| Net earnings | | $ | 776 | | | $ | 678 | | | $ | 2,211 | | | $ | 1,356 | |
| | | | | | | | | | | | | | | | | |
| Cash flow from continuing operating activities | | $ | 1,340 | | | $ | 959 | | | $ | 3,941 | | | $ | 2,644 | |
| | | | | | | | | | | | | | | | | |
Average capital employed (1) | | | | | | | | | | | | | | | | |
| Upstream | | | | | | | | | | $ | 7,967 | | | $ | 8,057 | |
| Downstream | | | | | | | | | | | 4,910 | | | | 4,048 | |
| Shared Services | | | | | | | | | | | 398 | | | | 195 | |
| Total Company | | | | | | | | | | $ | 13,275 | | | $ | 12,300 | |
| | | | | | | | | | | | | | | | | |
Return on capital employed (1) (%) | | | | | | | | | | | | | | | | |
| Upstream | | | | | | | | | | | 26.7 | | | | 22.6 | |
| Downstream | | | | | | | | | | | 12.9 | | | | 12.4 | |
| Total Company | | | | | | | | | | | 20.3 | | | | 17.8 | |
| | | | | | | | | | | | | | | | | |
Return on equity (1) (%) | | | | | | | | | | | 24.2 | | | | 21.9 | |
| | | | | | | | | | | | | | | | | |
| Debt | | | | | | | | | | $ | 2,367 | | | $ | 2,772 | |
Cash and cash equivalents (1) | | | | | | | | | | $ | 1,090 | | | $ | 680 | |
Debt-to-cash flow from continuing operating activities (times) | | | | | | | | | | | 0.5 | | | | 0.7 | |
Debt-to-debt plus equity (%) | | | | | | | | | | | 17.1 | | | | 21.9 | |
| | | | | | | | | | | | | | | | | |
| (1) | Includes discontinued operations. |
CONSOLIDATED STATEMENT OF EARNINGS (unaudited)
For the periods ended September 30
(millions of Canadian dollars, except per share amounts)
| | | | | | | |
| | | Three months ended September 30, | | | Nine months ended September 30, | |
| | | 2007 | | | 2006 | | | 2007 | | | 2006 | |
| | | | | | | | | | | | | |
| Revenue | | | | | | | | | | | | |
| Operating | | $ | 5,549 | | | $ | 5,065 | | | $ | 15,945 | | | $ | 14,316 | |
Investment and other income (expense) (Note 5) | | | (52 | ) | | | 136 | | | | (129 | ) | | | (197 | ) |
| | | | 5,497 | | | | 5,201 | | | | 15,816 | | | | 14,119 | |
| Expenses | | | | | | | | | | | | | | | | |
| Crude oil and product purchases | | | 2,562 | | | | 2,745 | | | | 7,392 | | | | 7,423 | |
| Operating, marketing and general | | | 919 | | | | 742 | | | | 2,732 | | | | 2,345 | |
| Exploration | | | 65 | | | | 57 | | | | 307 | | | | 232 | |
| Depreciation, depletion and amortization | | | 498 | | | | 311 | | | | 1,455 | | | | 958 | |
Unrealized (gain) loss on translation of foreign currency denominated long-term debt | | | (93 | ) | | | 1 | | | | (234 | ) | | | (70 | ) |
| Interest | | | 39 | | | | 41 | | | | 122 | | | | 128 | |
| | | | 3,990 | | | | 3,897 | | | | 11,774 | | | | 11,016 | |
| | | | | | | | | | | | | | | | | |
| Earnings from continuing operations before income taxes | | | 1,507 | | | | 1,304 | | | | 4,042 | | | | 3,103 | |
| | | | | | | | | | | | | | | | | |
Provision for income taxes (Note 6) | | | | | | | | | | | | | | | | |
| Current | | | 607 | | | | 460 | | | | 1,704 | | | | 1,618 | |
| Future | | | 124 | | | | 166 | | | | 127 | | | | 281 | |
| | | | 731 | | | | 626 | | | | 1,831 | | | | 1,899 | |
| | | | | | | | | | | | | | | | | |
| Net earnings from continuing operations | | | 776 | | | | 678 | | | | 2,211 | | | | 1,204 | |
| | | | | | | | | | | | | | | | | |
Net earnings from discontinued operations (Note 4) | | | - | | | | - | | | | - | | | | 152 | |
| | | | | | | | | | | | | | | | | |
| Net earnings | | $ | 776 | | | $ | 678 | | | $ | 2,211 | | | $ | 1,356 | |
| | | | | | | | | | | | | | | | | |
Earnings per share from continuing operations (Note 7) | | | | | | | | | | | | | | | | |
| Basic | | $ | 1.59 | | | $ | 1.36 | | | $ | 4.50 | | | $ | 2.38 | |
| Diluted | | $ | 1.58 | | | $ | 1.34 | | | $ | 4.45 | | | $ | 2.35 | |
| | | | | | | | | | | | | | | | | |
Earnings per share (Note 7) | | | | | | | | | | | | | | | | |
| Basic | | $ | 1.59 | | | $ | 1.36 | | | $ | 4.50 | | | $ | 2.68 | |
| Diluted | | $ | 1.58 | | | $ | 1.34 | | | $ | 4.45 | | | $ | 2.65 | |
CONSOLIDATED STATEMENT OF COMPREHENSIVE INCOME (unaudited) (Note 3)
For the periods ended September 30
(millions of Canadian dollars)
| | | | | | | |
| | | Three months ended September 30, | | | Nine months ended September 30, | |
| | | 2007 | | | 2006 | | | 2007 | | | 2006 | |
| | | | | | | | | | | | | |
| Net earnings | | $ | 776 | | | $ | 678 | | | $ | 2,211 | | | $ | 1,356 | |
| Other comprehensive income, net of tax | | | | | | | | | | | | | | | | |
| Change in foreign currency translation adjustment | | | (60 | ) | | | 30 | | | | (256 | ) | | | 123 | |
| Comprehensive income | | $ | 716 | | | $ | 708 | | | $ | 1,955 | | | $ | 1,479 | |
See accompanying Notes to Consolidated Financial Statements
CONSOLIDATED STATEMENT OF CASH FLOWS (unaudited)
For the periods ended September 30
(millions of Canadian dollars)
| | | | | | | |
| | | Three months ended September 30, | | | Nine months ended September 30, | |
| | | 2007 | | | 2006 | | | 2007 | | | 2006 | |
| | | | | | | | | | | | | |
| Operating activities | | | | | | | | | | | | |
| Net earnings | | $ | 776 | | | $ | 678 | | | $ | 2,211 | | | $ | 1,356 | |
| Less: Net earnings from discontinued operations | | | - | | | | - | | | | - | | | | 152 | |
| Net earnings from continuing operations | | | 776 | | | | 678 | | | | 2,211 | | | | 1,204 | |
| Items not affecting cash flow from continuing operating activities: | | | | | | | | | | | | | | | | |
| Depreciation, depletion and amortization | | | 498 | | | | 311 | | | | 1,455 | | | | 958 | |
| Future income taxes | | | 124 | | | | 166 | | | | 127 | | | | 281 | |
| Accretion of asset retirement obligations | | | 16 | | | | 14 | | | | 50 | | | | 41 | |
Unrealized (gain) loss on translation of foreign currency denominated long-term debt | | | (93 | ) | | | 1 | | | | (234 | ) | | | (70 | ) |
| Gain on sale of assets | | | (8 | ) | | | (4 | ) | | | (78 | ) | | | (24 | ) |
Unrealized (gain) loss associated with the Buzzard derivative contracts (Note 12) | | | (107 | ) | | | (117 | ) | | | 21 | | | | 210 | |
| Other | | | 3 | | | | 10 | | | | 10 | | | | 23 | |
| Exploration expenses | | | 20 | | | | 26 | | | | 183 | | | | 73 | |
Decrease (increase) in non-cash working capital related to continuing operating activities | | | 111 | | | | (126 | ) | | | 196 | | | | (52 | ) |
| Cash flow from continuing operating activities | | | 1,340 | | | | 959 | | | | 3,941 | | | | 2,644 | |
Cash flow from discontinued operating activities (Note 4) | | | - | | | | - | | | | - | | | | 15 | |
| Cash flow from operating activities | | | 1,340 | | | | 959 | | | | 3,941 | | | | 2,659 | |
| | | | | | | | | | | | | | | | | |
| Investing activities | | | | | | | | | | | | | | | | |
| Expenditures on property, plant and equipment and exploration | | | (919 | ) | | | (768 | ) | | | (2,403 | ) | | | (2,279 | ) |
Proceeds from sale of assets (Note 4) | | | 83 | | | | 12 | | | | 177 | | | | 675 | |
| Increase in other assets | | | (73 | ) | | | (9 | ) | | | (105 | ) | | | (41 | ) |
| Decrease (increase) in non-cash working capital related to investing activities | | | 32 | | | | 27 | | | | (119 | ) | | | (43 | ) |
| Cash used in investing activities | | | (877 | ) | | | (738 | ) | | | (2,450 | ) | | | (1,688 | ) |
| | | | | | | | | | | | | | | | | |
| Financing activities | | | | | | | | | | | | | | | | |
| Repayment of long-term debt | | | (3 | ) | | | (1 | ) | | | (6 | ) | | | (5 | ) |
Proceeds from issue of common shares (Note 9) | | | 9 | | | | 4 | | | | 33 | | | | 37 | |
Purchase of common shares (Note 9) | | | (220 | ) | | | (135 | ) | | | (735 | ) | | | (961 | ) |
| Dividends on common shares | | | (63 | ) | | | (50 | ) | | | (192 | ) | | | (151 | ) |
| Cash used in financing activities | | | (277 | ) | | | (182 | ) | | | (900 | ) | | | (1,080 | ) |
| | | | | | | | | | | | | | | | | |
| Increase (decrease) in cash and cash equivalents | | | 186 | | | | 39 | | | | 591 | | | | (109 | ) |
| Cash and cash equivalents at beginning of period | | | 904 | | | | 641 | | | | 499 | | | | 789 | |
| Cash and cash equivalents at end of period | | $ | 1,090 | | | $ | 680 | | | $ | 1,090 | | | $ | 680 | |
See accompanying Notes to Consolidated Financial Statements
CONSOLIDATED BALANCE SHEET (unaudited)
As at September 30, 2007
(millions of Canadian dollars)
| | | | | | | |
| | | September 30, 2007 | | | December 31, 2006 | |
| Assets | | | | | | |
| Current assets | | | | | | |
| Cash and cash equivalents | | $ | 1,090 | | | $ | 499 | |
| Accounts receivable | | | 1,731 | | | | 1,600 | |
| Inventories | | | 758 | | | | 632 | |
| Future income taxes | | | 203 | | | | 95 | |
| | | | 3,782 | | | | 2,826 | |
| | | | | | | | | |
| Property, plant and equipment, net | | | 18,697 | | | | 18,577 | |
| Goodwill | | | 719 | | | | 801 | |
Other assets (Note 3) | | | 434 | | | | 442 | |
| | | $ | 23,632 | | | $ | 22,646 | |
| | | | | | | | | |
| Liabilities and shareholders' equity | | | | | | | | |
| Current liabilities | | | | | | | | |
Accounts payable and accrued liabilities (Note 12) | | $ | 3,825 | | | $ | 3,319 | |
| Income taxes payable | | | 144 | | | | 22 | |
Current portion of long-term debt (Note 8) | | | 3 | | | | 7 | |
| | | | 3,972 | | | | 3,348 | |
| | | | | | | | | |
Long-term debt (Notes 3 and 8) | | | 2,364 | | | | 2,887 | |
Other liabilities (Note 12) | | | 1,561 | | | | 1,826 | |
| Asset retirement obligations | | | 1,181 | | | | 1,170 | |
| Future income taxes | | | 3,042 | | | | 2,974 | |
Commitments and contingent liabilities (Note 13) | | | | | | | | |
| | | | | | | | | |
| Shareholders' equity | | | | | | | | |
Common shares (Note 9) | | | 1,365 | | | | 1,366 | |
Contributed surplus (Note 9) | | | 24 | | | | 469 | |
| Retained earnings | | | 10,330 | | | | 8,557 | |
Accumulated other comprehensive income (Note 3) | | | | | | | | |
| Foreign currency translation adjustment | | | (207 | ) | | | 49 | |
| | | | 11,512 | | | | 10,441 | |
| | | $ | 23,632 | | | $ | 22,646 | |
CONSOLIDATED STATEMENT OF RETAINED EARNINGS (unaudited)
For the periods ended September 30
(millions of Canadian dollars)
| | | | | | | |
| | | Three months ended September 30, | | | Nine months ended September 30, | |
| | | 2007 | | | 2006 | | | 2007 | | | 2006 | |
| | | | | | | | | | | | | |
| Retained earnings at beginning of period | | $ | 9,826 | | | $ | 7,595 | | | $ | 8,557 | | | $ | 7,018 | |
Cumulative effect of adopting new accounting standards (Note 3) | | | - | | | | - | | | | 8 | | | | - | |
| Net earnings | | | 776 | | | | 678 | | | | 2,211 | | | | 1,356 | |
| Dividends on common shares | | | (63 | ) | | | (50 | ) | | | (192 | ) | | | (151 | ) |
Charges for normal course issuer bid (Note 9) | | | (209 | ) | | | - | | | | (254 | ) | | | - | |
| Retained earnings at end of period | | $ | 10,330 | | | $ | 8,223 | | | $ | 10,330 | | | $ | 8,223 | |
See accompanying Notes to Consolidated Financial Statements
NOTES TO CONSOLIDATED FINANCIAL STATEMENTS (unaudited)
(millions of Canadian dollars)
1. SEGMENTED INFORMATION FROM CONTINUING OPERATIONS
Three months ended September 30,
| | | | | | | | | | | | | | | | | | | | | | |
| | | Upstream | | | | | | | | | | | | | | | | | | | |
| | | | | | | | | | | | | | | International & Offshore | | | | | | | | | | | | | | | | | | | |
| | | North American Natural Gas | | | Oil Sands | | | East Coast Canada | | | International | | | Downstream | | | Shared Services | | | Consolidated | |
| | | 2007 | | | 2006 | | | 2007 | | | 2006 | | | 2007 | | | 2006 | | | 2007 | | | 2006 | | | 2007 | | | 2006 | | | 2007 | | | 2006 | | | 2007 | | | 2006 | |
| | | | | | | | | | | | | | | | | | | | | | | | | | | | | | | | | | | | | | | | | | | |
Revenue | | | | | | | | | | | | | | | | | | | | | | | | | | | | | | | | | | | | | | | | | | |
| Sales to customers | | $ | 308 | | | $ | 344 | | | $ | 145 | | | $ | 201 | | | $ | 671 | | | $ | 551 | | | $ | 1,079 | | | $ | 505 | | | $ | 3,346 | | | $ | 3,464 | | | $ | - | | | $ | - | | | $ | 5,549 | | | $ | 5,065 | |
Investment and other income (expense) (1) | | | 1 | | | | 4 | | | | (3 | ) | | | - | | | | (5 | ) | | | - | | | | (34 | ) | | | 114 | | | | (3 | ) | | | 11 | | | | (8 | ) | | | 7 | | | | (52 | ) | | | 136 | |
| Inter-segment sales | | | 70 | | | | 99 | | | | 316 | | | | 246 | | | | 114 | | | | 44 | | | | - | | | | - | | | | 5 | | | | 2 | | | | - | | | | - | | | | | | | | | |
| Segmented revenue | | | 379 | | | | 447 | | | | 458 | | | | 447 | | | | 780 | | | | 595 | | | | 1,045 | | | | 619 | | | | 3,348 | | | | 3,477 | | | | (8 | ) | | | 7 | | | | 5,497 | | | | 5,201 | |
Expenses | | | | | | | | | | | | | | | | | | | | | | | | | | | | | | | | | | | | | | | | | | | | | | | | | | | | | | | | |
Crude oil and product purchases | | | 62 | | | | 67 | | | | 112 | | | | 122 | | | | 158 | | | | 166 | | | | - | | | | - | | | | 2,229 | | | | 2,387 | | | | 1 | | | | 3 | | | | 2,562 | | | | 2,745 | |
| Inter-segment transactions | | | 2 | | | | 1 | | | | 1 | | | | 19 | | | | 2 | | | | 1 | | | | - | | | | - | | | | 500 | | | | 370 | | | | - | | | | - | | | | | | | | | |
Operating, marketing and general | | | 124 | | | | 117 | | | | 149 | | | | 103 | | | | 68 | | | | 94 | | | | 144 | | | | 82 | | | | 390 | | | | 373 | | | | 44 | | | | (27 | ) | | | 919 | | | | 742 | |
| Exploration | | | 25 | | | | 40 | | | | 1 | | | | 5 | | | | 5 | | | | - | | | | 34 | | | | 12 | | | | - | | | | - | | | | - | | | | - | | | | 65 | | | | 57 | |
Depreciation, depletion and amortization | | | 108 | | | | 100 | | | | 33 | | | | 37 | | | | 105 | | | | 46 | | | | 180 | | | | 51 | | | | 72 | | | | 71 | | | | - | | | | 6 | | | | 498 | | | | 311 | |
| Unrealized (gain) loss on translation of foreign currency denominated long-term debt | | | - | | | | - | | | | - | | | | - | | | | - | | | | - | | | | - | | | | - | | | | - | | | | - | | | | (93 | ) | | | 1 | | | | (93 | ) | | | 1 | |
| Interest | | | - | | | | - | | | | - | | | | - | | | | - | | | | - | | | | - | | | | - | | | | - | | | | - | | | | 39 | | | | 41 | | | | 39 | | | | 41 | |
| | | | 321 | | | | 325 | | | | 296 | | | | 286 | | | | 338 | | | | 307 | | | | 358 | | | | 145 | | | | 3,191 | | | | 3,201 | | | | (9 | ) | | | 24 | | | | 3,990 | | | | 3,897 | |
Earnings (loss) from continuing operations before income taxes | | | 58 | | | | 122 | | | | 162 | | | | 161 | | | | 442 | | | | 288 | | | | 687 | | | | 474 | | | | 157 | | | | 276 | | | | 1 | | | | (17 | ) | | | 1,507 | | | | 1,304 | |
Provision for income taxes | | | | | | | | | | | | | | | | | | | | | | | | | | | | | | | | | | | | | | | | | | | | | | | | | | | | | | | | |
| Current | | | 55 | | | | 84 | | | | 5 | | | | 3 | | | | 163 | | | | 113 | | | | 379 | | | | 280 | | | | 40 | | | | 27 | | | | (35 | ) | | | (47 | ) | | | 607 | | | | 460 | |
| Future | | | (52 | ) | | | (40 | ) | | | 47 | | | | 50 | | | | (14 | ) | | | (15 | ) | | | 108 | | | | 55 | | | | 12 | | | | 73 | | | | 23 | | | | 43 | | | | 124 | | | | 166 | |
| | | | 3 | | | | 44 | | | | 52 | | | | 53 | | | | 149 | | | | 98 | | | | 487 | | | | 335 | | | | 52 | | | | 100 | | | | (12 | ) | | | (4 | ) | | | 731 | | | | 626 | |
Net earnings (loss) from continuing operations | | $ | 55 | | | $ | 78 | | | $ | 110 | | | $ | 108 | | | $ | 293 | | | $ | 190 | | | $ | 200 | | | $ | 139 | | | $ | 105 | | | $ | 176 | | | $ | 13 | | | $ | (13 | ) | | $ | 776 | | | $ | 678 | |
Expenditures on property, plant and equipment and exploration from continuing operations (2) | | $ | 176 | | | $ | 151 | | | $ | 101 | | | $ | 93 | | | $ | 40 | | | $ | 54 | | | $ | 209 | | | $ | 171 | | | $ | 388 | | | $ | 290 | | | $ | 5 | | | $ | 9 | | | $ | 919 | | | $ | 768 | |
Cash flow from continuing operating activities | | $ | 155 | | | $ | 135 | | | $ | 176 | | | $ | 193 | | | $ | 403 | | | $ | 232 | | | $ | 455 | | | $ | 180 | | | $ | 215 | | | $ | 229 | | | $ | (64 | ) | | $ | (10 | ) | | $ | 1,340 | | | $ | 959 | |
Total assets from continuing operations | | $ | 3,986 | | | $ | 3,770 | | | $ | 3,121 | | | $ | 2,828 | | | $ | 2,333 | | | $ | 2,358 | | | $ | 5,661 | | | $ | 5,324 | | | $ | 7,668 | | | $ | 6,359 | | | $ | 863 | | | $ | 568 | | | $ | 23,632 | | | $ | 21,207 | |
| (1) | Investment and other income (expense) for the International segment includes unrealized gains relating to the Buzzard derivative contracts of $107 million for the three months ended September 30, 2007 ($117 million for the three months ended September 30, 2006) (Notes 5 and 12). |
| (2) | Consolidated expenditures include capitalized interest in the amount of $8 million for the three months ended September 30, 2007 ($10 million for the three months ended September 30, 2006). |
NOTES TO CONSOLIDATED FINANCIAL STATEMENTS (unaudited)
(millions of Canadian dollars)
1. SEGMENTED INFORMATION FROM CONTINUING OPERATIONS (Note 4)
Nine months ended September 30,
| | | | | | | | | | | | | | | | | | | | | | |
| | | Upstream | | | | | | | | | | | | | | | | | | | |
| | | | | | | | | | | | | | | International & Offshore | | | | | | | | | | | | | | | | | | | |
| | | North American Natural Gas | | | Oil Sands | | | East Coast Canada | | | International | | | Downstream | | | Shared Services | | | Consolidated | |
| | | 2007 | | | 2006 | | | 2007 | | | 2006 | | | 2007 | | | 2006 | | | 2007 | | | 2006 | | | 2007 | | | 2006 | | | 2007 | | | 2006 | | | 2007 | | | 2006 | |
| | | | | | | | | | | | | | | | | | | | | | | | | | | | | | | | | | | | | | | | | | | |
Revenue | | | | | | | | | | | | | | | | | | | | | | | | | | | | | | | | | | | | | | | | | | |
| Sales to customers | | $ | 1,016 | | | $ | 1,152 | | | $ | 458 | | | $ | 449 | | | $ | 2,052 | | | $ | 1,470 | | | $ | 2,654 | | | $ | 1,820 | | | $ | 9,765 | | | $ | 9,425 | | | $ | - | | | $ | - | | | $ | 15,945 | | | $ | 14,316 | |
Investment and other income (expense) (1) | | | 66 | | | | 5 | | | | (3 | ) | | | - | | | | (11 | ) | | | (1 | ) | | | (163 | ) | | | (220 | ) | | | (7 | ) | | | 13 | | | | (11 | ) | | | 6 | | | | (129 | ) | | | (197 | ) |
| Inter-segment sales | | | 238 | | | | 277 | | | | 759 | | | | 609 | | | | 352 | | | | 201 | | | | - | | | | - | | | | 12 | | | | 9 | | | | - | | | | - | | | | | | | | | |
| Segmented revenue | | | 1,320 | | | | 1,434 | | | | 1,214 | | | | 1,058 | | | | 2,393 | | | | 1,670 | | | | 2,491 | | | | 1,600 | | | | 9,770 | | | | 9,447 | | | | (11 | ) | | | 6 | | | | 15,816 | | | | 14,119 | |
Expenses | | | | | | | | | | | | | | | | | | | | | | | | | | | | | | | | | | | | | | | | | | | | | | | | | | | | | | | | |
Crude oil and product purchases | | | 165 | | | | 203 | | | | 366 | | | | 323 | | | | 545 | | | | 338 | | | | - | | | | - | | | | 6,308 | | | | 6,558 | | | | 8 | | | | 1 | | | | 7,392 | | | | 7,423 | |
| Inter-segment transactions | | | 6 | | | | 3 | | | | 11 | | | | 36 | | | | 6 | | | | 6 | | | | - | | | | - | | | | 1,338 | | | | 1,051 | | | | - | | | | - | | | | | | | | | |
Operating, marketing and general | | | 368 | | | | 340 | | | | 436 | | | | 366 | | | | 186 | | | | 202 | | | | 421 | | | | 242 | | | | 1,100 | | | | 1,115 | | | | 221 | | | | 80 | | | | 2,732 | | | | 2,345 | |
| Exploration | | | 122 | | | | 112 | | | | 25 | | | | 17 | | | | 14 | | | | 1 | | | | 146 | | | | 102 | | | | - | | | | - | | | | - | | | | - | | | | 307 | | | | 232 | |
Depreciation, depletion and amortization | | | 325 | | | | 298 | | | | 112 | | | | 98 | | | | 319 | | | | 165 | | | | 478 | | | | 207 | | | | 213 | | | | 181 | | | | 8 | | | | 9 | | | | 1,455 | | | | 958 | |
| Unrealized gain on translation of foreign currency denominated long-term debt | | | - | | | | - | | | | - | | | | - | | | | - | | | | - | | | | - | | | | - | | | | - | | | | - | | | | (234 | ) | | | (70 | ) | | | (234 | ) | | | (70 | ) |
| Interest | | | - | | | | - | | | | - | | | | - | | | | - | | | | - | | | | - | | | | - | | | | - | | | | - | | | | 122 | | | | 128 | | | | 122 | | | | 128 | |
| | | | 986 | | | | 956 | | | | 950 | | | | 840 | | | | 1,070 | | | | 712 | | | | 1,045 | | | | 551 | | | | 8,959 | | | | 8,905 | | | | 125 | | | | 148 | | | | 11,774 | | | | 11,016 | |
Earnings (loss) from continuing operations before income taxes | | | 334 | | | | 478 | | | | 264 | | | | 218 | | | | 1,323 | | | | 958 | | | | 1,446 | | | | 1,049 | | | | 811 | | | | 542 | | | | (136 | ) | | | (142 | ) | | | 4,042 | | | | 3,103 | |
Provision for income taxes (Note 6) | | | | | | | | | | | | | | | | | | | | | | | | | | | | | | | | | | | | | | | | | | | | | | | | | | | | | |
Current | | | 157 | | | | 250 | | | | (5 | ) | | | (7 | ) | | | 488 | | | | 346 | | | | 1,005 | | | | 948 | | | | 157 | | | | 119 | | | | (98 | ) | | | (38 | ) | | | 1,704 | | | | 1,618 | |
Future | | | (71 | ) | | | (86 | ) | | | 82 | | | | 35 | | | | (48 | ) | | | (61 | ) | | | 37 | | | | 306 | | | | 106 | | | | 33 | | | | 21 | | | | 54 | | | | 127 | | | | 281 | |
| | | | 86 | | | | 164 | | | | 77 | | | | 28 | | | | 440 | | | | 285 | | | | 1,042 | | | | 1,254 | | | | 263 | | | | 152 | | | | (77 | ) | | | 16 | | | | 1,831 | | | | 1,899 | |
Net earnings (loss) from continuing operations | | $ | 248 | | | $ | 314 | | | $ | 187 | | | $ | 190 | | | $ | 883 | | | $ | 673 | | | $ | 404 | | | $ | (205 | ) | | $ | 548 | | | $ | 390 | | | $ | (59 | ) | | $ | (158 | ) | | $ | 2,211 | | | $ | 1,204 | |
Expenditures on property, plant and equipment and exploration from continuing operations (2) | | $ | 497 | | | $ | 485 | | | $ | 297 | | | $ | 288 | | | $ | 126 | | | $ | 188 | | | $ | 538 | | | $ | 467 | | | $ | 928 | | | $ | 835 | | | $ | 17 | | | $ | 15 | | | $ | 2,403 | | | $ | 2,278 | |
Cash flow from continuing operating activities | | $ | 561 | | | $ | 543 | | | $ | 405 | | | $ | 300 | | | $ | 1,230 | | | $ | 837 | | | $ | 1,088 | | | $ | 669 | | | $ | 749 | | | $ | 521 | | | $ | (92 | ) | | $ | (226 | ) | | $ | 3,941 | | | $ | 2,644 | |
Total assets from continuing operations | | $ | 3,986 | | | $ | 3,770 | | | $ | 3,121 | | | $ | 2,828 | | | $ | 2,333 | | | $ | 2,358 | | | $ | 5,661 | | | $ | 5,324 | | | $ | 7,668 | | | $ | 6,359 | | | $ | 863 | | | $ | 568 | | | $ | 23,632 | | | $ | 21,207 | |
| (1) | Investment and other income (expense) for the International segment includes unrealized losses relating to the Buzzard derivative contracts of $21 million for the nine months ended September 30, 2007 ($210 million for the nine months ended September 30, 2006) (Notes 5 and 12). |
| (2) | Consolidated expenditures include capitalized interest in the amount of $21 million for the nine months ended September 30, 2007 ($24 million for the nine months ended September 30, 2006). |
NOTES TO CONSOLIDATED FINANCIAL STATEMENTS (unaudited)
(millions of Canadian dollars, unless otherwise stated)
The note disclosure requirements for annual financial statements provide additional disclosure to that required for interim financial statements. Accordingly, these interim Consolidated Financial Statements should be read in conjunction with the December 31, 2006 audited Consolidated Financial Statements. The interim Consolidated Financial Statements are presented in accordance with Canadian generally accepted accounting principles and follow the accounting policies summarized in the notes to the annual Consolidated Financial Statements, except for changes as described in Note 3.
| 3. | CHANGES IN ACCOUNTING POLICIES |
The Company adopted Canadian Institute of Chartered Accountants (CICA) Handbook Section 1530, Comprehensive Income; Section 3855, Financial Instruments – Recognition and Measurement; Section 3861, Financial Instruments – Presentation and Disclosure; and Section 3865, Hedges on January 1, 2007.
As a result of adopting CICA Section 1530, Comprehensive Income, a new Statement of Comprehensive Income forms part of the Company’s Consolidated Financial Statements. Gains and losses from the translation into Canadian dollars of assets and liabilities, including associated long-term debt, of the Company’s self-sustaining foreign operations are now presented as a separate component of other comprehensive income (loss) in the Consolidated Statement of Comprehensive Income. Accumulated other comprehensive income (loss) is presented as a separate component of shareholders’ equity in the Consolidated Balance Sheet. Previously, these gains and losses were deferred and included in the foreign currency translation adjustment as part of shareholders’ equity.
As a result of adopting CICA Section 3855, Financial Instruments – Recognition and Measurement, long-term debt is measured at fair value when initially recognized and, after initial recognition, at amortized cost using the effective interest method. Transaction costs and premiums or discounts directly attributable to the issuance of long-term debt are now added to the fair value on initial recognition. Previously, these amounts were deferred and amortized using the straight line method over the term of the debt. Unamortized amounts were separately presented in other assets on the Consolidated Balance Sheet. In accordance with the transitional provisions, prior periods have not been restated as a result of adopting this new accounting standard. To recognize the cumulative prior period effect, the following balance sheet categories were impacted on January 1, 2007:
| | | | |
| | | Increase (Decrease) | |
| Other assets | | $ | (101 | ) |
| Long-term debt | | | (112 | ) |
| Future income taxes liability | | | 3 | |
| Retained earnings | | | 8 | |
There is no other material impact on the Consolidated Financial Statements for adoption of these new standards.
| 4. | DISCONTINUED OPERATIONS |
On January 31, 2006, the Company completed the sale of its mature producing assets in Syria for net proceeds of $640 million, resulting in a gain on sale of $134 million.
The accounting for discontinued operations results in a reduction of the Consolidated Statement of Earnings balances as follows:
| | | | | | | |
| | | Three months ended September 30, | | | Nine months ended September 30, | |
| | | 2007 | | | 2006 | | | 2007 | | | 2006 | |
Revenue (1) | | $ | - | | | $ | - | | | $ | - | | | $ | 168 | |
| Expenses | | | | | | | | | | | | | | | | |
| Operating, marketing and general | | | - | | | | - | | | | - | | | | 6 | |
| Earnings from discontinued operations before income taxes | | | - | | | | - | | | | - | | | | 162 | |
| Provision for income taxes | | | - | | | | - | | | | - | | | | 10 | |
| Net earnings from discontinued operations | | $ | - | | | $ | - | | | $ | - | | | $ | 152 | |
(1) Revenue includes the gain on sale of $134 million.
NOTES TO CONSOLIDATED FINANCIAL STATEMENTS (unaudited)
(millions of Canadian dollars, unless otherwise stated)
| 5. | INVESTMENT AND OTHER INCOME (EXPENSE) |
Investment and other income (expense) includes net gains (losses) on derivative contracts (Note 12) of $(30) million and $(171) million for the three and nine months ended September 30, 2007, respectively ($127 million and $(207) million for the three and nine months ended September 30, 2006) and net gains on sales of assets of $8 million and $78 million for the three and nine months ended September 30, 2007, respectively ($4 million and $24 million for the three and nine months ended September 30, 2006).
The provisions for future income taxes for the nine months ended September 30, 2007 and September 30, 2006 were reduced by $18 million and $63 million respectively due to reductions in the Canadian federal and provincial income tax rates. The adjustments were allocated to the segments as a decrease (increase) to the tax provisions as follows: North American Natural Gas - $1 million ($6 million - September 30, 2006), Oil Sands - $7 million ($44 million - September 30, 2006), East Coast Canada - $5 million ($37 million - September 30, 2006), International - $nil ($(64) million - September 30, 2006), Downstream - $6 million ($41 million - September 30, 2006) and Shared Services $(1) million ($(1) million - September 30, 2006).
The provision for future income taxes for the nine months ended September 30, 2007 was reduced by $30 million as a result of the increase in the U.K. supplemental corporate income tax rate and the resulting impact of 2005 qualifying capital expenditures being deducted at the increased rate. The provision for future income taxes for the nine months ended September 30, 2006 includes a $242 million charge due to the enacted increase in the U.K. supplemental corporate income tax rate. The adjustments were allocated to the Company’s International business segment.
The provision for current taxes for the nine months ended September 30, 2006 was increased by $70 million due to the Quebec government enacting retroactive tax legislation. The adjustment was allocated to Shared Services.
| The following table provides the common shares used in calculating earnings per share amounts: |
| | | | | | | |
| | | Three months ended September 30, | | | Nine months ended September 30, | |
(millions) | | 2007 | | | 2006 | | | 2007 | | | 2006 | |
Weighted-average number of common shares outstanding - basic | | | 487.6 | | | | 500.1 | | | | 491.6 | | | | 505.9 | |
| Effect of dilutive stock options | | | 5.0 | | | | 5.7 | | | | 5.1 | | | | 6.1 | |
Weighted-average number of common shares outstanding - diluted | | | 492.6 | | | | 505.8 | | | | 496.7 | | | | 512.0 | |
8. LONG-TERM DEBT
| | | | | | | | | | |
| | | Maturity | | September 30, 2007 | | | December 31, 2006 | |
| | | | | (Note 3) | | | | |
Debentures and notes 5.95% unsecured senior notes ($600 million US) | | 2035 | | | $ | 581 | | | $ | 699 | |
5.35% unsecured senior notes ($300 million US) | | 2033 | | | | 251 | | | | 349 | |
7.00% unsecured debentures ($250 million US) | | 2028 | | | | 239 | | | | 291 | |
7.875% unsecured debentures ($275 million US) | | 2026 | | | | 269 | | | | 321 | |
9.25% unsecured debentures ($300 million US) | | 2021 | | | | 296 | | | | 349 | |
5.00% unsecured senior notes ($400 million US) | | 2014 | | | | 393 | | | | 466 | |
4.00% unsecured senior notes ($300 million US) | | 2013 | | | | 278 | | | | 349 | |
| Capital leases | | 2007-2022 | | | | 60 | | | | 70 | |
| | | | | | | | 2,367 | | | | 2,894 | |
| Current portion | | | | | | | (3) | | | | (7) | |
| | | | | | | $ | 2,364 | | | $ | 2,887 | |
NOTES TO CONSOLIDATED FINANCIAL STATEMENTS (unaudited)
(millions of Canadian dollars, unless otherwise stated)
Changes in common shares and contributed surplus were as follows:
| | | | | | | | | |
| | | Shares | | | Amount | | Contributed Surplus | |
| Balance at December 31, 2006 | | | 497,538,385 | | | $ | 1,366 | | | $ | 469 | |
| Issued under employee stock option and share purchase plans | | | 1,701,778 | | | | 38 | | | | (3 | ) |
| Repurchased under normal course issuer bid | | | (13,998,000 | ) | | | (39 | ) | | | (442 | ) |
| Balance at September 30, 2007 | | | 485,242,163 | | | $ | 1,365 | | | $ | 24 | |
In June 2007, the Company renewed its normal course issuer bid (NCIB) program to repurchase up to 25 million of its outstanding common shares during the period from June 22, 2007 to June 21, 2008, subject to certain conditions. During the three and nine months ended September 30, 2007, the Company purchased 3,998,000 common shares at a cost of $220 million and 13,998,000 common shares at a cost of $735 million, respectively (2,891,600 common shares at a cost of $135 million and 18,778,400 common shares at a cost of $961 million during the three and nine months ended September 30, 2006). The excess of the purchase price over the carrying amount of the shares purchased was recorded as a reduction of contributed surplus and retained earnings.
| 10. | STOCK-BASED COMPENSATION |
The total stock-based compensation expense (recovery) recorded was $24 million and $163 million for the three and nine months ended September 30, 2007, respectively ($(51) million and $11 million for the three and nine months ended September 30, 2006).
| | (a) Stock Option and Performance Share Unit (PSU) Plans |
Changes in the number of outstanding stock options and PSUs were as follows:
| | | | | | | |
| | | Stock Options | | | PSUs | |
| | | Number | | | Weighted-Average Exercise Price | | | Number | |
| Balance at December 31, 2006 | | | 20,714,733 | | | $ | 31 | | | | 1,482,986 | |
| Granted | | | 3,342,800 | | | | 44 | | | | 244,819 | |
| Exercised for common shares | | | (1,701,778 | ) | | | 20 | | | | n/a | |
| Surrendered for cash payment | | | (770,620 | ) | | | 33 | | | | n/a | |
| Cancelled/Expired | | | (273,250 | ) | | | 44 | | | | (560,865 | ) |
| Balance at September 30, 2007 | | | 21,311,885 | | | $ | 34 | | | | 1,166,940 | |
| | (b) Stock Appreciation Rights (SAR) |
Commencing 2007, the Company approved the issuance of SARs to certain employees, which entitle the holder to receive a cash payment equal to the difference between the stated exercise price and the market price of the Company’s common shares on date of surrender. The vesting period and other terms are similar to the terms of the Company’s existing stock option plan. At the time of grant, the exercise price approximated the market price. The following SARs have been granted:
| | | | |
| | | SARs | |
| | | Number | | | Weighted-Average Exercise Price | |
| Balance at December 31, 2006 | | | - | | | $ | - | |
| Granted | | | 3,751,500 | | | | 44 | |
| Cancelled | | | (97,850 | ) | | | 44 | |
| Balance at September 30, 2007 | | | 3,653,650 | | | $ | 44 | |
NOTES TO CONSOLIDATED FINANCIAL STATEMENTS (unaudited)
(millions of Canadian dollars, unless otherwise stated)
| 11. | EMPLOYEE FUTURE BENEFITS |
The Company maintains pension plans with defined benefit and defined contribution provisions and provides certain health care and life insurance benefits to its qualifying retirees. The expenses associated with these plans are as follows:
| | | | | | | |
| | | Three months ended September 30, | | | Nine months ended September 30, | |
| | | 2007 | | | 2006 | | | 2007 | | | 2006 | |
| Pension Plans: | | | | | | | | | | | | |
| Defined benefit plans | | | | | | | | | | | | |
Employer current service cost | | $ | 10 | | | $ | 10 | | | $ | 30 | | | $ | 30 | |
Interest cost | | | 22 | | | | 21 | | | | 66 | | | | 63 | |
Expected return on plan assets | | | (27 | ) | | | (24 | ) | | | (83 | ) | | | (74 | ) |
Amortization of transitional asset | | | (1 | ) | | | (1 | ) | | | (4 | ) | | | (5 | ) |
Amortization of net actuarial losses | | | 11 | | | | 13 | | | | 33 | | | | 39 | |
| | | | 15 | | | | 19 | | | | 42 | | | | 53 | |
| | | | | | | | | | | | | | | | | |
| Defined contribution plans | | | 5 | | | | 4 | | | | 14 | | | | 12 | |
| | | $ | 20 | | | $ | 23 | | | $ | 56 | | | $ | 65 | |
| | | | | | | | | | | | | | | | | |
| Other post-retirement plans: | | | | | | | | | | | | | | | | |
Employer current service cost | | $ | 1 | | | $ | 1 | | | $ | 4 | | | $ | 3 | |
Interest cost | | | 3 | | | | 3 | | | | 9 | | | | 9 | |
Amortization of transitional obligation | | | 2 | | | | 1 | | | | 4 | | | | 3 | |
| | | $ | 6 | | | $ | 5 | | | $ | 17 | | | $ | 15 | |
The Company expects to contribute $115 million to its pension plans in 2007.
| 12. | FINANCIAL INSTRUMENTS AND DERIVATIVES |
Investment and other income (expense) (Note 5) includes unrealized and realized gains and losses on various outstanding derivative contracts, including the derivative contracts associated with the 2004 acquisition of an interest in the Buzzard field in the U.K. sector of the North Sea. These contracts resulted in unrealized and realized gains (losses) as follows:
| | | | | | | |
| | | Three months ended September 30, | | | Nine months ended September 30, | |
| | | 2007 | | | 2006 | | | 2007 | | | 2006 | |
| Unrealized gains (losses) | | | | | | | | | | | | |
Buzzard derivative contracts | | $ | 107 | | | $ | 117 | | | $ | (21 | ) | | $ | (210 | ) |
Other derivative contracts | | | 2 | | | | (7 | ) | | | 5 | | | | (7 | ) |
| | | | 109 | | | | 110 | | | | (16 | ) | | | (217 | ) |
| Realized gains (losses) | | | | | | | | | | | | | | | | |
Buzzard derivative contracts (1) | | | (131 | ) | | | - | | | | (131 | ) | | | - | |
Other derivative contracts | | | (8 | ) | | | 17 | | | | (24 | ) | | | 10 | |
| | | | (139 | ) | | | 17 | | | | (155 | ) | | | 10 | |
| Net gains (losses) | | $ | (30 | ) | | $ | 127 | | | $ | (171 | ) | | $ | (207 | ) |
| (1) | Forward sales contracts for the sale of 2.6 million barrels of Brent crude oil matured during the three months ended September 30, 2007. Outstanding forward sales contracts maturing from 2007 to 2010 provide for the future sale of 33.2 million barrels of Brent crude oil at US$25.98 per barrel. |
NOTES TO CONSOLIDATED FINANCIAL STATEMENTS (unaudited)
(millions of Canadian dollars, unless otherwise stated)
The fair value positions of outstanding derivative contracts at September 30, 2007 are as follows:
| | | | |
| | | Net asset (liability) | |
| Buzzard derivative contracts | | | (1,502 | ) |
| Other derivative contracts | | | 1 | |
| | | | (1,501 | ) |
The fair value positions of outstanding derivative contracts at September 30, 2007 are included in the Consolidated Balance Sheet as follows:
| | | | | |
| Accounts receivable | | | 2 | |
| Accounts payable | | | (555 | ) |
| Other liabilities | | | (948 | ) |
| | | | (1,501 | ) |
| 13. | COMMITMENTS AND CONTINGENT LIABILITIES |
On September 20, 2007, the Company announced that it had entered into an agreement to acquire an additional 5% working interest in the Fort Hills oil sands project, bringing the Company’s total working interest to 60%. To pay for this incremental investment, Petro-Canada will fund an additional $375 million of Partnership expenditures. The transaction is expected to close in the fourth quarter of 2007.
| 14. | RECENT ACCOUNTING PRONOUNCEMENTS |
In June 2007, Canada's Accounting Standards Board (AcSB) issued CICA Handbook Section 3031, Inventories. This new standard provides considerable guidance when determining the cost of inventory. Where costs of inventory items cannot be specifically identified, costs must be assigned consistently on either a "first-in, first-out" (FIFO) or weighted average cost basis. A "last-in first-out" (LIFO) cost basis is no longer acceptable. The standard is effective for fiscal periods beginning on or after January 1, 2008. Converting the cost of crude oil and refined products from a LIFO to FIFO costing basis will significantly increase inventories, future income taxes (liability), and retained earnings. The impact of adoption will be based upon December 31, 2007 amounts.
- 32 -