Petro-Canada Increases Earnings and Production, and Advances Growth Projects in 2007
Highlights
| · | Delivered 21% growth in 2007 upstream production, compared with 2006 |
| · | Replaced 127% of proved plus probable reserves over five years |
| · | Expanded list of major growth projects to include Libyan Concession Development and White Rose Extensions |
Calgary– Petro-Canada announced today fourth quarter operating earnings from continuing operations adjusted for unusual items of $513 million ($1.06/share), compared with $486 million ($0.98/share) in the fourth quarter of 2006. Fourth quarter 2007 cash flow from continuing operating activities before changes in non-cash working capital was $17 million ($0.04/share), compared with $991 million ($1.99/share) in the same quarter of last year. The significant decrease in cash flow from continuing operating activities before changes in non-cash working capital in the fourth quarter of 2007, compared with the same quarter in 2006, was due to the payment of $1,145 million after-tax ($2.36/share) to settle the Buzzard derivative contract hedges as announced December 12, 2007.
Net earnings from continuing operations were $522 million ($1.08/share) in the fourth quarter of 2007, compared with $384 million ($0.77/share) in the same period of 2006. Net earnings included the change in the fair value of the Buzzard derivative contracts, and gains or losses on foreign currency translation and disposal of assets.
In 2007, operating earnings from continuing operations adjusted for unusual items was $2,528 million ($5.17/share), compared with $2,010 million ($3.99/share) in 2006. Cash flow from continuing operating activities before changes in non-cash working capital was $3,762 million ($7.69/share) in 2007, compared with $3,687 million ($7.32/share) for the previous year. Cash flow from continuing operating activities before changes in non-cash working capital for the full year in 2007 decreased due to the payment of $1,145 million after-tax ($2.34/share) to settle the Buzzard derivative contract hedges.
Net earnings from continuing operations for the full year in 2007 was $2,733 million ($5.59/share), compared with $1,588 million ($3.15/share) in 2006.
“The fourth quarter was a solid quarter, capping off an excellent year,” said Ron Brenneman, president and chief executive officer. “We successfully followed through on our two business priorities; exceeding our upstream production targets and not only advancing five major projects, but adding two more. In 2008, we will bring on the Edmonton refinery conversion project - a significant contributor to future cash flows. We will also advance our six other growth projects, making final investment decisions on Fort Hills, the Syria Ebla gas and Montreal coker projects.”
Fourth Quarter Results
| | | Three months ended December 31, | Year ended December 31, |
| (millions of Canadian dollars, except per share and share amounts) | | 2007 | | | 2006 | | | 2007 | | | 2006 | |
| Consolidated Results | | | | | | | | | | | | |
Operating earnings adjusted for unusual items (1) | | $ | 513 | | | $ | 486 | | | $ | 2,528 | | | $ | 2,028 | |
| Net earnings | | | 522 | | | | 384 | | | | 2,733 | | | | 1,740 | |
Cash flow (2) | | $ | 17 | | | $ | 991 | | | $ | 3,762 | | | $ | 3,704 | |
Operating return on capital employed (3)(%) | | | | | | | | | | | | | | | | |
| Upstream | | | | | | | | | | | 24.6 | | | | 19.4 | |
| Downstream | | | | | | | | | | | 12.1 | | | | 11.1 | |
| Total Company | | | | | | | | | | | 18.9 | | | | 15.0 | |
Consolidated Results from Continuing Operations (4) | | | | | | | | | | | | | | | | |
Operating earnings from continuing operations adjusted for unusual items (1) | | $ | 513 | | | $ | 486 | | | $ | 2,528 | | | $ | 2,010 | |
| – $/share | | | 1.06 | | | | 0.98 | | | | 5.17 | | | | 3.99 | |
| Net earnings from continuing operations | | | 522 | | | | 384 | | | | 2,733 | | | | 1,588 | |
| – $/share | | | 1.08 | | | | 0.77 | | | | 5.59 | | | | 3.15 | |
Cash flow from continuing operating activities before changes in non-cash working capital (5) | | | 17 | | | | 991 | | | | 3,762 | | | | 3,687 | |
| – $/share | | | 0.04 | | | | 1.99 | | | | 7.69 | | | | 7.32 | |
| Dividends – $/share | | | 0.13 | | | | 0.10 | | | | 0.52 | | | | 0.40 | |
| Share buyback program | | | 104 | | | | 50 | | | | 839 | | | | 1,011 | |
| – millions of shares | | | 2.0 | | | | 1.0 | | | | 16.0 | | | | 19.8 | |
| Capital expenditures for continuing operations | | $ | 1,601 | | | $ | 1,165 | | | $ | 4,109 | | | $ | 3,484 | |
Weighted-average common shares outstanding (millions of shares) | | | 484.6 | | | | 497.9 | | | | 489.0 | | | | 503.9 | |
| (1) | Operating earnings adjusted for unusual items (which represent net earnings, excluding gains or losses on foreign currency translation of long-term debt and on sale of assets, the change in fair value of the Buzzard derivative contracts, mark-to-market valuations of stock-based compensation, income tax adjustments, asset impairment and insurance proceeds) are used by the Company to evaluate operating performance (see page 3 NON-GAAP MEASURES). |
| (2) | From operating activities before changes in non-cash working capital (see page 3 NON-GAAP MEASURES). The significant decrease in cash flow from continuing operating activities before changes in non-cash working capital in the fourth quarter and for the full year of 2007, compared with the same periods in 2006, was due to the payment of $1,145 million after-tax to settle the Buzzard derivative contract hedges. |
| (3) | Includes discontinued operations. |
| (4) | On January 31, 2006, Petro-Canada closed the sale of its mature Syrian producing assets. These assets and associated results are reported as discontinued operations and are excluded from continuing operations. |
| (5) | The significant decrease in cash flow from continuing operating activities before changes in non-cash working capital in the fourth quarter and for the full year of 2007, compared with the same periods in 2006, was due to the payment of $1,145 million after-tax to settle the Buzzard derivative contract hedges. |
NON-GAAP MEASURES
Cash flow and cash flow from continuing operating activities before changes in non-cash working capital are commonly used in the oil and gas industry and by Petro-Canada to assist management and investors in analyzing operating performance, leverage and liquidity. In addition, the Company’s capital budget was prepared using anticipated cash flow from continuing operating activities before changes in non-cash working capital, as the timing of collecting receivables or making payments is not considered relevant for capital budgeting purposes. Operating earnings represent net earnings, excluding gains or losses on foreign currency translation of long-term debt and sale of assets and the change in fair value of derivative contracts associated with the Buzzard acquisition. Operating earnings adjusted for unusual items represent operating earnings, excluding mark-to-market valuations of stock-based compensation, income tax adjustments, asset impairment, and insurance proceeds and surcharges. Operating earnings and operating earnings adjusted for unusual items are used by the Company to evaluate operating performance. Cash flow, cash flow from continuing operating activities before changes in non-cash working capital, operating earnings and operating earnings adjusted for unusual items do not have standardized meanings prescribed by Canadian generally accepted accounting principles (GAAP) and, therefore, may not be comparable with the calculations of similar measures for other companies. For a reconciliation of cash flow and cash flow from continuing operating activities before changes in non-cash working capital to the associated GAAP measures, refer to the table on page 5. For a reconciliation of operating earnings and operating earnings adjusted for unusual items to the associated GAAP measures, refer to the table below.
| | | Three months ended December 31, | | | Year ended December 31, | |
| (millions of Canadian dollars, except per share amounts) | | 2007 | | | ($/share) | | | 2006 | | | ($/share) | | | 2007 | | | ($/share) | | | 2006 | | | ($/share) | |
| Net earnings | | $ | 522 | | | $ | 1.08 | | | $ | 384 | | | $ | 0.77 | | | $ | 2,733 | | | $ | 5.59 | | | $ | 1,740 | | | $ | 3.45 | |
| Net earnings from discontinued operations | | | – | | | | | | | | – | | | | | | | | – | | | | | | | | 152 | | | | | |
| Net earnings from continuing operations | | $ | 522 | | | $ | 1.08 | | | $ | 384 | | | $ | 0.77 | | | $ | 2,733 | | | $ | 5.59 | | | $ | 1,588 | | | $ | 3.15 | |
Foreign currency translation gain (loss) on long-term debt (1) | | | 10 | | | | | | | | (58 | ) | | | | | | | 208 | | | | | | | | 1 | | | | | |
Change in fair value of Buzzard derivative contracts (2) | | | (120 | ) | | | | | | | (33 | ) | | | | | | | (138 | ) | | | | | | | (240 | ) | | | | |
| Gain on sale of assets | | | 3 | | | | | | | | 4 | | | | | | | | 58 | | | | | | | | 25 | | | | | |
| Operating earnings from continuing operations | | $ | 629 | | | | | | | $ | 471 | | | | | | | $ | 2,605 | | | | | | | $ | 1,802 | | | | | |
| Mark-to-market valuation of stock-based compensation | | | 45 | | | | | | | | (21 | ) | | | | | | | (54 | ) | | | | | | | (31 | ) | | | | |
| Income tax adjustments | | | 143 | | | | | | | | – | | | | | | | | 191 | | | | | | | | (185 | ) | | | | |
Asset impairment charge (3) | | | (97 | ) | | | | | | | – | | | | | | | | (97 | ) | | | | | | | – | | | | | |
Insurance proceeds net of surcharges | | | 25 | | | | | | | | 6 | | | | | | | | 37 | | | | | | | | 8 | | | | | |
Operating earnings from continuing operations adjusted for unusual items | | $ | 513 | | | $ | 1.06 | | | $ | 486 | | | $ | 0.98 | | | $ | 2,528 | | | $ | 5.17 | | | $ | 2,010 | | | $ | 3.99 | |
Operating earnings from discontinued operations adjusted for unusual items | | | – | | | | | | | | – | | | | | | | | – | | | | | | | | 18 | | | | | |
| Operating earnings adjusted for unusual items | | $ | 513 | | | $ | 1.06 | | | $ | 486 | | | $ | 0.98 | | | $ | 2,528 | | | $ | 5.17 | | | $ | 2,028 | | | $ | 4.02 | |
| (1) | Foreign currency translation reflected gains or losses on United States (U.S.) dollar-denominated long-term debt not associated with the self-sustaining International business unit and the U.S. Rockies operations included in the North American Natural Gas business unit. |
| (2) | During the fourth quarter of 2007, the Company entered into derivative contracts to close out the hedged portion of its Buzzard production from January 1, 2008 to December 31, 2010. Under the terms of the contracts, the Company repurchased 30,688,000 barrels (bbls) of Dated Brent crude oil at an average price of approximately $85.79 US/bbl, resulting in an after-tax charge to net earnings of $120 million and a reduction in cash flow of $1,145 million after-tax. |
| (3) | In the fourth quarter of 2007, the North American Natural Gas business unit recorded a charge of $97 million after-tax for the impairment of coal bed methane (CBM) assets in the U.S. Rockies due to probable reserves reductions combined with lower prices. |
Earnings Variances
During the first quarter of 2006, Petro-Canada closed the sale of the Company’s mature producing assets in Syria. These assets and associated results are reported as discontinued operations and are excluded from continuing operations.
Q4/07 VERSUS Q4/06 FACTOR ANALYSIS
Operating Earnings from Continuing Operations Adjusted for Unusual Items
(millions of Canadian dollars, after-tax)
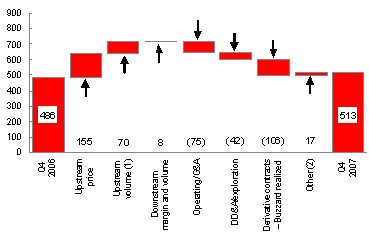 | | Operating earnings from continuing operations adjusted for unusual items increased to $513 million ($1.06/share) in the fourth quarter of 2007, compared with $486 million ($0.98/share) in the fourth quarter of 2006. Results reflected the positive impact of higher realized upstream prices ($155 million), increased upstream production(1)($70 million), lower other expenses(2)($17 million) and improved Downstream marketing margins ($8 million). The results were partially offset by the realized loss on the derivative contracts associated with Buzzard ($(106) million), higher operating, general and administrative (G&A) expenses ($(75) million) and increased depreciation, depletion and amortization (DD&A) and exploration expenses ($(42) million). |
| (1) | Upstream volumes included the portion of DD&A expense associated with changes in upstream production levels. |
| (2) | Other mainly included interest expense, foreign exchange, changes in effective tax rates and upstream inventory movements. |
Operating Earnings from Continuing Operations Adjusted for Unusual Items by Segment
(millions of Canadian dollars, after-tax)
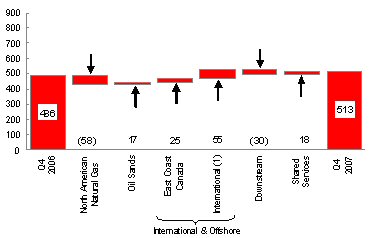 | | Operating earnings from continuing operations adjusted for unusual items on a segmented basis increased 6% to $513 million in the fourth quarter of 2007, compared with $486 million in the fourth quarter of 2006. The increase in fourth quarter operating earnings from continuing operations adjusted for unusual items reflected higher International(1) ($55 million), East Coast Canada ($25 million), and Oil Sands ($17 million) operating earnings adjusted for unusual items, and lower Shared Services costs ($18 million). The results were partially offset by lower North American Natural Gas ($(58) million) and Downstream ($(30) million) operating earnings from continuing operations adjusted for unusual items. |
| (1) | International operating earnings from continuing operations adjusted for unusual items for the three months ended December 31, 2007 included a realized loss on the derivative contracts associated with the Company’s acquisition of an interest in the Buzzard field of $106 million after-tax ($160 million before-tax). |
Net earnings in the fourth quarter of 2007 were $522 million ($1.08/share), compared with $384 million ($0.77/share) during the same period in 2006. Net earnings include gains or losses on foreign currency translation of long-term debt, changes in the fair value of the Buzzard derivative contracts, and on gains or losses on asset sales. Net earnings in the fourth quarter of 2007 were higher than in the fourth quarter of 2006 due to higher operating earnings and gains on foreign currency translation of long-term debt, partially offset by the change in the fair value of the Buzzard derivative contracts.
| | | Three months ended December 31, | Year ended December 31, |
(millions of Canadian dollars) | | 2007 | | | 2006 | | | 2007 | | | 2006 | |
| Cash flow from (used in) continuing operating activities | | $ | (602 | ) | | $ | 964 | | | $ | 3,339 | | | $ | 3,608 | |
Increase in non-cash working capital related to continuing operating activities | | | 619 | | | | 27 | | | | 423 | | | | 79 | |
Cash flow from continuing operating activities before changes in non-cash working capital | | $ | 17 | | | $ | 991 | | | $ | 3,762 | | | $ | 3,687 | |
| Cash flow from discontinued operating activities | | | – | | | | – | | | | – | | | | 15 | |
Increase in non-cash working capital related to discontinued operating activities | | | – | | | | – | | | | – | | | | 2 | |
Cash flow from operating activities before changes in non-cash working capital | | $ | 17 | | | $ | 991 | | | $ | 3,762 | | | $ | 3,704 | |
During the fourth quarter of 2007, the Company entered into derivative contracts to close out the hedged portion of its Buzzard production from January 1, 2008 to December 31, 2010. Under the terms of the contracts, the Company repurchased 30,688,000 bbls of Dated Brent crude oil at an average price of approximately $85.79 US/bbl, resulting in a reduction in cash flow of $1,145 million after-tax.
During the fourth quarter of 2007, cash flow from continuing operating activities before changes in non-cash working capital was $17 million ($0.04/share), down considerably from $991 million ($1.99/share) in the same quarter of 2006. The decrease in cash flow from continuing operating activities before changes in non-cash working capital reflected the cash payment made to settle the derivative contracts associated with Buzzard, partially offset by higher operating earnings from continuing operations.
Operating Highlights
Fourth quarter production from continuing operations averaged 409,800 barrels of oil equivalent per day (boe/d) net to Petro-Canada in 2007, up significantly from 368,200 boe/d net in the same quarter of 2006. Higher volumes reflected the addition of North Sea projects (Buzzard, De Ruyter, L5b-C and Saxon) and a rise in East Coast Canada production. This was partially offset by lower Oil Sands production and declines in the North American Natural Gas business. Production in the fourth quarter of 2006 was reduced as Terra Nova completed its planned maintenance turnaround.
In 2007, production of crude oil, natural gas liquids (NGL) and natural gas from continuing operations averaged 418,400 boe/d net, up 21% from 345,400 boe/d in 2006.
The Downstream delivered reliable operations and increased retail and wholesale sales volumes in the fourth quarter of 2007.
| | | Three months ended December 31, | Year ended December 31, |
| | | 2007 | | | 2006 | | | 2007 | | | 2006 | |
Upstream – Consolidated (1) | | | | | | | | | | | | |
| Production before royalties | | | | | | | | | | | | |
Crude oil and NGL production net (thousands of barrels/day –Mb/d) | | | 289.0 | | | | 245.0 | | | | 297.1 | | | | 226.9 | |
Natural gas production net, excluding injectants (millions of cubic feet/day–MMcf/d) | | | 725 | | | | 739 | | | | 728 | | | | 744 | |
Total production net (thousands of barrels of oil equivalent/day – Mboe/d) (2) | | | 410 | | | | 368 | | | | 418 | | | | 351 | |
| Average realized prices | | | | | | | | | | | | | | | | |
Crude oil and NGL ($/barrel–$/bbl) | | | 82.71 | | | | 62.37 | | | | 72.66 | | | | 67.48 | |
Natural gas ($/thousand cubic feet – $/Mcf) | | | 5.88 | | | | 6.61 | | | | 6.32 | | | | 6.96 | |
| Upstream – Continuing Operations | | | | | | | | | | | | | | | | |
| Production from continuing operations before royalties | | | | | | | | | | | | | | | | |
Crude oil and NGL production net (Mb/d) | | | 289.0 | | | | 245.0 | | | | 297.1 | | | | 221.7 | |
Natural gas production net,excluding injectants (MMcf/d) | | | 725 | | | | 739 | | | | 728 | | | | 742 | |
Total production net (Mboe/d) (2) | | | 410 | | | | 368 | | | | 418 | | | | 345 | |
| Average realized prices from continuing operations | | | | | | | | | | | | | | | | |
Crude oil and NGL ($/bbl) | | | 82.71 | | | | 62.37 | | | | 72.66 | | | | 67.38 | |
Natural gas ($/Mcf) | | | 5.88 | | | | 6.61 | | | | 6.32 | | | | 6.96 | |
| Downstream | | | | | | | | | | | | | | | | |
Petroleum product sales (thousands of cubic metres/day –m3/d) | | | 54.5 | | | | 53.9 | | | | 53.3 | | | | 52.5 | |
Average refinery utilization (%) | | | 99 | | | | 94 | | | | 99 | | | | 93 | |
Downstream operating earnings after-tax (cents/litre) | | | 1.6 | | | | 1.6 | | | | 3.2 | | | | 2.4 | |
| (1) | Includes discontinued operations. |
| (2) | Total production included natural gas converted at six Mcf of natural gas for one bbl of oil. |
BUSINESS STRATEGY
Petro-Canada's strategy is to create shareholder value by delivering long-term, profitable growth and improving the profitability of the base business.
Petro-Canada’s capital program supports bringing on seven major projects over the next several years. In 2008, the Company expects to complete the project to convert the Edmonton refinery to process lower cost, oil sands-based feedstock and to make final investment decisions on the Fort Hills mine and upgrader, Syria Ebla gas and Montreal coker projects. These projects are expected to add significant earnings and cash flow.
Petro-Canada continually works to strengthen its base business by improving the safety, reliability and efficiency of its operations and is focused on delivering upstream production in line with guidance.
Outlook
Operational Updates
| · | Syncrude to commence planned 45-day Coker 8-1 turnaround in March |
| · | White Rose advanced its planned 2008 maintenance turnaround to January 2008 |
Major Project Milestones
| · | Edmonton refinery conversion project construction 61% complete at the end of the fourth quarter and on track for startup in the fourth quarter of 2008 |
| · | Syria gas development front-end engineering and design (FEED) expected to be completed early in 2008, followed closely by the awarding of the engineering, procurement and construction (EPC) contract |
| · | Libyan heads of agreement signed for extension of concession development, with final ratification anticipated in the first half of 2008 |
| · | White Rose Extension development agreement signed, FEED on the North Amethyst portion of the project completed and progressing with detailed design in pursuit of regulatory approval in the first half of 2008 |
| · | Montreal coker investment decision expected in the second quarter of 2008 |
| · | Fort Hills project FEED on track for completion mid-2008, with a final investment decision planned for the third quarter of 2008 |
| · | MacKay River expansion continues with FEED, with a final investment decision expected in the first quarter of 2009 |
Business Unit Results
North American Natural Gas
| | | Three months ended December 31, | Year ended December 31, |
(millions of Canadian dollars) | | 2007 | | | 2006 | | | 2007 | | | 2006 | |
| Net earnings (loss) | | $ | (57 | ) | | $ | 91 | | | $ | 191 | | | $ | 405 | |
| Gain on sale of assets | | | – | | | | – | | | | 41 | | | | 3 | |
| Operating earnings (loss) | | $ | (57 | ) | | $ | 91 | | | $ | 150 | | | $ | 402 | |
| Insurance premium surcharges | | | – | | | | – | | | | – | | | | (1 | ) |
Asset impairment charge (1) | | | (97 | ) | | | – | | | | (97 | ) | | | – | |
| Income tax adjustments | | | 7 | | | | – | | | | 8 | | | | 6 | |
| Operating earnings adjusted for unusual items | | $ | 33 | | | $ | 91 | | | $ | 239 | | | $ | 397 | |
Cash flow from continuing operating activities before changes in non-cash working capital | | $ | 173 | | | $ | 136 | | | $ | 720 | | | $ | 739 | |
| (1) | In the fourth quarter of 2007, the North American Natural Gas business unit recorded a charge of $97 million after-tax for the impairment of CBM assets in the U.S. Rockies due to probable reserves reductions combined with lower prices. |
In the fourth quarter of 2007, North American Natural Gas contributed $33 million of operating earnings adjusted for unusual items, compared with $91 million in the fourth quarter of 2006. Lower volumes, realized prices and higher exploration costs resulted in lower operating earnings adjusted for unusual items.
Oil Sands
| | | Three months ended December 31, | Year ended December 31, |
(millions of Canadian dollars) | | 2007 | | | 2006 | | | 2007 | | | 2006 | |
Net earnings (1) | | $ | 129 | | | $ | 55 | | | $ | 316 | | | $ | 245 | |
| Gain on sale of assets | | | – | | | | – | | | | 1 | | | | – | |
| Operating earnings | | $ | 129 | | | $ | 55 | | | $ | 315 | | | $ | 245 | |
| Insurance premium (surcharges) recovery | | | 1 | | | | (1 | ) | | | 1 | | | | (3 | ) |
| Syncrude insurance proceeds | | | – | | | | – | | | | – | | | | 12 | |
| Income tax adjustments | | | 55 | | | | – | | | | 62 | | | | 44 | |
| Operating earnings adjusted for unusual items | | $ | 73 | | | $ | 56 | | | $ | 252 | | | $ | 192 | |
Cash flow from continuing operating activities before changes in non-cash working capital | | $ | 149 | | | $ | 164 | | | $ | 555 | | | $ | 497 | |
| (1) | Oil Sands bitumen inventory movements increased net earnings by $3 million before-tax ($2 million after-tax) and $9 million before-tax ($6 million after-tax) for the three months and year ended December 31, 2007, respectively. The same factor did not impact net earnings for the three months ended December 31, 2006 and decreased net earnings by $3 million before-tax ($2 million after-tax) for the year ended December 31, 2006. |
Oil Sands delivered operating earnings adjusted for unusual items of $73 million in the fourth quarter of 2007, up from $56 million in the fourth quarter of 2006. Higher realized prices and volumes at Syncrude were partially offset by lower realized prices and bitumen volumes at MacKay River, higher operating costs and increased DD&A expense.
International & Offshore
In the first quarter of 2007, the Company combined its East Coast Canada and International businesses under one management structure. The change leverages and grows the capabilities of similar operations. The combined East Coast Canada and International operations are now referred to as International & Offshore.
East Coast Canada
| | | Three months ended December 31, | Year ended December 31, |
(millions of Canadian dollars) | | 2007 | | | 2006 | | | 2007 | | | 2006 | |
Net earnings and operating earnings (1) | | $ | 346 | | | $ | 261 | | | $ | 1,229 | | | $ | 934 | |
| Insurance premium (surcharges) recovery | | | 1 | | | | (1 | ) | | | 1 | | | | (9 | ) |
| Terra Nova insurance proceeds | | | 20 | | | | 9 | | | | 27 | | | | 22 | |
| Income tax adjustments | | | 47 | | | | – | | | | 52 | | | | 37 | |
| Operating earnings adjusted for unusual items | | $ | 278 | | | $ | 253 | | | $ | 1,149 | | | $ | 884 | |
Cash flow from continuing operating activities before changes in non-cash working capital | | $ | 378 | | | $ | 382 | | | $ | 1,542 | | | $ | 1,163 | |
| (1) | East Coast Canada crude oil inventory movements decreased net earnings by $30 million before-tax ($20 million after-tax) and increased net earnings by $18 million before-tax ($12 million after-tax) for the three months and year ended December 31, 2007, respectively. The same factor decreased net earnings by $5 million before-tax ($4 million after-tax) and increased net earnings by $8 million before-tax ($5 million after-tax) for the three months and year ended December 31, 2006, respectively. |
In the fourth quarter of 2007, East Coast Canada contributed $278 million of operating earnings adjusted for unusual items, up from $253 million in the fourth quarter of 2006. Higher realized prices, increased volumes at Terra Nova and White Rose, and lower operating and exploration expenses were partially offset by lower production at Hibernia, increased DD&A expense and higher royalty payments.
International
| | | Three months ended December 31, | Year ended December 31, |
(millions of Canadian dollars) | | 2007 | | | 2006 | | | 2007 | | | 2006 | |
Net earnings (loss) from continuing operations (1) | | $ | (30 | ) | | $ | (1 | ) | | $ | 374 | | | $ | (206 | ) |
Change in fair value of Buzzard derivative contracts (2) | | | (120 | ) | | | (33 | ) | | | (138 | ) | | | (240 | ) |
| Gain (loss) on sale of assets | | | 2 | | | | (1 | ) | | | 9 | | | | 12 | |
| Operating earnings from continuing operations | | $ | 88 | | | $ | 33 | | | $ | 503 | | | $ | 22 | |
| Insurance premium (surcharges) recovery | | | 1 | | | | (2 | ) | | | 1 | | | | (8 | ) |
| Scott insurance proceeds | | | – | | | | 3 | | | | 5 | | | | 3 | |
| Income tax adjustments | | | – | | | | – | | | | 30 | | | | (242 | ) |
Operating earnings from continuing operations adjusted for unusual items | | $ | 87 | | | $ | 32 | | | $ | 467 | | | $ | 269 | |
Cash flow from (used in) continuing operating activities before changes in non-cash working capital (2) | | $ | (842 | ) | | $ | 194 | | | $ | 185 | | | $ | 716 | |
| (1) | International crude oil inventory movements increased the net loss from continuing operations by $58 million before-tax ($20 million after-tax) and decreased net earnings from continuing operations by $30 million before-tax ($14 million after-tax) for the three months and year ended December 31, 2007, respectively. The same factor decreased the net loss from continuing operations by $32 million before-tax ($18 million after-tax) and decreased the net loss from continuing operations by $67 million before-tax ($15 million after-tax) for the three months and year ended December 31, 2006, respectively. |
| (2) | During the fourth quarter of 2007, the Company entered into derivative contracts to close out the hedged portion of its Buzzard production from January 1, 2008 to December 31, 2010. Under the terms of the contracts, the Company repurchased 30,688,000 bbls of Dated Brent crude oil at an average price of approximately $85.79 US/bbl, resulting in an after-tax charge to net earnings of $120 million and a reduction in cash flow of $1,145 million after-tax. |
International contributed $87 million of operating earnings from continuing operations, adjusted for unusual items, in the fourth quarter of 2007, up from $32 million recorded in the fourth quarter of 2006. Higher realized oil prices and increased production volumes were partially offset by the realized loss on the derivative contracts associated with the Buzzard acquisition and increased exploration and DD&A expenses. Higher exploration expenses were due to well write-offs for unsuccessful wells drilled in the U.K. sector of the North Sea and Trinidad and Tobago. Increased DD&A expenses related primarily to the addition of North Sea projects (Buzzard, De Ruyter, L5b-C and Saxon).
Exploration Update
As part of Petro-Canada’s growth strategy, the Company has undertaken to build an exploration portfolio with prospects that provide a balanced risk/reward profile and that collectively add to reserves over time. In 2007, the Company and its partners drilled 15 wells. Seven of the 15 wells were completed as discoveries (Golden Eagle, 13/21b-7, van Nes and van Brakel in the North Sea; Farigh AA 13-12 in Libya; and Cassra-1 and Zandolie West offshore Trinidad and Tobago). Three wells were shut-in and are awaiting evaluation (Aklaq-6 and Aklaqyagg-1 in Alaska and Al Dahramat in Syria). Five wells were abandoned as dry holes or non-commercial discoveries and were written off.
At year-end 2007, operations continued on four additional wells (12/20b-1 in the North Sea, AA 14-12 in Libya, and Poinsettia-2 and Zandolie East offshore Trinidad and Tobago).
| | 2007 Results | 2008 Outlook (1) |
| (number of wells) | Discoveries – Oil | Discoveries – Natural Gas | Still being evaluated | Dry and Abandoned | |
| North Sea | 2 | 2 | – | 2 | 6 |
| Syria | – | – | 1 | 1 | – |
| Libya | 1 | – | – | – | 3 |
| Trinidad andTobago | – | 2 | – | 1 | 5 |
| Alaska | – | – | 2 | 1 | 3 |
| Total | 3 | 4 | 3 | 5 | 17 |
| (1) | The 2008 Outlook was previously released on December 13, 2007. |
In the fourth quarter of 2007, the Company drilled two successful exploration wells. On Block 13/21b in the U.K. sector of the North Sea, Petro-Canada, as operator with a 50% working interest in the Block, drilled a well that encountered two separate oil columns. On Block 22 offshore Trinidad and Tobago, Petro-Canada, as operator with a 90% working interest in the Block, drilled the Cassra-1 well and established a gas water contact. Both wells have been completed as discoveries and the Company and its partners will complete further appraisal work before considering development options.
In 2008, the Company expects to drill up to 17 wells focused in the North Sea, offshore Trinidad and Tobago, Libya and North of 60 (Northwest Territories and Alaska). Work is underway for the drilling of the three North of 60 wells in the first quarter of 2008. In the North Sea, Petro-Canada and its partners plan to drill up to six wells. Up to three wells are planned as part of the ongoing drilling program in Libya and the Company will continue its multi-well exploration program offshore Trinidad and Tobago, where up to five wells are planned in 2008.
Reserves
Petro-Canada's objective is to replace reserves over time through exploration, development and acquisition. The Company believes that the combination of proved plus probable reserves provides the best perspective of Petro-Canada’s reserves.
The following table and the accompanying narrative do not conform to U.S. Securities and Exchange Commission (SEC) standards and are for supplemental general information. Working interest reserves before royalties, million barrels of oil equivalent (MMboe), reserves life index, reserves replacement, probable reserves and combining proved and probable reserves do not conform to SEC standards.
| Consolidated Reserves | | North American Natural Gas | | | Oil Sands | | | East Coast Canada | | | International | | | Total | |
(working interest before royalties – MMboe) | | Western Canada | | | U.S. Rockies | | | Syncrude | | | Bitumen | | | | | | | | | | |
| | | | | | | | | | | | | | | | | | | | | | |
| Proved Reserves | | | | | | | | | | | | | | | | | | | | | |
| As at December 31, 2006 | | | 289 | | | | 32 | | | | 345 | | | | 157 | | | | 123 | | | | 328 | | | | 1,274 | |
| Revisions of previous estimate | | | (16 | ) | | | 3 | | | | 18 | | | | 72 | | | | 7 | | | | 1 | | | | 85 | |
| Net purchases/sales | | | (3 | ) | | | – | | | | – | | | | – | | | | – | | | | – | | | | (3 | ) |
Discoveries, extensions and improved recovery | | | 17 | | | | 10 | | | | – | | | | 55 | | | | 6 | | | | 24 | | | | 112 | |
| Production net | | | (36 | ) | | | (5 | ) | | | (13 | ) | | | (8 | ) | | | (36 | ) | | | (55 | ) | | | (153 | ) |
| As at December 31, 2007 | | | 251 | | | | 40 | | | | 350 | | | | 276 | | | | 100 | | | | 298 | | | | 1,315 | |
| | | | | | | | | | | | | | | | | | | | | | | | | | | | | |
| Probable Reserves | | | | | | | | | | | | | | | | | | | | | | | | | | | | |
| As at December 31, 2006 | | | 77 | | | | 28 | | | | 278 | | | | 153 | | | | 156 | | | | 224 | | | | 916 | |
| Revisions of previous estimate | | | (6 | ) | | | (7 | ) | | | (17 | ) | | | (42 | ) | | | (14 | ) | | | (32 | ) | | | (118 | ) |
| Net purchases/sales | | | – | | | | – | | | | – | | | | – | | | | – | | | | (1 | ) | | | (1 | ) |
Discoveries, extensions and improved recovery | | | 11 | | | | – | | | | – | | | | 211 | | | | 26 | | | | 49 | | | | 297 | |
| As at December 31, 2007 | | | 82 | | | | 21 | | | | 261 | | | | 322 | | | | 168 | | | | 240 | | | | 1,094 | |
| | | | | | | | | | | | | | | | | | | | | | | | | | | | | |
| Proved + Probable Reserves | | | | | | | | | | | | | | | | | | | | | | | | | | | | |
| As at December 31, 2006 | | | 366 | | | | 60 | | | | 623 | | | | 310 | | | | 279 | | | | 552 | | | | 2,190 | |
| Revisions of previous estimate | | | (22 | ) | | | (4 | ) | | | 1 | | | | 30 | | | | (7 | ) | | | (31 | ) | | | (33 | ) |
| Net purchases/sales | | | (3 | ) | | | – | | | | – | | | | – | | | | – | | | | (1 | ) | | | (4 | ) |
Discoveries, extensions and improved recovery | | | 28 | | | | 10 | | | | – | | | | 266 | | | | 32 | | | | 73 | | | | 409 | |
| Production net | | | (36 | ) | | | (5 | ) | | | (13 | ) | | | (8 | ) | | | (36 | ) | | | (55 | ) | | | (153 | ) |
| As at December 31, 2007 | | | 333 | | | | 61 | | | | 611 | | | | 598 | | | | 268 | | | | 538 | | | | 2,409 | |
In 2007, the Company replaced 243%(1) of production on a proved plus probable basis. Proved plus probable reserves additions totalled 372 MMboe, excluding 2007 production of 153 MMboe net. As a result, total proved plus probable reserves increased from 2,190 MMboe at year-end 2006 to 2,409 MMboe at year-end 2007. The proved plus probable reserves life index (RLI) was 15.8(1) at year-end 2007, compared with 17.3(1) at year-end 2006.
Petro-Canada’s overall objective is to replace proved plus probable reserves on a rolling five-year basis. Petro-Canada’s proved plus probable reserves replacement on a consolidated basis was 127%(1) over the last five years.
Further detail on Petro-Canada’s reserves and the basis for their estimation is provided in the Management’s Discussion and Analysis (MD&A) beginning on page 17.
| (1) | Reserves replacement and RLI are non-standardized measures and may not be comparable to similar measures of other companies. They are illustrative only. For purposes of these calculations, Petro-Canada has added data from its oil and gas activities, and oil sands mining activities together. Reserves replacement percentage is calculated by dividing the change in reserves for the period stated, before deducting production, by the total production for the same period. |
DOWNSTREAM
| | | Three months ended December 31, | Year ended December 31, |
(millions of Canadian dollars) | | 2007 | | | 2006 | | | 2007 | | | 2006 | |
Net earnings | | $ | 81 | | | $ | 83 | | | $ | 629 | | | $ | 473 | |
| Gain on sale of assets | | | 1 | | | | 5 | | | | 7 | | | | 10 | |
| Operating earnings | | $ | 80 | | | $ | 78 | | | $ | 622 | | | $ | 463 | |
| Insurance premium (surcharges) recovery | | | 2 | | | | (2 | ) | | | 2 | | | | (8 | ) |
| Income tax adjustments | | | 28 | | | | – | | | | 34 | | | | 41 | |
| Operating earnings adjusted for unusual items | | $ | 50 | | | $ | 80 | | | $ | 586 | | | $ | 430 | |
Cash flow from continuing operating activities before changes in non-cash working capital | | $ | 88 | | | $ | 178 | | | $ | 948 | | | $ | 790 | |
In the fourth quarter of 2007, the Downstream business contributed $50 million of operating earnings adjusted for unusual items, down from $80 million in the same quarter of 2006. Lower Refining and Supply operating earnings adjusted for unusual items were partially offset by higher Marketing results.
Refining and Supply contributed fourth quarter 2007 operating earnings adjusted for unusual items of $10 million, down significantly compared with $75 million in the same quarter of 2006. Results reflected lower lubricant, petrochemical and asphalt margins, negative foreign exchange impacts on cracking margins and crude price differentials, and increased operating costs. This was partially offset by higher light oil margins, stronger retail margins and increased refinery yields. Higher operating costs in the fourth quarter of 2007, compared with the prior year, include one-time items and the addition of environmental costs, including the Alberta greenhouse gas tax and the Quebec green levy.
Marketing contributed fourth quarter 2007 operating earnings adjusted for unusual items of $40 million, up compared with $5 million in the same quarter of 2006. In the fourth quarter of 2007, Marketing results reflected increased fuel and non-petroleum margins, and higher sales volumes.
CORPORATE
Shared Services | | Three months ended December 31, | Year ended December 31, |
(millions of Canadian dollars) | | 2007 | | | 2006 | | | 2007 | | | 2006 | |
Net earnings (loss) | | $ | 53 | | | $ | (105 | ) | | $ | (6 | ) | | $ | (263 | ) |
| Foreign currency translation gain (loss) on long-term debt | | | 10 | | | | (58 | ) | | | 208 | | | | 1 | |
| Operating earnings (loss) | | $ | 43 | | | $ | (47 | ) | | $ | (214 | ) | | $ | (264 | ) |
Stock-based compensation (expense) recovery (1) | | | 45 | | | | (21 | ) | | | (54 | ) | | | (31 | ) |
| Income tax adjustments | | | 6 | | | | – | | | | 5 | | | | (71 | ) |
| Operating loss adjusted for unusual items | | $ | (8 | ) | | $ | (26 | ) | | $ | (165 | ) | | $ | (162 | ) |
Cash flow from (used in) continuing operating activities before changes in non-cash working capital | | $ | 71 | | | $ | (63 | ) | | $ | (188 | ) | | $ | (218 | ) |
| (1) | Reflected the change in the mark-to-market valuation of stock-based compensation. |
Shared Services recorded an operating loss adjusted for unusual items of $8 million in the fourth quarter of 2007, compared with a loss of $26 million for the same period in 2006. The decrease in the operating loss adjusted for unusual items was a result of foreign exchange gains on U.S. dollar cash balances held during the quarter.
Petro-Canada is one of Canada’s largest oil and gas companies, operating in both the upstream and downstream sectors of the industry in Canada and internationally. The Company creates value by responsibly developing energy resources and providing world class petroleum products and services. Petro-Canada is proud to be a National Partner to the Vancouver 2010 Olympic and Paralympic Winter Games. Petro-Canada’s common shares trade on the Toronto Stock Exchange (TSX) under the symbol PCA and on the New York Stock Exchange (NYSE) under the symbol PCZ.
The full text of Petro-Canada's fourth quarter release, including MD&A, can be accessed on Petro-Canada's website at http://www.petro-canada.ca/en/investors/845.aspx and will be available through SEDAR at http://www.sedar.com.
Petro-Canada will hold a conference call to discuss these results with investors on Thursday, January 31, 2008 at 9:00 a.m. eastern standard time (EST). To participate, please call 1-866-898-9626 (toll-free in North America), 00-800-8989-6323 (toll-free internationally), or 416-340-2216 at 8:55 a.m. EST. Media are invited to listen to the call by dialing 1-866-540-8136 (toll-free in North America) or 416-340-8010. Media are invited to ask questions at the end of the call. A live audio broadcast of the conference call will be available on Petro-Canada's website at http://www.petro-canada.ca/en/investors/845.aspx on January 31, 2008 at 9:00 a.m. EST. Those who are unable to listen to the call live may listen to a recording of the call approximately one hour after its completion by dialing 1-800-408-3053 (toll-free in North America) or 416-695-5800 (pass code number 3246676#). Approximately one hour after the call, a recording will be available on Petro-Canada’s website.
LEGAL NOTICE – FORWARD-LOOKING INFORMATION
This news release contains forward-looking information. You can usually identify this information by such words as "plan,""anticipate,""forecast,""believe,""target,""intend,""expect,""estimate,""budget," or other terms that suggest future outcomes or references to outlooks. Listed below are examples of references to forward-looking information:
· business strategies and goals · future investment decisions · outlook (including operational updates and strategic milestones) · future capital, exploration and other expenditures · future resource purchases and sales · construction and repair activities · turnarounds at refineries and other facilities · anticipated refining margins · future oil and gas production levels and the sources of their growth · project development, and expansion schedules and results · future exploration activities and results and dates by which certain areas may be developed or may come on-stream | · retail throughputs · pre-production and operating costs · reserves and resources estimates · royalties and taxes payable · production life-of-field estimates · natural gas export capacity · future financing and capital activities (including purchases of Petro-Canada common shares under the Company's normal course issuer bid (NCIB) program) · contingent liabilities (including potential exposure to losses related to retail licensee agreements) · environmental matters · future regulatory approvals |
Such forward-looking information is subject to known and unknown risks and uncertainties. Other factors may cause actual results, levels of activity and achievements to differ materially from those expressed or implied by such information. Such factors include, but are not limited to:
· industry capacity · imprecise reserves estimates of recoverable quantities of oil, natural gas and liquids from resource plays, and other sources not currently classified as reserves · the effects of weather and climate conditions · the results of exploration and development drilling, and related activities · the ability of suppliers to meet commitments · decisions or approvals from administrative tribunals · risks associated with domestic and international oil and gas operations · expected rates of return | · general economic, market and business conditions · competitive action by other companies · fluctuations in oil and gas prices · refining and marketing margins · the ability to produce and transport crude oil and natural gas to markets · fluctuations in interest rates and foreign currency exchange rates · actions by governmental authorities (including changes in taxes, royalty rates and resource-use strategies) · changes in environmental and other regulations · international political events · nature and scope of actions by stakeholders and/or the general public |
Many of these and other similar factors are beyond the control of Petro-Canada. Petro-Canada discusses these factors in greater detail in filings with the Canadian provincial securities commissions and the SEC.
Readers are cautioned that this list of important factors affecting forward-looking information is not exhaustive. Furthermore, the forward-looking information in this news release is made as of January 31, 2008 and, except as required by applicable law, will not be publicly updated or revised. This cautionary statement expressly qualifies the forward-looking information in this news release.
Petro-Canada disclosure of reserves
Petro-Canada's qualified reserves evaluators prepare the reserves estimates the Company uses. The Canadian provincial securities commissions do not consider Petro-Canada’s reserves staff and management as independent of the Company. Petro-Canada has obtained an exemption from certain Canadian reserves disclosure requirements that allows Petro-Canada to make disclosure in accordance with SEC standards where noted in this news release. This exemption allows comparisons with U.S. and other international issuers.
As a result, Petro-Canada formally discloses its proved reserves data using U.S. requirements and practices, and these may differ from Canadian domestic standards and practices. The use of the terms such as "probable," "possible," ”resources” and “life-of-field production” in this news release does not meet the SEC guidelines for SEC filings. To disclose reserves in SEC filings, oil and gas companies must prove they are economically and legally producible under existing economic and operating conditions. Note that when the term boe is used in this news release, it may be misleading, particularly if used in isolation. A boe conversion ratio of six Mcf to one bbl is based on an energy equivalency conversion method. This method primarily applies at the burner tip and does not represent a value equivalency at the wellhead.
The table below describes the industry definitions that Petro-Canada currently uses:
Definitions Petro-Canada uses | Reference |
Proved oil and gas reserves (includes both proved developed and proved undeveloped) | U.S. SEC reserves definition (Accounting Rules Regulation S-X 210.4-10, U.S. Financial Accounting Standards Board Statement No. -69) SEC Guide 7 for Oilsands Mining |
| | |
Unproved reserves, probable and possible reserves | Canadian Securities Administrators: Canadian Oil and Gas Evaluation Handbook (COGEH), Vol. 1 Section 5 prepared by Society of Petroleum Evaluation Engineers (SPEE) and Canadian Institute of Mining Metallurgy and Petroleum (CIM) |
| | |
Contingent and prospective resources | Petroleum Resources Management System (PRMS): Society of Petroleum Engineers, Society of Petroleum Evaluation Engineers, World Petroleum Congress and American Association of Petroleum Geologist definitions (approved March 2007) Canadian Securities Administrators: COGEH Vol. 1 Section 5 |
Although the Society of Petroleum Engineers resource classification has categories of 1C, 2C, 3C for Contingent Resources, and low, best and high estimates for Prospective Resources, Petro-Canada will only refer to the 2C for Contingent Resources and the risked (an assessment of the probability of discovering the resources) best estimate for Prospective Resources, when referencing resources in this news release. Canadian Oil Sands represents approximately 71% of Petro-Canada’s total for Contingent and Prospective Resources. The balance of Petro-Canada’s resources is spread out across the business, most notably in the North American frontier and International areas. Also, when Petro-Canada references resources for the Company, Contingent Resources are approximately 53% and risked Prospective Resources are approximately 47% of the Company’s total resources.
Cautionary statement: In the case of discovered resources or a subcategory of discovered resources other than reserves, there is no certainty that it will be commercially viable to produce any portion of the resources. In the case of undiscovered resources or a subcategory of undiscovered resources, there is no certainty that any portion of the resources will be discovered. If discovered, there is no certainty that it will be commercially viable to produce any portion of the resources.
For movement of resources to reserve categories, all projects must have an economic depletion plan and may require
| · | additional delineation drilling and/or new technology for oil sands mining, in situ, and conventional Contingent and risked Prospective Resources, prior to project sanction and regulatory approvals; and |
| · | exploration success with respect to conventional risked Prospective Resources prior to project sanction and regulatory approvals. |
Reserves and resource information contained in this news release is as at December 31, 2007.
For more information, please contact:
| INVESTOR AND ANALYST INQUIRIES | MEDIA AND GENERAL INQUIRIES |
| | |
Ken Hall Investor Relations 403-296-7859 e-mail: investor@petro-canada.ca | Andrea Ranson Corporate Communications 403-296-4610 e-mail: corpcomm@petro-canada.ca |
| | |
Lisa McMahon Investor Relations 403-296-3764 e-mail: investor@petro-canada.ca | |
| | |
| www.petro-canada.ca |