Exhibit 99.1
| January 31, 2008 | (publié également en français) |
For the 12 months ended December 31, 2007
MANAGEMENT’S DISCUSSION AND ANALYSIS
The Management’s Discussion and Analysis (MD&A), dated January 31, 2008, is set out in pages 1 to 27 and should be read in conjunction with the unaudited Consolidated Financial Statements of the Company for the year ended December 31, 2007; the MD&A for the three months ended March 31, 2007, the six months ended June 30, 2007 and the nine months ended September 30, 2007; the MD&A for the year ended December 31, 2006; the audited Consolidated Financial Statements for the year ended December 31, 2006, and the Company’s 2006 Annual Information Form (AIF), dated March 22, 2007. Amounts are in Canadian dollars unless otherwise specified.
LEGAL NOTICE – FORWARD-LOOKING INFORMATION
This quarterly report contains forward-looking information. You can usually identify this information by such words as "plan,""anticipate,""forecast,""believe,""target,""intend,""expect,""estimate,""budget," or other terms that suggest future outcomes or references to outlooks. Listed below are examples of references to forward-looking information:
· business strategies and goals · future investment decisions · outlook (including operational updates and strategic milestones) · future capital, exploration and other expenditures · future resource purchases and sales · construction and repair activities · turnarounds at refineries and other facilities · anticipated refining margins · future oil and gas production levels and the sources of their growth · project development, and expansion schedules and results · future exploration activities and results and dates by which certain areas may be developed or may come on-stream | · retail throughputs · pre-production and operating costs · reserves and resources estimates · royalties and taxes payable · production life-of-field estimates · natural gas export capacity · future financing and capital activities (including purchases of Petro-Canada common shares under the Company's normal course issuer bid (NCIB) program) · contingent liabilities (including potential exposure to losses related to retail licensee agreements) · environmental matters · future regulatory approvals |
Such forward-looking information is subject to known and unknown risks and uncertainties. Other factors may cause actual results, levels of activity and achievements to differ materially from those expressed or implied by such information. Such factors include, but are not limited to:
· industry capacity · imprecise reserves estimates of recoverable quantities of oil, natural gas and liquids from resource plays, and other sources not currently classified as reserves · the effects of weather and climate conditions · the results of exploration and development drilling, and related activities · the ability of suppliers to meet commitments · decisions or approvals from administrative tribunals · risks associated with domestic and international oil and gas operations · expected rates of return | · general economic, market and business conditions · competitive action by other companies · fluctuations in oil and gas prices · refining and marketing margins · the ability to produce and transport crude oil and natural gas to markets · fluctuations in interest rates and foreign currency exchange rates · actions by governmental authorities (including changes in taxes, royalty rates and resource-use strategies) · changes in environmental and other regulations · international political events · nature and scope of actions by stakeholders and/or the general public |
Many of these and other similar factors are beyond the control of Petro-Canada. Petro-Canada discusses these factors in greater detail in filings with the Canadian provincial securities commissions and the United States (U.S.) Securities and Exchange Commission (SEC).
Readers are cautioned that this list of important factors affecting forward-looking information is not exhaustive. Furthermore, the forward-looking information in this quarterly report is made as of January 31, 2008 and, except as required by applicable law, will not be publicly updated or revised. This cautionary statement expressly qualifies the forward-looking information in this quarterly report.
MANAGEMENT'S DISCUSSION AND ANALYSIS
PETRO-CANADA
Petro-Canada disclosure of reserves
Petro-Canada's qualified reserves evaluators prepare the reserves estimates the Company uses. The Canadian provincial securities commissions do not consider Petro-Canada’s reserves staff and management as independent of the Company. Petro-Canada has obtained an exemption from certain Canadian reserves disclosure requirements that allows Petro-Canada to make disclosure in accordance with SEC standards where noted in this quarterly report. This exemption allows comparisons with U.S. and other international issuers.
As a result, Petro-Canada formally discloses its proved reserves data using U.S. requirements and practices, and these may differ from Canadian domestic standards and practices. The use of the terms such as "probable," "possible," ”resources” and “life-of-field production” in this quarterly report does not meet the SEC guidelines for SEC filings. To disclose reserves in SEC filings, oil and gas companies must prove they are economically and legally producible under existing economic and operating conditions. Note that when the term barrel of oil equivalent (boe) is used in this quarterly report, it may be misleading, particularly if used in isolation. A boe conversion ratio of six thousand cubic feet (Mcf) to one barrel (bbl) is based on an energy equivalency conversion method. This method primarily applies at the burner tip and does not represent a value equivalency at the wellhead.
The table below describes the industry definitions that Petro-Canada currently uses:
| Definitions Petro-Canada uses | Reference |
Proved oil and gas reserves (includes both proved developed and proved undeveloped) | U.S. SEC reserves definition (Accounting Rules Regulation S-X 210.4-10, U.S. Financial Accounting Standards Board Statement No. -69) SEC Guide 7 for Oilsands Mining |
Unproved reserves, probable and possible reserves | Canadian Securities Administrators: Canadian Oil and Gas Evaluation Handbook (COGEH), Vol. 1 Section 5 prepared by Society of Petroleum Evaluation Engineers (SPEE) and Canadian Institute of Mining Metallurgy and Petroleum (CIM) |
| Contingent and prospective resources | Petroleum Resources Management System (PRMS): Society of Petroleum Engineers, Society of Petroleum Evaluation Engineers, World Petroleum Congress and American Association of Petroleum Geologist definitions (approved March 2007) Canadian Securities Administrators: COGEH Vol. 1 Section 5 |
Although the Society of Petroleum Engineers resource classification has categories of 1C, 2C, 3C for Contingent Resources, and low, best and high estimates for Prospective Resources, Petro-Canada will only refer to the 2C for Contingent Resources and the risked (an assessment of the probability of discovering the resources) best estimate for Prospective Resources, when referencing resources in this quarterly report. Canadian Oil Sands represents approximately 71% of Petro-Canada’s total for Contingent and Prospective Resources. The balance of Petro-Canada’s resources is spread out across the business, most notably in the North American frontier and International areas. Also when Petro-Canada references resources for the Company, Contingent Resources are approximately 53% and risked Prospective Resources are approximately 47% of the Company’s total resources.
Cautionary statement: In the case of discovered resources or a subcategory of discovered resources other than reserves, there is no certainty that it will be commercially viable to produce any portion of the resources. In the case of undiscovered resources or a subcategory of undiscovered resources, there is no certainty that any portion of the resources will be discovered. If discovered, there is no certainty that it will be commercially viable to produce any portion of the resources.
For movement of resources to reserve categories, all projects must have an economic depletion plan, and may require
| · | additional delineation drilling and/or new technology for oil sands mining, in situ, and conventional Contingent and risked Prospective Resources, prior to project sanction and regulatory approvals; and |
| · | exploration success with respect to conventional risked Prospective Resources prior to project sanction and regulatory approvals. |
Reserves and resource information contained in this quarterly report is as at December 31, 2007.
- 2 -
MANAGEMENT'S DISCUSSION AND ANALYSIS
PETRO-CANADA
BUSINESS ENVIRONMENT
Market prices shown below influence average prices realized for crude oil, natural gas liquids (NGL), natural gas and petroleum products in the table on page 25.
UPSTREAM
Crude Oil
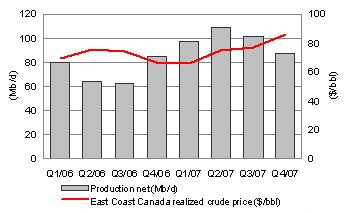
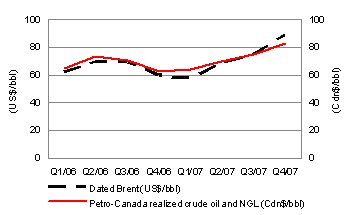 | The price of Dated Brent averaged $88.69 US/bbl in the fourth quarter of 2007, up nearly 50% compared with $59.68 US/bbl in the fourth quarter of 2006. Concern about global oil demand outpacing supply gains, combined with geopolitics and speculation, led to record high oil prices during the quarter. During the fourth quarter of 2007, the Canadian dollar averaged $1.02 US, up from $0.88 US in the fourth quarter of 2006. As a result, Petro-Canada’s corporate-wide realized Canadian dollar prices for crude oil and NGL from continuing operations increased 33%, from $62.37/bbl in the fourth quarter of 2006 to $82.71/bbl in the fourth quarter of 2007. |
In the fourth quarter of 2007, the spread between Dated Brent and Mexican Maya widened to $13.03 US/bbl, compared with $12.77 US/bbl in the fourth quarter of 2006. In Canada, the spread between Edmonton Light and Western Canada Select (WCS) widened to $31.66/bbl in the fourth quarter of 2007, compared with $19.72/bbl in the fourth quarter of 2006. Canadian heavy crudes continued to be sold at larger discounts to light crude prices, compared with international heavy crudes. The discount was due to Canadian heavy crude oil production growing at a faster rate than North American investment to convert refineries to process heavy feedstock, as well as the seasonal decline in asphalt demand.
Natural Gas
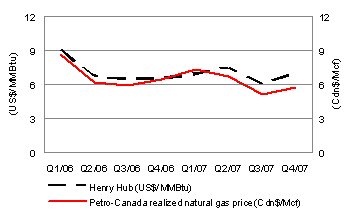 | North American natural gas prices at the Henry Hub were higher in the fourth quarter of 2007, compared with the fourth quarter of 2006, due to colder winter weather conditions than a year ago. In the fourth quarter of 2007, NYMEX Henry Hub natural gas prices averaged $7.03 US/million British thermal units (MMBtu), up 6% from $6.62 US/MMBtu in the fourth quarter of 2006. However, the gain in Henry Hub natural gas prices was more than offset by the strong appreciation of the Canadian dollar during the fourth quarter of 2007. Petro-Canada’s realized Canadian dollar prices for its North American Natural Gas business averaged $5.78/Mcf in the fourth quarter of 2007, down 11% from $6.52/Mcf in the fourth quarter of 2006. |
- 3 -
MANAGEMENT'S DISCUSSION AND ANALYSIS
PETRO-CANADA
DOWNSTREAM
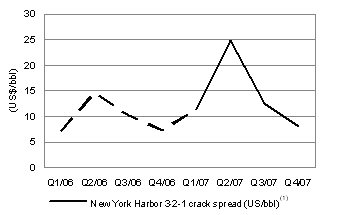 | New York Harbor 3-2-1 refinery crack spreads(1) averaged $8.18 US/bbl in the fourth quarter of 2007, up 13% compared with an average of $7.27 US/bbl in the fourth quarter of 2006. Strong heating oil crack spreads drove margin improvement, while gasoline spreads were slightly weaker compared with the fourth quarter of 2006. The increased strength of the Canadian dollar relative to the U.S. currency in the fourth quarter of 2007 lowered the impact of higher U.S. denominated refinery cracking margins for Canadian refiners. |
The average market prices for the periods stated were:
Three months ended December 31, | Year ended December 31, | |||||||||||||||
| 2007 | 2006 | 2007 | 2006 | |||||||||||||
Dated Brent at Sullom Voe (US$/bbl) | 88.69 | 59.68 | 72.52 | 65.14 | ||||||||||||
West Texas Intermediate (WTI) at Cushing (US$/bbl) | 90.68 | 60.21 | 72.31 | 66.22 | ||||||||||||
Dated Brent/Maya FOB price differential (US$/bbl) | 13.03 | 12.77 | 12.67 | 13.94 | ||||||||||||
Edmonton Light (Cdn$/bbl) | 87.11 | 65.12 | 76.84 | 73.23 | ||||||||||||
Edmonton Light/WCS FOB price differential (Cdn$/bbl) | 31.66 | 19.72 | 24.07 | 22.40 | ||||||||||||
Natural gas at Henry Hub (US$/MMBtu) | 7.03 | 6.62 | 6.92 | 7.26 | ||||||||||||
Natural gas at AECO (Cdn$/Mcf) | 6.26 | 6.64 | 6.89 | 7.28 | ||||||||||||
New York Harbor 3-2-1 crack spread (US$/bbl) (1) | 8.18 | 7.27 | 14.15 | 9.80 | ||||||||||||
Exchange rate (US cents/Cdn$) | 101.9 | 87.8 | 93.1 | 88.2 | ||||||||||||
| Average realized prices from continuing operations | ||||||||||||||||
Crude oil and NGL ($/bbl) | 82.71 | 62.37 | 72.66 | 67.38 | ||||||||||||
Natural gas ($/Mcf) | 5.88 | 6.61 | 6.32 | 6.96 | ||||||||||||
(1) On January 1, 2007, the New York Harbor 3-2-1 crack spread calculation changed. It is now based on Reformulated Gasoline Blendstock for Oxygenate Blending (RBOB) gasoline (the base for blending gasoline with 10% denatured ethanol) as opposed to conventional gasoline. Due to this change in specification, the 2007 crack spread values were not directly comparable to 2006 values.
- 4 -
MANAGEMENT'S DISCUSSION AND ANALYSIS
PETRO-CANADA
The following table shows the estimated after-tax effects that changes in certain factors would have had on Petro-Canada’s 2007 net earnings from continuing operations had these changes occurred. Amounts are in Canadian dollars unless otherwise specified.
| Annual net | Annual net | |||||||||||
| earnings impact | earnings impact | |||||||||||
Factor (1), (2) | Change (+) | (millions of dollars) | ($/share) (3) | |||||||||
| Upstream | ||||||||||||
Price received for crude oil and NGL (4) | $1.00/bbl | $ | 52 | $ | 0.11 | |||||||
| Price received for natural gas | $0.25/Mcf | 30 | 0.06 | |||||||||
Exchange rate: US$/Cdn$ refers to impact on upstream earnings from continuing operations (5) | $0.01 | (40 | ) | (0.08 | ) | |||||||
| Crude oil and NGL production | 1,000 barrel/day (b/d) | 10 | 0.02 | |||||||||
| Natural gas production | 10 million cubic feet/day (MMcf/d) | 7 | 0.01 | |||||||||
| Downstream | ||||||||||||
New York Harbor 3-2-1 crack spread (6) | $1.00 US/bbl | 22 | 0.05 | |||||||||
| Chicago 3-2-1 crack spread | $1.00 US/bbl | 24 | 0.04 | |||||||||
| Seattle 3-2-1 crack spread | $1.00 US/bbl | 7 | 0.01 | |||||||||
| Dated Brent/Maya FOB price differential | $1.00 US/bbl | 6 | 0.01 | |||||||||
| Edmonton Light/Synthetic price differential | $1.00 Cdn/bbl | 13 | 0.03 | |||||||||
Exchange rate: US$/Cdn$ refers to impact on downstream cracking margins and crude price differentials (7) | $0.01 | (11 | ) | (0.02 | ) | |||||||
| Corporate | ||||||||||||
Exchange rate: US$/Cdn$ refers to impact of the revaluation of U.S. dollar-denominated, long-term debt (8) | $0.01 | $ | 10 | $ | 0.02 | |||||||
| (1) | The impact of a change in one factor may be compounded or offset by changes in other factors. This table does not consider the impact of any inter-relationship among the factors. |
| (2) | The impact of these factors is illustrative. |
| (3) | Per share amounts are based on the number of shares outstanding as at December 31, 2007. |
| (4) | This sensitivity is based upon an equivalent change in the price of WTI and Dated Brent, excluding the derivative contracts associated with the Buzzard acquisition that were closed out in the fourth quarter of 2007. |
| (5) | A strengthening Canadian dollar compared with the U.S. dollar has a negative effect on upstream earnings from continuing operations. |
| (6) | On January 1, 2007, the New York Harbor 3-2-1 crack spread calculation changed. It is now based on RBOB gasoline (the base for blending gasoline with 10% denatured ethanol) as opposed to conventional gasoline. Due to this change in specification, the 2007 crack spread values are not directly comparable to 2006 values. |
| (7) | A strengthening Canadian dollar compared with the U.S. dollar has a negative effect on downstream cracking margins and crude price differentials. |
| (8) | A strengthening Canadian dollar versus the U.S. dollar has a positive effect on corporate earnings with respect to the Company’s U.S. denominated debt. The impact refers to gains or losses on $1.4 billion US of the Company’s U.S. denominated long-term debt and interest costs on U.S. denominated debt. Gains or losses on $1.1 billion US of the Company’s U.S. denominated long-term debt, associated with the self-sustaining International business segment and the U.S. Rockies operations included in the North American Natural Gas business unit, are deferred and included as part of shareholders’ equity. |
- 5 -
MANAGEMENT'S DISCUSSION AND ANALYSIS
PETRO-CANADA
BUSINESS STRATEGY
Petro-Canada's strategy is to create shareholder value by delivering long-term, profitable growth and improving the profitability of the base business.
Petro-Canada’s capital program supports bringing on seven major projects over the next several years. In 2008, the Company expects to complete the project to convert the Edmonton refinery to process lower cost, oil sands-based feedstock and to make final investment decisions on the Fort Hills mine and upgrader, Syria Ebla gas and Montreal coker projects. The Company and its partners also plan to advance the following upstream projects: the MacKay River in situ expansion, extension of the White Rose field off the East Coast of Canada and development of the Libyan concessions. The Company anticipates upstream production will significantly increase again as these big projects come on-stream. These projects are expected to add significant earnings and cash flow.
Petro-Canada continually works to strengthen its base business by improving the safety, reliability and efficiency of its operations and is focused on delivering upstream production in line with guidance.
| Strategic Priorities | Quarterly Progress |
DELIVERING PROFITABLE GROWTH WITH A FOCUS ON OPERATED, LONG-LIFE ASSETS | · advanced construction of the Edmonton refinery conversion project, which was 61% complete at the end of 2007 and on track for startup in the fourth quarter of 2008 · achieved first oil at the Saxon development in the United Kingdom (U.K.) sector of the North Sea · doubled U.S. Rockies production from 2004 acquisition levels to 100 million cubic feet equivalent/day (MMcfe/d) by year-end · signed binding heads of agreement for a 30-year extension of the Libyan concessions · drilled one oil discovery in the U.K. sector of the North Sea and one natural gas discovery offshore Trinidad and Tobago · entered formal agreement for the development of the partner operated White Rose Extensions · deferred final investment decision for the MacKay River expansion 40,000 b/d project until 2009 to explore cost savings alternatives |
DRIVING FOR FIRST QUARTILE OPERATION OF OUR ASSETS | · maintained reliability around 99% at Western Canada natural gas processing facilities · operated MacKay River at 87% reliability · delivered a combined reliability index of 92 at the Edmonton and Montreal refineries and the lubricants plant · grew convenience store sales by 10% and same-store sales by 9%, compared with the fourth quarter of 2006 |
MAINTAINING FINANCIAL DISCIPLINE AND FLEXIBILITY | · ended the quarter with debt levels at 22.5% of total capital and a ratio of 1.0 times debt-to-cash flow from continuing operating activities · repurchased 2.0 million common shares at an average price of $51.70/share for a total cost of $104 million · settled Buzzard derivative contract hedges for $1,145 million after-tax |
CONTINUING TO WORK AT BEING A RESPONSIBLE COMPANY | · developed principles for the responsible management of water across the Company · achieved total recordable injury frequency in 2007 of 0.86, compared with 0.85 in 2006 · lowered environmental exceedances from 24(1) in 2006 to 16 in 2007 |
| (1) | 2006 environmental exceedances included the Brazeau and West Pembina assets, which was sold in the first quarter of 2007. |
- 6 -
MANAGEMENT'S DISCUSSION AND ANALYSIS
PETRO-CANADA
STRATEGIC MILESTONES
Q1 2008 | Q2 2008 | Q3 2008 | ||
▼ | ▼ | ▼ | ||
§ anticipate receipt of a regulatory decision on the MacKay River expansion project § complete Syria development front-end engineering and design (FEED) and make final investment decision § anticipate receipt of a regulatory decision on the development application for the North Amethyst portion of the White Rose Extensions development | § anticipate receipt of a regulatory decision on the Fort Hills Sturgeon County Upgrader application § make final investment decision on the North Amethyst portion of the White Rose Extensions development § make final investment decision on potential 25,000 b/d coker at Montreal refinery § anticipate final ratification of Libyan concession development agreement | § make a final investment decision on the Fort Hills integrated mine/upgrader project § commence drilling in the North Amethyst glory hole | ||
ANALYSIS OF CONSOLIDATED EARNINGS
Earnings Analysis
During the first quarter of 2006, Petro-Canada closed the sale of the Company’s mature producing assets in Syria. These assets and associated results are reported as discontinued operations and are excluded from continuing operations.
Earnings Variances
Q4/07 VERSUS Q4/06 FACTOR ANALYSIS
Net Earnings from Continuing Operations
(millions of Canadian dollars, after-tax)
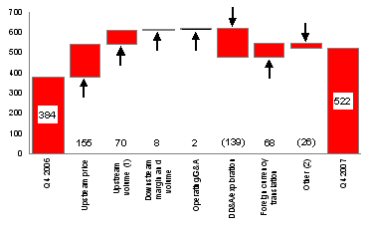 | Net earnings from continuing operations increased to $522 million ($1.08/share) in the fourth quarter of 2007, compared with $384 million ($0.77/share) in the fourth quarter of 2006. Higher upstream production, stronger realized crude oil prices and positive income tax adjustments contributed to higher net earnings from continuing operations. These factors were partially offset by higher other expenses, which included losses on the derivative contracts associated with Buzzard, increased exploration and depreciation, depletion and amortization (DD&A) expenses and weaker realized natural gas prices. |
| (1) | Upstream volumes included the portion of DD&A expense associated with changes in upstream production levels. |
| (2) | Other mainly included interest expense, changes in effective tax rates, gain on sale of assets, insurance proceeds, amounts related to the derivative contracts associated with Buzzard and upstream inventory movements. |
- 7 -
MANAGEMENT'S DISCUSSION AND ANALYSIS
PETRO-CANADA
Net Earnings from Continuing Operations by Segment
(millions of Canadian dollars, after-tax)
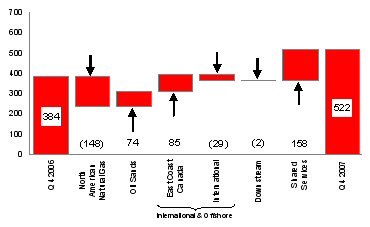 | Net earnings from continuing operations on a segmented basis increased 36% to $522 million in the fourth quarter of 2007, compared with $384 million in the fourth quarter of 2006. The increase in fourth quarter net earnings from continuing operations reflected higher East Coast Canada and Oil Sands net earnings. Shared Services recorded net earnings in the fourth quarter of 2007 due to a stock-based compensation recovery and gains in foreign currency translation. The results were partially offset by lower North American Natural Gas, International and Downstream net earnings. |
During the fourth quarter of 2007, cash flow from (used in) continuing operating activities was $(602) million ($(1.24)/share), down significantly from $964 million ($1.94/share) in the same quarter of 2006. The decrease in cash flow from continuing operating activities primarily reflects the payment to settle the Buzzard derivative contract hedges, partially offset by higher net earnings.
Quarterly Financial Information
| Three months ended | ||||||||||||||||||||||||||||||||
(millions of Canadian dollars, except per share amounts) | Dec. 31 2007 | Sept. 30 2007 | June 30 2007 | March 31 2007 | Dec. 31 2006 | Sept. 30 2006 | June 30 2006 | March 31 2006 | ||||||||||||||||||||||||
Total revenue from continuing operations | $ | 5,434 | $ | 5,497 | $ | 5,478 | $ | 4,841 | $ | 4,550 | $ | 5,201 | $ | 4,730 | $ | 4,188 | ||||||||||||||||
Net earnings from continuing operations | $ | 522 | $ | 776 | $ | 845 | $ | 590 | $ | 384 | $ | 678 | $ | 472 | $ | 54 | ||||||||||||||||
| Per share – basic | 1.08 | 1.59 | 1.71 | 1.19 | 0.77 | 1.36 | 0.93 | 0.11 | ||||||||||||||||||||||||
| – diluted | 1.07 | 1.58 | 1.70 | 1.18 | 0.76 | 1.34 | 0.92 | 0.10 | ||||||||||||||||||||||||
| Net earnings | $ | 522 | $ | 776 | $ | 845 | $ | 590 | $ | 384 | $ | 678 | $ | 472 | $ | 206 | ||||||||||||||||
| Per share – basic | 1.08 | 1.59 | 1.71 | 1.19 | 0.77 | 1.36 | 0.93 | 0.40 | ||||||||||||||||||||||||
| – diluted | 1.07 | 1.58 | 1.70 | 1.18 | 0.76 | 1.34 | 0.92 | 0.40 | ||||||||||||||||||||||||
- 8 -
MANAGEMENT'S DISCUSSION AND ANALYSIS
PETRO-CANADA
UPSTREAM
Production from Continuing Operations
Petro-Canada converts volumes of natural gas to oil equivalent at a rate of six Mcf of natural gas to one bbl of oil. Production volumes disclosed refer to net working interest before royalties, unless otherwise specified.
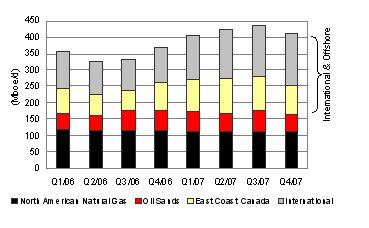 | In the fourth quarter of 2007, production averaged 409,800 barrels of oil equivalent per day (boe/d) net to Petro-Canada, up significantly from 368,200 boe/d net in the same quarter of 2006. Higher volumes reflected the addition of North Sea projects (Buzzard, De Ruyter, L5b-C and Saxon) and higher East Coast Canada production. This was partially offset by lower Oil Sands production and declines in the North American Natural Gas business. Production in the fourth quarter of 2006 was reduced as Terra Nova completed its planned maintenance turnaround. |
Exploration Update
In the fourth quarter of 2007, Petro-Canada drilled two successful exploration wells - one in the North Sea and one offshore Trinidad and Tobago.
As part of Petro-Canada’s growth strategy, the Company has undertaken to build an exploration portfolio with prospects that provide a balanced risk/reward profile and that collectively add to reserves over time. In 2007, the Company and its partners drilled 15 wells. Seven of the 15 wells were completed as discoveries (Golden Eagle, 13/21b-7, van Nes and van Brakel in the North Sea; Farigh AA 13-12 in Libya; and Cassra-1 and Zandolie West offshore Trinidad and Tobago). Three wells were shut-in and are awaiting evaluation (Aklaq-6 and Aklaqyagg-1 in Alaska and Al Dahramat in Syria). Five wells were abandoned as dry holes or non-commercial discoveries and were written off.
At year-end 2007, operations continued on four additional wells (12/20b-1 in the North Sea, AA 14-12 in Libya, and Poinsettia-2 and Zandolie East offshore Trinidad and Tobago).
In 2007, the Company invested $319 million on exploration capital expenditures, including general and administrative (G&A), geological and geophysical exploration expenses. Expenditures increased by 51%, compared with $211 million spent in 2006. The increase in 2007, compared with 2006, reflected the expanded scope of the Company’s exploration program and higher costs for contract rigs and services.
| 2007 Results | 2008 Outlook | ||||
| (number of wells) | Discoveries – Oil | Discoveries – Natural Gas | Still being evaluated | Dry and Abandoned | |
| North Sea | 2 | 2 | – | 2 | 6 |
| Syria | – | – | 1 | 1 | – |
| Libya | 1 | – | – | – | 3 |
| Trinidad andTobago | – | 2 | – | 1 | 5 |
| Alaska | – | – | 2 | 1 | 3 |
| Total | 3 | 4 | 3 | 5 | 17 |
In the fourth quarter of 2007, the Company drilled two successful exploration wells. On Block 13/21b in the U.K. sector of the North Sea, Petro-Canada, as operator with a 50% working interest in the Block, drilled a well to a total depth of 2,398 metres and encountered two separate oil columns. The deeper reservoir contained a gross column of 21 metres, with 34.5 degree API oil, while the shallower reservoir encountered a gross column of 58 metres, with 21 degree API oil. On Block 22 offshore Trinidad and Tobago, Petro-Canada, as operator with a 90% working interest in the Block, drilled the Cassra-1 well in 430 metres of water and reached a depth of 1,712 metres below sea level. The well encountered the reservoir objective and established a gas water contact. Both wells have been completed as discoveries and the Company and its partners will complete further appraisal work before considering development options.
- 9 -
MANAGEMENT'S DISCUSSION AND ANALYSIS
PETRO-CANADA
In 2008, the Company expects to drill up to 17 wells focused in the North Sea, offshore Trinidad and Tobago, Libya and North of 60 (Northwest Territories and Alaska). Work is underway for the drilling of the three North of 60 wells in the first quarter of 2008. In the North Sea, Petro-Canada and its partners plan to drill up to six wells, targeting a mix of reserves additions around existing infrastructure and larger exploration prospects. Up to three wells are planned as part of the ongoing drilling program in Libya, targeting reserves additions near existing infrastructure. In addition, the Company will continue its multi-well exploration program offshore Trinidad and Tobago, where up to five wells are planned in 2008.
2008 Upstream Consolidated Production Outlook
Upstream production is expected to decrease slightly in 2008, primarily due to natural declines in East Coast Canada and Western Canada. Offsetting these decreases are expectations of additional volumes from the full-year impact of Buzzard and Saxon in the North Sea and higher planned Oil Sands production. Production is expected to average in the range of 390,000 boe/d to 420,000 boe/d in 2008.
Factors that may impact production during 2008 include reservoir performance, drilling results, facility reliability and the successful execution of planned turnarounds.
(thousands of boe/d) | 2007 Outlook (+/-) As at July 26, 2007 | 2007 Actual | 2008 Outlook (+/-) |
| North American Natural Gas | |||
| Natural gas | 97 | 100 | 93 |
| Liquids | 13 | 12 | 12 |
| Oil Sands | |||
| Syncrude | 34 | 37 | 35 |
| MacKay River | 24 | 20 | 25 |
| International & Offshore | |||
East Coast Canada | 95 | 99 | 85 |
International | |||
North Sea | 90 | 91 | 93 |
Other International | 57 | 59 | 57 |
| Total continuing operations | 400 - 420 | 418 | 390 – 420 |
North American Natural Gas
North American Natural Gas exited 2007 with U.S. Rockies production reaching 100 MMcfe/d, achieving its goal to double production from 2004 acquisition levels.
Three months ended December 31, | Year ended December 31, | |||||||||||||||
| (millions of Canadian dollars) | 2007 | 2006 | 2007 | 2006 | ||||||||||||
| Net earnings (loss) | $ | (57 | ) | $ | 91 | $ | 191 | $ | 405 | |||||||
| Cash flow from continuing operating activities | $ | 164 | $ | 108 | $ | 725 | $ | 651 | ||||||||
North American Natural Gas recorded a net loss of $57 million in the fourth quarter of 2007, compared with net earnings of $91 million in the fourth quarter of 2006. Lower volumes and realized prices, combined with increased DD&A and exploration expense, resulted in lower net earnings. DD&A expense in the fourth quarter of 2007 included a charge of $150 million before-tax ($97 million after-tax) related to the impairment of coal bed methane (CBM) assets in the U.S. Rockies due to probable reserves reductions combined with lower prices.
Net earnings in the fourth quarter of 2007 included a $7 million positive adjustment related to income tax rate adjustments.
- 10 -
MANAGEMENT'S DISCUSSION AND ANALYSIS
PETRO-CANADA
North American Natural Gas Production and Pricing
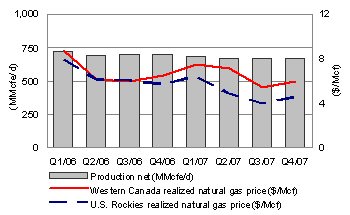 | In the fourth quarter of 2007, North American Natural Gas production declined by 4%, compared with the same period in 2006. Lower production reflected the sale of the Brazeau and West Pembina assets, anticipated natural declines in Western Canada and delayed well tie-ins. These factors were partially offset by higher natural gas production in the U.S. Rockies. Realized natural gas prices in Western Canada decreased by 10% in the fourth quarter of 2007, compared with the same quarter of 2006, consistent with market price trends. U.S. Rockies realized natural gas prices decreased 20% in the fourth quarter of 2007, compared with the fourth quarter of 2006, reflecting on going pipeline constraints. |
Fourth Quarter 2007 | Fourth Quarter 2006 | |
Production net (MMcfe/d) (1) | ||
Western Canada | 574 | 634 |
U.S. Rockies | 95 | 64 |
| Total North American Natural Gas production net | 669 | 698 |
Western Canada realized natural gas price (Cdn$/Mcf) (1) | $5.96 | $6.59 |
U.S. Rockies realized natural gas price (Cdn$/Mcf) (1) | $4.58 | $5.70 |
| (1) | For North American Natural Gas crude oil and NGL production and average realized prices, refer to the charts on pages 24 and 25, respectively. |
Petro-Canada operated gas plants and facilities in Western Canada delivered 99% reliability in the fourth quarter of 2007. The Company completed its 2007 drilling program, where 190 wells were drilled in Western Canada and the U.S. Rockies in the fourth quarter of 2007.
| U.S. Rockies production increased to 95 MMcfe/d in the fourth quarter of 2007, an increase of 48% compared with the same quarter of 2006. This was due to the ramp up of production from the Wild Turkey and other CBM fields in the Powder River Basin and increased drilling activity in the Denver-Julesburg Basin. U.S. Rockies production reached 100 MMcfe/d in late December, a doubling of production from 2004 acquisition levels. Actual U.S. Rockies production in the quarter was reduced by ongoing pipeline constraints; however, in the fourth quarter of 2007, the initial expansion of the Fort Union gas gathering system was completed, helping to reduce curtailments. |
Scheduled Turnarounds
No major turnarounds are planned at the Company’s natural gas processing facilities in the first quarter of 2008.
Oil Sands
Oil Sands added 127 million barrels (MMbbls) of proved reserves in 2007.
Three months ended December 31, | Year ended December 31, | |||||||||||||||
(millions of Canadian dollars) | 2007 | 2006 | 2007 | 2006 | ||||||||||||
Net earnings (1) | $ | 129 | $ | 55 | $ | 316 | $ | 245 | ||||||||
| Cash flow from continuing operating activities | $ | 107 | $ | 199 | $ | 512 | $ | 499 | ||||||||
| (1) | Oil Sands bitumen inventory movements increased net earnings by $3 million before-tax ($2 million after-tax) and $9 million before-tax ($6 million after-tax) for the three months and year ended December 31, 2007, respectively. The same factor did not impact net earnings for the three months ended December 31, 2006 and decreased net earnings by $3 million before-tax ($2 million after-tax) for the year ended December 31, 2006. |
In the fourth quarter of 2007, Oil Sands net earnings were $129 million, up from $55 million in the fourth quarter of 2006. Higher realized prices and volumes at Syncrude were partially offset by lower realized prices and bitumen volumes at MacKay River, higher operating costs and increased DD&A expense.
Net earnings in the fourth quarter of 2007 included a $55 million positive adjustment related to income tax rate adjustments.
- 11 -
MANAGEMENT'S DISCUSSION AND ANALYSIS
PETRO-CANADA
Oil Sands Production and Pricing
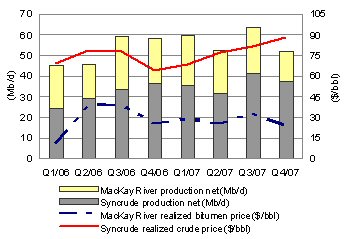 | Syncrude delivered solid production, up 4% in the fourth quarter of 2007, compared with the fourth quarter of 2006, reflecting the Stage III expansion. Syncrude realized prices were 38% higher in the fourth quarter of 2007, compared with the fourth quarter of 2006. MacKay River production was down 36% in the fourth quarter of 2007, compared with the same period of 2006, due to operational upsets. MacKay River realized bitumen prices decreased slightly in the fourth quarter of 2007, compared with the fourth quarter of 2006. |
Fourth Quarter 2007 | Fourth Quarter 2006 | |
Production net (b/d) | ||
Syncrude | 37,600 | 36,300 |
MacKay River | 14,100 | 21,900 |
| Total Oil Sands production net | 51,700 | 58,200 |
Syncrude realized crude price ($/bbl) | $88.01 | $63.68 |
MacKay River realized bitumen price ($/bbl) | $24.13 | $25.84 |
In October 2007, the steam header line feeding high pressure steam to pads 22 and 23 at the MacKay River in situ facility was damaged, resulting in the termination of steam injection to these pads. The Company completed repairs in November and commenced steaming the reservoir. Also in November 2007, the water treatment plant was brought off-line to clean the warm lime softener and one of the high temperature separators. Production has resumed and steadily increased to 25,000 b/d as of mid-January 2008.
On October 1, 2007, Syncrude’s Coker 8-3 was taken off-line. This unit is now back online and continues to have operating constraints, which are being largely offset by additional volumes from Cokers 8-1 and 8-2.
Fort Hills Project
The first phase of the Fort Hills project is planned to produce 140,000 b/d gross of synthetic crude oil (84,000 b/d net). Associated bitumen production is expected to be about 160,000 b/d gross (96,000 b/d net). First bitumen production is expected to begin in the fourth quarter of 2011, with first synthetic crude oil production from the Sturgeon Upgrader anticipated in the second quarter of 2012. The preliminary capital cost estimate for the mine and upgrading components of the first phase of Fort Hills is $14.1 billion gross ($8.5 billion net). The project is currently in the FEED stage. FEED is expected to be completed in the third quarter of 2008, producing a definitive cost estimate and the basis upon which the final investment decision on the project will be made.
In the fourth quarter of 2007, Petro-Canada and its partners in the Fort Hills project entered into an agreement, subject to the final investment decision, with Enbridge Inc., to develop pipeline and terminalling facilities to meet the requirements of Phase 1 and subsequent phases of the project. As well, the partnership applied for a Labour Market Opinion from the Government of Canada to allow for the import of temporary foreign workers during project construction.
MacKay River Expansion Project
In December 2007, the Company announced a one-year extension for the completion of FEED for the proposed MacKay River 40,000 b/d in situ expansion project due to cost pressures, including increased royalties. The economics for oil sands projects are challenging, so the Company is proceeding at a measured pace. Currently, Petro-Canada is evaluating opportunities for integration with the Fort Hills project and to pursue cost-saving opportunities associated with using foreign engineering, procurement and construction (EPC) contractors. A final investment decision is now expected in the first quarter of 2009.
- 12 -
MANAGEMENT'S DISCUSSION AND ANALYSIS
PETRO-CANADA
Scheduled Turnarounds
Syncrude is expected to commence its planned 45-day Coker 8-1 turnaround in March 2008. A major two-week turnaround is planned for MacKay River in May 2008.
Other Developments
Petro-Canada and its partners in Syncrude remain in negotiations with the Government of Alberta regarding the province’s desire for Syncrude to move to the new Alberta royalty framework in advance of the expiry of its existing royalty agreement in 2016.
International & Offshore
In the first quarter of 2007, the Company combined its East Coast Canada and International businesses under one management structure. The change leverages and grows the capabilities of similar operations. The combined East Coast Canada and International operations are now referred to as International & Offshore.
East Coast Canada
White Rose Extensions advanced with signing of binding agreements with the Province of Newfoundland and Labrador in the fourth quarter of 2007.
Three months ended December 31, | Year ended December 31, | |||||||||||||||
(millions of Canadian dollars) | 2007 | 2006 | 2007 | 2006 | ||||||||||||
Net earnings (1) | $ | 346 | $ | 261 | $ | 1,229 | $ | 934 | ||||||||
| Cash flow from continuing operating activities | $ | 261 | $ | 292 | $ | 1,491 | $ | 1,129 | ||||||||
| (1) | East Coast Canada crude oil inventory movements decreased net earnings by $30 million before-tax ($20 million after-tax) and increased net earnings by $18 million before-tax ($12 million after-tax) for the three months and year ended December 31, 2007, respectively. The same factor decreased net earnings by $5 million before-tax ($4 million after-tax) and increased net earnings by $8 million before-tax ($5 million after-tax) for the three months and year ended December 31, 2006, respectively. |
Net earnings for East Coast Canada were $346 million in the fourth quarter of 2007, up from $261 million in the fourth quarter of 2006. Higher realized prices, increased volumes at Terra Nova and White Rose, and lower operating and exploration expenses were partially offset by lower production at Hibernia, increased DD&A expense and higher royalty payments.
Net earnings in the fourth quarter of 2007 included a $47 million positive adjustment related to income tax rate adjustments and $20 million of insurance proceeds related to mechanical failures at Terra Nova, compared with $9 million of Terra Nova insurance proceeds received in the fourth quarter of 2006.
East Coast Canada Production and Pricing
 | In the fourth quarter of 2007, East Coast Canada production increased 3%, compared with the same period in 2006. Higher volumes at Terra Nova and White Rose contributed to the increase. This was partially offset by lower Hibernia production due to anticipated natural declines and increasing water production. Terra Nova production in the fourth quarter of 2007 was impacted slightly by production restrictions while the main power generator (MPG) was repaired. During the fourth quarter of 2007, East Coast Canada realized crude prices increased dramatically, compared with the fourth quarter of 2006. |
- 13 -
MANAGEMENT'S DISCUSSION AND ANALYSIS
PETRO-CANADA
Fourth Quarter 2007 | Fourth Quarter 2006 | |
Production net (b/d) | ||
Terra Nova | 31,600 | 18,000 |
Hibernia | 24,800 | 36,500 |
White Rose | 31,000 | 30,200 |
| Total East Coast Canada production net | 87,400 | 84,700 |
Average realized crude price ($/bbl) | $86.45 | $66.32 |
The Terra Nova Floating Production Storage and Offloading (FPSO) vessel operated at 70% facility reliability in the fourth quarter of 2007. Terra Nova’s facility reliability was lower, compared with the previous three quarters in 2007, due to reduced water injection capacity while the starboard MPG was under repair, as well as two five-day shutdowns to repair gas seal leaks in the gas injection and gas riser systems. Lower reliability was partially offset by higher reservoir capability from wells brought on-stream late in 2006. In December 2007, the Company completed repairs to the gas turbine that drives the starboard MPG, enabling reinstatement of full water injection capacity and, therefore, increased production. Full-year facility reliability was 86%, reflecting solid performance in the first three quarters of 2007. Production mid-January is averaging more than 100,000 b/d gross (34,000 b/d net). Performance of the Terra Nova FPSO swivel was unchanged in the fourth quarter of 2007. Plans are being developed for the repair or replacement of the swivel if performance deteriorates.
During the fourth quarter of 2007, the SeaRose FPSO in the White Rose field continued to operate reliably, although production was reduced in December due to issues with the Low Pressure (LP) Separator, a component of the system that separates gas, oil and water on the vessel. Production was 112,700 b/d gross (31,000 b/d net) in the fourth quarter of 2007, compared with 109,800 b/d gross (30,200 b/d net) in the fourth quarter of 2006.
Scheduled Turnarounds
White Rose has advanced most of its planned 2008 maintenance turnaround in the summer of 2008 to January 2008 to facilitate required cleaning and inspection of the LP Separator. The January 2008 outage is expected to last approximately two weeks. No major turnaround activity is planned for Terra Nova or Hibernia in the first quarter of 2008.
White Rose Extensions Development
In December, Petro-Canada and its partners in the North Amethyst, West White Rose and South White Rose Extension, collectively known as the White Rose Extensions development, signed a formal agreement with the Province of Newfoundland and Labrador for the development of these oilfields.
The partners received regulatory approval for the development of the South White Rose Extension and are in the regulatory review process for the North Amethyst development. The Company anticipates North Amethyst will be developed first, with first oil expected late in 2009. FEED for the North Amethyst portion of the project is complete and detailed design is underway. The objective is to achieve a timely regulatory decision and to facilitate making the final investment decision for North Amethyst in the first half of 2008.
East Coast Canada Royalties
In the fourth quarter of 2007, East Coast Canada royalties averaged 17%. Terra Nova production was subject to Tier I royalties of 30% of net revenue, or approximately 25% of gross revenues. White Rose production was subject to a Tier I royalty of 20% of net revenue, or approximately 15% of gross revenues. Royalties in the fourth quarter of 2006 were lower due to the Terra Nova turnaround, and White Rose production was subject to basic royalties of 1% of gross revenue. Production from Hibernia continued to be subject to basic royalties of 5% of gross revenue.
International
For reporting purposes, Petro-Canada has consolidated its International activities into two regions: North Sea (the U.K., the Netherlands and Norway sectors) and Other International (Trinidad and Tobago, Libya, Syria and Venezuela(1)). This change better reflects existing production and exploration interests.
Petro-Canada and the Libyan National Oil Corporation (NOC) signed binding heads of agreement for a 30-year extension of the Libyan concessions in the fourth quarter of 2007.
(1) In the fourth quarter of 2007, the Company completed the sale of its Venezuelan assets and closed the local office.
- 14 -
MANAGEMENT'S DISCUSSION AND ANALYSIS
PETRO-CANADA
Three months ended December 31, | Year ended December 31, | |||||||||||||||
(millions of Canadian dollars) | 2007 | 2006 | 2007 | 2006 | ||||||||||||
Net earnings (loss) from continuing operations (1) | $ | (30 | ) | $ | (1 | ) | $ | 374 | $ | (206 | ) | |||||
Cash flow from (used in) continuing operating activities (2) | $ | (868 | ) | $ | 171 | $ | 220 | $ | 840 | |||||||
| (1) | International crude oil inventory movements increased the net loss from continuing operations by $58 million before-tax ($20 million after-tax) and decreased net earnings from continuing operations by $30 million before-tax ($14 million after-tax) for the three months and year ended December 31, 2007, respectively. The same factor decreased the net loss from continuing operations by $32 million before-tax ($18 million after-tax) and decreased the net loss from continuing operations by $67 million before-tax ($15 million after-tax) for the three months and year ended December 31, 2006, respectively. |
| (2) | During the fourth quarter of 2007, the Company entered into derivative contracts to close out the hedged portion of its Buzzard production from January 1, 2008 to December 31, 2010. Under the terms of the contracts, the Company repurchased 30,688,000 bbls of Dated Brent crude oil at an average price of approximately $85.79 US/bbl, resulting in a reduction in cash flow of $1,145 million after-tax. |
In the fourth quarter of 2007, International had a net loss from continuing operations of $30 million, compared with a net loss from continuing operations of $1 million in the fourth quarter of 2006. Losses on the derivative contracts associated with the Buzzard acquisition and increased exploration and DD&A expenses were partially offset by higher realized oil prices and increased production volumes. Higher exploration expenses were due to well write-offs for unsuccessful wells drilled in the U.K. sector of the North Sea and offshore Trinidad and Tobago. Increased DD&A expenses related primarily to the addition of North Sea projects (Buzzard, De Ruyter, L5b-C and Saxon).
The net loss from continuing operations in the fourth quarter of 2007 included a $226 million loss on the Buzzard derivative contracts. The net loss from continuing operations in the fourth quarter of 2006 included a $33 million unrealized loss on the derivative contracts associated with Buzzard.
During the fourth quarter of 2007, the Company entered into derivative contracts to close out the hedged portion of its Buzzard production from January 1, 2008 to December 31, 2010. Under the terms of the contracts, the Company repurchased 30,688,000 bbls of Dated Brent crude oil at an average price of approximately $85.79 US/bbl, resulting in a reduction in cash flow of $1,145 million after-tax.
International Production and Pricing
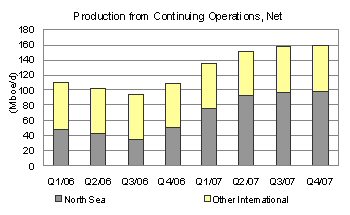 | International production from continuing operations increased 46% in the fourth quarter of 2007, compared with the fourth quarter of 2006. In the fourth quarter of 2007, production from the U.K. and the Netherlands sectors of the North Sea increased by 94%, reflecting the addition of production from Buzzard, De Ruyter, Saxon and L5b-C. These additions were partially offset by anticipated natural declines. Other International production increased slightly in the fourth quarter of 2007, compared with the fourth quarter of 2006. |
Fourth Quarter 2007 | Fourth Quarter 2006 | |
Production from continuing operations net (boe/d) | ||
U.K. sector of the North Sea | 74,800 | 27,500 |
The Netherlands sector of the North Sea | 23,400 | 23,100 |
North Sea | 98,200 | 50,600 |
Other International | 61,000 | 58,400 |
| Total International production net | 159,200 | 109,000 |
Average realized crude oil and NGL prices from continuing operations ($/bbl) | $85.40 | $67.84 |
Average realized natural gas price from continuing operations ($/Mcf) | $6.48 | $7.24 |
International operations’ realized crude oil and NGL prices increased 26% in the fourth quarter of 2007, compared with the same period in 2006. Realized prices from continuing operations for natural gas decreased 10% in the fourth quarter of 2007, compared with the same period in the prior year.
- 15 -
MANAGEMENT'S DISCUSSION AND ANALYSIS
PETRO-CANADA
North Sea
In the U.K. sector of the North Sea, Petro-Canada achieved first oil from its Saxon development in November 2007. Saxon is 100% owned and operated by Petro-Canada. The new field was producing at 5,000 b/d as of the middle of January 2008 and is expected to rampup to plateau level as the Company optimizes production on the entire Triton Guillemot system.
Buzzard production averaged approximately 174,600 boe/d gross (52,200 boe/d net) from 11 production wells in the fourth quarter of 2007, lower than expected due to damage from a major storm. During the fourth quarter of 2007, the partners completed the analysis of the options to deal with elevated levels of hydrogen sulphide in some of the producing wells. The plan, subject to partner approval, is to construct an additional hydrogen sulphide treatment platform with production sweetening capabilities.
In the Netherlands sector of the North Sea, production from the Petro-Canada operated De Ruyter facility continued to perform well, delivering 26,000 boe/d gross (about 14,000 boe/d net) in the fourth quarter of 2007.
Other International
Production in Libya averaged 49,000 boe/d in the fourth quarter of 2007, up slightly from 47,600 boe/d in the same quarter of 2006 due to improved production performance at En Naga. 2D and 3D seismic acquisition on Block 137 in the Sirte Basin in Libya was advanced to the first quarter of 2008 due to crew availability, but is not expected to impact the overall project schedule.
On Block II in Syria, the Company completed acquisition of 2D seismic in the fourth quarter of 2007.
Trinidad and Tobago offshore gas production averaged 72 MMcf/d in the fourth quarter of 2007, up compared with 65 MMcf/d in the fourth quarter of 2006, reflecting higher capacity at the Atlantic liquefied natural gas (LNG) terminal. The development of the Poinsettia field continues with the spudding of the Poinsettia-2 well in October 2007.
Ebla Gas Project
In the fourth quarter of 2007, Petro-Canada continued to advance FEED, with the Company issuing the EPC tender documents in November 2007. When completed, the Ebla gas project in Syria is expected to produce 80 MMcf/d of natural gas, with first gas anticipated in 2010.
Libyan Concession Development
In December 2007, Petro-Canada signed binding heads of agreement with the NOC to convert its existing Participation Agreements and old Exploration Production-Sharing Agreements (EPSA) to six new EPSA IV agreements. Under the new 30-year agreements, Petro-Canada will pay 50% of all development capital and will receive a 12% entitlement share of production.
The agreement will enable Petro-Canada to design and implement jointly with NOC the redevelopment of major fields and exploration programs in the Sirte Basin. Petro-Canada's Libyan concessions produce approximately 100,000 b/d gross (50,000 b/d net) on an annual average basis. Under the new agreements, production from the redevelopment program is expected to double over the next five to seven years.
Discontinued Operations
On January 31, 2006, Petro-Canada completed the sale of the Company’s mature producing assets in Syria to a joint venture of companies owned by India’s Oil and Natural Gas Corporation Limited and the China National Petroleum Corporation for net proceeds of $640 million. The sale resulted in a gain on disposal of $134 million recorded in the first quarter of 2006. This sale aligned with Petro-Canada’s strategy to focus on long-life and operated assets within its asset portfolio. Petro-Canada’s activities in Syria remain an important part of the Company’s international portfolio, with an active exploration program in Block II and the addition of the Ebla natural gas project in Syria during 2006.
Discontinued Operations | Three months ended December 31, | Year ended December 31, | ||||||||||||||
(millions of Canadian dollars) | 2007 | 2006 | 2007 | 2006 | ||||||||||||
Net earnings from discontinued operations | $ | – | $ | – | $ | – | $ | 152 | ||||||||
| Cash flow from discontinued operating activities | $ | – | $ | – | $ | – | $ | 15 | ||||||||
Production net (boe/d) | – | – | – | 5,500 | ||||||||||||
Average realized crude oil and NGL price ($/bbl) | $ | – | $ | – | $ | – | $ | 71.84 | ||||||||
| Average realized natural gas price ($/Mcf) | $ | – | $ | – | $ | – | $ | 7.94 | ||||||||
- 16 -
MANAGEMENT'S DISCUSSION AND ANALYSIS
PETRO-CANADA
Reserves
Petro-Canada's qualified reserves evaluators prepare the reserves estimates used by the Company. The Canadian provincial securities commissions do not consider Petro-Canada’s reserves staff and management as independent of the Company. Petro-Canada has obtained an exemption from certain Canadian reserves disclosure requirements that allows Petro-Canada to make disclosure in accordance with SEC standards where noted in this quarterly report. This exemption allows comparisons with U.S. and other international issuers.
As a result, Petro-Canada formally discloses its proved reserves data using U.S. requirements and practices, and these may differ from Canadian domestic standards and practices. The use of the terms such as "probable," "possible," ”resources” and “life-of-field production” in this quarterly report does not meet the SEC guidelines for SEC filings. To disclose reserves in SEC filings, oil and gas companies must prove they are economically and legally producible under existing economic and operating conditions. Note that when the term boe is used in this quarterly report, it may be misleading, particularly if used in isolation. A boe conversion ratio of six Mcf to one bbl is based on an energy equivalency conversion method. This method primarily applies at the burner tip and does not represent a value equivalency at the wellhead.
The Company's reserves data and reserves quantities are determined by Petro-Canada's staff of qualified reserves evaluators using corporate-wide policies, procedures and practices. These reserves policies, procedures and practices conform with the requirements in Canada, as well as with the U.S. SEC and the Association of Professional Engineers, Geologists and Geophysicists of Alberta's Standard of Practice for the Evaluation of Oil and Gas Reserves for Public Disclosure. Petro-Canada also employs independent third parties to evaluate, audit and/or review its reserves processes and estimates. In 2007, 33% of North American (excluding Oil Sands) and 42% of International proved reserves were assessed by independent reserves evaluators. The independent reserves evaluators concluded that the Company's year-end reserves estimates were reasonable.
The following table does not conform to SEC standards and is for supplemental general information. Working interest reserves before royalties and million barrels of oil equivalent (MMboe) do not conform to SEC standards.
December 31, 2007 Consolidated Reserves – for Oil and Gas Activities | Proved liquids | Proved gas | 2007 Proved reserves additions liquids (1) | 2007 Proved reserves additions gas (1) | Proved (2) | 2007 Proved reserves | ||||||||||||||||||
(working interest before royalties) | (MMbbls) | (Billion cubic feet – Bcf) | (MMbbls) | (Bcf) | (MMboe) | (MMboe) | ||||||||||||||||||
| North American Natural Gas | 45 | 1,479 | 3 | 53 | 291 | 11 | ||||||||||||||||||
Oil Sands (3) | 276 | – | 127 | – | 276 | 127 | ||||||||||||||||||
| International & Offshore | ||||||||||||||||||||||||
| East Coast Canada | 100 | – | 13 | – | 100 | 13 | ||||||||||||||||||
| International | 251 | 280 | 20 | 27 | 298 | 25 | ||||||||||||||||||
| Total | 672 | 1,759 | 163 | 80 | 965 | 176 | ||||||||||||||||||
| Production net | 96 | 266 | 140 | |||||||||||||||||||||
| (1) | Proved reserves additions are the sum of revisions of previous estimates, net purchases/sales, and discoveries, extensions and improved recovery. |
| (2) | At year-end 2007, 57% of proved reserves were classified as proved developed reserves. Of the total proved undeveloped reserves, 95% were associated with large projects currently producing or under active development, including Buzzard, Syncrude, MacKay River, Hibernia, Terra Nova, White Rose and Trinidad and Tobago natural gas. |
| (3) | Oil Sands proved reserves excluded reserves from Syncrude, which is considered a mining activity by the SEC. |
The following table does not conform to SEC standards and is for supplemental general information. Working interest reserves before royalties does not conform to SEC standards.
December 31, 2007 Reserves – for Syncrude Mining Operation | Proved liquids | 2007 Proved reserves additions liquids (1) | ||||||
| (working interest before royalties) | (MMbbls) | (MMbbls) | ||||||
| Reserves of synthetic crude oil | 350 | 18 | ||||||
| Production net | 13 | |||||||
| (1) | Proved reserves additions are the sum of revisions of previous estimates, net purchases/sales, and discoveries, extensions and improved recovery. |
- 17 -
MANAGEMENT'S DISCUSSION AND ANALYSIS
PETRO-CANADA
The following table and the accompanying narrative do not conform to SEC standards and are for supplemental general information. Working interest reserves before royalties, MMboe and combining oil and gas and oil sands mining activities together do not conform to SEC standards.
December 31, 2007 Consolidated Reserves – for Oil and Gas and Oil Sands Mining Activities | Proved liquids | Proved gas | 2007 Proved reserves additions liquids (1) | 2007 Proved reserves additions gas (1) | Proved (2) | 2007 Proved reserves additions (1) | ||||||||||||||||||
| (working interest before royalties) | (MMbbls) | (Bcf) | (MMbbls) | (Bcf) | (MMboe) | (MMboe) | ||||||||||||||||||
| North American Natural Gas | 45 | 1,479 | 3 | 53 | 291 | 11 | ||||||||||||||||||
Oil Sands (3) | 626 | – | 145 | – | 626 | 145 | ||||||||||||||||||
| International & Offshore | ||||||||||||||||||||||||
| East Coast Canada | 100 | – | 13 | – | 100 | 13 | ||||||||||||||||||
| International | 251 | 280 | 20 | 27 | 298 | 25 | ||||||||||||||||||
| Total | 1,022 | 1,759 | 181 | 80 | 1,315 | 194 | ||||||||||||||||||
| Production net | 109 | 266 | 153 | |||||||||||||||||||||
| (1) | Proved reserves additions are the sum of revisions of previous estimates, net purchases/sales, and discoveries, extensions and improved recovery. |
| (2) | At year-end 2007, 57% of proved reserves were classified as proved developed reserves. Of the total proved undeveloped reserves, 95% were associated with large projects currently producing or under active development, including Buzzard, Syncrude, MacKay River, Hibernia, Terra Nova, White Rose and Trinidad and Tobago natural gas. |
| (3) | Oil Sands proved reserves included reserves from Syncrude and MacKay River. |
In 2007, proved reserves additions totalled 194 MMboe, excluding 2007 production of 153 MMboe net. As a result, total proved reserves increased from 1,274 MMboe at year-end 2006 to 1,315 MMboe at year-end 2007.
The North American Natural Gas business added 11 MMboe of proved reserves additions in 2007. Reserve additions were due to exploration and development activity, partially offset by technical revisions related to reservoir performance of some Western Canada pools.
In 2007, 145 MMbbls of proved reserves were added in Oil Sands. At MacKay River, demonstrated performance, delineation drilling and progress with regulatory approval for an expanded development area resulted in the addition of 127 MMbbls of proved reserves. At Syncrude, 18 MMbbls were added to proved reserves as a result of optimizing the Aurora North mine plan.
In East Coast Canada, a total of 13 MMbbls was added to proved reserves during 2007 due to ongoing development well drilling and production performance at White Rose, Terra Nova and Hibernia.
International proved reserves increased by 25 MMboe in 2007, due primarily to development drilling at Buzzard and the start up of Saxon in the U.K. North Sea.
DOWNSTREAM
The Downstream delivered reliable operations and increased retail and wholesale sales volumes in the fourth quarter of 2007.
Three months ended December 31, | Year ended December 31, | |||||||||||||||
(millions of Canadian dollars) | 2007 | 2006 | 2007 | 2006 | ||||||||||||
Net earnings | $ | 81 | $ | 83 | $ | 629 | $ | 473 | ||||||||
| Cash flow from continuing operating activities | $ | 245 | $ | 314 | $ | 994 | $ | 835 | ||||||||
The Downstream business recorded net earnings of $81 million in the fourth quarter of 2007, relatively flat compared with $83 million in the same quarter of 2006. The net earnings reflected a variety of items including lower lubricant, petrochemical and asphalt margins, negative foreign exchange impacts on cracking margins and crude price differentials, and increased operating costs. These factors were partially offset by higher light oil margins, stronger retail margins and increased refinery yields. Higher operating costs in the fourth quarter of 2007, compared with the prior year, include $18 million in one-time items and the addition of environmental costs, including the Alberta greenhouse gas tax and the Quebec green levy.
Net earnings in the fourth quarter of 2007 included a $28 million positive adjustment related to income tax rate adjustments.
- 18 -
MANAGEMENT'S DISCUSSION AND ANALYSIS
PETRO-CANADA
Downstream Net Earnings
 |  |
| Fourth Quarter 2007 | Fourth Quarter 2006 | |||||||
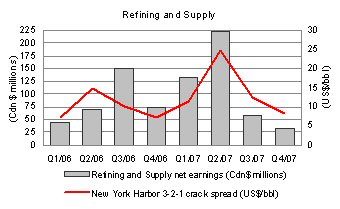
Refining and Supply net earnings (millions of Canadian dollars) | $ | 31 | $ | 74 | ||||
New York Harbor 3-2-1 crack spread (US$/bbl) (1) | $ | 8.18 | $ | 7.27 | ||||
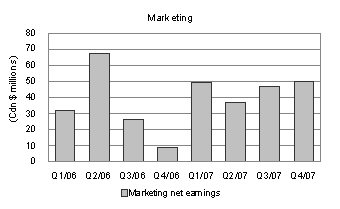
Marketing net earnings (millions of Canadian dollars) | $ | 50 | $ | 9 | ||||
The average New York Harbor 3-2-1 refinery crack spread(1) was $8.18 US/bbl in the fourth quarter of 2007, up from $7.27 US/bbl in the fourth quarter of 2006. The average international light/heavy crude price differential was $13.03 US/bbl in the fourth quarter of 2007, compared with $12.77 US/bbl in the fourth quarter of 2006.
In the fourth quarter of 2007, total sales of refined petroleum products increased 1% to 5 billion litres, compared with the same period last year. The increase reflected higher Retail and Wholesale volume, partially offset by lower Refining and Supply low-margin sales volumes.
Refining and Supply contributed fourth quarter 2007 net earnings of $31 million, down from $74 million in the same quarter of 2006. Results reflected lower lubricant, petrochemical and asphalt margins, negative foreign exchange impacts and increased operating costs. Higher operating costs in the fourth quarter of 2007, compared with the prior year, was due to the addition of environmental costs, including new greenhouse gas regulations and increased repair, maintenance and salary related expenses. These factors were partially offset by higher light oil margins and increased refinery yields.
Marketing contributed fourth quarter 2007 net earnings of $50 million, up compared with $9 million in the same quarter of 2006. In the fourth quarter of 2007, Marketing results reflected increased fuel and non-petroleum margins and higher sales volumes.
Downstream Turnaround Activity
No major turnarounds are planned at the Company’s Downstream facilities in the first quarter of 2008.
Edmonton Refinery Conversion Project (RCP)
At the Edmonton refinery, the Company is investing to convert the facility to run oil sands-based feedstock. The refinery conversion program will enable Petro-Canada to directly upgrade up to 26,000 b/d of bitumen and process up to 48,000 b/d of sour synthetic crude oil, replacing the conventional light crude feedstock currently refined.
At the end of the fourth quarter of 2007, Petro-Canada had completed 61% of the construction and all the major vessels and modules were installed. The total project cost estimated for RCP increased from $2 billion to $2.2 billion, reflecting labour cost pressures in Alberta. Approximately 82% of estimated project costs were committed at December 31, 2007. The project is anticipated to start up in the fourth quarter of 2008.
| (1) | On January 1, 2007, the New York Harbor 3-2-1 crack spread calculation changed. It is now based on RBOB gasoline (the base for blending gasoline with 10% denatured ethanol) as opposed to conventional gasoline. Due to this change in specification, the 2007 crack spread values are not directly comparable to 2006 values. |
- 19 -
MANAGEMENT'S DISCUSSION AND ANALYSIS
PETRO-CANADA
Change in Accounting for Inventory and Crude Oil and Product Purchases
Beginning January 1, 2008, Petro-Canada will adopt the “first-in, first-out” (FIFO) method for valuing its crude oil and refined product inventories. The change is due to the “last-in, first-out” (LIFO) method no longer being permitted under Canadian generally accepted accounting principles (GAAP). As a result of changing from the current LIFO inventory costing method to FIFO, the Company expects two impacts. The first anticipated impact is a one-time adjustment to increase inventories by $812 million, future income tax liabilities by $256 million and retained earnings by $556 million. This adjustment occurred on January 1, 2008 and increased the Company’s working capital and Downstream capital employed values. The second anticipated impact relates to reported cost of crude oil and product purchases. The change in methodology will reflect historic crude oil prices at the time the crude oil is purchased. Reported operating revenues continue to reflect current market prices when the crude oil is refined and sold. As a result of the lag between when crude oil is purchased and when product is sold, and fluctuating crude oil prices, future reported Downstream earnings may be more volatile.
CORPORATE
Shared Services | Three months ended December 31, | Year ended December 31, | ||||||||||||||
(millions of Canadian dollars) | 2007 | 2006 | 2007 | 2006 | ||||||||||||
Net earnings (loss) | $ | 53 | $ | (105 | ) | $ | (6 | ) | $ | (263 | ) | |||||
| Cash flow used in continuing operating activities | $ | (511 | ) | $ | (120 | ) | $ | (603 | ) | $ | (346 | ) | ||||
Shared Services recorded net earnings of $53 million in the fourth quarter of 2007, compared with a net loss of $105 million for the same period in 2006. The increase in net earnings, compared with the net loss in the fourth quarter of 2006 was due to foreign exchange gains on U.S. dollar cash balances held during the fourth quarter of 2007. Net earnings in the fourth quarter of 2007, included a $45 million recovery related to the mark-to-market valuation of stock-based compensation and a $10 million foreign currency translation gain on long-term debt, compared with a $21 million charge and a $58 million loss, respectively, in the fourth quarter of 2006.
Interest expense was $43 million before-tax during the fourth quarter of 2007, up from $37 million in the fourth quarter of the prior year. The Company capitalized $9 million of interest expense during the quarter, compared with $27 million in the fourth quarter of 2006.
Cash flow from continuing operating activities was affected by two items that typically cause differences between earnings and cash flow from continuing operating activities. Tax deferrals resulting from the Company's upstream partnership increased cash flow from continuing operating activities by about $18 million in the quarter, compared with a decrease of $40 million in the same period last year. The inventory valuation method prescribed for income tax purposes in the Downstream business decreased cash flow from continuing operating activities by $45 million in the fourth quarter of 2007, compared with an increase of $18 million in the fourth quarter of 2006. On January 1, 2008, the Company will adopt the FIFO costing method for valuing its Downstream inventories, which is consistent with the method prescribed for income tax purposes, thereby eliminating the difference in earnings and cash flow from continuing operating activities.
LIQUIDITY AND CAPITAL RESOURCES
Summary of Cash Flows
Three months ended December 31, | Year ended December 31, | |||||||||||||||
(millions of Canadian dollars) | 2007 | 2006 | 2007 | 2006 | ||||||||||||
| Cash flow from (used in) continuing operating activities | $ | (602 | ) | $ | 964 | $ | 3,339 | $ | 3,608 | |||||||
| Cash flow from discontinued operating activities | – | – | – | 15 | ||||||||||||
| Net cash (outflows) inflows from: | ||||||||||||||||
Investing activities | (1,197 | ) | (1,050 | ) | (3,647 | ) | (2,738 | ) | ||||||||
Financing activities | 940 | (95 | ) | 40 | (1,175 | ) | ||||||||||
| Decrease in cash and cash equivalents | (859 | ) | (181 | ) | (268 | ) | (290 | ) | ||||||||
| Cash and cash equivalents | $ | 231 | $ | 499 | $ | 231 | $ | 499 | ||||||||
Petro-Canada’s financing strategy is designed to maintain financial strength and flexibility to support profitable growth in all business environments. Two key measures that Petro-Canada uses to measure the Company’s overall financial strength are debt-to-cash flow from continuing operating activities and debt-to-debt plus equity. Petro-Canada’s debt-to-cash flow from continuing operating activities ratio, a key short-term leverage measure, was 1.0 times at December 31, 2007. This was within the Company’s target range of no more than 2.0 times. Debt-to-debt plus equity, the long-term measure for capital structure, was 22.5% at December 31, 2007, below the Company's target range of 25% to 35%.
- 20 -
MANAGEMENT'S DISCUSSION AND ANALYSIS
PETRO-CANADA
| Financial Ratios | December 31, 2007 | December 31, 2006 | ||||||
Debt-to-cash flow from continuing operating activities (times) | 1.0 | 0.8 | ||||||
Debt-to-debt plus equity (%) | 22.5 | 21.7 | ||||||
Operating Activities
Excluding cash and cash equivalents, the current portion of long-term debt and short-term notes payable, the operating working capital deficiency was $565 million at the end of the fourth quarter of 2007, compared with an operating working capital deficiency of $1,014 million at December 31, 2006. The working capital deficiency was lower primarily due to a decrease in accounts payable related to the settlement of the Buzzard hedge, partially offset by an increase in accounts receivable.
Investing Activities
Three months ended December 31, | Year ended December 31, | Outlook | ||||||||||||||||||
(millions of Canadian dollars) | 2007 | 2006 | 2007 | 2006 | 2008 | |||||||||||||||
| Upstream | ||||||||||||||||||||
North American Natural Gas | $ | 369 | $ | 303 | $ | 866 | $ | 788 | $ | 675 | ||||||||||
Oil Sands | 482 | 89 | 779 | 377 | 1,520 | |||||||||||||||
International &Offshore | ||||||||||||||||||||
East Coast Canada | 33 | 68 | 159 | 256 | 295 | |||||||||||||||
International (1) | 224 | 293 | 762 | 760 | 1,635 | |||||||||||||||
| 1,108 | 753 | 2,566 | 2,181 | 4,125 | ||||||||||||||||
| Downstream | ||||||||||||||||||||
Refining and Supply | 405 | 321 | 1,214 | 1,038 | 950 | |||||||||||||||
Sales and Marketing | 51 | 68 | 155 | 142 | 150 | |||||||||||||||
Lubricants | 12 | 5 | 27 | 49 | 25 | |||||||||||||||
| 468 | 394 | 1,396 | 1,229 | 1,125 | ||||||||||||||||
| Shared Services | 9 | 9 | 26 | 24 | 35 | |||||||||||||||
| Total property, plant and equipment | ||||||||||||||||||||
| and exploration | 1,585 | 1,156 | 3,988 | 3,434 | 5,285 | |||||||||||||||
| Other assets | 16 | 9 | 121 | 50 | – | |||||||||||||||
| Total continuing operations | 1,601 | 1,165 | 4,109 | 3,484 | 5,285 | |||||||||||||||
| Discontinued operations | – | – | – | 1 | – | |||||||||||||||
| Total | $ | 1,601 | $ | 1,165 | $ | 4,109 | $ | 3,485 | $ | 5,285 | ||||||||||
| (1) | International excluded capital expenditures related to the mature Syrian producing assets, which were sold by the Company in January 2006. |
Outlook – Capital Expenditures
In 2008, spending on new growth projects is expected to increase. Two-thirds of planned capital expenditures are anticipated to support delivering profitable new growth and funding exploration and new ventures. This is up by more than $1 billion compared with the same categories in 2007. The remaining one-third of the 2008 planned capital expenditures is expected to be directed toward replacing reserves in core areas, enhancing existing assets, improving base business profitability and complying with new regulations.
Petro-Canada’s 2008 capital expenditure plan incorporates the impact of the Alberta government’s new royalty framework, as announced on October 25, 2007.
- 21 -
MANAGEMENT'S DISCUSSION AND ANALYSIS
PETRO-CANADA
Capital Investment Priorities (millions of Canadian dollars) | 2008 Outlook As at Dec. 13, 2007 | 2008 Highlights |
Comply with new regulations | $ 105 | Spending on regulatory projects at Downstream facilities and investment at Syncrude to reduce sulphur emissions |
Enhance existing assets | 290 | Improving reliability at Downstream, Oil Sands and North American Natural Gas facilities |
Improve base business profitability | 140 | Developing the retail/wholesale marketing networks and increasing refinery yield |
Replace reserves in core areas | 1,195 | Investing for immediate impact across the four upstream businesses |
Advance new growth projects | 3,205 | Investing in medium-term growth projects, such as preliminary engineering and design for Fort Hills, developing the Libyan concessions, converting the Edmonton refinery to run oil sands feedstocks, preparing for the potential new coker at the Montreal refinery, developing the Ebla project in Syria, and preliminary engineering and design for the MacKay River expansion project |
| Fund exploration and new ventures for long-term growth | 350 | Investing in exploration activity in International, Alaska and the Northwest Territories |
| Total continuing operations | $5,285 |
Financing Activities
At the end of the fourth quarter of 2007, the Company’s syndicated committed credit facilities totalled $2,200 million and the Company’s bilateral demand credit facilities totalled $1,500 million. A total of $1,372 million of the credit facilities was used for Bankers’ Acceptances, letters of credit and overdraft coverage. As at December 31, 2007, there was $1,104 million in Bankers’ Acceptances outstanding. The syndicated facilities also may be used to provide liquidity support to a commercial paper program. No commercial paper was outstanding at December 31,2007.
As at December 31, 2007, the Company’s unsecured long-term debt securities were rated Baa2 by Moody’s Investors Service, BBB by Standard & Poor’s and A (low) by Dominion Bond Rating Service. The Company’s long-term debt ratings remain unchanged from year-end 2006.
As the Company moves into 2008 and beyond, spending on future large projects will likely result in annual capital expenditures exceeding operating cash flow. The Company anticipates that additional funding requirements will be met by external financing. As financial leverage is expected to increase over time, it will be managed in the context of Petro-Canada’s target ranges.
Returning Cash to Shareholders
Petro-Canada’s priority uses of cash are to fund the capital program and profitable growth opportunities, and to return cash to shareholders through dividends and a share buyback program. Petro-Canada renewed its NCIB program for the repurchase of its common shares from June 22, 2007 to June 21, 2008, entitling the Company to purchase up to 5% of its outstanding common shares, subject to certain conditions.
In the fourth quarter of 2007, the Company repurchased 2.0 million shares, compared with 1.0 million in the same period last year. Future share repurchases will depend on excess cash available after consideration of the Company’s priority uses of cash.
| Shares Repurchased | Average Price | Total Cost ($ millions) | ||||||||||||||||||||||
| Period | 2007 | 2006 | 2007 | 2006 | 2007 | 2006 | ||||||||||||||||||
| Fourth quarter | 2,000,000 | 1,000,000 | $ | 51.70 | $ | 50.26 | $ | 104 | $ | 50 | ||||||||||||||
| Full year | 15,998,000 | 19,778,400 | $ | 52.42 | $ | 51.10 | $ | 839 | $ | 1,011 | ||||||||||||||
Contingent Liabilities and Contractual Obligations
Contractual obligations are summarized in the Company’s 2006 annual MD&A and contingent liabilities are disclosed in Note 25 of the 2006 annual Consolidated Financial Statements. Total contractual obligations at December 31, 2007 were $30.6 billion. During the fourth quarter of 2007, total contractual obligations increased by approximately $4.4 billion due to increased Downstream product purchase obligations.
- 22 -
MANAGEMENT'S DISCUSSION AND ANALYSIS
PETRO-CANADA
Off Balance Sheet
The Company has certain retail licensee agreements that qualify as variable interest entities as described in Note 26 to the 2006 annual Consolidated Financial Statements. These entities were not consolidated as Petro-Canada is not the primary beneficiary and the Company’s maximum exposure to losses from these arrangements was not expected to be material.
RISK
Derivative Contracts
As part of its acquisition of an interest in the Buzzard field in the U.K. sector of the North Sea, Petro-Canada entered into a series of derivative contracts relating to the future sale of crude oil based on Dated Brent crude oil prices. As a result of the increase in Dated Brent crude oil prices, partially offset by the strengthening of the Canadian dollar relative to the U.S. dollar in the fourth quarter of 2007, compared with the third quarter of 2007, the losses associated with these derivative contracts were $226 million after-tax in the fourth quarter of 2007. This compares with a loss of $33 million after-tax in the fourth quarter of 2006.
During the fourth quarter of 2007, the Company entered into contracts to close out the hedged portion of its Buzzard production from January 1, 2008 to December 31, 2010. Under the terms of the contracts, the Company repurchased 30,688,000 bbls of Dated Brent crude oil at an average price of approximately $85.79 US/bbl, resulting in a reduction in cash flow of $1,145 million after-tax.
As at December 31, 2007, there were no other material changes in the Company’s risks or risk management activities since December 31, 2006. Petro-Canada’s risk management activities are conducted in accordance with the policies and guidelines established by the Board of Directors. Readers should refer to Petro-Canada’s 2006 AIF and the risk management section of the 2006 annual MD&A.
SHAREHOLDER INFORMATION
As at December 31, 2007, Petro-Canada’s outstanding common shares totalled 483.5 million and averaged 484.6 million during the fourth quarter of 2007. This figure compared with outstanding common shares of 497.5 million as at December 31, 2006 and average shares outstanding of 497.9 million for the quarter ended December 31, 2006.
Petro-Canada will hold a conference call to discuss these results with investors on Thursday, January 31, 2008 at 9:00 a.m. eastern standard time (EST). To participate, please call 1-866-898-9626 (toll-free in North America), 00-800-8989-6323 (toll-free internationally), or 416-340-2216 at 8:55 a.m. EST. Media are invited to listen to the call by dialing 1-866-540-8136 (toll-free in North America) or 416-340-8010. Media are invited to ask questions at the end of the call. A live audio broadcast of the conference call will be available on Petro-Canada's website at http://www.petro-canada.ca/en/investors/845.aspx on January 31, 2008 at 9:00 a.m. EST. Those who are unable to listen to the call live may listen to a recording of the call approximately one hour after its completion by dialing 1-800-408-3053 (toll-free in North America) or 416-695-5800 (pass code number 3246676#). Approximately one hour after the call, a recording will be available on Petro-Canada’s website.
- 23 -
MANAGEMENT'S DISCUSSION AND ANALYSIS
PETRO-CANADA
SELECT UPSTREAM OPERATING DATA
December 31, 2007
Three months ended December 31, | Year ended December 31, | |||||||||||||||
| 2007 | 2006 | 2007 | 2006 | |||||||||||||
Before Royalties | ||||||||||||||||
Crude oil and NGL production net (Mb/d) | ||||||||||||||||
North American Natural Gas (1) | 12.5 | 13.8 | 12.5 | 14.2 | ||||||||||||
| Oil Sands | 51.7 | 58.2 | 56.9 | 52.2 | ||||||||||||
| International & Offshore | ||||||||||||||||
| East Coast Canada | 87.4 | 84.7 | 98.7 | 72.7 | ||||||||||||
| International | ||||||||||||||||
| North Sea | 88.4 | 40.7 | 81.3 | 33.2 | ||||||||||||
Other International (2) | 49.0 | 47.6 | 47.7 | 49.4 | ||||||||||||
| 289.0 | 245.0 | 297.1 | 221.7 | |||||||||||||
Natural gas production net, excluding injectants (MMcf/d) | ||||||||||||||||
North American Natural Gas (1) | 594 | 615 | 599 | 616 | ||||||||||||
| International | ||||||||||||||||
| North Sea | 59 | 59 | 58 | 63 | ||||||||||||
Other International (2) | 72 | 65 | 71 | 63 | ||||||||||||
| 725 | 739 | 728 | 742 | |||||||||||||
Total production from continuing operations (Mboe/d) net before royalties (3) | 410 | 368 | 418 | 345 | ||||||||||||
| Discontinued operations | ||||||||||||||||
Crude oil and NGL production net (Mb/d) | – | – | – | 5.2 | ||||||||||||
Natural gas production net, excluding injectants (MMcf/d) | – | – | – | 2 | ||||||||||||
Total production from discontinued operations (Mboe/d) net before royalties (3) | – | – | – | 6 | ||||||||||||
Total production (Mboe/d) net before royalties (3) | 410 | 368 | 418 | 351 | ||||||||||||
After Royalties | ||||||||||||||||
Crude oil and NGL production net (Mb/d) | ||||||||||||||||
North American Natural Gas (1) | 9.5 | 10.3 | 9.5 | 10.8 | ||||||||||||
| Oil Sands | 45.3 | 56.2 | 51.2 | 48.8 | ||||||||||||
| International & Offshore | ||||||||||||||||
| East Coast Canada | 72.8 | 82.2 | 84.4 | 68.5 | ||||||||||||
| International | ||||||||||||||||
| North Sea | 88.4 | 40.7 | 81.3 | 33.2 | ||||||||||||
Other International (2) | 45.2 | 43.0 | 43.4 | 44.7 | ||||||||||||
| 261.2 | 232.4 | 269.8 | 206.0 | |||||||||||||
Natural gas production net, excluding injectants (MMcf/d) | ||||||||||||||||
North American Natural Gas (1) | 462 | 481 | 471 | 489 | ||||||||||||
| International | ||||||||||||||||
| North Sea | 59 | 59 | 58 | 63 | ||||||||||||
Other International (2) | 45 | 32 | 41 | 32 | ||||||||||||
| 566 | 572 | 570 | 584 | |||||||||||||
Total production from continuing operations (Mboe/d) net after royalties (3) | 356 | 328 | 365 | 303 | ||||||||||||
| Discontinued operations | ||||||||||||||||
Crude oil and NGL production net (Mb/d) | – | – | – | 1.4 | ||||||||||||
Natural gas production net, excluding injectants (MMcf/d) | – | – | – | – | ||||||||||||
Total production from discontinued operations (Mboe/d) net after royalties (3) | – | – | – | 1 | ||||||||||||
Total production (Mboe/d) net after royalties (3) | 356 | 328 | 365 | 304 | ||||||||||||
| (1) | North American Natural Gas included Western Canada and U.S. Rockies. |
| (2) | Other International excluded production relating to the mature Syrian producing assets, which were sold in January 2006 and reported as discontinued operations. |
| (3) | Natural gas converted at six Mcf of natural gas to one bbl of oil. |
- 24 -
MANAGEMENT'S DISCUSSION AND ANALYSIS
PETRO-CANADA
AVERAGE UPSTREAM PRICE REALIZED
December 31, 2007
Three months ended December 31, | Year ended December 31, | |||||||||||||||
| 2007 | 2006 | 2007 | 2006 | |||||||||||||
Crude oil and NGL ($/bbl) | ||||||||||||||||
North American Natural Gas (1) | 77.54 | 58.02 | 67.37 | 64.87 | ||||||||||||
| Oil Sands | 70.48 | 49.46 | 61.02 | 54.60 | ||||||||||||
| International & Offshore | ||||||||||||||||
| East Coast Canada | 86.45 | 66.32 | 75.87 | 71.12 | ||||||||||||
| International | ||||||||||||||||
North Sea (2) | 83.71 | 68.63 | 75.12 | 72.67 | ||||||||||||
| Other International | 88.53 | 67.15 | 77.26 | 72.70 | ||||||||||||
| Total crude oil and NGL from continuing operations | 82.71 | 62.37 | 72.66 | 67.38 | ||||||||||||
| Discontinued operations | – | – | – | 71.84 | ||||||||||||
| Total crude oil and NGL | 82.71 | 62.37 | 72.66 | 67.48 | ||||||||||||
Natural gas ($/Mcf) | ||||||||||||||||
North American Natural Gas (1) | 5.78 | 6.52 | 6.30 | 6.85 | ||||||||||||
| International | ||||||||||||||||
| North Sea | 8.63 | 8.61 | 7.94 | 8.91 | ||||||||||||
| Other International | 3.65 | 4.70 | 4.34 | 5.13 | ||||||||||||
| Total natural gas from continuing operations | 5.88 | 6.61 | 6.32 | 6.96 | ||||||||||||
| Discontinued operations | – | – | – | 7.94 | ||||||||||||
| Total natural gas | 5.88 | 6.61 | 6.32 | 6.96 | ||||||||||||
| (1) | North American Natural Gas included Western Canada and the U.S. Rockies. |
| (2) | North Sea average realized prices do not include the impact of the derivative contracts associated with the Company’s acquisition of an interest in the Buzzard field. If you include the impact of the derivative contracts associated with Buzzard, the average realized price for North Sea crude oil and NGL would be $64.02/bbl and $65.32/bbl for the three months and year ended December 31, 2007, respectively. |
EFFECTIVE ROYALTY RATES
December 31, 2007
Three months ended December 31, | Year ended December 31, | |||||||||||||||
| (% of sales revenues) | 2007 | 2006 | 2007 | 2006 | ||||||||||||
| North American Natural Gas | 22 | % | 22 | % | 22 | % | 21 | % | ||||||||
| Oil Sands | 12 | % | 3 | % | 10 | % | 6 | % | ||||||||
| International & Offshore | ||||||||||||||||
| East Coast Canada | 17 | % | 3 | % | 15 | % | 6 | % | ||||||||
| International | ||||||||||||||||
| North Sea | – | – | – | – | ||||||||||||
| Other International | 14 | % | 17 | % | 16 | % | 17 | % | ||||||||
| Total continuing operations | 13 | % | 11 | % | 13 | % | 12 | % | ||||||||
| Discontinued operations | – | – | – | 74 | % | |||||||||||
| Total | 13 | % | 11 | % | 13 | % | 13 | % | ||||||||
- 25 -
MANAGEMENT'S DISCUSSION AND ANALYSIS
PETRO-CANADA
SELECT DOWNSTREAM OPERATING DATA
December 31, 2007
Three months ended December 31, | Year ended December 31, | |||||||||||||||
| 2007 | 2006 | 2007 | 2006 | |||||||||||||
Petroleum product sales (thousands of cubic metres/day – m3/d) | ||||||||||||||||
| Gasoline | ||||||||||||||||
Eastern Canada | 13.7 | 13.4 | 13.8 | 13.5 | ||||||||||||
Western Canada | 9.9 | 10.2 | 10.3 | 10.7 | ||||||||||||
| 23.6 | 23.6 | 24.1 | 24.2 | |||||||||||||
| Distillates | ||||||||||||||||
Eastern Canada | 9.4 | 8.6 | 8.8 | 8.7 | ||||||||||||
Western Canada | 11.4 | 12.0 | 11.1 | 10.9 | ||||||||||||
| 20.8 | 20.6 | 19.9 | 19.6 | |||||||||||||
| Other, including petrochemicals | 10.1 | 9.7 | 9.3 | 8.7 | ||||||||||||
| Total petroleum product sales | 54.5 | 53.9 | 53.3 | 52.5 | ||||||||||||
Crude oil processed by Petro-Canada (thousands of m3/d) | ||||||||||||||||
Eastern Canada | 19.4 | 18.7 | 19.7 | 18.9 | ||||||||||||
Western Canada | 20.7 | 19.5 | 20.4 | 18.9 | ||||||||||||
| Total crude oil processed by Petro-Canada | 40.1 | 38.2 | 40.1 | 37.8 | ||||||||||||
Average refinery utilization (%) | 99 | 94 | 99 | 93 | ||||||||||||
Downstream net earnings after-tax (cents/litre) | 1.6 | 1.7 | 3.2 | 2.5 | ||||||||||||
AVERAGE DOWNSTREAM PRICES
December 31, 2007
Three months ended December 31, | Year ended December 31, | |||||||||||||||
| 2007 | 2006 | 2007 | 2006 | |||||||||||||
Rack prices (Canadian cents per litre) | ||||||||||||||||
| Gasoline | ||||||||||||||||
Eastern Canada | 65.43 | 52.33 | 63.68 | 59.49 | ||||||||||||
Western Canada | 63.50 | 54.41 | 65.10 | 61.72 | ||||||||||||
| Distillate | ||||||||||||||||
Eastern Canada | 58.95 | 58.19 | 64.84 | 64.21 | ||||||||||||
Western Canada | 75.05 | 72.15 | 68.76 | 67.01 | ||||||||||||
Pump prices (Canadian cents per litre, excluding taxes) | ||||||||||||||||
| Gasoline | ||||||||||||||||
Eastern Canada | 70.82 | 54.19 | 68.62 | 62.07 | ||||||||||||
Western Canada | 72.93 | 64.47 | 75.25 | 70.75 | ||||||||||||
- 26 -
MANAGEMENT'S DISCUSSION AND ANALYSIS
PETRO-CANADA
SHARE INFORMATION
December 31, 2007
Three months ended December 31, | Year ended December 31, | |||||||||||||||
| 2007 | 2006 | 2007 | 2006 | |||||||||||||
Weighted-average common shares outstanding (millions) | 484.6 | 497.9 | 489.0 | 503.9 | ||||||||||||
Weighted-average diluted common shares outstanding (millions) | 489.2 | 503.4 | 494.0 | 509.9 | ||||||||||||
Net earnings – basic ($/share) | 1.08 | 0.77 | 5.59 | 3.45 | ||||||||||||
– diluted ($/share) | 1.07 | 0.76 | 5.53 | 3.41 | ||||||||||||
Cash flow from (used in) continuing operating activities ($/share) | (1.24 | ) | 1.94 | 6.83 | 7.16 | |||||||||||
Dividends ($/share) | 0.13 | 0.10 | 0.52 | 0.40 | ||||||||||||
| Toronto Stock Exchange: | ||||||||||||||||
Share price (1) – High | 56.60 | 51.70 | 61.25 | 58.59 | ||||||||||||
– Low | 48.30 | 41.91 | 41.02 | 41.91 | ||||||||||||
– Close at December 31 | 53.25 | 47.75 | 53.25 | 47.75 | ||||||||||||
Shares traded (millions) | 133.0 | 108.7 | 532.3 | 484.3 | ||||||||||||
| New York Stock Exchange: | ||||||||||||||||
Share price (2) – High | 59.87 | 45.48 | 59.87 | 51.11 | ||||||||||||
– Low | 48.03 | 37.37 | 34.91 | 37.37 | ||||||||||||
– Close at December 31 | 53.62 | 41.04 | 53.62 | 41.04 | ||||||||||||
Shares traded (millions) | 64.4 | 34.2 | 194.0 | 138.5 | ||||||||||||
| (1) | Share price is in Canadian dollars and represents the closing price. |
| (2) | Share price is in U.S. dollars and represents the closing price. |
SELECT FINANCIAL DATA
December 31, 2007
(unaudited, millions of Canadian dollars)
Three months ended December 31, | Year ended December 31, | |||||||||||||||
| 2007 | 2006 | 2007 | 2006 | |||||||||||||
| Net earnings (loss) | ||||||||||||||||
| Upstream | ||||||||||||||||
| North American Natural Gas | $ | (57 | ) | $ | 91 | $ | 191 | $ | 405 | |||||||
| Oil Sands | 129 | 55 | 316 | 245 | ||||||||||||
| International & Offshore | ||||||||||||||||
| East Coast Canada | 346 | 261 | 1,229 | 934 | ||||||||||||
| International | (30 | ) | (1 | ) | 374 | (206 | ) | |||||||||
| Downstream | 81 | 83 | 629 | 473 | ||||||||||||
| Shared Services | 53 | (105 | ) | (6 | ) | (263 | ) | |||||||||
| Discontinued operations | – | – | – | 152 | ||||||||||||
| Net earnings | $ | 522 | $ | 384 | $ | 2,733 | $ | 1,740 | ||||||||
| Cash flow from (used in) continuing operating activities | $ | (602 | ) | $ | 964 | $ | 3,339 | $ | 3,608 | |||||||
Average capital employed (1) | ||||||||||||||||
| Upstream | $ | 8,943 | $ | 8,346 | ||||||||||||
| Downstream | 5,136 | 4,170 | ||||||||||||||
| Shared Services | 249 | 352 | ||||||||||||||
| Total Company | $ | 14,328 | $ | 12,868 | ||||||||||||
Return on capital employed (1) (%) | ||||||||||||||||
| Upstream | 23.6 | 18.3 | ||||||||||||||
| Downstream | 12.2 | 11.3 | ||||||||||||||
| Total Company | 19.8 | 14.3 | ||||||||||||||
Return on equity (1) (%) | 24.5 | 17.5 | ||||||||||||||
| Debt | $ | 3,450 | $ | 2,894 | ||||||||||||
Cash and cash equivalents (1) | $ | 231 | $ | 499 | ||||||||||||
Debt-to-cash flow from continuing operating activities (times) | 1.0 | 0.8 | ||||||||||||||
Debt-to-debt plus equity (%) | 22.5 | 21.7 | ||||||||||||||
| (1) | Includes discontinued operations. |
- 27 -
PETRO-CANADA
CONSOLIDATED STATEMENT OF EARNINGS (unaudited)
For the periods ended December 31
(millions of Canadian dollars, except per share amounts)
Three months ended December 31, | Year ended December 31, | |||||||||||||||
| 2007 | 2006 | 2007 | 2006 | |||||||||||||
| Revenue | ||||||||||||||||
| Operating | $ | 5,765 | $ | 4,595 | $ | 21,710 | $ | 18,911 | ||||||||
Investment and other income (expense) (Note 5) | (331 | ) | (45 | ) | (460 | ) | (242 | ) | ||||||||
| 5,434 | 4,550 | 21,250 | 18,669 | |||||||||||||
| Expenses | ||||||||||||||||
| Crude oil and product purchases | 2,899 | 2,226 | 10,291 | 9,649 | ||||||||||||
| Operating, marketing and general | 820 | 835 | 3,552 | 3,180 | ||||||||||||
| Exploration | 183 | 107 | 490 | 339 | ||||||||||||
Depreciation, depletion and amortization (Note 6) | 636 | 407 | 2,091 | 1,365 | ||||||||||||
Unrealized (gain) loss on translation of foreign currency denominated long-term debt | (12 | ) | 69 | (246 | ) | (1 | ) | |||||||||
| Interest | 43 | 37 | 165 | 165 | ||||||||||||
| 4,569 | 3,681 | 16,343 | 14,697 | |||||||||||||
| Earnings from continuing operations before income taxes | 865 | 869 | 4,907 | 3,972 | ||||||||||||
Provision for income taxes (Note 7) | ||||||||||||||||
| Current | 93 | 455 | 1,797 | 2,073 | ||||||||||||
| Future | 250 | 30 | 377 | 311 | ||||||||||||
| 343 | 485 | 2,174 | 2,384 | |||||||||||||
| Net earnings from continuing operations | 522 | 384 | 2,733 | 1,588 | ||||||||||||
Net earnings from discontinued operations (Note 4) | - | - | - | 152 | ||||||||||||
| Net earnings | $ | 522 | $ | 384 | $ | 2,733 | $ | 1,740 | ||||||||
Earnings per share from continuing operations (Note 8) | ||||||||||||||||
| Basic | $ | 1.08 | $ | 0.77 | $ | 5.59 | $ | 3.15 | ||||||||
| Diluted | $ | 1.07 | $ | 0.76 | $ | 5.53 | $ | 3.11 | ||||||||
Earnings per share (Note 8) | ||||||||||||||||
| Basic | $ | 1.08 | $ | 0.77 | $ | 5.59 | $ | 3.45 | ||||||||
| Diluted | $ | 1.07 | $ | 0.76 | $ | 5.53 | $ | 3.41 | ||||||||
CONSOLIDATED STATEMENT OF COMPREHENSIVE INCOME (unaudited) (Note 3)
For the periods ended December 31
(millions of Canadian dollars)
Three months ended December 31, | Year ended December 31, | |||||||||||||||
| 2007 | 2006 | 2007 | 2006 | |||||||||||||
| Net earnings | $ | 522 | $ | 384 | $ | 2,733 | $ | 1,740 | ||||||||
| Other comprehensive income, net of tax | ||||||||||||||||
| Change in foreign currency translation adjustment | (4 | ) | 240 | (260 | ) | 363 | ||||||||||
| Comprehensive income | $ | 518 | $ | 624 | $ | 2,473 | $ | 2,103 | ||||||||
| See accompanying Notes to Consolidated Financial Statements |
- 28 -
PETRO-CANADA
CONSOLIDATED STATEMENT OF CASH FLOWS (unaudited)
For the periods ended December 31
(millions of Canadian dollars)
Three months ended December 31, | Year ended December 31, | |||||||||||||||
| 2007 | 2006 | 2007 | 2006 | |||||||||||||
| Operating activities | ||||||||||||||||
| Net earnings | $ | 522 | $ | 384 | $ | 2,733 | $ | 1,740 | ||||||||
| Less: Net earnings from discontinued operations | - | - | - | 152 | ||||||||||||
| Net earnings from continuing operations | 522 | 384 | 2,733 | 1,588 | ||||||||||||
| Items not affecting cash flow from continuing operating activities: | ||||||||||||||||
Depreciation, depletion and amortization (Note 6) | 636 | 407 | 2,091 | 1,365 | ||||||||||||
| Future income taxes | 250 | 30 | 377 | 311 | ||||||||||||
| Accretion of asset retirement obligations | 20 | 13 | 70 | 54 | ||||||||||||
Unrealized (gain) loss on translation of foreign currency denominated long-term debt | (12 | ) | 69 | (246 | ) | (1 | ) | |||||||||
Gain on sale of assets (Note 5) | (3 | ) | (6 | ) | (81 | ) | (30 | ) | ||||||||
Unrealized loss associated with the Buzzard derivative contracts (Note 14) | - | 49 | - | 259 | ||||||||||||
Settlement of Buzzard derivative contracts (Note 14) | (1,502 | ) | - | (1,481 | ) | - | ||||||||||
| Other | (1 | ) | (5 | ) | 9 | 18 | ||||||||||
| Exploration expenses | 107 | 50 | 290 | 123 | ||||||||||||
Increase in non-cash working capital related to continuing operating activities | (619 | ) | (27 | ) | (423 | ) | (79 | ) | ||||||||
| Cash flow from (used in) continuing operating activities | (602 | ) | 964 | 3,339 | 3,608 | |||||||||||
Cash flow from discontinued operating activities (Note 4) | - | - | - | 15 | ||||||||||||
| Cash flow from (used in) operating activities | (602 | ) | 964 | 3,339 | 3,623 | |||||||||||
| Investing activities | ||||||||||||||||
Expenditures on property, plant and equipment and exploration (Note 9) | (1,585 | ) | (1,156 | ) | (3,988 | ) | (3,435 | ) | ||||||||
Proceeds from sale of assets (Note 4) | 6 | 13 | 183 | 688 | ||||||||||||
| Increase in other assets | (16 | ) | (9 | ) | (121 | ) | (50 | ) | ||||||||
| Decrease in non-cash working capital related to investing activities | 398 | 102 | 279 | 59 | ||||||||||||
| Cash flow used in investing activities | (1,197 | ) | (1,050 | ) | (3,647 | ) | (2,738 | ) | ||||||||
| Financing activities | ||||||||||||||||
Increase in short-term notes payable (Note 10) | 109 | - | 109 | - | ||||||||||||
Proceeds from issue of long-term debt (Note 10) | 995 | - | 995 | - | ||||||||||||
Repayment of long-term debt (Note 10) | (1 | ) | (2 | ) | (7 | ) | (7 | ) | ||||||||
Proceeds from issue of common shares (Note 11) | 4 | 7 | 37 | 44 | ||||||||||||
Purchase of common shares (Note 11) | (104 | ) | (50 | ) | (839 | ) | (1,011 | ) | ||||||||
| Dividends on common shares | (63 | ) | (50 | ) | (255 | ) | (201 | ) | ||||||||
| Cash flow from (used in) financing activities | 940 | (95 | ) | 40 | (1,175 | ) | ||||||||||
| Decrease in cash and cash equivalents | (859 | ) | (181 | ) | (268 | ) | (290 | ) | ||||||||
| Cash and cash equivalents at beginning of period | 1,090 | 680 | 499 | 789 | ||||||||||||
| Cash and cash equivalents at end of period | $ | 231 | $ | 499 | $ | 231 | $ | 499 | ||||||||
See accompanying Notes to Consolidated Financial Statements
- 29 -
PETRO-CANADA
CONSOLIDATED BALANCE SHEET (unaudited)
As at December 31, 2007
(millions of Canadian dollars)
December 31, 2007 | December 31, 2006 | |||||||
| Assets | ||||||||
| Current assets | ||||||||
| Cash and cash equivalents | $ | 231 | $ | 499 | ||||
| Accounts receivable | 1,973 | 1,600 | ||||||
| Income taxes receivable | 280 | - | ||||||
| Inventories | 668 | 632 | ||||||
| Future income taxes | 26 | 95 | ||||||
| 3,178 | 2,826 | |||||||
Property, plant and equipment, net (Notes 6 and 9) | 19,497 | 18,577 | ||||||
| Goodwill | 731 | 801 | ||||||
Other assets (Note 3) | 446 | 442 | ||||||
| $ | 23,852 | $ | 22,646 | |||||
| Liabilities and shareholders' equity | ||||||||
| Current liabilities | ||||||||
Accounts payable and accrued liabilities (Note 14) | $ | 3,512 | $ | 3,319 | ||||
| Income taxes payable | - | 22 | ||||||
Short-term notes payable (Note 10) | 109 | - | ||||||
Current portion of long-term debt (Note 10) | 2 | 7 | ||||||
| 3,623 | 3,348 | |||||||
Long-term debt (Notes 3 and 10) | 3,339 | 2,887 | ||||||
Other liabilities (Notes 9 and 14) | 717 | 1,826 | ||||||
| Asset retirement obligations | 1,234 | 1,170 | ||||||
| Future income taxes | 3,069 | 2,974 | ||||||
| Shareholders' equity | ||||||||
Common shares (Note 11) | 1,365 | 1,366 | ||||||
Contributed surplus (Note 11) | 24 | 469 | ||||||
| Retained earnings | 10,692 | 8,557 | ||||||
Accumulated other comprehensive income (Note 3) | ||||||||
| Foreign currency translation adjustment | (211 | ) | 49 | |||||
| 11,870 | 10,441 | |||||||
| $ | 23,852 | $ | 22,646 | |||||
CONSOLIDATED STATEMENT OF RETAINED EARNINGS (unaudited)
For the periods ended December 31
(millions of Canadian dollars)
Three months ended December 31, | Year ended December 31, | |||||||||||||||
| 2007 | 2006 | 2007 | 2006 | |||||||||||||
| Retained earnings at beginning of period | $ | 10,330 | $ | 8,223 | $ | 8,557 | $ | 7,018 | ||||||||
Cumulative effect of adopting new accounting standards (Note 3) | - | - | 8 | - | ||||||||||||
| Net earnings | 522 | 384 | 2,733 | 1,740 | ||||||||||||
| Dividends on common shares | (63 | ) | (50 | ) | (255 | ) | (201 | ) | ||||||||
Excess cost for normal course issuer bid (Note 11) | (97 | ) | - | (351 | ) | - | ||||||||||
| Retained earnings at end of period | $ | 10,692 | $ | 8,557 | $ | 10,692 | $ | 8,557 | ||||||||
See accompanying Notes to Consolidated Financial Statements
- 30 -
PETRO-CANADA
NOTES TO CONSOLIDATED FINANCIAL STATEMENTS (unaudited)
(millions of Canadian dollars)
1. SEGMENTED INFORMATION FROM CONTINUING OPERATIONS
Three months ended December 31,
| Upstream | ||||||||||||||||||||||||||||||||||||||||||||||||||||||||
| International & Offshore | ||||||||||||||||||||||||||||||||||||||||||||||||||||||||
North American Natural Gas | Oil Sands | East Coast Canada | International | Downstream | Shared Services | Consolidated | ||||||||||||||||||||||||||||||||||||||||||||||||||
| 2007 | 2006 | 2007 | 2006 | 2007 | 2006 | 2007 | 2006 | 2007 | 2006 | 2007 | 2006 | 2007 | 2006 | |||||||||||||||||||||||||||||||||||||||||||
| Revenue | ||||||||||||||||||||||||||||||||||||||||||||||||||||||||
| Sales to customers | $ | 331 | $ | 352 | $ | 153 | $ | 143 | $ | 656 | $ | 534 | $ | 1,043 | $ | 644 | $ | 3,582 | $ | 2,922 | $ | - | $ | - | $ | 5,765 | $ | 4,595 | ||||||||||||||||||||||||||||
Investment and other income (expense) (1) | - | 1 | 1 | - | (7 | ) | 1 | (386 | ) | (63 | ) | (5 | ) | 6 | 66 | 10 | (331 | ) | (45 | ) | ||||||||||||||||||||||||||||||||||||
| Inter-segment sales | 86 | 72 | 306 | 213 | 125 | 97 | - | - | 6 | 6 | - | - | - | - | ||||||||||||||||||||||||||||||||||||||||||
| Segmented revenue | 417 | 425 | 460 | 356 | 774 | 632 | 657 | 581 | 3,583 | 2,934 | 66 | 10 | 5,434 | 4,550 | ||||||||||||||||||||||||||||||||||||||||||
| Expenses | ||||||||||||||||||||||||||||||||||||||||||||||||||||||||
Crude oil and product purchases | 75 | 53 | 158 | 102 | 191 | 114 | - | - | 2,479 | 1,959 | (4 | ) | (2 | ) | 2,899 | 2,226 | ||||||||||||||||||||||||||||||||||||||||
Inter-segment transactions | 4 | 2 | 2 | (5 | ) | 2 | 3 | - | - | 515 | 388 | - | - | - | - | |||||||||||||||||||||||||||||||||||||||||
| Operating, marketing and general | 123 | 122 | 159 | 142 | 42 | 43 | 105 | 108 | 425 | 380 | (34 | ) | 40 | 820 | 835 | |||||||||||||||||||||||||||||||||||||||||
| Exploration | 70 | 38 | 3 | 4 | (1 | ) | 11 | 111 | 54 | - | - | - | - | 183 | 107 | |||||||||||||||||||||||||||||||||||||||||
Depreciation, depletion and amortization (Note 6) | 259 | 104 | 37 | 30 | 91 | 72 | 162 | 116 | 86 | 81 | 1 | 4 | 636 | 407 | ||||||||||||||||||||||||||||||||||||||||||
Unrealized (gain) loss on translation of foreign currency denominated long-term debt | - | - | - | - | - | - | - | - | - | - | (12 | ) | 69 | (12 | ) | 69 | ||||||||||||||||||||||||||||||||||||||||
| Interest | - | - | - | - | - | - | - | - | - | - | 43 | 37 | 43 | 37 | ||||||||||||||||||||||||||||||||||||||||||
| 531 | 319 | 359 | 273 | 325 | 243 | 378 | 278 | 3,505 | 2,808 | (6 | ) | 148 | 4,569 | 3,681 | ||||||||||||||||||||||||||||||||||||||||||
Earnings (loss) from continuing operations before income taxes | (114 | ) | 106 | 101 | 83 | 449 | 389 | 279 | 303 | 78 | 126 | 72 | (138 | ) | 865 | 869 | ||||||||||||||||||||||||||||||||||||||||
Provision for income taxes (Note 7) | ||||||||||||||||||||||||||||||||||||||||||||||||||||||||
| Current | 26 | 101 | (8 | ) | (46 | ) | 165 | 88 | (157 | ) | 300 | 75 | 22 | (8 | ) | (10 | ) | 93 | 455 | |||||||||||||||||||||||||||||||||||||
| Future | (83 | ) | (86 | ) | (20 | ) | 74 | (62 | ) | 40 | 466 | 4 | (78 | ) | 21 | 27 | (23 | ) | 250 | 30 | ||||||||||||||||||||||||||||||||||||
| (57 | ) | 15 | (28 | ) | 28 | 103 | 128 | 309 | 304 | (3 | ) | 43 | 19 | (33 | ) | 343 | 485 | |||||||||||||||||||||||||||||||||||||||
Net earnings (loss) from continuing operations | $ | (57 | ) | $ | 91 | $ | 129 | $ | 55 | $ | 346 | $ | 261 | $ | (30 | ) | $ | (1 | ) | $ | 81 | $ | 83 | $ | 53 | $ | (105 | ) | $ | 522 | $ | 384 | ||||||||||||||||||||||||
Expenditures on property, plant and equipment and exploration from continuing operations (Note 9)(2) | $ | 369 | $ | 303 | $ | 482 | $ | 89 | $ | 33 | $ | 68 | $ | 224 | $ | 293 | $ | 468 | $ | 394 | $ | 9 | $ | 9 | $ | 1,585 | $ | 1,156 | ||||||||||||||||||||||||||||
Cash flow from (used in) continuing operating activities | $ | 164 | $ | 108 | $ | 107 | $ | 199 | $ | 261 | $ | 292 | $ | (868 | ) | $ | 171 | $ | 245 | $ | 314 | $ | (511 | ) | $ | (120 | ) | $ | (602 | ) | $ | 964 | ||||||||||||||||||||||||
Total assets from continuing operations | $ | 4,119 | $ | 4,151 | $ | 3,659 | $ | 2,885 | $ | 2,345 | $ | 2,465 | $ | 5,180 | $ | 6,031 | $ | 7,989 | $ | 6,649 | $ | 560 | $ | 465 | $ | 23,852 | $ | 22,646 | ||||||||||||||||||||||||||||
| (1) | Investment and other income (expense) for the International segment includes losses relating to the Buzzard derivative contracts of $383 million for the three months ended December 31, 2007 ($49 million for the three months ended December 31, 2006) (Notes 5 and 14). |
| (2) | Consolidated expenditures include capitalized interest in the amount of $9 million for the three months ended December 31, 2007 ($27 million for the three months ended December 31, 2006). |
- 31 -
PETRO-CANADA
NOTES TO CONSOLIDATED FINANCIAL STATEMENTS (unaudited)
(millions of Canadian dollars)
1. SEGMENTED INFORMATION FROM CONTINUING OPERATIONS (Note 4)
Year ended December 31,
| Upstream | ||||||||||||||||||||||||||||||||||||||||||||||||||||||||
| International & Offshore | ||||||||||||||||||||||||||||||||||||||||||||||||||||||||
North American Natural Gas | Oil Sands | East Coast Canada | International | Downstream | Shared Services | Consolidated | ||||||||||||||||||||||||||||||||||||||||||||||||||
| 2007 | 2006 | 2007 | 2006 | 2007 | 2006 | 2007 | 2006 | 2007 | 2006 | 2007 | 2006 | 2007 | 2006 | |||||||||||||||||||||||||||||||||||||||||||
| Revenue | ||||||||||||||||||||||||||||||||||||||||||||||||||||||||
| Sales to customers | $ | 1,347 | $ | 1,504 | $ | 611 | $ | 592 | $ | 2,708 | $ | 2,004 | $ | 3,697 | $ | 2,464 | $ | 13,347 | $ | 12,347 | $ | - | $ | - | $ | 21,710 | $ | 18,911 | ||||||||||||||||||||||||||||
Investment and other income (expense) (1) | 66 | 6 | (2 | ) | - | (18 | ) | - | (549 | ) | (283 | ) | (12 | ) | 19 | 55 | 16 | (460 | ) | (242 | ) | |||||||||||||||||||||||||||||||||||
| Inter-segment sales | 324 | 349 | 1,065 | 822 | 477 | 298 | - | - | 18 | 15 | - | - | - | - | ||||||||||||||||||||||||||||||||||||||||||
| Segmented revenue | 1,737 | 1,859 | 1,674 | 1,414 | 3,167 | 2,302 | 3,148 | 2,181 | 13,353 | 12,381 | 55 | 16 | 21,250 | 18,669 | ||||||||||||||||||||||||||||||||||||||||||
| Expenses | ||||||||||||||||||||||||||||||||||||||||||||||||||||||||
| Crude oil and product purchases | 240 | 256 | 524 | 425 | 736 | 452 | - | - | 8,787 | 8,517 | 4 | (1 | ) | 10,291 | �� | 9,649 | ||||||||||||||||||||||||||||||||||||||||
| Inter-segment transactions | 10 | 5 | 13 | 31 | 8 | 9 | - | - | 1,853 | 1,439 | - | - | ||||||||||||||||||||||||||||||||||||||||||||
| Operating, marketing and general | 491 | 462 | 595 | 508 | 228 | 245 | 526 | 350 | 1,525 | 1,495 | 187 | 120 | 3,552 | 3,180 | ||||||||||||||||||||||||||||||||||||||||||
| Exploration | 192 | 150 | 28 | 21 | 13 | 12 | 257 | 156 | - | - | - | - | 490 | 339 | ||||||||||||||||||||||||||||||||||||||||||
Depreciation, depletion and amortization (Note 6) | 584 | 402 | 149 | 128 | 410 | 237 | 640 | 323 | 299 | 262 | 9 | 13 | 2,091 | 1,365 | ||||||||||||||||||||||||||||||||||||||||||
Unrealized gain on translation of foreign currency denominated long-term debt | - | - | - | - | - | - | - | - | - | - | (246 | ) | (1 | ) | (246 | ) | (1 | ) | ||||||||||||||||||||||||||||||||||||||
| Interest | - | - | - | - | - | - | - | - | - | - | 165 | 165 | 165 | 165 | ||||||||||||||||||||||||||||||||||||||||||
| 1,517 | 1,275 | 1,309 | 1,113 | 1,395 | 955 | 1,423 | 829 | 12,464 | 11,713 | 119 | 296 | 16,343 | 14,697 | |||||||||||||||||||||||||||||||||||||||||||
Earnings (loss) from continuing operations before income taxes | 220 | 584 | 365 | 301 | 1,772 | 1,347 | 1,725 | 1,352 | 889 | 668 | (64 | ) | (280 | ) | 4,907 | 3,972 | ||||||||||||||||||||||||||||||||||||||||
Provision for income taxes (Note 7) | ||||||||||||||||||||||||||||||||||||||||||||||||||||||||
Current | 183 | 351 | (13 | ) | (53 | ) | 653 | 434 | 848 | 1,248 | 232 | 141 | (106 | ) | (48 | ) | 1,797 | 2,073 | ||||||||||||||||||||||||||||||||||||||
Future | (154 | ) | (172 | ) | 62 | 109 | (110 | ) | (21 | ) | 503 | 310 | 28 | 54 | 48 | 31 | 377 | 311 | ||||||||||||||||||||||||||||||||||||||
| 29 | 179 | 49 | 56 | 543 | 413 | 1,351 | 1,558 | 260 | 195 | (58 | ) | (17 | ) | 2,174 | 2,384 | |||||||||||||||||||||||||||||||||||||||||
Net earnings (loss) from continuing operations | $ | 191 | $ | 405 | $ | 316 | $ | 245 | $ | 1,229 | $ | 934 | $ | 374 | $ | (206 | ) | $ | 629 | $ | 473 | $ | (6 | ) | $ | (263 | ) | $ | 2,733 | $ | 1,588 | |||||||||||||||||||||||||
Expenditures on property, plant and equipment and exploration from continuing operations (Note 9)(2) | $ | 866 | $ | 788 | $ | 779 | $ | 377 | $ | 159 | $ | 256 | $ | 762 | $ | 760 | $ | 1,396 | $ | 1,229 | $ | 26 | $ | 24 | $ | 3,988 | $ | 3,434 | ||||||||||||||||||||||||||||
Cash flow from (used in) continuing operating activities | $ | 725 | $ | 651 | $ | 512 | $ | 499 | $ | 1,491 | $ | 1,129 | $ | 220 | $ | 840 | $ | 994 | $ | 835 | $ | (603 | ) | $ | (346 | ) | $ | 3,339 | $ | 3,608 | ||||||||||||||||||||||||||
Total assets from continuing operations | $ | 4,119 | $ | 4,151 | $ | 3,659 | $ | 2,885 | $ | 2,345 | $ | 2,465 | $ | 5,180 | $ | 6,031 | $ | 7,989 | $ | 6,649 | $ | 560 | $ | 465 | $ | 23,852 | $ | 22,646 | ||||||||||||||||||||||||||||
| (1) | Investment and other income (expense) for the International segment includes losses relating to the Buzzard derivative contracts of $535 million for the year ended December 31, 2007 ($259 million for the year ended December 31, 2006) (Notes 5 and 14). |
| (2) | Consolidated expenditures include capitalized interest in the amount of $30 million for the year ended December 31, 2007 ($51 million for the year ended December 31, 2006). |
- 32 -
PETRO-CANADA
NOTES TO CONSOLIDATED FINANCIAL STATEMENTS (unaudited)
(millions of Canadian dollars, unless otherwise stated)
| 2. | BASIS OF PRESENTATION |
The note disclosure requirements for annual financial statements provide additional disclosure to that required for interim financial statements. Accordingly, these interim Consolidated Financial Statements should be read in conjunction with the December 31, 2006 audited Consolidated Financial Statements. The interim Consolidated Financial Statements are presented in accordance with Canadian generally accepted accounting principles and follow the accounting policies summarized in the notes to the annual Consolidated Financial Statements, except for changes as described in Note 3.
| 3. | CHANGES IN ACCOUNTING POLICIES |
The Company adopted Canadian Institute of Chartered Accountants (CICA) Handbook Section 1506, Accounting Changes; Section 1530, Comprehensive Income; Section 3855, Financial Instruments – Recognition and Measurement; Section 3861, Financial Instruments – Presentation and Disclosure; Section 3865, Hedges; and Emerging Issues Committee (EIC) Abstract 160, Stripping Costs Incurred in the Production Phase of a Mining Operation, on January 1, 2007.
As a result of adopting CICA Section 1530, Comprehensive Income, a new Statement of Comprehensive Income forms part of the Company’s Consolidated Financial Statements. Gains and losses from the translation into Canadian dollars of assets and liabilities, including associated long-term debt, of the Company’s self-sustaining foreign operations are now presented as a separate component of other comprehensive income (loss) in the Consolidated Statement of Comprehensive Income. Accumulated other comprehensive income (loss) is presented as a separate component of shareholders’ equity in the Consolidated Balance Sheet. Previously, these gains and losses were deferred and included in the foreign currency translation adjustment as part of shareholders’ equity.
As a result of adopting CICA Section 3855, Financial Instruments – Recognition and Measurement, long-term debt is measured at fair value when initially recognized and, after initial recognition, at amortized cost using the effective interest method. Transaction costs and premiums or discounts directly attributable to the issuance of long-term debt are now added to the fair value on initial recognition. Previously, these amounts were deferred and amortized using the straight line method over the term of the debt. Unamortized amounts were separately presented in other assets on the Consolidated Balance Sheet. In accordance with the transitional provisions, prior periods have not been restated as a result of adopting this new accounting standard. To recognize the cumulative prior period effect, the following balance sheet categories were impacted on January 1, 2007:
| Increase (Decrease) | ||||
| Other assets | $ | (101 | ) | |
| Long-term debt | (112 | ) | ||
| Future income taxes liability | 3 | |||
| Retained earnings | 8 | |||
There is no other material impact on the Consolidated Financial Statements from adoption of these new standards.
| 4. | DISCONTINUED OPERATIONS |
On January 31, 2006, the Company completed the sale of its mature producing assets in Syria for net proceeds of $640 million, resulting in a gain on sale of $134 million.
The accounting for discontinued operations results in a reduction of the Consolidated Statement of Earnings balances as follows:
Three months ended December 31, | Year ended December 31, | |||||||||||||||
| 2007 | 2006 | 2007 | 2006 | |||||||||||||
Revenue (1) | $ | - | $ | - | $ | - | $ | 168 | ||||||||
| Expenses | ||||||||||||||||
| Operating, marketing and general | - | - | - | 6 | ||||||||||||
| Earnings from discontinued operations before income taxes | - | - | - | 162 | ||||||||||||
| Provision for income taxes | - | - | - | 10 | ||||||||||||
| Net earnings from discontinued operations | $ | - | $ | - | $ | - | $ | 152 | ||||||||
(1) Revenue includes the gain on sale of $134 million.
- 33 -
PETRO-CANADA
NOTES TO CONSOLIDATED FINANCIAL STATEMENTS (unaudited)
(millions of Canadian dollars, unless otherwise stated)
| 5. | INVESTMENT AND OTHER INCOME (EXPENSE) |
Investment and other income (expense) includes net losses on the Buzzard derivative contracts (Note 14) of $383 million and $535 million for the three months and year ended December 31, 2007, respectively ($49 million and $259 million for the three months and year ended December 31, 2006); and net gains on sales of assets of $3 million and $81 million for the three months and year ended December 31, 2007, respectively ($6 million and $30 million for the three months and year ended December 31, 2006).
| 6. | ASSET WRITE-DOWNS |
During the three months ended December 31, 2007, the Company recognized a $150 million ($97 million after-tax) impairment expense due to a write-down of its coal bed methane assets in the U.S. Rockies’ Powder River Basin. The assets have been written down to management’s best estimate of fair value based on a discounted future cash flow valuation. These assets form part of the Company’s North American Natural Gas business segment. The impairment expense is included in Depreciation, Depletion and Amortization in the Consolidated Statement of Earnings.
| 7. | INCOME TAXES |
The provisions for current and future income taxes include tax recoveries (expenses) which are largely due to reductions in the Canadian federal and provincial income tax rates. These amounts have been allocated to the business segments as follows:
Three months ended December 31, | Year ended December 31, | |||||||||||||||
| 2007 | 2006 | 2007 | 2006 | |||||||||||||
| North American Natural Gas | $ | 7 | $ | - | $ | 8 | $ | 6 | ||||||||
| Oil Sands | 55 | - | 62 | 44 | ||||||||||||
| East Coast Canada | 47 | - | 52 | 37 | ||||||||||||
International (1) | - | - | 30 | (242 | ) | |||||||||||
| Downstream | 28 | - | 34 | 41 | ||||||||||||
Shared Services (2) | 6 | - | 5 | (71 | ) | |||||||||||
| $ | 143 | $ | - | $ | 191 | $ | (185 | ) | ||||||||
| (1) | Included in the International’s $nil and $30 million income tax recoveries for the three months and year ended December 31, 2007, respectively is a $6 million and $36 million reduction in the future income tax provision due to increases in the U.K. supplemental corporate income tax rate and the resulting impact of qualifying capital expenditures being deducted at the increased rate. International’s $242 million tax expense for year ended December 31, 2006 relates to an increase in the provision for future income taxes due to the increase in the U.K. supplemental corporate income tax rate. |
| (2) | Included in the Shared Services’ $71 million tax expense for the year ended December 31, 2006, is a $70 million increase in the provision for current income taxes due to the Quebec government enacting retroactive tax legislation. |
| 8. | EARNINGS PER SHARE |
The following table provides the number of common shares used in calculating earnings per share amounts:
Three months ended December 31, | Year ended December 31, | |||||||||||||||
| (millions) | 2007 | 2006 | 2007 | 2006 | ||||||||||||
Weighted-average number of common shares outstanding - basic | 484.6 | 497.9 | 489.0 | 503.9 | ||||||||||||
| Effect of dilutive stock options | 4.6 | 5.5 | 5.0 | 6.0 | ||||||||||||
Weighted-average number of common shares outstanding - diluted | 489.2 | 503.4 | 494.0 | 509.9 | ||||||||||||
- 34 -
PETRO-CANADA
NOTES TO CONSOLIDATED FINANCIAL STATEMENTS (unaudited)
(millions of Canadian dollars, unless otherwise stated)
| 9. | FORT HILLS OIL SANDS MINING PROJECT |
On November 23, 2007, the Company finalized an agreement to acquire an additional 5% working interest in the Fort Hills oil sands project, bringing the Company’s total working interest to 60%. To pay for this incremental investment, the Company will fund an additional $375 million of expenditures in excess of its working interest. The acquisition cost has been discounted to $347 million using an estimated payout pattern for the funding and the Company’s estimated cost of debt at the time of acquisition.
| 10. | LONG-TERM DEBT |
| Maturity | December 31, 2007 | December 31, 2006 | ||||||||||
| (Note 3) | ||||||||||||
Debentures and notes 5.95% unsecured senior notes ($600 million US) | 2035 | $ | 577 | $ | 699 | |||||||
5.35% unsecured senior notes ($300 million US) | 2033 | 248 | 349 | |||||||||
7.00% unsecured debentures ($250 million US) | 2028 | 237 | 291 | |||||||||
7.875% unsecured debentures ($275 million US) | 2026 | 267 | 321 | |||||||||
9.25% unsecured debentures ($300 million US) | 2021 | 294 | 349 | |||||||||
5.00% unsecured senior notes ($400 million US) | 2014 | 391 | 466 | |||||||||
4.00% unsecured senior notes ($300 million US) | 2013 | 275 | 349 | |||||||||
| Syndicated credit facilities | 2012 | 995 | - | |||||||||
| Capital leases | 2008-2022 | 57 | 70 | |||||||||
| 3,341 | 2,894 | |||||||||||
| Current portion | (2 | ) | (7 | ) | ||||||||
| $ | 3,339 | $ | 2,887 | |||||||||
At December 31, 2007, the Company had in place syndicated operating credit facilities totalling $2,200 million (December 31, 2006 - $2,200 million) maturing in 2012. The syndicated facilities are unsecured, committed revolving facilities that bear interest at either the lenders' rates for Canadian prime loans, U.S. base rate loans, Bankers' Acceptances rates or at London Inter-Bank Offered Rate (LIBOR) plus applicable margins. The Company also had revolving bilateral demand credit facilities of $1,500 million at December 31, 2007 (December 31, 2006 - $829 million).
A total of $1,372 million of the credit facilities was used for Bankers’ Acceptances, letters of credit and overdraft coverage at December 31, 2007. The syndicated facilities also may be used to provide liquidity support to Petro-Canada's commercial paper program. No commercial paper was outstanding at December 31, 2007.
At December 31, 2007, the Company had drawn on its syndicated credit facilities and its demand credit facilities for $995 million and $109 million, respectively in the form of Canadian dollar Bankers’ Acceptances. The weighted-average interest rate for Bankers’ Acceptances outstanding was 5.13% for the syndicated credit facilities and 4.99% for the demand credit facilities.
| 11. | SHAREHOLDERS’ EQUITY |
Changes in common shares and contributed surplus were as follows: |
| Shares | Amount | Contributed Surplus | ||||||||||
| Balance at December 31, 2006 | 497,538,385 | $ | 1,366 | $ | 469 | |||||||
| Issued under employee stock option and share purchase plans | 1,918,734 | 43 | (1 | ) | ||||||||
| Repurchased under normal course issuer bid | (15,998,000 | ) | (44 | ) | (444 | ) | ||||||
| Balance at December 31, 2007 | 483,459,119 | $ | 1,365 | $ | 24 | |||||||
- 35 -
PETRO-CANADA
NOTES TO CONSOLIDATED FINANCIAL STATEMENTS (unaudited)
(millions of Canadian dollars, unless otherwise stated)
| 11. | SHAREHOLDERS’ EQUITY, continued |
In June 2007, the Company renewed its normal course issuer bid (NCIB) program to repurchase up to 25 million of its outstanding common shares during the period from June 22, 2007 to June 21, 2008, subject to certain conditions. During the three months and year ended December 31, 2007, the Company purchased 2,000,000 common shares at a cost of $104 million and 15,998,000 common shares at a cost of $839 million, respectively (1,000,000 common shares at a cost of $50 million and 19,778,400 common shares at a cost of $1,011 million during the three months and year ended December 31, 2006). The excess of the purchase price over the carrying amount of the shares purchased was recorded as a reduction of contributed surplus and retained earnings.
| 12. | STOCK-BASED COMPENSATION |
The total stock-based compensation expense (recovery) recorded was $(68) million and $95 million for the three months and year ended December 31, 2007, respectively ($28 million and $39 million for the three months and year ended December 31, 2006).
| (a) | Stock Option and Performance Share Unit Plans (PSUs) |
Changes in the number of outstanding stock options and PSUs were as follows:
| Stock Options | PSUs | |||||||||||
| Number | Weighted-Average Exercise Price | Number | ||||||||||
| Balance at December 31, 2006 | 20,714,733 | $ | 31 | 1,482,986 | ||||||||
| Granted | 3,347,800 | 44 | 247,476 | |||||||||
| Exercised for common shares | (1,918,734 | ) | 19 | n/a | ||||||||
| Surrendered for cash payment | (800,685 | ) | 34 | n/a | ||||||||
| Cancelled/Expired | (308,050 | ) | 44 | (564,418 | ) | |||||||
| Balance at December 31, 2007 | 21,035,064 | $ | 34 | 1,166,044 | ||||||||
| (b) | Stock Appreciation Rights (SARs) |
Commencing 2007, the Company approved the issuance of SARs to certain employees. These entitle the holder to receive a cash payment equal to the difference between the stated exercise price and the market price of the Company’s common shares on date of surrender. The vesting period and other terms are similar to the terms of the Company’s existing stock option plan. At the time of grant, the exercise price approximated the market price. The following SARs have been granted:
| SARs | ||||||||
| Number | Weighted-Average Exercise Price | |||||||
| Balance at December 31, 2006 | - | $ | - | |||||
| Granted | 3,786,500 | 44 | ||||||
| Cancelled | (127,050 | ) | 44 | |||||
| Balance at December 31, 2007 | 3,659,450 | $ | 44 | |||||
- 36 -
PETRO-CANADA
NOTES TO CONSOLIDATED FINANCIAL STATEMENTS (unaudited)
(millions of Canadian dollars, unless otherwise stated)
| 13. | EMPLOYEE FUTURE BENEFITS |
| The Company maintains pension plans with defined benefit and defined contribution provisions and provides certain health care and life insurance benefits to its qualifying retirees. The expenses associated with these plans are as follows: |
Three months ended December 31, | Year ended December 31, | |||||||||||||||
| 2007 | 2006 | 2007 | 2006 | |||||||||||||
| Pension Plans: | ||||||||||||||||
| Defined benefit plans | ||||||||||||||||
Employer current service cost | $ | 13 | $ | 10 | $ | 43 | $ | 40 | ||||||||
Interest cost | 24 | 23 | 90 | 86 | ||||||||||||
Expected return on plan assets | (29 | ) | (25 | ) | (112 | ) | (99 | ) | ||||||||
Amortization of transitional asset | (2 | ) | - | (6 | ) | (5 | ) | |||||||||
Amortization of net actuarial losses | 11 | 12 | 44 | 51 | ||||||||||||
| 17 | 20 | 59 | 73 | |||||||||||||
| Defined contribution plans | 8 | 6 | 22 | 18 | ||||||||||||
| $ | 25 | $ | 26 | $ | 81 | $ | 91 | |||||||||
| Other post-retirement plans: | ||||||||||||||||
Employer current service cost | $ | 1 | $ | 1 | $ | 5 | $ | 4 | ||||||||
Interest cost | 3 | 2 | 12 | 11 | ||||||||||||
Amortization of transitional obligation | - | 1 | 4 | 4 | ||||||||||||
| $ | 4 | $ | 4 | $ | 21 | $ | 19 | |||||||||
The Company contributed $121 million to its pension plans in 2007.
| 14. | FINANCIAL INSTRUMENTS AND DERIVATIVES |
During 2004, the Company entered into a series of derivative contracts for the future sale of Dated Brent crude oil in connection with its acquisition of an interest in the Buzzard field in the U.K. sector of the North Sea. Some derivative contracts matured from July 1, 2007 to December 31, 2007. All remaining outstanding derivative contracts were settled. This resulted in the following:
Three months ended December 31, 2007 | Year ended December 31, 2007 | |||||||
| Unrealized losses at beginning of period | $ | (1,502 | ) | $ | (1,481 | ) | ||
Net losses during current period (Note 5) | (383 | ) | (535 | ) | ||||
Maturities (1) | 160 | 291 | ||||||
Settlement (2) | 1,725 | 1,725 | ||||||
| $ | - | $ | - | |||||
| (1) | Derivative contracts that matured from July 1, 2007 to December 31, 2007 resulted in realized losses of $160 million ($106 million after-tax) and $291 million ($193 million after-tax) for the three months and year ended December 31, 2007, respectively. |
| (2) | All remaining outstanding derivative contracts were settled, which resulted in realized losses of $1,725 million ($1,145 million after-tax). |
- 37 -
PETRO-CANADA
NOTES TO CONSOLIDATED FINANCIAL STATEMENTS (unaudited)
(millions of Canadian dollars, unless otherwise stated)
| 15. | RECENT ACCOUNTING PRONOUNCEMENTS |
In June 2007, Canada's Accounting Standards Board (AcSB) issued CICA Handbook Section 3031, Inventories. This new standard provides considerable guidance when determining the cost of inventory. Where costs of inventory items cannot be specifically identified, costs must be assigned consistently on either a "first-in, first-out" (FIFO) or weighted average cost basis. A "last-in first-out" (LIFO) cost basis is no longer acceptable. The standard is effective for fiscal periods beginning on or after January 1, 2008. The Company is adopting this standard prospectively. Converting the cost of crude oil and refined products from a LIFO to FIFO costing basis will increase January 1, 2008 inventories by $812 million, future income tax liabilities by $256 million, and retained earnings by $556 million.