UNITED STATES
SECURITIES AND EXCHANGE COMMISSION
Washington, D.C. 20549
FORM N-CSR
CERTIFIED SHAREHOLDER REPORT OF REGISTERED MANAGEMENT
INVESTMENT COMPANIES
| | |
| Investment Company Act file number: | | 811-04710 |
| |
| Exact name of registrant as specified in charter: | | The Asia Pacific Fund, Inc. |
| |
| Address of principal executive offices: | | Gateway Center 3, 100 Mulberry Street, Newark, New Jersey 07102 |
| |
| Name and address of agent for service: | | Deborah A. Docs Gateway Center 3, 100 Mulberry Street, Newark, New Jersey 07102 |
| |
| |
| Registrant’s telephone number, including area code: | | 973-367-7521 |
| |
| Date of fiscal year end: | | 3/31/2007 |
| |
| Date of reporting period: | | 3/31/2007 |
Item 1 – Reports to Stockholders

ANNUAL REPORT
March 31, 2007

The Asia Pacific Fund, Inc.
Contents
Notice is hereby given in accordance with Section 23(c) of the Investment Company Act of 1940 that The Asia Pacific Fund, Inc. (the “Fund”) may purchase, from time to time, shares of its common stock at market prices.
This report, including the financial statements herein, is transmitted to the shareholders of the Fund for their information. This is not a prospectus, circular or representation intended for use in the purchase of shares of the Fund or any securities mentioned in this report.
The Asia Pacific Fund, Inc.
Gateway Center Three
100 Mulberry Street
Newark, NJ 07102-4077
For general information on the Fund, please call (toll-free) the Altman Group, our shareholders’ servicing agent, at: 1-(888) 4-ASIA-PAC
Current information about the Fund is available on its website (http://www.asiapacificfund.com). This website includes monthly updates of the Fund’s performance and other data as well as the Manager’s quarterly presentation of performance and asset allocations and comments on the current Asian outlook.
The Fund’s CUSIP number is 044901106.
1
The Asia Pacific Fund, Inc.
Share Price, Net Asset Value and Distribution History (Unaudited)
| | | | | | |
| | | |
| Quarter End | | Closing Price
at Quarter End | | Net Asset Value
per Share
at Quarter End | | Dividends and
Distributions During Quarter* |
Financial Year 2006/2007 | | | | |
June | | $18.90 | | $20.18 | | — |
September | | 19.90 | | 21.96 | | — |
December | | 22.80 | | 23.46 | | $2.96 |
March | | 21.22 | | 24.03 | | — |
| | | | | | |
Financial Year 2005/2006 | | | | |
June | | $15.25 | | $16.69 | | — |
September | | 16.21 | | 17.89 | | — |
December | | 16.61 | | 18.65 | | $0.68 |
March | | 18.39 | | 20.54 | | — |
| | | | | | |
Financial Year 2004/2005 | | | | |
June | | $12.05 | | $13.88 | | — |
September | | 13.44 | | 14.58 | | — |
December | | 14.64 | | 16.07 | | $0.15 |
March | | 14.65 | | 16.62 | | — |
| | | | | | |
Financial Year 2003/2004 | | | | |
June | | $10.10 | | $10.73 | | — |
September | | 11.96 | | 12.46 | | — |
December | | 14.20 | | 13.76 | | $0.18 |
March | | 13.90 | | 14.90 | | — |
| | | | | | |
Financial Year 2002/2003 | | | | |
June | | $10.44 | | $11.22 | | — |
September | | 8.33 | | 9.78 | | — |
December | | 8.88 | | 10.00 | | — |
March | | 8.10 | | 9.10 | | — |
| * | Total per share distributions over the 5 years to March 31, 2007 amounted to $3.97. Total per share distributions over the Fund’s life (commencement of operations: May 4, 1987) have amounted to $17.53. |
2
The Asia Pacific Fund, Inc.
The Fund’s Management
Directors
Michael J. Downey, Chairman
Jessica M. Bibliowicz
David J. Brennan
Robert H. Burns
Olarn Chaipravat
Robert F. Gunia
Douglas Tong Hsu
Duncan M. McFarland
David G. P. Scholfield
Nicholas T. Sibley
Officers
Brian A. Corris, President
Robert F. Gunia, Vice-President and Treasurer
M. Sadiq Peshimam, Assistant Treasurer
Deborah A. Docs, Secretary and Chief Legal Officer
Valerie M. Simpson, Chief Compliance Officer
Lee D. Augsburger, Deputy Chief Compliance Officer
Investment Manager
Baring Asset Management (Asia) Limited
1901 Edinburgh Tower
15 Queen’s Road Central
Hong Kong
Administrator
Prudential Investments LLC
Gateway Center Three
100 Mulberry Street
Newark, NJ 07102-4077
Custodian
The Bank of New York
One Wall Street
New York, NY 10286
Transfer Agent
Computershare Trust Company N.A.
P.O. Box 43011
Providence, RI 02940-3011
Independent Auditors
Ernst & Young LLP
5 Times Square
New York, NY 10036
Legal Counsel
Sullivan & Cromwell LLP
125 Broad Street
New York, New York 10004
3
The Asia Pacific Fund, Inc.
Report of the Investment Manager (Unaudited)
for the fiscal year ended March 31, 2007
Overview
During the fiscal year ended March 31, 2007, the Fund’s net asset value (NAV) per share, adding back the distribution paid to shareholders, rose 32.2%. This compares with the Fund’s referenced benchmark’s total returns of 24.0%. The top three performing markets, as measured by the MSCI country indices in US Dollar (USD) terms over the period, were Philippines (+56.6%), Malaysia (+49.6%) and China (+47.1%). The bottom three were Thailand (+7.0%), Korea (+10.6%) and Taiwan (+14.0%). The strong returns achieved by Asian equities were aided by the strong Asian currencies versus the USD over the period. There were however three currencies which weakened slightly against the USD, the New Taiwanese Dollar, the Hong Kong Dollar and the Indonesian Rupiah.
For comparative purposes, over the period, the S&P 500 and MSCI World indices’ gross returns in USD terms were +11.8% and +16.0% respectively.
Dissecting the trend of Asian markets over the fiscal year to March 31, 2007, one can observe three phases as depicted in chart number 1.
Chart 1. MSCI AC Far East Ex-Japan Gross Index (March 2006 – March 2007)
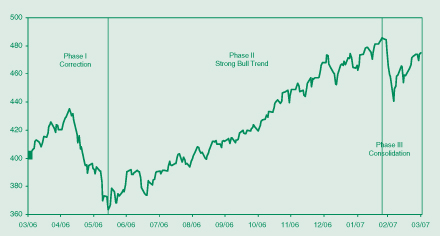
Source: Factset
4
The Asia Pacific Fund, Inc.
The first period was influenced by a number of global and regional uncertainties. Global concerns included the strong rise of the oil price to the high 70s (USD per barrel) and the continuing implementation of the monetary tightening policy by the US Federal Reserve as inflationary pressures in the US built. Within Asia, investors were unsure about the degree of macro tightening implemented by the Chinese government and the extent of the unstable speculative positions financed by cheap Yen borrowings known as ‘carry trade’.
The second period, the bull market phase, started in July, with the US Federal Reserve declaring that, while they maintained a tightening bias, the monetary tightening phase had come to a halt. In addition, macro tightening in China was not as severe as feared. Moreover, oil prices started to fall from their all-time highs. Finally, the Yen ‘carry trade’ unwinding appeared to have reached an end by July. The above, combined with the strong and sustainable growth in Asia and the region’s cheap valuation attracted investors back into equities. Of note was the sharp rally in the Chinese market, boosted by the better-than-expected growth in corporate earnings and the massive global and local interest in Chinese companies’ IPOs. The MSCI China index, during the July 2006 to early January 2007 period, rose by a strong 73% from bottom to top.
The third period was dominated by a return of global and regional uncertainties. Global concerns included the negative implications of a broadening of the sub-prime lending crisis in the US, a bounce in the oil price back to the mid-60s (USD per barrel) and the realisation by the market that the US Federal Reserve was unlikely to cut rates anytime soon. Again, within Asia, investors showed concern over the increasingly expensive valuation of two of the winners of 2006, namely India and China. In addition, they were unsure about the potential severity of further macro tightening by the Chinese and Indian governments, and the extent of the unwinding of the Yen ‘carry trade’.
At the sectoral level, over the fiscal year, out-performing sectors included Materials, Telecoms and Financials. Relative under-performers included Technology, Consumer Discretionary and Utilities.
5
The Asia Pacific Fund, Inc.
Report of the Investment Manager (Unaudited)
continued
Table 1. Stock Market Performance
Period: March 31, 2006 to March 31, 2007 (in US Dollar terms)
| | | | | | | | | | |
| | | | | |
| Country – Index | | 2nd Quarter 2006 % | | 3rd Quarter 2006 % | | 4th Quarter 2006 % | | 1st Quarter 2007 % | | 1 Year to 03/31/06
% |
North Asia | | | | | | | | | | |
MSCI China Free | | 2.3 | | 8.8 | | 35.9 | | –2.3 | | 47.1 |
MSCI Hong Kong Free | | –0.1 | | 6.3 | | 14.5 | | 0.5 | | 22.4 |
MSCI Taiwan Free | | 0.9 | | 3.4 | | 12.9 | | –3.2 | | 14.0 |
MSCI South Korea Free | | –3.0 | | 5.5 | | 4.8 | | 3.0 | | 10.6 |
ASEAN | | | | | | | | | | |
MSCI Philippines Free | | –6.3 | | 27.6 | | 20.3 | | 8.9 | | 56.6 |
MSCI Malaysia Free | | –1.1 | | 5.9 | | 20.8 | | 18.3 | | 49.6 |
MSCI Singapore Free | | 0.3 | | 6.9 | | 23.3 | | 10.3 | | 45.7 |
MSCI Indonesia Free | | –1.8 | | 18.5 | | 19.7 | | –2.1 | | 36.4 |
MSCI Thailand Free | | –5.0 | | 6.7 | | 1.9 | | 3.5 | | 7.0 |
South Asia | | | | | | | | | | |
MSCI India Free | | –9.3 | | 18.1 | | 16.3 | | –3.2 | | 20.5 |
MSCI All Countries Combined Far East Free Ex-Japan Gross | | –0.6 | | 6.3 | | 15.7 | | 1.5 | | 24.0 |
Source: Morgan Stanley Capital International, Factset. |
Table 2. Currency Market Performance vs US Dollar (Month-Ends)
Period: March 31, 2006 to March 31, 2007
| | | | | | | | | | | | |
| | | | | | |
| Currency – USD/local rate | | March 2006 | | June 2006 | | Sept 2006 | | Dec 2006 | | March 2007 | | 12 M Change* (%) |
North Asia | | | | | | | | | | | | |
Chinese Renminbi | | 8.02 | | 7.99 | | 7.90 | | 7.81 | | 7.73 | | 3.7 |
South Korean Won | | 972 | | 949 | | 947 | | 931 | | 941 | | 3.3 |
Hong Kong Dollar | | 7.76 | | 7.77 | | 7.79 | | 7.78 | | 7.81 | | –0.7 |
New Taiwan Dollar | | 32.45 | | 32.38 | | 33.10 | | 32.59 | | 33.09 | | –1.9 |
ASEAN | | | | | | | | | | | | |
Thai Baht | | 38.89 | | 38.15 | | 37.59 | | 36.15 | | 35.01 | | 11.1 |
Singaporean Dollar | | 1.62 | | 1.58 | | 1.59 | | 1.53 | | 1.52 | | 6.6 |
Malaysian Ringgit | | 3.68 | | 3.67 | | 3.69 | | 3.53 | | 3.46 | | 6.5 |
Philippine Peso | | 51.16 | | 53.13 | | 50.19 | | 49.01 | | 48.25 | | 6.0 |
Indonesian Rupiah | | 9,087 | | 9,263 | | 9,225 | | 8,994 | | 9,125 | | –0.4 |
South Asia | | | | | | | | | | | | |
Indian Rupee | | 44.56 | | 46.04 | | 45.93 | | 44.26 | | 43.47 | | 2.5 |
* Appreciation (depreciation) of Asian currencies versus the US Dollar during the period. Source: Baring Asset Management, Factset. |
6
The Asia Pacific Fund, Inc.
Chart 2. Performance of the Asia Pacific Fund’s NAV against its Benchmark Index
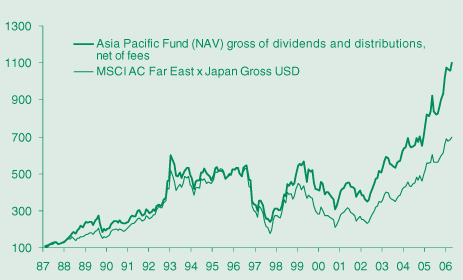
Note: This chart begins with the start date of the Index, MSCI AC Far East (Free) excl. Japan on 12.31.87.
Source: Baring Asset Management, Factset.
Performance
During the fiscal year ending March 31, 2007, the Fund’s net asset value (NAV) per share rose by US$3.49 from $20.54 to $24.03. Taking into account the distribution in December 2006 of income and capital gains of $2.96, the Fund’s total return was 32.2%. This compares with the Fund’s referenced benchmark total return as measured by the MSCI All Countries Combined Far East Free Ex-Japan index of 24.0%. Over the same period the Fund’s share price moved from $18.39 to $21.22. In percentage terms, adding back the distribution paid to shareholders, this represented a total increase of 30.4%. The Fund’s discount ranged between 1.2% to 12.4%, finishing the year at 11.7%. On a long-term basis, the Fund’s track record remains strong, with significant value added over the 1, 3, 5, 7, 10 year and 20 year periods.
Over the fiscal year to March 31, 2007, the Fund’s attribution analysis showed that stock selection was the significant contributor to out-performance of the referenced index. With regard to country allocation; China, Taiwan, Hong Kong, Singapore and Malaysia added significant value, while Korea and Thailand detracted slightly. The Fund’s over-weighting in China and under-weighting to Korea and Taiwan were positive contributors, although the leverage that was in effect in the June quarter of 2006 detracted value.
7
The Asia Pacific Fund, Inc.
Report of the Investment Manager (Unaudited)
continued
Table 3. Performance of Asia Pacific Fund, the Region and Major World Markets* (in %, US Dollar terms)
| | | | | | | | | | |
| | | | | |
Market Price (USD) Returns Gross (%) | | 1 Yr to
03/31/07 | | 3 Yrs to
03/31/07 | | 5 Yrs to
03/31/07 | | 7 Yrs to
03/31/07 | | 10 Yrs to
03/31/07 |
Asia Pacific Fund-NAV (incl. divs) | | 32.2 | | 90.9 | | 146.8 | | 96.0 | | 126.4 |
Asia Pacific Fund-Price (incl. divs) | | 30.4 | | 80.9 | | 151.7 | | 144.1 | | 142.1 |
MSCI AC Far East Ex-Japan Gross | | 24.0 | | 77.0 | | 125.7 | | 61.2 | | 39.7 |
MSCI World Gross | | 16.0 | | 52.8 | | 68.2 | | 21.5 | | 122.4 |
S&P Composite 500 | | 11.8 | | 33.3 | | 35.5 | | 6.4 | | 120.0 |
NASDAQ Composite (price)** | | 3.5 | | 21.4 | | 31.2 | | –47.0 | | 98.2 |
MSCI Europe Gross | | 26.0 | | 84.6 | | 112.5 | | 56.5 | | 177.9 |
MSCI Japan Gross | | 3.1 | | 39.3 | | 93.2 | | -1.0 | | 47.3 |
| * | Investment involves risk and past performance figures shown are not indicative of future performance. |
| ** | No gross dividends available from exchange |
Source: Baring Asset Management, Factset
Portfolio Strategy
The Fund’s overall strategy over the last fiscal year was to focus on those markets and stocks which were expected to show upside earnings surprises and which were relatively inexpensive. These included China, Singapore and small ASEAN markets. The Manager continued to increase the exposure to China in a substantial manner in the first half of the fiscal year. Expectations of strong growth combined with cheap valuation and positive price momentum were the attractive features of China. The markets of Singapore and ASEAN also offered interesting money-making opportunities for the Fund. The Manager reduced exposure to Korea, Taiwan and Thailand in order to fund the above-mentioned investments.
The themes which the Manager favored over the last fiscal year included: maintaining a pro-growth and pro-cyclical bias in the portfolio in order to participate in the positive earnings growth trend of China and other Asian markets; focusing on domestic reflation plays, including Chinese financials, Singaporean property, and consumer names; and on energy and materials in China and ASEAN, in order to gain exposure to China’s stronger-for-longer modernization and industrialization theme. These investments were principally funded from the Technology and Banking sectors.
Over the full fiscal year the Fund added the most value via good stock selection. The top five contributors included: China Merchant Bank (Chinese bank), Zijin Mining (Chinese gold mining), iShares FTSE/Xinhua A50 (China A-share tracker fund), Foxconn Technology (Taiwanese technology) and Capitaland (Singaporean property).
8
The Asia Pacific Fund, Inc.
Table 4. Asset Allocation at Quarter Ends (% of Fund’s Net Assets)*
| | | | | | | | | | | | |
| | | | | |
| Country | | March 31 2006 % | | | June 30 2006 % | | Sept 30 2006 % | | Dec 31 2006 % | | | Mar 31 2007 % |
North Asia | | 86.0 | | | 79.8 | | 79.4 | | 84.1 | | | 72.9 |
Hong Kong/China | | 35.9 | | | 33.4 | | 35.6 | | 47.1 | | | 39.3 |
South Korea | | 31.5 | | | 30.2 | | 27.6 | | 20.3 | | | 18.4 |
Taiwan | | 18.6 | | | 16.2 | | 16.2 | | 16.7 | | | 15.2 |
ASEAN | | 20.7 | | | 16.5 | | 16.4 | | 21.5 | | | 22.0 |
Indonesia | | 2.0 | | | 2.1 | | 3.0 | | 4.6 | | | 3.2 |
Philippines | | 0.8 | | | 0.8 | | 0.3 | | 0.9 | | | 0.8 |
Malaysia | | 2.8 | | | 2.7 | | 1.6 | | 4.8 | | | 6.5 |
Singapore | | 11.0 | | | 8.8 | | 8.7 | | 10.1 | | | 11.5 |
Thailand | | 4.1 | | | 2.1 | | 2.8 | | 1.1 | | | — |
South Asia | | | | | | | | | | | | |
India | | 2.3 | | | 2.4 | | 2.8 | | 3.0 | | | 1.9 |
Borrowings | | (9.4 | ) | | 0.0 | | 0.0 | | 0.0 | | | 0.0 |
Cash & Other | | 0.4 | | | 1.3 | | 1.4 | | (8.6 | ) | | 3.2 |
| * | Rounded up to one decimal place |
At the time of writing, the US and all other global equity markets, including the Asian region, remain strong. While the US economy is expected to slowdown due to the sub-prime debt problem and the weak state of the housing sector, other major economies appear to show more stable and sustainable growth. Investors are anticipating that the US Federal Reserve will continue to adopt a neutral to slightly easier monetary policy. On the other hand, investors are expecting that the European Central Bank and the Bank of Japan will continue to tighten gradually.
In Asia, the Manager remains optimistic that the secular growth trend of China will continue at least for the next few years. Similar to Japan in the ’70-’80s and Korea in the ’80-’90s, China can continue to grow at a steady rate as it is embarking on its ambitious plan to modernize the rural areas of Central and Western China, while continuing to grow strongly in the well-developed Eastern seaboard. Asian neighbors are likely to continue to benefit from the increasing growth in trade with China.
Risks to the above bullish scenario include: higher US inflation and interest rates leading to a US recession, higher-than-expected inflation and interest rates in China, a sudden collapse of the USD with negative implications on US financial assets, oil prices rising towards USD 100 per barrel, and equity investors’ risk appetite turning to risk aversion, caused by unexpected negative shocks.
Taking all the above opportunities and potential risks into consideration, in our research and portfolio construction process, the Manager continues to focus on investing in stocks with visible earnings growth and relatively inexpensive valuations.
Baring Asset Management (Asia) Limited
April 16, 2007
9
The Asia Pacific Fund, Inc.
Portfolio of Investments
March 31, 2007
| | | | | |
| Shares | | Description | | Value (Note 1) |
| | EQUITIES – 96.8% | | | |
| | |
| | HONG KONG/CHINA – 39.3% | | | |
| 1,736,000 | | Air China, Ltd. (Class “H” Shares) (Industrials) | | $ | 1,201,991 |
| 1,230,000 | | Aluminum Corp. of China, Ltd. (Class “H” Shares) (Materials) | | | 1,268,804 |
| 746,000 | | Angang Steel Co., Ltd. (Class “H” Shares) (Materials) | | | 1,294,652 |
| 158,000 | | Anhui Conch Cement Co., Ltd. (Class “H” Shares) (Materials) | | | 563,166 |
| 998,500 | | BOC Hong Kong Holdings, Ltd. (Banking) | | | 2,420,374 |
| 756,000 | | Cathay Pacific Airways, Ltd. (Industrials) | | | 1,923,502 |
| 2,810,191 | | China Communications Construction Co., Ltd. (Class “H” Shares) (a) (Industrials) | | | 3,387,982 |
| 6,407,000 | | China Construction Bank (Class “H” Shares) (Banking) | | | 3,665,360 |
| 1,198,000 | | China Merchants Bank Co., Ltd. (Class “H” Shares) (a) (Banking) | | | 2,416,392 |
| 810,000 | | China Mobile, Ltd. (Telecommunications) | | | 7,365,522 |
| 3,080,000 | | China Oilfield Services, Ltd. (Class “H” Shares) (Energy) | | | 2,475,510 |
| 2,348,000 | | China Overseas Land & Investment, Ltd. (Real Estate – Developers) | | | 2,950,964 |
| 394,000 | | China Resources Enterprise, Ltd. (Consumer Discretionary) | | | 1,316,107 |
| 1,486,000 | | China Shenhua Energy Co., Ltd. (Class “H” Shares) (Energy) | | | 3,594,471 |
| 952,000 | | Cosco Pacific, Ltd. (Industrials) | | | 2,358,830 |
| 549,100 | | Esprit Holdings, Ltd. (Consumer Discretionary) | | | 6,440,778 |
| 825,000 | | Foxconn International Holdings, Ltd. (a) (Information Technology) | | | 2,518,238 |
| 3,264,000 | | Guangshen Railway Co., Ltd. (Class “H” Shares) (Industrials) | | | 2,071,983 |
| 3,256,800 | | Guangzhou R&F Properties Co., Ltd. (Class “H” Shares) (Real Estate – Developers) | | | 7,252,618 |
| 1,828,000 | | Hengan International Group Co., Ltd. (Consumer Staples) | | | 5,357,548 |
| 243,000 | | Hong Kong Exchanges and Clearing, Ltd. (Diversified Financials) | | | 2,368,266 |
| 490,000 | | HongKong Land Holdings, Ltd. (Real Estate – Developers) | | | 2,283,400 |
| 363,100 | | iShares Asia Trust - iShares A50 China Tracker (Mutual Fund) | | | 5,334,854 |
| 1,540,000 | | Li & Fung, Ltd. (Consumer Discretionary) | | | 4,838,677 |
| 880,000 | | Lifestyle International Holdings, Ltd. (Consumer Discretionary) | | | 2,646,701 |
| 1,575,000 | | Nine Dragons Paper Holdings, Ltd. (Materials) | | | 3,285,659 |
| 224,500 | | Parkson Retail Group, Ltd. (Consumer Discretionary) | | | 1,465,348 |
| 1,746,000 | | PetroChina Co., Ltd. (Class “H” Shares) (Energy) | | | 2,071,469 |
| 2,200,000 | | Ports Design, Ltd. (Consumer Discretionary) | | | 5,856,530 |
| 9,790,000 | | Zijin Mining Group Co., Ltd. (Class “H” Shares) (Materials) | | | 5,700,966 |
| | | | | |
| | | | | 97,696,662 |
| | | | | |
| | INDIA – 1.9% | | | |
| 78,147 | | Housing Development Finance Corp., Ltd. (Banking) | | | 2,732,494 |
| 44,960 | | Infosys Technologies, Ltd. (Information Technology) | | | 2,088,082 |
| | | | | |
| | | | | 4,820,576 |
| | | | | |
See Notes to Financial Statements.
10
The Asia Pacific Fund, Inc.
| | | | | | |
| Shares | | Description | | | | Value (Note 1) |
| | INDONESIA – 3.2% | | | | |
| 376,000 | | Astra International Tbk PT (Consumer Discretionary) | | $ | | 543,912 |
| 52,250,500 | | Bank Internasional Indonesia (Banking) | | | | 1,105,134 |
| 3,257,000 | | Bank Rakyat Indonesia (Banking) | | | | 1,802,504 |
| 333,000 | | International Nickel Indonesia (Materials) | | | | 1,983,403 |
| 2,401,500 | | Telekomunikasi Indonesia (Telecommunications) | | | | 2,592,304 |
| | | | | | |
| | | | | | 8,027,257 |
| | | | | | |
| | MALAYSIA – 6.5% | | | | |
| 1,318,200 | | Commerce Holdings Berhad (Banking) | | | | 3,793,518 |
| 499,600 | | Gamuda Berhad (Industrials) | | | | 1,155,980 |
| 675,900 | | IJM Corp. Berhad (Industrials) | | | | 1,690,972 |
| 551,250 | | Kuala Lumpur Kepong Berhad (Consumer Staples) | | | | 1,913,232 |
| 1,650,900 | | Lion Diversified Holdings Berhad (Consumer Staples) | | | | 3,748,247 |
| 877,400 | | Malaysian Airline System Berhad (a) (Industrials) | | | | 1,459,161 |
| 424,600 | | Sime Darby Berhad (Industrials) | | | | 994,725 |
| 387,900 | | Tenaga Nasional Berhad (Utilities) | | | | 1,278,976 |
| | | | | | |
| | | | | | 16,034,811 |
| | | | | | |
| | PHILIPPINES – 0.8% | | | | |
| 82,420 | | Ayala Corp. (Diversified Financials) | | | | 956,584 |
| 745,100 | | Metropolitan Bank & Trust Co. (Banking) | | | | 965,156 |
| | | | | | |
| | | | | | 1,921,740 |
| | | | | | |
| | SINGAPORE – 11.5% | | | | |
| 1,889,000 | | Ascott Group, Ltd. (Real Estate – Developers) | | | | 2,129,117 |
| 1,337,000 | | CapitaLand, Ltd. (Real Estate – Developers) | | | | 7,050,060 |
| 253,000 | | DBS Group Holdings, Ltd. (Banking) | | | | 3,568,665 |
| 222,000 | | Keppel Corp., Ltd. (Industrials) | | | | 2,780,213 |
| 592,000 | | Keppel Land, Ltd. (Real Estate – Developers) | | | | 3,706,951 |
| 945,000 | | SIA Engineering Co. (Industrials) | | | | 2,927,529 |
| 214,000 | | Singapore Airlines, Ltd. (Industrials) | | | | 2,341,496 |
| 916,000 | | Singapore Exchange, Ltd. (Diversified Financials) | | | | 3,954,651 |
| | | | | | |
| | | | | | 28,458,682 |
| | | | | | |
See Notes to Financial Statements.
11
The Asia Pacific Fund, Inc.
Portfolio of Investments
continued
| | | | | | |
| Shares | | Description | | | | Value (Note 1) |
| | SOUTH KOREA – 18.4% | | | | |
| 18,360 | | Doosan Heavy Industries & Construction Co., Ltd. (Industrials) | | $ | | 1,186,531 |
| 76,140 | | Doosan Infracore Co., Ltd. (Industrials) | | | | 1,942,347 |
| 42,157 | | GS Engineering & Construction Corp. (Industrials) | | | | 3,772,980 |
| 43,160 | | Hana Financial Group, Inc. (Banking) | | | | 2,234,154 |
| 131,626 | | Hynix Semiconductor, Inc. (a) (Information Technology) | | | | 4,533,038 |
| 46,070 | | Hyundai Engineering & Construction Co., Ltd. (a) (Industrials) | | | | 2,482,726 |
| 87,631 | | Kookmin Bank (Banking) | | | | 7,861,454 |
| 78,860 | | Korea Exchange Bank (Banking) | | | | 1,274,099 |
| 2,997 | | Posco (Materials) | | | | 1,258,307 |
| 11,998 | | Samsung Electronics Co., Ltd. (Information Technology) | | | | 7,179,925 |
| 71,030 | | Samsung Heavy Industries Co., Ltd. (Industrials) | | | | 1,895,039 |
| 5,467 | | Shinsegae Co., Ltd. (Consumer Staples) | | | | 3,137,946 |
| 21,637 | | SK Corp. (Energy) | | | | 2,125,063 |
| 84,590 | | Woongjin Coway Co., Ltd. (Consumer Discretionary) | | | | 2,373,699 |
| 114,040 | | Woori Investment & Securities Co., Ltd. (Diversified Financials) | | | | 2,394,016 |
| | | | | | |
| | | | | | 45,651,324 |
| | | | | | |
| | TAIWAN – 15.2% | | | | |
| 1,338,000 | | China Steel Corp. (Materials) | | | | 1,508,141 |
| 342,000 | | Delta Electronics, Inc. (Information Technology) | | | | 1,105,826 |
| 1,964,584 | | Far Eastern Textile, Ltd. (b) (Industrials) | | | | 1,691,969 |
| 585,040 | | Foxconn Technology Co., Ltd. (Information Technology) | | | | 6,638,539 |
| 7,278,000 | | Goldsun Development & Construction Co., Ltd. (Materials) | | | | 3,782,836 |
| 1,110,947 | | Hon Hai Precision Industry Co., Ltd. (Information Technology) | | | | 7,452,866 |
| 1,939,000 | | Innolux Display Corp. (a) (Information Technology) | | | | 4,582,068 |
| 3,863,479 | | Shin Kong Financial Holding Co., Ltd. (Insurance) | | | | 3,426,602 |
| 3,242,000 | | Taiwan Fertilizer Co., Ltd. (Materials) | | | | 5,388,311 |
| 2,382,000 | | Uni-President Enterprises Corp. (Consumer Staples) | | | | 2,281,802 |
| | | | | | |
| | | | | | 37,858,960 |
| | | | | | |
| | Total Investments – 96.8%
(cost $147,768,473; Note 4) | | | | 240,470,012 |
| | Other assets in excess of liabilities – 3.2% | | | | 8,061,752 |
| | | | | | |
| | Net Assets – 100.0% | | $ | | 248,531,764 |
| | | | | | |
The following annotations are used in the Portfolio of Investments:
(a) Non-income producing securities.
(b) An Independent Director of the Fund is Chairman and Chief Executive Officer of the Company.
See Notes to Financial Statements.
12
The Asia Pacific Fund, Inc.
The Industry classification of portfolio holdings and other assets in excess of liabilities shown as a percentage of net assets as of March 31, 2007 was as follows:
| | | |
Industrials | | 15.0 | % |
Information Technology | | 14.5 | |
Banking | | 13.6 | |
Materials | | 10.5 | |
Consumer Discretionary | | 10.3 | |
Real Estate – Developers | | 10.2 | |
Consumer Staples | | 6.6 | |
Energy | | 4.1 | |
Telecommunications | | 4.0 | |
Diversified Financials | | 3.9 | |
Investment Companies | | 2.2 | |
Insurance | | 1.4 | |
Utilities | | 0.5 | |
| | | |
| | 96.8 | |
Other assets in excess of liabilities | | 3.2 | |
| | | |
Total | | 100.0 | % |
| | | |
See Notes to Financial Statements.
13
The Asia Pacific Fund, Inc.
Statement of Assets and Liabilities
March 31, 2007
| | | | | | |
Assets | | | | | | |
Investments, at value (cost $147,768,473) | | $ | | | 240,470,012 | |
Cash | | | | | 10,037,037 | |
Foreign currency (cost $142,670) | | | | | 142,615 | |
Dividends and interest receivable | | | | | 425,575 | |
Prepaid assets | | | | | 62,346 | |
| | | | | | |
Total assets | | | | | 251,137,585 | |
| | | | | | |
| | |
Liabilities | | | | | | |
Payable for investments purchased | | | | | 2,076,272 | |
Accrued expenses and other liabilities | | | | | 312,122 | |
Investment management fee payable | | | | | 168,166 | |
Administration fee payable | | | | | 49,261 | |
| | | | | | |
Total liabilities | | | | | 2,605,821 | |
| | | | | | |
Net Assets | | $ | | | 248,531,764 | |
| | | | | | |
| | |
Net assets comprised: | | | | | | |
Common stock, at par | | $ | | | 103,441 | |
Paid-in capital in excess of par | | | | | 131,192,212 | |
| | | | | | |
| | | | | 131,295,653 | |
| | |
Distribution in excess of net investment income | | | | | (428,159 | ) |
Accumulated net realized gains on investments and foreign currency transactions | | | | | 24,969,163 | |
Net unrealized appreciation on investments and foreign currencies | | | | | 92,695,107 | |
| | | | | | |
Net Assets, March 31, 2007 | | $ | | | 248,531,764 | |
| | | | | | |
| | |
Net Asset Value per share:
($248,531,764 ÷ 10,344,073 shares of common stock outstanding) | | $ | | | 24.03 | |
| | | | | | |
See Notes to Financial Statements.
14
The Asia Pacific Fund, Inc.
Statement of Operations
Year ended March 31, 2007
| | | | | | |
Net Investment Income | | | | | | |
| | |
| Income | | | | | | |
Dividends (net of foreign withholding taxes of $463,598) | | $ | | | 4,870,447 | |
Interest | | | | | 42,345 | |
| | | | | | |
Total income | | | | | 4,912,792 | |
| | | | | | |
| Expenses | | | | | | |
Investment management fee | | | | | 1,913,433 | |
Administration fee | | | | | 560,981 | |
Custodian’s fees and expenses | | | | | 287,000 | |
Directors’ fees and expenses | | | | | 280,000 | |
Loan interest expense (Note 6) | | | | | 237,542 | |
Reports to shareholders | | | | | 230,000 | |
Legal fees and expenses | | | | | 216,000 | |
Insurance expenses | | | | | 141,000 | |
Audit fees and expenses | | | | | 53,000 | |
Transfer agent’s fees and expenses | | | | | 35,000 | |
Registration expenses | | | | | 24,000 | |
Miscellaneous | | | | | 132,870 | |
| | | | | | |
Total expenses | | | | | 4,110,826 | |
| | | | | | |
Net investment income | | | | | 801,966 | |
| | | | | | |
| | |
| Realized and Unrealized Gain/(Loss) on Investments and Foreign Currency Transactions | | | | | | |
Net realized gain/(loss) on: | | | | | | |
Investment transactions (net of Indian capital gains taxes of $81,551) | | | | | 39,807,851 | |
Foreign currency transactions | | | | | (225,099 | ) |
| | | | | | |
| | | | | 39,582,752 | |
| | | | | | |
Net change in unrealized appreciation/(depreciation) on: | | | | | | |
Investments (net of change in Indian capital gains taxes of $29,841) | | | | | 26,319,310 | |
Foreign currencies | | | | | (10,592 | ) |
| | | | | | |
| | | | | 26,308,718 | |
| | | | | | |
Net gain on investments and foreign currencies | | | | | 65,891,470 | |
| | | | | | |
| | |
| Net Increase in Net Assets | | | | | | |
| Resulting from Operations | | $ | | | 66,693,436 | |
| | | | | | |
See Notes to Financial Statements.
15
The Asia Pacific Fund, Inc.
Statement of Changes in Net Assets
| | | | | | | | | | |
| | | Year ended March 31 | |
| Increase in Net Assets | | | | 2007 | | | | | 2006 | |
| | | | |
| Operations | | | | | | | | | | |
Net investment income | | $ | | 801,966 | | | $ | | 1,122,159 | |
Net realized gain on investments and foreign currency transactions | | | | 39,582,752 | | | | | 27,100,142 | |
Net change in unrealized appreciation on investments and foreign currencies | | | | 26,308,718 | | | | | 19,297,111 | |
| | | | | | | | | | |
Net increase in net assets resulting from operations | | | | 66,693,436 | | | | | 47,519,412 | |
| | | | | | | | | | |
Dividends paid from net investment income (Note 1) | | | | (2,011,922 | ) | | | | (1,241,289 | ) |
Distributions paid from net realized capital gains (Note 1) | | | | (28,568,260 | ) | | | | (5,792,681 | ) |
| | | | | | | | | | |
Total dividends and distributions | | | | (30,580,182 | ) | | | | (7,033,970 | ) |
| | | | | | | | | | |
Total increase | | | | 36,113,254 | | | | | 40,485,442 | |
| | | | |
| Net Assets | | | | | | | | | | |
Beginning of year | | $ | | 212,418,510 | | | $ | | 171,933,068 | |
| | | | | | | | | | |
End of year | | $ | | 248,531,764 | | | $ | | 212,418,510 | |
| | | | | | | | | | |
See Notes to Financial Statements.
16
The Asia Pacific Fund, Inc.
Notes to Financial Statements
The Asia Pacific Fund, Inc. (the “Fund”) is registered under the Investment Company Act of 1940 as a diversified, closed-end, management investment company. The Fund’s investment objective is to achieve long-term capital appreciation through investment of at least 80% of investable assets in equity securities of companies in the Asia Pacific countries.
| Note 1. | Accounting Policies |
The following is a summary of significant accounting policies followed by the Fund in the preparation of its financial statements.
The Fund’s financial statements are prepared in accordance with U.S. generally accepted accounting principles, which may require the use of management estimates and assumptions. Actual results could differ from these assumptions.
Securities Valuation
Investments are stated at value. Securities for which the primary market is on an exchange are valued at the last sale price on such exchange or market on the day of valuation or, if there was no sale on such day, at the last bid price quoted on such day. Securities for which reliable market quotations are not readily available, or whose value have been affected by events occurring after the close of the security’s foreign market and before the Fund’s normal pricing time, are valued at fair value in accordance with the Board of Director’s approved fair valuation procedures. When determining the fair valuation of securities some of the factors influencing the valuation include, the nature of any restrictions on disposition of the securities; assessment of the general liquidity of the securities; the issuer���s financial condition and the markets in which it does business; the cost of the investment; the size of the holding and the capitalization of issuer; the prices of any recent transactions or bids/offers for such securities or any comparable securities; any available analyst, media or other reports or information regarding the issuer or the markets or industry in which it operates; other analytical data; and consistency with valuation of similar securities held by other funds managed by Baring Asset Management (Asia) Limited. Using fair value to price securities may result in a value that is different from a security’s most recent closing price and from the price used by other mutual funds to calculate their net asset values.
Short-term securities which mature in more than 60 days are valued at current market quotations. Short-term securities which mature in 60 days or less are valued at amortized cost.
In connection with transactions in repurchase agreements with U.S. financial institutions, it is the Fund’s policy that its custodian takes possession of the underlying collateral securities, the value of which exceeds the principal amount of the repurchase transaction, including accrued interest. To the extent that any repurchase transaction exceeds one business day, the value of the collateral is marked-to-market on a daily basis to ensure the adequacy of the collateral. If the seller defaults, and the value of the collateral declines or if bankruptcy proceedings are commenced with respect to the seller of the security, realization of the collateral by the Fund may be delayed or limited.
17
The Asia Pacific Fund, Inc.
Notes to Financial Statements
continued
Foreign Currency Translation
The books and records of the Fund are maintained in United States dollars. Foreign currency amounts are translated into United States dollars on the following basis:
(i) market value of investment securities, other assets and liabilities – at the current rate of exchange.
(ii) purchases and sales of investment securities, income and expenses – at the rate of exchange prevailing on the respective dates of such transactions.
Although the net assets of the Fund are presented at the foreign exchange rates and market values at the close of the fiscal year, the Fund does not isolate that portion of the results of operations arising as a result of changes in the foreign exchange rates from the fluctuations arising from changes in the market prices of securities held at fiscal year end. Similarly, the Fund does not isolate the effect of changes in foreign exchange rates from the fluctuations arising from changes in the market prices of portfolio securities sold during the fiscal year. Accordingly, these realized foreign currency gains (losses) are included in the reported net realized gains (losses) on investment transactions.
Net realized gains (losses) on foreign currency transactions represent net foreign exchange gains (losses) from sales and maturities of short-term securities, holding of foreign currencies, currency gains (losses) realized between the trade and settlement dates on security transactions, and the difference between the amounts of dividends, interest and foreign taxes recorded on the Fund’s books and the US dollar equivalent amounts actually received or paid. Net currency gains (losses) from valuing foreign currency denominated assets, other than investment securities, and liabilities at fiscal year end exchange rates are reflected as a component of unrealized appreciation on investments and foreign currencies.
Foreign security and currency transactions may involve certain considerations and risks not typically associated with those of US companies as a result of, among other factors, the level of governmental supervision and regulation of foreign securities markets and the possibility of political or economic instability.
Security Transactions and Net Investment Income
Security transactions are recorded on the trade date. Realized and unrealized gains (losses) from security and foreign currency transactions are calculated on the identified cost basis. Dividend income is recorded on the ex-dividend date, and interest income and expenses are recorded on an accrual basis. Expenses are recorded on the accrual basis which may require the use of certain estimates by management.
Dividends and Distributions
Dividends from net investment income, if any, are declared and paid at least annually. The Fund will distribute at least annually any net capital gains in excess of net capital loss carryforwards. Dividends and distributions are recorded on the ex-dividend date.
Income distributions and capital gain distributions are determined in accordance with income tax regulations, which may differ from U.S. generally accepted accounting principles.
18
The Asia Pacific Fund, Inc.
Taxes
It is the Fund’s intention to continue to meet the requirements of the US Internal Revenue Code applicable to regulated investment companies and to distribute all of its taxable income to shareholders. Therefore, no federal income tax provision is required.
Withholding taxes on foreign dividends, interest and capital gains have been provided for in accordance with the Fund’s understanding of the applicable country’s tax rules and rates.
| Note 2. | Investment Management and Administration Agreements |
The Fund has a management agreement with Baring Asset Management (Asia) Limited (the “Investment Manager”) and an administration agreement with Prudential Investments LLC (the “Administrator”).
The investment management fee, is computed weekly and payable monthly at the following annual rates: 1.00% of the Fund’s average weekly net assets up to $100 million and 0.70% of such assets in excess of $100 million.
The administration fee is also computed weekly and payable monthly at the following annual rates: 0.25% of the Fund’s average weekly net assets up to $200 million and 0.20% of such assets in excess of $200 million.
Pursuant to the agreements, the Investment Manager provides continuous supervision of the investment portfolio and the Administrator provides occupancy and certain clerical, administrative and accounting services for the Fund. Both the Investment Manager and the Administrator pay the cost of compensation of certain directors and officers of the Fund. The Fund bears all other costs and expenses.
| Note 3. | Portfolio Securities |
Purchases and sales of investment securities, other than short-term investments, for the year ended March 31, 2007 aggregated $201,010,335 and $258,308,878 respectively.
| Note 4. | Distributions and Tax Information |
Distributions to shareholders are determined in accordance with United States federal income tax regulations, which may differ from generally accepted accounting principles. In order to present distribution in excess of net investment income and accumulated net realized gain on investments and foreign currency transactions on the statement of Assets and Liabilities that more closely represent their tax character, certain adjustments have been made to distribution in excess of net investment income and accumulated net realized gain on investments and foreign currency transactions. For the year ended March 31, 2007, the adjustments were to decrease distribution in excess of
19
The Asia Pacific Fund, Inc.
Notes to Financial Statements
continued
net investment income and decrease accumulated net realized gains on investments and foreign currency transactions by $994,494 due to differences in the treatment for book and tax purposes of certain transactions involving foreign securities and currencies and the tax treatment of passive foreign investment securities. Net investment income, net realized gains and net assets were not affected by this change.
For the year ended March 31, 2007 the tax character of dividends and distributions paid as reflected in the Statement of Changes in Net Assets were $4,860,680 of ordinary income and $25,719,502 of long-term capital gains. For the year ended March 31, 2006 the tax character of dividends paid as reflected in the Statement of Changes in Net Assets were $1,241,289 of ordinary income and $5,792,681 of long-term capital gains.
As of March 31, 2007, the accumulated undistributed earnings on a tax basis were $16,297,651 of ordinary income and $14,700,671 of long term-term capital gains. This differs from the amounts shown on the Statement of Assets and Liabilities primarily due to reclassification of net realized foreign currency losses and net realized and unrealized gain (loss) on passive foreign investment companies. The Fund incurred currency losses from November 1, 2006 to March 31, 2007 of approximately $13,500, which it will defer in the current fiscal year and recognize in the fiscal year ending March 31, 2008.
The United States federal income tax basis of the Fund’s investments and the net unrealized appreciation on a tax basis as of March 31, 2007 were as follows:
| | | | | | |
Tax Basis | | Appreciation | | Depreciation | | Total Net
Unrealized Appreciation
(Tax Basis) |
| $154,212,275 | | $86,983,214 | | $(725,477) | | $86,257,737 |
The difference between book basis and tax basis is attributable to deferred losses on wash sales and mark-to-market of unrealized gains on passive foreign investment companies.
The adjusted net unrealized appreciation on a tax basis was $86,251,303 which included other tax basis adjustments of $(6,432) that were primarily attributable to appreciation of foreign currency and mark to market of receivables and payables.
There are 30 million shares of $0.01 par value common stock authorized.
The Fund currently is a party to a committed credit facility with a bank. The credit facility provides for a maximum commitment of $30,000,000 or 20% of the Fund’s net assets, whichever is lower. Interest on any borrowings under the credit facility will be at LIBOR plus 0.50%. The Fund pays a commitment fee of .05% on the unused portion of
20
The Asia Pacific Fund, Inc.
the facility. The commitment fee is accrued daily and paid quarterly. The Fund’s obligations under the credit facility are secured by substantially all the assets of the Fund. The purpose of the credit facility is to assist the Fund with its general cash flow requirements including the provision of portfolio leverage. For the period through July 31, 2006 the Fund was a party to a revolving loan facility with Barings (Guernsey) Limited, an affiliate and wholly owned division of Northern Trust Corporation. The credit facility provided for a maximum commitment of $30,000,000 or 25% of the Fund’s net assets, whichever was lower. Interest on any borrowings under the credit facility was at LIBOR plus 0.75%.
At March 31, 2007, there was no balance outstanding; however during the year ended March 31, 2007, the Fund had an average daily outstanding loan balance of $18,337,349 during the 83 day period that the fund loan was outstanding at an average interest rate of 5.62%. The maximum amount of loan outstanding during the period was $20,000,000. The interest expense during the year ended March 31, 2007 was $237,542.
| Note 7. | New Accounting Pronouncements |
On July 13, 2006, the Financial Accounting Standards Board (FASB) released FASB Interpretation No. 48 “Accounting for Uncertainty in Income Taxes” (FIN 48). FIN 48 provides guidance for how uncertain tax positions should be recognized, measured, presented and disclosed in the financial statements. FIN 48 requires the evaluation of tax positions taken or expected to be taken in the course of preparing the Fund’s tax returns to determine whether the tax positions are “more-likely-than-not” of being sustained by the applicable tax authority. The impact of the tax positions not deemed to meet the more-likely-than-not threshold would be recorded in the year in which they arise. On December 22, 2006 the Securities and Exchange Commission delayed the effective date until September 28, 2007. At this time, management is evaluating the implications of FIN 48 and its impact, if any, on the financial statements has not yet been determined.
On September 20, 2006, the FASB released Statement of Financial Accounting Standards No. 157 “Fair Value Measurements” (FAS 157). FAS 157 establishes an authoritative definition of fair value, sets out a framework for measuring fair value, and requires additional disclosures about fair-value measurements. The application of FAS 157 is required for fiscal years beginning after November 15, 2007 and interim periods within those fiscal years. At this time, management is evaluating the implications of FAS 157 and its impact, if any, on the financial statements has not yet been determined.
21
The Asia Pacific Fund, Inc.
Financial Highlights
| | | | | | |
| |
| | | Year ended March 31, | |
| Per Share Operating Performance: | | 2007 | | | 2006 | |
Net asset value, beginning of year | | $20.54 | | | $16.62 | |
| | | | | | |
Net investment income | | 0.08 | | | 0.11 | |
Net realized and unrealized gain (loss) on
investment and foreign currency
transactions | | 6.37 | | | 4.49 | |
| | | | | | |
Total from investment operations | | 6.45 | | | 4.60 | |
| | | | | | |
Less dividends and distributions: | | | | | | |
Dividends from net investment income | | (0.20 | ) | | (0.12 | ) |
| | |
Distributions paid from capital gains | | (2.76 | ) | | (0.56 | ) |
| | | | | | |
Total dividends and distributions | | (2.96 | ) | | (0.68 | ) |
| | | | | | |
Increase resulting from tender offer | | — | | | — | |
| | | | | | |
Net asset value, end of year | | $24.03 | | | $20.54 | |
| | | | | | |
Market value, end of year | | $21.22 | | | $18.39 | |
| | | | | | |
Total investment return (a) | | 30.39 | % | | 30.32 | % |
| | | | | | |
| | | |
| Ratios to Average Net Assets: | | | | | | |
Total expenses (including loan interest) (b) | | 1.78 | % | | 2.24 | % |
Net investment income | | 0.35 | % | | 0.61 | % |
| | |
| Supplemental Data: | | | | | | |
Average net assets (000 omitted) | | $230,490 | | | $184,611 | |
Portfolio turnover rate | | 86 | % | | 122 | % |
Net assets, end of year (000 omitted) | | $248,532 | | | $212,419 | |
| (a) | Total investment return is calculated assuming a purchase of common stock at the current market value on the first day and a sale at the current market value on the last day of each fiscal year reported. Dividends and distributions are assumed, for purposes of this calculation, to be reinvested at prices obtained under the Fund’s dividend reinvestment plan. These calculations do not include brokerage commissions. |
| (b) | The expense ratio without loan interest expense would have been 1.68% and 1.78%, for the fiscal years ended March 31, 2007 and 2006, respectively. |
| | Shown above is selected data for a share of common stock outstanding, total investment return, ratios to average net assets and other supplemental data for the periods indicated. This information has been determined based upon information provided in the financial statements and market price data for the Fund’s shares. |
See Notes to Financial Statements.
22
The Asia Pacific Fund, Inc.
| | | | | | | | | | | | | |
| |
| | | Year ended March 31, | |
| Per Share Operating Performance: | | 2005 | | | | | 2004 | | | | | 2003 | |
Net asset value, beginning of year | | $14.90 | | | | | $9.10 | | | | | $11.67 | |
| | | | | | | | | | | | | |
Net investment income | | 0.18 | | | | | 0.09 | | | | | 0.01 | |
Net realized and unrealized gain (loss) on investment and foreign currency transactions | | 1.69 | | | | | 5.89 | | | | | (2.77 | ) |
| | | | | | | | | | | | | |
Total from investment operations | | 1.87 | | | | | 5.98 | | | | | (2.76 | ) |
| | | | | | | | | | | | | |
Less dividends and distributions: | | | | | | | | | | | | | |
Dividends from net investment income | | (0.15 | ) | | | | (0.18 | ) | | | | — | |
| | | | | |
Distributions paid from capital gains | | — | | | | | — | | | | | — | |
| | | | | | | | | | | | | |
Total dividends and distributions | | (0.15 | ) | | | | (0.18 | ) | | | | — | |
| | | | | | | | | | | | | |
Increase resulting from tender offer | | — | | | | | — | | | | | 0.19 | |
| | | | | | | | | | | | | |
Net asset value, end of year | | $16.62 | | | | | $14.90 | | | | | $9.10 | |
| | | | | | | | | | | | | |
Market value, end of year | | $14.65 | | | | | $13.90 | | | | | $8.10 | |
| | | | | | | | | | | | | |
Total investment return (a) | | 6.48 | % | | | | 73.83 | % | | | | (19.96 | )% |
| | | | | | | | | | | | | |
| | | | | | |
| Ratios to Average Net Assets: | | | | | | | | | | | | | |
Total expenses (including loan interest) (b) | | 2.01 | % | | | | 2.06 | % | | | | 2.25 | % |
Net investment income | | 1.18 | % | | | | 0.74 | % | | | | 0.09 | % |
| | | | | |
| Supplemental Data: | | | | | | | | | | | | | |
Average net assets (000 omitted) | | $155,484 | | | | | $128,632 | | | | | $122,681 | |
Portfolio turnover rate | | 73 | % | | | | 73 | % | | | | 34 | % |
Net assets, end of year (000 omitted) | | $171,933 | | | | | $154,135 | | | | | $94,127 | |
| (a) | Total investment return is calculated assuming a purchase of common stock at the current market value on the first day and a sale at the current market value on the last day of each fiscal year reported. Dividends and distributions are assumed, for purposes of this calculation, to be reinvested at prices obtained under the Fund’s dividend reinvestment plan. These calculations do not include brokerage commissions. |
| (b) | The expense ratio without loan interest expense would have been 1.94%, 2.03% and 2.24% for the fiscal years ended March 31, 2005, 2004 and 2003, respectively. |
| | Shown above is selected data for a share of common stock outstanding, total investment return, ratios to average net assets and other supplemental data for the periods indicated. This information has been determined based upon information provided in the financial statements and market price data for the Fund’s shares. |
See Notes to Financial Statements.
23
The Asia Pacific Fund, Inc.
Report of Ernst & Young LLP, Independent Registered Public Accounting Firm
To the Shareholders and Board of Directors
of The Asia Pacific Fund, Inc.
We have audited the accompanying statement of assets and liabilities of The Asia Pacific Fund, Inc. (“The Fund”), including the portfolio of investments, as of March 31, 2007, and the related statement of operations for the year then ended, the statement of changes in net assets for each of the two years in the period then ended and financial highlights for each of the five years in the period then ended. These financial statements and financial highlights are the responsibility of the Fund’s management. Our responsibility is to express an opinion on these financial statements based on our audits.
We conducted our audits in accordance with Standards of the Public Company Accounting Oversight Board (United States). Those standards require that we plan and perform the audit to obtain reasonable assurance about whether the financial statements and financial highlights are free of material misstatement. We were not engaged to perform an audit of the Fund’s internal control over financial reporting. Our audits included consideration of internal control over financial reporting as a basis for designing audit procedures that are appropriate in the circumstances, but not for the purpose of expressing an opinion on the effectiveness of the Fund’s internal control over financial reporting. Accordingly, we express no such opinion. An audit also includes examining, on a test basis, evidence supporting the amounts and disclosures in the financial statements and financial highlights, assessing the accounting principles used and significant estimates made by management, and evaluating the overall financial statement presentation. Our procedures included confirmation of securities owned as of March 31, 2007, by correspondence with the custodian and others. We believe that our audits provide a reasonable basis for our opinion.
In our opinion, the financial statements and financial highlights referred to above present fairly, in all material respects, the financial position of The Asia Pacific Fund, Inc., at March 31, 2007, and the results of its operations for the year then ended, the changes in its net assets for each of the two years in the period then ended and the financial highlights for each of the five years in the period then ended, in conformity with U.S. generally accepted accounting principles.
ERNST & YOUNG LLP
New York, New York
May 17, 2007
24
The Asia Pacific Fund, Inc.
U.S. Federal Tax Information (Unaudited)
Dividends and Distributions
As required by the U.S. Internal Revenue Code, we wish to advise you as to the federal tax status of dividends and distributions paid by the Fund during its fiscal year ended March 31, 2007.
During the fiscal year ended March 31, 2007, the Fund paid $0.47 per share of ordinary income dividends and $2.49 per share of long-term capital gain distributions.
For the fiscal year ended March 31, 2007, the Fund designated 71.73% of ordinary income distributions as qualified dividend income for the reduced tax rate under The Jobs and Growth Tax Relief Reconciliation Act of 2003.
The Fund intends to designate 58.61% of the ordinary income dividends as qualified under The American Jobs Act of 2004.
The Fund has elected to give the benefit of foreign tax credits to its shareholders. Accordingly, shareholders who must report their gross income dividends and distributions in a federal tax return will be entitled to a foreign tax credit, or an itemized deduction, in computing their U.S. income tax liability. It is generally more advantageous to claim a credit rather than to take a deduction. For the fiscal year ended March 31, 2007, the Fund intends on passing through $542,011 of ordinary income distributions as a foreign tax credit from recognized foreign source income of $6,105,478.
For purposes of preparing your federal income tax return, however, you should report the amounts as reflected on the appropriate Form 1099-DIV or substitute Form 1099-DIV which you received in January of each year.
25
The Asia Pacific Fund, Inc.
Dividend Reinvestment Plan (Unaudited)
Shareholders may elect to have all distributions of dividends and capital gains automatically re-invested in Fund shares (“Shares”) pursuant to the Fund’s Dividend Reinvestment Plan (“the Plan”). Shareholders who do not participate in the Plan will receive all distributions in cash paid by check in United States Dollars mailed directly to the shareholders of record (or if the shares are held in street or other nominee name, then to the nominee) by the custodian, as dividend disbursing agent. Shareholders who wish to participate in the Plan should complete the attached enrollment card or contact the Fund at 1-(800) 451-6788.
After the Fund declares a dividend or determines to make a capital gains distribution, if (1) the market price is lower than net asset value, the participants in the Plan will receive the equivalent in Shares valued at the market price determined as of the time of purchase (generally, following the payment date of the dividend or distribution); or if (2) the market price of Shares on the payment date of the dividend or distribution is equal to or exceeds their net asset value, participants will be issued Shares at the higher of net asset value or 95% of the market price.
There is no charge to participants for reinvesting dividends or capital gain distributions, except for certain brokerage commissions, as described below. The Plan Agent’s (Computershare Trust Co., formerly known as Equiserve) fees for the handling of the reinvestment of dividends and distributions will be paid by the Fund. There will be no brokerage commissions charged with respect to shares issued directly by the Fund. However, each participant will pay a pro rata share of brokerage commissions incurred with respect to the Plan Agent’s open market purchases in connection with the reinvestment of dividends and distributions. The automatic reinvestment of dividends and distributions will not relieve participants of any federal income tax that may be payable on such dividends or distributions.
The Fund reserves the right to amend or terminate the Plan upon 90 days’ written notice to shareholders of the Fund.
Participants in the Plan may withdraw from the Plan upon written notice to the Plan Agent and will receive certificates for whole Shares and cash for fractional Shares.
26
The Asia Pacific Fund, Inc.
Miscellaneous Information (Unaudited) Proxy Voting
Information regarding the policies and procedures that the Fund uses to determine how to vote proxies relating to portfolio securities is available:
| • | | Without charge, by calling the Fund’s toll-free telephone number (888) “ASIA-PAC”. |
| • | | On the Securities and Exchange Commission website, http://www.sec.gov. |
Information regarding the Fund’s proxy voting policies and procedures and its proxy voting record for the 12-month period ending June 30 of each year is filed with the SEC on Form N-PX no later than August 31 of each year. The Fund’s Form N-PX is available without charge, upon request, by calling the Fund at its toll free number 1-(888) 4-ASIA-PAC and on the SEC’s website (http://www.sec.gov).
New York Stock Exchange and Securities and Exchange Commission Certifications
The Fund is listed on the New York Stock Exchange. As a result, it is subject to certain corporate governance rules and related interpretations issued by the exchange. Pursuant to those requirements, the Fund must include information in this report regarding certain certifications.
The Fund’s President and Treasurer file certifications with the Securities and Exchange Commission regarding the quality of the Fund’s public disclosure. The certifications are made pursuant to Section 302 of the Sarbanes-Oxley Act (“Section 302 Certifications”). The section 302 Certifications are filed as exhibits to the Fund’s annual report on Form N-CSR, which include a copy of the annual report together with certain other information about the Fund.
Availability of Quarterly Portfolio Schedule
The Fund files its complete schedule of portfolio holdings with the Commission for the first and third quarters of each fiscal year on Form N-Q. The Fund’s N-Q Forms are available on the Commission’s website at http://www.sec.gov. The Fund’s N-Q Forms may also be reviewed and copied at the Commission’s Public Reference Room in Washington, D.C. Information on the operation of the Public Reference Room may be obtained by calling (800) SEC-0330 (732-0330).
27
The Asia Pacific Fund, Inc.
Directors and Officers of the Fund (Unaudited)
Information pertaining to the Directors of the Fund is set forth below. Directors who are not deemed to be “interested persons” of the Fund as defined in the Investment Company Act of 1940, as amended (the 1940 Act) are referred to as “Independent Directors.” Directors who are deemed to be “interested persons” of the Fund are referred to as “Interested Directors.” The “Fund Complex” consists of the Fund and any other investment companies managed by Baring Asset Management (Asia) Limited (the Investment Manager).
Independent Directors
| | | | | | |
Name, Address** and Age | | Positions With Fund | | Term of Office***
and Length of Time Served | | |
| | | |
| Jessica M. Bibliowicz (47) | | Director (Class II***) | | Since 2006 | | |
| | | |
| Robert H. Burns (77) | | Director (Class II***) | | Since 1986 | | |
| | | |
| Olarn Chaipravat (62) | | Director (Class I***) | | Since 1986 | | |
| | | |
| Michael J. Downey (63) | | Director and Chairman (Class I***) | | Since 1986 Since 1999 | | |
| | | |
| Douglas Tong Hsu (64) | | Director (Class II***) | | Since 1986 | | |
| | | |
| Duncan M. McFarland (63) | | Director (Class I***) | | Since 2005 | | |
| | | |
| David G. P. Scholfield (63) | | Director (Class II***) | | Since 1988 | | |
28
The Asia Pacific Fund, Inc.
| | | | |
Principal Occupations During Past 5 Years | | Number of
Portfolios in
Fund Complex
Overseen by
Director | | Other Directorships Held by the
Director**** |
| | |
| President and Chief Executive Officer of National Financial Partners. (NYSE:NFP), an independent distributor of financial services products. Formerly, President and Chief Operating Officer of John A. Levin & Co., a registered investment advisor. | | 1 | | |
| | |
| Chairman, Robert H. Burns Holdings Limited (an investment business), Hong Kong; formerly, Chairman and Chief Executive Officer, Regent International Hotels Limited, Hong Kong. | | 1 | | |
| | |
| Formerly, President and Chief Executive Officer (October 1992-January 1999), Director and Senior Executive Vice President (July 1990-September 1992) and Senior Executive Vice President (September 1987-June 1990), The Siam Commercial Bank, Public Company Limited, Thailand. | | 1 | | |
| | |
| Private Investor; formerly Managing Partner Lexington Capital LLC (1997-2004). | | 1 | | Director, AllianceBernstein L.P. Mutual Fund Complex. |
| | |
| Chairman and Chief Executive Officer, Far Eastern Textile Ltd., Taiwan. | | 1 | | |
| | |
| Formerly, Managing Partner and Chief Executive Officer, Wellington Management Company, LLP. (1994-2004); Trustee, Financial Accounting Foundation (since 2001). | | 1 | | Director of Gannett Co., Inc. and
NYSE Euronext. |
| | |
| Formerly, Managing Director Hong Kong, Bank of Bermuda Ltd. (1998-2004). | | 1 | | |
29
The Asia Pacific Fund, Inc.
Directors and Officers of the Fund (Unaudited)
continued
Independent Directors continued
| | | | | | |
Name, Address** and Age | | Positions
With Fund | |
Term of Office***
and Length of
Time Served | | |
| | | |
| Nicholas T. Sibley (68) | | Director (Class III***) | | Since 2001 | | |
Interested Directors
| | | | | | |
Name, Address** and Age | | Positions
With Fund | |
Term of Office***
and Length of
Time Served | | |
| | | |
| David J. Brennan (49)* | | Director (Class III***) | | Since 1990 | | |
| | | |
| Robert F. Gunia (60)* | | Vice President, Director and Treasurer (Class III***) | | Since 1988 Since 1989 Since 1999 | | |
30
The Asia Pacific Fund, Inc.
| | | | | | |
| | | Principal Occupations
During Past 5 Years | | Number of
Portfolios in
Fund Complex
Overseen by
Director | | Other Directorships
Held by the
Director**** |
| | | |
| | Fellow of the Institute of Chartered Accountants in England and Wales; Chairman of Aquarius Platinum Ltd.; Director of Tanzanite One Limited | | 1 | | Director of Corney and Barrow Group Ltd. |
| | | | | | |
| | | Principal Occupations
During Past 5 Years | | Number of
Portfolios in
Fund Complex
Overseen by
Director | | Other Directorships
Held by the
Director**** |
| | | |
| | Chairman and Chief Executive Officer, Baring Asset Management Holdings Limited; Chairman, Baring Asset Management Holdings, Inc.; Chairman, and Chief Executive Officer, Baring Asset Management Ltd.; Chairman, Baring Asset Management (Asia) Ltd.; Chairman, Barings (Guernsey) Ltd.; Chairman, Baring Asset Management, Inc.; Chairman and Chief Executive Officer, Baring International Investment Ltd.; Non-Executive Director, Baring Asset Management (Japan) Ltd. | | 1 | | |
| | | |
| | Chief Administrative Officer (since September 1999) and Executive Vice President (since April 1999) of Prudential Investments LLC; President (since April 1999) of Prudential Investment Management Services LLC; Executive Vice President (since March 1999) and Treasurer (since May 2000) of Prudential Mutual Fund Services LLC; Chief Administrative Officer, Executive Vice President and Director (since May 2003) of AST Investment Services, Inc. | | 1 | | Vice President and Director of 143 Funds in the Prudential Mutual Fund complex. |
31
The Asia Pacific Fund, Inc.
Directors and Officers of the Fund (Unaudited)
continued
Information pertaining to the Officers of the Fund who are not also Directors is set forth below.
Officers
| | | | | | |
| | | |
Name, Address** and Age | | Positions
With Fund | | Term of Office*** and Length of
Time Served | | |
| | | |
Brian A. Corris (48) | | President | | Since 2007 | | |
| | | |
| M. Sadiq Peshimam (43) | | Assistant
Treasurer | | Since 2005 | | |
| | | |
| Deborah A. Docs (49) | | Secretary
Chief Legal Officer
Assistant Secretary | | Since 1998
Since 2006
1989-1998 | | |
| | | |
Valerie M. Simpson (48) | | Chief Compliance
Officer | | Since 2007 | | |
| | | |
| Lee D. Augsburger (47) | | Deputy Chief
Compliance
Officer | | Since 2004 | | |
32
The Asia Pacific Fund, Inc.
| | | | |
| | |
| | |
Principal Occupations During Past 5 Years | | |
| | |
| | Director of Institutional Group of Baring Asset Management (since October 2005); formally Head of Institutional Pension Funds at Isis Asset Management (2000-2005). | | |
| | |
| | Vice President (since 2005) and Director (2000-2005) within Prudential Mutual Fund Administration. | | |
| | |
| | Vice President and Corporate Counsel (since January 2001) of Prudential; Vice President (since December 1996) and Assistant Secretary (since March 1999) of PI.; formerly Vice President and Assistant Secretary (May 2003-June 2005) of AST Services, Inc. | | |
| | |
| | Vice President and Senior Compliance Officer (since March 2006) of Prudential Investments; Vice President—Financial Reporting (since March 2006) for Prudential Life and Annuities Finance | | |
| | |
| | Senior Vice President and Chief Compliance Officer (since April 2003) of PI; Vice President (since November 2000) and Chief Compliance Officer (since October 2000) of Prudential Investment Management, Inc.; Chief Compliance Officer and Senior Vice President (since May 2003) of AST Services, Inc. | | |
| | * | Mr. Brennan is an “Interested person”, as defined in the 1940 Act, because of his employment with the Investment Manager, and Mr. Gunia is an “Interested person” because he is an officer of the Fund. |
| | ** | The address of the Directors and Officers is c/o: Prudential Investments LLC, Gateway Center Three, 100 Mulberry Street, Newark, New Jersey, 07102-4077. |
| | *** | The Fund’s Charter and Bylaws provide that the Board of Directors is divided into three classes of Directors, as nearly equal in number as possible. Each Director serves for a term of three years, with one class being elected each year. Each year the term of office of one class will expire. |
| | **** | This column includes only directorships of companies required to register, or file reports with the Commission under the Securities Exchange Act of 1934 (the Exchange Act) (i.e., “public companies”) or other investment companies registered under the 1940 Act. |
33
KNP Print Ltd • London • 020-8676 0019
Why should you consider reinvesting?
· It’s Convenient – Fund shares are automatically purchased for you.
· It Saves Money – Invest at no brokerage cost or at reduced costs.
· It’s Smart – By regularly reinvesting dividends and capital gains, you will be following the time-tested investment approach called “Dollar Cost Averaging”, that actually allows you to purchase more shares when prices are low and less when they are high. Dollar Cost Averaging does not assure a profit and does not protect against loss in declining markets. Such a plan involves continuous investment in securities regardless of fluctuating price levels of such securities and investors should consider their financial ability to continue participating in such a plan. Over time the average cost per share is usually lower than if the entire investment had been made all at once!
· It’s More Efficient – There’s no extra paperwork. You’ll regularly receive an account statement that shows total dividends, date of investment and number of shares purchased.
· If your shares are held through a brokerage firm, bank or other nominee, you should instruct them to participate on your behalf. If they are unable to accommodate your request, you may wish to register your shares in your own name, which will enable you to participate directly in the plan.
Help Your Asia Pacific Fund Shares Grow
One of the easiest – and smartest – ways is by choosing to automatically reinvest your dividends and capital gains. This disciplined investment approach harnesses the asset building power of compounding that provides the potential for your money to grow faster.
¨ Yes! Send me a reinvestment brochure.
| | |
Name (Please Print) |
Street | | City |
State/Zip Code | | Daytime Telephone |
Financial Adviser, if any |
Firm |
City | | |
Asset Building the Easy Way ...
Reinvest Your Dividends
Call 1-800-451-6788
In the United States
Or Send in This Card
Place
Stamp
Here
COMPUTERSHARE TRUST COMPANY N.A.
P.O. BOX 43011
PROVIDENCE, RI 02940-3011
USA


155 Bishopsgate, London EC2M 3XY
Telephone +44 (0)20-7628 6000
Facsimile +44 (0)20-7638 7928
Internet www.barings.com
• LONDON • BOSTON • FRANKFURT •
• GUERNSEY • HONG KONG •
• PARIS • SAN FRANCISCO •
• TAIPEI • TOKYO • TORONTO •
• VIENNA •
APBA
Item 2 – Code of Ethics – – See Exhibit (a)
As of the end of the period covered by this report, the registrant has adopted a code of ethics (the “Section 406 Standards for Investment Companies – Ethical Standards for Principal Executive and Financial Officers”) that applies to the registrant’s Principal Executive Officer and Principal Financial Officer; the registrant’s Principal Financial Officer also serves as the Principal Accounting Officer.
The registrant hereby undertakes to provide any person, without charge, upon request, a copy of the code of ethics. To request a copy of the code of ethics, contact the registrant 973-367-7521, and ask for a copy of the Section 406 Standards for Investment Companies—Ethical Standards for Principal Executive and Financial Officers.
Item 3 – Audit Committee Financial Expert –
The registrant’s Board has determined that Mr. Nicholas T. Sibley, member of the Board’s Audit Committee is an “audit committee financial expert” and that he is “independent” for purpose of this Item.
Item 4 – Principal Accountant Fees and Services –
For the fiscal years ended March 31, 2007 & 2006 Ernst & Young LLP, the Registrant’s principal accountant, billed the Registrant $53,000 & $51,000 respectively, for professional services rendered for the audit of the Registrant’s annual financial statements or services that are normally provided in connection with statutory and regulatory filings.
None.
None.
None.
| (e)(1) | Audit Committee Pre-Approval Policies and Procedures |
The Audit committee must pre-approve, or adopt appropriate procedures to pre-approve, all audit and non-audit services to be provided by the independent auditors, including applicable non-audit services provided to the Company’s investment adviser and any entity in a control relationship with the investment adviser that provides ongoing services to the Company that relate directly to the operations and financial reporting of the Company.
| (e)(2) | Percentage of services referred to in 4(b)- (4)(d) that were approved by the audit committee – |
Not applicable.
| (f) | Percentage of hours expended attributable to work performed by other than full time employees of principal accountant if greater than 50%. |
Not applicable.
Not applicable to Registrant and to the registrant’s investment adviser and any entity controlling, controlled by, or under common control with the investment adviser that provides ongoing services to the registrant.
| (h) | Principal Accountants Independence |
Not applicable as Ernst & Young has not provided non-audit services to the registrant’s investment adviser and any entity controlling, controlled by, or under common control with the investment adviser that provides ongoing services to the registrant that were not pre-approved pursuant to Rule 2-01(c)(7)(ii) of Regulation S-X.
Item 5 – Audit Committee of Listed Registrants –
The registrant has a separately designated standing audit committee (the “Audit Committee”) established in accordance with Section 3(a)(58)(A) of the Securities Exchange Act of 1934. The members of the Audit Committee are David G.P. Scholfield (Chairman), Robert H. Burns, Michael J. Downey, Duncan M. McFarland and Nicholas T. Sibley.
Item 6 – Schedule of Investments – The schedule is included as part of the report to shareholders filed under Item 1 of this Form.
Item 7 – Disclosure of Proxy Voting Policies and Procedures for Closed-End Management Investment Companies –
Baring Asset Management, Inc.
Baring International Investment Limited
Baring Asset Management (Asia)
(together, the “Companies”)
Section Three
Proxy Voting Policies and Procedures
For North American Clients
Executive Summary
The Companies owe fiduciary, contractual, and statutory duties to vote proxies on the securities that we manage for many of our clients. A breach of our proxy voting responsibilities may
lead to financial and reputational damage to the Companies. Proxy proposals are reviewed and transmitted to Barings’ third party proxy administrator (“ISS”) by the Global Events department in London. However, investment managers (or SIT heads, if investment managers are indisposed) are principally responsible for ensuring that proxy voting in respect of their portfolio holdings takes place in accordance with these procedures. For proxies concerning routine corporate governance matters, the Companies generally vote in favor of management proposals or with managements’ recommendations. For “non-routine” matters, investment managers must determine the proxy vote that will maximize the value of clients’ securities holdings.
Summary responsibilities are set forth below:
Investment Managers:
| | • | | Identify and ensure the Global Events department is aware of impending shareholder meetings and proxy proposals regarding non-routine matters; |
| | • | | Instruct the Global Events department regarding the proxy votes to be cast on all “non-routine” matters; |
| | • | | Seek approval from the Proxy Voting Committee prior to casting proxy votes contrary to these Proxy Voting Policies; and |
| | • | | Ensure that the Proxy Voting Policies are implemented in regard to the proxies appurtenant to securities in their portfolios. |
The Global Events Department:
| | • | | Collects proxy proposals from ISS and investment managers; |
| | • | | Reviews proxies to gauge whether proposals concern “routine” matters at annual shareholder meetings, in which case custodians are instructed to vote “for” management; |
| | • | | Distributes proxies concerning all “non-routine” proposals to investment managers, and collects completed proxy voting instructions from investment managers; |
| | • | | Verifies that Proxy Voting Committee approval has been granted for any proxy vote to be cast that is contrary to these Policies; |
| | • | | Notifies ISS regarding the votes cast by the Companies; and |
| | • | | Maintains records of the Companies’ proxy votes, and the reasons therefore, for review by investment managers, clients, and government agencies. |
The Proxy Voting Committee:
| | • | | Establishes and reviews the Companies’ proxy voting policies; |
| | • | | Advises investment managers upon request regarding unusual proxy proposals; |
| | • | | Reviews recommendations of investment managers who suggest casting proxy votes that are contrary to the Companies’ policies; and |
| | • | | Reviews, quarterly, the proxy votes cast by the Companies. |
The Onsite system identifies clients for whom the Companies vote proxies. The Global Events and Legal departments can provide additional details, if needed.
The Companies have prepared a synopsis of these procedures that may be disseminated to clients and prospective clients of the Companies. Please contact the Client Services department for a copy of that synopsis. In addition, Clients may obtain a complete copy of the Companies’ proxy voting policies and procedures by contacting Baring Asset Management, Inc.’s Legal and Compliance Department at (617) 946-5200.
Section Three
Proxy Voting Policies and Procedures
For North American Clients
| A. | Overview of the Companies’ Proxy Voting Responsibilities |
1. Clients That Are Affected By These Policies
For many clients, the Companies have assumed contractual responsibility to vote proxies on the securities that we manage for those clients’ accounts. For ERISA clients (i.e., employee benefit plans formed pursuant to the Employee Retirement Income Security Act of 1974), the Companies owe fiduciary and statutory duties to vote proxies on client securities unless the clients explicitly have retained the obligation to do so. The Companies vote proxies for those North American clients who have invested in certain commingled funds maintained by Bankers Trust Co. (the “BIFIT” and “Big T” funds), but do not vote proxies for clients who have invested in the “active/passive” commingled funds maintained at State Street Bank, which retains authority to vote proxies for those clients. Please review the Onsite system or contact the Global Events or Legal departments to ascertain whether a particular client has delegated proxy voting responsibility to the Companies.
2. Investment Managers Must Ensure That Proxy Voting On Securities
In Their Portfolios Takes Place In Accordance With These Procedures
The Global Events department in London (tel. ext. 1536, fax ext. 1742) coordinates the collection of proxy proposals, instructs ISS on proxy votes, and maintains records, by client and security, of proxy votes and the reasons therefore. Investment managers, however, are most familiar with the companies that have issued proxies and the potential ramifications on corporate governance and share values of particular proxy votes. Consequently, investment managers must identify and ensure that the Global Events department is aware of impending shareholder meetings and proxy proposals (as described below), and instruct the Global Events department on how votes should be cast. Investment managers are primarily responsible for ensuring that proxies on holdings in their portfolios are voted in accordance with these procedures.
3. The Proxy Voting Committee
The Companies have established a Proxy Voting Committee to set policies and review, at least quarterly, the proxy votes that were cast by the Companies. The Proxy Voting Committee is available to investment managers, analysts, and other personnel for advice on voting unusual proxy proposals. Investment managers who recommend casting proxy votes that are contrary to the Companies’ policies must contact the Proxy Voting Committee before instructing the Global Events department on how such votes should be cast, and present reasons for recommending votes that are contrary to policies. The Global Events department will record whether investment managers have instructed how the Companies should vote on non-routine proxy matters and ensure that Investment Managers have sought guidance from the Proxy Voting Committee before casting votes that contravene the Companies Proxy Voting Policies. For additional information or assistance, please contact Amanda Bustard (London, ext. 1529) or Daniel P. Barry (Boston, ext. 5311).
| B. | Proxy Voting Procedures |
| 1. | The Companies employ a third-party vendor, ISS, to review specific proposals and notify the Companies of upcoming shareholder meetings. |
| 2. | In most cases, the Global Events department will determine whether a proxy proposal concerns a routine matter or a non-routine matter (see “Proxy Voting Policies, #3” below.) The Global Events department maintains “standing instructions” (described below) that direct ISS to vote routine proposals at annual shareholder meetings for issuers located in geographic regions with well-established markets. Despite standing instructions, the Global Events department endeavors to review each proxy proposal to ensure that non-routine proposals (regarding, for example, a merger, acquisition, or the implementation of anti-takeover measures) are identified and forwarded to appropriate investment managers for full consideration. To reiterate, however, investment managers are responsible for ensuring that non-routine matters are identified as such and voted in a manner designed to maximize the value of client securities holdings. Investment managers must ensure that the Global Events department is aware of pending non-routine proposals and advise the Global Events department accordingly. |
| 3. | The Global Events department reconciles proxies with client holdings. The Global Events department additionally maintains records, by client and security issuer, of each proxy vote cast and the reasons therefore. The Global Events department will keep and maintain such records for inspection by clients and government agencies. |
| 4. | Special Circumstances: Some non-U.S. securities issuers impose fees on shareholders or their custodians for exercising the right to vote proxies. Other issuers may “block,” or prohibit, shareholders from transferring or otherwise disposing of their shares for a period of time after the securities holders have noticed their intent to vote their proxies. Moreover, some issuers require the registration of securities in the name of the beneficial owners before permitting proxies to be cast, and thus mandate the disclosure of the identity of beneficial owners of securities, which may be contrary to our clients’ wishes. In these instances, the Global Events department will notify the appropriate investment managers of the costs or restrictions that may apply in voting proxies. Investment managers and the Global Events department, with guidance from the Proxy Voting Committee if desired, will weigh the economic benefit to our clients of voting those proxies against the cost of doing so. |
The U.S. Department of Labor (the “U.S. Labor Department”), which enforces ERISA, recognizes that ERISA clients may incur additional costs in voting proxies appurtenant to shares of non-U.S. corporations. The U.S. Labor Department advises that investment advisers, such as the Companies, should weigh the effect of voting our clients’ shares against the cost of voting. Moreover, in choosing whether to purchase the shares of certain non-U.S. corporations, the Companies’ investment
managers should consider whether the difficulty and expense of voting the proxies is reflected in the market price of those shares. Investment managers should consult the Global Events department to ascertain the anticipated costs of voting proxies on certain non-U.S. corporations.
| 1. | The Companies’ fiduciary obligation is to maximize the value of our clients’ shareholdings, and our proxy voting decisions are made with that aim. For ERISA clients, the U.S. Labor Department has stated that |
“where proxy voting decisions may have an effect on the economic value of the plan’s underlying investment, plan fiduciaries (i.e., investment advisers) should make proxy voting decisions with a view to enhancing the value of the shares of stock.”
| 2. | The Companies will vote proxies on all proposals, except in those instances when investment managers determine that the economic returns of voting proxies issued by non-U.S. corporations are outweighed by the costs that would be incurred by client accounts. |
| 3. | The Companies follow general voting guidelines, but recognize the importance of reviewing each proposal. The Companies’ voting guidelines concern, for the most part, proxies on “routine,” or non-controversial, matters of corporate governance. Investment managers ultimately are responsible for determining whether a proposal concerns a routine matter or a non-routine matter. |
| 4. | The Companies generally vote in favor of management proposals on the following ballot items: |
| | a. | re-election of directors who have satisfied their fiduciary duties; |
| | b. | amendments to employee benefit plans; |
| | c. | approval of independent auditors; |
| | d. | directors’ and auditors’ compensation; |
| | e. | directors’ and officers’ indemnification; |
| | f. | financial statements and allocation of income; |
| | h. | authorization of share repurchase programs; and |
| | i. | elimination of cumulative voting. |
| 5. | Investment managers are responsible for advising the Global Events department on how votes should be cast on the following “non-routine” ballot measures: |
| | a. | changes to the issuer’s capitalization due to the addition or elimination of classes of stock and voting rights; |
| | b. | changes to the issuer’s capitalization due to stock splits and stock dividends; |
| | c. | the elimination of pre-emptive rights for share issuance; |
| | d. | the creation of, or changes to, anti-takeover measures, including shareholder rights plans (i.e., “poison pill” plans); |
| | e. | stock option plans, and other stock-based employee compensation or incentive plans; |
| | f. | the addition, deletion, or changes to super-majority voting requirements; |
| | g. | mergers or acquisitions; |
| | h. | the establishment or alteration of classified boards of directors; and |
| | i. | change-in-control provisions in management compensation plans. |
| 6. | The Companies examine shareholder proposals in the same light that we review management proposals: to determine whether such proposals will maximize overall returns on our clients’ shareholdings, in accordance with ERISA and our fiduciary duties. The Companies generally vote in favor of the following ballot items, that often are proposed by shareholders: |
| | a. | requiring auditors to attend the corporation’s annual shareholders’ meeting; |
| | b. | establishing an annual election of the board of directors; |
| | c. | establishing audit, nominating, or compensation committees; |
| | d. | requiring shareholder approval of amendments to the by-laws and corporate articles; |
| | e. | requiring a shareholder vote on the creation of shareholder rights plans, and calling for the repeal of anti-takeover measures; and |
| | f. | requiring reasonable expansion of financial or compensation-related reporting. |
| 7. | The Companies do not support proposals that would impose geographic or other restrictions on the businesses conducted by the issuers of the securities we manage for clients. The Companies do, of course, respect the investment guidelines of clients who choose not to own securities of companies that engage in certain lines of business or in certain regions. Investment managers must notify the Global Events department if a client has instructed the Companies regarding proxy voting on particular issues of corporate governance of other matters. |
| 8. | Due to the volume of proxies received by the Companies and the routine nature of many proposals presented at annual shareholders meetings, the Companies maintain “standing instructions” with ISS to vote “in favor” of management proposals at annual shareholder meetings. The standing instructions regard only annual shareholder meeting for issuers located in the U.S., Canada, and well-developed Pacific Basin and European countries. Investment managers are responsible for ensuring that any non-routine matters to be voted upon at annual meetings are evaluated and voted in accordance with these policies. The standing instructions are subject to review by the Proxy Voting Committee and the Global Events department. The Companies do not maintain standing instructions for proxies to be cast at “extraordinary” or special shareholders meetings. |
| 9. | Investment managers who recommend casting proxy votes that are contrary to the Companies’ policies must contact and obtain the approval of the Proxy Voting Committee before instructing the Global Events department on how such votes should be cast. The Global Events department is responsible for ensuring that investment managers have contacted the Proxy Voting Committee before such votes are cast. |
| 10. | Investment Managers are responsible for: (a) identifying situations where there may be a material conflict between the Companies’ (including affiliates) interests and those of its clients concerning proxy votes and, (b) raising such matters with the Proxy Voting Committee before instructing the Global Events Department on how such votes should be cast. The Proxy Voting Committee will review the matter. If the Proxy Voting Committee determines that the facts present a material conflict of interest, the Companies will disclose the material conflict to the client(s) and obtain written consent from the client(s) before voting. |
The Companies must retain the following documentation as it relates to proxy voting:
| 1. | Proxy voting policies & procedures; |
| 2. | Proxy statements received regarding client securities; |
| 3. | Records of votes cast on behalf of clients; |
| 4. | Records of written client requests; |
| 5. | Records of written responses from the Companies to either written or oral client requests; and |
| 6. | Documents prepared by the Companies that were material to the decision on how to vote, or that memorialized the basis for the decision. |
The above proxy voting records must be maintained in an easily accessible place for five years, the first two in an appropriate BAM office.
Rider 7
With respect to The Asia Pacific Fund, Inc. (“Fund”), the Companies will disclose the material conflict in writing to the person or persons designated by the Fund, and the Companies will be entitled to rely on the written consent of such person or persons; provided, however, that no such disclosure and consent will be required regarding any matter giving rise to a conflict of interest if:
| (i) | the matter is a routine, non-controversial matter, as determined pursuant to “Proxy Voting Policies,” #3; |
| (ii) | the matter is one for which there is a general voting policy under “Proxy Voting Policies,” #4 or #6 and the instructions regarding the vote will be consistent with the general proxy voting policy on such matter; or |
| (iii) | the instructions regarding the vote will be contrary to the interest of the party giving rise to the conflict of interest. |
The Companies will promptly notify the Fund of any material change in these Proxy Voting Policies and Procedures for North American Clients.
Item 8 – Portfolio Managers of Closed-End Management Investment Companies –
KHIEM TRONG DO —
| | (a)(1) | Khiem Trong Do, Head of Asia Multi-Asset, Baring Asset Management (Asia) Ltd. |
Length of Service at Baring Asset Management (Asia) Ltd: 10 1/2 years with 30 years of investment experience in total. Manager of Asia Pacific Fund, Inc.: from July 2004 – present
Khiem became the Head of the Asia Multi-Asset group in 2006. He is a member of the Strategic Policy Group, the Asia Pacific Specialist Investment Team and a member of the Global Multi-Asset Group. Khiem
joined Baring Asset Management in 1996 as an Investment Strategist for the Asia Pacific region from Citicorp Global Asset Management in Sydney, where he was the Chief Investment Officer, the chair of the Australian Asset Allocation Committee, and a member of the CGAM International Asset Allocation Committee. Khiem’s prior experience includes seven years at Bankers Trust Australia and seven years at Equitilink Australia Ltd. Khiem received his B.A. in Economics (Hons.) from Macquarie University (Australia). He was designated an Associate Member of the Securities Institute of Australia (the Australian CFA equivalent) in 1979. Khiem is fluent in English, Vietnamese, and French.
Khiem Do is the lead fund manager for the Fund. He works closely with his research team, composed of nine other fund managers and analysts.
| | (a)(2) | In addition to the Fund, Mr. Do was also responsible for the day-to-day management of the portfolio of one other account as of March 31, 2007. For details, please see table below: |
| | | | | | | | | | |
| | | Number
of Accounts | | Number of
Accounts with
Performance Fee | | Assets Under
Management ($ US mil) | | Assets Under
Management with
Performance Fee ($ US mil) |
Registered Investment Companies | | — | | — | | | — | | | — |
Other Pooled Investment Vehicles with Performance fees | | 1 | | 1 | | $ | 49.7 | | $ | 49.7 |
Segregated Institutional | | 7 | | | | $ | 269.1 | | | |
Other Pooled Investment Vehicles without Performance fees | | 1 | | | | $ | 49.2 | | | |
There is no material conflict between the management of Asia Pacific Fund versus other funds.
HENRY CHAN —
| | (a)(1) | Henry Chan, Head of Asian Investment Team, Baring Asset Management (Asia) Ltd. |
Length of Service at Baring Asset Management (Asia) Ltd: 3 years with 12 years of investment experience in total.
Henry is responsible for the Asian investment policy and portfolio construction. He became the Head of the Asian Investment Team in 2006. Henry joined Baring Asset Management in 2004 and assumed the lead role in driving our Asian institutional mandates and flagship retail products, namely, Baring Asia Growth and Baring Eastern Trust. At the specialist level, Henry is the co-manager the Baring China Absolute Return Fund, the Asia Pacific Fund, Inc. and Baring Korea Trust. Henry has extensive experience in the management of both Asian regional and specialist mandates. Prior to joining Baring Asset Management he worked at INVESCO (formerly LGT) where he handled a number of Pacific Basin (including Japan) and Asia ex Japan portfolios. His specialist experience covered a number of markets including Taiwan, Hong Kong, China, Korea and Japan. He was also the lead fund manager of INVESCO Asia NET Fund, INVESCO GT Taiwan Fund and a number of Greater China portfolios. Henry received his Bachelor Degree from the London School of Economics and Political Science in 1992. He was awarded the CPA designation in 1994 and became a CFA in 1997. Henry speaks fluent English, Cantonese and Mandarin.
| | (a)(2) | In addition to the Fund, Mr. Chan was also responsible for the day-to-day management of the portfolio of one other account as of March 31, 2007. For details, please see table below: |
| | | | | | | | | | |
| | | Number
of Accounts | | Number of
Accounts with
Performance Fee | | Assets Under
Management ($ US mil) | | Assets Under
Management with
Performance Fee ($ US mil) |
Registered Investment Companies | | — | | — | | | — | | | — |
Other Pooled Investment Vehicles with Performance fees | | 1 | | 1 | | $ | 49.7 | | $ | 49.7 |
Segregated Institutional | | 4 | | | | $ | 1,455.3 | | | |
Other Pooled Investment Vehicles without Performance fees | | 4 | | | | $ | 520.9 | | | |
There is no material conflict between the management of Asia Pacific Fund versus other funds.
| | (a)(3) | Portfolio Managers are compensated via his/her annual salary plus potential for a bonus performance if the majority of the funds managed by the Portfolio Managers and his/her team achieved their excess returns objectives. |
| | (a)(4) | None of the investment staff in the Asian team currently holds shares in the Asia Pacific Fund, Inc. |
| | |
Item 9 – | | Purchases of Equity Securities by Closed-End Management Investment Company and Affiliated Purchasers – There have been no purchases of equity securities by the registrant or any affiliated purchasers during the period covered by this report. |
| | |
Item 10 – | | Submission of Matters to a Vote of Security Holders – Not applicable. |
| | |
Item 11 – | | Controls and Procedures |
| | (a) | It is the conclusion of the registrant’s principal executive officer and principal financial officer that the effectiveness of the registrant’s current disclosure controls and procedures (such disclosure controls and procedures having been evaluated within 90 days of the date of this filing) provide reasonable assurance that the information required to be disclosed by the registrant has been recorded, processed, summarized and reported within the time period specified in the Commission’s rules and forms and that the information required to be disclosed by the registrant has been accumulated and communicated to the registrant’s principal executive officer and principal financial officer in order to allow timely decisions regarding required disclosure. |
| | (b) | There has been no significant change in the registrant’s internal control over financial reporting that occurred during the registrant’s most recent fiscal quarter of the period covered by this report that has materially affected, or is likely to materially affect, the registrant’s internal control over financial reporting. |
| | (a) | (1) Code of Ethics – Attached hereto as Exhibit EX-99.CODE-ETH |
(2) Certifications pursuant to Section 302 of the Sarbanes-Oxley Act – Attached hereto as Exhibit EX-99.CERT.
(3) Any written solicitation to purchase securities under Rule 23c-1. – Not applicable.
| | (b) | Certifications pursuant to Section 906 of the Sarbanes-Oxley Act – Attached hereto as Exhibit EX-99.906CERT. |
SIGNATURES
Pursuant to the requirements of the Securities Exchange Act of 1934 and the Investment Company Act of 1940, the registrant has duly caused this report to be signed on its behalf by the undersigned, thereunto duly authorized.
| | |
| (Registrant) | | The Asia Pacific Fund, Inc. |
| | |
| |
| By (Signature and Title)* | | /s/ Deborah A. Docs |
| | Deborah A. Docs Secretary |
Date May 23, 2007
Pursuant to the requirements of the Securities Exchange Act of 1934 and the Investment Company Act of 1940, this report has been signed below by the following persons on behalf of the registrant and in the capacities and on the dates indicated.
| | |
| By (Signature and Title)* | | /s/ Brian Corris |
| | Brian Corris |
| | President and Principal Executive Officer |
Date May 23, 2007
| | |
| By (Signature and Title)* | | /s/ Robert F. Gunia |
| | Robert F. Gunia |
| | Treasurer and Principal Financial Officer |
Date May 23, 2007
* | Print the name and title of each signing officer under his or her signature. |