Exhibit 99.2

MANAGEMENT’S DISCUSSION AND ANALYSIS
For the Three and Nine Months Ended September 30, 2022
November 28, 2022
This Management’s Discussion and Analysis (this “MD&A”) of Premium Nickel Resources Ltd. (formerly, North American Nickel Inc.) (“Premium Nickel Resources”, the “Company” or “PNRL”) has been prepared with all information available up to and including November 28, 2022. This MD&A should be read in conjunction with the Company’s unaudited condensed interim consolidated financial statements and accompanying notes thereto as at and for the three- and nine- month ended September 30, 2022 (the “Interim Financial Statements”), and the Company’s annual audited consolidated financial statements and accompany notes thereto as at and for the fiscal year (“FY 2021”) ended December 31, 2021 (the “Annual Financial Statements”). This MD&A is intended to assist the reader to assess the financial condition of the Company as at September 30, 2022, and the results of operations of the Company for the three and nine months ended September 30, 2022 (“Q3 2022”).
The Interim Financial Statements, and the financial information contained in this MD&A were prepared in accordance with International Financial Reporting Standards (“IFRS”) issued by the International Accounting Standards Board, IAS 34 – Interim Financial Reporting.
In this MD&A, unless the context otherwise requires, references to the Company, PNRL or Premium Nickel Resources refer to Premium Nickel Resources Ltd. and its consolidated subsidiaries. All monetary amounts in the discussion are expressed in Canadian dollars unless otherwise indicated.
This MD&A contains forward-looking information within the meaning of Canadian securities legislation (see “Forward-looking Information” below). Information regarding the adequacy of cash resources of the Company to carry out its exploration program or the need for future financing is considered to be forward-looking information. All forward-looking information, including information not specifically identified herein, is made subject to cautionary language in this MD&A. Readers are cautioned to refer to the disclosure in this MD&A under the heading “Forward-looking Information” when reading any forward-looking information. This MD&A is prepared in accordance with Form 51-102F1 adopted by the Canadian Securities Administration and has been approved by the Board of Directors of the Company.
Readers are also encouraged to read the other public filings of Premium Nickel Resources, which are available on SEDAR (www.sedar.com) under Premium Nickel Resources’ issuer profile. Other pertinent information about the Company can be found on the Company’s website (https://premiumnickelresources.ca/).
The Scientific and technical information in this MD&A relating to the Selebi Mines (as defined herein) is supported by the Selebi Technical Report (as defined herein).
Company Overview and Highlights
Premium Nickel Resources Ltd. is the continuing company (the “Resulting Issuer”, being NAN (as defined herein) after giving effect to the RTO (as defined herein)) resulting from the reverse takeover transaction (the “RTO”) of the Company (then named North American Nickel Inc. (“NAN”)), whereby Premium Nickel Resources Corporation (“PNRC”), the RTO acquiror, and 1000178269 Ontario Inc., a wholly-owned subsidiary of NAN (“NAN Subco”), amalgamated by way of a triangular amalgamation (the “Amalgamation”) under the Business Corporations Act (Ontario) (the “OBCA”) effective August 3, 2022. Prior to the RTO, the common shares of NAN were listed and posted for trading on the TSX Venture Exchange (the “Exchange”) under the symbol “NAN”. Following the RTO, the common shares of Premium Nickel Resources Ltd. are listed and posted for trading on the Exchange under the symbol “PNRL”.
Prior to the RTO, PNRC was a private company existing under the OBCA to evaluate, acquire, improve and reopen, assuming economic feasibility, a combination of certain assets of BCL Limited (“BCL”) and Tati Nickel Mining Company (“TNMC”) that were in liquidation in Botswana. The initial investors of PNRC include NAN, several resource investors, and local Namibian and Botswanan mine operators.
In connection with the RTO, the Company was continued under the OBCA and changed its name from “North American Nickel Inc.” to “Premium Nickel Resources Ltd.” The following corporate structure chart sets forth details of the direct and indirect ownership of the principal subsidiaries of the Company.
Currently, the Company’s principal business activity is the exploration and development of mineral properties in Botswana through its wholly-owned subsidiaries.
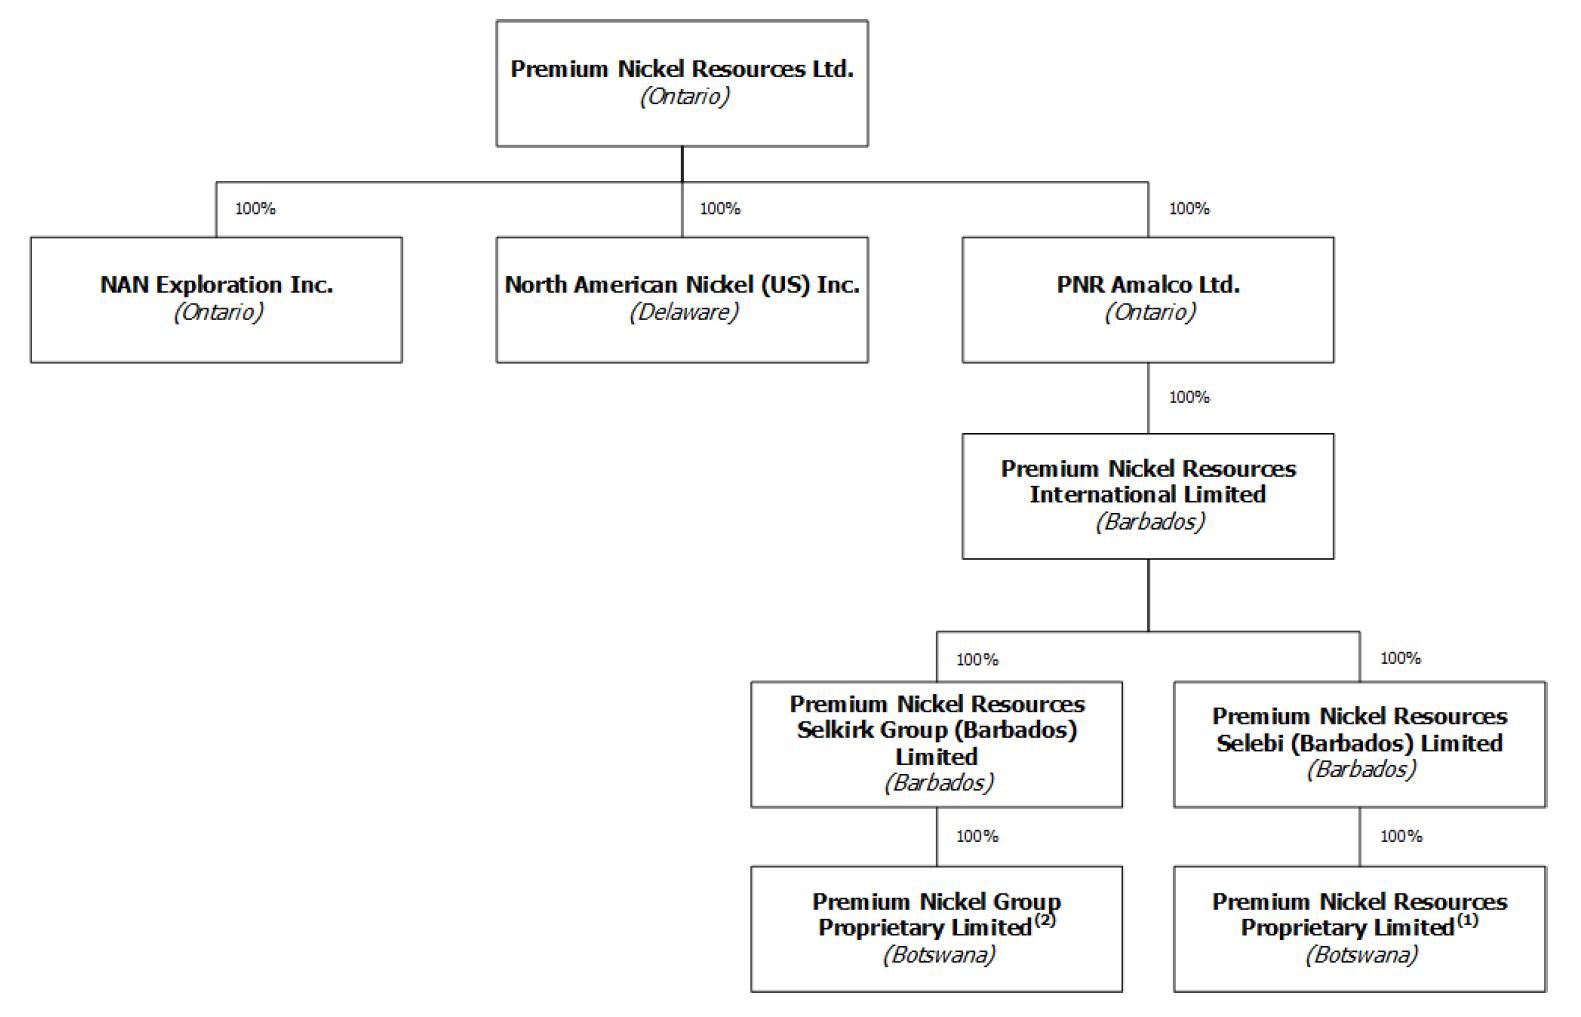
Notes:
(1) Premium Nickel Resources Proprietary Limited owns the Selebi Mines (as defined below).
(2) Premium Nickel Group Proprietary Limited owns the Selkirk mine.
The Company has its head and registered office at First Canadian Place, 100 King Street West, Suite 3400, Toronto, Ontario, Canada, M5X 1A4.
Highlights for the Nine-Month Ended September 30, 2022
| ● | The Company completed the RTO effective August 3, 2022, creating a leading international Nickel-copper-cobalt (“Ni-Cu-Co”) mine exploration and development company. With a portfolio of nickel-copper cobalt assets, PNRL will have the ability to execute a phased strategy and focus in the short term on developing the Selebi project in Botswana. |
| ● | PNRC completed, on January 31, 2022, the purchase of the Selebi mines, which comprise the Selebi North and Selebi shafts (together, the “Selebi Mines”), as well as all surface and underground infrastructures (together, with the Selebi Mines, the “Selebi Assets”), and the related Ni-Cu-Co deposits formerly operated by BCL. |
| | |
| ● | The Company completed, in August 2022, the purchase of the nickel, copper, cobalt, platinum-group elements (“Ni-Cu-Co-PGE”) Selkirk mine formerly operated by TNMC. |
| | |
| ● | PNRC completed, in April 2022, a non-brokered private placement financing of 8,865,619 common shares of PNRC at a price of US$2.00 per share for aggregate gross proceeds of US$17,731,238. |
| | |
| ● | NAN completed, in April 2022, a private placement offering of 21,118,000 subscription receipts (the “Subscription Receipts”) at a price of $0.48 per Subscription Receipt (in each case, prior to giving effect to the Company’s 5:1 consolidation of its common shares), including the partial exercise of the agents’ option, for total gross proceeds of $10,136,640. Upon the closing of the RTO, on August 3, 2022, the Subscription Receipts were converted into 4,223,600 common shares of the Company (post-consolidation), and the net subscription proceeds were released from escrow and delivered to the Company. This financing improved the liquidity and increased the capital of the Company. |
| | |
| ● | PNRC commenced, on March 14, 2022, and the Company continued the first diamond drilling program at its 100% owned Selebi Ni-Cu-Co sulphide mine in Botswana, with approximately 9,701.77 metres of drilling completed as of September 20, 2022. This first phase of surface drilling and borehole electromagnetics (“BHEM”) program at Selebi provides the Company with the relevant information to support the transition to underground resource drilling at both the Selebi North and Selebi deposits. |
| | |
| ● | The Company reported the results of the metallurgical study at its 100% owned Selkirk Ni-Cu-Co-PGE sulphide mine in Botswana. The study demonstrated the ability to produce salable market nickel and copper concentrates and identified significant PGE content in concentrate. |
| | |
| ● | The Company created “Premium Nickel Resources International Metals Group”, which will develop direct relations with end consumers in the base metals markets, including electric vehicle battery manufacturers, with the intent to bridge information gaps and provide the Company with critical access to world markets and real-time information that will aid in decisions involving the production and sale of Ni-Cu-Co-PGE that potentially could be produced principally from the Company’s 100% owned Selebi and Selkirk mines in Botswana. |
Highlights Subsequent to September 30, 2022
| ● | On November 25, 2022, the Company issued a promissory note (the “Promissory Note”) to Pinnacle Island LP (the “Lender”) in connection with its bridge loan (the “Bridge Loan”) financing. The Promissory Note has a principal amount of $7 million and bears interest at a rate of 10% per annum, calculated monthly and payable on February 22, 2023, being the maturity date of the Promissory Note; provided, however, that the Company may, in its sole discretion, extend the maturity date to March 22, 2023 by providing written notice to the Lender by February 15, 2023. The obligations of the Company under the Promissory Note are fully and unconditionally guaranteed by each of the Company’s existing and future subsidiaries. No assets of the Company were pledged as collateral under the Promissory Note. |
Selebi Mine Project in Botswana
In late summer 2019, Premium Nickel Resources Proprietary Limited (“PNRB”), a wholly-owned subsidiary of PNRC, qualified itself as a bidder in the liquidation of the former Botswana Government Mines known as BCL (Selebi-Phikwe, Tati-Phoenix, Tati-Selkirk) and other earlier stage or joint venture resource projects.
An Integrated Project Management Team was set-up by PNRB in early December 2019 to drive and monitor the progress of the technical due diligence and purchase of certain assets under liquidation and owned by BCL. PNRB’s initial due diligence provided the team with an understanding of the potential of the assets through the data mining of legacy information and the team submitted its interest in purchasing some of the assets owned by the BCL entities.
PNRB submitted an indicative offer to the BCL liquidator in June 2020 for the purchase of certain assets then under liquidation and owned by BCL.
On March 24, 2021, PNRB signed an Exclusivity memorandum of understanding with the BCL liquidator which governed a six-month exclusivity period to complete additional due diligence and related purchase agreements on the Selebi Assets. On September 28, 2021, PNRB executed a definitive asset purchase agreement (the “Selebi APA”) with the liquidator of BCL to acquire the Selebi Assets. On January 31, 2022, PNRB closed the acquisition of the Selebi Assets.
PNRL’s approach in re-starting operations of the Selebi Mines is based on three primary concepts:
| ● | PNRL’s technical due diligence work, including the review of related brownfield exploration data as well as mineralogy and processing studies it completed, provide insight into the Selebi Assets’ potential as well as a roadmap to increase the resources through a combination of infill and exploration drilling. |
| | | |
| ● | Decoupling the smelter from BCL’s historic business model to: |
| ◌ | develop a new optimized mine plan based on good mining practices and process optimization,; and |
| | | |
| ◌ | enable PNRL to re-define the Company’s business model around the production of separate nickel/cobalt and copper concentrates. |
| ● | Leverage modern metallurgy to demonstrate that commercial Ni-Cu-Co concentrates could be produced at the Selebi Mines without re-creating the environmental impact of the high sulphur emission flash furnace. |
Although BCL had been facing technical and financial difficulties since 1990, PNRL believes that an opportunity exists to leverage the remaining resource to produce a significant amount of Ni and Cu concentrate per year at the Selebi Mines.
Exploration and Development Activities
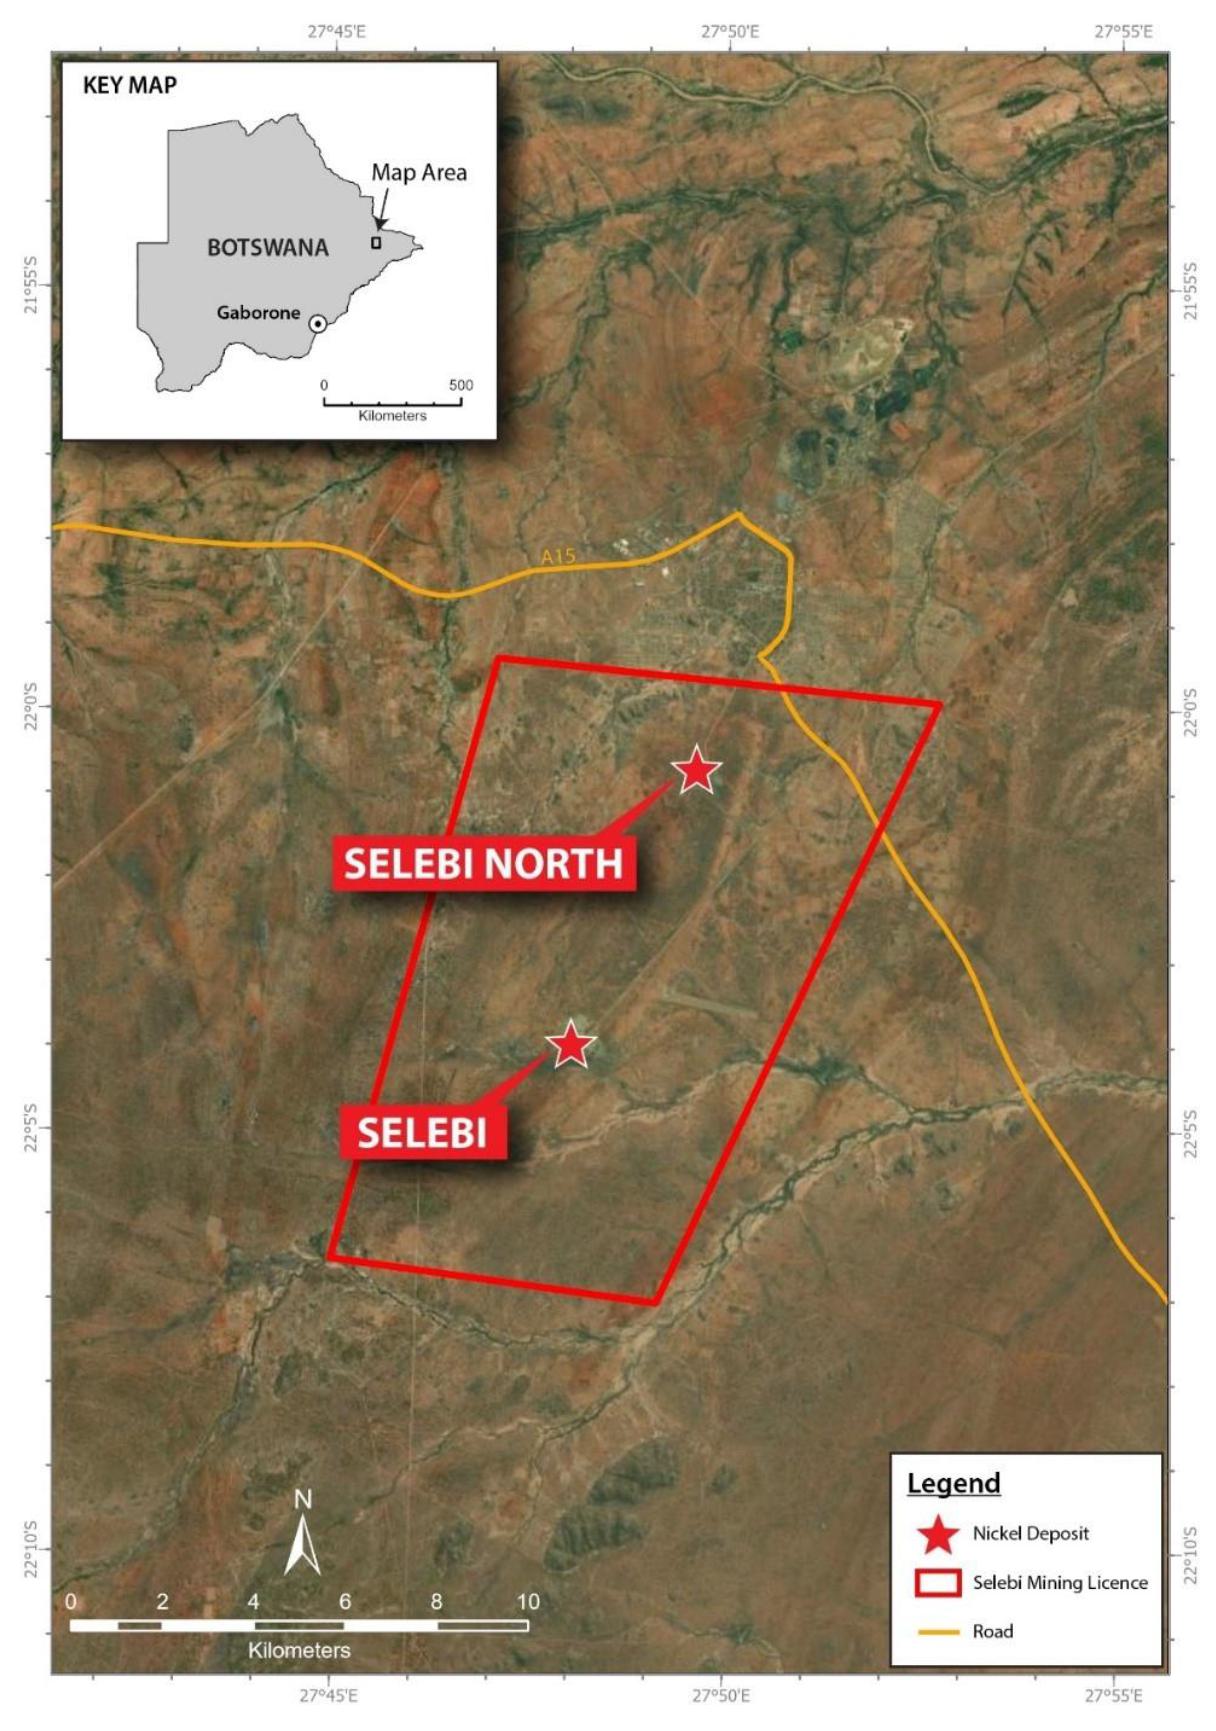
The Selebi Mines are comprised of a single mining license covering an area of 11,504 hectares located near the town of Selebi Phikwe, approximately 150 kilometres southeast of the city of Francistown, and 410 kilometres northeast of the national capital Gaborone (see Figure 1). The Selebi Mines include two shafts (Selebi and Selebi North deposits) as well as all related surface (rail, power and water) and underground infrastructures. The Selebi deposit began production in 1980 and Selebi North began production in 1990. Mining terminated at both operations in 2016 due to a failure in the separate Phikwe smelter processing facility and was subsequently placed under liquidation in 2017.
At the time of liquidation, South African Mineral Resource Committee (“SAMREC”) compliant mineral resources within the Selebi Mines were reported as in-situ and depleted for mining as of September 30, 2016. These historical measured and indicated mineral resources used a nickel equivalent (NiEq)1 cut-off grade of 0.4% and were estimated to total 17.83 Mt at grades of 0.87% Ni and 1.42% Cu containing 155, 000 tonnes (t) Ni and 253,000 t Cu. Historical inferred mineral resources were estimated to total 15.34 Mt at grades of 0.71% Ni and 0.89% Cu containing 109,000 t Ni and 136,000 t Cu. Nickel and copper prices used were US$8.00/lb Ni and US$3.00/lb Cu, respectively. This estimate, which has not been prepared in accordance with National Instrument 43-101 – Standards of Disclosure for Mineral Projects (“NI 43-101”), is considered to be historical in nature and should not be relied upon. However, management believes that it could be indicative of the presence of mineralization on the Selebi Mines property. A qualified person has not completed sufficient work to classify the historical mineral estimate as a current mineral resource estimate and PNRL is not treating the historical mineral estimates as current mineral resource estimate. Readers are cautioned that mineral resources are not mineral reserves and do not have demonstrated economic viability.
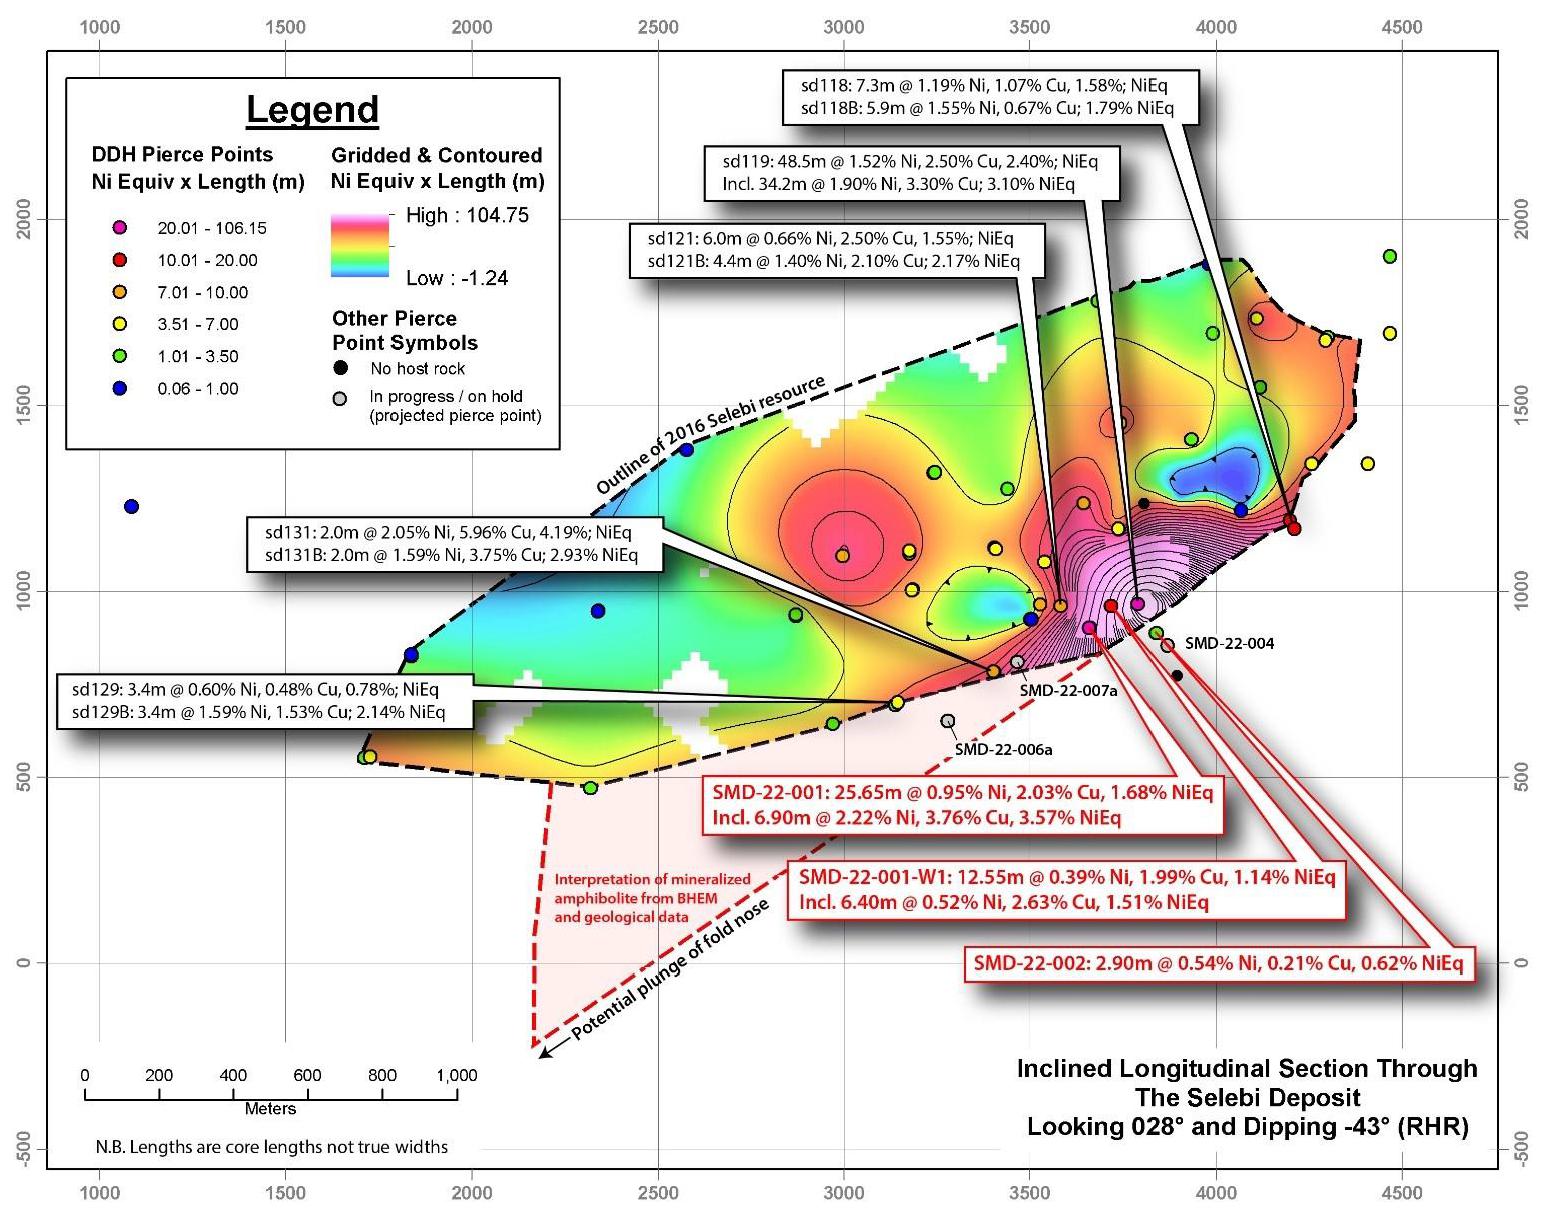
Since 2019, the PNRL technical team has been compiling and verifying information. The highlight of the historic data compilation at Selebi was the identification of an off-hole borehole electromagnetic (“EM”) anomaly in sd140, a 2010 drill hole targeting down-dip of 1992 drill hole sd119 that reported a down-hole interval of 48.5 metres2 averaging 1.52% Ni, 2.5% Cu, including 34.2m of 1.9% Ni and 3.3% Cu (see Figure 2), which management believes could be indicative of the presence of mineralization on the Selebi Mines property.
1 The NiEq cut-off grade was based on a ratio of nickel and copper prices where NiEq = %Ni + (Cu price/Ni price)*%Cu.
2 True thickness can be calculated assuming a dip/dip direction of 43°/206°.
| Figure 1 | Selebi Mines Project Location Map |
| Figure 2 | Grade x thickness colored image of the Selebi 2016 SAMEC-compliant resource showing 2022 PNRL drilling results |
Following the execution of the Selebi APA in September 2021, and to follow on sd140’s off-hole borehole EM anomaly, a field program commenced in October 2021 to open historic holes and collect new gyro and BHEM data. PNRL plate modeling of the EM results using updated gyro data indicated that the near edge of the conductor was located 15 metres away from sd140 and was intersected by sd119. Digitization of the underground infrastructure indicates that the nearest edge of the modelled plate is 110 meters from existing workings, and the sd119 intersection is approximately 300 metres from the existing mine workings.
The Company initiated a drilling program in March 2022, with holes targeting the area of the modelled off-hole conductor from sd140. Concurrent with the drill program, data compilation and verification continued. The program of re-opening historic holes that began in October 2021 is ongoing and up to three drills have been cleaning historic holes to facilitate the collection of new gyro and BHEM geophysical data. Collars of drillholes have been located and DGPS (as defined herein) data has been collected. An initial downhole program of televiewer and physical property logging has also been completed to support the creation of a structural model. Level plans were digitized, and after significant effort, PNRL now has a 3D model of the Selebi and Selebi North underground infrastructure. The gathering of the geological information to build a 3D model is ongoing. Information from handwritten drill logs was merged into the BCL drill hole database, and historic core is being re-logged.
As of September 30, 2022, a total of five new drill holes have reached target depth and intersected mineralized amphibolite. A total of 9,701.77 metres were drilled and assay results from 349 core samples in three holes have been received from ALS Chemex laboratories in South Africa. A total of 34 holes have been opened; 37 BHEM and 39 gyro surveys have been completed in new and historic holes. Collars of 228 holes have been located using a differential Global Positioning System (“DGPS”) and at another 105 sites where evidence of drilling was found, but no hole was seen. Televiewer and physical property surveys have been completed in five holes.
The work undertaken by PNRL to verify the historic data compilation is further described in the Selebi Technical Report, prepared by SLR Canada and released July 25, 2022.
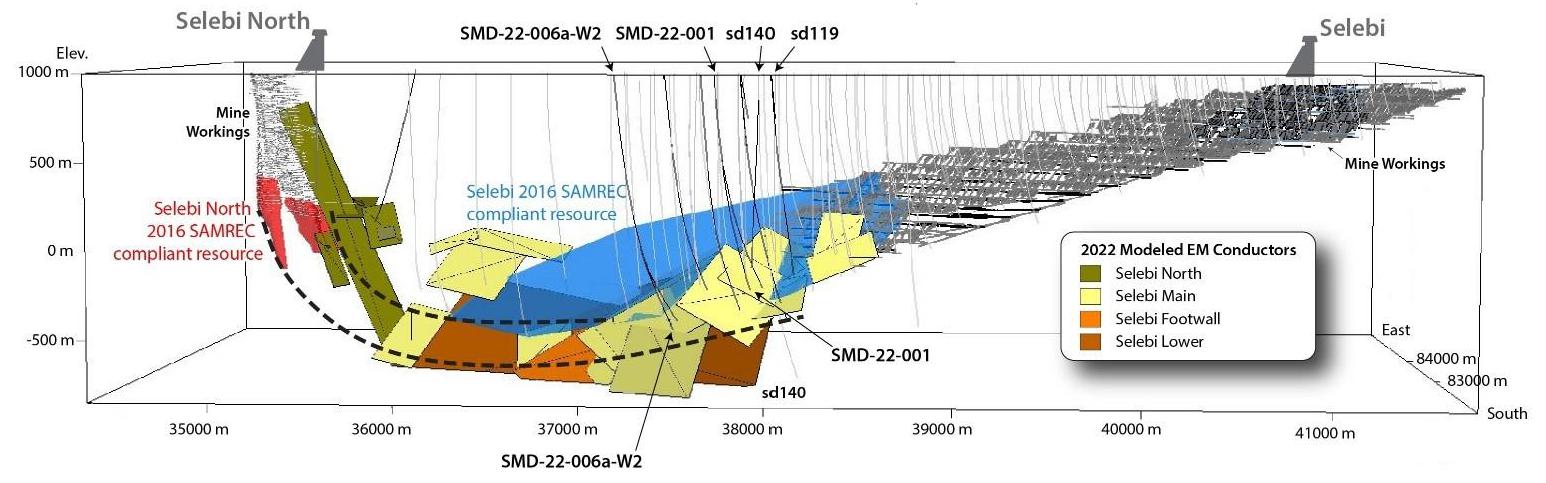
This work has highlighted the potential for establishment of mineral resources at depth at the Selebi deposit. Selebi North mineralization is also open at depth, and additional potential to establish mineral resources occurs here. Given the basin structure, it is possible that the Selebi North mineralization extends at depth and flattens to the south, while also potentially extending southward (see Figure 3).
The results from the drilling and geophysical surveys indicate that there is structural thickening at the western down-dip extent of the mineralized amphibolite, and drilling continues in this area to define the plunge and extent of this mineralization (see Figure 2).
Assay results have been received for two holes and one wedged hole, with results from two additional holes, SMD-22-006a and SMD-22-007a, pending. Assays results are given in Table 1 with hole collar information given in Table 2.
Table 1: Assay Results Selebi Mine Project
| Hole-ID | | From (m) | | To (m) | | Length (m) | | Cu (%) | | Ni (%) | | Co (%) | | S (%) | | Ag (g/t) |
| SMD-22-001 | | 1355.35 | | 1362.50 | | 7.15 | | 0.82 | | 0.33 | | 0.01 | | 4.28 | | 2.23 |
| SMD-22-001 | | 1374.50 | | 1400.20 | | 25.65 | | 2.03 | | 0.95 | | 0.04 | | 12.4 | | 7.4 |
| including | | 1378.00 | | 1384.90 | | 6.90 | | 3.76 | | 2.22 | | 0.08 | | 28.94 | | 13.47 |
| and | | 1390.75 | | 1394.00 | | 3.25 | | 2.00 | | 0.87 | | 0.04 | | 11.12 | | 6.54 |
| and | | 1398.25 | | 1400.20 | | 1.90 | | 0.76 | | 1.40 | | 0.06 | | 15.24 | | 2.58 |
| SMD-22-001-W1 | | 1344.05 | | 1351.00 | | 6.95 | | 0.58 | | 0.37 | | 0.01 | | 3.86 | | 2.95 |
| SMD-22-001-W1 | | 1363.00 | | 1367.35 | | 4.35 | | 1.61 | | 0.98 | | 0.02 | | 12.6 | | 4.69 |
| SMD-22-001-W1 | | 1385.65 | | 1398.20 | | 12.55 | | 1.99 | | 0.39 | | 0.02 | | 5.92 | | 5.42 |
| including | | 1391.00 | | 1397.40 | | 6.40 | | 2.63 | | 0.52 | | 0.03 | | 7.87 | | 7.49 |
| SMD-22-002 | | 1374.80 | | 1377.70 | | 2.90 | | 0.22 | | 0.55 | | 0.02 | | 4.54 | | 1.39 |
Table 2: Drill Collar Information Selebi Deposit (Selebi Mine)
| HOLE ID | | UTM_EAST | | UTM_ NORTH | | elevation | | hole length | | drilled meters | | comment |
| SMD-22-001 | | 582889.3 | | 7562998.8 | | 903.6 | | 1498.37 | | 1498.37 | | completed |
| SMD-22-001-W1 | | 582889.3 | | 7562998.8 | | 903.6 | | 1467.95 | | 1014.40 | | wedged from SMD-22-001 at 453.55m, hole completed |
| SMD-22-002 | | 582854.5 | | 7562848.3 | | 904.2 | | 1458.95 | | 1458.95 | | hole completed |
| SMD-22-003 | | 582745.0 | | 7562843.0 | | 905.0 | | 54.84 | | 54.84 | | hole abandoned, excessive deviation |
| SMD-22-004 | | 582749.1 | | 7562843.3 | | 905.0 | | 427.07 | | 427.07 | | on hold |
| SND-22-005 | | 584710.0 | | 7564991.3 | | 895.0 | | 353.47 | | 353.47 | | hole deviated from planned trace, renamed when wedged |
| SND-22-005a | | 584710.0 | | 7564991.3 | | 895.0 | | 517.07 | | 209.16 | | wedged from 005 at 307.91m – renamed when wedged |
| SND-22-005b | | 584710.0 | | 7564991.3 | | 895.0 | | 913.27 | | 473.40 | | wedged from 005a at 439.87m plus navi drilling from 469.80m – renamed when wedged |
| SND-22-005c | | 584710.0 | | 7564991.3 | | 895.0 | | 992.77 | | 125.51 | | wedged from SND-22-005c at 867.26 m – stopped because of damaged wedge, renamed when wedged |
| SND-22-005d | | 584710.0 | | 7564991.3 | | 895.0 | | 715.91 | | 12.62 | | wedged from SND-22-005c at 703.29, wedge damaged, hole suspended |
| SMD-22-006 | | 582754.0 | | 7563543.0 | | 903.0 | | 18.21 | | 18.21 | | abandoned in casing – excessive deviation |
| SMD-22-006a | | 582754.0 | | 7563543.0 | | 903.0 | | 1657.75 | | 1657.75 | | Re-start of SMD-22-006, hole completed |
| SMD-22-006a-W1 | | 582754.0 | | 7563543.0 | | 903.0 | | 1234.30 | | 393.45 | | wedged from SMD-22-006a at 840.85 m – hole renamed when second wedge inserted |
| SMD-22-006a-W2 | | 582754.0 | | 7563543.0 | | 903.0 | | 1201.30 | | 80.85 | | wedged from SMD-22-006a-W1 at 1120.45 m drilling in progress |
| SMD-22-007 | | 582801.0 | | 7563267.0 | | 897.0 | | 22.45 | | 22.45 | | hole abandoned in casing, excessive deviation |
| SMD-22-007a | | 582801.0 | | 7563267.0 | | 897.0 | | 1592.77 | | 1592.77 | | re-start of SMD-22-007 – hole completed |
| SMD-22-008 | | 582821.0 | | 7563069.0 | | 903.0 | | 15.84 | | 15.84 | | hole abandoned; drill mis-aligned |
| SMD-22-008a | | 582821.0 | | 7563069.0 | | 903.0 | | 385.79 | | 385.79 | | re-start of SMD-22-008, drilling in progress |
| TOTAL | | | | | | | | | | 9701.77 | | September 30, 2022 |
During the nine months ended September 30, 2022, the Company incurred $22,227,238 in acquisition and exploration expenditures on the Selebi Assets (December 31, 2021 - $3,099,926).
Outlook – Exploration and Development for the next eighteen months
The proposed work plan for the Selebi Mines includes continued surface diamond drilling at Selebi and future underground drilling at Selebi North, expected to commence in the first quarter of 2023. Drilling will be ongoing for up to 18 months, with the specific objective of delivering a preliminary economic assessment on the Selebi Mines. During that time, data compilation and verification efforts will continue, with hole re-opening, gyro, BHEM and televiewer surveys, digitization of historic data, re-logging of historic core and updating of the 3D geological and structural model. In addition to this work, additional metallurgical samples will be collected and sent for more detailed studies. The underground infrastructure at Selebi North will be upgraded to support the underground drilling program as well as improve health & safety.
| Figure 3 | 2016 SAMREC compliant resources at Selebi (blue) and Selebi North (red), showing mine workings (gray) and area of upside potential |
Selkirk Project, Botswana
The Selkirk property consists of a single mining licence covering an area of approximately 14.6 square kilometres and four prospecting licenses cover 126.7 square kilometres (see Figure 4). The project is situated 28 kilometres south-east of the town of Francistown, and 75 kilometres north of the 100% owned Selebi Mines.
| Figure 4 | Selkirk Project Property location map |
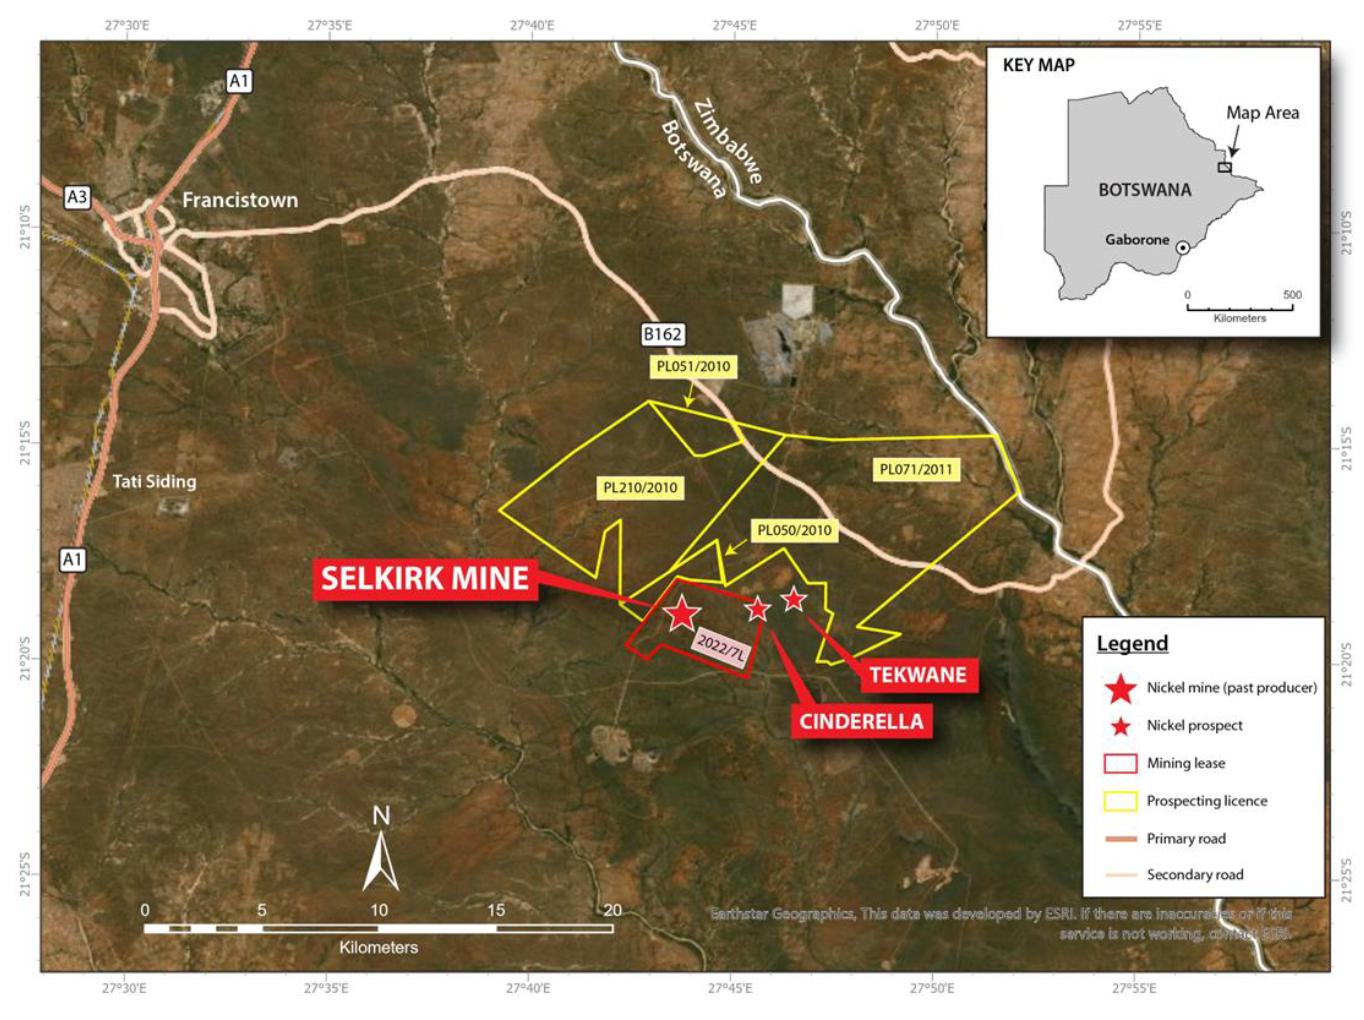
Production at the Selkirk mine took place between 1989 and 2002 with TNMC mining high grade Ni-Cu massive sulphides and producing 1 million tonnes at 2.6% Ni and 1.5% Cu. Prior to mining operations, the high-grade massive sulphides extended from near surface over a plunge distance of about 200 metres (105 metres vertical depth) and a strike length of about 150 metres and average thickness of 20 metres. On the hanging wall and footwall of this deposit lies a halo of disseminated sulphides, averaging approximately 100 metres in thickness, grading about 0.3% Ni and extending down plunge to unknown depths. This larger volume of disseminated sulphides has been previously evaluated by operators of TNMC for bulk tonnage open pit mining.
In 2006, LionOre Mining International Ltd. (“LionOre”) published a technical report in accordance with NI 43-101, which reported a historic indicated mineral resource estimate of 6.0 Mt grading 1.06% Ni and 0.36% Cu at a cutoff grade of 0.75% Ni. The technical report entitled “A Preliminary Assessment and Techno-Economic Analysis of the Requirements for the Establishment of a Nickel Mining & Processing Facility at the ‘Selkirk Project’ Situated on the Farms 73NQ and 75 NQ in NE Botswana, Mineral Properties and Prospects Held by LionOre” with an effective date of September 21, 2006 was prepared for LionOre by TMP Consulting (PTY) Ltd. See below under the heading “Historical Estimate”. The former operator of TNMC acquired Selkirk from Norilsk Nickel through a purchase agreement in October 2014. Norilsk was preparing Selkirk as an open pit operation and had completed definitive feasibility studies in 2012 and 2013 (Norilsk Nickel Annual Reports). Most recently, when TNMC closed operations at the Selkirk mine, Worley Parsons was working on a feasibility study with an intention of commencing operations in 2017. To that end, TNMC had received government approval for their environmental management plan that included an archeological assessment in support of the foregoing.
The Company has been carrying out due diligence on the Selkirk project since 2021. The results of the data verification efforts include examination and sampling of the underground workings, reviewing and sampling of mineralized drill core, collecting DGPS coordinates of drill collars and quality assessment of information in databases.
The Company examined underground workings and confirmed continuous visible sulphides along an exploration drift extending 144 metres across the interpreted primary sulphide horizon, in a southwestern direction from the previous mining operations. PNRL collected and submitted twenty 10-kilogram grab samples from this exploration drift for assay to determine the variability in the grade of the mineralization. Assays from the underground sample program are pending. The location of the drill holes and the underground exploration drift and samples are shown in Figure 5.
| Figure 5 | Selkirk Project Assayed Drill core and exploration drift location map |
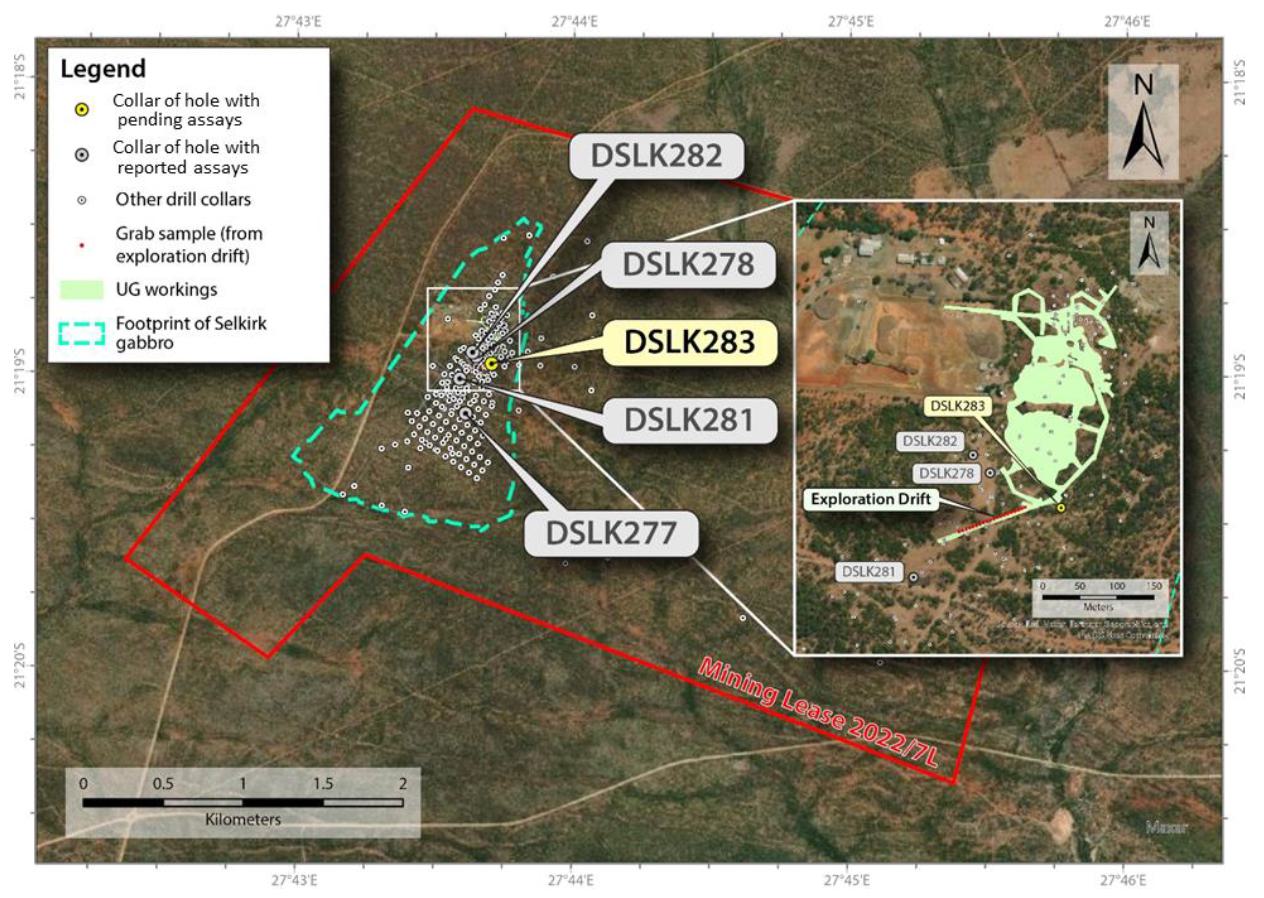
Additionally, the Company completed a concept level metallurgical study to assess if readily marketable copper and nickel concentrates could be produced and, if so, at what metal recovery levels. The Selkirk test program was carried out at SGS Canada in Lakefield, Ontario and followed a similar program conducted on samples from the Selebi Mines, which demonstrated potential for these metallurgical objectives to be achieved. The source of the material was previously unsampled HQ sized drill core from 2016 drill hole DSLK278, positioned 50m from historic mine workings. Highlights of the metallurgical study include: the ability to produce salable market nickel and copper concentrates, nickel concentrate grade of 10% nickel and 6% copper, copper concentrate grade of 33% copper, 0.32% nickel, recoveries of 63% nickel, 85% copper, concentrates clean of deleterious elements and with low (<1%) MgO levels, and attractive amounts of PGE present in the concentrates (36.0 g/t Pd in copper concentrate, 9.0 g/t Pd in nickel concentrate).
The Company plans to include the results of its findings in an updated technical report prepared in accordance with NI 43-101 which is expected to be completed by the end of 2022. The Company is preparing this technical report on a voluntary basis, as PNRL’s near-term focus continues to be its flagship asset, the Selebi Mines.
During the nine months ended September 30, 2022, the Company incurred $106,493 in acquisition and exploration expenditures on the Selkirk assets (December 31, 2021 - $nil).
Outlook – Exploration and Development for the next eighteen months
Following the completion of the technical report, the Company currently anticipates that a work plan will be proposed for the Selkirk mine re-development that will include drilling to better define the existing resources and search for additional resources, develop a 3D geological and structural model, and complete additional metallurgical studies focused on improving recoveries.
Maniitsoq Nickel-Copper-PGM Project, Southwest Greenland
The Greenland properties being explored for nickel-copper-cobalt-PGM sulphide by the Company have no mineral resources or reserves. The Maniitsoq project is centered 100 kilometres north of Nuuk, the capital of Greenland which is a safe, stable, mining-friendly jurisdiction. The centre of the project is located at 65 degrees 18 minutes north and 51 degrees 43 minutes west and has an arctic climate. It is accessible year-round either by helicopter or by boat from Nuuk or Maniitsoq, the latter located on the coast approximately 15 kilometres to the west. The deep-water coastline adjacent to Maniitsoq is typical of Greenland’s southwest coast which is free of pack ice with a year-round shipping season. The optimum shipping conditions are due to the warming Gulf Stream flowing continuously past the south west coastline of Greenland. There is no infrastructure on the property. However, the Seqi deep water port and a quantified watershed for hydropower are located peripherally to the project.
The Maniitsoq property is centred on the 75 kilometre by 15 kilometre Greenland Norite Belt which hosts numerous high-grade nickel-copper sulphide occurrences associated with mafic and ultramafic intrusions. Between 1959 and 2011, various companies carried out exploration over portions of the project area. The most extensive work was carried out by Kryolitselskabet Øresund A/S Company (“KØ”) who explored the project area from 1959 to 1973. KØ discovered numerous surface and near surface nickel-copper sulphide occurrences and this work was instrumental in demonstrating the nickel prospectivity of the Greenland Norite Belt.
The Company acquired the Maniitsoq project due to its potential for the discovery of significant magmatic sulfide deposits in a camp-scale belt. The Company believed that modern, time-domain, helicopter-borne EM systems would be more effective at detecting nickel sulphide deposits in the rugged terrain of Maniitsoq than previous, older airborne fixed wing geophysical surveys available to previous explorers. In addition, modern, time domain surface and borehole EM systems could be used to target mineralization in the sub-surface.
The Maniitsoq property consists of three exploration licences, Sulussagut No. 2011/54 and Ininngui No. 2012/28 comprising 2,689 and 296 square kilometres, respectively and the Carbonatite property No. 2018/21 (63 square kilometres).
During the years ended December 31, 2021 and 2020, the Greenland Mineral Licence & Safety Authority (“MLSA”) granted the Company two distinct one year period license extensions for all three exploration licences, and reduced exploration obligations to zero for both 2020 and 2021.
| ● | Sulussugut Licence (No. 2011/54) was granted to the Company by the Mineral Resources Authority (formerly, the Bureau of Minerals and Petroleum (“BMP”) of Greenland) on August 15, 2011, which was valid for a five-year term that expired on December 31, 2015; provided the Company meets the terms of the licence, which includes that specified eligible exploration expenditures must be made. The application for the second five-year term on the Sulussugut Licence was submitted to the MLSA which was effective on April 11, 2016. The granting of two one-year period extensions provides for the renewal period ending December 31, 2022. The renewal application for a reduced area of 2011/54 is currently in preparation. |
| ● | Ininngui Licence (No. 2012/28) is contiguous with the Sulussugut Licence and was granted to the Company by the BMP of Greenland on March 4, 2012. The Ininngui Licence was valid for a five-year term until June 30, 2017. The application for the second five-year term on the Ininngui Licence was submitted to the MLSA which was effective March 14, 2017. The granting of two one-year period extensions provides for the renewal period ending December 31, 2023. |
| | | |
| ● | Carbonatite Licence (No.2018/21) was granted to the Company by the BMP of Greenland on March 4, 2018 for exclusive exploration rights of an area located near Maniitsoq in West Greenland. The Company paid a licence fee of $6,523 (DKK 31,000) upon granting of the Carbonatite Licence. The Carbonatite Licence is valid for a five-year term. The granting of two one-year period extensions provides for the renewal period ending December 31, 2024. |
The confirmation of required work expenditures and accrued work credits for the above three licences are pending. The work credits accumulated to 2021 are tabulated and shown below in Table 3.The Greenland MLSA, in two distinct initiatives, has adjusted the minimum required exploration commitment for the above three licences to DKK 0 for the years 2020 and 2021 and adjusted the licence expiry dates and the banked credits carry forward period by two years. The obligations for 2022 can be reduced by 50% if certain conditions are met (no property reduction).
For all licences, future required minimum eligible exploration expenses will be adjusted each year on the basis of the change to the Danish Consumer Price Index.
For all licences, at the expiration of the second licence period (years six-ten), the Company may apply for a new three-year licence for years 11 to 13. Thereafter, the Company may apply three times for additional three-year licences for a total of nine additional years. The Company will be required to pay additional licence fees and will be obligated to incur minimum eligible exploration expenses for such years.
The three licences, 2011/54, 2012/28 and 2018/31 are believed to have sufficient accrued work credits to keep the property in good standing until December 2023, at which time a reduction in the size of the property will be required.
Table 3: Exploration commitment and credits at the end of 2021 (All amounts in table are expressed in thousands of DKK)
| | | Sulussugut Licence 2011/54 | | Ininngui Licence 2012/28 | | Carbonatite Licence 2018/21 |
| Area | | 2,689 km2 | | 296 km2 | | 63 km2 |
| Valid until | | December 31, 2022 | | December 31, 2023 | | December 31, 2024 |
| Annual licence fee DKK | | 41 | | 41 | | 31 |
| Total work credits |
| From 2017 | | 201,752 | | 19,534 | | - |
| From 2018 | | 79,604 | | 10,465 | | 9,563 |
| From 2019 | | 1,724 | | 283 | | 934 |
| From 2020 | | 865 | | 143 | | 48 |
| From 2021 | | 1,921 | | 90 | | 32 |
| Total DKK | | 285,866 | | 30,515 | | 10,577 |
| Average Annual Rate DKK to CAD | | 0.1995 | | 0.1995 | | 0.1995 |
| Accumulated exploration credits in CAD (,000) | | $57,027 | | $6,087 | | $2,110 |
West Greenland Prospecting Licence – 2020/05
A new prospecting licence, No. 2020/05, for West Greenland was awarded by the Greenland government on March 18, 2020. The prospecting licence is in effect until December 31, 2024.
Exploration and Development Activities
In 2019, the Company had planned to return to Maniitsoq and other regional target areas to continue the systematic exploration program. However, the Company did not obtain sufficient financing within the lead-time required for the logistical planning in Greenland. The initial 2019 work program for Maniitsoq project had been postponed to the 2020 summer season after a successful financing capable of supporting an integrated exploration program. However, the 2020 and 2021 summer program were further delayed due to the COVID-19 travel restrictions.
In June 2021, fuel and equipment stored on site at the Puiattoq camp site was removed. The wooden tent platforms remain on site for use in future exploration programs.
Hydropower assessment of watershed 06.H was continued with the emplacement of devices to measure the seasonal variability of water levels in Lake Taserssuatsiaq and to provide a framework for further surveys over the next three-five years. A new hydropower prospecting licence was submitted to the Greenland Government replacing the original licence that expired in July of 2021.
Prior to the closing of RTO on August 3, 2022, the Maniitsoq property had a book value of $36,692,516. As the transaction is accounted for as a capital transaction with NAN being identified as the accounting acquiree, the net assets of NAN should be measured at fair value. Management believes that facts and circumstances exist to suggest that the carrying amount of the Maniitsoq property at August 3, 2022 exceeds its fair value. As a result, management determined the Maniitsoq property should be impaired by $20,343,794 and its recoverable amount is $16,348,722. The valuation is based on historical drilling results and management’s future exploration plans on the Maniitsoq property. From August 3 to September 30, 2022, the Company spent $12,520 in acquisition and exploration expenditures on the Maniitsoq property.
Outlook - Exploration and Development for 2022-2024
Management will assess the situation with the expectation of implementing a field program in 2023.
| 2022 | ● | Apply the Company’s cumulative knowledge to Maniitsoq and other areas of Western Greenland and identify the geoscience data gaps to effective targeting. This targeting effort has been completed and the 2023 field program plan is near completion. |
| | | |
| | ● | Continue the assessment of hydropower development within watershed 06.H. |
| | | |
| 2023 | ● | Acquire the additional required geoscience data and additional properties of merit; conduct a field program that includes prospecting of additional target areas and geochemical sampling, conduct test drilling if any priority targets are identified and drill ready. |
| | | |
| 2024 | ● | Execute a major drill campaign of prioritized targets. |
This three-year plan will allow for the generation of priority drill targets while drawing down on the three years of exploration credits (see Table 3). The drilling expenditure in 2024 would extend the Company’s 100% ownership of the Maniitsoq project until 2025.
Canada Nickel Projects - Sudbury, Ontario
Post Creek Property
The Company entered into an option agreement in April 2010, subsequently amended in March 2013, to acquire rights to Post Creek property located within the Sudbury mining district of Ontario. On August 1, 2015, the Company has completed the required consideration and acquired 100% interest in the property. The Company is obligated to pay advances on a net smelter returns (“NSR”) royalty of $10,000 per annum, which will be deducted from any payments to be made under the NSR royalty.
The property is located 35 kilometres east of Sudbury in Norman, Parkin, Alymer and Rathburn townships and consists of 73 unpatented mining claim cells in two separate blocks, covering a total area of 912 hectares held by the Company. The center of the property occurs at UTM coordinates 513000mE, 5184500mN (WGS84, UTM Zone 17N). The Post Creek property lies adjacent to the Whistle Offset Dyke Structure which hosts the past–producing Whistle Offset and Podolsky Cu-Ni-PGM mines. Post Creek lies along an interpreted northeast extension of the corridor containing the Whistle Offset Dyke (see Figure 6). Offset Dykes and Footwall deposits account for a significant portion of all ore mined in the Sudbury nickel district and, as such, represent favourable exploration targets. Key lithologies are Quartz Diorite and metabreccia related to Offset Dykes and Sudbury Breccia associated with Footwall rocks of the Sudbury Igneous Complex which both represent potential controls on mineralization.
Immediately prior to completion of the RTO on August 3, 2022, the Post Creek property had a book value of $1,873,887. From August 3 to September 30, 2022, the Company spent $5,000 and $1,323 in acquisition and exploration expenditures, respectively, on the Post Creek property.
Outlook – Exploration and Development for the next twelve months
Parts of the Post Creek property have received limited historic exploration. Compilation work has identified targets comprised of radial and concentric offset dykes of the Sudbury Igneous Complex which are known to be associated with high grade copper-gold-platinum-group elements (“Cu-Au-PGE”) sulfide mineralization.
The Company’s 12-month exploration plan for the Post Creek property is to prospect and search for mineralization and/or quartz diorite on parts of the Post Creek properties that remain overlooked by previous exploration. The intention is to complete geophysical surveys over prospective target areas, and conduct test drilling if any priority targets are identified and drill ready.
This plan will allow for the generation of priority drill targets while drawing down on the available exploration credits. The work expenditure would extend the Company’s 100% ownership of the Post Creek project beyond 2025.
| Figure 6 | Location of the Post Creek Project and the Sudbury Breccia Zone |

Corporate Social Responsibility
The Company has established a good working relationship with the Wahnapitae First Nation (“WFN”) at Capreol (Ontario) commencing with community presentations and followed up with ongoing contact with the Resource and Environmental officer. The Company financially supported the 2019 Pow-Wow celebration held at Capreol. Exploration work on the property typically includes assistance of casual labour hired from the WFN community.
Halcyon Property
As at the date of this MD&A, the Company holds a 100% interest in the Halcyon property and is obligated to pay advances on the NSR royalty of $8,000 per annum, which will be deducted from any payments to be made under the NSR royalty.
The property is located 35 kilometres northeast of Sudbury in the Parkin and Aylmer townships, and consists of 63 unpatented mining cells for a total of 864 hectares. It is readily accessible by paved and all-weather gravel road. Halcyon is adjacent to the Post Creek property and is approximately 2 kilometres north of the producing Podolsky Mine of FNX Mining. Previous operators on the property defined numerous conductive zones based on induced polarization (I.P.) surveys with coincident anomalous Mobile Metal Ions soil geochemistry. Base and precious metal mineralization have been found in multiple locations on the property but follow-up work was never done. The former producing Jon Smith Mine (nickel-copper-cobalt-platinum) is situated one kilometre north of the property.
Immediately prior to completion of the RTO on August 3, 2022, the Halcyon property had a book value of $523,840. From August 3 to September 30, 2022, the Company spent $4,000 and $1,323 in acquisition and exploration expenditures, respectively, on the Halcyon property.
Outlook – Exploration and Development for the next twelve months
The objective of further compilation work on the Halcyon project was to provide a basis for prospecting and sampling of parts of the property that have received incomplete historic exploration. The targets comprised radial and concentric offset dykes of the Sudbury Igneous Complex which are known to be associated with high grade Cu-Au-PGE sulfide mineralization.
The Halcyon portion of the property has a priority target area flagged for follow-up in 2023, namely, the projection of the Milnet Fault Offset of the Parkin QD with minimal exploration and no EM or IP coverage. Across the target area, the Company will be prospecting for mineralization and/or radial/concentric offsets dykes located along stratigraphic horizons similar to those controlling the inflexion in the Parkin Offset at the historic Milnet Deposit.
The Company’s 12-month exploration plan for the Halcyon property is to prospect and search for mineralization and/or quartz diorite on parts of the Halcyon property that remain overlooked by previous exploration. Complete geophysical surveys over prospective target areas, and conduct test drilling if any priority targets are identified and drill ready.
This plan will allow for the generation of priority drill targets. The work expenditure in 2023 would extend the Company’s 100% ownership of the Halcyon project through 2025 and beyond.
Quetico Property
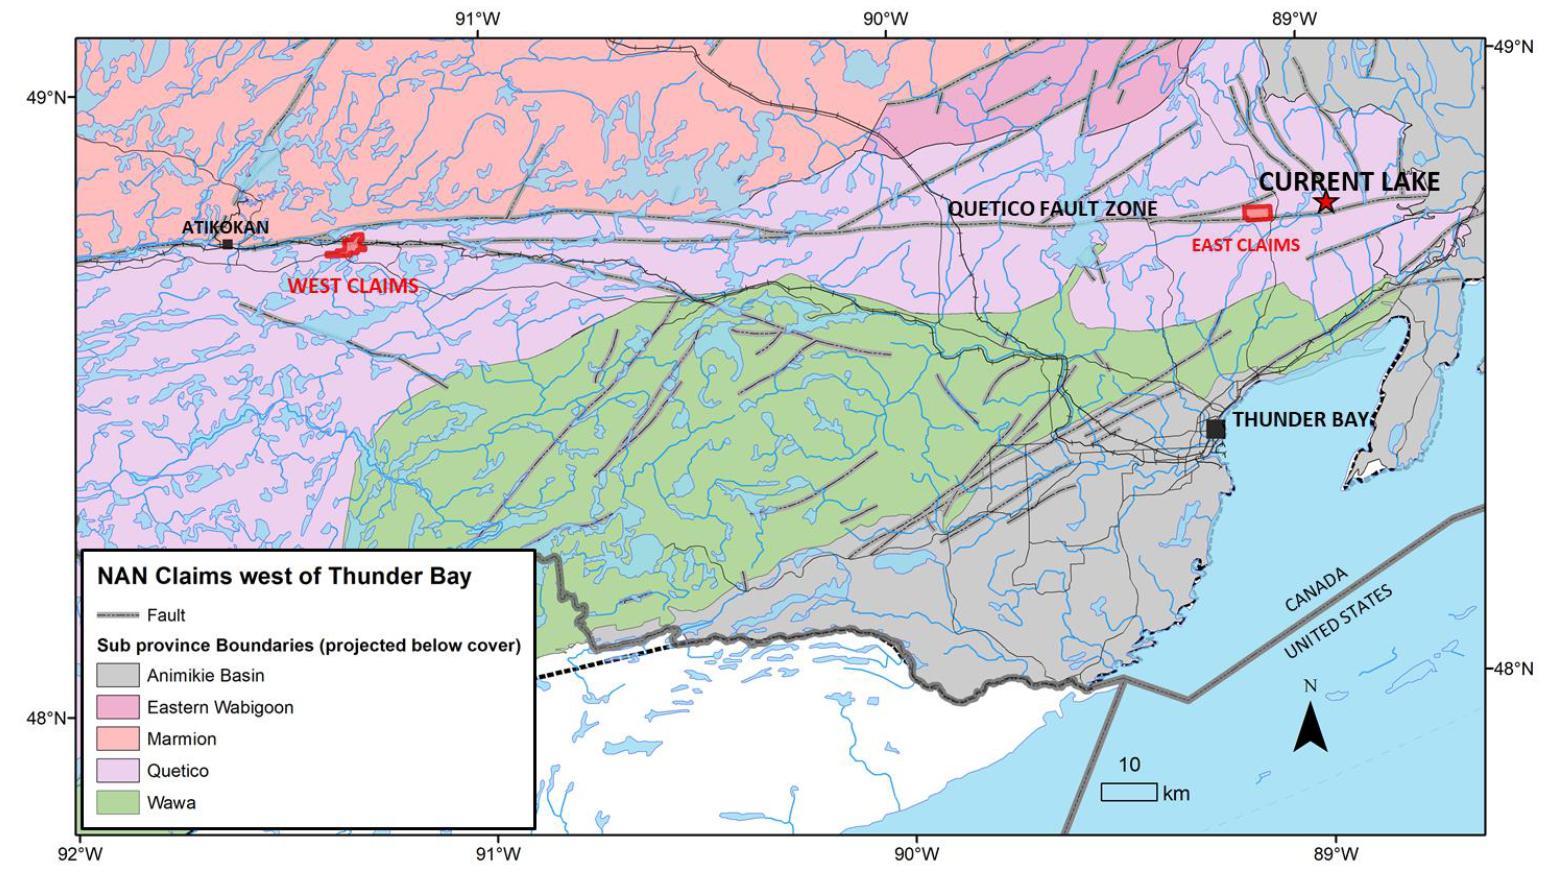
During the year ended December 31, 2018, the Company acquired 809 claims within the Thunder Bay Mining District of Ontario (see Figure 7). Cells were acquired to assess (i) the Quetico Sub-province corridor, which hosts intrusions with Ni-Cu-Co-PGM mineralization related to a late 2690 Ma Archean magmatic event, and (ii). the Neoproterozoic (1100 Ma MCR) magmatic event and related intrusions. Three clusters of claims cells, labeled Quetico South, East and West cover magnetic features interpreted to represent small, differentiated intrusions. The review of government geological and geophysical data, and historic assessment file data was completed in 2019 and recommendations for additional exploration work were prepared.
In April 2020, the Company applied for a one-year exclusion under a COVID-19 relief program offered by the Ontario Ministry of Energy, Northern Development and Mine (“ENDM”). The one-year exclusion was granted on September 1, 2020, thus adjusting the work requirement due dates to April and May of 2021. The COVID-19 relief program was offered again in 2021, and the Company lodged a second set of applications on March 29, 2021 and April 21, 2021 to extend the tenure of the claim blocks. The additional one-year exclusions were granted on May 14 and May 20, 2021 thus adjusting the work requirement due dates to April and May of 2022.
The work commitment to hold all 809 claim cells was $323,600, with claims due in April and May of 2022. The Company made a decision to retain the most prospective claims and chose 99 claims. For the Quetico East Block, the Company renewed 49 high priority claims for two years. For one of the Quetico West Blocks, the Company renewed 46 claims for one year and four high priority claims for two years. All other claims expired.
Immediately prior to completion of the RTO on August 3, 2022, the Quetico property had a book value of $129,147. From August 3 to September 30, 2022, the Company spent $nil on the property.
Outlook – Exploration and Development for the next twelve months
Revisit plans to complete a ground electromagnetic survey designed to identify coincident EM responses in association with the magnetic response expected from differentiated mafic-ultramafic intrusions in the Quetico structural zone. Complete geophysical surveys over prospective target areas, and drilling if any priority targets are identified. The geophysical program would be carried out in spring 2023 to generate targets for a summer exploration program.
| Figure 7 | Quetico Property Location Map |
Lingman Lake Property
The Company digitally staked 188 claim cells known as Lingman Lake on April 15, 2019. The property occurs about 65 kilometres south east of Red Sucker Lake First Nation and about 35 kilometres southwest of Sachigo Lake First Nation, approximately 650 kilometres northwest of Thunder Bay. The Lingman Nickel Project, covers a portion of the Archean age Lingman Lake Greenstone Belt that includes tholeiitic-komatiitic rocks and sulphide facies iron formation. Historic field work has identified ultramafic rocks with elevated nickel and copper in grab samples and untested VTEM anomalies.
An application was lodged with the ENDM on March 17, 2021 to extend the tenure of the claim blocks due to impact from COVID-19 on the implementation of exploration work. The one-year exclusion was granted on May 6, 2021. Work commitments of $75,200 were due prior to April 15, 2022. The Company had no plans to carry further work at the present, thence the claims expired.
High Atlas Project in Morocco
In 2018, the Company’s geologists identified a camp scale project opportunity in the high Atlas Mountains of Morocco. Jurassic aged troctolitic and gabbroic intrusions occur at the margin of a significant trans-lithospheric structure over a strike length greater than 100 kilometres. The intrusions are host to three major nickel-copper occurrences and another ten minor occurrences. There is no modern geophysical coverage and no drilling on the property.
In 2019, the Company signed a memorandum of understanding (the “MOU”) with Office National des Hydrocarbons et des Mines (“ONHYM”), a government entity and the single largest current permit holder in Morocco. Through this alliance, the Company was given access to confidential exploration data to develop nickel projects in the High Atlas Region of Morocco. In November and December 2021, the Company lodged applications for five permits in Morocco. In December 2021, four of the five permits were awarded to the Company. An application for a fifth permit was submitted and awarded in February 2022. Work plans were submitted in May 2022. The work obligations DKK528,000 (approximately C$65,000) per permit over a three-year period with work commencing within six months. The initial work will comprise compilation and targeting desktop studies.
In October 2022, the Company and ONHYM decided not to pursue the joint venture discussions that initially set out the general framework of a joint venture for the exploration and consolidation of permits owned by ONHYM in the Imilchil region. The company intends to continue its work on the five permits it acquired in 2021 in the same region.
The exploration and license related expenditures for the project is recorded as property investigation expense in the condensed interim consolidated statements of comprehensive loss. The Company has spent $nil on the project during the period from August 3 to September 30, 2022.
Outlook – Exploration and Development for the next twelve months
Over the next twelve months, the Company plans to assess the potential of acquiring additional permits and continue to develop strategic alliances to support Ni-Cu-Co exploration in the Imilchil region. The initial work plan includes prospecting of the property and modern EM surveys to define potential drill targets.
Financial Capability
The Company is an exploration and re-development stage entity and has not yet achieved profitable operations. The business of the Company entails significant risks. The recoverability of amounts shown for mineral property costs is dependent upon several factors including environmental risk, legal and political risk, the establishment of economically recoverable mineral reserves, confirmation of the Company’s interests in the underlying mineral claims, and the ability of the Company to obtain necessary financing to complete exploration and development, and to attain sufficient net cash flow from future profitable production or disposition proceeds.
At the end of Q3 2022, the Company had a working capital of $3,040,626 (FY 2021 - $1,558,011) and reported accumulated deficit of $91,818,773(FY 2021 - $13,482,624), including a loss on the RTO transaction of $75,375,567. At the end of Q3 2022, the Company required additional funds to continue its planned operations and meet its obligations.
As at September 30, 2022, the Company had $5,756,642 in available cash (December 31, 2021— $1,990,203). There are no sources of operating cash flows. Given the Company’s current financial position and the ongoing exploration and evaluation expenditures, the Company will need to raise additional capital through the issuance of equity or other available financing alternatives to continue funding its operating, exploration and evaluation activities, and eventual development of the mineral properties. Although the Company has been successful in its past fund-raising activities, there is no assurance as to the success of future fundraising efforts or as to the sufficiency of funds raised in the future.
On November 25, 2022, the Company issued the Promissory Note to the Lender in connection with the Bridge Loan financing. The Promissory Note has a principal amount of $7 million and bears interest at a rate of 10% per annum, calculated monthly and payable on February 22, 2023, being the maturity date of the Promissory Note; provided, however, that the Company may, in its sole discretion, extend the maturity date to March 22, 2023 by providing written notice to the Lender by February 15, 2023. The obligations of the Company under the Promissory Note are fully and unconditionally guaranteed by each of the Company’s existing and future subsidiaries. No assets of the Company were pledged as collateral under the Promissory Note. Refer to the Interim Financial Statements for further details of the bridge loan (see Note 13 – Subsequent Events).
Selected Financial Information
The amounts are derived from the condensed interim consolidated financial statements prepared under IFRS.
| In Canadian dollars, except per share amounts | | Three-month ended September 30, | | Nine-month ended September 30, |
| | | 2022 | | 2021 | | 2022 | | 2021 |
| Net profit (loss) | | | (54,254,152 | ) | | | (375,230 | ) | | | (78,287,243 | ) | | | (1,669,387 | ) |
| Basic proft (loss) per share | | | (0.51 | ) | | | (0.00 | ) | | | (0.86 | ) | | | (0.02 | ) |
| Diluted profit (loss) per share | | | (0.50 | ) | | | (0.00 | ) | | | (0.83 | ) | | | (0.02 | ) |
| Share capital | | | 124,257,621 | | | | 7,952,675 | | | | 124,257,621 | | | | 7,952,675 | |
| Common shares issued | | | 115,442,343 | | | | 80,246,129 | | | | 115,442,343 | | | | 80,246,129 | |
| Weighted average shares outstanding | | | 105,842,672 | | | | 77,529,213 | | | | 92,836,780 | | | | 74,581,558 | |
| Total assets | | | 52,044,621 | | | | 5,547,188 | | | | 52,044,621 | | | | 5,547,188 | |
| Investment in exploration and evaluation assets | | | 5,075,145 | | | | 770,021 | | | | 22,357,735 | | | | 2,093,913 | |
Overall Performance and Results of Operations
The RTO was effective August 3, 2022 and was considered a reverse takeover for accounting purposes as the majority of the shareholders, board of directors and management of the continuing entity are former shareholders, directors and management of PNRC.
The substance of the transaction is a reverse acquisition of a non-operating company. The combined company is considered a continuation of PNRC with the net assets of NAN acquired on August 3, 2022 and consolidated with the operations of PNRC from that date forward.
The Company recorded a net loss of $54,052,183 in Q3 2022, higher by $53,676,953 compared to a net loss of $375,230 in Q3 2021. The loss in Q3 2022 was mainly driven by a loss on the RTO transaction of $75,375,567, share-based payment expense of $4,183,657 and increase in corporate and administration expense, offset by a reversal of the fair value loss of $28,275,255 related to a warrant granted to NAN by PNRC being cancelled upon the RTO.
Total Assets
Total assets during Q3 2022 increased by a net of $46,806,198 from the end of FY 2021. The change is mainly attributed to an increase in exploration and evaluation assets of $41,233,495, increase in cash of $3,766,439 and increase in receivables and other current assets of $909,185 due to increased exploration activities on the Selebi Assets upon the closing of the Selebi acquisition in January 2022 and completion of the RTO in August.
Investment in Exploration and Evaluation Assets
Investment in exploration and evaluation assets relates to evaluation activities in connection with the acquisition of the Selebi Assets and the Selkirk mine in Botswana as well as the Greenland and Canada properties acquired from NAN through the RTO. During the nine-month period ended September 30, 2022 (“YTD 2022”), the recorded amount of the Company’s exploration and evaluation assets increased by $41,233,495. Principal factors contributing to this change were expenditures related to the acquisition and evaluation of the Selebi Assets ($22,227,238), and the deemed acquisition of the Maniitsoq property and the Canadian properties owned by NAN, effective on completion of the RTO ($18,884,595).
PNRC and NAN RTO
On April 26, 2022, PNRC and NAN entered into an amalgamation agreement (the “Amalgamation Agreement”) to combine the two companies to create a leading international Ni-Cu-Co mineral exploration company. The two companies agreed to combine by way of a three-cornered amalgamation whereby NAN Subco, a wholly-owned subsidiary of NAN, would amalgamate with PNRC to form one corporation, and holders of PNRC shares exchanged their shares at a rate of 1.054 common shares of NAN for each common share of PNRC (the “Exchange Ratio”), after giving effect to a consolidation of the common shares of NAN on a 5:1 basis, whereby one (1) post-consolidation common share was exchange for every five (5) pre-consolidation common shares (the “Consolidation”). Outstanding options and warrants of PNRC were adjusted in accordance with their terms, such that the number of common shares of the Company received upon exercise thereof and the exercise price therefor were adjusted proportionately to reflect the Exchange Ratio. The effective date of the RTO was August 3, 2022.
In connection with the RTO, NAN has, among other things: (i) changed its name to “Premium Nickel Resources Ltd.”; (ii) changed its stock exchange ticker symbol to “PNRL”; and (iii) reconstituted its board of directors and management.
Before the closing of the RTO, owned 7,667,707 common shares of PNRC and a 15% warrant which entitled NAN to purchase common shares of PNRC for up to 15% of the capital of PNRC, upon payment of US$10 million prior to the fifth anniversary of the date of issue. Prior to the date that the Amalgamation became effective, the common shares of PNRC and the 15% warrant to purchase common shares of PNRC held by NAN were contributed to NAN Subco, as part of the securities contribution, resulting in such securities being cancelled by operation of the Amalgamation.
Pursuant to the Amalgamation Agreement, effective August 3, 2022, NAN acquired all of the issued and outstanding shares of PNRC. Pursuant to the Amalgamation Agreement, the Company issued 82,157,536 common shares of the Company (on a post-Consolidation basis) in exchange for 77,948,368 common shares of PNRC. Immediately after giving effect to the RTO, the Company was owned as to (i) approximately 72.1% by persons who were shareholders of PNRC prior to the RTO, and (ii) approximately 27.9% by persons who were shareholders of NAN prior to the RTO. Before the closing of the RTO, NAN had 31,748,399 common shares outstanding (on a post-Consolidation basis). Taking into account the composition of the board and senior management and the relative ownership percentages of NAN and PNRC shareholders in the newly-combined enterprise, PNRC is considered, from an accounting perspective, to have acquired NAN, and hence the RTO transaction has been treated as a “reverse takeover” under IFRS.
Transaction Rationale
The reason and the expected benefits of the RTO stated at the time of the announcement were the following:
| ● | Strengthened Marketability for the Resulting Issuer. NAN’s interest in PNRC was a material asset to NAN and a key driver for the appreciation of NAN’s value following July 2020. Prior to the RTO, NAN and PNRC had been raising capital separately based on the value of PNRC. As the market had perceived the close connection between PNRC and NAN, it was considered to be more efficient and to mitigate future financing risks for the Resulting Issuer to raise additional funds in the future using a single entity. |
| | |
| ● | Knowledge of the PNRC Assets. NAN had greater familiarity with the potential benefits and risks associated with PNRC’s assets than it had with alternative acquisition targets, as it was a founding investor in PNRC and NAN’s management was involved in the operations of PNRC. This transaction afforded NAN with an opportunity to participate to a greater degree in a known quality asset through a more effective and efficient structure while continuing to have exposure to NAN’s other assets. |
| | |
| ● | Management of the Resulting Issuer. NAN’s management had been providing management support to PNRC on an ongoing basis and had been involved with the day-to-day operations of PNRC’s business. Following the consummation of the RTO transaction, certain members of NAN’s management continued to provide managerial support to the Resulting Issuer and the special committee of the board of directors of NAN (the “NAN Special Committee”) believed that the continuation of NAN’s management in the day-to-day operation of the Resulting Issuer would benefit the shareholders of NAN. |
| | |
| ● | Process. An extensive due diligence process was undertaken by NAN and in weighing potential strategic alternatives and the current economic prospects of NAN, the transaction was determined to be the most attractive of any such alternatives. |
| | |
| ● | Business and Industry Risks. The future business, operations, financial performance and condition, operating results and prospects of NAN faced significant risks and uncertainties. In light of these risks and uncertainties, the NAN Special Committee concluded that the RTO is more favourable to shareholders of NAN than continuing with NAN’s then current business plan or exercising its warrant to acquire a further equity interest in PNRC. |
| | |
| ● | Fairness Opinion. The fairness opinion provided by INFOR Financial Group Inc., NAN’s financial advisor, indicated that the RTO was fair, from a financial point of view to NAN, subject to and based on the considerations, assumptions and limitations described in such fairness opinion. |
| ● | Well-Supported Transaction. Pursuant to support agreements, the directors and officers of NAN (as well as certain shareholders of NAN) agreed to vote all of their NAN shares in favour of the transaction at the shareholder meeting to approve certain transactions contemplated in the Amalgamation Agreement. Approximately 54% of NAN shareholders and 69% of PNR shareholders, respectively, entered into support agreements. |
| | |
| ● | Negotiated Transaction. The terms of the transaction were the result of a comprehensive negotiation process, conducted under the supervision of the NAN Special Committee, in respect of the key elements of the Amalgamation Agreement and related waiver and suspension agreement, each of which included terms and conditions that were reasonable in the judgment of the NAN Special Committee. |
Board & Management
The board of directors of the Company consists of Keith Morrison, Charles Riopel, Sheldon Inwentash, John Hick, Sean Whiteford, William O’Reilly and Don Newberry with Charles Riopel as Executive Chairman. Management of the Company includes Keith Morrison (Chief Executive Officer), Mark Fedikow (President), Sarah Wenjia Zhu (Chief Financial Officer) and Timothy Moran (Corporate Secretary). In addition, the technical team of the Company includes Ms. Sharon Taylor (Chief Geophysicist) and Dr. Peter Lightfoot (Consulting Chief Geologist).
Financial Reporting
For financial reporting purposes, the Company is considered to be a continuation of PNRC except with regard to the authorized and issued share capital, which is that of NAN. The consolidated statements of operations and cash flows for the quarter ended September 30, 2022 include the results of operations and cash flows of PNRC for the period from January 1, 2022 to August 3, 2022, and the results of operations and cash flows of both PNRL and NAN for the period from August 3, 2022 to September 30, 2022. The primary reason for the RTO was to create a leading international Ni-Cu-Co mineral exploration company. With a portfolio of nickel-copper cobalt assets, the Company will have the ability to execute a phased strategy and focus in the short term on developing the Selebi project in Botswana, its material property.
The substance of the transaction is a reverse acquisition of a non-operating company. The transaction does not constitute a business acquisition as the amalgamation does not meet the definition of a business combination under IFRS 3. As a result, the transaction is accounted for as a capital transaction with NAN being identified as the accounting acquiree and the equity consideration being measured at fair value (“FV”).
The purchase price was determined based on the number of shares that PNRC would have had to issue on the date of closing to give the owners of NAN the same percentage equity (27.9%) of the combined entity as they hold subsequent to the RTO.
The costs of the acquisition have been allocated as follows:
| NAN’s shares outstanding before RTO | | | 158,741,995 | |
| NAN share price ($/share) before RTO | | $ | 0.58 | |
| FV of shares transferred | | | 92,070,357 | |
| FV of options, warrants and agent warrants | | | 12,110,855 | |
| FV of preferred shares | | | 38,082 | |
| Total FV of consideration transferred | | $ | 104,219,294 | |
| Cash | | | 11,051,917 | |
| Trade and other receivables | | | 450,522 | |
| Property, Plant and Equipment | | | 14,111 | |
| Exploration and evaluation assets | | | 18,875,759.93 | |
| Trade payables and accrued liabilities | | | (1,548,582 | ) |
| Net assets acquired | | | 28,843,728 | |
| Loss on acquisition | | | 75,375,567 | |
| | | $ | 104,219,294 | |
Pursuant to the RTO, an aggregate of 8,827,250 options (“Replacement Options”) were issued (on a post-Consolidation basis) to the former holders of options (“PNRC Options”) in exchange for 8,375,000 PNRC Options. The Replacement Options issued to the former holders of PNRC Options were on the same terms and conditions as those exchanged by such former holders of PNRC Options. No amount has been recorded in respect of these actual issuances of options. Rather, given that the RTO has been accounted for as a reverse takeover of NAN by PNRC, from an accounting perspective, PNRC is deemed to have issued options and warrants to the former securityholders of NAN. On August 3, 2022, NAN had 2,995,794 options and 2,228,340 warrants outstanding, respectively, as well as 118,186 preferred shares that could be converted to 13,131 common shares of NAN (on a post-consolidation basis). The fair value of the deemed issuance of 2,995,794 options, 2,228,340 warrants and 118,186 preferred shares of the Company was $12 million, and this amount has been included as a component of the purchase price.
The trading in common shares of NAN on the Exchange was halted following the announcement of the RTO on February 17, 2022, with the closing share price of $0.58 per share. On August 18, 2022, the common shares of the Company resumed trading on the Exchange under the symbol “PNRL”. Given that the acquisition was effected by way of a pre-determined share exchange ratio negotiated in April 2022, the effect of recording the share consideration exchanged using the market price for the shares on the last trading date prior to the transaction resulted in a loss of $75 million with respect to the fair value of identifiable net assets over the fair value of the consideration transferred, which has been recorded as a loss during the period in other income.
Results of Operations
The following table summarizes the Company’s Statement of Loss and Comprehensive Loss for the three- and nine-month
Periods ended September 30, 2022 and PRNC’s Statement of Loss and Comprehensive Loss for the three- and nine-month
periods ended September 30, 2021.
| | | Three months ended | | Nine months ended |
| | | September 30, 2022 | | September 30, 2021 | | September 30, 2022 | | September 30, 2021 |
| | | | | | | | | |
| EXPENSES | | | | | | | | | | | | | | | | |
| Corporate and administration expenses | | | (2,022,206 | ) | | | (97,421 | ) | | | (2,855,559 | ) | | | (265,732 | ) |
| Management fees | | | (625,905 | ) | | | (173,175 | ) | | | (1,701,211 | ) | | | (436,626 | ) |
| Due diligence BCL | | | (979 | ) | | | (32,286 | ) | | | (5,014 | ) | | | (86,649 | ) |
| Advisory and consultancy | | | (77,600 | ) | | | (69,433 | ) | | | (571,626 | ) | | | (110,744 | ) |
| Depreciation | | | (882 | ) | | | - | | | | (882 | ) | | | - | |
| Interest and bank charges | | | (7,302 | ) | | | (801 | ) | | | (15,851 | ) | | | (2,543 | ) |
| Share-based payment | | | (4,183,657 | ) | | | - | | | | (6,776,752 | ) | | | (761,480 | ) |
| Warrant fair value movement | | | 28,275,255 | | | | - | | | | 8,974,901 | | | | - | |
| Net foreign exchange gain (loss) | | | (33,343 | ) | | | (3,961 | ) | | | 127,449 | | | | (7,209 | ) |
| Operating loss | | | 21,323,381 | | | | (377,077 | ) | | | (2,824,545 | ) | | | (1,670,983 | ) |
| | | | | | | | | | | | | | | | | |
| Interest income (expenses) and other income | | | 3 | | | | 1,847 | | | | (87,131 | ) | | | 1,596 | |
| Acquisition loss on RTO | | | (75,375,567 | ) | | | - | | | | (75,375,567 | ) | | | | |
| NET PROFIT (LOSS) FOR THE PERIOD | | | (54,052,183 | ) | | | (375,230 | ) | | | (78,287,243 | ) | | | (1,669,387 | ) |
| | | | | | | | | | | | | | | | | |
| Exchange differences on translation of foreign operations | | | (201,969 | ) | | | (1,069 | ) | | | (1,473,326 | ) | | | (2,607 | ) |
| TOTAL COMPREHENSIVE PROFIT (LOSS) FOR THE PERIOD | | | (54,254,152 | ) | | | (376,299 | ) | | | (79,760,569 | ) | | | (1,671,994 | ) |
Three Months Ended September 30, 2022, and September 30, 2021
The Company incurred a net loss of $54,052,183 in Q3 2022 compared to a net loss of $375,230 in Q3 2021 resulting in an increased loss of $53,676,953 (quarter-over-quarter). The net loss in Q3 2022 was mainly driven by a loss on the RTO transaction of $75,375,567, net of a reversal of the fair value loss of $28,275,255 related to a warrant granted to NAN by PNRC being cancelled upon the RTO.
The following higher expenditures in Q3 2022 compared to Q3 2021 also contributed to the Q3 2022 loss:
| ● | Corporate and administrative expenses were $2,022,206 and were higher by $1,924,785 compared to $97,421 costs in Q3 2021. Activities related to the RTO were the key contributing factors to higher costs in Q3 2022. |
| | | |
| ● | Management fees were $625,905 in Q3 2022 and were higher by $452,730 compared to $173,175 in Q3 2021. This increase is a direct result of operational activities in Botswana following the purchase of the Selebi Assets and the Selkirk mine, expansion of consultancy management in support of the re-development of the Selebi Assets as well as management of the Company’s subsidiaries in Barbados, which did not exist in Q3 2021. |
| | | |
| ● | Share-based payment relating to options issuance was $4,183,657 in Q3 2022 compared to $nil in Q3 2021. |
| | | |
| ● | Advisory and consultancy fees were $77,600 and were higher by $8,167 compared to $69,433 incurred in Q3 2021 due to increasing activities in Botswana and Barbados upon the closing of Selebi and Selkirk acquisitions in January and August 2022 respectively. |
| ● | Foreign exchange loss totaled $33,343 during Q3 2022 and was higher by $29,382 compared to $3,961 loss in Q3 2021. The higher loss in Q3 2022 was due to increased volume in transactions denominated in foreign currencies and weakening Canadian dollar against the United States dollar. |
| | | |
| ● | Interest and bank charges were $7,302 in Q3 2022 and were higher by $6,501 compared to $801 in Q3 2021. |
| | | |
| ● | Interest income was nominal at $3 in Q3 2022 and was lower by $1,844 compared to $1,847 interest income in Q3 2021. |
| | | |
| ● | Depreciation expense was $882 during Q3 2022 compared to $nil in Q3 2021. |
The higher loss in Q3 2022 was offset by the following lower expenditures in Q3 2022 compared to Q3 2021:
| ● | Due diligence related expenditures totalled $979 in Q3 2022 and were lower by $31,307 compared to $32,286 costs in Q3 2021. Higher costs in Q3 2021 resulted from commencing capitalization of these costs in late Q3 2021 upon the Company being awarded exclusivity to acquire the assets and started to incur costs directly in association with the acquisition and evaluation of the properties. |
Nine Months Ended September 30, 2022 and September 30, 2021
The Company incurred a net loss of $78,287,243 in YTD 2022 compared to a net loss of $1,669,387 in the nine month period ended September 30, 2021 (“YTD 2021”), resulting in an increased loss of $76,617,856 (period-over-period). The net loss in YTD 2022 was mainly driven by a loss on the RTO transaction of $75,375,567, as well as higher share-based payment expenses and higher corporate and administrative expenses incurred in connection with the RTO and was due to the following events:
| ● | Share-based payment expense relating to options issuance was $6,776,752 and was higher by $6,015,272 in YTD 2022 compared to $761,480 in YTD 2021. |
| | | |
| ● | Corporate and administrative expenses were $2,855,559 and were higher by $2,589,827 compared to $265,732 incurred in YTD 2021. Activities related to undertaking the RTO were the key contributing factors to higher costs in YTD 2022. |
| | | |
| ● | Management fees were $1,701,211 in YTD 2022 and were higher by $1,264,585 compared to $436,626 in YTD 2021. This increase is a direct result of increased operational activities in Botswana following the purchase of the Selebi Assets and the Selkirk mine, expansion of consultancy management in support of the re-development of the Selebi Assets as well as activities in Barbados, which did not exist in Q3 2021. |
| | | |
| ● | Advisory and consultancy fees were $571,626 and were higher by $460,882 compared to $110,744 incurred in YTD 2021. Higher fees were due to increasing activities in Botswana and Barbados upon the closing of Selebi and Selkirk acquisitions in January and August 2022, respectively. |
| | | |
| ● | Interest and bank charges were $15,851 in YTD 2022 and were higher by $13,308 compared to $2,543 in YTD 2021. |
| | | |
| ● | Interest income was $1,596 in YTD 2021 and was higher by $88,727 compared to interest expense of $87,131 in YTD 2022. |
| | | |
| ● | Depreciation expense was $882 during Q3 2022 compared to $nil in Q3 2021. |
The higher loss in YTD 2022 was offset by the following lower expenditures in YTD 2022 compared to YTD 2021:
| ● | Reversal of the fair value loss of $8,974,901 related to the RTO. |
| | | |
| ● | Foreign exchange gain totalled $127,449 and was higher by $134,658 compared to $7,209 loss in YTD 2021. |
| ● | Due diligence related expenditures totalled $5,014 in YTD 2022 and were lower by $81,635 compared to $86,649 costs in YTD 2021. Higher costs in YTD 2021 resulted from commencing capitalization of these costs in late YTD 2021 upon the Company being awarded exclusivity to acquire the assets. |
Quarterly Results of Operations
| All amounts in table are expressed in thousands of CDN dollars, except shares and per share amounts | | 2022 3rd quarter | | 2022 2nd quarter | | 2022 1st quarter | | 2021 4th quarter |
| Statement of Loss | | | | | | | | | | | | | | | | |
| | | | | | | | | | | | | | | | | |
| Net loss | | | 54,052 | | | | 983 | | | | 390 | | | | 2,214 | |
| Net loss per share - basic and diluted | | | 0.51 | | | | 0.04 | | | | 0.01 | | | | 0.09 | |
| | | | | | | | | | | | | | | | | |
| Statement of Financial Position | | | | | | | | | | | | | | | | |
| | | | | | | | | | | | | | | | | |
| Cash, cash equivalents and short-term investments | | | 5,757 | | | | 1,321 | | | | 690 | | | | 1,973 | |
| Total assets | | | 52,045 | | | | 41,859 | | | | 41,970 | | | | 41,683 | |
| Net assets | | | 47,984 | | | | 40,210 | | | | 41,193 | | | | 41,203 | |
| Share capital | | | 124,257 | | | | 93,970 | | | | 93,970 | | | | 93,451 | |
| Common shares issued | | | 115,442,343 | | | | 26,774,006 | | | | 26,774,006 | | | | 26,240,925 | |
| Weighted average shares outstanding | | | 105,842,672 | | | | 26,774,006 | | | | 26,647,885 | | | | 25,653,156 | |
| | | | | | | | | | | | | | | | | |
| All amounts in table are expressed in thousands of CDN dollars, except shares and per share amounts | | 2021 3rd quarter | | 2021 2nd quarter | | 2021 1st quarter | | 2020 4th quarter |
| Statement of Loss | | | | | | | | | | | | | | | | |
| | | | | | | | | | | | | | | | | |
| Net loss | | | 236 | | | | 421 | | | | 1,125 | | | | 326 | |
| Net loss per share - basic and diluted | | | 0.01 | | | | 0.02 | | | | 0.05 | | | | 0.01 | |
| | | | | | | | | | | | | | | | | |
| Statement of Financial Position | | | | | | | | | | | | | | | | |
| | | | | | | | | | | | | | | | | |
| Cash, cash equivalents and short-term investments | | | 1,322 | | | | 1,936 | | | | 716 | | | | 308 | |
| Total assets | | | 41,298 | | | | 41,486 | | | | 40,185 | | | | 39,644 | |
| Net assets | | | 40,676 | | | | 40,876 | | | | 39,391 | | | | 39,015 | |
| Share capital | | | 91,607 | | | | 91,827 | | | | 90,534 | | | | 89,627 | |
| Common shares issued | | | 24,969,866 | | | | 24,889,866 | | | | 23,222,373 | | | | 21,966,730 | |
| Weighted average shares outstanding | | | 24,914,214 | | | | 23,945,386 | | | | 22,649,004 | | | | 21,966,730 | |
Note: Prior to the RTO, PNRC was a private company and no quarterly financial statements were prepared and published. The amounts in the above table from the fourth quarter of 2020 to the second quarter of 2022 represent NAN’s quarterly financial information, and are based on the information contained in the financial statements of NAN for the applicable periods, which are available on SEDAR (www.sedar.com) under Premium Nickel Resources’ issuer profile
Liquidity, Capital Resources and Going Concern
Liquidity
The Company has financed its operations to date primarily through the issuance of common shares. The Company continues to seek capital through various means including the issuance of equity and/or debt and the securing of joint venture partners where appropriate.
The Company’s principal requirements for cash over the next twelve months will be to fund the ongoing work program at the Selebi Mines (as more particularly described in the Selebi Technical Report and Appendix “C” – Information Concerning PNR) in the Form 3D2 (Information Required in a Filing Statement for a Reverse Takeover or Change of Business) (the “Filing Statement”) prepared in accordance with the policies of the Exchange, a copy of which is available on SEDAR (www.sedar.com) under Premium Nickel Resources’ issuer profile), general corporate and administrative costs and to service the Company’s current trade and other payables. Please see “Financing Activities” above for details regarding the Company’s recent financings.
As at September 30, 2022, the Company had $5,756,642 in available cash. On April 7, 2022 PNRL completed a non-brokered private placement financing of 8,865,619 common shares at a price of US$2.00 per share for aggregate gross proceeds of US$17,731,238. On August 3, 2022, upon satisfaction of the escrow release condition, the proceeds of the 4,223,600 Subscription Receipts, which were issued on April 28, 2022 pursuant to a brokered private placement of the Company at a price of $2.40 per Subscription Receipt for gross proceeds of 10,136,640 were released to the Company. Both financings improved the liquidity and increased the capital of the Company.
On November 25, 2022, the Company issued the Promissory Note to the Lender in connection with the Bridge Loan financing. The Promissory Note has a principal amount of $7 million and bears interest at a rate of 10% per annum, calculated monthly and payable on February 22, 2023, being the maturity date of the Promissory Note; provided, however, that the Company may, in its sole discretion, extend the maturity date to March 22, 2023 by providing written notice to the Lender by February 15, 2023. The net proceeds of the Bridge Loan, being $6,740,000 after deducting the commitment fee of $260,000, further enhanced the working capital of the Company. Refer to the Interim Financial Statements (Note 13 – Subsequent Events) for further details of the impact of the Bridge Loan financing.
Use of Proceeds
The following table provides an update on principal purposes for which the funds available to the Company are expected to be used, as disclosed in the Filing Statement, along with amounts expended to September 30, 2022. The funds available to the Company to achieve the purposes set out below include: (i) the net proceeds of approximately $9.37 million from the issuance of the Subscription Receipts, which was released from escrow and delivered to the Company in connection with the closing of RTO on August 3, 2022; (ii) remaining cash, at the time of the completion of the RTO, from the private placement of US$17.7 million (C$22.5 million) by PNRC that closed April 2022; and (iii) pre-existing cash on hand in each of NAN and PNRC.
| Principal Purpose | | Estimated Amount(1) | | Approximate Use of Proceeds to September 30, 2022 |
| | | US$ | | C$(2) | | C$ |
| Selebi Project – Phase I Work Program | | | | | | | | | | | | |
| Exploration and Infill Drilling Programs, BHEM and televiewer surveys | | | 3,500,176 | | | | 4,510,327 | | | | 3,723,221 | |
| Preliminary Economic Assessment | | | 280,008 | | | | 360,818 | | | | - | |
| Metallurgical Testing | | | 199,480 | | | | 257,050 | | | | 40,755 | |
| Site Administration Costs | | | 1,364,004 | | | | 1,757,656 | | | | 722,414 | |
| Care and Maintenance | | | 2,498,000 | | | | 3,218,923 | | | | 908,640 | |
| Sub-total | | | 7,841,668 | | | | 10,104,773 | | | | 5,395,030 | |
| | | | | | | | | | | | | |
| Selkirk Project | | | | | | | | | | | | |
| Site Administration Costs | | | 299,880 | | | | 386,425 | | | | 106,492 | |
| Completion of a NI 43-101 technical report | | | 25,000 | | | | 32,215 | | | | - | |
| Sub-Total | | | 324,880 | | | | 418,640 | | | | 106,492 | |
| | | | | | | | | | | | | |
| Other Project Cost | | | 253,034 | | | | 326,060 | | | | 15,169 | |
| General Operating Costs & G&A | | | 3,885,072 | | | | 5,006,304 | | | | 1,415,194 | |
| Contingency | | | 615,223 | | | | 792,776 | | | | - | |
| Total Estimated Spend for 18-month period from July 1, 2022 | | | 12,919,886 | | | | 16,648,565 | | | | 6,931,885 | |
Notes:
(1) For further detail, please refer to the Filing Statement under the heading “Principal Purposes of Funds”.
(2) The Canadian dollar equivalent is based on the exchange rate of US$1.00 = CDN $1.2886 used in the Filling Statement.
Approximate use of proceeds is based on expenditures of the Company for the nine-month period ended September 30, 2022, adjusted for non-cash expenses such as share-based compensation, amortization, and depreciation.
On November 25, 2022, the Company issued the Promissory Note to the Lender in connection with the Bridge Loan financing. The Promissory Note has a principal amount of $7 million and bears interest at a rate of 10% per annum, calculated monthly and payable on February 22, 2023, being the maturity date of the Promissory Note; provided, however, that the Company may, in its sole discretion, extend the maturity date to March 22, 2023 by providing written notice to the Lender by February 15, 2023. The Company intends to use the proceeds from the issuance of the Promissory Note to finance the working capital of the Company.
Working Capital
As at September 30, 2022, the Company had a working capital of $3,040,626 (December 31, 2021 – $1,558,011), calculated as total current assets less total current liabilities. The increase in working capital is mainly due to an increase in cash and other current assets, offset by an increase in accounts payable and accrued liabilities.
Going Concern
As at September 30, 2022, the Company had accumulated losses totaling $16,443,206. The continuation of the Company is dependent upon the continued financial support of shareholders, its ability to raise capital through the issuance of its securities, and/or obtaining long-term financing.
When managing capital, the Company’s objective is to ensure the Company continues as a going concern as well as to maintain optimal returns to shareholders and benefits for other stakeholders. Management adjusts the capital structure as necessary in order to support the acquisition and exploration of mineral properties.
The properties in which the Company currently has an interest are in the exploration and evaluation stage. As such, the Company is dependent on external financing to fund its activities. In order to carry out the planned exploration and pay for administrative costs, the Company will spend its existing working capital and raise additional amounts as needed. Although the Company has been successful in its past fund-raising activities, there is no assurance as to the success of future fundraising efforts or as to the sufficiency of funds raised in the future.
The Company will continue to assess new properties and seek to acquire an interest in additional properties if it believes there is sufficient geologic or economic potential and if it has adequate financial resources to do so.
Contractual Obligations and Contingencies
Selebi Assets
As per the Selebi APA, the aggregate purchase price payable to the seller for the Selebi Assets shall be the sum of US$56,750,000 which amount shall be paid in three instalments:
| ● | US$1,750,000 payable on the closing date. This payment has been made. |
| | |
| ● | US$25,000,000 upon the earlier of: a) approval by the Ministry of Mineral Resources, Green Technology and Energy Security (“MMRGTES”) of the Company’s Section 42 and Section 43 Applications (further extension of the mining license and conversion of the mining licence into an operating license respectively), and b) on the expiry date of the study phase, January 31, 2025, which could be extend for one year with written notice. |
| | |
| ● | The third instalment of $30,000,000 is payable on the completion of mine construction and production start-up by the Company on or before January 31, 2030, but not later than four years after the approval by the Minister of MMRGTES of the Company’s Section 42 and Section 43 Applications. |
| | |
| ● | Payment of care and maintenance funding contribution in respect of the Selebi Assets for a total of US$5,178,747 from March 22, 2021 to the closing date. |
As per the term and conditions of the Selebi APA, the Company has the option to cancel the second and third payments and give back the Selebi Assets to the liquidator in the event where the exploration program determines that the Selebi Assets are not economical. The Company also has an option to pay in advance the second and third payments in the event where the exploration program determines that the Selebi Assets are economical. The Company’s accounting policy, as permitted by IAS 16 – Property, Plant and Equipment, is to measure and record contingent consideration when the conditions associated with the contingency are met. As of September 30, 2022, none of the conditions of the second and third instalment are met. Hence, these amounts are not accrued in the Interim Financial Statements.
In addition to the Selebi APA, the purchase of the Selebi Assets is also subject to a contingent compensation agreement as well as a royalty agreement with the liquidator.
Selkirk Assets
In regard to the Selkirk assets (the Selkirk mine and related infrastructures), the purchase agreement does not provide for a purchase price or initial payment for the purchase of the assets. The Selkirk purchase agreement provides that if the Company elects to develop Selkirk first, the payment of the second Selebi instalment of US$25 million would be upon the approval by the Minister of MMRGTES of the Company’s Section 42 and Section 43 Applications (further extension of the Selkirk mining license (years) and conversion of the Selkirk mining licence into an operating license respectively). For the third Selebi instalment of US$30 million, if Selkirk were commissioning earlier than Selebi, the payment would trigger on Selkirk’s commission date.
Post Creek
Commencing August 1, 2015, the Company is obligated to pay advances on the NSR of $10,000 per annum. During Q2 2022, the Company paid $5,000 which will be deducted from any payments to be made under the NSR.
Halcyon
Commencing August 1, 2015, the Company is obligated to pay advances on the NSR of $8,000 per annum. During Q2 2022, the Company paid $4,000 which will be deducted from any payments to be made under the NSR.
Off-Balance Sheet Arrangements
There are no off-balance sheet arrangements as at September 30, 2022.
Financial Instruments and Financial Risk Management
The Company thoroughly examines the various financial instrument risks to which it is exposed and assesses the impact and likelihood of those risks. These risks may include interest rate risk, credit risk, liquidity risk and currency risk. The carrying value of the Company’s financial instruments approximates their fair value due to their short-term nature. Fair value measurements of financial instruments are required to be classified using a fair value hierarchy that reflects the significance of inputs in making the measurements. The levels of the fair value hierarchy are defined as follows:
Level 1 – Quoted prices (unadjusted) in active markets for identical assets or liabilities.
Level 2 – Inputs other than quoted prices included within Level 1 that are observable for the asset or liability,
either directly or indirectly.
Level 3 – Inputs for the asset or liability that are not based on observable market data.
On September 30, 2022, the fair value of the Company’s warrant liabilities is based on Level 3 measurements and the fair value of cash is based on Level 1 measurements. The fair values of other financial instruments approximate their carrying values due to the relatively short-term maturity of these instruments.
All amounts in table are expressed in
thousands of CDN dollars | | Fair Value at
September 30, 2022 | | Basis of Measurement | | Associated Risks |
| Cash | | | 5,756,642 | | | FVTPL | | Credit |
| Other receivables and prepaid expenses | | | 1,057,479 | | | Amortized cost | | Credit |
| Trade payables and accrued liabilities | | | 3,773,495 | | | Amortized cost | | Liquidity |
The Company’s accounting policies regarding financial instrument classification, measurement, impairment and derecognition are described in the Interim Financial Statements (see Note 2(3) – Basis of Presentation and Significant Accounting Policies – Exploration and evaluation assets).
Risk and Uncertainties
The business of the Company entails significant risks that may have a material and adverse impact on the future operations and financial performance of the Company and the value of the common shares of the Company. Although the Company has been successful in its past fund-raising activities, there is no assurance as to the success of future fundraising efforts or as to the sufficiency of funds raised in the future.
In March 2020, the World Health Organization declared coronavirus COVID-19 a global pandemic. This contagious disease outbreak, which has continued to spread, and any related adverse public health developments, have adversely affected workforces, economies and financial markets globally, potentially leading to an economic downturn. It is not possible for the Company to predict the duration or magnitude of the adverse results of the outbreak and its effects on the Company’s business or results of operations at this time.
Readers are encouraged to read and consider the risk factors which are more specifically described, inter alia, in (i) this MD&A (see “Risk and Uncertainties”), (ii) the Filing Statement (see “Risk Factors”), (iii) the Interim Financial Statements (see Note 12 – Risk Management), and (iv) the Annual Financial Statements (see Note 13 – Risk Management). Such risk factors could materially affect the future operating results of the Company and could cause actual events to differ materially from those described in the forward-looking statements relating to the Company.
Share Capital Information
As of the date of this MD&A the following number of common shares of the Company and other securities of the Company exercisable for common shares of the Company are outstanding:
| Securities | | Common shares |
| Common shares | | | 115,994,343 | |
| Preferred shares | | | 13,131 | |
| Warrants | | | 979,557 | |
| Stock options | | | 10,971,044 | |
| Fully diluted share capital | | | 127,958,075 | |
Events Subsequent to September 30, 2022
On November 21, 2022, the Company announced a $7 million bridge loan (the “Bridge Loan”) financing from the Lender. The Bridge Loan financing closed on November 25, 2022 and net proceeds of $6,740,000 were received by the Company (after deducting the commitment fee of $260,000). The Bridge Loan is evidenced by the issuance of the Promissory Note by the Company to the Lender. The Promissory Note has a principal amount of $7 million and bears interest at a rate of 10% per annum, calculated monthly and payable on February 22, 2023, being the maturity date of the Promissory Note; provided, however, that the Company may, in its sole discretion, extend the maturity date to March 22, 2023 by providing written notice to the Lender by February 15, 2023.
The obligations of the Company under the Promissory Note are fully and unconditionally guaranteed by each of the Company’s existing and future subsidiaries. No assets of the Company were pledged as collateral under the Promissory Note. The Promissory Note is subject to certain covenants and provisions on events of default, repayments and mandatory prepayments that are customary for a loan of this nature. The Company intends to use the proceeds from the issuance of the Promissory Note to fund the ongoing redevelopment work programs on its Botswanan assets and for general corporate purposes.
In connection with the Bridge Loan financing, the Company also issued 119,229 common share purchase warrants to the Lender, each of which is exercisable to acquire one common share of the Company at a price of $2.04 per share until November 25, 2023.
Disclosure Controls and Procedures
Management has established processes to provide them sufficient knowledge to support representations that they have exercised reasonable diligence that: (i) the consolidated financial statements do not contain any untrue statement of material fact or omit to state a material fact required to be stated or that is necessary to make a statement not misleading in light of the circumstances under which it is made, as of the date of and for the periods presented by the consolidated financial statements; and (ii) the consolidated financial statements fairly present in all material respects the financial condition, results of operations and cash flows of the Company, as of the date of and for the periods presented.
Caution Regarding Forward Looking Statements
Statements contained in this MD&A that are not historical facts are forward-looking information (within the meaning of the Canadian securities legislation) that involve risks and uncertainties. In this MD&A, forward-looking information includes, but is not limited to, statements with respect to the RTO, ongoing payments and covenants with respect to the Selebi acquisition and the Selkirk acquisition, the Company’s anticipated plans and work program at the Selebi Mines, establishment and estimation of mineral reserves and mineral resources, the realization of mineral reserve estimates, the timing and amount of estimated future capital expenditures, success of exploration activities, currency fluctuations, requirements for additional capital, government regulation of mining operations, environmental risks, unanticipated reclamation expenses, title disputes or claims, limitations on insurance coverage and the timing and possible outcome of pending litigation. In certain cases, forward-looking information can be identified by the use of words such as “plans”, “expects” or “does not expect”, “is expected”, “budget”, “scheduled”, “estimates”, “forecasts”, “intends”, “anticipates” or “does not anticipate”, or “believes”, or variations of such words and phrases or state that certain actions, events or results “may”, “could”, “would”, “might” or “will be taken”, “occur” or “be achieved”. Forward-looking information involves known and unknown risks, uncertainties and other factors which may cause the actual results, performance or achievements of the Company to be materially different from any future results, performance or achievements expressed or implied by such forward-looking information. Such risks and other factors that could cause actual results to differ materially from those anticipated in forward-looking information are described, inter alia, in (i) this MD&A (see “Risk and Uncertainties”), (ii) the Filing Statement (see “Risk Factors”), (iii) the Interim Financial Statements (see Note 12 – Risk Management), and (iv) the Annual Financial Statements (see Note 13 – Risk Management). Although the Company has attempted to identify important factors that could affect the Company and may cause actual actions, events or results to differ materially from those described in forward-looking information, there may be other factors that cause actions, events or results not to be as anticipated, estimated or intended. There can be no assurance that forward-looking information will prove to be accurate, as actual results and future events could differ materially from those anticipated in such statements. Accordingly, readers should not place undue reliance on forward-looking information. The forward-looking information in this MD&A speak only as of the date hereof. The Company does not undertake any obligation to release publicly any revisions to these forward-looking information to reflect events or circumstances after the date hereof to reflect the occurrence of unanticipated events, except as required by law.
Historical Estimate
The historical SAMREC compliant resource (the “Historic SAMREC Resource”) that was calculated for the Selebi Mine in 2016 is considered to be historical in nature and should not be relied upon as a current mineral resource estimate. While management believes that the Historic SAMREC Resource could be indicative of the presence of mineralization on the Selebi deposit, a qualified person has not completed sufficient work to classify the historical mineral estimate as a current mineral resource estimate and PNRL is not treating the historical mineral estimates as current mineral resource estimate.
Selebi Technical Report
The Scientific and technical information in this MD&A relating to the Selebi Mines is supported by the technical report titled “Technical Report on the Selebi Mines, Central District, Republic of Botswana, Report for NI 43-101”, dated June 16, 2022 (with an effective date of March 1, 2022) (the “Technical Report”), and prepared by SLR Consulting (Canada) Ltd. for Premium Nickel Resources, in accordance with NI 43-101. Reference should be made to the full text of the Technical Report, including the assumptions, limitations and qualifications contained therein, as well as the data verification relating to the historic data compilation presented in this MD&A, and is available electronically on SEDAR (www.sedar.com) under Premium Nickel Resources’ issuer profile.
Qualified Person and Other Technical Information
The scientific and technical information in this MD&A has been reviewed and approved by Sharon Taylor, Chief Geophysicist of the Company, who is a “qualified person” for the purposes of NI 43-101.
The drilling was completed by Mitchell Drilling of Botswana utilizing a Sandvik UDR1500 and a Boart Longyear LF-160 diamond drill rig. Drill core samples (47.75mm NQ) are cut in half by a diamond saw on site. Half of the core is retained for reference purposes. Samples are generally 1.0 to 1.5 metre intervals or less at the discretion of the site geologists. Sample preparation and lab analysis was completed at the ALS Chemex in Johannesburg, South Africa. Commercially prepared Blank samples and certified Cu/Ni sulphide analytical control standards with a range of grades are inserted in every batch of 20 samples or a minimum of one set per sample batch. Analyses for Ni, Cu, Co and S are completed using a peroxide fusion preparation and ICP-AES finish (ME-ICP81). Ag analyses are completed using a four acid digestion with ICP-AES Finish (ME-ICP61).
Lengths of assays are reported as down hole intervals. True thickness can be calculated assuming a dip/dip direction of 43°/206°.
The scientific and technical information in this MD&A relating to the assets of the Company in Greenland and Canada has been prepared by or under the supervision of Peter C. Lightfoot, PhD, P. Geo, the Consulting Chief Geologist of the Company, who is a “qualified person” for the purposes of NI 43-101. Dr. Lightfoot has reviewed and approved the disclosure in this MD&A relating to the assets of the Company in Greenland and Canada.
For further information relating to the Maniitsoq Project in southwest Greenland, please see the technical report titled “Updated Independent Technical Report for the Maniitsoq Nickel-Copper-Cobalt-PGM Project, Greenland” dated March 17, 2017 (with an effective date of March 17, 2017) prepared for the Company by SRK Consulting (US) Inc., and is available on SEDAR (www.sedar.com) under Premium Nickel Resources’ issuer profile.
See above under the heading “Selebi Technical Report” for a description of the technical report relating to the Selebi Mines, being the flagship asset of Premium Nickel Resources Ltd.
