Semiannual Report
March 31, 2019
Provident Trust Strategy Fund
(PROVX)
A NO-LOAD MUTUAL FUND
IMPORTANT NOTE: Beginning on January 1, 2021, as permitted by regulations adopted by the U.S. Securities and Exchange Commission, paper copies of the Fund’s annual and semi-annual shareholder reports will no longer be sent by mail, unless you specifically request paper copies of the shareholder reports from the Fund or from your financial intermediary, such as a broker-dealer or bank. Instead, the reports will be available on the Fund’s website (www.provfunds.com), and you will be notified by mail each time a report is posted and provided with a website link to access the report.
If you already elected to receive shareholder reports electronically, you will not be affected by this change and you need not take any action. You may elect to receive shareholder reports and other communications from the Fund electronically anytime by contacting your financial intermediary or, if you are a direct investor, by calling 1-855-739-9950.
You may elect to receive all future reports in paper, free of charge. If you invest through a financial intermediary, you can contact your financial intermediary to request that you continue to receive paper copies of your shareholder reports. If you invest directly with the Fund, you can call 1-855-739-9950 to let the Fund know you wish to continue receiving paper copies of your shareholder reports. Your election to receive reports in paper will apply to all funds that you hold through your financial intermediary or directly with the Fund.
TABLE OF CONTENTS
| Letter to Shareholders | 2 |
| Expense Example | 4 |
| Industry Sectors | 5 |
| Schedule of Investments | 5 |
| Statement of Assets and Liabilities | 7 |
| Statement of Operations | 8 |
| Statements of Changes in Net Assets | 9 |
| Financial Highlights | 10 |
| Notes to Financial Statements | 11 |
| Additional Information | 15 |
Provident Trust Strategy Fund
Letter to Shareholders (Unaudited)
April 1, 2019
Dear Fellow Provident Trust Strategy Fund Shareholders,
Provident Trust Strategy Fund (PROVX) lost -1.97% for the first half of the 2019 fiscal year vs. a -1.72% loss for the S&P 500. During Provident’s tenure as portfolio manager (beginning September 9, 2002), PROVX gained +379.85% cumulatively with a 79.8% average month-end allocation to equities vs. +340.20% for the always fully invested S&P 500. Top performers for the fiscal year to date were PayPal Holdings, Inc., Fastenal Co. and Visa Inc., while Cognizant Technology Solutions Corp., The Charles Schwab Corp. and Southwest Airlines Co. underperformed. During the fiscal year to date we added to our Fastenal, PayPal Holdings, Inc., Southwest Airlines and T. Rowe Price positions, eliminated long-term fund holding Cognizant Technology due to slowing growth and reduced our over-weighted position in Visa. The Fund’s equity exposure is 78.1%, in-line with the since 2002 average allocation, reflecting our investment mandate as the sole or core manager.
We believe the following investment practices differentiate PROVX:
| | – | We seek asset allocation and selection authority for investors seeking inflation-adjusted growth over complete market cycles. |
| | | |
| | – | Concentration: The top 10 holdings represent 65.7% of total fund assets. |
| | | |
| | – | Active management: The percentage of the portfolio that is weighted differently than the S&P 500 is 89.7%. |
| | | |
| | – | Flexible asset allocation: During our tenure as portfolio manager, PROVX’s equity allocation has ranged from 29.8% to 97.1%. |
| | | |
| | – | Long-term investment horizon: Portfolio turnover averaged 14.8% over the past 10 years. |
| | | |
| | – | Steady adherence to our growth at reasonable valuation (GARV) investment strategy. |
| | | |
| | – | Manager commitment: 100% of the portfolio managers’ retirement assets are invested in PROVX. |
We forecast a 20-25X S&P 500 valuation over the next 12-24 months and $150 of “scrubbed” earnings, resulting in a stock market return of +5-25% (including the typical 10-20% intra-year decline). We forecast relative valuation tightening between bonds and stocks. The outlook for 2019 stock market returns is good:
| | – | Inflation remains a P/E valuation friendly 2% (similar to the past 20 years). |
| | | |
| | – | Relative valuation favors stocks selling for 19X vs. 41X for bonds. |
| | | |
| | – | 2009-2018 investor cash flowing into bond mutual funds and ETFs exceeds $2 trillion despite significant outperformance from stocks; market peaks coincide with maximum investor optimism/allocation. |
Thank you for your interest in the Provident Trust Strategy Fund.
J. Scott Harkness, CFA
President
The Fund’s 1-year and annualized 5-year and 10-year returns through March 31, 2019 were: 8.36%, 10.91% and 13.13%, respectively. The S&P 500, the Fund’s benchmark index, 1-year and annualized 5-year and 10-year returns through March 31, 2019 were: 9.50%, 10.91% and 15.92%, respectively.
The returns do not reflect the deduction of taxes that a shareholder would pay on Fund distributions or the redemption of Fund shares. Performance data quoted represents past performance; past performance does not guarantee future results. The investment return and principal value of an investment will fluctuate so that an investor’s shares, when redeemed, may be worth more or less than their original cost. Current performance since the above time period may be higher or lower than the performance quoted. Performance data current to the most recent month end may be obtained by visiting www.provfunds.com.
Although the Fund is no load, management and other expenses still apply. As per the Fund’s January 31, 2019 Prospectus, the total annual gross operating expenses as a percentage of the value of your investment, which incorporates indirect fees and expenses that the Fund incurs from investing in the shares of other mutual funds otherwise known as Acquired Fund Fee Expenses or AFFE, for the fiscal year ended September 30, 2018 was 0.97%. After fee waivers and/or expense reimbursements, the total annual net expense ratio, or what the investor pays, was 1.01%. Provident has contractually agreed to cap the ratio of expenses to average net assets (excluding AFFE) at 1.00% through January 31, 2020.
Mutual fund investing involves risk. Principal loss is possible. The Fund is non-diversified, meaning it may concentrate its assets in fewer individual holdings than a diversified fund. Therefore, the Fund is more exposed to individual stock volatility than a diversified fund. The Fund may invest in smaller and medium sized companies, which involve additional risk such as more limited liquidity and greater volatility.
S&P 500 Index: An unmanaged index, consisting of 500 selected common stocks, commonly used to measure the performance of U.S. stocks. It is not possible to invest directly into an index.
P/E: Ratio of the market price of a company’s stock to its earnings per share.
Fund holdings and sector allocations are subject to change and should not be considered a recommendation to buy or sell any security. For a complete list of Fund holdings as of March 31, 2019, please refer to the Schedule of Investments in this report.
Opinions expressed are subject to change, are not guaranteed and should not be considered investment advice or recommendations to buy or sell any security. Current and future holdings are subject to risk.
You may obtain a hard copy of the prospectus and the most recent performance data by calling (855) 739-9950 (also available at www.provfunds.com). Please read the statutory and summary prospectus carefully to consider the investment objectives, risks, charges and expenses before investing or sending money. The prospectus contains this and more information. Please read the prospectus carefully before investing.
Provident Trust Strategy Fund
Expense Example (Unaudited)
As a shareholder of the Provident Trust Strategy Fund, you incur ongoing costs, including management fees, distribution (12b-1) fees and other Fund expenses. You do not incur transaction costs such as sales charges (loads) on purchase payments, reinvested dividends, or other distributions; redemption fees; and exchange fees because the Fund does not charge these fees. This example is intended to help you understand your ongoing costs (in dollars) of investing in the Fund, and to compare these costs with the ongoing costs of investing in other mutual funds.
The example is based on an investment of $1,000 invested at the beginning of the period and held for the entire period from October 1, 2018 through March 31, 2019.
Actual Expenses
The first line of the table below provides information about actual account values and actual expenses. You may use the information in this line, together with the amount you invested, to estimate the expenses that you paid over the period. Simply divide your account value by $1,000 (for example, an $8,600 account value divided by $1,000 = 8.6), then multiply the result by the number in the first line under the heading entitled “Expenses Paid During Period” to estimate the expenses you paid on your account during this period.
In addition to the costs highlighted and described below, the only Fund transaction costs you might currently incur would be wire fees ($15 per wire), if you choose to have proceeds from a redemption wired to your bank account instead of receiving a check. Additionally, U.S. Bank charges an annual processing fee ($15) if you maintain an IRA account with the Fund. To determine your total costs of investing in the Fund, you would need to add any applicable wire or IRA processing fees you’ve incurred during the period to the costs provided in the example below.
Hypothetical Example for Comparison Purposes
The second line of the table below provides information about hypothetical account values and hypothetical expenses based on the Fund’s actual expense ratio and an assumed rate of return of 5% per year before expenses, which is not the Fund’s actual return. The hypothetical account values and expenses may not be used to estimate the actual ending account balance or expenses you paid for the period. You may use this information to compare the ongoing costs of investing in the Fund and other funds. To do so, compare this 5% hypothetical example with the 5% hypothetical examples that appear in the shareholder reports of the other funds.
Please note that the expenses shown in the table are meant to highlight your ongoing costs only. The Fund does not charge any transactional fees, such as sales charges (loads), redemption fees or exchange fees. Therefore, the second line of the table is useful in comparing ongoing costs only, and will not help you determine the relative total costs of owning different funds.
| | Beginning | Ending | Expenses Paid |
| | Account Value | Account Value | During Period* |
| | 10/01/18 | 3/31/19 | 10/01/18 – 3/31/19 |
| Provident Trust Strategy Fund | | | |
| Actual | $1,000.00 | $ 980.30 | $4.89 |
| Hypothetical (5% return before expenses) | $1,000.00 | $1,019.97 | $4.99 |
| * | Expenses are equal to the Fund’s annualized expense ratio of 0.99%, multiplied by the average account value over the period, multiplied by 182/365 (to reflect the one-half year period between October 1, 2018 and March 31, 2019). |
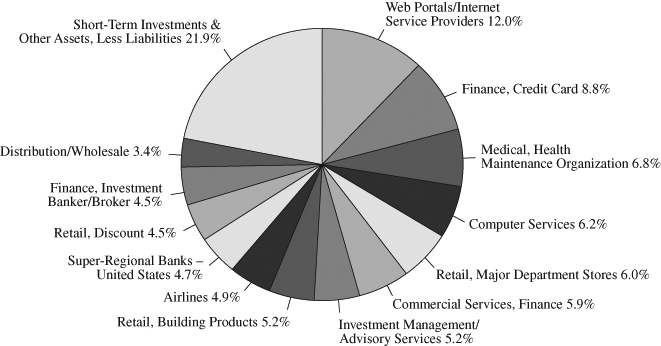
Provident Trust Strategy Fund
Industry Sectors
Percentage of Net Assets
March 31, 2019 (Unaudited)
Schedule of Investments
March 31, 2019 (Unaudited)
| Shares | | | | Cost | | | Value | |
| COMMON STOCKS – 78.1% (a) | | | | | | |
| | | | | | | | | |
| | | Airlines – 4.9% | | | | | | |
| | 166,685 | | Southwest Airlines Co. | | $ | 3,636,371 | | | $ | 8,652,618 | |
| | | | | | | | | | | | |
| | | | Commercial Services, Finance – 5.9% | | | | | | | | |
| | 99,880 | | PayPal Holdings, Inc.* | | | 4,174,057 | | | | 10,371,539 | |
| | | | | | | | | | | | |
| | | | Computer Services – 6.2% | | | | | | | | |
| | 62,760 | | Accenture PLC, Cl A | | | 1,824,144 | | | | 11,047,015 | |
| | | | | | | | | | | | |
| | | | Distribution/Wholesale – 3.4% | | | | | | | | |
| | 92,700 | | Fastenal Co. | | | 3,271,956 | | | | 5,961,537 | |
| | | | | | | | | | | | |
| | | | Finance, Credit Card – 8.8% | | | | | | | | |
| | 99,990 | | Visa Inc. | | | 1,639,095 | | | | 15,617,439 | |
| | | | | | | | | | | | |
| | | | Finance, Investment Banker/Broker – 4.5% | | | | | | | | |
| | 184,330 | | The Charles Schwab Corp. | | | 6,587,220 | | | | 7,881,951 | |
| | | | | | | | | | | | |
| | | | Investment Management/Advisory Services – 5.2% | | | | | | | | |
| | 91,560 | | T. Rowe Price Group Inc. | | | 7,362,226 | | | | 9,166,987 | |
| | | | | | | | | | | | |
| | | | Medical, Health Maintenance Organization – 6.8% | | | | | | | | |
| | 48,470 | | UnitedHealth Group Inc. | | | 2,647,058 | | | | 11,984,692 | |
The accompanying notes to financial statements are an integral part of this schedule.
Provident Trust Strategy Fund
Schedule of Investments (Continued)
March 31, 2019 (Unaudited)
| Shares or | | | | | | | | |
| Principal | | | | | | | | |
| Amount | | | | Cost | | | Value | |
| COMMON STOCKS – 78.1% (a) (Continued) | | | | | | |
| | | | | | | | | |
| | | Retail, Building Products – 5.2% | | | | | | |
| | 47,530 | | The Home Depot, Inc. | | $ | 3,971,270 | | | $ | 9,120,532 | |
| | | | | | | | | | | | |
| | | | Retail, Discount – 4.5% | | | | | | | | |
| | 33,110 | | Costco Wholesale Corp. | | | 5,136,792 | | | | 8,017,256 | |
| | | | | | | | | | | | |
| | | | Retail, Major Department Stores – 6.0% | | | | | | | | |
| | 199,920 | | The TJX Companies, Inc. | | | 1,939,075 | | | | 10,637,743 | |
| | | | | | | | | | | | |
| | | | Super-Regional Banks – United States – 4.7% | | | | | | | | |
| | 68,120 | | PNC Financial Services Group, Inc. | | | 3,619,855 | | | | 8,355,599 | |
| | | | | | | | | | | | |
| | | | Web Portals/Internet Service Providers – 12.0% | | | | | | | | |
| | 9,000 | | Alphabet, Inc., Cl A* | | | 2,346,650 | | | | 10,592,010 | |
| | 9,000 | | Alphabet, Inc., Cl C* | | | 2,332,746 | | | | 10,559,790 | |
| | | | | | | 4,679,396 | | | | 21,151,800 | |
| | | | Total common stocks | | | 50,488,515 | | | | 137,966,708 | |
| | | | | | | | | | | | |
| SHORT-TERM INVESTMENTS – 22.0% (a) | | | | | | | | |
| | | | | | | | | | | | |
| | | | Money Market Fund – 18.6% | | | | | | | | |
| | 32,815,046 | | Invesco Treasury Portfolio Institutional Class, 2.33%^ | | | 32,815,046 | | | | 32,815,046 | |
| | | | | | | | | | | | |
| | | | U.S. Treasury Securities – 3.4% | | | | | | | | |
| $ | 6,000,000 | | U.S. Treasury Bills, 1.771%, due 04/04/19† | | | 5,998,829 | | | | 5,998,819 | |
| | | | Total short-term investments | | | 38,813,875 | | | | 38,813,865 | |
| | | | Total investments – 100.1% | | $ | 89,302,390 | | | | 176,780,573 | |
| | | | Other assets, less liabilities – (0.1%) (a) | | | | | | | (112,334 | ) |
| | | | TOTAL NET ASSETS – 100.0% | | | | | | $ | 176,668,239 | |
| (a) | Percentages for the various classifications relate to total net assets. |
| * | Non-income producing security. |
| ^ | The rate quoted is the annualized 7 day yield as of March 31, 2019. |
| † | The rate shown is as of March 31, 2019. |
PLC – Public Limited Company
The accompanying notes to financial statements are an integral part of this schedule.
Provident Trust Strategy Fund
Statement of Assets and Liabilities
March 31, 2019 (Unaudited)
| ASSETS: | | | |
| Investments in securities, at value (cost $89,302,390) | | $ | 176,780,573 | |
| Receivables from shareholders for purchases | | | 45,991 | |
| Dividends and interest receivable | | | 59,069 | |
| Prepaid expenses | | | 16,522 | |
| Total assets | | | 176,902,155 | |
| | | | | |
| LIABILITIES: | | | | |
| Payable to adviser for management fees | | | 100,428 | |
| Payable to shareholders for redemptions | | | 76,367 | |
| Payable to transfer agent | | | 21,097 | |
| Payable for administration and accounting services | | | 20,689 | |
| Payable to directors | | | 5,199 | |
| Other liabilities | | | 10,136 | |
| Total liabilities | | | 233,916 | |
| | | | | |
| Net assets | | $ | 176,668,239 | |
| | | | | |
| NET ASSETS: | | | | |
| Capital Stock, $0.01 par value; 300,000,000 | | | | |
| shares authorized; 11,565,085 shares outstanding | | $ | 80,991,110 | |
| Total distributable earnings | | | 95,677,129 | |
| Net assets | | $ | 176,668,239 | |
| | | | | |
| CALCULATION OF NET ASSET VALUE PER SHARE: | | | | |
| Net asset value, offering and redemption price per share | | | | |
| (176,668,239 ÷ 11,565,085 shares outstanding) | | $ | 15.28 | |
The accompanying notes to financial statements are an integral part of this statement.
Provident Trust Strategy Fund
Statement of Operations
For the Six Month Period Ending March 31, 2019 (Unaudited)
| INCOME: | | | |
| Dividends | | $ | 1,178,682 | |
| Interest | | | 127,034 | |
| Total investment income | | | 1,305,716 | |
| | | | | |
| EXPENSES: | | | | |
| Management fees | | | 551,990 | |
| Transfer agent fees | | | 94,989 | |
| Administration and accounting services | | | 71,938 | |
| Professional fees | | | 26,382 | |
| Registration fees | | | 14,723 | |
| Directors fees | | | 10,075 | |
| Custodian fees | | | 8,395 | |
| Printing and postage expense | | | 6,607 | |
| Other expenses | | | 29,342 | |
| Total expenses before recoupment | | | 814,441 | |
| Management fees recouped | | | 34,261 | |
| Net expenses | | | 848,702 | |
| NET INVESTMENT INCOME | | | 457,014 | |
| NET REALIZED GAIN (LOSS) ON INVESTMENTS | | | 9,566,850 | |
| NET CHANGE IN UNREALIZED APPRECIATION/DEPRECIATION ON INVESTMENTS | | | (13,656,679 | ) |
| NET GAIN (LOSS) ON INVESTMENTS | | | (4,089,829 | ) |
| NET DECREASE IN NET ASSETS RESULTING FROM OPERATIONS | | $ | (3,632,815 | ) |
The accompanying notes to financial statements are an integral part of this statement.
Provident Trust Strategy Fund
Statements of Changes in Net Assets
For the Six Month Period Ending March 31, 2019 (Unaudited) and For the Year Ended September 30, 2018
| | | 2019 | | | 2018 | |
| OPERATIONS: | | | | | | |
| Net investment income | | $ | 457,014 | | | $ | 354,812 | |
| Net realized gain on investments | | | 9,566,850 | | | | 7,225,013 | |
| Net change in unrealized appreciation/depreciation on investments | | | (13,656,679 | ) | | | 23,104,268 | |
| Net increase (decrease) in net assets from operations | | | (3,632,815 | ) | | | 30,684,093 | |
| | | | | | | | | |
| DISTRIBUTIONS TO SHAREHOLDERS: | | | | | | | | |
| Total distributions (Note 6) | | | (8,968,182 | ) | | | (2,283,802 | ) |
| | | | | | | | | |
| FUND SHARE ACTIVITIES: | | | | | | | | |
| Proceeds from shares issued | | | | | | | | |
| (1,018,807 and 1,918,737 shares, respectively) | | | 15,363,033 | | | | 29,781,923 | |
| Proceeds from shares issued in distributions reinvested | | | | | | | | |
| (631,067 and 153,473 shares, respectively) | | | 8,898,046 | | | | 2,260,659 | |
| Cost of shares redeemed | | | | | | | | |
| (1,015,652 and 1,184,872 shares, respectively) | | | (15,046,632 | ) | | | (18,125,459 | ) |
| Net increase in net assets derived from Fund share activities | | | 9,214,447 | | | | 13,917,123 | |
| TOTAL INCREASE (DECREASE) | | | (3,386,550 | ) | | | 42,317,414 | |
| | | | | | | | | |
| NET ASSETS AT THE BEGINNING OF THE PERIOD | | | 180,054,789 | | | | 137,737,375 | |
| NET ASSETS AT THE END OF THE PERIOD | | $ | 176,668,239 | | | $ | 180,054,789 | |
The accompanying notes to financial statements are an integral part of these statements.
Provident Trust Strategy Fund
Financial Highlights
(Selected data for each share of the Fund outstanding throughout each period)
| | | (Unaudited) | | | | | | | | | | | | | | | | |
| | | For the Six | | | | | | | | | | | | | | | | |
| | | Month Period | | | | | | | | | | | | | | | | |
| | | Ending | | | | | | | | | | | | | | | | |
| | | March 31, | | | Years Ended September 30, | |
| | | 2019 | | | 2018 | | | 2017 | | | 2016 | | | 2015 | | | 2014 | |
| PER SHARE OPERATING PERFORMANCE: | | | | | | | | | | | | | | | | |
| Net asset value, beginning of period | | $ | 16.47 | | | $ | 13.71 | | | $ | 11.08 | | | $ | 11.25 | | | $ | 11.55 | | | $ | 10.35 | |
| Income from investment operations: | | | | | | | | | | | | | | | | | | | | | | | | |
Net investment income (loss)(1) | | | 0.04 | | | | 0.03 | | | | 0.02 | | | | 0.01 | | | | 0.02 | | | | (0.00 | )* |
| Net realized and unrealized gain (loss) | | | | | | | | | | | | | | | | | | | | | | | | |
| on investments | | | (0.43 | ) | | | 2.96 | | | | 2.84 | | | | 0.69 | | | | 0.59 | | | | 1.35 | |
| Total from investment operations | | | (0.39 | ) | | | 2.99 | | | | 2.86 | | | | 0.70 | | | | 0.61 | | | | 1.35 | |
| Less distributions: | | | | | | | | | | | | | | | | | | | | | | | | |
| Distributions from net investment income | | | (0.05 | ) | | | (0.02 | ) | | | (0.01 | ) | | | (0.01 | ) | | | (0.01 | ) | | | — | |
| Distributions from net realized gains | | | (0.75 | ) | | | (0.21 | ) | | | (0.22 | ) | | | (0.86 | ) | | | (0.90 | ) | | | (0.15 | ) |
| Total from distributions | | | (0.80 | ) | | | (0.23 | ) | | | (0.23 | ) | | | (0.87 | ) | | | (0.91 | ) | | | (0.15 | ) |
| Net asset value, end of period | | $ | 15.28 | | | $ | 16.47 | | | $ | 13.71 | | | $ | 11.08 | | | $ | 11.25 | | | $ | 11.55 | |
| | | | | | | | | | | | | | | | | | | | | | | | | |
| TOTAL RETURN | | | (1.97 | %)(2) | | | 21.98 | % | | | 26.19 | % | | | 6.25 | % | | | 5.41 | % | | | 13.15 | % |
| | | | | | | | | | | | | | | | | | | | | | | | | |
| RATIOS/SUPPLEMENTAL DATA: | | | | | | | | | | | | | | | | | | | | | | | | |
| Net assets, end of period (in 000’s $) | | | 176,668 | | | | 180,055 | | | | 137,737 | | | | 113,804 | | | | 103,496 | | | | 127,070 | |
| Ratio of expenses to average net assets: | | | | | | | | | | | | | | | | | | | | | | | | |
Before expense reimbursement/recoupment(3) | 0.95 | %(4) | | | 0.96 | % | | | 1.02 | % | | | 1.05 | % | | | 1.01 | % | | | 0.92 | % |
After expense reimbursement/recoupment(3) | 0.99 | %(4) | | | 1.00 | % | | | 1.00 | % | | | 1.00 | % | | | 1.00 | % | | | 0.92 | % |
| Ratio of net investment income (loss) | | | | | | | | | | | | | | | | | | | | | | | | |
| to average net assets: | | | | | | | | | | | | | | | | | | | | | | | | |
Before expense reimbursement/recoupment(3) | 0.58 | %(4) | | | 0.26 | % | | | 0.11 | % | | | 0.05 | % | | | 0.12 | % | | | (0.02 | %) |
After expense reimbursement/recoupment(3) | 0.54 | %(4) | | | 0.22 | % | | | 0.13 | % | | | 0.10 | % | | | 0.13 | % | | | (0.02 | %) |
| Portfolio turnover rate | | | 5 | %(2) | | | 2 | % | | | 7 | % | | | 4 | % | | | 10 | % | | | 14 | % |
| * | | Amount is less than $0.005. |
| (1) | | Net investment income (loss) per share was calculated using average shares outstanding. |
| (2) | | Not Annualized. |
| (3) | | Expenses waived or reimbursed reflect reductions to total expenses, whereas expenses recouped reflect increases to total expenses, as discussed in notes to the financial statements. These reimbursed amounts decrease the net investment loss ratio or increase the net investment income ratio, and recouped amounts increase the net investment loss ratio or decrease the net investment income ratio, as applicable. |
| (4) | | Annualized. |
The accompanying notes to financial statements are an integral part of this statement.
Provident Trust Strategy Fund
Notes to Financial Statements
March 31, 2019 (Unaudited)
| (1) | Summary of Significant Accounting Policies |
| | |
| | The following is a summary of significant accounting policies of Provident Mutual Funds, Inc. (the “Company”), which is registered as an open-end management investment company under the Investment Company Act of 1940, as amended (the “1940 Act”), and accordingly follows the investment company accounting and reporting guidance. The Company consists of one non-diversified fund – Provident Trust Strategy Fund (the “Fund”). The Company was incorporated under the laws of Wisconsin on May 23, 1986. |
| | |
| | The investment objective of the Fund is long-term growth of capital. |
| | (a) | Each equity security is valued at the last sale price reported by the principal security exchange on which the issue is traded. Securities that are traded on the Nasdaq Markets are valued at the Nasdaq Official Closing Price, or if no sale is reported, the latest bid price. Securities which are traded over-the-counter, bonds and short-term U.S. Treasury Bills are valued using an evaluated bid from a pricing service. Money market funds are valued at net asset value. Securities for which quotations are not readily available are valued at fair value as determined by the Fund’s investment adviser under the supervision of the Board of Directors. The fair value of a security may differ from the Fund’s last quoted price and the Fund may not be able to sell a security at the estimated fair value. Market quotations may not be available, for example, if trading in particular securities has halted during the day and not resumed prior to the close of trading on the New York Stock Exchange. As of March 31, 2019, there were no securities that were internally fair valued. |
| | | |
| | | In determining fair value, the Fund uses various valuation approaches. Generally accepted accounting principles in the United States of America (“GAAP”) establishes a fair value hierarchy for inputs used in measuring fair value that maximizes the use of observable inputs and minimizes the use of unobservable inputs by generally requiring that the most observable inputs be used when available. Observable inputs are those that market participants would use in pricing the asset or liability based on market data obtained from sources independent of the Fund. Unobservable inputs reflect the Fund’s assumptions about the inputs market participants would use in pricing the asset or liability developed based on the best information available in the circumstances. The inputs or methodologies used for valuing securities are not necessarily an indication of the risks associated with investing in those securities. |
| | | |
| | | The fair value hierarchy is categorized into three levels based on the inputs as follows: |
| | | Level 1 — | Valuations based on unadjusted quoted prices in active markets for identical assets. |
| | | | |
| | | Level 2 — | Valuations based on quoted prices for similar securities or in markets that are not active or for which all significant inputs are observable, either directly or indirectly. |
| | | | |
| | | Level 3 — | Valuations based on inputs that are unobservable and significant to the overall fair value measurement. |
| | | The following table summarizes the Fund’s investments as of March 31, 2019, based on the inputs used to value them: |
| | | | | | Investments | |
| | | Valuation Inputs | | in Securities | |
| | | Level 1 — | Common Stocks | | $ | 137,966,708 | |
| | | | Money Market Fund | | | 32,815,046 | |
| | | | Total Level 1 | | | 170,781,754 | |
| | | Level 2 — | U.S. Treasury Securities | | | 5,998,819 | |
| | | Level 3 — | | | | — | |
| | | Total | | | $ | 176,780,573 | |
| | | See the Schedule of Investments for investments detailed by industry classification. |
Provident Trust Strategy Fund
Notes to Financial Statements (Continued)
March 31, 2019 (Unaudited)
| | (b) | The Fund may purchase securities on a when-issued or delayed delivery basis. Although the payment and interest terms of these securities are established at the time the purchaser enters into the agreement, these securities may be delivered and paid for at a future date, generally within 45 days. The Fund records purchases of when-issued securities and reflects the value of such securities in determining net asset value in the same manner as other portfolio securities. For the six month period ending March 31, 2019, there were no such securities. |
| | | |
| | (c) | Net realized gains and losses on sales of securities are computed on the identified cost basis. For financial reporting purposes, investment transactions are recorded on the trade date. |
| | | |
| | (d) | Dividend income is recorded on the ex-dividend date. Interest income is recorded on the accrual basis. The Fund records the amortization and accretion of discounts and premiums on securities purchased using the effective interest method in accordance with GAAP. |
| | | |
| | (e) | The preparation of financial statements in conformity with GAAP requires management to make estimates and assumptions that affect the reported amounts of assets and liabilities and disclosure of contingent assets and liabilities at the date of the financial statements and the reported amounts of revenues and expenses during the reporting period. Actual results could differ from these estimates. |
| | | |
| | (f) | No provision has been made for federal income taxes since the Fund has elected to be taxed as a “regulated investment company” and intends to distribute substantially all net investment company taxable income and net capital gains to shareholders and otherwise comply with the requirements of Subchapter M of the Internal Revenue Code of 1986, as amended, applicable to regulated investment companies. |
| | | |
| | (g) | The Fund has reviewed all open tax years and major jurisdictions, which include Federal and the state of Wisconsin, and concluded that there are no significant uncertain tax positions that would require recognition in the financial statements. The Fund recognizes interest and penalties, if any, related to unrecognized tax benefits on uncertain tax positions as income tax expense in the Statement of Operations. During the six month period ending March 31, 2019, the Fund did not incur any interest or penalties. Open tax years are those that are open for exam by taxing authorities and, as of March 31, 2019, open federal tax years include tax years ended September 30, 2015 through 2018. The Fund has no examinations in progress and is also not aware of any tax positions for which it is reasonably possible that the total amounts of unrecognized tax benefits will significantly change in the next twelve months. |
| | | |
| | (h) | GAAP requires that certain components of net assets relating to permanent differences be reclassified for financial and tax reporting. These differences are caused primarily by differences in the timing of the recognition of certain components of income, expense or realized capital gain for federal income tax purposes. The Fund may utilize earnings and profits distributed to shareholders on redemption of shares as part of the dividends paid deduction. These reclassifications have no effect on net assets, results of operations or net asset value per share. |
| | | |
| | (i) | In preparing these financial statements, management has evaluated events and transactions for potential recognition or disclosure through the date the financial statements were issued. Management has determined that there were no subsequent events that would need to be disclosed in the Fund’s financial statement disclosures. |
| (2) | Investment Adviser and Management Agreement and Transactions with Related Parties |
| | |
| | The Company, on behalf of the Fund, entered into an investment advisory agreement (the “Advisory Agreement”) with Provident Trust Company (“PTC”), with whom certain officers and a director of the Fund are affiliated, to serve as the investment adviser. Under the terms of the Advisory Agreement, the Fund pays 0.75% on the first $30,000,000 of average daily net assets, 0.65% on average daily net assets in excess of $30,000,000 and less than $100,000,000 and 0.60% on average daily net assets over $100,000,000. The Fund is responsible for paying a share of the compensation, benefits and expenses of its Chief Compliance Officer. For administrative convenience, PTC initially makes these payments and is later reimbursed by the Fund. |
Provident Trust Strategy Fund
Notes to Financial Statements (Continued)
March 31, 2019 (Unaudited)
| | Pursuant to an expense cap/reimbursement agreement between PTC and the Company, PTC has agreed to waive a portion of its management fee and/or assume expenses for the Fund to the extent necessary to ensure that the Fund’s total operating expenses, excluding taxes, interest, brokerage commissions and other costs relating to portfolio securities transactions (including the costs, fees and expenses associated with the Fund’s investments in other investment companies) and other extraordinary expenses, do not exceed 1.00% of the Fund’s average daily net assets on an annual basis. The expense cap/reimbursement agreement will continue in effect until January 31, 2020, with successive renewal terms of one year unless terminated by PTC or the Company prior to any such renewal. PTC is entitled to recoup such amounts from the Fund for a period of up to three years from the date PTC reduced its compensation and/or assumed expenses for the Fund. During the six month period ending March 31, 2019, PTC recouped $12,335 of recoverable amounts due to expire on September 30, 2019, and $21,926 of recoverable amounts due to expire on September 30, 2020. As of March 31, 2019, PTC has recouped all eligible amounts. |
| | |
| | The Fund adopted a Distribution Plan (the “Plan”) pursuant to Rule 12b-1 under the 1940 Act. The Plan provides that the Fund may charge a distribution and service fee of up to 0.25% (on an annualized basis) of the Fund’s average daily net assets. Amounts payable under the Plan are paid monthly for any activities or expenses primarily intended to result in the sale of shares of the Fund. For the six month period ending March 31, 2019, no such expenses were charged to shareholders. |
| | |
| | Under the Company’s organizational documents, each director, officer, employee or other agent of the Company is indemnified, to the extent permitted by the 1940 Act, against certain liabilities that may arise out of performance of their duties to the Company. Additionally, in the normal course of business, the Company, on behalf of the Fund, enters into contracts that contain a variety of indemnification clauses. The Fund’s maximum exposure under these arrangements is unknown as this would involve future claims that may be made against the Fund that have not yet occurred. However, the Fund has not had prior claims or losses pursuant to these contracts and believes the risk of loss to be remote. |
| | |
| | As of March 31, 2019, PTC beneficially owned 15.60% of the outstanding shares of the Fund on behalf of its investment advisory clients. In addition, as of March 31, 2019, PTC’s employees, as participants in the Provident Trust Company Retirement Plan (the “Retirement Plan”), beneficially owned 14.00% of the outstanding shares of the Fund. As a result, as of March 31 2019, in its capacity as sponsor of the Retirement Plan and investment manager of advisory accounts, PTC beneficially owned, in the aggregate, 29.60% of the outstanding shares of the Fund. |
| | |
| (3) | Loan Agreement |
| | |
| | U.S. Bank, N.A. has made available to the Fund an unsecured line of credit for $16,000,000, pursuant to an amended Loan Agreement (“Agreement”) effective January 27, 2019, for the purpose of having cash available to satisfy redemption requests. For the period October 1, 2018 through January 26, 2019, the line of credit available was $14,000,000. Principal and interest on a loan under the Agreement is due not more than 20 days after the date of the loan. Amounts under the credit facility bear interest at a rate per annum equal to the current prime rate minus one percent on the amount borrowed (4.50% on March 31, 2019). The Agreement expires on January 26, 2020, however, it is renewable annually. For the six month period ending March 31, 2019, the Fund did not utilize the line of credit. |
| | |
| (4) | Distributions to Shareholders |
| | |
| | Net investment income and net realized gains, if any, are distributed to shareholders at least annually. Distributions to shareholders are recorded on the ex-dividend date. On December 14, 2018, the Board of Directors declared a distribution of $0.04523767 per share from net investment income and $0.75386 from long-term capital gains, payable to shareholders of record on December 13, 2018. |
| | |
| (5) | Investment Transactions |
| | |
| | For the six month period ending March 31, 2019, purchases and proceeds of sales of investment securities (excluding all short-term securities) were $6,547,746 and $11,941,141, respectively. |
Provident Trust Strategy Fund
Notes to Financial Statements (Continued)
March 31, 2019 (Unaudited)
| (6) | Income Tax Information |
| | |
| | The following information for the Fund is presented on an income tax basis as of September 30, 2018: |
| | | | | Net | | Distributable |
| | | Gross | Gross | Unrealized | Distributable | Long-Term |
| | Cost of | Unrealized | Unrealized | Appreciation | Ordinary | Capital |
| | Investments | Appreciation | Depreciation | on Investments | Income | Gains |
| | $78,947,419 | $101,205,987 | $(100,414) | $101,105,573 | $268,586 | $6,903,967 |
| | The difference between the cost amounts for financial statement and federal income tax purposes is due primarily to timing differences in recognizing certain gains and losses in security transactions. |
| | |
| | The tax components of dividends paid during the six month period ending March 31, 2019 and the year ended September 30, 2018 are: |
| | March 31, 2019 | September 30, 2018 | |
| | Ordinary | Long-Term | Ordinary | Long-Term | |
| | Income | Capital Gains | Income | Capital Gains | |
| | Distributions | Distributions | Distributions | Distributions | |
| | $507,697 | $8,460,485 | $184,729 | $2,099,073 | |
Provident Trust Strategy Fund
Additional Information (Unaudited)
For additional information about the Directors and Officers or for a description of the policies and procedures that the Fund uses to determine how to vote proxies relating to portfolio securities, please call 1-855-739-9950 and request a Statement of Additional Information. One will be mailed to you free of charge. The Statement of Additional Information is also available on the Fund’s website at http://www.provfunds.com or the website of the Securities and Exchange Commission (the “Commission”) at http://www.sec.gov. Information on how the Fund voted proxies relating to portfolio securities is available without charge by calling 1-855-739-9950, or on the Fund’s website at http://www.provfunds.com, or the website of the Commission no later than August 31 for the prior 12 months ending June 30. The Fund files its complete schedule of portfolio holdings with the Commission for the first and third quarters of each fiscal year on Form N-Q. The Fund’s Form N-Q is available on the Commission’s website. The Fund’s Form N-Q may be reviewed and copied at the Commission’s Public Reference Room in Washington, D.C., and information on the operation of the Public Reference Room may be obtained by calling 1-800-SEC-0330.
(This Page Intentionally Left Blank.)
Provident Trust Strategy Fund
N16 W23217 Stone Ridge Drive, Suite 310
Waukesha, Wisconsin 53188
BOARD OF DIRECTORS
JOHN F. HENSLER
ROBERT H. MANEGOLD
THOMAS N. TUTTLE, JR.
WILLARD T. WALKER, JR.
INVESTMENT ADVISER
PROVIDENT TRUST COMPANY
N16 W23217 Stone Ridge Drive, Suite 310
Waukesha, Wisconsin 53188
ADMINISTRATOR, ACCOUNTANT, TRANSFER AGENT
AND DIVIDEND DISBURSING AGENT
U.S. BANCORP FUND SERVICES, LLC
615 East Michigan Street
Milwaukee, Wisconsin 53202
800-811-5311 or 414-765-4124
CUSTODIAN
U.S. BANK, N.A.
1555 North RiverCenter Drive, Suite 302
Milwaukee, Wisconsin 53212
DISTRIBUTOR
QUASAR DISTRIBUTORS, LLC
777 East Wisconsin Avenue
Milwaukee, Wisconsin 53202
INDEPENDENT REGISTERED PUBLIC ACCOUNTING FIRM
COHEN & COMPANY, LTD.
342 North Water Street, Suite 830
Milwaukee, Wisconsin 53202
LEGAL COUNSEL
GODFREY & KAHN, S.C.
833 East Michigan Street, Suite 1800
Milwaukee, Wisconsin 53202
Item 2. Code of Ethics.
Not applicable for semi-annual reports.
Item 3. Audit Committee Financial Expert.
Not applicable for semi-annual reports.
Item 4. Principal Accountant Fees and Services.
Not applicable for semi-annual reports.
Item 5. Audit Committee of Listed Registrants.
Not applicable to registrants who are not listed issuers (as defined in Rule 10A-3 under the Securities Exchange Act of 1934).
Item 6. Schedule of Investments.
| (a) | The Schedule of Investments in securities of unaffiliated issuers is included as part of the report to shareholders filed under Item 1 of this Form. |
Item 7. Disclosure of Proxy Voting Policies and Procedures for Closed-End Management Investment Companies.
Not applicable to open-end investment companies.
Item 8. Portfolio Managers of Closed-End Management Investment Companies.
Not applicable to open-end investment companies.
Item 9. Purchases of Equity Securities by Closed-End Management Investment Company and Affiliated Purchasers.
Not applicable to open-end investment companies.
Item 10. Submission of Matters to a Vote of Security Holders.
None
Item 11. Controls and Procedures.
(a) The registrant’s disclosure controls and procedures are periodically evaluated. The registrant’s officers have concluded that the registrant’s disclosure controls and procedures are adequate (as defined in Rule 30a-3(c) under the Act (17 CFR 270.30a-3(c))) as of a date within 90 days of the filing date of the report that includes the disclosure required by this paragraph, based on the evaluation of these controls and procedures required by Rule 30a-3(b) under the Act (17 CFR 270.30a-3(b)) and Rules 13a-15(b) or 15d-15(b) under the Exchange Act (17 CFR 240.13a-15(b) or 240.15d-15(b)).
(b) The Registrant’s internal controls are periodically evaluated. There were no changes in the Registrant's internal control over financial reporting (as defined in Rule 30a-3(d) under the Act) that occurred during the second fiscal quarter of the period covered by this report that have materially affected, or are reasonably likely to materially affect, such controls.
Item 12. Disclosure of Securities Lending Activities for Closed-End Management Investment Companies
Not applicable to open-end investment companies.
Item 13. Exhibits.
| (a) | (1) Any code of ethics or amendment thereto, that is the subject of the disclosure required by Item 2, to the extent that the registrant intends to satisfy Item 2 requirements through filing an exhibit. Not Applicable |
(2) Certifications pursuant to Section 302 of the Sarbanes-Oxley Act of 2002. Filed herewith.
(3) Any written solicitation to purchase securities under Rule 23c‑1 under the Act sent or given during the period covered by the report by or on behalf of the registrant to 10 or more persons. Not applicable to open-end investment companies.
(4) Change in the registrant’s independent public accountant. There was no change in registrant’s independent public accountant for the period covered by this report.
| (b) | Certifications pursuant to Section 906 of the Sarbanes‑Oxley Act of 2002. Furnished herewith. |
SIGNATURES
Pursuant to the requirements of the Securities Exchange Act of 1934 and the Investment Company Act of 1940, the registrant has duly caused this report to be signed on its behalf by the undersigned, thereunto duly authorized.
Provident Mutual Funds, Inc.
Registrant
By /s/J. Scott Harkness
J. Scott Harkness, President/Principal Executive Officer
Date April 30, 2019
Pursuant to the requirements of the Securities Exchange Act of 1934 and the Investment Company Act of 1940, this report has been signed below by the following persons on behalf of the registrant and in the capacities and on the dates indicated.
Provident Mutual Funds, Inc.
Registrant
By /s/J. Scott Harkness
J. Scott Harkness, President/Principal Executive Officer
Date April 30, 2019
By /s/Michael A. Schelble
Michael A. Schelble, Treasurer/Principal Financial Officer
Date April 30, 2019