UNITED STATES
SECURITIES AND EXCHANGE COMMISSION
Washington, D.C. 20549
FORM N-CSR
CERTIFIED SHAREHOLDER REPORT OF REGISTERED MANAGEMENT
INVESTMENT COMPANIES
Investment Company Act file number 811-04719
The TETON Westwood Funds
(Exact name of registrant as specified in charter)
One Corporate Center
Rye, New York 10580-1422
(Address of principal executive offices) (Zip code)
Bruce N. Alpert
Gabelli Funds, LLC
One Corporate Center
Rye, New York 10580-1422
(Name and address of agent for service)
Registrant’s telephone number, including area code: 1-800-422-3554
Date of fiscal year end: September 30
Date of reporting period: September 30, 2014
Form N-CSR is to be used by management investment companies to file reports with the Commission not later than 10 days after the transmission to stockholders of any report that is required to be transmitted to stockholders under Rule 30e-1 under the Investment Company Act of 1940 (17 CFR 270.30e-1). The Commission may use the information provided on Form N-CSR in its regulatory, disclosure review, inspection, and policymaking roles.
A registrant is required to disclose the information specified by Form N-CSR, and the Commission will make this information public. A registrant is not required to respond to the collection of information contained in Form N-CSR unless the Form displays a currently valid Office of Management and Budget (“OMB”) control number. Please direct comments concerning the accuracy of the information collection burden estimate and any suggestions for reducing the burden to Secretary, Securities and Exchange Commission, 100 F Street, NE, Washington, DC 20549. The OMB has reviewed this collection of information under the clearance requirements of 44 U.S.C. § 3507.
Item 1. Reports to Stockholders.
The Report to Shareholders is attached herewith.

TETON WESTWOOD FUNDS
|
| |
|
Mighty MitesSM Fund |
| |
|
SmallCap Equity Fund |
| |
|
Mid-Cap Equity Fund |
| |
|
Income Fund |
| |
|
Equity Fund |
| |
|
Balanced Fund |
| |
|
Intermediate Bond Fund |
|
| Annual Report |
|
| September 30, 2014 |
TETON WESTWOOD FUNDS
(Unaudited)
| | | | | | | | | | | | | | | | | | | | | | | | | | | | | | | | | | | | | | | | | | | | | | | | | | | | | | | | | | | | | | | | | | | | | | | | | | | |
| | | Class AAA Shares | | | | Class A Shares |
| | | Average Annual Returns – September 30, 2014 (a) | | | | Average Annual Returns – September 30, 2014 (a)(b)(d) |
| | | 1 Year | | 5 Year | | 10 Year | | Since
Inception | | Gross
Expense
Ratio | | Expense
Ratio after
Adviser
Reimburse-
ments | | Maximum
Sales
Charge | | | | 1 Year | | 5 Year | | 10 Year | | Since
Inception | | Gross
Expense
Ratio | | Expense
Ratio after
Adviser
Reimburse-
ments | | Maximum
Sales
Charge |
Mighty Mites | | | | 2.23 | % | | | | 14.28 | % | | | | 11.03 | % | | | | 11.82 | % | | | | 1.44 | % | | | | 1.44 | % | | | | None | | | | | | | (2.12 | )% | | | | 13.07 | % | | | | 10.32 | % | | | | 11.34 | % | | | | 1.69 | % | | | | 1.69 | % | | | | 4.00 | % |
SmallCap Equity | | | | 3.48 | | | | | 12.69 | | | | | 8.91 | | | | | 7.17 | | | | | 1.63 | | | | | 1.50 | | | | | None | | | | | | | (0.83 | ) | | | | 11.51 | | | | | 8.22 | | | | | 6.78 | | | | | 1.88 | | | | | 1.75 | | | | | 4.00 | |
Mid-Cap Equity Fund | | | | 10.15 | | | | | — | | | | | — | | | | | 11.36 | | | | | 3.88 | | | | | 1.50 | | | | | None | | | | | | | 5.57 | | | | | — | | | | | — | | | | | 7.77 | | | | | 4.13 | | | | | 1.75 | | | | | 4.00 | |
Income | | | | 15.46 | | | | | 12.55 | | | | | 6.79 | | | | | 7.94 | | | | | 2.57 | | | | | 2.00 | | | | | None | | | | | | | 10.54 | | | | | 11.35 | | | | | 6.09 | | | | | 7.47 | | | | | 2.82 | | | | | 2.25 | | | | | 4.00 | |
Equity | | | | 15.28 | | | | | 12.91 | | | | | 7.85 | | | | | 10.17 | | | | | 1.60 | | | | | 1.60 | | | | | None | | | | | | | 10.43 | | | | | 11.72 | | | | | 7.14 | | | | | 9.78 | | | | | 1.85 | | | | | 1.85 | | | | | 4.00 | |
Balanced | | | | 9.85 | | | | | 9.03 | | | | | 6.49 | | | | | 8.65 | | | | | 1.28 | | | | | 1.28 | | | | | None | | | | | | | 5.17 | | | | | 7.88 | | | | | 5.79 | | | | | 8.20 | | | | | 1.53 | | | | | 1.53 | | | | | 4.00 | |
Intermediate Bond | | | | 0.54 | | | | | 2.23 | | | | | 3.17 | | | | | 4.94 | | | | | 1.36 | | | | | 1.00 | | | | | None | | | | | | | (3.53 | ) | | | | 1.30 | | | | | 2.63 | | | | | 4.69 | | | | | 1.46 | | | | | 1.10 | | | | | 4.00 | |
| | | | | | | | | | | | | | | | | | | | | | | | | | | | | | | | | | | | | | | | | | | | | | | | | | | | | | | | | | | | | | | | | | | | | | | | | | | |
| | | Class C Shares | | | | Class I Shares |
| | | Average Annual Returns – September 30, 2014 (a)(c)(d) | | | | Average Annual Returns – September 30, 2014 (a)(d) |
| | | 1 Year | | 5 Year | | 10 Year | | Since
Inception | | Gross
Expense
Ratio | | Expense
Ratio after
Adviser
Reimburse-
ments | | Maximum
Sales
Charge | | | | 1 Year | | 5 Year | | 10 Year | | Since
Inception | | Gross
Expense
Ratio | | Expense
Ratio after
Adviser
Reimburse-
ments | | Maximum
Sales
Charge |
Mighty Mites | | | | 0.41 | % | | | | 13.43 | % | | | | 10.21 | % | | | | 11.16 | % | | | | 2.19 | % | | | | 2.19 | % | | | | 1.00 | % | | | | | | 2.43 | % | | | | 14.56 | % | | | | 11.21 | % | | | | 11.94 | % | | | | 1.19 | % | | | | 1.19 | % | | None |
SmallCap Equity | | | | 1.77 | | | | | 11.86 | | | | | 7.90 | | | | | 6.54 | | | | | 2.38 | | | | | 2.25 | | | | | 1.00 | | | | | | | 3.78 | | | | | 12.98 | | | | | 9.10 | | | | | 7.28 | | | | | 1.38 | | | | | 1.25 | | | None |
Mid-Cap Equity | | | | 8.41 | | | | | — | | | | | — | | | | | 10.57 | | | | | 4.63 | | | | | 2.25 | | | | | 1.00 | | | | | | | 10.50 | | | | | — | | | | | — | | | | | 11.64 | | | | | 3.63 | | | | | 1.25 | | | None |
Income | | | | 13.57 | | | | | 11.70 | | | | | 5.99 | | | | | 7.41 | | | | | 3.32 | | | | | 2.75 | | | | | 1.00 | | | | | | | 15.77 | | | | | 12.81 | | | | | 6.97 | | | | | 8.04 | | | | | 2.32 | | | | | 1.75 | | | None |
Equity | | | | 13.51 | | | | | 12.08 | | | | | 7.05 | | | | | 9.70 | | | | | 2.35 | | | | | 2.35 | | | | | 1.00 | | | | | | | 15.38 | | | | | 13.16 | | | | | 8.02 | | | | | 10.23 | | | | | 1.35 | | | | | 1.35 | | | None |
Balanced | | | | 8.04 | | | | | 8.23 | | | | | 5.70 | | | | | 8.11 | | | | | 2.03 | | | | | 2.03 | | | | | 1.00 | | | | | | | 10.04 | | | | | 9.32 | | | | | 6.67 | | | | | 8.73 | | | | | 1.03 | | | | | 1.03 | | | None |
Intermediate Bond | | | | (1.16 | ) | | | | 1.45 | | | | | 2.40 | | | | | 4.50 | | | | | 2.11 | | | | | 1.75 | | | | | 1.00 | | | | | | | 0.88 | | | | | 2.49 | | | | | 3.34 | | | | | 5.01 | | | | | 1.11 | | | | | 0.75 | | | None |
| (a) | Returns represent past performance and do not guarantee future results. Total returns and average annual returns reflect changes in share price, reinvestment of distributions, and are net of expenses. Investment returns and the principal value of an investment will fluctuate. When shares are redeemed, they may be worth more or less than their original cost. Current performance may be lower or higher than the performance data presented. Visit www.tetonadv.com for performance information as of the most recent month end. For the SmallCap Equity, Mid-Cap Equity, Income, and Intermediate Bond Funds (and for the Mighty Mites Fund through September 30, 2005), TETON Advisors, Inc., (the “Adviser”) reimbursed expenses to limit the expense ratio. Had such limitations not been in place, returns would have been lower. The contractual expense limitations are in effect through January 31, 2015 and are renewable annually by the Adviser. The Funds, except for the Equity, Balanced, and Intermediate Bond Funds, impose a 2% redemption fee on shares sold or exchanged within seven days after the date of purchase. Investors should carefully consider the investment objectives, risks, charges, and expenses of a Fund before investing. The prospectuses contain information about these and other matters and should be read carefully before investing. To obtain a prospectus, please visit our website at www.tetonadv.com. |
| (b) | Includes the effect of the maximum 4.00% sales charge at the beginning of the period. |
| (c) | Assuming payment of the 1% maximum contingent deferred sales charge imposed on redemptions made within one year of purchase. |
| (d) | The performance of the Class AAA Shares is used to calculate performance for the periods prior to the issuance of Class A Shares, Class C Shares, and Class I Shares, except for the Mid-Cap Equity Fund. The performance for the Class I Shares of the Mid-Cap Equity Fund is based on the Fund’s inception date for this Share class. The performance for the Class A Shares and Class C Shares would have been lower due to the additional fees and expenses associated with these classes of shares. The performance for the Class I Shares would have been higher due to the lower expenses associated with this class of shares. The inception dates for the Class AAA Shares and the initial issuance dates for the Class A Shares, Class C Shares, and Class I Shares after which shares remained continuously outstanding are listed below. |
| | | | | | | | |
| | | Class AAA Shares | | Class A Shares | | Class C Shares | | Class I Shares |
Mighty Mites | | 05/11/98 | | 11/26/01 | | 08/03/01 | | 01/11/08 |
SmallCap Equity | | 04/15/97 | | 11/26/01 | | 11/26/01 | | 01/11/08 |
Mid-Cap Equity | | 05/31/13 | | 05/31/13 | | 05/31/13 | | 05/31/13 |
Income | | 09/30/97 | | 05/09/01 | | 11/26/01 | | 01/11/08 |
Equity | | 01/02/87 | | 01/28/94 | | 02/13/01 | | 01/11/08 |
Balanced | | 10/01/91 | | 04/06/93 | | 09/25/01 | | 01/11/08 |
Intermediate Bond | | 10/01/91 | | 07/26/01 | | 10/22/01 | | 01/11/08 |
The TETON Westwood Funds file a complete schedule of portfolio holdings with the Securities and Exchange Commission (the “SEC”) for the first and third quarters of each fiscal year on Form N-Q. Shareholders may obtain this information at www.gabelli.com or by calling the Funds at 800-WESTWOOD (800-937-8966). The Funds’ Form N-Q is available on the SEC’s website at www.sec.gov and may also be reviewed and copied at the SEC’s Public Reference Room in Washington, DC. Information on the operation of the Public Reference Room may be obtained by calling 800-SEC-0330.
Proxy Voting
Each Fund files Form N-PX with its complete proxy voting record for the twelve months ended June 30, no later than August 31 of each year. A description of the Funds’ proxy voting policies, procedures, and how the Funds voted proxies relating to portfolio securities are available without charge, upon request, by (i) calling 800-WESTWOOD (800-937-8966); (ii) writing to The TETON Westwood Funds at One Corporate Center, Rye, NY 10580-1422; and (iii) visiting the SEC’s website at www.sec.gov.
2
Performance Discussion (Unaudited)
Mighty Mites Fund
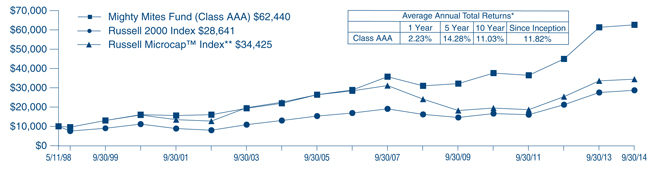
For the year ended September 30, 2014, the TETON Westwood Mighty Mites Fund net asset value (“NAV”) per Class AAA Share appreciated 2.2% versus gains of 3.9% for the Russell 2000 and 2.8% for the Russell Microcap Indices. See next page for additional performance information.
The Fund invests in small and micro-cap equity securities that have a market capitalization of $500 million or less at time of purchase. The portfolio management team focuses on bottom up stock selection, seeking bite sized companies with excellent management teams, strong balance sheets, and superior long term fundamentals. As bottom up, fundamental, research driven investors, the team seeks to purchase the inefficiently priced stocks of excellent companies selling at a discount to their private market value (PMV). In many cases, they look for a catalyst that can unlock hidden value within the enterprise. As such, (y)our portfolio is diversified across a broad cross section of companies sharing these valuation characteristics.
The first calendar quarter saw equity markets continue in a slow growth pattern. Tensions across the globe continued to build, with the U.S. and the European Union imposing sanctions on Russia. The greater geopolitical risk, along with slowing growth in China, indicated possible headwinds for the market.
During the quarter ended June 30, the performance of the equity markets continued to reflect the improving economic landscape in the U.S. Despite geopolitical concerns over civil war in Iraq, Russian posturing in Eastern Europe, and the rise of ISIS, the market continued its upward trajectory. The labor market continued to gain momentum, with an accelerating pace of job gains and a downtrend in the unemployment rate.
Despite a period of global uncertainty, the U.S. economy continued to grow in the third quarter. Small and microcap stocks have lagged the S&P 500 Index through September. Although small caps have been correcting since March, much of the slide has occurred in the third quarter. Also, economic data this year has been very uneven, with Gross Domestic Product contracting 2.9% in the March quarter followed by second quarter growth at a very strong 4.6%, the fastest rate of growth since the fourth quarter of 2011.
Deal activity was strong, with 19 announced transactions during the Fund’s fiscal year. Some notable deals during the fiscal year include: Costa Inc. was purchased by Essilor International for $21.50 in cash; Coastal Contacts Inc. was acquired by Essilor International for $12.45 in cash; LIN Media was acquired by Media General Inc. for $27.82 in cash and stock; Owens & Minor acquired Medical Action Industries Inc. for $13.80 in cash; Journal Communications Inc. (0.9% of net assets as of September 30, 2014) is being acquired by The E.W. Scripps Co. (0.2%) in an all stock deal. Private equity firm, Court Square Capital Partners, is buying Pike Corp. (0.2%) for $12.00 in cash. Skilled Healthcare Group, Inc. (less than 0.05%) is merging with Genesis Healthcare in an all stock deal. Multimedia Games Holding Co. Inc. (0.3%) is being acquired by Global Cash Access Holdings for $36.50 in cash.
Among the better performing stocks for the fiscal year were The Greenbrier Companies Inc. (0.2%), a transportation manufacturing corporation, specializing in rail transportation and leasing/management services; InfuSystems Holdings Inc. (0.2%), a provider of infusion pumps and related services; and Lawson Products Inc. (0.4%), a distributor of products and services to the industrial, commercial, institutional, and governmental maintenance, repair and operations marketplace. Some of our weaker performing stocks during the year were Coldwater Creek (sold), a specialty retailer of women’s apparel; Sevcon Inc. (0.3%), a producer and distributor in the electronic controls business; and the Dolan Co. (sold), a provider of professional services and business information to the legal, financial, and real estate sectors in the U.S.
We appreciate your confidence and trust.
3
Average Annual Returns Through September 30, 2014 (a) (Unaudited)
| | | | | | | | | | | | | | | | | | |
| | | 1 Year | | | 5 Year | | | 10 Year | | | Since
Inception
(5/11/98) | | | |
Mighty Mites Fund Class AAA | | | 2.23% | | | | 14.28% | | | | 11.03% | | | | 11.82% | | | |
Russell MicrocapTM Index | | | 2.78 | | | | 13.60 | | | | 6.36 | | | | N/A(b) | | | |
Russell 2000 Index | | | 3.93 | | | | 14.29 | | | | 8.19 | | | | 6.63 | | | |
Lipper Small Cap Value Fund Average | | | 6.71 | | | | 13.65 | | | | 8.20 | | | | 8.16(c) | | | |
In the current prospectus dated January 28, 2014, the expense ratio for Class AAA Shares is 1.44%. See page 42 for the expense ratios for the year ended September 30, 2014. Class AAA Shares do not have a sales charge.
| | (a) | Returns represent past performance and do not guarantee future results. Total returns and average annual returns reflect changes in share price, reinvestment of distributions, and are net of expenses. Investment returns and the principal value of an investment will fluctuate. When shares are redeemed, they may be worth more or less than their original cost. Current performance may be lower or higher than the performance data presented. Visit www.tetonadv.com for performance information as of the most recent month end. TETON Advisors, Inc., the Adviser, reimbursed expenses through September 30, 2005 to limit the expense ratios. Had such limitations not been in place, returns would have been lower. The Fund imposes a 2% redemption fee on shares sold or exchanged within seven days after the date of purchase. Investors should carefully consider the investment objectives, risks, charges, and expenses of the Fund before investing. The prospectuses contain information about these and other matters and should be read carefully before investing. To obtain a prospectus, please visit our website at www.tetonadv.com. Other share classes are available and have different performance characteristics. See page 2 for performance of other classes of shares. The Russell Microcap™ Index is an unmanaged indicator which measures the performance of the microcap segment of the U.S. equity market. The Russell 2000 Index is an unmanaged indicator which measures the performance of the small cap segment of the U.S. equity market. The Lipper Small Cap Value Fund Average reflects the average performance of mutual funds classified in this particular category. Investing in small capitalization securities involves special challenges because these securities may trade less frequently and experience more abrupt price movements than large capitalization securities. Dividends are considered reinvested. You cannot invest directly in an index. | |
| | (b) | The inception date of the Russell Microcap™ Index is June 30, 2000. | |
| | (c) | Lipper Small Cap Value Fund Average since inception performance is as of April 30, 1998. | |
COMPARISON OF CHANGE IN VALUE OF A $10,000 INVESTMENT IN
THE MIGHTY MITES FUND CLASS AAA, THE RUSSELL 2000 INDEX,
AND THE RUSSELL MICROCAP™ INDEX (Unaudited)
*Past performance is not predictive of future results. The performance tables and graph do not reflect the deduction of taxes that a shareholder would pay on fund distributions or the redemption of fund shares.
**The Russell Microcap™ Index inception date is June 30, 2000 and the value of the Index prior to July 1, 2000 is that of the Mighty Mites Fund (Class AAA).
4
SmallCap Equity Fund (Unaudited)
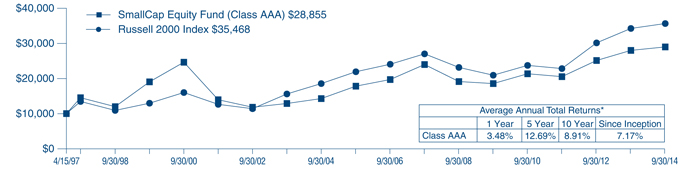
For the year ended September 30, 2014, the TETON Westwood SmallCap Equity Fund net asset value (“NAV”) per Class AAA Share appreciated 3.5% compared with a gain of 3.9% for the Russell 2000 Index. See below for additional performance information.
The last calendar quarter of 2013 saw equity price/earnings (P/E) multiples expand along with strong market gains. At its December meeting, the Federal Reserve announced that it would reduce the monthly pace of bond purchases by $10 billion per month.
The U.S. economic recovery gathered momentum in the first quarter of 2014, as evidenced by robust consumer spending and an improving job picture: nonfarm payrolls rose a seasonally adjusted 192,000 in March and figures for the prior two months were revised upward by a combined 37,000 with the unemployment rate holding steady at 6.7%. Moreover, the economy witnessed the early stages of a wave in merger and acquisition activity among smaller capitalization companies being acquired by both financial and strategic buyers.
Though the market was up significantly in the second quarter of 2014, the small cap index experienced an early stumble. The small cap pullback, attributable to concerns over a slowing economy, afforded the opportunity to refresh the portfolio through pruning and capital redeployment. Following the correction in the first quarter of 2014, nearly 40% of small caps were down 10% or more, causing the P/E premium of small caps vs. large caps to narrow to 1.16x from 1.35x in September 2013.
The quarter ended September 30 saw increasing geopolitical instability in the Middle East and Ukraine, decelerating growth in China, and fears of a less accommodative monetary policy by the Federal Reserve. Markets have historically corrected in anticipation of tightening credit and higher interest rates. Some positive domestic trends included strong new home sales, retail sales up 5% from the same month a year ago, and an improving job market and manufacturing activity.
Among the better performing stocks for the fiscal year were: Trinity Industries Inc. (1.7% of net assets as of September 30, 2014), a provider of products and services to the energy, transportation, chemical, and construction sectors in the U.S., Canada, Mexico, United Kingdom, Singapore, and Sweden; Patterson-UTI Energy Inc. (1.9%), a provider of onshore contract drilling services to major and independent oil and natural gas operators in the U.S. and Canada; and Hanesbrands Inc. (0.9%), a consumer goods company that designs, manufactures, sources, and sells basic apparels primarily in the U.S. Our weaker performing stocks during the year were Energy XXI Bermuda Ltd. (0.6%), which engages in the acquisition, exploration, development, production, and operation of oil and natural gas properties; General Cable Corp., a company offering fiber optic wire and cable products for the energy, industrial, construction, specialty, and communications markets worldwide which was sold prior to the fiscal year end; and Approach Resources Inc. (0.8%), an independent energy company engaged in the acquisition, development, exploration, and production of oil and gas properties in the U.S.
We thank you for your continued confidence and trust.
| | | | | | | | | | | | | | | | |
| Average Annual Returns through September 30, 2014 (a) (Unaudited) | | | Since | | |
| | | 1 Year | | | 5 Year | | | 10 Year | | | Inception
(4/15/97) | | |
SmallCap Equity Fund Class AAA | | | 3.48% | | | | 12.69% | | | | 8.91% | | | 7.17% | | |
Russell 2000 Index | | | 3.93 | | | | 14.29 | | | | 8.19 | | | 8.36 | | |
In the current prospectus dated January 28, 2014, the gross expense ratio for Class AAA Shares is 1.63%, and the net expense ratio is 1.50%, after contractual reimbursements by TETON Advisors, Inc. (the “Adviser”) in place through January 31, 2015. See page 43 for the expense ratios for the year ended September 30, 2014. Class AAA Shares do not have a sales charge.
| | (a) | Returns represent past performance and do not guarantee future results. Total returns and average annual returns reflect changes in share price, reinvestment of distributions, and are net of expenses. Investment returns and the principal value of an investment will fluctuate. When shares are redeemed, they may be worth more or less than their original cost. Current performance may be lower or higher than the performance data presented. Visit www.tetonadv.com for performance information as of the most recent month end. The Adviser reimbursed expenses to limit the expense ratio. Had such limitation not been in place, returns would have been lower. The Fund imposes a 2% redemption fee on shares sold or exchanged within seven days after the date of purchase. Investors should carefully consider the investment objectives, risks, charges, and expenses of the Fund before investing. The prospectuses contain information about these and other matters and should be read carefully before investing. To obtain a prospectus, please visit our website at www.tetonadv.com. Other share classes are available and have different performance characteristics. See page 2 for performance of other classes of shares. The Russell 2000 Index is an unmanaged indicator which measures the performance of the small cap segment of the U.S. equity market. Investing in small capitalization securities involves special challenges because these securities may trade less frequently and experience more abrupt price movements than large capitalization securities. Dividends are considered reinvested. You cannot invest directly in an index. | |
COMPARISON OF CHANGE IN VALUE OF A $10,000 INVESTMENT IN THE SMALLCAP EQUITY FUND
CLASS AAA AND THE RUSSELL 2000 INDEX (Unaudited)
| * | Past performance is not predictive of future results. The performance tables and graph do not reflect the deduction of taxes that a shareholder would pay on fund distributions or the redemption of fund shares. |
5
Mid-Cap Equity Fund (Unaudited)
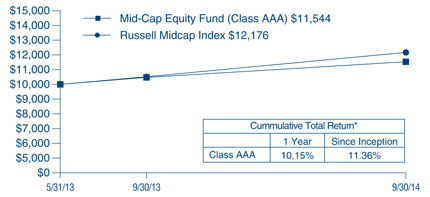
For the year ended September 30, 2014, the TETON Westwood Mid-Cap Equity Fund’s net asset value (“NAV”) per Class AAA Share appreciated 10.2% compared with 15.8% for the Russell Midcap Index. See next page for additional performance information.
The Fund invests primarily in mid-cap companies that the portfolio managers believe are undervalued by the market and have above average growth potential. The Fund defines mid-cap companies as those whose market capitalization (number of shares multiplied by share price) falls within a range of $1 billion to $20 billion. The portfolio managers seek to identify companies with attractive products or services, financial strength, strong competitive positions, high quality management, and reasonable valuation. As bottom up, fundamental, research driven investors, they seek to invest in attractively valued companies with strong balance sheets, secular growth, experienced management teams, solid earnings prospects, leading market shares, and superior long term fundamentals.
The fourth quarter of 2013, the opening of the Fund’s fiscal year, capped an exceptional year for the U.S. equity market fueled by accommodative monetary policy and solid improvement in the economy. Mid-cap stocks appreciated 8.4% in the fourth quarter ending the year at an all time high for the Russell Midcap Index.
The financial markets were very erratic during the first three months of the calendar year as investors focused on weaker macroeconomic statistics in the U.S. and the reversal of the Federal Reserve’s stimulative monetary policy. The Russell Midcap Index swooned more than 5.0% before ending the quarter up 3.5%. Economic activity suddenly reversed course, slowing markedly from the upward momentum seen at year end. Mid-cap stocks outperformed both large and small cap stocks during the first quarter. Growth stocks underperformed throughout the quarter, but were particularly hard hit in March when the market favored lower quality, value companies.
In the second calendar quarter, economic statistics from manufacturing to employment displayed gradual improvement, reaching levels similar to or better than those reported at the end of 2013. Equity markets celebrated the recovery by resuming their ascent, reaching record levels at mid year with mid-cap stocks up 5.0% for the quarter and 8.7% year to date as measured by the Russell Midcap Index. Mid-cap companies continued to outperform both large and small cap.
The U.S. equity markets’ performance during the third calendar quarter was closely aligned with the direction of U.S. economic growth, but turned a blind eye to weakening economies and geopolitical unrest in regions outside our borders. After a second quarter rebound in GDP to 4.6%, U.S. economic activity continued to advance through August with both manufacturing and service sectors matching or exceeding post recession highs as measured by the Institute for Supply Management. The economy appeared to be on solid footing. However, the economic recovery proved somewhat temperamental. The robust growth seen in spring and summer partly reflected some catchup after a weather worn winter, as most macroeconomic statistics from manufacturing to auto sales softened in September while consumer confidence took a hit.
Two conflicting trends remained consistent throughout the third quarter. Labor market statistics remained strong, while the housing market continued to languish. Despite the Federal Reserve’s reversal of easy monetary policy, and much to everyone’s surprise, interest rates in general continued to decline with the 10 year Treasury note ending the quarter at a low 2.5%. Outside of the U.S., political conflicts escalated in the Middle East and Ukraine, while the Ebola outbreak in West Africa intensified. The Chinese economy continued to weaken and the Eurozone slipped closer to recession. The quarter ended with the recovery intact, but concerns were building about its pace going forward.
Among the better performing stocks from for the year were Illumina Inc. (1.3% of net assets as of September 30, 2014), a developer and manufacturer of life science tools and integrated systems for the analysis of genetic variation and function; Synaptics Inc. (1.8%), a developer and supplier of custom designed human interface solutions that enable people to interact with a range of mobile computing, communications, entertainment, and other electronic devices; and Vertex Pharmaceuticals Inc. (2.4%), a company dedicated to discovering, developing, manufacturing, and commercializing small molecule drugs for the treatment of serious diseases. Some of our weaker performing holdings were Ariad Pharmaceuticals (sold), a global oncology company focused on the discovery, development, and commercialization of medicines for cancer patients; Covisint Corp. (0.4%), an American information technology company established in 2000 by a consortium of General Motors, Ford, and DaimlerChrysler; and Noble Corp. plc (0.6%), an offshore drilling contractor for the oil and gas industry.
We appreciate your confidence and trust.
6
Average Annual Returns through September 30, 2014 (a) (Unaudited)
| | | | | | | | | | |
| | | 1 Year | | | Since
Inception
(5/31/13) | | | |
Mid-Cap Equity Fund Class AAA | | | 10.15% | | | | 11.36% | | | |
Russell Midcap Index | | | 15.83 | | | | 15.88(b) | | | |
In the current prospectus dated January 28, 2014, the gross expense ratio for Class AAA Shares is 3.88%, and net expense ratio is 1.50% after contractual reimbursements by TETON Advisors, Inc. (the “Adviser”) in place through January 31, 2015. See page 44 for the expense ratios for the year ended September 30, 2014. Class AAA Shares do not have a sales charge.
| | (a) | Returns represent past performance and do not guarantee future results. Total returns and average annual returns reflect changes in share price, reinvestment of distributions, and are net of expenses. Investment returns and the principal value of an investment will fluctuate. When shares are redeemed, they may be worth more or less than their original cost. Current performance may be lower or higher than the performance data presented. Visit www.tetonadv.com for performance information as of the most recent month end. The Adviser reimbursed expenses to limit the expense ratio. Had such limitation not been in place, returns would have been lower. The Fund imposes a 2% redemption fee on shares sold or exchanged within seven days after the date of purchase. Investors should carefully consider the investment objectives, risks, charges, and expenses of the Fund before investing. The prospectuses contain information about these and other matters and should be read carefully before investing. To obtain a prospectus, please visit our website at www.tetonadv.com. Other share classes are available and have different performance characteristics. See page 2 for performance of other classes of shares. The Russell Midcap Index is an unmanaged indicator which measures the performance of the mid-cap segment of the U.S. equity market. Dividends are considered reinvested. You cannot invest directly in an index. | |
| | (b) | Russell Midcap Index since inception performance is from May 30, 2013. | |
COMPARISON OF CHANGE IN VALUE OF A $10,000 INVESTMENT IN THE MID-CAP EQUITY FUND
CLASS AAA AND THE RUSSELL MIDCAP INDEX (Unaudited)
| * | Past performance is not predictive of future results. The performance tables and graph do not reflect the deduction of taxes that a shareholder would pay on fund distributions or the redemption of fund shares. |
7
Income Fund (Unaudited)
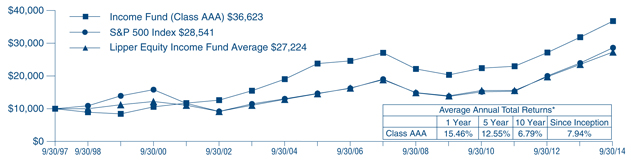
For the year ended September 30, 2014, the TETON Westwood Income Fund net asset value (“NAV”) per Class AAA Share appreciated 15.5% compared with gains of 19.7% and 16.1% for the Standard & Poor’s (“S&P”) 500 Index and the Lipper Equity Income Fund Average, respectively. See next page for additional performance information.
The Fund invests in companies to participate in the growth of their earnings and cash flow. We look for companies that we believe will continue to return cash flow to shareholders through reinvestment in their business resulting in greater cash flow and earnings, and higher share price valuation. The Fund looks to build a steady component of not only current return from dividend yields, but also rising dividend payout.
Investors ended 2013 on an optimistic note, sending the equity markets higher to a strong finish. In the fourth quarter of 2013, the U.S. equity markets gained over 10% to top off a 30% year, the best annual return since 1997. All ten industry sectors of the S&P 500 had positive returns in the quarter.
In the Fund’s second fiscal quarter, the ten industry sectors which comprise the stocks of the S&P 500 had more widely divergent returns than we have seen over the past year. As the underlying strength of the economy began to be questioned in the quarter, the strongest performing sectors were those considered defensive, or not dependent on economic growth. The utility sector had the highest total return, just under 10%, and the healthcare sector was also strong with a return of 5.9%. The weakest two sectors were those that would be most affected by a lack of strength and spending: consumer discretionary and industrials, with returns of 0.5% and 0.1%, respectively.
In the Fund’s third quarter, all ten industry sectors had positive returns, for the second quarter in a row. The energy sector posted the highest total return, of 12.1%, followed by the utilities and technology sectors. Through the third fiscal quarter the utilities sector has gained a tremendously strong 18.4%, followed by year to date gains in the energy sector of 12.8% and healthcare of 10.6%. The weakest sector in the third quarter was the consumer discretionary sector, which gained 0.6%, reflecting the growing realization the economy would post a much weaker first half than had been thought at the end of the first quarter.
The fourth quarter saw a return of volatility to financial markets, starting with a decline in July, as macroeconomic factors, including conflict in Ukraine and the Middle East, a slowdown in emerging markets growth, and Argentinian debt default on the last day of the month all weighed on the market. Markets rebounded sharply in August, as mostly positive second quarter earnings reports were coupled with dovish comments from Federal Reserve Chair Janet Yellen, who at the annual Federal Reserve meeting in Jackson Hole reiterated, “that it likely will be appropriate to maintain the current target range for the federal funds rate for a considerable time after our current asset purchase program ends.”
Toward the end of August, however, markets began factoring in the possibility of a recession in Europe, a worse than expected emerging markets slowdown, the negative impact of foreign currencies on overseas earnings (especially in the Eurozone), concerns about the impact of communicable diseases on travel and leisure industries, and continued conflict around the globe, whether in Ukraine, Iraq, Syria, or elsewhere.
Among the better performing stocks for the fiscal year were Intel Corp. (3.2% of net assets as of September 30, 2014), a leader in semiconductor chip and computer hardware producers; Apple Inc. (4.9%), an American multinational that designs, develops, and sells consumer electronics, computer software, online services, and PC’s; and Gilead Sciences Inc. (1.2%), a biotechnology company that discovers, develops, and commercializes therapeutics. Some of our weaker performing stocks during the year were Noble Corp. plc (0.4%), (formerly the Noble Drilling Company) a leading offshore drilling contractor; Barrick Gold Corp (0.9%), the largest gold mining company in the world with operations in over ten countries; and Newmont Mining Corp. (0.8%), one of the world’s largest producers of gold, with active mines in Nevada, Indonesia, Australia, New Zealand, Ghana, and Peru.
We appreciate your confidence and trust.
8
| | | | | | | | | | | | | | | | | | |
| Average Annual Returns Through September 30, 2014 (a) (Unaudited) | | | |
| | | 1 Year | | | 5 Year | | | 10 Year | | | Since
Inception
(9/30/97) | | | |
Income Fund Class AAA | | | 15.46% | | | | 12.55% | | | | 6.79% | | | | 7.94% | | | |
S&P 500 Index | | | 19.73 | | | | 15.70 | | | | 8.11 | | | | 6.34 | | | |
Lipper Equity Income Fund Average | | | 16.10 | | | | 14.02 | | | | 7.44 | | | | 6.07 | | | |
In the current prospectus dated January 28, 2014, the gross expense ratio for Class AAA Shares is 2.57%. The net expense ratio is 2.00% after contractual reimbursements by TETON Advisors, Inc. (the “Adviser”) in place through January 31, 2015. See page 45 for the expense ratios for the year ended September 30, 2014. Class AAA Shares do not have a sales charge.
| | (a) | Returns represent past performance and do not guarantee future results. Total returns and average annual returns reflect changes in share price, reinvestment of distributions, and are net of expenses. Investment returns and the principal value of an investment will fluctuate. When shares are redeemed, they may be worth more or less than their original cost. Current performance may be lower or higher than the performance data presented. Visit www.tetonadv.com for performance information as of the most recent month end. The Adviser reimbursed expenses to limit the expense ratio. Had such limitation not been in place, returns would have been lower. The Fund imposes a 2% redemption fee on shares sold or exchanged within seven days after the date of purchase. Investors should carefully consider the investment objectives, risks, charges, and expenses of the Fund before investing. The prospectuses contain information about these and other matters and should be read carefully before investing. To obtain a prospectus, please visit our website at www.tetonadv.com. Other share classes are available and have different performance characteristics. See page 2 for performance of other classes of shares. The S&P 500 Index is a market capitalization weighted index of 500 large capitalization stocks commonly used to represent the U.S. equity market. The Lipper Equity Income Fund Average includes the 30 largest equity funds tracked by Lipper, Inc. Dividends are considered reinvested. You cannot invest directly in an index. | |
COMPARISON OF CHANGE IN VALUE OF A $10,000 INVESTMENT IN THE INCOME FUND CLASS AAA,
THE S&P 500 INDEX, AND THE LIPPER EQUITY INCOME FUND AVERAGE (Unaudited)
| * | Past performance is not predictive of future results. The performance tables and graph do not reflect the deduction of taxes that a shareholder would pay on fund distributions or the redemption of fund shares. |
9
Equity Fund (Unaudited)
The Teton Westwood Equity Fund underperformed the benchmark S&P 500 Index over the fiscal year. For the twelve months ended September 30, 2014, the Equity Fund Class AAA shares posted a return of 15.3%, net of expenses, versus the S&P 500 Index return of 19.7%.
During the fiscal year ended September 30, 2014, Technology and Health Care were the best performing index sectors, while Consumer Discretionary and Energy performed the worst but still produced returns greater than 10%. Driving the Fund’s positive performance during the fiscal year was stock selection in Consumer Discretionary, followed by Utilities. The top contributors were Advance Auto Parts Inc. (1.0% of net assets as of September 30, 2014), which rallied after announcing a very accretive acquisition in the fourth quarter of 2013. Union Pacific Corp. (2.2%) was also additive to results as it continued to post strong earnings based on good execution and continued demand for rail transportation, while Wells Fargo & Co. (3.1%) was bid up on optimism over the housing market and a belief that the interest rate environment will favor banks going forward. Health care company Covidien Plc. (sold) rose after competitor Medtronic announced it was acquiring the firm, and technology company Skyworks Solutions Inc. (1.9%) continued its strong performance.
Detracting from the relative performance for the year was stock selection in Health Care, followed by Energy, Consumer Staples, and Technology. Detractors included technology companies Cisco Systems Inc. (sold), which lowered forward guidance as a result of increased competition in its core businesses, and ARRIS Group Inc. (1.9% of net assets as of September 30, 2014), after management made cautious comments about the effect on sales from consolidation in the cable/telecom provider industry. Financial services company CIT Group Inc. (1.7%) fell after reporting worse than expected net interest margins, while both consumer discretionary companies Viacom Inc (1.8%) and AMC Networks Inc. (1.7%) have experienced at points during the period weaker than expected advertising rates and a relative decline in sentiment for media companies following very strong performance in 2013.
We appreciate your confidence and trust.
| | | | | | | | | | | | | | | | | | |
| Average Annual Returns through September 30, 2014 (a) (Unaudited) | | | |
| | | 1 Year | | | 5 Year | | | 10 Year | | | Since
Inception
(1/2/87) | | | |
Equity Fund Class AAA | | | 15.28% | | | | 12.91% | | | | 7.85% | | | | 10.17% | | | |
S&P 500 Index | | | 19.73 | | | | 15.70 | | | | 8.11 | | | | 10.33(b) | | | |
In the current prospectus dated January 28, 2014, the expense ratio for Class AAA Shares is 1.60%. See page 46 for the expense ratios for the year ended September 30, 2014. Class AAA Shares do not have a sales charge.
| | (a) | Returns represent past performance and do not guarantee future results. Total returns and average annual returns reflect changes in share price, reinvestment of distributions, and are net of expenses. Investment returns and the principal value of an investment will fluctuate. When shares are redeemed, they may be worth more or less than their original cost. Current performance may be lower or higher than the performance data presented. Visit www.tetonadv.com for performance information as of the most recent month end. Investors should carefully consider the investment objectives, risks, charges, and expenses of the Fund before investing. The prospectuses contain information about these and other matters and should be read carefully before investing. To obtain a prospectus, please visit our website at www.tetonadv.com. Other share classes are available and have different performance characteristics. See page 2 for performance of other classes of shares. The S&P 500 Index is a market capitalization weighted index of 500 large capitalization stocks commonly used to represent the U.S. equity market. Dividends are considered reinvested. You cannot invest directly in an index. | |
| | (b) | S&P 500 Index since inception performance are as of December 31, 1986. | |
COMPARISON OF CHANGE IN VALUE OF A $10,000 INVESTMENT IN
THE EQUITY FUND CLASS AAA AND THE S&P 500 INDEX (Unaudited)
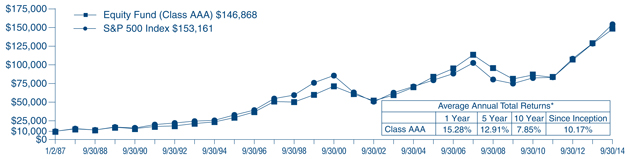
| * | Past performance is not predictive of future results. The performance tables and graph do not reflect the deduction of taxes that a shareholder would pay on fund distributions or the redemption of fund shares. |
10
Balanced Fund (Unaudited)
For twelve months ended September 30, 2014, the Teton Westwood Balanced Fund Class AAA Shares posted a return of 9.9%, net of expenses, versus the Barclays Government/Credit Bond Index return of 4.1%. The Fund’s return was less than a common balanced benchmark comprised of 60% S&P 500 Index and 40% of the Barclays Capital Government/Credit Bond Index which returned 13.5%. See next page for additional information.
The Fund is designed to provide exposure to equities while reducing overall risk through investment in investment grade fixed income securities. The bond portion typically invests in high quality notes with lower interest rate sensitivity and generally a shorter maturity than the typical bond index, with the objective of dampening the volatility of equity holdings. Unlike the prior fiscal year, this lower interest rate sensitivity detracted over the last twelve months from relative performance of the bond portion of the Fund versus the Barclays Capital Government/Credit Bond Index.
For the twelve months ended September 30, 2014, the Treasury yield curve twisted more markedly than during the quarter end September: within the Barclays Capital Government/Credit Bond Index, bonds longer than 10 years returned 12.9% while bonds 1-10 years in maturity returned 2.2%. The spread narrowing trend for Corporates, resulted in Corporates outperforming U.S. Governments 6.8% to 2.3%. In general, fixed income investors were better compensated over the fiscal year for taking interest rate risk over credit risk. Within the Corporate sector, the 8.4% return of Baa-rated credits more than tripled the performance of Aaa-rated credits. The Utility sector led Corporates with an 8.6% return. Treasury Inflation-Indexed securities earned 1.6%.
Factors driving the performance of the Fund relative to the Barclays Capital Government/Credit Bond Index were: (1) underweighting U.S. Treasurys – particularly long maturity bonds – while overweighting the (lowest performing) U.S. Agency sector, and (2) favoring in the Industrial and Financial Services sectors’ maturities less than 10 years relative to stronger performing long maturity credits. Considerable overweight positions in these two corporate sectors were beneficial, however.
The top five contributors to fiscal year Fund performance were four Corporates and one U.S. Agency: Intel Corp. 3.3% due 01-Oct-2021 (1.2% of net assets as of September 30, 2014), Occidental Petroleum Corp. 2.7% (0.9%) due 15-Feb-2023, JPMorgan Chase & Co 6.3% due 23-Apr-2019 (1.0%), Freddie Mac note 3.75% due 27-Mar-2019 (1.9%), and Burlington Northern Santa Fe LLC 5.65% due 01-May-2017 (1.3%).
Detracting the performance the most were three Treasury Inflation-Index Protected Securities: 1.375% due 15-Jan-2020 (1.4%), 2.125% due 15-Jan-2019 (1.3%), and 2.5% due 15-Jul-2016 (1.8%); and two corporate notes: Costco Wholesale Corporation 1.7% due 15-Dec-2019 (0.9%) and The Goldman Sachs Group Inc. 3.85% due 08-Jul-2024 (0.7%).
We appreciate your confidence and trust.
11
| | | | | | | | | | | | | | | | | | |
| Average Annual Returns through September 30, 2014 (a) (Unaudited) | | | |
| | | 1 Year | | | 5 Year | | | 10 Year | | | Since
Inception
(10/1/91) | | | |
Balanced Fund Class AAA | | | 9.85% | | | | 9.03% | | | | 6.49% | | | | 8.65% | | | |
Barclays Government/Credit Bond Index | | | 4.08 | | | | 4.27 | | | | 4.59 | | | | 6.21(c) | | | |
S&P 500 Index | | | 19.73 | | | | 15.70 | | | | 8.11 | | | | 9.53(c) | | | |
60% S&P 500 Index and 40% Barclays Government/Credit Bond Index (b) | | | 13.47 | | | | 11.13 | | | | 6.70 | | | | 8.20 | | | |
In the current prospectus dated January 28, 2014, the expense ratio for Class AAA Shares is 1.28%. See page 47 for the expense ratios for the year September 30, 2014. Class AAA Shares do not have a sales charge.
| | (a) | Returns represent past performance and do not guarantee future results. Total returns and average annual returns reflect changes in share price, reinvestment of distributions, and are net of expenses. Investment returns and the principal value of an investment will fluctuate. When shares are redeemed, they may be worth more or less than their original cost. Current performance may be lower or higher than the performance data presented. Visit www.tetonadv.com for performance information as of the most recent month end. TETON Advisors, LLC, the Adviser reimbursed expenses in years prior to 1998 to limit the expense ratio. Had such limitation not been in place, returns would have been lower. Investors should carefully consider the investment objectives, risks, charges, and expenses of the Fund before investing. The prospectuses contain information about these and other matters and should be read carefully before investing. To obtain a prospectus, please visit our website at www.tetonadv.com. Other share classes are available and have different performance characteristics. See page 2 for performance of other classes of shares. The Barclays Government/Credit Bond Index is a market value weighted index that tracks the performance of fixed rate, publicly placed, dollar denominated obligations. The S&P 500 Index is a market capitalization weighted index of 500 large capitalization stocks commonly used to represent the U.S. equity market. Dividends are considered reinvested. You cannot invest directly in an index. | |
| | (b) | The Blended Index consists of a 60% blend of each of the S&P 500 Index and 40% Barclays Government/Credit Bond Index. | |
| | (c) | S&P 500 Index and Barclays Government/Credit Bond Index since inception performance are as of September 30, 1991. | |
COMPARISON OF CHANGE IN VALUE OF A $10,000 INVESTMENT IN THE BALANCED FUND CLASS AAA,
THE S&P 500 INDEX, AND A COMPOSITE OF 60% OF THE S&P 500 INDEX AND 40% OF
THE BARCLAYS GOVERNMENT/CREDIT BOND INDEX (Unaudited)
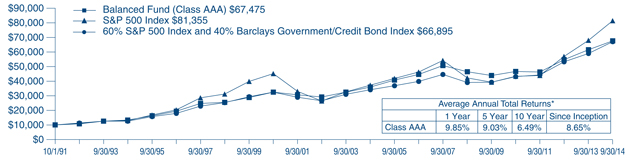
| * | Past performance is not predictive of future results. The performance tables and graph do not reflect the deduction of taxes that a shareholder would pay on fund distributions or the redemption of fund shares. |
12
Intermediate Bond Fund (Unaudited)
For the year ended September 30, 2014, the TETON Westwood Intermediate Bond Fund net asset value (“NAV”) per Class AAA Share increased 0.5% compared with the Barclays Government/Credit Bond Index which was up 4.1%. See next page for additional performance information.
Volatility for fixed income prices increased in the fourth calendar quarter of 2013 – the opening quarter of the Fund’s fiscal year – after the Federal Reserve announced plans on December 18 to reduce the quantitative easing purchases of Treasury and mortgage securities.
Fixed income continued to appreciate during a choppy first calendar quarter of 2014. Treasuries and Investment Grade corporates benefited from the “flight-to-quality” buying associated with geopolitical and military tension in Ukraine, several pieces of underwhelming U.S. economic data, and an emerging market sell-off in January. The Federal Reserve announced plans to wind down Quantitative Easing purchases by the end of the year.
The second calendar quarter of 2014 saw fixed income investments continue to appreciate as the 10 year Treasury yield rallied from 2.72% to finish the quarter at 2.53%, while other Treasury yields declined for maturities of 5 years and longer. During the third calendar quarter of 2014, the U.S. Treasury yield curve slightly twisted, as short/intermediate yields rose and longer bond yields declined, resulting in a rally for longer versus shorter maturities. The 10 year Treasury yield moved from 2.56% to 2.49%. The rally in long Treasurys reflected expectations for a delay in Fed interest rate hikes, based on inflation and labor readings below the Federal Reserve’s targets. U.S. Treasurys also benefited from historically low sovereign bond yields in Europe.
Credit spreads (the excess yield of a corporate bond above the comparable maturity Treasury) widened during the third quarter. The rise in risk premia was driven by concern over valuations and additional supply coming to market, particularly in September. This quarter’s credit spread widening interrupted the consistent spread narrowing trend which had been in place since 2012. Corresponding to the yield curve twist and corporate spread widening: Treasurys outperformed Corporates 0.34% to -0.08% and 10+ year bonds outperformed 1-10 year maturities 1.04% to -0.03%. Within investment grade corporates: Utilities led with a gain of 0.45%, while industrials lagged with a return of -0.16% and stronger credit quality outperformed lower credit quality –AAA credits returned 0.25% versus -0.20% for BBB credits.
The top five contributors to the Fund’s annual performance all were Corporates: Intel Corp. 3.3% due 01-Oct-2021 (1.7% of net assets as of September 30, 2014), Arrow Electronics Inc. 6.0% due 01-Apr-2020 (1.1%), Oracle Corp. 3.625% due 15-Jul-2023 (1.9%), Teva Pharmaceutical Finance 3.65% due 10-Nov-2021 (1.6%), and Murphy Oil Corp. 2.5% due 01-Dec-2017 (1.9%). Detracting the most to performance were Costco Wholesale Corp. 1.7% due 15-Dec-2019 (1.8%), and the following four Treasury Inflation-Index Protected Securities: 1.375% due 15-Jul-2018 (1.7%), 1.375% due 15-Jan-2020 (1.7%), 2.125% due 15-Jan-2019 (1.6%), and 2.5% due 15-Jul-2016 (1.6%).
We thank you for your continued confidence and trust.
13
| | | | | | | | | | | | | | | | | | |
| Average Annual Returns through September 30, 2014 (a) (Unaudited) | | | |
| | | 1 Year | | | 5 Year | | | 10 Year | | | Since
Inception
(10/1/91) | | | |
Intermediate Bond Fund Class AAA | | | 0.54% | | | | 2.23% | | | | 3.17% | | | | 4.94% | | | |
Barclays Government/Credit Bond Index | | | 4.08 | | | | 4.27 | | | | 4.59 | | | | 6.21(b) | | | |
In the current prospectus dated January 28, 2014, the gross expense ratio for AAA Shares is 1.36%. The net expense ratio is 1.00%, after contractual reimbursements by TETON Advisors Inc. (the “Adviser”) in place through January 31, 2015. See page 48 for the expense ratios for the year ended September 30, 2014. Class AAA Shares do not have a sales charge.
| | (a) | Returns represent past performance and do not guarantee future results. Total returns and average annual returns reflect changes in share price, reinvestment of distributions, and are net of expenses. Investment returns and the principal value of an investment will fluctuate. When shares are redeemed, they may be worth more or less than their original cost. Current performance may be lower or higher than the performance data presented. Visit www.tetonadv.com for performance information as of the most recent month end. The Adviser reimbursed expenses to limit the expense ratio. Had such limitation not been in place, returns would have been lower. Investors should carefully consider the investment objectives, risks, charges, and expenses of the Fund before investing. The prospectuses contain information about these and other matters and should be read carefully before investing. To obtain a prospectus, please visit our website at www.tetonadv.com. Other share classes are available and have different performance characteristics. See page 2 for performance of other classes of shares. The Barclays Government/Credit Bond Index is a market value weighted index that tracks the performance of fixed rate, publicly placed, dollar denominated obligations. Dividends are considered reinvested. You cannot invest directly in an index. | |
| | (b) | The Barclays Government/Credit Bond Index since inception performance is as of September 30, 1991. | |
COMPARISON OF CHANGE IN VALUE OF A $10,000 INVESTMENT IN THE
INTERMEDIATE BOND FUND CLASS AAA AND
THE BARCLAYS GOVERNMENT/CREDIT BOND INDEX (Unaudited)
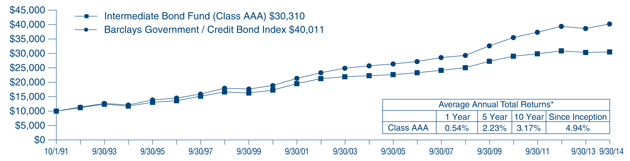
| * | Past performance is not predictive of future results. The performance tables and graph do not reflect the deduction of taxes that a shareholder would pay on fund distributions or the redemption of fund shares. |
14
Morningstar® Ratings Based on Risk Adjusted Returns as of September 30, 2014 (Unaudited)
| | | | | | | | | | | | | | | | | | |
| | | | | Overall Rating | | 3 Year Rating | | 5 Year Rating | | 10 Year Rating |
FUND | | Morningstar
Category | | Stars | | # of
Funds | | Stars | | # of
Funds | | Stars | | # of
Funds | | Stars | | # of
Funds |
| | | | | | | | | |
TETON Westwood Mighty Mites AAA | | Small Blend | | «««« | | 616 | | ««« | | 616 | | «««« | | 563 | | ««««« | | 351 |
TETON Westwood Mighty Mites A | | Small Blend | | «««« | | 616 | | «« | | 616 | | ««« | | 563 | | ««««« | | 351 |
TETON Westwood Mighty Mites C | | Small Blend | | «««« | | 616 | | «« | | 616 | | ««« | | 563 | | ««««« | | 351 |
TETON Westwood Mighty Mites I | | Small Blend | | «««« | | 616 | | ««« | | 616 | | «««« | | 563 | | ««««« | | 351 |
| | | | | | | | | |
TETON Westwood SmallCap Equity AAA | | Small Blend | | «« | | 616 | | «« | | 616 | | «« | | 563 | | ««« | | 351 |
TETON Westwood SmallCap Equity A | | Small Blend | | « | | 616 | | « | | 616 | | « | | 563 | | «« | | 351 |
TETON Westwood SmallCap Equity C | | Small Blend | | « | | 616 | | « | | 616 | | « | | 563 | | «« | | 351 |
TETON Westwood SmallCap Equity I | | Small Blend | | «« | | 616 | | «« | | 616 | | ¶¶ | | 563 | | ¶¶¶ | | 351 |
| | | | | | | | | |
TETON Westwood Mid-Cap Equity AAA | | Mid-Cap Growth | | — | | — | | — | | — | | — | | — | | — | | — |
TETON Westwood Mid-Cap Equity A | | Mid-Cap Growth | | — | | — | | — | | — | | — | | — | | — | | — |
TETON Westwood Mid-Cap Equity C | | Mid-Cap Growth | | — | | — | | — | | — | | — | | — | | — | | — |
TETON Westwood Mid-Cap Equity I | | Mid-Cap Growth | | — | | — | | — | | — | | — | | — | | — | | — |
| | | | | | | | | |
TETON Westwood Income AAA | | Large Value | | ««« | | 1092 | | «« | | 1092 | | ««« | | 966 | | ««« | | 635 |
TETON Westwood Income A | | Large Value | | «« | | 1092 | | « | | 1092 | | «« | | 966 | | ««« | | 635 |
TETON Westwood Income C | | Large Value | | «« | | 1092 | | « | | 1092 | | «« | | 966 | | ««« | | 635 |
TETON Westwood Income I | | Large Value | | ««« | | 1092 | | «« | | 1092 | | ««« | | 966 | | ««« | | 635 |
| | | | | | | | | |
TETON Westwood Equity AAA | | Large Value | | ««« | | 1092 | | ««« | | 1092 | | «« | | 966 | | «««« | | 635 |
TETON Westwood Equity A | | Large Value | | ««« | | 1092 | | «« | | 1092 | | «« | | 966 | | ««« | | 635 |
TETON Westwood Equity C | | Large Value | | ««« | | 1092 | | «« | | 1092 | | «« | | 966 | | ««« | | 635 |
TETON Westwood Equity I | | Large Value | | «« | | 1092 | | ««« | | 1092 | | «« | | 966 | | «««« | | 635 |
| | | | | | | | | |
TETON Westwood Balanced AAA | | Moderate Allocation | | «««« | | 737 | | ««« | | 737 | | ««« | | 652 | | «««« | | 430 |
TETON Westwood Balanced A | | Moderate Allocation | | ««« | | 737 | | «« | | 737 | | «« | | 652 | | ««« | | 430 |
TETON Westwood Balanced C | | Moderate Allocation | | ««« | | 737 | | ««« | | 737 | | «« | | 652 | | ««« | | 430 |
TETON Westwood Balanced I | | Moderate Allocation | | ««« | | 737 | | ««« | | 737 | | ««« | | 652 | | «««« | | 430 |
| | | | | | | | | |
TETON Westwood Intermediate Bond AAA | | Intermediate Term Bond | | « | | 929 | | « | | 929 | | « | | 808 | | « | | 574 |
TETON Westwood Intermediate Bond A | | Intermediate Term Bond | | « | | 929 | | « | | 929 | | « | | 808 | | « | | 574 |
TETON Westwood Intermediate Bond C | | Intermediate Term Bond | | « | | 929 | | « | | 929 | | « | | 808 | | « | | 574 |
TETON Westwood Intermediate Bond I | | Intermediate Term Bond | | « | | 929 | | « | | 929 | | « | | 808 | | ¶¶ | | 574 |
The Overall Morningstar Rating™ is derived from a weighted average of the performance figures associated with its three, five, and ten year (if applicable) Morningstar Rating metrics. Data presented reflects past performance, which is no guarantee of future results. Ratings are for Class AAA, A, C, or I Shares. Unrated classes of fund shares are not listed. For each fund with at least a three year history, Morningstar calculates a Morningstar Rating based on a Morningstar Risk-Adjusted Return measure (including the effects of sales charges, loads, and redemption fees) that accounts for variation in a fund’s monthly performance, placing more emphasis on downward variations and rewarding consistent performance. The top 10% of the funds in each category receive 5 stars, the next 22.5% receive 4 stars, the next 35% receive 3 stars, the next 22.5% receive 2 stars, and the bottom 10% receive 1 star. (Each share class is counted as a fraction of one fund within this scale and rated separately, which may cause slight variations in the distribution percentages.) Strong relative performance is not indicative of positive fund returns. © 2014 Morningstar, Inc. All rights reserved. The information contained herein: (1) is proprietary to Morningstar and/or its content providers; (2) may not be copied or distributed; and (3) is not warranted to be accurate, complete or timely. Neither Morningstar nor its content providers are responsible for any damages or losses arising from any use of this information.
Teton Advisors, Inc. is the investment manager for all TETON Westwood Funds. Investors should carefully consider the investment objectives, risks, sales charges, and expenses of a fund carefully before investing. Each Fund’s prospectuses contain this and other information about the Funds and are available by calling 800-WESTWOOD, online at www.tetonadv.com, or from your financial adviser. The prospectuses should be read carefully before investing.
Distributed by G.distributors, LLC, One Corporate Center, Rye, NY 10580. Call 800-WESTWOOD for a prospectus.
15
TETON Westwood Funds
Disclosure of Fund Expenses (Unaudited)
For the Six Month Period from April 1, 2014 through September 30, 2014
We believe it is important for you to understand the impact of fees and expenses regarding your investment. All mutual funds have operating expenses. As a shareholder of a fund, you incur ongoing costs, which include costs for portfolio management, administrative services, and shareholder reports (like this one), among others. Operating expenses, which are deducted from a fund’s gross income, directly reduce the investment return of a fund. When a fund’s expenses are expressed as a percentage of its average net assets, this figure is known as the expense ratio. The following examples are intended to help you understand the ongoing costs (in dollars) of investing in your Fund and to compare these costs with those of other mutual funds. The examples are based on an investment of $1,000 made at the beginning of the period shown and held for the entire period.
The Expense Table below illustrates your Fund’s costs in two ways:
Actual Fund Return: This section provides information about actual account values and actual expenses. You may use this section to help you to estimate the actual expenses that you paid over the period after any fee waivers and expense reimbursements. The “Ending Account Value” shown is derived from the Fund’s actual return during the past six months, and the Expenses Paid During Period” shows the dollar amount that would have been paid by an investor who started with $1,000 in the Fund. You may use this information, together with the amount you invested, to estimate the expenses that you paid over the period. To do so, simply divide your account value by $1,000 (for example, an $8,600 account value divided by $1,000 = 8.6), then multiply the result by the number given for your Fund under the heading “Expenses Paid During Period” to estimate the expenses you paid during this period.
Hypothetical 5% Return: This section provides information about hypothetical account values and hypothetical expenses based on the Fund’s actual expense ratio. It assumes a hypothetical annualized return of 5% before expenses during the period shown. In this case – because the hypothetical return used is not the Fund’s actual return – the results do not apply to your investment and you cannot use the hypothetical account value and expense to estimate the actual ending account balance or expenses you paid for the period. This example is useful in making comparisons of the ongoing costs of investing in the Fund and other funds. To do so, compare this 5% hypothetical example with the 5% hypothetical examples that appear in shareholder reports of other funds.
Please note that the expenses shown in the table are meant to highlight your ongoing costs only and do not reflect any transactional costs such as sales charges (loads), redemption fees, or exchange fees, if any, which are described in the Prospectus. If these costs were applied to your account, your costs would be higher. Therefore, the 5% hypothetical return is useful in comparing ongoing costs only, and will not help you determine the relative total costs of owning different funds. The “Annualized Expense Ratio” represents the actual expenses for the last six months and may be different from the expense ratio in the Financial Highlights which is for the year ended September 30, 2014.
16
TETON Westwood Funds
Disclosure of Fund Expenses (Unaudited) (Continued)
For the Six Month Period from April 1, 2014 through September 30, 2014
Expense Table
| | | | | | | | | | | | | | | | | | | | | | | | | | | | | | | | | | | | | | | | | | | | | |
| | | Actual Fund Return | | Hypothetical 5% Return |
| | | Beginning
Account Value
04/01/14 | | Ending
Account Value
09/30/14 | | Annualized
Expense
Ratio | | Expenses
Paid During
Period* | | Beginning
Account Value
04/01/14 | | Ending
Account Value
09/30/14 | | Annualized
Expense
Ratio | | Expenses
Paid During
Period* |
TETON Westwood Mighty Mites Fund | | | | | | | | | | | | | | | | | | | | | | | | | | | | | | | | | |
Class AAA | | | | $1,000.00 | | | | $ | 937.70 | | | | | 1.44 | % | | | $ | 6.99 | | | | | $1,000.00 | | | | | $1,017.85 | | | | | 1.44 | % | | | $ | 7.28 | | | |
Class A | | | | $1,000.00 | | | | $ | 936.20 | | | | | 1.69 | % | | | $ | 8.20 | | | | | $1,000.00 | | | | | $1,016.60 | | | | | 1.69 | % | | | $ | 8.54 | | | |
Class C | | | | $1,000.00 | | | | $ | 933.80 | | | | | 2.19 | % | | | $ | 10.62 | | | | | $1,000.00 | | | | | $1,014.09 | | | | | 2.19 | % | | | $ | 11.06 | | | |
Class I | | | | $1,000.00 | | | | $ | 938.70 | | | | | 1.18 | % | | | $ | 5.73 | | | | | $1,000.00 | | | | | $1,019.15 | | | | | 1.18 | % | | | $ | 5.97 | | | |
| | | | | | | | | | | | | | | | | | | | | | | | | | | | | | | | | | | | | | | | | | | |
TETON Westwood SmallCap Equity Fund | | | | | | | | | | | | | | | | | | | | | | | | | | | | | | | | | |
Class AAA | | | | $1,000.00 | | | | $ | 944.80 | | | | | 1.50 | % | | | $ | 7.31 | | | | | $1,000.00 | | | | | $1,017.55 | | | | | 1.50 | % | | | $ | 7.59 | | | |
Class A | | | | $1,000.00 | | | | $ | 944.00 | | | | | 1.75 | % | | | $ | 8.53 | | | | | $1,000.00 | | | | | $1,016.29 | | | | | 1.75 | % | | | $ | 8.85 | | | |
Class C | | | | $1,000.00 | | | | $ | 941.20 | | | | | 2.25 | % | | | $ | 10.95 | | | | | $1,000.00 | | | | | $1,013.79 | | | | | 2.25 | % | | | $ | 11.36 | | | |
Class I | | | | $1,000.00 | | | | $ | 946.00 | | | | | 1.25 | % | | | $ | 6.10 | | | | | $1,000.00 | | | | | $1,018.80 | | | | | 1.25 | % | | | $ | 6.33 | | | |
| | | | | | | | | | | | | | | | | | | | | | | | | | | | | | | | | | | | | | | | | | | |
TETON Westwood Mid-Cap Equity Fund | | | | | | | | | | | | | | | | | | | | | | | | | | | | | | | | | |
Class AAA | | | | $1,000.00 | | | | $ | 1,014.10 | | | | | 1.50 | % | | | $ | 7.57 | | | | | $1,000.00 | | | | | $1,017.55 | | | | | 1.50 | % | | | $ | 7.59 | | | |
Class A | | | | $1,000.00 | | | | $ | 1,013.20 | | | | | 1.75 | % | | | $ | 8.83 | | | | | $1,000.00 | | | | | $1,016.29 | | | | | 1.75 | % | | | $ | 8.85 | | | |
Class C | | | | $1,000.00 | | | | $ | 1,009.70 | | | | | 2.25 | % | | | $ | 11.34 | | | | | $1,000.00 | | | | | $1,013.79 | | | | | 2.25 | % | | | $ | 11.36 | | | |
Class I | | | | $1,000.00 | | | | $ | 1,014.90 | | | | | 1.25 | % | | | $ | 6.31 | | | | | $1,000.00 | | | | | $1,018.80 | | | | | 1.25 | % | | | $ | 6.33 | | | |
| | | | | | | | | | | | | | | | | | | | | | | | | | | | | | | | | | | | | | | | | | | |
TETON Westwood Income Fund | | | | | | | | | | | | | | | | | | | | | | | | | | | | | | | | | | | | | | |
Class AAA | | | | $1,000.00 | | | | $ | 1,064.90 | | | | | 2.00 | % | | | $ | 10.35 | | | | | $1,000.00 | | | | | $1,015.04 | | | | | 2.00 | % | | | $ | 10.10 | | | |
Class A | | | | $1,000.00 | | | | $ | 1,062.80 | | | | | 2.25 | % | | | $ | 11.64 | | | | | $1,000.00 | | | | | $1,013.79 | | | | | 2.25 | % | | | $ | 11.36 | | | |
Class C | | | | $1,000.00 | | | | $ | 1,061.00 | | | | | 2.75 | % | | | $ | 14.21 | | | | | $1,000.00 | | | | | $1,011.28 | | | | | 2.75 | % | | | $ | 13.87 | | | |
Class I | | | | $1,000.00 | | | | $ | 1,066.10 | | | | | 1.75 | % | | | $ | 9.06 | | | | | $1,000.00 | | | | | $1,016.29 | | | | | 1.75 | % | | | $ | 8.85 | | | |
| | | | | | | | | | | | | | | | | | | | | | | | | | | | | | | | | | | | | | | | | | | |
TETON Westwood Equity Fund | | | | | | | | | | | | | | | | | | | | | | | | | | | | | | | | | |
Class AAA | | | | $1,000.00 | | | | $ | 1,034.90 | | | | | 1.58 | % | | | $ | 8.06 | | | | | $1,000.00 | | | | | $1,017.15 | | | | | 1.58 | % | | | $ | 7.99 | | | |
Class A | | | | $1,000.00 | | | | $ | 1,032.60 | | | | | 1.83 | % | | | $ | 9.32 | | | | | $1,000.00 | | | | | $1,015.89 | | | | | 1.83 | % | | | $ | 9.25 | | | |
Class C | | | | $1,000.00 | | | | $ | 1,030.50 | | | | | 2.33 | % | | | $ | 11.86 | | | | | $1,000.00 | | | | | $1,013.39 | | | | | 2.33 | % | | | $ | 11.76 | | | |
Class I | | | | $1,000.00 | | | | $ | 1,035.70 | | | | | 1.33 | % | | | $ | 6.79 | | | | | $1,000.00 | | | | | $1,018.40 | | | | | 1.33 | % | | | $ | 6.73 | | | |
| | | | | | | | | | | | | | | | | | | | | | | | | | | | | | | | | | | | | | | | | | | |
TETON Westwood Balanced Fund | | | | | | | | | | | | | | | | | | | | | | | | | | | | | | | | | |
Class AAA | | | | $1,000.00 | | | | $ | 1,023.00 | | | | | 1.26 | % | | | $ | 6.39 | | | | | $1,000.00 | | | | | $1,018.75 | | | | | 1.26 | % | | | $ | 6.38 | | | |
Class A | | | | $1,000.00 | | | | $ | 1,021.50 | | | | | 1.51 | % | | | $ | 7.65 | | | | | $1,000.00 | | | | | $1,017.50 | | | | | 1.51 | % | | | $ | 7.64 | | | |
Class C | | | | $1,000.00 | | | | $ | 1,019.60 | | | | | 2.01 | % | | | $ | 10.18 | | | | | $1,000.00 | | | | | $1,014.99 | | | | | 2.01 | % | | | $ | 10.15 | | | |
Class I | | | | $1,000.00 | | | | $ | 1,024.30 | | | | | 1.01 | % | | | $ | 5.13 | | | | | $1,000.00 | | | | | $1,020.00 | | | | | 1.01 | % | | | $ | 5.11 | | | |
| | | | | | | | | | | | | | | | | | | | | | | | | | | | | | | | | | | | | | | | | | | |
TETON Westwood Intermediate Bond Fund | | | | | | | | | | | | | | | | | | | | | | | | | | | | | | | | | |
Class AAA | | | | $1,000.00 | | | | $ | 1,002.80 | | | | | 1.00 | % | | | $ | 5.02 | | | | | $1,000.00 | | | | | $1,020.05 | | | | | 1.00 | % | | | $ | 5.06 | | | |
Class A | | | | $1,000.00 | | | | $ | 1,002.30 | | | | | 1.10 | % | | | $ | 5.52 | | | | | $1,000.00 | | | | | $1,019.55 | | | | | 1.10 | % | | | $ | 5.57 | | | |
Class C | | | | $1,000.00 | | | | $ | 998.90 | | | | | 1.75 | % | | | $ | 8.77 | | | | | $1,000.00 | | | | | $1,016.29 | | | | | 1.75 | % | | | $ | 8.85 | | | |
Class I | | | | $1,000.00 | | | | $ | 1,005.00 | | | | | 0.75 | % | | | $ | 3.77 | | | | | $1,000.00 | | | | | $1,021.31 | | | | | 0.75 | % | | | $ | 3.80 | | | |
| * | Expenses are equal to the Funds’ annualized expense ratio for the last six months multiplied by the average account value over the period, multiplied by the number of days in the most recent fiscal half year (183 days), then divided by 365. |
17
Summary of Portfolio Holdings (Unaudited)
The following tables present portfolio holdings as a percent of net assets as of September 30, 2014:
TETON Westwood Mighty Mites Fund
| | | | |
U.S. Government Obligations | | | 26.4 | % |
Health Care | | | 7.4 | % |
Diversified Industrial | | | 7.4 | % |
Equipment and Supplies | | | 5.6 | % |
Automotive: Parts and Accessories | | | 4.8 | % |
Financial Services | | | 4.7 | % |
Food and Beverage | | | 3.7 | % |
Business Services | | | 3.4 | % |
Computer Software and Services | | | 3.1 | % |
Electronics | | | 2.8 | % |
Aviation: Parts and Services | | | 2.5 | % |
Broadcasting | | | 2.4 | % |
Specialty Chemicals | | | 2.4 | % |
Restaurants | | | 2.3 | % |
Retail | | | 2.1 | % |
Hotels and Gaming | | | 2.1 | % |
Telecommunications | | | 1.8 | % |
Machinery | | | 1.8 | % |
Consumer Products | | | 1.5 | % |
Real Estate | | | 1.3 | % |
Metals and Mining | | | 1.3 | % |
Publishing | | | 1.1 | % |
Entertainment | | | 0.8 | % |
| | | | |
Building and Construction | | | 0.7 | % |
Energy and Utilities: Natural Gas | | | 0.7 | % |
Energy and Utilities: Services | | | 0.7 | % |
Consumer Services | | | 0.6 | % |
Energy and Utilities: Water | | | 0.6 | % |
Manufactured Housing and Recreational Vehicles | | | 0.5 | % |
Energy and Utilities: Oil | | | 0.4 | % |
Semiconductors | | | 0.4 | % |
Airlines | | | 0.4 | % |
Agriculture | | | 0.4 | % |
Energy and Utilities: Integrated | | | 0.4 | % |
Automotive | | | 0.4 | % |
Paper and Forest Products | | | 0.3 | % |
Environmental Control | | | 0.2 | % |
Educational Services | | | 0.2 | % |
Communications Equipment | | | 0.2 | % |
Transportation | | | 0.2 | % |
Aerospace and Defense | | | 0.1 | % |
Energy and Utilities: Alternative Energy | | | 0.1 | % |
Closed-End Business Development Company | | | 0.0 | % |
Other Assets and Liabilities (Net) | | | (0.2 | )% |
| | | | |
| | | 100.0 | % |
| | | | |
TETON Westwood SmallCap Equity Fund
| | | | |
Financial Services | | | 19.0 | % |
Computer Software and Services | | | 8.1 | % |
Business Services | | | 7.9 | % |
Energy and Utilities | | | 7.9 | % |
Semiconductors | | | 7.6 | % |
Health Care | | | 7.1 | % |
Diversified Industrial | | | 6.1 | % |
Retail | | | 5.9 | % |
Electronics | | | 5.3 | % |
Building and Construction | | | 4.3 | % |
Aerospace | | | 3.6 | % |
Equipment and Supplies | | | 3.2 | % |
| | | | |
Telecommunications | | | 3.1 | % |
Machinery | | | 2.8 | % |
U.S. Government Obligations | | | 2.6 | % |
Specialty Chemicals | | | 1.4 | % |
Metals and Mining | | | 1.0 | % |
Consumer Products | | | 1.0 | % |
Entertainment | | | 1.0 | % |
Computer Hardware | | | 1.0 | % |
Publishing | | | 0.2 | % |
Other Assets and Liabilities (Net) | | | (0.1 | )% |
| | | | |
| | | 100.0 | % |
| | | | |
TETON Westwood Mid-Cap Equity Fund
| | | | |
Financials | | | 18.3 | % |
Industrials | | | 16.7 | % |
Health Care | | | 16.4 | % |
Consumer Discretionary | | | 14.0 | % |
Information Technology | | | 12.0 | % |
Energy | | | 7.7 | % |
| | | | |
U.S. Government Obligations | | | 7.0 | % |
Consumer Staples | | | 4.0 | % |
Materials | | | 2.9 | % |
Utilities | | | 2.4 | % |
Other Assets and Liabilities (Net) | | | (1.4 | )% |
| | | | |
| | | 100.0 | % |
| | | | |
18
Summary of Portfolio Holdings (Unaudited) (Continued)
TETON Westwood Income Fund
| | | | |
Financial Services | | | 18.2 | % |
Health Care | | | 14.5 | % |
Energy and Utilities: Oil | | | 8.3 | % |
Retail | | | 6.8 | % |
Computer Hardware | | | 4.9 | % |
Diversified Industrial | | | 4.3 | % |
Metals and Mining | | | 3.6 | % |
Energy and Utilities: Services | | | 3.4 | % |
Electronics | | | 3.2 | % |
Energy and Utilities: Water | | | 3.1 | % |
Specialty Chemicals | | | 2.8 | % |
Automotive | | | 2.7 | % |
Paper and Forest Products | | | 2.6 | % |
Cable and Satellite | | | 2.5 | % |
Food and Beverage | | | 2.3 | % |
| | | | |
Energy and Utilities: Natural Gas | | | 2.1 | % |
Communications Equipment | | | 2.1 | % |
Machinery | | | 2.1 | % |
Telecommunications | | | 1.9 | % |
Real Estate Investment Trusts | | | 1.3 | % |
Pharmaceuticals | | | 1.2 | % |
Consumer Staples | | | 1.2 | % |
Environmental Services | | | 1.1 | % |
Services | | | 1.0 | % |
Computer Software and Services | | | 0.7 | % |
Agriculture | | | 0.6 | % |
Energy and Utilities: Integrated | | | 0.5 | % |
Other Assets and Liabilities (Net) | | | 1.0 | % |
| | | | |
| | | 100.0 | % |
| | | | |
TETON Westwood Equity Fund
| | | | |
Banking | | | 14.5 | % |
Health Care | | | 10.2 | % |
Financial Services | | | 6.9 | % |
Food and Beverage | | | 6.5 | % |
Retail | | | 6.3 | % |
Aerospace | | | 6.3 | % |
Energy: Oil | | | 5.8 | % |
Telecommunications | | | 5.1 | % |
Entertainment | | | 4.8 | % |
Communications Equipment | | | 3.8 | % |
Cable and Satellite | | | 3.7 | % |
Business Services | | | 3.5 | % |
Diversified Industrial | | | 3.1 | % |
Transportation | | | 2.2 | % |
| | | | |
Mutual Funds | | | 2.2 | % |
Computer Hardware | | | 2.1 | % |
Computer Software and Services | | | 2.0 | % |
Consumer Products | | | 2.0 | % |
Energy: Integrated | | | 1.9 | % |
Semiconductors | | | 1.9 | % |
Electronics | | | 1.8 | % |
Energy and Energy Services | | | 1.8 | % |
Consumer Services | | | 1.0 | % |
Energy: Natural Gas | | | 0.8 | % |
Other Assets and Liabilities (Net) | | | (0.2 | )% |
| | | | |
| | | 100.0 | % |
| | | | |
TETON Westwood Balanced Fund
| | | | |
Banking | | | 13.6 | % |
Energy: Oil | | | 7.4 | % |
U.S. Government Obligations | | | 6.8 | % |
Health Care | | | 6.4 | % |
Financial Services | | | 5.8 | % |
Mutual Funds | | | 5.1 | % |
Federal National Mortgage Association | | | 4.8 | % |
Federal Home Loan Mortgage Corp. | | | 4.6 | % |
Food and Beverage | | | 4.4 | % |
Retail | | | 3.9 | % |
Aerospace | | | 3.7 | % |
Telecommunications | | | 3.1 | % |
Entertainment | | | 3.0 | % |
Consumer Products | | | 2.9 | % |
Electronics | | | 2.9 | % |
Transportation | | | 2.9 | % |
| | | | |
Diversified Industrial | | | 2.8 | % |
Communications Equipment | | | 2.3 | % |
Cable and Satellite | | | 2.2 | % |
Computer Hardware | | | 2.0 | % |
Energy: Integrated | | | 1.5 | % |
Semiconductors | | | 1.4 | % |
Computer Software and Services | | | 1.2 | % |
Energy and Energy Services | | | 1.2 | % |
Equipment and Supplies | | | 1.2 | % |
Business Services | | | 1.1 | % |
Real Estate Investment Trusts | | | 0.8 | % |
Consumer Services | | | 0.8 | % |
Energy: Natural Gas | | | 0.7 | % |
Other Assets and Liabilities (Net) | | | (0.5 | )% |
| | | | |
| | | 100.0 | % |
| | | | |
TETON Westwood Intermediate Bond Fund
| | | | |
Corporate Bonds | | | 43.2 | % |
U.S. Government Agency Obligations | | | 32.0 | % |
U.S. Government Obligations | | | 17.6 | % |
| | | | |
Mutual Funds | | | 8.2 | % |
Other Assets and Liabilities (Net) | | | (1.0 | )% |
| | | | |
| | | 100.0 | % |
| | | | |
19
TETON Westwood Mighty Mites Fund
Schedule of Investments — September 30, 2014
| | | | | | | | | | |
Shares | | | | Cost | | | Market Value | |
| | COMMON STOCKS — 73.5% | |
| | Aerospace and Defense — 0.1% | | | | | |
170,794 | | Innovative Solutions & Support Inc.† | | $ | 749,930 | | | $ | 890,691 | |
37,500 | | Kratos Defense & Security Solutions Inc.† | | | 247,124 | | | | 246,000 | |
| | | | | | | | | | |
| | | | | 997,054 | | | | 1,136,691 | |
| | | | | | | | | | |
| | Agriculture — 0.4% | | | | | | | | |
| 225 | | J.G. Boswell Co. | | | 144,675 | | | | 240,187 | |
| 186,836 | | Limoneira Co. | | | 4,085,154 | | | | 4,426,145 | |
| | | | | | | | | | |
| | | | | 4,229,829 | | | | 4,666,332 | |
| | | | | | | | | | |
| | Airlines — 0.4% | | | | | | | | |
| 125,000 | | American Airlines Group Inc. | | | 57,608 | | | | 4,435,000 | |
| 225,000 | | American Airlines Group Inc., Escrow† | | | 3,288 | | | | 337,500 | |
| | | | | | | | | | |
| | | | | 60,896 | | | | 4,772,500 | |
| | | | | | | | | | |
| | Automotive — 0.4% | | | | | | | | |
| 27,200 | | Lithia Motors Inc., Cl. A | | | 517,533 | | | | 2,058,768 | |
| 66,500 | | Sonic Automotive Inc., Cl. A | | | 849,600 | | | | 1,629,915 | |
| 70,000 | | Wabash National Corp.† | | | 132,194 | | | | 932,400 | |
| | | | | | | | | | |
| | | | | 1,499,327 | | | | 4,621,083 | |
| | | | | | | | | | |
| | Automotive: Parts and Accessories — 4.7% | |
| 6,000 | | China Automotive Systems Inc. | | | 34,007 | | | | 55,080 | |
| 105,000 | | Dana Holding Corp. | | | 624,230 | | | | 2,012,850 | |
| 273,081 | | Federal-Mogul Holdings Corp.† | | | 2,970,836 | | | | 4,060,714 | |
| 27,800 | | Gentherm Inc.† | | | 404,618 | | | | 1,173,994 | |
| 196,600 | | Modine Manufacturing Co.† | | | 1,907,098 | | | | 2,333,642 | |
| 31,000 | | Motorcar Parts of America Inc.† | | | 407,454 | | | | 843,510 | |
| 60,000 | | Puradyn Filter Technologies Inc.† | | | 13,098 | | | | 13,794 | |
| 60,000 | | Shiloh Industries Inc.† | | | 811,170 | | | | 1,020,600 | |
| 182,200 | | Standard Motor Products Inc. | | | 1,773,700 | | | | 6,273,146 | |
| 197,000 | | Strattec Security Corp.(a) | | | 4,552,098 | | | | 16,025,950 | |
| 597,000 | | Superior Industries International Inc. | | | 10,793,277 | | | | 10,465,410 | |
| 37,000 | | Tenneco Inc.† | | | 115,032 | | | | 1,935,470 | |
| 1,030,070 | | The Pep Boys - Manny, Moe & Jack† | | | 11,534,718 | | | | 9,177,924 | |
| 104,565 | | Tower International Inc.† | | | 1,697,806 | | | | 2,633,992 | |
| 134,231 | | West Marine Inc.† | | | 1,576,523 | | | | 1,208,079 | |
| | | | | | | | | | |
| | | | | 39,215,665 | | | | 59,234,155 | |
| | | | | | | | | | |
| | Aviation: Parts and Services — 2.5% | |
| 13,500 | | Astronics Corp.† | | | 127,472 | | | | 643,680 | |
| 11,090 | | Astronics Corp., Cl. B† | | | 100,709 | | | | 526,794 | |
| 120,485 | | Ducommun Inc.† | | | 2,034,710 | | | | 3,302,494 | |
| 1,218,900 | | GenCorp Inc.† | | | 5,625,828 | | | | 19,465,833 | |
| 197,201 | | Kaman Corp. | | | 5,007,415 | | | | 7,749,999 | |
| | | | | | | | | | |
| | | | | 12,896,134 | | | | 31,688,800 | |
| | | | | | | | | | |
| | Broadcasting — 2.4% | | | | | | | | |
| 614,200 | | ACME Communications Inc. | | | 21,436 | | | | 26,103 | |
| 582,793 | | Beasley Broadcast Group Inc., Cl. A(a) | | | 3,140,886 | | | | 3,123,770 | |
| 131,400 | | Crown Media Holdings Inc., Cl. A† | | | 308,815 | | | | 420,480 | |
| 36,000 | | Cumulus Media Inc., Cl. A† | | | 166,178 | | | | 145,080 | |
| 88,700 | | Entercom Communications Corp., Cl. A† | | | 196,753 | | | | 712,261 | |
| 407,500 | | Gray Television Inc.† | | | 362,094 | | | | 3,211,100 | |
| 53,032 | | Gray Television Inc., Cl. A† | | | 279,898 | | | | 335,162 | |
| 153,366 | | LIN Media LLC, Cl. A† | | | 2,259,081 | | | | 3,404,725 | |
| 1,105,029 | | Media General Inc.† | | | 5,663,506 | | | | 14,486,930 | |
| | | | | | | | | | |
Shares | | | | Cost | | | Market Value | |
| 564,710 | | Salem Communications Corp., Cl. A | | $ | 3,017,174 | | | $ | 4,297,443 | |
| 33,000 | | Sinclair Broadcast Group Inc., Cl. A | | | 53,667 | | | | 860,970 | |
| | | | | | | | | | |
| | | | | 15,469,488 | | | | 31,024,024 | |
| | | | | | | | | | |
| | Building and Construction — 0.7% | |
| 253,163 | | Builders FirstSource Inc.† | | | 1,899,778 | | | | 1,379,738 | |
| 850,065 | | Huttig Building Products Inc.† | | | 953,284 | | | | 3,145,240 | |
| 107,074 | | MYR Group Inc.† | | | 2,422,367 | | | | 2,578,342 | |
| 500 | | Nortek Inc.† | | | 20,053 | | | | 37,250 | |
| 75,360 | | The Monarch Cement Co. | | | 1,915,213 | | | | 2,192,976 | |
| | | | | | | | | | |
| | | | | 7,210,695 | | | | 9,333,546 | |
| | | | | | | | | | |
| | Business Services — 3.4% | | | | | | | | |
| 237,808 | | ACCO Brands Corp.† | | | 1,640,532 | | | | 1,640,875 | |
| 194,679 | | Ascent Capital Group Inc., Cl. A† | | | 5,834,739 | | | | 11,719,676 | |
| 19,000 | | Cenveo Inc.† | | | 63,979 | | | | 46,930 | |
| 193 | | Du-Art Film Labs Inc.† | | | 33,105 | | | | 30,880 | |
| 692,272 | | Edgewater Technology Inc.†(a) | | | 2,188,004 | | | | 4,755,909 | |
| 50,000 | | Fortegra Financial Corp.† | | | 394,500 | | | | 494,500 | |
| 101,271 | | GP Strategies Corp.† | | | 928,058 | | | | 2,908,503 | |
| 23,300 | | ICF International Inc.† | | | 558,939 | | | | 717,407 | |
| 491,477 | | Internap Network Services Corp.† | | | 3,199,991 | | | | 3,391,191 | |
| 32,029 | | KAR Auction Services Inc. | | | 443,660 | | | | 916,990 | |
| 3,000 | | Landauer Inc. | | | 107,267 | | | | 99,030 | |
| 1,500 | | Liquidity Services Inc.† | | | 7,977 | | | | 20,625 | |
| 16,500 | | Macquarie Infrastructure Co. LLC | | | 269,338 | �� | | | 1,100,550 | |
| 10,608 | | Matthews International Corp., Cl. A | | | 466,646 | | | | 465,585 | |
| 23,000 | | McGrath RentCorp. | | | 616,374 | | | | 786,600 | |
| 482,016 | | ModusLink Global Solutions Inc.† | | | 1,923,836 | | | | 1,720,797 | |
| 30,000 | | Pendrell Corp.† | | | 48,782 | | | | 40,200 | |
| 188,172 | | PFSweb Inc.† | | | 835,090 | | | | 2,047,311 | |
| 401,375 | | PRGX Global Inc.† | | | 2,535,374 | | | | 2,352,058 | |
| 302,900 | | Pure Technologies Ltd. | | | 1,403,331 | | | | 2,185,305 | |
| 167,655 | | Safeguard Scientifics Inc.† | | | 3,304,759 | | | | 3,084,852 | |
| 84,000 | | Stamps.com Inc.† | | | 853,414 | | | | 2,667,840 | |
| 10,032 | | Trans-Lux Corp.† | | | 98,964 | | | | 77,748 | |
| | | | | | | | | | |
| | | | | 27,756,659 | | | | 43,271,362 | |
| | | | | | | | | | |
| | Closed-End Business Development Company — 0.0% | |
| 45,000 | | MVC Capital Inc. | | | 499,586 | | | | 484,200 | |
| | | | | | | | | | |
| | Communications Equipment — 0.2% | |
| 149,537 | | Communications Systems Inc. | | | 1,642,215 | | | | 1,668,833 | |
| 166,100 | | Extreme Networks Inc.† | | | 672,216 | | | | 795,619 | |
| 134,600 | | Sycamore Networks Inc. | | | 37,521 | | | | 46,841 | |
| 30,000 | | ViewCast.com Inc.† | | | 14,100 | | | | 123 | |
| | | | | | | | | | |
| | | | | 2,366,052 | | | | 2,511,416 | |
| | | | | | | | | | |
| | Computer Software and Services — 3.1% | |
| 40,000 | | Avid Technology Inc.† | | | 405,070 | | | | 404,000 | |
| 187,284 | | Blucora Inc.† | | | 3,253,467 | | | | 2,854,208 | |
| 331,400 | | Callidus Software Inc.† | | | 1,847,278 | | | | 3,983,428 | |
| 68,487 | | Carbonite Inc.† | | | 717,393 | | | | 701,307 | |
| 16,000 | | Cinedigm Corp., Cl. A† | | | 27,077 | | | | 24,800 | |
| 165,652 | | Computer Task Group Inc. | | | 2,042,779 | | | | 1,838,737 | |
| 28,100 | | Constant Contact Inc.† | | | 392,805 | | | | 762,634 | |
| 76,000 | | CyrusOne Inc. | | | 1,447,240 | | | | 1,827,040 | |
| 40,000 | | Daegis Inc.† | | | 49,529 | | | | 32,800 | |
| 22,000 | | Datawatch Corp.† | | | 540,645 | | | | 225,500 | |
| 110,419 | | Digital River Inc.† | | | 1,939,990 | | | | 1,603,284 | |
| 509,311 | | Dot Hill Systems Corp.† | | | 1,712,799 | | | | 1,925,196 | |
| 184,650 | | EarthLink Holdings Corp. | | | 727,661 | | | | 631,503 | |
| 115,000 | | Emulex Corp.† | | | 782,680 | | | | 568,100 | |
| 760,343 | | FalconStor Software Inc.† | | | 2,478,062 | | | | 874,394 | |
See accompanying notes to financial statements.
20
TETON Westwood Mighty Mites Fund
Schedule of Investments (Continued) — September 30, 2014
| | | | | | | | | | |
Shares | | | | Cost | | | Market Value | |
| |
| | COMMON STOCKS (Continued) | |
| | Computer Software and Services (Continued) | |
| 503,161 | | Furmanite Corp.† | | $ | 3,188,805 | | | $ | 3,401,368 | |
| 1,410 | | Gemalto NV | | | 8,172 | | | | 129,437 | |
| 889,238 | | Global Sources Ltd.† | | | 6,442,627 | | | | 5,966,787 | |
| 25,000 | | GSE Systems Inc.† | | | 136,805 | | | | 39,000 | |
| 636,450 | | Guidance Software Inc.† | | | 5,280,999 | | | | 4,283,308 | |
| 144,117 | | iGO Inc.† | | | 484,026 | | | | 461,174 | |
| 458,356 | | Lionbridge Technologies Inc.† | | | 1,640,566 | | | | 2,062,602 | |
| 29,500 | | Mercury Systems Inc.† | | | 166,227 | | | | 324,795 | |
| 67,500 | | Mitek Systems Inc.† | | | 199,734 | | | | 162,675 | |
| 20,000 | | Move Inc.† | | | 418,644 | | | | 419,200 | |
| 5,802 | | MTS Systems Corp. | | | 265,634 | | | | 396,045 | |
| 12,000 | | Qualstar Corp.† | | | 17,642 | | | | 14,520 | |
| 188,932 | | Qumu Corp.† | | | 2,298,499 | | | | 2,456,116 | |
| 356,200 | | Speed Commerce Inc.† | | | 1,034,145 | | | | 979,550 | |
| 3,800 | | Tyler Technologies Inc.† | | | 39,378 | | | | 335,920 | |
| | | | | | | | | | |
| | | | | 39,986,378 | | | | 39,689,428 | |
| | | | | | | | | | |
| | Consumer Products — 1.5% | | | | | | | | |
| 155,070 | | Bassett Furniture Industries Inc. | | | 2,268,715 | | | | 2,118,256 | |
| 143,000 | | Blyth Inc. | | | 1,835,023 | | | | 1,161,160 | |
| 2,000 | | Brunswick Corp. | | | 30,085 | | | | 84,280 | |
| 55,687 | | Callaway Golf Co. | | | 383,296 | | | | 403,174 | |
| 10,000 | | Elizabeth Arden Inc.† | | | 153,306 | | | | 167,400 | |
| 3,500 | | Johnson Outdoors Inc., Cl. A | | | 29,026 | | | | 90,650 | |
| 11,400 | | Lakeland Industries Inc.† | | | 109,829 | | | | 79,230 | |
| 1,262,342 | | Marine Products Corp. | | | 8,496,293 | | | | 9,959,878 | |
| 13,000 | | MarineMax Inc.† | | | 63,807 | | | | 219,050 | |
| 200 | | National Presto Industries Inc. | | | 5,745 | | | | 12,142 | |
| 91,931 | | Nautilus Inc.† | | | 688,912 | | | | 1,100,414 | |
| 129,300 | | Oil-Dri Corp. of America | | | 2,299,864 | | | | 3,370,851 | |
| 5,700 | | PC Group Inc.† | | | 3,465 | | | | 125 | |
| 10,400 | | Syratech Corp.† | | | 2,600 | | | | 31 | |
| 286,636 | | The Wet Seal Inc., Cl. A† | | | 943,823 | | | | 150,627 | |
| 119,200 | | ValueVision Media Inc., Cl. A† | | | 546,447 | | | | 611,496 | |
| | | | | | | | | | |
| | | | | 17,860,236 | | | | 19,528,764 | |
| | | | | | | | | | |
| | Consumer Services — 0.6% | | | | | | | | |
| 508,804 | | 1-800-FLOWERS.COM Inc., Cl. A† | | | 1,494,779 | | | | 3,658,301 | |
| 41,000 | | Bowlin Travel Centers Inc.† | | | 50,022 | | | | 57,810 | |
| 800 | | Collectors Universe Inc. | | | 396 | | | | 17,600 | |
| 60,025 | | Liberty Tax Inc.† | | | 1,064,639 | | | | 1,938,807 | |
| 372,891 | | Martha Stewart Living Omnimedia Inc., Cl. A† | | | 1,593,749 | | | | 1,342,408 | |
| 72,905 | | XO Group Inc.† | | | 708,786 | | | | 817,265 | |
| | | | | | | | | | |
| | | | | 4,912,371 | | | | 7,832,191 | |
| | | | | | | | | | |
| | Diversified Industrial — 7.2% | | | | | | | | |
| 20,000 | | A.M. Castle & Co.† | | | 219,152 | | | | 170,800 | |
| 70,292 | | AEP Industries Inc.† | | | 3,310,548 | | | | 2,661,958 | |
| 9,292 | | American Railcar Industries Inc. | | | 147,177 | | | | 686,865 | |
| 313,899 | | Ampco-Pittsburgh Corp. | | | 7,182,783 | | | | 6,277,980 | |
| 189,342 | | Burnham Holdings Inc., Cl. A(a) | | | 2,835,864 | | | | 3,483,893 | |
| 121,122 | | Chase Corp. | | | 1,699,081 | | | | 3,769,317 | |
| 115,800 | | Columbus McKinnon Corp. | | | 1,904,076 | | | | 2,546,442 | |
| 265,292 | | FormFactor Inc.† | | | 1,607,344 | | | | 1,902,144 | |
| 33,000 | | Graham Corp. | | | 534,517 | | | | 948,750 | |
| 371,703 | | Griffon Corp. | | | 4,021,425 | | | | 4,233,697 | |
| 9,927 | | Handy & Harman Ltd.† | | | 254,270 | | | | 260,683 | |
| 25,000 | | Haulotte Group SA | | | 134,090 | | | | 389,969 | |
| 22,300 | | Haynes International Inc. | | | 1,098,402 | | | | 1,025,577 | |
| 5,000 | | Impreglon SE | | | 95,694 | | | | 90,340 | |
| 312,698 | | Insignia Systems Inc.† | | | 907,605 | | | | 959,983 | |
| 93,749 | | John Bean Technologies Corp. | | | 2,748,399 | | | | 2,637,159 | |
| 265,792 | | Katy Industries Inc.† | | | 286,409 | | | | 374,767 | |
| | | | | | | | | | |
Shares | | | | Cost | | | Market Value | |
| | | |
| 33,380 | | L.B. Foster Co., Cl. A | | $ | 1,225,035 | | | $ | 1,533,477 | |
| 246,099 | | Lawson Products Inc.† | | | 3,380,364 | | | | 5,485,547 | |
| 176,449 | | Lydall Inc.† | | | 1,696,229 | | | | 4,765,887 | |
| 75,255 | | Magnetek Inc.† | | | 1,376,963 | | | | 2,354,729 | |
| 11,800 | | MSA Safety Inc. | | | 367,269 | | | | 582,920 | |
| 480,356 | | Myers Industries Inc. | | | 5,956,756 | | | | 8,473,480 | |
| 97,158 | | NAPCO Security Technologies Inc.† | | | 537,572 | | | | 456,643 | |
| 147,000 | | Park-Ohio Holdings Corp. | | | 2,664,259 | | | | 7,035,420 | |
| 67,571 | | Raven Industries Inc. | | | 1,955,578 | | | | 1,648,732 | |
| 66,666 | | Rubicon Ltd.† | | | 37,762 | | | | 18,996 | |
| 17,900 | | RWC Inc.† | | | 296,129 | | | | 223,840 | |
| 465,564 | | Sevcon Inc.†(a) | | | 2,608,573 | | | | 3,794,347 | |
| 28,000 | | Standex International Corp. | | | 928,588 | | | | 2,075,920 | |
| 480,226 | | Steel Partners Holdings LP† | | | 7,605,431 | | | | 7,976,554 | |
| 196,956 | | Tredegar Corp. | | | 3,810,005 | | | | 3,625,960 | |
| 269,134 | | Twin Disc Inc. | | | 5,902,060 | | | | 7,255,853 | |
| 108,381 | | Vishay Precision Group Inc.† | | | 1,778,303 | | | | 1,619,212 | |
| | | | | | | | | | |
| | | | | 71,113,712 | | | | 91,347,841 | |
| | | | | | | | | | |
| | Educational Services — 0.2% | | | | | | | | |
| 187,587 | | Corinthian Colleges Inc.† | | | 188,970 | | | | 20,728 | |
| 290,336 | | Universal Technical Institute Inc. | | | 5,039,895 | | | | 2,714,642 | |
| | | | | | | | | | |
| | | | | 5,228,865 | | | | 2,735,370 | |
| | | | | | | | | | |
| | Electronics — 2.8% | | | | | | | | |
| 33,000 | | Alliance Semiconductor Corp.† | | | 66,300 | | | | 26,400 | |
| 14,000 | | Badger Meter Inc. | | | 477,554 | | | | 706,300 | |
| 132,347 | | Bel Fuse Inc., Cl. A(a) | | | 2,503,628 | | | | 3,119,419 | |
| 55,000 | | BTU International Inc.† | | | 219,541 | | | | 178,750 | |
| 342,500 | | CTS Corp. | | | 2,816,345 | | | | 5,442,325 | |
| 52,000 | | Daktronics Inc. | | | 527,159 | | | | 639,080 | |
| 151,867 | | Dialight plc | | | 1,836,479 | | | | 2,218,241 | |
| 49,789 | | Electro Scientific Industries Inc. | | | 507,868 | | | | 338,067 | |
| 34,000 | | IMAX Corp.† | | | 143,748 | | | | 933,640 | |
| 20,000 | | Iteris Inc.† | | | 32,200 | | | | 35,000 | |
| 105,000 | | Kopin Corp.† | | | 365,260 | | | | 357,000 | |
| 43,500 | | Mesa Laboratories Inc. | | | 1,122,942 | | | | 2,513,430 | |
| 38,800 | | Methode Electronics Inc. | | | 213,618 | | | | 1,430,556 | |
| 329,633 | | MOCON Inc.(a) | | | 4,695,211 | | | | 4,921,421 | |
| 52,100 | | MoSys Inc.† | | | 150,654 | | | | 126,082 | |
| 64,800 | | Newport Corp.† | | | 419,585 | | | | 1,148,256 | |
| 51,200 | | Park Electrochemical Corp. | | | 946,862 | | | | 1,205,760 | |
| 70,000 | | Pericom Semiconductor Corp.† | | | 699,279 | | | | 681,800 | |
| 10,000 | | Pulse Electronics Corp.† | | | 50,853 | | | | 13,500 | |
| 82,074 | | Rofin-Sinar Technologies Inc.† | | | 1,923,230 | | | | 1,892,626 | |
| 78,000 | | Schmitt Industries Inc.† | | | 210,348 | | | | 250,380 | |
| 6,776 | | Sparton Corp.† | | | 77,815 | | | | 167,028 | |
| 272,020 | | Stoneridge Inc.† | | | 1,408,646 | | | | 3,065,665 | |
| 157,000 | | Ultra Clean Holdings† | | | 478,219 | | | | 1,405,150 | |
| 109,198 | | Ultralife Corp.† | | | 437,808 | | | | 353,802 | |
| 99,500 | | Ultratech Inc.† | | | 1,819,137 | | | | 2,263,625 | |
| | | | | | | | | | |
| | | | | 24,150,289 | | | | 35,433,303 | |
| | | | | | | | | | |
| | Energy and Utilities: Alternative Energy — 0.1% | |
| 34,200 | | JA Solar Holdings Co. Ltd., ADR† | | | 300,114 | | | | 316,350 | |
| 234,400 | | Real Goods Solar Inc., Cl. A† | | | 889,176 | | | | 403,168 | |
| | | | | | | | | | |
| | | | | 1,189,290 | | | | 719,518 | |
| | | | | | | | | | |
| | Energy and Utilities: Integrated — 0.4% | |
| 134,475 | | Broadwind Energy Inc.† | | | 767,979 | | | | 1,007,218 | |
| 159,500 | | Headwaters Inc.† | | | 656,007 | | | | 2,000,130 | |
| 44,000 | | MGE Energy Inc. | | | 1,025,270 | | | | 1,639,440 | |
| | | | | | | | | | |
| | | | | 2,449,256 | | | | 4,646,788 | |
| | | | | | | | | | |
See accompanying notes to financial statements.
21
TETON Westwood Mighty Mites Fund
Schedule of Investments (Continued) — September 30, 2014
| | | | | | | | | | |
Shares | | | | Cost | | | Market Value | |
| | COMMON STOCKS (Continued) | |
| | Energy and Utilities: Natural Gas — 0.7% | |
| 71,554 | | Abraxas Petroleum Corp.† | | $ | 291,491 | | | $ | 377,805 | |
| 220,000 | | Alvopetro Energy Ltd.† | | | 225,907 | | | | 127,684 | |
| 5,700 | | American DG Energy Inc.† | | | 10,614 | | | | 6,555 | |
| 45,750 | | Chesapeake Utilities Corp. | | | 852,042 | | | | 1,905,945 | |
| 90,570 | | Corning Natural Gas Holding Co. | | | 1,015,904 | | | | 1,947,255 | |
| 103,000 | | Delta Natural Gas Co. Inc. | | | 1,564,014 | | | | 2,036,310 | |
| 17,200 | | Gas Natural Inc. | | | 172,240 | | | | 203,132 | |
| 95,800 | | Gastar Exploration Inc.† | | | 406,048 | | | | 562,346 | |
| 15,000 | | Piedmont Natural Gas Co. Inc. | | | 530,578 | | | | 502,950 | |
| 41,400 | | RGC Resources Inc. | | | 517,196 | | | | 823,860 | |
| 16,000 | | U.S. Energy Corp.† | | | 58,970 | | | | 51,040 | |
| 10,928 | | Whitecap Resources Inc. | | | 92,690 | | | | 156,414 | |
| | | | | | | | | | |
| | | | | 5,737,694 | | | | 8,701,296 | |
| | | | | | | | | | |
| | Energy and Utilities: Oil — 0.4% | | | | | |
| 194,844 | | Callon Petroleum Co.† | | | 1,328,335 | | | | 1,716,576 | |
| 24,334 | | Halcon Resources Corp.† | | | 137,638 | | | | 96,363 | |
| 10,900 | | Mitcham Industries Inc.† | | | 173,694 | | | | 120,445 | |
| 61,900 | | Tesco Corp. | | | 531,686 | | | | 1,228,715 | |
| 197,600 | | Triangle Petroleum Corp.† | | | 1,473,400 | | | | 2,175,576 | |
| | | | | | | | | | |
| | | | | 3,644,753 | | | | 5,337,675 | |
| | | | | | | | | | |
| | Energy and Utilities: Services — 0.7% | |
| 28,000 | | Archer Ltd.† | | | 94,653 | | | | 39,310 | |
| 30,000 | | Bolt Technology Corp. | | | 658,069 | | | | 658,200 | |
| 8,352 | | Dawson Geophysical Co. | | | 147,079 | | | | 151,839 | |
| 25,300 | | Flotek Industries Inc.† | | | 279,150 | | | | 659,571 | |
| 16,671 | | Gulf Island Fabrication Inc. | | | 441,878 | | | | 286,741 | |
| 173,287 | | Layne Christensen Co.† | | | 2,618,653 | | | | 1,682,617 | |
| 226,316 | | Pike Corp.† | | | 2,351,481 | | | | 2,690,897 | |
| 92,500 | | RPC Inc. | | | 218,733 | | | | 2,031,300 | |
| 7,100 | | Subsea 7 SA, ADR | | | 25,056 | | | | 100,962 | |
| 11,000 | | TGC Industries Inc.† | | | 76,188 | | | | 42,350 | |
| | | | | | | | | | |
| | | | | 6,910,940 | | | | 8,343,787 | |
| | | | | | | | | | |
| | Energy and Utilities: Water — 0.6% | |
| 22,726 | | Artesian Resources Corp., Cl. A | | | 449,265 | | | | 457,702 | |
| 44,174 | | Cadiz Inc.† | | | 515,735 | | | | 458,968 | |
| 24,800 | | California Water Service Group | | | 478,223 | | | | 556,512 | |
| 4,000 | | Connecticut Water Service Inc. | | | 135,142 | | | | 130,000 | |
| 65,000 | | Consolidated Water Co. Ltd. | | | 703,929 | | | | 759,200 | |
| 80,000 | | Energy Recovery Inc.† | | | 361,031 | | | | 283,200 | |
| 30,433 | | Middlesex Water Co. | | | 587,770 | | | | 596,487 | |
| 10,000 | | Mueller Water Products Inc., Cl. A | | | 88,100 | | | | 82,800 | |
| 111,304 | | SJW Corp. | | | 2,672,607 | | | | 2,990,738 | |
| 44,537 | | The York Water Co. | | | 726,093 | | | | 890,740 | |
| | | | | | | | | | |
| | | | | 6,717,895 | | | | 7,206,347 | |
| | | | | | | | | | |
| | Entertainment — 0.8% | | | | | |
| 91,887 | | Canterbury Park Holding Corp.† | | | 968,812 | | | | 938,166 | |
| 604,556 | | Dover Motorsports Inc. | | | 1,481,554 | | | | 1,396,524 | |
| 724,641 | | Entravision Communications Corp., Cl. A | | | 1,815,656 | | | | 2,869,578 | |
| 12,000 | | RealD Inc.† | | | 134,824 | | | | 112,440 | |
| 20,000 | | Rentrak Corp.† | | | 975,859 | | | | 1,218,800 | |
| 50,009 | | RLJ Entertainment Inc.† | | | 249,678 | | | | 193,535 | |
| 268,804 | | World Wrestling Entertainment Inc., Cl. A | | | 3,017,056 | | | | 3,701,431 | |
| | | | | | | | | | |
| | | | | 8,643,439 | | | | 10,430,474 | |
| | | | | | | | | | |
| | Environmental Control — 0.2% | | | | | |
| 7,500 | | BioteQ Environmental Technologies Inc.† | | | 12,419 | | | | 301 | |
| | | | | | | | | | |
Shares | | | | Cost | | | Market Value | |
| 471,606 | | Casella Waste Systems Inc., Cl. A† | | $ | 2,240,525 | | | $ | 1,815,683 | |
| 15,718 | | Ceco Environmental Corp. | | | 225,420 | | | | 210,621 | |
| 107,700 | | Hudson Technologies Inc.† | | | 387,751 | | | | 356,487 | |
| 48,859 | | Nuverra Environmental Solutions Inc.† | | | 1,124,325 | | | | 720,670 | |
| | | | | | | | | | |
| | | | | 3,990,440 | | | | 3,103,762 | |
| | | | | | | | | | |
| | Equipment and Supplies — 5.6% | | | | | |
| 20,000 | | AZZ Inc. | | | 716,820 | | | | 835,400 | |
| 10,000 | | Blount International Inc.† | | | 131,820 | | | | 151,300 | |
| 353,000 | | Capstone Turbine Corp.† | | | 423,087 | | | | 377,710 | |
| 144,100 | | CIRCOR International Inc. | | | 4,735,618 | | | | 9,702,253 | |
| 356,890 | | Core Molding Technologies Inc.† | | | 1,749,373 | | | | 5,060,700 | |
| 704,009 | | Federal Signal Corp. | | | 4,911,250 | | | | 9,321,079 | |
| 300,000 | | GrafTech International Ltd.† | | | 1,594,084 | | | | 1,374,000 | |
| 510,000 | | Interpump Group SpA | | | 3,677,985 | | | | 6,399,720 | |
| 430,033 | | Kimball International Inc., Cl. B | | | 6,594,786 | | | | 6,471,997 | |
| 20,000 | | Maezawa Kyuso Industries Co. Ltd. | | | 108,117 | | | | 243,264 | |
| 20,103 | | Powell Industries Inc. | | | 750,311 | | | | 821,409 | |
| 270,600 | | SL Industries Inc.†(a) | | | 2,902,278 | | | | 13,210,692 | |
| 91,059 | | The Eastern Co. | | | 1,437,146 | | | | 1,455,123 | |
| 106,000 | | The Gorman-Rupp Co. | | | 2,340,035 | | | | 3,184,240 | |
| 41,800 | | The Greenbrier Companies Inc. | | | 866,098 | | | | 3,067,284 | |
| 318,700 | | The L.S. Starrett Co., Cl. A(a) | | | 3,739,325 | | | | 4,410,808 | |
| 109,933 | | Titan Machinery Inc.† | | | 1,834,250 | | | | 1,428,030 | |
| 139,000 | | TransAct Technologies Inc. | | | 626,680 | | | | 936,860 | |
| 257,591 | | Vicor Corp.† | | | 1,727,228 | | | | 2,421,355 | |
| | | | | | | | | | |
| | | | | 40,866,291 | | | | 70,873,224 | |
| | | | | | | | | | |
| | Financial Services — 4.7% | | | | | | | | |
| 49,400 | | Anchor Bancorp.† | | | 508,737 | | | | 1,003,808 | |
| 20,000 | | Atlantic American Corp. | | | 75,277 | | | | 79,600 | |
| 60,500 | | BBCN Bancorp Inc. | | | 615,050 | | | | 882,695 | |
| 13,000 | | Berkshire Bancorp Inc. | | | 187,482 | | | | 110,110 | |
| 3,900 | | Berkshire Hills Bancorp Inc. | | | 78,058 | | | | 91,611 | |
| 500 | | BKF Capital Group Inc.† | | | 555 | | | | 707 | |
| 75 | | Burke & Herbert Bank and Trust Co. | | | 95,726 | | | | 165,000 | |
| 4 | | Capital Financial Holdings Inc.† | | | 35,200 | | | | 7,950 | |
| 6,791 | | Capitol Federal Financial Inc. | | | 75,244 | | | | 80,270 | |
| 18,200 | | Citizens & Northern Corp. | | | 357,816 | | | | 345,800 | |
| 102,339 | | CoBiz Financial Inc. | | | 1,159,544 | | | | 1,144,150 | |
| 28,800 | | Crazy Woman Creek Bancorp Inc.† | | | 497,983 | | | | 318,960 | |
| 22,100 | | Dime Community Bancshares Inc. | | | 368,196 | | | | 318,240 | |
| 540 | | Farmers & Merchants Bank of Long Beach | | | 2,650,790 | | | | 3,221,100 | |
| 11,218 | | Fidelity Southern Corp. | | | 67,779 | | | | 153,687 | |
| 32,000 | | First Internet Bancorp | | | 661,348 | | | | 515,840 | |
| 547,600 | | Flushing Financial Corp. | | | 8,756,664 | | | | 10,004,652 | |
| 10 | | Guaranty Corp., Cl. A† | | | 137,500 | | | | 500,000 | |
| 179,860 | | Hallmark Financial Services Inc.† | | | 1,565,758 | | | | 1,854,357 | |
| 6,600 | | Hampden Bancorp Inc. | | | 75,984 | | | | 113,454 | |
| 16,000 | | Hancock Holding Co. | | | 200,587 | | | | 512,800 | |
| 13,800 | | Heritage Commerce Corp. | | | 114,043 | | | | 113,298 | |
| 39,900 | | Heritage Financial Group Inc. | | | 414,190 | | | | 805,581 | |
| 72,554 | | Hudson Valley Holding Corp. | | | 1,369,778 | | | | 1,316,855 | |
| 22,500 | | JMP Group Inc. | | | 169,614 | | | | 141,075 | |
| 90,843 | | KKR & Co. LP | | | 265,210 | | | | 2,025,799 | |
| 11,200 | | Meadowbrook Insurance Group Inc. | | | 108,657 | | | | 65,520 | |
| 100,000 | | Medallion Financial Corp. | | | 832,118 | | | | 1,166,000 | |
See accompanying notes to financial statements.
22
TETON Westwood Mighty Mites Fund
Schedule of Investments (Continued) — September 30, 2014
| | | | | | | | | | | | |
Shares | | | | | Cost | | | Market Value | |
| | | | COMMON STOCKS (Continued) | |
| | | | Financial Services (Continued) | |
| | 8,255 | | | New York Community Bancorp Inc. | | $ | 104,605 | | | $ | 131,007 | |
| | 4,197 | | | Northrim BanCorp Inc. | | | 91,497 | | | | 110,927 | |
| | 21,300 | | | OceanFirst Financial Corp. | | | 395,540 | | | | 338,883 | |
| | 40,000 | | | Oritani Financial Corp. | | | 412,856 | | | | 563,600 | |
| | 150,000 | | | Pzena Investment Management Inc., Cl. A | | | 1,330,456 | | | | 1,432,500 | |
| | 1,696 | | | Security National Corp. | | | 142,785 | | | | 150,096 | |
| | 8,842 | | | SI Financial Group Inc. | | | 101,241 | | | | 98,942 | |
| | 30,000 | | | Simplicity Bancorp Inc. | | | 300,000 | | | | 504,000 | |
| | 20,594 | | | Southwest Bancorp Inc. | | | 370,915 | | | | 337,742 | |
| | 600,000 | | | Sprott Inc. | | | 1,753,102 | | | | 1,521,496 | |
| | 20,700 | | | State Bank Financial Corp. | | | 357,067 | | | | 336,168 | |
| | 460,870 | | | Steel Excel Inc.† | | | 13,225,582 | | | | 15,093,493 | |
| | 12,000 | | | Sterling Bancorp | | | 150,728 | | | | 153,480 | |
| | 12 | | | Sunwest Bank† | | | 343,901 | | | | 495,600 | |
| | 307,876 | | | SWS Group Inc.† | | | 1,940,159 | | | | 2,121,266 | |
| | 16,000 | | | The Ziegler Companies Inc.† | | | 356,491 | | | | 512,000 | |
| | 60,000 | | | TheStreet Inc. | | | 146,981 | | | | 134,400 | |
| | 22,500 | | | Tree.com Inc.† | | | 498,800 | | | | 807,525 | |
| | 55,000 | | | TrustCo Bank Corp NY | | | 253,000 | | | | 354,200 | |
| | 124,400 | | | United Financial Bancorp Inc. | | | 1,713,218 | | | | 1,578,636 | |
| | 33,089 | | | Value Line Inc. | | | 326,193 | | | | 528,431 | |
| | 45,900 | | | Washington Trust Bancorp Inc. | | | 1,029,683 | | | | 1,514,241 | |
| | 82,200 | | | Waterstone Financial Inc. | | | 876,303 | | | | 949,410 | |
| | 87,100 | | | Westfield Financial Inc. | | | 746,912 | | | | 614,926 | |
| | 28,500 | | | Wilshire Bancorp Inc. | | | 246,078 | | | | 263,055 | |
| | 40,000 | | | WisdomTree Investments Inc.† | | | 162,546 | | | | 455,200 | |
| | 402,800 | | | Wright Investors’ Service Holdings Inc.† | | | 625,586 | | | | 700,872 | |
| | 30,000 | | | Xenith Bankshares Inc.† | | | 127,500 | | | | 192,750 | |
| | | | | | | | | | | | |
| | | | | | | 49,574,613 | | | | 59,053,765 | |
| | | | | | | | | | | | |
| | | | Food and Beverage — 3.7% | |
| | 29,200 | | | Andrew Peller Ltd., Cl. A | | | 366,944 | | | | 380,660 | |
| | 30,000 | | | Annie’s Inc.† | | | 1,373,429 | | | | 1,377,000 | |
| | 508,973 | | | Boulder Brands Inc.† | | | 4,567,329 | | | | 6,937,302 | |
| | 149,814 | | | Calavo Growers Inc. | | | 3,927,953 | | | | 6,762,604 | |
| | 500,000 | | | Crimson Wine Group Ltd.† | | | 4,546,647 | | | | 4,585,000 | |
| | 80,000 | | | Diamond Foods Inc.† | | | 1,555,687 | | | | 2,288,800 | |
| | 90,286 | | | Farmer Brothers Co.† | | | 1,200,733 | | | | 2,613,780 | |
| | 1,100 | | | Hanover Foods Corp., Cl. A | | | 110,881 | | | | 131,450 | |
| | 192,794 | | | Inventure Foods Inc.† | | | 1,107,966 | | | | 2,498,610 | |
| | 1,500 | | | J & J Snack Foods Corp. | | | 21,623 | | | | 140,340 | |
| | 172,808 | | | Lifeway Foods Inc.† | | | 1,758,103 | | | | 2,396,847 | |
| | 25,000 | | | MGP Ingredients Inc. | | | 129,112 | | | | 326,750 | |
| | 7,800 | | | Rock Field Co. Ltd. | | | 125,557 | | | | 138,042 | |
| | 5,900 | | | Scheid Vineyards Inc., Cl. A† | | | 89,940 | | | | 199,951 | |
| | 163,000 | | | Snyder’s-Lance Inc. | | | 3,512,561 | | | | 4,319,500 | |
| | 315,265 | | | SunOpta Inc.† | | | 2,481,094 | | | | 3,805,249 | |
| | 13,500 | | | The Boston Beer Co. Inc., Cl. A† | | | 402,274 | | | | 2,993,760 | |
| | 40,000 | | | The Hain Celestial Group Inc.† | | | 827,229 | | | | 4,094,000 | |
| | 270,000 | | | Tingyi (Cayman Islands) Holding Corp. | | | 393,787 | | | | 709,350 | |
| | 280,000 | | | Vitasoy International Holdings Ltd. | | | 133,057 | | | | 356,633 | |
| | 23,000 | | | Willamette Valley Vineyards Inc.† | | | 88,087 | | | | 126,960 | |
| | | | | | | | | | | | |
| | | | | | | 28,719,993 | | | | 47,182,588 | |
| | | | | | | | | | | | |
| | | | Health Care — 7.4% | | | | | | | | |
| | 32,960 | | | Accuray Inc.† | | | 244,893 | | | | 239,290 | |
| | 2,362 | | | AcelRx Pharmaceuticals Inc.† | | | 21,558 | | | | 12,967 | |
| | 5,000 | | | Achillion Pharmaceuticals Inc.† | | | 19,520 | | | | 49,900 | |
| | | | | | | | | | | | |
Shares | | | | | Cost | | | Market Value | |
| | 13,000 | | | Alere Inc.† | | $ | 350,377 | | | $ | 504,140 | |
| | 36,000 | | | AngioDynamics Inc.† | | | 449,286 | | | | 493,920 | |
| | 80,000 | | | ArthroCare Corp. Stub† | | | 0 | | | | 28,000 | |
| | 342,341 | | | Biolase Inc.† | | | 450,242 | | | | 852,429 | |
| | 72,000 | | | Bio-Reference Laboratories Inc.† | | | 1,539,889 | | | | 2,020,320 | |
| | 832,519 | | | BioScrip Inc.† | | | 6,155,142 | | | | 5,752,706 | |
| | 107,000 | | | BioTelemetry Inc.† | | | 539,912 | | | | 717,970 | |
| | 9,000 | | | Boiron SA | | | 151,225 | | | | 751,961 | |
| | 561,826 | | | Cantel Medical Corp. | | | 5,807,319 | | | | 19,315,578 | |
| | 24,000 | | | Cardica Inc.† | | | 68,810 | | | | 25,680 | |
| | 89,100 | | | Cardiovascular Systems Inc.† | | | 1,317,825 | | | | 2,105,433 | |
| | 62,500 | | | Cepheid Inc.† | | | 595,116 | | | | 2,751,875 | |
| | 354,000 | | | Cutera Inc.† | | | 3,129,613 | | | | 3,575,400 | |
| | 5,144 | | | Cynosure Inc., Cl. A† | | | 121,200 | | | | 108,024 | |
| | 3,500 | | | DexCom Inc.† | | | 37,449 | | | | 139,965 | |
| | 161,300 | | | Exactech Inc.† | | | 2,757,802 | | | | 3,692,157 | |
| | 200,000 | | | Exelixis Inc.† | | | 381,000 | | | | 306,000 | |
| | 160,000 | | | Gentiva Health Services Inc.† | | | 1,794,183 | | | | 2,684,800 | |
| | 41,049 | | | Heska Corp.† | | | 395,858 | | | | 541,436 | |
| | 4,022 | | | ICU Medical Inc.† | | | 208,829 | | | | 258,132 | |
| | 633,835 | | | InfuSystems Holdings Inc.† | | | 1,649,886 | | | | 1,990,242 | |
| | 184,617 | | | IntriCon Corp.† | | | 749,012 | | | | 1,105,856 | |
| | 221,970 | | | Invacare Corp. | | | 4,093,040 | | | | 2,621,466 | |
| | 37,000 | | | Lexicon Pharmaceuticals Inc.† | | | 65,829 | | | | 52,170 | |
| | 377,397 | | | Liberator Medical Holdings Inc. | | | 1,354,166 | | | | 1,181,253 | |
| | 153,850 | | | Medical Action Industries Inc.† | | | 1,073,547 | | | | 2,120,053 | |
| | 134,000 | | | Meridian Bioscience Inc. | | | 2,768,466 | | | | 2,370,460 | |
| | 126,750 | | | Neogen Corp.† | | | 522,230 | | | | 5,006,625 | |
| | 161,407 | | | NeoGenomics Inc.† | | | 473,398 | | | | 840,930 | |
| | 179,611 | | | Nutraceutical International Corp.† | | | 4,424,687 | | | | 3,755,666 | |
| | 44,612 | | | Omnicell Inc.† | | | 732,122 | | | | 1,219,246 | |
| | 50,000 | | | OPKO Health Inc.† | | | 108,408 | | | | 425,500 | |
| | 38,200 | | | Orthofix International NV† | | | 715,836 | | | | 1,182,672 | |
| | 105,991 | | | Pain Therapeutics Inc.† | | | 355,444 | | | | 414,425 | |
| | 76,500 | | | PhotoMedex Inc.† | | | 1,010,755 | | | | 474,300 | |
| | 2,500 | | | PreMD Inc.† | | | 4,580 | | | | 0 | |
| | 147,061 | | | Quidel Corp.† | | | 1,709,110 | | | | 3,951,529 | |
| | 68,000 | | | RTI Surgical Inc.† | | | 352,328 | | | | 325,040 | |
| | 44,200 | | | Skilled Healthcare Group Inc., Cl. A† | | | 374,381 | | | | 291,720 | |
| | 213,900 | | | Special Diversified Opportunities Inc.† | | | 207,526 | | | | 256,680 | |
| | 281,831 | | | SurModics Inc.† | | | 6,070,145 | | | | 5,118,051 | |
| | 101,249 | | | Syneron Medical Ltd.† | | | 885,583 | | | | 1,014,515 | |
| | 2,000 | | | Targanta Therapeutics Corp., Escrow† | | | 0 | | | | 640 | |
| | 137,000 | | | Trinity Biotech plc, ADR | | | 1,389,648 | | | | 2,502,990 | |
| | 74,700 | | | United-Guardian Inc. | | | 656,817 | | | | 1,668,051 | |
| | 7,000 | | | Uroplasty Inc.† | | | 23,918 | | | | 17,500 | |
| | 5,174 | | | Utah Medical Products Inc. | | | 143,347 | | | | 252,284 | |
| | 133,540 | | | Vascular Solutions Inc.† | | | 1,345,264 | | | | 3,298,438 | |
| | 300,000 | | | Zealand Pharma A/S† | | | 3,716,971 | | | | 3,512,314 | |
| | | | | | | | | | | | |
| | | | | | | 63,513,492 | | | | 93,898,699 | |
| | | | | | | | | | | | |
| | | | Hotels and Gaming — 2.1% | |
| | 71,800 | | | Boyd Gaming Corp.† | | | 416,103 | | | | 729,488 | |
| | 74,340 | | | Churchill Downs Inc. | | | 2,785,502 | | | | 7,248,150 | |
| | 124,484 | | | Dover Downs Gaming & Entertainment Inc.† | | | 571,591 | | | | 123,239 | |
| | 95,073 | | | Eldorado Resorts Inc.† | | | 461,612 | | | | 404,060 | |
| | 17,000 | | | Isle of Capri Casinos Inc.† | | | 137,149 | | | | 127,500 | |
| | 10,000 | | | Lakes Entertainment Inc.† | | | 86,139 | | | | 83,300 | |
| | 581,581 | | | Morgans Hotel Group Co.† | | | 4,306,147 | | | | 4,693,359 | |
| | 120,541 | | | Multimedia Games Holding Co. Inc.† | | | 3,421,036 | | | | 4,340,681 | |
| | 95,000 | | | Pinnacle Entertainment Inc.† | | | 1,037,735 | | | | 2,383,550 | |
See accompanying notes to financial statements.
23
TETON Westwood Mighty Mites Fund
Schedule of Investments (Continued) — September 30, 2014
| | | | | | | | | | |
Shares | | | | Cost | | | Market Value | |
| | |
| | COMMON STOCKS (Continued) | | | | | |
| | Hotels and Gaming (Continued) | | | | | |
| 8,900 | | Ryman Hospitality Properties Inc. | | $ | 260,124 | | | $ | 420,970 | |
| 379,820 | | The Marcus Corp. | | | 4,810,811 | | | | 6,001,156 | |
| | | | | | | | | | |
| | | | | 18,293,949 | | | | 26,555,453 | |
| | | | | | | | | | |
| | Machinery — 1.8% | | | | | | | | |
| 220,027 | | Astec Industries Inc. | | | 7,552,335 | | | | 8,024,385 | |
| 15,000 | | Bolzoni SpA | | | 40,097 | | | | 57,406 | |
| 6,300 | | DMG MORI SEIKI AG | | | 40,709 | | | | 178,123 | |
| 12,200 | | DXP Enterprises Inc.† | | | 222,516 | | | | 898,896 | |
| 125,000 | | Gencor Industries Inc.† | | | 1,262,183 | | | | 1,235,000 | |
| 137,000 | | Global Power Equipment Group Inc. | | | 3,140,530 | | | | 2,041,300 | |
| 6,000 | | Hardinge Inc. | | | 54,215 | | | | 65,640 | |
| 151,009 | | Key Technology Inc.† | | | 2,537,003 | | | | 1,978,218 | |
| 16,064 | | Lindsay Corp. | | | 1,070,121 | | | | 1,200,784 | |
| 50,300 | | Tennant Co. | | | 1,073,836 | | | | 3,374,627 | |
| 44,400 | | The Middleby Corp.† | | | 464,969 | | | | 3,912,972 | |
| | | | | | | | | | |
| | | | | 17,458,514 | | | | 22,967,351 | |
| | | | | | | | | | |
| | Manufactured Housing and Recreational Vehicles — 0.5% | |
| 53,400 | | Cavco Industries Inc.† | | | 2,818,008 | | | | 3,631,200 | |
| 122,300 | | Nobility Homes Inc.† | | | 1,086,565 | | | | 1,284,150 | |
| 47,796 | | Skyline Corp.† | | | 222,012 | | | | 197,397 | |
| 61,000 | | Winnebago Industries Inc.† | | | 626,036 | | | | 1,327,970 | |
| | | | | | | | | | |
| | | | | 4,752,621 | | | | 6,440,717 | |
| | | | | | | | | | |
| | Metals and Mining — 1.3% | | | | | | | | |
| 85,000 | | 5N Plus Inc.† | | | 306,827 | | | | 223,894 | |
| 10,000 | | Alkane Resources Ltd.† | | | 3,333 | | | | 1,795 | |
| 2,000 | | Camino Minerals Corp.† | | | 3,744 | | | | 62 | |
| 30,000 | | Chaparral Gold Corp.† | | | 9,849 | | | | 14,197 | |
| 180,800 | | Materion Corp. | | | 3,872,388 | | | | 5,545,136 | |
| 800,000 | | Osisko Gold Royalties Ltd.† | | | 11,677,924 | | | | 10,129,024 | |
| 900,000 | | Tanami Gold NL† | | | 210,755 | | | | 14,184 | |
| | | | | | | | | | |
| | | | | 16,084,820 | | | | 15,928,292 | |
| | | | | | | | | | |
| | Paper and Forest Products — 0.3% | |
| 24,098 | | Keweenaw Land Association Ltd.† | | | 2,043,499 | | | | 2,650,780 | |
| 100,000 | | Wausau Paper Corp. | | | 1,048,080 | | | | 793,000 | |
| | | | | | | | | | |
| | | | | 3,091,579 | | | | 3,443,780 | |
| | | | | | | | | | |
| | Publishing — 1.1% | | | | | | | | |
| 460,000 | | Il Sole 24 Ore SpA† | | | 789,682 | | | | 405,833 | |
| 1,330,034 | | Journal Communications Inc., Cl. A† | | | 4,355,053 | | | | 11,212,187 | |
| 155,000 | | The E.W. Scripps Co., Cl. A† | | | 672,184 | | | | 2,528,050 | |
| | | | | | | | | | |
| | | | | 5,816,919 | | | | 14,146,070 | |
| | | | | | | | | | |
| | Real Estate — 1.3% | | | | | | | | |
| 134,300 | | Ambase Corp.† | | | 201,065 | | | | 179,962 | |
| 8,000 | | Bresler & Reiner Inc.† | | | 4,912 | | | | 6,560 | |
| 59,400 | | Capital Properties Inc., Cl. A† | | | 550,951 | | | | 652,509 | |
| 100,000 | | Cohen & Steers Inc. | | | 2,137,829 | | | | 3,844,000 | |
| 46,135 | | DGT Holdings Corp.† | | | 664,322 | | | | 737,007 | |
| 147,785 | | Griffin Land & Nurseries Inc. | | | 4,165,036 | | | | 4,241,429 | |
| 9,742 | | Gyrodyne Special Distribution, LLC† | | | 201,659 | | | | 201,659 | |
| 7,300 | | Holobeam Inc.† | | | 132,985 | | | | 302,950 | |
| 359,623 | | Reading International Inc., Cl. A† | | | 2,269,643 | | | | 3,020,833 | |
| 65,856 | | Reading International Inc., Cl. B† | | | 518,153 | | | | 592,704 | |
| 2,508 | | Royalty LLC | | | 0 | | | | 1,404 | |
| 110,000 | | Tejon Ranch Co.† | | | 3,120,119 | | | | 3,084,400 | |
| | | | | | | | | | |
| | | | | 13,966,674 | | | | 16,865,417 | |
| | | | | | | | | | |
| | | | | | | | | | |
Shares | | | | Cost | | | Market Value | |
| | Restaurants — 2.3% | | | | | | | | |
| 24,068 | | Biglari Holdings Inc.† | | $ | 6,735,601 | | | $ | 8,177,344 | |
| 86,000 | | Denny’s Corp.† | | | 276,744 | | | | 604,580 | |
| 95,803 | | Famous Dave’s of America Inc.† | | | 1,159,029 | | | | 2,579,017 | |
| 218,777 | | Nathan’s Famous Inc.† | | | 4,919,239 | | | | 14,809,015 | |
| 57,000 | | The Cheesecake Factory Inc. | | | 1,667,900 | | | | 2,593,500 | |
| | | | | | | | | | |
| | | | | 14,758,513 | | | | 28,763,456 | |
| | | | | | | | | | |
| | Retail — 2.1% | | | | | | | | |
| 49,000 | | Aaron’s Inc.† | | | 949,904 | | | | 1,191,680 | |
| 248,789 | | Big 5 Sporting Goods Corp. | | | 3,525,152 | | | | 2,331,153 | |
| 30,000 | | Destination XL Group Inc.† | | | 169,350 | | | | 141,600 | |
| 45,996 | | Ethan Allen Interiors Inc. | | | 1,107,113 | | | | 1,048,709 | |
| 191,200 | | Ingles Markets Inc., Cl. A | | | 3,204,922 | | | | 4,529,528 | |
| 303,800 | | Krispy Kreme Doughnuts Inc.† | | | 1,903,838 | | | | 5,213,208 | |
| 34,000 | | La-Z-Boy Inc. | | | 775,396 | | | | 672,860 | |
| 14,000 | | Movado Group Inc. | | | 169,833 | | | | 462,840 | |
| 35,000 | | Pier 1 Imports Inc. | | | 421,157 | | | | 416,150 | |
| 29,605 | | Rush Enterprises Inc., Cl. A† | | | 545,615 | | | | 990,287 | |
| 103,005 | | Rush Enterprises Inc., Cl. B† | | | 1,775,041 | | | | 3,080,880 | |
| 6,000 | | SpartanNash Co. | | | 121,934 | | | | 116,700 | |
| 3,572 | | Swisher Hygiene Inc.† | | | 25,559 | | | | 10,859 | |
| 539,455 | | The Bon-Ton Stores Inc. | | | 6,107,254 | | | | 4,509,844 | |
| 67,000 | | The Pantry Inc.† | | | 1,087,901 | | | | 1,355,410 | |
| 38,581 | | Village Super Market Inc., Cl. A | | | 1,040,340 | | | | 878,875 | |
| 4,000 | | Winmark Corp. | | | 284,701 | | | | 294,000 | |
| | | | | | | | | | |
| | | | | 23,215,010 | | | | 27,244,583 | |
| | | | | | | | | | |
| | Semiconductors — 0.4% | | | | | | | | |
| 236,160 | | Cascade Microtech Inc.† | | | 1,323,037 | | | | 2,392,301 | |
| 145,100 | | Entegris Inc.† | | | 800,846 | | | | 1,668,650 | |
| 93,700 | | IXYS Corp. | | | 991,052 | | | | 983,850 | |
| | | | | | | | | | |
| | | | | 3,114,935 | | | | 5,044,801 | |
| | | | | | | | | | |
| | Specialty Chemicals — 2.4% | | | | | | | | |
| 80,000 | | Chemtura Corp.† | | | 1,355,439 | | | | 1,866,400 | |
| 1,186,000 | | Ferro Corp.† | | | 5,973,230 | | | | 17,185,140 | |
| 267,226 | | General Chemical Group Inc.†(a) | | | 59,859 | | | | 5,345 | |
| 138,012 | | Hawkins Inc. | | | 4,760,491 | | | | 4,962,912 | |
| 4,000 | | Minerals Technologies Inc. | | | 116,940 | | | | 246,840 | |
| 11,000 | | Navigator Holdings Ltd.† | | | 255,128 | | | | 306,130 | |
| 260,000 | | OMNOVA Solutions Inc.† | | | 633,248 | | | | 1,396,200 | |
| 137,600 | | Penford Corp.† | | | 1,748,065 | | | | 1,812,192 | |
| 199,179 | | Zep Inc. | | | 2,458,980 | | | | 2,792,490 | |
| | | | | | | | | | |
| | | | | 17,361,380 | | | | 30,573,649 | |
| | | | | | | | | | |
| | Telecommunications — 1.8% | | | | | |
| 74,200 | | Atlantic Tele-Network Inc. | | | 3,030,595 | | | | 3,999,380 | |
| 750,005 | | Cincinnati Bell Inc.† | | | 2,653,901 | | | | 2,527,517 | |
| 1,000 | | Consolidated Communications Holdings Inc. | | | 18,634 | | | | 25,050 | |
| 70,400 | | Enventis Corp. | | | 674,950 | | | | 1,279,872 | |
| 20,000 | | Frequency Electronics Inc.† | | | 225,394 | | | | 213,400 | |
| 715,178 | | HC2 Holdings Inc.† | | | 2,613,959 | | | | 3,289,819 | |
| 350 | | Horizon Telecom Inc., Cl. B† | | | 30,092 | | | | 3,160 | |
| 68,000 | | Ixia† | | | 847,956 | | | | 621,520 | |
| 43,000 | | New ULM Telecom Inc. | | | 421,285 | | | | 318,200 | |
| 1,480,000 | | NII Holdings Inc.† | | | 2,460,954 | | | | 81,400 | |
| 4,100 | | North State Telecommunications Corp., Cl. A | | | 349,343 | | | | 289,050 | |
| 542,438 | | ORBCOMM Inc.† | | | 3,062,423 | | | | 3,119,019 | |
| 63,483 | | PC-Tel Inc. | | | 498,106 | | | | 481,836 | |
| 7,788 | | Preformed Line Products Co. | | | 338,590 | | | | 410,895 | |
See accompanying notes to financial statements.
24
TETON Westwood Mighty Mites Fund
Schedule of Investments (Continued) — September 30, 2014
| | | | | | | | | | |
Shares | | | | Cost | | | Market Value | |
| | COMMON STOCKS (Continued) | |
| | Telecommunications (Continued) | |
| 250,000 | | Shenandoah Telecommunications Co. | | $ | 2,747,595 | | | $ | 6,202,500 | |
| | | | | | | | | | |
| | | | | 19,973,777 | | | | 22,862,618 | |
| | | | | | | | | | |
| | Transportation — 0.2% | | | | | | | | |
| 21,000 | | Dakota Plains Holdings Inc.† | | | 53,275 | | | | 50,400 | |
| 8,200 | | PHI Inc.† | | | 130,182 | | | | 345,138 | |
| 110,308 | | Providence and Worcester Railroad Co. | | | 1,536,078 | | | | 1,929,287 | |
| 1 | | Trailer Bridge Inc.† | | | 7,995 | | | | 465 | |
| | | | | | | | | | |
| | | | | 1,727,530 | | | | 2,325,290 | |
| | | | | | | | | | |
| | TOTAL COMMON STOCKS | | | 657,027,553 | | | | 931,970,406 | |
| | | | | | | | | | |
| | PREFERRED STOCKS — 0.1% | | | | | |
| | Automotive: Parts and Accessories — 0.1% | |
| 20,000 | | Jungheinrich AG | | | 229,855 | | | | 1,127,278 | |
| | | | | | | | | | |
| | CONVERTIBLE PREFERRED STOCKS — 0.2% | |
| | Diversified Industrial — 0.2% | |
| 88,937 | | Sevcon Inc., 4.000%, Ser. A | | | 1,912,146 | | | | 2,174,510 | |
| | | | | | | | | | |
| | Food and Beverage — 0.0% | | | | | | | | |
| 500 | | Seneca Foods Corp., Ser. 2003† | | | 7,625 | | | | 14,300 | |
| | | | | | | | | | |
| | TOTAL CONVERTIBLE PREFERRED STOCKS | | | 1,919,771 | | | | 2,188,810 | |
| | | | | | | | | | |
| | RIGHTS — 0.0% | | | | | | | | |
| | Health Care — 0.0% | | | | | | | | |
| 300,000 | | Adolor Corp., CPR,
expire 07/01/19† | | | 0 | | | | 156,000 | |
| 200,000 | | Clinical Data Inc., CVR,
expire 04/14/18† | | | 0 | | | | 190,000 | |
| 400,000 | | Sanofi, CVR, expire 12/31/20† | | | 137,800 | | | | 186,000 | |
| 200,000 | | Teva Pharmaceutical Industries Ltd., CPR, expire 02/20/23† | | | 103,591 | | | | 106,000 | |
| | | | | | | | | | |
| | TOTAL RIGHTS | | | 241,391 | | | | 638,000 | |
| | | | | | | | | | |
| | WARRANTS — 0.0% | | | | | | | | |
| | Real Estate — 0.0% | | | | | | | | |
| 15,170 | | Tejon Ranch Co., expire 08/31/16† | | | 89,313 | | | | 31,099 | |
| | | | | | | | | | |
| | Transportation — 0.0% | | | | | | | | |
| 2 | | Trailer Bridge Inc., Ser. A,
expire 04/02/17† | | | 0 | | | | 0 | |
| 2 | | Trailer Bridge Inc., Ser. B,
expire 04/02/17† | | | 0 | | | | 0 | |
| | | | | | | | | | |
| | | | | 0 | | | | 0 | |
| | | | | | | | | | |
| | TOTAL WARRANTS | | | 89,313 | | | | 31,099 | |
| | | | | | | | | | |
| | | | | | | | | | |
Principal
Amount | | | | Cost | | | Market
Value | |
| | CORPORATE BONDS — 0.0% | |
| | Real Estate — 0.0% | | | | | | | | |
| $40,860 | | Capital Properties Inc.,
5.000%, 12/31/22 | | $ | 40,860 | | | $ | 40,281 | |
| 108,079 | | Gyrodyne Co. of America Inc., Sub. Deb.,
5.000%, 06/30/17 | | | 106,090 | | | | 106,090 | |
| | | | | | | | | | |
| | TOTAL CORPORATE BONDS | | | 146,950 | | | | 146,371 | |
| | | | | | | | | | |
| | U.S. GOVERNMENT OBLIGATIONS — 26.4% | |
| 334,265,000 | | U.S. Treasury Bills,
0.000% to 0.076%††,
10/02/14 to 03/26/15 | | | 334,225,050 | | | | 334,246,726 | |
| | | | | | | | | | |
| | | |
| | TOTAL INVESTMENTS — 100.2% | | $ | 993,879,883 | | | | 1,270,348,690 | |
| | | | | | | | | | |
| | Other Assets and
Liabilities (Net) — (0.2)% | | | | (1,964,610 | ) |
| | | | | | | | | | |
| | |
| | NET ASSETS — 100.0% | | | $ | 1,268,384,080 | |
| | | | | | | | | | |
| (a) | Security considered an affiliated holding because the Fund owns at least 5% of its outstanding shares. |
| † | Non-income producing security. |
| †† | Represents annualized yield at date of purchase. |
| ADR | American Depositary Receipt |
| CPR | Contingent Payment Right |
| CVR | Contingent Value Right |
See accompanying notes to financial statements.
25
TETON Westwood SmallCap Equity Fund
Schedule of Investments — September 30, 2014
| | | | | | | | | | |
Shares | | | | Cost | | | Market
Value | |
| | COMMON STOCKS — 97.5% | | | | | | | | |
| | Aerospace — 3.6% | | | | | | | | |
| 31,750 | | AAR Corp. | | $ | 480,820 | | | $ | 766,762 | |
| 17,900 | | Hexcel Corp.† | | | 398,398 | | | | 710,630 | |
| | | | | | | | | | |
| | | | | 879,218 | | | | 1,477,392 | |
| | | | | | | | | | |
| | Building and Construction — 4.3% | | | | | | | | |
| 14,400 | | Builders FirstSource Inc.† | | | 77,257 | | | | 78,480 | |
| 15,350 | | Dycom Industries Inc.† | | | 267,533 | | | | 471,398 | |
| 6,500 | | EMCOR Group Inc. | | | 246,816 | | | | 259,740 | |
| 5,600 | | MasTec Inc.† | | | 175,567 | | | | 171,472 | |
| 33,600 | | MYR Group Inc.† | | | 703,264 | | | | 809,088 | |
| | | | | | | | | | |
| | | | | 1,470,437 | | | | 1,790,178 | |
| | | | | | | | | | |
| | Business Services — 7.9% | | | | | | | | |
| 21,950 | | ABM Industries Inc. | | | 471,552 | | | | 563,895 | |
| 23,800 | | Checkpoint Systems Inc.† | | | 299,777 | | | | 291,074 | |
| 15,350 | | Convergys Corp. | | | 190,932 | | | | 273,537 | |
| 19,550 | | FTI Consulting Inc.† | | | 669,476 | | | | 683,468 | |
| 4,600 | | G & K Services Inc., Cl. A | | | 142,947 | | | | 254,748 | |
| 10,750 | | KAR Auction Services Inc. | | | 168,377 | | | | 307,772 | |
| 10,400 | | McGrath RentCorp | | | 282,193 | | | | 355,680 | |
| 30,450 | | PRGX Global Inc.† | | | 211,969 | | | | 178,437 | |
| 14,800 | | The Brink’s Co. | | | 377,497 | | | | 355,792 | |
| | | | | | | | | | |
| | | | | 2,814,720 | | | | 3,264,403 | |
| | | | | | | | | | |
| | Computer Hardware — 1.0% | | | | | | | | |
| 43,200 | | QLogic Corp.† | | | 661,647 | | | | 395,712 | |
| | | | | | | | | | |
| | Computer Software and Services — 8.1% | |
| 10,600 | | Bottomline Technologies Inc.† | | | 191,501 | | | | 292,454 | |
| 26,500 | | Callidus Software Inc.† | | | 145,774 | | | | 318,530 | |
| 26,100 | | Constant Contact Inc.† | | | 420,261 | | | | 708,354 | |
| 23,500 | | Covisint Corp.† | | | 155,658 | | | | 97,525 | |
| 16,800 | | Guidance Software Inc.† | | | 159,599 | | | | 113,064 | |
| 11,900 | | Heartland Payment Systems Inc. | | | 243,963 | | | | 567,868 | |
| 4,200 | | Informatica Corp.† | | | 114,797 | | | | 143,808 | |
| 10,300 | | NetScout Systems Inc.† | | | 142,913 | | | | 471,740 | |
| 18,700 | | Progress Software Corp.† | | | 383,084 | | | | 447,117 | |
| 5,400 | | PTC Inc.† | | | 108,099 | | | | 199,260 | |
| | | | | | | | | | |
| | | | | 2,065,649 | | | | 3,359,720 | |
| | | | | | | | | | |
| | Consumer Products — 1.0% | | | | | | | | |
| 9,900 | | ACCO Brands Corp.† | | | 74,676 | | | | 68,310 | |
| 3,300 | | Hanesbrands Inc. | | | 88,092 | | | | 354,552 | |
| | | | | | | | | | |
| | | | | 162,768 | | | | 422,862 | |
| | | | | | | | | | |
| | Diversified Industrial — 6.1% | | | | | | | | |
| 10,000 | | Badger Meter Inc. | | | 318,033 | | | | 504,500 | |
| 8,250 | | Barnes Group Inc. | | | 201,245 | | | | 250,387 | |
| 24,160 | | Columbus McKinnon Corp. | | | 402,544 | | | | 531,278 | |
| 16,800 | | Furmanite Corp.† | | | 96,746 | | | | 113,568 | |
| 3,738 | | Griffon Corp. | | | 33,122 | | | | 42,576 | |
| 5,400 | | Itron Inc.† | | | 211,601 | | | | 212,274 | |
| 10,150 | | Kennametal Inc. | | | 404,646 | | | | 419,297 | |
| 12,800 | | Sealed Air Corp. | | | 198,375 | | | | 446,464 | |
| | | | | | | | | | |
| | | | | 1,866,312 | | | | 2,520,344 | |
| | | | | | | | | | |
| | Electronics — 5.3% | | | | | | | | |
| 6,500 | | Avnet Inc. | | | 205,163 | | | | 269,750 | |
| 51,550 | | Electro Scientific Industries Inc. | | | 728,072 | | | | 350,024 | |
| 45,400 | | Newport Corp.† | | | 607,192 | | | | 804,488 | |
| 4,100 | | Park Electrochemical Corp. | | | 83,261 | | | | 96,555 | |
| 14,750 | | Vishay Intertechnology Inc. | | | 142,803 | | | | 210,778 | |
| 10,100 | | Woodward Inc. | | | 341,268 | | | | 480,962 | |
| | | | | | | | | | |
| | | | | 2,107,759 | | | | 2,212,557 | |
| | | | | | | | | | |
| | Energy and Utilities — 7.9% | | | | | | | | |
| 23,100 | | Approach Resources Inc.† | | | 599,577 | | | | 334,950 | |
| 15,300 | | C&J Energy Services Inc.† | | | 399,008 | | | | 467,415 | |
| 14,200 | | Comstock Resources Inc. | | | 227,684 | | | | 264,404 | |
| 23,500 | | Energy XXI Bermuda Ltd. | | | 674,019 | | | | 266,725 | |
| | | | | | | | | | |
Shares | | | | Cost | | | Market
Value | |
| 11,750 | | Matrix Service Co.† | | $ | 136,205 | | | $ | 283,410 | |
| 34,000 | | Newpark Resources Inc.† | | | 258,058 | | | | 422,960 | |
| 24,700 | | Patterson-UTI Energy Inc. | | | 410,840 | | | | 803,491 | |
| 9,300 | | Rosetta Resources Inc.† | | | 416,056 | | | | 414,408 | |
| | | | | | | | | | |
| | | |
| | | | | 3,121,447 | | | | 3,257,763 | |
| | | | | | | | | | |
| | Entertainment — 1.0% | | | | | | | | |
| 15,200 | | RealD Inc.† | | | 189,062 | | | | 142,424 | |
| 19,600 | | World Wrestling Entertainment Inc., Cl. A | | | 220,727 | | | | 269,892 | |
| | | | | | | | | | |
| | | |
| | | | | 409,789 | | | | 412,316 | |
| | | | | | | | | | |
| | Equipment and Supplies — 3.2% | | | | | | | | |
| 4,100 | | CIRCOR International Inc. | | | 151,497 | | | | 276,053 | |
| 10,700 | | Crown Holdings Inc.† | | | 403,996 | | | | 476,364 | |
| 3,300 | | Moog Inc., Cl. A† | | | 115,278 | | | | 225,720 | |
| 3,850 | | MSA Safety Inc. | | | 131,639 | | | | 190,190 | |
| 10,700 | | Titan Machinery Inc.† | | | 210,642 | | | | 138,993 | |
| | | | | | | | | | |
| | | |
| | | | | 1,013,052 | | | | 1,307,320 | |
| | | | | | | | | | |
| | Financial Services — 19.0% | | | | | | | | |
| 5,450 | | Anchor Bancorp.† | | | 52,001 | | | | 110,744 | |
| 9,000 | | BankUnited Inc. | | | 217,482 | | | | 274,410 | |
| 11,750 | | BBCN Bancorp Inc. | | | 87,734 | | | | 171,432 | |
| 12,300 | | Beneficial Mutual Bancorp Inc.† | | | 136,874 | | | | 157,194 | |
| 4,600 | | Berkshire Hills Bancorp Inc. | | | 106,506 | | | | 108,054 | |
| 10,500 | | Boston Private Financial Holdings Inc. | | | 79,345 | | | | 130,095 | |
| 11,850 | | Brown & Brown Inc. | | | 277,572 | | | | 380,977 | |
| 12,300 | | Cardinal Financial Corp. | | | 139,027 | | | | 209,961 | |
| 8,800 | | CoBiz Financial Inc. | | | 86,858 | | | | 98,384 | |
| 9,700 | | Columbia Banking System Inc. | | | 181,416 | | | | 240,657 | |
| 3,900 | | Financial Institutions Inc. | | | 63,255 | | | | 87,672 | |
| 14,300 | | Flushing Financial Corp. | | | 188,821 | | | | 261,261 | |
| 7,050 | | FNF Group | | | 92,760 | | | | 195,567 | |
| 2,349 | | FNFV Group† | | | 18,993 | | | | 32,322 | |
| 12,600 | | Glacier Bancorp Inc. | | | 181,714 | | | | 325,836 | |
| 17,400 | | Heritage Commerce Corp. | | | 138,074 | | | | 142,854 | |
| 3,900 | | HF Financial Corp. | | | 33,740 | | | | 52,416 | |
| 11,784 | | Hudson Valley Holding Corp. | | | 206,011 | | | | 213,880 | |
| 68,250 | | Investors Bancorp Inc. | | | 575,536 | | | | 691,372 | |
| 4,750 | | National Penn Bancshares Inc. | | | 28,909 | | | | 46,123 | |
| 4,750 | | OceanFirst Financial Corp. | | | 62,176 | | | | 75,573 | |
| 14,850 | | OFG Bancorp | | | 177,646 | | | | 222,453 | |
| 2,900 | | Old National Bancorp | | | 32,711 | | | | 37,613 | |
| 7,600 | | Oritani Financial Corp. | | | 111,304 | | | | 107,084 | |
| 8,500 | | Southwest Bancorp Inc. | | | 138,288 | | | | 139,400 | |
| 5,000 | | Square 1 Financial Inc.† | | | 90,000 | | | | 96,150 | |
| 10,200 | | State Bank Financial Corp. | | | 181,863 | | | | 165,648 | |
| 12,309 | | Sterling Bancorp | | | 97,725 | | | | 157,432 | |
| 16,800 | | Stifel Financial Corp.† | | | 541,820 | | | | 787,752 | |
| 14,200 | | TrustCo Bank Corp NY | | | 65,679 | | | | 91,448 | |
| 7,750 | | Umpqua Holdings Corp. | | | 86,219 | | | | 127,643 | |
| 26,200 | | United Financial Bancorp Inc. | | | 351,289 | | | | 332,478 | |
| 33,500 | | ViewPoint Financial Group Inc. | | | 617,837 | | | | 801,990 | |
| 12,700 | | Washington Federal Inc. | | | 198,354 | | | | 258,572 | |
| 8,800 | | Washington Trust Bancorp Inc. | | | 193,672 | | | | 290,312 | |
| 13,100 | | Waterstone Financial Inc. | | | 140,245 | | | | 151,305 | |
| 14,000 | | Xenith Bankshares Inc.† | | | 57,380 | | | | 89,950 | |
| | | | | | | | | | |
| | | |
| | | | | 6,036,836 | | | | 7,864,014 | |
| | | | | | | | �� | | |
| | Health Care — 7.1% | | | | | | | | |
| 9,050 | | AngioDynamics Inc.† | | | 126,045 | | | | 124,166 | |
| 30,300 | | BioScrip Inc.† | | | 226,417 | | | | 209,373 | |
| 2,100 | | ICU Medical Inc.† | | | 85,762 | | | | 134,778 | |
| 8,250 | | Omnicare Inc. | | | 257,311 | | | | 513,645 | |
| 5,350 | | Omnicell Inc.† | | | 70,208 | | | | 146,216 | |
| 23,050 | | Patterson Companies Inc. | | | 699,918 | | | | 954,962 | |
| 5,600 | | STERIS Corp. | | | 181,854 | | | | 302,176 | |
| 1,800 | | Thoratec Corp.† | | | 53,914 | | | | 48,114 | |
See accompanying notes to financial statements.
26
TETON Westwood SmallCap Equity Fund
Schedule of Investments (Continued) — September 30, 2014
| | | | | | | | | | |
Shares | | | | Cost | | | Market Value | |
| | COMMON STOCKS (Continued) | |
| | Health Care (Continued) | | | | | |
| 12,600 | | VCA Inc.† | | $ | 213,971 | | | $ | 495,558 | |
| | | | | | | | | | |
| | | | | 1,915,400 | | | | 2,928,988 | |
| | | | | | | | | | |
| | Machinery — 2.8% | | | | | | | | |
| 23,900 | | Briggs & Stratton Corp. | | | 448,322 | | | | 430,678 | |
| 15,200 | | Trinity Industries Inc. | | | 195,428 | | | | 710,144 | |
| | | | | | | | | | |
| | | | | 643,750 | | | | 1,140,822 | |
| | | | | | | | | | |
| | Metals and Mining — 1.0% | | | | | | | | |
| 9,650 | | Carpenter Technology Corp. | | | 470,131 | | | | 435,697 | |
| | | | | | | | | | |
| | Publishing — 0.2% | | | | | | | | |
| 1,600 | | Meredith Corp. | | | 46,356 | | | | 68,480 | |
| | | | | | | | | | |
| | Retail — 5.9% | | | | | | | | |
| 36,450 | | American Eagle Outfitters Inc. | | | 492,434 | | | | 529,254 | |
| 9,200 | | Big 5 Sporting Goods Corp. | | | 74,585 | | | | 86,204 | |
| 24,850 | | Ethan Allen Interiors Inc. | | | 492,441 | | | | 566,580 | |
| 6,800 | | Haverty Furniture Companies Inc. | | | 171,647 | | | | 148,172 | |
| 10,200 | | Penske Automotive Group Inc. | | | 229,280 | | | | 414,018 | |
| 21,200 | | Rush Enterprises Inc., Cl. A† | | | 383,586 | | | | 709,140 | |
| | | | | | | | | | |
| | | | | 1,843,973 | | | | 2,453,368 | |
| | | | | | | | | | |
| | Semiconductors — 7.6% | | | | | | | | |
| 4,300 | | Cabot Microelectronics Corp.† | | | 175,328 | | | | 178,235 | |
| 18,400 | | Cascade Microtech Inc.† | | | 89,393 | | | | 186,392 | |
| 9,200 | | Cypress Semiconductor Corp. | | | 80,914 | | | | 90,850 | |
| 42,300 | | Entegris Inc.† | | | 419,598 | | | | 486,450 | |
| 98,600 | | FormFactor Inc.† | | | 656,583 | | | | 706,962 | |
| 45,000 | | Intersil Corp., Cl. A | | | 369,240 | | | | 639,450 | |
| 63,300 | | ON Semiconductor Corp.† | | | 500,272 | | | | 565,902 | |
| 12,400 | | Ultratech Inc.† | | | 295,407 | | | | 282,100 | |
| | | | | | | | | | |
| | | | | 2,586,735 | | | | 3,136,341 | |
| | | | | | | | | | |
| | Specialty Chemicals — 1.4% | | | | | | | | |
| 11,900 | | Chemtura Corp.† | | | 313,377 | | | | 277,627 | |
| | | | | | | | | | |
Shares | | | | Cost | | | Market Value | |
| 5,300 | | PolyOne Corp. | | $ | 60,361 | | | $ | 188,574 | |
| 8,500 | | Zep Inc. | | | 149,927 | | | | 119,170 | |
| | | | | | | | | | |
| | | | | 523,665 | | | | 585,371 | |
| | | | | | | | | | |
| | Telecommunications — 3.1% | | | | | |
| 4,650 | | Atlantic Tele-Network Inc. | | | 163,864 | | | | 250,635 | |
| 63,900 | | Extreme Networks Inc.† | | | 271,062 | | | | 306,081 | |
| 23,900 | | Ixia† | | | 343,236 | | | | 218,446 | |
| 27,400 | | Polycom Inc.† | | | 317,604 | | | | 336,609 | |
| 16,100 | | Procera Networks Inc.† | | | 201,409 | | | | 154,238 | |
| | | | | | | | | | |
| | | | | 1,297,175 | | | | 1,266,009 | |
| | | | | | | | | | |
| | TOTAL COMMON STOCKS | | | 31,936,819 | | | | 40,299,657 | |
| | | | | | | | | | |
Principal
Amount | | | | | | | | |
| | U.S. GOVERNMENT OBLIGATIONS — 2.6% | |
| $1,095,000 | | U.S. Treasury Bills,
0.005% to 0.045%††,
11/20/14 to 12/26/14 | | | 1,094,970 | | | | 1,094,967 | |
| | | | | | | | | | |
| | | |
| | TOTAL
INVESTMENTS — 100.1% | | $ | 33,031,789 | | | | 41,394,624 | |
| | | | | | | | | | |
| | Other Assets and Liabilities (Net) — (0.1)% | | | | (60,816 | ) |
| | | | | | | | | | |
| | NET ASSETS — 100.0% | | | | | | $ | 41,333,808 | |
| | | | | | | | | | |
| † | Non-income producing security. |
| †† | Represents annualized yield at date of purchase. |
See accompanying notes to financial statements.
27
TETON Westwood Mid-Cap Equity Fund
Schedule of Investments — September 30, 2014
| | | | | | | | | | |
Shares | | | | Cost | | | Market
Value | |
| | COMMON STOCKS — 94.4% | |
| | FINANCIALS — 18.3% | |
| | Banks — 4.2% | | | | | | | | |
| 2,909 | | BankUnited Inc. | | $ | 87,726 | | | $ | 88,695 | |
| 5,171 | | Regions Financial Corp. | | | 51,770 | | | | 51,917 | |
| 2,271 | | Zions Bancorporation | | | 66,371 | | | | 65,995 | |
| | | | | | | | | | |
| | | | | 205,867 | | | | 206,607 | |
| | | | | | | | | | |
| | Diversified Financials — 4.3% | | | | | | | | |
| 338 | | Affiliated Managers Group Inc.† | | | 62,827 | | | | 67,722 | |
| 826 | | Financial Engines Inc. | | | 40,496 | | | | 28,262 | |
| 2,204 | | Invesco Ltd. | | | 77,756 | | | | 87,014 | |
| 2,620 | | WisdomTree Investments Inc.† | | | 31,520 | | | | 29,816 | |
| | | | | | | | | | |
| | | | | 212,599 | | | | 212,814 | |
| | | | | | | | | | |
| | Insurance — 3.4% | | | | | | | | |
| 602 | | ACE Ltd. | | | 57,847 | | | | 63,132 | |
| 2,212 | | HCC Insurance Holdings Inc. | | | 98,798 | | | | 106,817 | |
| | | | | | | | | | |
| | | | | 156,645 | | | | 169,949 | |
| | | | | | | | | | |
| | Real Estate — 6.4% | | | | | | | | |
| 1,016 | | American Tower Corp. | | | 84,053 | | | | 95,128 | |
| 3,416 | | CBRE Group Inc., Cl. A† | | | 90,832 | | | | 101,592 | |
| 2,038 | | Corrections Corp. of America | | | 69,625 | | | | 70,026 | |
| 1,681 | | Gaming and Leisure Properties Inc. | | | 65,521 | | | | 51,943 | |
| | | | | | | | | | |
| | | | | 310,031 | | | | 318,689 | |
| | | | | | | | | | |
| | TOTAL FINANCIALS | | | 885,142 | | | | 908,059 | |
| | | | | | | | | | |
| | INDUSTRIALS — 16.7% | | | | | | | | |
| | Capital Goods — 9.4% | | | | | | | | |
| 357 | | Cummins Inc. | | | 48,108 | | | | 47,117 | |
| 1,542 | | Fortune Brands Home & Security Inc. | | | 62,648 | | | | 63,392 | |
| 1,528 | | Hexcel Corp.† | | | 59,922 | | | | 60,662 | |
| 950 | | MSC Industrial Direct Co. Inc., Cl. A | | | 80,928 | | | | 81,187 | |
| 2,888 | | Quanta Services Inc.† | | | 91,204 | | | | 104,806 | |
| 3,862 | | Rexnord Corp.† | | | 94,221 | | | | 109,874 | |
| | | | | | | | | | |
| | | | | 437,031 | | | | 467,038 | |
| | | | | | | | | | |
| | Commercial and Professional Services — 6.1% | |
| 1,039 | | Bright Horizons Family Solutions Inc.† | | | 39,569 | | | | 43,700 | |
| 505 | | IHS Inc., Cl. A† | | | 59,052 | | | | 63,221 | |
| 2,037 | | Nielsen NV | | | 83,553 | | | | 90,300 | |
| 3,754 | | Steelcase Inc., Cl. A | | | 60,847 | | | | 60,777 | |
| 367 | | Stericycle Inc.† | | | 41,837 | | | | 42,778 | |
| | | | | | | | | | |
| | | | | 284,858 | | | | 300,776 | |
| | | | | | | | | | |
| | Transportation — 1.2% | | | | | | | | |
| 1,422 | | Expeditors International of Washington Inc. | | | 58,769 | | | | 57,705 | |
| | | | | | | | | | |
| | TOTAL INDUSTRIALS | | | 780,658 | | | | 825,519 | |
| | | | | | | | | | |
| | HEALTH CARE — 16.4% | | | | | | | | |
| | Health Care Equipment and Services — 5.4% | |
| 888 | | Castlight Health Inc., Cl. B† | | | 10,210 | | | | 11,491 | |
| 2,542 | | Catamaran Corp.† | | | 119,315 | | | | 107,145 | |
| 1,925 | | Insulet Corp.† | | | 70,078 | | | | 70,936 | |
| 761 | | Universal Health Services Inc., Cl. B | | | 62,031 | | | | 79,524 | |
| | | | | | | | | | |
| | | | | 261,634 | | | | 269,096 | |
| | | | | | | | | | |
| | Pharmaceuticals, Biotechnology, and Life Sciences — 11.0% | |
| 670 | | Alexion Pharmaceuticals Inc.† | | | 91,275 | | | | 111,099 | |
| 753 | | Covance Inc.† | | | 64,878 | | | | 59,261 | |
| 4,730 | | Exact Sciences Corp.† | | | 69,167 | | | | 91,667 | |
| 399 | | Illumina Inc.† | | | 50,187 | | | | 65,404 | |
| 994 | | Incyte Corp. Ltd.† | | | 41,059 | | | | 48,756 | |
| 184 | | Mettler-Toledo International Inc.† | | | 44,250 | | | | 47,128 | |
| | | | | | | | | | |
Shares | | | | Cost | | | Market
Value | |
| 1,056 | | Vertex Pharmaceuticals Inc.† | | $ | 83,428 | | | $ | 118,599 | |
| | | | | | | | | | |
| | | | | 444,244 | | | | 541,914 | |
| | | | | | | | | | |
| | TOTAL HEALTH CARE | | | 705,878 | | | | 811,010 | |
| | | | | | | | | | |
| | CONSUMER DISCRETIONARY — 14.0% | |
| | Consumer Durables — 1.1% | | | | | | | | |
| 1,722 | | Toll Brothers Inc.† | | | 58,854 | | | | 53,658 | |
| | | | | | | | | | |
| | Consumer Services — 2.2% | | | | | | | | |
| 728 | | Hyatt Hotels Corp., Cl. A† | | | 37,485 | | | | 44,059 | |
| 1,167 | | Norwegian Cruise Line Holdings Ltd.† | | | 37,926 | | | | 42,035 | |
| 349 | | Royal Caribbean Cruises Ltd. | | | 19,014 | | | | 23,484 | |
| | | | | | | | | | |
| | | | | 94,425 | | | | 109,578 | |
| | | | | | | | | | |
| | Media — 5.6% | | | | | | | | |
| 1,929 | | Discovery Communications Inc., Cl. C† | | | 72,488 | | | | 71,913 | |
| 2,131 | | Liberty Global plc, Cl. C† | | | 81,942 | | | | 87,403 | |
| 429 | | Liberty Media Corp., Cl. A† | | | 19,570 | | | | 20,240 | |
| 858 | | Liberty Media Corp., Cl. C† | | | 38,142 | | | | 40,317 | |
| 853 | | Omnicom Group Inc. | | | 58,462 | | | | 58,738 | |
| | | | | | | | | | |
| | | | | 270,604 | | | | 278,611 | |
| | | | | | | | | | |
| | Retailing — 5.1% | | | | | | | | |
| 628 | | Bed Bath & Beyond Inc.† | | | 42,046 | | | | 41,341 | |
| 1,615 | | Ethan Allen Interiors Inc. | | | 40,284 | | | | 36,822 | |
| 486 | | O’Reilly Automotive Inc.† | | | 64,686 | | | | 73,075 | |
| 1,365 | | Urban Outfitters Inc.† | | | 52,220 | | | | 50,095 | |
| 1,272 | | zulily Inc., Cl. A† | | | 46,061 | | | | 48,196 | |
| | | | | | | | | | |
| | | |
| | | | | 245,297 | | | | 249,529 | |
| | | | | | | | | | |
| | TOTAL CONSUMER DISCRETIONARY | | | 669,180 | | | | 691,376 | |
| | | | | | | | | | |
| | INFORMATION TECHNOLOGY — 12.0% | |
| | Software and Services — 10.2% | |
| 2,796 | | Activision Blizzard Inc. | | | 54,088 | | | | 58,129 | |
| 1,217 | | Citrix Systems Inc.† | | | 76,899 | | | | 86,821 | |
| 848 | | Cornerstone OnDemand Inc.† | | | 34,680 | | | | 29,180 | |
| 5,210 | | Covisint Corp.† | | | 46,122 | | | | 21,621 | |
| 359 | | Equinix Inc.† | | | 69,761 | | | | 76,280 | |
| 4,799 | | Fortinet Inc.† | | | 102,630 | | | | 121,247 | |
| 596 | | MercadoLibre Inc. | | | 64,541 | | | | 64,755 | |
| 838 | | Splunk Inc.† | | | 45,309 | | | | 46,392 | |
| | | | | | | | | | |
| | | |
| | | | | 494,030 | | | | 504,425 | |
| | | | | | | | | | |
| | Technology Hardware and Equipment — 1.8% | |
| 1,211 | | Synaptics Inc.† | | | 69,205 | | | | 88,645 | |
| | | | | | | | | | |
| | TOTAL INFORMATION TECHNOLOGY | | | 563,235 | | | | 593,070 | |
| | | | | | | | | | |
| | ENERGY — 7.7% | | | | | | | | |
| | Energy — 7.7% | | | | | | | | |
| 1,032 | | Antero Resources Corp.† | | | 60,463 | | | | 56,646 | |
| 1,052 | | Cameron International Corp.† | | | 66,502 | | | | 69,832 | |
| 1,224 | | Noble Corp. plc | | | 35,368 | | | | 27,197 | |
| 408 | | Paragon Offshore plc† | | | 4,717 | | | | 2,509 | |
| 1,120 | | Peabody Energy Corp. | | | 18,581 | | | | 13,866 | |
| 425 | | Pioneer Natural Resources Co. | | | 77,093 | | | | 83,712 | |
| 808 | | Range Resources Corp. | | | 64,135 | | | | 54,790 | |
| 3,387 | | Weatherford International plc† | | | 56,746 | | | | 70,450 | |
| | | | | | | | | | |
| | TOTAL ENERGY | | | 383,605 | | | | 379,002 | |
| | | | | | | | | | |
See accompanying notes to financial statements.
28
TETON Westwood Mid-Cap Equity Fund
Schedule of Investments (Continued) — September 30, 2014
| | | | | | | | | | |
Shares | | | | Cost | | | Market
Value | |
| | COMMON STOCKS (Continued) | |
| | CONSUMER STAPLES — 4.0% | | | | | | | | |
| | Food and Beverage — 4.0% | | | | | | | | |
| 1,927 | | Coca-Cola Enterprises Inc. | | $ | 82,349 | | | $ | 85,482 | |
| 611 | | McCormick & Co. Inc., Non-Voting | | | 42,015 | | | | 40,876 | |
| 749 | | Mead Johnson Nutrition Co. | | | 62,658 | | | | 72,069 | |
| | | | | | | | | | |
| | TOTAL CONSUMER STAPLES | | | 187,022 | | | | 198,427 | |
| | | | | | | | | | |
| | MATERIALS — 2.9% | | | | | | | | |
| | Materials — 2.9% | | | | | | | | |
| 1,269 | | Cytec Industries Inc. | | | 55,342 | | | | 60,011 | |
| 713 | | Ecolab Inc. | | | 71,062 | | | | 81,874 | |
| | | | | | | | | | |
| | TOTAL MATERIALS | | | 126,404 | | | | 141,885 | |
| | | | | | | | | | |
| | UTILITIES — 2.4% | | | | | | | | |
| | Utilities — 2.4% | | | | | | | | |
| 2,248 | | ITC Holdings Corp. | | | 74,581 | | | | 80,096 | |
| 2,872 | | The AES Corp. | | | 38,865 | | | | 40,725 | |
| | | | | | | | | | |
| | TOTAL UTILITIES | | | 113,446 | | | | 120,821 | |
| | | | | | | | | | |
| | TOTAL COMMON STOCKS | | | 4,414,570 | | | | 4,669,169 | |
| | | | | | | | | | |
| | | | | | | | | | |
Principal
Amount | | | | Cost | | | Market
Value | |
| | U.S. GOVERNMENT OBLIGATIONS — 7.0% | |
| $345,000 | | U.S. Treasury Bills,
0.000% to 0.045%††,
10/30/14 to 03/05/15 | | $ | 344,969 | | | $ | 344,981 | |
| | | | | | | | | | |
| | | |
| | TOTAL INVESTMENTS — 101.4% | | $ | 4,759,539 | | | | 5,014,150 | |
| | | | | | | | | | |
| | |
| | Other Assets and Liabilities (Net) — (1.4)% | | | | (69,371 | ) |
| | | | | | | | | | |
| | | |
| | NET ASSETS — 100.0% | | | | | | $ | 4,944,779 | |
| | | | | | | | | | |
| † | Non-income producing security. |
| †† | Represents annualized yield at date of purchase. |
See accompanying notes to financial statements.
29
TETON Westwood Income Fund
Schedule of Investments — September 30, 2014
| | | | | | | | | | |
Shares | | | | Cost | | | Market
Value | |
| | COMMON STOCKS — 99.0% | | | | | | | | |
| | Agriculture — 0.6% | | | | | | | | |
| 1,000 | | Archer Daniels Midland Co. | | $ | 28,410 | | | $ | 51,100 | |
| | | | | | | | | | |
| | Automotive — 2.7% | | | | | | | | |
| 5,000 | | General Motors Co. | | | 163,215 | | | | 159,700 | |
| 2,300 | | Navistar International Corp.† | | | 67,619 | | | | 75,693 | |
| | | | | | | | | | |
| | | | | 230,834 | | | | 235,393 | |
| | | | | | | | | | |
| | Cable and Satellite — 2.5% | | | | | | | | |
| 1,500 | | Scripps Networks Interactive Inc., Cl. A | | | 115,203 | | | | 117,135 | |
| 700 | | Time Warner Cable Inc. | | | 93,543 | | | | 100,443 | |
| | | | | | | | | | |
| | | | | 208,746 | | | | 217,578 | |
| | | | | | | | | | |
| | Communications Equipment — 2.1% | |
| 3,000 | | Cisco Systems Inc. | | | 73,663 | | | | 75,510 | |
| 1,400 | | QUALCOMM Inc. | | | 100,380 | | | | 104,678 | |
| | | | | | | | | | |
| | | | | 174,043 | | | | 180,188 | |
| | | | | | | | | | |
| | Computer Hardware — 4.9% | | | | | | | | |
| 4,200 | | Apple Inc. | | | 237,468 | | | | 423,150 | |
| | | | | | | | | | |
| | Computer Software and Services — 0.7% | |
| 1,000 | | eBay Inc.† | | | 51,305 | | | | 56,630 | |
| | | | | | | | | | |
| | Consumer Staples — 1.2% | | | | | | | | |
| 3,000 | | Mondelēz International Inc., Cl. A | | | 63,120 | | | | 102,795 | |
| | | | | | | | | | |
| | Diversified Industrial — 4.3% | | | | | | | | |
| 7,000 | | General Electric Co. | | | 122,298 | | | | 179,340 | |
| 2,000 | | Honeywell International Inc. | | | 78,538 | | | | 186,240 | |
| | | | | | | | | | |
| | | | | 200,836 | | | | 365,580 | |
| | | | | | | | | | |
| | Electronics — 3.2% | | | | | | | | |
| 8,000 | | Intel Corp. | | | 188,828 | | | | 278,560 | |
| | | | | | | | | | |
| | Energy and Utilities: Integrated — 0.5% | |
| 1,334 | | FirstEnergy Corp. | | | 50,482 | | | | 44,782 | |
| | | | | | | | | | |
| | Energy and Utilities: Natural Gas — 2.1% | |
| 4,800 | | CONSOL Energy Inc. | | | 185,869 | | | | 181,728 | |
| | | | | | | | | | |
| | Energy and Utilities: Oil — 8.3% | | | | | | | | |
| 500 | | Apache Corp. | | | 42,855 | | | | 46,935 | |
| 1,500 | | BP plc, ADR | | | 68,990 | | | | 65,925 | |
| 1,000 | | Chevron Corp. | | | 84,889 | | | | 119,320 | |
| 2,500 | | ConocoPhillips | | | 152,078 | | | | 191,300 | |
| 1,600 | | Devon Energy Corp. | | | 95,837 | | | | 109,088 | |
| 2,250 | | Phillips 66 | | | 86,073 | | | | 182,948 | |
| | | | | | | | | | |
| | | | | 530,722 | | | | 715,516 | |
| | | | | | | | | | |
| | Energy and Utilities: Services — 3.4% | |
| 4,000 | | Halliburton Co. | | | 145,790 | | | | 258,040 | |
| 1,500 | | Noble Corp. plc | | | 59,714 | | | | 33,330 | |
| 500 | | Paragon Offshore plc† | | | 8,143 | | | | 3,075 | |
| | | | | | | | | | |
| | | | | 213,647 | | | | 294,445 | |
| | | | | | | | | | |
| | Energy and Utilities: Water — 3.1% | |
| 5,500 | | American Water Works Co. Inc. | | | 96,405 | | | | 265,265 | |
| | | | | | | | | | |
| | Environmental Services — 1.1% | | | | | | | | |
| 2,000 | | Waste Management Inc. | | | 69,920 | | | | 95,060 | |
| | | | | | | | | | |
| | Financial Services — 18.2% | | | | | | | | |
| 5,000 | | American International Group Inc. | | | 181,970 | | | | 270,100 | |
| 4,000 | | Bank of America Corp. | | | 49,700 | | | | 68,200 | |
| 3,500 | | Citigroup Inc. | | | 160,807 | | | | 181,370 | |
| 2,800 | | CME Group Inc. | | | 164,453 | | | | 223,874 | |
| | | | | | | | | | |
Shares | | | | Cost | | | Market
Value | |
| 3,400 | | JPMorgan Chase & Co. | | .$ | 159,068 | | | $ | 204,816 | |
| 6,000 | | The Blackstone Group LP | | | 202,290 | | | | 188,880 | |
| 4,000 | | U.S. Bancorp | | | 131,903 | | | | 167,320 | |
| 5,000 | | Wells Fargo & Co. | | | 157,923 | | | | 259,350 | |
| | | | | | | | | | |
| | | | | 1,208,114 | | | | 1,563,910 | |
| | | | | | | | | | |
| | Food and Beverage — 2.3% | | | | | | | | |
| 2,000 | | General Mills Inc. | | | 58,976 | | | | 100,900 | |
| 1,000 | | PepsiCo Inc. | | | 54,570 | | | | 93,090 | |
| | | | | | | | | | |
| | | | | 113,546 | | | | 193,990 | |
| | | | | | | | | | |
| | Health Care — 14.5% | | | | | | | | |
| 1,500 | | AbbVie Inc. | | | 40,989 | | | | 86,640 | |
| 2,000 | | AstraZeneca plc, ADR | | | 85,794 | | | | 142,880 | |
| 1,783 | | Bristol-Myers Squibb Co. | | | 51,086 | | | | 91,254 | |
| 1,000 | | Eli Lilly & Co. | | | 43,784 | | | | 64,850 | |
| 1,500 | | Johnson & Johnson | | | 85,403 | | | | 159,885 | |
| 3,000 | | Merck & Co. Inc. | | | 132,674 | | | | 177,840 | |
| 5,264 | | Pfizer Inc. | | | 111,058 | | | | 155,656 | |
| 2,000 | | Sanofi, ADR | | | 101,714 | | | | 112,860 | |
| 6,858 | | Zoetis Inc. | | | 196,452 | | | | 253,403 | |
| | | | | | | | | | |
| | | | | 848,954 | | | | 1,245,268 | |
| | | | | | | | | | |
| | Machinery — 2.1% | | | | | | | | |
| 5,000 | | Xylem Inc. | | | 132,724 | | | | 177,450 | |
| | | | | | | | | | |
| | Metals and Mining — 3.6% | | | | | | | | |
| 5,000 | | Barrick Gold Corp. | | | 91,137 | | | | 73,300 | |
| 5,000 | | Freeport-McMoRan Inc. | | | 189,000 | | | | 163,250 | |
| 3,000 | | Newmont Mining Corp. | | | 147,074 | | | | 69,150 | |
| | | | | | | | | | |
| | | | | 427,211 | | | | 305,700 | |
| | | | | | | | | | |
| | Paper and Forest Products — 2.6% | |
| 4,700 | | International Paper Co. | | | 134,673 | | | | 224,378 | |
| | | | | | | | | | |
| | Pharmaceuticals — 1.2% | | | | | | | | |
| 1,000 | | Gilead Sciences Inc.† | | | 72,102 | | | | 106,450 | |
| | | | | | | | | | |
| | Real Estate Investment Trusts — 1.3% | |
| 5,000 | | Starwood Property Trust Inc. | | | 89,451 | | | | 109,800 | |
| | | | | | | | | | |
| | Retail — 6.8% | | | | | | | | |
| 7,000 | | Best Buy Co. Inc. | | | 182,263 | | | | 235,130 | |
| 6,500 | | Hertz Global Holdings Inc.† | | | 183,791 | | | | 165,035 | |
| 2,000 | | The Home Depot Inc. | | | 79,247 | | | | 183,480 | |
| | | | | | | | | | |
| | | | | 445,301 | | | | 583,645 | |
| | | | | | | | | | |
| | Services — 1.0% | | | | | | | | |
| 4,000 | | Weatherford International plc† | | | 83,668 | | | | 83,200 | |
| | | | | | | | | | |
| | Specialty Chemicals — 2.8% | | | | | | | | |
| 2,200 | | E. I. du Pont de Nemours and Co. | | | 104,556 | | | | 157,872 | |
| 2,000 | | H.B. Fuller Co. | | | 76,354 | | | | 79,400 | |
| | | | | | | | | | |
| | | | | 180,910 | | | | 237,272 | |
| | | | | | | | | | |
| | Telecommunications — 1.9% | |
| 3,315 | | Verizon Communications Inc. | | | 142,414 | | | | 165,717 | |
| | | | | | | | | | |
| | TOTAL COMMON STOCKS | | | 6,409,703 | | | | 8,504,550 | |
| | | | | | | | | | |
| | TOTAL INVESTMENTS — 99.0% | | $ | 6,409,703 | | | | 8,504,550 | |
| | | | | | | | | | |
| | Other Assets and Liabilities (Net) — 1.0% | | | | 83,260 | |
| | | | | | | | | | |
| | NET ASSETS — 100.0% | | | | | | $ | 8,587,810 | |
| | | | | | | | | | |
| † | Non-income producing security. |
| ADR | American Depositary Receipt |
See accompanying notes to financial statements.
30
TETON Westwood Equity Fund
Schedule of Investments — September 30, 2014
| | | | | | | | | | |
Shares | | | | Cost | | | Market Value | |
| | COMMON STOCKS — 98.0% | |
| | Aerospace — 6.3% | | | | | | | | |
| 14,400 | | Raytheon Co. | | $ | 1,350,739 | | | $ | 1,463,328 | |
| 11,300 | | The Boeing Co. | | | 1,143,892 | | | | 1,439,394 | |
| 13,100 | | United Technologies Corp. | | | 1,399,129 | | | | 1,383,360 | |
| | | | | | | | | | |
| | | | | 3,893,760 | | | | 4,286,082 | |
| | | | | | | | | | |
| | Banking — 14.5% | | | | | | | | |
| 132,100 | | Bank of America Corp. | | | 1,401,376 | | | | 2,252,305 | |
| 25,700 | | Capital One Financial Corp. | | | 1,650,510 | | | | 2,097,634 | |
| 25,400 | | CIT Group Inc. | | | 821,437 | | | | 1,167,384 | |
| 36,884 | | JPMorgan Chase & Co. | | | 1,578,226 | | | | 2,221,892 | |
| 40,700 | | Wells Fargo & Co. | | | 1,504,094 | | | | 2,111,109 | |
| | | | | | | | | | |
| | | | | 6,955,643 | | | | 9,850,324 | |
| | | | | | | | | | |
| | Business Services — 3.5% | | | | | | | | |
| 7,000 | | FedEx Corp. | | | 923,392 | | | | 1,130,150 | |
| 14,997 | | MSC Industrial Direct Co. Inc., Cl. A | | | 1,260,147 | | | | 1,281,644 | |
| | | | | | | | | | |
| | | | | 2,183,539 | | | | 2,411,794 | |
| | | | | | | | | | |
| | Cable and Satellite — 3.7% | | | | | | | | |
| 19,400 | | AMC Networks Inc., Cl. A† | | | 1,385,121 | | | | 1,133,348 | |
| 26,100 | | Comcast Corp., Cl. A | | | 481,560 | | | | 1,403,658 | |
| | | | | | | | | | |
| | | | | 1,866,681 | | | | 2,537,006 | |
| | | | | | | | | | |
| | Communications Equipment — 3.8% | |
| 45,300 | | ARRIS Group Inc.† | | | 1,397,893 | | | | 1,284,481 | |
| 17,700 | | QUALCOMM Inc. | | | 1,171,730 | | | | 1,323,429 | |
| | | | | | | | | | |
| | | | | 2,569,623 | | | | 2,607,910 | |
| | | | | | | | | | |
| | Computer Hardware — 2.1% | | | | | | | | |
| 14,000 | | Apple Inc. | | | 1,063,400 | | | | 1,410,500 | |
| | | | | | | | | | |
| | Computer Software and Services — 2.0% | |
| 24,000 | | eBay Inc.† | | | 1,299,245 | | | | 1,359,120 | |
| | | | | | | | | | |
| | Consumer Products — 2.0% | | | | | | | | |
| 20,700 | | Colgate-Palmolive Co. | | | 1,182,031 | | | | 1,350,054 | |
| | | | | | | | | | |
| | Consumer Services — 1.0% | | | | | | | | |
| 10,100 | | IAC/InterActiveCorp | | | 521,527 | | | | 665,590 | |
| | | | | | | | | | |
| | Diversified Industrial — 3.1% | | | | | | | | |
| 22,400 | | Honeywell International Inc. | | | 1,323,857 | | | | 2,085,888 | |
| | | | | | | | | | |
| | Electronics — 1.8% | | | | | | | | |
| 15,700 | | WESCO International Inc.† | | | 1,242,820 | | | | 1,228,682 | |
| | | | | | | | | | |
| | Energy and Energy Services — 1.8% | |
| 12,100 | | EOG Resources Inc. | | | 1,029,308 | | | | 1,198,142 | |
| | | | | | | | | | |
| | Energy: Integrated — 1.9% | | | | | | | | |
| 13,900 | | NextEra Energy Inc. | | | 1,062,078 | | | | 1,304,932 | |
| | | | | | | | | | |
| | Energy: Natural Gas — 0.8% | | | | | | | | |
| 6,200 | | EQT Corp. | | | 312,207 | | | | 567,548 | |
| | | | | | | | | | |
| | Energy: Oil — 5.8% | | | | | | | | |
| 10,800 | | Chevron Corp. | | | 739,557 | | | | 1,288,656 | |
| 13,900 | | Exxon Mobil Corp. | | | 1,197,591 | | | | 1,307,295 | |
| 13,810 | | Occidental Petroleum Corp. | | | 1,114,319 | | | | 1,327,832 | |
| | | | | | | | | | |
| | | | | 3,051,467 | | | | 3,923,783 | |
| | | | | | | | | | |
| | Entertainment — 4.8% | | | | | | | | |
| 26,800 | | Time Warner Inc. | | | 1,581,274 | | | | 2,015,628 | |
| | | | | | | | | | |
Shares | | | | Cost | | | Market Value | |
| 16,300 | | Viacom Inc., Cl. B | | $ | 954,473 | | | $ | 1,254,122 | |
| | | | | | | | | | |
| | | | | 2,535,747 | | | | 3,269,750 | |
| | | | | | | | | | |
| | Financial Services — 6.9% | | | | | | | | |
| 25,500 | | American International Group Inc. | | | 897,767 | | | | 1,377,510 | |
| 36,900 | | Invesco Ltd. | | | 1,338,177 | | | | 1,456,812 | |
| 12,600 | | MetLife Inc. | | | 680,314 | | | | 676,872 | |
| 31,100 | | The Hartford Financial Services Group Inc. | | | 739,878 | | | | 1,158,475 | |
| | | | | | | | | | |
| | | | | 3,656,136 | | | | 4,669,669 | |
| | | | | | | | | | |
| | Food and Beverage — 6.5% | | | | | | | | |
| 19,500 | | General Mills Inc. | | | 759,713 | | | | 983,775 | |
| 19,700 | | McCormick & Co. Inc., Non-Voting | | | 1,333,727 | | | | 1,317,930 | |
| 15,900 | | PepsiCo Inc. | | | 989,029 | | | | 1,480,131 | |
| 6,600 | | The J.M. Smucker Co. | | | 679,366 | | | | 653,334 | |
| | | | | | | | | | |
| | | | | 3,761,835 | | | | 4,435,170 | |
| | | | | | | | | | |
| | Health Care — 10.2% | | | | | | | | |
| 34,400 | | Abbott Laboratories | | | 1,209,560 | | | | 1,430,696 | |
| 11,800 | | Becton, Dickinson and Co. | | | 1,277,590 | | | | 1,342,958 | |
| 14,600 | | Cigna Corp. | | | 1,286,120 | | | | 1,324,074 | |
| 20,500 | | Express Scripts Holding Co.† | | | 1,267,630 | | | | 1,447,915 | |
| 13,400 | | Johnson & Johnson | | | 1,165,600 | | | | 1,428,306 | |
| | | | | | | | | | |
| | | | | 6,206,500 | | | | 6,973,949 | |
| | | | | | | | | | |
| | Retail — 6.3% | | | | | | | | |
| 5,145 | | Advance Auto Parts Inc. | | | 425,736 | | | | 670,393 | |
| 36,400 | | Target Corp. | | | 2,296,654 | | | | 2,281,552 | |
| 15,000 | | The Home Depot Inc. | | | 1,203,871 | | | | 1,376,100 | |
| | | | | | | | | | |
| | | | | 3,926,261 | | | | 4,328,045 | |
| | | | | | | | | | |
| | Semiconductors — 1.9% | | | | | | | | |
| 22,200 | | Skyworks Solutions Inc. | | | 814,091 | | | | 1,288,710 | |
| | | | | | | | | | |
| | Telecommunications — 5.1% | |
| 44,500 | | Amdocs Ltd. | | | 1,711,586 | | | | 2,041,660 | |
| 28,500 | | Verizon Communications Inc. | | | 1,406,679 | | | | 1,424,715 | |
| | | | | | | | | | |
| | | | | 3,118,265 | | | | 3,466,375 | |
| | | | | | | | | | |
| | Transportation — 2.2% | | | | | | | | |
| 14,100 | | Union Pacific Corp. | | | 513,630 | | | | 1,528,722 | |
| | | | | | | | | | |
| | TOTAL COMMON STOCKS | | | 54,089,651 | | | | 66,747,745 | |
| | | | | | | | | | |
| | SHORT TERM INVESTMENT — 2.2% | |
| | Mutual Fund — 2.2% | | | | | | | | |
| 1,502,210 | | Dreyfus Cash Management, 0.030%* | | | 1,502,210 | | | | 1,502,210 | |
| | | | | | | | | | |
| | TOTAL
INVESTMENTS — 100.2% | | $ | 55,591,861 | | | | 68,249,955 | |
| | | | | | | | | | |
| | Other Assets and Liabilities (Net) — (0.2)% | | | | (111,112 | ) |
| | | | | | | | | | |
| | NET ASSETS — 100.0% | | | | | | $ | 68,138,843 | |
| | | | | | | | | | |
| † | Non-income producing security. |
See accompanying notes to financial statements.
31
TETON Westwood Balanced Fund
Schedule of Investments — September 30, 2014
| | | | | | | | | | | | |
Shares | | | | | Cost | | | Market
Value | |
| | | | COMMON STOCKS — 62.4% | |
| | | | Aerospace — 3.7% | | | | | | | | |
| | 10,500 | | | Raytheon Co. | | $ | 985,275 | | | $ | 1,067,010 | |
| | 8,100 | | | The Boeing Co. | | | 770,751 | | | | 1,031,778 | |
| | 9,400 | | | United Technologies Corp. | | | 978,492 | | | | 992,640 | |
| | | | | | | | | | | | |
| | | | | | | 2,734,518 | | | | 3,091,428 | |
| | | | | | | | | | | | |
| | | | Banking — 8.8% | | | | | | | | |
| | 90,100 | | | Bank of America Corp. | | | 559,023 | | | | 1,536,205 | |
| | 18,300 | | | Capital One Financial Corp. | | | 1,127,528 | | | | 1,493,646 | |
| | 19,900 | | | CIT Group Inc. | | | 642,067 | | | | 914,604 | |
| | 27,796 | | | JPMorgan Chase & Co. | | | 1,063,873 | | | | 1,674,431 | |
| | 32,700 | | | Wells Fargo & Co. | | | 1,109,869 | | | | 1,696,149 | |
| | | | | | | | | | | | |
| | | | | | | 4,502,360 | | | | 7,315,035 | |
| | | | | | | | | | | | |
| | | | Business Services — 1.1% | | | | | | | | |
| | 5,700 | | | FedEx Corp. | | | 748,999 | | | | 920,265 | |
| | | | | | | | | | | | |
| | | | Cable and Satellite — 2.2% | | | | | | | | |
| | 13,300 | | | AMC Networks Inc., Cl. A† | | | 952,025 | | | | 776,986 | |
| | 19,600 | | | Comcast Corp., Cl. A | | | 363,281 | | | | 1,054,088 | |
| | | | | | | | | | | | |
| | | | | | | 1,315,306 | | | | 1,831,074 | |
| | | | | | | | | | | | |
| | |
| | | | Communications Equipment — 2.3% | | | | | |
| | 32,900 | | | ARRIS Group Inc.† | | | 1,013,268 | | | | 932,879 | |
| | 13,700 | | | QUALCOMM Inc. | | | 906,346 | | | | 1,024,349 | |
| | | | | | | | | | | | |
| | | | | | | 1,919,614 | | | | 1,957,228 | |
| | | | | | | | | | | | |
| | | | Computer Hardware — 1.2% | | | | | | | | |
| | 10,150 | | | Apple Inc. | | | 769,813 | | | | 1,022,612 | |
| | | | | | | | | | | | |
| | | | Computer Software and Services — 1.2% | |
| | 17,500 | | | eBay Inc.† | | | 947,512 | | | | 991,025 | |
| | | | | | | | | | | | |
| | | | Consumer Products — 1.4% | | | | | | | | |
| | 18,400 | | | Colgate-Palmolive Co. | | | 1,049,365 | | | | 1,200,048 | |
| | | | | | | | | | | | |
| | | | Consumer Services — 0.8% | | | | | | | | |
| | 9,500 | | | IAC/InterActiveCorp. | | | 503,400 | | | | 626,050 | |
| | | | | | | | | | | | |
| | | | Diversified Industrial — 1.8% | | | | | | | | |
| | 15,925 | | | Honeywell International Inc. | | | 945,457 | | | | 1,482,936 | |
| | | | | | | | | | | | |
| | | | Electronics — 1.1% | | | | | | | | |
| | 11,800 | | | WESCO International Inc.† | | | 928,138 | | | | 923,468 | |
| | | | | | | | | | | | |
| | | | Energy and Energy Services — 1.2% | | | | | |
| | 10,000 | | | EOG Resources Inc. | | | 865,832 | | | | 990,200 | |
| | | | | | | | | | | | |
| | | | Energy: Integrated — 1.5% | | | | | | | | |
| | 13,700 | | | NextEra Energy Inc. | | | 1,043,966 | | | | 1,286,156 | |
| | | | | | | | | | | | |
| | | | Energy: Natural Gas — 0.7% | | | | | | | | |
| | 6,400 | | | EQT Corp. | | | 334,857 | | | | 585,856 | |
| | | | | | | | | | | | |
| | | | Energy: Oil — 3.8% | | | | | | | | |
| | 9,400 | | | Chevron Corp. | | | 621,814 | | | | 1,121,608 | |
| | 10,700 | | | Exxon Mobil Corp. | | | 928,158 | | | | 1,006,335 | |
| | 10,700 | | | Occidental Petroleum Corp. | | | 849,183 | | | | 1,028,805 | |
| | | | | | | | | | | | |
| | | |
| | | | | | | 2,399,155 | | | | 3,156,748 | |
| | | | | | | | | | | | |
| | | | Entertainment — 3.0% | | | | | | | | |
| | 19,500 | | | Time Warner Inc. | | | 967,239 | | | | 1,466,595 | |
| | 13,100 | | | Viacom Inc., Cl. B | | | 766,503 | | | | 1,007,914 | |
| | | | | | | | | | | | |
| | | |
| | | | | | | 1,733,742 | | | | 2,474,509 | |
| | | | | | | | | | | | |
| | | | Equipment and Supplies — 1.2% | | | | | |
| | 11,500 | | | MSC Industrial Direct Co. Inc., Cl. A | | | 963,427 | | | | 982,790 | |
| | | | | | | | | | | | |
| | | | Financial Services — 4.6% | | | | | | | | |
| | 21,400 | | | American International Group Inc. | | | 715,595 | | | | 1,156,028 | |
| | 27,500 | | | Invesco Ltd. | | | 998,493 | | | | 1,085,700 | |
| | 10,000 | | | MetLife Inc. | | | 488,187 | | | | 537,200 | |
| | | | | | | | | | | | |
Shares | | | | | Cost | | | Market
Value | |
| | 27,600 | | | The Hartford Financial Services Group Inc. | | $ | 653,468 | | | $ | 1,028,100 | |
| | | | | | | | | | | | |
| | | | | | | 2,855,743 | | | | 3,807,028 | |
| | | | | | | | | | | | |
| | | | Food and Beverage — 4.4% | |
| | 15,900 | | | General Mills Inc. | | | 619,889 | | | | 802,155 | |
| | 15,300 | | | McCormick & Co. Inc., Non-Voting | | | 1,033,549 | | | | 1,023,570 | |
| | 14,500 | | | PepsiCo Inc. | | | 893,634 | | | | 1,349,805 | |
| | 4,800 | | | The J.M. Smucker Co. | | | 494,156 | | | | 475,152 | |
| | | | | | | | | | | | |
| | | | | | | 3,041,228 | | | | 3,650,682 | |
| | | | | | | | | | | | |
| | | | Health Care — 6.4% | | | | | | | | |
| | 27,200 | | | Abbott Laboratories | | | 946,605 | | | | 1,131,248 | |
| | 9,100 | | | Becton, Dickinson and Co. | | | 983,093 | | | | 1,035,671 | |
| | 10,600 | | | Cigna Corp. | | | 926,398 | | | | 961,314 | |
| | 16,500 | | | Express Scripts Holding Co.† | | | 1,021,819 | | | | 1,165,395 | |
| | 9,800 | | | Johnson & Johnson | | | 839,616 | | | | 1,044,582 | |
| | | | | | | | | | | | |
| | | | | | | 4,717,531 | | | | 5,338,210 | |
| | | | | | | | | | | | |
| | | | Retail — 3.9% | | | | | | | | |
| | 3,665 | | | Advance Auto Parts Inc. | | | 303,220 | | | | 477,549 | |
| | 26,700 | | | Target Corp. | | | 1,673,619 | | | | 1,673,556 | |
| | 12,400 | | | The Home Depot Inc. | | | 994,370 | | | | 1,137,576 | |
| | | | | | | | | | | | |
| | | | | | | 2,971,209 | | | | 3,288,681 | |
| | | | | | | | | | | | |
| | | | Semiconductors — 1.4% | | | | | | | | |
| | 20,600 | | | Skyworks Solutions Inc. | | | 749,778 | | | | 1,195,830 | |
| | | | | | | | | | | | |
| | | | Telecommunications — 3.1% | |
| | 34,000 | | | Amdocs Ltd. | | | 1,302,884 | | | | 1,559,920 | |
| | 20,500 | | | Verizon Communications Inc. | | | 1,011,816 | | | | 1,024,795 | |
| | | | | | | | | | | | |
| | | |
| | | | | | | 2,314,700 | | | | 2,584,715 | |
| | | | | | | | | | | | |
| | | | Transportation — 1.6% | | | | | | | | |
| | 12,200 | | | Union Pacific Corp. | | | 416,012 | | | | 1,322,724 | |
| | | | | | | | | | | | |
| | | |
| | | | TOTAL COMMON STOCKS | | | 40,771,662 | | | | 52,025,298 | |
| | | | | | | | | | | | |
| | | |
Principal
Amount | | | | | | | | | |
| | | | CORPORATE BONDS — 16.8% | | | | | |
| | | | Banking — 4.8% | | | | | | | | |
| $ | 750,000 | | | Barclays Bank plc, Ser. 1,
5.000%, 09/22/16 | | | 761,442 | | | | 805,491 | |
| | 1,125,000 | | | Citigroup Inc., MTN,
5.500%, 10/15/14 | | | 1,125,037 | | | | 1,125,037 | |
| | 750,000 | | | JPMorgan Chase & Co.,
6.300%, 04/23/19 | | | 762,923 | | | | 870,476 | |
| | 600,000 | | | The Goldman Sachs Group Inc., MTN, 3.850%, 07/08/24 | | | 600,368 | | | | 597,180 | |
| | 600,000 | | | Wells Fargo & Co., MTN,
3.500%, 03/08/22 | | | 615,947 | | | | 613,895 | |
| | | | | | | | | | | | |
| | | |
| | | | | | | 3,865,717 | | | | 4,012,079 | |
| | | | | | | | | | | | |
| | | | Computer Hardware — 0.8% | |
| | 650,000 | | | International Business Machines Corp., 2.900%, 11/01/21 | | | 659,159 | | | | 657,513 | |
| | | | | | | | | | | | |
| | | | Consumer Products — 1.5% | |
| | 500,000 | | | Colgate-Palmolive Co., MTN, 2.100%, 05/01/23 | | | 494,563 | | | | 469,346 | |
| | 800,000 | | | Costco Wholesale Corp.,
1.700%, 12/15/19 | | | 790,262 | | | | 782,290 | |
| | | | | | | | | | | | |
| | | |
| | | | | | | 1,284,825 | | | | 1,251,636 | |
| | | | | | | | | | | | |
See accompanying notes to financial statements.
32
TETON Westwood Balanced Fund
Schedule of Investments (Continued) — September 30, 2014
| | | | | | | | | | | | |
Principal
Amount | | | | | Cost | | | Market
Value | |
| | | | CORPORATE BONDS (Continued) | |
| | | | Diversified Industrial — 1.0% | |
| | $ 800,000 | | | John Deere Capital Corp., MTN, 1.950%, 12/13/18 | | $ | 801,877 | | | $ | 799,130 | |
| | | | | | | | | | | | |
| | | | Electronics — 1.8% | | | | | | | | |
| | 1,000,000 | | | Intel Corp., 3.300%, 10/01/21 | | | 1,030,664 | | | | 1,030,097 | |
| | 500,000 | | | Texas Instruments Inc.,
1.650%, 08/03/19 | | | 498,680 | | | | 486,841 | |
| | | | | | | | | | | | |
| | | | | | | 1,529,344 | | | | 1,516,938 | |
| | | | | | | | | | | | |
| | | | Energy: Oil — 3.6% | | | | | | | | |
| | 1,000,000 | | | Anadarko Petroleum Corp., 5.950%, 09/15/16 | | | 992,762 | | | | 1,091,317 | |
| | 500,000 | | | Marathon Oil Corp.,
5.900%, 03/15/18 | | | 501,191 | | | | 565,779 | |
| | 800,000 | | | Occidental Petroleum Corp., 2.700%, 02/15/23 | | | 747,641 | | | | 769,241 | |
| | 500,000 | | | XTO Energy Inc.,
6.500%, 12/15/18 | | | 539,361 | | | | 592,425 | |
| | | | | | | | | | | | |
| | | | | | | 2,780,955 | | | | 3,018,762 | |
| | | | | | | | | | | | |
| | | | Financial Services — 1.2% | |
| | 950,000 | | | ACE INA Holdings Inc.,
5.600%, 05/15/15 | | | 952,953 | | | | 979,928 | |
| | | | | | | | | | | | |
| | | | Real Estate Investment Trusts — 0.8% | |
| | 700,000 | | | Vornado Realty LP,
4.250%, 04/01/15 | | | 699,675 | | | | 706,452 | |
| | | | | | | | | | | | |
| | | | Transportation — 1.3% | |
| | 1,000,000 | | | Burlington Northern Santa Fe LLC, 5.650%, 05/01/17 | | | 994,180 | | | | 1,109,406 | |
| | | | | | | | | | | | |
| | | | TOTAL CORPORATE BONDS | | | 13,568,685 | | | | 14,051,844 | |
| | | | | | | | | | | | |
| | | | U.S. GOVERNMENT AGENCY
OBLIGATIONS — 9.4% | |
| | | | Federal Home Loan Mortgage Corp. — 4.6% | |
| | 800,000 | | | 1.750%, 09/10/15 | | | 810,867 | | | | 811,778 | |
| | 1,500,000 | | | 3.750%, 03/27/19 | | | 1,497,101 | | | | 1,624,931 | |
| | 600,000 | | | 1.750%, 05/30/19 | | | 593,954 | | | | 598,582 | |
| | 800,000 | | | 2.375%, 01/13/22 | | | 800,000 | | | | 795,903 | |
| | | | | | | | | | | | |
| | | | | | | 3,701,922 | | | | 3,831,194 | |
| | | | | | | | | | | | |
| | | | Federal National Mortgage Association — 4.8% | |
| | 1,500,000 | | | 5.000%, 04/15/15 | | | 1,505,214 | | | | 1,539,657 | |
| | 800,000 | | | 0.625%, 08/26/16 | | | 801,714 | | | | 800,663 | |
| | 800,000 | | | 1.125%, 04/27/17 | | | 804,218 | | | | 804,222 | |
| | 775,000 | | | 5.375%, 06/12/17 | | | 799,064 | | | | 865,153 | |
| | | | | | | | | | | | |
| | | |
| | | | | | | 3,910,210 | | | | 4,009,695 | |
| | | | | | | | | | | | |
| | | | TOTAL U.S. GOVERNMENT AGENCY OBLIGATIONS | | | 7,612,132 | | | | 7,840,889 | |
| | | | | | | | | | | | |
| | | | | | | | | | | | |
Principal
Amount | | | | | Cost | | | Market
Value | |
| | | | U.S. GOVERNMENT OBLIGATIONS — 6.8% | |
| | | | U.S. Treasury Inflation Indexed Notes — 4.5% | |
| | $1,415,700 | | | 2.500%, 07/15/16 | | $ | 1,416,286 | | | $ | 1,503,628 | |
| | 998,730 | | | 2.125%, 01/15/19 | | | 1,008,738 | | | | 1,091,737 | |
| | 1,101,770 | | | 1.375%, 01/15/20 | | | 1,129,570 | | | | 1,172,696 | |
| | | | | | | | | | | | |
| | | | | | | 3,554,594 | | | | 3,768,061 | |
| | | | | | | | | | | | |
| | | | U.S. Treasury Notes — 2.3% | |
| | 1,000,000 | | | 3.625%, 08/15/19 | | | 1,013,701 | | | | 1,087,227 | |
| | 750,000 | | | 3.375%, 11/15/19 | | | 810,476 | | | | 807,686 | |
| | | | | | | | | | | | |
| | | | | | | 1,824,177 | | | | 1,894,913 | |
| | | | | | | | | | | | |
| | | |
| | | | TOTAL U.S. GOVERNMENT OBLIGATIONS | | | 5,378,771 | | | | 5,662,974 | |
| | | | | | | | | | | | |
| | | |
Shares | | | | | | | | | |
| | | | SHORT TERM INVESTMENT — 5.1% | |
| | | | Mutual Fund — 5.1% | | | | | | | | |
| | 4,262,082 | | | Dreyfus Cash Management, 0.030%* | | | 4,262,082 | | | | 4,262,082 | |
| | | | | | | | | | | | |
| | | |
| | | | TOTAL
INVESTMENTS — 100.5% | | $ | 71,593,332 | | | | 83,843,087 | |
| | | | | | | | | | | | |
| | | | Other Assets and Liabilities
(Net) — (0.5)% | | | | (424,725 | ) |
| | | | | | | | | | | | |
| | | | NET ASSETS — 100.0% | | | | | | $ | 83,418,362 | |
| | | | | | | | | | | | |
| † | Non-income producing security. |
MTN Medium Term Note
See accompanying notes to financial statements.
33
TETON Westwood Intermediate Bond Fund
Schedule of Investments (Continued) — September 30, 2014
| | | | | | | | | | | | |
Principal
Amount | | | | | Cost | | | Market
Value | |
| | | | CORPORATE BONDS — 43.2% | | | | | |
| | | | Aerospace — 1.1% | | | | | | | | |
| | $ 200,000 | | | The Boeing Co., 6.000%, 03/15/19 | | $ | 202,856 | | | $ | 232,557 | |
| | | | | | | | | | | | |
| | | | Automotive — 1.7% | | | | | | | | |
| | 350,000 | | | Toyota Motor Credit Corp., MTN, 1.750%, 05/22/17 | | | 353,055 | | | | 354,670 | |
| | | | | | | | | | | | |
| | | |
| | | | Banking — 5.0% | | | | | | | | |
| | 300,000 | | | Bank of America Corp., MTN, Ser. L, 5.650%, 05/01/18 | | | 331,160 | | | | 333,962 | |
| | 225,000 | | | Barclays Bank plc, Ser.
1, 5.000%, 09/22/16 | | | 225,376 | | | | 241,647 | |
| | 250,000 | | | Citigroup Inc., MTN,
5.500%, 10/15/14 | | | 250,008 | | | | 250,008 | |
| | 200,000 | | | JPMorgan Chase & Co.,
6.300%, 04/23/19 | | | 199,299 | | | | 232,127 | |
| | | | | | | | | | | | |
| | | | | | | 1,005,843 | | | | 1,057,744 | |
| | | | | | | | | | | | |
| | | | Computer Hardware — 3.1% | |
| | 300,000 | | | Apple Inc., 0.489%,
05/03/18(a) | | | 300,560 | | | | 300,702 | |
| | 360,000 | | | International Business Machines Corp., 2.900%, 11/01/21 | | | 365,072 | | | | 364,161 | |
| | | | | | | | | | | | |
| | | | | | | 665,632 | | | | 664,863 | |
| | | | | | | | | | | | |
| | | | Computer Software and Services — 3.1% | |
| | 250,000 | | | Microsoft Corp., 1.625%, 09/25/15 | | | 249,885 | | | | 253,392 | |
| | 400,000 | | | Oracle Corp., 3.625%, 07/15/23 | | | 400,209 | | | | 411,282 | |
| | | | | | | | | | | | |
| | | | | | | 650,094 | | | | 664,674 | |
| | | | | | | | | | | | |
| | | | Consumer Products — 1.8% | | | | | | | | |
| | 400,000 | | | Costco Wholesale Corp.,
1.700%, 12/15/19 | | | 395,131 | | | | 391,145 | |
| | | | | | | | | | | | |
| | | | Diversified Industrial — 3.3% | |
| | 400,000 | | | General Electric Capital Corp., 1.625%, 07/02/15 | | | 402,501 | | | | 403,879 | |
| | 300,000 | | | John Deere Capital Corp., MTN, 1.950%, 12/13/18 | | | 302,346 | | | | 299,674 | |
| | | | | | | | | | | | |
| | | | | | | 704,847 | | | | 703,553 | |
| | | | | | | | | | | | |
| | | | Electronics — 2.4% | | | | | | | | |
| | 200,000 | | | Arrow Electronics Inc.,
6.000%, 04/01/20 | | | 199,866 | | | | 226,980 | |
| | 300,000 | | | Texas Instruments Inc.,
1.650%, 08/03/19 | | | 299,201 | | | | 292,105 | |
| | | | | | | | | | | | |
| | | | | | | 499,067 | | | | 519,085 | |
| | | | | | | | | | | | |
| | | | Energy and Utilities: Electric — 1.5% | |
| | 275,000 | | | Dominion Resources Inc.,
6.400%, 06/15/18 | | | 305,355 | | | | 316,631 | |
| | | | | | | | | | | | |
| | | | Energy and Utilities: Oil — 5.7% | |
| | 200,000 | | | Anadarko Petroleum Corp.,
5.950%, 09/15/16 | | | 198,558 | | | | 218,263 | |
| | 125,000 | | | Marathon Oil Corp.,
5.900%, 03/15/18 | | | 125,298 | | | | 141,445 | |
| | 400,000 | | | Murphy Oil Corp.,
2.500%, 12/01/17 | | | 401,709 | | | | 406,599 | |
| | 200,000 | | | Total Capital SA,
3.000%, 06/24/15 | | | 202,376 | | | | 203,887 | |
| | | | | | | | | | | | |
Principal
Amount | | | | | Cost | | | Market
Value | |
| | $ 200,000 | | | XTO Energy Inc.,
6.500%, 12/15/18 | | $ | 215,744 | | | $ | 236,970 | |
| | | | | | | | | | | | |
| | | | | | | 1,143,685 | | | | 1,207,164 | |
| | | | | | | | | | | | |
| | | | Financial Services — 3.6% | | | | | | | | |
| | 175,000 | | | ACE INA Holdings Inc.,
5.600%, 05/15/15 | | | 174,863 | | | | 180,513 | |
| | 260,000 | | | International Bank for Reconstruction & Development,
8.625%, 10/15/16 | | | 270,908 | | | | 300,131 | |
| | 275,000 | | | Merrill Lynch & Co. Inc., MTN, Ser. C, 5.000%, 01/15/15 | | | 275,010 | | | | 278,581 | |
| | | | | | | | | | | | |
| | | | | | | 720,781 | | | | 759,225 | |
| | | | | | | | | | | | |
| | | | Food and Beverage — 2.8% | | | | | | | | |
| | 275,000 | | | Bottling Group LLC,
5.125%, 01/15/19 | | | 305,892 | | | | 308,024 | |
| | 250,000 | | | Mondelēz International Inc.,
5.375%, 02/10/20 | | | 252,698 | | | | 283,772 | |
| | | | | | | | | | | | |
| | | | | | | 558,590 | | | | 591,796 | |
| | | | | | | | | | | | |
| | | | Health Care — 1.5% | | | | | | | | |
| | 325,000 | | | Teva Pharmaceutical Finance IV BV, 3.650%, 11/10/21 | | | 329,768 | | | | 330,846 | |
| | | | | | | | | | | | |
| | | | Real Estate Investment Trusts — 1.2% | |
| | 250,000 | | | Vornado Realty LP,
4.250%, 04/01/15 | | | 249,897 | | | | 252,304 | |
| | | | | | | | | | | | |
| | | | Semiconductors — 1.7% | | | | | | | | |
| | 350,000 | | | Intel Corp., 3.300%, 10/01/21 | | | 349,393 | | | | 360,534 | |
| | | | | | | | | | | | |
| | | | Telecommunications — 2.4% | |
| | 500,000 | | | AT&T Inc., 1.700%, 06/01/17 | | | 505,264 | | | | 504,441 | |
| | | | | | | | | | | | |
| | | | Transportation — 1.3% | | | | | | | | |
| | 200,000 | | | Burlington Northern Santa Fe LLC, 5.650%, 05/01/17 | | | 199,687 | | | | 221,881 | |
| | 65,000 | | | CSX Corp., 6.250%, 04/01/15 | | | 64,997 | | | | 66,861 | |
| | | | | | | | | | | | |
| | | |
| | | | | | | 264,684 | | | | 288,742 | |
| | | | | | | | | | | | |
| | | |
| | | | TOTAL CORPORATE BONDS | | | 8,903,942 | | | | 9,199,974 | |
| | | | | | | | | | | | |
| | | | U.S. GOVERNMENT AGENCY OBLIGATIONS — 32.0% | |
| | | | Federal Home Loan Bank — 1.3% | |
| | 250,000 | | | 5.375%, 05/18/16, Ser. 656 | | | 250,332 | | | | 269,839 | |
| | | | | | | | | | | | |
| | | | Federal Home Loan Mortgage Corp. — 13.3% | |
| | 900,000 | | | 1.750%, 09/10/15 | | | 911,505 | | | | 913,251 | |
| | 325,000 | | | 5.250%, 04/18/16 | | | 335,200 | | | | 348,994 | |
| | 600,000 | | | 3.750%, 03/27/19 | | | 626,234 | | | | 649,972 | |
| | 450,000 | | | 1.750%, 05/30/19 | | | 445,465 | | | | 448,936 | |
| | 475,000 | | | 2.375%, 01/13/22 | | | 475,000 | | | | 472,568 | |
| | | | | | | | | | | | |
| | | |
| | | | | | | 2,793,404 | | | | 2,833,721 | |
| | | | | | | | | | | | |
| | | | Federal National Mortgage Association — 16.8% | |
| | 700,000 | | | 2.625%, 11/20/14 | | | 701,979 | | | | 701,979 | |
| | 600,000 | | | 5.000%, 04/15/15 | | | 608,782 | | | | 615,863 | |
| | 650,000 | | | 2.375%, 07/28/15 | | | 658,808 | | | | 661,677 | |
| | 450,000 | | | 0.625%, 08/26/16 | | | 450,964 | | | | 450,373 | |
| | 800,000 | | | 1.125%, 04/27/17 | | | 805,982 | | | | 804,222 | |
| | 275,000 | | | 5.375%, 06/12/17 | | | 283,539 | | | | 306,990 | |
See accompanying notes to financial statements.
34
TETON Westwood Intermediate Bond Fund
Schedule of Investments (Continued) — September 30, 2014
| | | | | | | | | | | | |
Principal
Amount | | | | | Cost | | | Market
Value | |
| | | | U.S. GOVERNMENT AGENCY
OBLIGATIONS (Continued) | | | | | |
| | | | Federal National Mortgage Association (Continued) | |
| | $ 20,582 | | | Pool #745122, 5.500%, 09/01/20 | | $ | 20,453 | | | $ | 22,384 | |
| | 18,673 | | | Pool #255554, 5.500%, 01/01/35 | | | 18,796 | | | | 20,934 | |
| | | | | | | | | | | | |
| | | | | | | 3,549,303 | | | | 3,584,422 | |
| | | | | | | | | | | | |
| | | | Government National Mortgage Association — 0.6% | |
| | 8,491 | | | Pool #562288, 6.000%, 12/15/33 | | | 8,568 | | | | 9,822 | |
| | 26,084 | | | Pool #604946, 5.500%, 01/15/34 | | | 26,253 | | | | 29,802 | |
| | 18,746 | | | Pool #604970, 5.500%, 01/15/34 | | | 18,828 | | | | 21,068 | |
| | 31,346 | | | Pool #003747, 5.000%, 08/20/35 | | | 31,112 | | | | 34,874 | |
| | 28,578 | | | Pool #550728, 5.500%, 11/15/35 | | | 28,569 | | | | 31,976 | |
| | | | | | | | | | | | |
| | | | | | | 113,330 | | | | 127,542 | |
| | | | | | | | | | | | |
| | | | TOTAL U.S. GOVERNMENT AGENCY OBLIGATIONS | | | 6,706,369 | | | | 6,815,524 | |
| | | | | | | | | | | | |
| | | | U.S. GOVERNMENT OBLIGATIONS — 17.6% | |
| | | | U.S. Treasury Inflation Indexed Notes — 8.7% | |
| | 324,431 | | | 2.500%, 07/15/16 | | | 324,572 | | | | 344,581 | |
| | 331,461 | | | 1.375%, 07/15/18 | | | 313,483 | | | | 352,320 | |
| | 305,169 | | | 2.125%, 01/15/19 | | | 308,018 | | | | 333,586 | |
| | 330,531 | | | 1.375%, 01/15/20 | | | 343,904 | | | | 351,809 | |
| | 388,395 | | | 2.500%, 01/15/29 | | | 406,945 | | | | 474,449 | |
| | | | | | | | | | | | |
| | | | | | | 1,696,922 | | | | 1,856,745 | |
| | | | | | | | | | | | |
| | | | | | | | | | | | |
Principal
Amount | | | | | Cost | | | Market
Value | |
| | | | U.S. Treasury Notes — 8.0% | |
| | $ 675,000 | | | 3.250%, 05/31/16 | | $ | 706,853 | | | $ | 706,482 | |
| | 275,000 | | | 3.500%, 02/15/18 | | | 275,166 | | | | 295,023 | |
| | 650,000 | | | 3.375%, 11/15/19 | | | 667,271 | | | | 699,994 | |
| | | | | | | | | | | | |
| | | | | | | 1,649,290 | | | | 1,701,499 | |
| | | | | | | | | | | | |
| | | | U.S. Treasury Bonds — 0.9% | |
| | 150,000 | | | 5.375%, 02/15/31 | | | 165,240 | | | | 198,598 | |
| | | | | | | | | | | | |
| | | | TOTAL U.S. GOVERNMENT OBLIGATIONS | | | 3,511,452 | | | | 3,756,842 | |
| | | | | | | | | | | | |
Shares | | | | | | | | | |
| | | | SHORT TERM INVESTMENT — 8.2% | |
| | | | Mutual Fund — 8.2% | |
| | 1,740,090 | | | Dreyfus Cash Management, 0.030%* | | | 1,740,090 | | | | 1,740,090 | |
| | | | | | | | | | | | |
| | | | TOTAL
INVESTMENTS —101.0% | | $ | 20,861,853 | | | | 21,512,430 | |
| | | | | | | | | | | | |
| | | | Other Assets and Liabilities
(Net) — (1.0)% | | | | (202,541 | ) |
| | | | | | | | | | | | |
| | | | NET ASSETS — 100.0% | | | | | | $ | 21,309,889 | |
| | | | | | | | | | | | |
| (a) | Variable rate security. Rate shown is the effective rate as of September 30, 2014. |
MTN Medium Term Note
See accompanying notes to financial statements.
35
TETON Westwood Funds
Statements of Assets and Liabilities
September 30, 2014
| | | | | | | | | | | | | | | | |
| | | Mighty Mites Fund | | | | SmallCap
Equity Fund | | | | Mid-Cap
Equity Fund | | | | Income Fund | | |
Assets: | | | | | | | | | | | | | | | | |
Investments, at value (cost $964,654,157, $33,031,789, $4,759,539, and $6,409,703, respectively) | | $1,213,497,136 | | | | $41,394,624 | | | | $5,014,150 | | | | $8,504,550 | | |
Investments in affiliates, at value (cost $29,225,726) | | 56,851,554 | | | | — | | | | — | | | | — | | |
Cash | | 4,633 | | | | 47,637 | | | | 71,315 | | | | 91,661 | | |
Receivable for Fund shares sold | | 7,247,266 | | | | 6,691 | | | | 2,401 | | | | 9,052 | | |
Receivable for investments sold | | 40,912 | | | | 301,769 | | | | — | | | | — | | |
Receivable from Adviser | | — | | | | — | | | | 13,249 | | | | — | | |
Dividends and interest receivable | | 450,102 | | | | 26,222 | | | | 4,378 | | | | 8,590 | | |
Prepaid expenses | | 48,895 | | | | 15,757 | | | | 8,077 | | | | 20,226 | | |
| | | | | | | | | | | | | | | | |
Total Assets | | 1,278,140,498 | | | | 41,792,700 | | | | 5,113,570 | | | | 8,634,079 | | |
| | | | | | | | | | | | | | | | |
Liabilities: | | | | | | | | | | | | | | | | |
Payable for investments purchased | | 5,775,581 | | | | 273,781 | | | | 134,323 | | | | — | | |
Payable for Fund shares redeemed | | 2,038,454 | | | | 87,373 | | | | — | | | | — | | |
Distributions payable | | — | | | | — | | | | — | | | | — | | |
Payable for investment advisory fees | | 1,068,126 | | | | 32,162 | | | | — | | | | 4,409 | | |
Payable for distribution fees | | 333,437 | | | | 8,919 | | | | 810 | | | | 2,604 | | |
Payable for accounting fees | | 15,000 | | | | — | | | | — | | | | — | | |
Payable for payroll expenses | | — | | | | — | | | | 445 | | | | — | | |
Payable for legal and audit fees | | 69,111 | | | | 34,160 | | | | 20,182 | | | | 24,959 | | |
Payable for shareholder communications expenses | | — | | | | — | | | | — | | | | 7,183 | | |
Other accrued expenses | | 456,709 | | | | 22,497 | | | | 13,031 | | | | 7,114 | | |
| | | | | | | | | | | | | | | | |
Total Liabilities | | 9,756,418 | | | | 458,892 | | | | 168,791 | | | | 46,269 | | |
| | | | | | | | | | | | | | | | |
Net Assets | | $1,268,384,080 | | | | $41,333,808 | | | | $4,944,779 | | | | $8,587,810 | | |
| | | | | | | | | | | | | | | | |
Net Assets Consist of: | | | | | | | | | | | | | | | | |
Paid-in capital | | $983,123,291 | | | | $31,629,874 | | | | $4,639,171 | | | | $8,096,156 | | |
Accumulated net investment income/(loss) | | (10,760,258) | | | | (113,892) | | | | 296 | | | | 4,261 | | |
Accumulated net realized gain/(loss) on investments and foreign currency transactions | | 19,553,007 | | | | 1,454,991 | | | | 50,701 | | | | (1,607,454) | | |
Net unrealized appreciation on investments | | 276,468,807 | | | | 8,362,835 | | | | 254,611 | | | | 2,094,847 | | |
Net unrealized depreciation on foreign currency translations | | (767) | | | | — | | | | — | | | | — | | |
| | | | | | | | | | | | | | | | |
Net Assets | | $1,268,384,080 | | | | $41,333,808 | | | | $4,944,779 | | | | $8,587,810 | | |
| | | | | | | | | | | | | | | | |
Shares of Beneficial Interest, each at $0.001 par value; unlimited number of shares authorized:
Class AAA: | | | | | | | | | | | | | | | | |
Net assets | | $365,022,294 | | | | $15,649,133 | | | | $1,679,123 | | | | $6,239,372 | | |
Shares of beneficial interest outstanding | | 15,864,762 | | | | 762,528 | | | | 145,490 | | | | 529,357 | | |
Net Asset Value, offering, and redemption price per share | | $23.01 | | | | $20.52 | | | | $11.54 | | | | $11.79 | | |
Class A: | | | | | | | | | | | | | | | | |
Net assets | | $175,107,658 | | | | $4,269,427 | | | | $681,994 | | | | $1,013,166 | | |
Shares of beneficial interest outstanding | | 7,798,753 | | | | 212,982 | | | | 59,275 | | | | 83,163 | | |
Net Asset Value and redemption price per share | | $22.45 | | | | $20.05 | | | | $11.51 | | | | $12.18 | | |
Maximum offering price per share (NAV ÷ 0.96, based on maximum sales charge of 4.00% of the offering price) | | $23.39 | | | | $20.89 | | | | $11.99 | | | | $12.69 | | |
Class C: | | | | | | | | | | | | | | | | |
Net assets | | $208,795,170 | | | | $4,185,589 | | | | $238,690 | | | | $1,045,282 | | |
Shares of beneficial interest outstanding | | 10,212,682 | | | | 225,535 | | | | 20,881 | | | | 80,148 | | |
Net Asset Value and offering price per share(a) | | $20.44 | | | | $18.56 | | | | $11.43 | | | | $13.04 | | |
Class I: | | | | | | | | | | | | | | | | |
Net assets | | $519,458,958 | | | | $17,229,659 | | | | $2,344,972 | | | | $289,990 | | |
Shares of beneficial interest outstanding | | 22,319,777 | | | | 826,421 | | | | 202,666 | | | | 24,570 | | |
Net Asset Value, offering, and redemption price per share | | $23.27 | | | | $20.85 | | | | $11.57 | | | | $11.80 | | |
| (a) | Redemption price varies based on the length of time held. |
See accompanying notes to financial statements.
36
TETON Westwood Funds
Statements of Assets and Liabilities (Continued)
September 30, 2014
| | | | | | | | | | | | | | | | |
| Assets: | | Equity Fund | | | | | Balanced Fund | | | | Intermediate
Bond Fund | | | |
Investments, at value (cost $55,591,861, $71,593,332, and $20,861,853, respectively) | | | $68,249,955 | | | | | $83,843,087 | | | | | $21,512,430 | | | |
Investments in affiliates, at value | | | — | | | | | — | | | | | — | | | |
Cash | | | — | | | | | — | | | | | 362 | | | |
Receivable for Fund shares sold | | | 15,403 | | | | | 20,181 | | | | | 26,019 | | | |
Receivable for investments sold | | | 1,351,271 | | | | | 985,944 | | | | | — | | | |
Receivable from Adviser | | | — | | | | | — | | | | | — | | | |
Dividends and interest receivable | | | 62,830 | | | | | 309,857 | | | | | 180,531 | | | |
Prepaid expenses | | | 17,943 | | | | | 20,528 | | | | | 15,623 | | | |
| | | | | | | | | | | | | | | | |
Total Assets | | | 69,697,402 | | | | | 85,179,597 | | | | | 21,734,965 | | �� | |
| | | | | | | | | | | | | | | | |
Liabilities: | | | | | | | | | | | | | | | | |
Payable for investments purchased | | | 1,299,245 | | | | | 1,614,629 | | | | | 369,480 | | | |
Payable for Fund shares redeemed | | | 110,368 | | | | | 567 | | | | | 5,482 | | | |
Distributions payable | | | — | | | | | — | | | | | 508 | | | |
Payable for investment advisory fees | | | 56,963 | | | | | 51,998 | | | | | 4,241 | | | |
Payable for distribution fees | | | 14,669 | | | | | 21,475 | | | | | 1,788 | | | |
Payable for accounting fees | | | 15,000 | | | | | 15,000 | | | | | — | | | |
Payable for payroll expenses | | | — | | | | | — | | | | | — | | | |
Payable for legal and audit fees | | | 26,733 | | | | | 27,015 | | | | | 27,996 | | | |
Payable for shareholder communications expenses | | | — | | | | | — | | | | | — | | | |
Other accrued expenses | | | 35,581 | | | | | 30,551 | | | | | 15,581 | | | |
| | | | | | | | | | | | | | | | |
Total Liabilities | | | 1,558,559 | | | | | 1,761,235 | | | | | 425,076 | | | |
| | | | | | | | | | | | | | | | |
Net Assets | | | $68,138,843 | | | | | $83,418,362 | | | | | $21,309,889 | | | |
| | | | | | | | | | | | | | | | |
Net Assets Consist of: | | | | | | | | | | | | | | | | |
Paid-in capital | | | $48,969,785 | | | | | $65,227,345 | | | | | $20,662,472 | | | |
Accumulated net investment income/(loss) | | | 189,835 | | | | | — | | | | | 99 | | | |
Accumulated net realized gain/(loss) on investments and foreign currency transactions | | | 6,321,129 | | | | | 5,941,262 | | | | | (3,259 | ) | | |
Net unrealized appreciation on investments | | | 12,658,094 | | | | | 12,249,755 | | | | | 650,577 | | | |
Net unrealized appreciation on foreign currency translations | | | — | | | | | — | | | | | — | | | |
| | | | | | | | | | | | | | | | |
Net Assets | | | $68,138,843 | | | | | $83,418,362 | | | | | $21,309,889 | | | |
| | | | | | | | | | | | | | | | |
Shares of Beneficial Interest, each at $0.001 par value; unlimited number of shares authorized: | | | | | | | | | | | | | | | | |
Class AAA: | | | | | | | | | | | | | | | | |
Net assets | | | $60,587,249 | | | | | $69,187,557 | | | | | $5,173,872 | | | |
Shares of beneficial interest outstanding | | | 4,440,090 | | | | | 5,358,474 | | | | | 446,393 | | | |
Net Asset Value, offering, and redemption price per share | | | $13.65 | | | | | $12.91 | | | | | $11.59 | | | |
Class A: | | | | | | | | | | | | | | | | |
Net assets | | | $3,329,292 | | | | | $6,442,974 | | | | | $927,976 | | | |
Shares of beneficial interest outstanding | | | 244,549 | | | | | 496,689 | | | | | 80,150 | | | |
Net Asset Value and redemption price per share | | | $13.61 | | | | | $12.97 | | | | | $11.58 | | | |
Maximum offering price per share (NAV ÷ 0.96, based on maximum sales charge of 4.00% of the offering price) | | | $14.18 | | | | | $13.51 | | | | | $12.06 | | | |
Class C: | | | | | | | | | | | | | | | | |
Net assets | | | $675,928 | | | | | $5,349,940 | | | | | $503,374 | | | |
Shares of beneficial interest outstanding | | | 51,298 | | | | | 407,895 | | | | | 45,709 | | | |
Net Asset Value and offering price per share(a) | | | $13.18 | | | | | $13.12 | | | | | $11.01 | | | |
Class I: | | | | | | | | | | | | | | | | |
Net assets | | | $3,546,374 | | | | | $2,437,891 | | | | | $14,704,667 | | | |
Shares of beneficial interest outstanding | | | 260,093 | | | | | 188,985 | | | | | 1,268,008 | | | |
Net Asset Value, offering, and redemption price per share | | | $13.64 | | | | | $12.90 | | | | | $11.60 | | | |
| (a) | Redemption price varies based on the length of time held. |
See accompanying notes to financial statements.
37
TETON Westwood Funds
Statements of Operations
For the Year Ended September 30, 2014
| | | | | | | | | | | | | | | | | | | | |
| | | | | | | | |
| | | Mighty
Mites Fund | | | | | SmallCap
Equity Fund | | | | Mid-Cap
Equity Fund | | | | | Income
Fund | | |
Investment Income: | | | | | | | | | | | | | | | | | | | | |
Dividends - unaffiliated (net of foreign withholding taxes of $41,376, $445, $198, and $1,941, respectively) | | $ | 5,490,946 | | | | | $ 509,173 | | | | $ | 37,664 | | | | | $ 342,600 | | |
Dividends - affiliated | | | 628,994 | | | | | — | | | | | — | | | | | — | | |
Interest | | | 214,720 | | | | | 650 | | | | | 88 | | | | | 207 | | |
| | | | | | | | | | | | | | | | | | | | |
Total Investment Income | | | 6,334,660 | | | | | 509,823 | | | | | 37,752 | | | | | 342,807 | | |
| | | | | | | | | | | | | | | | | | | | |
Expenses: | | | | | | | | | | | | | | | | | | | | |
Investment advisory fees | | | 12,676,410 | | | | | 443,389 | | | | | 33,389 | | | | | 88,156 | | |
Distribution fees - Class AAA | | | 1,265,229 | | | | | 49,314 | | | | | 3,108 | | | | | 16,051 | | |
Distribution fees - Class A | | | 863,489 | | | | | 24,183 | | | | | 1,830 | | | | | 4,840 | | |
Distribution fees - Class C | | | 2,037,171 | | | | | 44,421 | | | | | 1,483 | | | | | 11,786 | | |
Accounting fees | | | 45,000 | | | | | — | | | | | — | | | | | — | | |
Custodian fees | | | 201,714 | | | | | 11,542 | | | | | 23,954 | | | | | 5,043 | | |
Interest expense | | | — | | | | | — | | | | | 236 | | | | | — | | |
Legal and audit fees | | | 85,729 | | | | | 35,946 | | | | | 20,418 | | | | | 25,560 | | |
Offering expenses | | | — | | | | | — | | | | | 25,802 | | | | | — | | |
Payroll expenses | | | — | | | | | — | | | | | 1,481 | | | | | — | | |
Registration expenses | | | 125,585 | | | | | 41,303 | | | | | 10,266 | | | | | 43,195 | | |
Shareholder communications expenses | | | 350,735 | | | | | 15,702 | | | | | 6,630 | | | | | 11,599 | | |
Shareholder services fees | | | 1,152,754 | | | | | 26,602 | | | | | 5,920 | | | | | 8,231 | | |
Trustees’ fees | | | 67,625 | | | | | 2,499 | | | | | 156 | | | | | 505 | | |
Miscellaneous expenses | | | 61,455 | | | | | 10,056 | | | | | 5,845 | | | | | 8,607 | | |
| | | | | | | | | | | | | | | | | | | | |
Total Expenses | | | 18,932,896 | | | | | 704,957 | | | | | 140,518 | | | | | 223,573 | | |
| | | | | | | | | | | | | | | | | | | | |
Less: | | | | | | | | | | | | | | | | | | | | |
Fees waived or expenses reimbursed by Adviser (See Note 3) | | | — | | | | | (32,802) | | | | | (92,134 | ) | | | | (36,616) | | |
Advisory fee reduction on unsupervised assets (Note 3) | | | (76,140 | ) | | | | — | | | | | — | | | | | — | | |
Custodian fee credits | | | — | | | | | — | | | | | — | | | | | — | | |
| | | | | | | | | | | | | | | | | | | | |
Total Reimbursements and Reductions | | | (76,140 | ) | | | | (32,802) | | | | | (92,134 | ) | | | | (36,616) | | |
| | | | | | | | | | | | | | | | | | | | |
Net Expenses | | | 18,856,756 | | | | | 672,155 | | | | | 48,384 | | | | | 186,957 | | |
| | | | | | | | | | | | | | | | | | | | |
Net Investment Income/(Loss) | | | (12,522,096 | ) | | | | (162,332) | | | | | (10,632 | ) | | | | 155,850 | | |
| | | | | | | | | | | | | | | | | | | | |
Net Realized and Unrealized Gain/(Loss) on Investments and Foreign Currency: | | | | | | | | | | | | | | | | | | | | |
Net realized gain on investments - unaffiliated | | | 28,138,708 | | | | | 2,853,146 | | | | | 51,231 | | | | | 653,324 | | |
Net realized gain on investments - affiliated | | | 445,093 | | | | | — | | | | | — | | | | | — | | |
Net realized loss on foreign currency transactions | | | (3,148 | ) | | | | — | | | | | — | | | | | — | | |
| | | | | | | | | | | | | | | | | | | | |
Net realized gain on investments and foreign currency transactions | | | 28,580,653 | | | | | 2,853,146 | | | | | 51,231 | | | | | 653,324 | | |
| | | | | | | | | | | | | | | | | | | | |
Net change in unrealized appreciation/depreciation: | | | | | | | | | | | | | | | | | | | | |
on investments | | | (305,940 | ) | | | | (1,101,155) | | | | | 175,605 | | | | | 420,235 | | |
on foreign currency translations | | | (1,308 | ) | | | | — | | | | | — | | | | | — | | |
| | | | | | | | | | | | | | | | | | | | |
Net change in unrealized appreciation/depreciation on investments and foreign currency translations | | | (307,248 | ) | | | | (1,101,155) | | | | | 175,605 | | | | | 420,235 | | |
| | | | | | | | | | | | | | | | | | | | |
Net Realized and Unrealized Gain on Investments and Foreign Currency | | | 28,273,405 | | | | | 1,751,991 | | | | | 226,836 | | | | | 1,073,559 | | |
| | | | | | | | | | | | | | | | | | | | |
Net Increase in Net Assets Resulting from Operations | | $ | 15,751,309 | | | | | $1,589,659 | | | | $ | 216,204 | | | | | $1,229,409 | | |
| | | | | | | | | | | | | | | | | | | | |
See accompanying notes to financial statements.
38
TETON Westwood Funds
Statements of Operations (Continued)
For the Year Ended September 30, 2014
| | | | | | | | | | | | | | |
| | | Equity
Fund | | | | | Balanced
Fund | | | | Intermediate
Bond Fund | |
Investment Income: | | | | | | | | | | | | | | |
Dividends - unaffiliated (net of foreign withholding taxes of $0, $0, and $0, respectively) | | $ | 1,407,342 | | | | | $1,050,985 | | | | $ | 528 | |
Dividends - affiliated | | | — | | | | | — | | | | | — | |
Interest | | | — | | | | | 923,641 | | | | | 510,816 | |
| | | | | | | | | | | | | | |
Total Investment Income | | | 1,407,342 | | | | | 1,974,626 | | | | | 511,344 | |
| | | | | | | | | | | | | | |
Expenses: | | | | | | | | | | | | | | |
Investment advisory fees | | | 717,376 | | | | | 633,570 | | | | | 132,511 | |
Distribution fees - Class AAA | | | 164,053 | | | | | 178,283 | | | | | 15,525 | |
Distribution fees - Class A | | | 16,451 | | | | | 32,134 | | | | | 3,292 | |
Distribution fees - Class C | | | 7,499 | | | | | 53,520 | | | | | 6,825 | |
Accounting fees | | | 45,000 | | | | | 45,000 | | | | | — | |
Custodian fees | | | 17,737 | | | | | 19,595 | | | | | 7,048 | |
Interest expense | | | 303 | | | | | — | | | | | — | |
Legal and audit fees | | | 28,039 | | | | | 28,933 | | | | | 29,373 | |
Offering expenses | | | — | | | | | — | | | | | — | |
Payroll expenses | | | — | | | | | — | | | | | — | |
Registration expenses | | | 52,340 | | | | | 52,952 | | | | | 46,317 | |
Shareholder communications expenses | | | 28,547 | | | | | 26,531 | | | | | 10,868 | |
Shareholder services fees | | | 58,060 | | | | | 54,866 | | | | | 12,450 | |
Trustees’ fees | | | 4,111 | | | | | 4,836 | | | | | 1,267 | |
Miscellaneous expenses | | | 11,179 | | | | | 11,916 | | | | | 9,070 | |
| | | | | | | | | | | | | | |
Total Expenses | | | 1,150,695 | | | | | 1,142,136 | | | | | 274,546 | |
| | | | | | | | | | | | | | |
Less: | | | | | | | | | | | | | | |
Fees waived or expenses reimbursed by Adviser (See Note 3) | | | — | | | | | — | | | | | (83,262 | ) |
Advisory fee reduction on unsupervised assets (Note 3) | | | — | | | | | — | | | | | — | |
Custodian fee credits | | | — | | | | | (19,595) | | | | | — | |
| | | | | | | | | | | | | | |
Total Reimbursements and Credits | | | — | | | | | (19,595) | | | | | (83,262 | ) |
| | | | | | | | | | | | | | |
Net Expenses | | | 1,150,695 | | | | | 1,122,541 | | | | | 191,284 | |
| | | | | | | | | | | | | | |
Net Investment Income | | | 256,647 | | | | | 852,085 | | | | | 320,060 | |
| | | | | | | | | | | | | | |
Net Realized and Unrealized Gain/(Loss) on Investments and Foreign Currency: | | | | | | | | | | | | | | |
Net realized gain on investments - unaffiliated | | | 11,429,623 | | | | | 8,096,441 | | | | | 1,843 | |
Net realized gain on investments - affiliated | | | — | | | | | — | | | | | — | |
Net realized loss on foreign currency transactions | | | — | | | | | — | | | | | — | |
| | | | | | | | | | | | | | |
Net realized gain on investments transactions | | | 11,429,623 | | | | | 8,096,441 | | | | | 1,843 | |
| | | | | | | | | | | | | | |
Net change in unrealized appreciation/depreciation: | | | | | | | | | | | | | | |
on investments | | | (1,366,101 | ) | | | | (1,069,693) | | | | | (162,532 | ) |
on foreign currency translations | | | — | | | | | — | | | | | — | |
| | | | | | | | | | | | | | |
Net change in unrealized appreciation/depreciation on investments | | | (1,366,101 | ) | | | | (1,069,693) | | | | | (162,532 | ) |
| | | | | | | | | | | | | | |
Net Realized and Unrealized Gain/Loss on Investments | | | 10,063,522 | | | | | 7,026,748 | | | | | (160,689 | ) |
| | | | | | | | | | | | | | |
Net Increase in Net Assets Resulting from Operations | | $ | 10,320,169 | | | | | $7,878,833 | | | | $ | 159,371 | |
| | | | | | | | | | | | | | |
See accompanying notes to financial statements.
39
TETON Westwood Funds
Statements of Changes in Net Assets
| | | | | | | | | | | | | | | | | | | | |
| | | Mighty Mites Fund | | | SmallCap Equity Fund | | Mid-Cap Equity Fund | |
| | | 2014 | | | 2013 | | | 2014 | | 2013 | | 2014 | | | 2013(a) | |
Operations: | | | | | | | | | | | | | | | | | | | | |
Net investment income/(loss) | | $ | (12,522,096 | ) | | $ | 626,045 | | | $(162,332) | | $(23,125) | | $ | (10,632 | ) | | $ | (1,342 | ) |
Net realized gain/(loss) on investments and foreign currency transactions | | | 28,580,653 | | | | 65,848,252 | | | 2,853,146 | | 651,363 | | | 51,231 | | | | 289 | |
Net change in unrealized appreciation/depreciation on investments and foreign currency translations | | | (307,248 | ) | | | 158,288,013 | | | (1,101,155) | | 9,335,713 | | | 175,605 | | | | 79,006 | |
| | | | | | | | | | | | | | | | | | | | |
Net Increase/(Decrease) in Net Assets Resulting from Operations | | | 15,751,309 | | | | 224,762,310 | | | 1,589,659 | | 9,963,951 | | | 216,204 | | | | 77,953 | |
| | | | | | | | | | | | | | | | | | | | |
Distributions to Shareholders: | | | | | | | | | | | | | | | | | | | | |
Net investment income | | | | | | | | | | | | | | | | | | | | |
Class AAA | | | — | | | | (1,163,541 | ) | | — | | — | | | — | | | | — | |
Class A | | | — | | | | (182,178 | ) | | — | | — | | | — | | | | — | |
Class B* | | | — | | | | — | | | — | | — | | | — | | | | — | |
Class C | | | — | | | | — | | | — | | — | | | — | | | | — | |
Class I | | | — | | | | (1,213,298 | ) | | — | | (18,250) | | | (836 | ) | | | — | |
| | | | | | | | | | | | | | | | | | | | |
| | | — | | | | (2,559,017 | ) | | — | | (18,250) | | | (836 | ) | | | — | |
| | | | | | | | | | | | | | | | | | | | |
Net realized gain | | | | | | | | | | | | | | | | | | | | |
Class AAA | | | (28,607,652 | ) | | | (5,789,706 | ) | | — | | — | | | (205 | ) | | | — | |
Class A | | | (8,971,292 | ) | | | (1,631,680 | ) | | — | | — | | | (54 | ) | | | — | |
Class B* | | | (301 | ) | | | (81 | ) | | — | | — | | | — | | | | — | |
Class C | | | (11,292,276 | ) | | | (2,128,714 | ) | | — | | — | | | (22 | ) | | | — | |
Class I | | | (17,271,524 | ) | | | (2,772,247 | ) | | — | | — | | | (348 | ) | | | — | |
| | | | | | | | | | | | | | | | | | | | |
| | | (66,143,045 | ) | | | (12,322,428 | ) | | — | | — | | | (629 | ) | | | — | |
| | | | | | | | | | | | | | | | | | | | |
Total Distributions to Shareholders | | | (66,143,045 | ) | | | (14,881,445 | ) | | — | | (18,250) | | | (1,465 | ) | | | — | |
| | | | | | | | | | | | | | | | | | | | |
Shares of Beneficial Interest Transactions: | | | | | | | | | | | | | | | | | | | | |
Proceeds from shares issued | | | | | | | | | | | | | | | | | | | | |
Class AAA | | | 127,362,664 | | | | 160,798,060 | | | 1,265,433 | | 3,851,325 | | | 1,069,627 | | | | 635,749 | |
Class A | | | 68,894,121 | | | | 54,834,902 | | | 732,091 | | 650,454 | | | 508,794 | | | | 189,126 | |
Class B* | | | 2,760 | | | | — | | | — | | — | | | — | | | | — | |
Class C | | | 78,226,583 | | | | 54,048,432 | | | 250,511 | | 343,040 | | | 156,348 | | | | 73,990 | |
Class I | | | 343,011,332 | | | | 135,506,181 | | | 5,987,464 | | 3,225,462 | | | 1,076,761 | | | | 1,101,734 | |
| | | | | | | | | | | | | | | | | | | | |
| | | 617,497,460 | | | | 405,187,575 | | | 8,235,499 | | 8,070,281 | | | 2,811,530 | | | | 2,000,599 | |
| | | | | | | | | | | | | | | | | | | | |
Proceeds from reinvestment of distributions | | | | | | | | | | | | | | | | | | | | |
Class AAA | | | 28,170,975 | | | | 6,694,144 | | | — | | — | | | 205 | | | | — | |
Class A | | | 7,544,617 | | | | 1,521,531 | | | — | | — | | | 54 | | | | — | |
Class B* | | | 302 | | | | 81 | | | — | | — | | | — | | | | — | |
Class C | | | 8,388,483 | | | | 1,647,595 | | | — | | — | | | 22 | | | | — | |
Class I | | | 10,456,110 | | | | 2,307,004 | | | — | | 6,057 | | | 1,184 | | | | — | |
| | | | | | | | | | | | | | | | | | | | |
| | | 54,560,487 | | | | 12,170,355 | | | — | | 6,057 | | | 1,465 | | | | — | |
| | | | | | | | | | | | | | | | | | | | |
Cost of shares redeemed | | | | | | | | | | | | | | | | | | | | |
Class AAA | | | (253,544,484 | ) | | | (67,722,877 | ) | | (6,095,587) | | (4,651,260) | | | (129,214 | ) | | | — | |
Class A | | | (33,455,166 | ) | | | (22,483,171 | ) | | (1,305,181) | | (2,608,488) | | | (32,293 | ) | | | — | |
Class B* | | | (6,131 | ) | | | (1,486 | ) | | — | | — | | | — | | | | — | |
Class C | | | (27,914,687 | ) | | | (19,392,541 | ) | | (651,867) | | (2,254,817) | | | — | | | | — | |
Class I | | | (92,388,557 | ) | | | (42,109,849 | ) | | (2,830,578) | | (5,689,423) | | | — | | | | — | |
| | | | | | | | | | | | | | | | | | | | |
| | | (407,309,025 | ) | | | (151,709,924 | ) | | (10,883,213) | | (15,203,988) | | | (161,507 | ) | | | — | |
| | | | | | | | | | | | | | | | | | | | |
Net Increase/(Decrease) in Net Assets from Shares of Beneficial Interest Transactions | | | 264,748,922 | | | | 265,648,006 | | | (2,647,714) | | (7,127,650) | | | 2,651,488 | | | | 2,000,599 | |
| | | | | | | | | | | | | | | | | | | | |
Redemption Fees | | | 7,859 | | | | 3,305 | | | 206 | | 489 | | | — | | | | — | |
| | | | | | | | | | | | | | | | | | | | |
Net Increase/(Decrease) in Net Assets | | | 214,365,045 | | | | 475,532,176 | | | (1,057,849) | | 2,818,540 | | | 2,866,227 | | | | 2,078,552 | |
Net Assets: | | | | | | | | | | | | | | | | | | | | |
Beginning of period | | | 1,054,019,035 | | | | 578,486,859 | | | 42,391,657 | | 39,573,117 | | | 2,078,552 | | | | — | |
| | | | | | | | | | | | | | | | | | | | |
End of period | | $ | 1,268,384,080 | | | $ | 1,054,019,035 | | | $41,333,808 | | $42,391,657 | | $ | 4,944,779 | | | $ | 2,078,552 | |
| | | | | | | | | | | | | | | | | | | | |
Undistributed net investment income | | | — | | | | — | | | — | | — | | $ | 296 | | | $ | 789 | |
| | | | | | | | | | | | | | | | | | | | |
| (a) | The Mid-Cap Equity Fund commenced investment operations on May 31, 2013. |
| * | Class B Shares were fully redeemed and closed on January 27, 2014 for the Mighty Mites Fund, Balanced Fund, and Intermediate Bond Fund. |
See accompanying notes to financial statements.
40
TETON Westwood Funds
Statements of Changes in Net Assets (Continued)
| | | | | | | | | | | | | | | | | | | | | | |
Income Fund | | Equity Fund | | | Balanced Fund | | Intermediate Bond Fund | |
2014 | | 2013 | | 2014 | | | 2013 | | | 2014 | | 2013 | | 2014 | | | 2013 | |
| $ 155,850 | | $ 46,665 | | $ | 256,647 | | | $ | 381,600 | | | $ 852,085 | | $ 1,013,181 | | $ | 320,060 | | | $ | 310,685 | |
| 653,324 | | 282,210 | | | 11,429,623 | | | | 8,927,942 | | | 8,096,441 | | 6,790,222 | | | 1,843 | | | | (4,459 | ) |
| 420,235 | | 852,498 | | | (1,366,101 | ) | | | 4,268,428 | | | (1,069,693) | | 2,582,764 | | | (162,532 | ) | | | (761,956 | ) |
| | | | | | | |
| | | | | | | | | | | | | | | | | | | | | | |
| 1,229,409 | | 1,181,373 | | | 10,320,169 | | | | 13,577,970 | | | 7,878,833 | | 10,386,167 | | | 159,371 | | | | (455,730 | ) |
| | | | | | | |
| | | | | | | | | | | | | | | | | | | | | | |
| | | | | | | | | | | | | | | | | | | | | | |
| (113,919) | | (46,737) | | | (224,436 | ) | | | (586,885 | ) | | (762,439) | | (920,053) | | | (80,310 | ) | | | (123,229 | ) |
| (15,373) | | (2,916) | | | (2,454 | ) | | | (21,453 | ) | | (51,219) | | (53,325) | | | (11,391 | ) | | | (18,235 | ) |
| — | | — | | | — | | | | — | | | (1) | | (18) | | | (6 | ) | | | (24 | ) |
| (17,119) | | (1,136) | | | — | | | | (1,694 | ) | | (16,208) | | (21,428) | | | (3,735 | ) | | | (5,793 | ) |
| (5,185) | | (1,703) | | | (11,148 | ) | | | (52,873 | ) | | (26,644) | | (13,524) | | | (224,667 | ) | | | (168,457 | ) |
| | | | | | | |
| | | | | | | | | | | | | | | | | | | | | | |
| (151,596) | | (52,492) | | | (238,038 | ) | | | (662,905 | ) | | (856,511) | | (1,008,348) | | | (320,109 | ) | | | (315,738 | ) |
| | | | | | | |
| | | | | | | | | | | | | | | | | | | | | | |
| | | | | | | | | | | | | | | | | | | | | | |
| — | | — | | | — | | | | — | | | (4,993,471) | | — | | | — | | | | (11,127 | ) |
| — | | — | | | — | | | | — | | | (418,931) | | — | | | — | | | | (2,177 | ) |
| — | | — | | | — | | | | — | | | (72) | | — | | | — | | | | (5 | ) |
| — | | — | | | — | | | | — | | | (363,637) | | — | | | — | | | | (1,949 | ) |
| — | | — | | | — | | | | — | | | (215,697) | | — | | | — | | | | (9,741 | ) |
| | | | | | | |
| | | | | | | | | | | | | | | | | | | | | | |
| — | | — | | | — | | | | — | | | (5,991,808) | | — | | | — | | | | (24,999 | ) |
| | | | | | | |
| | | | | | | | | | | | | | | | | | | | | | |
| (151,596) | | (52,492) | | | (238,038 | ) | | | (662,905 | ) | | (6,848,319) | | (1,008,348) | | | (320,109 | ) | | | (340,737 | ) |
| | | | | | | |
| | | | | | | | | | | | | | | | | | | | | | |
| | | | | | | | | | | | | | | | | | | | | | |
| 1,108,013 | | 2,391,019 | | | 1,649,660 | | | | 3,161,295 | | | 5,761,575 | | 6,066,643 | | | 945,719 | | | | 1,225,024 | |
| 64,620 | | 529,953 | | | 282,199 | | | | 208,950 | | | 1,995,064 | | 1,100,436 | | | 234,913 | | | | 1,301,024 | |
| — | | — | | | — | | | | — | | | — | | — | | | — | | | | — | |
| 188,020 | | 243,251 | | | 32,091 | | | | 32,176 | | | 452,031 | | 2,033,264 | | | 243,159 | | | | 286,380 | |
| 121,172 | | 100,221 | | | 2,014,865 | | | | 270,386 | | | 3,500,327 | | 212,282 | | | 6,140,869 | | | | 5,162,576 | |
| | | | | | | |
| | | | | | | | | | | | | | | | | | | | | | |
| 1,481,825 | | 3,264,444 | | | 3,978,815 | | | | 3,672,807 | | | 11,708,997 | | 9,412,625 | | | 7,564,660 | | | | 7,975,004 | |
| | | | | | | |
| | | | | | | | | | | | | | | | | | | | | | |
| | | | | | | | | | | | | | | | | | | | | | |
| 107,093 | | 44,097 | | | 211,867 | | | | 554,580 | | | 5,581,690 | | 886,356 | | | 76,690 | | | | 128,739 | |
| 14,770 | | 2,658 | | | 2,358 | | | | 20,692 | | | 399,032 | | 43,395 | | | 8,696 | | | | 15,113 | |
| — | | — | | | — | | | | — | | | 73 | | 18 | | | 4 | | | | 29 | |
| 16,786 | | 1,113 | | | — | | | | 1,454 | | | 341,143 | | 18,839 | | | 3,305 | | | | 7,099 | |
| 5,159 | | 1,634 | | | 6,205 | | | | 11,674 | | | 237,178 | | 12,907 | | | 150,457 | | | | 2,294 | |
| | | | | | | |
| | | | | | | | | | | | | | | | | | | | | | |
| 143,808 | | 49,502 | | | 220,430 | | | | 588,400 | | | 6,559,116 | | 961,515 | | | 239,152 | | | | 153,274 | |
| | | | | | | |
| | | | | | | | | | | | | | | | | | | | | | |
| | | | | | | | | | | | | | | | | | | | | | |
| (1,908,982) | | (2,267,542) | | | (15,134,334 | ) | | | (20,612,357 | ) | | (13,953,031) | | (23,231,904) | | | (4,538,021 | ) | | | (3,527,680 | ) |
| (94,076) | | (99,368) | | | (669,010 | ) | | | (797,465 | ) | | (1,922,839) | | (980,644) | | | (374,422 | ) | | | (1,557,515 | ) |
| — | | — | | | — | | | | — | | | (1,063) | | (6,502) | | | (5,141 | ) | | | (15 | ) |
| (389,163) | | (655,948) | | | (152,653 | ) | | | (263,906 | ) | | (783,550) | | (2,321,691) | | | (542,141 | ) | | | (1,222,092 | ) |
| (49,418) | | (67,424) | | | (935,016 | ) | | | (3,153,115 | ) | | (2,231,067) | | (130,611) | | | (3,394,712 | ) | | | (2,201,117 | ) |
| | | | | | | |
| | | | | | | | | | | | | | | | | | | | | | |
| (2,441,639) | | (3,090,282) | | | (16,891,013 | ) | | | (24,826,843 | ) | | (18,891,550) | | (26,671,352) | | | (8,854,437 | ) | | | (8,508,419 | ) |
| | | | | | | |
| | | | | | | | | | | | | | | | | | | | | | |
| | | | | | | | | | | | | | | | | | | | | | |
| (816,006) | | 223,664 | | | (12,691,768 | ) | | | (20,565,636 | ) | | (623,437) | | (16,297,212) | | | (1,050,625 | ) | | | (380,141 | ) |
| | | | | | | |
| | | | | | | | | | | | | | | | | | | | | | |
| 476 | | 208 | | | — | | | | — | | | — | | — | | | — | | | | — | |
| | | | | | | |
| | | | | | | | | | | | | | | | | | | | | | |
| 262,283 | | 1,352,753 | | | (2,609,637 | ) | | | (7,650,571 | ) | | 407,077 | | (6,919,393) | | | (1,211,363 | ) | | | (1,176,608 | ) |
| | | | | | | | | | | | | | | | | | | | | | |
| 8,325,527 | | 6,972,774 | | | 70,748,480 | | | | 78,399,051 | | | 83,011,285 | | 89,930,678 | | | 22,521,252 | | | | 23,697,860 | |
| | | | | | | |
| | | | | | | | | | | | | | | | | | | | | | |
| $8,587,810 | | $ 8,325,527 | | $ | 68,138,843 | | | $ | 70,748,480 | | | $ 83,418,362 | | $ 83,011,285 | | $ | 21,309,889 | | | $ | 22,521,252 | |
| | | | | | | |
| | | | | | | | | | | | | | | | | | | | | | |
| $ 4,261 | | $ 4,785 | | $ | 189,835 | | | $ | 171,874 | | | — | | $ 4,833 | | $ | 99 | | | | — | |
| | | | | | | |
| | | | | | | | | | | | | | | | | | | | | | |
See accompanying notes to financial statements.
41
TETON Westwood Funds
Financial Highlights
Selected data for a share of beneficial interest outstanding throughout each year:
| | | | | | | | | | | | | | | | | | | | | | | | | | | | | | | | | | | | | | | | | | | | | | | | | | | | | | | | | | | | | | | | | | | | | | | | | | | |
| | | | | Income (Loss) from Investment Operations | | Distributions to Shareholders | | | | | | | | Ratios to Average Net Assets/Supplemental Data |
Year Ended
September 30 | | Net Asset
Value,
Beginning
of Year | | Net
Investment
Income
(Loss)(a)(b) | | Net
Realized and
Unrealized
Gain (Loss) on
Investments | | Total from
Investment
Operations | | Net
Investment
Income | | Net
Realized
Gain on
Investments | | Total
Distributions | | Redemption
Fees(a)(c) | | Net Asset
Value,
End of
Year | | Total
Return† | | Net Assets,
End of
Year
(in 000’s) | | Net
Investment
Income
(Loss)(b) | | Operating
Expenses
Net of
Waivers/
Reimbursements/
Reductions | | Operating
Expenses
Before
Waivers/
Reimbursements/
Reductions(d) | | Portfolio
Turnover
Rate |
Mighty Mites Fund | | | | | | | | | | | | | | | | | | | | | | | | | | | | | | | | | | | | | | | | | | | | | | | | | | | | | | | | | | | | | | | | | | |
Class AAA | | | | | | | | | | | | | | | | | | | | | | | | | | | | | | | | | | | | | | | | | | | | | | | | | | | | | | | | | | | | | | | | | | | | | | | |
2014 | | | $ | 23.81 | | | | $ | (0.22 | ) | | | $ | 0.80 | | | | $ | 0.58 | | | | | — | | | | $ | (1.38 | ) | | | $ | (1.38 | ) | | | $ | 0.00 | | | | $ | 23.01 | | | | | 2.2 | % | | | $ | 365,022 | | | | | (0.90 | )% | | | | 1.41 | % | | | | 1.42 | % | | | | 14 | % |
2013 | | | | 17.94 | | | | | 0.04 | | | | | 6.29 | | | | | 6.33 | | | | $ | (0.08 | ) | | | | (0.38 | ) | | | | (0.46 | ) | | | | 0.00 | | | | | 23.81 | | | | | 36.2 | | | | | 476,112 | | | | | 0.19 | | | | | 1.41 | | | | | 1.43 | | | | | 15 | |
2012 | | | | 14.85 | | | | | (0.10 | ) | | | | 3.54 | | | | | 3.44 | | | | | — | | | | | (0.35 | ) | | | | (0.35 | ) | | | | 0.00 | | | | | 17.94 | | | | | 23.6 | | | | | 277,666 | | | | | (0.62 | ) | | | | 1.44 | | | | | 1.46 | | | | | 12 | |
2011 | | | | 15.81 | | | | | (0.14 | ) | | | | (0.34 | ) | | | | (0.48 | ) | | | | (0.06 | ) | | | | (0.42 | ) | | | | (0.48 | ) | | | | 0.00 | | | | | 14.85 | | | | | (3.3 | ) | | | | 344,800 | | | | | (0.79 | ) | | | | 1.46 | | | | | 1.48 | | | | | 20 | |
2010 | | | | 13.49 | | | | | (0.10 | ) | | | | 2.42 | | | | | 2.32 | | | | | — | | | | | (0.00 | )(c) | | | | (0.00 | )(c) | | | | 0.00 | | | | | 15.81 | | | | | 17.2 | | | | | 261,810 | | | | | (0.67 | ) | | | | 1.55 | | | | | 1.58 | | | | | 27 | |
Class A | | | | | | | | | | | | | | | | | | | | | | | | | | | | | | | | | | | | | | | | | | | | | | | | | | | | | | | | | | | | | | | | | | | | | | | |
2014 | | | $ | 23.32 | | | | $ | (0.27 | ) | | | $ | 0.78 | | | | $ | 0.51 | | | | | — | | | | $ | (1.38 | ) | | | $ | (1.38 | ) | | | $ | 0.00 | | | | $ | 22.45 | | | | | 2.0 | % | | | $ | 175,108 | | | | | (1.16 | )% | | | | 1.66 | % | | | | 1.67 | % | | | | 14 | % |
2013 | | | | 17.59 | | | | | (0.02 | ) | | | | 6.17 | | | | | 6.15 | | | | $ | (0.04 | ) | | | | (0.38 | ) | | | | (0.42 | ) | | | | 0.00 | | | | | 23.32 | | | | | 35.8 | | | | | 139,464 | | | | | (0.08 | ) | | | | 1.66 | | | | | 1.68 | | | | | 15 | |
2012 | | | | 14.61 | | | | | (0.14 | ) | | | | 3.47 | | | | | 3.33 | | | | | — | | | | | (0.35 | ) | | | | (0.35 | ) | | | | 0.00 | | | | | 17.59 | | | | | 23.2 | | | | | 77,803 | | | | | (0.87 | ) | | | | 1.69 | | | | | 1.71 | | | | | 12 | |
2011 | | | | 15.57 | | | | | (0.18 | ) | | | | (0.32 | ) | | | | (0.50 | ) | | | | (0.04 | ) | | | | (0.42 | ) | | | | (0.46 | ) | | | | 0.00 | | | | | 14.61 | | | | | (3.5 | ) | | | | 64,457 | | | | | (1.04 | ) | | | | 1.71 | | | | | 1.73 | | | | | 20 | |
2010 | | | | 13.32 | | | | | (0.13 | ) | | | | 2.38 | | | | | 2.25 | | | | | — | | | | | (0.00 | )(c) | | | | (0.00 | )(c) | | | | 0.00 | | | | | 15.57 | | | | | 16.9 | | | | | 48,464 | | | | | (0.91 | ) | | | | 1.80 | | | | | 1.83 | | | | | 27 | |
Class C | | | | | | | | | | | | | | | | | | | | | | | | | | | | | | | | | | | | | | | | | | | | | | | | | | | | | | | | | | | | | | | | | | | | | | | |
2014 | | | $ | 21.46 | | | | $ | (0.36 | ) | | | $ | 0.72 | | | | $ | 0.36 | | | | | — | | | | $ | (1.38 | ) | | | $ | (1.38 | ) | | | $ | 0.00 | | | | $ | 20.44 | | | | | 1.4 | % | | | $ | 208,795 | | | | | (1.66 | )% | | | | 2.16 | % | | | | 2.17 | % | | | | 14 | % |
2013 | | | | 16.25 | | | | | (0.10 | ) | | | | 5.69 | | | | | 5.59 | | | | | — | | | | | (0.38 | ) | | | | (0.38 | ) | | | | 0.00 | | | | | 21.46 | | | | | 35.3 | | | | | 160,852 | | | | | (0.57 | ) | | | | 2.16 | | | | | 2.18 | | | | | 15 | |
2012 | | | | 13.59 | | | | | (0.21 | ) | | | | 3.22 | | | | | 3.01 | | | | | — | | | | | (0.35 | ) | | | | (0.35 | ) | | | | 0.00 | | | | | 16.25 | | | | | 22.6 | | | | | 92,012 | | | | | (1.37 | ) | | | | 2.19 | | | | | 2.21 | | | | | 12 | |
2011 | | | | 14.55 | | | | | (0.25 | ) | | | | (0.29 | ) | | | | (0.54 | ) | | | | — | | | | | (0.42 | ) | | | | (0.42 | ) | | | | 0.00 | | | | | 13.59 | | | | | (4.0 | ) | | | | 79,827 | | | | | (1.57 | ) | | | | 2.21 | | | | | 2.23 | | | | | 20 | |
2010 | | | | 12.51 | | | | | (0.19 | ) | | | | 2.23 | | | | | 2.04 | | | | | — | | | | | (0.00 | )(c) | | | | (0.00 | )(c) | | | | 0.00 | | | | | 14.55 | | | | | 16.3 | | | | | 40,297 | | | | | (1.41 | ) | | | | 2.30 | | | | | 2.33 | | | | | 27 | |
Class I | | | | | | | | | | | | | | | | | | | | | | | | | | | | | | | | | | | | | | | | | | | | | | | | | | | | | | | | | | | | | | | | | | | | | | | |
2014 | | | $ | 24.02 | | | | $ | (0.16 | ) | | | $ | 0.79 | | | | $ | 0.63 | | | | | — | | | | $ | (1.38 | ) | | | $ | (1.38 | ) | | | $ | 0.00 | | | | $ | 23.27 | | | | | 2.4 | % | | | $ | 519,459 | | | | | (0.67 | )% | | | | 1.16 | % | | | | 1.17 | % | | | | 14 | % |
2013 | | | | 18.13 | | | | | 0.08 | | | | | 6.35 | | | | | 6.43 | | | | $ | (0.16 | ) | | | | (0.38 | ) | | | | (0.54 | ) | | | | 0.00 | | | | | 24.02 | | | | | 36.6 | | | | | 277,588 | | | | | 0.40 | | | | | 1.16 | | | | | 1.18 | | | | | 15 | |
2012 | | | | 14.98 | | | | | (0.06 | ) | | | | 3.56 | | | | | 3.50 | | | | | — | | | | | (0.35 | ) | | | | (0.35 | ) | | | | 0.00 | | | | | 18.13 | | | | | 23.8 | | | | | 131,003 | | | | | (0.38 | ) | | | | 1.19 | | | | | 1.21 | | | | | 12 | |
2011 | | | | 15.92 | | | | | (0.10 | ) | | | | (0.33 | ) | | | | (0.43 | ) | | | | (0.09 | ) | | | | (0.42 | ) | | | | (0.51 | ) | | | | 0.00 | | | | | 14.98 | | | | | (3.0 | ) | | | | 53,767 | | | | | (0.57 | ) | | | | 1.21 | | | | | 1.23 | | | | | 20 | |
2010 | | | | 13.55 | | | | | (0.06 | ) | | | | 2.43 | | | | | 2.37 | | | | | — | | | | | (0.00 | )(c) | | | | (0.00 | )(c) | | | | 0.00 | | | | | 15.92 | | | | | 17.5 | | | | | 23,406 | | | | | (0.41 | ) | | | | 1.30 | | | | | 1.33 | | | | | 27 | |
| † | Total return represents aggregate total return of a hypothetical $1,000 investment at the beginning of the year and sold at the end of the year including reinvestment of distributions and does not reflect applicable sales charges. |
| (a) | Per share data is calculated using the average shares outstanding method. |
| (b) | Due to capital share activity, net investment income (loss), per share and the ratio to average net assets are not necessarily correlated among the different classes of shares. |
| (c) | Amount represents less than $0.005 per share. |
| (d) | Before advisory fee reduction on unsupervised assets totaling 0.01%, 0.02%, 0.02%, 0.02%, and 0.03% of net assets for the years ended September 30, 2014, 2013, 2012, 2011, and 2010, respectively. |
See accompanying notes to financial statements.
42
TETON Westwood Funds
Financial Highlights
Selected data for a share of beneficial interest outstanding throughout each year:
| | | | | | | | | | | | | | | | | | | | | | | | | | | | | | | | | | | | | | | | | | | | | | | | | | | | | | | | | | | | | | | | | | | | | | | | | | | |
| | | | | Income (Loss) from Investment Operations | | Distributions to Shareholders | | | | | | | | Ratios to Average Net Assets/Supplemental Data |
Year Ended
September 30 | | Net Asset
Value,
Beginning
of Year | | Net
Investment
Income
(Loss)(a) | | Net
Realized and
Unrealized
Gain (Loss) on
Investments | | Total From
Investment
Operations | | Net
Investment
Income | | Net
Realized
Gain on
Investments | | Total
Distributions | | Redemption
Fees(a)(b) | | Net Asset
Value,
End of
Year | | Total
Return† | | Net Assets,
End of
Year
(in 000’s) | | Net
Investment
Income
(Loss) | | Operating
Expenses
Net of
Waivers/
Reimbursements | | Operating
Expenses
Before Waivers/
Reimbursements | | Portfolio
Turnover
Rate |
SmallCap Equity Fund | | | | | | | | | | | | | | | | | | | | | | | | | | | | | | | | | | | | | | | | | | | | | | | | | | | | | | | | | | | | | | | | | | |
Class AAA | | | | | | | | | | | | | | | | | | | | | | | | | | | | | | | | | | | | | | | | | | | | | | | | | | | | | | | | | | | | | | | | | | | | | | | |
2014 | | | $ | 19.83 | | | | $ | (0.07 | ) | | | $ | 0.76 | | | | $ | 0.69 | | | | | — | | | | | — | | | | | — | | | | $ | 0.00 | | | | $ | 20.52 | | | | | 3.5 | % | | | $ | 15,649 | | | | | (0.35 | )% | | | | 1.50 | % | | | | 1.57 | % | | | | 13 | % |
2013 | | | | 15.32 | | | | | (0.01 | ) | | | | 4.52 | | | | | 4.51 | | | | | — | | | | | — | | | | | — | | | | | 0.00 | | | | | 19.83 | | | | | 29.4 | | | | | 19,576 | | | | | (0.05 | ) | | | | 1.50 | | | | | 1.63 | | | | | 12 | |
2012 | | | | 12.85 | | | | | (0.03 | ) | | | | 2.87 | | | | | 2.84 | | | | | — | | | | $ | (0.37 | ) | | | $ | (0.37 | ) | | | | 0.00 | | | | | 15.32 | | | | | 22.5 | | | | | 16,170 | | | | | (0.21 | ) | | | | 1.50 | | | | | 1.65 | | | | | 39 | |
2011 | | | | 13.36 | | | | | (0.12 | ) | | | | (0.39 | ) | | | | (0.51 | ) | | | | — | | | | | — | | | | | — | | | | | 0.00 | | | | | 12.85 | | | | | (3.8 | ) | | | | 28,843 | | | | | (0.73 | ) | | | | 1.50 | | | | | 1.69 | | | | | 52 | |
2010 | | | | 11.60 | | | | | (0.10 | ) | | | | 1.86 | | | | | 1.76 | | | | | — | | | | | — | | | | | — | | | | | 0.00 | | | | | 13.36 | | | | | 15.2 | | | | | 10,435 | | | | | (0.81 | ) | | | | 1.50 | | | | | 1.99 | | | | | 28 | |
Class A | | | | | | | | | | | | | | | | | | | | | | | | | | | | | | | | | | | | | | | | | | | | | | | | | | | | | | | | | | | | | | | | | | | | | | | |
2014 | | | $ | 19.41 | | | | $ | (0.12 | ) | | | $ | 0.76 | | | | $ | 0.64 | | | | | — | | | | | — | | | | | — | | | | $ | 0.00 | | | | $ | 20.05 | | | | | 3.3 | % | | | $ | 4,269 | | | | | (0.60 | )% | | | | 1.75 | % | | | | 1.82 | % | | | | 13 | % |
2013 | | | | 15.03 | | | | | (0.04 | ) | | | | 4.42 | | | | | 4.38 | | | | | — | | | | | — | | | | | — | | | | | 0.00 | | | | | 19.41 | | | | | 29.1 | | | | | 4,668 | | | | | (0.22 | ) | | | | 1.75 | | | | | 1.88 | | | | | 12 | |
2012 | | | | 12.65 | | | | | (0.06 | ) | | | | 2.81 | | | | | 2.75 | | | | | — | | | | $ | (0.37 | ) | | | $ | (0.37 | ) | | | | 0.00 | | | | | 15.03 | | | | | 22.1 | | | | | 5,390 | | | | | (0.42 | ) | | | | 1.75 | | | | | 1.90 | | | | | 39 | |
2011 | | | | 13.18 | | | | | (0.16 | ) | | | | (0.37 | ) | | | | (0.53 | ) | | | | — | | | | | — | | | | | — | | | | | 0.00 | | | | | 12.65 | | | | | (4.0 | ) | | | | 4,965 | | | | | (0.98 | ) | | | | 1.75 | | | | | 1.94 | | | | | 52 | |
2010 | | | | 11.47 | | | | | (0.13 | ) | | | | 1.84 | | | | | 1.71 | | | | | — | | | | | — | | | | | — | | | | | 0.00 | | | | | 13.18 | | | | | 14.9 | | | | | 3,509 | | | | | (1.06 | ) | | | | 1.75 | | | | | 2.24 | | | | | 28 | |
Class C | | | | | | | | | | | | | | | | | | | | | | | | | | | | | | | | | | | | | | | | | | | | | | | | | | | | | | | | | | | | | | | | | | | | | | | |
2014 | | | $ | 18.06 | | | | $ | (0.21 | ) | | | $ | 0.71 | | | | $ | 0.50 | | | | | — | | | | | — | | | | | — | | | | $ | 0.00 | | | | $ | 18.56 | | | | | 2.8 | % | | | $ | 4,186 | | | | | (1.10 | )% | | | | 2.25 | % | | | | 2.32 | % | | | | 13 | % |
2013 | | | | 14.06 | | | | | (0.11 | ) | | | | 4.11 | | | | | 4.00 | | | | | — | | | | | — | | | | | — | | | | | 0.00 | | | | | 18.06 | | | | | 28.4 | | | | | 4,460 | | | | | (0.72 | ) | | | | 2.25 | | | | | 2.38 | | | | | 12 | |
2012 | | | | 11.91 | | | | | (0.13 | ) | | | | 2.65 | | | | | 2.52 | | | | | — | | | | $ | (0.37 | ) | | | $ | (0.37 | ) | | | | 0.00 | | | | | 14.06 | | | | | 21.5 | | | | | 5,261 | | | | | (0.92 | ) | | | | 2.25 | | | | | 2.40 | | | | | 39 | |
2011 | | | | 12.47 | | | | | (0.22 | ) | | | | (0.34 | ) | | | | (0.56 | ) | | | | — | | | | | — | | | | | — | | | | | 0.00 | | | | | 11.91 | | | | | (4.5 | ) | | | | 5,406 | | | | | (1.50 | ) | | | | 2.25 | | | | | 2.44 | | | | | 52 | |
2010 | | | | 10.91 | | | | | (0.18 | ) | | | | 1.74 | | | | | 1.56 | | | | | — | | | | | — | | | | | — | | | | | 0.00 | | | | | 12.47 | | | | | 14.3 | | | | | 911 | | | | | (1.55 | ) | | | | 2.25 | | | | | 2.74 | | | | | 28 | |
Class I | | | | | | | | | | | | | | | | | | | | | | | | | | | | | | | | | | | | | | | | | | | | | | | | | | | | | | | | | | | | | | | | | | | | | | | |
2014 | | | $ | 20.09 | | | | $ | (0.02 | ) | | | $ | 0.78 | | | | $ | 0.76 | | | | | — | | | | | — | | | | | — | | | | $ | 0.00 | | | | $ | 20.85 | | | | | 3.8 | % | | | $ | 17,230 | | | | | (0.09 | )% | | | | 1.25 | % | | | | 1.32 | % | | | | 13 | % |
2013 | | | | 15.50 | | | | | 0.04 | | | | | 4.57 | | | | | 4.61 | | | | $ | (0.02 | ) | | | | — | | | | $ | (0.02 | ) | | | | 0.00 | | | | | 20.09 | | | | | 29.8 | | | | | 13,688 | | | | | 0.22 | | | | | 1.25 | | | | | 1.38 | | | | | 12 | |
2012 | | | | 12.96 | | | | | 0.04 | | | | | 2.87 | | | | | 2.91 | | | | | — | | | | $ | (0.37 | ) | | | | (0.37 | ) | | | | 0.00 | | | | | 15.50 | | | | | 22.8 | | | | | 12,752 | | | | | 0.23 | | | | | 1.25 | | | | | 1.40 | | | | | 39 | |
2011 | | | | 13.45 | | | | | (0.07 | ) | | | | (0.42 | ) | | | | (0.49 | ) | | | | — | | | | | — | | | | | — | | | | | 0.00 | | | | | 12.96 | | | | | (3.6 | ) | | | | 759 | | | | | (0.46 | ) | | | | 1.25 | | | | | 1.44 | | | | | 52 | |
2010 | | | | 11.65 | | | | | (0.08 | ) | | | | 1.88 | | | | | 1.80 | | | | | — | | | | | — | | | | | — | | | | | 0.00 | | | | | 13.45 | | | | | 15.5 | | | | | 1,123 | | | | | (0.59 | ) | | | | 1.25 | | | | | 1.74 | | | | | 28 | |
| † | Total return represents aggregate total return of a hypothetical $1,000 investment at the beginning of the year and sold at the end of the year including reinvestment of distributions and does not reflect applicable sales charges. |
| (a) | Per share data is calculated using the average shares outstanding method. |
| (b) | Amount represents less than $0.005 per share. |
See accompanying notes to financial statements.
43
TETON Westwood Funds
Financial Highlights
Selected data for a share of beneficial interest outstanding throughout each period:
| | | | | | | | | | | | | | | | | | | | | | | | | | | | | | | | | | | | | | | | | | | | | | | | | | | | | | | | | | | | | | | | | | | | | | |
| | | | | Income (Loss) from Investment Operations | | Distributions to Shareholders | | | | | | Ratios to Average Net Assets/Supplemental Data |
Period Ended
September 30 | | Net Asset
Value,
Beginning
of Period | | Net Investment
Income (Loss)(a) | | Net
Realized and
Unrealized
Gain on
Investments | | Total From
Investment
Operations | | Net
Investment
Income | | Net
Realized
Gain on
Investments/Loss | | Total
Distributions | | Net Asset
Value,
End of
Period | | Total
Return† | | Net Assets,
End of
Period
(in 000’s) | | Net Investment
Income/Loss | | Operating
Expenses
Net of
Waivers/
Reimbursements | | Operating
Expenses
Before Waivers/
Reimbursements | | Portfolio
Turnover
Rate |
Mid-Cap Equity Fund | | | | | | | | | | | | | | | | | | | | | | | | | | | | | | | | | | | | | | | | | | | | | | | | | | | | | | | | |
Class AAA | | | | | | | | | | | | | | | | | | | | | | | | | | | | | | | | | | | | | | | | | | | | | | | | | | | | | | | | | | | | | | | | | | |
2014 | | | $ | 10.48 | | | | $ | (0.04 | ) | | | $ | 1.10 | | | | $ | 1.06 | | | | | — | | | | $ | (0.00 | )(b) | | | $ | (0.00 | )(b) | | | $ | 11.54 | | | | | 10.2 | % | | | $ | 1,679 | | | | | (0.39 | )% | | | | 1.51 | %(c) | | | | 4.27 | % | | | | 22 | % |
2013(d) | | | | 10.00 | | | | | (0.01 | ) | | | | 0.49 | | | | | 0.48 | | | | | — | | | | | — | | | | | — | | | | | 10.48 | | | | | 4.8 | | | | | 661 | | | | | (0.42 | )(e) | | | | 1.50 | (e) | | | | 3.88 | (e)(f) | | | | 3 | |
Class A | | | | | | | | | | | | | | | | | | | | | | | | | | | | | | | | | | | | | | | | | | | | | | | | | | | | | | | | | | | | | | | | | | |
2014 | | | $ | 10.47 | | | | $ | (0.08 | ) | | | $ | 1.12 | | | | $ | 1.04 | | | | | — | | | | $ | (0.00 | )(b) | | | $ | (0.00 | )(b) | | | $ | 11.51 | | | | | 10.0 | % | | | $ | 682 | | | | | (0.69 | )% | | | | 1.76 | %(c) | | | | 4.52 | % | | | | 22 | % |
2013(d) | | | | 10.00 | | | | | 0.03 | | | | | 0.44 | | | | | 0.47 | | | | | — | | | | | — | | | | | — | | | | | 10.47 | | | | | 4.7 | | | | | 188 | | | | | 0.81 | (e) | | | | 1.75 | (e) | | | | 4.13 | (e)(f) | | | | 3 | |
Class C | | | | | | | | | | | | | | | | | | | | | | | | | | | | | | | | | | | | | | | | | | | | | | | | | | | | | | | | | | | | | | | | | | |
2014 | | | $ | 10.45 | | | | $ | (0.13 | ) | | | $ | 1.11 | | | | $ | 0.98 | | | | | — | | | | $ | (0.00 | )(b) | | | $ | (0.00 | )(b) | | | $ | 11.43 | | | | | 9.4 | % | | | $ | 239 | | | | | (1.17 | )% | | | | 2.26 | %(c) | | | | 5.02 | % | | | | 22 | % |
2013(d) | | | | 10.00 | | | | | (0.02 | ) | | | | 0.47 | | | | | 0.45 | | | | | — | | | | | — | | | | | — | | | | | 10.45 | | | | | 4.5 | | | | | 74 | | | | | (0.65 | )(e) | | | | 2.25 | (e) | | | | 4.63 | (e)(f) | | | | 3 | |
Class I | | | | | | | | | | | | | | | | | | | | | | | | | | | | | | | | | | | | | | | | | | | | | | | | | | | | | | | | | | | | | | | | | | |
2014 | | | $ | 10.48 | | | | $ | (0.01 | ) | | | $ | 1.11 | | | | $ | 1.10 | | | | $ | (0.01 | ) | | | $ | (0.00 | )(b) | | | $ | (0.01 | ) | | | $ | 11.57 | | | | | 10.5 | % | | | $ | 2,345 | | | | | (0.09 | )% | | | | 1.26 | %(c) | | | | 4.02 | % | | | | 22 | % |
2013(d) | | | | 10.00 | | | | | (0.01 | ) | | | | 0.49 | | | | | 0.48 | | | | | — | | | | | — | | | | | — | | | | | 10.48 | | | | | 4.8 | | | | | 1,155 | | | | | (0.20 | )(e) | | | | 1.25 | (e) | | | | 3.63 | (e)(f) | | | | 3 | |
| † | Total return represents aggregate total return of a hypothetical $1,000 investment at the beginning of the period and sold at the end of the period including reinvestment of distributions and does not reflect the applicable sales charges. Total return for a period of less than one year is not annualized. |
| (a) | Per share data is calculated using the average shares outstanding method. |
| (b) | Amount represents less than $0.005 per share. |
| (c) | The Fund incurred interest expense during the year ended September 30, 2014. If interest expense had not been incurred, the ratio of operating expenses to average net assets would have been 1.50% (Class AAA), 1.75% (Class A), 2.25% (Class C), and 1.25% (Class I), respectively. |
| (d) | From the commencement of offering of Fund Shares on May 31, 2013 through September 30, 2013. |
| (f) | Certain non-recurring expenses incurred by the Fund were not annualized in the calculation of the expense ratios. If these expenses were annualized, the total expenses would have been 10.11% (Class AAA), 10.36% (Class A), 10.86% (Class C), and 9.86% (Class I). |
See accompanying notes to financial statements.
44
TETON Westwood Funds
Financial Highlights
Selected data for a share of beneficial interest outstanding throughout each year:
| | | | | | | | | | | | | | | | | | | | | | | | | | | | | | | | | | | | | | | | | | | | | | | | | | | | | | | | | | | | | | | | | | | | | | |
| | | | | Income from Investment Operations | | Distributions to Shareholders | | | | | | | | Ratios to Average Net Assets/Supplemental Data |
Year Ended
September 30 | | Net Asset Value,
Beginning of Year | | Net
Investment
Income(a) | | Net
Realized and
Unrealized
Gain on
Investments | | Total From
Investment
Operations | | Net
Investment
Income | | Total
Distributions | | Redemption
Fees(a) | | Net Asset
Value,
End of Year | | Total Return† | | Net Assets,
End of Year
(in 000’s) | | Net
Investment
Income | | Operating
Expenses
Net of
Waivers/
Reimbursements | | Operating
Expenses
Before Waivers/
Reimbursements | | Portfolio
Turnover
Rate |
Income Fund | | | | | | | | | | | | | | | | | | | | | | | | | | | | | | | | | | | | | | | | | | | | | | | | | | | | | | | | | | | | | |
Class AAA | | | | | | | | | | | | | | | | | | | | | | | | | | | | | | | | | | | | | | | | | | | | | | | | | | | | | | | | | | | | | | | | | | |
2014 | | | $ | 10.40 | | | | $ | 0.21 | | | | $ | 1.38 | | | | $ | 1.59 | | | | $ | (0.20 | ) | | | $ | (0.20 | ) | | | $ | 0.00 | (b) | | | $ | 11.79 | | | | | 15.5 | % | | | $ | 6,240 | | | | | 1.86 | % | | | | 2.00 | % | | | | 2.42 | % | | | | 31 | % |
2013 | | | | 8.96 | | | | | 0.07 | | | | | 1.45 | | | | | 1.52 | | | | | (0.08 | ) | | | | (0.08 | ) | | | | 0.00 | (b) | | | | 10.40 | | | | | 17.0 | | | | | 6,147 | | | | | 0.73 | | | | | 2.00 | | | | | 2.57 | | | | | 13 | |
2012 | | | | 7.65 | | | | | 0.10 | | | | | 1.31 | | | | | 1.41 | | | | | (0.10 | ) | | | | (0.10 | ) | | | | 0.00 | (b) | | | | 8.96 | | | | | 18.5 | | | | | 5,151 | | | | | 1.22 | | | | | 2.00 | | | | | 2.82 | | | | | 11 | |
2011 | | | | 7.53 | | | | | 0.09 | | | | | 0.11 | | | | | 0.20 | | | | | (0.08 | ) | | | | (0.08 | ) | | | | 0.00 | (b) | | | | 7.65 | | | | | 2.6 | | | | | 4,665 | | | | | 1.08 | | | | | 1.84 | | | | | 2.74 | | | | | 14 | |
2010 | | | | 6.96 | | | | | 0.13 | | | | | 0.56 | | | | | 0.69 | | | | | (0.12 | ) | | | | (0.12 | ) | | | | — | | | | | 7.53 | | | | | 9.9 | | | | | 4,822 | | | | | 1.73 | | | | | 1.50 | | | | | 3.19 | | | | | 10 | |
Class A | | | | | | | | | | | | | | | | | | | | | | | | | | | | | | | | | | | | | | | | | | | | | | | | | | | | | | | | | | | | | | | | | | |
2014 | | | $ | 10.75 | | | | $ | 0.19 | | | | $ | 1.43 | | | | $ | 1.62 | | | | $ | (0.19 | ) | | | $ | (0.19 | ) | | | $ | 0.00 | (b) | | | $ | 12.18 | | | | | 15.2 | % | | | $ | 1,013 | | | | | 1.63 | % | | | | 2.25 | % | | | | 2.67 | % | | | | 31 | % |
2013 | | | | 9.26 | | | | | 0.05 | | | | | 1.49 | | | | | 1.54 | | | | | (0.05 | ) | | | | (0.05 | ) | | | | 0.00 | (b) | | | | 10.75 | | | | | 16.7 | | | | | 907 | | | | | 0.44 | | | | | 2.25 | | | | | 2.82 | | | | | 13 | |
2012 | | | | 7.91 | | | | | 0.07 | | | | | 1.37 | | | | | 1.44 | | | | | (0.09 | ) | | | | (0.09 | ) | | | | 0.00 | (b) | | | | 9.26 | | | | | 18.3 | | | | | 389 | | | | | 0.78 | | | | | 2.25 | | | | | 3.07 | | | | | 11 | |
2011 | | | | 7.79 | | | | | 0.08 | | | | | 0.10 | | | | | 0.18 | | | | | (0.06 | ) | | | | (0.06 | ) | | | | 0.00 | (b) | | | | 7.91 | | | | | 2.2 | | | | | 47 | | | | | 0.98 | | | | | 1.89 | | | | | 3.15 | | | | | 14 | |
2010 | | | | 7.20 | | | | | 0.10 | | | | | 0.59 | | | | | 0.69 | | | | | (0.10 | ) | | | | (0.10 | ) | | | | — | | | | | 7.79 | | | | | 9.7 | | | | | 341 | | | | | 1.29 | | | | | 1.75 | | | | | 3.44 | | | | | 10 | |
Class C | | | | | | | | | | | | | | | | | | | | | | | | | | | | | | | | | | | | | | | | | | | | | | | | | | | | | | | | | | | | | | | | | | |
2014 | | | $ | 11.54 | | | | $ | 0.17 | | | | $ | 1.50 | | | | $ | 1.67 | | | | $ | (0.17 | ) | | | $ | (0.17 | ) | | | $ | 0.00 | (b) | | | $ | 13.04 | | | | | 14.6 | % | | | $ | 1,045 | | | | | 1.30 | % | | | | 2.75 | % | | | | 3.17 | % | | | | 31 | % |
2013 | | | | 9.94 | | | | | 0.00 | (b) | | | | 1.61 | | | | | 1.61 | | | | | (0.01 | ) | | | | (0.01 | ) | | | | 0.00 | (b) | | | | 11.54 | | | | | 16.2 | | | | | 1,086 | | | | | 0.01 | | | | | 2.75 | | | | | 3.32 | | | | | 13 | |
2012 | | | | 8.49 | | | | | 0.03 | | | | | 1.46 | | | | | 1.49 | | | | | (0.04 | ) | | | | (0.04 | ) | | | | 0.00 | (b) | | | | 9.94 | | | | | 17.6 | | | | | 1,307 | | | | | 0.36 | | | | | 2.75 | | | | | 3.57 | | | | | 11 | |
2011 | | | | 8.36 | | | | | 0.02 | | | | | 0.13 | | | | | 0.15 | | | | | (0.02 | ) | | | | (0.02 | ) | | | | 0.00 | (b) | | | | 8.49 | | | | | 1.8 | | | | | 437 | | | | | 0.19 | | | | | 2.62 | | | | | 3.47 | | | | | 14 | |
2010 | | | | 7.70 | | | | | 0.08 | | | | | 0.62 | | | | | 0.70 | | | | | (0.04 | ) | | | | (0.04 | ) | | | | — | | | | | 8.36 | | | | | 9.1 | | | | | 97 | | | | | 1.04 | | | | | 2.25 | | | | | 3.94 | | | | | 10 | |
Class I | | | | | | | | | | | | | | | | | | | | | | | | | | | | | | | | | | | | | | | | | | | | | | | | | | | | | | | | | | | | | | | | | | |
2014 | | | $ | 10.40 | | | | $ | 0.24 | | | | $ | 1.39 | | | | $ | 1.63 | | | | $ | (0.23 | ) | | | $ | (0.23 | ) | | | $ | 0.00 | (b) | | | $ | 11.80 | | | | | 15.8 | % | | | $ | 290 | | | | | 2.15 | % | | | | 1.75 | % | | | | 2.17 | % | | | | 31 | % |
2013 | | | | 8.96 | | | | | 0.10 | | | | | 1.44 | | | | | 1.54 | | | | | (0.10 | ) | | | | (0.10 | ) | | | | 0.00 | (b) | | | | 10.40 | | | | | 17.3 | | | | | 185 | | | | | 0.99 | | | | | 1.75 | | | | | 2.32 | | | | | 13 | |
2012 | | | | 7.65 | | | | | 0.12 | | | | | 1.31 | | | | | 1.43 | | | | | (0.12 | ) | | | | (0.12 | ) | | | | 0.00 | (b) | | | | 8.96 | | | | | 18.8 | | | | | 126 | | | | | 1.43 | | | | | 1.75 | | | | | 2.57 | | | | | 11 | |
2011 | | | | 7.53 | | | | | 0.10 | | | | | 0.12 | | | | | 0.22 | | | | | (0.10 | ) | | | | (0.10 | ) | | | | 0.00 | (b) | | | | 7.65 | | | | | 2.9 | | | | | 92 | | | | | 1.26 | | | | | 1.61 | | | | | 2.48 | | | | | 14 | |
2010 | | | | 6.97 | | | | | 0.14 | | | | | 0.56 | | | | | 0.70 | | | | | (0.14 | ) | | | | (0.14 | ) | | | | — | | | | | 7.53 | | | | | 10.1 | | | | | 54 | | | | | 1.97 | | | | | 1.25 | | | | | 2.94 | | | | | 10 | |
| † | Total return represents aggregate total return of a hypothetical $1,000 investment at the beginning of the year and sold at the end of the year including reinvestment of distributions and does not reflect applicable sales charges. |
| (a) | Per share data is calculated using the average shares outstanding method. |
| (b) | Amount represents less than $0.005 per share. |
See accompanying notes to financial statements.
45
TETON Westwood Funds
Financial Highlights
Selected data for a share of beneficial interest outstanding throughout each year:
| | | | | | | | | | | | | | | | | | | | | | | | | | | | | | | | | | | | | | | | | | | | | | | | | | | | | | | | | |
| | | | | Income (Loss) from Investment Operations | | Distributions to Shareholders | | | | | | Ratios to Average Net Assets/Supplemental Data |
Year Ended September 30 | | Net Asset Value,
Beginning of Year | | Net Investment
Income (Loss)(a) | | Net Realized and
Unrealized
Gain (Loss) on
Investments | | Total From
Investment
Operations | | Net Investment
Income | | Total Distributions | | Net Asset
Value,
End of Year | | Total Return† | | Net Assets,
End of Year (in 000’s) | | Net
Investment
Income (Loss) | | Operating
Expenses††(b) | | Portfolio
Turnover Rate |
Equity Fund | | | | | | | | | | | | | | | | | | | | | | | | | | | | | | | | | | | | | | | | | | | | | | | | | | | | | | | | | |
Class AAA | | | | | | | | | | | | | | | | | | | | | | | | | | | | | | | | | | | | | | | | | | | | | | | | | | | | | | | | | |
2014 | | | $ | 11.88 | | | | $ | 0.05 | | | | $ | 1.76 | | | | $ | 1.81 | | | | $ | (0.04 | ) | | $(0.04) | | | $ | 13.65 | | | | | 15.3 | % | | | $ | 60,587 | | | | | 0.37 | % | | | | 1.59 | % | | | | 51 | % |
2013 | | | | 9.92 | | | | | 0.06 | | | | | 1.99 | | | | | 2.05 | | | | | (0.09 | ) | | (0.09) | | | | 11.88 | | | | | 20.9 | | | | | 64,595 | | | | | 0.53 | | | | | 1.62 | | | | | 53 | |
2012 | | | | 7.81 | | | | | 0.08 | | | | | 2.11 | | | | | 2.19 | | | | | (0.08 | ) | | (0.08) | | | | 9.92 | | | | | 28.3 | | | | | 70,017 | | | | | 0.84 | | | | | 1.59 | | | | | 41 | |
2011 | | | | 8.17 | | | | | 0.07 | | | | | (0.38 | ) | | | | (0.31 | ) | | | | (0.05 | ) | | (0.05) | | | | 7.81 | | | | | (3.8 | ) | | | | 79,328 | | | | | 0.73 | | | | | 1.54 | | | | | 38 | |
2010 | | | | 7.72 | | | | | 0.04 | | | | | 0.48 | | | | | 0.52 | | | | | (0.07 | ) | | (0.07) | | | | 8.17 | | | | | 6.8 | | | | | 99,986 | | | | | 0.55 | | | | | 1.56 | | | | | 52 | |
Class A | | | | | | | | | | | | | | | | | | | | | | | | | | | | | | | | | | | | | | | | | | | | | | | | | | | | | | | | | |
2014 | | | $ | 11.84 | | | | $ | 0.02 | | | | $ | 1.76 | | | | $ | 1.78 | | | | $ | (0.01 | ) | | $(0.01) | | | $ | 13.61 | | | | | 15.0 | % | | | $ | 3,329 | | | | | 0.12 | % | | | | 1.84 | % | | | | 51 | % |
2013 | | | | 9.89 | | | | | 0.03 | | | | | 1.99 | | | | | 2.02 | | | | | (0.07 | ) | | (0.07) | | | | 11.84 | | | | | 20.5 | | | | | 3,256 | | | | | 0.27 | | | | | 1.87 | | | | | 53 | |
2012 | | | | 7.78 | | | | | 0.05 | | | | | 2.11 | | | | | 2.16 | | | | | (0.05 | ) | | (0.05) | | | | 9.89 | | | | | 27.9 | | | | | 3,221 | | | | | 0.60 | | | | | 1.84 | | | | | 41 | |
2011 | | | | 8.13 | | | | | 0.04 | | | | | (0.37 | ) | | | | (0.33 | ) | | | | (0.02 | ) | | (0.02) | | | | 7.78 | | | | | (4.0 | ) | | | | 3,445 | | | | | 0.44 | | | | | 1.79 | | | | | 38 | |
2010 | | | | 7.69 | | | | | 0.02 | | | | | 0.48 | | | | | 0.50 | | | | | (0.06 | ) | | (0.06) | | | | 8.13 | | | | | 6.5 | | | | | 6,616 | | | | | 0.31 | | | | | 1.81 | | | | | 52 | |
Class C | | | | | | | | | | | | | | | | | | | | | | | | | | | | | | | | | | | | | | | | | | | | | | | | | | | | | | | | | |
2014 | | | $ | 11.51 | | | | $ | (0.05 | ) | | | $ | 1.72 | | | | $ | 1.67 | | | | | — | | | — | | | $ | 13.18 | | | | | 14.5 | % | | | $ | 676 | | | | | (0.38 | )% | | | | 2.34 | % | | | | 51 | % |
2013 | | | | 9.62 | | | | | (0.02 | ) | | | | 1.93 | | | | | 1.91 | | | | $ | (0.02 | ) | | $(0.02) | | | | 11.51 | | | | | 19.9 | | | | | 693 | | | | | (0.22 | ) | | | | 2.37 | | | | | 53 | |
2012 | | | | 7.56 | | | | | 0.01 | | | | | 2.05 | | | | | 2.06 | | | | | — | | | — | | | | 9.62 | | | | | 27.3 | | | | | 784 | | | | | 0.10 | | | | | 2.34 | | | | | 41 | |
2011 | | | | 7.91 | | | | | (0.00 | )(c) | | | | (0.35 | ) | | | | (0.35 | ) | | | | — | | | — | | | | 7.56 | | | | | (4.4 | ) | | | | 816 | | | | | (0.02 | ) | | | | 2.29 | | | | | 38 | |
2010 | | | | 7.49 | | | | | (0.02 | ) | | | | 0.46 | | | | | 0.44 | | | | | (0.02 | ) | | (0.02) | | | | 7.91 | | | | | 5.9 | | | | | 999 | | | | | (0.19 | ) | | | | 2.31 | | | | | 52 | |
Class I | | | | | | | | | | | | | | | | | | | | | | | | | | | | | | | | | | | | | | | | | | | | | | | | | | | | | | | | | |
2014 | | | $ | 11.89 | | | | $ | 0.08 | | | | $ | 1.74 | | | | $ | 1.82 | | | | $ | (0.07 | ) | | $(0.07) | | | $ | 13.64 | | | | | 15.4 | % | | | $ | 3,547 | | | | | 0.60 | % | | | | 1.34 | % | | | | 51 | % |
2013 | | | | 9.93 | | | | | 0.09 | | | | | 1.99 | | | | | 2.08 | | | | | (0.12 | ) | | (0.12) | | | | 11.89 | | | | | 21.2 | | | | | 2,204 | | | | | 0.84 | | | | | 1.37 | | | | | 53 | |
2012 | | | | 7.83 | | | | | 0.09 | | | | | 2.12 | | | | | 2.21 | | | | | (0.11 | ) | | (0.11) | | | | 9.93 | | | | | 28.5 | | | | | 4,377 | | | | | 0.96 | | | | | 1.34 | | | | | 41 | |
2011 | | | | 8.19 | | | | | 0.10 | | | | | (0.39 | ) | | | | (0.29 | ) | | | | (0.07 | ) | | (0.07) | | | | 7.83 | | | | | (3.6 | ) | | | | 1,258 | | | | | 1.07 | | | | | 1.29 | | | | | 38 | |
2010 | | | | 7.73 | | | | | 0.06 | | | | | 0.49 | | | | | 0.55 | | | | | (0.09 | ) | | (0.09) | | | | 8.19 | | | | | 7.1 | | | | | 1,043 | | | | | 0.81 | | | | | 1.31 | | | | | 52 | |
| † | Total return represents aggregate total return of a hypothetical $1,000 investment at the beginning of the year and sold at the end of the year including reinvestment of distributions and does not reflect applicable sales charges. |
| †† | The ratios do not include a reduction for custodian fee credits on cash balances maintained with the custodian (“Custodian Fee Credits”). Including such Custodian Fee Credits, the ratios for the years ended September 30, 2013, 2012, 2011, and 2010 would have been 1.60% 1.56%, 1.52%, and 1.54% (Class AAA), 1.85%, 1.81%, 1.77%, and 1.79% (Class A), 2.35%, 2.31%, 2.27%, and 2.29% (Class C), and 1.35%, 1.31%, 1.27%, and 1.29% (Class I), respectively. For the year ended September 30, 2014, there were no Custodian Fee Credits. |
| (a) | Per share data is calculated using the average shares outstanding method. |
| (b) | The Fund incurred interest expense during the years ended September 30, 2014, 2013, 2012, 2011, and 2010. This interest expense was paid for by prior years Custodian Fee Credits. The effect of interest expense was minimal. |
| (c) | Amount represents less than $0.005 per share. |
See accompanying notes to financial statements.
46
TETON Westwood Funds
Financial Highlights
Selected data for a share of beneficial interest outstanding throughout each year:
| | | | | | | | | | | | | | | | | | | | | | | | | | | | | | | | | | | | | | | | | | | | | | | | | | | | | | | | | | | | | | | | | | | | | | |
| | | | | Income (Loss) from Investment Operations | | Distributions to Shareholders | | | | | | Ratios to Average Net Assets/Supplemental Data | | |
Year Ended
September 30 | | Net Asset Value,
Beginning of Year | | Net Investment
Income(a) | | Net
Realized and
Unrealized
Gain (Loss) on
Investments | | Total From
Investment
Operations | | Net Investment
Income | | Net
Realized
Gain on
Investments | | Total
Distributions | | Net Asset
Value,
End of Year | | Total Return† | | Net Assets,
End of Year (in 000’s) | | Net
Investment
Income | | Operating
Expenses†† | | Portfolio
Turnover Rate | | |
Balanced Fund | | | | | | | | | | | | | | | | | | | | | | | | | | | | | | | | | | | | | | | | | | | | | | | | | | | | | | | | | | | | | | | | | | | |
Class AAA | | | | | | | | | | | | | | | | | | | | | | | | | | | | | | | | | | | | | | | | | | | | | | | | | | | | | | | | | | | | | | | | | | | |
2014 | | | $ | 12.76 | | | | $ | 0.14 | | | | $ | 1.07 | | | | $ | 1.21 | | | | $ | (0.14 | ) | | | $ | (0.92 | ) | | | $ | (1.06 | ) | | | $ | 12.91 | | | | | 9.9 | % | | | $ | 69,187 | | | | | 1.07 | % | | | | 1.29 | % | | | | 39 | % | | |
2013 | | | | 11.48 | | | | | 0.15 | | | | | 1.28 | | | | | 1.43 | | | | | (0.15 | ) | | | | — | | | | | (0.15 | ) | | | | 12.76 | | | | | 12.5 | | | | | 70,824 | | | | | 1.21 | | | | | 1.30 | | | | | 36 | | | |
2012 | | | | 9.86 | | | | | 0.16 | | | | | 1.62 | | | | | 1.78 | | | | | (0.16 | ) | | | | — | | | | | (0.16 | ) | | | | 11.48 | | | | | 18.2 | | | | | 78,999 | | | | | 1.47 | | | | | 1.30 | | | | | 34 | | | |
2011 | | | | 10.13 | | | | | 0.18 | | | | | (0.27 | ) | | | | (0.09 | ) | | | | (0.18 | ) | | | | — | | | | | (0.18 | ) | | | | 9.86 | | | | | (1.0 | ) | | | | 76,941 | | | | | 1.65 | | | | | 1.24 | | | | | 24 | | | |
2010 | | | | 9.65 | | | | | 0.14 | | | | | 0.49 | | | | | 0.63 | | | | | (0.15 | ) | | | | — | | | | | (0.15 | ) | | | | 10.13 | | | | | 6.5 | | | | �� | 106,782 | | | | | 1.45 | | | | | 1.26 | | | | | 33 | | | |
Class A | | | | | | | | | | | | | | | | | | | | | | | | | | | | | | | | | | | | | | | | | | | | | | | | | | | | | | | | | | | | | | | | | | | |
2014 | | | $ | 12.82 | | | | $ | 0.11 | | | | $ | 1.07 | | | | $ | 1.18 | | | | $ | (0.11 | ) | | | $ | (0.92 | ) | | | $ | (1.03 | ) | | | $ | 12.97 | | | | | 9.5 | % | | | $ | 6,443 | | | | | 0.83 | % | | | | 1.54 | % | | | | 39 | % | | |
2013 | | | | 11.53 | | | | | 0.12 | | | | | 1.29 | | | | | 1.41 | | | | | (0.12 | ) | | | | — | | | | | (0.12 | ) | | | | 12.82 | | | | | 12.3 | | | | | 5,869 | | | | | 0.95 | | | | | 1.55 | | | | | 36 | | | |
2012 | | | | 9.90 | | | | | 0.13 | | | | | 1.64 | | | | | 1.77 | | | | | (0.14 | ) | | | | — | | | | | (0.14 | ) | | | | 11.53 | | | | | 17.9 | | | | | 5,121 | | | | | 1.21 | | | | | 1.55 | | | | | 34 | | | |
2011 | | | | 10.17 | | | | | 0.15 | | | | | (0.26 | ) | | | | (0.11 | ) | | | | (0.16 | ) | | | | — | | | | | (0.16 | ) | | | | 9.90 | | | | | (1.2 | ) | | | | 4,298 | | | | | 1.40 | | | | | 1.49 | | | | | 24 | | | |
2010 | | | | 9.69 | | | | | 0.12 | | | | | 0.48 | | | | | 0.60 | | | | | (0.12 | ) | | | | — | | | | | (0.12 | ) | | | | 10.17 | | | | | 6.2 | | | | | 5,136 | | | | | 1.20 | | | | | 1.51 | | | | | 33 | | | |
Class C | | | | | | | | | | | | | | | | | | | | | | | | | | | | | | | | | | | | | | | | | | | | | | | | | | | | | | | | | | | | | | | | | | | |
2014 | | | $ | 12.95 | | | | $ | 0.04 | | | | $ | 1.09 | | | | $ | 1.13 | | | | $ | (0.04 | ) | | | $ | (0.92 | ) | | | $ | (0.96 | ) | | | $ | 13.12 | | | | | 9.0 | % | | | $ | 5,350 | | | | | 0.32 | % | | | | 2.04 | % | | | | 39 | % | | |
2013 | | | | 11.64 | | | | | 0.05 | | | | | 1.31 | | | | | 1.36 | | | | | (0.05 | ) | | | | — | | | | | (0.05 | ) | | | | 12.95 | | | | | 11.7 | | | | | 5,257 | | | | | 0.43 | | | | | 2.05 | | | | | 36 | | | |
2012 | | | | 9.99 | | | | | 0.08 | | | | | 1.65 | | | | | 1.73 | | | | | (0.08 | ) | | | | — | | | | | (0.08 | ) | | | | 11.64 | | | | | 17.4 | | | | | 4,932 | | | | | 0.72 | | | | | 2.05 | | | | | 34 | | | |
2011 | | | | 10.26 | | | | | 0.10 | | | | | (0.27 | ) | | | | (0.17 | ) | | | | (0.10 | ) | | | | — | | | | | (0.10 | ) | | | | 9.99 | | | | | (1.7 | ) | | | | 4,318 | | | | | 0.90 | | | | | 1.99 | | | | | 24 | | | |
2010 | | | | 9.78 | | | | | 0.07 | | | | | 0.48 | | | | | 0.55 | | | | | (0.07 | ) | | | | — | | | | | (0.07 | ) | | | | 10.26 | | | | | 5.7 | | | | | 4,975 | | | | | 0.70 | | | | | 2.01 | | | | | 33 | | | |
Class I | | | | | | | | | | | | | | | | | | | | | | | | | | | | | | | | | | | | | | | | | | | | | | | | | | | | | | | | | | | | | | | | | | | |
2014 | | | $ | 12.76 | | | | $ | 0.17 | | | | $ | 1.06 | | | | $ | 1.23 | | | | $ | (0.17 | ) | | | $ | (0.92 | ) | | | $ | (1.09 | ) | | | $ | 12.90 | | | | | 10.0 | % | | | $ | 2,438 | | | | | 1.35 | % | | | | 1.04 | % | | | | 39 | % | | |
2013 | | | | 11.48 | | | | | 0.18 | | | | | 1.28 | | | | | 1.46 | | | | | (0.18 | ) | | | | — | | | | | (0.18 | ) | | | | 12.76 | | | | | 12.8 | | | | | 1,060 | | | | | 1.44 | | | | | 1.05 | | | | | 36 | | | |
2012 | | | | 9.85 | | | | | 0.19 | | | | | 1.63 | | | | | 1.82 | | | | | (0.19 | ) | | | | — | | | | | (0.19 | ) | | | | 11.48 | | | | | 18.4 | | | | | 872 | | | | | 1.74 | | | | | 1.05 | | | | | 34 | | | |
2011 | | | | 10.12 | | | | | 0.21 | | | | | (0.27 | ) | | | | (0.06 | ) | | | | (0.21 | ) | | | | — | | | | | (0.21 | ) | | | | 9.85 | | | | | (0.7 | ) | | | | 1,834 | | | | | 1.92 | | | | | 0.99 | | | | | 24 | | | |
2010 | | | | 9.64 | | | | | 0.17 | | | | | 0.48 | | | | | 0.65 | | | | | (0.17 | ) | | | | — | | | | | (0.17 | ) | | | | 10.12 | | | | | 6.8 | | | | | 1,769 | | | | | 1.70 | | | | | 1.01 | | | | | 33 | | | |
| † | Total return represents aggregate total return of a hypothetical $1,000 investment at the beginning of the year and sold at the end of the year including reinvestment of distributions and does not reflect applicable sales charges. |
| †† | The ratios do not include a reduction for custodian fee credits on cash balances maintained with the custodian (“Custodian Fee Credits”). Including such Custodian Fee Credits, the ratios for the years ended September 30, 2014, 2013, 2012, 2011, and 2010 would have been 1.27%, 1.28%, 1.27%, 1.22%, and 1.24% (Class AAA), 1.52%, 1.53%, 1.52%, 1.47%, and 1.49% (Class A), 2.02%, 2.03%, 2.02%, 1.97%, and 1.99% (Class C), and 1.02%, 1.03%, 1.02%, 0.97%, and 0.99% (Class I), respectively. |
| (a) | Per share data is calculated using the average shares outstanding method. |
See accompanying notes to financial statements.
47
TETON Westwood Funds
Financial Highlights
Selected data for a share of beneficial interest outstanding throughout each year:
| | | | | | | | | | | | | | | | | | | | | | | | | | | | | | | | | | | | | | | | | | | | | | | | | | | | | | | | | | | | | | | | | | | | | | |
| | | | | Income (Loss) from Investment Operations | | Distributions to Shareholders | | | | | | Ratios to Average Net Assets/Supplemental Data |
Year Ended
September 30 | | Net Asset
Value,
Beginning
of Year | | Net
Investment
Income(a) | | Net
Realized and
Unrealized
Gain (Loss) on
Investments | | Total From
Investment
Operations | | Net
Investment
Income | | Net
Realized
Gain on
Investments | | Total
Distributions | | Net Asset
Value,
End of Year | | Total
Return† | | Net Assets,
End of Year
(in 000’s) | | Net
Investment
Income | | Operating
Expenses
Net of
Waivers/
Reimbursements†† | | Operating
Expenses
Before Waivers/
Reimbursements††† | | Portfolio
Turnover
Rate |
Intermediate Bond Fund | | | | | | | | | | | | | | | | | | | | | | | | | | | | | | | | | | | | | | | | | | | | | | | | | | | | | | | | | | | | | | | | | | | | | | |
Class AAA | | | | | | | | | | | | | | | | | | | | | | | | | | | | | | | | | | | | | | | | | | | | | | | | | | | | | | | | | | | | | | | | | | | | | | |
2014 | | | $ | 11.68 | | | | $ | 0.15 | | | | $ | (0.09 | ) | | | $ | 0.06 | | | | $ | (0.15 | ) | | | | — | | | | $ | (0.15 | ) | | | $ | 11.59 | | | | | 0.5 | % | | | $ | 5,174 | | | | | 1.29 | % | | | | 1.00 | % | | | | 1.38 | % | | | | 16 | % |
2013 | | | | 12.06 | | | | | 0.14 | | | | | (0.36 | ) | | | | (0.22 | ) | | | | (0.15 | ) | | | $ | (0.01 | ) | | | | (0.16 | ) | | | | 11.68 | | | | | (1.9 | ) | | | | 8,737 | | | | | 1.21 | | | | | 1.00 | | | | | 1.36 | | | | | 20 | |
2012 | | | | 11.91 | | | | | 0.19 | | | | | 0.22 | | | | | 0.41 | | | | | (0.19 | ) | | | | (0.07 | ) | | | | (0.26 | ) | | | | 12.06 | | | | | 3.5 | | | | | 11,230 | | | | | 1.56 | | | | | 1.00 | | | | | 1.33 | | | | | 15 | |
2011 | | | | 11.90 | | | | | 0.29 | | | | | 0.03 | | | | | 0.32 | | | | | (0.29 | ) | | | | (0.02 | ) | | | | (0.31 | ) | | | | 11.91 | | | | | 2.7 | | | | | 16,959 | | | | | 2.45 | | | | | 1.00 | | | | | 1.39 | | | | | 16 | |
2010 | | | | 11.52 | | | | | 0.27 | | | | | 0.46 | | | | | 0.73 | | | | | (0.27 | ) | | | | (0.08 | ) | | | | (0.35 | ) | | | | 11.90 | | | | | 6.5 | | | | | 17,038 | | | | | 2.32 | | | | | 1.02 | | | | | 1.49 | | | | | 14 | |
Class A | | | | | | | | | | | | | | | | | | | | | | | | | | | | | | | | | | | | | | | | | | | | | | | | | | | | | | | | | | | | | | | | | | | | | | |
2014 | | | $ | 11.66 | | | | $ | 0.14 | | | | $ | (0.08 | ) | | | $ | 0.06 | | | | $ | (0.14 | ) | | | | — | | | | $ | (0.14 | ) | | | $ | 11.58 | | | | | 0.5 | % | | | $ | 928 | | | | | 1.21 | % | | | | 1.10 | % | | | | 1.48 | % | | | | 16 | % |
2013 | | | | 12.04 | | | | | 0.13 | | | | | (0.37 | ) | | | | (0.24 | ) | | | | (0.13 | ) | | | $ | (0.01 | ) | | | | (0.14 | ) | | | | 11.66 | | | | | (2.0 | ) | | | | 1,066 | | | | | 1.06 | | | | | 1.10 | | | | | 1.46 | | | | | 20 | |
2012 | | | | 11.91 | | | | | 0.18 | | | | | 0.20 | | | | | 0.38 | | | | | (0.18 | ) | | | | (0.07 | ) | | | | (0.25 | ) | | | | 12.04 | | | | | 3.1 | | | | | 1,365 | | | | | 1.46 | | | | | 1.10 | | | | | 1.43 | | | | | 15 | |
2011 | | | | 11.90 | | | | | 0.27 | | | | | 0.04 | | | | | 0.31 | | | | | (0.28 | ) | | | | (0.02 | ) | | | | (0.30 | ) | | | | 11.91 | | | | | 2.6 | | | | | 842 | | | | | 2.33 | | | | | 1.10 | | | | | 1.49 | | | | | 16 | |
2010 | | | | 11.51 | | | | | 0.26 | | | | | 0.47 | | | | | 0.73 | | | | | (0.26 | ) | | | | (0.08 | ) | | | | (0.34 | ) | | | | 11.90 | | | | | 6.4 | | | | | 487 | | | | | 2.23 | | | | | 1.12 | | | | | 1.59 | | | | | 14 | |
Class C | | | | | | | | | | | | | | | | | | | | | | | | | | | | | | | | | | | | | | | | | | | | | | | | | | | | | | | | | | | | | | | | | | | | | | |
2014 | | | $ | 11.09 | | | | $ | 0.06 | | | | $ | (0.08 | ) | | | $ | (0.02 | ) | | | $ | (0.06 | ) | | | | — | | | | $ | (0.06 | ) | | | $ | 11.01 | | | | | (0.2 | )% | | | $ | 503 | | | | | 0.55 | % | | | | 1.75 | % | | | | 2.13 | % | | | | 16 | % |
2013 | | | | 11.46 | | | | | 0.05 | | | | | (0.36 | ) | | | | (0.31 | ) | | | | (0.05 | ) | | | $ | (0.01 | ) | | | | (0.06 | ) | | | | 11.09 | | | | | (2.7 | ) | | | | 803 | | | | | 0.43 | | | | | 1.75 | | | | | 2.11 | | | | | 20 | |
2012 | | | | 11.32 | | | | | 0.09 | | | | | 0.21 | | | | | 0.30 | | | | | (0.09 | ) | | | | (0.07 | ) | | | | (0.16 | ) | | | | 11.46 | | | | | 2.7 | | | | | 1,772 | | | | | 0.80 | | | | | 1.75 | | | | | 2.08 | | | | | 15 | |
2011 | | | | 11.32 | | | | | 0.17 | | | | | 0.04 | | | | | 0.21 | | | | | (0.19 | ) | | | | (0.02 | ) | | | | (0.21 | ) | | | | 11.32 | | | | | 1.9 | | | | | 2,234 | | | | | 1.51 | | | | | 1.75 | | | | | 2.14 | | | | | 16 | |
2010 | | | | 10.96 | | | | | 0.17 | | | | | 0.44 | | | | | 0.61 | | | | | (0.17 | ) | | | | (0.08 | ) | | | | (0.25 | ) | | | | 11.32 | | | | | 5.7 | | | | | 1,716 | | | | | 1.50 | | | | | 1.77 | | | | | 2.24 | | | | | 14 | |
Class I | | | | | | | | | | | | | | | | | | | | | | | | | | | | | | | | | | | | | | | | | | | | | | | | | | | | | | | | | | | | | | | | | | | | | | |
2014 | | | $ | 11.68 | | | | $ | 0.18 | | | | $ | (0.08 | ) | | | $ | 0.10 | | | | $ | (0.18 | ) | | | | — | | | | $ | (0.18 | ) | | | $ | 11.60 | | | | | 0.9 | % | | | $ | 14,705 | | | | | 1.58 | % | | | | 0.75 | % | | | | 1.13 | % | | | | 16 | % |
2013 | | | | 12.06 | | | | | 0.17 | | | | | (0.36 | ) | | | | (0.19 | ) | | | | (0.18 | ) | | | $ | (0.01 | ) | | | | (0.19 | ) | | | | 11.68 | | | | | (1.6 | ) | | | | 11,910 | | | | | 1.45 | | | | | 0.75 | | | | | 1.11 | | | | | 20 | |
2012 | | | | 11.92 | | | | | 0.22 | | | | | 0.21 | | | | | 0.43 | | | | | (0.22 | ) | | | | (0.07 | ) | | | | (0.29 | ) | | | | 12.06 | | | | | 3.6 | | | | | 9,326 | | | | | 1.82 | | | | | 0.75 | | | | | 1.08 | | | | | 15 | |
2011 | | | | 11.91 | | | | | 0.32 | | | | | 0.03 | | | | | 0.35 | | | | | (0.32 | ) | | | | (0.02 | ) | | | | (0.34 | ) | | | | 11.92 | | | | | 3.0 | | | | | 125 | | | | | 2.68 | | | | | 0.75 | | | | | 1.14 | | | | | 16 | |
2010 | | | | 11.52 | | | | | 0.30 | | | | | 0.47 | | | | | 0.77 | | | | | (0.30 | ) | | | | (0.08 | ) | | | | (0.38 | ) | | | | 11.91 | | | | | 6.8 | | | | | 125 | | | | | 2.58 | | | | | 0.77 | | | | | 1.24 | | | | | 14 | |
| † | Total return represents aggregate total return of a hypothetical $1,000 investment at the beginning of the year and sold at the end of the year including reinvestment of distributions and does not reflect applicable sales charges. |
| †† | The ratios do not include a reduction for custodian fee credits on cash balances maintained with the custodian (“Custodian Fee Credits”). Including such Custodian Fee Credits, the ratios for the year ended September 30, 2010 would have been 1.00% (Class AAA), 1.10% (Class A), 1.75% (Class C), and 0.75% (Class I), respectively. For the years ended September 30, 2014, 2013, 2012, and 2011, there were no Custodian Fee Credits. |
| ††† | The ratios do not include a reduction for Custodian Fee Credits. Including such Custodian Fee Credits, the ratios for the year ended September 30, 2010 would have been 1.47% (Class AAA), 1.57% (Class A), 2.22% (Class C), and 1.22% (Class I), respectively. For the years ended September 30, 2014, 2013, 2012, and 2011, there were no Custodian Fee Credits. |
| (a) | Per share data is calculated using the average shares outstanding method. |
See accompanying notes to financial statements.
48
TETON Westwood Funds
Notes to Financial Statements
1. Organization. The TETON Westwood Funds (the “Trust”) was organized as a Massachusetts business trust on June 12, 1986. The Trust is registered under the Investment Company Act of 1940, as amended (the “1940 Act”), as a diversified open-end management investment company and currently consists of seven active separate investment portfolios: TETON Westwood Mighty Mites Fund (“Mighty Mites Fund”), TETON Westwood SmallCap Equity Fund (“SmallCap Equity Fund”), TETON Westwood Mid-Cap Equity Fund (“Mid-Cap Equity Fund”), TETON Westwood Income Fund (“Income Fund”), TETON Westwood Equity Fund (“Equity Fund”), TETON Westwood Balanced Fund (“Balanced Fund”), and TETON Westwood Intermediate Bond Fund (“Intermediate Bond Fund”), (individually, a “Fund” and collectively, the “Funds”), each with four classes of shares. Each class of shares outstanding bears the same voting, dividend, liquidation, and other rights and conditions, except that the expenses incurred in the distribution and marketing of such shares are different for each class.
The investment objectives of each Fund are as follows:
| — | | Mighty Mites Fund seeks to provide long term capital appreciation by investing primarily in micro-capitalization equity securities. |
| — | | SmallCap Equity Fund seeks to provide long term capital appreciation by investing primarily in smaller capitalization equity securities. |
| — | | Mid-Cap Equity Fund seeks to provide long term growth of capital and future income by investing primarily in mid-cap equity securities. |
| — | | Income Fund seeks to provide a high level of current income as well as long term capital appreciation. |
| — | | Equity Fund seeks to provide capital appreciation. The Equity Fund’s secondary goal is to produce current income. |
| — | | Balanced Fund seeks to provide capital appreciation and current income resulting in a high total investment return consistent with prudent investment risk and a balanced investment approach. |
| — | | Intermediate Bond Fund seeks to maximize total return, while maintaining a level of current income consistent with the maintenance of principal and liquidity. |
2. Significant Accounting Policies. The Trust’s financial statements are prepared in accordance with U.S. Generally Accepted Accounting Principles (“GAAP”), which may require the use of management estimates and assumptions. Actual results could differ from those estimates. The following is a summary of significant accounting policies followed by the Funds in the preparation of its financial statements.
Security Valuation. Portfolio securities listed or traded on a nationally recognized securities exchange or traded in the U.S. over-the-counter market for which market quotations are readily available are valued at the last quoted sale price or a market’s official closing price as of the close of business on the day the securities are being valued. If there were no sales that day, the security is valued at the average of the closing bid and asked prices or, if there were no asked prices quoted on that day, then the security is valued at the closing bid price on that day. If no bid or asked prices are quoted on such day, the security is valued at the most recently available price or, if the Board of Trustees (the “Board”) so determines, by such other method as the Board shall determine in good faith to reflect its fair market value. Portfolio securities traded on more than one national securities exchange or market are valued according to the broadest and most representative market, as determined by Teton Advisors, Inc. (the “Adviser”).
Portfolio securities primarily traded on a foreign market are generally valued at the preceding closing values of such securities on the relevant market, but may be fair valued pursuant to procedures established by the Board if market conditions change significantly after the close of the foreign market, but prior to the close of business on the day the securities are being valued. Debt instruments with remaining maturities of sixty days or less that are not credit impaired are valued at amortized cost, unless the Board determines such amount does not reflect the securities’ fair value, in which case these securities will be fair valued as determined by the Board. Debt instruments having a maturity greater than sixty days for which market quotations are readily available are valued at the average of the latest bid and asked prices. If there were no asked prices quoted on such day, the security is valued using the closing bid price. U.S. government obligations with maturities greater than sixty days are normally valued using a model that incorporates market observable data such as reported sales of similar securities, broker quotes, yields, bids, offers, and reference data. Certain securities are valued principally using dealer quotations.
Securities and assets for which market quotations are not readily available are fair valued as determined by the Board. Fair valuation methodologies and procedures may include, but are not limited to: analysis and review of available financial and non-financial information about the company; comparisons with the valuation and changes in valuation of similar securities,
49
TETON Westwood Funds
Notes to Financial Statements (Continued)
including a comparison of foreign securities with the equivalent U.S. dollar value American Depositary Receipt securities at the close of the U.S. exchange; and evaluation of any other information that could be indicative of the value of the security.
The inputs and valuation techniques used to measure fair value of the Funds’ investments are summarized into three levels as described in the hierarchy below:
| | — | | Level 1 — quoted prices in active markets for identical securities; |
| | — | | Level 2 — other significant observable inputs (including quoted prices for similar securities, interest rates, prepayment speeds, credit risk, etc.); and |
| | — | | Level 3 — significant unobservable inputs (including a Board’s determinations as to the fair value of investments). |
A financial instrument’s level within the fair value hierarchy is based on the lowest level of any input both individually and in the aggregate that is significant to the fair value measurement. The inputs or methodology used for valuing securities are not necessarily an indication of the risk associated with investing in those securities. The summary of the Funds’ investments in securities by inputs used to value the Funds’ investments as of September 30, 2014 is as follows:
| | | | | | | | | | | | | | | | | | | | |
| | | Valuation Inputs | | |
| | | Level 1
Quoted Prices | | Level 2 Other Significant
Observable Inputs | | Level 3 Significant
Unobservable Inputs | | Total Market Value
at 9/30/14 |
MIGHTY MITES FUND | | | | | | | | | | | | | | | | | | | | |
INVESTMENTS IN SECURITIES: | | | | | | | | | | | | | | | | | | | | |
ASSETS (Market Value): | | | | | | | | | | | | | | | | | | | | |
Common Stocks: | | | | | | | | | | | | | | | | | | | | |
Airlines | | | $ | 4,435,000 | | | | $ | 337,500 | | | | | — | | | | $ | 4,772,500 | |
Consumer Products | | | | 19,528,733 | | | | | — | | | | $ | 31 | | | | | 19,528,764 | |
Diversified Industrial | | | | 91,124,001 | | | | | 223,840 | | | | | — | | | | | 91,347,841 | |
Financial Services | | | | 58,558,165 | | | | | 495,600 | | | | | — | | | | | 59,053,765 | |
Health Care | | | | 93,870,059 | | | | | — | | | | | 28,640 | | | | | 93,898,699 | |
Real Estate | | | | 16,662,354 | | | | | — | | | | | 203,063 | | | | | 16,865,417 | |
Transportation | | | | 2,324,825 | | | | | — | | | | | 465 | | | | | 2,325,290 | |
Other Industries(a) | | | | 644,178,130 | | | | | — | | | | | — | | | | | 644,178,130 | |
Total Common Stocks | | | | 930,681,267 | | | | | 1,056,940 | | | | | 232,199 | | | | | 931,970,406 | |
Preferred Stocks(a) | | | | 1,127,278 | | | | | — | | | | | — | | | | | 1,127,278 | |
Convertible Preferred Stocks(a) | | | | — | | | | | 2,188,810 | | | | | — | | | | | 2,188,810 | |
Rights(a) | | | | 186,000 | | | | | — | | | | | 452,000 | | | | | 638,000 | |
Warrants(a) | | | | 31,099 | | | | | — | | | | | 0 | | | | | 31,099 | |
Corporate Bonds(a) | | | | — | | | | | 40,281 | | | | | 106,090 | | | | | 146,371 | |
U.S. Government Obligations | | | | — | | | | | 334,246,726 | | | | | — | | | | | 334,246,726 | |
TOTAL INVESTMENTS IN SECURITIES – ASSETS | | | $ | 932,025,644 | | | | $ | 337,532,757 | | | | $ | 790,289 | | | | $ | 1,270,348,690 | |
| | | | |
SMALLCAP EQUITY FUND | | | | | | | | | | | | | | | | | | | | |
INVESTMENTS IN SECURITIES: | | | | | | | | | | | | | | | | | | | | |
ASSETS (Market Value): | | | | | | | | | | | | | | | | | | | | |
Common Stocks(a) | | | $ | 40,299,657 | | | | | — | | | | | — | | | | $ | 40,299,657 | |
U.S. Government Obligations | | | | — | | | | $ | 1,094,967 | | | | | — | | | | | 1,094,967 | |
TOTAL INVESTMENTS IN SECURITIES – ASSETS | | | $ | 40,299,657 | | | | $ | 1,094,967 | | | | | — | | | | $ | 41,394,624 | |
| | | | |
MID-CAP EQUITY FUND | | | | | | | | | | | | | | | | | | | | |
INVESTMENTS IN SECURITIES: | | | | | | | | | | | | | | | | | | | | |
ASSETS (Market Value): | | | | | | | | | | | | | | | | | | | | |
Common Stocks(a) | | | $ | 4,669,169 | | | | | — | | | | | — | | | | $ | 4,669,169 | |
U.S. Government Obligations | | | | — | | | | $ | 344,981 | | | | | — | | | | | 344,981 | |
TOTAL INVESTMENTS IN SECURITIES – ASSETS | | | $ | 4,669,169 | | | | $ | 344,981 | | | | | — | | | | $ | 5,014,150 | |
| | | | |
INCOME FUND | | | | | | | | | | | | | | | | | | | | |
INVESTMENTS IN SECURITIES: | | | | | | | | | | | | | | | | | | | | |
ASSETS (Market Value): | | | | | | | | | | | | | | | | | | | | |
Common Stocks(a) | | | $ | 8,504,550 | | | | | — | | | | | — | | | | $ | 8,504,550 | |
TOTAL INVESTMENTS IN SECURITIES – ASSETS | | | $ | 8,504,550 | | | | | — | | | | | — | | | | $ | 8,504,550 | |
| | | | |
EQUITY FUND | | | | | | | | | | | | | | | | | | | | |
INVESTMENTS IN SECURITIES: | | | | | | | | | | | | | | | | | | | | |
ASSETS (Market Value): | | | | | | | | | | | | | | | | | | | | |
Common Stocks(a) | | | $ | 66,747,745 | | | | | — | | | | | — | | | | $ | 66,747,745 | |
Short Term Investments | | | | 1,502,210 | | | | | — | | | | | — | | | | | 1,502,210 | |
TOTAL INVESTMENTS IN SECURITIES – ASSETS | | | $ | 68,249,955 | | | | | — | | | | | — | | | | $ | 68,249,955 | |
50
TETON Westwood Funds
Notes to Financial Statements (Continued)
| | | | | | | | | | | | | | | | | | | | |
| | | Valuation Inputs | | |
| | | Level 1
Quoted Prices | | Level 2 Other Significant
Observable Inputs | | Level 3 Significant
Unobservable Inputs | | Total Market Value
at 9/30/14 |
BALANCED FUND | | | | | | | | | | | | | | | | | | | | |
INVESTMENTS IN SECURITIES: | | | | | | | | | | | | | | | | | | | | |
ASSETS (Market Value): | | | | | | | | | | | | | | | | | | | | |
Common Stocks(a) | | | $ | 52,025,298 | | | | | — | | | | | — | | | | $ | 52,025,298 | |
Corporate Bonds(a) | | | | — | | | | $ | 14,051,844 | | | | | — | | | | | 14,051,844 | |
U.S. Government Agency Obligations | | | | — | | | | | 7,840,889 | | | | | — | | | | | 7,840,889 | |
U.S. Government Obligations | | | | — | | | | | 5,662,974 | | | | | — | | | | | 5,662,974 | |
Short Term Investments | | | | 4,262,082 | | | | | — | | | | | — | | | | | 4,262,082 | |
TOTAL INVESTMENTS IN SECURITIES – ASSETS | | | $ | 56,287,380 | | | | $ | 27,555,707 | | | | | — | | | | $ | 83,843,087 | |
INTERMEDIATE BOND FUND | | | | | | | | | | | | | | | | | | | | |
INVESTMENTS IN SECURITIES: | | | | | | | | | | | | | | | | | | | | |
ASSETS (Market Value): | | | | | | | | | | | | | | | | | | | | |
Corporate Bonds(a) | | | | — | | | | $ | 9,199,974 | | | | | — | | | | $ | 9,199,974 | |
U.S. Government Agency Obligations | | | | — | | | | | 6,815,524 | | | | | — | | | | | 6,815,524 | |
U.S. Government Obligations | | | | — | | | | | 3,756,842 | | | | | — | | | | | 3,756,842 | |
Short Term Investments | | | $ | 1,740,090 | | | | | — | | | | | — | | | | | 1,740,090 | |
TOTAL INVESTMENTS IN SECURITIES – ASSETS | | | $ | 1,740,090 | | | | $ | 19,772,340 | | | | | — | | | | $ | 21,512,430 | |
| (a) | Please refer to the Schedule of Investments for the industry classifications of these portfolio holdings. |
The Funds did not have material transfers among Level 1, Level 2, and Level 3 during the year ended September 30, 2014. The Funds’ policy is to recognize transfers among Levels as of the beginning of the reporting period.
There were no Level 3 investments held at September 30, 2014 or September 30, 2013 for SmallCap Equity Fund, Mid-Cap Equity Fund, Income Fund, Equity Fund, Balanced Fund, and Intermediate Bond Fund.
The following table reconciles Level 3 investments for Mighty Mites Fund for which significant unobservable inputs were used to determine fair value:
| | | | | | | | | | | | | | | | | | | | | | | | | | | | | | | | | | | | | | | | | | | | | | | | | | |
| MIGHTY MITES FUND | | Balance
as of
9/30/13 | | Accrued
discounts/
(premiums) | | Realized
gain/
(loss) | | Change in
unrealized
appreciation/
depreciation† | | Purchases | | Sales | | Transfers
into
Level 3†† | | Transfers
out of Level 3†† | | Balance as of
9/30/14 | | Net change in
unrealized
appreciation/
depreciation
on Level 3
investments still held
at 9/30/14† |
INVESTMENTS IN SECURITIES: | | | | | | | | | | | | | | | | | | | | | |
ASSETS (Market Value): | | | | | | | | | | | | | | | | | | | | | |
Common Stocks: | | | | | | | | | | | | | | | | | | | | | | | | | | | | | | | | | | | | | | | | | | | | | | | | | | |
Health Care | | | $ | 640 | | | | $ | — | | | | $ | — | | | | $ | 27,997 | | | | $ | — | | | | $ | — | | | | $ | 3 | | | | $ | — | | | | $ | 28,640 | | | | $ | 27,997 | |
Real Estate | | | | 983 | | | | | — | | | | | — | | | | | 421 | | | | | 201,659 | | | | | — | | | | | — | | | | | — | | | | | 203,063 | | | | | 421 | |
Other Industries | | | | 24,256 | | | | | — | | | | | (274 | ) | | | | (2,817 | ) | | | | — | | | | | — | | | | | 31 | | | | | (20,700 | ) | | | | 496 | | | | | — | |
Total Common Stocks | | | | 25,879 | | | | | — | | | | | (274 | ) | | | | 25,601 | | | | | 201,659 | | | | | — | | | | | 34 | | | | | (20,700 | ) | | | | 232,199 | | | | | 28,418 | |
Rights | | | | 346,000 | | | | | — | | | | | — | | | | | 2,409 | | | | | 103,591 | | | | | — | | | | | — | | | | | — | | | | | 452,000 | | | | | 2,409 | |
Warrants | | | | 0 | | | | | — | | | | | — | | | | | 0 | | | | | — | | | | | — | | | | | — | | | | | — | | | | | 0 | | | | | 0 | |
Corporate Bonds | | | | 40,860 | | | | | — | | | | | — | | | | | — | | | | | 106,090 | | | | | — | | | | | — | | | | | (40,860 | ) | | | | 106,090 | | | | | — | |
TOTAL INVESTMENTS IN SECURITIES | | | $ | 412,739 | | | | $ | — | | | | $ | (274 | ) | | | $ | 28,010 | | | | $ | 411,340 | | | | $ | — | | | | $ | 34 | | | | $ | (61,560 | ) | | | $ | 790,289 | | | | $ | 30,827 | |
| † | Net change in unrealized appreciation/depreciation on investments is included in the related amounts in the Statement of Operations. |
| †† | The Fund’s policy is to recognize transfers into and transfers out of Level 3 as of the beginning of the reporting period. |
51
TETON Westwood Funds
Notes to Financial Statements (Continued)
The following tables summarize the valuation techniques used and unobservable inputs utilized to determine the value of certain of the Fund’s Level 3 investments as of September 30, 2014.
| | | | | | | | | | | | | | | | | | | | |
Description | | Balance at 9/30/14 | | Valuation Technique | | Unobservable Input | | Range |
MIGHTY MITES FUND | | | | | | | | | | | | | | | | | |
INVESTMENTS IN SECURITIES: | | | | | | | | | | | | | | | | | |
ASSETS (Market Value): | | | | | | | | | | | | | | | | | |
Common Stocks: | | | | | | | | | | | | | | | | | |
Health Care | | | | $28,640 | | | | | Last Price | | | Discount Range | | | | 0 | % |
Real Estate | | | | 203,063 | | | | | Restructure Plan/Cash Flow Analysis | | | Discount Range | | | | 0 | % |
| | | | | | | | | | | | | | | | | | |
Total Common Stocks | | | | 231,703 | | | | | | | | | | | | | |
| | | | | | | | | | | | | | | | | | |
Rights | | | | 452,000 | | | | | Last Price | | | Discount Range | | | | 0 | % |
Corporate Bonds | | | | 106,090 | | | | | Restructure Plan | | | Discount Range | | | | 0 | % |
All Other Investments (a) | | | | 496 | | | | | | | | | | | | | |
| | | | | | | | | | | | | | | | | | |
| | | | $790,289 | | | | | | | | | | | | | |
| | | | | | | | | | | | | | | | | | |
| (a) | Includes fair valued securities of investments developed using various valuation techniques and unobservable inputs. |
| | | | | | | | | | |
Unobservable Input | | Impact to Value if Input Increases | | Impact to Value if Input Decreases |
Discount Range | | Decrease | | Increase |
Additional Information to Evaluate Qualitative Information.
General. The Funds use recognized industry pricing services – approved by the Board and unaffiliated with the Adviser –to value most of their securities, and use broker quotes provided by market makers of securities not valued by these and other recognized pricing sources. Several different pricing feeds are received to value domestic equity securities, international equity securities, preferred equity securities, and fixed income securities. The data within these feeds is ultimately sourced from major stock exchanges and trading systems where these securities trade. The prices supplied by external sources are checked by obtaining quotations or actual transaction prices from market participants. If a price obtained from the pricing source is deemed unreliable, prices will be sought from another pricing service or from a broker/dealer that trades that security or similar securities.
Fair Valuation. Fair valued securities may be common and preferred equities, warrants, options, rights, and fixed income obligations. Where appropriate, Level 3 securities are those for which market quotations are not available, such as securities not traded for several days, or for which current bids are not available, or which are restricted as to transfer. Among the factors to be considered to fair value a security are recent prices of comparable securities that are publicly traded, reliable prices of securities not publicly traded, the use of valuation models, current analyst reports, valuing the income or cash flow of the issuer, or cost if the preceding factors do not apply. A significant change in the unobservable inputs could result in a lower or higher value in Level 3 securities. The circumstances of Level 3 securities are frequently monitored to determine if fair valuation measures continue to apply.
The Adviser reports quarterly to the Board the results of the application of fair valuation policies and procedures. These include back testing the prices realized in subsequent trades of these fair valued securities to fair values previously recognized.
Foreign Currency Translations. The books and records of the Funds are maintained in U.S. dollars. Foreign currencies, investments, and other assets and liabilities are translated into U.S. dollars at current exchange rates. Purchases and sales of investment securities, income, and expenses are translated at the exchange rate prevailing on the respective dates of such transactions. Unrealized gains and losses that result from changes in foreign exchange rates and/or changes in market prices of securities have been included in unrealized appreciation/depreciation on investments and foreign currency translations. Net realized foreign currency gains and losses resulting from changes in exchange rates include foreign currency gains and losses between trade date and settlement date on investment securities transactions, foreign currency transactions, and the difference between the amounts of interest and dividends recorded on the books of the Funds and the amounts actually received. The portion of foreign currency gains and losses related to fluctuation in exchange rates between the initial purchase trade date and subsequent sale trade date is included in realized gain/(loss) on investments.
Foreign Securities. The Funds may directly purchase securities of foreign issuers. Investing in securities of foreign issuers involves special risks not typically associated with investing in securities of U.S. issuers. The risks include possible revaluation of currencies, the inability to repatriate funds, less complete financial information about companies, and possible future adverse
52
TETON Westwood Funds
Notes to Financial Statements (Continued)
political and economic developments. Moreover, securities of many foreign issuers and their markets may be less liquid and their prices more volatile than securities of comparable U.S. issuers.
Foreign Taxes. The Funds may be subject to foreign taxes on income, gains on investments, or currency repatriation, a portion of which may be recoverable. The Funds will accrue such taxes and recoveries as applicable, based upon their current interpretation of tax rules and regulations that exist in the markets in which they invest.
Restricted Securities. Each Fund may invest up to 10% (except for the Mighty Mites Fund, SmallCap Equity Fund, and Income Fund which may invest up to 15%) of its net assets in securities for which the markets are restricted. Restricted securities include securities whose disposition is subject to substantial legal or contractual restrictions. The sale of restricted securities often requires more time and results in higher brokerage charges or dealer discounts and other selling expenses than does the sale of securities eligible for trading on national securities exchanges or in the over-the-counter markets. Restricted securities may sell at a price lower than similar securities that are not subject to restrictions on resale. Securities freely saleable among qualified institutional investors under special rules adopted by the SEC may be treated as liquid if they satisfy liquidity standards established by the Board. The continued liquidity of such securities is not as well assured as that of publicly traded securities, and accordingly the Board will monitor their liquidity.
Investments in other Investment Companies. All Funds may invest, from time to time, in shares of other investment companies (or entities that would be considered investment companies but are excluded from the definition pursuant to certain exceptions under the 1940 Act) (the “Acquired Funds”) in accordance with the 1940 Act and related rules. Shareholders in these Funds would bear the pro rata portion of the periodic expenses of the Acquired Funds in addition to the Fund’s expenses. For the year ended September 30, 2014, both the Mighty Mites Fund’s and Intermediate Bond Fund’s pro rata portion of the periodic expenses charged by the Acquired Funds was 1 basis point. For the year ended September 30, 2014, the Equity Fund’s and Balanced Fund’s pro rata portion of the periodic expenses charged by the Acquired Funds was less than one basis point. During the year ended September 30, 2014, the SmallCap Equity Fund, Mid-Cap Equity Fund, and Income Fund held no investments in other investment companies.
Securities Transactions and Investment Income. Securities transactions are accounted for on the trade date with realized gain or loss on investments determined by using the identified cost method. Interest income (including amortization of premium and accretion of discount) is recorded on the accrual basis. Premiums and discounts on debt securities are amortized using the effective yield to maturity method. Dividend income is recorded on the ex-dividend date except for certain dividends from foreign securities that are recorded as soon after the ex-dividend date as a Fund becomes aware of such dividends.
Determination of Net Asset Value and Calculation of Expenses. Certain administrative expenses are common to, and allocated among, various affiliated funds. Such allocations are made on the basis of each fund’s average net assets or other criteria directly affecting the expenses as determined by the Adviser pursuant to procedures established by the Board.
In calculating the NAV per share of each class, investment income, realized and unrealized gains and losses, redemption fees, and expenses other than class specific expenses are allocated daily to each class of shares based upon the proportion of net assets of each class at the beginning of each day. Distribution expenses are borne solely by the class incurring the expense.
Custodian Fee Credits and Interest Expense. When cash balances are maintained in a Fund’s custody account, the Fund receives credits which are used to offset custodian fees. The gross expenses paid under each custody arrangement are included in custodian fees in the Statements of Operations with the corresponding expense offset, if any, shown as “Custodian fee credits.” When cash balances are overdrawn, a Fund is charged an overdraft fee equal to 90% of the current Treasury Bill rate on outstanding balances. These amounts, if any, would be included in the Statements of Operations.
Distributions to Shareholders. Distributions from net investment income are declared and paid annually for the Mighty Mites Fund, SmallCap Equity Fund, Mid-Cap Equity Fund, and Equity Fund, and quarterly for the Income Fund and Balanced Fund. The Intermediate Bond Fund declares dividends daily and pays those dividends monthly. Distributions of net realized gain on investments are normally declared and paid at least annually by each Fund. Distributions to shareholders are recorded on the ex-dividend date. Distributions to shareholders are based on income and capital gains as determined in accordance with federal income tax regulations, which may differ from income and capital gains as determined under GAAP. These differences are primarily due to differing treatments of income and gains on various investment securities and foreign currency transactions held by the Funds, timing differences, and differing characterizations of distributions made by the Funds. Distributions from net investment income for federal income tax purposes include net realized gains on foreign currency transactions. These book/tax differences are either temporary or permanent in nature. To the extent these differences are permanent, adjustments are made to the appropriate capital accounts in the period when the differences arise. Permanent differences were primarily due to adjustments on the sale of securities no longer deemed passive foreign investment companies and reclassifications of
53
TETON Westwood Funds
Notes to Financial Statements (Continued)
distributions (Mighty Mites Fund), current year write-off of net operating loss (Mighty Mites Fund and SmallCap Equity Fund), disallowed offering expenses (Mid-Cap Equity Fund), and reclassifications of paydown loss (Intermediate Bond Fund). These reclassifications have no impact on the NAV of the Funds.
For the year ended September 30, 2014, the following reclassifications were made to increase/decrease such amounts with offsetting adjustments to paid-in capital:
| | | | | | | | | | | | | | | |
| | | Accumulated
Net
Investment
Income (Loss) | | Accumulated Net
Realized Gain
(Loss) on
Investments | | Paid-in
Capital |
Mighty Mites Fund | | | $ | 7,605,099 | | | | $ | (3,161,573 | ) | | | $ | (4,443,526 | ) |
SmallCap Equity Fund | | | | 153,863 | | | | | — | | | | | (153,863 | ) |
Mid-Cap Equity Fund | | | | 10,975 | | | | | (190 | ) | | | | (10,785 | ) |
Income Fund | | | | (4,778 | ) | | | | 238 | | | | | 4,540 | |
Equity Fund | | | | (648 | ) | | | | 648 | | | | | — | |
Balanced Fund | | | | (407 | ) | | | | 407 | | | | | — | |
Intermediate Bond Fund | | | | 163 | | | | | (163 | ) | | | | — | |
The tax character of distributions paid during the years ended September 30, 2014 and 2013 was as follows:
| | | | | | | | | | | | | | | | | | | | | | | | | | | | | | | | |
| | | Year Ended
September 30, | | | Year Ended
September 30, | | | Year Ended
September 30, | | | Year Ended
September 30, | |
| | | 2014 | | | 2013 | | | 2014 | | | 2013 | | | 2014 | | | 2013 | | | 2014 | | | 2013 | |
| | | Mighty Mites Fund | | | SmallCap Equity Fund | | | Mid-Cap Equity Fund | | | Income Fund | |
Ordinary Income (inclusive of short term capital gains) | | $ | 1,522,516 | | | $ | 4,504,664 | | | $ | — | | | $ | 18,250 | | | $ | 1,460 | | | $ | — | | | $ | 151,596 | | | $ | 52,492 | |
Net long term capital gains | | | 64,620,529 | | | | 10,376,781 | | | | — | | | | — | | | | 5 | | | | — | | | | — | | | | — | |
| | | | | | | | | | | | | | | | | | | | | | | | | | | | | | | | |
Total distributions paid | | $ | 66,143,045 | | | $ | 14,881,445 | | | $ | — | | | $ | 18,250 | | | $ | 1,465 | | | $ | — | | | $ | 151,596 | | | $ | 52,492 | |
| | | | | | | | | | | | | | | | | | | | | | | | | | | | | | | | |
| | | Equity Fund | | | Balanced Fund | | | Intermediate
Bond Fund | | | | | | | |
Ordinary Income (inclusive of short term capital gains) | | $ | 238,038 | | | $ | 662,905 | | | $ | 856,511 | | | $ | 1,008,348 | | | $ | 320,109 | | | $ | 316,469 | | | | | | | | | |
Net long term capital gains | | | — | | | | — | | | | 5,991,808 | | | | — | | | | — | | | | 24,268 | | | | | | | | | |
| | | | | | | | | | | | | | | | | | | | | | | | | | | | | | | | |
Total distributions paid | | $ | 238,038 | | | $ | 662,905 | | | $ | 6,848,319 | | | $ | 1,008,348 | | | $ | 320,109 | | | $ | 340,737 | | | | | | | | | |
| | | | | | | | | | | | | | | | | | | | | | | | | | | | | | | | |
Provision for Income Taxes. The Funds intend to continue to qualify as regulated investment companies under Subchapter M of the Internal Revenue Code of 1986, as amended (the “Code”). It is the policy of the Funds to comply with the requirements of the Code applicable to regulated investment companies and to distribute substantially all of the Funds’ net investment company taxable income and net capital gains. Therefore, no provision for federal income taxes is required.
At September 30, 2014, the components of accumulated earnings/losses on a tax basis were as follows:
| | | | | | | | | | | | | | | | | | | | | | | | | | | | | | | | | | | |
| | | Mighty
Mites
Fund | | SmallCap
Equity
Fund | | Mid-Cap
Equity
Fund | | Income
Fund | | Equity
Fund | | Balanced
Fund | | Intermediate
Bond Fund |
Undistributed ordinary income (inclusive of short term capital gains) | | | $ | — | | | | $ | — | | | | $ | 37,639 | | | | $ | — | | | | $ | 189,835 | | | | $ | 773,211 | | | | $ | 608 | |
Undistributed long term capital gain | | | | 23,955,794 | | | | | 1,896,343 | | | | | 15,777 | | | | | — | | | | | 6,321,139 | | | | | 5,205,708 | | | | | — | |
Accumulated capital loss carryforward | | | | — | | | | | — | | | | | — | | | | | (1,598,033 | ) | | | | — | | | | | — | | | | | (3,259 | ) |
Unrealized appreciation | | | | 271,896,772 | | | | | 7,921,483 | | | | | 252,192 | | | | | 2,099,106 | | | | | 12,658,084 | | | | | 12,212,098 | | | | | 650,576 | |
Qualified late year loss deferral* | | | | (10,591,777 | ) | | | | (113,892 | ) | | | | — | | | | | (9,419 | ) | | | | — | | | | | — | | | | | — | |
Other temporary differences** | | | | — | | | | | — | | | | | — | | | | | — | | | | | — | | | | | — | | | | | (508 | ) |
| | | | | | | | | | | | | | | | | | | | | | | | | | | | | | | | | | | |
Total accumulated earnings | | | $ | 285,260,789 | | | | $ | 9,703,934 | | | | $ | 305,608 | | | | $ | 491,654 | | | | $ | 19,169,058 | | | | $ | 18,191,017 | | | | $ | 647,417 | |
| | | | | | | | | | | | | | | | | | | | | | | | | | | | | | | | | | | |
| * | Qualified late year losses related to passive foreign investment companies, ordinary losses, and losses on sales of securities and foreign currency realized after October 31(certain ordinary losses incurred after December 31) and prior to the Funds’ year end may be elected as occurring on the first day of the following year. |
| ** | Other temporary differences are due to distributions payable. |
At September 30, 2014, the below Funds had net capital loss carryforwards for federal income tax purposes which are available to reduce future required distributions of net capital gains to shareholders. Under the Regulated Investment Company Modernization Act of 2010, the Funds are permitted to carry forward for an unlimited period capital losses incurred in years beginning after December 22, 2010. In addition, these losses must be utilized prior to the losses incurred in pre-enactment taxable years. As a result of the rule, pre-enactment capital loss carryforwards may have an increased likelihood of expiring unused. Additionally,
54
TETON Westwood Funds
Notes to Financial Statements (Continued)
post-enactment capital losses that are carried forward will retain their character as either short term or long term capital losses rather than being considered all short term as under previous law.
The following summarizes capital loss carryforwards and expiration dates for each Fund at September 30, 2014:
| | | | | | | | | | | | | | | | | | | | | | | | | | | | | | | | | | | |
Expiring in Fiscal Year | | Mighty
Mites
Fund | | SmallCap
Equity
Fund | | Mid-Cap
Equity
Fund | | Income
Fund | | Equity
Fund | | Balanced
Fund | | Intermediate
Bond Fund |
2017 | | | | $— | | | | | $— | | | | | $— | | | | | $ 31,941 | | | | | $— | | | | | $— | | | | | $— | |
2018 | | | | — | | | | | — | | | | | — | | | | | 1,503,326 | | | | | — | | | | | — | | | | | — | |
2019 | | | | — | | | | | — | | | | | — | | | | | 62,766 | | | | | — | | | | | — | | | | | — | |
Short term with no expiration | | | | — | | | | | — | | | | | — | | | | | — | | | | | — | | | | | — | | | | | 3,259 | |
| | | | | | | | | | | | | | | | | | | | | | | | | | | | | | | | | | | |
Total capital loss carryforwards | | | | $— | | | | | $— | | | | | $— | | | | | $1,598,033 | | | | | $— | | | | | $— | | | | | $3,259 | |
| | | | | | | | | | | | | | | | | | | | | | | | | | | | | | | | | | | |
During the year ended September 30, 2014, the Small Cap Equity Fund, Income Fund, Equity Fund, and Intermediate Bond Fund utilized capital loss carryforwards of $916,852, $662,722, $5,066,097, and $1,680, respectively.
At September 30, 2014, the temporary differences between book basis and tax basis unrealized appreciation/depreciation on investments was primarily due to deferral of losses from wash sales for tax purposes, mark-to-market adjustments on investments in passive foreign investment companies, and basis adjustments in partnerships.
The following summarizes the tax cost of investments and the related net unrealized appreciation at September 30, 2014:
| | | | | | | | | | | | | | | | | | | | | | | | | | | | |
| | | Mighty
Mites Fund | | | SmallCap
Equity
Fund | | | Mid-Cap
Equity
Fund | | | Income
Fund | | | Equity
Fund | | | Balanced
Fund | | | Intermediate
Bond Fund | |
Aggregate cost of investments | | | $998,451,151 | | | | $33,473,141 | | | $ | 4,761,958 | | | | $6,405,444 | | | | $55,591,871 | | | | $71,630,989 | | | $ | 20,861,854 | |
| | | | | | | | | | | | | | | | | | | | | | | | | | | | |
Gross unrealized appreciation | | | $314,375,868 | | | | $10,369,041 | | | $ | 374,170 | | | | $2,301,126 | | | | $13,113,559 | | | | $12,598,971 | | | $ | 671,220 | |
Gross unrealized depreciation | | | (42,478,329 | ) | | | (2,447,558 | ) | | | (121,978 | ) | | | (202,020 | ) | | | (455,475 | ) | | | (386,873 | ) | | | (20,644 | ) |
| | | | | | | | | | | | | | | | | | | | | | | | | | | | |
Net unrealized appreciation | | | $271,897,539 | | | | $ 7,921,483 | | | $ | 252,192 | | | | $2,099,106 | | | | $12,658,084 | | | | $12,212,098 | | | $ | 650,576 | |
| | | | | | | | | | | | | | | | | | | | | | | | | | | | |
The Funds are required to evaluate tax positions taken or expected to be taken in the course of preparing the Funds’ tax returns to determine whether the tax positions are “more-likely-than-not” of being sustained by the applicable tax authority. Income tax and related interest and penalties would be recognized by the Funds as tax expense in the Statement of Operations if the tax positions were deemed not to meet the more-likely-than-not threshold. As of September 30, 2014, the Adviser has reviewed all open tax years and concluded that there was no impact to the Funds’ net assets or results of operations. The Funds’ federal and state tax returns for the prior three fiscal years remain open, subject to examination by the Internal Revenue Service and state taxing authorities. On an ongoing basis, the Adviser will monitor the Funds’ tax positions to determine if adjustments to this conclusion are necessary.
3. Investment Advisory Agreements and Other Transactions. The Funds have entered into investment advisory agreements (the “Advisory Agreements”) with the Adviser which provide that the Funds will pay the Adviser a fee, computed daily and paid monthly, at the annual rate of 1.00% for the Mighty Mites Fund, SmallCap Equity Fund, Mid-Cap Equity Fund, Income Fund, and Equity Fund, 0.75% for the Balanced Fund, and 0.60% for the Intermediate Bond Fund, of the value of a Fund’s average daily net assets. In accordance with the Advisory Agreements, the Adviser provides a continuous investment program for the Funds’ portfolios, oversees the administration of all aspects of the Funds’ business and affairs, and pays the compensation of all Officers and Trustees of the Funds who are affiliated persons of the Adviser.
There was a reduction in the advisory fee paid to the Adviser relating to certain portfolio holdings, i.e., unsupervised assets, of the Funds with respect to which the Adviser transferred dispositive and voting control to the Funds’ Proxy Voting Committee. During the year ended September 30, 2014, the Mighty Mites Fund’s Proxy Voting Committee exercised control and discretion over all rights to vote or consent with respect to such securities, and the Adviser reduced its fee with respect to such securities by $76,140.
The Adviser has contractually agreed to waive investment advisory fees and/or to reimburse expenses to the SmallCap Equity Fund, Mid-Cap Equity Fund, Income Fund, and Intermediate Bond Fund in the event annual expenses of such Funds exceed certain prescribed limits. Such fee waiver/reimbursement arrangements continue at least until January 31, 2015. For the year ended September 30, 2014, the Adviser waived fees or reimbursed expenses in the amounts of $32,802, $92,134, $36,616, and $83,262 for the SmallCap Equity Fund, Mid-Cap Equity Fund, Income Fund, and Intermediate Bond Fund, respectively. In addition, the SmallCap Equity Fund, Mid-Cap Equity Fund, Income Fund, and Intermediate Bond Fund are obliged to repay the Adviser for a period of two fiscal years following the fiscal year in which the Adviser reimbursed the Funds only to the extent that
55
TETON Westwood Funds
Notes to Financial Statements (Continued)
the operating expenses of the Funds fall below the applicable expense limitation for Class AAA of 1.50%, 1.50%, 2.00%, and 1.00%, respectively, and for Class A of 1.75%, 1.75%, 2.25%, and 1.10%, respectively, and for Class C of 2.25%, 2.25%, 2.75%, and 1.75%, respectively, and for Class I of 1.25%, 1.25%, 1.75%, and 0.75%, respectively, of average daily net assets, the annual limitation under the Advisory Agreements. As of September 30, 2014, the cumulative unreimbursed amounts which may be recovered by the Adviser within the next two fiscal years are as follows:
| | | | | | | | | | | | | | | |
| | | For the year ended
September 30, 2013,
expiring
September 30, 2015 | | For the year ended
September 30, 2014,
expiring
September 30, 2016 | | Total |
SmallCap Equity Fund | | | $ | 50,965 | | | | $ | 32,802 | | | | $ | 83,767 | |
Mid-Cap Equity Fund | | | | 45,488 | | | | | 92,134 | | | | | 137,622 | |
Income Fund | | | | 44,065 | | | | | 36,616 | | | | | 80,681 | |
Intermediate Bond Fund | | | | 87,322 | | | | | 83,262 | | | | | 170,584 | |
The Adviser has a Subadvisory Agreement with Westwood Management Corp. (the “Subadviser”) for the Equity Fund, Balanced Fund, and Intermediate Bond Fund. The Adviser paid the Subadviser out of its advisory fees with respect to these three Funds a fee, computed daily and payable monthly, in an amount equal on an annualized basis to the greater of (i) $150,000 per year on an aggregate basis for all applicable Funds or (ii) 35% of the net revenues to the Adviser from the applicable Funds.
The Adviser has a sub-administration agreement for each of the Funds with Gabelli Funds, LLC, an affiliate. Gabelli Funds, LLC has entered into an agreement with BNY Mellon Investment Servicing (US) Inc. to provide certain administrative services to the Funds.
As per the approval of the Board, the Mid-Cap Equity Fund compensates officers of the Fund, who are employed by the Fund and are not employed by the Adviser (although the officers may receive incentive based variable compensation from affiliates of the Adviser). For the year ended September 30, 2014, the Fund paid or accrued $1,481 in payroll expenses in the Statement of Operations.
The Trust pays each Trustee who is not considered an affiliated person an annual retainer of $9,000 plus $2,000 for each Board meeting attended, and they are reimbursed by the Trust for any out of pocket expenses incurred in attending meetings. All Board committee members receive $1,000 per meeting attended, the Chairman of the Audit Committee receives a $3,000 annual fee, and the Lead Trustee receives an annual fee of $2,000. A Trustee may receive a single meeting fee, allocated among the participating funds, for attending certain meetings held on behalf of multiple funds. Trustees who are directors or employees of the Adviser or an affiliated company receive no compensation or expense reimbursement from the Trust.
4. Distribution Plan. The Trust’s Board has adopted a distribution plan (the “Plan”) for each class of shares, except Class I Shares, pursuant to Rule 12b-1 under the 1940 Act. Under the Class AAA, Class A, and Class C Share Plans, payments are authorized to G.distributors, LLC (the “Distributor”), an affiliate of the Adviser, at annual rates of 0.25%, 0.50% (for the Intermediate Bond Fund’s Class A Shares at an annual rate of 0.35%), and 1.00%, respectively, of the average daily net assets of those classes, the annual limitations under each Plan. Such payments are accrued daily and paid monthly.
5. Portfolio Securities. Purchases and sales (including maturities) of securities during the year ended September 30, 2014, other than short term securities, are as follows:
| | | | | | | | | | | | | | | | |
| | | Purchases
(excluding U.S.
Government
Securities) | | | Sales
(excluding U.S.
Government
Securities) | | | Purchases
of U.S.
Government
Securities | | | Sales of U.S.
Government
Securities | |
Mighty Mites Fund | | | $247,976,361 | | | | $133,676,577 | | | | — | | | | — | |
SmallCap Equity Fund | | | 5,455,828 | | | | 8,202,346 | | | | — | | | | — | |
Mid-Cap Equity Fund | | | 3,138,969 | | | | 688,335 | | | | | | | | | |
Income Fund | | | 2,591,957 | | | | 2,601,181 | | | | — | | | | — | |
Equity Fund | | | 35,881,172 | | | | 48,568,746 | | | | — | | | | — | |
Balanced Fund | | | 27,711,926 | | | | 36,713,753 | | | | $2,999,399 | | | | $1,000,000 | |
Intermediate Bond Fund | | | 1,763,363 | | | | 1,086,819 | | | | 1,370,908 | | | | 2,600,000 | |
6. Significant Shareholders. As of September 30, 2014, 61.2% of the Mid-Cap Equity Fund was beneficially owned by the Adviser and other affiliates, for which the affiliates and the Adviser have voting control, and 66.5% of the Intermediate Bond Fund and 8.6% of the SmallCap Equity Fund were beneficially owned by the Subadviser and other affiliates, for which the affiliates and the Subadviser have voting control.
56
TETON Westwood Funds
Notes to Financial Statements (Continued)
7. Transactions with Affiliates. During the year ended September 30, 2014, the Mighty Mites Fund and Income Fund paid brokerage commissions on security trades of $131,479 and $2,077, respectively, to G.research, Inc., an affiliate of the Adviser. Additionally, the Distributor retained a total of $183,025 from investors representing commissions (sales charges and underwriting fees) on sales and redemptions of Fund shares.
The cost of calculating each Fund’s NAV per share is a Fund expense pursuant to the Advisory Agreement. During the year ended September 30, 2014, the Mighty Mites Fund, Equity Fund, and Balanced Fund each paid or accrued $45,000 to the Adviser in connection with the cost of computing these Funds’ NAVs. This expense was not charged during the year ended September 30, 2014 for the SmallCap Equity Fund, Mid-Cap Equity Fund, Income Fund, and Intermediate Bond Fund.
8. Shares of Beneficial Interest. The Funds offer four classes of shares – Class AAA Shares, Class A Shares, Class C Shares, and Class I Shares. Class AAA Shares are offered without a sales charge only to investors who acquire them directly from the Distributor, through selected broker/dealers, or the transfer agent. Class I Shares are offered without a sales charge, directly through the Distributor, or brokers that have entered into selling agreements specifically with respect to Class I Shares. Class A Shares are subject to a maximum front-end sales charge of 4.00%. Class C Shares are subject to a 1.00% contingent deferred sales charge for one year after purchase. Class B Shares were fully redeemed and closed on January 27, 2014 for the Mighty Mites Fund, Balanced Fund, and Intermediate Bond Fund.
The Mighty Mites Fund, SmallCap Equity Fund, Mid-Cap Equity Fund, and Income Fund impose a redemption fee of 2.00% on all classes of shares that are redeemed or exchanged on or before the seventh day of a purchase. The redemption fee is deducted from the proceeds otherwise payable to the redeeming shareholders and is retained by the respective Fund as an increase in paid-in capital. The redemption fees retained by the Fund during the years ended September 30, 2014 and 2013, if any, can be found in the Statement of Changes in Net Assets under Redemption Fees.
Transactions in shares of beneficial interest were as follows:
| | | | | | | | | | | | | | | | | | | | | | | | | | | | | | | | |
| | | Year Ended
September 30, | | | Year Ended
September 30, | | | Year Ended
September 30, | | | Year Ended
September 30, | |
| | | 2014 | | | 2013 | | | 2014 | | | 2013 | | | 2014 | | | 2013 | | | 2014 | | | 2013 | |
| | | Mighty Mites Fund | | | SmallCap Equity
Fund | | | Mid-Cap Equity
Fund | | | Income Fund | |
Class AAA | | | | | | | | | | | | | | | | | | | | | | | | | | | | | | | | |
Shares sold | | | 5,284,081 | | | | 7,502,160 | | | | 60,394 | | | | 220,341 | | | | 94,193 | | | | 63,098 | | | | 100,837 | | | | 239,994 | |
Shares issued upon reinvestment of distributions | | | 1,177,716 | | | | 381,989 | | | | — | | | | — | | | | 19 | | | | — | | | | 9,695 | | | | 4,627 | |
Shares redeemed | | | (10,590,878 | ) | | | (3,371,539 | ) | | | (285,204 | ) | | | (288,756 | ) | | | (11,820 | ) | | | — | | | | (172,467 | ) | | | (228,479 | ) |
| | | | | | | | | | | | | | | | | | | | | | | | | | | | | | | | |
Net increase/(decrease) in Class AAA Shares | | | (4,129,081 | ) | | | 4,512,610 | | | | (224,810 | ) | | | (68,415 | ) | | | 82,392 | | | | 63,098 | | | | (61,935 | ) | | | 16,142 | |
| | | | | | | | | | | | | | | | | | | | | | | | | | | | | | | | |
Class A | | | | | | | | | | | | | | | | | | | | | | | | | | | | | | | | |
Shares sold | | | 2,923,626 | | | | 2,614,975 | | | | 35,414 | | | | 38,137 | | | | 44,298 | | | | 17,957 | | | | 5,624 | | | | 52,518 | |
Shares issued upon reinvestment of distributions | | | 322,557 | | | | 88,833 | | | | — | | | | — | | | | 5 | | | | — | | | | 1,297 | | | | 271 | |
Shares redeemed | | | (1,426,681 | ) | | | (1,148,097 | ) | | | (62,842 | ) | | | (156,259 | ) | | | (2,985 | ) | | | — | | | | (8,173 | ) | | | (10,411 | ) |
| | | | | | | | | | | | | | | | | | | | | | | | | | | | | | | | |
Net increase/(decrease) in Class A Shares | | | 1,819,502 | | | | 1,555,711 | | | | (27,428 | ) | | | (118,122 | ) | | | 41,318 | | | | 17,957 | | | | (1,252 | ) | | | 42,378 | |
| | | | | | | | | | | | | | | | | | | | | | | | | | | | | | | | |
Class B* | | | | | | | | | | | | | | | | | | | | | | | | | | | | | | | | |
Shares sold | | | 124 | | | | — | | | | — | | | | — | | | | — | | | | — | | | | — | | | | — | |
Shares issued upon reinvestment of distributions | | | 14 | | | | 5 | | | | — | | | | — | | | | — | | | | — | | | | — | | | | — | |
Shares redeemed | | | (287 | ) | | | (70 | ) | | | — | | | | — | | | | — | | | | — | | | | — | | | | — | |
| | | | | | | | | | | | | | | | | | | | | | | | | | | | | | | | |
Net decrease in Class B Shares | | | (149 | ) | | | (65 | ) | | | — | | | | — | | | | — | | | | — | | | | — | | | | — | |
| | | | | | | | | | | | | | | | | | | | | | | | | | | | | | | | |
Class C | | | | | | | | | | | | | | | | | | | | | | | | | | | | | | | | |
Shares sold | | | 3,628,556 | | | | 2,786,543 | | | | 13,065 | | | | 21,567 | | | | 13,765 | | | | 7,114 | | | | 15,461 | | | | 22,728 | |
Shares issued upon reinvestment of distributions | | | 392,169 | | | | 104,797 | | | | — | | | | — | | | | 2 | | | | — | | | | 1,374 | | | | 114 | |
Shares redeemed | | | (1,304,569 | ) | | | (1,056,009 | ) | | | (34,427 | ) | | | (148,837 | ) | | | — | | | | — | | | | (30,784 | ) | | | (60,184 | ) |
| | | | | | | | | | | | | | | | | | | | | | | | | | | | | | | | |
Net increase/(decrease) in Class C Shares | | | 2,716,156 | | | | 1,835,331 | | | | (21,362 | ) | | | (127,270 | ) | | | 13,767 | | | | 7,114 | | | | (13,949 | ) | | | (37,342 | ) |
| | | | | | | | | | | | | | | | | | | | | | | | | | | | | | | | |
Class I | | | | | | | | | | | | | | | | | | | | | | | | | | | | | | | | |
Shares sold | | | 14,155,431 | | | | 6,279,203 | | | | 277,271 | | | | 192,986 | | | | 92,389 | | | | 110,168 | | | | 10,683 | | | | 10,300 | |
Shares issued upon reinvestment of distributions | | | 432,965 | | | | 130,100 | | | | — | | | | 381 | | | | 109 | | | | — | | | | 464 | | | | 171 | |
Shares redeemed | | | (3,825,732 | ) | | | (2,078,323 | ) | | | (132,160 | ) | | | (334,566 | ) | | | — | | | | — | | | | (4,372 | ) | | | (6,672 | ) |
| | | | | | | | | | | | | | | | | | | | | | | | | | | | | | | | |
Net increase/(decrease) in Class I Shares | | | 10,762,664 | | | | 4,330,980 | | | | 145,111 | | | | (141,199 | ) | | | 92,498 | | | | 110,168 | | | | 6,775 | | | | 3,799 | |
| | | | | | | | | | | | | | | | | | | | | | | | | | | | | | | | |
57
TETON Westwood Funds
Notes to Financial Statements (Continued)
Transactions in shares of beneficial interest (continued):
| | | | | | | | | | | | | | | | | | | | | | | | |
| | | Year Ended
September 30, | | | Year Ended
September 30, | | | Year Ended
September 30, | |
| | | 2014 | | | 2013 | | | 2014 | | | 2013 | | | 2014 | | | 2013 | |
| | | Equity Fund | | | Balanced Fund | | | Intermediate
Bond Fund | |
Class AAA | | | | | | | | | | | | | | | | | | | | | | | | |
Shares sold | | | 128,429 | | | | 292,231 | | | | 452,969 | | | | 492,830 | | | | 81,083 | | | | 102,467 | |
Shares issued upon reinvestment of distributions | | | 16,882 | | | | 56,590 | | | | 450,647 | | | | 73,366 | | | | 6,572 | | | | 10,817 | |
Shares redeemed | | | (1,143,844 | ) | | | (1,970,199 | ) | | | (1,093,801 | ) | | | (1,897,920 | ) | | | (389,550 | ) | | | (296,417 | ) |
| | | | | | | | | | | | | | | | | | | | | | | | |
Net decrease in Class AAA Shares | | | (998,533 | ) | | | (1,621,378 | ) | | | (190,185 | ) | | | (1,331,724 | ) | | | (301,895 | ) | | | (183,133 | ) |
| | | | | | | | | | | | | | | | | | | | | | | | |
Class A | | | | | | | | | | | | | | | | | | | | | | | | |
Shares sold | | | 21,284 | | | | 20,145 | | | | 156,771 | | | | 90,076 | | | | 20,155 | | | | 108,199 | |
Shares issued upon reinvestment of distributions | | | 188 | | | | 2,114 | | | | 32,083 | | | | 3,575 | | | | 746 | | | | 1,269 | |
Shares redeemed | | | (51,900 | ) | | | (73,053 | ) | | | (150,088 | ) | | | (79,773 | ) | | | (32,150 | ) | | | (131,358 | ) |
| | | | | | | | | | | | | | | | | | | | | | | | |
Net increase/(decrease) in Class A Shares | | | (30,428 | ) | | | (50,794 | ) | | | 38,766 | | | | 13,878 | | | | (11,249 | ) | | | (21,890 | ) |
| | | | | | | | | | | | | | | | | | | | | | | | |
Class B* | | | | | | | | | | | | | | | | | | | | | | | | |
Shares issued upon reinvestment of distributions | | | — | | | | — | | | | 6 | | | | 1 | | | | 0 | (a) | | | 2 | |
Shares redeemed | | | — | | | | — | | | | (85 | ) | | | (522 | ) | | | (441 | ) | | | (1 | ) |
| | | | | | | | | | | | | | | | | | | | | | | | |
Net increase/(decrease) in Class B Shares | | | — | | | | — | | | | (79 | ) | | | (521 | ) | | | (441 | ) | | | 1 | |
| | | | | | | | | | | | | | | | | | | | | | | | |
Class C | | | | | | | | | | | | | | | | | | | | | | | | |
Shares sold | | | 2,647 | | | | 3,029 | | | | 35,389 | | | | 169,289 | | | | 21,908 | | | | 25,183 | |
Shares issued upon reinvestment of distributions | | | — | | | | 152 | | | | 27,183 | | | | 1,562 | | | | 298 | | | | 624 | |
Shares redeemed | | | (11,556 | ) | | | (24,437 | ) | | | (60,672 | ) | | | (188,419 | ) | | | (48,941 | ) | | | (107,987 | ) |
| | | | | | | | | | | | | | | | | | | | | | | | |
Net increase/(decrease) in Class C Shares | | | (8,909 | ) | | | (21,256 | ) | | | 1,900 | | | | (17,568 | ) | | | (26,735 | ) | | | (82,180 | ) |
| | | | | | | | | | | | | | | | | | | | | | | | |
Class I | | | | | | | | | | | | | | | | | | | | | | | | |
Shares sold | | | 147,696 | | | | 25,901 | | | | 267,169 | | | | 16,870 | | | | 526,597 | | | | 431,571 | |
Shares issued upon reinvestment of distributions | | | 495 | | | | 1,192 | | | | 19,192 | | | | 1,063 | | | | 12,901 | | | | 193 | |
Shares redeemed | | | (73,527 | ) | | | (282,527 | ) | | | (180,484 | ) | | | (10,837 | ) | | | (291,093 | ) | | | (185,355 | ) |
| | | | | | | | | | | | | | | | | | | | | | | | |
Net increase/(decrease) in Class I Shares | | | 74,664 | | | | (255,434 | ) | | | 105,877 | | | | 7,096 | | | | 248,405 | | | | 246,409 | |
| | | | | | | | | | | | | | | | | | | | | | | | |
| (a) | Amount represents less than 0.5 Shares. |
| * | Mighty Mites Fund, Balanced Fund, and Intermediate Bond Fund Class B Shares were fully redeemed and closed on January 27, 2014. |
9. Transactions in Securities of Affiliated Issuers. The 1940 Act defines affiliated issuers as those in which a Fund’s holdings of an issuer represent 5% or more of the outstanding voting securities of the issuer. A summary of the Mighty Mites Fund’s transactions in the securities of these issuers during the year ended September 30, 2014 is set forth below:
| | | | | | | | | | | | | | | | | | | | | | | | | | | | | | | | | | | | | | | | | | | | | |
| | | Beginning
Shares | | Shares
Purchased | | Shares
Sold | | Ending
Shares | | Dividend
Income | | Realized
Gain | | Market
Value at
September 30, 2014 | | | | Percent
Owned of
Shares
Outstanding |
Beasley Broadcast Group Inc., Cl. A | | | | 574,282 | | | | | 8,511 | | | | | — | | | | | 582,793 | | | | $ | 104,459 | | | | | — | | | | $ | 3,123,770 | | | | | | | 9.03 | % |
Bel Fuse, Cl. A | | | | 112,300 | | | | | 20,047 | | | | | — | | | | | 132,347 | | | | | 30,524 | | | | | — | | | | | 3,119,419 | | | | | | | 6.08 | % |
Burnham Holdings Inc., Cl. A | | | | 168,000 | | | | | 21,342 | | | | | — | | | | | 189,342 | | | | | 144,312 | | | | | — | | | | | 3,483,893 | | | | | | | 6.25 | % |
Edgewater Technology Inc. | | | | 672,189 | | | | | 20,083 | | | | | — | | | | | 692,272 | | | | | — | | | | | — | | | | | 4,755,909 | | | | | | | 6.09 | % |
General Chemical Group Inc. | | | | 267,226 | | | | | — | | | | | — | | | | | 267,226 | | | | | — | | | | | — | | | | | 5,345 | | | | | | | 8.59 | % |
MOCON Inc.* | | | | 140,360 | | | | | 189,273 | | | | | — | | | | | 329,633 | | | | | 132,131 | | | | | — | | | | | 4,921,421 | | | | | | | 5.82 | % |
Sevcon Inc. | | | | 391,235 | | | | | 76,329 | | | | | (2,000 | ) | | | | 465,564 | | | | | — | | | | $ | 5,022 | | | | | 3,794,347 | | | | | | | 13.02 | % |
SL Industries Inc. | | | | 263,788 | | | | | 12,094 | | | | | (5,282 | ) | | | | 270,600 | | | | | — | | | | | 137,624 | | | | | 13,210,692 | | | | | | | 6.53 | % |
Strattec Security Corp. | | | | 188,796 | | | | | 12,500 | | | | | (4,296 | ) | | | | 197,000 | | | | | 90,097 | | | | | 302,265 | | | | | 16,025,950 | | | | | | | 5.51 | % |
The L.S. Starrett Co., Cl. A | | | | 315,443 | | | | | 3,572 | | | | | (315 | ) | | | | 318,700 | | | | | 127,471 | | | | | 182 | | | | | 4,410,808 | | | | | | | 5.16 | % |
| | | | | | | | | | | | | | | | | | | | | | | | | | | | | | |
Total | | | | | | | | | | | | | | | | | | | | | | | $ | 628,994 | | | | $ | 445,093 | | | | $ | 56,851,554 | | | | | | | | |
| | | | | | | | | | | | | | | | | | | | | | | | | | | | | | |
| * | Security was not affiliated at September 30, 2013. |
10. Indemnifications. The Funds enter into contracts that contain a variety of indemnifications. The Funds’ maximum exposure under these arrangements is unknown. However, the Funds have not had prior claims or losses pursuant to these contracts. Management has reviewed the Funds’ existing contracts and expects the risk of loss to be remote.
11. Subsequent Events. Management has evaluated the impact on the Fund of all subsequent events occurring through the date the financial statements were issued and has determined that there were no subsequent events requiring recognition or disclosure in the financial statements.
58
Report of Independent Registered Public Accounting Firm
To the Board of Trustees and Shareholders of
The TETON Westwood Funds:
In our opinion, the accompanying statements of assets and liabilities, including the schedules of investments, and the related statements of operations and of changes in net assets and the financial highlights present fairly, in all material respects, the financial position of TETON Westwood Mighty MitesSM Fund, TETON Westwood SmallCap Equity Fund, TETON Westwood Income Fund, TETON Westwood Equity Fund, TETON Westwood Balanced Fund, TETON Westwood Intermediate Bond Fund and TETON Westwood Mid-Cap Equity Fund (hereafter referred to as the “Funds”) at September 30, 2014, the results of each of their operations, the changes in each of their net assets and the financial highlights for each of the periods presented, in conformity with accounting principles generally accepted in the United States of America. These financial statements and financial highlights (hereafter referred to as “financial statements”) are the responsibility of the Funds’ management; our responsibility is to express an opinion on these financial statements based on our audits. We conducted our audits of these financial statements in accordance with the standards of the Public Company Accounting Oversight Board (United States). Those standards require that we plan and perform the audit to obtain reasonable assurance about whether the financial statements are free of material misstatement. An audit includes examining, on a test basis, evidence supporting the amounts and disclosures in the financial statements, assessing the accounting principles used and significant estimates made by management, and evaluating the overall financial statement presentation. We believe that our audits, which included confirmation of securities at September 30, 2014 by correspondence with the custodian and brokers, provide a reasonable basis for our opinion.
PricewaterhouseCoopers LLP
New York, NY
November 28, 2014
59
2014 Tax Notice to Shareholders (Unaudited)
U.S. Government Income: – The percentage of the ordinary income dividend paid by the Balanced Fund and Intermediate Bond Fund (collectively, the “Funds”) during the year ended September 30, 2014 which was derived from U.S. Treasury securities was 8.41% and 0.57%, respectively. Such income is exempt from state and local tax in all states. However, many states, including New York and California, allow a tax exemption for a portion of the income earned only if a mutual fund has invested at least 50% of its assets at the end of each quarter of the Fund’s fiscal year in U.S. Government securities. The Funds did not meet this strict requirement during the year ended September 30, 2014. Due to the diversity in state and local tax law, it is recommended that you consult your personal tax adviser for the applicability of the information provided as to your specific situation.
Mighty Mites Fund – During the year ended September 30, 2014, the Fund paid to shareholders ordinary income dividends (comprised of short term capital gains) totaling $0.032, $0.032, $0.032, and $0.032 per share for Class AAA, Class A, Class C, and Class I Shares, respectively, and long term capital gains totaling $64,620,529. The distributions of long term capital gains have been designated as a capital gain dividend by the Fund’s Board of Trustees. For the year ended September 30, 2014, 100% of the ordinary income dividend qualifies for the dividends received deduction available to corporations. The Fund designates 100% of the ordinary income distribution as qualified dividend income, pursuant to the Jobs and Growth Tax Relief Reconciliation Act of 2003. The Fund designates 100% of the ordinary income distribution as qualified short term gain.
SmallCap Equity Fund – During the year ended September 30, 2014, the Fund paid no dividends to shareholders.
Mid-Cap Equity Fund – During the year ended September 30, 2014, the Fund paid to shareholders ordinary income dividends (comprised of net investment income and short term capital gains) totaling $0.003, $0.003, $0.003, and $0.010 per share for Class AAA, Class A, Class C, and Class I Shares, respectively, and long term capital gains totaling $5. The distributions of long term capital gains have been designated as a capital gain dividend by the Fund’s Board of Trustees. For the year ended September 30, 2014, 78.51% of the ordinary income dividend qualifies for the dividends received deduction available to corporations. The Fund designates 82.17% of the ordinary income distributions as qualified dividend income, pursuant to the Jobs and Growth Tax Relief Reconciliation Act of 2003. The Fund designates 11.83% of the ordinary income distributions as qualified interest income, pursuant to the American Jobs Creation Act of 2004. The Fund designates 45.53% of the ordinary income distribution as qualified short term gain.
Income Fund – During the year ended September 30, 2014, the Fund paid to shareholders ordinary income dividends (comprised of net investment income) totaling $0.204, $0.188, $0.171, and $0.226 per share for Class AAA, Class A, Class C, and Class I Shares, respectively. For the year ended September 30, 2014, 100% of the ordinary income dividend qualifies for the dividends received deduction available to corporations. The Fund designates 100% of the ordinary income distributions as qualified dividend income, pursuant to the Jobs and Growth Tax Relief Reconciliation Act of 2003. The Fund designates 0.06% of the ordinary income distributions as qualified interest income, pursuant to the American Jobs Creation Act of 2004.
Equity Fund – During the year ended September 30, 2014, the Fund paid to shareholders ordinary income dividends (comprised of net investment income) totaling $0.042, $0.009 and $0.073 per share for Class AAA, Class A, and Class I Shares, respectively. For the year ended September 30, 2014, 100% of the ordinary income dividend qualifies for the dividends received deduction available to corporations. The Fund designates 100% of the ordinary income distribution as qualified dividend income, pursuant to the Jobs and Growth Tax Relief Reconciliation Act of 2003. The Fund designates 0.01% of the ordinary income distribution as qualified interest income, pursuant to the American Jobs Creation Act of 2004.
Balanced Fund – During the year ended September 30, 2014, the Fund paid to shareholders ordinary income dividends (comprised of net investment income) totaling $0.139, $0.105, $0.040, and $0.171 per share for Class AAA, Class A, Class C, and Class I Shares, respectively, and long term capital gains totaling $5,991,808. The distributions of long term capital gains have been designated as a capital gain dividend by the Fund’s Board of Trustees. For the year ended September 30, 2014, 56.83% of the ordinary income dividend qualifies for the dividends received deduction available to corporations. The Fund designates 61.68% of the ordinary income distributions as qualified dividend income, pursuant to the Jobs and Growth Tax Relief Reconciliation Act of 2003. The Fund designates 64.13% of the ordinary income distributions as qualified interest income, pursuant to the American Jobs Creation Act of 2004. The Fund designates 100% of the ordinary income distribution as qualified short term gain.
Intermediate Bond Fund – During the year ended September 30, 2014, the Fund paid to shareholders ordinary income dividends (comprised of net investment income) totaling $0.154, $0.142, $0.063, and $0.183 per share for Class AAA, Class A, Class C, and Class I Shares, respectively. The Fund designates 89.74% of the ordinary income distributions as qualified interest income, pursuant to the American Jobs Creation Act of 2004.
All designations are based on financial information available as of the date of this annual report and, accordingly, are subject to change. For each item, it is the intention of the Fund to designate the maximum amount permitted under the Internal Revenue Code and the regulations thereunder.
60
TETON Westwood Funds
Board Consideration and Re-Approval of Investment Advisory and Subadvisory Agreements (Unaudited)
In determining whether to approve the continuance of each of the Agreements, the Board considered the following information:
1) The nature, extent, and quality of services provided by the Adviser and the Subadviser.
The Board reviewed in detail the nature and extent of the services provided by the Adviser and the Subadviser under the Agreements and the quality of those services over the past year. The Board noted that these services included managing the investment program of the Funds, including the purchase and sale of portfolio securities, as well as the provision of general corporate services. The Board considered that the Adviser also provided, at its expense, office facilities for use by the Funds and supervisory personnel responsible for supervising the performance of administrative, accounting, and related services including, for each Fund, monitoring to assure compliance with stated investment policies and restrictions under the 1940 Act and related securities regulations. The Board noted that, in addition to managing the investment program for the Funds, the Adviser provided certain non-advisory and compliance services, including services under the Funds’ Rule 38a-1 compliance program.
The Board also considered that the Adviser paid for all compensation of officers and Board Members of the Funds that were affiliated with the Adviser and that the Adviser further provided services to shareholders of the Funds who had invested through various programs offered by third party financial intermediaries. The Board evaluated these factors based on its direct experience with the Adviser and Subadviser and in consultation with Fund Counsel. The Board noted that the Adviser had engaged, at its expense, BNY Mellon Investment Servicing (US) Inc. (BNY), to assist it in performing certain of its administrative functions. The Board concluded that the nature and extent of the services provided was reasonable and appropriate in relation to the advisory fee, that the level of services provided by the Adviser, either directly or through BNY, and by the Subadviser, had not diminished over the past year and that the quality of service continued to be high.
The Board reviewed the personnel responsible for providing services to the Funds and concluded, based on their experience and interaction with the Adviser and Subadviser, that (i) the Adviser and Subadviser were able to retain quality personnel, (ii) the Adviser, Subadviser, and their agents exhibited a high level of diligence and attention to detail in carrying out their advisory and administrative responsibilities under the Agreements, (iii) the Adviser and Subadviser were responsive to requests of the Board, (iv) the scope and depth of the Adviser’s and Subadviser’s resources were adequate, and (v) the Adviser and Subadviser had kept the Board apprised of developments relating to each Fund and the industry in general. The Board also focused on the Adviser’s reputation and longstanding relationship with the Funds. The Board also believed that the Adviser had devoted substantial resources and made substantial commitments to address new regulatory compliance requirements applicable to the Funds.
2) The performance of the Funds, the Adviser, and the Subadviser.
The Board reviewed the investment performance of each Fund, on an absolute basis, as compared with its Lipper peer group of other SEC registered funds, and against each Fund’s broad based securities market benchmarks as reflected in each Fund’s prospectuses and annual report. The Board also considered rankings and ratings of the Funds issued by Lipper over the short, intermediate, and long term. The Board considered each Fund’s one, three, five, and, ten year average annual total return for the periods ended June 30, 2014, but placed greatest emphasis on a Fund’s longer term performance. The peer groups considered by the Board were developed by Lipper and were comprised of funds within the same Lipper peer group category (the “Peer Group”), regardless of asset size or primary channel of distribution. Each Fund’s performance against the performance Peer Group (the “Performance Peer Group”) was considered by the Board as providing an objective comparative benchmark against which each Fund’s performance could be assessed. In general, the Board considered these comparisons helpful in their assessment as to whether the Adviser was obtaining for the Funds’ shareholders the total return performance that was available in the marketplace, given each Fund’s investment objectives, strategies, limitations, and restrictions. In reviewing the Funds’ performance, the Board noted that the Equity Fund’s performance was below the median for the one year, three year, and five year periods and above the median for the ten year period; the Balanced Fund’s performance was below the median for the one year and five year periods and above the median for the three year and ten year periods; the SmallCap Equity Fund’s performance was above the median for the one year, five year, and ten year periods and below the median for the three year period; the Mighty Mites Fund’s performance was below the median for the one year and five year periods and above the median for the three year and ten year periods; the Income Fund’s performance was below the median for the one year, three year, and five year periods; the Mid-Cap Equity Fund’s performance was below the median for the one year period; and the Intermediate Bond Fund’s performance was below the median for the one year, three year, five year and ten year periods. The Board also noted that the Income Fund had changed its investment objective in 2005 and therefore only had nine years of Peer Group performance data for comparison purposes. The Board Members concluded that the Funds’ performance was reasonable in comparison with that of the Performance Peer Groups.
In connection with its assessment of the performance of the Adviser and the Subadviser, the Board considered the Adviser’s and Subadviser’s financial condition and whether they had the resources necessary to continue to carry out their responsibilities
61
under the Agreements. The Board concluded that the Adviser and Subadviser had the financial resources necessary to continue to perform their obligations under the Agreements and to continue to provide the high quality services that they have provided to the Funds to date.
3) The cost of the advisory services and the profits to the Adviser and Subadviser and their affiliates from the relationship with the Funds.
In connection with the Board’s consideration of the cost of the advisory and sub-advisory services and the profits to the Adviser, Subadviser and their affiliates from their relationships with the Fund, the Board considered a number of factors. First, the Board compared the level of the advisory fee for each Fund against comparative Lipper expense peer groups (“Expense Peer Group”). The Board also considered comparative non-management fee expenses and comparative total fund expenses of the Funds and each Expense Peer Group. The Board considered this information as useful in assessing whether the Adviser and Subadviser were providing services at a cost that was competitive with other similar funds. In assessing this information, the Board considered both the comparative contract rates as well as the level of the advisory fees after waivers and/or reimbursements. The Board noted that the SmallCap Equity Fund, the Income Fund, and the Intermediate Bond Fund operated pursuant to a Fee Waiver and Expense Deferral Agreement with the Adviser wherein the Adviser had agreed to waive a portion of its fee or reimburse a Fund for a portion of its expenses necessary to limit the Fund’s total operating expenses to the level set forth in the respective Fund’s prospectus. The Board noted that the Mid-Cap Equity Fund operated pursuant to an Expense Limitation Agreement with the Adviser wherein the Adviser had agreed to limit a portion of its fee or reimburse that Fund for a portion of its expenses necessary to limit the Fund’s total operating expenses to the level set forth in the Fund’s prospectus. The Board noted that the advisory fees and expense ratios for the Equity Fund, the SmallCap Equity Fund, and the Mighty Mites Fund were higher than average when compared with those of their Expense Peer Groups. The Board noted that with respect to the Balanced Fund, the advisory fee was lower than average and expense ratios were higher than average when compared with its Expense Peer Group. Finally, the Board noted that although the Intermediate Bond Fund’s, Mid-Cap Equity Fund’s, and Income Fund’s net advisory fees were lower than average, after considering their fee waivers, their expense ratios were higher than average when compared with their Expense Peer Groups. The Board also reviewed the fees charged by the Adviser and Subadviser to provide similar advisory services to other registered investment companies with similar investment objectives and to separate accounts, noting that in some cases the fees charged by the Adviser or Subadviser were higher and, in other cases lower, than the fees charged to the Funds. In evaluating this information, the Board considered the difference in services provided by the Adviser and Subadviser to these other accounts. In particular, the Board considered the differences in risks involved in managing separate accounts and the Funds from a compliance and regulatory perspective.
The Board also considered an analysis prepared by the Adviser of the estimated profitability to the Adviser of its relationship with the Funds and reviewed with the Adviser its cost allocation methodology in connection with its profitability. In this regard, the Board reviewed Proforma Income Statements of the Adviser for the year ended December 31, 2013. The Board considered one analysis for the Adviser as a whole, and a second analysis for the Adviser with respect to each of the Funds. With respect to the Fund analysis, the Board received an analysis based on each Fund’s average net assets during the period as well as a proforma analysis of profitability at higher and lower asset levels. The Board concluded that the profitability of the Funds to the Adviser under either analysis was not excessive.
4) The extent to which economies of scale will be realized as the Funds grow and whether fee levels reflect those economies of scale.
With respect to the Board’s consideration of economies of scale, the Board discussed whether economies of scale would be realized by the Funds at higher asset levels. The Board also reviewed data from the Expense Peer Groups to assess whether the Expense Peer Group funds had advisory fee breakpoints and, if so, at what asset levels. The Board also assessed whether certain of the Adviser’s costs would increase if asset levels rise. The Board concluded that under foreseeable conditions, they were unable to assess at this time whether economies of scale would be realized if the Funds were to experience significant asset growth. In the event there were to be significant asset growth in the Funds, the Board determined to reassess whether the advisory fee appropriately took into account any economies of scale that had been realized as a result of that growth.
5) Other Factors.
In addition to the above factors, the Board also discussed other benefits received by the Adviser and Subadviser from their management of the Funds. The Board considered that the Adviser and Subadviser do use soft dollars in connection with their management of the Funds.
Based on a consideration of all these factors in their totality, the Board Members, including all of the Independent Board Members, determined that each Fund’s advisory fee and, with respect to the Equity Fund, the Balanced Fund, and the Intermediate Bond Fund, the sub-advisory fee, was fair and reasonable with respect to the quality of services provided and in light of the other factors described above that the Board deemed relevant. Accordingly, the Board Members determined to approve the continuation of each Fund’s Advisory Agreement and, with respect to the Equity Fund, the Balanced Fund, and the Intermediate Bond Fund, the Subadvisory agreements. The Board based its decision on evaluations of all these factors as a whole and did not consider any one factor as all important or controlling.
62
TETON Westwood Funds
Additional Fund Information (Unaudited)
The business and affairs of the Trust are managed under the direction of its Board of Trustees. Information pertaining to the Trustees and officers of the Trust is set forth below. The Trust’s Statement of Additional Information includes additional information about the TETON Westwood Funds’ Trustees and is available, without charge, upon request, by calling 800-WESTWOOD (800-937-8966) or by writing to the TETON Westwood Funds at One Corporate Center, Rye, NY 10580-1422.
| | | | | | | | |
Name, Position(s), Address1 and Age | | Term of Office and Length of Time Served2 | | Number of Funds in
Fund
Complex
Overseen
by Trustee | | Principal Occupation(s) During Past Five Years | | Other Directorships Held by Trustee3 |
| INDEPENDENT TRUSTEES4 : | | | | | | | | |
| | | | |
Anthony J. Colavita Trustee Age: 78 | | Since 1994 | | 37 | | President of the law firm of Anthony J. Colavita, P.C. | | — |
| | | | |
James P. Conn Trustee Age: 76 | | Since 1994 | | 21 | | Former Managing Director and Chief Investment Officer of Financial Security Assurance Holdings Ltd. (1992-1998) | | Director of First Republic Bank (banking) through January 2008 |
| | | | |
Werner J. Roeder, MD Trustee Age: 74 | | Since 1994 | | 23 | | Medical Director of Lawrence Hospital and practicing private physician | | — |
| | | | |
Salvatore J. Zizza Trustee Age: 68 | | Since 2004 | | 31 | | Chairman of Zizza & Associates Corp. (financial consulting); Chairman of Metropolitan Paper Recycling, Inc. (recycling) (since 2005); Chairman of Harbor Diversified, Inc. (biotechnology) (since 1999); Chairman of BAM (semiconductor and aerospace manufacturing) (since 2000); Chairman of Bergen Cove Realty Inc. (since 2002) | | Director and Vice Chairman of Trans-Lux Corporation (business services); Director and Chairman of Harbor Diversified Inc. (pharmaceuticals); Chairman of Bion Environmental Technologies (technology); Director, Chairman, and CEO of General Employment Enterprises (staffing services) (2009-2012) |
| OFFICERS: | | | | | | | | |
Bruce N. Alpert President Age: 62 | | Since 1994 | | — | | Executive Vice President and Chief Operating Officer of Gabelli Funds, LLC since 1988; and an Officer of registered investment companies in the Gabelli/GAMCO Funds complex; Director of Teton Advisors, Inc. 1998-2012; Chairman of Teton Advisors, Inc. 2008-2010; President of Teton Advisors, Inc., 1998-2008; Senior Vice President of GAMCO Investors, Inc. since 2008 | | — |
| | | | |
Andrea R. Mango Secretary Age: 42 | | Since November 2013 | | — | | Counsel of Gabelli Funds, LLC; Corporate Vice President within the Corporate Compliance Department of New York Life Insurance Company 2011-2013; Vice President and Counsel of Deutsche Bank 2006-2011 | | — |
| | | | |
Agnes Mullady Treasurer Age: 56 | | Since 2006 | | — | | President and Chief Operating Officer of the Open-End Fund Division of Gabelli Funds, LLC since 2010; Senior Vice President of GAMCO Investors, Inc. since 2009; Vice President of Gabelli Funds, LLC since 2007; Officer of registered investment companies in the Gabelli/GAMCO Funds Complex | | — |
| | | | |
Richard J. Walz Chief Compliance Officer Age: 55 | | Since November 2013 | | — | | Chief Compliance Officer of the Gabelli/GAMCO Funds Complex; Chief Compliance Officer of AEGON USA Investment Management LLC 2011-2013; Chief Compliance Officer of Cutwater Asset Management 2004-2011 | | — |
| 1 | Address: One Corporate Center, Rye, NY 10580-1422, unless otherwise noted. |
| 2 | Each Trustee will hold office for an indefinite term until the earliest of (i) the next meeting of shareholders, if any, called for the purpose of considering the election or re-election of such Trustee and until the election and qualification of his or her successor, if any, elected at such meeting, or (ii) the date a Trustee resigns or retires, or a Trustee is removed by the Board of Trustees or shareholders, in accordance with the Trust’s Amended By-Laws and Amended and Restated Declaration of Trust. Each officer will hold office for an indefinite term until the date he or she resigns or retires or until his or her successor is elected and qualified. |
| 3 | This column includes only directorships of companies required to report to the SEC under the Securities Exchange Act of 1934, i.e., public companies, or other investment companies registered under the Investment Company Act of 1940. |
| 4 | Trustees who are not interested persons are considered “Independent” Trustees. |
63
TETON WESTWOOD FUNDS
TETON Westwood Mighty MitesSM Fund
TETON Westwood SmallCap Equity Fund
TETON Westwood Mid-Cap Equity Fund
TETON Westwood Income Fund
TETON Westwood Equity Fund
TETON Westwood Balanced Fund
TETON Westwood Intermediate Bond Fund
One Corporate Center
Rye, New York 10580-1422
General and Account Information:
800-WESTWOOD [800-937-8966]
fax: 914-921-5118
website: www.tetonadv.com
e-mail: info@tetonadv.com
Board of Trustees
| | | | |
| | | | | |
ANTHONY J. COLAVITA | | | | WERNER J. ROEDER, MD |
President, | | | | Medical Director, |
Anthony J. Colavita, P.C. | | | | Lawrence Hospital |
| | |
JAMES P. CONN | | | | SALVATORE J. ZIZZA |
Former Chief Investment Officer, | | | | Chairman, |
Financial Security Assurance Holdings Ltd. | | Zizza & Associates Corp. |
|
| Officers |
| | |
BRUCE N. ALPERT | | | | RICHARD J. WALZ |
President | | | | Chief Compliance Officer |
| | |
ANDREA R. MANGO | | | | AGNES MULLADY |
Secretary | | | | Treasurer |
Investment Adviser
TETON Advisors, Inc.
Custodian
The Bank of New York Mellon
Distributor
G.distributors, LLC
Legal Counsel
Paul Hastings LLP
We have separated the portfolio managers’ commentaries from the financial statements and investment portfolio due to corporate governance regulations stipulated by the Sarbanes-Oxley Act of 2002. We have done this to ensure that the content of the portfolio managers’ commentaries is unrestricted. The financial statements and investment portfolio are mailed separately from the commentaries. Both the commentaries and the financial statements, including the portfolio of investments, will be available on our website at www.tetonadv.com.
This report is submitted for the information of the shareholders of the TETON Westwood Funds. It is not authorized for distribution to prospective investors unless preceded or accompanied by an effective prospectus.
GABWWQ314AR
Item 2. Code of Ethics.
| | (a) | The registrant, as of the end of the period covered by this report, has adopted a code of ethics that applies to the registrant’s principal executive officer, principal financial officer, principal accounting officer or controller, or persons performing similar functions, regardless of whether these individuals are employed by the registrant or a third party. |
| | (c) | There have been no amendments, during the period covered by this report, to a provision of the code of ethics that applies to the registrant’s principal executive officer, principal financial officer, principal accounting officer or controller, or persons performing similar functions, regardless of whether these individuals are employed by the registrant or a third party, and that relates to any element of the code of ethics description. |
| | (d) | The registrant has not granted any waivers, including an implicit waiver, from a provision of the code of ethics that applies to the registrant’s principal executive officer, principal financial officer, principal accounting officer or controller, or persons performing similar functions, regardless of whether these individuals are employed by the registrant or a third party, that relates to one or more of the items set forth in paragraph (b) of this item’s instructions. |
Item 3. Audit Committee Financial Expert.
As of the end of the period covered by the report, the registrant’s board of directors has determined that James P. Conn is qualified to serve as an audit committee financial expert serving on its audit committee and that he is “independent.”
Item 4. Principal Accountant Fees and Services.
Audit Fees
| | (a) | The aggregate fees billed for each of the last two fiscal years for professional services rendered by the principal accountant for the audit of the registrant’s annual financial statements or services that are normally provided by the accountant in connection with statutory and regulatory filings or engagements for those fiscal years are $160,000 in 2013 and $164,800 in 2014. |
Audit-Related Fees
| | (b) | The aggregate fees billed in each of the last two fiscal years for assurance and related services by the principal accountant that are reasonably related to the performance of the audit of the registrant’s financial statements and are not reported under paragraph (a) of this Item are $0 in 2013 and $0 in 2014. |
Tax Fees
| | | | |
| | (c) | | The aggregate fees billed in each of the last two fiscal years for professional services rendered by the principal accountant for tax compliance, tax advice, and tax planning are $27,080 in 2013 and $27,890 in 2014. Tax fees represent tax compliance services provided in connection with the review of the Registrant’s tax returns. |
|
| All Other Fees |
| | |
| | (d) | | The aggregate fees billed in each of the last two fiscal years for products and services provided by the principal accountant, other than the services reported in paragraphs (a) through (c) of this Item are $0 in 2013 and $0 in 2014. |
| | |
| | (e)(1) | | Disclose the audit committee’s pre-approval policies and procedures described in paragraph (c)(7) of Rule 2-01 of Regulation S-X. |
| | |
| | | | Pre-Approval Policies and Procedures. The Audit Committee (“Committee”) of the registrant is responsible for pre-approving (i) all audit and permissible non-audit services to be provided by the independent registered public accounting firm to the registrant and (ii) all permissible non-audit services to be provided by the independent registered public accounting firm to the Adviser, Gabelli Advisers, Inc., and any affiliate of Gabelli Funds, LLC (“Gabelli”) that provides services to the registrant (a “Covered Services Provider”) if the registered public accounting firm’s engagement related directly to the operations and financial reporting of the registrant. The Committee may delegate its responsibility to pre-approve any such audit and permissible non-audit services to the Chairperson of the Committee, and the Chairperson must report to the Committee, at its next regularly scheduled meeting after the Chairperson’s pre-approval of such services, his or her decision(s). The Committee may also establish detailed pre-approval policies and procedures for pre-approval of such services in accordance with applicable laws, including the delegation of some or all of the Committee’s pre-approval responsibilities to the other persons (other than Gabelli or the registrant’s officers). Pre-approval by the Committee of any permissible non-audit services is not required so long as: (i) the permissible non-audit services were not recognized by the registrant at the time of the engagement to be non-audit services; and (ii) such services are promptly brought to the attention of the Committee and approved by the Committee or Chairperson prior to the completion of the audit. |
| | |
| | (e)(2) | | The percentage of services described in each of paragraphs (b) through (d) of this Item that were approved by the audit committee pursuant to paragraph (c)(7)(i)(C) of Rule 2-01 of Regulation S-X are as follows: |
| | | | (b) N/A (c) 100% (d) N/A |
| | |
| | (f) | | The percentage of hours expended on the principal accountant’s engagement to audit the registrant’s financial statements for the most recent fiscal year that were attributed to work |
| | performed by persons other than the principal accountant’s full-time, permanent employees was 0%. |
| | (g) | The aggregate non-audit fees billed by the registrant’s accountant for services rendered to the registrant, and rendered to the registrant’s investment adviser (not including any sub-adviser whose role is primarily portfolio management and is subcontracted with or overseen by another investment adviser), and any entity controlling, controlled by, or under common control with the adviser that provides ongoing services to the registrant for each of the last two fiscal years of the registrant was $27,080 in 2013 and $27,890 in 2014. |
| | (h) | The registrant’s audit committee of the board of directors has considered whether the provision of non-audit services that were rendered to the registrant’s investment adviser (not including any sub-adviser whose role is primarily portfolio management and is subcontracted with or overseen by another investment adviser), and any entity controlling, controlled by, or under common control with the investment adviser that provides ongoing services to the registrant that were not pre-approved pursuant to paragraph (c)(7)(ii) of Rule 2-01 of Regulation S-X is compatible with maintaining the principal accountant’s independence. |
Item 5. Audit Committee of Listed registrants.
Not applicable.
Item 6. Investments.
| (a) | Schedule of Investments in securities of unaffiliated issuers as of the close of the reporting period is included as part of the report to shareholders filed under Item 1 of this form. |
| Item 7. | Disclosure of Proxy Voting Policies and Procedures for Closed-End Management Investment Companies. |
Not applicable.
Item 8. Portfolio Managers of Closed-End Management Investment Companies.
Not applicable.
| Item 9. | Purchases of Equity Securities by Closed-End Management Investment Company and Affiliated Purchasers. |
Not applicable.
Item 10. Submission of Matters to a Vote of Security Holders.
There have been no material changes to the procedures by which the shareholders may recommend nominees to the registrant’s board of trustees, where those changes were implemented after the registrant last provided disclosure in response to the requirements of Item 407(c)(2)(iv) of Regulation S-K (17 CFR 229.407) (as required by Item 22(b)(15) of Schedule 14A (17 CFR 240.14a-101)), or this Item.
Item 11. Controls and Procedures.
| | (a) | The registrant’s principal executive and principal financial officers, or persons performing similar functions, have concluded that the registrant’s disclosure controls and procedures (as defined in Rule 30a-3(c) under the Investment Company Act of 1940, as amended (the “1940 Act”) (17 CFR 270.30a-3(c))) are effective, as of a date within 90 days of the filing date of the report that includes the disclosure required by this paragraph, based on their evaluation of these controls and procedures required by Rule 30a-3(b) under the 1940 Act (17 CFR 270.30a-3(b)) and Rules 13a-15(b) or 15d-15(b) under the Securities Exchange Act of 1934, as amended (17 CFR 240.13a-15(b) or 240.15d-15(b)). |
| | (b) | There were no changes in the registrant’s internal control over financial reporting (as defined in Rule 30a-3(d) under the 1940 Act (17 CFR 270.30a-3(d)) that occurred during the registrant’s second fiscal quarter of the period covered by this report that has materially affected, or is reasonably likely to materially affect, the registrant’s internal control over financial reporting. |
Item 12. Exhibits.
| | |
(a)(1) | | Code of ethics, or any amendment thereto, that is the subject of disclosure required by Item 2 is attached hereto. |
| |
(a)(2) | | Certifications pursuant to Rule 30a-2(a) under the 1940 Act and Section 302 of the Sarbanes-Oxley Act of 2002 are attached hereto. |
| |
(a)(3) | | Not applicable. |
| |
(b) | | Certifications pursuant to Rule 30a-2(b) under the 1940 Act and Section 906 of the Sarbanes-Oxley Act of 2002 are attached hereto. |
(12.other) Not applicable.
SIGNATURES
Pursuant to the requirements of the Securities Exchange Act of 1934 and the Investment Company Act of 1940, the registrant has duly caused this report to be signed on its behalf by the undersigned, thereunto duly authorized.
| | | | |
(Registrant) | | The TETON Westwood Funds | | |
| | | | |
By (Signature and Title)* | | /s/ Bruce N. Alpert | | |
| | Bruce N. Alpert, Principal Executive Officer | | |
Pursuant to the requirements of the Securities Exchange Act of 1934 and the Investment Company Act of 1940, this report has been signed below by the following persons on behalf of the registrant and in the capacities and on the dates indicated.
| | | | |
By (Signature and Title)* | | /s/ Bruce N. Alpert | | |
| | Bruce N. Alpert, Principal Executive Officer | | |
| | | | |
By (Signature and Title)* | | /s/ Agnes Mullady | | |
| | Agnes Mullady, Principal Financial Officer and Treasurer | | |
| * | Print the name and title of each signing officer under his or her signature. |