EXHIBIT 99.1

Occidental Petroleum Corporation
September 7, 2005
STEVE CHAZEN
Senior Executive Vice President &
Chief Financial Officer
Lehman Brothers
Nineteenth Annual CEO Energy/Power Conference
1

Occidental Petroleum Corporation
Equity Market Capitalization $33 billion as of 8/31/05
4th largest U.S. oil & gas company
Proven Reserves of 2.5 billion barrels oil equivalent
2004 Results:WTI = $41.40 per bbl
Net Income $2.6 billion
Cash From Operations $3.9 billion
Return on Equity 27.8%
Return on Capital Employed 20.2%
Total Shareholder Return 41.1%
2

Six Month 2005 Results
Net Income – Core/Reported
Earnings per Share – Core/Reported
Cash from Operations
Stockholders’ Equity
*ROCE (%)
*ROE (%)
Total Shareholder Return
$1.717/$2.382 Billion
$4.28/$5.94
$2.4 Billion
$12.7 Billion
32
41
32.9%
Consolidated Results
*Annualized through first half of 2005
WTI = $51.51
See Appendix for GAAP reconciliation.
3

Financial Performance Criteria
Return on Capital Employed
Measures Efficient Use of Capital
Return on Equity
Total Return to Stockholders
Stock Price Change Plus Dividend
4
20
Return On Capital Employed
Percent
15
15
11
15
12
11
9
2004
2002 - 2004
2000 - 2004
1995 - 2004
S&P 500
Oil & Gas Index
Oxy
Data Source: Bloomberg
5

Return On Common Equity
Percent
28
22
22
15
25
17
17
12
2004
2002 - 2004
2000 - 2004
1995 - 2004
S&P 500
Oil & Gas Index
Oxy
Data Source: Bloomberg
6

Total Returns
2000-2004
1995-2004
% Without Dividend
% With Dividend
350
203
286
192
212
164
242
181
Six Months 2005
170
38
(1)
(4)
220
56
(11)
4
33
20
(18)
(6)
Data Source: Bloomberg
7

What’s Been Oxy Strategy:
Focused Operations
Focused Value Creation
Disciplined Financial Philosophy
8
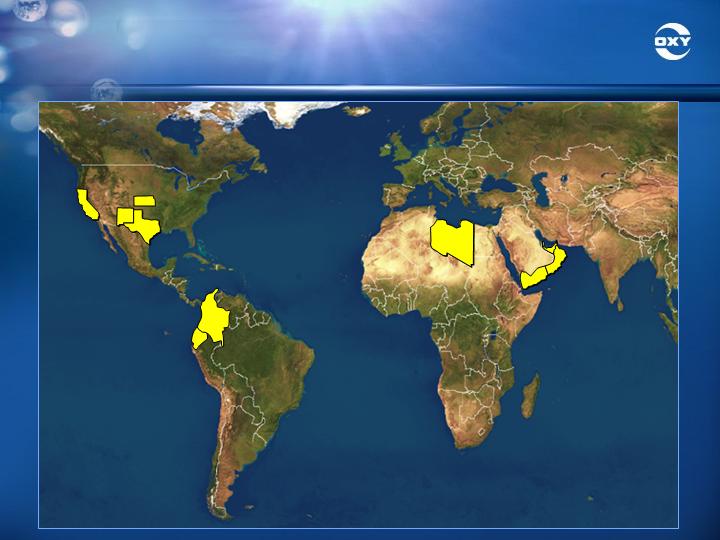
Worldwide Operations
Long Beach
Permian Basin
Horn Mountain
Hugoton
Elk Hills
Colombia
Ecuador
Libya
Russia
Pakistan
Oman
U.A.E.
Yemen
Qatar
.
.
.
9

2004 Proven Reserves by Country
Million BOE
1,844
348
58
63
49
42
24
US
Qatar
Yemen
Russia
Pakistan
Oman
Colombia
104
Ecuador
See Appendix for GAAP reconciliation.
10
Thousand BOE/Day
515
476
566
547
461
425
438
395
Worldwide Production
11

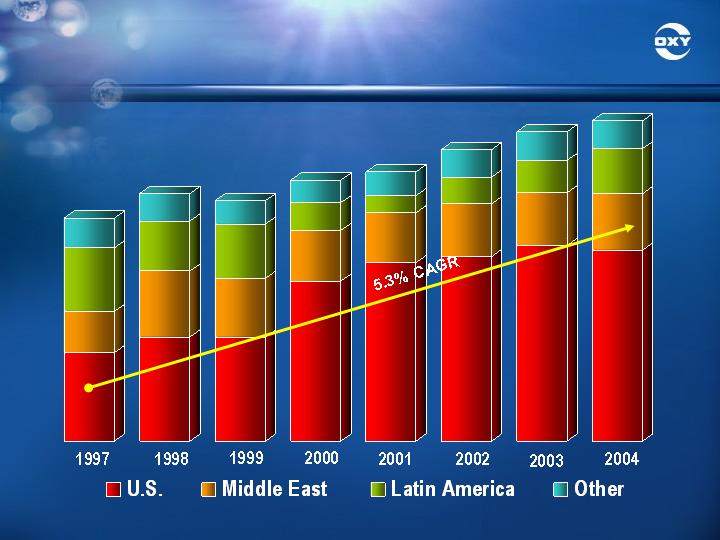
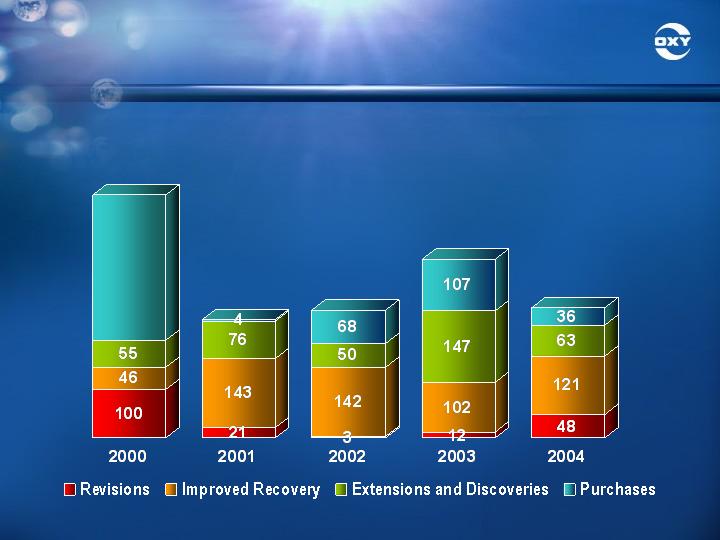
Production & Reserve Additions
173
244
188
263
200
368
207
268
Million BOE
2004
2003
2002
2001
Production
Additions
See Appendix for GAAP reconciliation.
12
Million BOE
Sources of Worldwide Reserve Additions
1,170
244
263
368
268
969
See Appendix for GAAP reconciliation.
13
2001
2002
2,241
2,311
Worldwide Proven Reserves
Million BOE
2003
1,698
543
1,755
556
US
International
1,804
667
2,471
- Horn Mountain -
2004
1,844
688
2,532
R/P = 12.2
See Appendix for GAAP reconciliation.
14

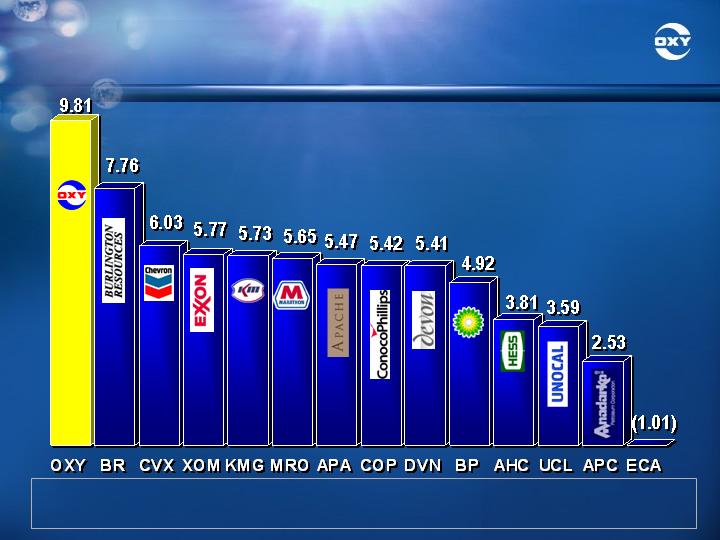
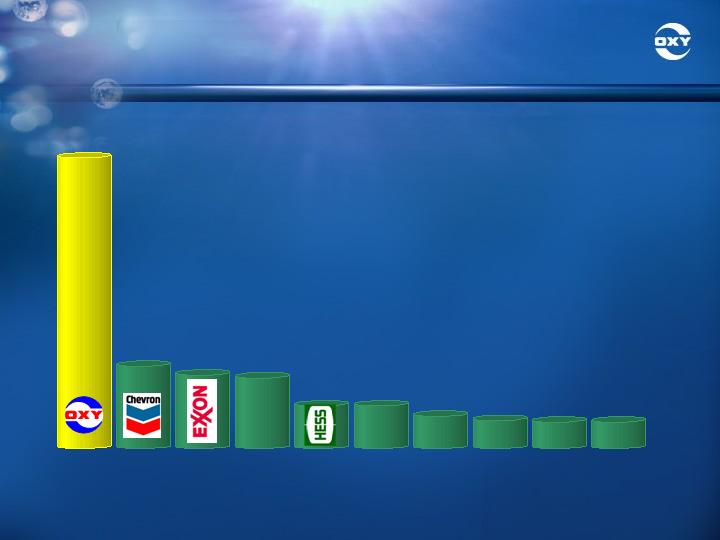
Finding & Development Costs
3-year Average (2002-2004)
BP plc
Marathon Oil
ExxonMobil
Chevron Corporation
Apache Corporation
Burlington Resources
ConocoPhillips
Anadarko Petroleum
Unocal Corporation
Devon Energy
Amerada Hess
Kerr-McGee Corporation
5.42
5.71
6.05
6.77
6.95
7.00
8.20
8.58
9.35
9.72
15.99
17.18
$/BOE
Oxy
5.00
Source: Merrill Lynch Equity Research
15
2002-2004 Free Cash Flow*
$/BOE
OXY: 2004 $12.04/BOE
* Combined (consolidated and other interests) exploration & production income after taxes and before interest,
plus DD&A and exploration expense, less capital (excluding acquisitions and ARO costs) – divided by BOE
sales.
See Appendix for GAAP reconciliation
16

Focused Value Creation Strategy
Maintain Strong Balance Sheet
Disciplined Capital Expenditure Program
Selective Acquisitions
Moderate Predictable Reserve/Production Growth
Chemicals Provides Excess Cash Flow
Review Non-Core Investments
Review Dividend Policy Annually
17
Balance Sheet
6,354
4,890
2000
2001
2002
4,759
4,774
5,634
6,318
Total Debt - $ Millions
Total Equity - $Millions
2000
2001
2002
4,570
2003
2003
7,929
2004
3,905
2004
10,550
57
46
43
37
27
Debt/Cap - Percentage
3,461
2Q 2005
2Q 2005
12,706
21
18

2005 Capital Expenditures ($MM)
Oil & Gas US $ 775
Middle East 560
Latin America 160
Other International 10
Exploration 280
Chemicals 165
1,950
Dolphin 360
$ 2,310
Net Acquisition Capital $ 1,200
19

Selective Acquisitions
Natural Consolidator
Permian Basin
California
Vulcan Chlor-Alkali Plants
20

Permian Basin Acquisitions
Spent $1.2 Billion on Three Asset Acquisitions
(Net of Asset Sales)
Projected Production Impact
Estimated Year-End 2005 Exit Rate of 26,000 BOE/Day
Total Proved Reserves for All Three Permian
Acquisitions (Net of Asset Sales)
At Least 130 Million BOE
First Half 2005
21
Oxy’s Permian Basin Production
Thousand BOE/Day
172
1Q-05
172
198
with 1H-05 acquisitions
26
22
198
56
22
18
19
OXY*
CVX
COP
PDX
UCL
AHC
APA
29
Additional Permian Opportunities Still Exist
Top 10 Permian Oil Producers
(Thousand Barrels/Day)
Data Source: IHS Energy
KMI
XTO
48
29
18
*production adjusted for recent acquisitions/divestitures
XOM*
50
23

Chemical Highlights
Generate Cash Flow In Excess of
Capital Expenditures Through the
Business Cycle
Primary Mission of
Oxy’s Chemicals Business
Generated Nearly $3 Billion of Cash Flow After Capital
During the Last 10 Years
Generated Over $500 Million of Cash Flow After Capital
in 2004
24

Ingleside, Texas LNG Terminal*
*Conceptual Illustration
25

FERC Approval Granted in Late July
$450 Million LNG Receiving Terminal and Related
26-Mile Pipeline
1 BCF/Day Send-Out Capacity
To Be Integrated with Oxy’s Existing Ingleside
Chemical and Power Facilities
Includes NGL Recovery Unit & Vaporization Facility
Expected Start-up late 2008
Ingleside, Texas LNG Terminal
26

Dividends
2002-2004 Dividend Payments
Totaled Nearly $1.2 Billion
Annual Payout Rates Per Common Share
2002 = $1.00
2003 = $1.04
2004 = $1.10
2005 = $1.24
Dividend Policy Evaluated Annually
Cash Dividends
Paid Continuously Since 1975
27

What’s ahead?
Success Riding on Two Factors
Add New Projects in Core Areas to Provide Growth
Maintain Strong Asset Base to Generate Cash to
Support Growth
Stay Focused on the Fundamentals
Maintain Financial Discipline and Focus
Execute Our Strategy
Create Long-Term Value
28

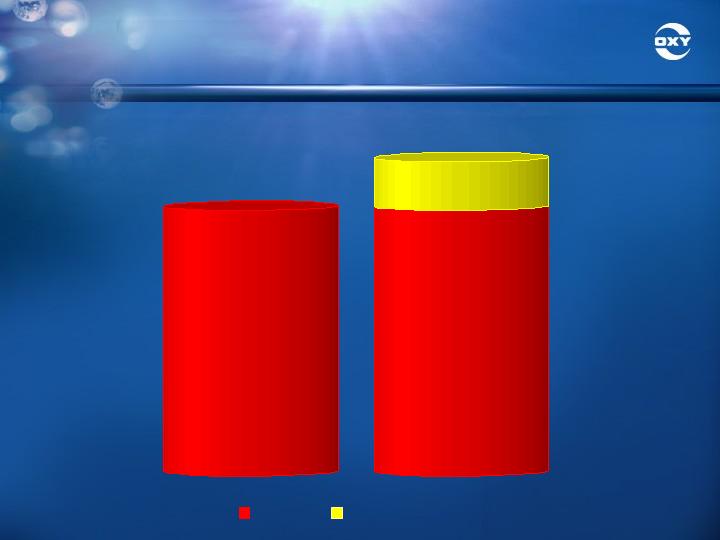
Production Growth Projects
Oman: Mukhaizna Oil Field
Qatar:
ISND / ISSD
Dolphin
Libya
Permian Basin / California
Exploration
Current Plans to Drill 30-40 Wells in 2005
Awarded 9 Exploration Blocks in Libya in January
29
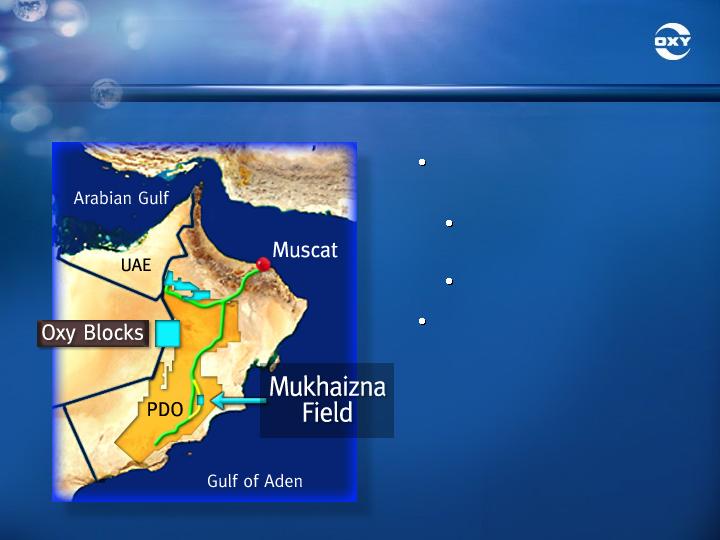
Oman - Mukhaizna Oil Field
Oxy Active in Oman
Since 1979
2nd Quarter 2005
Production
29,000 BOE/Day
Oxy Signs 30-Year
Production Sharing
Contract for Oman’s
Mukhaizna Oil Field
30

Oman - Mukhaizna Oil Field
Current Production
10,000 Barrels of Oil/Day (Gross)
Future Investment
$2 Billion (Gross)
Future Production Target
150,000 Barrels of Oil/Day (Gross)
Ultimate Recovery
1 Billion Barrels Over Project Life
Project Overview
31

Dolphin Gas Project
Projected Start – late 2006
Invest Gross Capital
of $4 Billion
(2004-2006)
Oxy’s Share is 24.5%
Estimated Net Reserves:
300 Million BOE
(assumes 2 BCF/Day Gas
Production)
32

Dolphin Gas Project
Oxy’s Peak Net Production
Oxy’s Production
275 Million Cubic Ft./Day
20,000 Barrels Liquids/Day
Equals 65,000 BOE/Day
Contracts in Place for 2 Billion Cubic Ft./Day
Phase 2
Working on Contracts for an Additional Billion Cubic
Feet/Day
Scheduled Start-Up 2009– 2010
33

Return to Libya
We Have Returned to our Historical Assets
Immediate impact will be to add 12,000 to 15,000
BOE/day of production to 2005 exit rate
Oxy’s net working interest in Libya covers
approximately 130,000 square kilometers
Exploration
Work program proceeding on nine blocks awarded
earlier this year
Significant Potential for Future Production
Growth Through Investment in EOR Projects
34
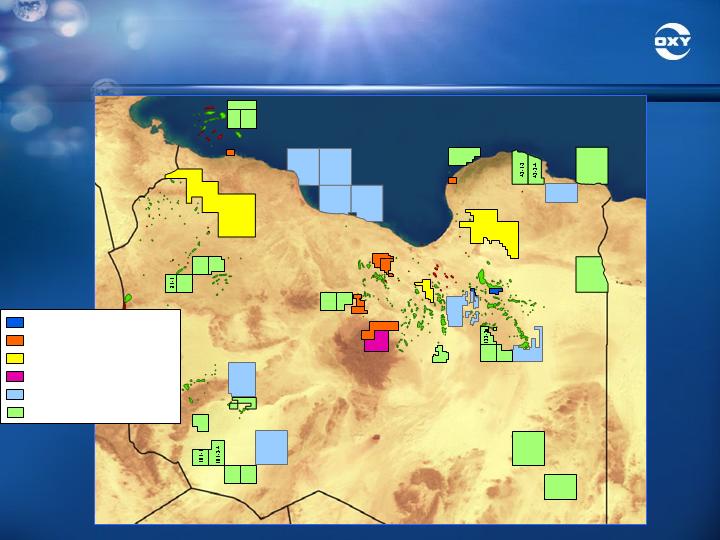
Return to Libya
EPSA II
NC143
EPSA II
NC145
EPSA II
NC144
EPSA 85
NC150
EPSA I
NC74
EPSA I
NC29
Concessions
102, 103
B
C
A
B
F
36
53
35
52
163
131
59
124
106
Concession Blocks
EPSA I (Zueitina)
EPSA II Exploration (Oxy)
EPSA 85 Exploration (Oxy)
EPSA IV #1 Exploration (Oxy)
EPSA IV #2 Bid Round
Libya
Tunisia
Algeria
Niger
Chad
Egypt
Tripoli
Benghazi
44
94
171
186
40-3-4
17-4
82-3
81-2
17-3
82-4
2-1-2
102-3
123-1
176-3
176-4
146-1
102-4
123-2
121-2
147-3-4
123-3b
35

Conclusion
Strong, Flexible Balance Sheet
Continued Oil & Gas Production Growth
Long-Lived Domestic Oil & Gas Reserve Base
New, High Potential Exploration Opportunities
Solid Base for Future Growth
And Profitability
36

Occidental Petroleum Corporation
Statements in this presentation that contain words such as "will", "expect" or "estimate",
or otherwise relate to the future, are forward-looking and involve risks and uncertainties
that could significantly affect expected results. Factors that could cause results to differ
materially include, but are not limited to: changes in tax rate, exploration risks such as
drilling of unsuccessful wells, global commodity pricing fluctuations and supply/demand
considerations for oil, gas and chemicals; higher-than-expected costs; political risk; and
not successfully completing (or any material delay in) any expansion, capital expenditure,
acquisition, or disposition. Occidental disclaims any obligation to update any forward-
looking statements. The United States Securities and Exchange Commission (SEC)
permits oil and natural gas companies, in their filings with the SEC, to disclose only
proved reserves demonstrated by actual production or conclusive formation tests to be
economically producible under existing economic and operating conditions. We use
certain terms in this presentation, such as probable, possible and recoverable reserves,
that the SEC's guidelines strictly prohibit us from using in filings with the SEC.
Additionally, the SEC requires oil and natural gas companies, in their filings, to disclose
non-financial statistical information about their consolidated entities separately from
such information about their equity holdings and not to show combined totals. Certain
information in this presentation is shown on a combined basis; however, the information
is disclosed separately in the Appendix. U.S. investors are urged to consider carefully
the disclosure in our Form 10-K, available through the following toll-free telephone
number,1-888-OXYPETE (1-888-699-7383)or on the Internet athttp://www.oxy.com.
You also can obtain a copy from the SEC by calling1-800-SEC-0330.
37
38

Appendix
39

US International Worldwide
2004 OIL GAS BOE OIL GAS BOE OIL GAS BOE
Consolidated Subsidiaries 1,494 2,101 1,844 499 874 645 1,993 2,975 2,489
Other Interests - - - 43 - 43 43 - 43
Worldwide 1,494 2,101 1,844 542 874 688 2,036 2,975 2,532
2003
Consolidated Subsidiaries 1,500 1,826 1,804 490 759 617 1,990 2,585 2,421
Other Interests - - - 48 9 50 48 9 �� 50
Worldwide 1,500 1,826 1,804 538 768 667 2,038 2,594 2,471
2002
Consolidated Subsidiaries 1,452 1,821 1,755 476 228 514 1,928 2,049 2,269
Other Interests - - - 42 - 42 42 - 42
Worldwide 1,452 1,821 1,755 518 228 556 1,970 2,049 2,311
2001
Consolidated Subsidiaries 1,371 1,962 1,698 482 106 499 1,853 2,068 2,197
Other Interests - - - 44 - 44 44 - 44
Worldwide 1,371 1,962 1,698 526 106 543 1,897 2,068 2,241
Worldwide Proven Reserves
(Million BOE)
GAAP RECONCILIATION
40

Consolidated Subsidiaries Other Interests Worldwide
OIL GAS BOE OIL GAS BOE OIL GAS BOE
United States 1,494 2,101 1,844 - - - 1,494 2,101 1,844
Qatar 237 668 348 - - - 237 668 348
Ecuador 104 - 104 - - - 104 - 104
Oman 46 100 63 - - - 46 100 63
Colombia 67 - 67 (9) - (9) 58 - 58
Russia - - - 49 - 49 49 - 49
Yemen 39 - 39 3 - 3 42 - 42
Pakistan 6 106 24 - - - 6 106 24
1,993 2,975 2,489 43 - 43 2,036 2,975 2,532
2004 Proven Reserves by Country
(Million BOE)
GAAP RECONCILIATION
41

(Million BOE) Consolidated Subsidiaries Other Interests Worldwide
OIL GAS BOE OIL GAS BOE OIL GAS BOE
PRODUCTION
2000 117 259 160 8 - 8 125 259 168
2001 124 241 164 9 - 9 133 241 173
2002 �� 142 229 180 8 - 8 150 229 188
2003 153 221 190 10 - 10 163 221 200
2004 159 233 198 9 - 9 168 233 207
Proved Reserve Additions
2000 1,041 777 1,170 - - - 1,041 777 1,170
2001 219 100 236 8 - 8 227 100 244
2002 221 216 257 6 - 6 227 216 263
2003 223 766 351 16 9 18 23 775 368
2004 162 624 266 4 (9) 2 166 615 268
Worldwide Production and Proved
Reserve Additions
GAAP RECONCILIATION
42

(Million BOE) Consolidated Subsidiaries Other Interests Worldwide
OIL GAS BOE OIL GAS BOE OIL GAS BOE
2004
Revisions 5 241 45 5 (9) 3 10 232 48
Improved Recovery 88 185 120 1 - 1 89 185 121
Extensions and Discoveries 30 191 61 2 - - 2 32 191 63
Purchases 39 7 40 (4) - (4 ) 35 7 36
162 624 266 4 (9) 2 166 615 268
2003
Revisions (1) 44 6 6 - 6 5 44 12
Improved Recovery 85 70 97 4 9 6 89 79 102
Extensions and Discoveries 41 597 141 6 - 6 47 597 147
Purchases 98 55 107 - - - - 98 55 107
223 766 351 16 9 18 239 775 368
2002
Revisions 13 (54) 4 (1 ) - (1) 12 (54) 3
Improved Recovery 112 151 137 5 - - 5 117 151 142
Extensions and Discoveries 40 50 - - - - - 40 60 50
Purchases 56 59 66 2 - 2 58 9 68
221 216 257 �� 6 - 6 227 216 263
2001
Revisions 21 (49) 13 8 - 8 29 (49) 21
Improved Recovery 139 23 143 - - - - 139 23 143
Extensions and Discoveries 56 122 76 - - - - 56 122 76
Purchases 3 4 4 - - - 3 4 4
219 100 236 8 - 8 227 100 244
2000
Revisions 62 223 99 1 - 1 63 223 100
Improved Recovery 42 25 46 - - - - 42 25 46
Extensions and Discoveries 37 112 56 (1) - (1 ) 36 112 55
Purchases 900 417 969 - - - - 900 417 969
1,041 777 1,170 - - - 1,041 777 1,170
Sources of Worldwide Proved
Reserve Additions
GAAP RECONCILIATION
43
2004
Occidental Petroleum Consolidated Statement of Cash Flows
Cash flow from operating activities $ 3,878
Cash flow from investing activities (2,288)
Cash flow from financing activities (824)
Consolidated Other
Subsidiaries Interests Worldwide
FAS 69 GAAP Oil & Gas results of operations $ 2,781 $ 50 $ 2,831
Depreciation, depletion & amortization 1,040 12 1,052
Exploration expense 214 1 215
Capital expenditures (excluding acquisitions) (1,596) (11) (1,607)
Cash flow from operations $ 2,439 $ 52 $ 2,491
Sales volumes (million BOE) 206.83
Cash flow per BOE $ 12.04
Oil & Gas: Cash Flow
($ Millions, except $/BOE)
44

Annual Average
2002 - 2004
Occidental Petroleum Consolidated Statement of Cash Flows
Cash flow from operating activities $ 3,017
Cash flow from investing activities (2,002)
Cash flow from financing activities (599)
Change in cash $ 416
Annual Average 2002 - 2004
Consolidated Other
Subsidiaries Interests Worldwide
FAS 69 GAAP Oil & Gas results of operations $ 2,095 $ 26 $ 2,121
Depreciation, depletion & amortization 933 14 947
Exploration expense 176 0 176
Capital expenditures (excluding acquisitions) (1,272) (9) (1,281)
Cash flow from operations $ 1,932 $ 31 $ 1,963
Sales volumes (million BOE) 200.15
Cash flow per BOE $ 9.81
Oil & Gas: Cash Flow
($ Millions, except $/BOE)
GAAP RECONCILIATION
45

December 31 June 30 2005
2004 2005 Annualized
GAAP measure – earnings applicable $ 2,568 $ 2,382
to common shareholders
Interest expense 239 108
Tax effect of interest expense (84) (38)
Earnings before tax-effected interest expense $ 2,723 2,452
GAAP stockholders’ equity $10,550 $ 12,706
Debt
GAAP debt
Debt, including current maturities $ 3,804 $ 3,360
Non-GAAP debt
Capital lease obligation 26 26
Subsidiary preferred stock 75 75
Total debt $ 3,905 $ 3,461
Total capital employed $ 14,455 $ 16,167
RETURN ON CAPITAL EMPLOYED (ROCE) (%) 20.2 16.0 32.0
Return on Capital Employed (ROCE)
($ Millions)
GAAP RECONCILIATION
46