From your standpoint as investors, the most important performance indicator is the total return to shareholders.
All the oil companies have benefited from higher prices, but Oxy’s total return of 279 percent, like our profits and cash flow per barrel, has led the industry over the past five years.
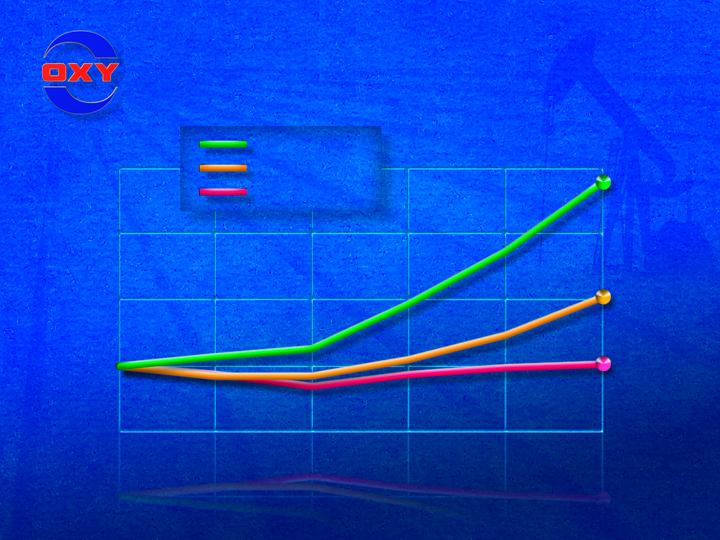
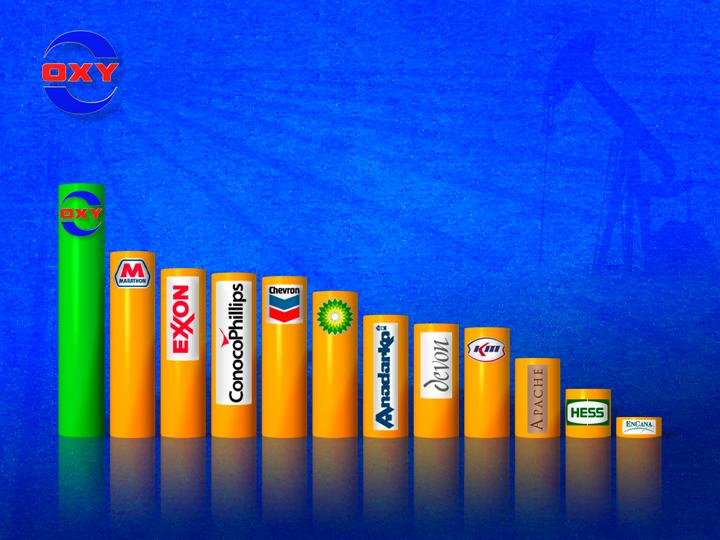
Comparative Total Returns
Oxy
Peer Group
S&P 500
$400
$300
$200
$100
$0
$379
$229
$103
2000
2001
2002
2003
2004
2005
This chart compares Oxy’s cumulative total return with the cumulative total return of the S&P 500 Index and our Proxy peer group.
The peer group includes Amerada Hess, Anadarko, Apache, Chevron, ConocoPhillips, Devon Energy, ExxonMobil, Kerr-McGee and Occidental.
If you invested $100 in Oxy stock at yearend 2000, the value of your investment would have grown to $379 by the end of 2005.
By comparison, your $100 investment in the composite peer group would have yielded $229 over the same five-year period. That’s $150 less than the value of your comparable Oxy investment.
If you had invested $100 in the S&P Index, your investment would have been worth only $103 after five years.
As we have said repeatedly, our primary focus is on generating superior total returns for our shareholders relative to our competitors. We trust you are pleased with the results.
Our job is to keep the value of your Oxy investment growing – subject, of course, to market conditions.
11

Oxy Shareholders (3/31/06)
Million
Shares
%/
Total
%/
Cumulative
Top 10 Institutional Shareholders:
BZW Barclays Global Investors
25,750
6.0
6.0
Barrow Hanley Mewhinney & Strauss
20,000
4.7
10.7
Davis Select Advisers
15,900
3.7
14.4
State Street Bank & Trust
14,500
3.4
17.8
Wellington Management/Vanguard
14,100
3.3
21.1
Fidelity Management & Research
13,500
3.2
24.3
Sanford/Alliance Capital
12,000
2.8
27.1
Jennison Associates
10,100
2.4
29.5
Capital Research & Management
9,500
2.2
31.7
Dodge & Cox
9,000
2.1
33.8
52 Holders of 1 – 9 Million Shares
123,105
28.7
62.5
Other Institutions
77,301
18.0
80.5
Individuals
83,513
19.5
100.0
Total Shares Outstanding
428,269
100.0
On behalf of the board, the management team and our employees, I want to thank all our shareholders, and especially our long-term shareholders, for their loyalty.
While the views of all our shareholders are important to us, we are engaged in regular dialogue with our large shareholders. Let me give you a breakdown of our shareholders.
Our 10 largest shareholders own more than 144 million shares that account for one-third of Oxy’s total shares. There are 52 institutional shareholders, who own between 1 and 9 million shares, that account for over 123 million shares, or about 29 percent. That means that 62 institutions own nearly two-thirds of our shares.
In addition, other large institutions hold an additional 77 million shares, or 18 percent, giving our institutional shareholders control of more than 80 percent of our stock.
I would now like to review some of last year’s highlights that helped set the stage for Oxy’s continued growth.
12
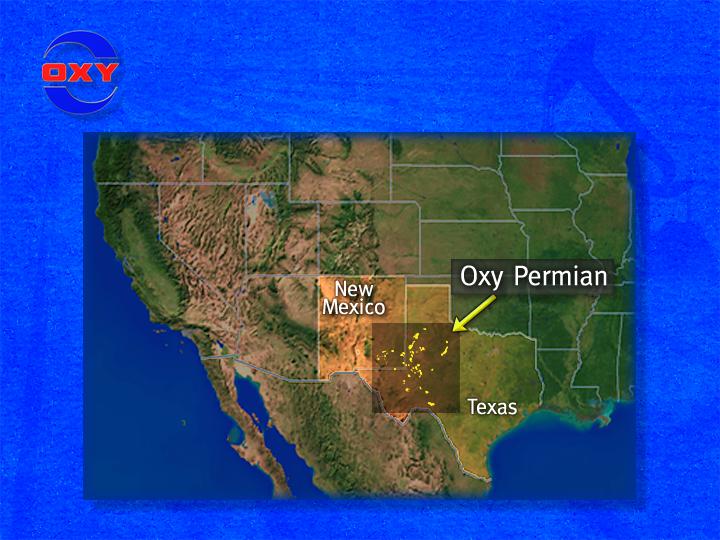
2005 Highlights – Texas & New Mexico
We enhanced our industry-leading position in the Permian Basin in Texas and New Mexico through a series of acquisitions. These acquisitions have further strengthened Oxy’s dominant position in this important producing area. Our Permian operations are the largest in our worldwide portfolio of assets. We expect our total Permian production from Texas and New Mexico to average approximately 200,000 equivalent barrels per day this year.
13
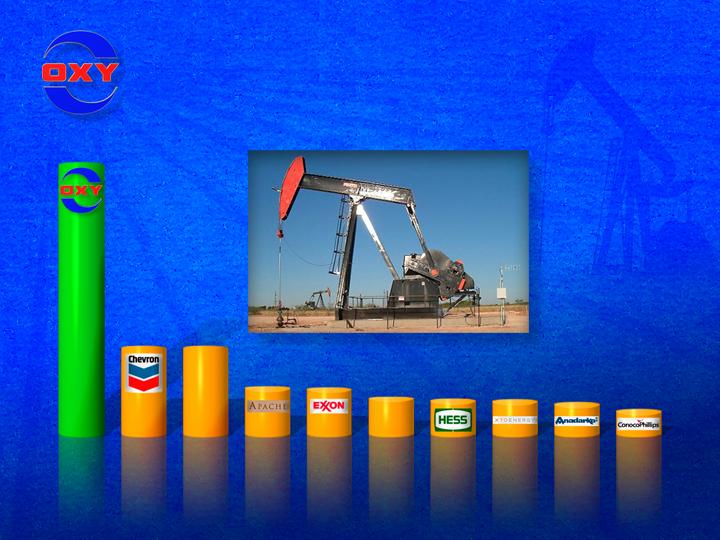
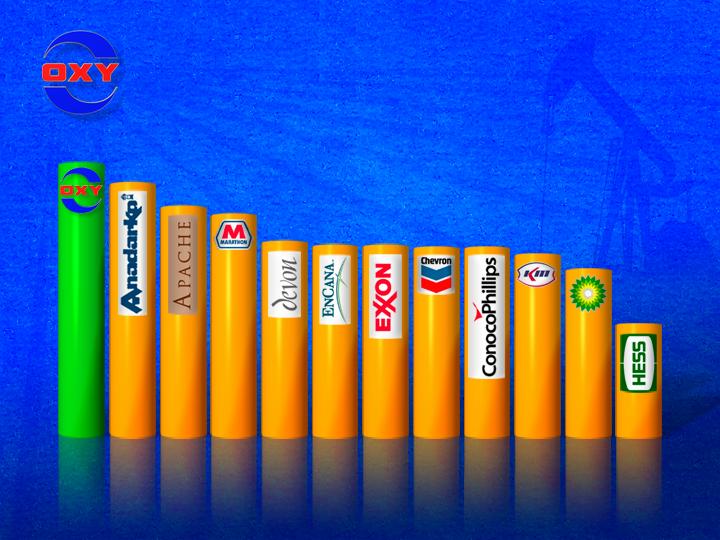
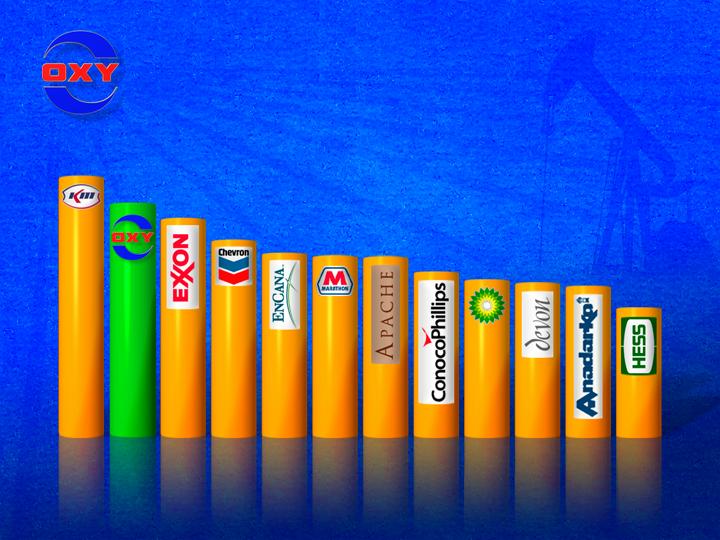
Top 10 Texas Oil Producers
2005 Gross Operated Production
(Thousand Barrels/Day)
174.5
OXY
56.7
CVX
56.5
KMI
30.7
APA
29.6
XOM
23.6
PXD
22.5
AHC
21.9
XTO
20.4
APC
15.5
COP
As you can see, Oxy is by far the largest oil producer in Texas, with production three times greater than Chevron which is the next largest producer. Our size and infrastructure place us in an excellent position to play the role of regional consolidator.
14

2005 Highlights – U.S.
Our California assets, which are expected to produce 125,000 equivalent barrels per day this year, together with our Permian operations, comprise the core of Oxy’s domestic oil and gas business that will continue to generate income and cash for many years to come.
15
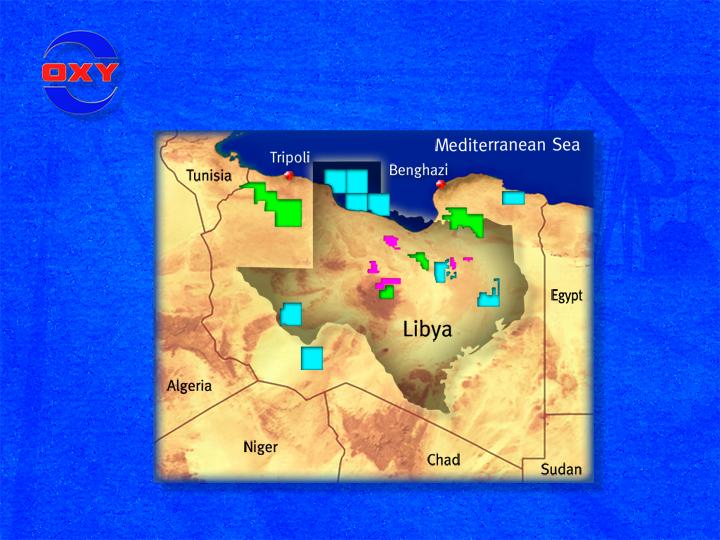
2005 Highlights – Libya
Let’s now turn to Libya. Since it’s difficult to grasp the magnitude of geographic areas outlined on a map, we thought we’d give you a little help by superimposing a map of Texas over a map of Libya. The purple blocks show Oxy’s historic producing areas that we operated from the 1960s through the mid-1980s. The green blocks are the historical exploration areas we were awarded in the 1980s, and the blue blocks are the 9 exploration blocks we won in January 2005.
If you could move all of these blocks inside the Texas outline, you would readily see that Oxy’s total acreage position in Libya would fill a large portion of Texas. Oxy’s 30 million Libyan acres encompass an area larger than the entire Permian Basin.
As you know Libya played an important role in Oxy’s early growth, and is poised to do so again.
Oxy’s net production in Libya averaged about of 22,000 net barrels of oil per day in the first quarter, but the real excitement surrounds our Libyan exploration program – which is the largest exploration effort in Oxy’s history. We are moving forward quickly and expect to drill at least 4 test wells this year.
16
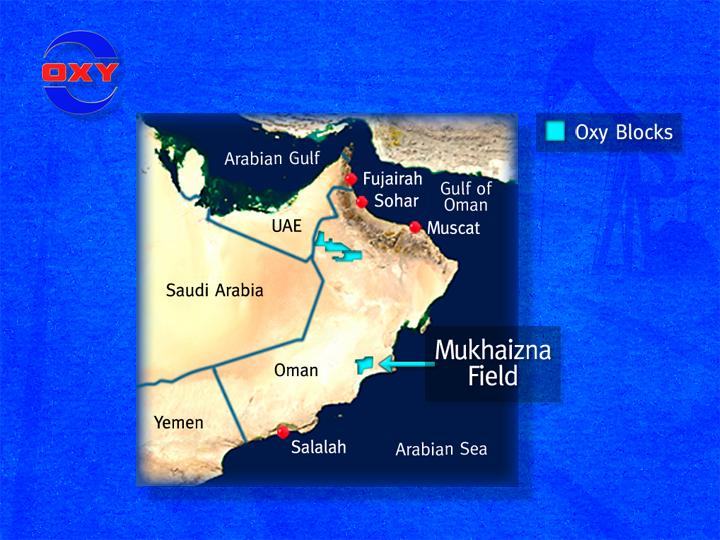
2005 Highlights – Oman
Last year, we also were awarded a contract by the Government of Oman to operate the giant Mukhaizna oil field. It took 3 to 4 years of technical work and persistent negotiation to convince the Government that replacing the previous operator would significantly expand and accelerate the field’s development.
Along with our partners, we plan to invest approximately $3 billion to increase production from 8,500 barrels per day - when we took over the Mukhaizna operation last September - to 150,000 barrels per day within the next few years.
We also have identified other high potential projects in Oman.
17
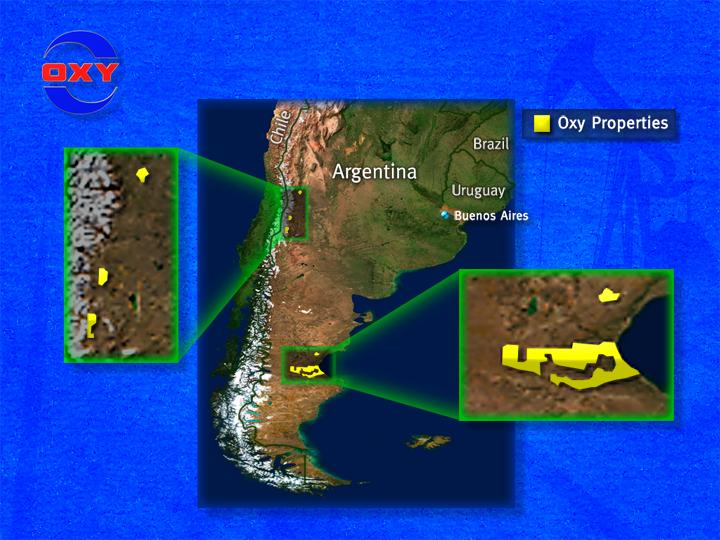
2005 Highlights – Argentina
Our acquisition of Vintage Petroleum has given Oxy a sizeable operation in Argentina that has significant growth potential. We are especially excited about the opportunities to significantly increase production, particularly in our properties in the southern part of the country.
We have identified numerous locations of proved undeveloped reserves. We expect to double production from these Argentina operations over the next 5 years to approximately 70,000 barrels per day.
18

Worldwide Proved Reserves
Billion BOE
1.39
1996
1.43
1997
1.54
1998
1.47
1999
2.17
2000
2.24
2001
2.31
2002
2.47
2003
2.53
2004
2.71
2005
When a company achieves these kind of results, investors want to know if and how we can sustain that high level of performance in the future. I’m confident we can because we have focused on the fundamentals to keep our oil and gas reserve base growing.
Our continued success in adding new reserves at a pace well ahead of production has increased our total proved reserves to historical highs in each of the last five years. At yearend 2005, our proved reserves were at a record high 2.71 billion equivalent barrels.
Our reserve additions set the stage for significant production growth over the next five years. We believe our proved reserves are headed for another record high at yearend, despite expectations of significantly higher production levels.
19
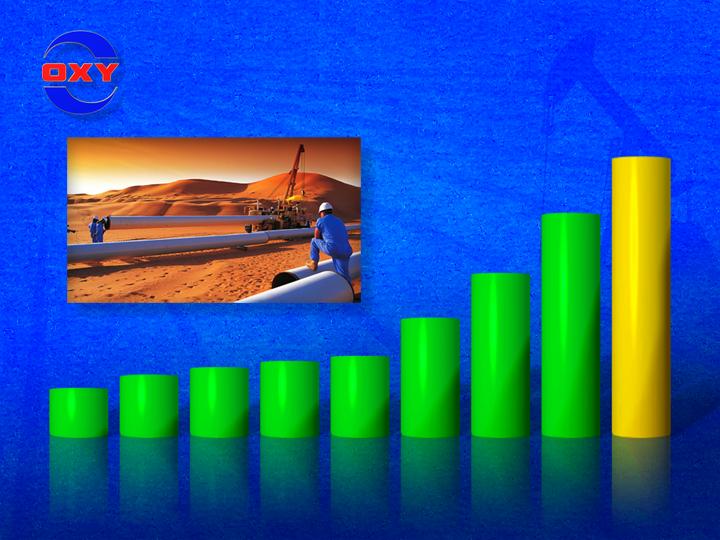
Oil & Gas Production Growth
Thousand BOE/Day
Yemen
568
2005
740
2010
Minimum
850
2010
Target
After a careful review of our assets, we expect to grow our production by an average of about 6 percent per year through 2010. That rate of growth would increase in our base production to a MINIMUM of 740,000 equivalent barrels per day in 2010. This estimate is derived from projects already in our pipeline and does not depend on new EOR projects, future exploration success or new acquisitions.
In addition, we have identified a number of new EOR opportunities in the Middle East and North Africa. We also believe we will have other opportunities to capture large projects in our core areas, including the U. S. and the Middle East - North Africa.
We expect to continue acquiring assets with upside potential in California and Texas. We see ourselves as natural consolidators in both regions given the size of our asset base and infrastructure.
With only modest success in capturing new projects that are not yet in our portfolio, we could achieve an average annual growth rate of up to 10 percent and reach a TARGET production level of 850,000 equivalent barrels per day in 2010.
20

Chemicals – Cash Flow
$ Millions
180
2001
245
2002
305
2003
505
2004
855
2005
Let’s turn briefly to our chemical operations which also had an excellent year in 2005. The primary mission of our chemical business is to generate cash flow in excess of capital expenditures.
Over the past 5 years, our chemical business has generated more than $2 billion of cash flow. Last year alone, OxyChem produced $855 million of cash flow after capital.
2006 has the potential to be an even better year.
21
Chemicals Profit Margins
2005 Operating Profits as Percent of Sales
16.7
2.9
8.0
11.6
14.0
7.6
7.2
11.2
8.2
13.9
13.0
13.4
11.8
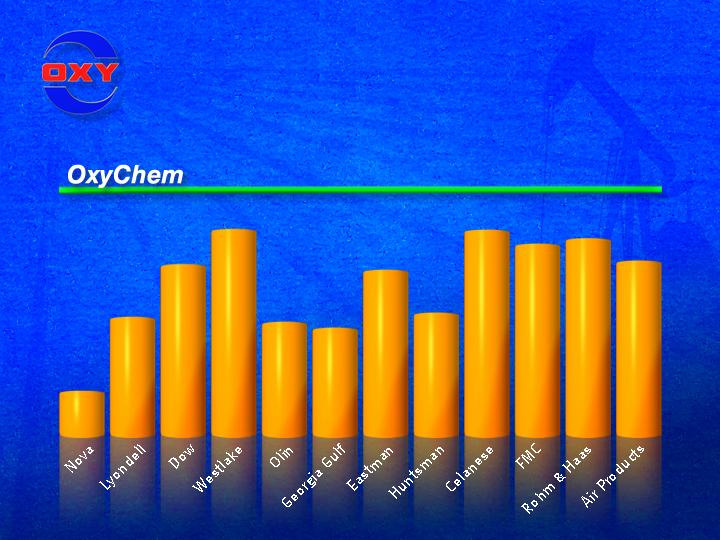
Our strategy for managing our chemical business is similar to our strategy for managing our oil and gas operations.
We focus on optimizing profitability and cash flow on a unit of production basis from large core assets where we have economies of scale. We aggressively manage our costs and maintain a disciplined program for capital spending.
As a result, OxyChem’s operating profit as a percent of sales is the highest among our chemical industry peers. OxyChem’s profit margin was 16.7 percent compared to the average profit margin for the group of 10.2 percent.
Strong margins in the first quarter helped us get off to a fast start this year.
22

Q1 2005 & 2006 Comparison
Q1 2005
Q1 2006
Change
Oil & Gas Production
565,000 BOE/Day
636,000 BOE/Day
+ 13%
Oil & Gas Income
$1.35 Billion
$2.00 Billion
+ 48%
Chemicals Income
$214 Million
$248 Million
+ 16%
We recently announced our financial and operational results for this year’s first quarter.
With the strides we made last year to strengthen our oil and gas and chemical businesses, coupled with continuing robust energy prices and a strong economy, we’re off to another outstanding year in 2006.
This year’s quarterly results compare very favorably to last year’s first quarter results.
While oil and gas income rose by 48 percent, and segment income from our chemical business was 16 percent higher, another very important factor was the 13 percent increase in our oil and gas production.
A production increase of this magnitude within a year by a company our size is a remarkable achievement. It is highly improbable that any of our competitors will come close to matching us.
23

Q1 2005 & 2006 Comparison
Q1 2005
Q1 2006
Change
Net Income
$846 Million
$1.23 Billion
+ 45%
Earnings/Share
$2.11/Share
$2.90/Share
+ 37%
On a consolidated basis, net income compared to last year’s first quarter is up by 45 percent to more than $1.2 billion.
Earnings per share are up by 37 percent to $2.90 per share.
24

Fortune Ranking
Our performance is resulting in additional recognition by the market.
In Fortune magazine’s annual edition profiling America’s 500 largest companies, Oxy was number one among the 21 companies within the mining and oil producing category based on revenues and profits.
25

Business Week Ranking
Criteria
1 & 3 Year
Total Return
Sales Growth
Profit Growth
Profit Margins
Return on Equity
Debt to Capital Ratio
As many of you know, each April, BusinessWeek publishes its annual survey of 50 “Top Performers” among the S&P 500 companies.
BusinessWeek ranks the companies based on one-year and three-year total returns, sales growth and profit growth. Other criteria include profit margins and return on equity, with additional weight given for a company’s debt-to-capital ratio.
26

Business Week Ranking
Based on these criteria, we’re pleased to report that Oxy ranked sixth overall for the second year in a row. Oxy is the ONLY company ranked in the top ten both years - as well as in 3 of the last 5 years.
Furthermore, Oxy is the ONLY oil company ranked in the top ten. Only two of our competitors are ranked in the top 50 – ConocoPhillips at number 31 and Marathon at number 32.
Oxy’s rankings are a testimonial to the guidance provided by our board of directors and the excellent management team we have in place. Institutional Investor Magazine, for example, has ranked Steve Chazen as the top Chief Financial Officer in the oil and gas industry for three consecutive years.
Above all, I want to pay tribute to our employees. Their performance has been exemplary, not only from a financial and operational perspective, but also as demonstrated by their commitment to responsible corporate citizenship.
I would now like to introduce Dr. Larry Meriage, our Vice President of Communications and Public Affairs, who will present our report on social responsibility and corporate governance.
27
28

Portions of this presentation contain forward-looking statements and
involve risks and uncertainties that could materially affect expected
results of operations, liquidity, cash flows and business prospects.
Forward-looking statements are generally accompanied by words
such as “estimate”, “project”, “predict”, “will”, “anticipate”, “plan”,
“intend”, “believe”, “expect” or similar expressions that convey the
uncertainty of future events or outcomes. You should not place
undue reliance on these forward-looking statements. Unless legally
required, Occidental does not undertake any obligation to update
any forward-looking statements, whether as a result of new
information, future events or otherwise.
Certain risks that may affect Occidental’s results of operations and
financial position appear in Part 1, Item 1A of Occidental’s 2005
Annual Report on Form 10-K.
Reconciliations to GAAP are provided at www.oxy.com for
Worldwide Production and Proved Reserves, Profitability, Cash Flow
per BOE, Chemicals Free Cash Flow, and Chemicals Profit Margins
as a Percentage of Sales.
29
Worldwide Production and Proved Reserve
Reconciliation to Generally Accepted Accounting Principles (GAAP)
| | Consolidated Subsidiaries | | Other Interests | | Worldwide |
| MBBL
OIL | MMCF
GAS | BOE | | MBBL
OIL | MMCF
GAS | BOE | | MBBL
OIL | MMCF
GAS | BOE |
PRODUCTION PER DAY | | | | | | | | | | | |
For the Quarter Ended | | | | | | | | | | | |
Quarter 1 - 2006 | 492 | 708 | 610 | | 21 | 28 | 26 | | 513 | 736 | 636 |
Quarter 1 - 2005 | 427 | 662 | 537 | | 24 | 21 | 28 | | 451 | 683 | 565 |
| | | | | | | | | | | | |
| | | | | | | | | | | | |
| | Consolidated Subsidiaries | | Other Interests | | Worldwide |
| MMBBL
OIL | BCF
GAS | BOE | | MMBBL
OIL | BCF
GAS | BOE | | MMBBL
OIL | BCF
GAS | BOE |
PRODUCTION | | | | | | | | | | | |
For the Year Ended | | | | | | | | | | | |
2005 | 158 | 246 | 199 | | 7 | 6 | 8 | | 165 | 252 | 207 |
| | | | | | | | | | | | |
PROVED RESERVES | | | | | | | | | | | |
1996 | 897 | 2,584 | 1,328 | | 39 | 154 | 65 | | 936 | 2,738 | 1,392 |
1997 | 900 | 2,458 | 1,310 | | 77 | 238 | 117 | | 977 | 2,696 | 1,426 |
1998 | 1,066 | 2,149 | 1,424 | | 83 | 187 | 114 | | 1,149 | 2,336 | 1,538 |
1999 | 984 | 1,892 | 1,299 | | 140 | 179 | 170 | | 1,124 | 2,071 | 1,469 |
2000 | 1,758 | 2,210 | 2,126 | | 45 | - | 45 | | 1,803 | 2,210 | 2,171 |
2001 | 1,853 | 2,068 | 2,198 | | 44 | - | 44 | | 1,897 | 2,068 | 2,242 |
2002 | 1,928 | 2,049 | 2,270 | | 42 | - | 42 | | 1,970 | 2,049 | 2,312 |
2003 | 1,990 | 2,585 | 2,421 | | 48 | 9 | 50 | | 2,038 | 2,594 | 2,470 |
2004 | 1,993 | 2,975 | 2,489 | | 43 | - | 43 | | 2,036 | 2,975 | 2,532 |
2005 | 2,082 | 3,478 | 2,662 | | 45 | - | 45 | | 2,127 | 3,478 | 2,707 |
Natural gas volumes have been converted to BOE based on energy content of 6,000 cubic feet of gas to one barrel of oil.
Oil & Gas - Profitability
Reconciliation to Generally Accepted Accounting Principles (GAAP)
For the Year Ended December 31, 2005
($ Millions, Except$/BOE)
| | Consolidated
Subsidiaries | | Other
Interests | | Worldwide |
Revenues | 10,069 | | 286 | | | 10,355 |
Production costs | 1,724 | | 203 | | | 1,927 |
Exploration expenses | 337 | | (2 | ) | | 335 |
Other operating expenses | 495 | | 7 | | | 502 |
DD&A | 1,213 | | 11 | | | 1,224 |
Pre-tax income | 6,300 | | 67 | | | 6,367 |
Income tax expense | 2,338 | | 3 | | | 2,341 |
Results of operations | 3,962 | | 64 | | | 4,026 |
BOE Sales Volumes | | | | | | 207 |
Revenues | | | | | $ | 50.02 |
Production costs | | | | | | 9.31 |
Exploration expenses | | | | | | 1.62 |
Other operating expenses | | | | | | 2.43 |
DD&A | | | | | | 5.91 |
Pre-tax income | | | | | | 30.76 |
Income tax expense | | | | | | 11.31 |
Results of operations | | | | | $ | 19.45 |
Oil & Gas - Cash Flow
Reconciliation to Generally Accepted Accounting Principles (GAAP)
For the Year Ended December 31, 2005
($ Millions, Except$/BOE)
Occidental Petroleum Consolidated Statement of Cash Flows | | | | | 2005 | |
Cash flow from operating activities | | | | | | 5,337 | |
Cash flow from investing activities | | | | | | (3,161 | ) |
Cash flow from financing activities | | | | | | (1,186 | ) |
Change in cash | | | | | | 990 | |
| | Consolidated
Subsidiaries | | Other
Interests | | Worldwide | |
SFAS 69 GAAP Oil & Gas results of operations | 3,962 | | 64 | | | 4,026 | |
Depreciation, depletion & amortization | 1,213 | | 11 | | | 1,224 | |
Exploration expenses | 337 | | (2 | ) | | 335 | |
Capital expenditures (excluding acquisitions) | (2,177 | ) | (13 | ) | | (2,190 | ) |
Cash flow from operations | 3,335 | | 60 | | | 3,395 | |
BOE Sales Volumes | | | | | | 207 | |
Cash flow per BOE | | | | | $ | 16.40 | |
Chemicals Free Cash Flow
Reconciliation to Generally Accepted Accounting Principles (GAAP)
($ Millions)
| | 2001 | 2002 | 2003 | 2004 | 2005 |
Occidental Petroleum Consolidated Statement of Cash Flows | | | | | | | | | | |
Cash flow from operating activities | 2,566 | | 2,100 | | 3,074 | | 3,878 | | 5,337 | |
Cash flow from investing activities | (651 | ) | (1,696 | ) | (2,131 | ) | (2,428 | ) | (3,161 | ) |
Cash flow from financing activities | (1,814 | ) | (456 | ) | (516 | ) | (824 | ) | (1,186 | ) |
Change in cash | 101 | | (52 | ) | 427 | | 626 | | 990 | |
Chemicals Free Cash Flow | | | | | | | | | | |
Segment earnings | (437 | ) | (99 | ) | 223 | | 414 | | 607 | |
Reversal of Petrochemicals | 492 | | 276 | | - | | - | | - | |
Write-off of plants | - | | - | | - | | - | | 159 | |
Hurricane related insurance charges | - | | - | | - | | - | | 11 | |
Others | - | | (2 | ) | 2 | | 1 | | (2 | ) |
Core earnings | 55 | | 175 | | 225 | | 415 | | 775 | |
Depreciation & amortization expense | 181 | | 180 | | 203 | | 243 | | 251 | |
Working capital and other | 53 | | (3 | ) | (3 | ) | 2 | | 2 | |
Capital expenditures (excluding acquisitions) | (109 | ) | (107 | ) | (120 | ) | (155 | ) | (173 | ) |
Free cash flow | 180 | | 245 | | 305 | | 505 | | 855 | |
Chemical - Percent of Sales
Reconciliation to Generally Accepted Accounting Principles (GAAP)
For the Year Ended December 31, 2005
($ Millions, Except % of Sales)
Sales | | | |
Oil and Gas | 10,416 | | |
Chemical | 4,641 | | |
Other | 151 | | |
| | 15,208 | | |
Chemicals | $ AMT | | % of Sales |
Segment income | 607 | | |
Less: significant items affecting earnings | | | |
Hurricane insurance charges | 11 | | |
Write-off of plants | 159 | | |
Core earnings | 777 | | 16.7% |
Worldwide Production and Proved Reserve Additions
Million BOE
Reconciliation to Generally Accepted Accounting Principles (GAAP)
For the Year Ended December 31, 2005
| | Consolidated Subsidiaries | | Other Interests | | Worldwide |
| OIL | GAS | BOE | | OIL | GAS | BOE | | OIL | GAS | BOE |
PRODUCTION BOE/D | | | | | | | | | | | | | | | | | | | | |
United States | 253 | | 553 | | 345 | | | - | | - | | - | | | 253 | | 553 | | 345 | |
Latin America | 78 | | - | | 78 | | | (4 | ) | - | | (4 | ) | | 74 | | - | | 74 | |
Middle East / North Africa | 95 | | 44 | | 102 | | | 1 | | - | | 1 | | | 96 | | 44 | | 103 | |
Other Eastern Hemisphere | 5 | | 77 | | 18 | | | 25 | | 15 | | 28 | | | 30 | | 92 | | 45 | |
Total | 431 | | 674 | | 543 | | | 22 | | 15 | | 25 | | | 453 | | 689 | | 568 | |