EXHIBIT 99.1

June 2, 2006
Dr. Ray R. Irani
Chairman, President & Chief
Executive Officer
Sanford C. Bernstein Co., Inc.
22nd Annual Strategic Decisions
Conference 2006

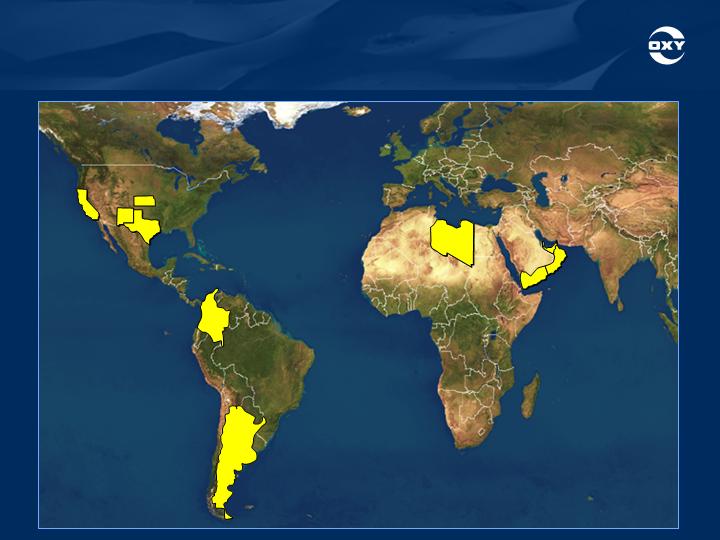
Core Area Growth Projects
Large pipeline of growth projects
U.S.
California & Permian
Latin America
Argentina
Colombia
Middle East & North Africa
Libya
Oman
Qatar
United Arab Emirates
Yemen
2

Ecuador
Oxy filed arbitration claim against the Government
of Ecuador for illegally seizing assets
Claim filed with International Centre for Settlement of
Investment disputes under the U.S.-Ecuador Bilateral
Investment Treaty
Oxy requests the arbitration panel block third party
takeover of assets until claim is settled
3

Ecuador
Impact of expropriation
Net production averaged 44,000 barrels/day in
1st quarter 2006
7% of worldwide production of 636,000 BOE/day
Year-end 2005 proved reserves of 96 million
barrels
3% of proforma worldwide reserves, including
Vintage properties
Net PP&E @ 3/31/06 of about $400 million
2% of worldwide total
4

Ecuador
Since 1999
Oxy’s cash flow from the Block 15 operations
significantly exceeded its investment (net of
the Encana farmout)
Managing Risk
5

Production Growth Profile
Grow oil & gas production
Minimum volume growth of 5
percent
More likely growth of 7 – 10
percent
Maintain top quartile financial
returns
6

Oil & Gas ROCE *
WTI
($/Barrel)
Domestic
Returns
(%)
International
Returns
(%)
2005
56.56
26
40
2004
41.40
20
37
2003
31.03
16
30
2002
26.08
10
35
2001
25.97
17
23
* Net income divided by average capital employed.
7

Return Targets*
New Projects & Acquisitions
Domestic …………………...
15+%
International ……………….
20+%
* Assumes moderate product prices
8

Argentina
2005 production – 37,000
BOE/Day
2006 annualized
production – 41,000
BOE/Day
Inventory of 700 drilling
locations
2006: 145 wells
Ramp up in future years
Increase production to
70,000 BOE/Day by 2011
9
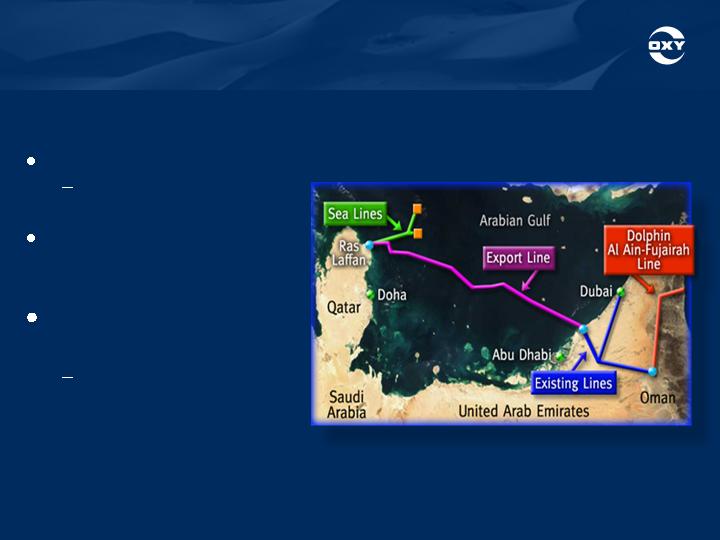
UAE / Qatar – Dolphin Project
Phase I
$4 billion gross capital
Oxy’s share 24.5%
First gas @ year-end
2006
Production ramp-up
in 2007
Estimated year-end
exit rate of 55,000
BOE/Day
10

Oman – Overview
Mukhaizna Overview
Discovered in 1975
2+ billion barrels of heavy oil
Previous peak production -
15,000 barrels/day
Transfer of operatorship
to Oxy & partners
3-4 years of technical work &
negotiation
11

Oman – Mukhaizna Project
Project Overview
Gross Capital – $3.5 Billion
1800+ wells
Central processing facility
Water treatment plant
Steam generation facilities
Pipelines
2006 Work Program
$450 – $500 MM (Gross)
Drill 65 – 85 wells
Initial steam injection
12

Oman – Additional Growth Potential
13

Oxy Libya Holdings
14

Oxy 2006 Exploration Program
35
36
52
59
59
106
124
131
163
15
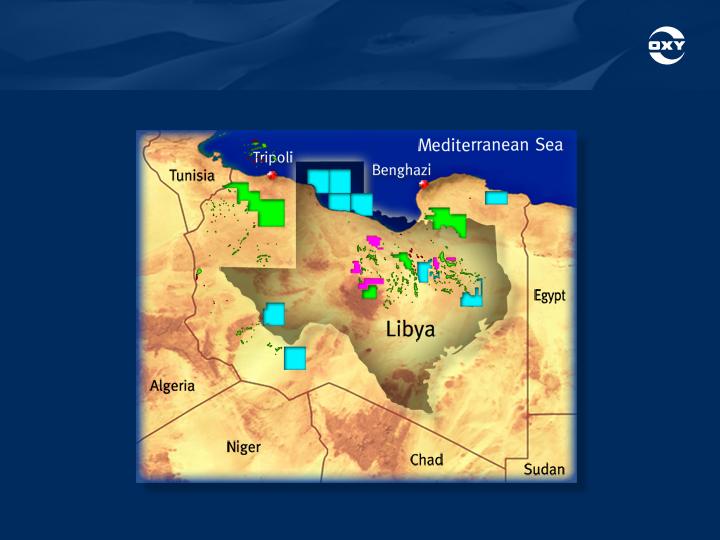
Scope of Oxy Libya Projects
16

Worldwide Production Outlook
Does not depend on exploration success
Does not include future acquisitions
Does not include new EOR/development projects
Does not include swap/sale of mature non-
operated properties
Range reflects timing differences
17

Additional Growth Opportunities
Base Production ………………
New EOR/development projects
Middle East/North Africa ….
Latin America……………....
Exploration …………………….
Domestic acquisitions ………..
Mature non-operated …………
Total ……………………………
665 - 750
50 - 75
20 - 30
20 - 40
35 - 50
(20 - 30)
770 - 915
(Thousand BOE/Day)
Excludes Ecuador.
5.3%-8.5%
9.3%-14.8%
Growth Rate
Production
18

Competitive Advantages
Economies of scale
Infrastructure
Operating experience
Large technical data base
Strong regional relations
19
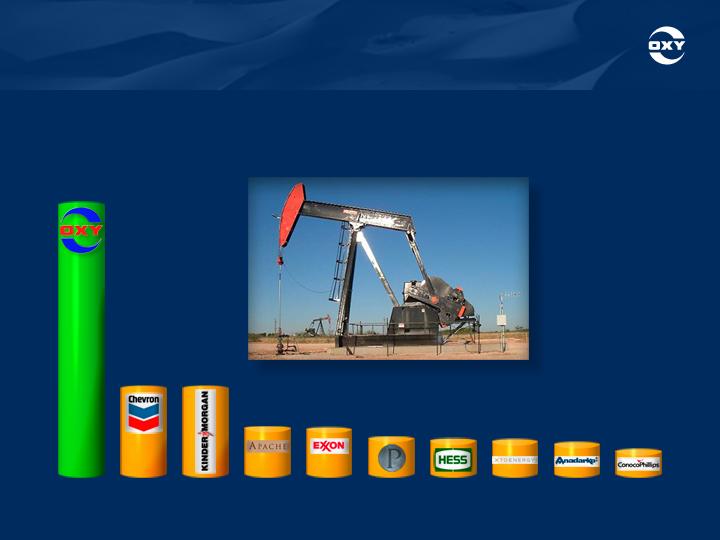
Top 10 Texas Oil Producers
2005 Gross Operated Production
(Thousand Barrels/Day)
174.5
OXY
56.7
CVX
56.5
KMI
30.7
APA
29.6
XOM
23.6
PXD
22.5
HES
21.9
XTO
20.4
APC
15.5
COP
20

Financial Policy
Continue to increase the dividend regularly
Reduce outstanding shares to a pre-Vintage
acquisition level of about 400 million shares
Keep debt levels low & maintain “A” credit
ratings
21

Conclusion - Focus on Key Metrics
Focus on key performance metrics that drive top
quartile financial returns
Continue to improve quality of assets
Grow reserves at a rate exceeding production
Keep finding & development costs low
Optimize profit/BOE
Optimize free cash flow/BOE
Maintain financial discipline
Maintain “A” credit rating
Achieve top quartile returns on equity & capital
employed
Generate top quartile total returns
22


Occidental Petroleum Corporation
Statements in this presentation that contain words such as "will," "expect" or "estimate," or otherwise
relate to the future, are forward-looking and involve risks and uncertainties that could significantly affect
expected results. Factors that could cause results to differ materially include, but are not limited to:
exploration risks such as drilling of unsuccessful wells, global commodity pricing fluctuations and
supply/demand considerations for oil, gas and chemicals; higher than expected costs; political risks;
changes in tax rates; unrealized acquisition benefits or higher than expected integration costs; and not
successfully completing (or any material delay in) any expansion, capital expenditure, acquisition or
disposition. You should not place undue reliance on these forward-looking statements which speak only
as of the date of this presentation. Unless legally required, Occidental does not undertake any obligation
to update any forward-looking statements as a result of new information, future events or otherwise. The
United States Securities and Exchange Commission (SEC) permits oil and natural gas companies, in their
filings with the SEC, to disclose only proved reserves demonstrated by actual production or conclusive
formation tests to be economically producible under existing economic and operating conditions. We use
certain terms in this presentation, such as probable, possible and recoverable reserves and oil in place,
that the SEC's guidelines strictly prohibit us from using in filings with the SEC. Additionally, the SEC
requires oil and natural gas companies, in their filings, to disclose non-financial statistical information
about their consolidated entities separately from such information about their equity holdings and not to
show combined totals. Certain information in this presentation is shown on a combined basis; however,
the information is disclosed separately in the Appendix. U.S investors are urged to consider carefully the
disclosure in our Form 10-K, available through 1-888-699-7383 or at www.oxy.com. You also can obtain a
copy from the SEC by calling 1-800-SEC-0330.
24

Appendix
25
Worldwide Oil & Gas Operations
Long Beach
Permian Basin
Horn Mountain
Hugoton
Elk Hills
Colombia
Libya
Russia
Pakistan
Oman
U.A.E.
Yemen
Qatar
.
.
.
Argentina
26
Return on Equity
Percentage
22
2001
17
2002
21
2003
28
2004
41
2005
28
5-Year
Average
See Appendix for GAAP reconciliation.
27
Return on Capital Employed
Percentage
2001
2002
2003
2004
5 Year
Average
13
11
15
20
33
2005
19
See Appendix for GAAP reconciliation.
28

Reserves Replacement
244
263
368
268
382
339
305
173
188
200
207
194
200
192
Worldwide
Reserve Additions
(Million BOE)
Worldwide
Production
(Million BOE)
2001
2002
2003
2004
2005
3-Year Average
5-Year Average
2005 excludes Ecuador. See Appendix for GAAP reconciliation.
29

Finding & Development Costs
1,171
1,223
1,584
1,785
4,283
2,551
2,009
244
263
368
268
382
339
305
Costs
Incurred
($ Millions)
Reserve
Additions
(Million BOE)
2001
2002
2003
2004
2005
3-Year Average
5-Year Average
2005 excludes Ecuador. See Appendix for GAAP reconciliation.
30

Finding & Development Costs
2005
2004
2003
2002
2001
3-Year Average
5-Year Average
2,103
1,631
1,216
1,031
1,089
1,650
1,414
2,180
154
368
192
82
901
595
4,283
1,785
1,584
1,223
1,171
2,551
2,009
49
91
77
84
93
65
70
Organic
Growth
Acquisitions
Total
Organic
(% Total)
Costs Incurred
($ Million)
382
268
368
263
244
339
305
Total
Reserve
Additions
(Million BOE)
2005 excludes Ecuador.
31
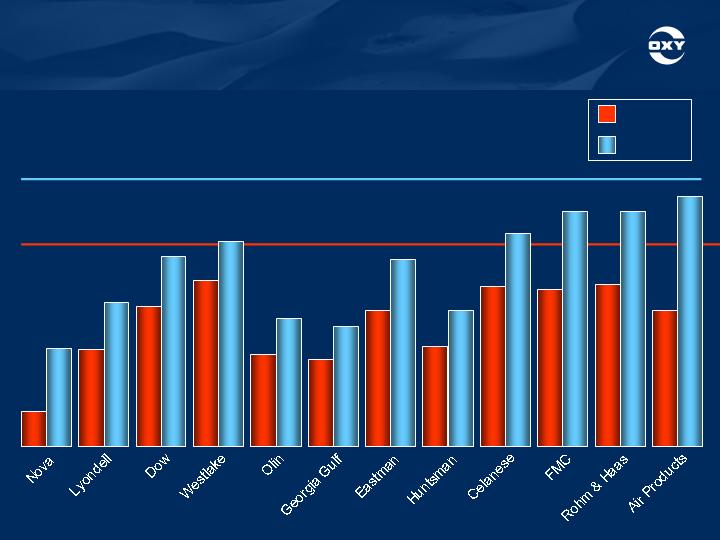
Chemical Companies Comparisons
OxyChem – 16.7
OxyChem – 22.2
8.0
11.6
2.9
14.0
7.6
7.2
8.2
13.9
11.8
13.0
13.4
11.2
EBIT
Percent of Sales
EBITDA
12.0
8.1
11.9
10.6
9.9
20.7
19.4
19.4
15.7
15.5
17.3
18.4
Excludes special items.
32
WORLDWIDE PRODUCTION
Reconciliation to Generally Accepted Accounting Principles (GAAP)
For the Quarter Ended March 31, 2006
| | Per Form 10Q | | Less: Ecuador | | Restated 2006 |
MBOE/D | OIL | GAS | BOE | | OIL | GAS | BOE | | OIL | GAS | BOE |
| | | | | | | | | | | | | | | | | | | | | |
California | 82 | | 250 | | 124 | | | - | | - | | - | | | 82 | | 250 | | 124 | |
Permian | 166 | | 133 | | 187 | | | - | | - | | - | | | 166 | | 133 | | 187 | |
Horn Mountain | 15 | | 10 | | 17 | | | - | | - | | - | | | 15 | | 10 | | 17 | |
Hugoton / Other | 3 | | 189 | | 36 | | | - | | - | | - | | | 3 | | 189 | | 36 | |
Total US | 266 | | 582 | | 363 | | | - | | - | | - | | | 266 | | 582 | | 363 | |
| | | | | | | | | | | | | | | | | | | | | |
Argentina | 24 | | 13 | | 26 | | | - | | - | | - | | | 24 | | 13 | | 26 | |
Bolivia | - | | 13 | | 2 | | | - | | - | | - | | | - | | 13 | | 2 | |
Colombia - 100% | 39 | | - | | 39 | | | - | | - | | - | | | 39 | | - | | 39 | |
Colombia - MI | (5 | ) | - | | (5 | ) | | - | | - | | - | | | (5 | ) | - | | (5 | ) |
Ecuador | 44 | | - | | 44 | | | (44 | ) | - | | (44 | ) | | - | | - | | - | |
Latin America | 102 | | 26 | | 106 | | | (44 | ) | - | | (44 | ) | | 58 | | 26 | | 62 | |
| | | | | | | | | | | | | | | | | | | | | |
Oman | 17 | | 25 | | 21 | | | - | | - | | - | | | 17 | | 25 | | 21 | |
Qatar | 44 | | - | | 44 | | | - | | - | | - | | | 44 | | - | | 44 | |
Libya | 22 | | - | | 22 | | | - | | - | | - | | | 22 | | - | | 22 | |
Yemen | 32 | | - | | 32 | | | - | | - | | - | | | 32 | | - | | 32 | |
Yemen - Comeco | 2 | | - | | 2 | | | - | | - | | - | | | 2 | | - | | 2 | |
Middle East / No Africa | 117 | | 25 | | 121 | | | - | | - | | - | | | 117 | | 25 | | 121 | |
| | | | | | | | | | | | | | | | | | | | | |
Pakistan | 4 | | 75 | | 17 | | | - | | - | | - | | | 4 | | 75 | | 17 | |
Vanyoganneft | 24 | | 28 | | 29 | | | - | | - | | - | | | 24 | | 28 | | 29 | |
Other Eastern | 28 | | 103 | | 45 | | | - | | - | | - | | | 28 | | 103 | | 45 | |
| | | | | | | | | | | | | | | | | | | | | |
Total International | | | | | 273 | | | | | | | (44 | ) | | | | | | 229 | |
| | | | | | | | | | | | | | | | | | | | | |
Worldwide | 513 | | 736 | | 636 | | | (44 | ) | - | | (44 | ) | | 469 | | 736 | | 592 | |
| | | | | | | | | | | | | | | | | | | | | |
Percentage of Total | | | | | | | | 7% | | | | | | | | | | | | |
Pro-forma Oil and Gas Net Proved Developed and Undeveloped Year-End Reserves
Reconciliation to Generally Accepted Accounting Principles (GAAP)
2005 Barrels of Oil Equivalent Basis ¹
| | OXY Annual Rpt | Less: Ecuador | OXY Restated | VPI Rounded | Total |
United States | | | | | | |
California - OXY | 659 | - | | 659 | - | 659 |
California - VPI | - | - | | - | 67 | 67 |
Permian | 1,211 | - | | 1,211 | - | 1,211 |
Other Domestic | 156 | - | | 156 | - | 156 |
Other Domestic - VPI (Keeper) | - | - | | - | 2 | 2 |
Total Domestic | 2,026 | - | | 2,026 | 69 | 2,095 |
| | | | | | | |
Latin America | | | | | | |
Argentina - VPI | - | - | | - | 219 | 219 |
Bolivia - VPI | - | - | | - | 51 | 51 |
Colombia | 43 | - | | 43 | - | 43 |
Colombia - minority interest | - | - | | - | - | - |
Ecuador | 96 | (96 | ) | - | - | - |
| | 139 | (96 | ) | 43 | 270 | 313 |
Middle East and North Africa | | | | | | |
Oman | 44 | - | | 44 | - | 44 |
Qatar | 396 | - | | 396 | - | 396 |
Yemen | 35 | - | | 35 | - | 35 |
Yemen - Oxy net interest | - | - | | - | - | - |
Yemen - VPI | - | - | | - | 5 | 5 |
United Arab Emirates | - | - | | - | - | - |
| | 475 | - | | 475 | 5 | 480 |
Other Eastern Hemisphere | | | | | | |
Pakistan | 19 | - | | 19 | - | 19 |
Russia - Oxy net interest | 48 | - | | 48 | - | 48 |
| | 67 | - | | 67 | - | 67 |
| | | | | | | |
Total International | 681 | (96 | ) | 585 | 275 | 860 |
Total Worldwide - Continuing Ops | 2,707 | (96 | ) | 2,611 | 344 | 2,955 |
VPI - Divestiture Assets | - | - | | - | 72 | - |
| | 2,707 | (96 | ) | 2,611 | 416 | 2,955 |
¹ Gas volumes converted at 6,000 cubic feet per barrel of oil.
Return on Capital Employed (ROCE)
($ Millions)
Reconciliation to Generally Accepted Accounting Principles (GAAP) | 2001 | 2002 | 2003 | 2004 | 2005 | | 5 Year Average |
GAAP measure - earnings applicable | 1,154 | | 989 | | 1,527 | | 2,568 | | 5,281 | | | 2,304 | |
to common shareholders | | | | | | | | | | | | | |
Interest expense | 392 | | 281 | | 295 | | 239 | | 201 | | | 282 | |
Tax effect of interest expense | (137 | ) | (98 | ) | (103 | ) | (84 | ) | (70 | ) | | (98 | ) |
Earnings before tax-effected interest expense | 1,409 | | 1,172 | | 1,719 | | 2,723 | | 5,412 | | | 2,487 | |
| | | | | | | | | | | | | |
GAAP average stockholders' equity | 5,634 | | 6,318 | | 7,929 | | 10,550 | | 15,032 | | | 8,373 | |
| | | | | | | | | | | | | |
Average Debt | | | | | | | | | | | | | |
GAAP debt | | | | | | | | | | | | | |
Notes payable | 54 | | - | | - | | - | | - | | | 9 | |
Non-recourse debt | - | | - | | - | | - | | - | | | 317 | |
Debt, including current maturities | 4,065 | | 4,203 | | 4,016 | | 3,804 | | 2,919 | | | 3,758 | |
Non-GAAP debt | | | | | | | | | | | | | |
Capital lease obligation | 26 | | 26 | | 26 | | 26 | | 25 | | | 26 | |
Subsidiary preferred stock | - | | 75 | | 75 | | 75 | | 75 | | | 50 | |
Gas sales agreements | 282 | | - | | - | | - | | - | | | 116 | |
Trust preferred securities | 463 | | 455 | | 453 | | - | | - | | | 307 | |
Average total debt | 4,890 | | 4,759 | | 4,570 | | 3,905 | | 3,019 | | | 4,583 | |
| | | | | | | | | | | | | |
Total average capital employed | 10,524 | | 11,077 | | 12,499 | | 14,455 | | 18,051 | | | 12,956 | |
| | | | | | | | | | | | | |
ROCE | 13.0 | | 10.9 | | 14.6 | | 20.2 | | 33.3 | | | 19.2 | |
Worldwide Production and Proved Reserve Additions
Million BOE
Reconciliation to Generally Accepted Accounting Principles (GAAP)
| Consolidated Subsidiaries | | Other Interests | | Worldwide |
| OIL | GAS | BOE | | OIL | GAS | BOE | | OIL | GAS | BOE |
PRODUCTION | | | | | | | | | | | | |
2001 | 124 | 241 | 164 | | 9 | - | | 9 | | 133 | 241 | 173 |
2002 | 142 | 229 | 180 | | 8 | - | | 8 | | 150 | 229 | 188 |
2003 | 153 | 221 | 190 | | 10 | - | | 10 | | 163 | 221 | 200 |
2004 | 159 | 233 | 198 | | 9 | - | | 9 | | 168 | 233 | 207 |
2005 (see restatement below) | 145 | 246 | 186 | | 7 | 6 | | 8 | | 152 | 252 | 194 |
Three-Year (2003 - 2005) Average | 152 | 233 | 191 | | 9 | 2 | | 9 | | 161 | 235 | 200 |
Five-Year (2001 - 2005) Average | 145 | 234 | 184 | | 9 | 1 | | 9 | | 153 | 235 | 192 |
| | | | | | | | | | | | |
Proved Reserve Additions | | | | | | | | | | | | |
2000 | 1,041 | 777 | 1,170 | | - | - | | - | | 1,041 | 777 | 1,170 |
2001 | 219 | 100 | 236 | | 8 | - | | 8 | | 227 | 100 | 244 |
2002 | 221 | 216 | 257 | | 6 | - | | 6 | | 227 | 216 | 263 |
2003 | 223 | 766 | 351 | | 16 | 9 | | 18 | | 239 | 775 | 368 |
2004 | 162 | 624 | 266 | | 4 | (9 | ) | 2 | | 166 | 615 | 268 |
2005 (see restatement below) | 247 | 752 | 372 | | 9 | 6 | | 10 | | 256 | 758 | 382 |
Three-Year (2003 - 2005) Average | 211 | 714 | 330 | | 10 | 2 | | 10 | | 220 | 716 | 339 |
Five-Year (2001 - 2005) Average | 214 | 492 | 296 | | 9 | 1 | | 9 | | 223 | 493 | 305 |
Note: 2005 has been restated to exclude Ecuador as follows:
PRODUCTION | | | | | | | | | | | | | | | |
2005 - per annual report | 158 | | 246 | 199 | | | 7 | 6 | 8 | | 165 | | 252 | 207 | |
Less: Ecuador | (13 | ) | - | (13 | ) | | - | - | - | | (13 | ) | - | (13 | ) |
2005 - restated | 145 | | 246 | 186 | | | 7 | 6 | 8 | | 152 | | 252 | 194 | |
| | | | | | | | | | | | | | | |
Proved Reserve Additions | | | | | | | | | | | | | | | |
2005 - per annual report | 255 | | 752 | 380 | | | 9 | 6 | 10 | | 264 | | 758 | 390 | |
Less: Ecuador | (8 | ) | - | (8 | ) | | - | - | - | | (8 | ) | - | (8 | ) |
2005 - restated | 247 | | 752 | 372 | | | 9 | 6 | 10 | | 256 | | 758 | 382 | |
Sources of Worldwide Proved Reserve Additions
Million BOE
Reconciliation to Generally Accepted Accounting Principles (GAAP)
| Consolidated Subsidiaries | | Other Interests | | Worldwide |
| OIL | GAS | BOE | | OIL | GAS | BOE | | OIL | GAS | BOE |
Three Year (2001-2005) Average | 211 | | 714 | | 330 | | | 10 | | 2 | | 10 | | | 220 | | 716 | | 339 | |
| | | | | | | | | | | | | | | | | | | | |
Five Year (2001-2005) Average | 214 | | 492 | | 296 | | | 9 | | 1 | | 9 | | | 223 | | 493 | | 305 | |
| | | | | | | | | | | | | | | | | | | | |
2005 | | | | | | | | | | | | | | | | | | | | |
Revisions | (18 | ) | 30 | | (13 | ) | | 8 | | 6 | | 9 | | | (10 | ) | 36 | | (4 | ) |
Improved Recovery | 107 | | 131 | | 129 | | | - | | - | | - | | | 107 | | 131 | | 129 | |
Extensions and Discoveries | 46 | | 427 | | 117 | | | 1 | | - | | 1 | | | 47 | | 427 | | 118 | |
Purchases | 112 | | 164 | | 139 | | | - | | - | | - | | | 112 | | 164 | | 139 | |
| 247 | | 752 | | 372 | | | 9 | | 6 | | 10 | | | 256 | | 758 | | 382 | |
| | | | | | | | | | | | | | | | | | | | |
2004 | | | | | | | | | | | | | | | | | | | | |
Revisions | 5 | | 241 | | 45 | | | 5 | | (9 | ) | 3 | | | 10 | | 232 | | 48 | |
Improved Recovery | 88 | | 185 | | 120 | | | 1 | | - | | 1 | | | 89 | | 185 | | 121 | |
Extensions and Discoveries | 30 | | 191 | | 61 | | | 2 | | - | | 2 | | | 32 | | 191 | | 63 | |
Purchases | 39 | | 7 | | 40 | | | (4 | ) | - | | (4 | ) | | 35 | | 7 | | 36 | |
| 162 | | 624 | | 266 | | | 4 | | (9 | ) | 2 | | | 166 | | 615 | | 268 | |
| | | | | | | | | | | | | | | | | | | | |
2003 | | | | | | | | | | | | | | | | | | | | |
Revisions | (1 | ) | 44 | | 6 | | | 6 | | - | | 6 | | | 5 | | 44 | | 12 | |
Improved Recovery | 85 | | 70 | | 97 | | | 4 | | 9 | | 6 | | | 89 | | 79 | | 102 | |
Extensions and Discoveries | 41 | | 597 | | 141 | | | 6 | | - | | 6 | | | 47 | | 597 | | 147 | |
Purchases | 98 | | 55 | | 107 | | | - | | - | | - | | | 98 | | 55 | | 107 | |
| 223 | | 766 | | 351 | | | 16 | | 9 | | 18 | | | 239 | | 775 | | 368 | |
| | | | | | | | | | | | | | | | | | | | |
2002 | | | | | | | | | | | | | | | | | | | | |
Revisions | 13 | | (54 | ) | 4 | | | (1 | ) | - | | (1 | ) | | 12 | | (54 | ) | 3 | |
Improved Recovery | 112 | | 151 | | 137 | | | 5 | | - | | 5 | | | 117 | | 151 | | 142 | |
Extensions and Discoveries | 40 | | 60 | | 50 | | | - | | - | | - | | | 40 | | 60 | | 50 | |
Purchases | 56 | | 59 | | 66 | | | 2 | | - | | 2 | | | 58 | | 59 | | 68 | |
| 221 | | 216 | | 257 | | | 6 | | - | | 6 | | | 227 | | 216 | | 263 | |
| | | | | | | | | | | | | | | | | | | | |
2001 | | | | | | | | | | | | | | | | | | | | |
Revisions | 21 | | (49 | ) | 13 | | | 8 | | - | | 8 | | | 29 | | (49 | ) | 21 | |
Improved Recovery | 139 | | 23 | | 143 | | | - | | - | | - | | | 139 | | 23 | | 143 | |
Extensions and Discoveries | 56 | | 122 | | 76 | | | - | | - | | - | | | 56 | | 122 | | 76 | |
Purchases | 3 | | 4 | | 4 | | | - | | - | | - | | | 3 | | 4 | | 4 | |
| 219 | | 100 | | 236 | | | 8 | | - | | 8 | | | 227 | | 100 | | 244 | |
Note: 2005 has been restated to exclude Ecuador as follows:
2005 - Per Annual Report | | | | | | | | | | | | | | | | | | | | |
Revisions | (26 | ) | 30 | | (21 | ) | | 8 | | 6 | | 9 | | | (18 | ) | 36 | | (12 | ) |
Improved Recovery | 117 | | 131 | | 139 | | | - | | - | | - | | | 117 | | 131 | | 139 | |
Extensions and Discoveries | 52 | | 427 | | 123 | | | 1 | | - | | 1 | | | 53 | | 427 | | 124 | |
Purchases | 112 | | 164 | | 139 | | | - | | - | | - | | | 112 | | 164 | | 139 | |
| 255 | | 752 | | 380 | | | 9 | | 6 | | 10 | | | 264 | | 758 | | 390 | |
| | | | | | | | | | | | | | | | | | | | |
Less: Ecuador | | | | | | | | | | | | | | | | | | | | |
Revisions | 8 | | - | | 8 | | | - | | - | | - | | | 8 | | - | | 8 | |
Improved Recovery | (10 | ) | - | | (10 | ) | | - | | - | | - | | | (10 | ) | - | | (10 | ) |
Extensions and Discoveries | (6 | ) | - | | (6 | ) | | - | | - | | - | | | (6 | ) | - | | (6 | ) |
Purchases | - | | - | | - | | | - | | - | | - | | | - | | - | | - | |
| (8 | ) | - | | (8 | ) | | - | | - | | - | | | (8 | ) | - | | (8 | ) |
| | | | | | | | | | | | | | | | | | | | |
2005 - Restated | | | | | | | | | | | | | | | | | | | | |
Revisions | (18 | ) | 30 | | (13 | ) | | 8 | | 6 | | 9 | | | (10 | ) | 36 | | (4 | ) |
Improved Recovery | 107 | | 131 | | 129 | | | - | | - | | - | | | 107 | | 131 | | 129 | |
Extensions and Discoveries | 46 | | 427 | | 117 | | | 1 | | - | | 1 | | | 47 | | 427 | | 118 | |
Purchases | 112 | | 164 | | 139 | | | - | | - | | - | | | 112 | | 164 | | 139 | |
| 247 | | 752 | | 372 | | | 9 | | 6 | | 10 | | | 256 | | 758 | | 382 | |
Costs Incurred
Million BOE
Reconciliation to Generally Accepted Accounting Principles (GAAP)
| Consolidated Subsidiaries | Other Interests | Worldwide | | Consolidated Subsidiaries | Other Interests | Worldwide |
Three Year (2003-2005) Average | 2,544 | 7 | | 2,551 | | | | | |
| | | | | | | | | |
Five Year (2001-2005) Average | 2,003 | 7 | | 2,009 | | | | | |
| | | | | | | | | |
Property acquisition costs | 2005 | | 2004 |
Proved properties | 1,782 | - | | 1,782 | | 158 | (12 | ) | 146 |
Unproved properties | 398 | - | | 398 | | 8 | - | | 8 |
Exploration costs | 245 | (2 | ) | 243 | | 158 | - | | 158 |
Development costs | 1,833 | 15 | | 1,848 | | 1,438 | 11 | | 1,449 |
Asset retirement costs | 12 | - | | 12 | | 25 | (1 | ) | 24 |
Costs incurred | 4,270 | 13 | | 4,283 | | 1,787 | (2 | ) | 1,785 |
| | | | | | | | | |
| | | | | | | | | |
Property acquisition costs | 2003 | | 2002 |
Proved properties | 364 | - | | 364 | | 163 | - | | 163 |
Unproved properties | 4 | - | | 4 | | 29 | - | | 29 |
Exploration costs | 98 | (1 | ) | 97 | | 134 | - | | 134 |
Development costs | 1,097 | 10 | | 1,107 | | 890 | 7 | | 897 |
Asset retirement costs | 12 | - | | 12 | | - | - | | - |
Costs incurred | 1,575 | 9 | | 1,584 | | 1,216 | 7 | | 1,223 |
| | | | | | | | | |
| | | | | | | | | |
Property acquisition costs | 2001 | | | | | |
Proved properties | 29 | - | | 29 | | | | | |
Unproved properties | 53 | - | | 53 | | | | | |
Exploration costs | 176 | (5 | ) | 171 | | | | | |
Development costs | 907 | 11 | | 918 | | | | | |
Asset retirement costs | - | - | | - | | | | | |
Costs incurred | 1,165 | 6 | | 1,171 | | | | | |
Note: 2005 has been restated to exclude Ecuador as follows:
2005 - Per Annual Report | | | | | | | | | |
Property acquisition costs | | | | | | | | | |
Proved properties | 1,782 | | - | | 1,782 | | | | |
Unproved properties | 398 | | - | | 398 | | | | |
Exploration costs | 257 | | (2 | ) | 255 | | | | |
Development costs | 1,920 | | 15 | | 1,935 | | | | |
Asset retirement costs | 12 | | - | | 12 | | | | |
Costs incurred | 4,369 | | 13 | | 4,382 | | | | |
| | | | | | | | | |
Less - Ecuador | | | | | | | | | |
Property acquisition costs | | | | | | | | | |
Proved properties | - | | - | | - | | | | |
Unproved properties | - | | - | | - | | | | |
Exploration costs | (12 | ) | - | | (12 | ) | | | |
Development costs | (87 | ) | - | | (87 | ) | | | |
Asset retirement costs | - | | - | | - | | | | |
Costs incurred | (99 | ) | - | | (99 | ) | | | |
| | | | | | | | | |
2005 - Restated | | | | | | | | | |
Property acquisition costs | | | | | | | | | |
Proved properties | 1,782 | | - | | 1,782 | | | | |
Unproved properties | 398 | | - | | 398 | | | | |
Exploration costs | 245 | | (2 | ) | 243 | | | | |
Development costs | 1,833 | | 15 | | 1,848 | | | | |
Asset retirement costs | 12 | | - | | 12 | | | | |
Costs incurred | 4,270 | | 13 | | 4,283 | | | | |
| | | | | | | | | |
Finding & Development Costs
Reconciliation to Generally Accepted Accounting Principles (GAAP)
| | | | | | Total |
| Costs Incurred ($ Millions) | | Reserve |
| Organic | | | Organic | | Additions |
| Growth | Acquisitions | Total | (% Total) | | (million boe) |
Three Year (2003-2005) Average | 1,650 | 901 | 2,551 | 65% | | 339 |
| | | | | | |
Five Year (2001-2005) Average | 1,414 | 595 | 2,009 | 70% | | 305 |
| | | | | | |
2005 | 2,103 | 2,180 | 4,283 | 49% | | 382 |
2004 | 1,631 | 154 | 1,785 | 91% | | 268 |
2003 | 1,216 | 368 | 1,584 | 77% | | 368 |
2002 | 1,031 | 192 | 1,223 | 84% | | 263 |
2001 | 1,089 | 82 | 1,171 | 93% | | 244 |
See detail of costs incurred and reserve additions by category in the GAAP reconciliations for costs incurred and source of worldwide reserve additions.
Note: 2005 has been restated to exclude Ecuador as follows:
2005 - Per Annual Report | 2,202 | | 2,180 | 4,382 | | 50% | | 390 | |
Less - Ecuador | (99 | ) | - | (99 | ) | | | (8 | ) |
2005 - Restated | 2,103 | | 2,180 | 4,283 | | 49% | | 382 | |
| | | | | | | | | |
Chemical - Percent of Sales
Reconciliation to Generally Accepted Accounting Principles (GAAP)
For the Year Ended December 31, 2005
Sales | | | |
Oil and Gas | 10,416 | | |
Chemical | 4,641 | | |
Other | 151 | | |
| 15,208 | | |
| | | |
Chemicals | $ AMT | | % of Sales |
Segment income | 607 | | |
Less: significant items affecting earnings | | | |
Hurricane insurance charges | 11 | | |
Write-off of plants | 159 | | |
Core earnings - EBIT | 777 | | 16.7% |
DD&A expense | 251 | | |
EBITDA | 1,028 | | 22.2% |