EXHIBIT 99.4
Second Quarter 2007
Earnings Conference Call
July 24, 2007
1

Second Quarter 2007 Earnings - Highlights
Reported Net Income - $1.412 Billion
Reported EPS $1.68 (diluted)
Reported Net Income includes:
$419 mm A-T gains ($0.50 per diluted share) from sale of
non-core assets:
$181 mm from sale of 18.6 mm shares of Lyondell (remaining
2.4 mm shares were sold in early July).
$116 mm from sale of Pakistan assets.
$107 mm from swap of Horn Mountain assets with BP.
$15 mm from sale of domestic mineral interests.
$44 mm A-T income ($0.06 per share) from Pakistan & Horn
Mountain operations, and other.
Pakistan and Horn Mountain will be reported as
discontinued operations in 2Q07 SEC 10Q filing.
All prior periods will be adjusted for the swap of Horn Mountain and
sale of Pakistan.
2
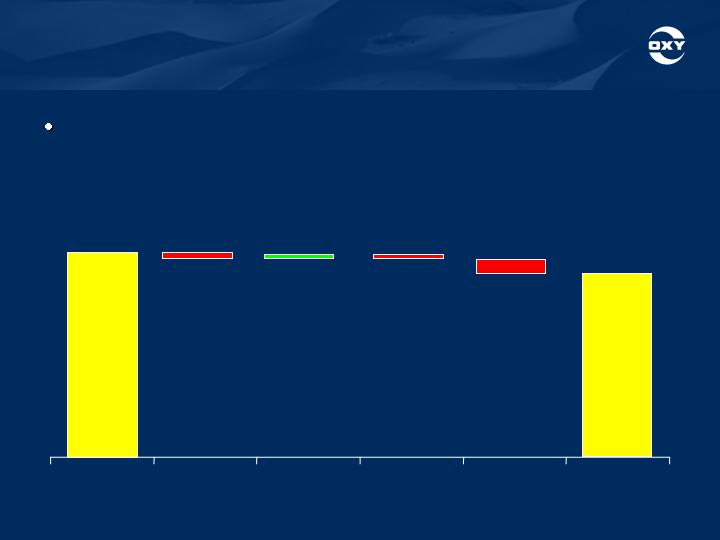
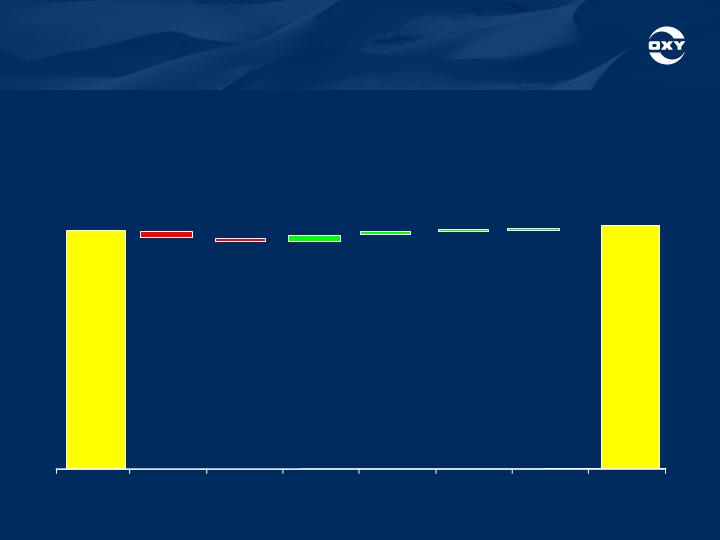
Second Quarter 2007 Earnings - Oil & Gas
Segment Variance Analysis - 2Q07 vs. 2Q06
Results for 2Q07 of $1.656 Billion
- 11% year-over-year
($ in millions)
$1,857
2Q 06
$66
Sales Price
$45
Sales
Volume/Mix
$43
Exploration
Expense
$137
All Others*
$1,656
2Q 07
*All Others includes: DD&A increase ($46 mm), Operating and overhead cost increase ($37 mm), Russia 2006 income ($19 mm), and other.
3

Second Quarter 2007 Earnings –
Oil & Gas Segment
2Q07
2Q06
Reported Segment Earnings ($ mm)
*$1,682
$1,857
WTI Oil Price ($/bbl)
$65.05
$70.70
NYMEX Gas Price ($/mcf)
$7.56
$7.26
Oxy’s Realized Prices
Worldwide Oil ($/bbl)
$59.11
$61.66
US Natural Gas ($/mcf)
$7.07
$6.23
*Includes gain from sale of domestic mineral interests ($23 mm) and litigation settlements ($3 mm).
4

Second Quarter 2007 Earnings –
Oil & Gas Segment
2Q07
2Q06
Oil and Gas Production (mboe/day)
583
609
- 4% year-over-year
Production for both quarters includes volumes
of Horn Mountain & Pakistan.
Oil and Gas Production (mboe/day)
558
551
(Excluding Horn Mountain, Pakistan, and Russia)
+ 1% year-over-year
Production lower than earlier guidance due to:
Higher oil prices lowered PSC volumes by 3 mboe/day.
Weather-related downtime in Permian.
Processing plant maintenance in Libya.
5

Second Quarter 2007 Earnings –
Oil & Gas Segment
2Q07
2Q06
Exploration Expense ($ mm)
$93
$50
Increase came from
Middle East/North Africa.
Oil and Gas operating costs were $12.30 per boe in 1H07
vs. $11.70 per boe in 2006.
Increase due to higher field operating and maintenance expenses.
6
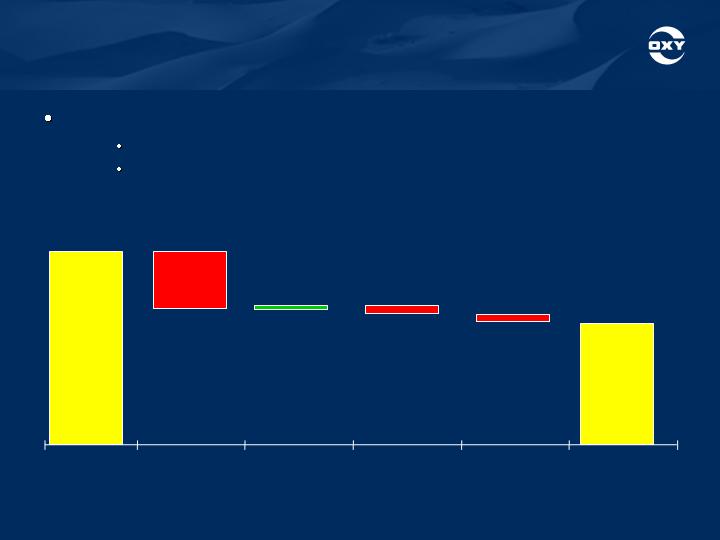
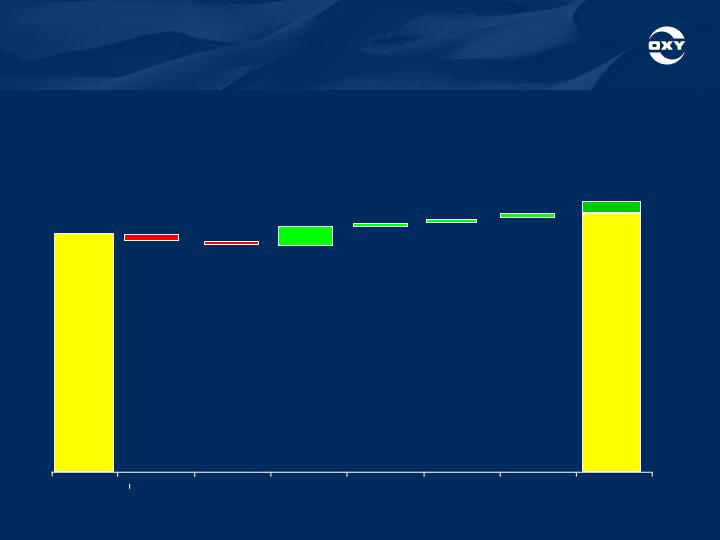
Second Quarter 2007 Earnings – Chemical
Segment Variance Analysis - 2Q07 vs. 2Q06
Earnings for 2Q07 of $158 Million
- 37% year-over-year, and in line with previous guidance.
Primary factor accounting for quarter-to-quarter difference was
lower chloro-vinyl margins.
($ in millions)
$251
2Q 06
$73
Sales Price
$5
Sales
Volume/Mix
$11
Operations/
Manufacturing
$14
All Others
$158
2Q 07
7

Second Quarter 2007 Earnings –
Six Months Results
YTD2007
YTD2006
Net Income ($ mm)
$2,624
$2,091
EPS (diluted)
$3.11
$2.42
2007 results include:
2Q07 asset sales gains
$412 mm A-T gain from sale of Russian investment
$112 mm A-T gain for litigation settlements
$107 mm A-T charge for cash tender of debt
$30 mm A-T provision for plant closure
Oil and Gas production (mboe/day)
587
601
Oil and Gas production (mboe/day)
559
542
(ex- Russia, Pakistan, Horn Mountain)
+3% year-over-year
8

Second Quarter 2007 Earnings –
Six Months Results
YTD2007
YTD2006
Capital Spending ($ mm)
$1,630
$1,230
Net Interest Expense ($ mm)
$8
$62
Cash Flow from Operations ($ mm)
$2,900
$3,100
ROE*
26%
24%
ROCE*
24%
21%
* Annualized (see attached Excel file for GAAP reconciliation)
9
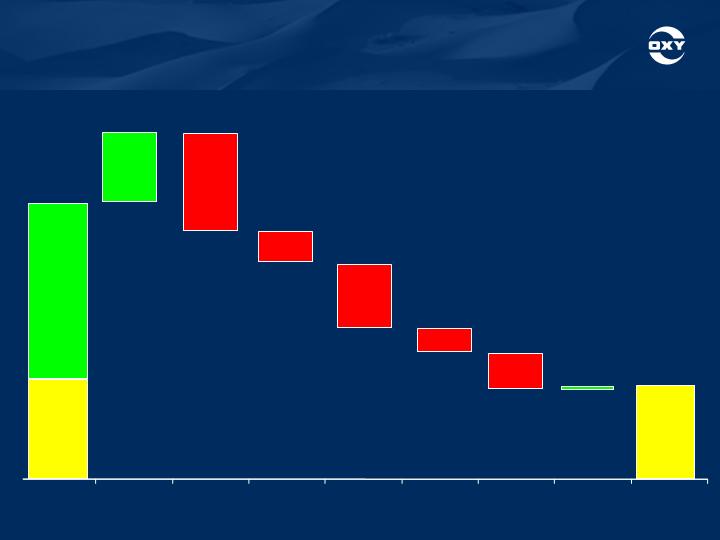
Second Quarter 2007 Earnings –
Cash Flow YTD2007
($ in millions)
$4,480
Cash
Flow From
Operations
$2,900
Beginning
Cash
$1,580
Available
Cash
$1,140
Asset Sale
Proceeds
$1,600
Capex
$500
Acquisitions
$1,100
Debt
Reduction
$370
Dividends
$550
Share
Repurchase
$5
Other
$1,505
Ending Cash
Balance
10

Second Quarter 2007 Earnings –
Share Repurchase
Spent $550 million to repurchase 11.2 million shares
YTD 2007 at an average price of $49.84 a share.
15 million shares remain under the current 55 million
share repurchase authorization.
Shares Outstanding (mm)
YTD07
6/30/07
Weighted Average Basic
839.3
Weighted Average Diluted
843.2
Basic Shares Outstanding
835.1
Diluted Shares Outstanding
839.0
11

Second Quarter 2007 Earnings - 3Q07 Outlook
We expect 3Q07 Oil and Gas production of 585 to 590
mboe/day.
Increase vs. 2Q07 includes:
17 mboe/day from Dolphin.
7 mboe/day from the Permian assets acquired in the BP swap.
4 mboe/day from the announced acquisition of Qatar assets from Anadarko.
Sale of Pakistan and swap of Horn Mountain will reduce 3Q07
production by 25 mboe/day compared to 2Q07.
Dolphin expected pre-tax income contribution of $10 million in 3Q07
(including start-up gas sales and pipeline tariff volumes).
3Q07 will include Dolphin start-up expenses and full operating costs
(including interest on the pipeline operations which was capitalized
during construction).
12
Second Quarter 2007 Earnings –
3Q07 Production Outlook
(mboe/day)
583
2Q07
Production
16
Pakistan
Sold
9
Horn Mountain
Swap
17
Dolphin
7
Permian
Acquisition
4
Qatar
Acquisition
1
Other
587
3Q07
Production
13

Second Quarter 2007 Earnings –
2007 Production Outlook
We expect Oil and Gas production 2007 year-end exit
rate of 630 to 650 mboe/day.
Increase vs. 2Q07 includes:
47 to 65 mboe/day from Dolphin.
7 mboe/day from the Permian assets acquired in the BP
swap.
6 mboe/day from the announced acquisition of Qatar assets
from Anadarko.
14
Second Quarter 2007 Earnings –
2007 Production Outlook
(mboe/day)
583
2Q07
Production
16
Pakistan
Sold
9
Horn Mountain
Swap
47 - - 65
Dolphin
7
Permian
Acquisition
6
Qatar
Acquisition
12
Growth
650
630
2007
Production
Exit Rate
Dolphin
Variance
15

Second Quarter 2007 Earnings - 3Q07 Outlook
Commodity Price Sensitivity
A $1.00 per barrel change in oil prices impacts oil and gas quarterly
earnings by about $40 million (pre-tax).
A change of 50-cents per million BTUs in gas prices has a $24
million impact on quarterly earnings (pre-tax). The NYMEX gas
price for 2Q07 was $7.56 per mcf.
Exploration expense of about $95 million for seismic and
drilling for our Libya and South American programs.
16

Second Quarter 2007 Earnings - 3Q07 Outlook
We expect 3Q07 Chemical earnings to be in the range of
$160 to $175 million compared to $158 million in 2Q07.
Interest expense of about $12 million in 3Q07.
The increase vs. 2Q07 reflects the loss of capitalized interest
on the Dolphin Project.
Expect our worldwide tax rate in 3Q07 to increase to
about 47 percent, due to increases in foreign exploration.
17

Second Quarter 2007 Earnings
See the investor relations supplemental schedules for the reconciliation of non-
GAAP items. Statements in this presentation that contain words such as "will",
"expect" or "estimate", or otherwise relate to the future, are forward-looking and
involve risks and uncertainties that could materially affect expected
results. Factors that could cause results to differ materially include, but are not
limited to: exploration risks, such as drilling of unsuccessful wells; global
commodity pricing fluctuations and supply/demand considerations for oil, gas
and chemicals; higher-than-expected costs; political risk; and not successfully
completing (or any material delay in) any expansion, capital expenditure,
acquisition, or disposition. You should not place undue reliance on these
forward-looking statements which speak only as of the date of this presentation.
Unless legally required, Occidental disclaims any obligation to update any
forward-looking statements as a result of new information, future events or
otherwise. U.S. investors are urged to consider carefully the disclosure in our
Form 10-K, available through the following toll-free telephone number, 1-888-
OXYPETE (1-888-699-7383) or on the Internet at http://www.oxy.com . You also
can obtain a copy from the SEC by calling 1-800-SEC-0330.
17
Occidental Petroleum Corporation |
|
|
|
|
|
|
|
Return on Capital Employed (% ) |
|
|
|
|
|
|
|
($ Millions) |
|
| Six |
|
|
| |
|
|
| Months |
| Annualized | ||
Reconciliation to Generally Accepted Accounting Principles (GAAP) | 2006 | 2007 |
| 2007 | |||
GAAP measure - earnings applicable to common shareholders | 4,191 |
| 2,624 |
|
|
|
|
Interest expense | 131 |
| 175 |
|
|
|
|
Tax effect of interest expense | (46 | ) | (61 | ) |
|
|
|
Earnings before tax-effected interest expense | 4,276 |
| 2,738 |
|
|
|
|
GAAP stockholders' equity | 19,252 |
| 21,111 |
|
|
|
|
DEBT |
|
|
|
|
|
|
|
GAAP debt |
|
|
|
|
|
|
|
Debt, including current maturities | 2,790 |
| 1,880 |
|
|
|
|
Non-GAAP debt |
|
|
|
|
|
|
|
Capital lease obligation | 25 |
| 25 |
|
|
|
|
Subsidiary preferred stock | 75 |
| 75 |
|
|
|
|
Total debt | 2,890 |
| 1,980 |
|
|
|
|
Total capital employed | 22,142 |
| 23,091 |
|
|
|
|
Return on Capital Employed (%) | 21.2 |
| 12.1 |
|
| 24.2 | |