EXHIBIT 99.4
Third Quarter 2007
Earnings Conference Call
October 24, 2007
1
Third Quarter 2007 Earnings – Highlights
Reported Net Income - $1.324 Billion
+ 13% year-over-year
Reported EPS $1.58 (diluted)
Core Earnings - $1.210 Billion
+ 10% year-over-year
Core EPS $1.45 (diluted); + 13% year-over-year
Reported Net Income includes
$106 mm A-T gains from the sale of non-core assets:
$72 mm from sale of West Africa exploration properties (net of
asset impairments);
$27 mm from the sale of remaining 2.4 mm Lyondell shares;
$7 mm from sale of domestic oil & gas interests;
$8 mm of income from discontinued operations.
2
Third Quarter 2007 Earnings - Oil & Gas
Segment Variance Analysis - 3Q07 vs. 3Q06
Core results for 3Q07 of $1.988 Billion
+ 11% year-over-year
($ in millions)
$1,790
$249
$101
$6
$158
$1,988
3Q 06
Sales Price
Sales
Volume/Mix
Exploration
Expense
All Others*
3Q 07
*All Others include: DD&A increase ($40 mm), and higher operating expenses.
3
Third Quarter 2007 Earnings –
Oil & Gas Segment
3Q07
3Q06
Reported Segment Earnings ($ mm)
*$2,029
$1,790
WTI Oil Price ($/bbl)
$75.38
$70.53
NYMEX Gas Price ($/mcf)
$6.69
$6.33
Oxy’s Realized Prices
Worldwide Oil ($/bbl)
$67.81
$61.83
US Natural Gas ($/mcf)
$5.90
$5.88
*Includes gain from sale of oil and gas interests ($12 mm), gain on sale of exploration properties ($103 mm) and exploration impairment charge ($74 mm).
4
Third Quarter 2007 Earnings –
Oil & Gas Segment
3Q07
3Q06
Oil and Gas Production (mboe/day)
570
533
+7% year-over-year
Production improvement due to:
Dolphin start-up (+15 mboe/day);
Volume increases in California, Colombia and Qatar.
Production lower than earlier guidance due to:
Delayed closing of Qatar asset acquisition from APC (- 4 mboe/day);
Price impact from PSCs (- 4 mboe/day);
Argentina labor strike and other.
Dolphin contribution:
$13 mm income A-T vs. guidance of $10 mm;
Sales volumes of 15 mboe/day vs. guidance of 17 mboe/day (due to
one less lifting during 3Q).
5
Third Quarter 2007 Earnings –
Oil & Gas Segment
3Q07
3Q06
Exploration Expense ($ mm)
$68
$74
Oil and Gas production costs were $12.56 per boe through
nine months of 2007 vs. $11.70 per boe for full-year 2006.
Increase due to higher field operating and maintenance costs,
mainly in the US and Latin America.
6
Third Quarter 2007 Earnings – Chemical
Segment Variance Analysis - 3Q07 vs. 3Q06
Earnings for 3Q07 of $212 Million
-15% year-over-year, although above our previous guidance;
Improvement vs. guidance due to higher chloro-vinyls prices;
Year-over-year decline primarily due to lower PVC margins.
($ in millions)
$248
$36
$5
$13*
$18
$212
3Q 06
Sales Price
Sales
Volume/Mix
Operations/
Manufacturing
All Others
3Q 07
*Lower energy and feedstock costs.
7
Third Quarter 2007 Earnings –
Nine Months Results
($ in millions, except EPS data)
YTD2007
YTD2006
Net Income
$3,948
$3,261
Reported EPS (diluted)
$4.69
$3.78
Core Income
$2,941
$3,332
Core EPS (diluted)
$3.50
$3.86
Oil and Gas production (mboe/day)
563
539
Capital Spending
$2,510
$1,977
Net Interest Expense
$19
$80
Cash Flow from Operations
$4,300
$4,800
ROE*
26%
24%
ROCE*
24%
21%
* Annualized (see attached Excel file for GAAP reconciliation)
8
Third Quarter 2007 Earnings –
Cash Flow YTD2007
($ in millions)
$5,880
$1,600
$2,500
$1,000
$1,000
$560
$910
$55
$1,455
Cash
Flow From
Operations
$4,300
Beginning
Cash
$1,580
Available
Cash
Asset Sale
Proceeds
Capex
Acquisitions
Debt
Reduction
Dividends
Share
Repurchase
Other
Ending Cash
Balance
9
Third Quarter 2007 Earnings –
Share Repurchase
Spent $910 million to repurchase 17.4 million shares YTD
2007 at an average price of $52.27 a share.
9.1 million shares remain under the current 55 million
share repurchase authorization.
Shares Outstanding (mm)
YTD2007
9/30/07
Weighted Average Basic
837.0
Weighted Average Diluted
840.9
Basic Shares Outstanding
829.7
Diluted Shares Outstanding
833.7
10
Third Quarter 2007 Earnings - 4Q07 Outlook
We expect Oil and Gas production of 600 to 615 mboe/day
in 4Q07.
Increase includes:
21 mboe/day from Dolphin;
5 mboe/day from the acquisition of Qatar assets from Anadarko.
We expect Dolphin’s 4Q07 after-tax income in the range of
$50 to $60 million.
Dolphin expected to operate at 55% of capacity in 4Q07;
contributions will improve as it becomes fully operational.
11
Third Quarter 2007 Earnings –
4Q07 Production Outlook
(mboe/day)
570
21
5
13
615
600
3Q 07
Production
Dolphin
Qatar
Acquisition
Other
4Q 07
Production
12
Third Quarter 2007 Earnings –
2007 Year-End Production Exit Rate Outlook
We expect the oil and gas production year-end exit rate
to be 615 to 635 mboe/day.
Increase (vs. 3Q07) includes:
45 to 50 mboe/day from Dolphin;
Dolphin exit rate could be higher depending on ramp-up pace of final
train of the gas plant to full capacity;
Expect Dolphin to run at full capacity during January 2008.
5 mboe/day from the announced acquisition of Qatar assets from
Anadarko;
Higher Latin American and other production.
13
Third Quarter 2007 Earnings –
2007 Year-End Production Exit Rate Outlook
(mboe/day)
570
45 - 50
5
9
635
615
3Q 07
Production
Dolphin
Qatar
Acquisition
Latin America
& Other
2007
Production
Exit rate
14
Third Quarter 2007 Earnings - 4Q07 Outlook
Commodity Price Sensitivity
A $1.00 per barrel change in oil prices impacts oil and gas quarterly
earnings by about $35 mm before income taxes and Dolphin;
A change of $0.50 per mmBTU in domestic gas prices has a $24 mm
pre-tax impact on quarterly earnings. The NYMEX gas price for 3Q07
was $6.69 per mcf.
We expect exploration expense of about $80 to $100 mm
for seismic and drilling for our Libya and Latin American
exploration programs.
15
Third Quarter 2007 Earnings - 4Q07 Outlook
We expect 4Q07 Chemical segment earnings to be in the
range of $100 to $140 million.
Decline (vs. 3Q07) reflects:
Normal seasonal downturn;
Continued weakening demand due to lower housing starts;
Lower chloro-vinyl margins due to higher energy and ethylene costs.
We expect 4Q07 chemical product prices and volumes as
follows:
Chlorine prices -10% vs. 4Q06, with comparable volumes;
Caustic soda prices +20% vs. 4Q06, with comparable volumes;
PVC prices up slightly vs. 4Q06, with volumes to be about similar;
Ethylene costs at least +30% vs. 4Q06.
16
Third Quarter 2007 Earnings - 4Q07 Outlook
Difficulty of predicting interim period tax rates is due to:
Interim period rates are based on projected total year income and taxes;
Oxy’s tax rate is sensitive to changes in oil and gas prices and foreign
expensed exploration;
Changes in oil prices have an inverse effect on income tax rates;
Rising oil prices increases the proportion of US income which has lower
income tax rates than our international operations;
Oxy generally records no tax benefit on foreign expensed exploration
until the project is completely abandoned.
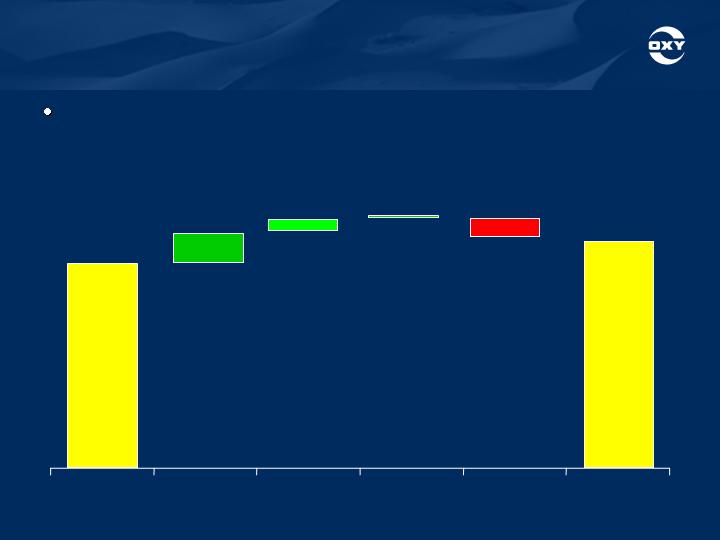
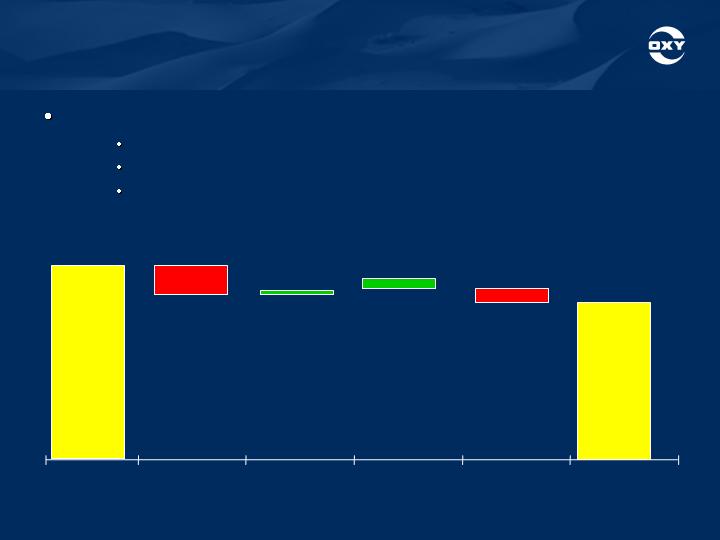
We expect 4Q07 foreign exploration expense, which is
not currently tax deductible, to be ~ $70 mm.
The 4Q07 worldwide tax rate before this exploration
expense is expected to be ~ 45%.
We expect our combined worldwide 4Q07 tax rate,
including exploration expense, to be ~ 46%.
17
Third Quarter 2007 Earnings
See the investor relations supplemental schedules for the reconciliation of non-
GAAP items. Statements in this presentation that contain words such as "will",
"expect" or "estimate", or otherwise relate to the future, are forward-looking and
involve risks and uncertainties that could materially affect expected
results. Factors that could cause results to differ materially include, but are not
limited to: exploration risks, such as drilling of unsuccessful wells; global
commodity pricing fluctuations and supply/demand considerations for oil, gas
and chemicals; higher-than-expected costs; political risk; and not successfully
completing (or any material delay in) any expansion, capital expenditure,
acquisition, or disposition. You should not place undue reliance on these
forward-looking statements which speak only as of the date of this presentation.
Unless legally required, Occidental disclaims any obligation to update any
forward-looking statements as a result of new information, future events or
otherwise. U.S. investors are urged to consider carefully the disclosure in our
Form 10-K, available through the following toll-free telephone number, 1-888-
OXYPETE (1-888-699-7383) or on the Internet at http://www.oxy.com. You also
can obtain a copy from the SEC by calling 1-800-SEC-0330.
18
Occidental Petroleum Corporation |
|
|
|
|
|
Return on Capital Employed (% ) |
|
|
|
|
|
($ Millions) |
|
| Nine |
|
|
|
|
| Months |
| Annualized |
Reconciliation to Generally Accepted Accounting Principles (GAAP) |
| 2006 | 2007 |
| 2007 |
GAAP measure - earnings applicable to common shareholders |
| 4,191 | 3,948 |
|
|
Interest expense |
| 131 | 186 |
|
|
Tax effect of interest expense |
| (46) | (65) |
|
|
Earnings before tax-effected interest expense |
| 4,276 | 4,069 |
|
|
GAAP stockholders' equity |
| 19,252 | 21,901 |
|
|
DEBT |
|
|
|
|
|
GAAP debt |
|
|
|
|
|
Debt, including current maturities |
| 2,790 | 1,904 |
|
|
Non-GAAP debt |
|
|
|
|
|
Capital lease obligation |
| 25 | 25 |
|
|
Subsidiary preferred stock |
| 75 | 75 |
|
|
Total debt |
| 2,890 | 2,004 |
|
|
Total capital employed |
| 22,142 | 23,905 |
|
|
Return on Capital Employed (%) |
| 21.2 | 17.7 |
| 23.6 |