| Item 8 | Financial Statements and Supplementary Data |
Management's Annual Assessment of and Report on Internal Control Over Financial Reporting
The management of Occidental Petroleum Corporation and subsidiaries (Occidental) is responsible for establishing and maintaining adequate internal control over financial reporting. Occidental’s system of internal control over financial reporting is designed to provide reasonable assurance regarding the reliability of financial reporting and the preparation of consolidated financial statements for external purposes in accordance with generally accepted accounting principles. Occidental’s internal control over financial reporting includes those policies and procedures that: (i) pertain to the maintenance of records that, in reasonable detail, accurately and fairly reflect the transactions and dispositions of Occidental’s assets; (ii) provide reasonable assurance that transactions are recorded as necessary to permit preparation of financial statements in accordance with generally accepted accounting principles, and that Occidental’s receipts and expenditures are being made only in accordance with authorizations of Occidental’s management and directors; and (iii) provide reasonable assurance regarding prevention or timely detection of unauthorized acquisition, use or disposition of Occidental’s assets that could have a material effect on the financial statements.
Because of its inherent limitations, internal control over financial reporting may not prevent or detect misstatements. Also, projections of any evaluation of effectiveness to future periods are subject to the risk that controls may become inadequate because of changes in conditions, or that the degree of compliance with the policies or procedures may deteriorate.
Management has assessed the effectiveness of Occidental’s internal control system as of December 31, 2009 based on the criteria for effective internal control over financial reporting described in Internal Control — Integrated Framework issued by the Committee of Sponsoring Organizations of the Treadway Commission (COSO). Based on this assessment, management believes that, as of December 31, 2009, Occidental’s system of internal control over financial reporting is effective.
Occidental’s independent auditors, KPMG LLP, have issued an audit report on Occidental’s internal control over financial reporting.
Report of Independent Registered Public Accounting Firm on Consolidated Financial Statements
To the Board of Directors and Stockholders
Occidental Petroleum Corporation:
We have audited the accompanying consolidated balance sheets of Occidental Petroleum Corporation and subsidiaries as of December 31, 2009 and 2008, and the related consolidated statements of income, stockholders’ equity, comprehensive income and cash flows for each of the years in the three-year period ended December 31, 2009. In connection with our audits of the consolidated financial statements, we also have audited the accompanying financial statement schedule. These consolidated financial statements and financial statement schedule are the responsibility of the Company’s management. Our responsibility is to express an opinion on these consolidated financial statements and financial statement schedule based on our audits.
We conducted our audits in accordance with the standards of the Public Company Accounting Oversight Board (United States). Those standards require that we plan and perform the audit to obtain reasonable assurance about whether the financial statements are free of material misstatement. An audit includes examining, on a test basis, evidence supporting the amounts and disclosures in the financial statements. An audit also includes assessing the accounting principles used and significant estimates made by management, as well as evaluating the overall financial statement presentation. We believe that our audits provide a reasonable basis for our opinion.
In our opinion, the consolidated financial statements referred to above present fairly, in all material respects, the financial position of Occidental Petroleum Corporation and subsidiaries as of December 31, 2009 and 2008, and the results of their operations and their cash flows for each of the years in the three-year period ended December 31, 2009, in conformity with U.S. generally accepted accounting principles. Also in our opinion, the related financial statement schedule, when considered in relation to the basic consolidated financial statements taken as a whole, presents fairly, in all material respects, the information set forth therein.
We also have audited, in accordance with the standards of the Public Company Accounting Oversight Board (United States), Occidental Petroleum Corporation and subsidiaries' internal control over financial reporting as of December 31, 2009, based on criteria established in Internal Control - Integrated Framework issued by the Committee of Sponsoring Organizations of the Treadway Commission (COSO), and our report dated February 25, 2010 expressed an unqualified opinion on the effectiveness of the Company’s internal control over financial reporting.
/s/ KPMG LLP
Los Angeles, California
February 25, 2010
Report of Independent Registered Public Accounting Firm on Internal Control Over Financial Reporting
To the Board of Directors and Stockholders
Occidental Petroleum Corporation:
We have audited Occidental Petroleum Corporation and subsidiaries' internal control over financial reporting as of December 31, 2009, based on criteria established in Internal Control - Integrated Framework issued by the Committee of Sponsoring Organizations of the Treadway Commission (COSO). The Company’s management is responsible for maintaining effective internal control over financial reporting and for its assessment of the effectiveness of internal control over financial reporting, included in the accompanying Management’s Annual Assessment of and Report on Internal Control Over Financial Reporting. Our responsibility is to express an opinion on the Company’s internal control over financial reporting based on our audit.
We conducted our audit in accordance with the standards of the Public Company Accounting Oversight Board (United States). Those standards require that we plan and perform the audit to obtain reasonable assurance about whether effective internal control over financial reporting was maintained in all material respects. Our audit included obtaining an understanding of internal control over financial reporting, assessing the risk that a material weakness exists, and testing and evaluating the design and operating effectiveness of internal control based on the assessed risk. Our audit also included performing such other procedures as we considered necessary in the circumstances. We believe that our audit provides a reasonable basis for our opinion.
A company's internal control over financial reporting is a process designed to provide reasonable assurance regarding the reliability of financial reporting and the preparation of financial statements for external purposes in accordance with generally accepted accounting principles. A company's internal control over financial reporting includes those policies and procedures that (1) pertain to the maintenance of records that, in reasonable detail, accurately and fairly reflect the transactions and dispositions of the assets of the company; (2) provide reasonable assurance that transactions are recorded as necessary to permit preparation of financial statements in accordance with generally accepted accounting principles, and that receipts and expenditures of the company are being made only in accordance with authorizations of management and directors of the company; and (3) provide reasonable assurance regarding prevention or timely detection of unauthorized acquisition, use, or disposition of the company’s assets that could have a material effect on the financial statements.
Because of its inherent limitations, internal control over financial reporting may not prevent or detect misstatements. Also, projections of any evaluation of effectiveness to future periods are subject to the risk that controls may become inadequate because of changes in conditions, or that the degree of compliance with the policies or procedures may deteriorate.
In our opinion, Occidental Petroleum Corporation and its subsidiaries maintained, in all material respects, effective internal control over financial reporting as of December 31, 2009, based on criteria established in Internal Control - Integrated Framework issued by the Committee of Sponsoring Organizations of the Treadway Commission (COSO).
We also have audited, in accordance with the standards of the Public Company Accounting Oversight Board (United States), the consolidated balance sheets of Occidental Petroleum Corporation and subsidiaries as of December 31, 2009 and 2008, and the related consolidated statements of income, stockholders’ equity, comprehensive income and cash flows for each of the years in the three-year period ended December 31, 2009, and our report dated February 25, 2010 expressed an unqualified opinion on those consolidated financial statements.
/s/ KPMG LLP
Los Angeles, CaliforniaFebruary 25, 2010
| Consolidated Statements of Income | Occidental Petroleum Corporation | |
| In millions, except per-share amounts | and Subsidiaries | |
| For the years ended December 31, | | 2009 | | 2008 | | 2007 | |
| | | | | | | | | | | |
| revenues and other income | | | | | | | | | | |
| Net sales | | $ | 15,403 | | $ | 24,217 | | $ | 18,784 | |
| Interest, dividends and other income | | | 118 | | | 236 | | | 355 | |
| Gains on disposition of assets, net | | | 10 | | | 27 | | | 874 | |
| | | | | | | | | | | |
| | | | 15,531 | | | 24,480 | | | 20,013 | |
| | | | | | | | | | | |
| costs and other deductions | | | | | | | | | | |
| Cost of sales (excludes depreciation, depletion and amortization of | | | | | | | | | | |
| $3,067 in 2009, $2,664 in 2008 and $2,338 in 2007) | | | 5,360 | | | 7,423 | | | 6,454 | |
| Selling, general and administrative and other operating expenses | | | 1,350 | | | 1,257 | | | 1,320 | |
| Depreciation, depletion and amortization | | | 3,117 | | | 2,710 | | | 2,379 | |
| Taxes other than on income | | | 433 | | | 588 | | | 414 | |
| Environmental remediation | | | 25 | | | 28 | | | 107 | |
| Exploration expense | | | 267 | | | 327 | | | 364 | |
| Charges for impairments | | | 170 | | | 647 | | | 58 | |
| Interest and debt expense, net | | | 140 | | | 129 | | | 339 | |
| | | | | | | | | | | |
| | | | 10,862 | | | 13,109 | | | 11,435 | |
| | | | | | | | | | | |
| income before income taxes and other items | | | 4,669 | | | 11,371 | | | 8,578 | |
| Provision for domestic and foreign income taxes | | | 1,918 | | | 4,629 | | | 3,507 | |
| Income from equity investments | | | (227 | ) | | (213 | ) | | (82 | ) |
| | | | | | | | | | | |
| income from continuing operations | | | 2,978 | | | 6,955 | | | 5,153 | |
| Discontinued operations, net | | | (12 | ) | | 18 | | | 322 | |
| | | | | | | | | | | |
| net income | | | 2,966 | | | 6,973 | | | 5,475 | |
| Less: Net income attributable to noncontrolling interest | | | (51 | ) | | (116 | ) | | (75 | ) |
| | | | | | | | | | | |
| net income attributable to common stock | | $ | 2,915 | | $ | 6,857 | | $ | 5,400 | |
| | | | | | | | | | | |
basic earnings per common share (attributable to common stock) | | | | | | | | | | |
| Income from continuing operations | | $ | 3.60 | | $ | 8.35 | | $ | 6.06 | |
| Discontinued operations, net | | | (0.01 | ) | | 0.02 | | | 0.39 | |
| | | | | | | | | | | |
| basic earnings per common share | | $ | 3.59 | | $ | 8.37 | | $ | 6.45 | |
| | | | | | | | | | | |
diluted earnings per common share (attributable to common stock) | | | | | | | | | | |
| Income from continuing operations | | $ | 3.59 | | $ | 8.32 | | $ | 6.03 | |
| Discontinued operations, net | | | (0.01 | ) | | 0.02 | | | 0.39 | |
| | | | | | | | | | | |
| diluted earnings per common share | | $ | 3.58 | | $ | 8.34 | | $ | 6.42 | |
| | | | | | | | | | | |
| dividends per common share | | $ | 1.31 | | $ | 1.21 | | $ | 0.94 | |
| The accompanying notes are an integral part of these consolidated financial statements. | |
| Consolidated Balance Sheets | Occidental Petroleum Corporation | |
| In millions | and Subsidiaries | |
| Assets at December 31, | | 2009 | | 2008 | |
| | | | | | | | |
| current assets | | | | | | | |
| | | | | | | | |
| Cash and cash equivalents | | $ | 1,230 | | $ | 1,777 | |
| | | | | | | | |
| Trade receivables, net of reserves of $30 in 2009 and $45 in 2008 | | | 4,142 | | | 3,117 | |
| | | | | | | | |
| Marketing and trading assets and other | | | 1,203 | | | 1,012 | |
| | | | | | | | |
| Inventories | | | 1,081 | | | 958 | |
| | | | | | | | |
| Prepaid expenses and other | | | 430 | | | 308 | |
| | | | | | | | |
| Total current assets | | | 8,086 | | | 7,172 | |
| | | | | | | | |
| investments in unconsolidated entities | | | 1,732 | | | 1,263 | |
| | | | | | | | |
| property, plant and equipment | | | | | | | |
| | | | | | | | |
| Oil and gas segment | | | 43,692 | | | 40,091 | |
| | | | | | | | |
| Chemical segment | | | 5,298 | | | 5,090 | |
| | | | | | | | |
| Midstream, marketing and other segment | | | 3,056 | | | 2,445 | |
| | | | | | | | |
| Corporate | | | 1,085 | | | 1,102 | |
| | | | | | | | |
| | | | 53,131 | | | 48,728 | |
| | | | | | | | |
| Accumulated depreciation, depletion and amortization | | | (19,486 | ) | | (16,462 | ) |
| | | | | | | | |
| | | | 33,645 | | | 32,266 | |
| | | | | | | | |
| long-term receivables and other assets, net | | | 766 | | | 836 | |
| | | | | | | | |
| TOTAL ASSETS | | $ | 44,229 | | $ | 41,537 | |
The accompanying notes are an integral part of these consolidated financial statements.
| Consolidated Balance Sheets | Occidental Petroleum Corporation | |
| In millions, except share and per-share amounts | and Subsidiaries | |
| Liabilities and Stockholders’ Equity at December 31, | | 2009 | | 2008 | |
| | | | | | | | |
| current liabilities | | | | | | | |
| | | | | | | | |
| Current maturities of long-term debt | | $ | 239 | | $ | 698 | |
| | | | | | | | |
| Accounts payable | | | 3,379 | | | 3,306 | |
| | | | | | | | |
| Accrued liabilities | | | 2,341 | | | 1,861 | |
| | | | | | | | |
| Domestic and foreign income taxes | | | 28 | | | 158 | |
| | | | | | | | |
| Liabilities of discontinued operations | | | 105 | | | 111 | |
| | | | | | | | |
| Total current liabilities | | | 6,092 | | | 6,134 | |
| | | | | | | | |
| long-term debt, net | | | 2,557 | | | 2,049 | |
| | | | | | | | |
| deferred credits and other liabilities | | | | | | | |
| | | | | | | | |
| Deferred and other domestic and foreign income taxes | | | 3,125 | | | 2,660 | |
| | | | | | | | |
| Long-term liabilities of discontinued operations | | | 136 | | | 152 | |
| | | | | | | | |
| Other | | | 3,160 | | | 3,217 | |
| | | | | | | | |
| | | | 6,421 | | | 6,029 | |
| | | | | | | | |
| contingent liabilities and commitments | | | | | | | |
| | | | | | | | |
| stockholders’ equity | | | | | | | |
| | | | | | | | |
| Common stock, $0.20 par value, authorized 1.1 billion shares, outstanding shares: | | | 177 | | | 176 | |
| | | | | | | | |
| 2009 — 883,642,957 and 2008 — 881,423,225 | | | | | | | |
| | | | | | | | |
| Treasury stock: 2009 — 71,721,221 shares and 2008 — 71,176,487 shares | | | (4,161 | ) | | (4,121 | ) |
| | | | | | | | |
| Additional paid-in capital | | | 7,127 | | | 7,113 | |
| | | | | | | | |
| Retained earnings | | | 26,534 | | | 24,684 | |
| | | | | | | | |
| Accumulated other comprehensive loss | | | (596 | ) | �� | (552 | ) |
| | | | | | | | |
| Noncontrolling interest | | | 78 | | | 25 | |
| | | | | | | | |
| | | | 29,159 | | | 27,325 | |
| | | | | | | | |
| TOTAL LIABILITIES AND STOCKHOLDERS' EQUITY | | $ | 44,229 | | $ | 41,537 | |
The accompanying notes are an integral part of these consolidated financial statements.
Consolidated Statements of Stockholders' Equity | Occidental Petroleum Corporation | |
| In millions | and Subsidiaries | |
| | | | | | | | | | | | | | | | Accumulated | | | | |
| | | | | | | | | | Additional | | | | | | Other | | | | |
| | | | Common | | | Treasury | | | Paid-in | | | Retained | | | Comprehensive | | | Noncontrolling | |
| | | | Stock | | | Stock | | | Capital | | | Earnings | | | Income (Loss) | | | Interest | |
| Balance, December 31, 2006 | | $ | 174 | | $ | (1,481 | ) | $ | 6,905 | | $ | 13,987 | | $ | (333 | ) | $ | 352 | |
| Net income | | | — | | | — | | | — | | | 5,400 | (a) | | — | | | 75 | |
| Uncertain tax positions adjustment | | | — | | | — | | | — | | | 219 | | | — | | | — | |
| Other comprehensive loss, net of tax | | | — | | | — | | | — | | | — | | | (299 | ) | | — | |
| Dividends on common stock | | | — | | | — | | | — | | | (787 | ) | | — | | | (59 | ) |
| Issuance of common stock and other, net | | | 1 | | | — | | | 166 | | | — | | | — | | | — | |
| Purchases of noncontrolling interest | | | — | | | — | | | — | | | — | | | — | | | (333 | ) |
| Purchases of treasury stock | | | — | | | (1,129 | ) | | — | | | — | | | — | | | — | |
| Balance, December 31, 2007 | | $ | 175 | | $ | (2,610 | ) | $ | 7,071 | | $ | 18,819 | | $ | (632 | ) | $ | 35 | |
| Net income | | | — | | | — | | | — | | | 6,857 | (a) | | — | | | 116 | |
| Other comprehensive income, net of tax | | | — | | | — | | | — | | | — | | | 80 | | | — | |
| Dividends on common stock | | | — | | | — | | | — | | | (992 | ) | | — | | | (126 | ) |
| Issuance of common stock and other, net | | | 1 | | | — | | | 42 | | | — | | | — | | | — | |
| Purchases of treasury stock | | | — | | | (1,511 | ) | | — | | | — | | | — | | | — | |
| Balance, December 31, 2008 | | $ | 176 | | $ | (4,121 | ) | $ | 7,113 | | $ | 24,684 | | $ | (552 | ) | $ | 25 | |
| Net income | | | — | | | — | | | — | | | 2,915 | (a) | | — | | | 51 | |
| Other comprehensive loss, net of tax | | | — | | | — | | | — | | | — | | | (44 | ) | | — | |
| Dividends on common stock | | | — | | | — | | | — | | | (1,065 | ) | | — | | | (16 | ) |
| Issuance of common stock and other, net | | | 1 | | | — | | | 14 | | | — | | | — | | | 18 | |
| Purchases of treasury stock | | | — | | | (40 | ) | | — | | | — | | | — | | | — | |
| Balance, December 31, 2009 | | $ | 177 | | $ | (4,161 | ) | $ | 7,127 | | $ | 26,534 | | $ | (596 | ) | $ | 78 | |
| (a) | Represent amounts attributable to common stock after deducting noncontrolling interest amounts. | |
| Consolidated Statements of Comprehensive Income | |
| In millions | |
| For the years ended December 31, | | 2009 | | 2008 | | 2007 | |
| Net income attributable to common stock | | $ | 2,915 | | $ | 6,857 | | $ | 5,400 | |
| Other comprehensive income (loss) items: | | | | | | | | | | |
Foreign currency translation adjustments (a) | | | 32 | | | (24 | ) | | 14 | |
Unrealized gains (losses) on derivatives (b) | | | (93 | ) | | 207 | | | (243 | ) |
Pension and postretirement adjustments (c) | | | 1 | | | (184 | ) | | (13 | ) |
Reclassification of realized losses (gains) on derivatives and securities (d) | | | 13 | | | 68 | | | (156 | ) |
Unrealized gains on securities (e) | | | 3 | | | 13 | | | 99 | |
Other comprehensive income (loss), net of tax (f) | | | (44 | ) | | 80 | | | (299 | ) |
| Comprehensive income attributable to common stock | | $ | 2,871 | | $ | 6,937 | | $ | 5,101 | |
| (a) | Net of tax of $0 in all three years. | |
| (b) | Net of tax of $53, ($118) and $139 in 2009, 2008 and 2007, respectively. | |
| (c) | Net of tax of $0, $110 and $8 in 2009, 2008 and 2007, respectively. | |
| (d) | Net of tax of ($7), ($39) and $89 in 2009, 2008 and 2007, respectively. 2007 amount represents the recognition of the gain on the sale of the remaining Lyondell Chemical Company (Lyondell) shares. | |
| (e) | Net of tax of ($1), ($7) and ($56) in 2009, 2008 and 2007, respectively. | |
| (f) | There were no other comprehensive income (loss) items related to noncontrolling interests in 2009, 2008 and 2007. | |
| | | |
| The accompanying notes are an integral part of these consolidated financial statements. | |
| Consolidated Statements of Cash Flows | Occidental Petroleum Corporation | |
| In millions | and Subsidiaries | |
| For the years ended December 31, | | 2009 | | 2008 | | 2007 | |
| | | | | | | | | | | |
| cash flow from operating activities | | | | | | | | | | |
| Net income | | $ | 2,966 | | $ | 6,973 | | $ | 5,475 | |
| Adjustments to reconcile net income to net cash provided by operating activities: | | | | | | | | | | |
| Discontinued operations, net | | | 12 | | | (18 | ) | | (322 | ) |
| Depreciation, depletion and amortization of assets | | | 3,117 | | | 2,710 | | | 2,379 | |
| Deferred income tax provision | | | 507 | | | 268 | | | 35 | |
| Other noncash charges to income | | | 638 | | | 1,071 | | | 870 | |
| Gains on disposition of assets, net | | | (10 | ) | | (27 | ) | | (874 | ) |
| Income from equity investments | | | (227 | ) | | (213 | ) | | (82 | ) |
| Dry hole and impairment expense | | | 212 | | | 244 | | | 189 | |
| Changes in operating assets and liabilities: | | | | | | | | | | |
| Decrease (increase) in receivables | | | (602 | ) | | 1,518 | | | (2,219 | ) |
| Increase in inventories | | | (107 | ) | | (64 | ) | | (71 | ) |
| Decrease (increase) in prepaid expenses and other assets | | | (77 | ) | | 6 | | | (96 | ) |
| (Decrease) increase in accounts payable and accrued liabilities | | | (403 | ) | | (1,342 | ) | | 1,807 | |
| Increase (decrease) in current domestic and foreign income taxes | | | 12 | | | (222 | ) | | (73 | ) |
| Other operating, net | | | (182 | ) | | (275 | ) | | (358 | ) |
| Operating cash flow from continuing operations | | | 5,856 | | | 10,629 | | | 6,660 | |
| Operating cash flow from discontinued operations, net of taxes | | | (43 | ) | | 23 | | | 138 | |
| | | | | | | | | | | |
| Net cash provided by operating activities | | | 5,813 | | | 10,652 | | | 6,798 | |
| | | | | | | | | | | |
| cash flow from investing activities | | | | | | | | | | |
| Capital expenditures | | | (3,581 | ) | | (4,664 | ) | | (3,360 | ) |
| Sales of assets, net | | | 51 | | | 27 | | | 509 | |
| Purchases of assets, net | | | (1,782 | ) | | (4,701 | ) | | (1,522 | ) |
| Purchases of short-term investments | | | — | | | — | | | (10 | ) |
| Sales of short-term investments | | | — | | | — | | | 250 | |
| Sales of equity investments and available-for-sale investments | | | — | | | 51 | | | 1,157 | |
| Equity investments and other, net | | | (15 | ) | | (42 | ) | | (88 | ) |
| Investing cash flow from continuing operations | | | (5,327 | ) | | (9,329 | ) | | (3,064 | ) |
| Investing cash flow from discontinued operations | | | — | | | — | | | (11 | ) |
| | | | | | | | | | | |
| Net cash used by investing activities | | | (5,327 | ) | | (9,329 | ) | | (3,075 | ) |
| | | | | | | | | | | |
| cash flow from financing activities | | | | | | | | | | |
| Proceeds from long-term debt | | | 740 | | | 1,043 | | | 127 | |
| Payments of long-term debt | | | (699 | ) | | (96 | ) | | (1,291 | ) |
| Proceeds from issuance of common stock | | | 18 | | | 32 | | | 17 | |
| Purchases of treasury stock | | | (40 | ) | | (1,511 | ) | | (1,129 | ) |
| Redemption of preferred stock | | | — | | | — | | | (75 | ) |
| Cash dividends paid | | | (1,063 | ) | | (940 | ) | | (765 | ) |
| Excess share-based tax benefits and other | | | 27 | | | 90 | | | 71 | |
| Distributions to noncontrolling interest | | | (16 | ) | | (128 | ) | | (53 | ) |
| | | | | | | | | | | |
| Net cash used by financing activities | | | (1,033 | ) | | (1,510 | ) | | (3,098 | ) |
| | | | | | | | | | | |
| (Decrease) increase in cash and cash equivalents | | | (547 | ) | | (187 | ) | | 625 | |
| Cash and cash equivalents — beginning of year | | | 1,777 | | | 1,964 | | | 1,339 | |
| | | | | | | | | | | |
| Cash and cash equivalents — end of year | | $ | 1,230 | | $ | 1,777 | | $ | 1,964 | |
The accompanying notes are an integral part of these consolidated financial statements.
| Notes to Consolidated Financial Statements | Occidental Petroleum Corporation |
| | and Subsidiaries |
| Note 1 | Summary of Significant Accounting Policies |
Nature of Operations
In this report, "Occidental" or "the Company" refers to Occidental Petroleum Corporation, a Delaware corporation, (OPC), and/or one or more entities in which it owns a majority voting interest (subsidiaries). Occidental is a multinational organization whose subsidiaries and affiliates operate in the oil and gas, chemical and midstream, marketing and other segments. The oil and gas segment explores for, develops, produces and markets crude oil, including natural gas liquids (NGLs) and condensate, as well as natural gas. The chemical segment (OxyChem) manufactures and markets basic chemicals, vinyls and other chemicals. The midstream, marketing and other segment (midstream and marketing) gathers, treats, processes, transports, stores, purchases and markets crude oil (including NGLs and condensate), natural gas, carbon dioxide (CO2) and power. It also trades around its assets, including pipelines and storage capacity, and trades commodities and securities. Unless otherwise indicated hereafter, discussion of oil or oil and liquids refers to crude oil, NGLs and condensate. In addition, discussions of oil and gas production or volumes, in general, refer to sales volumes unless context requires or it is indicated otherwise.
Principles of Consolidation
The consolidated financial statements have been prepared in conformity with United States generally accepted accounting principles (GAAP) and include the accounts of OPC, its subsidiaries and its undivided interests in oil and gas exploration and production ventures. Occidental's proportionate share of oil and gas exploration and production ventures, in which it has a direct working interest, is accounted for by reporting its proportionate share of assets, liabilities, revenues, costs and cash flows within the relevant lines on the balance sheets, income statements and cash flow statements.
Certain financial statements, notes and supplementary data for prior years have been reclassified to conform to the 2009 presentation.
Investments in Unconsolidated Entities
Investments in unconsolidated entities include equity-method investments. Amounts representing Occidental’s percentage interest in the underlying net assets of affiliates (excluding undivided interests in oil and gas exploration and production ventures) in which it does not have a majority voting interest but as to which it exercises significant influence, are accounted for under the equity method. Occidental reviews equity-method investments for impairment whenever events or changes in circumstances indicate that an other-than-temporary decline in value may have occurred. The amount of impairment, if any, is based on quoted market prices, where available, or other valuation techniques, including discounted cash flows.
Revenue Recognition
Revenue is recognized from oil and gas production when title has passed to the customer, which occurs when the product is shipped. In international locations where oil is shipped by tanker, title passes when the tanker is loaded or product is received by the customer, depending on the shipping terms. This process occasionally causes a difference between actual production in a reporting period and sales volumes that have been recognized as revenue. Revenue from marketing and trading activities is recognized on net settled transactions upon completion of contract terms, and for physical deliveries upon title transfer. For unsettled transactions, contracts that meet specified accounting criteria are recorded at fair value. Revenue from all marketing and trading activities is reported on a net basis.
Revenue from chemical product sales is recognized when the product is shipped and title has passed to the customer. Prices are fixed at the time of shipment. Certain incentive programs may provide for payments or credits to be made to customers based on the volume of product purchased over a defined period. Total customer incentive payments over a given period are estimated and recorded as a reduction to revenue ratably over the contract period. Such estimates are evaluated and revised as warranted.
Occidental records revenue net of taxes that are assessed by governmental authorities on Occidental's customers.
Risks and Uncertainties
The process of preparing consolidated financial statements in conformity with GAAP requires Occidental's management to make informed estimates and judgments regarding certain types of financial statement balances. Such estimates primarily relate to unsettled transactions and events as of the date of the consolidated financial statements. Changes in facts and circumstances or discovery of new information relating to such transactions and events may result in revised estimates and judgments, and upon settlement actual results may differ from these estimates, but generally not by material amounts. Management believes that these estimates and assumptions provide a reasonable basis for the fair presentation of Occidental’s financial position and results of operations.
Realization of deferred tax assets, including any net operating loss carry forwards, is dependent upon Occidental generating sufficient future taxable income in jurisdictions where such assets originate. Occidental expects to realize the recorded deferred tax assets, net of any allowances, through future operating income and reversal of temporary differences.
The accompanying consolidated financial statements include assets of approximately $11.7 billion as of December 31, 2009, and net sales of approximately $5.9 billion for the year ended December 31, 2009, relating to Occidental’s operations in countries outside North America. Occidental operates some of its oil and gas business in countries that occasionally have experienced political instability, armed conflict, terrorism, insurgency, civil unrest, security problems, labor unrest, OPEC production restrictions, equipment import restrictions and sanctions that prevent continued operations, all of which increase Occidental's risk of loss or delayed or restricted production or may result in other adverse consequences. Occidental attempts to conduct its financial affairs so as to mitigate its exposure against such risks and would seek compensation in the event of nationalization.
Since Occidental’s major products are commodities, significant changes in the prices of oil and gas and chemical products may have a significant impact on Occidental’s results of operations for any particular year.
Also, see "Property, Plant and Equipment" below.
Cash and Cash Equivalents
Cash equivalents are short-term, highly liquid investments that are readily convertible to cash. Cash equivalents totaled approximately $1.2 billion and $1.8 billion at December 31, 2009 and 2008, respectively.
Short-Term Investments
Short-term investments are recorded at fair value with any unrealized gains or losses included in accumulated other comprehensive income/loss (AOCI).
Inventories
Materials and supplies are valued at the lower of weighted-average cost or market and are reviewed periodically for obsolescence. Oil and natural gas inventories are valued at the lower of cost or market.
For the chemical segment, Occidental's inventories are valued at the lower of cost or market. For most of its domestic inventories, other than materials and supplies, the chemical segment uses the last-in, first-out (LIFO) method as it better matches current costs and current revenue. For other countries, Occidental uses the first-in, first-out method (if the costs of goods are specifically identifiable) or the average-cost method (if the costs of goods are not specifically identifiable).
Property, Plant and Equipment
Oil and Gas
The carrying value of Occidental’s property, plant and equipment (PP&E) is based on the cost incurred to acquire the PP&E, including any capitalized interest, net of accumulated depreciation, depletion and amortization (DD&A) and net of any impairment charges. For acquisitions of a business, PP&E cost is determined by an allocation of total purchase price to the components of PP&E based on their estimated fair values at the date of acquisition. Interest costs incurred in connection with qualifying capital expenditures are capitalized and amortized over the lives of the related assets.
Occidental uses the successful efforts method to account for its oil and gas properties. Under this method, costs of acquiring properties, costs of drilling successful exploration wells and development costs are capitalized. The costs of exploratory wells are initially capitalized pending a determination of whether proved reserves have been found. At the completion of drilling activities, the costs of exploratory wells remain capitalized if a determination is made that proved reserves have been found. If no proved reserves have been found, the costs of the related exploratory wells are charged to expense. In some cases, a determination of proved reserves cannot be made at the completion of drilling, requiring additional testing and evaluation of the wells. Occidental's practice is to expense the costs of such exploratory wells if a determination of proved reserves has not been made within a 12-month period after drilling is complete. Annual lease rentals and geological, geophysical and seismic costs are expensed as incurred.
The following table summarizes the activity of capitalized exploratory well costs for the years ended December 31:
| In millions | | 2009 | | 2008 | | 2007 | |
Balance — Beginning of Year | | $ | 68 | | $ | 17 | | $ | 46 | |
| Additions to capitalized exploratory well costs pending the determination of proved reserves | | | 42 | | | 69 | | | 18 | |
| Reclassifications to property, plant and equipment based on the determination of proved reserves | | | (11 | ) | | (3 | ) | | (5 | ) |
| Capitalized exploratory well costs charged to expense | | | (57 | ) | | (15 | ) | | (42 | ) |
| Balance — End of Year | | $ | 42 | | $ | 68 | | $ | 17 | |
Proved oil and gas reserves (as defined in the Securities and Exchange Commission's Regulation S-X, Rule 4-10(a)) are those quantities of oil and gas, which, by analysis of geoscience and engineering data, can be estimated with reasonable certainty to be economically producible—from a given date forward, from known reservoirs, and under existing economic conditions, operating methods, and government regulations—prior to the time at which contracts providing the right to operate expire, unless evidence indicates that renewal is reasonably certain, regardless of whether deterministic or probabilistic methods are used for the estimation. Occidental has no proved oil and gas reserves for which the determination of commercial viability is subject to the completion of major additional capital expenditures. Depreciation and depletion of oil and gas producing properties is determined by the unit-of-production method.
A portion of the carrying value of Occidental’s oil and gas properties is attributable to unproved properties. At December 31, 2009, the net capitalized costs attributable to unproved properties were $1.9 billion. The unproved amounts are not subject to DD&A or impairment until a determination is made as to the existence of proved reserves. As exploration and development work progresses, if reserves on these properties are proved, capitalized costs attributable to the properties will be subject to depreciation and depletion. If the exploration and development work were to be unsuccessful, or management's plans changed with respect to these properties, as a result of economic, operating or contractual conditions, the capitalized costs of the related properties would be expensed in the period in which the determination was made. The timing of any writedowns of these unproved properties, if warranted, depends upon management's plans, the nature, timing and extent of future exploration and development activities and their results. Occidental believes its current plans and exploration and development efforts will allow it to realize its unproved property balance.
Additionally, Occidental performs impairment tests with respect to its proved properties generally when prices decline other than temporarily, reserve estimates change significantly or other significant events occur that may impact the ability to realize the recorded asset amounts. Impairment tests incorporate a number of assumptions involving expectations of future cash flows, which can change significantly over time. These assumptions include estimates of future product prices, which Occidental bases on forward price curves, estimates of oil and gas reserves and estimates of future expected operations and development costs. Fluctuations in commodities prices and production and development costs could cause management's plans to change with respect to unproved properties and could cause the carrying values of proved properties to be unrealizable. Such circumstances could result in impairments in the carrying values of proved or unproved properties or both. Any impairment loss would be calculated as the excess of the asset’s net book value over its estimated fair value.
Chemical
The most critical accounting policy affecting Occidental's chemical assets is the determination of the estimated useful lives of the PP&E. Occidental’s chemical plants are depreciated using either the unit-of-production or straight-line method, based upon the estimated useful lives of the facilities. The estimated useful lives of Occidental’s chemical assets, which range from three years to 50 years, are also used for impairment tests. The estimated useful lives used for the chemical facilities are based on the assumption that Occidental will provide an appropriate level of annual expenditures to ensure productive capacity is sustained. Without these continued expenditures, the useful lives of these plants could decrease significantly. Other factors that could change the estimated useful lives of Occidental’s chemical plants include sustained higher or lower product prices, which are particularly affected by both domestic and foreign competition, demand, feedstock costs, energy prices, environmental regulations and technological changes.
Occidental performs impairment tests on its chemical assets whenever events or changes in circumstances lead to a reduction in the estimated useful lives or estimated future cash flows that would indicate that the carrying amount may not be recoverable, or when management’s plans change with respect to those assets. Any impairment loss would be calculated as the excess of the asset’s net book value over its estimated fair value.
Midstream and Marketing
Occidental’s midstream and marketing PP&E is depreciated over the estimated useful lives of the assets, using either the unit-of-production or straight-line method.
Occidental performs impairment tests on its midstream and marketing assets whenever events or changes in circumstances lead to a reduction in the estimated useful lives or estimated future cash flows that would indicate that the carrying amount may not be recoverable, or when management’s plans change with respect to those assets. Any impairment loss would be calculated as the excess of the asset’s net book value over its estimated fair value.
Fair Value Measurements
Occidental has categorized its assets and liabilities that are measured at fair value, based on the priority of the inputs to the valuation techniques, in a three-level fair value hierarchy: Level 1 – using quoted prices in active markets for identical assets or liabilities; Level 2 – using observable inputs other than quoted prices; and Level 3 – using unobservable inputs. Occidental primarily applies the market approach for recurring fair value measurements, maximizes its use of observable inputs and minimizes its use of unobservable inputs. Occidental utilizes the mid-point price between bid and ask prices for valuing the majority of its assets and liabilities measured and reported at fair value. In addition to using market data, Occidental makes assumptions in valuing its assets and liabilities, including assumptions about risk and the risks inherent in the inputs to the valuation technique.
Certain of Occidental's derivative instruments are valued using industry-standard models that consider various inputs, including quoted forward prices for commodities, time value, volatility factors, and current market and contractual prices for the underlying instruments, as well as other relevant economic measures. Substantially all of these inputs are observable in the marketplace throughout the full term of the instrument, can be derived from observable data or are supported by observable prices at which transactions are executed in the marketplace.
Occidental generally uses an income approach to measure fair value when there is not a market observable price for an identical or similar asset or liability. This approach utilizes management's best assumptions regarding expectations of projected cash flows, and discounts the expected cash flows using a commensurate risk-adjusted discount rate. The portion of derivatives valued using Level 3 inputs is de minimis.
Accrued Liabilities—Current
Accrued liabilities include accrued payroll, commissions and related expenses of $644 million and $352 million at December 31, 2009 and 2008, respectively.
Environmental Liabilities and Expenditures Environmental expenditures that relate to current operations are expensed or capitalized as appropriate. Occidental records environmental reserves for estimated remediation costs that relate to existing conditions from past operations when environmental remediation efforts are probable and the costs can be reasonably estimated. In determining the reserves and the range of reasonably possible additional loss, Occidental refers to currently available information, including relevant past experience, remedial objectives, available technologies, applicable laws and regulations and cost-sharing arrangements. Occidental bases environmental reserves on management’s estimate of the most likely cost to be incurred, using the most cost-effective technology reasonably expected to achieve the remedial objective. Occidental periodically reviews reserves and adjusts them as new information becomes available. Occidental records environmental reserves on a discounted basis only when the aggregate amount and the timing of cash payments are reliably determinable at the time the reserves are established. The reserve methodology with respect to discounting for a specific site is not modified once it has been established. Occidental generally records reimbursements or recoveries of environmental remediation costs in income when received, unless receipt of recovery is highly probable, in which case an accrual may be recorded. As of December 31, 2009, 2008 and 2007, Occidental has not accrued any reimbursements or recoveries.
Many factors could affect Occidental’s future remediation costs and result in adjustments to its environmental reserves and range of reasonably possible additional loss. The most significant are: (1) cost estimates for remedial activities may be inaccurate; (2) the length of time, type or amount of remediation necessary to achieve the remedial objective may change due to factors such as site conditions, the ability to identify and control contaminant sources or the discovery of additional contamination; (3) the regulatory agency may ultimately reject or modify Occidental’s proposed remedial plan; (4) improved or alternative remediation technologies may change remediation costs; and (5) laws and regulations may impose more or less stringent remediation requirements or affect cost sharing or allocation of liability.
Certain sites involve multiple parties with various cost-sharing arrangements, which fall into the following three categories: (1) environmental proceedings that result in a negotiated or prescribed allocation of remediation costs among Occidental and other alleged potentially responsible parties; (2) oil and gas ventures in which each participant pays its proportionate share of remediation costs reflecting its working interest; or (3) contractual arrangements, typically relating to purchases and sales of properties, in which the parties to the transaction agree to methods of allocating remediation costs. In these circumstances, Occidental evaluates the financial viability of other parties with whom it is alleged to be jointly liable, the degree of their commitment to participate and the consequences to Occidental of their failure to participate when estimating Occidental's ultimate share of liability. Occidental records reserves at its expected net cost of remedial activities and, based on these factors, believes that it will not be required to assume a share of liability of such other potentially responsible parties in an amount materially above amounts reserved.
In addition to the costs of investigations and cleanup measures, which often take in excess of ten years at Comprehensive Environmental Response, Compensation, and Liability Act (CERCLA) National Priorities List (NPL) sites, Occidental’s reserves include management’s estimates of the costs to operate and maintain remedial systems. If remedial systems are modified over time in response to significant changes in site-specific data, laws, regulations, technologies or engineering estimates, Occidental reviews and adjusts its reserves accordingly.
Asset Retirement Obligations
In the period in which an asset retirement obligation is incurred and becomes reasonably estimable, Occidental recognizes the fair value of the liability if there is a legal obligation to dismantle the asset and reclaim or remediate the property at the end of its useful life. The liability amounts are based on future retirement cost estimates and incorporate many assumptions such as time to abandonment, technological changes, future inflation rates and the adjusted risk-free rate of interest. When the liability is initially recorded, Occidental capitalizes the cost by increasing the related PP&E balances. If the estimated future cost of the asset retirement obligation changes, an adjustment is recorded to both the asset retirement obligation and PP&E. Over time, the liability is increased and expense is recognized for changes in its present value, and the initial capitalized cost is depreciated over the useful life of the asset. No market risk premium has been included in Occidental’s liability since no reliable estimate can be made at this time.
Occidental has identified conditional asset retirement obligations at a certain number of its facilities that are related mainly to plant decommissioning. Occidental believes that there is an indeterminate settlement date for these asset retirement obligations because the range of time over which Occidental may settle these obligations is unknown or cannot be estimated. Therefore, Occidental cannot reasonably estimate the fair value of these liabilities. Occidental will recognize these conditional asset retirement obligations in the periods in which sufficient information becomes available to reasonably estimate their fair values.
The following table summarizes the activity of the asset retirement obligation, of which $677 million and $480 million is included in deferred credits and other liabilities - other, with the remaining current portion in accrued liabilities at December 31, 2009 and 2008, respectively.
| For the years ended December 31, (in millions) | | 2009 | | 2008 | |
| Beginning balance | | $ | 521 | | $ | 471 | |
| Liabilities incurred | | | 84 | | | 38 | |
| Liabilities settled | | | (28 | ) | | (30 | ) |
| Accretion expense | | | 36 | | | 30 | |
| Acquisitions and other | | | 8 | | | 45 | |
| Revisions to estimated cash flows | | | 101 | | | (33 | ) |
| Ending balance | | $ | 722 | | $ | 521 | |
Derivative Instruments
Derivatives are carried at fair value and on a net basis when a legal right of offset exists with the same counterparty. Occidental applies hedge accounting when transactions meet specified criteria for such treatment. If a derivative does not qualify or is not designated and documented as a hedge, any fair value gains or losses are recognized in earnings in the current period. For cash-flow hedges, the effective portion of the gain or loss on the derivative is reported as a component of other comprehensive income (OCI) with an offsetting adjustment to the basis of the item being hedged. Realized gains or losses from cash-flow hedges, and any ineffectiveness, are recorded as a component of net sales in the consolidated statements of income. Ineffectiveness is primarily created by a basis difference between the hedged item and the hedging instrument due to location, quality or grade of the physical commodity transactions. Gains and losses from derivative instruments are reported net in the consolidated statements of income. There were no fair value hedges as of and for the years ended December 31, 2009, 2008 and 2007.
A hedge is regarded as highly effective and qualifies for hedge accounting if, at inception and throughout its life, it is expected that changes in the fair value or cash flows of the hedged item are almost fully offset by the changes in the fair value or changes in cash flows of the hedging instrument and actual effectiveness is within a range of 80 to 125 percent. In the case of hedging a forecasted transaction, the transaction must be probable and must present an exposure to variations in cash flows that could ultimately affect reported net income or loss. Occidental discontinues hedge accounting when it determines that a derivative has ceased to be highly effective as a hedge; when the derivative expires, or is sold, terminated, or exercised; when the hedged item matures or is sold or repaid; or when a forecasted transaction is no longer deemed probable.
Stock-Based Incentive Plans
Occidental has established several shareholder-approved stock-based incentive plans for certain employees (Plans) that are more fully described in Note 12. A summary of Occidental’s accounting policy under each type of award issued under the Plans follows below.
For cash- and stock-settled restricted stock units (RSUs), compensation expense is initially measured on the grant date using the quoted market price of Occidental’s common stock. For stock options (Options), stock-settled stock appreciation rights (SARs), performance stock awards (PSAs) and total shareholder return incentives (TSRIs), compensation expense is initially measured on the grant date using potential exercise values or estimated payout level using valuation models. Compensation expense for all awards is recognized on a straight-line basis over the requisite service periods, which is generally over the awards’ respective vesting or performance periods. The compensation expense for PSAs and TSRIs are adjusted quarterly for any changes in the number of shares expected to be issued based on the performance criteria using valuation models. In addition, every quarter the cash-settled portion of RSUs, SARs, PSAs and TSRIs is further revalued for changes in the values of the underlying stock. All such performance or stock-price-related changes are recognized in periodic compensation expense.
Supplemental Cash Flow Information
Occidental paid U.S. federal, state and foreign income taxes of approximately $1.4 billion, $4.5 billion and $3.5 billion during the years ended December 31, 2009, 2008 and 2007, respectively. Occidental also paid production, property and other taxes, mostly in the U.S., of approximately $584 million, $590 million and $463 million during the years ended December 31, 2009, 2008 and 2007, respectively. Cash payments for federal, state and foreign income paid by discontinued operations were $8 million, $7 million and $17 million for the years 2009, 2008 and 2007, respectively. Interest paid totaled approximately $164 million, $84 million and $307 million for the years 2009, 2008 and 2007, respectively.
Foreign Currency Transactions
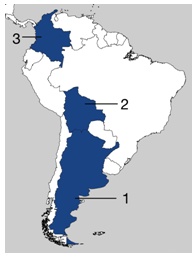
The functional currency applicable to all of Occidental’s foreign oil and gas operations is the U.S. dollar since cash flows are denominated principally in U.S. dollars. Occidental’s chemical operations in Brazil use the Real as the functional currency. Exchange-rate changes on transactions denominated in non-U.S. dollar functional currencies generated gains of $36 million and $91 million in 2009 and 2008, respectively, and losses of $18 million in 2007.
| Note 2 | Acquisitions and Dispositions |
Subsequent Event
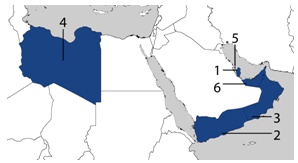
In January 2010, Occidental and its partners signed a technical service contract with the government of Iraq to develop the Zubair Field in Iraq.
Occidental's management has evaluated events from January 1, 2010 through February 25, 2010 and has made the appropriate disclosures.
2009
On December 31, 2009, Occidental completed the acquisition of interests in Phibro LLC (Phibro) from Citigroup Inc. for approximately $370 million. Phibro, primarily an investor in commodities and securities, is included as a part of Occidental's midstream and marketing segment. The assets acquired and liabilities assumed were recorded at their estimated fair values at the acquisition date. The majority of Phibro's assets and liabilities are derivatives and trading securities, which are carried at fair value and, consequently, the allocated purchase prices are included in Note 7, Derivative Activities and Note 15, Fair Value Measurements. No goodwill was recorded on this transaction.
In December 2009, Occidental purchased additional interests in the General Partner of the Plains All-American Pipeline, L.P. for approximately $330 million. Occidental now owns approximately 22 percent of this entity.
Occidental and its partners signed a Development and Production Sharing Agreement (DPSA) in April 2009 with the National Oil and Gas Authority of Bahrain for further development of the Bahrain Field, which became effective in December 2009. Under this agreement, a joint operating company formed by Occidental and its partners will serve as operator for the project.
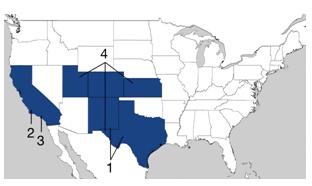
In 2009, Occidental acquired various additional oil and gas properties in California and the Permian Basin for approximately $610 million.
2008
In August 2008, Occidental purchased noncontrolling interests in the General Partner of Plains All-American Pipeline, L.P. for approximately $330 million in cash.
In July 2008, Occidental purchased a 15-percent interest in the Joslyn Oil Sands Project (Joslyn) in northern Alberta, Canada, for approximately $500 million in cash.
In June 2008, Occidental signed an agreement for a third party to construct a west Texas gas processing plant that will provide carbon dioxide (CO2) for Occidental’s enhanced oil recovery projects in the Permian Basin. Occidental will own and operate the new facility.
In June 2008, Occidental and its partner signed 30-year agreements (including a potential 5-year extension) with the Libyan National Oil Company (NOC) to upgrade its existing petroleum contracts in Libya. The new agreements increased Occidental's after-tax economic returns while allowing NOC and Occidental to design and implement major field redevelopment and exploration programs in the Sirte Basin. Occidental will contribute 37.5 percent of the development capital. Under these contracts, Occidental will pay $750 million as its share of a signature bonus. Occidental made its first payment in the amount of $450 million in June 2008 and its second payment of $150 million in June 2009. Occidental's remaining payment of $150 million is due in June 2010.
In February 2008, Occidental purchased from Plains Exploration & Production Company (Plains) a 50-percent interest in oil and gas properties in the Permian Basin and western Colorado for approximately $1.5 billion in cash. In December 2008, Occidental purchased the remainder of Plains’ interests in the same assets for $1.2 billion in cash.
2007
In September 2007, Occidental sold exploration properties in West Africa and recorded a pre-tax gain of $103 million.
In June 2007, Occidental completed a fair value exchange under which BP p.l.c. (BP) acquired Occidental's oil and gas interests in Horn Mountain and received cash. Occidental acquired oil and gas interests in the Permian Basin and a gas processing plant in Texas from BP. Occidental also purchased for cash BP's west Texas pipeline system and, in a separate transaction, Occidental sold its oil and gas interests in Pakistan to BP. As a result of these transactions, both the Horn Mountain and Pakistan operations were classified as discontinued operations for all periods presented. Net revenues and pre-tax income for discontinued operations related to Pakistan and Horn Mountain were $193 million and $469 million (including after-tax disposal gains of $230 million) in 2007. The assets and liabilities of Horn Mountain and Pakistan are classified as assets of discontinued operations and liabilities of discontinued operations on the consolidated balance sheet.
In January 2007, Occidental sold its 50-percent joint venture interest in Russia for an after-tax gain of approximately $412 million.
| Note 3 | Accounting and Disclosure Changes |
Future Accounting and Disclosure Changes
Effective for the first quarter of 2010, Occidental will modify its method of assessing the consolidation of variable interest entities as a result of adopting new accounting requirements issued by the Financial Accounting Standards Board (FASB) in June 2009. Occidental is currently assessing the effect of this new guidance on its financial statements but does not expect it to be material.
Recently Adopted Accounting and Disclosure Changes
Effective for the year ended December 31, 2009, the Securities and Exchange Commission (SEC) and the FASB modified certain accounting and disclosure requirements for oil and gas properties, which Occidental adopted. The new guidance includes changes to pricing methodology and the use of allowable technologies in the recognition and measurement of reserves, as well as oil and gas disclosure requirements. As of December 31, 2009, Occidental conformed its disclosures to the new guidelines, which did not have a material impact on Occidental's financial statements.
As of December 31, 2009, Occidental enhanced its disclosures related to the assets held in defined benefit plans and other post-retirement benefits in accordance with disclosure requirements issued by the FASB in December 2008 and in April 2009.
In the quarter ended June 30, 2009, Occidental adopted new disclosure requirements for its evaluation of subsequent events as a result of new accounting guidance issued by the FASB in May 2009.
In the quarter ended June 30, 2009, Occidental adopted new disclosure requirements for the fair value of financial instruments in interim periods when it is practicable to estimate such values as a result of new accounting guidance issued by the FASB in April 2009.
Beginning January 1, 2009, Occidental modified its calculation of basic earnings per share (EPS) in accordance with new accounting guidance issued by the FASB in June 2008. Under this new accounting guidance, instruments containing rights to nonforfeitable dividends granted in share-based payment transactions are considered participating securities prior to vesting and, therefore, have been included in the earnings allocations in computing EPS under the two-class method. While prior period EPS data has been adjusted retrospectively, this change had no material impact on Occidental’s financial statements.
Beginning January 1, 2009, Occidental adopted new disclosure requirements for its derivative and hedging activities as a result of new accounting guidance issued by the FASB in March 2008.
Beginning January 1, 2009, Occidental prospectively adopted the deferred portion of new accounting guidance related to the application of the measurement and disclosure framework of non-financial assets and liabilities that are recorded at fair value on a non-recurring basis. This new guidance was issued by the FASB in February 2008.
Beginning January 1, 2009, Occidental adopted new accounting guidance related to the accounting and disclosure requirements for business combinations. The new guidance was issued by the FASB in December 2007 and April 2009 and had no material impact on Occidental’s financial statements upon adoption.
On January 1, 2009, Occidental adopted new accounting guidance affecting the presentation and disclosure requirements related to noncontrolling interests in subsidiaries. Occidental adopted this new guidance prospectively, except for the presentation and disclosure requirements which were applied retrospectively to all periods presented. These new requirements were issued in December 2007 and had no material impact on Occidental’s financial statements upon adoption.
Net carrying values of inventories valued under the LIFO method were approximately $175 million and $166 million at December 31, 2009 and 2008, respectively. Inventories consisted of the following:
| Balance at December 31, (in millions) | | 2009 | | 2008 | |
| Raw materials | | $ | 63 | | $ | 123 | |
| Materials and supplies | | | 515 | | | 412 | |
| Finished goods | | | 584 | | | 494 | |
| | | | 1,162 | | | 1,029 | |
| LIFO reserve | | | (81 | ) | | (71 | ) |
| Total | | $ | 1,081 | | $ | 958 | |
Long-term debt consisted of the following:
| Balance at December 31, (in millions) | | 2009 | | 2008 | |
| Occidental Petroleum Corporation | | | | | | | |
| 7.0% senior notes due 2013 | | $ | 1,000 | | $ | 1,000 | |
| 4.125% senior notes due 2016 | | | 750 | | | — | |
| 6.75% senior notes due 2012 | | | 368 | | | 368 | |
| 4.25% medium-term senior notes due 2010 | | | 227 | | | 227 | |
| 8.45% senior notes due 2029 | | | 116 | | | 116 | |
| 9.25% senior debentures due 2019 | | | 116 | | | 116 | |
| 10.125% senior debentures due 2009 | | | ― | | | 91 | |
| 7.2% senior debentures due 2028 | | | 82 | | | 82 | |
| 8.75% medium-term notes due 2023 | | | 22 | | | 22 | |
| 11.125% senior notes due 2010 | | | 12 | | | 12 | |
| | | | 2,693 | | | 2,034 | |
| Subsidiary Debt | | | | | | | |
Dolphin Energy Limited (Dolphin Energy) loans due 2009 (3.915% as of December 31, 2008) | | | ― | | | 600 | |
| 0.19% to 0.35% unsecured notes due 2011 through 2018 | | | 115 | | | 115 | |
| | | | 2,808 | | | 2,749 | |
| Less: | | | | | | | |
| Unamortized discount, net | | | (12 | ) | | (9 | ) |
| Current maturities | | | (239 | ) | | (691 | ) |
| Total | | $ | 2,557 | | $ | 2,049 | |
In July 2009, Occidental repaid its $600 million debt associated with Dolphin Energy's debt. Also, in July 2009, Dolphin Energy refinanced its debt on a limited-recourse basis. Occidental provided guarantees limited to certain political and other events. The fair value of these guarantees was immaterial. At December 31, 2009, the notional amount was approximately $300 million, which represented a substantial majority of Occidental's total guarantees.
In May 2009, Occidental issued $750 million of 4.125-percent senior unsecured notes due 2016, receiving $740 million of net proceeds. Interest on the notes will be payable semi-annually in arrears on June 1 and December 1 of each year.
In October 2008, Occidental issued $1 billion of 7-percent senior unsecured notes due 2013, receiving $985 million of net proceeds. Interest on the notes will be payable semi-annually in arrears on May 1 and November 1 of each year.
Occidental has a $1.5 billion bank credit facility (Credit Facility) through September 2012, which adjusts to $1.4 billion in September 2011. The Credit Facility provides for the termination of the loan commitments and requires immediate repayment of any outstanding amounts if certain events of default occur or if Occidental files for bankruptcy. Up to $350 million of the Credit Facility is available in the form of letters of credit. Occidental did not draw down any amounts under the Credit Facility during 2009. Available but unused lines of committed bank credit totaled approximately $1.5 billion at December 31, 2009.
None of Occidental's committed bank credits contain material adverse change clauses or debt ratings triggers that could restrict Occidental's ability to borrow under these lines. Occidental's credit facilities and debt agreements do not contain ratings triggers that could terminate bank commitments or accelerate debt in the event of a ratings downgrade. Borrowings under the Credit Facility bear interest at various benchmark rates, including LIBOR, plus a margin based on Occidental's senior debt ratings. Additionally, Occidental paid an annual facility fee of 0.05 percent in 2009 on the total commitment amount, which was based on Occidental's senior debt ratings.
In May 2007, Occidental redeemed all $276 million of the outstanding principal amount of its 8.25-percent Vintage senior notes due 2012. In January 2007, Occidental completed cash tender offers for portions of various debt instruments totaling $659 million in principal amount. The redemption and repurchases resulted in a pre-tax interest expense of $167 million.
At December 31, 2009, minimum principal payments on long-term debt subsequent to December 31, 2009 aggregated $2.8 billion, of which $239 million is due in 2010, $68 million in 2011, $368 million in 2012, $1.0 billion in 2013, zero in 2014, zero in 2015 and $1.1 billion thereafter.
As of December 31, 2009, under the most restrictive covenants of its financing agreements, Occidental had substantial capacity for additional unsecured borrowings, the payment of cash dividends and other distributions on, or acquisitions of, Occidental stock.
Occidental estimates the fair value of fixed-rate debt based on the quoted market prices for those instruments or on quoted market yields for similarly rated debt instruments, taking into account their maturities. The estimated fair values of Occidental’s debt, at December 31, 2009 and 2008, were approximately $3.1 billion and $2.9 billion, respectively, compared to carrying values of approximately $2.8 billion and $2.7 billion, respectively. Occidental's exposure to changes in interest rates relates primarily to its variable-rate, long-term debt obligations, and is not expected to be material. As of December 31, 2009, variable-rate debt constituted approximately four percent of Occidental's total debt.
The present value of minimum capital lease payments, net of the current portion, totaled $25 million at both December 31, 2009 and 2008. These amounts are included in other liabilities.
Operating and capital lease agreements, which include leases for manufacturing facilities, office space, railcars and tanks, frequently include renewal or purchase options and require Occidental to pay for utilities, taxes, insurance and maintenance expense.
At December 31, 2009, future net minimum lease payments for capital and noncancelable operating leases (excluding oil and gas and other mineral leases, utilities, taxes, insurance and maintenance expense) were the following:
| In millions | | Capital | | Operating | (a) |
| 2010 | | $ | — | | $ | 153 | |
| 2011 | | | — | | | 118 | |
| 2012 | | | — | | | 87 | |
| 2013 | | | — | | | 70 | |
| 2014 | | | — | | | 59 | |
| Thereafter | | | 26 | | | 630 | |
| Total minimum lease payments | | | 26 | | $ | 1,117 | |
| Less: | | | | | | | |
| Imputed interest | | | 1 | | | | |
| Present value of minimum capital lease payments | | $ | 25 | | | | |
| (a) | At December 31, 2009, these operating lease payments are net of sublease rental amounts of $15 million, which are to be received as follows (in millions): 2010—$4, 2011—$4, 2012—$4, 2013—$2 and 2014—$1. | |
Rental expense for operating leases, net of sublease rental income, was $172 million in 2009, $178 million in 2008 and $196 million in 2007. Rental expense was net of sublease income of $4 million, $7 million and $7 million in 2009, 2008 and 2007, respectively.
| Note 7 | Derivative Activities |
Objective & Strategy
Occidental has used derivatives to reduce its long-term exposure to price volatility on a small portion of its oil and gas production. Through its low-risk marketing and trading activities and within its established policy controls and procedures, Occidental has also used derivative instruments, including a combination of short-term futures, forwards, options and swaps to improve realized prices for its oil and gas.
Additionally, Occidental, through its Phibro subsidiary, will also engage in trading activities using derivatives for the purpose of generating profits mainly from market price changes of commodities.
Refer to Note 1 for Occidental’s accounting policy on derivatives.
Cash-Flow Hedges
Occidental holds a series of collar agreements that qualify as cash-flow hedges for the sale of approximately 2 percent of its crude oil production. These agreements continue to the end of 2011. The following table presents the daily quantities and weighted-average strike prices of Occidental's collar positions as of December 31, 2009:
| | | Crude Oil Collars |
| | | Daily Volume (barrels) | | Average Floor | | Average Cap |
| 2010 | | 12,000 | | $33.00 | | $46.35 |
| 2011 | | 12,000 | | $32.92 | | $46.27 |
In 2009, Occidental entered into financial swap agreements related to the sale of a portion of its natural gas production from the Rockies that qualify as cash-flow hedges. The following table presents the daily quantities and weighted-average hedged prices that will be received by Occidental as of December 31, 2009:
| | | Natural Gas Swaps |
| | | Daily Volume | | Average Strike Price |
| January 2010 - December 2010 | | 40 million cubic feet | | $5.03 |
| December 2010 - March 2012 | | 50 million cubic feet | | $6.07 |
Occidental’s marketing and trading operations store natural gas purchased from third parties at Occidental’s leased storage facilities. Derivative instruments are used to fix margins on the future sales of the stored volumes. These agreements continue through 2010. As of December 31, 2009, Occidental had approximately 28 billion cubic feet of natural gas held in storage. Occidental has designated the forecasted sale of approximately 24 billion cubic feet of natural gas from storage as cash-flow hedges.
The following table presents the pre-tax gains (losses) recognized in and reclassified from Accumulated Other Comprehensive Income (AOCI) and recognized in income (net sales), including any hedge ineffectiveness, for derivative instruments classified as cash-flow hedges for the year ended December 31, 2009:
Cash-Flow Hedges (in millions) | | Gains (Losses) Recognized in AOCI – Effective Portion | | Amount of (Gains) Losses Reclassified from AOCI into Income – Effective Portion | | Gains Recognized in Income – Ineffective Portion | |
Commodity contracts | | | | | | | | | | | | | |
| Occidental’s crude oil production | | $ | (162 | ) | | $ | 74 | | | $ | 10 | | |
| Occidental’s natural gas production | | | (2 | ) | | | — | | | | — | | |
Commodity contracts | | | | | | | | | | | | | |
| Natural gas storage | | | 19 | | | | (50 | ) | | | — | | |
| Total | | $ | (145 | ) | | $ | 24 | | | $ | 10 | | |
The following table summarizes net after-tax derivative activity recorded in AOCI for the years ended December 31, 2009 and 2008:
| In millions | | 2009 | | 2008 | |
| Beginning Balance | | $ | (150 | ) | $ | (441 | ) |
| Gains (losses) from changes in cash-flow hedges | | | (93 | ) | | 207 | |
| Losses reclassified to income | | | 16 | | | 84 | |
| Ending Balance | | $ | (227 | ) | $ | (150 | ) |
During the next twelve months, Occidental expects that approximately $106 million of net after-tax derivative losses included in AOCI, based on their valuation as of December 31, 2009, will be reclassified into income.
Derivatives Not Designated as Hedging Instruments
Occidental’s third-party marketing and trading activities have been focused on purchasing crude oil and natural gas for resale from partners, producers and third parties whose oil and gas supply is located near the midstream and marketing assets; such as pipelines, processing plants and storage facilities, that are owned or leased by Occidental. These purchases allow Occidental to aggregate volumes to maximize prices received for Occidental’s production. The aggregate volumes and durations of these third-party marketing and trading purchase and sales contracts generally approximate each other. In addition, Occidental’s trading unit, Phibro, uses derivative instruments to profit from market price changes.
The following table presents gross volumes of Occidental’s commodity derivatives not designated as hedging instruments as of December 31, 2009:
| Commodity | | Volumes | |
| Occidental’s production sales contracts | | | |
| Crude oil | | 9 million barrels | |
| | | | |
| Third-party marketing and trading activities | | | |
| Purchase contracts | | | |
| Crude oil | | 161 million barrels | |
| Natural gas | | 1,386 billion cubic feet | |
| Electricity | | 408,000 megawatt hours | |
| | | | |
| Sales contracts | | | |
| Crude oil | | 182 million barrels | |
| Natural gas | | 1,556 billion cubic feet | |
| Electricity | | 408,000 megawatt hours | |
In addition, Occidental has certain other commodity trading contracts, including agricultural products, metals, precious metals and foreign exchange contracts, which were not material to Occidental as of December 31, 2009.
Approximately $61 million of gains from derivatives not designated as hedging instruments were recognized in net sales for the year ended December 31, 2009.
The following table presents the gross fair value of Occidental’s outstanding derivatives as of December 31, 2009:
| | | Asset Derivatives | | Fair | | Liability Derivatives | | Fair | |
| (in millions) | | Balance Sheet Location | | Value | | Balance Sheet Location | | Value | |
Cash-flow hedges (a) | | | | | | | | | | | |
| | | Marketing and trading assets and other | | $ | 2 | | Accrued liabilities | | $ | (168 | ) |
| Commodity contracts | | Long-term receivables and other assets, net | | | 5 | | Deferred credits and other liabilities | | | (174 | ) |
| | | | | $ | 7 | | | | $ | (342 | ) |
| | | | | | | | | | | | |
Derivatives not designated as hedging instruments (a) | | | | | | | | | | | |
| | | Marketing and trading assets and other | | $ | 776 | | Accrued liabilities | | $ | (789 | ) |
| Commodity contracts | | Long-term receivables and other assets, net | | | 72 | | Deferred credits and other liabilities | | | (69 | ) |
| | | | | | 848 | | | | | (858 | ) |
| Total gross fair value of derivatives | | | | | 855 | | | | | (1,200 | ) |
| Less: counterparty netting and cash collateral | | | | | (642 | ) | | | | 648 | |
| Total net fair value of derivatives | | | | $ | 213 | | | | $ | (552 | ) |
| (a) | The above fair values are presented at gross amounts, including when the derivatives are subject to master netting arrangements and qualify for net presentation in the consolidated balance sheet. | |
See Note 15 for fair value measurement disclosures on derivatives.
Credit Risk
A majority of Occidental’s derivative transactions are exchange-traded contracts, which are subject to nominal credit risk as a significant portion of these transactions are executed on a daily margin basis. Cash collateral of $222 million deposited by Occidental with clearing houses, which has not been reflected in the derivative fair value tables, is included in the marketing and trading assets and other balance as of December 31, 2009.
In addition, Occidental executes a portion of its derivative transactions in the over-the-counter (OTC) market with various high-credit-quality counterparties. Occidental is subject to counterparty credit risk to the extent the counterparty to the derivatives is unable to meet its settlement commitments. Occidental manages this credit risk by selecting
counterparties that it believes to be financially strong, by spreading the credit risk among many such counterparties, and by entering into master netting arrangements with the counterparties, as appropriate. Occidental actively monitors the creditworthiness of each counterparty and records valuation adjustments to reflect counterparty risk, if necessary. Certain of Occidental's OTC derivative instruments contain collateral thresholds. If the credit exposure exceeds collateral thresholds or if Occidental’s or the counterparty’s credit rating is reduced by the major credit rating agencies, Occidental or the counterparty may be required to post collateral via available cash or letters of credit to satisfy the difference between the current exposure and the negotiated credit threshold. As of December 31, 2009, Occidental had a net liability of $357 million for which Occidental has posted $43 million of collateral in the normal course of business. This net liability amount of $357 million represents the fair value of derivative instruments with credit-risk-related contingent features. Occidental believes that if it had received a one-notch reduction in its credit rating, it would not have resulted in a material change in its collateral-posting requirements as of December 31, 2009.
Foreign Currency Risk
Occidental’s foreign operations have currency risk. Occidental manages its exposure primarily by balancing monetary assets and liabilities and maintaining cash positions in foreign currencies only at levels necessary for operating purposes. Most international crude oil sales are denominated in U.S. dollars. Additionally, all of Occidental’s consolidated foreign oil and gas subsidiaries have the U.S. dollar as the functional currency. The effect of exchange rates on transactions in foreign currencies is included in periodic income.
| Note 8 | Environmental Liabilities and Expenditures |
Occidental’s operations are subject to stringent federal, state, local and foreign laws and regulations relating to improving or maintaining environmental quality. Occidental’s environmental compliance costs have generally increased over time and could continue to rise in the future. Occidental factors environmental expenditures for its operations into its business planning process as an integral part of producing quality products responsive to market demand.
Environmental Remediation
The laws that require or address environmental remediation, including CERCLA and similar federal, state, local and foreign laws, may apply retroactively and regardless of fault, the legality of the original activities or the current ownership or control of sites. OPC or certain of its subsidiaries participate in or actively monitor a range of remedial activities and government or private proceedings under these laws with respect to alleged past practices at operating, closed and third-party sites. Remedial activities may include one or more of the following: investigation involving sampling, modeling, risk assessment or monitoring; cleanup measures including removal, treatment or disposal; or operation and maintenance of remedial systems. The environmental proceedings seek funding or performance of remediation and, in some cases, compensation for alleged property damage, punitive damages, civil penalties, injunctive relief and government oversight costs.
As of December 31, 2009, Occidental participated in or monitored remedial activities or proceedings at 168 sites. The following table presents Occidental’s environmental remediation reserves as of December 31, 2009, 2008 and 2007, the current portion of which is included in accrued liabilities ($84 million in 2009, $68 million in 2008 and $69 million in 2007) and the remainder in deferred credits and other liabilities — other ($319 million in 2009, $371 million in 2008 and $388 million in 2007). The reserves are grouped as environmental remediation sites listed or proposed for listing by the U.S. Environmental Protection Agency on the CERCLA NPL (NPL sites) and three categories of non-NPL sites — third-party sites, Occidental-operated sites and closed or non-operated Occidental sites.
| | | | | | | | |
| $ amounts in millions | | 2009 | | 2008 | | 2007 | |
| | | Number of Sites | | Reserve Balance | | Number of Sites | | Reserve Balance | | Number of Sites | | Reserve Balance | |
| NPL sites | | 39 | | | | $ | 57 | | | 40 | | | | $ | 60 | | | 39 | | | | $ | 81 | | |
| Third-party sites | | 81 | | | | | 104 | | | 76 | | | | | 117 | | | 79 | | | | | 124 | | |
| Occidental-operated sites | | 19 | | | | | 126 | | | 19 | | | | | 127 | | | 18 | | | | | 121 | | |
| Closed or non-operated Occidental sites | | 29 | | | | | 116 | | | 31 | | | | | 135 | | | 27 | | | | | 131 | | |
| | | | | | | | | | | | | | | | | | | | | | | | | | |
| Total | | 168 | | | | $ | 403 | | | 166 | | | | $ | 439 | | | 163 | | | | $ | 457 | | |
As of December 31, 2009, Occidental’s environmental reserves exceeded $10 million each at 14 of the 168 sites described above, and 118 of the sites had reserves from $0 to $1 million each.
As of December 31, 2009, two landfills in western New York owned by Occidental accounted for 70 percent of its reserves associated with NPL sites. Maxus Energy Corporation has retained the liability and indemnified Occidental for 17 of the remaining NPL sites.
As of December 31, 2009, Maxus has also retained the liability and indemnified Occidental for 16 of the 81 third-party sites. Two of the remaining 65 third-party sites — a former copper mining and smelting operation in Tennessee and an active refinery in Louisiana where Occidental reimburses the current owner and operator for certain remedial activities — accounted for 54 percent of Occidental’s reserves associated with these sites.
Five sites — chemical plants in Kansas, Louisiana and New York and two groups of oil and gas properties in the southwestern United States — accounted for 71 percent of the reserves associated with the Occidental-operated sites. Five other sites — former chemical plants in Delaware, Michigan, Tennessee and Washington and a closed coal mine in Pennsylvania — accounted for 75 percent of the reserves associated with closed or non-operated Occidental sites.
The following table shows environmental reserve activity for the past three years:
| In millions | | 2009 | | 2008 | | 2007 | |
Balance — Beginning of Year | | $ | 439 | | $ | 457 | | $ | 412 | |
| Remediation expenses and interest accretion | | | 26 | | | 29 | | | 108 | |
| Changes from acquisitions/dispositions | | | 4 | | | 25 | | | 5 | |
| Payments | | | (66 | ) | | (72 | ) | | (68 | ) |
| Balance — End of Year | | $ | 403 | | $ | 439 | | $ | 457 | |
Occidental expects to expend funds corresponding to about half of the current environmental reserves over the next four years and the balance over the subsequent ten or more years. Occidental believes its range of reasonably possible additional loss beyond those liabilities recorded for environmental remediation at the sites described above could be up to $375 million.
Environmental Costs
Occidental’s environmental costs, some of which include estimates, are shown below for each segment for the years ended December 31:
| In millions | | 2009 | | 2008 | | 2007 | |
| Operating Expenses | | | | | | | | | | |
| Oil and Gas | | $ | 123 | | $ | 127 | | $ | 99 | |
| Chemical | | | 67 | | | 85 | | | 80 | |
| Midstream and Marketing | | | 14 | | | 20 | | | 9 | |
| | | $ | 204 | | $ | 232 | | $ | 188 | |
| Capital Expenditures | | | | | | | | | | |
| Oil and Gas | | $ | 83 | | $ | 104 | | $ | 55 | |
| Chemical | | | 15 | | | 18 | | | 14 | |
| Midstream and Marketing | | | 4 | | | 6 | | | 4 | |
| | | $ | 102 | | $ | 128 | | $ | 73 | |
| Remediation Expenses | | | | | | | | | | |
| Corporate | | $ | 25 | | $ | 28 | | $ | 107 | |
Operating expenses are incurred on a continual basis. Capital expenditures relate to longer-lived improvements in currently operating properties. Remediation expenses relate to existing conditions from past operations.
| Note 9 | Lawsuits, Claims, Commitments, Contingencies and Related Matters |
OPC or certain of its subsidiaries are named, in the normal course of business, in lawsuits, claims and other legal proceedings that seek, among other things, compensation for alleged personal injury, breach of contract, property damage, punitive damages, civil penalties or other losses, or injunctive or declaratory relief. OPC or certain of its subsidiaries also have been named in proceedings under CERCLA and similar federal, state, local and foreign environmental laws. These environmental proceedings seek funding or performance of remediation and, in some cases, compensation for alleged property damage, punitive damages, civil penalties and injunctive relief; however, Occidental is usually one of many companies in these proceedings and has to date been successful in sharing response costs with other financially sound companies. With respect to all such lawsuits, claims and proceedings, including environmental proceedings, Occidental accrues reserves when it is probable a liability has been incurred and the amount of loss can be reasonably estimated.
Lawsuits filed in Nicaragua against Occidental Chemical Corporation (OxyChem) and other companies that once manufactured or used the pesticide dibromochloropropane (DBCP) claim damages of several billion dollars for alleged personal injuries. In the opinion of management, the claims against OxyChem are without merit because, among other things, the DBCP it manufactured was never sold or used in Nicaragua. Nicaraguan courts have entered judgments of approximately $900 million against four defendants, including OxyChem, which, if affirmed and ultimately enforced, would
be shared equally among the defendants. When the plaintiffs attempted to enforce one judgment in Miami, the federal district court granted summary judgment in favor of OxyChem and refused to enforce the judgment, finding the Nicaraguan court lacked personal jurisdiction because OxyChem DBCP was not used in Nicaragua, OxyChem did not have sufficient contacts with Nicaragua, and other grounds for dismissal. OxyChem has no assets in Nicaragua and, in the opinion of management, no such Nicaraguan judgment would be enforceable in the United States.
During the course of its operations, Occidental is subject to audit by tax authorities for varying periods in various federal, state, local and foreign tax jurisdictions. While the audits for taxable years through 2007 have concluded for U.S. federal income tax purposes, the 2008 and 2009 taxable years are currently under audit by the U.S. Internal Revenue Service pursuant to its compliance assurance program. Foreign government tax authorities are in various stages of auditing Occidental, and income taxes for taxable years from 2000 through 2009 remain subject to examination in certain jurisdictions. During the course of tax audits, disputes have arisen and other disputes may arise as to facts and matters of law.
Occidental has entered into agreements providing for future payments to secure terminal and pipeline capacity, drilling rigs and services, electrical power, steam and certain chemical raw materials. Occidental has certain other commitments under contracts, guarantees and joint ventures, including purchase commitments for goods and services at market-related prices and certain other contingent liabilities. At December 31, 2009, commitments for major fixed and determinable capital expenditures during 2010 and thereafter were approximately $1.2 billion.
Occidental has indemnified various parties against specified liabilities that those parties might incur in the future in connection with purchases and other transactions that they have entered into with Occidental. These indemnities usually are contingent upon the other party incurring liabilities that reach specified thresholds. As of December 31, 2009, Occidental is not aware of circumstances that it believes would reasonably be expected to lead to future indemnity claims against it in connection with these transactions that would result in payments materially in excess of reserves.
The ultimate amount of losses and the timing of any such losses that OPC and its subsidiaries may incur resulting from currently outstanding lawsuits, claims and proceedings, audits, commitments, contingencies and related matters cannot be determined reliably at this time. If these matters were ultimately resolved unfavorably at amounts substantially exceeding Occidental’s reserves, an outcome not currently expected, it is possible that such outcome could have a material adverse effect upon Occidental’s consolidated financial position or results of operations. However, after taking into account reserves, management does not expect the ultimate resolution of any of these matters to have a material adverse effect upon Occidental’s consolidated financial position or results of operations.
| Note 10 | Domestic and Foreign Income Taxes |
The domestic and foreign components of income from continuing operations before domestic and foreign income taxes and net of noncontrolling interest amounts were as follows:
| For the years ended December 31, (in millions) | | Domestic | | Foreign | | Total | |
| 2009 | | $ | 2,091 | | $ | 2,754 | | $ | 4,845 | |
| 2008 | | $ | 5,923 | | $ | 5,545 | | $ | 11,468 | |
| 2007 | | $ | 4,604 | | $ | 3,981 | | $ | 8,585 | |
The provisions (credits) for domestic and foreign income taxes on continuing operations consisted of the following:
| For the years ended December 31, (in millions) | | U.S. Federal | | State and Local | | Foreign | | Total | |
| 2009 | | | | | | | | | | | | | |
| Current | | $ | 16 | | $ | 27 | | $ | 1,368 | | $ | 1,411 | |
| Deferred | | | 606 | | | 37 | | | (136 | ) | | 507 | |
| | | $ | 622 | | $ | 64 | | $ | 1,232 | | $ | 1,918 | |
| 2008 | | | | | | | | | | | | | |
| Current | | $ | 1,558 | | $ | 166 | | $ | 2,637 | | $ | 4,361 | |
| Deferred | | | 435 | | | 29 | | | (196 | ) | | 268 | |
| | | $ | 1,993 | | $ | 195 | | $ | 2,441 | | $ | 4,629 | |
| 2007 | | | | | | | | | | | | | |
| Current | | $ | 1,371 | | $ | 125 | | $ | 1,976 | | $ | 3,472 | |
| Deferred | | | 48 | | | 14 | | | (27 | ) | | 35 | |
| | | $ | 1,419 | | $ | 139 | | $ | 1,949 | | $ | 3,507 | |
The following is a reconciliation, stated as a percentage of pre-tax income, of the United States statutory federal income tax rate to Occidental’s effective tax rate on income from continuing operations:
| For the years ended December 31, | | 2009 | | 2008 | | 2007 | |
| United States federal statutory tax rate | | 35 | % | | 35 | % | | 35 | % | |
| Operations outside the United States | | 5 | | | 6 | | | 6 | | |
| State taxes, net of federal benefit | | 1 | | | 1 | | | 1 | | |
| Other | | (1 | ) | | (2 | ) | | (1 | ) | |
| Tax rate provided by Occidental | | 40 | % | | 40 | % | | 41 | % | |
The tax effects of temporary differences resulting in deferred income taxes at December 31, 2009 and 2008 were as follows:
| | | | 2009 | | | 2008 | |
| Tax effects of temporary differences (in millions) | | | | | | | | | |
| Property, plant and equipment differences | | $ | 15 | | $ | 4,230 | | $ | 16 | | $ | 3,646 | |
| Environmental reserves | | | 144 | | | — | | | 177 | | | — | |
| Postretirement benefit accruals | | | 331 | | | — | | | 296 | | | — | |
| Deferred compensation and benefits | | | 262 | | | — | | | 240 | | | — | |
| Asset retirement obligations | | | 209 | | | — | | | 159 | | | — | |
| Derivatives | | | 132 | | | — | | | 64 | | | — | |
| Foreign tax credit carryforward | | | 426 | | | — | | | 423 | | | — | |
| State income taxes | | | 77 | | | — | | | 85 | | | — | |
| All other | | | 433 | | | 153 | | | 409 | | | 205 | |
| Subtotal | | | 2,029 | | | 4,383 | | | 1,869 | | | 3,851 | |
| Valuation allowance | | | (491 | ) | | — | | | (478 | ) | | — | |
| Total deferred taxes | | $ | 1,538 | | $ | 4,383 | | $ | 1,391 | | $ | 3,851 | |
Included in total deferred tax assets was a current portion aggregating $280 million and $200 million as of December 31, 2009 and 2008, respectively, that was reported in prepaid expenses and other. Total deferred tax assets were $1.5 billion and $1.4 billion as of December 31, 2009 and 2008, respectively, the noncurrent portion of which is netted against deferred tax liabilities.
Occidental has, as of December 31, 2009, foreign tax credit carryforwards of $426 million, which expire in varying amounts through 2019 and various state operating loss carryforwards, which have varying carryforward periods through 2025. Occidental establishes a valuation allowance against net operating losses and other deferred tax assets to the extent it believes future benefit from these assets will not be realized in the statutory carryforward periods. Substantially all of Occidental's valuation allowance is provided for foreign tax credit and state operating loss carryforwards.
A deferred tax liability has not been recognized for temporary differences related to unremitted earnings of certain consolidated foreign subsidiaries aggregating approximately $5.5 billion at December 31, 2009, as it is Occidental’s intention, generally, to reinvest such earnings permanently. If the earnings of these foreign subsidiaries were not indefinitely reinvested, an additional deferred tax liability of approximately $85 million would be required, assuming utilization of available foreign tax credits.
The discontinued operations include an income tax benefit of $2 million in 2009, a charge of $29 million in 2008 and a charge of $141 million in 2007.
Additional paid-in capital was credited $24 million in 2009, $77 million in 2008 and $43 million in 2007 for an excess tax benefit from the exercise of certain stock-based compensation awards.
As of December 31, 2009, Occidental had liabilities for unrecognized tax benefits of approximately $52 million included in deferred credits and other liabilities – other, all of which, if subsequently recognized, would have affected Occidental’s effective tax rate.
A reconciliation of the beginning and ending amount of unrecognized tax benefits is as follows:
| For the years ended December 31, (in millions) | | 2009 | | 2008 |
| Balance at January 1, | | $ | 62 | | | $ | 83 | |
| Additions based on tax positions related to the current year | | | 2 | | | | 57 | |
| Reductions based on tax positions related to prior years and settlements | | | (12 | ) | | | (78 | ) |
| Balance at December 31, | | $ | 52 | | | $ | 62 | |
Occidental records estimated potential interest and penalties related to liabilities for unrecognized tax benefits in the provisions for domestic and foreign income and other taxes and these amounts were not material for the years ended December 31, 2009, 2008 and 2007.
Occidental is subject to audit by various tax authorities in varying periods. See Note 9 for a discussion of these matters.
It is unlikely that Occidental’s liabilities for unrecognized tax benefits related to existing matters would increase or decrease within the next twelve months by a material amount. Occidental cannot reasonably estimate a range of potential changes in such benefits due to the unresolved nature of the various audits.
| Note 11 | Stockholders’ Equity |
The following is an analysis of common stock issuances:
| (shares in thousands) | | Common Stock | |
| Balance, December 31, 2006 | | 870,679 | |
| Issued | | 2,643 | |
| Options exercised and other, net | | 3,802 | |
| Balance, December 31, 2007 | | 877,124 | |
| Issued | | 1,532 | |
| Options exercised and other, net | | 2,767 | |
| Balance, December 31, 2008 | | 881,423 | |
| Issued | | 1,697 | |
| Options exercised and other, net | | 523 | |
| Balance, December 31, 2009 | | 883,643 | |
Treasury Stock
Occidental has had a 95-million share authorization in place since 2008 for its share repurchase program; however, the program does not obligate Occidental to acquire any specific number of shares and may be discontinued at any time. In 2008 and 2007, Occidental purchased 19.8 million and 20.6 million shares, respectively, under the program at an average cost of $76.33 and $54.75 per share, respectively.
Additionally, Occidental purchased shares from the trustee of its defined contribution savings plan during the years ended December 31, 2009, 2008 and 2007.
Nonredeemable Preferred Stock
Occidental has authorized 50,000,000 shares of preferred stock with a par value of $1.00 per share. At December 31, 2009, 2008 and 2007, Occidental had no outstanding shares of preferred stock.
Earnings Per Share
As discussed in Note 3, Occidental adopted new accounting guidance for EPS on January 1, 2009. Under this new accounting guidance, Occidental's instruments containing rights to nonforfeitable dividends granted in share-based payment transactions are considered participating securities prior to vesting, and, therefore, have been included in the earnings allocations in computing basic and diluted EPS under the two-class method.
Basic EPS was computed by dividing net income attributable to common stock by the weighted-average number of common shares outstanding during each period, net of treasury shares and including vested but unissued shares and share units. The computation of diluted EPS further reflected the dilutive effect of stock options and unvested stock awards. The following table presents the calculation of basic and diluted EPS for the years ended December 31:
| | | Years Ended December 31 | |
| In millions, except per-share amounts | | 2009 | | 2008 | | 2007 | |
| Basic EPS | | | | | | | | | | |
| Income from continuing operations | | $ | 2,978 | | $ | 6,955 | | $ | 5,153 | |
| Less: Income from continuing operations attributable to noncontrolling interest | | | (51 | ) | | (116 | ) | | (75 | ) |
| Income from continuing operations attributable to common stock | | | 2,927 | | | 6,839 | | | 5,078 | |
| Discontinued operations | | | (12 | ) | | 18 | | | 322 | |
| Net income attributable to common stock | | | 2,915 | | | 6,857 | | | 5,400 | |
| Less: Net income allocated to participating securities | | | (4 | ) | | (13 | ) | | (18 | ) |
| Net income attributable to common stock, net of participating securities | | $ | 2,911 | | $ | 6,844 | | $ | 5,382 | |
| Weighted average number of basic shares | | | 811.3 | | | 817.6 | | | 834.9 | |
| Basic EPS | | $ | 3.59 | | $ | 8.37 | | $ | 6.45 | |
| | | | | | | | | | | |
| Diluted EPS | | | | | | | | | | |
| Net income attributable to common stock, net of participating securities | | $ | 2,911 | | $ | 6,844 | | $ | 5,382 | |
| Weighted average number of basic shares | | | 811.3 | | | 817.6 | | | 834.9 | |
| Dilutive effect of potentially dilutive securities | | | 2.5 | | | 2.9 | | | 3.8 | |
| Total diluted weighted average common shares | | | 813.8 | | | 820.5 | | | 838.7 | |
| Diluted EPS | | $ | 3.58 | | $ | 8.34 | | $ | 6.42 | |
Accumulated Other Comprehensive Loss
Accumulated other comprehensive loss consisted of the following after-tax losses:
| Balance at December 31, (in millions) | | 2009 | | 2008 | |
| Foreign currency translation adjustments | | $ | (2 | ) | $ | (34 | ) |
| Unrealized losses on derivatives | | | (227 | ) | | (150 | ) |
Pension and post-retirement adjustments (a) | | | (363 | ) | | (365 | ) |
| Unrealized losses on securities | | | (4 | ) | | (3 | ) |
| Total | | $ | (596 | ) | $ | (552 | ) |
| (a) | See Note 13 for further information. |
| Note 12 | Stock-Based Incentive Plans |
Occidental has established several Plans that allow it to issue stock-based awards in the form of RSUs, Options, SARs, PSAs and TSRIs. At December 31, 2009, an aggregate of 66 million shares of Occidental common stock were reserved for issuance under outstanding awards and approximately 54 million shares were available for future awards. During 2009, non-employee directors were granted awards for 63,134 shares of restricted stock that fully vested on the grant date. Compensation expense for these awards was measured using the quoted market price of Occidental's common stock on the grant date and was fully recognized at that time.
The table below summarizes certain stock-based incentive amounts for the past three years:
| For the years ended December 31, (in millions) | | 2009 | | 2008 | | 2007 | |
| Compensation expense | | $ | 151 | | $ | 139 | | $ | 290 | |
| Income tax benefit recognized in the income statement | | $ | 55 | | $ | 51 | | $ | 105 | |
| Intrinsic value of options and stock-settled SAR exercises | | $ | 58 | | $ | 291 | | $ | 110 | |
Cash paid (a) | | $ | 50 | | $ | 177 | | $ | 95 | |
Fair value of RSUs and PSAs vested during the year (b) | | $ | 142 | | $ | 112 | | $ | 128 | |
| (a) | Includes cash paid under the cash-settled SARs and the cash-settled portion of the PSAs and RSUs. |
| (b) | As measured on the vesting date for the stock-settled portion of the RSUs and PSAs. |
As of December 31, 2009, there was $174 million of pre-tax unrecognized compensation expense, based on year-end valuation, related to all unvested stock-based incentive award grants. This expense is expected to be recognized over a weighted-average period of 2.4 years.
RSUs
Certain employees are awarded the right to receive cash-settled RSUs, which are equivalent in value to actual shares of Occidental common stock but are paid in cash at the time of vesting. These awards vest either in total over two years or ratably over three years after the grant date and can be forfeited or accelerated under certain conditions. For those awards which vest in total over two years, dividend equivalents are accumulated during the vesting period and are paid when they vest. For those awards which vest ratably, dividend equivalents are paid during the vesting period. The weighted-average, grant-date fair values of these awards granted in 2009, 2008 and 2007 were $66.43, $76.23 and $61.90 per share, respectively.
Certain employees are awarded the right to receive stock-settled RSUs that vest ratably over three or five years from the grant date and can be forfeited or accelerated under certain conditions. Dividend equivalents are paid during the vesting period. There were no such awards granted in 2009 and the 2008 and 2007 grants were immaterial.
A summary of changes in Occidental’s unvested cash- and stock-settled RSUs during the year ended December 31, 2009 is presented below:
| | | Cash-Settled | | Stock-Settled | |
| | | | | Weighted-Average | | | | Weighted-Average | |
| | | RSUs | | Grant-Date | | RSUs | | Grant-Date | |
| | | (000's) | | Fair Value | | (000's) | | Fair Value | |
| Unvested at January 1 | | 1,335 | | | $ | 71.97 | | | 433 | | | $ | 46.27 | | |
| Granted | | 585 | | | $ | 66.43 | | | — | | | $ | — | | |
| Vested | | (367 | ) | | $ | 69.25 | | | (370 | ) | | $ | 46.17 | | |
| Forfeitures | | (107 | ) | | $ | 72.01 | | | (2 | ) | | $ | 50.45 | | |
| Unvested at December 31 | | 1,446 | | | $ | 70.40 | | | 61 | | | $ | 46.79 | | |
Stock Options and SARs
Certain employees have been granted Options that are settled in stock and SARs that are settled either only in stock or only in cash. No Options or SARs have been granted since 2006 and all outstanding awards are vested. Exercise prices of the Options and SARs were equal to the quoted market value of Occidental’s stock on the grant date. Generally, the Options and SARs vest ratably over three years from the grant date with a maximum term of ten years. These Options and SARs may be forfeited or accelerated under certain circumstances.
The fair value of each Option, stock-settled SAR or cash-settled SAR is initially measured on the grant date using the Black Scholes option valuation model. The expected life is estimated based on the actual weighted-average life of historical exercise activity of the grantee population at the grant date. The volatility factors are based on the historical volatilities of Occidental common stock over the expected lives as estimated on the grant date. The risk-free interest rate is the implied yield available on zero coupon T-notes (US Treasury Strip) at the grant date with a remaining term equal to the expected life. The dividend yield is the expected annual dividend yield over the expected life, expressed as a percentage of the stock price on the grant date. Estimates of fair value may not accurately predict actual future events or the value ultimately realized by employees who receive stock-based incentive awards, and subsequent events may not be indicative of the reasonableness of the original estimates of fair value made by Occidental.
The following is a summary of Option and SAR transactions during the year ended December 31, 2009:
| | | Stock-Settled | | Cash-Settled | |
| | | | | | | Weighted- | | | | | | | | Weighted- | | | |
| | | | | Weighted- | | Average | | Aggregate | | | | Weighted- | | Average | | Aggregate | |
| | | SARs & | | Average | | Remaining | | Intrinsic | | | | Average | | Remaining | | Intrinsic | |
| | | Options | | Exercise | | Contractual | | Value | | SARs | | Exercise | | Contractual | | Value | |
| | | (000's) | | Price | | Term (yrs) | | (000’s) | | (000's) | | Price | | Term (yrs) | | (000’s) | |
| Beginning balance, January 1, | | 3,978 | | | $ | 34.94 | | | | | | | | | | 1,318 | | | $ | 24.66 | | | | | | | | | |
| Exercised | | (1,565 | ) | | $ | 41.94 | | | | | | | | | | (233 | ) | | $ | 24.66 | | | | | | | | | |
| Ending balance, December 31, | | 2,413 | | | $ | 30.40 | | | | 4.6 | | $ | 122,909 | | | 1,085 | | | $ | 24.66 | | | | 4.5 | | $ | 61,518 | | |
| Exercisable at December 31, | | 2,413 | | | $ | 30.40 | | | | 4.6 | | $ | 122,909 | | | 1,085 | | | $ | 24.66 | | | | 4.5 | | $ | 61,518 | | |
Occidental had certain performance-based restricted awards granted in July 2006 that vested in 2009.
PSAs and TSRIs
Certain executives are awarded PSAs and TSRIs that vest at the end of the four-year period following the grant date if performance targets are certified as being met. TSRIs granted in July 2009 had payouts that ranged from 0 to 200 percent of the target award that would settle, once certified, 60 percent in stock and 40 percent in cash. TSRIs granted in July 2008 and 2007 had payouts that ranged from 0 to 150 percent of the target award that would settle, once certified, equally in stock and cash. PSAs granted prior to July 2007 had payouts that ranged from 0 to 200 percent of the target award and provided that, once certified, the first 100 percent payout would settle only in stock and any payout in excess of 100 percent would settle in cash. Dividend equivalents for PSA and TSRI target shares are paid during the performance period regardless of the payout range or settlement provision.
The fair values of PSAs and TSRIs are initially determined based on the underlying value of Occidental's common stock and estimated payout level. The estimate of the ultimate payout level of the PSAs and TSRIs are determined on the grant date using a Monte Carlo simulation model based on Occidental's assumptions, noted in the following table, and the volatility from corresponding peer companies. The expected life is based on the vesting period (Term). The risk-free interest rate is the implied yield available on zero coupon T-notes (US Treasury Strip) at the time of grant with a remaining term equal to the Term. The dividend yield is the expected annual dividend yield over the Term, expressed as a percentage of the stock price on the grant date. Estimates of fair value may not accurately predict actual future events or the value ultimately realized by the employees who receive the awards, and subsequent events may not be indicative of the reasonableness of the original estimates of fair value made by Occidental.
The grant-date assumptions used in the Monte Carlo simulation models for the estimated payout level of PSAs and TSRIs were as follows:
| | | PSAs | | TSRIs | |
| Year Granted | | 2007 | | 2009 | | 2008 | | 2007 | |
| Assumptions used: | | | | | | | | | | | | | | | | | |
| Risk-free interest rate | | | 4.1% | | | | 2.1% | | | | 3.0% | | | | 4.4% | | |
| Dividend yield | | | 1.9% | | | | 2.0% | | | | 1.7% | | | | 1.7% | | |
| Volatility factor | | | 25% | | | | 28% | | | | 31% | | | | 26% | | |
| Expected life (years) | | | 4 | | | | 4 | | | | 4 | | | | 4 | | |
| Grant-date fair value of underlying Occidental common stock | | $ | 48.83 | | | $ | 66.74 | | | $ | 77.00 | | | $ | 61.93 | | |
The fair value of the cash-settled portion of the PSAs and TSRIs are updated quarterly through vesting for changes in Occidental common stock price and changes in estimated payout levels using a Monte Carlo simulation model and updated assumptions. Changes in value of the cash-settled portion of the PSAs and TSRIs are recorded in compensation expense each quarter. Compensation expense is recognized ratably over the vesting period for all awards, along with the quarterly change in the fair value of the cash-settled portion of the PSAs and TSRIs.
A summary of Occidental’s unvested PSAs and TSRIs as of December 31, 2009 and changes during the year ended December 31, 2009, is presented below:
| | | PSAs | | TSRIs | |
| | | | | Weighted-Average | | | | Weighted-Average | |
| | | Awards (000’s) | | Grant Date Fair Value of Occidental Stock | | Awards (000’s) | | Grant Date Fair Value of Occidental Stock | |
Unvested at January 1 (a) | | 583 | | | $ | 37.83 | | | 934 | | | $ | 68.66 | | |
Granted (a) | | — | | | $ | — | | | 804 | | | $ | 66.74 | | |
Vested (b) | | (246 | ) | | $ | 29.26 | | | — | | | $ | — | | |
| Forfeitures | | (19 | ) | | $ | 45.28 | | | (38 | ) | | $ | 67.78 | | |
Unvested at December 31 (a) | | 318 | | | $ | 43.99 | | | 1,700 | | | $ | 66.77 | | |
| (a) | Unvested awards and award grants are presented at the target payouts. |
| (b) | The weighted-average payout at vesting was 200 percent of the target. |
| Retirement Plans and Postretirement Benefits |
Occidental has various benefit plans for its salaried, domestic union and nonunion hourly, and certain foreign national employees.
Defined Contribution Plans
All domestic employees and certain foreign national employees are eligible to participate in one or more of the defined contribution retirement or savings plans that provide for periodic contributions by Occidental based on plan-specific criteria, such as base pay, age level and employee contributions. Certain salaried employees participate in a supplemental retirement plan that provides restoration of benefits lost due to governmental limitations on qualified retirement benefits. The accrued liabilities for the supplemental retirement plan were $95 million and $97 million as of December 31, 2009 and 2008, respectively, and Occidental expensed $97 million in 2009, $93 million in 2008 and $86 million in 2007 under the provisions of these defined contribution and supplemental retirement plans.
Defined Benefit Plans
Participation in defined benefit plans is limited and approximately 1,100 domestic and 2,100 foreign national employees, mainly union, nonunion hourly and certain employees that joined Occidental from acquired operations with grandfathered benefits, are currently accruing benefits under these plans.
Pension costs for Occidental’s defined benefit pension plans, determined by independent actuarial valuations, are generally funded by payments to trust funds, which are administered by independent trustees.
Other Postretirement Benefit Plans
Occidental provides medical and dental benefits and life insurance coverage for certain active, retired and disabled employees and their eligible dependents. The benefits are generally funded by Occidental as the benefits are paid during the year. The total benefit costs, including the postretirement costs, were approximately $161 million in 2009, $144 million in 2008 and $131 million in 2007.
Obligations and Funded Status
Occidental recognizes the overfunded or underfunded amounts of its defined benefit pension and postretirement plans in its financial statements and uses a measurement date of December 31. The following table shows the funding status of Occidental's plans:
| | | Pension Benefits | | Postretirement Benefits | |
| | | | | | | | | Unfunded Plans | | Funded Plans | |
For the years ended December 31, (in millions) | | 2009 | | 2008 | | 2009 | | 2008 | | 2009 | | 2008 | |
| | | | | | | | | | | | | | | | | | | | |
Changes in benefit obligation: | | | | | | | | | | | | | | | | | | | |
| Benefit obligation — beginning of year | | $ | 542 | | $ | 527 | | $ | 768 | | $ | 662 | | $ | 39 | | $ | 33 | |
| Service cost — benefits earned during the period | | | 15 | | | 14 | | | 16 | | | 13 | | | 1 | | | — | |
| Interest cost on projected benefit obligation | | | 28 | | | 30 | | | 39 | | | 36 | | | 2 | | | 2 | |
| Actuarial loss | | | 28 | | | 23 | | | 74 | | | 112 | | | 2 | | | 5 | |
| Foreign currency exchange rate loss (gain) | | | 15 | | | (16 | ) | | — | | | — | | | — | | | — | |
| Benefits paid | | | (46 | ) | | (45 | ) | | (55 | ) | | (55 | ) | | (1 | ) | | (1 | ) |
| Business acquisitions | | | — | | | — | | | 6 | | | — | | | — | | | ― | |
| Plan amendments and other | | | 1 | | | 9 | | | — | | | — | | | — | | | — | |
| | | | | | | | | | | | | | | | | | | | |
| Benefit obligation — end of year | | $ | 583 | | $ | 542 | | $ | 848 | | $ | 768 | | $ | 43 | | $ | 39 | |
| | | | | | | | | | | | | | | | | | | | |
Changes in plan assets: | | | | | | | | | | | | | | | | | | | |
| Fair value of plan assets — beginning of year | | $ | 400 | | $ | 567 | | $ | — | | $ | — | | $ | 3 | | $ | 4 | |
| Actual return on plan assets | | | 91 | | | (136 | ) | | — | | | — | | | — | | | (1 | ) |
| Foreign currency exchange rate gain (loss) | | | 6 | | | (5 | ) | | — | | | — | | | — | | | — | |
| Employer contributions | | | 31 | | | 19 | | | — | | | — | | | — | | | 1 | |
| Benefits paid | | | (46 | ) | | (45 | ) | | — | | | — | | | (1 | ) | | (1 | ) |
| | | | | | | | | | | | | | | | | | | | |
| Fair value of plan assets — end of year | | $ | 482 | | $ | 400 | | $ | — | | $ | — | | $ | 2 | | $ | 3 | |
| | | | | | | | | | | | | | | | | | | | |
| Unfunded status: | | $ | (101 | ) | $ | (142 | ) | $ | (848 | ) | $ | (768 | ) | $ | (41 | ) | $ | (36 | ) |
The projected benefit obligation, accumulated benefit obligation and fair value of plan assets for defined benefit pension plans with an accumulated benefit obligation in excess of plan assets were $184 million, $161 million and $35 million, respectively, as of December 31, 2009, and $388 million, $363 million and $233 million, respectively, as of December 31, 2008. The projected benefit obligation, accumulated benefit obligation and fair value of plan assets for defined benefit pension plans with plan assets in excess of the accumulated benefit obligation were $399 million, $390 million and $447 million, respectively, as of December 31, 2009, and $154 million, $146 million and $167 million, respectively, as of December 31, 2008.
Occidental has 401(h) accounts established within certain defined benefit pension plans. These plans allow Occidental to fund postretirement medical benefits for employees at two of its operations. Contributions to these 401(h) accounts are made at Occidental's discretion. All of Occidental's other postretirement benefit plans are unfunded.
Amounts recognized in the consolidated balance sheets consist of:
| | | Pension Benefits | | Postretirement Benefits | |
| | | | | | | | | Unfunded Plans | | Funded Plans | |
| As of December 31, (in millions) | | 2009 | | 2008 | | 2009 | | 2008 | | 2009 | | 2008 | |
| Other assets | | $ | 52 | | $ | 21 | | $ | — | | $ | — | | $ | — | | $ | — | |
| Accrued liabilities | | | (10 | ) | | (10 | ) | | (56 | ) | | (51 | ) | | — | | | — | |
| Deferred credits and other liabilities – other | | | (143 | ) | | (153 | ) | | (792 | ) | | (717 | ) | | (41 | ) | | (36 | ) |
| | | $ | (101 | ) | $ | (142 | ) | $ | (848 | ) | $ | (768 | ) | $ | (41 | ) | $ | (36 | ) |
At December 31, 2009 and 2008, AOCI included the following after-tax balances:
| | | Pension Benefits | | Postretirement Benefits | |
| | | | | | | | | Unfunded Plans | | Funded Plans | |
| As of December 31, (in millions) | | 2009 | | 2008 | | 2009 | | 2008 | | 2009 | | 2008 | |
| Net loss | | $ | 103 | | $ | 139 | | $ | 243 | | $ | 208 | | $ | 12 | | $ | 11 | |
| Prior service cost | | | 2 | | | 3 | | | 3 | | | 4 | | | — | | | — | |
| | | $ | 105 | | $ | 142 | | $ | 246 | | $ | 212 | | $ | 12 | | $ | 11 | |
Occidental does not expect any plan assets to be returned during 2010.
Components of Net Periodic Benefit Cost and Other Amounts Recognized in OCI
| | | Pension Benefits | | Postretirement Benefits | |
| | | | | | | | | | | | Unfunded Plans | | Funded Plans | |
| For the years ended December 31, (in millions) | | 2009 | | 2008 | | 2007 | | 2009 | | 2008 | | 2007 | | 2009 | | 2008 | | 2007 | |
| Net periodic benefit costs: | | | | | | | | | | | | | | | | | | | | | | | | | | | | |
| Service cost — benefits earned during the period | | $ | 15 | | $ | 14 | | $ | 9 | | $ | 16 | | $ | 13 | | $ | 12 | | $ | 1 | | $ | — | | $ | 1 | |
| Interest cost on benefit obligation | | | 28 | | | 30 | | | 27 | | | 39 | | | 36 | | | 34 | | | 2 | | | 2 | | | 2 | |
| Expected return on plan assets | | | (25 | ) | | (39 | ) | | (38 | ) | | — | | | — | | | — | | | — | | | — | | | (1 | ) |
| Amortization of prior service cost | | | 1 | | | — | | | 1 | | | 1 | | | 1 | | | 1 | | | — | | | — | | | — | |
| Recognized actuarial loss | | | 20 | | | 6 | | | 3 | | | 20 | | | 15 | | | 14 | | | 1 | | | 1 | | | 1 | |
Settlement and special termination benefits cost (a) | | | — | | | — | | | 3 | | | — | | | — | | | — | | | — | | | — | | | — | |
| Currency adjustments | | | 11 | | | (12 | ) | | 10 | | | — | | | — | | | — | | | — | | | — | | | — | |
| | | | | | | | | | | | | | | | | | | | | | | | | | | | | |
| Net periodic benefit cost | | $ | 50 | | $ | (1 | ) | $ | 15 | | $ | 76 | | $ | 65 | | $ | 61 | | $ | 4 | | $ | 3 | | $ | 3 | |
| (a) | Settlement cost relates to benefit distributions made in 2007. | |
The estimated net loss and prior service cost for the defined benefit pension plans that will be amortized from AOCI into net periodic benefit cost over the next fiscal year are $12 million and $1 million, respectively. The estimated net loss and prior service cost for the defined benefit postretirement plans that will be amortized from AOCI into net periodic benefit cost over the next fiscal year are $25 million and $1 million, respectively.
Additional Information
Occidental’s defined benefit pension and postretirement benefit plan obligations are determined based on various assumptions and discount rates. The discount rate assumptions used are meant to reflect the interest rate at which the obligations could effectively be settled on the measurement date. Occidental uses the fair value of assets to determine expected return on plan assets in calculating pension expense. Occidental funds and expenses negotiated pension increases for domestic union employees over the terms of the applicable collective bargaining agreements.
The following table sets forth the weighted-average assumptions used to determine Occidental's benefit obligation and net periodic benefit cost for domestic plans:
| | | Pension Benefits | | Postretirement Benefits | |
| | | | | | | | | Unfunded Plans | | Funded Plans | |
| For the years ended December 31, | | 2009 | | 2008 | | 2009 | | 2008 | | 2009 | | 2008 | |
| Benefit Obligation Assumptions: | | | | | | | | | | | | | | | | | | | |
| Discount rate | | 5.12 | % | | 5.25 | % | | 5.12 | % | | 5.25 | % | | 5.12 | % | | 5.25 | % | |
| Rate of compensation increase | | 4.00 | % | | 4.00 | % | | — | | | — | | | — | | | — | | |
| | | | | | | | | | | | | | | | | | | | |
| Net Periodic Benefit Cost Assumptions: | | | | | | | | | | | | | | | | | | | |
| Discount rate | | 5.25 | % | | 5.68 | % | | 5.25 | % | | 5.68 | % | | 5.25 | % | | 5.68 | % | |
| Assumed long term rate of return on assets | | 6.50 | % | | 7.00 | % | | — | | | — | | | 6.50 | % | | 7.00 | % | |
| Rate of compensation increase | | 4.00 | % | | 4.00 | % | | — | | | — | | | — | | | — | | |
For domestic pension plans and postretirement benefit plans, Occidental based the discount rate on the Hewitt Bond Universe yield curve in 2009 and 2008. The weighted-average rate of increase in future compensation levels is consistent with Occidental’s past and anticipated future compensation increases for employees participating in retirement plans that determine benefits using compensation. The assumed long-term rate of return on assets is estimated with regard to current market factors but within the context of historical returns. Occidental considers historical returns and correlation of equities and fixed income securities and current market factors such as inflation and interest rates.
For pension plans outside the United States, Occidental based its discount rate on rates indicative of government or investment grade corporate debt in the applicable country, taking into account hyperinflationary environments when necessary. The discount rates used for the foreign pension plans ranged from 1.5 percent to 12.0 percent at both December 31, 2009 and 2008. The average rate of increase in future compensation levels ranged from a low of 1.5 percent to a high of 12.0 percent in 2009, depending on local economic conditions. The expected long-term rate of return on plan assets was 6.9 percent and 5.2 percent in excess of local inflation in 2009 and 2008, respectively.
The postretirement benefit obligation was determined by application of the terms of medical and dental benefits and life insurance coverage, including the effect of established maximums on covered costs, together with relevant actuarial assumptions and health care cost trend rates projected at an assumed Consumer Price Index (CPI) increase of 2.55 percent and 2.25 percent as of December 31, 2009 and 2008, respectively. Beginning in 1993, participants other than certain union employees have paid for all medical cost increases in excess of increases in the CPI. For those union employees, the health care cost trend rates were projected at annual rates ranging ratably from 9 percent in 2009 to 6 percent through the year 2015 and level thereafter. A 1-percent increase or a 1-percent decrease in these assumed health care cost trend rates would result in an increase of $26 million or a reduction of $25 million, respectively, in the postretirement benefit obligation as of December 31, 2009, and a corresponding increase or reduction of $2 million in interest cost in 2009. The annual service costs would not be materially affected by these changes.
The actuarial assumptions used could change in the near term as a result of changes in expected future trends and other factors that, depending on the nature of the changes, could cause increases or decreases in the plan liabilities.
Fair Value of Pension and Postretirement Plan Assets
Occidental employs a total return investment approach that uses a mix of equity and fixed income investments to maximize the long-term return of plan assets at a prudent level of risk. The investments are monitored by Occidental’s Investment Committee in its role as fiduciary. The Investment Committee, consisting of senior Occidental executives, selects and employs various external professional investment management firms to manage specific investments across the spectrum of asset classes. The resulting aggregate investment portfolio contains a diversified blend of equity and fixed-income investments. Equity investments are diversified across United States and non-United States stocks, as well as differing styles and market capitalizations. Other asset classes such as private equity and real estate may be used to enhance long-term returns while improving portfolio diversification. The target allocation of plan assets is 60 percent equity securities and 40 percent debt securities. Investment performance is measured and monitored on an ongoing basis through quarterly investment and manager guideline compliance reviews, annual liability measurements, and periodic studies.
Pension and postretirement plan assets are measured at fair value. Common stocks, publicly registered mutual funds, U.S. government securities, corporate bonds, convertible bonds, and preferred stocks are valued using quoted market prices in active markets when available. When quoted market prices are not available, these investments are valued using pricing models with observable inputs from both active and non-active markets. Common/collective trusts are valued at the net asset value (NAV) of the units provided by the fund issuer, which represents the quoted price in a non-active market. Collateral received for securities loaned include investments in short-term investment funds. The short-term investment funds are valued at the NAV of the units provided by the fund issuer. Partnerships and joint ventures are valued using the liquidation value, which approximates fair value. The guaranteed deposit account is valued using a composite market value factor, which approximates fair value.
The fair values of Occidental’s pension plan assets by asset category are as follows (in millions):
| | | Using Fair Value Measurements at December 31, 2009 | |
| Description | | Level 1 | | Level 2 | | Level 3 | | Total | |
| Asset Category: | | | | | | | | | | | | | | | | | | | | | |
| Cash and cash equivalents | | | $ | 1 | | | | $ | — | | | | $ | — | | | | $ | 1 | | |
| Collateral received for securities loaned | | | | — | | | | | 11 | | | | | — | | | | | 11 | | |
| U.S. government securities | | | | 17 | | | | | 23 | | | | | — | | | | | 40 | | |
Corporate bonds (a) | | | | — | | | | | 55 | | | | | — | | | | | 55 | | |
Common/collective trusts and mutual funds (b) | | | | 144 | | | | | 47 | | | | | — | | | | | 191 | | |
Common and preferred stocks (c) | | | | 187 | | | | | — | | | | | — | | | | | 187 | | |
| Other | | | | — | | | | | — | | | | | 18 | | | | | 18 | | |
Total pension plan assets (d) | | | $ | 349 | | | | $ | 136 | | | | $ | 18 | | | | $ | 503 | | |
| (a) | This category represents investment grade bonds of U.S. and non-U.S. issuers from diverse industries. | |
| (b) | This category includes investment funds that primarily invest in U.S. and non-U.S. common stocks and fixed income securities. | |
| (c) | This category represents investment in U.S. and non-U.S. common and preferred stocks from diverse industries. | |
| (d) | Amount excludes net payables of $21 million as of December 31, 2009. | |
The activity during the year ended December 31, 2009 for the assets using Level 3 fair value measurements was not significant.
Occidental expects to contribute $11 million to its defined benefit pension plans during 2010. All of the contributions are expected to be in the form of cash.
Estimated future benefit payments, which reflect expected future service, as appropriate, are as follows:
| For the years ended December 31, (in millions) | | Pension Benefits | | Postretirement Benefits | |
| 2010 | | | $ | 45 | | | | $ | 59 | | |
| 2011 | | | $ | 48 | | | | $ | 60 | | |
| 2012 | | | $ | 49 | | | | $ | 59 | | |
| 2013 | | | $ | 51 | | | | $ | 58 | | |
| 2014 | | | $ | 54 | | | | $ | 57 | | |
| 2015 — 2019 | | | $ | 281 | | | | $ | 276 | | |
| Investments and Related-Party Transactions |
At December 31, 2009 and 2008, investments in unconsolidated entities, including advances, comprised $1.7 billion and $1.3 billion of equity-method investments, respectively.
Equity Investments
At December 31, 2009, Occidental’s equity investments consisted mainly of a 24.5-percent interest in the stock of Dolphin Energy, an approximately 22-percent interest in the General Partner of Plains All-American Pipeline L.P. and various other partnerships and joint ventures. Equity investments paid dividends of $139 million, $111 million and $33 million to Occidental in 2009, 2008 and 2007, respectively. At December 31, 2009, cumulative undistributed earnings of equity-method investees since their respective acquisitions were $306 million. At December 31, 2009, Occidental's investments in equity investees exceeded the underlying equity in net assets by $938 million, of which $174 million represents goodwill and $764 million relates to assets, including intangibles, which are being amortized over their estimated useful lives.
The following table presents Occidental’s ownership interest in the summarized financial information of its equity-method investments:
| For the years ended December 31, (in millions) | | 2009 | | 2008 | | 2007 | |
| | | | | | | | | | | |
| Revenues | | $ | 1,080 | | $ | 860 | | $ | 463 | |
| Costs and expenses | | | 847 | | | 647 | | | 381 | |
| | | | | | | | | | | |
| Net income | | $ | 233 | | $ | 213 | | $ | 82 | |
| | | | | | | | | | | |
| As of December 31, (in millions) | | 2009 | | 2008 | | | | |
| | | | | | | | | | | |
| Current assets | | $ | 1,422 | | $ | 411 | | | | |
| Non-current assets | | $ | 2,904 | | $ | 1,655 | | | | |
| Current liabilities | | $ | 713 | | $ | 387 | | | | |
| Long-term debt | | $ | 1,951 | | $ | 726 | | | | |
| Other non-current liabilities | | $ | 138 | | $ | 116 | | | | |
| Stockholders’ equity | | $ | 1,524 | | $ | 837 | | | | |
Occidental’s investment in Dolphin, which was acquired in 2002, consists of two separate economic interests through which Occidental owns (i) a 24.5-percent undivided interest in the assets and liabilities associated with a DPSA which is proportionately consolidated in the financial statements; and (ii) a 24.5-percent interest in the stock of Dolphin Energy, which is accounted for as an equity investment.
In Ecuador, Occidental has a 14-percent interest in the Oleoducto de Crudos Pesados Ltd. (OCP) oil export pipeline, which Occidental records as an equity investment.
Occidental has a 50-percent interest in Elk Hills Power, LLC (EHP), a limited liability company that operates a gas-fired, power-generation plant in California, which it accounts for as an equity-method investment.
Related-Party Transactions
Occidental purchases power, steam and chemicals from and sells oil, gas, chemicals and power to certain of its equity investees at market-related prices. During 2009, 2008 and 2007, Occidental entered into the following related-party transactions and had the following amounts due from or to its related parties:
| December 31, (in millions) | | 2009 | | 2008 | | 2007 | |
Purchases (a) | | $ | 174 | | $ | 315 | | $ | 236 | |
| Sales | | $ | 222 | | $ | 433 | | $ | 351 | |
| Services | | $ | 2 | | $ | 1 | | $ | 1 | |
| Advances and amounts due from | | $ | 123 | | $ | 8 | | $ | 184 | |
| Amounts due to | | $ | 112 | | $ | — | | $ | — | |
| In 2009, 2008 and 2007, purchases from EHP accounted for 73 percent, 97 percent and 98 percent, respectively. | |
| Note 15 | Fair Value Measurements |
Fair Values - Recurring
The following tables provide fair value measurement information for such assets and liabilities that are measured on a recurring basis (in millions):
| | | Fair Value Measurements at December 31, 2009 Using | | | | | |
| Description | | Level 1 | | Level 2 | | Level 3 | | Netting and Collateral | (a) | Total Fair Value | |
| Assets: | | | | | | | | | | | | | | | | | | | | | |
| Trading securities | | | | | | | | | | | | | | | | | | | | | |
| Marketing and trading assets and other, net | | $ | 230 | | | $ | — | | | $ | — | | | $ | — | | | $ | 230 | | |
| Derivative financial instruments | | | | | | | | | | | | | | | | | | | | | |
| Marketing and trading assets and other, net | | | 373 | | | | 405 | | | | — | | | | (600 | ) | | | 178 | | |
| Long-term receivables, net | | | — | | | | 77 | | | | — | | | | (42 | ) | | | 35 | | |
| Total assets | | $ | 603 | | | $ | 482 | | | $ | — | | | $ | (642 | ) | | $ | 443 | | |
| | | | | | | | | | | | | | | | | | | | | | |
| Liabilities: | | | | | | | | | | | | | | | | | | | | | |
| Derivative financial instruments | | | | | | | | | | | | | | | | | | | | | |
| Accrued liabilities | | $ | 412 | | | $ | 545 | | | $ | — | | | $ | (606 | ) | | $ | 351 | | |
| Deferred credits and other liabilities-other | | | — | | | | 243 | | | | — | | | | (42 | ) | | | 201 | | |
| Total liabilities | | $ | 412 | | | $ | 788 | | | $ | — | | | $ | (648 | ) | | $ | 552 | | |
| | | Fair Value Measurements at December 31, 2008 Using | | | | | |
| Description | | Level 1 | | Level 2 | | Level 3 | | Netting and Collateral | (a) | Total Fair Value | |
| Assets: | | | | | | | | | | | | | | | | | | | | | |
| Derivative financial instruments | | | | | | | | | | | | | | | | | | | | | |
| Marketing and trading assets and other, net | | $ | 611 | | | $ | 785 | | | $ | — | | | $ | (1,150 | ) | | $ | 246 | | |
| Long-term receivables, net | | | 3 | | | | 85 | | | | — | | | | (29 | ) | | | 59 | | |
| Total assets | | $ | 614 | | | $ | 870 | | | $ | — | | | $ | (1,179 | ) | | $ | 305 | | |
| | | | | | | | | | | | | | | | | | | | | | |
| Liabilities: | | | | | | | | | | | | | | | | | | | | | |
| Derivative financial instruments | | | | | | | | | | | | | | | | | | | | | |
| Accrued liabilities | | $ | 698 | | | $ | 652 | | | $ | — | | | $ | (1,150 | ) | | $ | 200 | | |
| Deferred credits and other liabilities-other | | | — | | | | 273 | | | | — | | | | (29 | ) | | | 244 | | |
| Total liabilities | | $ | 698 | | | $ | 925 | | | $ | — | | | $ | (1,179 | ) | | $ | 444 | | |
| (a) | Represents the impact of netting assets, liabilities and collateral when a legal right of offset exists. | |
Fair Values - Nonrecurring
At year-end, Occidental evaluates its significant properties for potential impairment. Based on this annual impairment evaluation, certain Argentine producing properties were impaired as of December 31, 2009. The fair value of the PP&E was $144 million, resulting in an impairment charge of $170 million, and was measured using an income approach based upon internal estimates of future production levels, prices, costs and a discount rate, which were Level 3 inputs.
Financial Instruments Fair Value
The carrying amounts of cash and cash equivalents and other on-balance-sheet financial instruments, other than fixed-rate debt, approximate fair value. The cost, if any, to terminate off-balance-sheet financial instruments is not significant.
| Note 16 | Industry Segments and Geographic Areas |
Occidental conducts its continuing operations through three segments: (1) oil and gas; (2) chemical; and (3) midstream and marketing. The oil and gas segment explores for, develops, produces and markets crude oil, including NGLs and condensate, as well as natural gas. The chemical segment manufactures and markets basic chemicals, vinyls and other chemicals. The midstream and marketing segment gathers, treats, processes, transports, stores, purchases and markets crude oil (including NGLs and condensate), natural gas, CO2 and power. It also trades around its assets, including pipelines and storage capacity, and trades commodities and securities.
Earnings of industry segments and geographic areas generally exclude income taxes, interest income, interest expense, environmental remediation expenses, unallocated corporate expenses and discontinued operations, but include gains and losses from dispositions of segment and geographic area assets and income from the segments’ equity investments. Intersegment sales are generally made at prices approximately equal to those that the selling entity is able to obtain in third-party transactions and eliminate upon consolidation.
Identifiable assets are those assets used in the operations of the segments. Corporate assets consist of cash, certain corporate receivables and PP&E, and the investment in Joslyn.
| Industry Segments | | | | | | | | | | | |
| In millions | | | | | | | | | | | |
| | | Oil and Gas | | Chemical | | Midstream, Marketing and Other | | Corporate and Eliminations | | Total | |
| | | | | | | | | | | | | | | | | |
| YEAR ENDED DECEMBER 31, 2009 | | | | | | | | | | | | | | | | |
| Net sales | | $ | 11,598 | (a) | $ | 3,225 | (b) | $ | 1,016 | (c) | $ | (436 | ) | $ | 15,403 | |
| | | | | | | | | | | | | | | | | |
| Pretax operating profit (loss) | | $ | 4,735 | (d,e) | $ | 389 | | $ | 235 | | $ | (514 | ) (f) | $ | 4,845 | (d) |
| Income taxes | | | — | | | — | | | — | | | (1,918 | ) | | (1,918 | ) |
| Discontinued operations, net | | | — | | | — | | | — | | | (12 | ) | | (12 | ) |
| | | | | | | | | | | | | | | | | |
| Net income (loss) | | $ | 4,735 | (d,e) | $ | 389 | | $ | 235 | | $ | (2,444 | ) (g) | $ | 2,915 | (d) |
| | | | | | | | | | | | | | | | | |
| Investments in unconsolidated entities | | $ | 118 | | $ | 131 | | $ | 1,473 | | $ | 10 | | $ | 1,732 | |
| | | | | | | | | | | | | | | | | |
Property, plant and equipment additions, net (h) | | $ | 2,907 | | $ | 213 | | $ | 583 | | $ | 39 | | $ | 3,742 | |
| | | | | | | | | | | | | | | | | |
| Depreciation, depletion and amortization | | $ | 2,688 | | $ | 298 | | $ | 110 | | $ | 21 | | $ | 3,117 | |
| | | | | | | | | | | | | | | | | |
| Total assets | | $ | 29,646 | | $ | 3,608 | | $ | 8,773 | | $ | 2,202 | | $ | 44,229 | |
| | | | | | | | | | | | | | | | | |
| YEAR ENDED DECEMBER 31, 2008 | | | | | | | | | | | | | | | | |
| Net sales | | $ | 18,187 | (a) | $ | 5,112 | (b) | $ | 1,598 | (c) | $ | (680 | ) | $ | 24,217 | |
| | | | | | | | | | | | | | | | | |
| Pretax operating profit (loss) | | $ | 10,651 | (d,e) | $ | 669 | (i) | $ | 520 | | $ | (372 | )(f) | $ | 11,468 | (d) |
| Income taxes | | | — | | | — | | | — | | | (4,629 | ) | | (4,629 | ) |
| Discontinued operations, net | | | — | | | — | | | — | | | 18 | | | 18 | |
| | | | | | | | | | | | | | | | | |
| Net income (loss) | | $ | 10,651 | (d,e) | $ | 669 | (i) | $ | 520 | | $ | (4,983 | )(g) | $ | 6,857 | (d) |
| | | | | | | | | | | | | | | | | |
| Investments in unconsolidated entities | | $ | 84 | | $ | 82 | | $ | 1,087 | | $ | 10 | | $ | 1,263 | |
| | | | | | | | | | | | | | | | | |
Property, plant and equipment additions, net (h) | | $ | 3,973 | | $ | 245 | | $ | 507 | | $ | 101 | | $ | 4,826 | |
| | | | | | | | | | | | | | | | | |
| Depreciation, depletion and amortization | | $ | 2,307 | | $ | 311 | | $ | 73 | | $ | 19 | | $ | 2,710 | |
| | | | | | | | | | | | | | | | | |
| Total assets | | $ | 28,522 | | $ | 3,457 | | $ | 6,424 | | $ | 3,134 | | $ | 41,537 | |
| | | | | | | | | | | | | | | | | |
| YEAR ENDED DECEMBER 31, 2007 | | | | | | | | | | | | | | | | |
| Net sales | | $ | 13,304 | (a) | $ | 4,664 | (b) | $ | 1,388 | (c) | $ | (572 | ) | $ | 18,784 | |
| | | | | | | | | | | | | | | | | |
| Pretax operating profit (loss) | | $ | 7,957 | (d,e) | $ | 601 | | $ | 367 | | $ | (340 | )(f) | $ | 8,585 | (d) |
| Income taxes | | | — | | | — | | | — | | | (3,507 | ) | | (3,507 | ) |
| Discontinued operations, net | | | — | | | — | | | — | | | 322 | | | 322 | |
| | | | | | | | | | | | | | | | | |
| Net income (loss) | | $ | 7,957 | (d,e) | $ | 601 | | $ | 367 | | $ | (3,525 | )(g) | $ | 5,400 | (d) |
| | | | | | | | | | | | | | | | | |
| Investments in unconsolidated entities | | $ | 81 | | $ | 118 | | $ | 584 | | $ | — | | $ | 783 | |
| | | | | | | | | | | | | | | | | |
Property, plant and equipment additions, net (h) | | $ | 2,994 | | $ | 251 | | $ | 244 | | $ | 8 | | $ | 3,497 | |
| | | | | | | | | | | | | | | | | |
| Depreciation, depletion and amortization | | $ | 1,992 | | $ | 304 | | $ | 67 | | $ | 16 | | $ | 2,379 | |
| | | | | | | | | | | | | | | | | |
| Total assets | | $ | 23,421 | | $ | 3,814 | | $ | 6,589 | | $ | 2,695 | | $ | 36,519 | |
| | | | | | | | | | | | | | | | | |
| (See footnotes on next page) | | | | | | | | | | | | | | | | |
| (a) | Crude oil sales represented approximately 87 percent, 87 percent and 85 percent of the oil and gas segment net sales for the years ended December 31, 2009, 2008 and 2007, respectively. | |
| (b) | Total product sales for the chemical segment were as follows: | |
| | | | Basic Chemicals | | Vinyls | | Other Chemicals | |
| | Year ended December 31, 2009 | | 61 | % | | 34 | % | | 5 | % | |
| | Year ended December 31, 2008 | | 58 | % | | 39 | % | | 3 | % | |
| | Year ended December 31, 2007 | | 52 | % | | 45 | % | | 3 | % | |
| (c) | Total sales for the midstream and marketing segment were as follows: | |
| | | | Gas Plants | | Cogeneration | | Marketing, Trading, Transportation and other | |
| | Year ended December 31, 2009 | | 56 | % | | 26 | % | | 18 | % | |
| | Year ended December 31, 2008 | | 60 | % | | 30 | % | | 10 | % | |
| | Year ended December 31, 2007 | | 53 | % | | 26 | % | | 21 | % | |
| (d) | Represents amount attributable to common stock after deducting noncontrolling interest amounts of $51 million, $116 million and $75 million for 2009, 2008 and 2007, respectively. | |
| (e) | The 2009 amount includes a $170 million fourth quarter pre-tax charge for the impairment of certain Argentine producing properties and an $8 million pre-tax charge for the termination of rig contracts. The 2008 amount includes a pre-tax charge of $599 million for asset impairments, including undeveloped acreage in Argentina and Yemen and domestic producing properties, and a pre-tax charge of $58 million for termination of rig contracts. The 2007 amount includes an after-tax gain of $412 million from the sale of Occidental’s interest in a Russian joint venture, an after-tax gain of $112 million from certain litigation settlements, a pre-tax gain of $103 million from the sale of exploration properties, a pre-tax gain of $35 million from the sale of miscellaneous domestic oil and gas interests and a $74 million pre-tax loss from the exploration impairments. | |
| (f) | Includes unallocated net interest expense, administration expense, environmental remediation and other pre-tax items noted in footnote (g) below. | |
| (g) | Includes the following significant items affecting earnings for the years ended December 31: | |
| | Benefit (Charge) (In millions) | | | 2009 | | | 2008 | | | 2007 | |
| | corporate | | | | | | | | | | |
| | Pre-tax operating profit (loss) | | | | | | | | | | |
| | Railcar leases | | $ | (15 | ) | $ | — | | $ | — | |
| | Severance charge | | | (40 | ) | | — | | | (25 | ) |
| | Gain on sale of Lyondell shares | | | — | | | — | | | 326 | |
| | Debt purchase expense | | | — | | | — | | | (167 | ) |
| | Facility closure | | | — | | | — | | | (47 | ) |
| | | | $ | (55 | ) | $ | — | | $ | 87 | |
| | Income taxes | | | | | | | | | | |
| | Tax effect of pre-tax adjustments * | | $ | 77 | | $ | 238 | | $ | (2 | ) |
| | | | $ | 77 | | $ | 238 | | $ | (2 | ) |
| | | | | | | | | | | | |
| | Discontinued operations, net of tax | | $ | (12 | ) | $ | 18 | | $ | 322 | |
| | * Amounts represent the tax effect of all pre-tax adjustments listed, as well as those in footnote (e). | |
| (h) | Includes capital expenditures, capitalized interest and capitalized CO2, and excludes purchases of assets, net. Also includes amounts attributable to the noncontrolling interest in a Colombian subsidiary. | |
| (i) | Includes a pre-tax charge of $90 million for plant closure and impairments. | |
Geographic Areas
In millions
| | | Net sales (a) | | Property, plant and equipment, net | |
| For the years ended December 31, | | 2009 | | 2008 | | 2007 | | 2009 | | 2008 | | 2007 | |
| United States | | $ | 9,448 | | $ | 15,258 | | $ | 12,300 | | $ | 23,440 | | $ | 22,164 | | $ | 17,838 | |
| | | | | | | | | | | | | | | | | | | | |
| Foreign | | | | | | | | | | | | | | | | | | | |
| Qatar | | | 2,201 | | | 3,298 | | | 2,145 | | | 2,842 | | | 2,896 | | | 2,964 | |
| Colombia | | | 922 | | | 1,721 | | | 1,271 | | | 688 | | | 661 | | | 402 | |
| Oman | | | 1,038 | | | 1,207 | | | 741 | | | 1,885 | | | 1,625 | | | 1,215 | |
| Yemen | | | 667 | | | 1,016 | | | 861 | | | 398 | | | 386 | | | 494 | |
| Argentina | | | 588 | | | 504 | | | 461 | | | 2,508 | | | 2,766 | | | 3,031 | |
| Libya | | | 243 | | | 748 | | | 625 | | | 968 | | | 979 | | | 222 | |
| Other Foreign | | | 296 | | | 465 | | | 380 | | | 916 | | | 789 | | | 112 | |
| Total Foreign | | | 5,955 | | | 8,959 | | | 6,484 | | | 10,205 | | | 10,102 | | | 8,440 | |
| | | | | | | | | | | | | | | | | | | | |
| Total | | $ | 15,403 | | $ | 24,217 | | $ | 18,784 | | $ | 33,645 | | $ | 32,266 | | $ | 26,278 | |
| (a) | Sales are shown by individual country based on the location of the entity making the sale. | |
2009 Quarterly Financial Data (Unaudited) | Occidental Petroleum Corporation | |
| In millions, except per-share amounts | and Subsidiaries | |
| Three months ended | | March 31 | | June 30 | | September 30 | | December 31 | |
| | | | | | | | | | | | | | |
| Segment net sales | | | | | | | | | | | | | |
Oil and gas | | $ | 2,137 | | $ | 2,726 | | $ | 3,089 | | $ | 3,646 | |
| Chemical | | | 792 | | | 811 | | | 842 | | | 780 | |
| Midstream, marketing and other | | | 228 | | | 250 | | | 285 | | | 253 | |
| Eliminations | | | (84 | ) | | (100 | ) | | (112 | ) | | (140 | ) |
| | | | | | | | | | | | | | |
| Net sales | | $ | 3,073 | | $ | 3,687 | | $ | 4,104 | | $ | 4,539 | |
| | | | | | | | | | | | | | |
| | | | | | | | | | | | | | |
| Gross profit | | $ | 904 | | $ | 1,518 | | $ | 1,869 | | $ | 2,252 | |
| | | | | | | | | | | | | | |
| Segment earnings | | | | | | | | | | | | | |
Oil and gas (b) | | $ | 545 | | $ | 1,083 | | $ | 1,464 | | $ | 1,643 | (a) |
| Chemical | | | 169 | | | 115 | | | 72 | | | 33 | |
| Midstream, marketing and other | | | 14 | | | 63 | | | 77 | | | 81 | |
| | | | 728 | | | 1,261 | | | 1,613 | | | 1,757 | |
| | | | | | | | | | | | | | |
| Unallocated corporate items | | | | | | | | | | | | | |
| Interest expense, net | | | (20 | ) | | (23 | ) | | (33 | ) | | (33 | ) |
| Income taxes | | | (241 | ) | | (455 | ) | | (549 | ) | | (673 | ) |
| Other | | | (96 | ) | | (99 | ) | | (102 | ) | | (108 | ) |
| | | | | | | | | | | | | | |
Income from continuing operations (b) | | | 371 | | | 684 | | | 929 | | | 943 | |
| Discontinued operations, net | | | (3 | ) | | (2 | ) | | (2 | ) | | (5 | ) |
| | | | | | | | | | | | | | |
Net income attributable to common stock | | $ | 368 | | $ | 682 | | $ | 927 | | $ | 938 | |
| | | | | | | | | | | | | | |
Basic earnings per common share (b) | | | | | | | | | | | | | |
| Income from continuing operations | | $ | 0.45 | | $ | 0.84 | | $ | 1.14 | | $ | 1.16 | |
| Discontinued operations, net | | | — | | | — | | | — | | | (0.01 | ) |
| | | | | | | | | | | | | | |
| Basic earnings per common share | | $ | 0.45 | | $ | 0.84 | | $ | 1.14 | | $ | 1.15 | |
| | | | | | | | | | | | | | |
| | | | | | | | | | | | | | |
Diluted earnings per common share (b) | | | | | | | | | | | | | |
| Income from continuing operations | | $ | 0.45 | | $ | 0.84 | | $ | 1.14 | | $ | 1.16 | |
| Discontinued operations, net | | | — | | | — | | | — | | | (0.01 | ) |
| | | | | | | | | | | | | | |
| Diluted earnings per common share | | $ | 0.45 | | $ | 0.84 | | $ | 1.14 | | $ | 1.15 | |
| | | | | | | | | | | | | | |
| | | | | | | | | | | | | | |
| Dividends per common share | | $ | 0.32 | | $ | 0.33 | | $ | 0.33 | | $ | 0.33 | |
| | | | | | | | | | | | | | |
| | | | | | | | | | | | | | |
| Market price per common share | | | | | | | | | | | | | |
| High | | $ | 64.00 | | $ | 71.59 | | $ | 79.58 | | $ | 85.20 | |
| Low | | $ | 47.50 | | $ | 51.52 | | $ | 58.67 | | $ | 73.74 | |
| (a) | Includes a fourth quarter pre-tax charge of $170 million for asset impairments related to certain Argentine producing properties. | |
| (b) | Represent amounts attributable to common stock after deducting noncontrolling interest amounts. | |
2008 Quarterly Financial Data (Unaudited) | Occidental Petroleum Corporation | |
| In millions, except per-share amounts | and Subsidiaries | |
| Three months ended | | March 31 | | June 30 | | September 30 | | December 31 | |
| | | | | | | | | | | | | | |
| Segment net sales | | | | | | | | | | | | | |
| Oil and gas | | $ | 4,518 | | $ | 5,501 | | $ | 5,422 | | $ | 2,746 | |
| Chemical | | | 1,267 | | | 1,386 | | | 1,454 | | | 1,005 | |
| Midstream, marketing and other | | | 405 | | | 418 | | | 381 | | | 394 | |
| Eliminations | | | (170 | ) | | (189 | ) | | (197 | ) | | (124 | ) |
| | | | | | | | | | | | | | |
| Net sales | | $ | 6,020 | | $ | 7,116 | | $ | 7,060 | | $ | 4,021 | |
| | | | | | | | | | | | | | |
| | | | | | | | | | | | | | |
| Gross profit | | $ | 3,478 | | $ | 4,334 | | $ | 4,118 | | $ | 1,612 | |
| | | | | | | | | | | | | | |
| Segment earnings | | | | | | | | | | | | | |
Oil and gas (c) | | $ | 2,888 | | $ | 3,806 | | $ | 3,618 | | $ | 339 | (a) |
| Chemical | | | 179 | | | 144 | | | 219 | | | 127 | (b) |
| Midstream, marketing and other | | | 123 | | | 161 | | | 66 | | | 170 | |
| | | | 3,190 | | | 4,111 | | | 3,903 | | | 636 | |
| | | | | | | | | | | | | | |
| Unallocated corporate items | | | | | | | | | | | | | |
| Interest expense, net | | | — | | | (7 | ) | | (3 | ) | | (16 | ) |
| Income taxes | | | (1,294 | ) | | (1,671 | ) | | (1,546 | ) | | (118 | ) |
| Other | | | (77 | ) | | (133 | ) | | (82 | ) | | (54 | ) |
| | | | | | | | | | | | | | |
Income from continuing operations (c) | | | 1,819 | | | 2,300 | | | 2,272 | | | 448 | |
| Discontinued operations, net | | | 27 | | | (3 | ) | | (1 | ) | | (5 | ) |
| | | | | | | | | | | | | | |
Net income attributable to common stock | | $ | 1,846 | | $ | 2,297 | | $ | 2,271 | | $ | 443 | |
| | | | | | | | | | | | | | |
Basic earnings per common share (c) | | | | | | | | | | | | | |
| Income from continuing operations | | $ | 2.21 | | $ | 2.79 | | $ | 2.78 | | $ | 0.55 | |
| Discontinued operations, net | | | 0.03 | | | — | | | — | | | — | |
| | | | | | | | | | | | | | |
| Basic earnings per common share | | $ | 2.24 | | $ | 2.79 | | $ | 2.78 | | $ | 0.55 | |
| | | | | | | | | | | | | | |
| | | | | | | | | | | | | | |
Diluted earnings per common share (c) | | | | | | | | | | | | | |
| Income from continuing operations | | $ | 2.19 | | $ | 2.78 | | $ | 2.77 | | $ | 0.55 | |
| Discontinued operations, net | | | 0.03 | | | — | | | — | | | — | |
| | | | | | | | | | | | | | |
| Diluted earnings per common share | | $ | 2.22 | | $ | 2.78 | | $ | 2.77 | | $ | 0.55 | |
| | | | | | | | | | | | | | |
| | | | | | | | | | | | | | |
| Dividends per common share | | $ | 0.25 | | $ | 0.32 | | $ | 0.32 | | $ | 0.32 | |
| | | | | | | | | | | | | | |
| | | | | | | | | | | | | | |
| Market price per common share | | | | | | | | | | | | | |
| High | | $ | 80.83 | | $ | 100.04 | | $ | 92.49 | | $ | 70.11 | |
| Low | | $ | 60.70 | | $ | 72.23 | | $ | 63.96 | | $ | 39.93 | |
| (a) | Includes a fourth quarter pre-tax charge of $599 million for asset impairments, including undeveloped acreage in Argentina and Yemen and domestic producing properties (included in depreciation, depletion and amortization expense), and a fourth quarter pre-tax charge of $58 million for rig contract terminations. | |
| (b) | Includes a fourth quarter pre-tax charge of $90 million for plant closure and impairments. | |
| (c) | Represent amounts attributable to common stock after deducting noncontrolling interest amounts. | |
Supplemental Oil and Gas Information (Unaudited)
The following tables set forth Occidental’s net interests in quantities of proved developed and undeveloped reserves of crude oil, NGLs, condensate and natural gas and changes in such quantities. Unless otherwise indicated hereafter, discussion of oil or oil and liquids refers to crude oil, condensate and NGLs. In addition, discussions of oil and gas production or volumes, in general, refer to sales volumes unless context requires or it is indicated otherwise. The reserves are stated after applicable royalties. The estimated reserves include Occidental's economic interests under production sharing contracts (PSCs) and other similar economic arrangements.
Occidental’s estimates of proved reserves and associated future net cash flows as of December 31, 2009 were made solely by Occidental’s technical personnel and are the responsibility of management. The reserve estimation process involves reservoir engineers, geoscientists, planning engineers and financial analysts. As part of this process, all reserves volumes are estimated by a forecast of production rates, operating costs and capital expenditures. Price differentials between benchmark prices and realized prices and specifics of each operating agreement are then used to estimate the net reserves. Production rate forecasts are derived by a number of methods, including estimates from decline curve analyses, material balance calculations that take into account the volume of substances replacing the volumes produced and associated reservoir pressure changes, or computer simulation of the reservoir performance. Operating and capital costs are forecasted using the current cost environment applied to expectations of future operating and development activities.
The current Senior Director of Worldwide Reserves and Reservoir Engineering is responsible for overseeing the preparation of reserve estimates, including the internal audit and review of Occidental's oil and gas reserves data. The Senior Director has over 28 years of experience in the upstream sector of the exploration and production business, and has held various assignments in North America, Asia and Europe. He is a three-time past Chair of the Society of Petroleum Engineers Oil and Gas Reserves Committee. He is an American Association of Petroleum Geologists (AAPG) Certified Petroleum Geologist and the current Chair of the AAPG Committee on Resource Evaluation. He is a member of the Society of Petroleum Evaluation Engineers, the Colorado School of Mines Potential Gas Committee and the UNECE Expert Group on Resource Classification. The Senior Director has Bachelor of Science and Master of Science degrees in geology from Emory University in Atlanta.
Occidental has a Corporate Reserves Review Committee (Reserves Committee), consisting of senior corporate officers, to monitor and review Occidental's oil and gas reserves. The Reserves Committee reports to the Audit Committee of Occidental's Board of Directors periodically during the year. Since 2003, Occidental has retained Ryder Scott Company, L.P. (Ryder Scott), independent petroleum engineering consultants, to review its annual oil and gas reserve estimation processes.
In 2009, Ryder Scott compared Occidental’s methods and procedures for estimating oil and gas reserves to generally accepted industry standards and reviewed certain pertinent facts interpreted and assumptions made in estimating the proved reserves volumes, preparing the economic evaluations and determining reserves classifications. Ryder Scott reviewed the specific application of such methods and procedures for selected oil and gas properties considered to be a valid representation of Occidental’s total reserves portfolio. In 2009, Ryder Scott reviewed approximately 20 percent of Occidental’s proved oil and gas reserves. Since being engaged in 2003, Ryder Scott has reviewed the specific application of Occidental’s reserve estimation methods and procedures for approximately 71 percent of Occidental’s proved oil and gas reserves. Management retains Ryder Scott to provide objective third-party input on its methods and procedures and to gather industry information applicable to Occidental’s reserve estimation and reporting process. Ryder Scott has not been engaged to render an opinion as to the reasonableness of reserves quantities reported by Occidental.
Based on its reviews, including the data, technical processes and interpretations presented by Occidental, Ryder Scott has concluded that the overall procedures and methodologies utilized in determining the proved reserves for the reviewed properties as estimated by Occidental are reasonable and consistent with generally accepted industry standards and comply with current Securities and Exchange Commission (SEC) standards.
Estimates of proved reserves are collected in a database and changes in this database are reviewed by engineering personnel to ensure accuracy. Finally, reserves volumes and changes are reviewed and approved by Occidental's senior management.
Occidental has classified its Horn Mountain (in 2007) and Pakistan (in 2007) operations as discontinued operations on a retrospective basis and excluded them from all tables in the Supplemental Oil and Gas Information section.
Effective for the year ended December 31, 2009, the SEC and the Financial Accounting Standards Board modified certain disclosure requirements for oil and gas properties. As of December 31, 2009, Occidental conformed its disclosures to the new guidelines as follows:
| | | |
| | Ø | additional disclosures were provided regarding proved undeveloped reserves, including investments and progress made to convert proved undeveloped reserves to proved developed reserves and reasons why any material amounts of proved undeveloped reserves remain undeveloped for five or more years; and |
| | | |
| | Ø | general disclosures were incorporated regarding recording of new reserves, material additions to reserve estimates and, as appropriate, reasonable technologies used to establish reserves estimates and categories; |
| | | |
| | Ø | proved oil and gas reserves were calculated using the unweighted arithmetic average of the first-day-of-the-month price for each month within the year instead of the year-end spot price; and |
| | | |
| | Ø | the standard for reasonable certainty in determination of reserves was applied using its newly defined meaning of "a high degree of confidence." |
The new rules also require that reserves coming from certain non-traditional sources and technologies be included in reserves if they can be proved. As of December 31, 2009, Occidental did not have any reserves from non-traditional sources.
Historically, Occidental’s production volumes and reserves have been reported as a mix of pre-tax and after-tax volumes while its revenues have reflected only pre-tax sales. This difference is caused by Occidental’s PSCs in the Middle East/North Africa where production is immediately taken and sold to pay the local income tax. Occidental has historically reported these volumes as additional revenues and income taxes but not additional production and reserves. To simplify Occidental’s reporting and to conform with industry practice, Occidental has included these volumes in its reserves as of December 31, 2009. Beginning in 2010, Occidental’s production volumes and revenues will be reported on the same basis.
| Oil Reserves | | | | | | | | | |
| In millions of barrels | | | | | | | | | |
| | | United States | | Latin America | (a) | Middle East/ North Africa | | Total | |
| proved developed and undeveloped reserves | | | | | | | | | |
| | | | | | | | | | |
| Balance at December 31, 2006 | | 1,660 | | 220 | | 330 | | 2,210 | (c) |
| Revisions of previous estimates | | (20 | ) | (17 | ) | (43 | ) | (80 | ) |
| Improved recovery | | 114 | | 17 | | 53 | | 184 | |
| Extensions and discoveries | | 1 | | 14 | | 2 | | 17 | |
| Purchases of proved reserves | | 47 | | — | | 10 | | 57 | |
| Sales of proved reserves | | — | | — | | — | | — | |
| Production | | (95 | ) | (25 | ) | (44 | ) | (164 | ) |
| | | | | | | | | | |
| Balance at December 31, 2007 | | 1,707 | | 209 | | 308 | | 2,224 | |
| Revisions of previous estimates | | (243 | ) | (8 | ) | 137 | | (114 | ) |
| Improved recovery | | 99 | | 44 | | 46 | | 189 | |
| Extensions and discoveries | | 11 | | — | | — | | 11 | |
| Purchases of proved reserves | | 71 | | — | | — | | 71 | |
| Sales of proved reserves | | (2 | ) | — | | — | | (2 | ) |
| Production | | (96 | ) | (26 | ) | (47 | ) | (169 | ) |
| | | | | | | | | | |
| Balance at December 31, 2008 | | 1,547 | | 219 | | 444 | (b) | 2,210 | |
| Revisions of previous estimates | | 58 | | (32 | ) | 108 | | 134 | |
| Improved recovery | | 56 | | 37 | | 51 | | 144 | |
| Extensions and discoveries | | 29 | | 2 | | — | | 31 | |
| Purchases of proved reserves | | 15 | | — | | 11 | | 26 | |
| Sales of proved reserves | | — | | — | | — | | — | |
| Production | | (99 | ) | (28 | ) | (52 | ) | (179 | ) |
| | | | | | | | | | |
| Balance at December 31, 2009 | | 1,606 | | 198 | | 562 | (b) | 2,366 | |
| | | | | | | | | | |
| proved developed reserves | | | | | | | | | |
| December 31, 2006 | | 1,382 | | 135 | | 251 | | 1,768 | |
| December 31, 2007 | | 1,406 | | 115 | | 265 | | 1,786 | |
| December 31, 2008 | | 1,209 | | 119 | | 345 | | 1,673 | |
December 31, 2009 (d) | | 1,286 | | 125 | | 446 | | 1,857 | |
| | | | | | | | | | |
| proved undeveloped reserves | | | | | | | | | |
| December 31, 2006 | | 278 | | 85 | | 79 | | 442 | |
| December 31, 2007 | | 301 | | 94 | | 43 | | 438 | |
| December 31, 2008 | | 338 | | 100 | | 99 | | 537 | |
December 31, 2009 (e) | | 320 | | 73 | | 116 | | 509 | |
| (a) | Excludes proved oil reserves related to the noncontrolling interest of a Colombian subsidiary. | |
| (b) | Proved reserve amounts relate to PSCs. | |
| (c) | Excludes proved oil reserves of 30 million barrels as of December 31, 2006, related to Occidental's joint venture interest in Russia, which was sold in 2007. | |
| (d) | Approximately five percent of the proved developed reserves at December 31, 2009 are nonproducing, the majority of which are located in the United States. | |
| (e) | The amount of Occidental's proved undeveloped reserves that have not been developed for over five years was not material. | |
| Gas Reserves | | | | | | | | | |
| In billions of cubic feet | | | | | | | | | |
| | | United States | | Latin America | | Middle East/ North Africa | (a) | Total | |
| proved developed and undeveloped reserves | | | | | | | | | |
| | | | | | | | | | |
| Balance at December 31, 2006 | | 2,424 | | 194 | | 1,106 | | 3,724 | |
| Revisions of previous estimates | | 35 | | 5 | | (130 | ) | (90 | ) |
| Improved recovery | | 406 | | 5 | | 6 | | 417 | |
| Extensions and discoveries | | 5 | | 19 | | 11 | | 35 | |
| Purchases of proved reserves | | 18 | | — | | — | | 18 | |
| Sales of proved reserves | | — | | — | | — | | — | |
| Production | | (216 | ) | (15 | ) | (30 | ) | (261 | ) |
| | | | | | | | | | |
| Balance at December 31, 2007 | | 2,672 | | 208 | | 963 | | 3,843 | |
| Revisions of previous estimates | | (490 | ) | (26 | ) | 328 | | (188 | ) |
| Improved recovery | | 281 | | 46 | | 21 | | 348 | |
| Extensions and discoveries | | 76 | | — | | — | | 76 | |
| Purchases of proved reserves | | 832 | | — | | — | | 832 | |
| Sales of proved reserves | | (3 | ) | — | | — | | (3 | ) |
| Production | | (215 | ) | (16 | ) | (76 | ) | (307 | ) |
| | | | | | | | | | |
| Balance at December 31, 2008 | | 3,153 | | 212 | | 1,236 | | 4,601 | |
| Revisions of previous estimates | | (688 | ) | (40 | ) | 281 | | (447 | ) |
| Improved recovery | | 137 | | 26 | | 11 | | 174 | |
| Extensions and discoveries | | 362 | | 2 | | — | | 364 | |
| Purchases of proved reserves | | 67 | | — | | 736 | | 803 | |
| Sales of proved reserves | | — | | — | | — | | — | |
| Production | | (232 | ) | (17 | ) | (89 | ) | (338 | ) |
| | | | | | | | | | |
| Balance at December 31, 2009 | | 2,799 | | 183 | | 2,175 | | 5,157 | |
| | | | | | | | | | |
| proved developed reserves | | | | | | | | | |
| December 31, 2006 | | 1,940 | | 137 | | 560 | | 2,637 | |
| December 31, 2007 | | 1,997 | | 140 | | 932 | | 3,069 | |
| December 31, 2008 | | 1,866 | | 142 | | 1,206 | | 3,214 | |
December 31, 2009 (b) | | 1,931 | | 125 | | 1,759 | | 3,815 | |
| | | | | | | | | | |
| proved undeveloped reserves | | | | | | | | | |
| December 31, 2006 | | 484 | | 57 | | 546 | | 1,087 | |
| December 31, 2007 | | 675 | | 68 | | 31 | | 774 | |
| December 31, 2008 | | 1,287 | | 70 | | 30 | | 1,387 | |
December 31, 2009 (c) | | 868 | | 58 | | 416 | | 1,342 | |
| (a) | Proved reserve amounts relate to PSCs. | |
| (b) | Approximately two percent of the proved developed reserves at December 31, 2009 are nonproducing, the majority of which are located in the United States. | |
| (c) | The amount of Occidental's proved undeveloped reserves that have not been developed for over five years was not material. | |
Capitalized costs relating to oil and gas producing activities and related accumulated DD&A were as follows:
| In millions | | United States | | Latin America | (a) | Middle East/ North Africa | | Total | |
| december 31, 2009 | | | | | | | | | | | | | |
| Proved properties | | $ | 24,488 | | $ | 5,743 | | $ | 10,909 | | $ | 41,140 | |
Unproved properties (b) | | | 1,709 | | | — | | | 158 | | | 1,867 | |
| | | | | | | | | | | | | | |
Total capitalized costs (c) | | | 26,197 | | | 5,743 | | | 11,067 | | | 43,007 | |
| Accumulated depreciation, depletion and amortization | | | (7,956 | ) | | (2,490 | ) | | (4,826 | ) | | (15,272 | ) |
| | | | | | | | | | | | | | |
| Net capitalized costs | | $ | 18,241 | | $ | 3,253 | | $ | 6,241 | | $ | 27,735 | |
| december 31, 2008 | | | | | | | | | | | | | |
| Proved properties | | $ | 22,425 | | $ | 5,177 | | $ | 9,490 | | $ | 37,092 | |
Unproved properties (b) | | | 1,855 | | | — | | | 417 | | | 2,272 | |
| | | | | | | | | | | | | | |
Total capitalized costs (c) | | | 24,280 | | | 5,177 | | | 9,907 | | | 39,364 | |
| Accumulated depreciation, depletion and amortization | | | (6,669 | ) | | (1,693 | ) | | (4,021 | ) | | (12,383 | ) |
| | | | | | | | | | | | | | |
| Net capitalized costs | | $ | 17,611 | | $ | 3,484 | | $ | 5,886 | | $ | 26,981 | |
| december 31, 2007 | | | | | | | | | | | | | |
| Proved properties | | $ | 18,872 | | $ | 4,204 | | $ | 7,935 | | $ | 31,011 | |
Unproved properties (b) | | | 689 | | | 527 | | | 228 | | | 1,444 | |
| | | | | | | | | | | | | | |
Total capitalized costs (c) | | | 19,561 | | | 4,731 | | | 8,163 | | | 32,455 | |
| Accumulated depreciation, depletion and amortization | | | (5,779 | ) | | (1,241 | ) | | (3,268 | ) | | (10,288 | ) |
| | | | | | | | | | | | | | |
| Net capitalized costs | | $ | 13,782 | | $ | 3,490 | | $ | 4,895 | | $ | 22,167 | |
| (a) | Includes net capitalized cost of $31 million, $45 million and $36 million in 2009, 2008 and 2007, respectively, related to the noncontrolling interest in a Colombian subsidiary. | |
| (b) | The 2009 and 2008 amounts primarily consist of Midcontinent Gas, Permian, California and Libya. The 2007 amount primarily consists of California, Argentina and Libya. | |
| (c) | Includes costs related to leases, exploration costs, lease and well equipment, other equipment, capitalized interest, asset retirement obligations and other costs. | |
Costs incurred in oil and gas property acquisition, exploration and development activities, whether capitalized or expensed, were as follows:
| In millions | | United States | | Latin America | (a) | Middle East/ North Africa | | Total | |
| for the year ended december 31, 2009 | | | | | | | | | | | | | |
| Property acquisition costs | | | | | | | | | | | | | |
| Proved properties | | $ | 569 | | $ | — | | $ | 158 | | $ | 727 | |
| Unproved properties | | | 100 | | | — | | | 3 | | | 103 | |
| Exploration costs | | | 131 | | | 26 | | | 50 | | | 207 | |
| Development costs | | | 1,223 | | | 560 | | | 996 | | | 2,779 | |
| Costs incurred | | $ | 2,023 | | $ | 586 | | $ | 1,207 | | $ | 3,816 | |
| for the year ended december 31, 2008 | | | | | | | | | | | | | |
| Property acquisition costs | | | | | | | | | | | | | |
| Proved properties | | $ | 1,819 | | $ | 8 | | $ | 4 | | $ | 1,831 | |
| Unproved properties | | | 1,362 | | | — | | | 348 | | | 1,710 | |
| Exploration costs | | | 130 | | | 96 | | | 115 | | | 341 | |
| Development costs | | | 1,740 | | | 864 | | | 1,496 | | | 4,100 | |
| Costs incurred | | $ | 5,051 | | $ | 968 | | $ | 1,963 | | $ | 7,982 | |
| for the year ended december 31, 2007 | | | | | | | | | | | | | |
| Property acquisition costs | | | | | | | | | | | | | |
| Proved properties | | $ | 626 | | $ | — | | $ | 300 | | $ | 926 | |
| Unproved properties | | | 167 | | | (58 | ) | | 10 | | | 119 | |
| Exploration costs | | | 39 | | | 79 | | | 213 | | | 331 | |
| Development costs | | | 1,268 | | | 524 | | | 1,032 | | | 2,824 | |
| Costs incurred | | $ | 2,100 | | $ | 545 | | $ | 1,555 | | $ | 4,200 | |
| (a) | Includes exploration and development costs of $0 and $13 million, $7 million and $21 million, and $4 million and $19 million in 2009, 2008 and 2007, respectively, related to the noncontrolling interest in a Colombian subsidiary. | |
The results of operations of Occidental’s oil and gas producing activities, which exclude oil and gas trading activities and items such as asset dispositions, corporate overhead, interest and royalties, were as follows:
| In millions | | United States | | Latin America | (a) | Middle East/ North Africa | | Total | |
| for the year ended december 31, 2009 | | | | | | | | | | | | | |
Revenues (b) | | $ | 5,832 | | $ | 1,538 | | $ | 4,195 | | $ | 11,565 | |
| Production costs | | | 1,452 | | | 409 | | | 601 | | | 2,462 | |
| Other operating expenses | | | 389 | | | 116 | | | 208 | | | 713 | |
| Depreciation, depletion and amortization | | | 1,237 | | | 628 | | | 823 | | | 2,688 | |
| Taxes other than on income | | | 399 | | | 22 | | | — | | | 421 | |
| Charges for impairments | | | — | | | 170 | | | — | | | 170 | |
| Exploration expenses | | | 156 | | | 28 | | | 83 | | | 267 | |
| | | | | | | | | | | | | | |
| Pretax income | | | 2,199 | | | 165 | | | 2,480 | | | 4,844 | |
Income tax expense(c) | | | 594 | | | 6 | | | 1,227 | | | 1,827 | |
| | | | | | | | | | | | | | |
| Results of operations | | $ | 1,605 | | $ | 159 | | $ | 1,253 | | $ | 3,017 | |
| for the year ended december 31, 2008 | | | | | | | | | | | | | |
Revenues (b) | | $ | 9,581 | | $ | 2,009 | | $ | 6,287 | | $ | 17,877 | |
| Production costs | | | 1,666 | | | 429 | | | 589 | | | 2,684 | |
| Other operating expenses | | | 350 | | | 44 | | | 159 | | | 553 | |
| Depreciation, depletion and amortization | | | 1,094 | | | 453 | | | 760 | | | 2,307 | |
| Taxes other than on income | | | 544 | | | 36 | | | — | | | 580 | |
| Charges for impairments | | | — | | | 476 | | | 81 | | | 557 | |
| Exploration expenses | | | 92 | | | 54 | | | 181 | | | 327 | |
| | | | | | | | | | | | | | |
| Pretax income | | | 5,835 | | | 517 | | | 4,517 | | | 10,869 | |
Income tax expense(c) | | | 1,857 | | | 37 | | | 2,284 | | | 4,178 | |
| | | | | | | | | | | | | | |
| Results of operations | | $ | 3,978 | | $ | 480 | | $ | 2,233 | | $ | 6,691 | |
| for the year ended december 31, 2007 | | | | | | | | | | | | | |
Revenues (b) | | $ | 7,115 | | $ | 1,559 | | $ | 4,365 | | $ | 13,039 | |
| Production costs | | | 1,440 | | | 297 | | | 430 | | | 2,167 | |
| Other operating expenses | | | 265 | | | 117 | | | 185 | | | 567 | |
| Depreciation, depletion and amortization | | | 1,039 | | | 356 | | | 597 | | | 1,992 | |
| Taxes other than on income | | | 388 | | | 23 | | | — | | | 411 | |
| Charges for impairment | | | 58 | | | — | | | — | | | 58 | |
| Exploration expenses | | | 54 | | | 56 | | | 254 | | | 364 | |
| | | | | | | | | | | | | | |
| Pretax income | | | 3,871 | | | 710 | | | 2,899 | | | 7,480 | |
Income tax expense(c) | | | 1,161 | | | 241 | | | 1,717 | | | 3,119 | |
| | | | | | | | | | | | | | |
| Results of operations | | $ | 2,710 | | $ | 469 | | $ | 1,182 | | $ | 4,361 | |
| (a) | Includes revenues of $118 million, $209 million and $144 million, production costs of $17 million, $21 million and $17 million, and results of operations of $49 million, $116 million and $69 million in 2009, 2008 and 2007, respectively, related to the noncontrolling interest in a Colombian subsidiary. | |
| (b) | Revenues from net production exclude royalty payments and other adjustments. | |
| (c) | United States federal income taxes reflect certain expenses related to oil and gas activities allocated for United States income tax purposes only, including allocated interest and corporate overhead. | |
Results per Unit of Production
| | | United States | | Latin America | (a) | Middle East/ North Africa | | Total | |
| for the year ended december 31, 2009 | | | | | | | | | | | | | |
Revenues from net production barrel of oil equivalent ($/bbl.)(b,c) | | $ | 42.47 | | $ | 46.76 | | $ | 44.11 | | $ | 43.53 | |
| Production costs | | | 10.57 | | | 12.43 | | | 8.93 | | | 10.37 | |
| Other operating expenses | | | 2.83 | | | 3.53 | | | 3.09 | | | 3.00 | |
| Depreciation, depletion and amortization | | | 9.01 | | | 19.09 | | | 12.23 | | | 11.32 | |
| Taxes other than on income | | | 2.91 | | | 0.67 | | | — | | | 1.77 | |
| Charges for impairments | | | — | | | 5.17 | | | — | | | 0.72 | |
| Exploration expenses | | | 1.14 | | | 0.85 | | | 1.23 | | | 1.12 | |
| | | | | | | | | | | | | | |
| Pretax income | | | 16.01 | | | 5.02 | | | 18.63 | | | 15.23 | |
Income tax expense (d) | | | 4.33 | | | 0.18 | | | — | | | 2.53 | |
| | | | | | | | | | | | | | |
| Results of operations | | $ | 11.68 | | $ | 4.84 | | $ | 18.63 | | $ | 12.70 | |
| for the year ended december 31, 2008 | | | | | | | | | | | | | |
Revenues from net production barrel of oil equivalent ($/bbl.)(b,c) | | $ | 72.51 | | $ | 66.79 | | $ | 71.16 | | $ | 71.37 | |
| Production costs | | | 12.61 | | | 14.26 | | | 9.98 | | | 12.13 | |
| Other operating expenses | | | 2.65 | | | 1.46 | | | 2.68 | | | 2.50 | |
| Depreciation, depletion and amortization | | | 8.28 | | | 15.06 | | | 12.87 | | | 10.43 | |
| Taxes other than on income | | | 4.12 | | | 1.20 | | | — | | | 2.62 | |
| Charges for impairments | | | — | | | 15.82 | | | 1.37 | | | 2.52 | |
| Exploration expenses | | | 0.70 | | | 1.80 | | | 3.12 | | | 1.48 | |
| | | | | | | | | | | | | | |
| Pretax income | | | 44.15 | | | 17.19 | | | 41.14 | | | 39.69 | |
Income tax expense (d) | | | 14.05 | | | 1.23 | | | 3.95 | | | 9.61 | |
| | | | | | | | | | | | | | |
| Results of operations | | $ | 30.10 | | $ | 15.96 | | $ | 37.19 | | $ | 30.08 | |
| for the year ended december 31, 2007 | | | | | | | | | | | | | |
Revenues from net production barrel of oil equivalent ($/bbl.)(b,c) | | $ | 54.31 | | $ | 52.33 | | $ | 62.49 | | $ | 55.91 | |
| Production costs | | | 10.99 | | | 9.97 | | | 8.91 | | | 10.37 | |
| Other operating expenses | | | 2.02 | | | 3.93 | | | 3.81 | | | 2.71 | |
| Depreciation, depletion and amortization | | | 7.93 | | | 11.95 | | | 12.37 | | | 9.53 | |
| Taxes other than on income | | | 2.96 | | | 0.77 | | | — | | | 1.97 | |
| Charges for impairments | | | 0.44 | | | — | | | — | | | 0.28 | |
| Exploration expenses | | | 0.41 | | | 1.88 | | | 4.64 | | | 1.74 | |
| | | | | | | | | | | | | | |
| Pretax income | | | 29.56 | | | 23.83 | | | 32.76 | | | 29.31 | |
Income tax expense (d) | | | 8.86 | | | 8.09 | | | 8.13 | | | 8.58 | |
| | | | | | | | | | | | | | |
| Results of operations | | $ | 20.70 | | $ | 15.74 | | $ | 24.63 | | $ | 20.73 | |
| (a) | Includes the noncontrolling interest in a Colombian subsidiary. | |
| (b) | Natural gas volumes have been converted to barrels of oil equivalent (BOE) based on energy content of six thousand cubic feet (Mcf) of gas to one barrel of oil. | |
| (c) | Revenues from net production exclude royalty payments and other adjustments. | |
| (d) | United States federal income taxes reflect certain expenses related to oil and gas activities allocated for United States income tax purposes only, including allocated interest and corporate overhead. | |
Standardized Measure, Including Year-to-Year Changes Therein, of Discounted Future Net Cash Flows
For purposes of the following disclosures, future cash flows as of December 31, 2009 were computed by applying to Occidental's proved oil and gas reserves the unweighted arithmetic average of the first-day-of-the-month price for each month within the year ended December 31, 2009, unless prices were defined by contractual arrangements, excluding escalations based upon future conditions. Future cash flows as of December 31, 2008 and 2007 were computed by applying year-end prices to Occidental’s proved reserves, unless prices were defined by contractual arrangements. Future operating and capital costs are forecasted using the current cost environment applied to expectations of future operating and development activities. Future income tax expenses were computed by applying, generally, year-end statutory tax rates (adjusted for permanent differences, tax credits, allowances and foreign income repatriation considerations) to the estimated net future pre-tax cash flows. The discount was computed by application of a 10-percent discount factor. The calculations assumed the continuation of existing economic, operating and contractual conditions at each of December 31, 2009, 2008 and 2007. Such arbitrary assumptions have not necessarily proven accurate in the past. Other assumptions of equal validity would give rise to substantially different results.
The realized prices used to calculate future cash flows vary by producing area and market conditions. For the 2009, 2008 and 2007 disclosures, the West Texas Intermediate oil prices used were $61.18 per barrel, $44.60 per barrel and $95.98 per barrel, respectively. The Henry Hub gas prices used for the 2009, 2008 and 2007 disclosures were $3.986 per MMBtu, $5.71 per MMBtu and $6.795 per MMBtu, respectively.
| Standardized Measure of Discounted Future Net Cash Flows | | |
| In millions | | | | | | | | | | | | | |
| | | United States | | Latin America | (a) | Middle East/ North Africa | | Total | |
| at december 31, 2009 | | | | | | | | | | | | | |
| Future cash inflows | | $ | 96,997 | | $ | 9,892 | | $ | 32,344 | | $ | 139,233 | |
| Future costs | | | | | | | | | | | | | |
| Production costs and other operating expenses | | | (42,352 | ) | | (3,664 | ) | | (7,605 | ) | | (53,621 | ) |
Development costs (b) | | | (7,895 | ) | | (1,456 | ) | | (3,305 | ) | | (12,656 | ) |
| Future income tax expense | | | (13,386 | ) | | (959 | ) | | (10,010 | ) | | (24,355 | ) |
| Future net cash flows | | | 33,364 | | | 3,813 | | | 11,424 | | | 48,601 | |
| Ten percent discount factor | | | (18,348 | ) | | (1,281 | ) | | (4,009 | ) | | (23,638 | ) |
| Standardized measure of discounted future | | | | | | | | | | | | | |
| net cash flows | | $ | 15,016 | | $ | 2,532 | | $ | 7,415 | | $ | 24,963 | |
| at december 31, 2008 | | | | | | | | | | | | | |
| Future cash inflows | | $ | 75,267 | | $ | 9,667 | | $ | 17,053 | | $ | 101,987 | |
| Future costs | | | | | | | | | | | | | |
| Production costs and other operating expenses | | | (38,315 | ) | | (4,312 | ) | | (6,960 | ) | | (49,587 | ) |
Development costs (b) | | | (7,376 | ) | | (1,698 | ) | | (2,446 | ) | | (11,520 | ) |
| Future income tax expense | | | (6,867 | ) | | (819 | ) | | — | | | (7,686 | ) |
| Future net cash flows | | | 22,709 | | | 2,838 | | | 7,647 | | | 33,194 | |
| Ten percent discount factor | | | (12,344 | ) | | (1,025 | ) | | (3,129 | ) | | (16,498 | ) |
| Standardized measure of discounted future | | | | | | | | | | | | | |
| net cash flows | | $ | 10,365 | | $ | 1,813 | | $ | 4,518 | | $ | 16,696 | |
| at december 31, 2007 | | | | | | | | | | | | | |
| Future cash inflows | | $ | 166,082 | | $ | 10,975 | | $ | 25,466 | | $ | 202,523 | |
| Future costs | | | | | | | | | | | | | |
| Production costs and other operating expenses | | | (57,618 | ) | | (3,315 | ) | | (4,992 | ) | | (65,925 | ) |
Development costs (b) | | | (5,797 | ) | | (1,391 | ) | | (1,967 | ) | | (9,155 | ) |
| Future income tax expense | | | (34,375 | ) | | (2,059 | ) | | (1,164 | ) | | (37,598 | ) |
| Future net cash flows | | | 68,292 | | | 4,210 | | | 17,343 | | | 89,845 | |
| Ten percent discount factor | | | (39,476 | ) | | (1,347 | ) | | (6,180 | ) | | (47,003 | ) |
| Standardized measure of discounted future | | | | | | | | | | | | | |
| net cash flows | | $ | 28,816 | | $ | 2,863 | | $ | 11,163 | | $ | 42,842 | |
| (a) | Excludes discounted future net cash flows of $89 million, $19 million and $172 million as of December 31, 2009, 2008 and 2007, respectively, related to the noncontrolling interest in a Colombian subsidiary. | |
| (b) | Includes asset retirement costs. | |
| Changes in the Standardized Measure of Discounted Future | | | | | | | | | | |
| Net Cash Flows From Proved Reserve Quantities | | | | | | | | | | |
| In millions | | | | | | | | | | |
| | | | | | | | | | | |
| For the years ended December 31, | | | 2009 | | | 2008 | | | 2007 | |
| Beginning of year | | $ | 16,696 | | $ | 42,842 | | $ | 24,723 | |
| Sales and transfers of oil and gas produced, net of production costs and other operating expenses | | | (7,869 | ) | | (12,689 | ) | | (9,203 | ) |
| Net change in prices received per barrel, net of production costs and other operating expenses | | | 16,473 | | | (37,335 | ) | | 28,349 | |
| Extensions, discoveries and improved recovery, net of future production and development costs | | | 3,743 | | | 2,271 | | | 6,636 | |
| Change in estimated future development costs | | | (1,353 | ) | | (3,603 | ) | | (3,008 | ) |
| Revisions of quantity estimates | | | 3,214 | | | (1,451 | ) | | (2,214 | ) |
| Development costs incurred during the period | | | 2,814 | | | 4,107 | | | 2,900 | |
| Accretion of discount | | | 1,950 | | | 5,383 | | | 3,097 | |
| Net change in income taxes | | | (9,396 | ) | | 13,418 | | | (8,339 | ) |
| Purchases and sales of reserves in place, net | | | 325 | | | 854 | | | 1,801 | |
| Changes in production rates and other | | | (1,634 | ) | | 2,899 | | | (1,900 | ) |
| | | | | | | | | | | |
| Net change | | | 8,267 | | | (26,146 | ) | | 18,119 | |
| | | | | | | | | | | |
| End of year | | $ | 24,963 | | $ | 16,696 | | $ | 42,842 | |
Average Sales Prices and Average Production Costs of Oil and Gas
The following table sets forth, for each of the three years in the period ended December 31, 2009, Occidental’s approximate average sales prices and average production costs of oil and gas. Production costs are the costs incurred in lifting the oil and gas to the surface and include gathering, treating, primary processing, field storage, property and production taxes and insurance on proved properties, but do not include depreciation, depletion and amortization, royalties, income taxes, interest, general and administrative and other expenses.
| | | | United States | | Latin America | (a) | Middle East/ North Africa | | Total | |
| 2009 | | | | | | | | | | | | | | |
| Oil | – Average sales price ($/bbl.) | | $ | 56.74 | | $ | 49.43 | | $ | 58.75 | (b) | $ | 55.97 | |
| Gas | – Average sales price ($/bbl.) | | $ | 3.46 | | $ | 3.01 | | $ | 1.00 | | $ | 2.79 | |
| | | | | | | | | | | | | | |
Average oil and gas production cost ($/bbl.) (c) | | $ | 10.57 | | $ | 12.43 | | $ | 8.93 | | $ | 10.37 | (d) |
| 2008 | | | | | | | | | | | | | | |
| Oil | – Average sales price ($/bbl.) | | $ | 91.16 | | $ | 70.53 | | $ | 94.70 | (b) | $ | 88.26 | |
| Gas | – Average sales price ($/bbl.) | | $ | 8.03 | | $ | 4.43 | | $ | 1.01 | | $ | 6.10 | |
| | | | | | | | | | | | | | |
Average oil and gas production cost ($/bbl.) (c) | | $ | 12.61 | | $ | 14.26 | | $ | 9.98 | | $ | 12.13 | (d) |
| 2007 | | | | | | | | | | | | | | |
| Oil | – Average sales price ($/bbl.) | | $ | 65.67 | | $ | 56.66 | | $ | 69.24 | (b) | $ | 64.77 | |
| Gas | – Average sales price ($/bbl.) | | $ | 6.53 | | $ | 2.66 | | $ | 0.99 | | $ | 5.68 | |
| | | | | | | | | | | | | | |
Average oil and gas production cost ($/bbl.) (c) | | $ | 10.99 | | $ | 9.97 | | $ | 8.91 | | $ | 10.37 | (d) |
| (a) | Sales prices include royalties with respect to certain of Occidental’s interests. | |
| (b) | Excludes income taxes owed by Occidental but paid by governmental entities on its behalf. | |
| (c) | Natural gas volumes have been converted to BOE based on energy content of six Mcf of gas to one barrel of oil. | |
| (d) | Excludes taxes other than on income of $1.77, $2.62 and $1.97 for the years ended December 31, 2009, 2008 and 2007, respectively. | |
Net Productive and Dry — Exploratory and Development Wells Completed
The following table sets forth, for each of the three years in the period ended December 31, 2009, Occidental’s net productive and dry–exploratory and development wells completed.
| | | | United States | | Latin America | (a) | Middle East/ North Africa | | Total | |
| 2009 | | | | | | | | | | | | | | |
| Oil ��� | Exploratory | | | 5.5 | | | 7.0 | | | 0.7 | | | 13.2 | |
| | Development | | | 224.3 | | | 159.1 | | | 105.3 | | | 488.7 | |
| Gas – | Exploratory | | | — | | | — | | | — | | | — | |
| | Development | | | 14.5 | | | — | | | 2.0 | | | 16.5 | |
| Dry – | Exploratory | | | 13.7 | | | 3.4 | | | 2.9 | | | 20.0 | |
| | Development | | | 1.8 | | | 0.7 | | | 0.7 | | | 3.2 | |
| 2008 | | | | | | | | | | | | | | |
| Oil – | Exploratory | | | 6.6 | | | 16.6 | | | 2.0 | | | 25.2 | |
| | Development | | | 527.9 | | | 215.9 | | | 137.0 | | | 880.8 | |
| Gas – | Exploratory | | | — | | | — | | | — | | | — | |
| | Development | | | 223.5 | | | — | | | 1.3 | | | 224.8 | |
| Dry – | Exploratory | | | 3.5 | | | 10.6 | | | 13.0 | | | 27.1 | |
| | Development | | | 10.9 | | | 5.7 | | | — | | | 16.6 | |
| 2007 | | | | | | | | | | | | | | |
| Oil – | Exploratory | | | 2.5 | | | 9.0 | | | — | | | 11.5 | |
| | Development | | | 383.1 | | | 335.0 | | | 114.8 | | | 832.9 | |
| Gas – | Exploratory | | | — | | | — | | | — | | | — | |
| | Development | | | 84.7 | | | — | | | 8.5 | | | 93.2 | |
| Dry – | Exploratory | | | 4.5 | | | 0.5 | | | 1.7 | | | 6.7 | |
| | Development | | | 1.4 | | | 0.8 | | | 2.4 | | | 4.6 | |
| (a) | Includes exploratory and development wells completed by the noncontrolling interest in a Colombian subsidiary. | |
Productive Oil and Gas Wells
The following table sets forth, as of December 31, 2009, Occidental’s productive oil and gas wells (both producing and capable of production).
Wells at December 31, 2009 | | United States | (a) | Latin America | (a,b) | Middle East/ North Africa | (a) | Total | |
| Oil – | Gross (c) | | 25,875 | (963 | ) | | 3,799 | (2,622 | ) | | 2,399 | (58 | ) | | 32,073 | (3,643 | ) | |
| | Net (d) | | 18,987 | (704 | ) | | 2,970 | (2,390 | ) | | 1,267 | (34 | ) | | 23,224 | (3,128 | ) | |
| Gas – | Gross (c) | | 5,485 | (284 | ) | | 161 | (132 | ) | | 114 | (1 | ) | | 5,760 | (417 | ) | |
| | Net (d) | | 4,550 | (223 | ) | | 159 | (132 | ) | | 59 | (1 | ) | | 4,768 | (356 | ) | |
| (a) | The numbers in parentheses indicate the number of wells with multiple completions. | |
| (b) | Includes productive wells related to the noncontrolling interest in a Colombian subsidiary. | |
| (c) | The total number of wells in which interests are owned. | |
| (d) | The sum of fractional interests. | |
Participation in Exploratory and Development Wells Being Drilled The following table sets forth, as of December 31, 2009, Occidental’s participation in exploratory and development wells being drilled.
Wells at December 31, 2009 | | United States | | Latin America | (a) | Middle East/ North Africa | | Total | |
| Exploratory and development wells | | | | | | | | | |
| – | Gross | | 22 | | 8 | | 17 | | 47 | |
| – | Net | | 16 | | 7 | | 9 | | 32 | |
| (a) | Includes the noncontrolling interest in a Colombian subsidiary. | |
At December 31, 2009, Occidental was participating in 179 pressure maintenance projects in the United States, 16 in Latin America and 35 in the Middle East/North Africa.
Oil and Gas Acreage
The following table sets forth, as of December 31, 2009, Occidental’s holdings of developed and undeveloped oil and gas acreage.
Thousands of acres at December 31, 2009 | | United States | | Latin America | (a) | Middle East/ North Africa | | Total | |
Developed (b) | | | | | | | | | | | | | |
| – | Gross (c) | | 5,628 | | | 572 | | | 1,480 | | | 7,680 | | |
| – | Net (d) | | 3,627 | | | 497 | | | 654 | | | 4,778 | | |
Undeveloped (e) | | | | | | | | | | | | | |
| – | Gross (c) | | 2,885 | | | 2,403 | | | 17,934 | | | 23,222 | | |
| – | Net (d) | | 1,693 | | | 1,743 | | | 16,407 | | | 19,843 | | |
| (a) | Includes acreage related to the noncontrolling interest of a Colombian subsidiary. | |
| (b) | Acres spaced or assigned to productive wells. | |
| (c) | Total acres in which interests are held. | |
| (d) | Sum of the fractional interests owned based on working interests, or interests under PSCs and other economic arrangements. | |
| (e) | Acres on which wells have not been drilled or completed to a point that would permit the production of commercial quantities of oil and gas, regardless of whether the acreage contains proved reserves. | |
Oil and Natural Gas Sales Volumes and Production Per Day
The following tables set forth the sales volumes and production of oil and liquids and natural gas per day for each of the three years in the period ended December 31, 2009. The differences between the sales volumes and production per day are generally due to the timing of shipments at Occidental’s international locations where product is loaded onto tankers.
| Sales Volumes per Day | | | 2009 | | | 2008 | | | 2007 | |
| United States | | | | | | | | | | |
| Oil and liquids (MBBL) | | | | | | | | | | |
| California | | | 93 | | | 89 | | | 89 | |
| Permian | | | 168 | | | 168 | | | 167 | |
| Midcontinent Gas | | | 10 | | | 6 | | | 4 | |
| TOTAL | | | 271 | | | 263 | | | 260 | |
| Natural gas (MMCF) | | | | | | | | | | |
| California | | | 250 | | | 235 | | | 254 | |
| Permian | | | 199 | | | 181 | | | 186 | |
| Midcontinent Gas | | | 186 | | | 171 | | | 153 | |
| TOTAL | | | 635 | | | 587 | | | 593 | |
| Latin America | | | | | | | | | | |
| Crude oil (MBBL) | | | | | | | | | | |
| Argentina | | | 37 | | | 32 | | | 32 | |
Colombia (a) | | | 39 | | | 37 | | | 37 | |
| TOTAL | | | 76 | | | 69 | | | 69 | |
| Natural gas (MMCF) | | | | | | | | | | |
| Argentina | | | 30 | | | 21 | | | 22 | |
| Bolivia | | | 16 | | | 21 | | | 18 | |
| TOTAL | | | 46 | | | 42 | | | 40 | |
| Middle East/North Africa | | | | | | | | | | |
| Oil and liquids (MBBL) | | | | | | | | | | |
| Oman | | | 39 | | | 23 | | | 20 | |
| Dolphin | | | 21 | | | 21 | | | 4 | |
| Qatar | | | 48 | | | 47 | | | 48 | |
| Yemen | | | 29 | | | 23 | | | 27 | |
| Libya | | | 7 | | | 15 | | | 22 | |
| TOTAL | | | 144 | | | 129 | | | 121 | |
| Natural gas (MMCF) | | | | | | | | | | |
| Oman | | | 22 | | | 24 | | | 30 | |
| Dolphin | | | 213 | | | 184 | | | 51 | |
| Bahrain | | | 10 | | | — | | | — | |
| TOTAL | | | 245 | | | 208 | | | 81 | |
Total Sales Volumes (MBOE) (b) | | | 645 | | | 601 | | | 570 | |
(See footnotes following the Production per Day table)
| Production per Day | | | 2009 | | | 2008 | | | 2007 | |
| United States | | | | | | | | | | |
| Oil and liquids (MBBL) | | | 271 | | | 263 | | | 260 | |
| Natural gas (MMCF) | | | 635 | | | 587 | | | 593 | |
| Latin America | | | | | | | | | | |
| Crude oil (MBBL) | | | | | | | | | | |
| Argentina | | | 36 | | | 34 | | | 33 | |
Colombia (a) | | | 39 | | | 38 | | | 36 | |
| TOTAL | | | 75 | | | 72 | | | 69 | |
| Natural gas (MMCF) | | | 46 | | | 42 | | | 40 | |
| Middle East/North Africa | | | | | | | | | | |
| Oil and liquids (MBBL) | | | | | | | | | | |
| Oman | | | 39 | | | 23 | | | 19 | |
| Dolphin | | | 22 | | | 20 | | | 5 | |
| Qatar | | | 48 | | | 47 | | | 47 | |
| Yemen | | | 28 | | | 23 | | | 27 | |
| Libya | | | 6 | | | 15 | | | 21 | |
| TOTAL | | | 143 | | | 128 | | | 119 | |
| Natural gas (MMCF) | | | 245 | | | 208 | | | 81 | |
Total Production (MBOE) (b) | | | 643 | | | 603 | | | 567 | |
| (a) | Excludes sales and production volumes related to the noncontrolling interest in a Colombian subsidiary. | |
| (b) | Natural gas volumes have been converted to BOE based on energy content of six Mcf of gas to one barrel of oil. | |
| Schedule II – Valuation and Qualifying Accounts | Occidental Petroleum Corporation | |
| In millions | and Subsidiaries | |
| | | | | Additions | | | | | |
| | | Balance at Beginning of Period | | Charged to Costs and Expenses | | Charged to Other Accounts | | Deductions | (a) | Balance at End of Period | |
| 2009 | | | | | | | | | | | | | | | | |
| Allowance for doubtful accounts | | $ | 45 | | $ | (7 | ) | $ | | | $ | (8 | ) | $ | 30 | |
| Environmental | | $ | 439 | | $ | 26 | | $ | 4 | | $ | (66 | ) | $ | 403 | |
| Litigation, tax and other reserves | | | 225 | | | 2 | | | (9 | ) | | (55 | ) | | 163 | |
| | | | | | | | | | | | | | | | | |
| | | $ | 664 | | $ | 28 | | $ | (5 | ) | $ | (121 | ) | $ | 566 | (b) |
| 2008 | | | | | | | | | | | | | | | | |
| Allowance for doubtful accounts | | $ | 35 | | $ | 11 | | $ | — | | $ | (1 | ) | $ | 45 | |
| Environmental | | $ | 457 | | $ | 29 | | $ | 25 | | $ | (72 | ) | $ | 439 | |
| Litigation, tax and other reserves | | | 241 | | | 67 | | | (9 | ) | | (74 | ) | | 225 | |
| | | | | | | | | | | | | | | | | |
| | | $ | 698 | | $ | 96 | | $ | 16 | | $ | (146 | ) | $ | 664 | (b) |
| 2007 | | | | | | | | | | | | | | | | |
| Allowance for doubtful accounts | | $ | 15 | | $ | 7 | | $ | 13 | | $ | — | | $ | 35 | |
| Environmental | | $ | 412 | | $ | 108 | | $ | 5 | | $ | (68 | ) | $ | 457 | |
| Litigation, tax and other reserves | | | 243 | | | 24 | | | (5 | ) | | (21 | ) | | 241 | |
| | | | | | | | | | | | | | | | | |
| | | $ | 655 | | $ | 132 | | $ | — | | $ | (89 | ) | $ | 698 | (b) |
| (a) | Primarily represents payments. | |
| (b) | Of these amounts, $119 million, $130 million and $139 million in 2009, 2008 and 2007, respectively, are classified as current. | |
| Item 9 | Changes in and Disagreements with Accountants on Accounting and Financial Disclosure |
Not applicable.
| Item 9a | Controls and Procedures |
Disclosure Controls and Procedures
Occidental's Chairman of the Board of Directors and Chief Executive Officer and its President and Chief Financial Officer supervised and participated in Occidental's evaluation of its disclosure controls and procedures (as defined in Rules 13a-15(e) and 15d-15(e) under the Securities Exchange Act of 1934) as of the end of the period covered by this report. Based upon that evaluation, Occidental's Chairman of the Board of Directors and Chief Executive Officer and President and Chief Financial Officer concluded that Occidental's disclosure controls and procedures were effective as of December 31, 2009.
There has been no change in Occidental's internal control over financial reporting (as defined in Rules 13a-15(f) and 15d-15(f) under the Securities Exchange Act of 1934) during the fourth quarter of 2009 that has materially affected, or is reasonably likely to materially affect, Occidental's internal control over financial reporting. Management’s Annual Assessment of and Report on Occidental’s Internal Control over Financial Reporting and the Report of Independent Registered Public Accounting Firm on Internal Control over Financial Reporting are set forth in Item 8.
| Item 10 | Directors, Executive Officers and Corporate Governance |
Occidental has adopted a Code of Business Conduct (Code). The Code applies to the Chairman of the Board of Directors and Chief Executive Officer, President and Chief Financial Officer, Principal Accounting Officer and persons performing similar functions (Key Personnel). The Code also applies to Occidental's directors, its employees and the employees of entities it controls. The Code is posted at www.oxy.com. Occidental will satisfy any disclosure requirement under Item 5.05 of Form 8-K regarding an amendment to, or waiver from, any provision of the Code with respect to its Key Personnel or directors by disclosing the nature of that amendment or waiver on its website.
This item incorporates by reference the information regarding Occidental's directors appearing under the caption "Election of Directors" and "Nominations for Directors for Term Expiring in 2012" in Occidental's definitive proxy statement filed in connection with its May 7, 2010, Annual Meeting of Stockholders (2010 Proxy Statement). The list of Occidental's executive officers and significant employees and related information under "Executive Officers" set forth in Part I of this report is incorporated by reference herein.
| Item 11 | Executive Compensation |
This item incorporates by reference the information appearing under the captions "Executive Compensation" (except information under the sub-caption " – 2009 Performance Highlights") and "Election of Directors – Information Regarding the Board of Directors and Its Committees" in the 2010 Proxy Statement.
| Item 12 | Security Ownership of Certain Beneficial Owners and Management |
This item incorporates by reference the information with respect to security ownership appearing under the caption "Security Ownership of Certain Beneficial Owners and Management" in the 2010 Proxy Statement. See also the information under "Securities Authorized for Issuance Under Equity Compensation Plans" in Part II, Item 5 of this report.
| Item 13 | Certain Relationships and Related Transactions and Director Independence |
This item incorporates by reference the information appearing under the caption "Election of Directors – Information Regarding the Board of Directors and its Committees – Independence", " – Corporate Governance" and " – Related Party Transactions" in the 2010 Proxy Statement.
| Item 14 | Principal Accountant Fees and Services |
This item incorporates by reference the information with respect to accountant fees and services appearing under the captions "Ratification of Independent Auditors – Audit and Other Fees" and " – Report of the Audit Committee" in the 2010 Proxy Statement.
| Item 15 | Exhibits and Financial Statement Schedules |
The agreements included as exhibits to this report are included to provide information about their terms and not to provide any other factual or disclosure information about Occidental or the other parties to the agreements. The agreements contain representations and warranties by each of the parties to the applicable agreement that were made solely for the benefit of the other agreement parties and:
| Ÿ | should not be treated as categorical statements of fact, but rather as a way of allocating the risk among the parties if those statements prove to be inaccurate; |
| | |
| Ÿ | have been qualified by disclosures that were made to the other party in connection with the negotiation of the applicable agreement, which disclosures are not necessarily reflected in the agreement; |
| | |
| Ÿ | may apply standards of materiality in a way that is different from the way investors may view materiality; and |
| | |
| Ÿ | were made only as of the date of the applicable agreement or such other date or dates as may be specified in the agreement and are subject to more recent developments. |
(a) (1) and (2). Financial Statements and Financial Statement Schedule
Reference is made to Item 8 of the Table of Contents of this report, where these documents are listed.
| | | 2.1* | Agreement and Plan of Merger among Occidental Petroleum Corporation, Occidental Transaction 1, LLC and Vintage Petroleum, Inc., dated as of October 13, 2005. (Disclosure schedules to this agreement have been omitted pursuant to Item 601(b)(2) of Regulation S-K) (filed as Exhibit 2.1 to the Current Report on Form 8-K of Occidental dated October 13, 2005 (filed October 17, 2005), File No. 1-9210). |
| | | 3.(i)* | Restated Certificate of Incorporation of Occidental, dated November 12, 1999 (filed as Exhibit 3.(i) to the Annual Report on Form 10-K of Occidental for the fiscal year ended December 31, 1999, File No. 1-9210). |
| | | 3.(i)(a)* | Certificate of Change of Location of Registered Office and of Registered Agent, dated July 6, 2001 (filed as Exhibit 3.1(i) to the Registration Statement on Form S-3 of Occidental, File No. 333-82246). |
| | | 3.(i)(b)* | Certificate of Amendment of Restated Certificate of Incorporation of Occidental Petroleum Corporation, dated May 5, 2006 (filed as Exhibit 3.(i)(b) to the Annual Report on Form 10-K of Occidental for the fiscal year ended December 31, 2006, File No.1-9210). |
| | | 3.(i)(c)* | Certificate of Amendment of Restated Certificate of Incorporation of Occidental Petroleum Corporation, dated May 1, 2009 (filed as Exhibit 3.(i)(c) to the Quarterly Report on Form 10-Q of Occidental for the fiscal quarter ended June 30, 2009, File No. 1-9210). |
| | | 3.(ii)* | Bylaws of Occidental, as amended through May 1, 2009 (filed as Exhibit 3.(ii) to the Current Report on Form 8-K of Occidental dated May 1, 2009 (date of earliest event reported), File No. 1-9210). |
| | | 4.1* | Occidental Petroleum Corporation Amended and Restated Five-Year Credit Agreement, dated as of September 27, 2006, among Occidental; J.P. Morgan Securities Inc. and Citigroup Global Markets Inc., as Co-Arrangers and Joint Bookrunners; JPMorgan Chase Bank, N.A. and Citibank, N.A., as Co-Syndication Agents, BNP Paribas, Bank of America, N.A., Barclays Bank PLC and The Royal Bank of Scotland plc, as Co-Documentation Agents, The Bank of Nova Scotia, as Administrative Agent (filed as Exhibit 4.1 to the Quarterly Report on Form 10-Q of Occidental for the fiscal quarter ended September 30, 2006, File No. 1-9210). |
| | | 4.2* | Indenture (Senior Debt Securities), dated as of April 1, 1998, between Occidental and The Bank of New York, as Trustee (filed as Exhibit 4 to the Registration Statement on Form S-3 of Occidental, File No. 333-52053). |
| | | 4.3* | Specimen certificate for shares of Common Stock (filed as Exhibit 4.9 to the Registration Statement on Form S-3 of Occidental, File No. 333-82246). |
| | | 4.4* | Form of Officers’ Certificate, dated October 21, 2008, establishing the terms and form of the 7% Notes due 2013 (filed as Exhibit 4.1 to the Current Report on Form 8-K of Occidental dated October 16, 2008 (date of earliest event reported), File No. 1-9210). |
| | | 4.5* | Form of 7% Note due 2013 (filed as Exhibit 4.2 to the Current Report on Form 8-K of Occidental dated October 16, 2008 (date of earliest event reported), File No. 1-9210). |
| | | 4.6* | Form of Officers’ Certificate, dated May 15, 2009, establishing the terms and form of the 4.125% Notes due 2016 (filed as Exhibit 4.1 to the Current Report on Form 8-K of Occidental dated May 12, 2009 (date of earliest event reported), File No. 1-9210). |
| | | 4.7* | Form of 4.125% Note due 2016 (filed as Exhibit 4.2 to the Current Report on Form 8-K of Occidental dated May 12, 2009 (date of earliest event reported), File No. 1-9210). |
| | | 4.8 | Instruments defining the rights of holders of other long-term debt of Occidental and its subsidiaries are not being filed since the total amount of securities authorized under each of such instruments does not exceed 10 percent of the total assets of Occidental and its subsidiaries on a consolidated basis. Occidental agrees to furnish a copy of any such instrument to the Commission upon request. |
| All of the Exhibits numbered 10.1 to 10.62 are management contracts and compensatory plans required to be identified specifically as responsive to Item 601(b)(10)(iii)(A) of Regulation S-K pursuant to Item 15(b) of Form 10-K. |
| | 10.1* | Amended and Restated Employment Agreement, dated as of October 9, 2008, between Occidental and Dr. Ray R. Irani (filed as Exhibit 10.1 to the Quarterly Report on Form 10-Q of Occidental for the quarterly period ended September 30, 2008, File No. 1-9210). |
* Incorporated herein by reference
| | 10.2* | Employment Agreement, dated January 28, 2010, between Occidental and Stephen I. Chazen (filed as Exhibit 10.1 to the Current Report on Form 8-K of Occidental dated January 28, 2010, File No. 1-9210). |
| | 10.3* | Amended and Restated Employment Agreement, dated October 9, 2008, between Occidental and Donald P. de Brier (filed as Exhibit 10.3 to the Quarterly Report on Form 10-Q of Occidental for the quarterly period ended September 30, 2008, File No. 1-9210). |
| | 10.4* | Form of Indemnification Agreement between Occidental and each of its directors and certain executive officers (filed as Exhibit B to the Proxy Statement of Occidental for its May 21, 1987, Annual Meeting of Stockholders, File No. 1-9210). |
| | 10.5* | Occidental Petroleum Corporation Split Dollar Life Insurance Program and Related Documents (filed as Exhibit 10.2 to the Quarterly Report on Form 10-Q of Occidental for the quarterly period ended September 30, 1994, File No. 1-9210). |
| | 10.6* | Split Dollar Life Insurance Agreement, dated January 24, 2002, by and between Occidental and Donald P. de Brier (filed as Exhibit 10.1 to the Quarterly Report on Form 10-Q of Occidental for the quarterly period ended March 31, 2002, File No. 1-9210). |
| | 10.7* | Occidental Petroleum Insured Medical Plan, as amended and restated effective April 29, 1994, amending and restating the Occidental Petroleum Corporation Executive Medical Plan (as amended and restated effective April 1, 1993) (filed as Exhibit 10 to the Quarterly Report on Form 10-Q of Occidental for the quarterly period ending March 31, 1994, File No. 1-9210). |
| | 10.8* | Form of Occidental Petroleum Corporation Modified Deferred Compensation Plan (Effective December 31, 2006, Amended and Restated Effective November 1, 2008) (filed as Exhibit 10.4 to the Quarterly Report on Form 10-Q of Occidental for the quarterly period ended September 30, 2008, File No. 1-9210). |
| | 10.9* | Form of Occidental Petroleum Corporation Amendment to Senior Executive Supplemental Life Insurance Plan (Effective as of January 1, 1986, Amended and Restated Effective as of January 1, 1996) (filed as Exhibit 10.5 to the Quarterly Report on Form 10-Q of Occidental for the quarterly period ended September 30, 2008, File No. 1-9210). |
| | 10.10* | Form of Occidental Petroleum Corporation Amendment to Senior Executive Survivor Benefit Plan (Effective as of January 1, 1986, Amended and Restated Effective as of January 1, 1996) (filed as Exhibit 10.6 to the Quarterly Report on Form 10-Q of Occidental for the quarterly period ended September 30, 2008, File No. 1-9210). |
| | 10.11* | Occidental Petroleum Corporation 1996 Restricted Stock Plan for Non-Employee Directors, amended October 11, 2007 (filed as Exhibit 10.1 to the Quarterly Report on Form 10-Q of Occidental for the quarterly period ended September 30, 2007, File No. 1-9210). |
| | 10.12* | Form of Restricted Stock Option Assignment under Occidental Petroleum Corporation 1996 Restricted Stock Plan for Non-Employee Directors (filed as Exhibit 99.2 to the Registration Statement on Form S-8 of Occidental, File No. 333-02901). |
| | 10.13* | Form of Restricted Stock Agreement under Occidental Petroleum Corporation 1996 Restricted Stock Plan for Non-Employee Directors (filed as Exhibit 10.3 to the Quarterly Report on Form 10-Q of Occidental for the quarterly period ended March 31, 2003, File No. 1-9210). |
| | 10.14* | Amendment to Form of Restricted Stock Agreement under Occidental Petroleum Corporation 1996 Restricted Stock Plan for Non-Employee Directors (filed as Exhibit 10.2 to the Quarterly Report on Form 10-Q of Occidental for the quarterly period ended September 30, 2007, File No. 1-9210). |
| | 10.15* | Form of Occidental Petroleum Corporation Supplemental Retirement Plan II (Effective as of January 1, 2005, Amended and Restated as of November 1, 2008) (filed as Exhibit 10.7 to the Quarterly Report on Form 10-Q of Occidental for the quarterly period ended September 30, 2008, File No. 1-9210). |
| | 10.16 | Amendment Number 1 to the Occidental Petroleum Corporation Supplemental Retirement Plan II (Effective as of January 1, 2005, Amended and Restated as of November 1, 2008). |
| | 10.17 | Amendment Number 2 to the Occidental Petroleum Corporation Supplemental Retirement Plan II (Effective as of January 1, 2005, Amended and Restated as of November 1, 2008). |
| | 10.18* | Occidental Petroleum Corporation 2001 Incentive Compensation Plan (as amended through September 12, 2002) (filed as Exhibit 10.2 to the Quarterly Report on Form 10-Q of Occidental for the quarterly period ended September 30, 2002, File No. 1-9210). |
| | 10.19* | Form of Incentive Stock Option Agreement under Occidental Petroleum Corporation 2001 Incentive Compensation Plan (filed as Exhibit 10.1 to the Quarterly Report on Form 10-Q of Occidental for the quarterly period ended September 30, 2001, File No. 1-9210). |
| | 10.20* | Form of Nonqualified Stock Option Agreement under Occidental Petroleum Corporation 2001 Incentive Compensation Plan (filed as Exhibit 10.2 to the Quarterly Report on Form 10-Q of Occidental for the quarterly period ended September 30, 2001, File No. 1-9210). |
| | 10.21* | Form of Incentive Stock Option Agreement under Occidental Petroleum Corporation 2001 Incentive Compensation Plan (July 2002 version) (filed as Exhibit 10.4 to the Quarterly Report on Form 10-Q of Occidental for the quarterly period ended September 30, 2002, File No. 1-9210). |
| | 10.22* | Form of Nonqualified Stock Option Agreement under Occidental Petroleum Corporation 2001 Incentive Compensation Plan (July 2002 version) (filed as Exhibit 10.5 to the Quarterly Report on Form 10-Q of Occidental for the quarterly period ended September 30, 2002, File No. 1-9210). |
| | 10.23* | Terms and Conditions for Incentive Stock Option Award under Occidental Petroleum Corporation 2001 Incentive Compensation Plan (July 2003 version) (filed as Exhibit 10.3 to the Quarterly Report on Form 10-Q of Occidental for the quarterly period ended June 30, 2003, File No. 1-9210). |
* Incorporated herein by reference
| | 10.24* | Terms and Conditions for Nonqualified Stock Option Award under Occidental Petroleum Corporation 2001 Incentive Compensation Plan (July 2003 version) (filed as Exhibit 10.4 to the Quarterly Report on Form 10-Q of Occidental for the quarterly period ended June 30, 2003, File No. 1-9210). |
| | 10.25* | Terms and Conditions of Stock Appreciation Rights Award under Occidental Petroleum Corporation 2001 Incentive Compensation Plan (filed as Exhibit 10.3 to the Quarterly Report on Form 10-Q of Occidental for the fiscal quarter ended June 30, 2004, File No. 1-9210). |
| | 10.26* | Occidental Petroleum Corporation 2005 Long-Term Incentive Plan (filed as Exhibit 99.1 to the Registration Statement on Form S-8 of Occidental, File No. 333-124732). |
| | 10.27* | Terms and Conditions of Stock Appreciation Rights Award under Occidental Petroleum Corporation 2005 Long-Term Incentive Plan (filed as Exhibit 10.12 to the Quarterly Report on Form 10-Q of Occidental for the quarterly period ended June 30, 2005, File No. 1-9210). |
| | 10.28* | Agreement to Amend Outstanding Option Awards, dated October 26, 2005 (filed as Exhibit 10.2 to the Quarterly Report on Form 10-Q of Occidental for the quarterly period ended September 30, 2005, File No. 1-9210). |
| | 10.29* | Terms and Conditions of Restricted Share Unit Award (mandatory deferred issuance of shares) under Occidental Petroleum Corporation 2005 Long-Term Incentive Plan (December 2005 version) (filed as Exhibit 10.62 to the Annual Report on Form 10-K of Occidental for the fiscal year ended December 31, 2005, File No. 1-9210). |
| | 10.30* | Global Restricted Stock Unit Amendment to the 2005 Terms and Conditions (filed as Exhibit 10.5 to the Current Report on Form 8-K of Occidental dated October 12, 2006 (date of earliest event reported), File No. 1-9210). |
| | 10.31* | Terms and Conditions of Performance-Based Stock Award (deferred issuance of shares) under Occidental Petroleum Corporation 2005 Long-Term Incentive Plan (January 2006 version – Corporate) (filed as Exhibit 10.63 to the Annual Report on Form 10-K of Occidental for the fiscal year ended December 31, 2005, File No. 1-9210). |
| | 10.32* | Terms and Conditions of Performance-Based Stock Award (deferred issuance of shares) under Occidental Petroleum Corporation 2005 Long-Term Incentive Plan (January 2006 version – Oil and Gas) (filed as Exhibit 10.64 to the Annual Report on Form 10-K of Occidental for the fiscal year ended December 31, 2005, File No. 1-9210). |
| | 10.33* | Terms and Conditions of Performance-Based Stock Award (deferred issuance of shares) under Occidental Petroleum Corporation 2005 Long-Term Incentive Plan (January 2006 version – Chemicals) (filed as Exhibit 10.65 to the Annual Report on Form 10-K of Occidental for the fiscal year ended December 31, 2005, File No. 1-9210). |
| | 10.34* | Terms and Conditions of Stock Appreciation Rights (SARs) under Occidental Petroleum Corporation 2005 Long-Term Incentive Plan (July 2006 version) (filed as Exhibit 10.4 to the Quarterly Report on Form 10-Q of Occidental for the quarterly period ended June 30, 2006, File No. 1-9210). |
| | 10.35* | Form of Occidental Petroleum Corporation 2005 Deferred Stock Program (Restatement Effective as of November 1, 2008) (filed as Exhibit 10.8 to the Quarterly Report on Form 10-Q of Occidental for the quarterly period ended September 30, 2008, File No. 1-9210). |
| | 10.36* | Occidental Petroleum Corporation Executive Incentive Compensation Plan (filed as Exhibit 10.69 to the Annual Report on Form 10-K of Occidental for the fiscal year ended December 31, 2005, File No. 1-9210). |
| | 10.37* | Description of financial counseling program (filed as Exhibit 10.50 to the Annual Report on Form 10-K of Occidental for the fiscal year ended December 31, 2003, File No. 1-9210). |
| | 10.38* | Description of group excess liability insurance program (filed as Exhibit 10.51 to the Annual Report on Form 10-K of Occidental for the fiscal year ended December 31, 2003, File No. 1-9210). |
| | 10.39* | Executive Stock Ownership Guidelines (filed as Exhibit 10.1 to the Quarterly Report on Form 10-Q of Occidental for the quarterly period ended March 31, 2005, File No. 1-9210). |
| | 10.40* | Form of Restricted Stock Award for Non-Employee Directors under Occidental Petroleum Corporation 2005 Long-Term Incentive Plan (filed as Exhibit 10.1 to the Current Report on Form 8-K of Occidental dated February 16, 2006 (date of earliest event reported), filed February 22, 2006, File No. 1-9210). |
| | 10.41* | Amendment to Form of Restricted Stock Award for Non-Employee Directors under Occidental Petroleum Corporation 2005 Long-Term Incentive Plan (filed as Exhibit 10.3 to the Quarterly Report on Form 10-Q of Occidental for the fiscal quarter ended September 30, 2007, File No. 1-9210). |
| | 10.42* | Form of Restricted Stock Award for Non-Employee Directors under Occidental Petroleum Corporation 2005 Long-Term Incentive Plan (2007 version) (filed as Exhibit 10.4 to the Quarterly Report on Form 10-Q of Occidental for the fiscal quarter ended September 30, 2007, File No. 1-9210). |
| | 10.43* | Director Retainer and Attendance Fees (filed as Exhibit 10.2 to the Current Report on Form 8-K of Occidental dated February 16, 2006 (date of earliest event reported), filed February 22, 2006, File No. 1-9210). |
| | 10.44* | Terms and Conditions of Performance-Based Stock Award under Occidental Petroleum Corporation 2005 Long-Term Incentive Plan (January 2007 version – Corporate) (filed as Exhibit 10.68 to the Annual Report on Form 10-K of Occidental for the fiscal year ended December 31, 2006, File No. 1-9210). |
| | 10.45* | Terms and Conditions of Performance-Based Stock Award under Occidental Petroleum Corporation 2005 Long-Term Incentive Plan (January 2007 version – Oil and Gas) (filed as Exhibit 10.69 to the Annual Report on Form 10-K of Occidental for the fiscal year ended December 31, 2006, File No. 1-9210). |
| | 10.46* | Terms and Conditions of Performance-Based Stock Award under Occidental Petroleum Corporation 2005 Long-Term Incentive Plan (January 2007 version – Chemicals) (filed as Exhibit 10.70 to the Annual Report on Form 10-K of Occidental for the fiscal year ended December 31, 2006, File No. 1-9210). |
| | 10.47* | Occidental Petroleum Corporation 2005 Long-Term Incentive Plan Return On Equity Incentive Award (Cash-based, Cash-settled Award) (filed as Exhibit 10.1 to the Current Report on Form 8-K of Occidental dated July 18, 2007 (date of earliest event reported), File No. 1-9210). |
* Incorporated herein by reference
| | 10.48* | Occidental Petroleum Corporation 2005 Long-Term Incentive Plan Total Shareholder Return Incentive Award Agreement (Equity-based, Equity and Cash-Settled Award) (filed as Exhibit 10.2 to the Current Report on Form 8-K of Occidental dated July 18, 2007 (date of earliest event reported), File No. 1-9210). |
| | 10.49* | Occidental Petroleum Corporation 2005 Long-Term Incentive Plan Long-Term Incentive Award Agreement (Equity-based, Cash-Settled Award) (filed as Exhibit 10.3 to the Current Report on Form 8-K of Occidental dated July 18, 2007 (date of earliest event reported), File No. 1-9210). |
| | 10.50* | Occidental Petroleum Corporation 2005 Long-Term Incentive Plan Occidental Oil And Gas Corporation Return On Assets Incentive Award Agreement (Cash-Based, Cash-Settled Award) (filed as Exhibit 10.5 to the Quarterly Report on Form 10-Q of Occidental for the fiscal quarter ended June 30, 2007, File No. 1-9210). |
| | 10.51* | Occidental Petroleum Corporation 2005 Long-Term Incentive Plan Occidental Chemical Corporation Return On Assets Incentive Award Agreement (Cash-Based, Cash-Settled Award) (filed as Exhibit 10.6 to the Quarterly Report on Form 10-Q of Occidental for the fiscal quarter ended June 30, 2007, File No. 1-9210). |
| | 10.52* | Occidental Petroleum Corporation 2005 Long-Term Incentive Plan Return on Equity Incentive Award (Cash-based, Cash-settled Award) (filed as Exhibit 10.1 to the Current Report On Form 8-K of Occidental dated July 16, 2008 (date of earliest event reported), File No. 1-9210). |
| | 10.53* | Occidental Petroleum Corporation 2005 Long-Term Incentive Plan Total Shareholder Return Incentive Award Agreement (Equity-based, Equity and Cash-settled Award) (filed as Exhibit 10.2 to the Current Report On Form 8-K of Occidental dated July 16, 2008 (date of earliest event reported), File No. 1-9210). |
| | 10.54* | Occidental Petroleum Corporation 2005 Long-Term Incentive Plan Long-Term Incentive Award Agreement (Equity-based, Cash-settled Award) (filed as Exhibit 10.4 to the Quarterly Report on Form 10-Q of Occidental for the fiscal quarter ended June 30, 2008, File No. 1-9210). |
| | 10.55* | Occidental Petroleum Corporation 2005 Long-Term Incentive Plan Occidental Oil and Gas Corporation Return on Assets Incentive Award Agreement (Cash-based, Cash-settled Award) (filed as Exhibit 10.5 to the Quarterly Report on Form 10-Q of Occidental for the fiscal quarter ended June 30, 2008, File No. 1-9210). |
| | 10.56* | Occidental Petroleum Corporation 2005 Long-Term Incentive Plan Occidental Chemical Corporation Return on Assets Incentive Award Agreement (Cash-based, Cash-settled Award) (filed as Exhibit 10.6 to the Quarterly Report on Form 10-Q of Occidental for the fiscal quarter ended June 30, 2008, File No. 1-9210). |
| | 10.57* | Occidental Petroleum Corporation 2005 Long-Term Incentive Plan Return on Equity Incentive Award Agreement (Cash-based, Cash-settled Award) (filed as Exhibit 10.1 to the Current Report on Form 8-K of Occidental dated July 15, 2009 (Date of Earliest Event Reported), File No. 1-9120). |
| | 10.58* | Occidental Petroleum Corporation 2005 Long-Term Incentive Plan Total Shareholder Return Incentive Award Agreement (Equity-based, Equity and Cash-settled Award) (filed as Exhibit 10.2 to the Current Report on Form 8-K of Occidental dated July 15, 2009 (Date of Earliest Event Reported), File No. 1-9210). |
| | 10.59* | Occidental Petroleum Corporation 2005 Long-Term Incentive Plan Occidental Chemical Corporation Return on Assets Incentive Award Agreement (Cash-based, Cash-settled Award) (filed as Exhibit 10.3 to the Quarterly Report on Form 10-Q of Occidental for the fiscal quarter ended June 30, 2009, File No. 1-9210). |
| | 10.60* | Occidental Petroleum Corporation 2005 Long-Term Incentive Plan Occidental Oil and Gas Corporation Return on Assets Incentive Award Agreement (Cash-based, Cash-settled Award) (filed as Exhibit 10.4 to the Quarterly Report on Form 10-Q of Occidental for the fiscal quarter ended June 30, 2009, File No. 1-9210). |
| | 10.61* | Occidental Petroleum Corporation 2005 Long-Term Incentive Plan Long-Term Incentive Award Terms and Conditions (Equity-based, Cash-settled Award) (filed as Exhibit 10.5 to the Quarterly Report on Form 10-Q of Occidental for the fiscal quarter ended June 30, 2009, File No. 1-9210). |
| | 10.62* | Occidental Petroleum Corporation 2005 Long-Term Incentive Plan Long-Term Incentive Award Terms and Conditions (Equity-based, Cash-settled Award) (alternate – CV) (filed as Exhibit 10.6 to the Quarterly Report on Form 10-Q of Occidental for the fiscal quarter ended June 30, 2009, File No. 1-9210). |
| | 12 | Statement regarding computation of total enterprise ratios of earnings to fixed charges for each of the five years in the period ended December 31, 2009. |
| | 21 | List of subsidiaries of Occidental at December 31, 2009. |
| | 23.1 | Consent of Independent Registered Public Accounting Firm. |
| | 23.2 | Consent of Independent Petroleum Engineers. |
| | 31.1 | Certification of CEO Pursuant to Section 302 of the Sarbanes-Oxley Act of 2002. |
| | 31.2 | Certification of CFO Pursuant to Section 302 of the Sarbanes-Oxley Act of 2002. |
| | 32.1 | Certifications of CEO and CFO Pursuant to Section 906 of the Sarbanes-Oxley Act of 2002. |
| | 99.1 | Ryder Scott Company Report on Reserves Procedures and Methodologies. |
| 101.INS | XBRL Instance Document. |
| 101.SCH | XBRL Taxonomy Extension Schema Document. |
| 101.CAL | XBRL Taxonomy Extension Calculation Linkbase Document. |
| 101.LAB | XBRL Taxonomy Extension Label Linkbase Document. |
| 101.PRE | XBRL Taxonomy Extension Presentation Linkbase Document. |
| 101.DEF | XBRL Taxonomy Extension Definition Linkbase Document. |
* Incorporated herein by reference
Pursuant to the requirements of Section 13 or 15(d) of the Securities Exchange Act of 1934, the registrant has duly caused this report to be signed on its behalf by the undersigned, thereunto duly authorized.
| | OCCIDENTAL PETROLEUM CORPORATION |
| | | |
| | | |
| February 25, 2010 | By: | /s/ Ray R. Irani |
| | | Ray R. Irani |
| | | Chairman of the Board of Directors |
| | | and Chief Executive Officer |
Pursuant to the requirements of the Securities Exchange Act of 1934, this report has been signed below by the following persons on behalf of the registrant and in the capacities and on the dates indicated.
| | Title | Date |
/s/ Ray R. Irani | | |
| Ray R. Irani | Chairman of the Board of Directors | February 25, 2010 |
| | and Chief Executive Officer | |
| | | |
/s/ Stephen I. Chazen | | |
| Stephen I. Chazen | President and Chief Financial Officer | February 25, 2010 |
| | | |
| | | |
/s/ Roy Pineci | | |
| Roy Pineci | Vice President, Controller and | February 25, 2010 |
| | Principal Accounting Officer | |
| | | |
/s/ Spencer Abraham | | |
| Spencer Abraham | Director | February 25, 2010 |
| | | |
| | | |
/s/ Ronald W. Burkle | | |
| Ronald W. Burkle | Director | February 25, 2010 |
| | | |
| | | |
/s/ John S. Chalsty | | |
| John S. Chalsty | Director | February 25, 2010 |
| | | |
| | | |
/s/ Edward P. Djerejian | | |
| Edward P. Djerejian | Director | February 25, 2010 |
| | | |
| | | |
/s/ John E. Feick | | |
| John E. Feick | Director | February 25, 2010 |
| | | |
| | | |
/s/ Carlos M. Gutierrez | | |
| Carlos M. Gutierrez | Director | February 25, 2010 |
| | | |
| | | |
| | Title | Date |
/s/ Irvin W. Maloney | | |
| Irvin W. Maloney | Director | February 25, 2010 |
| | | |
| | | |
/s/Avedick B. Poladian | | |
| Avedick B. Poladian | Director | February 25, 2010 |
| | | |
| | | |
/s/ Rodolfo Segovia | | |
| Rodolfo Segovia | Director | February 25, 2010 |
| | | |
| | | |
/s/ Aziz D. Syriani | | |
| Aziz D. Syriani | Director | February 25, 2010 |
| | | |
| | | |
/s/ Rosemary Tomich | | |
| Rosemary Tomich | Director | February 25, 2010 |
| | | |
| | | |
/s/ Walter L. Weisman | | |
| Walter L. Weisman | Director | February 25, 2010 |
| | | |
This report was printed on recycled paper.
© 2010 Occidental Petroleum Corporation
| | 10.16 | Amendment Number 1 to the Occidental Petroleum Corporation Supplemental Retirement Plan II (Effective as of January 1, 2005, Amended and Restated as of November 1, 2008). |
| | | |
| | 10.17 | Amendment Number 2 to the Occidental Petroleum Corporation Supplemental Retirement Plan II (Effective as of January 1, 2005, Amended and Restated as of November 1, 2008). |
| | | |
| | 12 | Statement regarding computation of total enterprise ratios of earnings to fixed charges for each of the five years in the period ended December 31, 2009. |
| | | |
| | 21 | List of subsidiaries of Occidental at December 31, 2009. |
| | | |
| | 23.1 | Consent of Independent Registered Public Accounting Firm. |
| | | |
| | 23.2 | Consent of Independent Petroleum Engineers. |
| | | |
| | 31.1 | Certification of CEO Pursuant to Section 302 of the Sarbanes-Oxley Act of 2002. |
| | | |
| | 31.2 | Certification of CFO Pursuant to Section 302 of the Sarbanes-Oxley Act of 2002. |
| | | |
| | 32.1 | Certifications of CEO and CFO Pursuant to Section 906 of the Sarbanes-Oxley Act of 2002. |
| | | |
| | 99.1 | Ryder Scott Company Report on Reserves Procedures and Methodologies. |
| | |
| 101.INS | XBRL Instance Document. |
| | |
| 101.SCH | XBRL Taxonomy Extension Schema Document. |
| | |
| 101.CAL | XBRL Taxonomy Extension Calculation Linkbase Document. |
| | |
| 101.LAB | XBRL Taxonomy Extension Label Linkbase Document. |
| | |
| 101.PRE | XBRL Taxonomy Extension Presentation Linkbase Document. |
| | |
| 101.DEF | XBRL Taxonomy Extension Definition Linkbase Document. |