Washington, D.C. 20549
Indicate by check mark whether the registrant is a large accelerated filer, an accelerated filer, a non-accelerated filer or a smaller reporting company. (See definition of "large accelerated filer," "accelerated filer" and "smaller reporting company" in Rule 12b-2 of the Exchange Act).
The aggregate market value of the voting common stock held by nonaffiliates of the registrant was approximately $83.2 billion, computed by reference to the closing price on the New York Stock Exchange composite tape of $104.04 per share of Common Stock on June 30, 2011. Shares of Common Stock held by each executive officer and director have been excluded from this computation in that such persons may be deemed to be affiliates. This determination of potential affiliate status is not a conclusive determination for other purposes.
At January 31, 2012, there were 811,055,632 shares of Common Stock outstanding.
Portions of the registrant’s definitive Proxy Statement, filed in connection with its May 4, 2012 Annual Meeting of Stockholders, are incorporated by reference into Part III.
In this report, "Occidental" refers to Occidental Petroleum Corporation, a Delaware corporation (OPC), or OPC and one or more entities in which it owns a controlling interest (subsidiaries). Occidental conducts its operations through various subsidiaries and affiliates. Occidental’s executive offices are located at 10889 Wilshire Boulevard, Los Angeles, California 90024; telephone (310) 208-8800.
Occidental’s domestic oil and gas operations are located mainly in California, Colorado, Kansas, Montana, New Mexico, North Dakota, Oklahoma, Texas, Utah and West Virginia. International operations are located in Bahrain, Bolivia, Colombia, Iraq, Libya, Oman, Qatar, the United Arab Emirates (UAE) and Yemen. Occidental sold its Argentine operations in February 2011 and has classified them as discontinued operations on a retrospective application basis.
The table below shows Occidental’s total oil, NGLs and natural gas proved reserves and sales volumes in 2011, 2010 and 2009. See "MD&A — Oil and Gas Segment," and the information under the caption "Supplemental Oil and Gas Information" for certain details regarding Occidental’s proved reserves, the reserves estimation process, sales and production volumes, production costs and other reserves-related data.
As a producer of oil and condensate, NGLs and natural gas, Occidental competes with numerous other domestic and foreign private and government producers. Oil, NGLs and natural gas are commodities that are sensitive to prevailing global and, in certain cases local, current and anticipated market conditions. They are sold at current market prices or on a forward basis to refiners and other market participants. Occidental’s competitive strategy relies on increasing production through strategic acquisitions and enhanced oil recovery projects in mature and underdeveloped fields. Occidental also competes to develop and produce its worldwide oil and gas reserves cost-effectively and obtain the required labor and services.
OxyChem owns and operates manufacturing plants at 22 domestic sites in Alabama, Georgia, Illinois, Kansas, Louisiana, Michigan, New Jersey, New York, Ohio, Pennsylvania and Texas and at two international sites in Canada and Chile and has interests in a Brazilian joint venture.
In 2011, OxyChem announced plans to build a 182,500-ton-per-year membrane chlor-alkali plant in Tennessee, which it expects to begin operating in 2013.
OxyChem competes with numerous other domestic and foreign chemical producers. For every product it manufactures and markets, OxyChem’s market position is first or second in the United States and first, second or third in the world. OxyChem’s competitive strategy is to be a low-cost producer of its products in order to compete on price.
The midstream and marketing operations are conducted in the locations described below:
Occidental employed approximately 11,300 people at December 31, 2011, 8,000 of whom were located in the United States. Occidental employed approximately 7,200 people in the oil and gas and midstream and marketing segments and 3,000 people in the chemical segment. An additional 1,100 people were employed in administrative and headquarters functions. Approximately 800 U.S.-based employees and 200 foreign-based employees are represented by labor unions.
Occidental has a long-standing strict policy to provide fair and equal employment opportunities to all applicants and employees.
For environmental regulation information, including associated costs, see the information under the heading "Environmental Liabilities and Expenditures" in the MD&A section of this report and "Risk Factors."
Occidental makes the following information available free of charge on its website at www.oxy.com:
Information contained on Occidental's web site is not part of this report.
Volatile global and local commodity pricing strongly affects Occidental’s results of operations.
Occidental’s financial results correlate closely to the prices it obtains for its products, particularly oil and gas.
Changes in consumption patterns, global and local economic conditions, inventory levels, production disruptions, the actions of OPEC, currency exchange rates, worldwide drilling and exploration activities, technological developments, weather, geophysical and technical limitations and other matters affect the supply and demand dynamics of oil and gas, which, along with the effect of changes in market perceptions, contribute to price unpredictability and volatility.
Demand and, consequently, the price obtained for Occidental’s chemical products correlate strongly to the health of the United States and global economies, as well as chemical industry expansion and contraction cycles. Occidental also depends on feedstocks and energy to produce chemicals, which are commodities subject to significant price fluctuations.
Occidental’s oil and gas business operates in highly competitive environments, which affect, among other things, its results of operations and its ability to grow production and replace reserves.
Results of operations, reserves replacement and growth in oil and gas production depend, in part, on Occidental’s ability to profitably acquire, develop or find additional reserves. Occidental has many competitors (including national oil companies), some of which are: (i) larger and better funded, (ii) may be willing to accept greater risks or (iii) have special competencies. Competition for reserves may make it more difficult to find attractive investment opportunities or require delay of reserve replacement efforts. During periods of low product prices, any cash conservation efforts may delay production growth and reserve replacement efforts.
Occidental may experience delays, cost overruns, losses or unrealized expectations in development efforts and exploration activities.
Occidental bears the risks of development delays and cost overruns due to approval delays for drilling and other permits, equipment failures, construction delays, escalating costs or competition for services, materials, supplies or labor, property or border disputes, disappointing reservoir performance and other associated risks that may affect its ability to profitably grow production, replace reserves and achieve its targeted returns.
Exploration is inherently risky. Exploration is subject to delays, misinterpretation of geologic or engineering data, unexpected geologic conditions or finding reserves of disappointing quality or quantity, which may result in significant losses.
Governmental actions and political instability may affect Occidental’s results of operations.
Occidental’s businesses are subject to the decisions of many governments and political interests. As a result, Occidental faces risks of:
Occidental faces risks associated with its acquisitions and divestitures.
Occidental’s acquisition and divestiture activities carry risks that it may: (i) not fully realize anticipated benefits due to less-than-expected reserves or production or changed circumstances, such as product prices; (ii) bear unexpected integration costs or experience other integration difficulties; (iii) experience share price declines based on the market’s evaluation of the activity; or (iv) assume or retain liabilities that are greater than anticipated.
Occidental’s oil and gas reserves are based on professional judgments and may be subject to revision.
Calculations of oil and gas reserves depend on estimates concerning reservoir characteristics and recoverability, including production decline rates and operating performance, as well as capital and operating costs. If Occidental were required to make unanticipated significant negative reserve revisions, its results of operations and stock price could be adversely affected.
Concerns about climate change may affect Occidental’s operations.
There is an ongoing effort to assess and quantify the effects of climate change and the potential human influences on climate. The U.S. federal government and the states of California and New Mexico have adopted, and other jurisdictions are considering, legislation, regulations or policies that seek to control or reduce the production, use or emissions of “greenhouse gases” (GHG), to control or reduce the production or consumption of fossil fuels, and to increase the use of renewable or alternative energy sources. California’s cap-and-trade program is moving into the implementation phase. The U.S. Environmental Protection Agency has begun to regulate certain GHG emissions from both stationary and mobile sources. The uncertain outcome and timing of existing and proposed international, national and state measures make it difficult to predict their business impact. However, Occidental could face risks of delays in development projects, increases in costs and taxes and reductions in the demand for and restrictions on the use of its products as a result of ongoing GHG reduction efforts.
Occidental’s businesses may experience catastrophic events.
The occurrence of events, such as earthquakes, hurricanes, floods, well blowouts, fires, explosions, chemical releases, industrial accidents, physical or cyber attacks and other events that cause operations to cease or be curtailed, may negatively affect Occidental’s businesses and the communities in which it operates. Third-party insurance may not provide adequate coverage or Occidental may be self-insured with respect to the related losses.
Other risk factors.
Occidental has no unresolved SEC staff comments that have been outstanding more than 180 days at December 31, 2011.
For information regarding legal proceedings, see the information under the caption, "Lawsuits, Claims and Other Contingencies" in the MD&A section of this report and in Note 9 to the Consolidated Financial Statements.
The current term of employment of each executive officer of Occidental will expire at the May 4, 2012, organizational meeting of the Board of Directors or when a successor is selected. The following table sets forth the executive officers of Occidental:
This section incorporates by reference the quarterly financial data appearing under the caption "Quarterly Financial Data (Unaudited)" after the Notes to the Consolidated Financial Statements and the information appearing under the caption "Liquidity and Capital Resources" in the MD&A section of this report. Occidental’s common stock was held by 33,819 stockholders of record at December 31, 2011, and by approximately 475,000 additional stockholders whose shares were held for them in street name or nominee accounts. The common stock is listed and traded on the New York Stock Exchange. The quarterly financial data, which are included in this report after the Notes to the Consolidated Financial Statements, set forth the range of trading prices for the common stock as reported on the composite tape of the New York Stock Exchange and quarterly dividend information.
The quarterly dividends declared on the common stock were $0.46 for all quarters of 2011 ($1.84 for the year). On February 9, 2012, a quarterly dividend of $0.54 per share was declared on the common stock, payable on April 15, 2012 to stockholders of record on March 9, 2012. The declaration of future dividends is a business decision made by the Board of Directors from time to time, and will depend on Occidental’s financial condition and other factors deemed relevant by the Board.
All of Occidental's equity compensation plans for its employees and non-employee directors have been approved by the stockholders. The aggregate number of shares of Occidental common stock authorized for issuance under such plans was approximately 66 million as of December 31, 2011. The following is a summary of the securities reserved for issuance under such plans:
Share Repurchase Activities
Occidental’s share repurchase activities for the year ended December 31, 2011, were as follows:
| Period | | Total Number of Shares Purchased (a) | | Average Price Paid per Share | | Total Number of Shares Purchased as Part of Publicly Announced Plans or Programs | | Maximum Number of Shares that May Yet Be Purchased Under the Plans or Programs |
| First Quarter 2011 | | 129,521 | | | $ | 103.07 | | | — | | | | |
| Second Quarter 2011 | | 264,560 | | | $ | 112.90 | | | — | | | | |
| Third Quarter 2011 | | 2,100,000 | | | $ | 77.57 | | | 2,100,000 | | | | |
| October 1 - 31, 2011 | | 564,772 | | | $ | 77.66 | | | 420,000 | | | | |
| November 1 - 30, 2011 | | 180,182 | | | $ | 95.69 | | | 70,000 | | | | |
| December 1 - 31, 2011 | | 80,000 | | | $ | 88.22 | | | 80,000 | | | | |
| Fourth Quarter 2011 | | 824,954 | | | $ | 82.62 | | | 570,000 | | | | |
| Total 2011 | | 3,319,035 | | | $ | 82.64 | | | 2,670,000 | | | 24,485,575 | (b) |
| (a) | Includes shares purchased from the trustee of Occidental's defined contribution savings plan that are not part of publicly announced plans or programs. |
| (b) | Occidental has had a 95 million share repurchase program authorized since 2008; however, the program does not obligate Occidental to acquire any specific number of shares and may be discontinued at any time. |
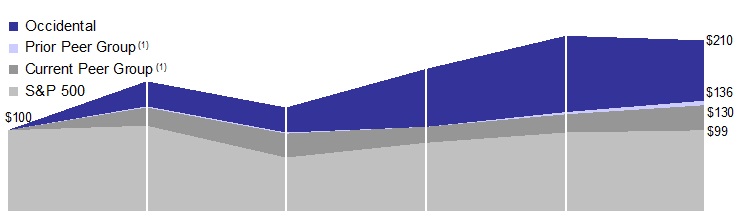
Performance Graph
The following graph compares the yearly percentage change in Occidental’s cumulative total return on its common stock with the cumulative total return of the Standard & Poor's 500 Stock Index (S&P 500) and with that of Occidental’s peer groups over the five-year period ended on December 31, 2011. The graph assumes that $100 was invested at the beginning of the five-year period shown in the graph below in (i) Occidental common stock, (ii) in the stock of the companies in the S&P 500 and (iii) in each of the current and prior peer group companies' common stock weighted by their relative market values within the respective peer groups and that all dividends were reinvested.
In 2011, Occidental revised its current peer group due to a significant decrease in market capitalization and restructuring of a previously included entity. Prior to the revision, Occidental's peer group consisted of Anadarko Petroleum Corporation, Apache Corporation, Canadian Natural Resources Limited, Chevron Corporation, ConocoPhillips, Devon Energy Corporation, EOG Resources Inc., ExxonMobil Corporation, Hess Corporation, Marathon Oil Corporation, Royal Dutch Shell plc and Occidental. Occidental's current peer group consists of Anadarko Petroleum Corporation, Apache Corporation, Canadian Natural Resources Limited, Chevron Corporation, ConocoPhillips, Devon Energy Corporation, EOG Resources Inc., ExxonMobil Corporation, Hess Corporation, Royal Dutch Shell plc, Total S.A. and Occidental.
| 12/31/06 | | 12/31/07 | | 12/31/08 | | 12/31/09 | | 12/31/10 | | 12/31/11 |
| |  | $100 | | | $160 | | | $127 | | | $176 | | | $216 | | | $210 | |
| |  | 100 | | | 129 | | | 97 | | | 104 | | | 122 | | | 136 | |
| |  | 100 | | | 128 | | | 96 | | | 104 | | | 119 | | | 130 | |
| |  | 100 | | | 105 | | | 66 | | | 84 | | | 97 | | | 99 | |
| | The information provided in this Performance Graph shall not be deemed "soliciting material" or "filed" with the Securities and Exchange Commission or subject to Regulation 14A or 14C under the Securities Exchange Act of 1934 (Exchange Act), other than as provided in Item 201 to Regulation S-K under the Exchange Act, or subject to the liabilities of Section 18 of the Exchange Act and shall not be deemed incorporated by reference into any filing under the Securities Act of 1933 or the Exchange Act except to the extent Occidental specifically requests that it be treated as soliciting material or specifically incorporates it by reference. | |
| | | | | |
| | (1) | The cumulative total return of the peer group companies' common stock includes the cumulative total return of Occidental's common stock. | |
Item 6 Selected Financial Data
| Five-Year Summary of Selected Financial Data | | | | | | | |
| Dollar amounts in millions, except per-share amounts | | | | | | | | | | | |
| | | | | | | | | | | | |
| | | | | | | | | | | | |
| As of and for the years ended December 31, | | 2011 | | 2010 | | 2009 | | 2008 | | 2007 | |
results of operations (a) | | | | | | | | | | | | | | | | |
| Net sales | | $ | 23,939 | | $ | 19,045 | | $ | 14,814 | | $ | 23,713 | | $ | 18,323 | |
Income from continuing operations (b) | | $ | 6,640 | | $ | 4,569 | | $ | 3,151 | | $ | 7,183 | | $ | 5,072 | |
| Net income attributable to common stock | | $ | 6,771 | | $ | 4,530 | | $ | 2,915 | | $ | 6,857 | | $ | 5,400 | |
Basic earnings per common share from continuing operations (b) | | $ | 8.16 | | $ | 5.62 | | $ | 3.88 | | $ | 8.77 | | $ | 6.06 | |
Basic earnings per common share (b) | | $ | 8.32 | | $ | 5.57 | | $ | 3.59 | | $ | 8.37 | | $ | 6.45 | |
Diluted earnings per common share (b) | | $ | 8.32 | | $ | 5.56 | | $ | 3.58 | | $ | 8.34 | | $ | 6.42 | |
| | | | | | | | | | | | | | | | | |
financial position (a) | | | | | | | | | | | | | | | | |
| Total assets | | $ | 60,044 | | $ | 52,432 | | $ | 44,229 | | $ | 41,537 | | $ | 36,519 | |
| Long-term debt, net | | $ | 5,871 | | $ | 5,111 | | $ | 2,557 | | $ | 2,049 | | $ | 1,741 | |
| Stockholders’ equity | | $ | 37,620 | | $ | 32,484 | | $ | 29,159 | | $ | 27,325 | | $ | 22,858 | |
| | | | | | | | | | | | | | | | | |
market capitalization (c) | | $ | 75,992 | | $ | 79,735 | | $ | 66,050 | | $ | 48,607 | | $ | 63,573 | |
| | | | | | | | | | | | | | | | | |
| cash flow | | | | | | | | | | | | | | | | |
| Operating: | | | | | | | | | | | | | | | | |
| Cash provided by operating activities | | $ | 12,281 | | $ | 9,566 | | $ | 5,946 | | $ | 10,765 | | $ | 6,831 | |
| Investing: | | | | | | | | | | | | | | | | |
| Capital expenditures | | $ | (7,518 | ) | $ | (3,940 | ) | $ | (3,245 | ) | $ | (4,126 | ) | $ | (3,038 | ) |
| Cash used by all other investing activities, net | | $ | (2,385 | ) (d) | $ | (5,355 | ) | $ | (2,221 | ) | $ | (5,314 | ) | $ | (70 | ) |
| Financing: | | | | | | | | | | | | | | | | |
| Cash dividends paid | | $ | (1,436 | ) | $ | (1,159 | ) | $ | (1,063 | ) | $ | (940 | ) | $ | (765 | ) |
| Cash provided (used) by all other financing activities, net | | $ | 261 | | $ | 2,242 | | $ | 30 | | $ | (570 | ) | $ | (2,333 | ) |
| | | | | | | | | | | | | | | | | |
| dividends per common share | | $ | 1.84 | | $ | 1.47 | | $ | 1.31 | | $ | 1.21 | | $ | 0.94 | |
| | | | | | | | | | | | | | | | | |
weighted average basic shares outstanding (thousands) | | | 812,075 | | | 812,472 | | | 811,305 | | | 817,635 | | | 834,932 | |
Note: Argentine operations were sold in February 2011 and have been reflected as discontinued operations for all periods.
| (a) | See the MD&A section of this report and the Notes to Consolidated Financial Statements for information regarding acquisitions and dispositions, discontinued operations and other items affecting comparability. | |
| (b) | Represent amounts attributable to common stock after deducting noncontrolling interest amounts of $72 million in 2010, $51 million in 2009, $116 million in 2008 and $75 million in 2007. There were no noncontrolling interests in 2011. | |
| (c) | Market capitalization is calculated by multiplying the year-end total shares of common stock outstanding, net of shares held as treasury stock, by the year-end closing stock price. | |
| (d) | Includes $2.6 billion of cash received from the sale of the Argentine operations. | |
Item 7 and 7A
Management’s Discussion and Analysis of Financial Condition and Results of Operations (MD&A)
Strategy
General
In this report, "Occidental" refers to Occidental Petroleum Corporation (OPC), or OPC and one or more entities in which it owns a controlling interest (subsidiaries). Occidental's principal businesses consist of three segments operated by OPC's subsidiaries and affiliates. The oil and gas segment explores for, develops and produces oil and condensate, NGLs and natural gas. The chemical segment mainly manufactures and markets basic chemicals and vinyls. The midstream, marketing and other segment gathers, treats, processes, transports, stores, purchases and markets oil, condensate, NGLs, natural gas, CO2 and power. It also trades around its assets, including pipelines and storage capacity, and trades oil, NGLs, gas and other commodities.
Occidental aims to maximize total returns to stockholders using the following strategies:
| Ø | Grow oil and gas production through development programs focused on large, long-lived oil and gas assets with long-term growth potential, and acquisitions; |
| Ø | Allocate and deploy capital with a focus on achieving returns well in excess of Occidental's cost-of-capital; |
| Ø | Provide consistent dividend growth; and |
| Ø | Maintain financial discipline and a strong balance sheet. |
Occidental prefers to seek growth of oil and gas production by holding large, long-lived "legacy" oil and gas assets, like those in California and the Permian Basin, that tend to have enhanced secondary and tertiary recovery opportunities and economies of scale that lead to cost-effective production. Capital is employed to operate segment assets in a safe and environmentally sound manner. Management expects such assets to contribute substantially to earnings and cash flow after invested capital. Management currently believes its growth will be most strongly affected by the success of the development plans for its California prospects, the Permian development program, Oman and the Shah Gas Field development project in Abu Dhabi.
The primary objective of the chemical business is to generate cash flow in excess of its normal capital expenditure requirements and achieve above-cost-of-capital returns. Capital is employed to operate the chemical business in a safe and environmentally sound manner, to sustain production capacity and to focus on projects designed to improve the competitiveness of these assets. Acquisitions may be pursued when they are expected to enhance the existing core chlor-alkali and PVC businesses or take advantage of other specific opportunities.
The midstream and marketing segment is also managed to generate returns on capital employed in excess of Occidental's cost of capital. In marketing its own production and third-party purchases, Occidental attempts to maximize realized prices and margins and limit credit risk exposure. In commodities trading, Occidental seeks to generate gains using net-long positions. Capital is employed to operate segment assets in a safe and environmentally sound manner, to sustain or, where appropriate, increase operational capacity and to improve the competitiveness of Occidental's assets.
Occidental maintains financial discipline by prioritizing the uses of its cash flows in the following order:
| Ø | Maintenance capital |
| Ø | Dividends |
| Ø | Growth capital |
| Ø | Acquisitions |
| Ø | Share repurchases |
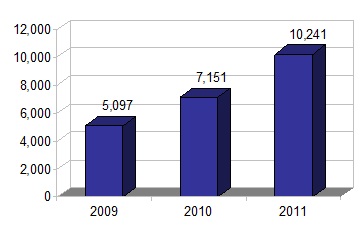
Oil and Gas
Segment Earnings
($ millions)
The oil and gas business seeks to increase its oil and gas production profitably and add new reserves at a pace ahead of production while minimizing costs incurred for finding and development of such reserves. The oil and gas business implements this strategy within the limits of the overall corporate strategy primarily by:
| Ø | Deploying capital to fully develop areas where proved reserves exist and increase production from mature fields by applying appropriate technology and advanced reservoir-management practices; |
| Ø | Adding reserves through a combination of focused exploration and development programs conducted in Occidental's core areas, which are the United States, the Middle East/North Africa and Latin America; and |
| Ø | Maintaining a disciplined approach to acquisitions and divestitures with an emphasis on transactions at attractive prices. |
Over the past several years, Occidental has strengthened its asset base within its core areas. Occidental has invested in, and disposed of, assets with the goal of raising the average performance and potential of its assets.
In the first quarter of 2011, Occidental sold its Argentine oil and gas operations for after-tax proceeds of approximately $2.6 billion. In 2011, Occidental also completed the acquisition of producing properties in South Texas for approximately $1.8 billion and acquired other domestic oil and gas assets, which included properties in California, as well as the Permian and Williston Basins for approximately $2.6 billion.
Internationally, Occidental acquired a 40-percent participating interest in the Shah Gas Field development project in Abu Dhabi, which is operated by Abu Dhabi Gas Development Company Limited (Al Hosn Gas Project), in the first quarter of 2011. Occidental partnered with the Abu Dhabi National Oil Company in a 30-year joint venture agreement for the $10 billion project, of which Occidental’s portion is approximately $4 billion. In May 2011, Occidental paid approximately $500 million for its share of pre-acquisition development expenditures. Approximately $460 million of this amount related to expenditures recorded in the midstream and marketing segment.
In addition, Occidental continues to deploy significant capital to its core operations in the Permian Basin and California, as well as in Iraq, Oman and Qatar, to increase production from these assets.
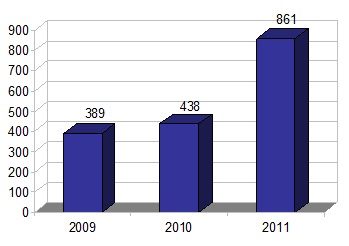
Chemical
Segment Earnings
($ millions)
OxyChem’s strategy is to be a low-cost producer in order to maximize its cash flow generation. OxyChem concentrates on the chlorovinyls chain beginning with chlorine, which is co-produced with caustic soda, both of which are marketed to third parties. In addition, chlorine, together with ethylene, is converted through a series of intermediate products into PVC. OxyChem's focus on chlorovinyls allows it to maximize the benefits of integration and take advantage of economies of scale.
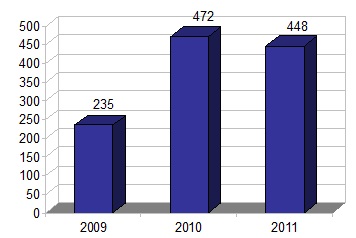
Midstream, Marketing and Other
Segment Earnings
($ millions)
The midstream and marketing segment is managed to generate returns on capital invested in excess of Occidental's cost of capital. In order to generate these returns, the segment provides low-cost services to other segments and operates and invests in gas plants and oil, gas, NGLs and CO2 pipeline systems and storage facilities. It also provides similar services to third parties. In addition, the marketing and trading group markets Occidental's and third-party oil and gas, trades around the midstream and marketing segment assets and engages in commodities trading.
Key Performance Indicators
General
Occidental seeks to meet its strategic goals by continuously measuring its success in its key performance metrics, which ultimately drives total stockholder return. Occidental believes the following are the most significant metrics that maximize total stockholder return:
| Ø | Dividend growth; |
| Ø | Production growth in the oil and gas segment; |
| Ø | Return on equity (ROE) and return on capital employed (ROCE). |
In addition, Occidental monitors other segment-specific measures such as per-unit profit, production cost, cash flow, finding and development cost and others.
Occidental's oil and gas production has grown a cumulative 15 percent for the three-year period from 2008 through 2011. Based on the $2.16 per share annual dividend rate announced in February 2012, Occidental’s dividend rate has increased by 332 percent in 10 years. While Occidental's stockholders' equity increased by 16 percent for 2011 and 29 percent for the three-year period from 2009 through 2011, it continued to deliver above-cost-of-capital returns as follows:
| | | Annual 2011 (a) | | Three-Year Annual Average 2009 - 2011 (b) |
| ROE | | 19.3% | | 15.0% |
| ROCE | | 17.2% | | 13.5% |
| (a) | The ROE and ROCE for 2011 were calculated by dividing Occidental's 2011 net income attributable to common stock (taking into account after-tax cost of capital for ROCE) by its average equity and capital employed, respectively, during 2011. |
| (b) | The three-year average ROE and ROCE were calculated by dividing Occidental's average net income attributable to common stock (taking into account after-tax cost of capital for ROCE) over the three-year period 2009-2011 by its average equity and capital employed, respectively, over the same period. |
| | |
As a result, through December 31, 2011, Occidental’s total stockholder return has been 110 percent over the past five years and 769 percent over the past 10 years.
Debt Structure
Occidental’s year-end 2011 total debt-to-capitalization (debt and equity) ratio was 13 percent. In the first quarter of 2011, Occidental redeemed $1.4 billion of senior notes. Occidental issued $2.15 billion of senior unsecured notes in the third quarter of 2011.
Occidental has a $2.0 billion bank credit facility (2011 Credit Facility). The interest rate on any borrowings under the 2011 Credit Facility is based in part on Occidental’s senior debt ratings. Occidental’s long-term senior unsecured debt was rated A by Fitch Ratings, Standard and Poor’s Ratings and DBRS. Occidental’s long-term unsecured debt was rated A2 by Moody’s Investors Service. A security rating is not a recommendation to buy, sell or hold securities, may be subject to revision or withdrawal at any time by the assigning rating organization and should be evaluated independently of any other rating.
Oil and Gas Segment
Business Environment
Oil and gas prices are the major variables that drive the industry’s short- and intermediate-term financial performance. Average oil prices were higher in 2011 than 2010. The average daily per barrel WTI and Brent market prices, respectively, for 2011 were $95.12 and $110.90, compared with $79.53 and $79.61 in 2010. Approximately 60 percent of Occidental’s oil production tracks world oil prices, such as Brent, and 40 percent is indexed to WTI. Occidental’s average realized price for oil as a percentage of average WTI and Brent prices was approximately 103 percent and 88 percent for 2011, and 95 percent and 94 percent for 2010, respectively. Occidental's average realized price for NGLs as a percentage of average WTI price was approximately 56 percent and 57 percent for 2011 and 2010, respectively.
The average daily New York Mercantile Exchange (NYMEX) domestic natural gas price in 2011 decreased approximately 8 percent from 2010. For 2011, the price averaged $4.11 per Mcf compared with $4.49 per Mcf for 2010, and was $2.99 per Mcf as of December 31, 2011.
Prices and differentials can vary significantly, even on a short-term basis, making it impossible to predict realized prices with a reliable degree of certainty.
Operations
Domestic Interests
Occidental conducts its domestic operations through land leases, subsurface mineral rights it owns or a combination of both surface land and subsurface mineral rights it owns. Occidental's domestic oil and gas leases have a primary term ranging from one to ten years, which are extended through the end of production once production commences. Of the total 7.4 million net acres domestically where Occidental conducts its operations, 73 percent is leased, 26 percent represents owned subsurface mineral rights and for 1 percent it owns both land and the mineral rights.
Production-Sharing Contracts (PSC)
Occidental has interests in Bahrain, Iraq, Libya, Oman, Yemen and Qatar, including Dolphin, that are operated under PSCs or similar contracts. Under such contracts, Occidental receives a share of production and reserves to recover its costs and an additional share for profit. In addition, Occidental's share of production and reserves from operations in Long Beach, California, and certain contracts in Colombia are subject to contractual arrangements similar to a PSC. These contracts do not transfer any right of ownership to Occidental and reserves reported from these arrangements are based on Occidental’s economic interest as defined in the contracts. Occidental’s share of production and reserves from these contracts decreases when product prices rise and increases when prices decline. Overall, Occidental’s net economic benefit from these contracts is greater when product prices are higher.
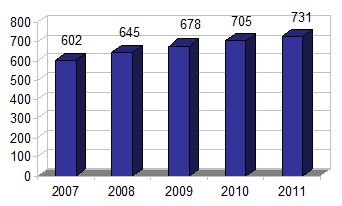
Business Review
The following chart shows Occidental’s total volumes for the last five years:
Worldwide Sales Volumes
(thousands BOE/day)
| Notes: |
| * | Includes average sales volumes per day of 4 thousand barrels (mbbl), 6 mbbl, 6 mbbl and 5 mbbl for 2010, 2009, 2008 and 2007, respectively, related to the noncontrolling interest in a Colombian subsidiary. |
| * | Excludes average sales volumes per day of 5 thousand barrels of oil equivalent (MBOE), 43 MBOE, 42 MBOE, 36 MBOE and 36 MBOE for 2011, 2010, 2009, 2008 and 2007, respectively, related to the Argentine operations sold in February 2011 and classified as discontinued operations. |
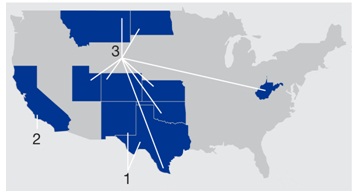
United States Assets
| | | |
| | | 2. Elk Hills and other California interests 3. Midcontinent and Other Interests | |
Permian
Occidental's Permian production is diversified across a large number of producing areas in the Permian Basin. The Permian Basin extends throughout southwest Texas and southeast New Mexico and is one of the largest and most active oil basins in the United States, with the entire basin accounting for approximately 16 percent of the total United States oil production. Occidental is the largest producer of oil in the Permian Basin with an approximate 15-percent net share of the total production. Occidental also produces and processes natural gas and NGLs in the Permian Basin.
In the past several years, including 2011, Occidental increased its Permian interests through various acquisitions.
Occidental’s interests in Permian offer additional development and exploitation potential. During 2011, Occidental drilled approximately 409 wells on its operated properties and participated in additional wells drilled on third-party-operated properties. Occidental also focused on improving the performance of existing wells.
Approximately 64 percent of Occidental’s Permian oil production is from fields that actively employ the application of CO2 flood technology, an enhanced oil recovery (EOR) technique. This technique involves injecting CO2 into oil reservoirs where it causes the oil to flow more freely into producing wells. These CO2 flood operations make Occidental a world leader in the application of this technology. During 2011, Occidental’s non-CO2 operations increased their development program, which accounted for more than half of the wells drilled in Permian.
Occidental's total share of production in Permian was approximately 198,000 BOE per day in 2011.
California
Occidental's California operations consist of holdings in the Elk Hills area, the Wilmington and other fields in the Los Angeles basin and interests in the Ventura, San Joaquin and Sacramento basins. Occidental's properties in California consist of more than 90 fields.
Occidental's interests in the Elk Hills area include the Elk Hills oil and gas field in the southern portion of California’s San Joaquin Valley, which it operates with an approximate 78-percent interest, along with other adjacent properties. The Elk Hills Field is the largest producer of gas and NGLs in California. During 2011, Occidental continued to invest in the Elk Hills area, performing infill drilling, field extensions and recompletions identified by advanced reservoir characterization techniques, resulting in approximately 330 new wells being drilled.
Occidental began construction of a new gas processing plant in the Elk Hills area in 2010, which is expected to be completed in 2012.
Occidental holds approximately 1.7 million acres in California, the vast majority of which are net fee mineral interests. As a result, Occidental has a substantial inventory of properties available for future development and exploitation in conventional areas, as well as unconventional prospects, such as shale. In all of California during 2011, Occidental drilled approximately 675 wells and performed approximately 500 workovers.
Occidental's share of production and reserves from its operations in the Wilmington Field is subject to contractual arrangements similar to a PSC.
Occidental's total share of production in California was approximately 138,000 BOE per day in 2011.
Midcontinent and Other
The Midcontinent properties, which include interests in the Hugoton Field and the Piceance Basin, are located in Colorado, Utah, Kansas and Oklahoma. Occidental holds over 2.4 million net acres in the midcontinent region, which includes 1.4 million acres in a large concentration of gas reserves and production and royalty interests in the Hugoton area located in Kansas and Oklahoma, and approximately 1.0 million acres in Colorado and Utah.
Other interests are located in North Dakota, Montana, South Texas and West Virginia. In January 2011, Occidental completed the acquisition of producing properties in South Texas. Occidental holds approximately 138,000 net acres in South Texas. Occidental also holds approximately 277,000 net acres of oil producing and prospective unconventional properties in North Dakota’s Williston Basin, including acreage in the Bakken and Three Forks formations. A substantial portion of this acreage was purchased in 2011 and 2010. In addition, Occidental holds 229,000 net acres in West Virginia.
In Midcontinent and Other, Occidental drilled approximately 270 wells and produced approximately 92,000 BOE per day in 2011. Occidental expects to reduce drilling activity for gas wells in 2012.
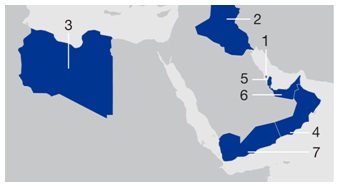
Middle East/North Africa Assets
| | | |
| | | Middle East/North Africa 1. Bahrain 2. Iraq 3. Libya 4. Oman 5. Qatar 6. United Arab Emirates 7. Yemen | |
Bahrain
In 2009, Occidental and its partners began operating the Bahrain Field under a 20-year development and production sharing agreement (DPSA). Occidental has a 48-percent working interest in the joint venture. Since handover of operations, Occidental and its partners have increased gross gas production capacity more than 40 percent from an initial level of 1.5 billion cubic feet per day to over 2.1 billion cubic feet per day and increased gross oil production by 60 percent from 26,000 barrels per day to 42,000 barrels per day. Occidental plans to continue growing gross gas production capacity to over 2.3 billion cubic feet per day and gross oil production to over 75,000 barrels. Occidental's share of production from Bahrain during 2011 was approximately 173 million cubic feet (MMcf) of gas and 4,000 barrels of oil per day.
Iraq
In 2010, Occidental and its partners signed a 20-year contract with the South Oil Company of Iraq to develop the Zubair Field. Occidental has a 23.44-percent interest in this contract, which entitles Occidental to receive oil for cost recovery and a remuneration fee, as a result of having achieved an initial gross production threshold of approximately 180,000 BOE per day in 2010. Occidental and its partners plan to increase production to a contractually targeted production level of 1.2 million BOE per day by 2016 and maintain this level of production for seven years. Occidental's share of production in Iraq was approximately 7,000 BOE per day in 2011.
Libya
Occidental, under agreements with the Libyan National Oil Corporation, participates in Sirte Basin producing operations. These agreements continue through 2032.
In early 2011, Occidental ceased exploration activities and its participation in production operations in Libya due to civil unrest in the country and United States sanctions. The United States government lifted its sanctions in September 2011 and Occidental resumed its participation in the producing operations at that time. Occidental Libya’s 2011 and 2010 production volumes were approximately 4,000 and 13,000 BOE per day, representing less than 1 percent and 2 percent, respectively, of Occidental’s worldwide volumes.
Oman
In Oman, Occidental is the operator of Block 9 and Block 27, with a 65-percent working interest in each block; Block 53, with a 45-percent working interest; and Block 62, with a 48-percent working interest.
Occidental and its partners signed a 30-year PSC for the Mukhaizna Field (Block 53) with the Government of Oman in 2005, pursuant to which Occidental assumed operations of the field. By the end of 2011, Occidental had drilled over 1,400 new wells and continued implementation of a major steam flood project. As of year-end 2011, the exit rate of gross daily production was over 16 times higher than the production rate in September 2005, reaching 124,000 BOE per day. Occidental plans to steadily increase production through continued expansion of the steam flood project.
The term for Block 9 is through December 2015, with a potential 10-year extension. The term for Block 27 is through September 2035.
In 2008, Occidental was awarded a 20-year contract for Block 62, subject to declaration of commerciality, where it is pursuing development and exploration opportunities targeting gas and condensate resources.
Occidental's share of production from the Oman properties was approximately 76,000 BOE per day in 2011.
Qatar
Occidental operates three offshore projects in Qatar: Idd El Shargi North Dome (ISND) and Idd El Shargi South Dome (ISSD), with a 100-percent working interest in each project, and Al Rayyan (Block 12), with a 92.5-percent working interest. The terms for ISND, ISSD and Block 12 extend through 2019, 2022 and 2017, respectively.
In 2011, Occidental received approval from the Government of Qatar for the fourth phase of field development of the ISND Field, focusing on continued development of mature reservoirs while further delineating and developing less mature reservoirs. Drilling under this phase is planned to be completed in 2012. Occidental also received approval for field development plans for ISSD and Al Rayyan, which would include additional drilling through 2013.
Occidental also has an investment in Dolphin, which was acquired in 2002, consisting of two separate economic interests through which Occidental owns: (i) a 24.5-percent undivided interest in the operations under a DPSA with the Government of Qatar to develop and produce natural gas and NGLs in Qatar’s North Field through mid-2032, with a provision to request a five-year extension; and (ii) a 24.5-percent interest in the stock of Dolphin Energy Limited (Dolphin Energy), which is discussed further in "Midstream, Marketing and Other Segment – Pipeline Transportation."
Occidental's share of production from all of its operations in Qatar was approximately 126,000 BOE per day in 2011.
United Arab Emirates
In the first quarter of 2011, Occidental acquired a 40-percent participating interest in the Al Hosn Gas Project. Occidental partnered with the Abu Dhabi National Oil Company in a 30-year joint venture agreement for the project. The project is anticipated to produce over 500 MMcf per day of natural gas, of which Occidental’s net share would be over 200 MMcf per day. In addition, the project is expected to produce over 50,000 barrels per day of NGLs and condensates, of which Occidental’s net share would be over 20,000 barrels per day. Occidental’s 2011 capital expenditures for this project were approximately $460 million, with an additional $500 million paid for Occidental's share of pre-acquisition development expenditures. A substantial portion of the total expenditures to date have been incurred in connection with plants and facilities, which are included in the midstream and marketing segment. As the development project progresses, higher portions of the capital will be spent to drill wells, which will be reflected in the oil and gas segment. Occidental believes that its share of remaining capital until production from the field begins (expected to be in 2014), will be approximately $3 billion.
Occidental conducts a majority of its Middle East business development activities through its office in Abu Dhabi, which also provides various support functions for Occidental’s Middle East/North Africa oil and gas operations.
Yemen
Occidental owns contractual interests in two producing blocks in Yemen, Block 10 East Shabwa Field with a 40.4-percent interest that includes an 11.8-percent interest held in an unconsolidated entity, and Block S-1 An Nagyah Field, which is an Occidental-operated block with a 75-percent working interest. Occidental’s working interests in the Block 14 Masila Field expired in December 2011.
Occidental's share of production from the Yemen properties was approximately 27,000 BOE per day in 2011, which included nearly 11,000 BOE per day from the Masila Field.
Latin America Assets
| | 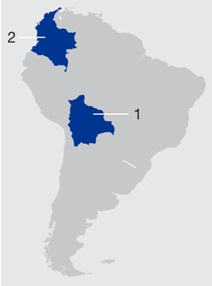 | | 2. Colombia | |
Bolivia
Occidental holds working interests in four blocks located in the Tarija, Chuquisaca and Santa Cruz regions of Bolivia.
Colombia
Occidental is the operator under four contracts within the Llanos Norte Basin: the Cravo Norte, Rondón, Cosecha and Chipirón association contracts. Occidental’s working interests under these four contracts are 39 percent, 44 percent, 53 percent and 61 percent, respectively. Occidental also holds a 48-percent working interest in the La Cira-Infantas Field, which is located in the Middle-Magdalena Basin. Occidental's share of 2011 production from its Colombian operations was approximately 29,000 BOE per day.
Proved Reserves
For further information regarding Occidental's proved reserves, see "Supplemental Oil and Gas Information" following the "Financial Statements."
Occidental had proved reserves at year-end 2011 of 3,176 million BOE, as compared with the year-end 2010 amount of 3,167 million BOE. Proved reserves at year-end 2011 and 2010 consisted of, respectively, 63 percent and 64 percent oil, 9 percent and 9 percent NGLs and 28 percent and 27 percent natural gas. Proved developed reserves represented approximately 76 percent of Occidental’s total proved reserves at year-end 2011 and 2010.
Proved Reserve Additions
Occidental's total proved reserve additions from all sources were 276 million BOE in 2011. The total additions were as follows:
| In millions of BOE | | | |
| Improved recovery | | | 264 | |
| Extensions and discoveries | | | 25 | |
| Purchases | | | 201 | |
| Revisions of previous estimates | | | (214 | ) |
| Total additions | | | 276 | |
Occidental's ability to add reserves, other than through purchases, depends on the success of improved recovery, extension and discovery projects, each of which depends on reservoir characteristics, technology improvements, oil and natural gas prices, as well as capital and operating costs. Many of these factors are outside of management’s control, and will affect whether or not these historical sources of proved reserve additions continue at similar levels.
Revisions of Previous Estimates
Revisions can include upward or downward changes to previous proved reserves estimates for existing fields due to the evaluation of existing or new geologic, production decline or operating performance data, or changes in prices and costs that are used in reserves estimations. In 2011, revisions of previous estimates provided a net 214 million BOE reduction to reserves.
Oil price changes affect proved reserves recorded by Occidental. For example, when oil prices increase, less oil volume is required to recover costs under PSCs, which results in a reduction of Occidental’s share of proved reserves. Conversely, when oil prices drop, Occidental’s share of proved reserves increases for these PSCs. Oil and natural gas price changes also affect the economic lives of proved reserves, primarily in domestic properties, in a manner offsetting these PSC effects, because higher prices result in longer reservoir lives and more reserves.
In 2011, Occidental’s domestic reserves had a positive price-related revision as a result of higher oil prices, net of negative revisions in certain properties resulting from lower gas prices during the year. International reserves had negative price adjustments due to high oil prices. Price adjustments for the company as a whole were negative. If the currently prevailing natural gas prices stay at depressed levels for an extended period, domestic gas reserves could experience a further negative price revision at the end of 2012.
Other revisions outside the United States were largely in Libya and Iraq. In Libya, the revision was the result of the current situation in the country where development plans for proved undeveloped reserves have not yet been put into effect. In Iraq, a slower than
expected pace of the development resulted in a revision to the proved undeveloped reserves. In both countries, Occidental expects that these reserves will be reinstated as the development plans progress. Other revisions internationally were caused by the performance of previously drilled wells.
In the United States, other revisions were caused by performance issues related to wells drilled in prior periods. The revisions involved several properties where wells experienced higher than expected decline rates. Sizable portions of these revisions were transferred from the proved category to probable, possible and contingent categories.
Apart from the effects of product prices, Occidental believes its approach to interpreting technical data regarding proved oil and gas reserves makes it more likely that future proved reserve revisions will be positive rather than negative.
Improved Recovery
In 2011, Occidental added proved reserves of 264 million BOE from improved recovery through its EOR and infill drilling activities. Generally, the improved recovery additions in 2011 were associated with the continued development of properties in California, Permian, Williston, Oman, Colombia and Bahrain. These properties are generally characterized by the deployment of secondary and tertiary development projects, largely employing application of waterflood (secondary), steamflood (tertiary) or CO2 (secondary or tertiary) injection. These development projects are often applied through existing wells, though additional drilling may be required to fully optimize the development configuration. Waterflooding is the technique of injecting water into the formation to displace the oil to the offsetting oil production wells. Steamflooding is the technique of injecting steam into the formation to lower oil viscosity so that it flows more freely into producing wells. This process is applied in areas where the oil is too viscous to be effectively moved with water. CO2 flooding involves injecting CO2 into oil reservoirs where it causes the oil to flow more freely into producing wells. In addition, some improved recovery comes from drilling infill wells that allow recovery of reserves that would not be recoverable from existing wells.
Extensions and Discoveries
Occidental also obtained reserve additions from extensions and discoveries, which are dependent on successful exploration and exploitation programs. In 2011, extensions and discoveries added 25 million BOE.
Purchases and Divestitures of Proved Reserves
Occidental continues to add reserves through acquisitions when properties are available at prices it deems reasonable. As market conditions change, the available supply of properties may increase or decrease accordingly. In 2011, Occidental added 201 million BOE through purchases of proved reserves largely consisting of several domestic acquisitions in South Texas, the Permian Basin and California.
Proved Undeveloped Reserves
In 2011, Occidental had proved undeveloped reserves additions of 307 million BOE from improved recovery, extensions and discoveries and purchases. Of the total additions, 186 million BOE represented additions from improved recovery, primarily in California, Permian, Williston, Oman, Colombia, Bahrain and Qatar. Occidental added 106 million BOE through purchases of proved undeveloped reserves domestically in South Texas, the Permian Basin and California. These proved undeveloped reserve additions were offset by reserves transfers of 178 million BOE to the proved developed category as a result of the 2011 development programs. Occidental incurred approximately $2.7 billion in 2011 to convert proved undeveloped reserves to proved developed reserves. Permian, California, Midcontinent, Oman, Qatar and Bahrain accounted for approximately 89 percent of the reserves transfers from proved undeveloped to proved developed in 2011. Costs to develop proved undeveloped reserves have increased over time and costs of transfers to proved developed reserves may continue to increase.
Reserves Evaluation and Review Process
Occidental’s estimates of proved reserves and associated future net cash flows as of December 31, 2011, were made by Occidental’s technical personnel and are the responsibility of management. The estimation of proved reserves is based on the requirement of reasonable certainty of economic producibility and funding commitments by Occidental toward the development of reserves. This process involves reservoir engineers, geoscientists, planning engineers and financial analysts. As part of the proved reserves estimation process, all reserves volumes are estimated by a forecast of production rates, operating costs and capital expenditures. Price differentials between benchmark prices (the unweighted arithmetic average of the first-day-of-the-month price for each month within the year) and realized prices and specifics of each operating agreement are then used to estimate the net reserves. Production rate forecasts are derived by a number of methods, including estimates from decline curve analysis, type-curve analysis, material balance calculations that take into account the volumes of substances replacing the volumes produced and associated reservoir pressure changes, seismic analysis and computer simulation of the reservoir performance. These field-tested technologies have demonstrated reasonably certain results with consistency and repeatability in the formation being evaluated or in an analogous formation. Operating and capital costs are forecast using the current cost environment applied to expectations of future operating and development activities.
Net proved developed reserves are those volumes that are expected to be recovered through existing wells with existing equipment and operating methods for which the incremental cost of any additional required investment is relatively minor. Net proved undeveloped reserves are those volumes that are expected to be recovered from new wells on undrilled acreage, or from existing wells where a relatively major expenditure is required for recompletion.
The current Senior Director of Worldwide Reserves and Reservoir Engineering is responsible for overseeing the preparation of reserve estimates, in compliance with SEC rules and regulations, including the internal audit and review of Occidental's oil and gas reserves data. The Senior Director has over 30 years of experience in the upstream sector of the exploration and production
business, and has held various assignments in North America, Asia and Europe. He is a three-time past Chair of the Society of Petroleum Engineers Oil and Gas Reserves Committee. He is an American Association of Petroleum Geologists (AAPG) Certified Petroleum Geologist and currently serves on the AAPG Committee on Resource Evaluation. He is a member of the Society of Petroleum Evaluation Engineers, the Colorado School of Mines Potential Gas Committee and the UNECE Expert Group on Resource Classification. He is also an active member of the Joint Committee on Reserves Evaluator Training (JCORET). The Senior Director has Bachelor of Science and Master of Science degrees in geology from Emory University in Atlanta.
Occidental has a Corporate Reserves Review Committee (Reserves Committee) consisting of senior corporate officers to monitor, review and approve Occidental's oil and gas reserves. The Reserves Committee reports to the Audit Committee of Occidental's Board of Directors during the year. Since 2003, Occidental has retained Ryder Scott Company, L.P. (Ryder Scott), independent petroleum engineering consultants, to review its annual oil and gas reserve estimation processes.
In 2011, Ryder Scott conducted a process review of Occidental’s methods and analytical procedures utilized by Occidental’s engineering and geological staff for estimating the proved reserves volumes, preparing the economic evaluations and determining the reserves classifications as of December 31, 2011, in accordance with the U.S. Securities and Exchange Commission (SEC) regulatory standards. Ryder Scott reviewed the specific application of such methods and procedures for selected oil and gas properties considered to be a valid representation of Occidental’s 2011 year-end total proved reserves portfolio. In 2011, Ryder Scott reviewed approximately 20 percent of Occidental’s proved oil and gas reserves. Since being engaged in 2003, Ryder Scott has reviewed the specific application of Occidental’s reserve estimation methods and procedures for approximately 76 percent of Occidental’s existing proved oil and gas reserves. Management retains Ryder Scott to provide objective third-party input on its methods and procedures and to gather industry information applicable to Occidental’s reserve estimation and reporting process. Ryder Scott has not been engaged to render an opinion as to the reasonableness of reserves quantities reported by Occidental. Occidental has filed Ryder Scott's independent report as an exhibit to this Form 10-K.
Based on its reviews, including the data, technical processes and interpretations presented by Occidental, Ryder Scott has concluded that the overall procedures and methodologies Occidental utilized in estimating the proved reserves volumes for the reviewed properties are appropriate for the purpose thereof, and comply with current SEC regulations.
Industry Outlook
The petroleum industry is highly competitive and subject to significant volatility due to numerous current and anticipated market conditions. The WTI and Brent oil price indexes generally increased throughout 2011, settling at $98.83 per barrel and $107.38 per barrel as of December 31, 2011.
Oil prices will continue to be affected by (i) global supply and demand, which is generally a function of global economic conditions, inventory levels, production disruptions, currency exchange rates, and the actions of OPEC, other significant producers and governments, and (ii) the effect of changes in these variables on market perceptions. These factors make it impossible to predict the future direction of oil prices reliably. Occidental continues to adjust to economic conditions by adjusting capital expenditures in line with current economic conditions with the goal of keeping returns well above its cost of capital.
NGL prices are related to the supply and demand for the components of products making up these liquids. Some of them more typically correlate to the price of oil while others are affected by natural gas prices as well as the demand for certain chemical products for which they are used as feedstock. In addition, infrastructure constraints magnify the pricing volatility from region to region. The volatility in all of these markets makes it impossible to predict NGL prices reliably.
Domestic natural gas prices and local differentials are strongly affected by local supply and demand fundamentals, as well as government regulations and availability of transportation capacity from producing areas. These and other factors can cause prices to be volatile, making it impossible to forecast gas prices reliably.
Chemical Segment
Business Environment
Chemical segment earnings increased in 2011 as certain economies continued to recover from the global economic downturn. Higher margins across most product lines were achieved as prices more than offset higher feedstock costs.
Business Review
Basic Chemicals
During 2011, United States and international manufacturing sectors continued to recover from the global economic downturn resulting in strong demand and pricing for basic chemical products. Industry chlorine production increased by 2 percent, compared to 2010, as chlorine demand in emerging economies continued to outpace United States demand. Exports of downstream chlorine derivatives remained competitive in offshore markets as a result of the North America feedstock cost advantages, which are driven mostly by natural gas prices. Pricing for liquid caustic soda improved each quarter of 2011 partly as a result of major global events, including the devastating tsunami in Japan, which led to an increase in exports of 7 percent over 2010. Chlorine prices remained steady throughout the year, and began to decrease during the fourth quarter due to seasonal slowdowns, which negatively impacted overall chlorine demand.
Vinyls
Year-over-year domestic vinyls demand fell 3.6 percent due to the persistent low demand from the housing and commercial construction markets. Consequently, domestic operating rates in 2011 were down 1 percent compared to 2010, and margins also decreased in 2011. In addition, ethylene costs, which contribute significantly to feedstock costs, increased
globally in 2011. However, North American-produced ethylene continues to cost significantly less compared to costs in Europe and Asia, giving North American vinyl products an advantage in global markets. As a result, Occidental's vinyl exports in 2011 were 19 percent higher compared to 2010.
Industry Outlook
Future performance will depend on the recovery of domestic housing and construction markets, positive global economic activity, and the cost competitiveness of United States feedstock and energy pricing compared to global markets.
Basic Chemicals
Occidental expects that if the United States housing, automotive and durable goods sectors continue to improve, it should experience higher domestic demand for basic chemical products in 2012. With the stronger demand, chlorine and caustic soda margins would be expected to generally remain at 2011 levels. The continued competitiveness of downstream chlorine derivatives in global markets is contingent on United States feedstock costs remaining favorable compared to other global markets.
Vinyls
If the United States economy continues to improve, domestic demand for vinyls and operating rates would also be expected to improve in 2012, which should result in better domestic margins. Occidental expects export demand to remain firm, but for margins to be challenged as North American ethylene producers operate near capacity reducing the United States cost advantages compared to other vinyl producing regions of the world.
Midstream, Marketing and Other Segment
Business Environment
Midstream and marketing segment earnings are affected by the performance of its marketing and trading businesses and its processing and transportation assets. The marketing and trading businesses earn margins from trading oil, gas and other commodities, marketing the oil and gas segment's products and storage activity. Earnings related to processing and transportation are affected by the volumes that are processed at, and transported through, the segment's plants and pipelines, as well as the margins obtained on related services.
The midstream and marketing segment earnings were modestly lower in 2011, compared to 2010, reflecting lower marketing and trading income, partially offset by higher pipeline income.
Business Review
Oil and Gas Marketing and Trading
The marketing and trading group markets substantially all of Occidental’s oil, NGLs and gas production, trades around the midstream and marketing segment assets and engages in commodities trading. Occidental’s third-party marketing and trading activities focus on purchasing oil, NGLs and gas for resale from partners, producers and third parties whose oil and gas supply is located near its midstream and marketing assets, such as pipelines, processing plants and storage facilities. These purchases allow Occidental to aggregate volumes to maximize prices received for Occidental’s production. In addition, Occidental’s Phibro trading unit's strategy is to profit from market price changes. Marketing and trading earnings are affected primarily by commodity price changes and margins in oil and gas transportation and storage programs. In 2011, the marketing and trading group earnings decreased due to lower trading results.
Gas Processing Plants and CO2 Fields and Facilities
Occidental processes its and third-party domestic wet gas to extract NGLs and other gas by-products, including CO2, and delivers dry gas to pipelines. Margins primarily result from the difference between inlet costs of wet gas and market prices for NGLs. Occidental’s 2011 earnings from these operations improved compared to 2010, due to higher gas processing volumes and higher NGL prices.
Pipeline Transportation
Margin and cash flow from pipeline transportation operations mainly reflect volumes shipped. Dolphin Energy owns and operates a 230-mile-long, 48-inch diameter natural gas pipeline (Dolphin Pipeline), which transports dry natural gas from Qatar to the UAE. Through its 24.5-percent interest in Dolphin Energy, the Dolphin Pipeline investment contributes significantly to Occidental's pipeline transportation results. The Dolphin Pipeline has a capacity to transport up to 3.2 Bcf of natural gas per day and currently transports approximately 2.3 Bcf per day. Demand for natural gas in the UAE and Oman has grown and Dolphin Energy’s customers have requested additional gas supplies. To help fulfill this growing demand, Dolphin Energy will continue to pursue an agreement to secure an additional supply of gas from Qatar.
Occidental owns an oil-gathering, common carrier pipeline and storage system with approximately 2,700 miles of pipelines from southeast New Mexico across the Permian Basin of southwest Texas to Cushing, Oklahoma. The system has a current throughput capacity of about 365,000 barrels per day, 5.8 million barrels of active storage capability as well as 64 truck unloading facilities at various points along the system, which allow for additional volumes to be delivered into the pipeline.
Occidental owns approximately 35 percent of the General Partner of Plains All-American Pipeline, L.P. (Plains Pipeline), an oil and gas pipeline transportation, storage, terminalling and marketing entity.
Occidental’s 2011 pipeline transportation earnings improved due to better revenues and margins from all of these assets.
Power Generation Facilities
Earnings from power generation facilities are derived from the sales of steam and power to affiliates and third parties. Occidental’s 2011 earnings from these facilities were flat compared to 2010. On December 31, 2010, Occidental completed its acquisition of the remaining 50-percent joint-venture interest in Elk Hills Power, LLC (EHP), a limited liability company that operates a gas-fired power-generation plant in California, bringing Occidental's total ownership to 100 percent.
Industry Outlook
The pipeline transportation and power generation businesses are expected to remain relatively stable. The gas processing plant operations could have volatile results depending mostly on NGL prices, which cannot be predicted. Generally, higher NGL prices result in higher profitability. The trading and marketing business is inherently volatile. Based on its framework of controls and risk management systems, Occidental does not expect the volatility of these operations to be significant to the company as a whole.
Segment Results of Operations
Segment earnings exclude income taxes, interest income, interest expense, environmental remediation expenses, unallocated corporate expenses and discontinued operations, but include gains and losses from dispositions of segment assets and income from the segments' equity investments. Seasonality is not a primary driver of changes in Occidental's consolidated quarterly earnings during the year.
The following table sets forth the sales and earnings of each operating segment and corporate items:
| In millions, except per share amounts | | | | | | | |
| For the years ended December 31, | | 2011 | | 2010 | | 2009 | |
net sales (a) | | | | | | | | | | |
| Oil and Gas | | $ | 18,419 | | $ | 14,276 | | $ | 11,009 | |
| Chemical | | | 4,815 | | | 4,016 | | | 3,225 | |
| Midstream, Marketing and Other | | | 1,447 | | | 1,471 | | | 1,016 | |
Eliminations (a) | | | (742 | ) | | (718 | ) | | (436 | ) |
| | | $ | 23,939 | | $ | 19,045 | | $ | 14,814 | |
| earnings | | | | | | | | | | |
Oil and Gas (b,c) | | $ | 10,241 | | $ | 7,151 | | $ | 5,097 | |
| Chemical | | | 861 | | | 438 | | | 389 | |
| Midstream, Marketing and Other | | | 448 | | | 472 | | | 235 | |
| | | | 11,550 | | | 8,061 | | | 5,721 | |
| Unallocated corporate items | | | | | | | | | | |
Interest expense, net (d) | | | (284 | ) | | (93 | ) | | (102 | ) |
Income taxes (e) | | | (4,201 | ) | | (2,995 | ) | | (2,063 | ) |
Other (f) | | | (425 | ) | | (404 | ) | | (405 | ) |
Income from continuing operations (b) | | | 6,640 | | | 4,569 | | | 3,151 | |
Discontinued operations, net (g) | | | 131 | | | (39 | ) | | (236 | ) |
Net Income (b) | | $ | 6,771 | | $ | 4,530 | | $ | 2,915 | |
| | | | | | | | | | | |
| Basic Earnings per Common Share | | $ | 8.32 | | $ | 5.57 | | $ | 3.59 | |
| (a) | Intersegment sales eliminate upon consolidation and are generally made at prices approximately equal to those that the selling entity would be able to obtain in third-party transactions. | |
| (b) | Oil and gas segment earnings, income from continuing operations and net income represent amounts attributable to common stock after deducting noncontrolling interest amounts of $72 million and $51 million for 2010 and 2009, respectively. | |
| (c) | The 2011 amount includes pre-tax charges of $35 million related to exploration write-offs in Libya and $29 million related to a Colombian net worth tax, and a pre-tax gain for sale of an interest in a Colombian pipeline of $22 million. The 2010 amount includes a $275 million pre-tax charge for asset impairments, predominately of gas properties in the Rocky Mountain region. The 2009 amount includes an $8 million pre-tax charge for the termination of rig contracts. | |
| (d) | The 2011 amount includes a pre-tax charge of $163 million related to the premium on debt extinguishment. | |
| (e) | The 2011 amount includes a net $21 million charge for out-of-period state income taxes. The 2010 amount includes an $80 million benefit related to foreign tax credit carryforwards. The 2009 amount includes tax benefits of $87 million resulting from relinquishment of exploration properties. | |
| (f) | The 2009 amount includes a $40 million pre-tax charge related to severance and a $15 million pre-tax charge for railcar leases. | |
| (g) | The 2011 amount includes a $144 million after-tax gain from the sale of the Argentine operations. The 2009 amount includes an after-tax charge of $111 million for asset impairments of certain Argentine producing properties. | |
Oil and Gas
| Dollars in millions, except as indicated | | 2011 | | 2010 | | 2009 | |
| Segment Sales | | $ | 18,419 | | $ | 14,276 | | $ | 11,009 | |
| Segment Earnings | | $ | 10,241 | | $ | 7,151 | | $ | 5,097 | |
The following tables set forth the production and sales volumes of oil, NGLs and natural gas per day for each of the three years in the period ended December 31, 2011. The differences between the production and sales volumes per day are generally due to the timing of shipments at Occidental’s international locations where product is loaded onto tankers.
| | | | | | | | |
| Production per Day | | 2011 | | 2010 | | 2009 | |
| United States | | | | | | | | | | |
Oil (MBBL) | | | | | | | | | | |
| California | | | 80 | | | 76 | | | 76 | |
| Permian | | | 134 | | | 136 | | | 141 | |
| Midcontinent and Other | | | 16 | | | 7 | | | 6 | |
| Total | | | 230 | | | 219 | | | 223 | |
NGLs (MBBL) | | | | | | | | | | |
| California | | | 15 | | | 16 | | | 17 | |
| Permian | | | 38 | | | 29 | | | 27 | |
| Midcontinent and Other | | | 16 | | | 7 | | | 4 | |
| Total | | | 69 | | | 52 | | | 48 | |
Natural gas (MMCF) | | | | | | | | | | |
| California | | | 260 | | | 280 | | | 250 | |
| Permian | | | 157 | | | 199 | | | 199 | |
| Midcontinent and Other | | | 365 | | | 198 | | | 186 | |
| Total | | | 782 | | | 677 | | | 635 | |
Latin America (a) | | | | | | | | | | |
Oil (MBBL) – Colombia (b) | | | 29 | | | 37 | | | 45 | |
Natural gas (MMCF) – Bolivia | | | 15 | | | 16 | | | 16 | |
| Middle East/North Africa | | | | | | | | | | |
Oil (MBBL) | | | | | | | | | | |
| Bahrain | | | 4 | | | 3 | | | ― | |
| Dolphin | | | 9 | | | 11 | | | 15 | |
| Iraq | | | 7 | | | 3 | | | ― | |
| Libya | | | 4 | | | 12 | | | 10 | |
| Oman | | | 67 | | | 62 | | | 50 | |
| Qatar | | | 73 | | | 76 | | | 79 | |
| Yemen | | | 27 | | | 31 | | | 34 | |
| Total | | | 191 | | | 198 | | | 188 | |
NGLs (MBBL) | | | | | | | | | | |
| Dolphin | | | 10 | | | 13 | | | 11 | |
| Libya | | | ― | | | 1 | | | 1 | |
| Total | | | 10 | | | 14 | | | 12 | |
Natural gas (MMCF) | | | | | | | | | | |
| Bahrain | | | 173 | | | 169 | | | 10 | |
| Dolphin | | | 199 | | | 236 | | | 257 | |
| Oman | | | 54 | | | 48 | | | 49 | |
| Total | | | 426 | | | 453 | | | 316 | |
Total Production (MBOE) (a,c) | | | 733 | | | 711 | | | 677 | |
| (See footnotes following the Average Sales Price table) | |
| Sales Volumes per Day | | 2011 | | 2010 | | 2009 | |
| United States | | | | | | | | | | |
Oil (MBBL) | | | 230 | | | 219 | | | 223 | |
NGLs (MBBL) | | | 69 | | | 52 | | | 48 | |
Natural gas (MMCF) | | | 782 | | | 677 | | | 635 | |
Latin America (a) | | | | | | | | | | |
Oil (MBBL) – Colombia (b) | | | 29 | | | 36 | | | 45 | |
Natural gas (MMCF) – Bolivia | | | 15 | | | 16 | | | 16 | |
| Middle East/North Africa | | | | | | | | | | |
Oil (MBBL) | | | | | | | | | | |
| Bahrain | | | 4 | | | 3 | | | ― | |
| Dolphin | | | 9 | | | 12 | | | 14 | |
| Iraq | | | 3 | | | ― | | | ― | |
| Libya | | | 4 | | | 12 | | | 12 | |
| Oman | | | 69 | | | 61 | | | 50 | |
| Qatar | | | 73 | | | 76 | | | 79 | |
| Yemen | | | 27 | | | 30 | | | 35 | |
| Total | | | 189 | | | 194 | | | 190 | |
NGLs (MBBL) | | | | | | | | | | |
| Dolphin | | | 10 | | | 12 | | | 11 | |
| Libya | | | ― | | | 1 | | | ― | |
| Total | | | 10 | | | 13 | | | 11 | |
Natural gas (MMCF) | | | 426 | | | 453 | | | 316 | |
Total Sales Volumes (MBOE) (a,c) | | | 731 | | | 705 | | | 678 | |
| (See footnotes following the Average Sales Price table) | |
| | | 2011 | | 2010 | | 2009 | |
| Average Sales Prices | | | | | | | | | | |
Oil Prices ($ per bbl) | | | | | | | | | | |
| United States | | $ | 92.80 | | $ | 73.79 | | $ | 56.74 | |
Latin America (a) | | $ | 97.16 | | $ | 75.29 | | $ | 55.89 | |
| Middle East/North Africa | | $ | 104.34 | | $ | 76.67 | | $ | 58.75 | |
Total worldwide (a) | | $ | 97.92 | | $ | 75.16 | | $ | 57.31 | |
NGL Prices ($ per bbl) | | | | | | | | | | |
| United States | | $ | 59.10 | | $ | 48.86 | | $ | 37.26 | |
| Middle East/North Africa | | $ | 32.09 | | $ | 30.64 | | $ | 21.88 | |
| Total worldwide | | $ | 55.53 | | $ | 45.08 | | $ | 34.27 | |
Gas Prices ($ per Mcf) | | | | | | | | | | |
| United States | | $ | 4.06 | | $ | 4.53 | | $ | 3.46 | |
Latin America (a) | | $ | 10.11 | | $ | 7.73 | | $ | 5.70 | |
Total worldwide (a) | | $ | 3.01 | | $ | 3.11 | | $ | 2.83 | |
Expensed Exploration (d) | | $ | 258 | | $ | 262 | | $ | 254 | |
| Capital Expenditures | | | | | | | | | | |
| Development | | $ | 5,686 | | $ | 2,955 | | $ | 2,274 | |
| Exploration | | $ | 421 | | $ | 194 | | $ | 132 | |
| Other | | $ | 38 | | $ | 17 | | $ | 42 | |
| (a) | For all periods presented, excludes volumes and amounts from the Argentine operations sold in February 2011 and classified as discontinued operations. | |
| (b) | Includes production volumes per day of 5 mbbl and 6 mbbl for the years ended December 31, 2010 and 2009, respectively, related to the noncontrolling interest in a Colombian subsidiary. Includes sales volumes per day of 4 mbbl and 6 mbbl for the years ended December 31, 2010 and 2009, respectively, related to the noncontrolling interest in a Colombian subsidiary. | |
| (c) | Natural gas volumes have been converted to BOE based on energy content of six Mcf of gas to one barrel of oil. | |
| (d) | Includes dry hole write-offs and lease impairments of $160 million in 2011, $139 million in 2010 and $200 million in 2009. The 2011 amount includes a $35 million Libya exploration write-off. | |
Oil and gas segment earnings in 2011 were $10.2 billion compared to $7.2 billion in 2010. The increase reflected higher oil and NGL prices and volumes, partially offset by higher depreciation, depletion and amortization (DD&A) rates and higher operating costs, including higher field support, workover and well maintenance expenses driven by Occidental’s program to increase production at current high oil prices.
Daily oil and gas production volumes were 733,000 BOE for 2011, compared with 711,000 BOE for 2010. The increase was mainly due to acquisitions in South Texas, California and the Williston Basin, including the effect of post-acquisition capital investment, and higher production in Oman’s Mukhaizna Field and Iraq, which were partially offset by lower production in Libya. Production was negatively impacted in the Middle East/North Africa, Colombia and Long Beach by higher year-over-year average oil prices affecting PSCs by 18,000 BOE per day. Daily sales volumes were 731,000 BOE in the twelve months of 2011, compared with 705,000 BOE for 2010.
Oil and gas segment earnings in 2010 were $7.2 billion compared to $5.1 billion in 2009. The increase reflected higher average worldwide oil, NGL and domestic natural gas prices and higher volumes, partially offset by higher operating expenses partly resulting from fully expensing CO2, higher field support and workover expenses and higher DD&A rates.
Daily oil and gas production volumes were 711,000 BOE for 2010, compared with 677,000 BOE for 2009. The increase was mainly due to the new production in Bahrain, higher production in the Mukhaizna Field in Oman, and gas production from domestic assets, which were partially offset by a decline in Colombia. Production was negatively impacted in the Middle East/North Africa, Long Beach and Colombia by higher year-over-year average oil prices affecting PSCs by 16,000 BOE per day. Daily sales volumes were 705,000 BOE in the twelve months of 2010, compared with 678,000 BOE for 2009.
Oil and gas segment earnings in 2011 include pre-tax charges of $35 million related to exploration write-offs in Libya and $29 million related to Colombia net worth tax, as well as a pre-tax gain for sale of an interest in a Colombian pipeline of $22 million.
Oil and gas segment earnings in 2010 included a pre-tax charge of $275 million for asset impairments, predominately of gas properties in the Rocky Mountain region. Oil and gas segment earnings in 2009 included an $8 million pre-tax charge for the termination of rig contracts.
Average production costs for 2011, excluding taxes other than on income, were $12.84 per BOE, compared to $10.19 for 2010. The increase resulted from higher workover and well maintenance activity driven by Occidental’s program to increase production at current increased oil prices. We expect further increases in the activity level in 2012.
Chemical
| In millions | | 2011 | | 2010 | | 2009 | |
| Segment Sales | | $ | 4,815 | | $ | 4,016 | | $ | 3,225 | |
| Segment Earnings | | $ | 861 | | $ | 438 | | $ | 389 | |
| Capital Expenditures | | $ | 234 | | $ | 237 | | $ | 205 | |
Chemical segment earnings were $861 million in 2011, compared to $438 million in 2010. The 2011 results reflected strong export sales and higher margins resulting from higher demand across most products.
Chemical segment earnings were $438 million in 2010, compared to $389 million in 2009. The increase in 2010 reflected improved market conditions, particularly for exports, driven by favorable feedstock costs in North America compared to Europe and Asia. Vinyls exports in 2010 were 125 percent higher compared to 2009.
Midstream, Marketing and Other
| In millions | | 2011 | | 2010 | | 2009 | |
| Segment Sales | | $ | 1,447 | | $ | 1,471 | | $ | 1,016 | |
| Segment Earnings | | $ | 448 | | $ | 472 | | $ | 235 | |
| Capital Expenditures | | $ | 1,089 | | $ | 501 | | $ | 554 | |
Midstream and marketing segment earnings in 2011 were $448 million, compared to $472 million in 2010. The 2011 results reflected lower marketing and trading income, partially offset by higher pipeline income.
Midstream and marketing segment earnings in 2010 were $472 million, compared to $235 million in 2009. The 2010 results reflected higher margins in the marketing and trading and gas processing businesses and increased earnings in the pipeline business.
Significant Items Affecting Earnings
The following table sets forth, for the years ended December 31, 2011, 2010 and 2009, significant transactions and events affecting Occidental’s earnings that vary widely and unpredictably in nature, timing and amount:
Significant Items Affecting Earnings
Benefit (Charge) (in millions) | | 2011 | | 2010 | | 2009 | |
| oil and gas | | | | | | | | | | |
| Libya exploration write-off | | $ | (35 | ) | $ | ― | | $ | ― | |
| Gains on sale of Colombian pipeline interest | | | 22 | | | ― | | | ― | |
| Foreign tax | | | (29 | ) | | ― | | | ― | |
| Asset impairments | | | ― | | | (275 | ) | | ― | |
| Rig contract terminations | | | ― | | | ― | | | (8 | ) |
| Total Oil and Gas | | $ | (42 | ) | $ | (275 | ) | $ | (8 | ) |
| chemical | | | | | | | | | | |
| No significant items affecting earnings | | $ | ― | | $ | ― | | $ | ― | |
| Total Chemical | | $ | ― | | $ | ― | | $ | ― | |
| | | | | | | | | | | |
| midstream, marketing and other | | | | | | | | | | |
| No significant items affecting earnings | | $ | ― | | $ | ― | | $ | ― | |
| Total Midstream, Marketing and Other | | $ | ― | | $ | ― | | $ | ― | |
| corporate | | | | | | | | | | |
| Premium on debt extinguishments | | $ | (163 | ) | $ | ― | | $ | ― | |
| State income tax charge | | | (33 | ) | | ― | | | ― | |
| Severance charge | | | ― | | | ― | | | (40 | ) |
| Railcar leases | | | ― | | | ― | | | (15 | ) |
| Foreign tax credit carry-forwards | | | ― | | | 80 | | | ― | |
| Tax effect of pre-tax adjustments | | | 50 | | | 100 | | | 22 | |
Discontinued operations, net of tax (a) | | | 131 | | | (39 | ) | | (236 | ) |
| | | | | | | | | | | |
| Total Corporate | | $ | (15 | ) | $ | 141 | | $ | (269 | ) |
| (a) | The 2011 amount includes a $144 million after-tax gain from the sale of the Argentine operations. The 2009 amount includes an after-tax charge of $111 million for asset impairments of certain Argentine producing properties. | |
Taxes
Deferred tax liabilities, net of deferred tax assets of $1.9 billion, were $4.7 billion at December 31, 2011. The current portion of the deferred tax assets of $200 million is included in prepaid expenses and other. The deferred tax assets, net of allowances, are expected to be realized through future operating income and reversal of temporary differences.
Worldwide Effective Tax Rate
The following table sets forth the calculation of the worldwide effective tax rate for income from continuing operations:
| In millions | | 2011 | | 2010 | | 2009 | |
| EARNINGS | | | | | | | | | | |
| Oil and Gas | | $ | 10,241 | | $ | 7,151 | | $ | 5,097 | |
| Chemical | | | 861 | | | 438 | | | 389 | |
| Midstream, Marketing and Other | | | 448 | | | 472 | | | 235 | |
| Unallocated Corporate Items | | | (709 | ) | | (497 | ) | | (507 | ) |
| Pre-tax income | | | 10,841 | | | 7,564 | | | 5,214 | |
| | | | | | | | | | | |
| Income tax expense | | | | | | | | | | |
| Federal and State | | | 1,795 | | | 1,087 | | | 686 | |
| Foreign | | | 2,406 | | | 1,908 | | | 1,377 | |
| Total | | | 4,201 | | | 2,995 | | | 2,063 | |
| | | | | | | | | | | |
| Income from continuing operations | | $ | 6,640 | | $ | 4,569 | | $ | 3,151 | |
| | | | | | | | | | | |
| Worldwide effective tax rate | | | 39% | | | 40% | | | 40% | |
Occidental’s 2011 worldwide tax rate was 39 percent, slightly lower than 2010 and 2009 due to higher proportionate domestic pre-tax income in 2011. The 2011 income tax expense included a net $21 million charge for out-of-period state income taxes. The 2010 income tax expense included an $80 million benefit related to foreign tax credit carryforwards. The 2009 income tax expense included a tax benefit of $87 million resulting from relinquishments of exploration properties.
Consolidated Results of Operations
Changes in components of Occidental's results of operations are discussed below:
Selected Revenue and Other Income Items
| In millions | | 2011 | | 2010 | | 2009 | |
| Net sales | | $ | 23,939 | | $ | 19,045 | | $ | 14,814 | |
| Interest, dividends and other income | | $ | 165 | | $ | 111 | | $ | 118 | |
The increase in net sales in 2011, compared to 2010, was due to higher oil and NGL prices, higher oil and gas segment volumes and higher sales, including higher export sales, across most chemical products. Price and volume increases in the oil and gas segment represented approximately 84 percent of the overall increase while chemical segment price and volume increases represented 16 percent of the increase.
The increase in net sales in 2010, compared to 2009, was primarily due to higher oil, NGLs, gas and chemical product prices and volumes. Price and volume increases in the oil and gas segment represented approximately 71 percent of the overall increase, chemical volume and price increases represented 19 percent and midstream and marketing represented the remaining increase.
Selected Expense Items
| In millions | | 2011 | | 2010 | | 2009 | |
Cost of sales (a) | | $ | 7,385 | | $ | 6,112 | | $ | 5,105 | |
| Selling, general and administrative and other operating expenses | | $ | 1,523 | | $ | 1,396 | | $ | 1,300 | |
| Depreciation, depletion and amortization | | $ | 3,591 | | $ | 3,153 | | $ | 2,687 | |
| Taxes other than on income | | $ | 605 | | $ | 484 | | $ | 425 | |
| Exploration expense | | $ | 258 | | $ | 262 | | $ | 254 | |
| Charges for impairments | | $ | ― | | $ | 275 | | $ | ― | |
| Interest and debt expense, net | | $ | 298 | | $ | 116 | | $ | 133 | |
| (a) | Excludes DD&A of $3,584 million in 2011, $3,145 million in 2010 and $2,643 million in 2009. | |
Cost of sales increased in 2011, compared to 2010, due to higher oil and gas volumes, higher oil and gas operating costs, mostly resulting from higher workover and well maintenance activity and higher feedstock costs in the chemical segment.
Cost of sales increased in 2010, compared to 2009, due to higher oil and gas production costs, partly resulting from the effects of fully expensing CO2 costs in 2010, as well as higher field operating, workover and well maintenance costs, and higher volumes; and higher chemical volumes, energy and feedstock costs.
Selling, general and administrative and other operating expenses increased in 2011 due to higher headcount and environmental remediation expense and the Colombia net worth tax.
Selling, general and administrative and other operating expenses increased in 2010, compared to 2009, due to higher compensation costs, in particular, equity compensation expense due to higher stock prices in 2010.
DD&A increased in 2011, compared to 2010, due to higher DD&A rates and volumes in the oil and gas segment. The DD&A rate is expected to further increase in 2012.
DD&A increased in 2010, compared to 2009, due to higher DD&A rates and volumes, including a full year of operations in Bahrain.
Taxes other than on income increased in 2011, compared to 2010, due to higher realized domestic oil prices and volumes and higher domestic ad valorem taxes resulting from increased property values.
Taxes other than on income increased in 2010, compared to 2009, due to higher production taxes for Permian and Midcontinent resulting from higher realized domestic oil and natural gas prices and higher ad valorem taxes in Permian resulting from increased property values.
Exploration expense was comparable for 2011, 2010 and 2009.
Charges for impairments in 2010 predominately related to gas properties in the Rocky Mountain region.
Interest and debt expense, net, increased in 2011, compared to 2010, mainly due to the $163 million early debt extinguishment charge recorded in the first quarter of 2011.
Interest and debt expense, net, decreased in 2010, compared to 2009, due to lower average interest rates during 2010.
Selected Other Items
(Income)/expense (in millions) | | 2011 | | 2010 | | 2009 | |
| Provision for income taxes | | $ | 4,201 | | $ | 2,995 | | $ | 2,063 | |
| Income from equity investments | | $ | (382 | ) | $ | (277 | ) | $ | (227 | ) |
| Discontinued operations, net | | $ | (131 | ) | $ | 39 | | $ | 236 | |
| Net income attributable to noncontrolling interest | | $ | ― | | $ | 72 | | $ | 51 | |
Provision for domestic and foreign income taxes increased in 2011, compared to 2010, due to higher pre-tax income, partially offset by a slightly lower effective tax rate. The lower tax rate is due to higher proportionate domestic pre-tax income in 2011, compared to 2010.
Provision for domestic and foreign income taxes increased in 2010, compared to 2009, due to higher income before taxes in 2010. The worldwide effective tax rate in 2010 was comparable to 2009. The 2010 income tax expense included an $80 million benefit related to foreign tax credit carryforwards.
Income from equity investments increased in 2011, compared to 2010, due to an additional investment in the Plains Pipeline in late 2010 and its higher earnings.
Discontinued operations, net, in 2011 primarily reflected the $144 million after-tax gain recorded from the sale of the Argentine operations.
Discontinued operations, net, in 2010 primarily reflected the after-tax losses in the Argentine operations held for sale. The 2009 amount included after-tax impairment charges of $111 million for producing properties in Argentina.
There was no noncontrolling interest in 2011 due to the restructuring of Occidental’s Colombian operations to take a direct working interest in the related assets as of December 31, 2010.
Consolidated Analysis of Financial Position
The changes in the following components of Occidental’s balance sheet are discussed below:
Selected Balance Sheet Components
| In millions | | 2011 | | 2010 | |
| CURRENT ASSETS | | | | | | | |
| Cash and cash equivalents | | $ | 3,781 | | $ | 2,578 | |
| Trade receivables, net | | | 5,395 | | | 5,032 | |
| Marketing and trading assets and other | | | 916 | | | 900 | |
| Assets of discontinued operations | | | ― | | | 2,861 | |
| Inventories | | | 1,069 | | | 1,041 | |
| Prepaid expenses and other | | | 381 | | | 647 | |
| Total current assets | | $ | 11,542 | | $ | 13,059 | |
| Investments in unconsolidated entities | | $ | 2,072 | | $ | 2,039 | |
| Property, plant and equipment, net | | $ | 45,684 | | $ | 36,536 | |
| Long-term receivables and other assets, net | | $ | 746 | | $ | 798 | |
| | | | | | | | |
| CURRENT LIABILITIES | | | | | | | |
| Accounts payable | | $ | 5,304 | | $ | 4,646 | |
| Accrued liabilities | | | 2,440 | | | 2,397 | |
| Domestic and foreign income taxes | | | 110 | | | 170 | |
| Liabilities of discontinued operations | | | 93 | | | 612 | |
| Total current liabilities | | $ | 7,947 | | $ | 7,825 | |
| Long-term debt, net | | $ | 5,871 | | $ | 5,111 | |
| Deferred credits and other liabilities-income taxes | | $ | 4,846 | | $ | 3,445 | |
| Deferred credits and other liabilities-other | | $ | 3,662 | | $ | 3,452 | |
| Long-term liabilities of discontinued operations | | $ | 98 | | $ | 115 | |
| Stockholders’ equity | | $ | 37,620 | | $ | 32,484 | |
Assets
See "Liquidity and Capital Resources — Cash Flow Analysis" for discussion about the change in cash and cash equivalents.
The increase in trade receivables, net, was due to higher oil and NGL prices and volumes in the fourth quarter of 2011, compared to the fourth quarter of 2010. The decrease in assets of discontinued operations was due to the sale of Occidental’s Argentine operations, which closed in February 2011. The decrease in prepaid expenses and other reflected the closing of the South Texas acquisition in January 2011, for which a deposit was made in 2010.
The increase in PP&E, net, was due to capital expenditures and the acquisitions of oil and gas properties, partially offset by DD&A.
Liabilities and Stockholders' Equity
The increase in the accounts payable and accrued liabilities balances reflected higher capital expenditures during the fourth quarter of 2011 compared to the fourth quarter of 2010. The decrease in liabilities of discontinued operations was due to the sale of Occidental’s Argentine operations.
The increase in long-term debt, net, was due to the issuance of $2.15 billion of senior unsecured notes in August 2011, partially offset by the redemption of $1.4 billion of senior notes in March 2011.
The increase in deferred credits and other liabilities – income taxes was due to higher capital expenditures in 2011. The increase in deferred credits and other liabilities – other reflected the long-term portion of liabilities related to the higher asset retirement obligations. The increase in stockholders’ equity reflected net income for 2011, partially offset by dividend payments and treasury stock purchases.
Liquidity and Capital Resources
At December 31, 2011, Occidental had approximately $3.8 billion in cash on hand, a substantial majority of which is held domestically. Income and cash flows are largely dependent on oil and gas prices and sales volumes. Occidental believes that cash on hand and cash generated from operations will be sufficient to fund its operating needs and planned capital expenditures, dividends and any debt payments.
Occidental's available but unused committed bank credit was $2.0 billion at December 31, 2011. In October 2011, Occidental entered into a new five-year $2.0 billion bank credit facility (2011 Credit Facility), which replaced its previous $1.4 billion bank credit facility (2006 Credit Facility), which was scheduled to expire in September 2012. The 2011 Credit Facility provides for the termination of loan commitments and requires immediate repayment of any outstanding amounts if certain events of default occur or if Occidental files for bankruptcy. Up to $1.0 billion of the 2011 Credit Facility is available in the form of letters of credit. Occidental did not draw down any amounts under the 2011 Credit Facility or the 2006 Credit Facility during 2011.
The 2011 Credit Facility and other debt agreements do not contain material adverse change clauses or debt ratings triggers that could restrict Occidental's ability to borrow or permit the lenders to terminate their commitments or accelerate debt. Borrowings under the 2011 Credit Facility bear interest at various benchmark rates, including LIBOR, plus a margin based on Occidental's senior debt ratings. Additionally, Occidental paid prorated annual facility fees of 0.10 percent and 0.05 percent, respectively, in 2011 on the total commitment amounts of the 2011 Credit Facility and the 2006 Credit Facility based on Occidental’s senior debt ratings.
Occidental has a shelf registration statement that facilitates issuing senior debt securities. In August 2011, Occidental issued $2.15 billion of debt under this shelf, which comprised $1.25 billion of 1.75-percent senior unsecured notes due 2017 and $900 million of 3.125-percent senior unsecured notes due 2022. Occidental received net proceeds of approximately $2.1 billion. Interest on the notes will be payable semiannually in arrears in February and August of each year for both series of notes.
In March 2011, Occidental redeemed all $1.0 billion of its outstanding 7-percent senior notes due 2013 and all $368 million of its outstanding 6.75-percent senior notes due 2012. Occidental recorded a $163 million pre-tax charge related to this redemption in the first quarter of 2011.
Occidental, from time to time, may access and has accessed debt markets for long-term and short-term funding for general corporate purposes, including acquisitions. At this time, Occidental does not anticipate any needs for such funding.
As of December 31, 2011, under the most restrictive covenants of its financing agreements, Occidental had substantial capacity for additional unsecured borrowings, the payment of cash dividends and other distributions on, or acquisitions of, Occidental stock.
Cash Flow Analysis
| | 2011 | | 2010 | | 2009 | |
| Net cash provided by operating activities | | $ | 12,281 | | $ | 9,566 | | $ | 5,946 | |
The most important sources of the increase in operating cash flow in 2011, compared to 2010, were higher worldwide oil and NGLs prices and volumes.
In 2011, compared to 2010, Occidental’s global realized oil and NGL prices increased 30 percent and 23 percent, respectively. In 2011, Occidental’s oil and NGL production accounted for 71 percent of its total net sales. In 2011, oil volumes increased, compared to 2010, mainly due to acquisitions in California and the Williston Basin, including the effect of post-acquisition capital investment, and higher production in Oman’s Mukhaizna Field and Iraq, which were partially offset by lower production in Libya. Increases in field support, workover and well maintenance costs in 2011, compared to 2010, partially offset the increases in prices and volumes.
Other cost elements, such as labor costs and overhead, are not significant drivers of changes in cash flow because they are relatively stable within a narrow range over the short to intermediate term. Changes in these costs had a much smaller effect on cash flow than oil and NGL prices and volumes.
The increase in operating cash flows in 2011, compared to 2010, also reflected high chemical product prices and margins for most products.
The most important sources of the increase in operating cash flow in 2010, compared to 2009, were higher worldwide oil and domestic natural gas prices and
volumes. In 2010, compared to 2009, Occidental’s global realized oil and United States natural gas prices for continuing operations each increased by 31 percent. In 2010, Occidental's United States gas production represented approximately 59 percent of its worldwide natural gas production. Occidental’s 2010 oil and gas sales volumes increased, compared to 2009, mainly due to the new production from Bahrain and higher production in the Mukhaizna Field in Oman and higher domestic gas production, partially offset by a decline in Colombia. Increases in field support, workover and well maintenance costs in 2010, compared to 2009, partially offset the increases in prices and volumes.
The increase in operating cash flows in 2010, compared to 2009, also reflected higher chemical product prices for PVC, VCM, ethylene dichloride (EDC) and chlorine, which resulted in higher margins. In addition, all chemical product volumes increased in 2010, compared to 2009, due to improved market conditions, particularly for exports. The 2010 operating cash flows also reflected higher margins in the marketing and trading and gas processing businesses and increased earnings in the pipeline business.
In general, the overall impact of the chemical and midstream and marketing segments’ margins was less significant than the changes in oil and gas segment prices because the chemical and midstream and marketing segments' earnings and cash flows are significantly smaller than those for the oil and gas segment.
Other non-cash charges to income in 2011, 2010 and 2009 included charges for stock-based compensation plans and asset retirement obligation accruals. The 2010 amount included a $275 million charge for asset impairments, predominately of gas properties in the Rocky Mountain region.
Operating cash flows for discontinued operations include the Argentine operations through the date they were sold in February 2011. The 2009 amounts included after-tax charges of $111 million for asset impairments of certain Argentine producing properties.
In millions | | 2011 | | 2010 | | 2009 | |
| Capital expenditures | | | | | | | | | | |
| Oil and Gas | | $ | (6,145 | ) | $ | (3,166 | ) | $ | (2,448 | ) |
| Chemical | | | (234 | ) | | (237 | ) | | (205 | ) |
| Midstream and Marketing | | | (1,089 | ) | | (501 | ) | | (554 | ) |
| Corporate | | | (50 | ) | | (36 | ) | | (38 | ) |
| Total | | | (7,518 | ) | | (3,940 | ) | | (3,245 | ) |
| Other investing activities, net | | | (4,955 | ) | | (4,940 | ) | | (1,885 | ) |
| Net cash used by investing activities – continuing operations | | | (12,473 | ) | | (8,880 | ) | | (5,130 | ) |
| Investing cash flow from discontinued operations | | | 2,570 | | | (415 | ) | | (336 | ) |
| Net cash used by investing activities | | $ | (9,903 | ) | $ | (9,295 | ) | $ | (5,466 | ) |
The increase in capital expenditures of $3.6 billion from 2010 to 2011 was mainly due to the $3.0 billion increase in oil and gas expenditures, which reflected Occidental’s share of development costs in Oman and Bahrain, and higher spending in domestic properties in California, the Permian Basin, South Texas and the Williston Basin. Occidental’s United States operated rig activity increased 89 percent from 38 rigs at year-end 2010 to 72 rigs at year-end 2011.
Occidental’s capital spending for 2012 is expected to be approximately $8.3 billion and will be focused on increasing oil and gas production and ensuring Occidental's returns remain well above its cost of capital given current oil and gas prices and the cost environment.
The increase in capital expenditures in 2012 from $7.5 billion in 2011 will be allocated to the oil and gas segment. Of the $8.3 billion 2012 capital spending, the oil and gas, midstream and marketing, and chemical segments will receive 84 percent, 11 percent and 5 percent, respectively.
The 2011 other investing activities, net amount included $4.9 billion in cash payments for the acquisitions of businesses and assets, including various interests in domestic oil and gas properties, in operated, producing and non-producing properties in California and the Permian and Williston Basins for approximately $2.4 billion, properties in South Texas for $1.8 billion and $0.5 billion for Occidental’s share of pre-acquisition development expenditures incurred by the Al Hosn Gas Project.
The 2010 other investing activities, net amount included $4.9 billion in cash payments for the acquisitions of businesses and assets, including acquisitions of various interests in domestic oil and gas properties, in operated, producing and non-producing properties in the Permian Basin, midcontinent region and California, for approximately $2.5 billion, properties in North Dakota for approximately $1.4 billion, additional interests in Plains Pipeline for approximately $430 million and the remaining 50-percent interest in EHP for approximately $175 million, as well as foreign contract payments of approximately $225 million.
The 2009 other investing activities, net amount included $1.7 billion in cash payments for the acquisitions of businesses and assets, including acquisitions of various oil and gas properties in California and the Permian Basin for approximately $610 million, interests in Phibro for approximately $370 million, additional interests in Plains Pipeline for approximately $330 million and various other acquisitions totaling approximately $320 million. The 2009 amount also included foreign signing bonuses of approximately $190 million, the bulk of which was scheduled under the 2008 Libya agreements.
Investing cash flow from discontinued operations included $2.6 billion of cash received from the sale of the Argentine operations in 2011, and capital expenditures of $310 million and $336 million in 2010 and 2009, respectively.
Commitments at December 31, 2011, for major fixed and determinable capital expenditures during 2012 and thereafter were approximately $2.0 billion. Occidental expects to fund these commitments and capital expenditures with cash from operations.
In millions | | 2011 | | 2010 | | 2009 | |
| Net cash (used) provided by financing activities | | $ | (1,175 | ) | $ | 1,083 | | $ | (1,033 | ) |
The 2011 amount included net proceeds of approximately $2.1 billion from the August 2011 issuance of senior unsecured notes. The 2011 amount also included financing cash flow use of $1.5 billion to retire other long-term debt, purchases of treasury stock of $274 million and $121 million of distributions to a noncontrolling interest partner.
The 2010 amount included net proceeds of approximately $2.6 billion from the December 2010 issuance of senior unsecured notes. The 2010 amount also included financing cash flow use of $311 million to retire other long-term debt.
The 2009 amount included net proceeds of $740 million from the issuance of 4.125-percent senior unsecured notes due 2016 and Occidental’s payment of $600 million of debt associated with Dolphin Energy.
Occidental also paid common stock dividends of $1.4 billion in 2011, $1.2 billion in 2010 and $1.1 billion in 2009.
Off-Balance-Sheet Arrangements
In the course of its business activities, Occidental pursues a number of projects and transactions to meet its core business objectives. Occidental also makes commitments on behalf of unconsolidated entities. Some of these projects, transactions and commitments (off-balance-sheet arrangements) are not reflected on Occidental’s balance sheets, as a result of the application of generally accepted accounting principles (GAAP) to their specific terms. The following is a description of the business purpose and nature of these off-balance-sheet arrangements.
Guarantees
Occidental has guaranteed certain equity investees' debt and has entered into various other guarantees including performance bonds, letters of credit, indemnities and commitments provided by Occidental to third parties, mainly to provide assurance that OPC or its subsidiaries and affiliates will meet their various obligations (guarantees). As of December 31, 2011, Occidental’s guarantees were not material and a substantial majority consisted of limited recourse guarantees on $300 million of Dolphin’s debt, for which the fair value was immaterial.
See "Oil and Gas Segment — Business Review — Qatar" and “Segment Results of Operations” for further information about Dolphin.
Leases
Occidental has entered into various operating lease agreements, mainly for transportation equipment, power plants, machinery, terminals, storage facilities, land and office space. Occidental leases assets when leasing offers greater operating flexibility. Lease payments are generally expensed as part of cost of sales. For more information, see "Contractual Obligations."
Contractual Obligations
The table below summarizes and cross-references Occidental’s contractual obligations. This summary indicates those obligations that are reflected in the Consolidated Balance Sheets as of December 31, 2011, as well as those that are not.
| | | | | Payments Due by Year | |
Contractual Obligations (in millions) | | Total | | 2012 | | 2013 and 2014 | | 2015 and 2016 | | 2017 and thereafter | |
| Consolidated Balance Sheet | | | | | | | | | | | | | | | | |
Long-term debt (Note 5) (a) | | $ | 5,904 | | $ | ― | | $ | 600 | | $ | 1,450 | | $ | 3,854 | |
Other long-term liabilities (b) | | | 2,070 | | | 228 | | | 459 | | | 222 | | | 1,161 | |
| Other Obligations | | | | | | | | | | | | | | | | |
Operating leases (Note 6) (c) | | | 1,013 | | | 140 | | | 187 | | | 169 | | | 517 | |
Purchase obligations (d,e,f) | | | 7,868 | | | 2,657 | | | 2,027 | | | 759 | | | 2,425 | |
| Total | | $ | 16,855 | | $ | 3,025 | | $ | 3,273 | | $ | 2,600 | | $ | 7,957 | |
| (a) | Excludes unamortized debt discount and interest on the debt. As of December 31, 2011, interest on long-term debt totaling $1.5 billion is payable in the following years (in millions): 2012 - $189, 2013 and 2014 - $369, 2015 and 2016 - $326, 2017 and thereafter - $597. | |
| (b) | Includes obligations under postretirement benefit and deferred compensation plans, as well as certain accrued liabilities. | |
| (c) | Amounts have not been reduced for sublease rental income. | |
| (d) | Amounts represent payments which will become due under long-term agreements to purchase goods and services used in the normal course of business. Some of these arrangements involve take-or-pay commitments but they do not represent debt obligations. Long-term purchase contracts are discounted at a 3.2-percent discount rate. | |
| (e) | Amounts exclude certain oil purchase obligations related to marketing and trading activities for which there are no minimum amounts. | |
| (f) | Amounts represent agreements Occidental has entered into providing for future payments to secure terminal and pipeline capacity, drilling rigs and services, electrical power, steam and certain chemical raw materials. | |
Lawsuits, Claims and Other Contingencies
OPC or certain of its subsidiaries are named, in the normal course of business, in lawsuits, claims and other legal proceedings that seek, among other things, compensation for alleged personal injury, breach of contract, property damage, punitive damages, civil penalties or other losses, or injunctive or declaratory relief. OPC or certain of its subsidiaries also have been named in proceedings under the Comprehensive Environmental Response, Compensation, and Liability Act (CERCLA) and similar federal, state, local and foreign environmental laws. These environmental proceedings seek funding or performance of remediation and, in some cases, compensation for alleged property damage, punitive damages, civil penalties and injunctive relief; however, Occidental or such subsidiaries are usually among many companies in these proceedings and have to date been successful in sharing response costs with other financially sound companies. Occidental accrues reserves for currently outstanding lawsuits, claims and proceedings when it is probable that a liability has been incurred and the liability can be reasonably estimated. Occidental has disclosed its
reserve balances for environmental matters. Reserve balances for other matters as of December 31, 2011 and 2010, were not material to Occidental's consolidated balance sheets. Occidental also evaluates the amount of reasonably possible additional losses that it could incur as a result of the matters mentioned above. Occidental has disclosed its range of reasonably possible losses for sites where it is a participant in environmental remediation. Occidental believes that other reasonably possible losses that it could incur in excess of reserves accrued on the balance sheet would not be material to its consolidated financial position or results of operations. Environmental matters are further discussed under the caption "Environmental Liabilities and Expenditures" below.
During the course of its operations, Occidental is subject to audit by tax authorities for varying periods in various federal, state, local and foreign tax jurisdictions. While the audits of corporate tax returns for taxable years through 2009 have concluded for United States federal income tax purposes, the 2010 and 2011 taxable years are currently under review by the United States Internal Revenue Service pursuant to its Compliance Assurance Program. Taxable years from 2000 through the current year remain subject to examination by foreign and state government tax authorities in certain jurisdictions. In certain of these jurisdictions, tax authorities are in various stages of auditing Occidental's income taxes. During the course of tax audits, disputes have arisen and other disputes may arise as to facts and matters of law. Occidental believes that the resolution of outstanding tax matters would not have a material adverse effect on its consolidated financial position or results of operations.
OPC, its subsidiaries or both have indemnified various parties against specified liabilities those parties might incur in the future in connection with purchases and other transactions that they have entered into with Occidental. These indemnities usually are contingent upon the other party incurring liabilities that reach specified thresholds. As of December 31, 2011, Occidental is not aware of circumstances that it believes would reasonably be expected to lead to future indemnity claims against it in connection with these transactions that would result in payments materially in excess of reserves.
Environmental Liabilities and Expenditures
Occidental’s operations are subject to stringent federal, state, local and foreign laws and regulations relating to improving or maintaining environmental quality. Occidental’s environmental compliance costs have generally increased over time and are expected to rise in the future. Occidental factors environmental expenditures for its operations into its business planning process as an integral part of producing quality products responsive to market demand.
Environmental Remediation
The laws that require or address environmental remediation, including CERCLA and similar federal, state, local and foreign laws, may apply retroactively and regardless of fault, the legality of the original activities or the current ownership or control of sites. OPC or certain of its subsidiaries participate in or actively monitor a range of remedial activities and government or private proceedings under these laws with respect to alleged past practices at operating, closed and third-party sites. Remedial activities may include one or more of the following: investigation involving sampling, modeling, risk assessment or monitoring; cleanup measures including removal, treatment or disposal; or operation and maintenance of remedial systems. The environmental proceedings seek funding or performance of remediation and, in some cases, compensation for alleged property damage, punitive damages, civil penalties, injunctive relief and government oversight costs.
As of December 31, 2011, Occidental participated in or monitored remedial activities or proceedings at 160 sites. The following table presents Occidental’s environmental remediation reserves as of December 31, 2011, 2010 and 2009, grouped as environmental remediation sites listed or proposed for listing by the U.S. Environmental Protection Agency on the CERCLA National Priorities List (NPL sites) and three categories of non-NPL sites — third-party sites, Occidental-operated sites and closed or non-operated Occidental sites, as follows:
| $ amounts in millions | | 2011 | | 2010 | | 2009 | |
| | | # of Sites | | Reserve Balance | | # of Sites | | Reserve Balance | | # of Sites | | Reserve Balance | |
| NPL sites | | 36 | | $ | 63 | | 38 | | $ | 56 | | 39 | | $ | 57 | |
| Third-party sites | | 73 | | | 88 | | 83 | | | 91 | | 81 | | | 104 | |
| Occidental-operated sites | | 22 | | | 120 | | 20 | | | 122 | | 19 | | | 126 | |
| Closed or non-operated Occidental sites | | 29 | | | 89 | | 29 | | | 97 | | 29 | | | 116 | |
| Total | | 160 | | $ | 360 | | 170 | | $ | 366 | | 168 | | $ | 403 | |
As of December 31, 2011, Occidental’s environmental reserves exceeded $10 million each at 10 of the 160 sites described above, and 107 of the sites had reserves from zero to $1 million each.
As of December 31, 2011, two landfills in western New York owned by Occidental accounted for 64 percent of its reserves associated with NPL sites. Maxus Energy Corporation has retained the liability and indemnified Occidental for 13 of the remaining NPL sites.
As of December 31, 2011, Maxus has also retained the liability and indemnified Occidental for 9 of the 73 third-party sites. Two of the remaining 64 third-party sites — a former copper mining and smelting operation in Tennessee and a containment and removal project in Tennessee — accounted for 44 percent of Occidental’s reserves associated with these sites.
Four sites — chemical plants in Kansas, Louisiana and New York and a group of oil and gas properties in the southwestern United States — accounted for 61 percent of the reserves associated with the Occidental-operated sites. Two other sites — a former chemical plant in Tennessee and a closed coal mine in Pennsylvania — accounted for 42 percent of the reserves associated with closed or non-operated Occidental sites.
The following table presents environmental reserve activity for the past three years:
| In millions | | 2011 | | 2010 | | 2009 | |
| Balance - Beginning of Year | | $ | 366 | | $ | 403 | | $ | 439 | |
| Remediation expenses and interest accretion | | | 53 | | | 26 | | | 26 | |
| Changes from acquisitions/dispositions | | | 14 | | | 3 | | | 4 | |
| Payments | | | (73 | ) | | (66 | ) | | (66 | ) |
| Balance - End of Year | | $ | 360 | | $ | 366 | | $ | 403 | |
Occidental expects to expend funds corresponding to approximately half of the current environmental reserves over the next four years and the balance over the subsequent 10 or more years. Occidental believes its range of reasonably possible additional loss beyond those liabilities recorded for environmental remediation at the sites described above could be up to $375 million. See "Critical Accounting Policies and Estimates — Environmental Liabilities and Expenditures" for additional information.
Occidental’s environmental costs, some of which include estimates, are presented below for each segment for the years ended December 31:
| | 2011 | | 2010 | | 2009 | |
| Operating Expenses | | | | | | | | | | |
| Oil and Gas | | $ | 158 | | $ | 108 | | $ | 110 | |
| Chemical | | | 68 | | | 72 | | | 67 | |
| Midstream and Marketing | | | 21 | | | 13 | | | 14 | |
| | | $ | 247 | | $ | 193 | | $ | 191 | |
| Capital Expenditures | | | | | | | | | | |
| Oil and Gas | | $ | 110 | | $ | 72 | | $ | 78 | |
| Chemical | | | 15 | | | 19 | | | 15 | |
| Midstream and Marketing | | | 15 | | | 13 | | | 4 | |
| | | $ | 140 | | $ | 104 | | $ | 97 | |
| Remediation Expenses | | | | | | | | | | |
| Corporate | | $ | 52 | | $ | 25 | | $ | 25 | |
Operating expenses are incurred on a continual basis. Capital expenditures relate to longer-lived improvements in currently operating properties. Remediation expenses relate to existing conditions from past operations.
Occidental presently estimates capital expenditures for environmental compliance of approximately $160 million for 2012.
Foreign Investments
Many of Occidental’s assets are located outside North America. At December 31, 2011, the carrying value of Occidental’s assets in countries outside North America aggregated approximately $11 billion, or approximately 18 percent of Occidental’s total assets at that date. Of such assets, approximately $9 billion are located in the Middle East/North Africa and approximately $1.4 billion are located in Latin America. For the year ended December 31, 2011, net sales outside North America totaled $8.7 billion, or approximately 36 percent of total net sales.
Critical Accounting Policies and Estimates
The process of preparing financial statements in accordance with GAAP requires the management of Occidental to make informed estimates and judgments regarding certain items and transactions. Changes in facts and circumstances or discovery of new information may result in revised estimates and judgments, and actual results may differ from these estimates. Occidental considers the following to be its most critical accounting policies and estimates that involve management's judgment. There has been no material change to these policies over the past three years. The selection and development of these critical accounting policies and estimates have been discussed with the Audit Committee of the Board of Directors.
Oil and Gas Properties
The carrying value of Occidental’s property, plant and equipment (PP&E) represents the cost incurred to acquire or develop the asset, including any capitalized interest, net of accumulated depreciation, depletion and amortization (DD&A) and net of any impairment charges. For business acquisitions, PP&E cost is based on fair values at the acquisition date. Interest costs incurred in connection with qualifying capital expenditures are capitalized and amortized over the lives of the related assets.
Occidental uses the successful efforts method to account for its oil and gas properties. Under this method, costs of acquiring properties, costs of drilling successful exploration wells and development costs are capitalized. The costs of exploratory wells are initially capitalized pending a determination of whether proved reserves have been found. If proved reserves have been found, the costs of exploratory wells remain capitalized. Otherwise, the costs of the related exploratory wells are charged to expense. In some cases, a determination of proved reserves cannot be made at the completion of drilling, requiring additional testing and evaluation of the wells. Occidental's practice is generally to expense the costs of such exploratory wells if a determination of proved reserves has not been made within a 12-month period after drilling is complete.
Annual lease rentals and geological, geophysical and seismic costs are expensed as incurred.
Occidental’s policy is to expense the costs of injectants for secondary and tertiary recovery.
Depreciation and depletion of oil and gas producing properties are determined by the unit-of-production method. Leasehold acquisition costs are amortized over total proved reserves, while capitalized development and successful exploration costs are amortized over proved developed reserves.
Proved oil and gas reserves (as defined in the Securities and Exchange Commission's Regulation S-X, Rule 4-10(a)) are those quantities of oil and gas, which, by analysis of geoscience and engineering data, can be estimated with reasonable certainty to be economically producible—from a given date forward, from known reservoirs, and under existing economic conditions, operating methods, and government regulations—prior to the time at which contracts providing the right to operate expire, unless evidence indicates that renewal is reasonably certain, regardless of whether deterministic or probabilistic methods are used for the estimation. Occidental has no proved oil and gas reserves for which the determination of commercial viability is subject to the completion of major additional capital expenditures.
Several factors could change Occidental’s proved oil and gas reserves. For example, Occidental receives a
share of production from PSCs to recover its costs and generally an additional share for profit. Occidental’s share of production and reserves from these contracts decreases when oil prices rise and increases when oil prices decline. Overall, Occidental’s net economic benefit from these contracts is greater at higher oil prices. In other cases, particularly with long-lived properties, lower product prices may lead to a situation where production of a portion of proved reserves becomes uneconomical. For such properties, higher product prices typically result in additional reserves becoming economical. Estimation of future production and development costs is also subject to change partially due to factors beyond Occidental's control, such as energy costs and inflation or deflation of oil field service costs. These factors, in turn, could lead to changes in the quantity of proved reserves. Additional factors that could result in a change of proved reserves include production decline rates and operating performance differing from those estimated when the proved reserves were initially recorded. In 2011, revisions of previous estimates provided a net 214 million BOE reduction to proved reserves, which amounted to less than 7 percent of Occidental's total reserves as of December 31, 2011.
The most significant financial statement effect from a change in Occidental's oil and gas reserves would be to the DD&A rate. For example, a 5-percent increase or decrease in the amount of oil and gas reserves would change the DD&A rate by approximately $0.75 per barrel, which would increase or decrease pre-tax income by $200 million annually at current production rates. The change in the DD&A rate over the past three years due to revisions of previous proved reserve estimates has been immaterial.
A portion of the carrying value of Occidental’s oil and gas properties is attributable to unproved properties. At December 31, 2011, the net capitalized costs attributable to unproved properties were $4.9 billion. The unproved amounts are not subject to DD&A or impairment until they are classified as proved properties. As exploration and development work progresses, if reserves on these properties are proved, capitalized costs attributable to the properties will become subject to DD&A. If the exploration and development work were to be unsuccessful, or management's plans changed with respect to these properties, as a result of economic, operating or contractual conditions, the capitalized costs of the related properties would be expensed. The timing of any writedowns of these unproved properties, if warranted, depends upon management's plans, the nature, timing and extent of future exploration and development activities and their results. Occidental believes its current plans and exploration and development efforts will allow it to realize its unproved property balance.
Additionally, Occidental performs impairment tests with respect to its proved properties generally when prices decline other than temporarily, reserve estimates change significantly or other significant events occur that may impact its ability to realize the recorded asset amounts. Impairment tests incorporate a number of assumptions involving expectations of future cash flows, which can change significantly over time. These assumptions include estimates of future product prices, which Occidental bases on forward price curves and, where applicable, contractual prices, estimates of oil and gas reserves and estimates of future expected operating and development costs. Fluctuations in commodity prices and production and development costs could cause management's plans to change with respect to unproved properties and could cause the carrying values of proved properties to be unrealizable. Such circumstances could result in impairments in the carrying values of proved or unproved properties or both. For example, if natural gas prices in the United States remain depressed for an extended period, management’s plans for certain domestic gas assets may change and some of its investments may become impaired. Any impairment loss would be calculated as the excess of the asset's net book value over its estimated fair value.
Chemical Assets
Occidental's chemical assets are depreciated using either the unit-of-production or straight-line method, based upon the estimated useful lives of the facilities. The estimated useful lives of Occidental’s chemical assets, which range from three years to 50 years, are also used for impairment tests. The estimated useful lives for the chemical facilities are based on the assumption that Occidental will provide an appropriate level of annual expenditures to ensure productive capacity is sustained. Such expenditures consist of ongoing routine repairs and maintenance, as well as planned major maintenance activities (PMMA). Ongoing routine repairs and maintenance expenditures are expensed as incurred. PMMA costs are capitalized and amortized over the period until the next planned overhaul. Additionally, Occidental incurs capital expenditures that extend the remaining useful lives of existing assets, increase their capacity or operating efficiency beyond the original specification or add value through modification for a different use. These capital expenditures are not considered in the initial determination of the useful lives of these assets at the time they are placed into service. The resulting revision, if any, of the asset’s estimated useful life is measured and accounted for prospectively.
Without these continued expenditures, the useful lives of these assets could decrease significantly. Other factors that could change the estimated useful lives of Occidental’s chemical assets include sustained higher or lower product prices, which are particularly affected by both domestic and foreign competition, demand, feedstock costs, energy prices, environmental regulations and technological changes.
Occidental performs impairment tests on its chemical assets whenever events or changes in circumstances lead to a reduction in the estimated useful lives or estimated future cash flows that would indicate that the carrying amount may not be recoverable, or when management’s plans change with respect to those assets. Any impairment loss would be calculated as the excess of the asset's net book value over its estimated fair value.
Occidental's net PP&E for the chemical segment is approximately $2.5 billion and its depreciation expense for 2012 is expected to be approximately $300 million. The most significant financial statement impact of a decrease in the estimated useful lives of Occidental's chemical plants would be on depreciation expense. For example, a reduction in the remaining useful lives of one
year would increase depreciation and reduce pre-tax earnings by approximately $40 million per year.
Midstream, Marketing and Other Assets
Derivatives are carried at fair value and on a net basis when a legal right of offset exists with the same counterparty. Occidental applies hedge accounting when transactions meet specified criteria for such treatment and management elects to do so. If a derivative does not qualify or is not designated and documented as a cash-flow hedge, any fair value gains or losses are recognized in earnings in the current period. For cash-flow hedges, the gain or loss on the effective portion of the derivative is reported as a component of other comprehensive income (OCI) with an offsetting adjustment to the basis of the item being hedged. Realized gains or losses from cash-flow hedges, and any ineffective portion, are recorded as a component of net sales in the consolidated statements of income. Ineffectiveness is primarily created by a basis difference between the hedged item and the hedging instrument due to location, quality or grade of the physical commodity transactions. Gains and losses from derivative instruments are reported net in the consolidated statements of income. There were no fair value hedges as of and during the year ended December 31, 2011.
A hedge is regarded as highly effective such that it qualifies for hedge accounting if, at inception and throughout its life, it is expected that changes in the fair value or cash flows of the hedged item will be offset by 80 to 125 percent of the changes in the fair value or cash flows, respectively, of the hedging instrument. In the case of hedging a forecast transaction, the transaction must be probable and must present an exposure to variations in cash flows that could ultimately affect reported net income or loss. Occidental discontinues hedge accounting when it determines that a derivative has ceased to be highly effective as a hedge; when the hedged item matures or is sold or repaid; or when a forecast transaction is no longer deemed probable.
Occidental's midstream and marketing PP&E is depreciated over the estimated useful lives of the assets, using either the unit-of-production or straight-line method. Occidental performs impairment tests on its midstream and marketing assets whenever events or changes in circumstances lead to a reduction in the estimated useful lives or estimated future cash flows that would indicate that the carrying amount may not be recoverable, or when management’s plans change with respect to those assets. Any impairment loss would be calculated as the excess of the asset's net book value over its estimated fair value.
Fair Value Measurements
Occidental has categorized its assets and liabilities that are measured at fair value, based on the priority of the inputs to the valuation techniques, in a three-level fair value hierarchy: Level 1 – using quoted prices in active markets for identical assets or liabilities; Level 2 – using observable inputs other than quoted prices for identical assets or liabilities; and Level 3 – using unobservable inputs. Transfers between levels, if any, are reported at the end of each reporting period.
Fair Values - Recurring
Occidental primarily applies the market approach for recurring fair value measurements, maximizes its use of observable inputs and minimizes its use of unobservable inputs. Occidental utilizes the mid-point price between bid and ask prices for valuing the majority of its assets and liabilities measured and reported at fair value. In addition to using market data, Occidental makes assumptions in valuing its assets and liabilities, including assumptions about the risks inherent in the inputs to the valuation technique. For assets and liabilities carried at fair value, Occidental measures fair value using the following methods:
| Ø | Trading securities – Quoted prices in active markets exist and are used to provide fair values for these instruments. These securities are classified as Level 1. |
| Ø | Commodity derivatives – Occidental values exchange-cleared commodity derivatives using closing prices provided by the exchange as of the balance sheet date. These derivatives are classified as Level 1. Over-the-Counter (OTC) financial commodity contracts, options and physical commodity forward purchase and sale contracts are generally valued using quotations provided by brokers or industry-standard models that consider various inputs, including quoted forward prices for commodities, time value, volatility factors, credit risk and current market and contractual prices for the underlying instruments, as well as other relevant economic measures. Substantially all of these inputs are observable in the marketplace throughout the full term of the instrument, can be derived from observable data or are supported by observable prices at which transactions are executed in the marketplace. Occidental classifies these measurements as Level 2. |
Occidental generally uses an income approach to measure fair value when there is not a market observable price for an identical or similar asset or liability. This approach utilizes management's best assumptions regarding expectations of projected cash flows, and discounts the expected cash flows using a risk-adjusted risk-free discount rate.
Environmental Liabilities and Expenditures
Environmental expenditures that relate to current operations are expensed or capitalized as appropriate. Occidental records environmental reserves for estimated remediation costs that relate to existing conditions from past operations when environmental remediation efforts are probable and the costs can be reasonably estimated. In determining the reserves and the range of reasonably possible additional loss, Occidental refers to currently available information, including relevant past experience, remedial objectives, available technologies, applicable laws and regulations and cost-sharing arrangements. Occidental bases environmental reserves on management’s estimate of the most likely cost to be incurred, using the most cost-effective technology reasonably expected to achieve the remedial objective. Occidental periodically reviews reserves and adjusts them as new information becomes available. Occidental records environmental reserves on a discounted basis when it deems the aggregate amount and timing of cash
payments to be reliably determinable at the time the reserves are established. The reserve methodology with respect to discounting for a specific site is not modified once it is established. The amount of discounted environmental reserves is insignificant. Occidental generally records reimbursements or recoveries of environmental remediation costs in income when received, or when receipt of recovery is highly probable. As of December 31, 2011, 2010 and 2009, Occidental did not have any accruals for reimbursements or recoveries.
Many factors could affect Occidental’s future remediation costs and result in adjustments to its environmental reserves and range of reasonably possible additional loss. The most significant are: (1) cost estimates for remedial activities may be inaccurate; (2) the length of time, type or amount of remediation necessary to achieve the remedial objective may change due to factors such as site conditions, the ability to identify and control contaminant sources or the discovery of additional contamination; (3) the regulatory agency may ultimately reject or modify Occidental’s proposed remedial plan; (4) improved or alternative remediation technologies may change remediation costs; and (5) laws and regulations may impose more or less stringent remediation requirements or affect cost sharing or allocation of liability.
Certain sites involve multiple parties with various cost-sharing arrangements, which fall into the following three categories: (1) environmental proceedings that result in a negotiated or prescribed allocation of remediation costs among Occidental and other alleged potentially responsible parties; (2) oil and gas ventures in which each participant pays its proportionate share of remediation costs reflecting its working interest; or (3) contractual arrangements, typically relating to purchases and sales of properties, in which the parties to the transaction agree to methods of allocating remediation costs. In these circumstances, Occidental evaluates the financial viability of other parties with whom it is alleged to be jointly liable, the degree of their commitment to participate and the consequences to Occidental of their failure to participate when estimating Occidental's ultimate share of liability. Occidental records reserves at its expected net cost of remedial activities and, based on these factors, believes that it will not be required to assume a share of liability of such other potentially responsible parties in an amount materially above amounts reserved.
In addition to the costs of investigations and cleanup measures, which often take in excess of 10 years at NPL sites, Occidental’s reserves include management’s estimates of the costs to operate and maintain remedial systems. If remedial systems are modified over time in response to significant changes in site-specific data, laws, regulations, technologies or engineering estimates, Occidental reviews and adjusts its reserves accordingly.
If Occidental adjusts the environmental reserve balance based on the factors described above, the amount of the increase or decrease would be recognized in earnings. For example, if the reserve balance were reduced by 10 percent, Occidental would record a pre-tax gain of $36 million. If the reserve balance were increased by 10 percent, Occidental would record an additional remediation expense of $36 million.
Other Loss Contingencies
Occidental is involved with numerous lawsuits, claims, proceedings and audits in the normal course of its operations. Occidental records a loss contingency for these matters when it is probable that an asset has been impaired or a liability has been incurred and the amount of the loss can be reasonably estimated. In addition, Occidental discloses, in aggregate, its exposure to loss in excess of the amount recorded on the balance sheet for these matters if it is reasonably possible that an additional material loss may be incurred. Occidental reviews its loss contingencies on an ongoing basis.
Loss contingencies are based on judgments made by management with respect to the likely outcome of these matters and are adjusted as appropriate. Management’s judgments could change based on new information, changes in laws or regulations, changes in management’s plans or intentions and the outcome of legal proceedings, settlements or other factors. See "Lawsuits, Claims and Other Contingencies" for additional information.
Significant Accouting and Disclosure Changes
Pursuant to a new rule issued by the Financial Accounting Standards Board, Occidental moved the Consolidated Statements of Comprehensive Income to consecutively follow the Consolidated Statements of Income. Occidental early-adopted the rule, as permitted, in the fourth quarter of 2011.
Derivative Activities and Market Risk
Commodity Price Risk
General
Occidental’s results are sensitive to fluctuations in oil, NGL and natural gas prices. Price changes at current global prices and levels of production affect Occidental’s pre-tax income by approximately $150 million for a $1 per barrel change in oil prices and $30 million for a $1 per barrel change in NGL prices. If domestic natural gas prices vary by $0.50 per Mcf, it would have an estimated annual effect on Occidental's pre-tax income of approximately $125 million. As production levels change in the future, the sensitivity of Occidental’s results to oil and gas prices also will change. The trading and marketing results are also sensitive to price changes of oil, gas and, to a lesser degree, other commodities. These sensitivities are additionally dependent on trading and marketing volumes and cannot be predicted reliably.
Occidental’s results are also sensitive to fluctuations in chemical prices. A variation in chlorine and caustic soda prices of $10 per ton would have a pre-tax annual effect on income of approximately $10 million and $30 million, respectively. A variation in PVC prices of $0.01 per lb. would have a pre-tax annual effect on income of approximately $25 million. A variation in ethylene dichloride (EDC) prices of $10 per ton would have a pre-tax annual effect on income of approximately $5 million. Historically, over time, product price changes have tracked raw material and feedstock product price changes, somewhat mitigating the margin effect of price changes. According to Chemical Market Associates, Inc., December 2011 average contract prices were: chlorine—$288 per ton, caustic soda—$615 per ton, PVC—$0.75 per lb. and EDC—$180 per ton.
Marketing and Trading Operations
Through its marketing and trading activities and within its established policy controls and procedures, Occidental uses derivative instruments, including a combination of short-term futures, forwards, options and swaps, to improve realized prices for its oil and gas. Additionally, Occidental’s Phibro trading unit engages in trading activities using derivatives for the purpose of generating profits mainly from market price changes of commodities. In the past, Occidental has also used derivatives to reduce its exposure to price volatility on a small portion of its oil and gas production.
Risk Management
Occidental conducts its risk management activities for marketing and trading activities under the controls and governance of its risk control policy. The controls under this policy are implemented and enforced by certain members of management embedded in the marketing and trading operations in order to manage risk by providing an independent and separate evaluation and check. These members of management report to the Corporate Vice President and Treasurer. The President and Chief Executive Officer and risk committees comprising members of Occidental's senior corporate management also oversee these controls. Controls for these activities include limits on value at risk, limits on credit, limits on total notional trade value, segregation of duties, delegation of authority, daily price verifications, daily reporting to senior management of positions together with various risk measures and a number of other policy and procedural controls. Additionally, these operations maintain highly liquid positions, as a result of which the market risk typically can be neutralized on short notice.
Fair Value of Marketing and Trading Derivative Contracts
As part of its third-party marketing and trading activities, Occidental enters into purchase and sale contracts for oil and gas. Occidental manages these contracts so that the aggregate terms and volumes of the purchases and sales generally approximate each other. The following table shows the changes in the net fair value of Occidental’s marketing and trading derivative contracts during 2011 and 2010:
Assets/(liabilities) (in millions) | | 2011 | | 2010 | |
| Fair value of contracts outstanding at beginning of year | | $ | (142 | ) | $ | (345 | ) |
| Contracts realized or settled during the year | | | 182 | | | (17 | ) |
| Gains (losses) or other changes in fair value | | | (53 | ) | | 220 | |
| Fair value of contracts outstanding at end of year | | $ | (13 | ) | $ | (142 | ) |
The following table shows the fair value of derivatives, segregated by maturity periods and by methodology of fair value estimation:
| | | Maturity Periods | | | | |
Source of Fair Value Assets/(liabilities) (in millions) | | | 2012 | | | 2013 and 2014 | | | 2015 and 2016 | | | 2017 and thereafter | | | Total | |
| Prices actively quoted | | $ | (4 | ) | $ | 3 | | $ | ― | | $ | ― | | $ | (1 | ) |
| Prices provided by other external sources | | | 71 | | | (62 | ) | | (21 | ) | | ― | | | (12 | ) |
| Total | | $ | 67 | | $ | (59 | ) | $ | (21 | ) | $ | ― | | $ | (13 | ) |
Cash-Flow Hedges
Throughout 2011, Occidental held a series of collar agreements that qualified as cash-flow hedges for the sale of approximately 3 percent of its oil production. These agreements were for existing domestic production and terminated as of December 31, 2011. The collar agreements hedged the sale of 12,000 barrels per day at a weighted-average strike price that ranged from $32.92 to $46.27.
In 2009, Occidental entered into financial swap agreements for the sale of a portion of its existing natural gas production from the Rocky Mountain region of the United States that qualify as cash-flow hedges. The following table presents the daily quantities and weighted-average prices that will be received by Occidental as of December 31, 2011:
| Natural Gas - Swaps | | Daily Volume (cubic feet) | | Average Price | |
January 2012 ― March 2012 | | 50 million | | $6.07 | |
Occidental’s marketing and trading operations store natural gas purchased from third parties at Occidental's North American leased storage facilities. Derivative instruments are used to fix margins on the future sales of the stored volumes. These derivative agreements continue through January 2013. As of December 31, 2011, Occidental had approximately 25 billion cubic feet of natural gas held in storage. As of December 31, 2011, Occidental had cash-flow hedges for the forecast sale, to be settled by physical delivery, of approximately 35 billion cubic feet of natural gas held in storage.
As of December 31, 2011, the total fair value of cash-flow hedges, which was a net asset of $39 million, was included in the total fair value (a net liability of $13 million) in the tables in "Fair Value of Marketing and Trading Derivative Contracts" above.
Quantitative Information
Occidental uses value at risk to estimate the potential effects of changes in fair values of commodity-based and foreign currency derivatives and commodity contracts used in marketing and trading activities. This method determines the maximum potential negative short-term change in fair value with at least a 95-percent level of confidence. The marketing and trading value at risk determined with this method was immaterial during 2011.
On December 31, 2009, Occidental acquired Phibro, which trades oil, gas and other commodities. Occidental determined that operations of Phibro are not reasonably likely to have a material adverse effect on the Company. This conclusion is based primarily on the trading limits Occidental placed on the unit, including, among others, limits on total notional trade value, value at risk and credit, as well as the highly liquid positions the operation maintains, as a result of which the market risk typically can be neutralized on short notice.
Delivery Commitments
Occidental sells a portion of its oil, NGLs and natural gas from its operations, as well as volumes from third parties, under a variety of contractual obligations that specify the delivery of a fixed and determinable quantity. The total amount contracted to be delivered from 2012 through 2019, a substantial majority of which are in the
United States, is approximately 107 million barrels of oil, 358 billion cubic feet of gas and immaterial amounts of NGLs. As of December 31, 2011, Occidental had purchase contracts to fulfill a substantial portion of these obligations and believes that it has sufficient production and existing volumes in storage, as well as the ability to fulfill the remaining obligations with contractual purchases, and that, to the extent it has any shortfall in sourcing the required quantities, it believes it has the ability to secure such volumes in the spot market.
Interest Rate Risk
General
Occidental's exposure to changes in interest rates relates primarily to its variable-rate, long-term debt obligations, and is not expected to be material. As of December 31, 2011, variable-rate debt constituted approximately one percent of Occidental's total debt.
Tabular Presentation of Interest Rate Risk
The table below provides information about Occidental's debt obligations. Debt amounts represent principal payments by maturity date.
Year of Maturity (in millions of U.S. dollars, except rates) | | U.S. Dollar Fixed-Rate Debt | | U.S. Dollar Variable-Rate Debt | | Grand Total (a) | |
| 2012 | | $ | ― | | $ | ― | | $ | ― | |
| 2013 | | | 600 | | | ― | | | 600 | |
| 2014 | | | ― | | | ― | | | ― | |
| 2015 | | | ― | | | ― | | | ― | |
| 2016 | | | 1,450 | | | ― | | | 1,450 | |
| Thereafter | | | 3,786 | | | 68 | | | 3,854 | |
| Total | | $ | 5,836 | | $ | 68 | | $ | 5,904 | |
| Weighted-average interest rate | | | 3.23% | | | 0.11% | | | 3.20% | |
| Fair Value | | $ | 6,342 | | $ | 68 | | $ | 6,410 | |
| (a) | Excludes unamortized net discounts of $33 million. | |
Credit Risk
Occidental’s contracts are spread among a large number of counterparties. Creditworthiness is reviewed before doing business with a new counterparty and on an ongoing basis, and master netting agreements are used when appropriate. Occidental monitors aggregated counterparty exposure relative to credit limits. Credit exposure for each customer is monitored for outstanding balances, current activity, and forward mark-to-market exposure.
A substantial portion of Occidental’s derivative transaction volume is executed through exchange-traded contracts, which are subject to nominal credit risk as a significant portion of these transactions are executed on a daily margin basis. Occidental executes the rest of its derivative transactions in the OTC market. Occidental is subject to counterparty credit risk to the extent the counterparty to the derivatives is unable to meet its settlement commitments. Occidental manages this credit risk by selecting counterparties that it believes to be financially strong, by spreading the credit risk among many such counterparties, by entering into master netting arrangements with the counterparties and by requiring collateral, as appropriate. Occidental actively monitors the creditworthiness of each counterparty and records valuation adjustments to reflect counterparty risk, if necessary.
Certain of Occidental's OTC derivative instruments contain credit-risk-contingent features, primarily tied to credit ratings for Occidental or its counterparties, which may affect the amount of collateral that each would need to post. As of December 31, 2011 and 2010, Occidental had a net liability of $58 million and $234 million, respectively, for which the amount of collateral posted was $27 million and $10 million, respectively. Occidental believes that if it had received a one-notch reduction in its credit ratings, it would not have resulted in a material change in its collateral-posting requirements as of December 31, 2011 and 2010.
As of December 31, 2011, the substantial majority of the credit exposures was with investment grade counterparties. Occidental believes its exposure to credit-related losses at December 31, 2011 was not material. Losses associated with credit risk have been immaterial for all years presented.
Occidental’s foreign operations have currency risk. Occidental manages its exposure primarily by balancing monetary assets and liabilities and maintaining cash positions in foreign currencies only at levels necessary for operating purposes. Most international oil sales are denominated in United States dollars. Additionally, all of Occidental’s consolidated foreign oil and gas subsidiaries have the United States dollar as the functional currency. As of December 31, 2011, the fair value of foreign currency derivatives used in the trading operations was immaterial. The effect of exchange rates on transactions in foreign currencies is included in periodic income.
Safe Harbor Discussion Regarding Outlook and Other Forward-Looking Data
Portions of this report, including Items 1 and 2 (including the information appearing under the captions "Business and Properties — Competition and Sales and Marketing") and Items 7 and 7A (including "Management's Discussion and Analysis of Financial Condition and Results of Operations," including the information under the sub captions "Strategy," "Oil and Gas Segment — Proved Reserves" and " — Industry Outlook," "Chemical Segment — Industry Outlook," "Midstream, Marketing and Other Segment — Industry Outlook," "Liquidity and Capital Resources," "Lawsuits, Claims and Other Contingencies," "Environmental Liabilities and Expenditures," "Critical Accounting Policies and Estimates," and "Derivative Activities and Market Risk"), contain forward-looking statements and involve risks and uncertainties that could materially affect expected results of operations, liquidity, cash flows and business prospects. Words such as "estimate," "project," "predict," "will," "would," "should," "could," "may," "might," "anticipate," "plan," "intend," "believe," "expect," "aim," "goal," "target," "objective," "likely" or similar expressions that convey the uncertainty of future events or outcomes generally indicate forward-looking statements. You should not place undue reliance on these forward-looking statements, which speak only as of the date of this report. Unless legally required, Occidental does not undertake any obligation to update any forward-looking statements as a result of new information, future events or otherwise. Factors that may cause Occidental’s results of operations and financial position to differ from expectations include items noted in Item 1A "Risk Factors," and elsewhere.
33
| Item 8 | Financial Statements and Supplementary Data |
Management's Annual Assessment of and Report on Internal Control Over Financial Reporting
The management of Occidental Petroleum Corporation and subsidiaries (Occidental) is responsible for establishing and maintaining adequate internal control over financial reporting. Occidental’s system of internal control over financial reporting is designed to provide reasonable assurance regarding the reliability of financial reporting and the preparation of consolidated financial statements for external purposes in accordance with generally accepted accounting principles. Occidental’s internal control over financial reporting includes those policies and procedures that: (i) pertain to the maintenance of records that, in reasonable detail, accurately and fairly reflect the transactions and dispositions of Occidental’s assets; (ii) provide reasonable assurance that transactions are recorded as necessary to permit preparation of financial statements in accordance with generally accepted accounting principles, and that Occidental’s receipts and expenditures are being made only in accordance with authorizations of Occidental’s management and directors; and (iii) provide reasonable assurance regarding prevention or timely detection of unauthorized acquisition, use or disposition of Occidental’s assets that could have a material effect on the financial statements.
Because of its inherent limitations, internal control over financial reporting may not prevent or detect misstatements. Also, projections of any evaluation of effectiveness to future periods are subject to the risk that controls may become inadequate because of changes in conditions, or that the degree of compliance with the policies or procedures may deteriorate.
Management has assessed the effectiveness of Occidental’s internal control system as of December 31, 2011 based on the criteria for effective internal control over financial reporting described in Internal Control — Integrated Framework issued by the Committee of Sponsoring Organizations of the Treadway Commission (COSO). Based on this assessment, management believes that, as of December 31, 2011, Occidental’s system of internal control over financial reporting is effective.
Occidental’s independent auditors, KPMG LLP, have issued an audit report on Occidental’s internal control over financial reporting.
Report of Independent Registered Public Accounting Firm on Consolidated Financial Statements
To the Board of Directors and Stockholders
Occidental Petroleum Corporation:
We have audited the accompanying consolidated balance sheets of Occidental Petroleum Corporation and subsidiaries as of December 31, 2011 and 2010, and the related consolidated statements of income, stockholders’ equity, comprehensive income and cash flows for each of the years in the three-year period ended December 31, 2011. In connection with our audits of the consolidated financial statements, we also have audited the accompanying financial statement schedule. These consolidated financial statements and financial statement schedule are the responsibility of the Company’s management. Our responsibility is to express an opinion on these consolidated financial statements and financial statement schedule based on our audits.
We conducted our audits in accordance with the standards of the Public Company Accounting Oversight Board (United States). Those standards require that we plan and perform the audit to obtain reasonable assurance about whether the financial statements are free of material misstatement. An audit includes examining, on a test basis, evidence supporting the amounts and disclosures in the financial statements. An audit also includes assessing the accounting principles used and significant estimates made by management, as well as evaluating the overall financial statement presentation. We believe that our audits provide a reasonable basis for our opinion.
In our opinion, the consolidated financial statements referred to above present fairly, in all material respects, the financial position of Occidental Petroleum Corporation and subsidiaries as of December 31, 2011 and 2010, and the results of their operations and their cash flows for each of the years in the three-year period ended December 31, 2011, in conformity with U.S. generally accepted accounting principles. Also in our opinion, the related financial statement schedule, when considered in relation to the basic consolidated financial statements taken as a whole, presents fairly, in all material respects, the information set forth therein.
We also have audited, in accordance with the standards of the Public Company Accounting Oversight Board (United States), Occidental Petroleum Corporation and subsidiaries' internal control over financial reporting as of December 31, 2011, based on criteria established in Internal Control - Integrated Framework issued by the Committee of Sponsoring Organizations of the Treadway Commission (COSO), and our report dated February 23, 2012 expressed an unqualified opinion on the effectiveness of the Company’s internal control over financial reporting.
/s/ KPMG LLP
Los Angeles, CaliforniaFebruary 23, 2012
34
Report of Independent Registered Public Accounting Firm on Internal Control Over Financial Reporting
To the Board of Directors and Stockholders
Occidental Petroleum Corporation:
We have audited Occidental Petroleum Corporation and subsidiaries' internal control over financial reporting as of December 31, 2011, based on criteria established in Internal Control - Integrated Framework issued by the Committee of Sponsoring Organizations of the Treadway Commission (COSO). The Company’s management is responsible for maintaining effective internal control over financial reporting and for its assessment of the effectiveness of internal control over financial reporting, included in the accompanying Management’s Annual Assessment of and Report on Internal Control Over Financial Reporting. Our responsibility is to express an opinion on the Company’s internal control over financial reporting based on our audit.
We conducted our audit in accordance with the standards of the Public Company Accounting Oversight Board (United States). Those standards require that we plan and perform the audit to obtain reasonable assurance about whether effective internal control over financial reporting was maintained in all material respects. Our audit included obtaining an understanding of internal control over financial reporting, assessing the risk that a material weakness exists, and testing and evaluating the design and operating effectiveness of internal control based on the assessed risk. Our audit also included performing such other procedures as we considered necessary in the circumstances. We believe that our audit provides a reasonable basis for our opinion.
A company's internal control over financial reporting is a process designed to provide reasonable assurance regarding the reliability of financial reporting and the preparation of financial statements for external purposes in accordance with generally accepted accounting principles. A company's internal control over financial reporting includes those policies and procedures that: (1) pertain to the maintenance of records that, in reasonable detail, accurately and fairly reflect the transactions and dispositions of the assets of the company; (2) provide reasonable assurance that transactions are recorded as necessary to permit preparation of financial statements in accordance with generally accepted accounting principles, and that receipts and expenditures of the company are being made only in accordance with authorizations of management and directors of the company; and (3) provide reasonable assurance regarding prevention or timely detection of unauthorized acquisition, use, or disposition of the company’s assets that could have a material effect on the financial statements.
Because of its inherent limitations, internal control over financial reporting may not prevent or detect misstatements. Also, projections of any evaluation of effectiveness to future periods are subject to the risk that controls may become inadequate because of changes in conditions, or that the degree of compliance with the policies or procedures may deteriorate.
In our opinion, Occidental Petroleum Corporation and its subsidiaries maintained, in all material respects, effective internal control over financial reporting as of December 31, 2011, based on criteria established in Internal Control - Integrated Framework issued by the Committee of Sponsoring Organizations of the Treadway Commission (COSO).
We also have audited, in accordance with the standards of the Public Company Accounting Oversight Board (United States), the consolidated balance sheets of Occidental Petroleum Corporation and subsidiaries as of December 31, 2011 and 2010, and the related consolidated statements of income, stockholders’ equity, comprehensive income and cash flows for each of the years in the three-year period ended December 31, 2011, and our report dated February 23, 2012 expressed an unqualified opinion on those consolidated financial statements.
/s/ KPMG LLP
Los Angeles, California
February 23, 2012
35
| Consolidated Balance Sheets | Occidental Petroleum Corporation | |
| In millions | and Subsidiaries | |
| Assets at December 31, | | 2011 | | 2010 | |
| | | | | | | | |
| current assets | | | | | | | |
| | | | | | | | |
| Cash and cash equivalents | | $ | 3,781 | | $ | 2,578 | |
| | | | | | | | |
| Trade receivables, net of reserves of $16 in 2011 and $19 in 2010 | | | 5,395 | | | 5,032 | |
| | | | | | | | |
| Marketing and trading assets and other | | | 916 | | | 900 | |
| | | | | | | | |
| Assets of discontinued operations | | | ― | | | 2,861 | |
| | | | | | | | |
| Inventories | | | 1,069 | | | 1,041 | |
| | | | | | | | |
| Prepaid expenses and other | | | 381 | | | 647 | |
| | | | | | | | |
| Total current assets | | | 11,542 | | | 13,059 | |
| | | | | | | | |
| investments in unconsolidated entities | | | 2,072 | | | 2,039 | |
| | | | | | | | |
| property, plant and equipment | | | | | | | |
| | | | | | | | |
| Oil and gas segment | | | 56,682 | | | 46,232 | |
| | | | | | | | |
| Chemical segment | | | 5,715 | | | 5,508 | |
| | | | | | | | |
| Midstream, marketing and other segment | | | 5,664 | | | 4,094 | |
| | | | | | | | |
| Corporate | | | 1,310 | | | 1,123 | |
| | | | | | | | |
| | | | 69,371 | | | 56,957 | |
| | | | | | | | |
| Accumulated depreciation, depletion and amortization | | | (23,687 | ) | | (20,421 | ) |
| | | | | | | | |
| | | | 45,684 | | | 36,536 | |
| | | | | | | | |
| long-term receivables and other assets, net | | | 746 | | | 798 | |
| | | | | | | | |
| TOTAL ASSETS | | $ | 60,044 | | $ | 52,432 | |
The accompanying notes are an integral part of these consolidated financial statements.
36
| Consolidated Balance Sheets | Occidental Petroleum Corporation | |
| In millions, except share and per-share amounts | and Subsidiaries | |
| Liabilities and Stockholders’ Equity at December 31, | | 2011 | | 2010 | |
| | | | | | | | |
| current liabilities | | | | | | | |
| | | | | | | | |
| Accounts payable | | $ | 5,304 | | $ | 4,646 | |
| | | | | | | | |
| Accrued liabilities | | | 2,440 | | | 2,397 | |
| | | | | | | | |
| Domestic and foreign income taxes | | | 110 | | | 170 | |
| | | | | | | | |
| Liabilities of discontinued operations | | | 93 | | | 612 | |
| | | | | | | | |
| Total current liabilities | | | 7,947 | | | 7,825 | |
| | | | | | | | |
| long-term debt, net | | | 5,871 | | | 5,111 | |
| | | | | | | | |
| deferred credits and other liabilities | | | | | | | |
| | | | | | | | |
| Deferred and other domestic and foreign income taxes | | | 4,846 | | | 3,445 | |
| | | | | | | | |
| Long-term liabilities of discontinued operations | | | 98 | | | 115 | |
| | | | | | | | |
| Other | | | 3,662 | | | 3,452 | |
| | | | | | | | |
| | | | 8,606 | | | 7,012 | |
| | | | | | | | |
| contingent liabilities and commitments | | | | | | | |
| | | | | | | | |
| stockholders’ equity | | | | | | | |
| | | | | | | | |
Common stock, $0.20 par value, authorized 1.1 billion shares, outstanding shares: 2011 — 886,808,654 and 2010 — 885,275,302 | | | 177 | | | 177 | |
| | | | | | | | |
| Treasury stock: 2011 — 75,799,573 shares and 2010 — 72,480,538 shares | | | (4,502 | ) | | (4,228 | ) |
| | | | | | | | |
| Additional paid-in capital | | | 7,286 | | | 7,191 | |
| | | | | | | | |
| Retained earnings | | | 35,142 | | | 29,868 | |
| | | | | | | | |
| Accumulated other comprehensive loss | | | (483 | ) | | (524 | ) |
| | | | | | | | |
| Total stockholders’ equity | | | 37,620 | | | 32,484 | |
| | | | | | | | |
| TOTAL LIABILITIES AND STOCKHOLDERS' EQUITY | | $ | 60,044 | | $ | 52,432 | |
The accompanying notes are an integral part of these consolidated financial statements.
37
| Consolidated Statements of Income | Occidental Petroleum Corporation | |
| In millions, except per-share amounts | and Subsidiaries | |
| For the years ended December 31, | | 2011 | | 2010 | | 2009 | |
| | | | | | | | | | | |
| revenues and other income | | | | | | | | | | |
| Net sales | | $ | 23,939 | | $ | 19,045 | | $ | 14,814 | |
| Interest, dividends and other income | | | 165 | | | 111 | | | 118 | |
| Gains on disposition of assets, net | | | 15 | | | 1 | | | 10 | |
| | | | 24,119 | | | 19,157 | | | 14,942 | |
| | | | | | | | | | | |
| costs and other deductions | | | | | | | | | | |
| Cost of sales (excludes depreciation, depletion and amortization of $3,584 in 2011, $3,145 in 2010 and $2,643 in 2009) | | | 7,385 | | | 6,112 | | | 5,105 | |
| Selling, general and administrative and other operating expenses | | | 1,523 | | | 1,396 | | | 1,300 | |
| Depreciation, depletion and amortization | | | 3,591 | | | 3,153 | | | 2,687 | |
| Taxes other than on income | | | 605 | | | 484 | | | 425 | |
| Exploration expense | | | 258 | | | 262 | | | 254 | |
| Charges for impairments | | | ― | | | 275 | | | ― | |
| Interest and debt expense, net | | | 298 | | | 116 | | | 133 | |
| | | | 13,660 | | | 11,798 | | | 9,904 | |
| | | | | | | | | | | |
| income before income taxes and other items | | | 10,459 | | | 7,359 | | | 5,038 | |
| Provision for domestic and foreign income taxes | | | 4,201 | | | 2,995 | | | 2,063 | |
| Income from equity investments | | | (382 | ) | | (277 | ) | | (227 | ) |
| | | | | | | | | | | |
| income from continuing operations | | | 6,640 | | | 4,641 | | | 3,202 | |
| Discontinued operations, net | | | 131 | | | (39 | ) | | (236 | ) |
| | | | | | | | | | | |
| net income | | | 6,771 | | | 4,602 | | | 2,966 | |
| Less: Net income attributable to noncontrolling interest | | | ― | | | (72 | ) | | (51 | ) |
| net income attributable to common stock | | $ | 6,771 | | $ | 4,530 | | $ | 2,915 | |
| | | | | | | | | | | |
basic earnings per common share (attributable to common stock) | | | | | | | | | | |
| Income from continuing operations | | $ | 8.16 | | $ | 5.62 | | $ | 3.88 | |
| Discontinued operations, net | | | 0.16 | | | (0.05 | ) | | (0.29 | ) |
| basic earnings per common share | | $ | 8.32 | | $ | 5.57 | | $ | 3.59 | |
| | | | | | | | | | | |
diluted earnings per common share (attributable to common stock) | | | | | | | | | | |
| Income from continuing operations | | $ | 8.16 | | $ | 5.61 | | $ | 3.87 | |
| Discontinued operations, net | | | 0.16 | | | (0.05 | ) | | (0.29 | ) |
| | | | | | | | | | | |
| diluted earnings per common share | | $ | 8.32 | | $ | 5.56 | | $ | 3.58 | |
| | | | | | | | | | | |
| dividends per common share | | $ | 1.84 | | $ | 1.47 | | $ | 1.31 | |
| The accompanying notes are an integral part of these consolidated financial statements. | | | | | | | | | | |
| Consolidated Statements of Comprehensive Income | Occidental Petroleum Corporation | |
| In millions | and Subsidiaries | |
| For the years ended December 31, | | 2011 | | 2010 | | 2009 | |
| Net income attributable to common stock | | $ | 6,771 | | $ | 4,530 | | $ | 2,915 | |
| Other comprehensive income (loss) items: | | | | | | | | | | |
| Foreign currency translation adjustments | | | (11 | ) | | 4 | | | 32 | |
Unrealized gains (losses) on derivatives (a) | | | 14 | | | 37 | | | (93 | ) |
Pension and postretirement adjustments (b) | | | (60 | ) | | (52 | ) | | 1 | |
Reclassification of realized losses on derivatives and securities (c) | | | 98 | | | 83 | | | 13 | |
Unrealized gains on securities (d) | | | ― | | | ― | | | 3 | |
Other comprehensive income (loss), net of tax (e) | | | 41 | | | 72 | | | (44 | ) |
| Comprehensive income attributable to common stock | | $ | 6,812 | | $ | 4,602 | | $ | 2,871 | |
| (a) | Net of tax of $(7), $(20) and $53 in 2011, 2010 and 2009, respectively. | |
| (b) | Net of tax of $34, $30 and zero in 2011, 2010 and 2009, respectively. | |
| (c) | Net of tax of $(56), $(47) and $(7) in 2011 2010 and 2009, respectively. | |
| (d) | Net of tax of zero, zero and $(1) in 2011, 2010 and 2009, respectively. | |
| (e) | There were no other comprehensive income (loss) items related to noncontrolling interests in 2011, 2010 and 2009. | |
| Consolidated Statements of Stockholders' Equity | |
| In millions | |
| | |
| | | Equity Attributable to Common Stock | | | | | | | |
| | | | | | | | | | | | | | | Accumulated | | | | | | | |
| | | | | | | | | Additional | | | | | Other | | | | | | | |
| | | Common | | Treasury | | Paid-in | | Retained | | Comprehensive | | Noncontrolling | | Total | |
| | | Stock | | Stock | | Capital | | Earnings | | Income (Loss) | | Interest | | Equity | |
| Balance, December 31, 2008 | | $ | 176 | | $ | (4,121 | ) | $ | 7,113 | | $ | 24,684 | | $ | (552 | ) | $ | 25 | | $ | 27,325 | |
| Net income | | | ― | | | ― | | | ― | | | 2,915 | | | ― | | | 51 | | | 2,966 | |
| Other comprehensive loss, net of tax | | | ― | | | ― | | | ― | | | ― | | | (44 | ) | | ― | | | (44 | ) |
| Dividends on common stock | | | ― | | | ― | | | ― | | | (1,065 | ) | | ― | | | (16 | ) | | (1,081 | ) |
| Issuance of common stock and other, net | | | 1 | | | ― | | | 14 | | | ― | | | ― | | | 18 | | | 33 | |
| Purchases of treasury stock | | | ― | | | (40 | ) | | ― | | | ― | | | ― | | | ― | | | (40 | ) |
| Balance, December 31, 2009 | | $ | 177 | | $ | (4,161 | ) | $ | 7,127 | | $ | 26,534 | | $ | (596 | ) | $ | 78 | | $ | 29,159 | |
| Net income | | | ― | | | ― | | | ― | | | 4,530 | | | ― | | | 72 | | | 4,602 | |
| Other comprehensive income, net of tax | | | ― | | | ― | | | ― | | | ― | | | 72 | | | ― | | | 72 | |
| Dividends on common stock | | | ― | | | ― | | | ― | | | (1,196 | ) | | ― | | | ― | | | (1,196 | ) |
| Issuance of common stock and other, net | | | ― | | | ― | | | 64 | | | ― | | | ― | | | (150 | )(a) | | (86 | ) |
| Purchases of treasury stock | | | ― | | | (67 | ) | | ― | | | ― | | | ― | | | ― | | | (67 | ) |
| Balance, December 31, 2010 | | $ | 177 | | $ | (4,228 | ) | $ | 7,191 | | $ | 29,868 | | $ | (524 | ) | $ | — | | $ | 32,484 | |
| Net income | | | ― | | | ― | | | ― | | | 6,771 | | | ― | | | ― | | | 6,771 | |
| Other comprehensive income, net of tax | | | ― | | | ― | | | ― | | | ― | | | 41 | | | ― | | | 41 | |
| Dividends on common stock | | | ― | | | ― | | | ― | | | (1,497 | ) | | ― | | | �� | | | (1,497 | ) |
| Issuance of common stock and other, net | | | ― | | | ― | | | 95 | | | ― | | | ― | | | ― | | | 95 | |
| Purchases of treasury stock | | | ― | | | (274 | ) | | ― | | | ― | | | ― | | | ― | | | (274 | ) |
| Balance, December 31, 2011 | | $ | 177 | | $ | (4,502 | ) | $ | 7,286 | | $ | 35,142 | | $ | (483 | ) | $ | ― | | $ | 37,620 | |
(a) | On December 31, 2010, Occidental restructured its Colombian operations to take a direct working interest in the related assets. | |
The accompanying notes are an integral part of these consolidated financial statements.
| Consolidated Statements of Cash Flows | Occidental Petroleum Corporation | |
| In millions | and Subsidiaries | |
| For the years ended December 31, | | 2011 | | 2010 | | 2009 | |
| | | | | | | | | | | |
| cash flow from operating activities | | | | | | | | | | |
| Net income | | $ | 6,771 | | $ | 4,602 | | $ | 2,966 | |
| Adjustments to reconcile net income to net cash provided by operating activities: | | | | | | | | | | |
| Discontinued operations, net | | | (131 | ) | | 39 | | | 236 | |
| Depreciation, depletion and amortization of assets | | | 3,591 | | | 3,153 | | | 2,687 | |
| Deferred income tax provision | | | 1,436 | | | 406 | | | 659 | |
| Other noncash charges to income | | | 205 | | | 507 | | | 336 | |
| Gains on disposition of assets, net | | | (15 | ) | | (1 | ) | | (10 | ) |
| Undistributed earnings from equity investments | | | (33 | ) | | (60 | ) | | (88 | ) |
| Dry hole and impairment expense | | | 160 | | | 139 | | | 200 | |
| Changes in operating assets and liabilities: | | | | | | | | | | |
| (Increase) decrease in receivables | | | (338 | ) | | (850 | ) | | (573 | ) |
| (Increase) decrease in inventories | | | (50 | ) | | (42 | ) | | (119 | ) |
| Decrease (increase) in prepaid expenses and other assets | | | 73 | | | 131 | | | (9 | ) |
| Increase (decrease) in accounts payable and accrued liabilities | | | 829 | | | 1,295 | | | (316 | ) |
| (Decrease) increase in current domestic and foreign income taxes | | | (174 | ) | | 186 | | | 1 | |
| Other operating, net | | | (18 | ) | | (149 | ) | | (114 | ) |
| Operating cash flow from continuing operations | | | 12,306 | | | 9,356 | | | 5,856 | |
| Operating cash flow from discontinued operations, net of taxes | | | (25 | ) | | 210 | | | 90 | |
| Net cash provided by operating activities | | | 12,281 | | | 9,566 | | | 5,946 | |
| | | | | | | | | | | |
| cash flow from investing activities | | | | | | | | | | |
| Capital expenditures | | | (7,518 | ) | | (3,940 | ) | | (3,245 | ) |
| Payments for purchases of assets and businesses | | | (4,909 | ) | | (4,924 | ) | | (1,782 | ) |
| Sales of assets, net | | | 50 | | | 20 | | | 51 | |
| Other, net | | | (96 | ) | | (36 | ) | | (154 | ) |
| Investing cash flow from continuing operations | | | (12,473 | ) | | (8,880 | ) | | (5,130 | ) |
| Investing cash flow from discontinued operations | | | 2,570 | | | (415 | ) | | (336 | ) |
| Net cash used by investing activities | | | (9,903 | ) | | (9,295 | ) | | (5,466 | ) |
| | | | | | | | | | | |
| cash flow from financing activities | | | | | | | | | | |
| Proceeds from long-term debt | | | 2,111 | | | 2,584 | | | 740 | |
| Payments of long-term debt | | | (1,523 | ) | | (311 | ) | | (692 | ) |
| Proceeds from issuance of common stock | | | 50 | | | 10 | | | 18 | |
| Purchases of treasury stock | | | (274 | ) | | (67 | ) | | (40 | ) |
| Distributions to noncontrolling interest | | | (121 | ) | | ― | | | (16 | ) |
| Cash dividends paid | | | (1,436 | ) | | (1,159 | ) | | (1,063 | ) |
| Other, net | | | 18 | | | 26 | | | 27 | |
| Financing cash flow from continuing operations | | | (1,175 | ) | | 1,083 | | | (1,026 | ) |
| Financing cash flow from discontinued operations | | | ― | | | ― | | | (7 | ) |
| Net cash provided (used) by financing activities | | | (1,175 | ) | | 1,083 | | | (1,033 | ) |
| | | | | | | | | | | |
| Increase (decrease) in cash and cash equivalents | | | 1,203 | | | 1,354 | | | (553 | ) |
| Cash and cash equivalents — beginning of year | | | 2,578 | | | 1,224 | | | 1,777 | |
| | | | | | | | | | | |
| Cash and cash equivalents — end of year | | $ | 3,781 | | $ | 2,578 | | $ | 1,224 | |
The accompanying notes are an integral part of these consolidated financial statements.
| Notes to Consolidated Financial Statements | Occidental Petroleum Corporation |
| | and Subsidiaries |
| Note 1 | Summary of Significant Accounting Policies |
Nature of Operations
In this report, "Occidental" or "the Company" refers to Occidental Petroleum Corporation, a Delaware corporation (OPC), or OPC and one or more entities in which it owns a controlling interest (subsidiaries). Occidental is a multinational organization whose subsidiaries and affiliates operate in the oil and gas, chemical and midstream, marketing and other segments. The oil and gas segment explores for, develops and produces oil and condensate, natural gas liquids (NGLs) and natural gas. The chemical segment (OxyChem) mainly manufactures and markets basic chemicals and vinyls. The midstream, marketing and other segment (midstream and marketing) gathers, treats, processes, transports, stores, purchases and markets oil, condensate, NGLs, natural gas, carbon dioxide (CO2) and power. It also trades around its assets, including pipelines and storage capacity, and trades oil, NGLs, gas and other commodities.
Principles of Consolidation
The consolidated financial statements have been prepared in conformity with United States generally accepted accounting principles (GAAP) and include the accounts of OPC, its subsidiaries and its undivided interests in oil and gas exploration and production ventures. Occidental accounts for its share of oil and gas exploration and production ventures, in which it has a direct working interest, by reporting its proportionate share of assets, liabilities, revenues, costs and cash flows within the relevant lines on the balance sheets, income statements and cash flow statements.
Certain financial statements, notes and supplementary data for prior years have been reclassified to conform to the 2011 presentation.
Investments in Unconsolidated Entities
Occidental’s percentage interest in the underlying net assets of affiliates as to which it exercises significant influence without having a majority voting interest (excluding oil and gas ventures in which Occidental holds an undivided interest) are accounted for under the equity method. Occidental reviews equity-method investments for impairment whenever events or changes in circumstances indicate that an other-than-temporary decline in value may have occurred. The amount of impairment, if any, is based on quoted market prices, where available, or other valuation techniques, including discounted cash flows.
Revenue Recognition
Revenue is recognized from oil and gas production when title has passed to the customer, which occurs when the product is shipped. In international locations where oil is shipped by tanker, title passes when the tanker is loaded or product is received by the customer, depending on the shipping terms. This process occasionally causes a difference between actual production in a reporting period and sales volumes that have been recognized as revenue.
Revenue from chemical product sales is recognized when the product is shipped and title has passed to the customer. Certain incentive programs may provide for payments or credits to be made to customers based on the volume of product purchased over a defined period. Total customer incentive payments over a given period are estimated and recorded as a reduction to revenue ratably over the contract period. Such estimates are evaluated and revised as warranted.
Revenue from marketing and trading activities is recognized on net settled transactions upon completion of contract terms, and for physical deliveries upon title transfer. For unsettled transactions, contracts are recorded at fair value and changes in fair value are reflected in net sales. Revenue from all marketing and trading activities is reported on a net basis.
Occidental records revenue net of any taxes, such as sales taxes, that are assessed by governmental authorities on Occidental's customers.
Risks and Uncertainties
The process of preparing consolidated financial statements in conformity with GAAP requires Occidental's management to make informed estimates and judgments regarding certain types of financial statement balances. Such estimates primarily relate to unsettled transactions and events as of the date of the consolidated financial statements. Changes in facts and circumstances or discovery of new information relating to such transactions and events may result in revised estimates and judgments and actual results may differ from estimates upon settlement but generally not by material amounts. Management believes that these estimates and assumptions provide a reasonable basis for the fair presentation of Occidental’s financial position and results of operations.
Occidental establishes a valuation allowance against net operating losses and other deferred tax assets to the extent it believes the future benefit from these assets will not be realized in the statutory carryforward periods. Realization of deferred tax assets, including any net operating loss carryforwards, is dependent upon Occidental generating sufficient future taxable income in jurisdictions where such assets originate and reversal of temporary differences.
The accompanying consolidated financial statements include assets of approximately $11 billion as of December 31, 2011, and net sales of approximately $8.7 billion for the year ended December 31, 2011, relating to Occidental’s operations in countries outside North America. Occidental operates some of its oil and gas business in countries that occasionally have experienced political instability, armed conflict, terrorism, insurgency, civil unrest, security problems, labor unrest, OPEC production restrictions, equipment import restrictions and sanctions, all of which increase Occidental's risk of loss or delayed or restricted production or may result in other adverse consequences. Occidental attempts to conduct its financial affairs so as to mitigate its exposure to such risks and would seek compensation in the event of nationalization.
Since Occidental’s major products are commodities, significant changes in the prices of oil and gas and chemical products may have a significant impact on Occidental’s results of operations.
Also, see "Property, Plant and Equipment" below.
Cash and Cash Equivalents
Cash equivalents are short-term, highly liquid investments that are readily convertible to cash. Cash equivalents were approximately $3.5 billion and $2.5 billion at December 31, 2011 and 2010, respectively.
Investments
Available-for-sale securities are recorded at fair value with any unrealized gains or losses included in accumulated other comprehensive income/loss (AOCI). Trading securities are recorded at fair value with unrealized and realized gains or losses included in net sales.
Inventories
Materials and supplies are valued at the lower of weighted-average cost or market and are reviewed periodically for obsolescence. Oil, NGLs and natural gas inventories are valued at the lower of cost or market.
For the chemical segment, Occidental's inventories are valued at the lower of cost or market. For most of its domestic inventories, other than materials and supplies, the chemical segment uses the last-in, first-out (LIFO) method as it better matches current costs and current revenue. For other countries, Occidental uses the first-in, first-out method (if the costs of goods are specifically identifiable) or the average-cost method (if the costs of goods are not specifically identifiable).
Property, Plant and Equipment
Oil and Gas
The carrying value of Occidental’s property, plant and equipment (PP&E) represents the cost incurred to acquire or develop the asset, including any capitalized interest, net of accumulated depreciation, depletion and amortization (DD&A) and net of any impairment charges. For business acquisitions, PP&E cost is based on fair values at the acquisition date. Interest costs incurred in connection with qualifying capital expenditures are capitalized and amortized over the lives of the related assets.
Occidental uses the successful efforts method to account for its oil and gas properties. Under this method, costs of acquiring properties, costs of drilling successful exploration wells and development costs are capitalized. The costs of exploratory wells are initially capitalized pending a determination of whether proved reserves have been found. If proved reserves have been found, the costs of exploratory wells remain capitalized. Otherwise, the costs of the related exploratory wells are charged to expense. In some cases, a determination of proved reserves cannot be made at the completion of drilling, requiring additional testing and evaluation of the wells. Occidental's practice is generally to expense the costs of such exploratory wells if a determination of proved reserves has not been made within a 12-month period after drilling is complete.
The following table summarizes the activity of capitalized exploratory well costs for continuing operations for the years ended December 31:
| In millions | | 2011 | | 2010 | | 2009 | |
Balance — Beginning of Year | | $ | 73 | | $ | 51 | | $ | 63 | |
| Additions to capitalized exploratory well costs pending the determination of proved reserves | | | 155 | | | 73 | | | 51 | |
| Reclassifications to property, plant and equipment based on the determination of proved reserves | | | (28 | ) | | (29 | ) | | (8 | ) |
| Capitalized exploratory well costs charged to expense | | | (18 | ) | | (22 | ) | | (55 | ) |
| Balance — End of Year | | $ | 182 | | $ | 73 | | $ | 51 | |
Annual lease rentals and geological, geophysical and seismic costs are expensed as incurred.
Occidental’s policy is to expense the costs of injectants for secondary and tertiary recovery.
Depreciation and depletion of oil and gas producing properties are determined by the unit-of-production method. Leasehold acquisition costs are amortized over total proved reserves, while capitalized development and successful exploration costs are amortized over proved developed reserves.
Proved oil and gas reserves (as defined in the Securities and Exchange Commission's Regulation S-X, Rule 4-10(a)) are those quantities of oil and gas, which, by analysis of geoscience and engineering data, can be estimated with reasonable certainty to be economically producible—from a given date forward, from known reservoirs, and under existing economic conditions, operating methods, and government regulations—prior to the time at which contracts providing the right to operate expire, unless evidence indicates that renewal is reasonably certain, regardless of whether deterministic or probabilistic methods are used for the estimation. Occidental has no proved oil and gas reserves for which the determination of commercial viability is subject to the completion of major additional capital expenditures.
A portion of the carrying value of Occidental’s oil and gas properties is attributable to unproved properties. At December 31, 2011, the net capitalized costs attributable to unproved properties were $4.9 billion. The unproved amounts are not subject to DD&A or impairment until they are classified as proved properties. As exploration and development work progresses, if reserves on these properties are proved, capitalized costs attributable to the properties will become subject to DD&A. If the exploration and development work were to be unsuccessful, or management's plans changed with respect to these properties, as a result of economic, operating or contractual conditions, the capitalized costs of the related properties would be expensed. The timing of any writedowns of these unproved properties, if warranted, depends upon management's plans, the nature, timing and extent of future exploration and development activities and their results. Occidental believes its current plans and exploration and development efforts will allow it to realize its unproved property balance.
Additionally, Occidental performs impairment tests with respect to its proved properties generally when prices decline other than temporarily, reserve estimates change significantly or other significant events occur that may impact its ability to realize the recorded asset amounts. Impairment tests incorporate a number of assumptions involving expectations of future cash flows, which can change significantly over time. These assumptions include estimates of future product prices, which Occidental bases on forward price curves and, where applicable, contractual prices, estimates of oil and gas reserves and estimates of future expected operating and development costs. Fluctuations in commodity prices and production and development costs could cause management's plans to change with respect to unproved properties and could cause the carrying values of proved properties to be unrealizable. Such circumstances could result in impairments in the carrying values of proved or unproved properties or both. Any impairment loss would be calculated as the excess of the asset’s net book value over its estimated fair value.
Chemical
Occidental’s chemical assets are depreciated using either the unit-of-production or straight-line method, based upon the estimated useful lives of the facilities. The estimated useful lives of Occidental’s chemical assets, which range from three years to 50 years, are also used for impairment tests. The estimated useful lives for the chemical facilities are based on the assumption that Occidental will provide an appropriate level of annual expenditures to ensure productive capacity is sustained. Such expenditures consist of ongoing routine repairs and maintenance, as well as planned major maintenance activities (PMMA). Ongoing routine repairs and maintenance expenditures are expensed as incurred. PMMA costs are capitalized and amortized over the period until the next planned overhaul. Additionally, Occidental incurs capital expenditures that extend the remaining useful lives of existing assets, increase their capacity or operating efficiency beyond the original specification or add value through modification for a different use. These capital expenditures are not considered in the initial determination of the useful lives of these assets at the time they are placed into service. The resulting revision, if any, of the asset’s estimated useful life is measured and accounted for prospectively.
Without these continued expenditures, the useful lives of these assets could decrease significantly. Other factors that could change the estimated useful lives of Occidental’s chemical assets include sustained higher or lower product prices, which are particularly affected by both domestic and foreign competition, demand, feedstock costs, energy prices, environmental regulations and technological changes.
Occidental performs impairment tests on its chemical assets whenever events or changes in circumstances lead to a reduction in the estimated useful lives or estimated future cash flows that would indicate that the carrying amount may not be recoverable, or when management’s plans change with respect to those assets. Any impairment loss would be calculated as the excess of the asset’s net book value over its estimated fair value.
Midstream and Marketing
Occidental’s midstream and marketing PP&E is depreciated over the estimated useful lives of the assets, using either the unit-of-production or straight-line method.
Occidental performs impairment tests on its midstream and marketing assets whenever events or changes in circumstances lead to a reduction in the estimated useful lives or estimated future cash flows that would indicate that the carrying amount may not be recoverable, or when management’s plans change with respect to those assets. Any impairment loss would be calculated as the excess of the asset’s net book value over its estimated fair value.
Fair Value Measurements
Occidental has categorized its assets and liabilities that are measured at fair value, based on the priority of the inputs to the valuation techniques, in a three-level fair value hierarchy: Level 1 – using quoted prices in active markets for identical assets or liabilities; Level 2 – using observable inputs other than quoted prices for identical assets or liabilities; and Level 3 – using unobservable inputs. Transfers between levels, if any, are reported at the end of each reporting period.
Fair Values - Recurring
Occidental primarily applies the market approach for recurring fair value measurements, maximizes its use of observable inputs and minimizes its use of unobservable inputs. Occidental utilizes the mid-point price between bid and ask prices for valuing the majority of its assets and liabilities measured and reported at fair value. In addition to using market data, Occidental makes assumptions in valuing its assets and liabilities, including assumptions about the risks inherent in the inputs to the valuation technique. For assets and liabilities carried at fair value, Occidental measures fair value using the following methods:
| | Ø | Trading securities – Quoted prices in active markets exist and are used to provide fair values for these instruments. These securities are classified as Level 1. |
| | Ø | Commodity derivatives – Occidental values exchange-cleared commodity derivatives using closing prices provided by the exchange as of the balance sheet date. These derivatives are classified as Level 1. Over-the-Counter (OTC) financial commodity contracts, options and physical commodity forward purchase and sale contracts are generally valued using quotations provided by brokers or industry-standard models that consider various inputs, including quoted forward prices for commodities, time value, volatility factors, credit risk and current market and contractual prices for the underlying instruments, as well as other relevant economic measures. Substantially all of these inputs are observable in the marketplace throughout the full term of the instrument, can be derived from observable data or are supported by observable prices at which transactions are executed in the marketplace. Occidental classifies these measurements as Level 2. |
Occidental generally uses an income approach to measure fair value when there is not a market-observable price for an identical or similar asset or liability. This approach utilizes management's best assumptions regarding expectations of projected cash flows, and discounts the expected cash flows using a risk-adjusted risk-free discount rate.
Accrued Liabilities—Current
Accrued liabilities include accrued payroll, commissions and related expenses of $462 million and $470 million at December 31, 2011 and 2010, respectively.
Environmental Liabilities and Expenditures Environmental expenditures that relate to current operations are expensed or capitalized as appropriate. Occidental records environmental reserves for estimated remediation costs that relate to existing conditions from past operations when environmental remediation efforts are probable and the costs can be reasonably estimated. In determining the reserves and the range of reasonably possible additional loss, Occidental refers to currently available information, including relevant past experience, remedial objectives, available technologies, applicable laws and regulations and cost-sharing arrangements. Occidental bases environmental reserves on management’s estimate of the most likely cost to be incurred, using the most cost-effective technology reasonably expected to achieve the remedial objective. Occidental periodically reviews reserves and adjusts them as new information becomes available. Occidental records environmental reserves on a discounted basis when it deems the aggregate amount and timing of cash payments to be reliably determinable at the time the reserves are established. The reserve methodology with respect to discounting for a specific site is not modified once it is established. The amount of discounted environmental reserves is insignificant. Occidental generally records reimbursements or recoveries of environmental remediation costs in income when received, or when receipt of recovery is highly probable. As of December 31, 2011, 2010 and 2009, Occidental did not have any accruals for reimbursements or recoveries.
Many factors could affect Occidental’s future remediation costs and result in adjustments to its environmental reserves and range of reasonably possible additional loss. The most significant are: (1) cost estimates for remedial activities may be inaccurate; (2) the length of time, type or amount of remediation necessary to achieve the remedial objective may change due to factors such as site conditions, the ability to identify and control contaminant sources or the discovery of additional contamination; (3) the regulatory agency may ultimately reject or modify Occidental’s proposed remedial plan; (4) improved or alternative remediation technologies may change remediation costs; and (5) laws and regulations may impose more or less stringent remediation requirements or affect cost sharing or allocation of liability.
Certain sites involve multiple parties with various cost-sharing arrangements, which fall into the following three categories: (1) environmental proceedings that result in a negotiated or prescribed allocation of remediation costs among Occidental and other alleged potentially responsible parties; (2) oil and gas ventures in which each participant pays its proportionate share of remediation costs reflecting its working interest; or (3) contractual arrangements,
typically relating to purchases and sales of properties, in which the parties to the transaction agree to methods of allocating remediation costs. In these circumstances, Occidental evaluates the financial viability of the other parties with whom it is alleged to be jointly liable, the degree of their commitment to participate and the consequences to Occidental of their failure to participate when estimating Occidental's ultimate share of liability. Occidental records reserves at its expected net cost of remedial activities and, based on these factors, believes that it will not be required to assume a share of liability of such other potentially responsible parties in an amount materially above amounts reserved.
In addition to the costs of investigations and cleanup measures, which often take in excess of 10 years at Comprehensive Environmental Response, Compensation, and Liability Act (CERCLA) National Priorities List (NPL) sites, Occidental’s reserves include management’s estimates of the costs to operate and maintain remedial systems. If remedial systems are modified over time in response to significant changes in site-specific data, laws, regulations, technologies or engineering estimates, Occidental reviews and adjusts its reserves accordingly.
Asset Retirement Obligations
Occidental recognizes the fair value of asset retirement obligations in the period in which a determination is made that a legal obligation exists to dismantle an asset and reclaim or remediate the property at the end of its useful life and the cost of the obligation can be reasonably estimated. The liability amounts are based on future retirement cost estimates and incorporate many assumptions such as time to abandonment, technological changes, future inflation rates and the risk-adjusted risk-free rate of interest. When the liability is initially recorded, Occidental capitalizes the cost by increasing the related PP&E balances. If the estimated future cost of the asset retirement obligation changes, Occidental records an adjustment to both the asset retirement obligation and PP&E. Over time, the liability is increased and expense is recognized for accretion, and the initial capitalized cost is depreciated over the useful life of the asset. Occidental has recorded no market risk premium in its liability since no reliable estimate can be made at this time.
At a certain number of its facilities, Occidental has identified conditional asset retirement obligations that are related mainly to plant decommissioning. Occidental believes that there is an indeterminate settlement date for these asset retirement obligations because the range of time over which Occidental may settle these obligations is unknown or cannot be estimated. Therefore, Occidental cannot reasonably estimate the fair value of these liabilities. Occidental will recognize these conditional asset retirement obligations in the periods in which sufficient information becomes available to reasonably estimate their fair values.
The following table summarizes the activity of the asset retirement obligation, of which $1,030 million and $762 million is included in deferred credits and other liabilities - other, with the remaining current portion in accrued liabilities at December 31, 2011 and 2010, respectively.
| For the years ended December 31, (in millions) | | 2011 | | 2010 | |
| Beginning balance | | $ | 800 | | $ | 657 | |
| Liabilities incurred - capitalized to PP&E | | | 74 | | | 47 | |
| Liabilities settled and paid | | | (53 | ) | | (32 | ) |
| Accretion expense | | | 48 | | | 37 | |
| Acquisitions and other - capitalized to PP&E | | | 177 | | | 66 | |
| Revisions to estimated cash flows - capitalized to PP&E | | | 43 | | | 25 | |
| Ending balance | | $ | 1,089 | | $ | 800 | |
Derivative Instruments
Derivatives are carried at fair value and on a net basis when a legal right of offset exists with the same counterparty. Occidental applies hedge accounting when transactions meet specified criteria for such treatment and management elects to do so. If a derivative does not qualify or is not designated and documented as a cash-flow hedge, any fair value gains or losses are recognized in earnings in the current period. For cash-flow hedges, the gain or loss on the effective portion of the derivative is reported as a component of other comprehensive income (OCI) with an offsetting adjustment to the basis of the item being hedged. Realized gains or losses from cash-flow hedges, and any ineffective portion, are recorded as a component of net sales in the consolidated statements of income. Ineffectiveness is primarily created by a basis difference between the hedged item and the hedging instrument due to location, quality or grade of the physical commodity transactions. Gains and losses from derivative instruments are reported net in the consolidated statements of income. There were no fair value hedges as of and during the years ended December 31, 2011, 2010 and 2009.
A hedge is regarded as highly effective such that it qualifies for hedge accounting if, at inception and throughout its life, it is expected that changes in the fair value or cash flows of the hedged item will be offset by 80 to 125 percent of the changes in the fair value or cash flows, respectively, of the hedging instrument. In the case of hedging a forecast transaction, the transaction must be probable and must present an exposure to variations in cash flows that could ultimately affect reported net income or loss. Occidental discontinues hedge accounting when it determines that a derivative has ceased to be highly effective as a hedge; when the hedged item matures or is sold or repaid; or when a forecast transaction is no longer deemed probable.
Stock-Based Incentive Plans
Occidental has established several stockholder-approved stock-based incentive plans for certain employees (Plans) that are more fully described in Note 12. A summary of Occidental’s accounting policy under each type of award issued under the Plans follows below.
For cash- and stock-settled restricted stock units or incentive award shares (RSUs), compensation value is initially measured on the grant date using the quoted market price of Occidental’s common stock. For stock options (Options), stock-settled stock appreciation rights (SARs), performance stock awards (PSAs) and total shareholder return incentives (TSRIs), compensation value is initially measured on the grant date using potential exercise values or estimated payout levels using Monte Carlo or other valuation models. Compensation expense for all awards is recognized on a straight-line basis over the requisite service periods, which is generally over the awards’ respective vesting or performance periods. Compensation expense for PSAs and TSRIs is adjusted quarterly for any changes in the number of shares expected to be issued based on the performance criteria using valuation models. In addition, every quarter, compensation expense for the cash-settled portion of RSUs, SARs, PSAs and TSRIs is adjusted for changes in the value of the underlying stock. The stock-settled portion of all these awards is expensed using the initially measured compensation value. All such performance or stock-price-related changes are recognized in periodic compensation expense.
Earnings per Share
Occidental's instruments containing rights to nonforfeitable dividends granted in stock-based payment transactions are considered participating securities prior to vesting, and, therefore, have been included in the earnings allocations in computing basic and diluted EPS under the two-class method.
Basic EPS was computed by dividing net income attributable to common stock, net of participating securities, by the weighted-average number of common shares outstanding during each period, net of treasury shares and including vested but unissued shares and share units. The computation of diluted EPS reflects the additional dilutive effect of stock options and unvested stock awards.
Retirement Plans and Postretirement Benefits
Occidental recognizes the overfunded or underfunded amounts of its defined benefit pension and postretirement plans in its financial statements using a December 31 measurement date.
Occidental determines its defined benefit pension and postretirement benefit plan obligations based on various assumptions and discount rates. The discount rate assumptions used are meant to reflect the interest rate at which the obligations could effectively be settled on the measurement date. Occidental uses the fair value of assets to determine expected return on plan assets in calculating pension expense. Occidental funds and expenses negotiated pension increases for domestic union employees over the terms of the applicable collective bargaining agreements.
Pension and postretirement plan assets are measured at fair value. Common stock, preferred stock, publicly registered mutual funds, U.S. government securities and corporate bonds are valued using quoted market prices in active markets when available. When quoted market prices are not available, these investments are valued using pricing models with observable inputs from both active and non-active markets. Common and collective trusts are valued at the fund units' net asset value (NAV) provided by the issuer, which represents the quoted price in a non-active market. Some of the collateral Occidental receives for securities loaned includes investments in short-term investment funds. The short-term investment funds are valued at the fund units' NAV provided by the issuer.
Supplemental Cash Flow Information
Occidental paid United States federal, state and foreign income taxes for continuing operations of approximately $2.9 billion, $2.4 billion and $1.4 billion during the years ended December 31, 2011, 2010 and 2009, respectively. Occidental also paid production, property and other taxes of approximately $635 million, $510 million and $484 million during the years ended December 31, 2011, 2010 and 2009, respectively, substantially all of which was in the United States. Additionally, net payments for income taxes related to discontinued operations were zero, $42 million and $4 million for the years 2011, 2010 and 2009, respectively. Production, property and other taxes paid related to discontinued operations were zero, $197 million and $100 million for the years 2011, 2010 and 2009, respectively. Interest paid totaled approximately $315 million, $161 million and $164 million for the years 2011, 2010 and 2009, respectively. The 2011 interest paid included $154 million of debt extinguishment premiums.
Foreign Currency Transactions
The functional currency applicable to all of Occidental’s foreign oil and gas operations is the United States dollar since cash flows are denominated principally in United States dollars. In Occidental's other operations, Occidental's use of non-United States dollar functional currencies was not material for all years presented. The effect of exchange rates on transactions in foreign currencies is included in periodic income. Exchange-rate gains and losses for continuing operations were not material for all years presented.
| Note 2 | Acquisitions, Dispositions and Other Transactions |
2011
During the year ended December 31, 2011, Occidental acquired producing properties in South Texas for approximately $1.8 billion. Occidental also acquired approximately $2.6 billion of other domestic oil and gas assets, which included properties in California, as well as the Permian and Williston Basins.
In the first quarter of 2011, Occidental completed the sale of its Argentine oil and gas operations, initiated in 2010.
Internationally, Occidental acquired a 40-percent participating interest in the Shah Gas Field development project in Abu Dhabi, which is operated by Abu Dhabi Gas Development Company Limited (Al Hosn Gas Project), in the first quarter of 2011. Occidental partnered with the Abu Dhabi National Oil Company in a 30-year joint venture agreement for the $10 billion project, of which Occidental’s portion is approximately $4 billion. In May 2011, Occidental paid approximately $500 million for its share of pre-acquisition development expenditures.
In early 2011, Occidental ceased exploration activity and its participation in production operations in Libya due to civil unrest in the country and United States sanctions. As a result, Occidental wrote off the entire amount of the capitalized and suspended exploration costs incurred to date, including lease acquisition costs, of approximately $35 million in the first quarter of 2011. The United States government lifted its sanctions in September 2011 and Occidental resumed its participation in the producing operations at that time.
2010
In December 2010, Occidental acquired oil producing and prospective properties in North Dakota for approximately $1.4 billion in cash. In 2010, Occidental also acquired various domestic oil and gas interests, in operated, producing and non-producing properties in the Permian Basin, mid-continent region and California, for approximately $2.8 billion.
In December 2010, Occidental executed an agreement with a subsidiary of China Petrochemical Corporation (Sinopec) to sell its Argentine oil and gas operations for after-tax proceeds of approximately $2.6 billion. Occidental recorded a pre-tax gain of $225 million when the sale closed in February 2011. Net revenues and pre-tax income for discontinued operations related to Argentina were $97 million and $2 million for the year ended December 31, 2011. Net revenues and pre-tax losses for such discontinued operations were, respectively, $700 million and $(39) million in 2010, and $589 million and $(369) million in 2009. As of December 31, 2011 and 2010, the assets of discontinued operations related to Argentina were zero and $2.9 billion, respectively, which mainly comprised PP&E as of December 31, 2010. As of December 31, 2011 and 2010, the liabilities of discontinued operations were zero and $513 million, which mainly comprised deferred tax liabilities and accrued liabilities as of December 31, 2010.
In December 2010, Occidental purchased additional noncontrolling interests in the General Partner of Plains All-American Pipeline, L.P. (Plains Pipeline) for approximately $430 million, and now owns approximately 35 percent of the General Partner. In December 2010, Occidental also completed its acquisition of the remaining 50-percent joint venture interest in Elk Hills Power, LLC (EHP), a limited liability company that operates a gas-fired power-generation plant in California, for approximately $175 million, bringing Occidental’s total ownership to 100 percent. EHP is now consolidated in Occidental's balance sheet.
In January 2010, Occidental and its partners signed a 20-year contract with the South Oil Company of Iraq to develop the Zubair Field in Iraq.
2009
On December 31, 2009, Occidental completed the acquisition of Phibro LLC (Phibro) for approximately $370 million in cash and maintains a controlling interest. Phibro, primarily an investor in commodities, is included as a part of Occidental's midstream and marketing segment. The assets acquired and liabilities assumed were recorded at their estimated fair values at the acquisition date. No goodwill was recorded on this transaction.
In December 2009, Occidental purchased additional noncontrolling interests in Plains Pipeline for approximately $330 million in cash.
Occidental and its partners signed a Development and Production Sharing Agreement (DPSA) in April 2009 with the National Oil and Gas Authority of Bahrain for further development of the Bahrain Field, which became effective in December 2009. Under this agreement, a joint operating company formed by Occidental and its partners serves as operator for the project.
In 2009, Occidental acquired various additional oil and gas properties in California and the Permian Basin for approximately $610 million in cash.
| Note 3 | Accounting and Disclosure Changes |
Recently Adopted Accounting and Disclosure Changes
Pursuant to a new rule issued by the Financial Accounting Standards Board, Occidental moved the Consolidated Statements of Comprehensive Income to consecutively follow the Consolidated Statements of Income. Occidental early adopted the rule, as permitted, in the fourth quarter of 2011.
Net carrying values of inventories valued under the LIFO method were approximately $176 million and $177 million at December 31, 2011 and 2010, respectively. Inventories in continuing operations consisted of the following:
| Balance at December 31, (in millions) | | 2011 | | 2010 | |
| Raw materials | | $ | 69 | | $ | 63 | |
| Materials and supplies | | | 443 | | | 414 | |
| Finished goods | | | 655 | | | 636 | |
| | | | 1,167 | | | 1,113 | |
| LIFO reserve | | | (98 | ) | | (72 | ) |
| Total | | $ | 1,069 | | $ | 1,041 | |
Long-term debt consisted of the following:
| | | | | | |
| Balance at December 31, (in millions) | | 2011 | | 2010 | |
| 4.10% senior notes due 2021 | | $ | 1,300 | | $ | 1,300 | |
| 1.75% senior notes due 2017 | | | 1,250 | | | ― | |
| 7.0% senior notes due 2013 | | | ― | | | 1,000 | |
| 3.125% senior notes due 2022 | | | 900 | | | ― | |
| 4.125% senior notes due 2016 | | | 750 | | | 750 | |
| 2.5% senior notes due 2016 | | | 700 | | | 700 | |
| 1.45% senior notes due 2013 | | | 600 | | | 600 | |
| 6.75% senior notes due 2012 | | | ― | | | 368 | |
| 8.45% senior notes due 2029 | | | 116 | | | 116 | |
| 9.25% senior debentures due 2019 | | | 116 | | | 116 | |
| 7.2% senior debentures due 2028 | | | 82 | | | 82 | |
| Variable rate bonds due 2030 (0.11% and 0.32% as of December 31, 2011 and 2010, respectively) | | | 68 | | | 68 | |
| 8.75% medium-term notes due 2023 | | | 22 | | | 22 | |
| | | | 5,904 | | | 5,122 | |
| Less: | | | | | | | |
| Unamortized discount, net | | | (33 | ) | | (11 | ) |
| Total | | $ | 5,871 | | $ | 5,111 | |
Occidental's available but unused committed bank credit was $2.0 billion at December 31, 2011. In October 2011, Occidental entered into a new five-year, $2.0 billion bank credit facility (2011 Credit Facility) which replaced its previous $1.4 billion bank credit facility (2006 Credit Facility), which was scheduled to expire in September 2012. The 2011 Credit Facility provides for the termination of the loan commitments and requires immediate repayment of any outstanding amounts if certain events of default occur or if Occidental files for bankruptcy. Up to $1.0 billion of the 2011 Credit Facility is available in the form of letters of credit. Occidental did not draw down any amounts under the 2011 Credit Facility or the 2006 Credit Facility during 2011.
The 2011 Credit Facility and other debt agreements do not contain material adverse change clauses or debt ratings triggers that could restrict Occidental's ability to borrow or permit the lenders to terminate their commitments or accelerate debt. Borrowings under the 2011 Credit Facility bear interest at various benchmark rates, including LIBOR, plus a margin based on Occidental's senior debt ratings. Additionally, Occidental paid prorated annual facility fees of 0.10 percent and 0.05 percent, respectively, in 2011 on the total commitment amounts of the 2011 Credit Facility and the 2006 Credit Facility based on Occidental's senior debt ratings.
In August 2011, Occidental issued $2.15 billion of debt, which comprised $1.25 billion of 1.75-percent senior unsecured notes due 2017 and $900 million of 3.125-percent senior unsecured notes due 2022. Occidental received net proceeds of approximately $2.1 billion. Interest on the notes will be payable semi-annually in arrears in February and August of each year for both series of notes.
In March 2011, Occidental redeemed all $1.0 billion of its outstanding 7-percent senior notes due 2013 and all $368 million of its outstanding 6.75-percent senior notes due 2012. Occidental recorded a $163 million pre-tax charge related to this redemption in the first quarter of 2011.
In December 2010, Occidental issued $2.6 billion of debt, which comprised $600 million of 1.45-percent senior unsecured notes due 2013, $700 million of 2.50-percent senior unsecured notes due 2016 and $1.3 billion of 4.10-percent senior unsecured notes due 2021. Occidental received net proceeds of approximately $2.6 billion. Interest on the notes will be payable semi-annually in arrears in June and December of each year for the 1.45-percent notes and February and August of each year for the other notes.
In July 2009, Occidental repaid its $600 million debt associated with Dolphin Energy's debt. Also, in July 2009, Dolphin Energy refinanced its debt on a limited-recourse basis. Occidental provided guarantees limited to certain political and other events. At December 31, 2011 and 2010, Occidental’s guarantees were not material and a substantial majority of the amounts consisted of limited recourse guarantees on $300 million of Dolphin’s debt, of which the fair value was immaterial.
At December 31, 2011, minimum principal payments on long-term debt subsequent to December 31, 2011 aggregated $5.9 billion, of which zero is due in 2012, $0.6 billion in 2013, zero in 2014, zero in 2015, $1.5 billion in 2016 and $3.8 billion in 2017 and thereafter.
As of December 31, 2011, under the most restrictive covenants of its financing agreements, Occidental had substantial capacity for additional unsecured borrowings, the payment of cash dividends and other distributions on, or acquisitions of, Occidental stock.
Occidental estimates the fair value of fixed-rate debt based on the quoted market prices for those instruments or on quoted market yields for similarly rated debt instruments, taking into account such instruments' maturities. The estimated fair values of Occidental’s debt at December 31, 2011 and 2010 were approximately $6.4 billion and $5.5 billion, respectively, compared to carrying values of approximately $5.9 billion and $5.1 billion, respectively. Occidental's exposure to changes in interest rates relates primarily to its variable-rate, long-term debt obligations, and is not material. As of December 31, 2011 and 2010, variable-rate debt constituted approximately one percent of Occidental's total debt.
Operating lease agreements include leases for transportation equipment, power plants, machinery, terminals, storage facilities, land and office space. Occidental’s operating lease agreements frequently include renewal or purchase options and require it to pay for utilities, taxes, insurance and maintenance expense. At December 31, 2011, future net minimum lease payments for noncancelable operating leases (excluding oil and gas and other mineral leases, utilities, taxes, insurance and maintenance expense) were the following:
| In millions | | | | Amount | (a) |
| 2012 | | | | | $ | 140 | |
| 2013 | | | | | | 102 | |
| 2014 | | | | | | 85 | |
| 2015 | | | | | | 91 | |
| 2016 | | | | | | 78 | |
| Thereafter | | | | | | 517 | |
| Total minimum lease payments | | | | | $ | 1,013 | |
| (a) | These amounts are net of sublease rentals of $11 million, which are to be received as follows (in millions): 2012—$4, 2013—$4, 2014—$3, 2015—zero and 2016—zero. | |
Rental expense for operating leases, net of sublease rental income for continuing operations, was $179 million in 2011, $170 million in 2010 and $170 million in 2009. Rental expense was net of sublease income of $4 million, $4 million and $4 million in 2011, 2010 and 2009, respectively.
Objective & Strategy
Through its marketing and trading activities and within its established policy controls and procedures, Occidental uses derivative instruments, including a combination of short-term futures, forwards, options and swaps, to improve realized prices for its oil and gas. Additionally, Occidental’s Phibro trading unit engages in trading activities using derivatives for the purpose of generating profits mainly from market price changes of commodities. In the past, Occidental has also used derivatives to reduce its exposure to price volatility on a small portion of its oil and gas production.
Refer to Note 1 for Occidental’s accounting policy on derivatives.
Cash-Flow Hedges
Throughout 2011 and 2010, Occidental held a series of collar agreements that qualified as cash-flow hedges for the sale of approximately 3 percent and 2 percent, respectively, of its oil production. These agreements were for existing domestic production and terminated as of December 31, 2011. The collar agreements hedged the sale of 12,000 barrels per day at a weighted-average strike price that ranged from $32.92 to $46.35.
In 2009, Occidental entered into financial swap agreements for the sale of a portion of its existing natural gas production from the Rocky Mountain region of the United States that qualify as cash-flow hedges. The following table presents the daily quantities and weighted-average prices that will be received by Occidental as of December 31, 2011 and 2010:
| Natural Gas Swaps | | Daily Volume (cubic feet) | | | Average Price |
January 2012 - March 2012 (a) | | 50 million | | | $6.07 |
| (a) | At December 31, 2010, these contracts were outstanding with the same daily volumes and terms indicated and also covered the period from January 1, 2011 to December 31, 2011. |
Occidental’s marketing and trading operations store natural gas purchased from third parties at Occidental’s North American leased storage facilities. Derivative instruments are used to fix margins on the future sales of the stored volumes. These derivative agreements continue through January 2013. As of December 31, 2011 and 2010, Occidental had approximately 25 billion cubic feet and 28 billion cubic feet of natural gas held in storage, respectively. As of December 31, 2011 and 2010, Occidental had cash-flow hedges for the forecast sale, to be settled by physical delivery, of approximately 35 billion cubic feet and 24 billion cubic feet of natural gas held in storage, respectively.
The following table presents the pre-tax gains and losses recognized in, and reclassified from, AOCI and recognized in income (net sales), including any hedge ineffectiveness, for derivative instruments classified as cash-flow hedges for the years ended December 31, 2011 and 2010 (in millions):
| | | 2011 | | 2010 | |
| Commodity Contracts – cash-flow hedges | | | | | | | |
| Unrealized gains recognized in AOCI | | $ | 20 | | $ | 55 | |
| Losses reclassified into income | | $ | 154 | | $ | 123 | |
| Gains recognized in income - ineffective portion | | $ | 1 | | $ | 2 | |
The following table summarizes net after-tax derivative activity recorded in AOCI for the years ended December 31, 2011 and 2010 (in millions):
| | | 2011 | | 2010 | |
| Beginning Balance - AOCI | | $ | (111 | ) | $ | (227 | ) |
| Unrealized gains recognized in AOCI | | | 14 | | | 37 | |
| Losses reclassified into income | | | 98 | | | 79 | |
| Ending Balance - AOCI | | $ | 1 | | $ | (111 | ) |
During the next twelve months, Occidental expects that approximately $14 million of net after-tax derivative gains included in AOCI will be reclassified into income based on their valuation as of December 31, 2011.
Derivatives Not Designated as Hedging Instruments
Occidental’s third-party marketing and trading activities focus on purchasing oil, NGLs and gas for resale from partners, producers and third parties whose oil and gas supply is located near its midstream and marketing assets, such as pipelines, processing plants and storage facilities. These purchases allow Occidental to aggregate volumes to maximize prices received for Occidental’s production. The third-party marketing and trading purchase and sales contracts generally approximate each other with respect to aggregate volumes and terms. In addition, Occidental’s Phibro trading unit's strategy is to profit from market price changes using derivatives not designated as hedging instruments.
The following table presents gross volumes of Occidental’s outstanding commodity derivatives contracts not designated as hedging instruments as of December 31, 2011 and 2010:
| Commodity | | Volumes | |
| | | 2011 | | 2010 | |
| Sales contracts related to Occidental's production | | | | | | | |
| Oil (million barrels) | | 9 | | | 8 | | |
| | | | | | | | |
| Third-party marketing and trading activities | | | | | | | |
| Purchase contracts | | | | | | | |
| Oil (million barrels) | | 109 | | | 136 | | |
| Natural gas (billion cubic feet) | | 481 | | | 833 | | |
| Precious metals (million troy ounces) | | 4 | | | 13 | | |
| | | | | | | | |
| Sales contracts | | | | | | | |
| Oil (million barrels) | | 109 | | | 144 | | |
| Natural gas (billion cubic feet) | | 723 | | | 1,156 | | |
| Precious metals (million troy ounces) | | 1 | | | 1 | | |
In addition, Occidental’s Phibro trading unit has certain other commodity trading contracts, including agricultural products, metals and electricity, as well as foreign exchange contracts, but these were not material to Occidental as of December 31, 2011 and 2010.
Occidental has oil sales contracts representing a small portion of Occidental's domestic oil production. Additionally, for third-party marketing and trading activities, a substantial portion of the sales contracts that exist at the end of a reporting period are typically fulfilled by offsetting purchase contracts that have substantially identical terms entered into within a short time. For a substantial portion of the sales commitments not satisfied by such contracts as of December 31, 2011, Occidental entered into offsetting contracts after December 31, 2011. Occidental believes it has the ability to fulfill any remaining portion through its equity production or through additional third-party purchases.
Approximately $1 million and $293 million of gains from derivatives not designated as hedging instruments were recognized in net sales for the years ended December 31, 2011 and 2010, respectively.
Fair Value of Derivatives
The following tables present the gross fair value of Occidental’s outstanding derivatives as of December 31, 2011 and 2010 (in millions):
| | | Asset Derivatives | | Fair | | Liability Derivatives | | Fair | |
| December 31, 2011 | | Balance Sheet Location | | Value | | Balance Sheet Location | | Value | |
Cash-flow hedges (a) | | | | | | | | | | | |
| | | Marketing and trading assets and other | | $ | 41 | | Accrued liabilities | | $ | 5 | |
| Commodity contracts | | Long-term receivables and other assets, net | | | 3 | | Deferred credits and other liabilities | | | ― | |
| | | | | $ | 44 | | | | $ | 5 | |
| | | | | | | | | | | | |
Derivatives not designated as hedging instruments (a) | | | | | | | | | | | |
| | | Marketing and trading assets and other | | $ | 835 | | Accrued liabilities | | $ | 887 | |
| Commodity contracts | | Long-term receivables and other assets, net | | | 71 | | Deferred credits and other liabilities | | | 71 | |
| | | | | | 906 | | | | | 958 | |
| Total gross fair value | | | | | 950 | | | | | 963 | |
Less: counterparty netting and cash collateral (b) | | | | | (755 | ) | | | | (779 | ) |
| Total net fair value of derivatives | | | | $ | 195 | | | | $ | 184 | |
| | | Asset Derivatives | | Fair | | Liability Derivatives | | Fair | |
| December 31, 2010 | | Balance Sheet Location | | Value | | Balance Sheet Location | | Value | |
Cash-flow hedges (a) | | | | | | | | | | | |
| | | Marketing and trading assets and other | | $ | 51 | | Accrued liabilities | | $ | 209 | |
| Commodity contracts | | Long-term receivables and other assets, net | | | 9 | | Deferred credits and other liabilities | | | ― | |
| | | | | $ | 60 | | | | $ | 209 | |
| | | | | | | | | | | | |
Derivatives not designated as hedging instruments (a) | | | | | | | | | | | |
| | | Marketing and trading assets and other | | $ | 829 | | Accrued liabilities | | $ | 823 | |
| Commodity contracts | | Long-term receivables and other assets, net | | | 86 | | Deferred credits and other liabilities | | | 85 | |
| | | | | | 915 | | | | | 908 | |
| Total gross fair value | | | | | 975 | | | | | 1,117 | |
Less: counterparty netting and cash collateral (c) | | | | | (680 | ) | | | | (736 | ) |
| Total net fair value of derivatives | | | | $ | 295 | | | | $ | 381 | |
(a) | Fair values are presented at gross amounts, including when the derivatives are subject to master netting arrangements and qualify for net presentation in the consolidated balance sheet. | |
| (b) | As of December 31, 2011, collateral received of $39 million has been netted against derivative assets and collateral paid of $63 million has been netted against derivative liabilities. | |
| (c) | As of December 31, 2010, collateral received of $39 million has been netted against derivative assets and collateral paid of $95 million has been netted against derivative liabilities. | |
See Note 15 for fair value measurement disclosures on derivatives.
Credit Risk
A substantial portion of Occidental’s derivative transaction volume is executed through exchange-traded contracts, which are subject to nominal credit risk as a significant portion of these transactions are executed on a daily margin basis. Collateral of $173 million and $154 million deposited by Occidental for such contracts with clearing houses and brokers, which has not been reflected in the derivative fair value tables, is included in the marketing and trading assets and other balance as of December 31, 2011 and 2010, respectively.
Occidental executes the rest of its derivative transactions in the OTC market. Occidental is subject to counterparty credit risk to the extent the counterparty to the derivatives is unable to meet its settlement commitments. Occidental manages this credit risk by selecting counterparties that it believes to be financially strong, by spreading the credit risk among many such counterparties, by entering into master netting arrangements with the counterparties and by requiring collateral, as appropriate. Occidental actively monitors the creditworthiness of each counterparty and records valuation adjustments to reflect counterparty risk, if necessary.
Certain of Occidental's OTC derivative instruments contain credit-risk-contingent features, primarily tied to credit ratings for Occidental or its counterparties, which may affect the amount of collateral that each would need to post. As of December 31, 2011 and 2010, Occidental had a net liability of $58 million and $234 million, respectively, for which the amount of collateral posted was $27 million and $10 million, respectively. Occidental believes that if it had received a one-notch reduction in its credit ratings, it would not have resulted in a material change in its collateral-posting requirements as of December 31, 2011 and 2010.
Foreign Currency Risk
Occidental’s foreign operations have currency risk. Occidental manages its exposure primarily by balancing monetary assets and liabilities and maintaining cash positions in foreign currencies only at levels necessary for operating purposes. Most international oil sales are denominated in United States dollars. Additionally, all of Occidental’s consolidated foreign oil and gas subsidiaries have the United States dollar as the functional currency.
| Note 8 | Environmental Liabilities and Expenditures |
Occidental’s operations are subject to stringent federal, state, local and foreign laws and regulations relating to improving or maintaining environmental quality. Occidental’s environmental compliance costs have generally increased over time and are expected to rise in the future. Occidental factors environmental expenditures for its operations into its business planning process as an integral part of producing quality products responsive to market demand.
Environmental Remediation
The laws that require or address environmental remediation, including CERCLA and similar federal, state, local and foreign laws, may apply retroactively and regardless of fault, the legality of the original activities or the current ownership or control of sites. OPC or certain of its subsidiaries participate in or actively monitor a range of remedial activities and government or private proceedings under these laws with respect to alleged past practices at operating, closed and third-party sites. Remedial activities may include one or more of the following: investigation involving sampling, modeling, risk assessment or monitoring; cleanup measures including removal, treatment or disposal; or operation and maintenance of remedial systems. The environmental proceedings seek funding or performance of remediation and, in some cases, compensation for alleged property damage, punitive damages, civil penalties, injunctive relief and government oversight costs.
As of December 31, 2011, Occidental participated in or monitored remedial activities or proceedings at 160 sites. The following table presents Occidental’s environmental remediation reserves as of December 31, 2011, 2010 and 2009, the current portion of which is included in accrued liabilities ($79 million in 2011, $79 million in 2010 and $84 million in 2009) and the remainder in deferred credits and other liabilities — other ($281 million in 2011, $287 million in 2010 and $319 million in 2009). The reserves are grouped as environmental remediation sites listed or proposed for listing by the U.S. Environmental Protection Agency on the CERCLA NPL (NPL sites) and three categories of non-NPL sites — third-party sites, Occidental-operated sites and closed or non-operated Occidental sites, as follows:
| $ amounts in millions | | 2011 | | 2010 | | 2009 | |
| | | Number of Sites | | Reserve Balance | | Number of Sites | | Reserve Balance | | Number of Sites | | Reserve Balance | |
| NPL sites | | 36 | | | $ | 63 | | | 38 | | | $ | 56 | | | 39 | | | $ | 57 | | |
| Third-party sites | | 73 | | | | 88 | | | 83 | | | | 91 | | | 81 | | | | 104 | | |
| Occidental-operated sites | | 22 | | | | 120 | | | 20 | | | | 122 | | | 19 | | | | 126 | | |
| Closed or non-operated Occidental sites | | 29 | | | | 89 | | | 29 | | | | 97 | | | 29 | | | | 116 | | |
| Total | | 160 | | | $ | 360 | | | 170 | | | $ | 366 | | | 168 | | | $ | 403 | | |
As of December 31, 2011, Occidental’s environmental reserves exceeded $10 million each at 10 of the 160 sites described above, and 107 of the sites had reserves from zero to $1 million each.
As of December 31, 2011, two landfills in western New York owned by Occidental accounted for 64 percent of its reserves associated with NPL sites. Maxus Energy Corporation has retained the liability and indemnified Occidental for 13 of the remaining NPL sites.
As of December 31, 2011, Maxus has also retained the liability and indemnified Occidental for 9 of the 73 third-party sites. Two of the remaining 64 third-party sites — a former copper mining and smelting operation in Tennessee and a containment and removal project in Tennessee — accounted for 44 percent of Occidental’s reserves associated with these sites.
Four sites — chemical plants in Kansas, Louisiana and New York and a group of oil and gas properties in the southwestern United States — accounted for 61 percent of the reserves associated with the Occidental-operated sites. Two other sites — a former chemical plant in Tennessee and a closed coal mine in Pennsylvania — accounted for 42 percent of the reserves associated with closed or non-operated Occidental sites.
The following table presents environmental reserve activity for the past three years:
| In millions | | 2011 | | 2010 | | 2009 | |
Balance — Beginning of Year | | $ | 366 | | $ | 403 | | $ | 439 | |
| Remediation expenses and interest accretion | | | 53 | | | 26 | | | 26 | |
| Changes from acquisitions/dispositions | | | 14 | | | 3 | | | 4 | |
| Payments | | | (73 | ) | | (66 | ) | | (66 | ) |
| Balance — End of Year | | $ | 360 | | $ | 366 | | $ | 403 | |
Occidental expects to expend funds corresponding to approximately half of the current environmental reserves over the next four years and the balance over the subsequent 10 or more years. Occidental believes its range of reasonably possible additional loss beyond those liabilities recorded for environmental remediation at the sites described above could be up to $375 million.
Environmental Costs
Occidental’s environmental costs, some of which include estimates, are presented below for each segment for the years ended December 31:
| In millions | | 2011 | | 2010 | | 2009 | |
| Operating Expenses | | | | | | | | | | |
| Oil and Gas | | $ | 158 | | $ | 108 | | $ | 110 | |
| Chemical | | | 68 | | | 72 | | | 67 | |
| Midstream and Marketing | | | 21 | | | 13 | | | 14 | |
| | | $ | 247 | | $ | 193 | | $ | 191 | |
| Capital Expenditures | | | | | | | | | | |
| Oil and Gas | | $ | 110 | | $ | 72 | | $ | 78 | |
| Chemical | | | 15 | | | 19 | | | 15 | |
| Midstream and Marketing | | | 15 | | | 13 | | | 4 | |
| | | $ | 140 | | $ | 104 | | $ | 97 | |
| Remediation Expenses | | | | | | | | | | |
| Corporate | | $ | 52 | | $ | 25 | | $ | 25 | |
Operating expenses are incurred on a continual basis. Capital expenditures relate to longer-lived improvements in currently operating properties. Remediation expenses relate to existing conditions from past operations.
| Note 9 | Lawsuits, Claims, Commitments and Other Contingencies |
OPC or certain of its subsidiaries are named, in the normal course of business, in lawsuits, claims and other legal proceedings that seek, among other things, compensation for alleged personal injury, breach of contract, property damage, punitive damages, civil penalties or other losses, or injunctive or declaratory relief. OPC or certain of its subsidiaries also have been named in proceedings under CERCLA and similar federal, state, local and foreign environmental laws. These environmental proceedings seek funding or performance of remediation and, in some cases, compensation for alleged property damage, punitive damages, civil penalties and injunctive relief; however, Occidental or such subsidiaries are usually among many companies in these proceedings and have to date been successful in sharing response costs with other financially sound companies. Occidental accrues reserves for currently outstanding lawsuits, claims and proceedings when it is probable that a liability has been incurred and the liability can be reasonably estimated. Occidental has disclosed its reserve balances for environmental matters. Reserve balances for other matters as of December 31, 2011 and 2010, were not material to Occidental's consolidated balance sheets. Occidental also evaluates the amount of reasonably possible losses that it could incur as a result of the matters mentioned above. Occidental has disclosed its range of reasonably possible additional losses for sites where it is a participant in environmental remediation. Occidental believes that other reasonably possible losses that it could incur in excess of reserves accrued on the balance sheet would not be material to its consolidated financial position or results of operations.
During the course of its operations, Occidental is subject to audit by tax authorities for varying periods in various federal, state, local and foreign tax jurisdictions. While the audits of corporate tax returns for taxable years through 2009 have concluded for United States federal income tax purposes, the 2010 and 2011 taxable years are currently under review by the United States Internal Revenue Service pursuant to its Compliance Assurance Program. Taxable years from 2000 through the current year remain subject to examination by foreign and state government tax authorities in certain jurisdictions. In certain of these jurisdictions, tax authorities are in various stages of auditing Occidental’s income taxes. During the course of tax audits, disputes have arisen and other disputes may arise as to facts and matters of law. Occidental believes that the resolution of outstanding tax matters would not have a material adverse effect on its consolidated financial position or results of operations.
OPC, its subsidiaries or both have entered into agreements providing for future payments to secure terminal and pipeline capacity, drilling rigs and services, electrical power, steam and certain chemical raw materials. Occidental has certain other commitments under contracts, guarantees and joint ventures, including purchase commitments for goods and services at market-related prices and certain other contingent liabilities. At December 31, 2011, total purchase obligations were $7.9 billion, which included approximately $2.7 billion, $1.3 billion, $700 million, $450 million and $300 million that will be paid in 2012, 2013, 2014, 2015 and 2016, respectively. Included in the purchase obligations are commitments for major fixed and determinable capital expenditures during 2012 and thereafter, which were approximately $2.0 billion.
OPC, its subsidiaries or both have indemnified various parties against specified liabilities those parties might incur in the future in connection with purchases and other transactions that they have entered into with Occidental. These indemnities usually are contingent upon the other party incurring liabilities that reach specified thresholds. As of December 31, 2011, Occidental is not aware of circumstances that it believes would reasonably be expected to lead to future indemnity claims against it in connection with these transactions that would result in payments materially in excess of reserves.
| Note 10 | Domestic and Foreign Income Taxes |
The domestic and foreign components of income from continuing operations before domestic and foreign income taxes and net of noncontrolling interest amounts were as follows:
| For the years ended December 31, (in millions) | | Domestic | | Foreign | | Total | |
| 2011 | | $ | 4,806 | | $ | 6,035 | | $ | 10,841 | |
| 2010 | | $ | 3,295 | | $ | 4,269 | | $ | 7,564 | |
| 2009 | | $ | 2,091 | | $ | 3,123 | | $ | 5,214 | |
The provisions for domestic and foreign income taxes on continuing operations consisted of the following:
| For the years ended December 31, (in millions) | | U.S. Federal | | State and Local | | Foreign | | Total | |
| 2011 | | | | | | | | | | | | | |
| Current | | $ | 320 | | $ | 88 | | $ | 2,357 | | $ | 2,765 | |
| Deferred | | | 1,340 | | | 47 | | | 49 | | | 1,436 | |
| | | $ | 1,660 | | $ | 135 | | $ | 2,406 | | $ | 4,201 | |
| 2010 | | | | | | | | | | | | | |
| Current | | $ | 614 | | $ | 79 | | $ | 1,896 | | $ | 2,589 | |
| Deferred | | | 390 | | | 4 | | | 12 | | | 406 | |
| | | $ | 1,004 | | $ | 83 | | $ | 1,908 | | $ | 2,995 | |
| 2009 | | | | | | | | | | | | | |
| Current | | $ | 16 | | $ | 27 | | $ | 1,361 | | $ | 1,404 | |
| Deferred | | | 606 | | | 37 | | | 16 | | | 659 | |
| | | $ | 622 | | $ | 64 | | $ | 1,377 | | $ | 2,063 | |
The following reconciliation of the United States statutory federal income tax rate to Occidental’s effective tax rate on income from continuing operations is stated as a percentage of pre-tax income:
| For the years ended December 31, | | | 2011 | | | 2010 | | | 2009 | |
| United States federal statutory tax rate | | | 35 | % | | | 35 | % | | | 35 | % | |
| Operations outside the United States | | | 4 | | | | 5 | | | | 5 | | |
| State income taxes, net of federal benefit | | | 1 | | | | 1 | | | | 1 | | |
| Other | | | (1 | ) | | | (1 | ) | | | (1 | ) | |
| Tax rate provided by Occidental | | | 39 | % | | | 40 | % | | | 40 | % | |
The tax effects of temporary differences resulting in deferred income taxes at December 31, 2011 and 2010 were as follows:
| | | | 2011 | | | 2010 | |
| | | Deferred | | Deferred | | Deferred | | Deferred | |
| Tax effects of temporary differences (in millions) | | Tax Assets | | Tax Liabilities | | Tax Assets | | Tax Liabilities | |
| Property, plant and equipment differences | | $ | ― | | $ | 6,039 | | $ | ― | | $ | 4,558 | |
| Equity investments, partnerships and foreign subsidiaries | | | ― | | | 351 | | | ― | | | 208 | |
| Environmental reserves | | | 131 | | | ― | | | 135 | | | ― | |
| Postretirement benefit accruals | | | 410 | | | ― | | | 368 | | | ― | |
| Deferred compensation and benefits | | | 286 | | | ― | | | 275 | | | ― | |
| Asset retirement obligations | | | 318 | | | ― | | | 242 | | | ― | |
| Foreign tax credit carryforwards | | | 1,240 | | | ― | | | 718 | | | ― | |
| Federal benefit of state income taxes | | | 104 | | | ― | | | 88 | | | ― | |
| All other | | | 374 | | | 116 | | | 442 | | | 131 | |
| Subtotal | | | 2,863 | | | 6,506 | | | 2,268 | | | 4,897 | |
| Valuation allowance | | | (1,003 | ) | | ― | | | (486 | ) | | ― | |
| Total deferred taxes | | $ | 1,860 | | $ | 6,506 | | $ | 1,782 | | $ | 4,897 | |
Included in total deferred tax assets was a current portion aggregating $200 million and $330 million as of December 31, 2011 and 2010, respectively, that was reported in prepaid expenses and other. Total deferred tax assets were $1.9 billion and $1.8 billion as of December 31, 2011 and 2010, respectively, the noncurrent portion of which is netted against deferred tax liabilities. Occidental expects to realize the recorded deferred tax assets, net of any allowances, through future operating income and reversal of temporary differences.
Occidental has, as of December 31, 2011, foreign tax credit carryforwards of $1.2 billion, which expire in varying amounts through 2021, and various state operating loss carryforwards, which have varying carryforward periods through 2025. Substantially all of Occidental's valuation allowance is provided for foreign tax credit and state operating loss carryforwards.
A deferred tax liability has not been recognized for temporary differences related to unremitted earnings of certain consolidated foreign subsidiaries aggregating approximately $5.5 billion at December 31, 2011, as it is Occidental’s intention, generally, to reinvest such earnings permanently. If the earnings of these foreign subsidiaries were not indefinitely reinvested, an additional deferred tax liability of approximately $88 million would be required, assuming utilization of available foreign tax credits.
Discontinued operations include income tax charges of $86 million in 2011, and income tax benefits of $26 million in 2010 and $147 million in 2009.
Additional paid-in capital was credited $14 million in 2011, $22 million in 2010 and $24 million in 2009 for an excess tax benefit from the exercise of certain stock-based compensation awards.
As of December 31, 2011, Occidental had liabilities for unrecognized tax benefits of approximately $67 million included in deferred credits and other liabilities – other, all of which, if subsequently recognized, would favorably affect Occidental’s effective tax rate.
A reconciliation of the beginning and ending amount of unrecognized tax benefits is as follows: