EXHIBIT 99.3
Investor Relations Supplemental Schedules
| Investor Relations Supplemental Schedules |
| Summary |
| ($ Millions) |
| | | | | | |
| | | | | | |
| | | | | | |
| | | | | | |
| | | 2Q 2010 | | | 2Q 2009 |
| | | | | | |
| Reported Net Income | | $1,063 | | | $682 |
| EPS - Diluted | | $1.31 | | | $0.84 |
| | | | | | |
| Core Results | | $1,069 | | | $689 |
| EPS - Diluted | | $1.31 | | | $0.85 |
| | | | | | |
| Total Worldwide Sales Volumes (mboe/day) | | 747 | | | 719 |
| | | | | | |
| Total Worldwide Crude Oil Realizations ($/BBL) | | $72.13 | | | $52.97 |
| Domestic Natural Gas Realizations ($/MCF) | | $4.19 | | | $2.87 |
| | | | | | |
| Wtd. Average Basic Shares O/S (mm) | | 812.6 | | | 811.0 |
| Wtd. Average Diluted Shares O/S (mm) | | 813.8 | | | 814.0 |
| | | | | | |
| | | | | | |
| | | YTD 2010 | | | YTD 2009 |
| | | | | | |
| Reported Net Income | | $2,127 | | | $1,050 |
| EPS - Diluted | | $2.61 | | | $1.29 |
| | | | | | |
| Core Results | | $2,140 | | | $1,096 |
| EPS - Diluted | | $2.63 | | | $1.34 |
| | | | | | |
| Total Worldwide Sales Volumes (mboe/day) | | 737 | | | 716 |
| | | | | | |
| Total Worldwide Crude Oil Realizations ($/BBL) | | $72.01 | | | $46.05 |
| Domestic Natural Gas Realizations ($/MCF) | | $4.90 | | | $3.20 |
| | | | | | |
| Wtd. Average Basic Shares O/S (mm) | | 812.3 | | | 810.8 |
| Wtd. Average Diluted Shares O/S (mm) | | 813.7 | | | 813.7 |
| | | | | | |
| Shares Outstanding (mm) | | 812.2 | | | 810.8 |
| | | | | | |
| Cash Flow from Operations | $ | 4,300 | | $ | 2,200 |
Investor Relations Supplemental Schedules
| OCCIDENTAL PETROLEUM |
| 2010 Second Quarter |
| Net Income (Loss) |
| ($ millions) |
| | | | | | | | | | | | | | | |
| | | | | | | | | | | | | | | |
| | Reported | | | | | | | | | Core |
| | Income | | Significant Items Affecting Income | | Results |
| Oil & Gas | $ | 1,853 | | | | | | | | | | $ | 1,853 | |
| | | | | | | | | | | | | | | |
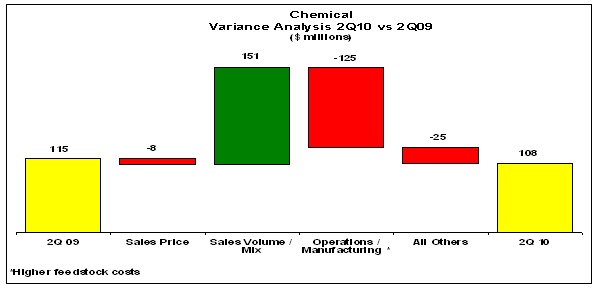
| Chemical | | 108 | | | | | | | | | | | 108 | |
| | | | | | | | | | | | | | | |
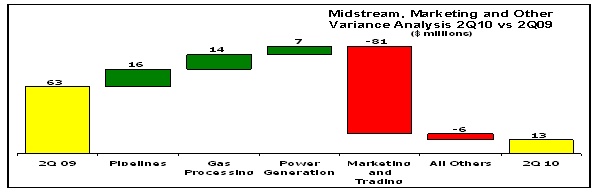
| Midstream, marketing and other | | 13 | | | | | | | | | | | 13 | |
| | | | | | | | | | | | | | | |
| Corporate | | | | | | | | | | | | | | |
| Interest expense, net | | (22 | ) | | | | | | | | | | (22 | ) |
| | | | | | | | | | | | | | | |
| Other | | (83 | ) | | | | | | | | | | (83 | ) |
| | | | | | | | | | | | | | | |
| Taxes | | (800 | ) | | | | | | | | | | (800 | ) |
| | | | | | | | | | | | | | | |
| Income from continuing operations | | 1,069 | | | | - | | | | | | | 1,069 | |
| Discontinued operations, net of tax | | (6 | ) | | | 6 | | | Discontinued operations, net | | | | - | |
| Net Income | $ | 1,063 | | | $ | 6 | | | | | | $ | 1,069 | |
| | | | | | | | | | | | | | | |
| | | | | | | | | | | | | | | |
| Basic Earnings Per Common Share | | | | | | | | | | | | | | |
| Income from continuing operations | $ | 1.31 | | | | | | | | | | | | |
| Discontinued operations, net | | - | | | | | | | | | | | | |
| Net Income | $ | 1.31 | | | | | | | | | | $ | 1.31 | |
| | | | | | | | | | | | | | | |
| Diluted Earnings Per Common Share | | | | | | | | | | | | | | |
| Income from continuing operations | $ | 1.31 | | | | | | | | | | | | |
| Discontinued operations, net | | - | | | | | | | | | | | | |
| Net Income | $ | 1.31 | | | | | | | | | | $ | 1.31 | |
Investor Relations Supplemental Schedules
| OCCIDENTAL PETROLEUM |
| 2009 Second Quarter |
| Net Income (Loss) |
| ($ millions) |
| | | | | | | | | | | | | | | |
| | | | | | | | | | | | | | | |
| | Reported | | | | | | | | | Core |
| | Income | | Significant Items Affecting Income | | Results |
| Oil & Gas | $ | 1,083 | | | | | | | | | | $ | 1,083 | |
| | | | | | | | | | | | | | | |
| | | | | | | | | | | | | | | |
| Chemical | | 115 | | | | | | | | | | | 115 | |
| | | | | | | | | | | | | | | |
| Midstream, marketing and other | | 63 | | | | | | | | | | | 63 | |
| | | | | | | | | | | | | | | |
| Corporate | | | | | | | | | | | | | | |
| Interest expense, net | | (23 | ) | | | | | | | | | | (23 | ) |
| | | | | | | | | | | | | | | |
| Other | | (99 | ) | | | 8 | | | Severance | | | | (91 | ) |
| | | | | | | | | | | | | | | |
| Taxes | | (455 | ) | | | (3 | ) | | Tax effect of adjustments | | | | (458 | ) |
| | | | | | | | | | | | | | | |
| Income from continuing operations | | 684 | | | | 5 | | | | | | | 689 | |
| Discontinued operations, net of tax | | (2 | ) | | | 2 | | | Discontinued operations, net | | | | - | |
| Net Income | $ | 682 | | | $ | 7 | | | | | | $ | 689 | |
| | | | | | | | | | | | | | | |
| | | | | | | | | | | | | | | |
| Basic Earnings Per Common Share | | | | | | | | | | | | | | |
| Income from continuing operations | $ | 0.84 | | | | | | | | | | | | |
| Discontinued operations, net | | - | | | | | | | | | | | | |
| Net Income | $ | 0.84 | | | | | | | | | | $ | 0.85 | |
| Diluted Earnings Per Common Share | | | | | | | | | | | | | | |
| Income from continuing operations | $ | 0.84 | | | | | | | | | | | | |
| Discontinued operations, net | | - | | | | | | | | | | | | |
| Net Income | $ | 0.84 | | | | | | | | | | $ | 0.85 | |
Investor Relations Supplemental Schedules
| OCCIDENTAL PETROLEUM |
| 2010 First Six Months |
| Net Income (Loss) |
| ($ millions) |
| | | | | | | | | | | | | | | |
| | | | | | | | | | | | | | | |
| | Reported | | | | | | | | | Core |
| | Income | | Significant Items Affecting Income | | Results |
| Oil & Gas | $ | 3,672 | | | | | | | | | | $ | 3,672 | |
| | | | | | | | | | | | | | | |
| Chemical | | 138 | | | | | | | | | | | 138 | |
| | | | | | | | | | | | | | | |
| Midstream, marketing and other | | 107 | | | | | | | | | | | 107 | |
| | | | | | | | | | | | | | | |
| Corporate | | | | | | | | | | | | | | |
| Interest expense, net | | (58 | ) | | | | | | | | | | (58 | ) |
| | | | | | | | | | | | | | | |
| Other | | (190 | ) | | | | | | | | | | (190 | ) |
| | | | | | | | | | | | | | | |
| Taxes | | (1,529 | ) | | | | | | | | | | (1,529 | ) |
| | | | | | | | | | | | | | | |
| Income from continuing operations | | 2,140 | | | | - | | | | | | | 2,140 | |
| Discontinued operations, net of tax | | (13 | ) | | | 13 | | | Discontinued operations, net | | | | - | |
| Net Income | $ | 2,127 | | | $ | 13 | | | | | | $ | 2,140 | |
| | | | | | | | | | | | | | | |
| | | | | | | | | | | | | | | |
| Basic Earnings Per Common Share | | | | | | | | | | | | | | |
| Income from continuing operations | $ | 2.63 | | | | | | | | | | | | |
| Discontinued operations, net | | (0.02 | ) | | | | | | | | | | | |
| Net Income | $ | 2.61 | | | | | | | | | | $ | 2.63 | |
| | | | | | | | | | | | | | | |
| Diluted Earnings Per Common Share | | | | | | | | | | | | | | |
| Income from continuing operations | $ | 2.63 | | | | | | | | | | | | |
| Discontinued operations, net | | (0.02 | ) | | | | | | | | | | | |
| Net Income | $ | 2.61 | | | | | | | | | | $ | 2.63 | |
Investor Relations Supplemental Schedules
| OCCIDENTAL PETROLEUM |
| 2009 First Six Months |
| Net Income (Loss) |
| ($ millions) |
| | | | | | | | | | | | | | | |
| | | | | | | | | | | | | | | |
| | Reported | | | | | | | | | Core |
| | Income | | Significant Items Affecting Income | | Results |
| Oil & Gas | $ | 1,628 | | | $ | 8 | | | Rig contract terminations | | | $ | 1,636 | |
| | | | | | | | | | | | | | | |
| Chemical | | 284 | | | | | | | | | | | 284 | |
| | | | | | | | | | | | | | | |
| Midstream, marketing and other | | 77 | | | | | | | | | | | 77 | |
| | | | | | | | | | | | | | | |
| Corporate | | | | | | | | | | | | | | |
| Interest expense, net | | (43 | ) | | | | | | | | | | (43 | ) |
| | | | | | | | | | | | | | | |
| Other | | (195 | ) | | | 40 | | | Severance | | | | (140 | ) |
| | | | | | | 15 | | | Railcar leases | | | | | |
| | | | | | | | | | | | | | | |
| Taxes | | (696 | ) | | | (22 | ) | | Tax effect of adjustments | | | | (718 | ) |
| | | | | | | | | | | | | | | |
| Income from continuing operations | | 1,055 | | | | 41 | | | | | | | 1,096 | |
| Discontinued operations, net of tax | | (5 | ) | | | 5 | | | Discontinued operations, net | | | | - | |
| Net Income | $ | 1,050 | | | $ | 46 | | | | | | $ | 1,096 | |
| | | | | | | | | | | | | | | |
| | | | | | | | | | | | | | | |
| Basic Earnings Per Common Share | | | | | | | | | | | | | | |
| Income from continuing operations | $ | 1.30 | | | | | | | | | | | | |
| Discontinued operations, net | | (0.01 | ) | | | | | | | | | | | |
| Net Income | $ | 1.29 | | | | | | | | | | $ | 1.35 | |
| Diluted Earnings Per Common Share | | | | | | | | | | | | | | |
| Income from continuing operations | $ | 1.30 | | | | | | | | | | | | |
| Discontinued operations, net | | (0.01 | ) | | | | | | | | | | | |
| Net Income | $ | 1.29 | | | | | | | | | | $ | 1.34 | |
Investor Relations Supplemental Schedules
| OCCIDENTAL PETROLEUM |
| Items Affecting Comparability of Core Results Between Periods |
| | | | | | | | | | | | |
| The item(s) below are included in core results and are shown in this table | | |
| because they affect the comparability between periods. | | | | | | | |
| | | | | | | | | | | | |
| Pre-tax | | | | | | | | | | | |
| Income / (Expense) | Second Quarter | | Six Months |
| | 2010 | | 2009 | | 2010 | | 2009 |
| | | | | | | | | | | | |
| Foreign Exchange Gains & (Losses) * | 4 | | | (6 | ) | | (1 | ) | | 31 | |
| | | | | | | | | | | | |
| *Amounts shown after-tax | | | | | | | | | | | |
Investor Relations Supplemental Schedules

| OCCIDENTAL PETROLEUM | | | | | | |
| Worldwide Effective Tax Rate | | | | | | |
| | | | | | | | | | | | | | | |
| | QUARTERLY | | YEAR-TO-DATE |
| | 2010 | | 2010 | | 2009 | | 2010 | | 2009 |
| REPORTED INCOME | QTR 2 | | QTR 1 | | QTR 2 | | 6 Months | | 6 Months |
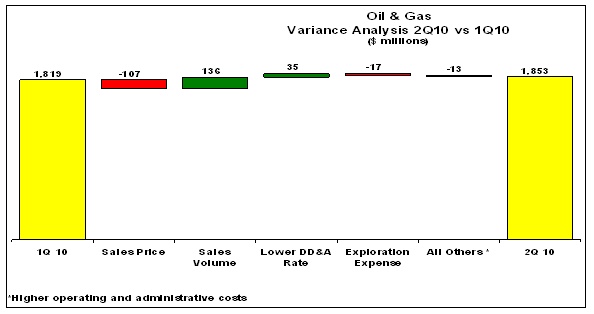
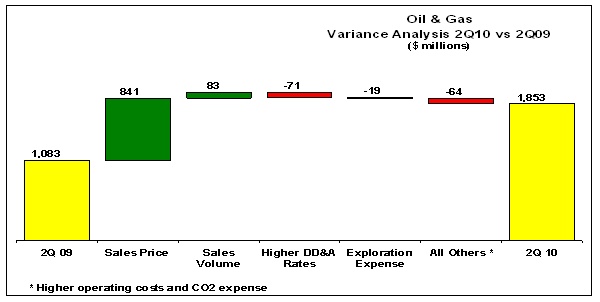
| Oil & Gas | 1,853 | | | 1,819 | | | 1,083 | | | 3,672 | | | 1,628 | |
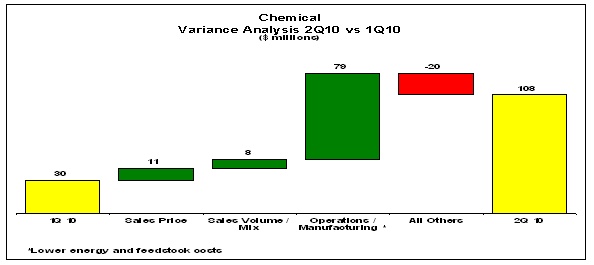
| Chemicals | 108 | | | 30 | | | 115 | | | 138 | | | 284 | |
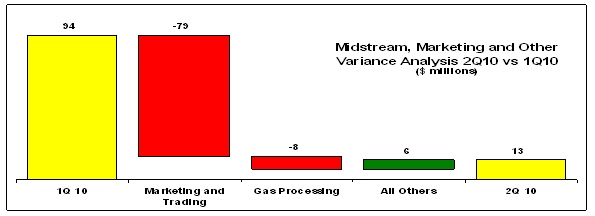
| Midstream, marketing and other | 13 | | | 94 | | | 63 | | | 107 | | | 77 | |
| Corporate & other | (105 | ) | | (143 | ) | | (122 | ) | | (248 | ) | | (238 | ) |
| Pre-tax income | 1,869 | | | 1,800 | | | 1,139 | | | 3,669 | | | 1,751 | |
| | | | | | | | | | | | | | | |
| Income tax expense | | | | | | | | | | | | | | |
| Federal and state | 329 | | | 307 | | | 148 | | | 636 | | | 160 | |
| Foreign | 471 | | | 422 | | | 307 | | | 893 | | | 536 | |
| Total | 800 | | | 729 | | | 455 | | | 1,529 | | | 696 | |
| | | | | | | | | | | | | | | |
| Income from continuing operations | 1,069 | | | 1,071 | | | 684 | | | 2,140 | | | 1,055 | |
| | | | | | | | | | | | | | | |
| Worldwide effective tax rate | 43% | | 41% | | 40% | | 42% | | 40% |
| | | | | | | | | | | | | | | |
| | | | | | | | | | | | | | | |
| | 2010 | | 2010 | | 2009 | | 2010 | | 2009 |
| CORE RESULTS | QTR 2 | | QTR 1 | | QTR 2 | | 6 Months | | 6 Months |
| Oil & Gas | 1,853 | | | 1,819 | | | 1,083 | | | 3,672 | | | 1,636 | |
| Chemicals | 108 | | | 30 | | | 115 | | | 138 | | | 284 | |
| Midstream, marketing and other | 13 | | | 94 | | | 63 | | | 107 | | | 77 | |
| Corporate & other | (105 | ) | | (143 | ) | | (114 | ) | | (248 | ) | | (183 | ) |
| Pre-tax income | 1,869 | | | 1,800 | | | 1,147 | | | 3,669 | | | 1,814 | |
| | | | | | | | | | | | | | | |
| Income tax expense | | | | | | | | | | | | | | |
| Federal and state | 329 | | | 307 | | | 151 | | | 636 | | | 182 | |
| Foreign | 471 | | | 422 | | | 307 | | | 893 | | | 536 | |
| Total | 800 | | | 729 | | | 458 | | | 1,529 | | | 718 | |
| | | | | | | | | | | | | | | |
| Core results | 1,069 | | | 1,071 | | | 689 | | | 2,140 | | | 1,096 | |
| | | | | | | | | | | | | | | |
| Worldwide effective tax rate | 43% | | 41% | | 40% | | 42% | | 40% |
Investor Relations Supplemental Schedules
| OCCIDENTAL PETROLEUM |
| 2010 Second Quarter Net Income (Loss) |
| Reported Income Comparison |
| | | | | | | | | | | | | |
| | | Second | | First | | | | |
| | | Quarter | | Quarter | | | | |
| | | 2010 | | 2010 | | B / (W) |
| Oil & Gas | | $ | 1,853 | | | $ | 1,819 | | | $ | 34 | |
| Chemical | | | 108 | | | | 30 | | | | 78 | |
| Midstream, marketing and other | | | 13 | | | | 94 | | | | (81 | ) |
| Corporate | | | | | | | | | | | | |
| Interest expense, net | | | (22 | ) | | | (36 | ) | | | 14 | |
| Other | | | (83 | ) | | | (107 | ) | | | 24 | |
| Taxes | | | (800 | ) | | | (729 | ) | | | (71 | ) |
| Income from continuing operations | | | 1,069 | | | | 1,071 | | | | (2 | ) |
| Discontinued operations, net | | | (6 | ) | | | (7 | ) | | | 1 | |
| Net Income | | $ | 1,063 | | | $ | 1,064 | | | $ | (1 | ) |
| | | | | | | | | | | | | |
| Earnings Per Common Share | | | | | | | | | | | | |
| Basic | | $ | 1.31 | | | $ | 1.31 | | | $ | - | |
| Diluted | | $ | 1.31 | | | $ | 1.31 | | | $ | - | |
| | | | | | | | | | | | | |
| | | | | | | | | | | | | |
| Worldwide Effective Tax Rate | | | 43% | | | 41% | | | -2% |
| | | | | | | | | | | | | |
| | | | | | | | | | | | | |
| | | | | | | | | | | | | |
| OCCIDENTAL PETROLEUM |
| 2010 Second Quarter Net Income (Loss) |
| Core Results Comparison |
| | | | | | | | | | | | | |
| | | Second | | First | | | | |
| | | Quarter | | Quarter | | | | |
| | | 2010 | | 2010 | | B / (W) |
| Oil & Gas | | $ | 1,853 | | | $ | 1,819 | | | $ | 34 | |
| Chemical | | | 108 | | | | 30 | | | | 78 | |
| Midstream, marketing and other | | | 13 | | | | 94 | | | | (81 | ) |
| Corporate | | | | | | | | | | | | |
| Interest expense, net | | | (22 | ) | | | (36 | ) | | | 14 | |
| Other | | | (83 | ) | | | (107 | ) | | | 24 | |
| Taxes | | | (800 | ) | | | (729 | ) | | | (71 | ) |
| Core Results | | $ | 1,069 | | | $ | 1,071 | | | $ | (2 | ) |
| | | | | | | | | | | | | |
| Core Results Per Common Share | | | | | | | | | | | | |
| Basic | | $ | 1.31 | | | $ | 1.32 | | | $ | (0.01 | ) |
| Diluted | | $ | 1.31 | | | $ | 1.32 | | | $ | (0.01 | ) |
| | | | | | | | | | | | | |
| Worldwide Effective Tax Rate | | | 43% | | | 41% | | | -2% |
Investor Relations Supplemental Schedules
Investor Relations Supplemental Schedules
| OCCIDENTAL PETROLEUM |
| 2010 Second Quarter Net Income (Loss) |
| Reported Income Comparison |
| | | | | | | | | | | | | |
| | | Second | | Second | | | | |
| | | Quarter | | Quarter | | | | |
| | | 2010 | | 2009 | | B / (W) |
| Oil & Gas | | $ | 1,853 | | | $ | 1,083 | | | $ | 770 | |
| Chemical | | | 108 | | | | 115 | | | | (7 | ) |
| Midstream, marketing and other | | | 13 | | | | 63 | | | | (50 | ) |
| Corporate | | | | | | | | | | | | |
| Interest expense, net | | | (22 | ) | | | (23 | ) | | | 1 | |
| Other | | | (83 | ) | | | (99 | ) | | | 16 | |
| Taxes | | | (800 | ) | | | (455 | ) | | | (345 | ) |
| Income from continuing operations | | | 1,069 | | | | 684 | | | | 385 | |
| Discontinued operations, net | | | (6 | ) | | | (2 | ) | | | (4 | ) |
| Net Income | | $ | 1,063 | | | $ | 682 | | | $ | 381 | |
| | | | | | | | | | | | | |
| Earnings Per Common Share | | | | | | | | | | | | |
| Basic | | $ | 1.31 | | | $ | 0.84 | | | $ | 0.47 | |
| Diluted | | $ | 1.31 | | | $ | 0.84 | | | $ | 0.47 | |
| | | | | | | | | | | | | |
| | | | | | | | | | | | | |
| Worldwide Effective Tax Rate | | | 43% | | | 40% | | | -3% |
| | | | | | | | | | | | | |
| | | | | | | | | | | | | |
| | | | | | | | | | | | | |
| OCCIDENTAL PETROLEUM |
| 2010 Second Quarter Net Income (Loss) |
| Core Results Comparison |
| | | | | | | | | | | | | |
| | | Second | | Second | | | | |
| | | Quarter | | Quarter | | | | |
| | | 2010 | | 2009 | | B / (W) |
| Oil & Gas | | $ | 1,853 | | | $ | 1,083 | | | $ | 770 | |
| Chemical | | | 108 | | | | 115 | | | | (7 | ) |
| Midstream, marketing and other | | | 13 | | | | 63 | | | | (50 | ) |
| Corporate | | | | | | | | | | | | |
| Interest expense, net | | | (22 | ) | | | (23 | ) | | | 1 | |
| Other | | | (83 | ) | | | (91 | ) | | | 8 | |
| Taxes | | | (800 | ) | | | (458 | ) | | | (342 | ) |
| Core Results | | $ | 1,069 | | | $ | 689 | | | $ | 380 | |
| | | | | | | | | | | | | |
| Core Results Per Common Share | | | | | | | | | | | | |
| Basic | | $ | 1.31 | | | $ | 0.85 | | | $ | 0.46 | |
| Diluted | | $ | 1.31 | | | $ | 0.85 | | | $ | 0.46 | |
| | | | | | | | | | | | | |
| Worldwide Effective Tax Rate | | | 43% | | | 40% | | | -3% |
Investor Relations Supplemental Schedules
Investor Relations Supplemental Schedules
|
| SUMMARY OF OPERATING STATISTICS |
| | | | | | | | | | | | |
| | | | Second Quarter | | | Six Months |
| | | | 2010 | | 2009 | | | 2010 | | 2009 |
| NET SALES VOLUMES PER DAY: | | | | | | | | | | | | | | |
| United States | | | | | | | | | | | | | | |
| Crude Oil and Liquids (MBBL) | | | | | | | | | | | | | | |
| | California | | 92 | | | 90 | | | | 93 | | | 93 | |
| | Permian | | 159 | | | 163 | | | | 159 | | | 165 | |
| | Midcontinent Gas | | 18 | | | 14 | | | | 17 | | | 13 | |
| | Total | | 269 | | | 267 | | | | 269 | | | 271 | |
| Natural Gas (MMCF) | | | | | | | | | | | | | | |
| | California | | 293 | | | 232 | | | | 294 | | | 224 | |
| | Permian | | 129 | | | 124 | | | | 127 | | | 124 | |
| | Midcontinent Gas | | 259 | | | 265 | | | | 257 | | | 273 | |
| | Total | | 681 | | | 621 | | | | 678 | | | 621 | |
| Latin America | | | | | | | | | | | | | | |
| Crude Oil (MBBL) | | | | | | | | | | | | | | |
| | Argentina | | 37 | | | 37 | | | | 37 | | | 41 | |
| | Colombia | | 27 | | | 42 | | | | 30 | | | 41 | |
| | Total | | 64 | | | 79 | | | | 67 | | | 82 | |
| Natural Gas (MMCF) | | | | | | | | | | | | | | |
| | Argentina | | 32 | | | 30 | | | | 32 | | | 32 | |
| | Bolivia | | 15 | | | 19 | | | | 13 | | | 17 | |
| | Total | | 47 | | | 49 | | | | 45 | | | 49 | |
| Middle East / North Africa | | | | | | | | | | | | | | |
| Crude Oil and Liquids (MBBL) | | | | | | | | | | | | | | |
| | Bahrain | | 3 | | | - | | | | 3 | | | - | |
| | Dolphin | | 23 | | | 29 | | | | 23 | | | 26 | |
| | Libya | | 25 | | | 14 | | | | 14 | | | 10 | |
| | Oman | | 58 | | | 49 | | | | 57 | | | 48 | |
| | Qatar | | 78 | | | 82 | | | | 76 | | | 79 | |
| | Yemen | | 32 | | | 32 | | | | 33 | | | 37 | |
| | Total | | 219 | | | 206 | | | | 206 | | | 200 | |
| Natural Gas (MMCF) | | | | | | | | | | | | | | |
| | Bahrain | | 161 | | | - | | | | 163 | | | - | |
| | Dolphin | | 235 | | | 282 | | | | 232 | | | 257 | |
| | Oman | | 48 | | | 50 | | | | 50 | | | 52 | |
| | Total | | 444 | | | 332 | | | | 445 | | | 309 | |
| | | | | | | | | | | | | | | |
| Barrels of Oil Equivalent (MBOE) | | | 747 | | | 719 | | | | 737 | | | 716 | |
Investor Relations Supplemental Schedules
| OCCIDENTAL PETROLEUM | | | | | |
| SUMMARY OF OPERATING STATISTICS | | | | | |
| | | | | | | | | | | | | | | |
| | | | Second Quarter | | | Six Months |
| | | | 2010 | | 2009 | | | 2010 | | 2009 |
| NET PRODUCTION PER DAY: | | | | | | | | | | | | | | |
| United States | | | | | | | | | | | | | | |
| Crude Oil and Liquids (MBBL) | | | 269 | | | 267 | | | | 269 | | | 271 | |
| Natural Gas (MMCF) | | | 681 | | | 621 | | | | 678 | | | 621 | |
| | | | | | | | | | | | | | | |
| Latin America | | | | | | | | | | | | | | |
| Crude Oil (MBBL) | | | | | | | | | | | | | | |
| | Argentina | | 37 | | | 38 | | | | 37 | | | 38 | |
| | Colombia | | 32 | | | 41 | | | | 33 | | | 41 | |
| | Total | | 69 | | | 79 | | | | 70 | | | 79 | |
| | | | | | | | | | | | | | | |
| Natural Gas (MMCF) | | | 47 | | | 49 | | | | 45 | | | 49 | |
| | | | | | | | | | | | | | | |
| Middle East / North Africa | | | | | | | | | | | | | | |
| Crude Oil and Liquids (MBBL) | | | | | | | | | | | | | | |
| | Bahrain | | 3 | | | - | | | | 3 | | | - | |
| | Dolphin | | 23 | | | 29 | | | | 24 | | | 26 | |
| | Libya | | 15 | | | 13 | | | | 15 | | | 11 | |
| | Oman | | 60 | | | 49 | | | | 58 | | | 47 | |
| | Qatar | | 78 | | | 78 | | | | 76 | | | 79 | |
| | Yemen | | 31 | | | 35 | | | | 33 | | | 37 | |
| | Total | | 210 | | | 204 | | | | 209 | | | 200 | |
| | | | | | | | | | | | | | | |
| Natural Gas (MMCF) | | | 444 | | | 332 | | | | 445 | | | 309 | |
| | | | | | | | | | | | | | | |
| Barrels of Oil Equivalent (MBOE) | | | 743 | | | 717 | | | | 743 | | | 713 | |
Investor Relations Supplemental Schedules
| OCCIDENTAL PETROLEUM |
| SUMMARY OF OPERATING STATISTICS |
| | | | | | | | | | | | | | | | | | |
| | | | Second Quarter | | Six Months |
| | | | 2010 | | 2009 | | 2010 | | 2009 |
| | | | | | | | | | | | | | | | | | |
| OIL & GAS: | | | | | | | | | | | | | | | | | |
| PRICES | | | | | | | | | | | | | | | | | |
| United States | | | | | | | | | | | | | | | | | |
| Crude Oil ($/BBL) | | | 71.66 | | | 55.55 | | | 72.38 | | | 46.43 | |
| Natural gas ($/MCF) | | | 4.19 | | | 2.87 | | | 4.90 | | | 3.20 | |
| | | | | | | | | | | | | | | | | | |
| Latin America | | | | | | | | | | | | | | | | | |
| Crude Oil ($/BBL) | | | 57.57 | | | 46.08 | | | 59.37 | | | 42.71 | |
| Natural Gas ($/MCF) | | | 3.90 | | | 2.75 | | | 3.63 | | | 3.11 | |
| | | | | | | | | | | | | | | | | | |
| Middle East / North Africa | | | | | | | | | | | | | | | | | |
| Crude Oil ($/BBL) | | | 77.50 | | | 53.43 | | | 76.31 | | | 47.60 | |
| | | | | | | | | | | | | | | | | | |
| Total Worldwide | | | | | | | | | | | | | | | | | |
| Crude Oil ($/BBL) | | | 72.13 | | | 52.97 | | | 72.01 | | | 46.05 | |
| Natural Gas ($/MCF) | | | 2.90 | | | 2.34 | | | 3.30 | | | 2.61 | |
| | | | | | | | | | | | | | | | | | |
| | | | | | | | | | | | | | | | | | |
| | | | | | | | | | | | | | | | | | |
| | | | Second Quarter | | Six Months |
| | | | 2010 | | 2009 | | 2010 | | 2009 |
| Exploration Expense | | | | | | | | | | | | | | | | | |
| United States | | | $ | 42 | | | $ | 35 | | | $ | 72 | | | $ | 62 | |
| Latin America | | | | 4 | | | | 8 | | | | 5 | | | | 10 | |
| Middle East / North Africa | | | | 27 | | | | 10 | | | | 52 | | | | 38 | |
| Other Eastern Hemisphere | | | | - | | | | 1 | | | | - | | | | 2 | |
| TOTAL REPORTED | | | $ | 73 | | | $ | 54 | | | $ | 129 | | | $ | 112 | |
Investor Relations Supplemental Schedules
| OCCIDENTAL PETROLEUM |
| SUMMARY OF OPERATING STATISTICS |
| | | | | | | | | | | | | | | | | |
| | | | | | | | | | | | | | | | | |
| | | Second Quarter | | Six Months |
| Capital Expenditures ($MM) | | 2010 | | 2009 | | 2010 | | 2009 |
| Oil & Gas | | | | | | | | | | | | | | | | |
| California | | $ | 180 | | | $ | 128 | | | $ | 329 | | | $ | 284 | |
| Permian | | | 81 | | | | 82 | | | | 154 | | | | 271 | |
| Midcontinent Gas | | | 49 | | | | 12 | | | | 86 | | | | 68 | |
| Latin America | | | 112 | | | | 118 | | | | 215 | | | | 308 | |
| Middle East / North Africa | | | 252 | | | | 262 | | | | 515 | | | | 534 | |
| Exploration | | | 35 | | | | 29 | | | | 92 | | | | 77 | |
| Chemicals | | | 50 | | | | 40 | | | | 80 | | | | 71 | |
| Midstream, marketing and other | | | 104 | | | | 143 | | | | 228 | | | | 265 | |
| Corporate | | | 5 | | | | 17 | | | | 17 | | | | 24 | |
| | TOTAL | $ | 868 | | | $ | 831 | | | $ | 1,716 | | | $ | 1,902 | |
| | | | | | | | | | | | | | | | | |
| | | | | | | | | | | | | | | | | |
| Depreciation, Depletion & | | Second Quarter | | Six Months |
| Amortization of Assets ($MM) | | 2010 | | 2009 | | 2010 | | 2009 |
| Oil & Gas | | | | | | | | | | | | | | | | |
| Domestic | | $ | 349 | | | $ | 304 | | | $ | 700 | | | $ | 615 | |
| Latin America | | | 105 | | | | 155 | | | | 247 | | | | 323 | |
| Middle East / North Africa | | | 300 | | | | 179 | | | | 559 | | | | 387 | |
| Chemicals | | | 81 | | | | 73 | | | | 161 | | | | 144 | |
| Midstream, marketing and other | | | 36 | | | | 26 | | | | 73 | | | | 49 | |
| Corporate | | | 5 | | | | 5 | | | | 10 | | | | 10 | |
| | TOTAL | $ | 876 | | | $ | 742 | | | $ | 1,750 | | | $ | 1,528 | |
Investor Relations Supplemental Schedules
| OCCIDENTAL PETROLEUM | |
| CORPORATE | |
| ($ millions) | |
| | | | | | | | | | | | | |
| | | 30-Jun-10 | | 31-Dec-09 |
| | | | | | | | | | | | | |
| CAPITALIZATION | | | | | | | | | | | | |
| | | | | | | | | | | | | |
| Long-Term Debt (including current maturities) | | | $ | 2,523 | | | | | $ | 2,796 | | |
| | | | | | | | | | | | | |
| Others | | | | - | | | | | | 25 | | |
| | | | | | | | | | | | | |
| | Total Debt | | $ | 2,523 | | | | | $ | 2,821 | | |
| | | | | | | | | | | | | |
| | | | | | | | | | | | | |
| EQUITY | | | $ | 30,912 | | | | | $ | 29,159 | | |
| | | | | | | | | | | | | |
| Total Debt To Total Capitalization | | | | 8% | | | | | 9% | |
16