EXHIBIT 99.3
Investor Relations Supplemental Schedules

| Investor Relations Supplemental Schedules |
| Summary |
| ($ Millions) |
| | | | | | | | |
| | | | | | | | |
| | | | | | | | |
| | | | | | | | |
| | 3Q 2011 | | 3Q 2010 |
| | | | | | | | |
| Core Results | | $1,775 | | | | $1,203 | |
| EPS - Diluted | | $2.18 | | | | $1.48 | |
| | | | | | | | |
| Reported Net Income | | $1,771 | | | | $1,191 | |
| EPS - Diluted | | $2.17 | | | | $1.46 | |
| | | | | | | | |
| Total Worldwide Sales Volumes (mboe/day) | | 743 | | | | 713 | |
| Total Worldwide Production Volumes (mboe/day) | | 739 | | | | 706 | |
| | | | | | | | |
| Total Worldwide Crude Oil Realizations ($/BBL) | | $97.24 | | | | $72.31 | |
| Total Worldwide NGL Realizations ($/BBL) | | $56.06 | | | | $39.70 | |
| Domestic Natural Gas Realizations ($/MCF) | | $4.23 | | | | $4.20 | |
| | | | | | | | |
| Wtd. Average Basic Shares O/S (mm) | | 812.5 | | | | 812.7 | |
| Wtd. Average Diluted Shares O/S (mm) | | 813.2 | | | | 813.9 | |
| | | | | | | | |
| | | | | | | | |
| | YTD 2011 | | YTD 2010 |
| | | | | | | | |
| Core Results | | $5,187 | | | | $3,377 | |
| EPS - Diluted | | $6.37 | | | | $4.14 | |
| | | | | | | | |
| Reported Net Income | | $5,137 | | | | $3,318 | |
| EPS - Diluted | | $6.31 | | | | $4.07 | |
| | | | | | | | |
| Total Worldwide Sales Volumes (mboe/day) | | 726 | | | | 701 | |
| Total Worldwide Production Volumes (mboe/day) | | 728 | | | | 703 | |
| | | | | | | | |
| Total Worldwide Crude Oil Realizations ($/BBL) | | $97.33 | | | | $73.58 | |
| Total Worldwide NGL Realizations ($/BBL) | | $55.63 | | | | $43.66 | |
| Domestic Natural Gas Realizations ($/MCF) | | $4.24 | | | | $4.67 | |
| | | | | | | | |
| Wtd. Average Basic Shares O/S (mm) | | 812.6 | | | | 812.4 | |
| Wtd. Average Diluted Shares O/S (mm) | | 813.3 | | | | 813.8 | |
| | | | | | | | |
| Shares Outstanding (mm) | | 811.8 | | | | 812.6 | |
| | | | | | | | |
| Cash Flow from Operations | $ | 8,600 | | | $ | 6,700 | |
Investor Relations Supplemental Schedules
| OCCIDENTAL PETROLEUM |
| 2011 Third Quarter |
| Net Income (Loss) |
| ($ millions) |
| | | | | | | | | | | | | | |
| | | | | | | | | | | | | | |
| | Reported | | | | | | | | Core |
| | Income | | Significant Items Affecting Income | | Results |
| Oil & Gas | $ | 2,612 | | | | | | | | | $ | 2,612 | |
| | | | | | | | | | | | | | |
| Chemical | | 245 | | | | | | | | | | 245 | |
| | | | | | | | | | | | | | |
| Midstream, marketing and other | | 77 | | | | | | | | | | 77 | |
| | | | | | | | | | | | | | |
| Corporate | | | | | | | | | | | | | |
| Interest expense, net | | (23 | ) | | | | | | | | | (23 | ) |
| | | | | | | | | | | | | | |
| Other | | (49 | ) | | | | | | | | | (49 | ) |
| | | | | | | | | | | | | | |
| Taxes | | (1,087 | ) | | | | | | | | | (1,087 | ) |
| | | | | | | | | | | | | | |
| | | | | | | | | | | | | | |
| Income from continuing operations | | 1,775 | | | | - | | | | | | 1,775 | |
| Discontinued operations, net of tax | | (4 | ) | | | 4 | | | Discontinued operations, net | | | - | |
| Net Income | $ | 1,771 | | | $ | 4 | | | | | $ | 1,775 | |
| | | | | | | | | | | | | | |
| | | | | | | | | | | | | | |
| Basic Earnings Per Common Share | | | | | | | | | | | | | |
| Income from continuing operations | $ | 2.18 | | | | | | | | | | | |
| Discontinued operations, net | | (0.01 | ) | | | | | | | | | | |
| Net Income | $ | 2.17 | | | | | | | | | $ | 2.18 | |
| | | | | | | | | | | | | | |
| Diluted Earnings Per Common Share | | | | | | | | | | | | | |
| Income from continuing operations | $ | 2.18 | | | | | | | | | | | |
| Discontinued operations, net | | (0.01 | ) | | | | | | | | | | |
| Net Income | $ | 2.17 | | | | | | | | | $ | 2.18 | |
Investor Relations Supplemental Schedules
| OCCIDENTAL PETROLEUM |
| 2010 Third Quarter |
| Net Income (Loss) |
| ($ millions) |
| | | | | | | | | | | | | | |
| | | | | | | | | | | | | | |
| | Reported | | | | | | | | Core |
| | Income | | Significant Items Affecting Income | | Results |
| Oil & Gas | $ | 1,757 | | | | | | | | | $ | 1,757 | |
| | | | | | | | | | | | | | |
| | | | | | | | | | | | | | |
| Chemical | | 189 | | | | | | | | | | 189 | |
| | | | | | | | | | | | | | |
| Midstream, marketing and other | | 163 | | | | | | | | | | 163 | |
| | | | | | | | | | | | | | |
| Corporate | | | | | | | | | | | | | |
| Interest expense, net | | (18 | ) | | | | | | | | | (18 | ) |
| | | | | | | | | | | | | | |
| Other | | (66 | ) | | | | | | | | | (66 | ) |
| | | | | | | | | | | | | | |
| Taxes | | (822 | ) | | | | | | | | | (822 | ) |
| | | | | | | | | | | | | | |
| Income from continuing operations | | 1,203 | | | | - | | | | | | 1,203 | |
| Discontinued operations, net of tax | | (12 | ) | | | 12 | | | Discontinued operations, net | | | - | |
| Net Income | $ | 1,191 | | | $ | 12 | | | | | $ | 1,203 | |
| | | | | | | | | | | | | | |
| | | | | | | | | | | | | | |
| Basic Earnings Per Common Share | | | | | | | | | | | | | |
| Income from continuing operations | $ | 1.48 | | | | | | | | | | | |
| Discontinued operations, net | | (0.02 | ) | | | | | | | | | | |
| Net Income | $ | 1.46 | | | | | | | | | $ | 1.48 | |
| | | | | | | | | | | | | | |
| Diluted Earnings Per Common Share | | | | | | | | | | | | | |
| Income from continuing operations | $ | 1.48 | | | | | | | | | | | |
| Discontinued operations, net | | (0.02 | ) | | | | | | | | | | |
| Net Income | $ | 1.46 | | | | | | | | | $ | 1.48 | |
Investor Relations Supplemental Schedules
| OCCIDENTAL PETROLEUM |
| 2011 Nine Months |
| Net Income (Loss) |
| ($ millions) |
| | | | | | | | | | | | | | |
| | | | | | | | | | | | | | |
| | Reported | | | | | | | | Core |
| | Income | | Significant Items Affecting Income | | Results |
| Oil & Gas | $ | 7,704 | | | $ | 35 | | | Libya exploration write-off | | $ | 7,746 | |
| | | | | | | (22 | ) | | Gain on sale of Colombia pipeline interest | | | | |
| | | | | | | 29 | | | Foreign tax | | | | |
| Chemical | | 717 | | | | | | | | | | 717 | |
| | | | | | | | | | | | | | |
| Midstream, marketing and other | | 378 | | | | | | | | | | 378 | |
| | | | | | | | | | | | | | |
| Corporate | | | | | | | | | | | | | |
| Interest expense, net | | (259 | ) | | | 163 | | | Premium on debt extinguishments | | | (96 | ) |
| | | | | | | | | | | | | | |
| Other | | (289 | ) | | | | | | | | | (289 | ) |
| | | | | | | | | | | | | | |
| Taxes | | (3,252 | ) | | | (50 | ) | | Tax effect of adjustments | | | (3,269 | ) |
| | | | | | | 33 | | | State income tax charge | | | | |
| | | | | | | | | | | | | | |
| | | | | | | | | | | | | | |
| Income from continuing operations | | 4,999 | | | | 188 | | | | | | 5,187 | |
| Discontinued operations, net of tax | | 138 | | | | (138 | ) | | Discontinued operations, net | | | - | |
| Net Income | $ | 5,137 | | | $ | 50 | | | | | $ | 5,187 | |
| | | | | | | | | | | | | | |
| | | | | | | | | | | | | | |
| Basic Earnings Per Common Share | | | | | | | | | | | | | |
| Income from continuing operations | $ | 6.14 | | | | | | | | | | | |
| Discontinued operations, net | | 0.17 | | | | | | | | | | | |
| Net Income | $ | 6.31 | | | | | | | | | $ | 6.37 | |
| | | | | | | | | | | | | | |
| Diluted Earnings Per Common Share | | | | | | | | | | | | | |
| Income from continuing operations | $ | 6.14 | | | | | | | | | | | |
| Discontinued operations, net | | 0.17 | | | | | | | | | | | |
| Net Income | $ | 6.31 | | | | | | | | | $ | 6.37 | |
Investor Relations Supplemental Schedules
| OCCIDENTAL PETROLEUM |
| 2010 Nine Months |
| Net Income (Loss) |
| ($ millions) |
| | | | | | | | | | | | | | |
| | | | | | | | | | | | | | |
| | Reported | | | | | | | | Core |
| | Income | | Significant Items Affecting Income | | Results |
| Oil & Gas | $ | 5,485 | | | | | | | | | $ | 5,485 | |
| | | | | | | | | | | | | | |
| Chemical | | 327 | | | | | | | | | | 327 | |
| | | | | | | | | | | | | | |
| Midstream, marketing and other | | 270 | | | | | | | | | | 270 | |
| | | | | | | | | | | | | | |
| Corporate | | | | | | | | | | | | | |
| Interest expense, net | | (73 | ) | | | | | | | | | (73 | ) |
| | | | | | | | | | | | | | |
| Other | | (255 | ) | | | | | | | | | (255 | ) |
| | | | | | | | | | | | | | |
| Taxes | | (2,377 | ) | | | | | | | | | (2,377 | ) |
| | | | | | | | | | | | | | |
| Income from continuing operations | | 3,377 | | | | - | | | | | | 3,377 | |
| Discontinued operations, net of tax | | (59 | ) | | | 59 | | | Discontinued operations, net | | | - | |
| Net Income | $ | 3,318 | | | $ | 59 | | | | | $ | 3,377 | |
| | | | | | | | | | | | | | |
| | | | | | | | | | | | | | |
| Basic Earnings Per Common Share | | | | | | | | | | | | | |
| Income from continuing operations | $ | 4.15 | | | | | | | | | | | |
| Discontinued operations, net | | (0.07 | ) | | | | | | | | | | |
| Net Income | $ | 4.08 | | | | | | | | | $ | 4.15 | |
| | | | | | | | | | | | | | |
| Diluted Earnings Per Common Share | | | | | | | | | | | | | |
| Income from continuing operations | $ | 4.14 | | | | | | | | | | | |
| Discontinued operations, net | | (0.07 | ) | | | | | | | | | | |
| Net Income | $ | 4.07 | | | | | | | | | $ | 4.14 | |
Investor Relations Supplemental Schedules
| OCCIDENTAL PETROLEUM |
| Worldwide Effective Tax Rate |
| | | | | | | | | | | | | | |
| | QUARTERLY | | YEAR-TO-DATE |
| | 2011 | | 2011 | | 2010 | | 2011 | | 2010 |
| REPORTED INCOME | QTR 3 | | QTR 2 | | QTR 3 | | 9 Months | | 9 Months |
| Oil & Gas | 2,612 | | | 2,624 | | | 1,757 | | | 7,704 | | | 5,485 | |
| Chemicals | 245 | | | 253 | | | 189 | | | 717 | | | 327 | |
| Midstream, marketing and other | 77 | | | 187 | | | 163 | | | 378 | | | 270 | |
| Corporate & other | (72 | ) | | (134 | ) | | (84 | ) | | (548 | ) | | (328 | ) |
| Pre-tax income | 2,862 | | | 2,930 | | | 2,025 | | | 8,251 | | | 5,754 | |
| | | | | | | | | | | | | | | |
| Income tax expense | | | | | | | | | | | | | | |
| Federal and state | 433 | | | 557 | | | 322 | | | 1,360 | | | 958 | |
| Foreign | 654 | | | 554 | | | 500 | | | 1,892 | | | 1,419 | |
| Total | 1,087 | | | 1,111 | | | 822 | | | 3,252 | | | 2,377 | |
| | | | | | | | | | | | | | | |
| Income from continuing operations | 1,775 | | | 1,819 | | | 1,203 | | | 4,999 | | | 3,377 | |
| | | | | | | | | | | | | | | |
| Worldwide effective tax rate | 38% | | 38% | | 41% | | 39% | | 41% |
| | | | | | | | | | | | | | | |
| | | | | | | | | | | | | | | |
| | 2011 | | 2011 | | 2010 | | 2011 | | 2010 |
| CORE RESULTS | QTR 3 | | QTR 2 | | QTR 3 | | 9 Months | | 9 Months |
| Oil & Gas | 2,612 | | | 2,624 | | | 1,757 | | | 7,746 | | | 5,485 | |
| Chemicals | 245 | | | 253 | | | 189 | | | 717 | | | 327 | |
| Midstream, marketing and other | 77 | | | 187 | | | 163 | | | 378 | | | 270 | |
| Corporate & other | (72 | ) | | (134 | ) | | (84 | ) | | (385 | ) | | (328 | ) |
| Pre-tax income | 2,862 | | | 2,930 | | | 2,025 | | | 8,456 | | | 5,754 | |
| | | | | | | | | | | | | | | |
| Income tax expense | | | | | | | | | | | | | | |
| Federal and state | 433 | | | 557 | | | 322 | | | 1,390 | | | 958 | |
| Foreign | 654 | | | 554 | | | 500 | | | 1,879 | | | 1,419 | |
| Total | 1,087 | | | 1,111 | | | 822 | | | 3,269 | | | 2,377 | |
| | | | | | | | | | | | | | | |
| Core results | 1,775 | | | 1,819 | | | 1,203 | | | 5,187 | | | 3,377 | |
| | | | | | | | | | | | | | | |
| Worldwide effective tax rate | 38% | | | 38% | | 41% | | 39% | | 41% |
Investor Relations Supplemental Schedules
| OCCIDENTAL PETROLEUM |
| 2011 Third Quarter Net Income (Loss) |
| Reported Income Comparison |
| | | | | | | | | | | | | |
| | | Third | | Second | | | | |
| | | Quarter | | Quarter | | | | |
| | | 2011 | | 2011 | | B / (W) |
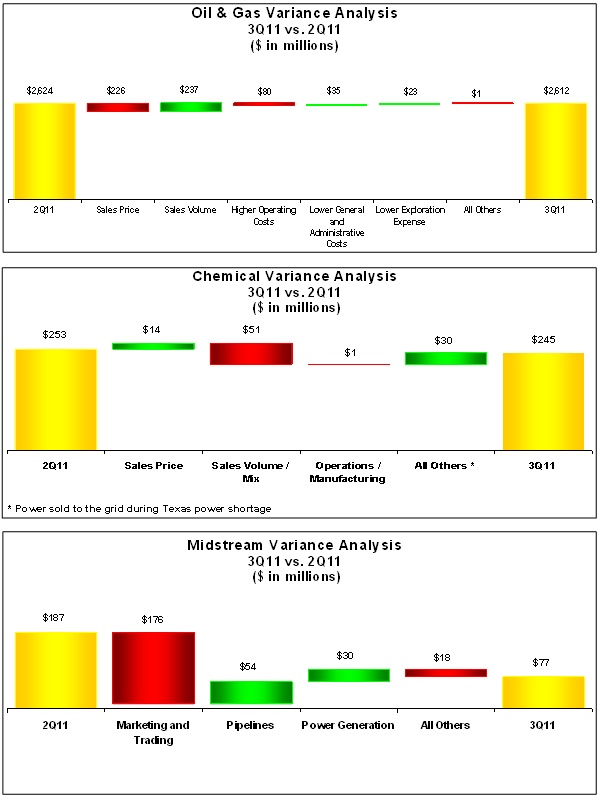
| Oil & Gas | | $ | 2,612 | | | $ | 2,624 | | | $ | (12 | ) |
| Chemical | | | 245 | | | | 253 | | | | (8 | ) |
| Midstream, marketing and other | | | 77 | | | | 187 | | | | (110 | ) |
| Corporate | | | | | | | | | | | | |
| Interest expense, net | | | (23 | ) | | | (22 | ) | | | (1 | ) |
| Other | | | (49 | ) | | | (112 | ) | | | 63 | |
| Taxes | | | (1,087 | ) | | | (1,111 | ) | | | 24 | |
| Income from continuing operations | | | 1,775 | | | | 1,819 | | | | (44 | ) |
| Discontinued operations, net | | | (4 | ) | | | (2 | ) | | | (2 | ) |
| Net Income | | $ | 1,771 | | | $ | 1,817 | | | $ | (46 | ) |
| | | | | | | | | | | | | |
| Earnings Per Common Share | | | | | | | | | | | | |
| Basic | | $ | 2.17 | | | $ | 2.23 | | | $ | (0.06 | ) |
| Diluted | | $ | 2.17 | | | $ | 2.23 | | | $ | (0.06 | ) |
| | | | | | | | | | | | | |
| | | | | | | | | | | | | |
| Worldwide Effective Tax Rate | | | 38% | | | | 38% | | | 0% |
| | | | | | | | | | | | | |
| | | | | | | | | | | | | |
| | | | | | | | | | | | | |
| OCCIDENTAL PETROLEUM |
| 2011 Third Quarter Net Income (Loss) |
| Core Results Comparison |
| | | | | | | | | | | | | |
| | | Third | | Second | | | | |
| | | Quarter | | Quarter | | | | |
| | | 2011 | | 2011 | | B / (W) |
| Oil & Gas | | $ | 2,612 | | | $ | 2,624 | | | $ | (12 | ) |
| Chemical | | | 245 | | | | 253 | | | | (8 | ) |
| Midstream, marketing and other | | | 77 | | | | 187 | | | | (110 | ) |
| Corporate | | | | | | | | | | | | |
| Interest expense, net | | | (23 | ) | | | (22 | ) | | | (1 | ) |
| Other | | | (49 | ) | | | (112 | ) | | | 63 | |
| Taxes | | | (1,087 | ) | | | (1,111 | ) | | | 24 | |
| Core Results | | $ | 1,775 | | | $ | 1,819 | | | $ | (44 | ) |
| | | | | | | | | | | | | |
| Core Results Per Common Share | | | | | | | | | | | | |
| Basic | | $ | 2.18 | | | $ | 2.23 | | | $ | (0.05 | ) |
| Diluted | | $ | 2.18 | | | $ | 2.23 | | | $ | (0.05 | ) |
| | | | | | | | | | | | | |
| Worldwide Effective Tax Rate | | | 38% | | | | 38% | | | 0% |
Investor Relations Supplemental Schedules
Investor Relations Supplemental Schedules
| OCCIDENTAL PETROLEUM |
| 2011 Third Quarter Net Income (Loss) |
| Reported Income Comparison |
| | | | | | | | | | | | | |
| | | Third | | Third | | | | |
| | | Quarter | | Quarter | | | | |
| | | 2011 | | 2010 | | B / (W) |
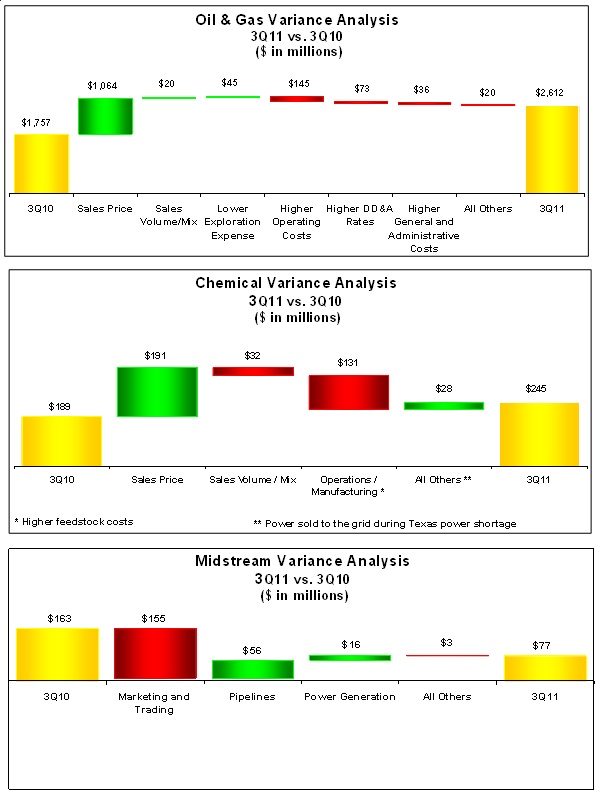
| Oil & Gas | | $ | 2,612 | | | $ | 1,757 | | | $ | 855 | |
| Chemical | | | 245 | | | | 189 | | | | 56 | |
| Midstream, marketing and other | | | 77 | | | | 163 | | | | (86 | ) |
| Corporate | | | | | | | | | | | | |
| Interest expense, net | | | (23 | ) | | | (18 | ) | | | (5 | ) |
| Other | | | (49 | ) | | | (66 | ) | | | 17 | |
| Taxes | | | (1,087 | ) | | | (822 | ) | | | (265 | ) |
| Income from continuing operations | | | 1,775 | | | | 1,203 | | | | 572 | |
| Discontinued operations, net | | | (4 | ) | | | (12 | ) | | | 8 | |
| Net Income | | $ | 1,771 | | | $ | 1,191 | | | $ | 580 | |
| | | | | | | | | | | | | |
| Earnings Per Common Share | | | | | | | | | | | | |
| Basic | | $ | 2.17 | | | $ | 1.46 | | | $ | 0.71 | |
| Diluted | | $ | 2.17 | | | $ | 1.46 | | | $ | 0.71 | |
| | | | | | | | | | | | | |
| | | | | | | | | | | | | |
| Worldwide Effective Tax Rate | | | 38% | | | 41% | | | 3% |
| | | | | | | | | | | | | |
| | | | | | | | | | | | | |
| | | | | | | | | | | | | |
| | | | | | | | | | | | | |
| | | | | | | | | | | | | |
| OCCIDENTAL PETROLEUM |
| 2011 Third Quarter Net Income (Loss) |
| Core Results Comparison |
| | | | | | | | | | | | | |
| | | Third | | Third | | | | |
| | | Quarter | | Quarter | | | | |
| | | 2011 | | 2010 | | B / (W) |
| Oil & Gas | | $ | 2,612 | | | $ | 1,757 | | | $ | 855 | |
| Chemical | | | 245 | | | | 189 | | | | 56 | |
| Midstream, marketing and other | | | 77 | | | | 163 | | | | (86 | ) |
| Corporate | | | | | | | | | | | | |
| Interest expense, net | | | (23 | ) | | | (18 | ) | | | (5 | ) |
| Other | | | (49 | ) | | | (66 | ) | | | 17 | |
| Taxes | | | (1,087 | ) | | | (822 | ) | | | (265 | ) |
| Core Results | | $ | 1,775 | | | $ | 1,203 | | | $ | 572 | |
| | | | | | | | | | | | | |
| Core Results Per Common Share | | | | | | | | | | | | |
| Basic | | $ | 2.18 | | | $ | 1.48 | | | $ | 0.70 | |
| Diluted | | $ | 2.18 | | | $ | 1.48 | | | $ | 0.70 | |
| | | | | | | | | | | | | |
| Worldwide Effective Tax Rate | | | 38% | | | 41% | | | 3% |
Investor Relations Supplemental Schedules
Investor Relations Supplemental Schedules
| OCCIDENTAL PETROLEUM |
| SUMMARY OF OPERATING STATISTICS |
| | | | | | | | | | | | | | | |
| | | | Third Quarter | | | Nine Months |
| | | | 2011 | | 2010 | | | 2011 | | | 2010 |
| NET PRODUCTION PER DAY: | | | | | | | | | | | | | | |
| | | | | | | | | | | | | | | |
| United States | | | | | | | | | | | | | | |
| Crude Oil (MBBL) | | | | | | | | | | | | | | |
| | California | | 80 | | | 75 | | | | 78 | | | 75 | |
| | Permian | | 133 | | | 134 | | | | 132 | | | 136 | |
| | Midcontinent and other | | 17 | | | 7 | | | | 16 | | | 7 | |
| | Total | | 230 | | | 216 | | | | 226 | | | 218 | |
| NGL (MBBL) | | | | | | | | | | | | | | |
| | California | | 16 | | | 17 | | | | 15 | | | 17 | |
| | Permian | | 37 | | | 30 | | | | 38 | | | 28 | |
| | Midcontinent and other | | 20 | | | 7 | | | | 14 | | | 7 | |
| | Total | | 73 | | | 54 | | | | 67 | | | 52 | |
| Natural Gas (MMCF) | | | | | | | | | | | | | | |
| | California | | 269 | | | 276 | | | | 254 | | | 288 | |
| | Permian | | 151 | | | 186 | | | | 153 | | | 194 | |
| | Midcontinent and other | | 379 | | | 194 | | | | 357 | | | 189 | |
| | Total | | 799 | | | 656 | | | | 764 | | | 671 | |
| | | | | | | | | | | | | | | |
| | | | | | | | | | | | | | | |
| Latin America | | | | | | | | | | | | | | |
| | | | | | | | | | | | | | | |
| Crude Oil (MBBL) | Colombia | | 27 | | | 33 | | | | 29 | | | 33 | |
| | | | | | | | | | | | | | | |
| Natural Gas (MMCF) | Bolivia | | 15 | | | 19 | | | | 16 | | | 15 | |
| | | | | | | | | | | | | | | |
| | | | | | | | | | | | | | | |
| Middle East / North Africa | | | | | | | | | | | | | | |
| Crude Oil (MBBL) | | | | | | | | | | | | | | |
| | Bahrain | | 4 | | | 3 | | | | 4 | | | 3 | |
| | Dolphin | | 10 | | | 12 | | | | 10 | | | 12 | |
| | Iraq | | 4 | | | - | | | | 6 | | | - | |
| | Libya | | - | | | 11 | | | | 5 | | | 13 | |
| | Oman | | 69 | | | 63 | | | | 68 | | | 60 | |
| | Qatar | | 73 | | | 78 | | | | 72 | | | 77 | |
| | Yemen | | 28 | | | 30 | | | | 28 | | | 32 | |
| | Total | | 188 | | | 197 | | | | 193 | | | 197 | |
| NGL (MBBL) | | | | | | | | | | | | | | |
| | Dolphin | | 11 | | | 13 | | | | 11 | | | 12 | |
| | Libya | | - | | | 1 | | | | - | | | 1 | |
| | Total | | 11 | | | 14 | | | | 11 | | | 13 | |
| Natural Gas (MMCF) | | | | | | | | | | | | | | |
| | Bahrain | | 169 | | | 181 | | | | 171 | | | 169 | |
| | Dolphin | | 215 | | | 250 | | | | 205 | | | 238 | |
| | Oman | | 59 | | | 47 | | | | 53 | | | 49 | |
| | Total | | 443 | | | 478 | | | | 429 | | | 456 | |
| | | | | | | | | | | | | | | |
| | | | | | | | | | | | | | | |
| Barrels of Oil Equivalent (MBOE) | | 739 | | | 706 | | | | 728 | | | 703 | |
Investor Relations Supplemental Schedules
| OCCIDENTAL PETROLEUM | | | | | |
| SUMMARY OF OPERATING STATISTICS | | | | | |
| | | | | | | | | | | | | | | |
| | | | Third Quarter | | | Nine Months |
| | | | 2011 | | 2010 | | | 2011 | | 2010 |
| NET SALES VOLUMES PER DAY: | | | | | | | | | | | | | | |
| United States | | | | | | | | | | | | | | |
| Crude Oil (MBBL) | | | 230 | | | 216 | | | | 226 | | | 218 | |
| NGL (MBBL) | | | 73 | | | 54 | | | | 67 | | | 52 | |
| Natural Gas (MMCF) | | | 799 | | | 656 | | | | 764 | | | 671 | |
| | | | | | | | | | | | | | | |
| Latin America | | | | | | | | | | | | | | |
| Crude Oil (MBBL) | | | 24 | | | 36 | | | | 29 | | | 32 | |
| Natural Gas (MMCF) | | | 15 | | | 19 | | | | 16 | | | 15 | |
| | | | | | | | | | | | | | | |
| Middle East / North Africa | | | | | | | | | | | | | | |
| Crude Oil (MBBL) | | | | | | | | | | | | | | |
| | Bahrain | | 4 | | | 3 | | | | 4 | | | 3 | |
| | Dolphin | | 9 | | | 12 | | | | 9 | | | 11 | |
| | Iraq | | 7 | | | - | | | | 2 | | | - | |
| | Libya | | - | | | 12 | | | | 5 | | | 12 | |
| | Oman | | 71 | | | 66 | | | | 70 | | | 60 | |
| | Qatar | | 76 | | | 79 | | | | 73 | | | 77 | |
| | Yemen | | 28 | | | 30 | | | | 28 | | | 32 | |
| | Total | | 195 | | | 202 | | | | 191 | | | 195 | |
| | | | | | | | | | | | | | | |
| NGL (MBBL) | Dolphin | | 11 | | | 13 | | | | 11 | | | 13 | |
| | Libya | | - | | | - | | | | - | | | 1 | |
| | Total | | 11 | | | 13 | | | | 11 | | | 14 | |
| | | | | | | | | | | | | | | |
| Natural Gas (MMCF) | | | 443 | | | 478 | | | | 429 | | | 456 | |
| | | | | | | | | | | | | | | |
| | | | | | | | | | | | | | | |
| Barrels of Oil Equivalent (MBOE) | | 743 | | | 713 | | | | 726 | | | 701 | |
Investor Relations Supplemental Schedules
| OCCIDENTAL PETROLEUM |
| SUMMARY OF OPERATING STATISTICS |
| | | | | | | | | | | | | | | | | | |
| | | | Third Quarter | | Nine Months |
| | | | 2011 | | 2010 | | 2011 | | 2010 |
| | | | | | | | | | | | | | | | | | |
| OIL & GAS: | | | | | | | | | | | | | | | | | |
| PRICES | | | | | | | | | | | | | | | | | |
| United States | | | | | | | | | | | | | | | | | |
| Crude Oil ($/BBL) | | | | 89.78 | | | | 71.14 | | | | 92.19 | | | | 71.96 | |
| NGL ($/BBL) | | | | 59.73 | | | | 43.67 | | | | 59.18 | | | | 47.80 | |
| Natural gas ($/MCF) | | | | 4.23 | | | | 4.20 | | | | 4.24 | | | | 4.67 | |
| | | | | | | | | | | | | | | | | | |
| Latin America | | | | | | | | | | | | | | | | | |
| Crude Oil ($/BBL) | | | | 91.01 | | | | 71.82 | | | | 95.85 | | | | 73.52 | |
| Natural Gas ($/MCF) | | | | 11.21 | | | | 7.71 | | | | 9.64 | | | | 7.72 | |
| | | | | | | | | | | | | | | | | | |
| Middle East / North Africa | | | | | | | | | | | | | | | | | |
| Crude Oil ($/BBL) | | | | 106.97 | | | | 73.66 | | | | 103.74 | | | | 75.39 | |
| NGL ($/BBL) | | | | 31.60 | | | | 23.24 | | | | 32.98 | | | | 27.51 | |
| | | | | | | | | | | | | | | | | | |
| Total Worldwide | | | | | | | | | | | | | | | | | |
| Crude Oil ($/BBL) | | | | 97.24 | | | | 72.31 | | | | 97.33 | | | | 73.58 | |
| NGL ($/BBL) | | | | 56.06 | | | | 39.70 | | | | 55.63 | | | | 43.66 | |
| Natural Gas ($/MCF) | | | | 3.12 | | | | 2.85 | | | | 3.09 | | | | 3.17 | |
| | | | | | | | | | | | | | | | | | |
| | | | | | | | | | | | | | | | | | |
| | | | | | | | | | | | | | | | | | |
| | | | Third Quarter | | Nine Months |
| | | | 2011 | | 2010 | | 2011 | | 2010 |
| Exploration Expense | | | | | | | | | | | | | | | | | |
| United States | | | $ | 36 | | | $ | 63 | | | $ | 135 | | | $ | 135 | |
| Latin America | | | | 1 | | | | - | | | | 1 | | | | 1 | |
| Middle East / North Africa | | | | 2 | | | | 20 | | | | 49 | | | | 72 | |
| TOTAL REPORTED | | | $ | 39 | | | $ | 83 | | | $ | 185 | | | $ | 208 | |
| Less - non-core impairments | | | | - | | | | - | | | | (35 | ) | | | - | |
| TOTAL CORE | | | $ | 39 | | | $ | 83 | | | $ | 150 | | | $ | 208 | |
Investor Relations Supplemental Schedules
| OCCIDENTAL PETROLEUM |
| SUMMARY OF OPERATING STATISTICS |
| | | | | | | | | | | | | | | | | |
| | | | | | | | | | | | | | | | | |
| | | Third Quarter | | Nine Months |
| Capital Expenditures ($MM) | | 2011 | | 2010 | | 2011 | | 2010 |
| Oil & Gas | | | | | | | | | | | | | | | | |
| California | | $ | 481 | | | $ | 215 | | | $ | 1,202 | | | $ | 544 | |
| Permian | | | 308 | | | | 136 | | | | 761 | | | | 290 | |
| Midcontinent and other | | | 311 | | | | 52 | | | | 725 | | | | 138 | |
| Latin America | | | 52 | | | | 40 | | | | 139 | | | | 107 | |
| Middle East / North Africa | | | 338 | | | | 340 | | | | 993 | | | | 855 | |
| Exploration | | | 115 | | | | 46 | | | | 291 | | | | 130 | |
| Chemicals | | | 59 | | | | 50 | | | | 118 | | | | 129 | |
| Midstream, marketing and other | | | 331 | | | | 128 | | | | 701 | | | | 357 | |
| Corporate | | | 16 | | | | 13 | | | | 39 | | | | 30 | |
| | TOTAL | $ | 2,011 | | | $ | 1,020 | | | $ | 4,969 | | | $ | 2,580 | |
| | | | | | | | | | | | | | | | | |
| | | | | | | | | | | | | | | | | |
| Depreciation, Depletion & | | Third Quarter | | Nine Months |
| Amortization of Assets ($MM) | | 2011 | | 2010 | | 2011 | | 2010 |
| Oil & Gas | | | | | | | | | | | | | | | | |
| Domestic | | $ | 448 | | | $ | 346 | | | $ | 1,265 | | | $ | 1,046 | |
| Latin America | | | 18 | | | | 33 | | | | 67 | | | | 91 | |
| Middle East / North Africa | | | 324 | | | | 294 | | | | 920 | | | | 853 | |
| Chemicals | | | 82 | | | | 81 | | | | 249 | | | | 242 | |
| Midstream, marketing and other | | | 45 | | | | 32 | | | | 134 | | | | 105 | |
| Corporate | | | 7 | | | | 6 | | | | 18 | | | | 16 | |
| | TOTAL | $ | 924 | | | $ | 792 | | | $ | 2,653 | | | $ | 2,353 | |
Investor Relations Supplemental Schedules
| OCCIDENTAL PETROLEUM | |
| CORPORATE | |
| ($ millions) | |
| | | | | | | | | | | | | |
| | | 30-Sep-11 | | 31-Dec-10 |
| | | | | | | | | | | | | |
| CAPITALIZATION | | | | | | | | | | | | |
| | | | | | | | | | | | | |
| Long-Term Debt (including short-term borrowings) | | | $ | 5,870 | | | | | $ | 5,111 | | |
| | | | | | | | | | | | | |
| EQUITY | | | $ | 36,479 | | | | | $ | 32,484 | | |
| | | | | | | | | | | | | |
| Total Debt To Total Capitalization | | | | 14% | | | | | 14% | |
15