EXHIBIT 99.3
Investor Relations Supplemental Schedules

| Investor Relations Supplemental Schedules |
| Summary |
| ($ Millions) |
| | | | |
| | | | |
| | | | |
| | | | |
| | 4Q 2011 | | 4Q 2010 |
| | | | |
| Core Results | $1,641 | | $1,287 |
| EPS - Diluted | $2.02 | | $1.58 |
| | | | |
| Reported Net Income | $1,634 | | $1,212 |
| EPS - Diluted | $2.01 | | $1.49 |
| | | | |
| Total Worldwide Sales Volumes (mboe/day) | 749 | | 699 |
| Total Worldwide Production Volumes (mboe/day) | 748 | | 714 |
| | | | |
| Total Worldwide Crude Oil Realizations ($/BBL) | $99.62 | | $79.96 |
| Total Worldwide NGL Realizations ($/BBL) | $55.25 | | $49.17 |
| Domestic Natural Gas Realizations ($/MCF) | $3.59 | | $4.13 |
| | | | |
| Wtd. Average Basic Shares O/S (mm) | 810.7 | | 812.6 |
| Wtd. Average Diluted Shares O/S (mm) | 811.5 | | 813.7 |
| | | | |
| | | | |
| | YTD 2011 | | YTD 2010 |
| | | | |
| Core Results | $6,828 | | $4,664 |
| EPS - Diluted | $8.39 | | $5.72 |
| | | | |
| Reported Net Income | $6,771 | | $4,530 |
| EPS - Diluted | $8.32 | | $5.56 |
| | | | |
| Total Worldwide Sales Volumes (mboe/day) | 731 | | 701 |
| Total Worldwide Production Volumes (mboe/day) | 733 | | 706 |
| | | | |
| Total Worldwide Crude Oil Realizations ($/BBL) | $97.92 | | $75.16 |
| Total Worldwide NGL Realizations ($/BBL) | $55.53 | | $45.08 |
| Domestic Natural Gas Realizations ($/MCF) | $4.06 | | $4.53 |
| | | | |
| Wtd. Average Basic Shares O/S (mm) | 812.1 | | 812.5 |
| Wtd. Average Diluted Shares O/S (mm) | 812.9 | | 813.8 |
| | | | |
| Shares Outstanding (mm) | 811.0 | | 812.8 |
| | | | |
| Cash Flow from Operations | $ 12,300 | | $ 9,600 |
Investor Relations Supplemental Schedules
| OCCIDENTAL PETROLEUM |
| 2011 Fourth Quarter |
| Net Income (Loss) |
| ($ millions) |
| | | | | | | | | | | | | | |
| | | | | | | | | | | | | | |
| | Reported | | | | | | | | Core |
| | Income | | Significant Items Affecting Income | | Results |
| Oil & Gas | $ | 2,537 | | | | | | | | | $ | 2,537 | |
| | | | | | | | | | | | | | |
| Chemical | | 144 | | | | | | | | | | 144 | |
| | | | | | | | | | | | | | |
| Midstream, marketing and other | | 70 | | | | | | | | | | 70 | |
| | | | | | | | | | | | | | |
| Corporate | | | | | | | | | | | | | |
| Interest expense, net | | (25 | ) | | | | | | | | | (25 | ) |
| | | | | | | | | | | | | | |
| Other | | (136 | ) | | | | | | | | | (136 | ) |
| | | | | | | | | | | | | | |
| Taxes | | (949 | ) | | | | | | | | | (949 | ) |
| | | | | | | | | | | | | | |
| | | | | | | | | | | | | | |
| Income from continuing operations | | 1,641 | | | | - | | | | | | 1,641 | |
| Discontinued operations, net of tax | | (7 | ) | | | 7 | | | Discontinued operations, net | | | - | |
| Net Income | $ | 1,634 | | | $ | 7 | | | | | $ | 1,641 | |
| | | | | | | | | | | | | | |
| | | | | | | | | | | | | | |
| Basic Earnings Per Common Share | | | | | | | | | | | | | |
| Income from continuing operations | $ | 2.02 | | | | | | | | | | | |
| Discontinued operations, net | | (0.01 | ) | | | | | | | | | | |
| Net Income | $ | 2.01 | | | | | | | | | $ | 2.02 | |
| | | | | | | | | | | | | | |
| Diluted Earnings Per Common Share | | | | | | | | | | | | | |
| Income from continuing operations | $ | 2.02 | | | | | | | | | | | |
| Discontinued operations, net | | (0.01 | ) | | | | | | | | | | |
| Net Income | $ | 2.01 | | | | | | | | | $ | 2.02 | |
Investor Relations Supplemental Schedules
| OCCIDENTAL PETROLEUM |
| 2010 Fourth Quarter |
| Net Income (Loss) |
| ($ millions) |
| | | | | | | | | | | | | | |
| | | | | | | | | | | | | | |
| | Reported | | | | | | | | Core |
| | Income | | Significant Items Affecting Income | | Results |
| Oil & Gas | $ | 1,666 | | | $ | 275 | | | Asset impairments | | $ | 1,941 | |
| | | | | | | | | | | | | | |
| | | | | | | | | | | | | | |
| Chemical | | 111 | | | | | | | | | | 111 | |
| | | | | | | | | | | | | | |
| Midstream, marketing and other | | 202 | | | | | | | | | | 202 | |
| | | | | | | | | | | | | | |
| Corporate | | | | | | | | | | | | | |
| Interest expense, net | | (20 | ) | | | | | | | | | (20 | ) |
| | | | | | | | | | | | | | |
| Other | | (149 | ) | | | | | | | | | (149 | ) |
| | | | | | | | | | | | | | |
| Taxes | | (618 | ) | | | (100 | ) | | Tax effect of adjustments | | | (798 | ) |
| | | | | | | (80 | ) | | Benefit from foreign tax credit | | | | |
| | | | | | | | | | carry-forwards | | | | |
| | | | | | | | | | | | | | |
| Income from continuing operations | | 1,192 | | | | 95 | | | | | | 1,287 | |
| Discontinued operations, net of tax | | 20 | | | | (20 | ) | | Discontinued operations, net | | | - | |
| Net Income | $ | 1,212 | | | $ | 75 | | | | | $ | 1,287 | |
| | | | | | | | | | | | | | |
| | | | | | | | | | | | | | |
| Basic Earnings Per Common Share | | | | | | | | | | | | | |
| Income from continuing operations | $ | 1.47 | | | | | | | | | | | |
| Discontinued operations, net | | 0.02 | | | | | | | | | | | |
| Net Income | $ | 1.49 | | | | | | | | | $ | 1.58 | |
| | | | | | | | | | | | | | |
| Diluted Earnings Per Common Share | | | | | | | | | | | | | |
| Income from continuing operations | $ | 1.47 | | | | | | | | | | | |
| Discontinued operations, net | | 0.02 | | | | | | | | | | | |
| Net Income | $ | 1.49 | | | | | | | | | $ | 1.58 | |
Investor Relations Supplemental Schedules
| OCCIDENTAL PETROLEUM |
| 2011 Twelve Months |
| Net Income (Loss) |
| ($ millions) |
| | | | | | | | | | | | | | |
| | | | | | | | | | | | | | |
| | Reported | | | | | | | | Core |
| | Income | | Significant Items Affecting Income | | Results |
| Oil & Gas | $ | 10,241 | | | $ | 35 | | | Libya exploration write-off | | $ | 10,283 | |
| | | | | | | (22 | ) | | Gain on sale of Colombia pipeline interest | | | | |
| | | | | | | 29 | | | Foreign tax | | | | |
| Chemical | | 861 | | | | | | | | | | 861 | |
| | | | | | | | | | | | | | |
| Midstream, marketing and other | | 448 | | | | | | | | | | 448 | |
| | | | | | | | | | | | | | |
| Corporate | | | | | | | | | | | | | |
| Interest expense, net | | (284 | ) | | | 163 | | | Premium on debt extinguishments | | | (121 | ) |
| | | | | | | | | | | | | | |
| Other | | (425 | ) | | | | | | | | | (425 | ) |
| | | | | | | | | | | | | | |
| Taxes | | (4,201 | ) | | | (50 | ) | | Tax effect of adjustments | | | (4,218 | ) |
| | | | | | | 33 | | | State income tax charge | | | | |
| | | | | | | | | | | | | | |
| | | | | | | | | | | | | | |
| Income from continuing operations | | 6,640 | | | | 188 | | | | | | 6,828 | |
| Discontinued operations, net of tax | | 131 | | | | (131 | ) | | Discontinued operations, net | | | - | |
| Net Income | $ | 6,771 | | | $ | 57 | | | | | $ | 6,828 | |
| | | | | | | | | | | | | | |
| | | | | | | | | | | | | | |
| Basic Earnings Per Common Share | | | | | | | | | | | | | |
| Income from continuing operations | $ | 8.16 | | | | | | | | | | | |
| Discontinued operations, net | | 0.16 | | | | | | | | | | | |
| Net Income | $ | 8.32 | | | | | | | | | $ | 8.39 | |
| | | | | | | | | | | | | | |
| Diluted Earnings Per Common Share | | | | | | | | | | | | | |
| Income from continuing operations | $ | 8.16 | | | | | | | | | | | |
| Discontinued operations, net | | 0.16 | | | | | | | | | | | |
| Net Income | $ | 8.32 | | | | | | | | | $ | 8.39 | |
Investor Relations Supplemental Schedules
| OCCIDENTAL PETROLEUM |
| 2010 Twelve Months |
| Net Income (Loss) |
| ($ millions) |
| | | | | | | | | | | | | | |
| | | | | | | | | | | | | | |
| | Reported | | | | | | | | Core |
| | Income | | Significant Items Affecting Income | | Results |
| Oil & Gas | $ | 7,151 | | | $ | 275 | | | Asset impairments | | $ | 7,426 | |
| | | | | | | | | | | | | | |
| Chemical | | 438 | | | | | | | | | | 438 | |
| | | | | | | | | | | | | | |
| Midstream, marketing and other | | 472 | | | | | | | | | | 472 | |
| | | | | | | | | | | | | | |
| Corporate | | | | | | | | | | | | | |
| Interest expense, net | | (93 | ) | | | | | | | | | (93 | ) |
| | | | | | | | | | | | | | |
| Other | | (404 | ) | | | | | | | | | (404 | ) |
| | | | | | | | | | | | | | |
| Taxes | | (2,995 | ) | | | (100 | ) | | Tax effect of adjustments | | | (3,175 | ) |
| | | | | | | (80 | ) | | Benefit from foreign tax credit | | | | |
| | | | | | | | | | carry-forwards | | | | |
| | | | | | | | | | | | | | |
| Income from continuing operations | | 4,569 | | | | 95 | | | | | | 4,664 | |
| Discontinued operations, net of tax | | (39 | ) | | | 39 | | | Discontinued operations, net | | | - | |
| Net Income | $ | 4,530 | | | $ | 134 | | | | | $ | 4,664 | |
| | | | | | | | | | | | | | |
| | | | | | | | | | | | | | |
| Basic Earnings Per Common Share | | | | | | | | | | | | | |
| Income from continuing operations | $ | 5.62 | | | | | | | | | | | |
| Discontinued operations, net | | (0.05 | ) | | | | | | | | | | |
| Net Income | $ | 5.57 | | | | | | | | | $ | 5.73 | |
| | | | | | | | | | | | | | |
| Diluted Earnings Per Common Share | | | | | | | | | | | | | |
| Income from continuing operations | $ | 5.61 | | | | | | | | | | | |
| Discontinued operations, net | | (0.05 | ) | | | | | | | | | | |
| Net Income | $ | 5.56 | | | | | | | | | $ | 5.72 | |
Investor Relations Supplemental Schedules
| OCCIDENTAL PETROLEUM |
| Worldwide Effective Tax Rate |
| | | | | | | | | | | | | | | |
| | QUARTERLY | | YEAR-TO-DATE |
| | 2011 | | 2011 | | 2010 | | 2011 | | 2010 |
| REPORTED INCOME | QTR 4 | | QTR 3 | | QTR 4 | | 12 Months | | 12 Months |
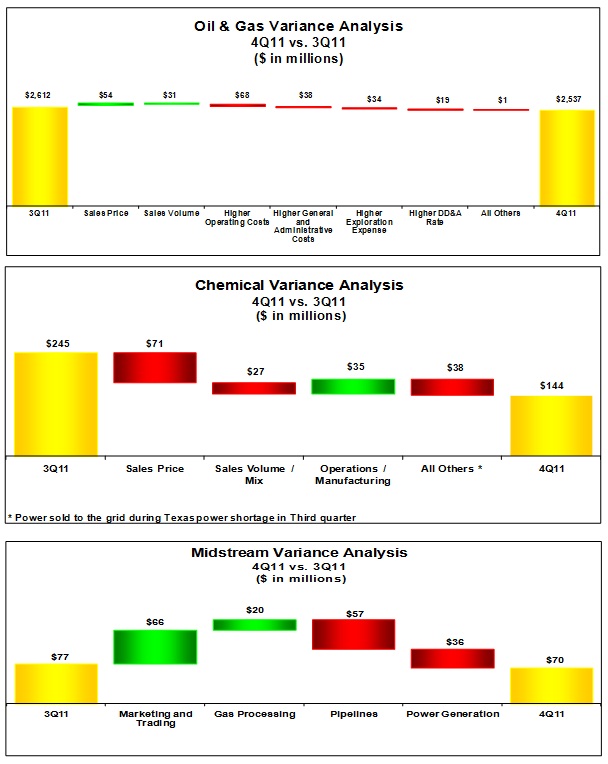
| Oil & Gas | 2,537 | | | 2,612 | | | 1,666 | | | 10,241 | | | 7,151 | |
| Chemicals | 144 | | | 245 | | | 111 | | | 861 | | | 438 | |
| Midstream, marketing and other | 70 | | | 77 | | | 202 | | | 448 | | | 472 | |
| Corporate & other | (161 | ) | | (72 | ) | | (169 | ) | | (709 | ) | | (497 | ) |
| Pre-tax income | 2,590 | | | 2,862 | | | 1,810 | | | 10,841 | | | 7,564 | |
| | | | | | | | | | | | | | | |
| Income tax expense | | | | | | | | | | | | | | |
| Federal and state | 435 | | | 433 | | | 129 | | | 1,795 | | | 1,087 | |
| Foreign | 514 | | | 654 | | | 489 | | | 2,406 | | | 1,908 | |
| Total | 949 | | | 1,087 | | | 618 | | | 4,201 | | | 2,995 | |
| | | | | | | | | | | | | | | |
| Income from continuing operations | 1,641 | | | 1,775 | | | 1,192 | | | 6,640 | | | 4,569 | |
| | | | | | | | | | | | | | | |
| Worldwide effective tax rate | 37% | | 38% | | 34% | | 39% | | 40% |
| | | | | | | | | | | | | | | |
| | | | | | | | | | | | | | | |
| | 2011 | | 2011 | | 2010 | | 2011 | | 2010 |
| CORE RESULTS | QTR 4 | | QTR 3 | | QTR 4 | | 12 Months | | 12 Months |
| Oil & Gas | 2,537 | | | 2,612 | | | 1,941 | | | 10,283 | | | 7,426 | |
| Chemicals | 144 | | | 245 | | | 111 | | | 861 | | | 438 | |
| Midstream, marketing and other | 70 | | | 77 | | | 202 | | | 448 | | | 472 | |
| Corporate & other | (161 | ) | | (72 | ) | | (169 | ) | | (546 | ) | | (497 | ) |
| Pre-tax income | 2,590 | | | 2,862 | | | 2,085 | | | 11,046 | | | 7,839 | |
| | | | | | | | | | | | | | | |
| Income tax expense | | | | | | | | | | | | | | |
| Federal and state | 435 | | | 433 | | | 309 | | | 1,825 | | | 1,267 | |
| Foreign | 514 | | | 654 | | | 489 | | | 2,393 | | | 1,908 | |
| Total | 949 | | | 1,087 | | | 798 | | | 4,218 | | | 3,175 | |
| | | | | | | | | | | | | | | |
| Core results | 1,641 | | | 1,775 | | | 1,287 | | | 6,828 | | | 4,664 | |
| | | | | | | | | | | | | | | |
| Worldwide effective tax rate | 37% | | 38% | | 38% | | 38% | | 41% |
Investor Relations Supplemental Schedules
| OCCIDENTAL PETROLEUM |
| 2011 Fourth Quarter Net Income (Loss) |
| Reported Income Comparison |
| | | | | | | | | | | | | |
| | | Fourth | | Third | | | | |
| | | Quarter | | Quarter | | | | |
| | | 2011 | | 2011 | | B / (W) |
| Oil & Gas | | $ | 2,537 | | | $ | 2,612 | | | $ | (75 | ) |
| Chemical | | | 144 | | | | 245 | | | | (101 | ) |
| Midstream, marketing and other | | | 70 | | | | 77 | | | | (7 | ) |
| Corporate | | | | | | | | | | | | |
| Interest expense, net | | | (25 | ) | | | (23 | ) | | | (2 | ) |
| Other | | | (136 | ) | | | (49 | ) | | | (87 | ) |
| Taxes | | | (949 | ) | | | (1,087 | ) | | | 138 | |
| Income from continuing operations | | | 1,641 | | | | 1,775 | | | | (134 | ) |
| Discontinued operations, net | | | (7 | ) | | | (4 | ) | | | (3 | ) |
| Net Income | | $ | 1,634 | | | $ | 1,771 | | | $ | (137 | ) |
| | | | | | | | | | | | | |
| Earnings Per Common Share | | | | | | | | | | | | |
| Basic | | $ | 2.01 | | | $ | 2.17 | | | $ | (0.16 | ) |
| Diluted | | $ | 2.01 | | | $ | 2.17 | | | $ | (0.16 | ) |
| | | | | | | | | | | | | |
| | | | | | | | | | | | | |
| Worldwide Effective Tax Rate | | | 37% | | | 38% | | | 1% |
| | | | | | | | | | | | | |
| | | | | | | | | | | | | |
| | | | | | | | | | | | | |
| OCCIDENTAL PETROLEUM |
| 2011 Fourth Quarter Net Income (Loss) |
| Core Results Comparison |
| | | | | | | | | | | | | |
| | | Fourth | | Third | | | | |
| | | Quarter | | Quarter | | | | |
| | | 2011 | | 2011 | | B / (W) |
| Oil & Gas | | $ | 2,537 | | | $ | 2,612 | | | $ | (75 | ) |
| Chemical | | | 144 | | | | 245 | | | | (101 | ) |
| Midstream, marketing and other | | | 70 | | | | 77 | | | | (7 | ) |
| Corporate | | | | | | | | | | | | |
| Interest expense, net | | | (25 | ) | | | (23 | ) | | | (2 | ) |
| Other | | | (136 | ) | | | (49 | ) | | | (87 | ) |
| Taxes | | | (949 | ) | | | (1,087 | ) | | | 138 | |
| Core Results | | $ | 1,641 | | | $ | 1,775 | | | $ | (134 | ) |
| | | | | | | | | | | | | |
| Core Results Per Common Share | | | | | | | | | | | | |
| Basic | | $ | 2.02 | | | $ | 2.18 | | | $ | (0.16 | ) |
| Diluted | | $ | 2.02 | | | $ | 2.18 | | | $ | (0.16 | ) |
| | | | | | | | | | | | | |
| Worldwide Effective Tax Rate | | | 37% | | | 38% | | | 1% |
Investor Relations Supplemental Schedules
Investor Relations Supplemental Schedules
| OCCIDENTAL PETROLEUM |
| 2011 Fourth Quarter Net Income (Loss) |
| Reported Income Comparison |
| | | | | | | | | | | | | |
| | | Fourth | | Fourth | | | | |
| | | Quarter | | Quarter | | | | |
| | | 2011 | | 2010 | | B / (W) |
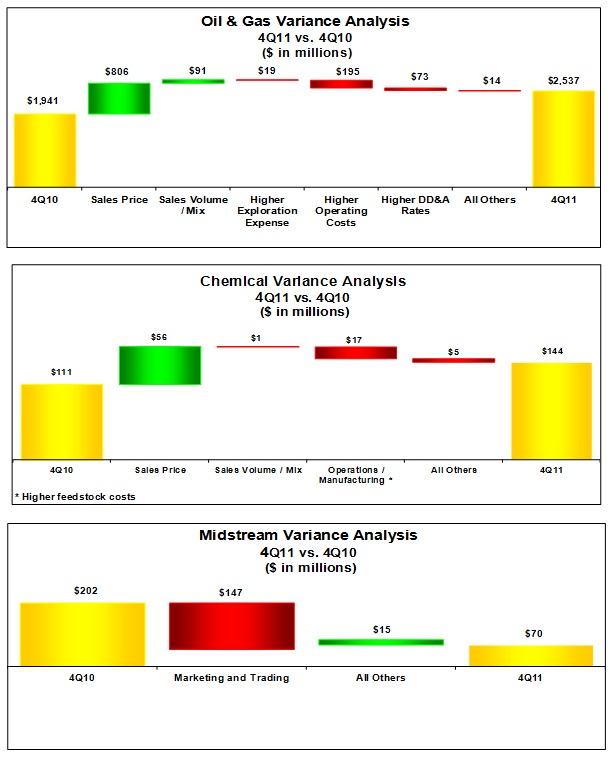
| Oil & Gas | | $ | 2,537 | | | $ | 1,666 | | | $ | 871 | |
| Chemical | | | 144 | | | | 111 | | | | 33 | |
| Midstream, marketing and other | | | 70 | | | | 202 | | | | (132 | ) |
| Corporate | | | | | | | | | | | | |
| Interest expense, net | | | (25 | ) | | | (20 | ) | | | (5 | ) |
| Other | | | (136 | ) | | | (149 | ) | | | 13 | |
| Taxes | | | (949 | ) | | | (618 | ) | | | (331 | ) |
| Income from continuing operations | | | 1,641 | | | | 1,192 | | | | 449 | |
| Discontinued operations, net | | | (7 | ) | | | 20 | | | | (27 | ) |
| Net Income | | $ | 1,634 | | | $ | 1,212 | | | $ | 422 | |
| | | | | | | | | | | | | |
| Earnings Per Common Share | | | | | | | | | | | | |
| Basic | | $ | 2.01 | | | $ | 1.49 | | | $ | 0.52 | |
| Diluted | | $ | 2.01 | | | $ | 1.49 | | | $ | 0.52 | |
| | | | | | | | | | | | | |
| | | | | | | | | | | | | |
| Worldwide Effective Tax Rate | | | 37% | | | 34% | | | -3% |
| | | | | | | | | | | | | |
| | | | | | | | | | | | | |
| | | | | | | | | | | | | |
| | | | | | | | | | | | | |
| | | | | | | | | | | | | |
| OCCIDENTAL PETROLEUM |
| 2011 Fourth Quarter Net Income (Loss) |
| Core Results Comparison |
| | | | | | | | | | | | | |
| | | Fourth | | Fourth | | | | |
| | | Quarter | | Quarter | | | | |
| | | 2011 | | 2010 | | B / (W) |
| Oil & Gas | | $ | 2,537 | | | $ | 1,941 | | | $ | 596 | |
| Chemical | | | 144 | | | | 111 | | | | 33 | |
| Midstream, marketing and other | | | 70 | | | | 202 | | | | (132 | ) |
| Corporate | | | | | | | | | | | | |
| Interest expense, net | | | (25 | ) | | | (20 | ) | | | (5 | ) |
| Other | | | (136 | ) | | | (149 | ) | | | 13 | |
| Taxes | | | (949 | ) | | | (798 | ) | | | (151 | ) |
| Core Results | | $ | 1,641 | | | $ | 1,287 | | | $ | 354 | |
| | | | | | | | | | | | | |
| Core Results Per Common Share | | | | | | | | | | | | |
| Basic | | $ | 2.02 | | | $ | 1.58 | | | $ | 0.44 | |
| Diluted | | $ | 2.02 | | | $ | 1.58 | | | $ | 0.44 | |
| | | | | | | | | | | | | |
| Worldwide Effective Tax Rate | | | 37% | | | 38% | | | 1% |
Investor Relations Supplemental Schedules
Investor Relations Supplemental Schedules
| OCCIDENTAL PETROLEUM |
| SUMMARY OF OPERATING STATISTICS |
| | | | | | | | | | | | | | | |
| | | | Fourth Quarter | | | Twelve Months |
| | | | 2011 | | 2010 | | | 2011 | | 2010 |
| NET PRODUCTION PER DAY: | | | | | | | | | | | | | | |
| | | | | | | | | | | | | | | |
| United States | | | | | | | | | | | | | | |
| Crude Oil (MBBL) | | | | | | | | | | | | | | |
| California | | 84 | | | 75 | | | | 80 | | | 76 | |
| Permian | | 137 | | | 135 | | | | 134 | | | 136 | |
| Midcontinent and other | | 19 | | | 9 | | | | 16 | | | 7 | |
| | Total | | 240 | | | 219 | | | | 230 | | | 219 | |
| NGL (MBBL) | | | | | | | | | | | | | | |
| California | | 15 | | | 15 | | | | 15 | | | 16 | |
| Permian | | 37 | | | 31 | | | | 38 | | | 29 | |
| Midcontinent and other | | 18 | | | 7 | | | | 16 | | | 7 | |
| | Total | | 70 | | | 53 | | | | 69 | | | 52 | |
| Natural Gas (MMCF) | | | | | | | | | | | | | | |
| California | | 276 | | | 259 | | | | 260 | | | 280 | |
| Permian | | 167 | | | 215 | | | | 157 | | | 199 | |
| Midcontinent and other | | 390 | | | 225 | | | | 365 | | | 198 | |
| | Total | | 833 | | | 699 | | | | 782 | | | 677 | |
| | | | | | | | | | | | | | | |
| | | | | | | | | | | | | | | |
| Latin America | | | | | | | | | | | | | | |
| | | | | | | | | | | | | | | |
| Crude Oil (MBBL) | Colombia | | 28 | | | 30 | | | | 29 | | | 32 | |
| | | | | | | | | | | | | | | |
| Natural Gas (MMCF) | Bolivia | | 14 | | | 18 | | | | 15 | | | 16 | |
| | | | | | | | | | | | | | | |
| | | | | | | | | | | | | | | |
| Middle East / North Africa | | | | | | | | | | | | | | |
| Crude Oil (MBBL) | | | | | | | | | | | | | | |
| | Bahrain | | 5 | | | 3 | | | | 4 | | | 3 | |
| | Dolphin | | 9 | | | 11 | | | | 9 | | | 11 | |
| | Iraq | | 9 | | | 11 | | | | 7 | | | 3 | |
| | Libya | | 1 | | | 11 | | | | 4 | | | 12 | |
| | Oman | | 67 | | | 67 | | | | 67 | | | 62 | |
| | Qatar | | 76 | | | 75 | | | | 73 | | | 76 | |
| | Yemen | | 23 | | | 27 | | | | 27 | | | 31 | |
| | Total | | 190 | | | 205 | | | | 191 | | | 198 | |
| NGL (MBBL) | | | | | | | | | | | | | | |
| | Dolphin | | 9 | | | 12 | | | | 10 | | | 13 | |
| | Libya | | - | | | 1 | | | | - | | | 1 | |
| | Total | | 9 | | | 13 | | | | 10 | | | 14 | |
| Natural Gas (MMCF) | | | | | | | | | | | | | | |
| | Bahrain | | 180 | | | 170 | | | | 173 | | | 169 | |
| | Dolphin | | 181 | | | 232 | | | | 199 | | | 236 | |
| | Oman | | 58 | | | 47 | | | | 54 | | | 48 | |
| | Total | | 419 | | | 449 | | | | 426 | | | 453 | |
| | | | | | | | | | | | | | | |
| | | | | | | | | | | | | | | |
| Barrels of Oil Equivalent (MBOE) | | | 748 | | | 714 | | | | 733 | | | 706 | |
Investor Relations Supplemental Schedules
| OCCIDENTAL PETROLEUM | | | | | |
| SUMMARY OF OPERATING STATISTICS | | | | | |
| | | | | | | | | | | | | | | |
| | | | Fourth Quarter | | | Twelve Months |
| | | | 2011 | | 2010 | | | 2011 | | 2010 |
| NET SALES VOLUMES PER DAY: | | | | | | | | | | | | | | |
| United States | | | | | | | | | | | | | | |
| Crude Oil (MBBL) | | | 240 | | | 219 | | | | 230 | | | 219 | |
| NGL (MBBL) | | | 70 | | | 53 | | | | 69 | | | 52 | |
| Natural Gas (MMCF) | | | 833 | | | 699 | | | | 782 | | | 677 | |
| | | | | | | | | | | | | | | |
| Latin America | | | | | | | | | | | | | | |
| Crude Oil (MBBL) | | | 32 | | | 31 | | | | 29 | | | 32 | |
| Natural Gas (MMCF) | | | 14 | | | 18 | | | | 15 | | | 16 | |
| | | | | | | | | | | | | | | |
| Middle East / North Africa | | | | | | | | | | | | | | |
| Crude Oil (MBBL) | | | | | | | | | | | | | | |
| | Bahrain | | 5 | | | 3 | | | | 4 | | | 3 | |
| | Dolphin | | 9 | | | 11 | | | | 9 | | | 12 | |
| | Iraq | | 6 | | | - | | | | 3 | | | - | |
| | Libya | | 1 | | | 9 | | | | 4 | | | 12 | |
| | Oman | | 66 | | | 63 | | | | 69 | | | 61 | |
| | Qatar | | 75 | | | 74 | | | | 73 | | | 76 | |
| | Yemen | | 24 | | | 27 | | | | 27 | | | 30 | |
| | Total | | 186 | | | 187 | | | | 189 | | | 194 | |
| | | | | | | | | | | | | | | |
| NGL (MBBL) | Dolphin | | 10 | | | 12 | | | | 10 | | | 12 | |
| | Libya | | - | | | 3 | | | | - | | | 1 | |
| | Total | | 10 | | | 15 | | | | 10 | | | 13 | |
| | | | | | | | | | | | | | | |
| Natural Gas (MMCF) | | | 419 | | | 449 | | | | 426 | | | 453 | |
| | | | | | | | | | | | | | | |
| | | | | | | | | | | | | | | |
| Barrels of Oil Equivalent (MBOE) | | | 749 | | | 699 | | | | 731 | | | 701 | |
Investor Relations Supplemental Schedules
| OCCIDENTAL PETROLEUM |
| SUMMARY OF OPERATING STATISTICS |
| | | | | | | | | | | | | | | | | | |
| | | | Fourth Quarter | | Twelve Months |
| | | | 2011 | | 2010 | | 2011 | | 2010 |
| | | | | | | | | | | | | | | | | | |
| OIL & GAS: | | | | | | | | | | | | | | | | | |
| PRICES | | | | | | | | | | | | | | | | | |
| United States | | | | | | | | | | | | | | | | | |
| Crude Oil ($/BBL) | | | | 94.50 | | | | 79.20 | | | | 92.80 | | | | 73.79 | |
| NGL ($/BBL) | | | | 58.85 | | | | 51.97 | | | | 59.10 | | | | 48.86 | |
| Natural gas ($/MCF) | | | | 3.59 | | | | 4.13 | | | | 4.06 | | | | 4.53 | |
| | | | | | | | | | | | | | | | | | |
| Latin America | | | | | | | | | | | | | | | | | |
| Crude Oil ($/BBL) | | | | 100.66 | | | | 81.05 | | | | 97.16 | | | | 75.29 | |
| Natural Gas ($/MCF) | | | | 11.63 | | | | 7.76 | | | | 10.11 | | | | 7.73 | |
| | | | | | | | | | | | | | | | | | |
| Middle East / North Africa | | | | | | | | | | | | | | | | | |
| Crude Oil ($/BBL) | | | | 106.20 | | | | 80.65 | | | | 104.34 | | | | 76.67 | |
| NGL ($/BBL) | | | | 29.17 | | | | 39.13 | | | | 32.09 | | | | 30.64 | |
| | | | | | | | | | | | | | | | | | |
| Total Worldwide | | | | | | | | | | | | | | | | | |
| Crude Oil ($/BBL) | | | | 99.62 | | | | 79.96 | | | | 97.92 | | | | 75.16 | |
| NGL ($/BBL) | | | | 55.25 | | | | 49.17 | | | | 55.53 | | | | 45.08 | |
| Natural Gas ($/MCF) | | | | 2.76 | | | | 2.91 | | | | 3.01 | | | | 3.11 | |
| | | | | | | | | | | | | | | | | | |
| | | | | | | | | | | | | | | | | | |
| | | | | | | | | | | | | | | | | | |
| | | | Fourth Quarter | | Twelve Months |
| | | | 2011 | | 2010 | | 2011 | | 2010 |
| Exploration Expense | | | | | | | | | | | | | | | | | |
| United States | | | $ | 71 | | | $ | 27 | | | $ | 204 | | | $ | 162 | |
| Latin America | | | | - | | | | 6 | | | | 1 | | | | 7 | |
| Middle East / North Africa | | | | 2 | | | | 21 | | | | 53 | | | | 93 | |
| TOTAL REPORTED | | | $ | 73 | | | $ | 54 | | | $ | 258 | | | $ | 262 | |
| Less - non-core impairments | | | | - | | | | - | | | | (35 | ) | | | - | |
| TOTAL CORE | | | $ | 73 | | | $ | 54 | | | $ | 223 | | | $ | 262 | |
Investor Relations Supplemental Schedules
| OCCIDENTAL PETROLEUM |
| SUMMARY OF OPERATING STATISTICS |
| | | | | | | | | | | | | | | | | |
| | | | | | | | | | | | | | | | | |
| | | Fourth Quarter | | Twelve Months |
| Capital Expenditures ($MM) | | 2011 | | 2010 | | 2011 | | 2010 |
| Oil & Gas | | | | | | | | | | | | | | | | |
| California | | $ | 515 | | | $ | 297 | | | $ | 1,717 | | | $ | 841 | |
| Permian | | | 385 | | | | 212 | | | | 1,146 | | | | 502 | |
| Midcontinent and other | | | 433 | | | | 131 | | | | 1,158 | | | | 269 | |
| Latin America | | | 79 | | | | 56 | | | | 218 | | | | 163 | |
| Middle East / North Africa | | | 492 | | | | 342 | | | | 1,485 | | | | 1,197 | |
| Exploration | | | 130 | | | | 64 | | | | 421 | | | | 194 | |
| Chemicals | | | 116 | | | | 108 | | | | 234 | | | | 237 | |
| Midstream, marketing and other | | 388 | | | | 144 | | | | 1,089 | | | | 501 | |
| Corporate | | | 11 | | | | 6 | | | | 50 | | | | 36 | |
| | TOTAL | $ | 2,549 | | | $ | 1,360 | | | $ | 7,518 | | | $ | 3,940 | |
| | | | | | | | | | | | | | | | | |
| | | | | | | | | | | | | | | | | |
| Depreciation, Depletion & | | Fourth Quarter | | Twelve Months |
| Amortization of Assets ($MM) | 2011 | | 2010 | | 2011 | | 2010 |
| Oil & Gas | | | | | | | | | | | | | | | | |
| Domestic | | $ | 489 | | | $ | 366 | | | $ | 1,754 | | | $ | 1,412 | |
| Latin America | | | 23 | | | | 31 | | | | 90 | | | | 122 | |
| Middle East / North Africa | | | 300 | | | | 281 | | | | 1,220 | | | | 1,134 | |
| Chemicals | | | 81 | | | | 79 | | | | 330 | | | | 321 | |
| Midstream, marketing and other | | 39 | | | | 37 | | | | 173 | | | | 142 | |
| Corporate | | | 6 | | | | 6 | | | | 24 | | | | 22 | |
| | TOTAL | $ | 938 | | | $ | 800 | | | $ | 3,591 | | | $ | 3,153 | |
Investor Relations Supplemental Schedules
| OCCIDENTAL PETROLEUM | |
| CORPORATE | |
| ($ millions) | |
| | | | | | | | | | | | | |
| | | 31-Dec-11 | | 31-Dec-10 |
| | | | | | | | | | | | | |
| CAPITALIZATION | | | | | | | | | | | | |
| | | | | | | | | | | | | |
| Long-Term Debt (including short-term borrowings) | | | $ | 5,871 | | | | | $ | 5,111 | | |
| | | | | | | | | | | | | |
| EQUITY | | | $ | 37,620 | | | | | $ | 32,484 | | |
| | | | | | | | | | | | | |
| Total Debt To Total Capitalization | | | | 13% | | | | | 14% | |
15