EXHIBIT 99.3
Investor Relations Supplemental Schedules

| Investor Relations Supplemental Schedules |
| Summary |
| ($ Millions) |
| | | | |
| | | | |
| | | | |
| | | | |
| | 2Q 2012 | | 2Q 2011 |
| | | | |
| Core Results | $1,332 | | $1,819 |
| EPS - Diluted | $1.64 | | $2.23 |
| | | | |
| Reported Net Income | $1,328 | | $1,817 |
| EPS - Diluted | $1.64 | | $2.23 |
| | | | |
| Total Worldwide Sales Volumes (mboe/day) | 759 | | 705 |
| Total Worldwide Production Volumes (mboe/day) | 766 | | 715 |
| | | | |
| Total Worldwide Crude Oil Realizations ($/BBL) | $99.34 | | $103.12 |
| Total Worldwide NGL Realizations ($/BBL) | $42.06 | | $57.67 |
| Domestic Natural Gas Realizations ($/MCF) | $2.09 | | $4.27 |
| | | | |
| Wtd. Average Basic Shares O/S (mm) | 810.3 | | 812.5 |
| Wtd. Average Diluted Shares O/S (mm) | 811.0 | | 813.3 |
| | | | |
| | | | |
| | YTD 2012 | | YTD 2011 |
| | | | |
| Core Results | $2,892 | | $3,412 |
| EPS - Diluted | $3.56 | | $4.19 |
| | | | |
| Reported Net Income | $2,887 | | $3,366 |
| EPS - Diluted | $3.55 | | $4.13 |
| | | | |
| Total Worldwide Sales Volumes (mboe/day) | 752 | | 717 |
| Total Worldwide Production Volumes (mboe/day) | 760 | | 723 |
| | | | |
| Total Worldwide Crude Oil Realizations ($/BBL) | $103.63 | | $97.38 |
| Total Worldwide NGL Realizations ($/BBL) | $47.52 | | $55.38 |
| Domestic Natural Gas Realizations ($/MCF) | $2.46 | | $4.24 |
| | | | |
| Wtd. Average Basic Shares O/S (mm) | 810.4 | | 812.5 |
| Wtd. Average Diluted Shares O/S (mm) | 811.2 | | 813.3 |
| | | | |
| Shares Outstanding (mm) | 809.9 | | 812.8 |
| | | | |
| Cash Flow from Operations | $ 6,000 | | $ 5,600 |
Investor Relations Supplemental Schedules
| OCCIDENTAL PETROLEUM |
| 2012 Second Quarter |
| Net Income (Loss) |
| ($ millions) |
| | | | | | | | | | | | | | |
| | | | | | | | | | | | | | |
| | Reported | | | | | | | | Core |
| | Income | | Significant Items Affecting Income | | Results |
| Oil & Gas | $ | 2,043 | | | | | | | | | $ | 2,043 | |
| | | | | | | | | | | | | | |
| Chemical | | 194 | | | | | | | | | | 194 | |
| | | | | | | | | | | | | | |
| Midstream, marketing and other | | 77 | | | | | | | | | | 77 | |
| | | | | | | | | | | | | | |
| Corporate | | | | | | | | | | | | | |
| Interest expense, net | | (25 | ) | | | | | | | | | (25 | ) |
| | | | | | | | | | | | | | |
| Other | | (82 | ) | | | | | | | | | (82 | ) |
| | | | | | | | | | | | | | |
| Taxes | | (875 | ) | | | | | | | | | (875 | ) |
| | | | | | | | | | | | | | |
| | | | | | | | | | | | | | |
| Income from continuing operations | | 1,332 | | | | - | | | | | | 1,332 | |
| Discontinued operations, net of tax | | (4 | ) | | | 4 | | | Discontinued operations, net | | | - | |
| Net Income | $ | 1,328 | | | $ | 4 | | | | | $ | 1,332 | |
| | | | | | | | | | | | | | |
| | | | | | | | | | | | | | |
| Basic Earnings Per Common Share | | | | | | | | | | | | | |
| Income from continuing operations | $ | 1.64 | | | | | | | | | | | |
| Discontinued operations, net | | - | | | | | | | | | | | |
| Net Income | $ | 1.64 | | | | | | | | | $ | 1.64 | |
| | | | | | | | | | | | | | |
| Diluted Earnings Per Common Share | | | | | | | | | | | | | |
| Income from continuing operations | $ | 1.64 | | | | | | | | | | | |
| Discontinued operations, net | | - | | | | | | | | | | | |
| Net Income | $ | 1.64 | | | | | | | | | $ | 1.64 | |
Investor Relations Supplemental Schedules
| OCCIDENTAL PETROLEUM |
| 2011 Second Quarter |
| Net Income (Loss) |
| ($ millions) |
| | | | | | | | | | | | | | |
| | | | | | | | | | | | | | |
| | Reported | | | | | | | | Core |
| | Income | | Significant Items Affecting Income | | Results |
| Oil & Gas | $ | 2,624 | | | | | | | | | $ | 2,624 | |
| | | | | | | | | | | | | | |
| Chemical | | 253 | | | | | | | | | | 253 | |
| | | | | | | | | | | | | | |
| Midstream, marketing and other | | 187 | | | | | | | | | | 187 | |
| | | | | | | | | | | | | | |
| Corporate | | | | | | | | | | | | | |
| Interest expense, net | | (22 | ) | | | | | | | | | (22 | ) |
| | | | | | | | | | | | | | |
| Other | | (112 | ) | | | | | | | | | (112 | ) |
| | | | | | | | | | | | | | |
| Taxes | | (1,111 | ) | | | | | | | | | (1,111 | ) |
| | | | | | | | | | | | | | |
| | | | | | | | | | | | | | |
| Income from continuing operations | | 1,819 | | | | - | | | | | | 1,819 | |
| Discontinued operations, net of tax | | (2 | ) | | | 2 | | | Discontinued operations, net | | | - | |
| Net Income | $ | 1,817 | | | $ | 2 | | | | | $ | 1,819 | |
| | | | | | | | | | | | | | |
| | | | | | | | | | | | | | |
| Basic Earnings Per Common Share | | | | | | | | | | | | | |
| Income from continuing operations | $ | 2.23 | | | | | | | | | | | |
| Discontinued operations, net | | - | | | | | | | | | | | |
| Net Income | $ | 2.23 | | | | | | | | | $ | 2.23 | |
| | | | | | | | | | | | | | |
| Diluted Earnings Per Common Share | | | | | | | | | | | | | |
| Income from continuing operations | $ | 2.23 | | | | | | | | | | | |
| Discontinued operations, net | | - | | | | | | | | | | | |
| Net Income | $ | 2.23 | | | | | | | | | $ | 2.23 | |
Investor Relations Supplemental Schedules
| OCCIDENTAL PETROLEUM |
| 2012 Six Months |
| Net Income (Loss) |
| ($ millions) |
| | | | | | | | | | | | | | |
| | | | | | | | | | | | | | |
| | Reported | | | | | | | | Core |
| | Income | | Significant Items Affecting Income | | Results |
| Oil & Gas | $ | 4,547 | | | | | | | | | $ | 4,547 | |
| | | | | | | | | | | | | | |
| Chemical | | 378 | | | | | | | | | | 378 | |
| | | | | | | | | | | | | | |
| Midstream, marketing and other | | 208 | | | | | | | | | | 208 | |
| | | | | | | | | | | | | | |
| Corporate | | | | | | | | | | | | | |
| Interest expense, net | | (53 | ) | | | | | | | | | (53 | ) |
| | | | | | | | | | | | | | |
| Other | | (174 | ) | | | | | | | | | (174 | ) |
| | | | | | | | | | | | | | |
| Taxes | | (2,014 | ) | | | | | | | | | (2,014 | ) |
| | | | | | | | | | | | | | |
| | | | | | | | | | | | | | |
| | | | | | | | | | | | | | |
| Income from continuing operations | | 2,892 | | | | - | | | | | | 2,892 | |
| Discontinued operations, net of tax | | (5 | ) | | | 5 | | | Discontinued operations, net | | | - | |
| Net Income | $ | 2,887 | | | $ | 5 | | | | | $ | 2,892 | |
| | | | | | | | | | | | | | |
| | | | | | | | | | | | | | |
| Basic Earnings Per Common Share | | | | | | | | | | | | | |
| Income from continuing operations | $ | 3.56 | | | | | | | | | | | |
| Discontinued operations, net | | (0.01 | ) | | | | | | | | | | |
| Net Income | $ | 3.55 | | | | | | | | | $ | 3.56 | |
| | | | | | | | | | | | | | |
| Diluted Earnings Per Common Share | | | | | | | | | | | | | |
| Income from continuing operations | $ | 3.56 | | | | | | | | | | | |
| Discontinued operations, net | | (0.01 | ) | | | | | | | | | | |
| Net Income | $ | 3.55 | | | | | | | | | $ | 3.56 | |
Investor Relations Supplemental Schedules
| OCCIDENTAL PETROLEUM |
| 2011 Six Months |
| Net Income (Loss) |
| ($ millions) |
| | | | | | | | | | | | | | |
| | | | | | | | | | | | | | |
| | Reported | | | | | | | | Core |
| | Income | | Significant Items Affecting Income | | Results |
| Oil & Gas | $ | 5,092 | | | $ | 35 | | | Libya exploration write-off | | $ | 5,134 | |
| | | | | | | (22 | ) | | Gain on sale of Colombia pipeline interest | | | | |
| | | | | | | 29 | | | Foreign tax | | | | |
| | | | | | | | | | | | | | |
| Chemical | | 472 | | | | | | | | | | 472 | |
| | | | | | | | | | | | | | |
| Midstream, marketing and other | | 301 | | | | | | | | | | 301 | |
| | | | | | | | | | | | | | |
| Corporate | | | | | | | | | | | | | |
| Interest expense, net | | (236 | ) | | | 163 | | | Premium on debt extinguishments | | | (73 | ) |
| | | | | | | | | | | | | | |
| Other | | (240 | ) | | | | | | | | | (240 | ) |
| | | | | | | | | | | | | | |
| Taxes | | (2,165 | ) | | | (50 | ) | | Tax effect of adjustments | | | (2,182 | ) |
| | | | | | | 33 | | | State income tax charge | | | | |
| | | | | | | | | | | | | | |
| Income from continuing operations | | 3,224 | | | | 188 | | | | | | 3,412 | |
| Discontinued operations, net of tax | | 142 | | | | (142 | ) | | Discontinued operations, net | | | - | |
| Net Income | $ | 3,366 | | | $ | 46 | | | | | $ | 3,412 | |
| | | | | | | | | | | | | | |
| | | | | | | | | | | | | | |
| Basic Earnings Per Common Share | | | | | | | | | | | | | |
| Income from continuing operations | $ | 3.96 | | | | | | | | | | | |
| Discontinued operations, net | | 0.18 | | | | | | | | | | | |
| Net Income | $ | 4.14 | | | | | | | | | $ | 4.19 | |
| | | | | | | | | | | | | | |
| Diluted Earnings Per Common Share | | | | | | | | | | | | | |
| Income from continuing operations | $ | 3.96 | | | | | | | | | | | |
| Discontinued operations, net | | 0.17 | | | | | | | | | | | |
| Net Income | $ | 4.13 | | | | | | | | | $ | 4.19 | |
Investor Relations Supplemental Schedules
| OCCIDENTAL PETROLEUM |
| Worldwide Effective Tax Rate |
| | | | | | | | | | | | | | | |
| | QUARTERLY | | YEAR-TO-DATE |
| | 2012 | | 2012 | | 2011 | | 2012 | | 2011 |
| REPORTED INCOME | QTR 2 | | QTR 1 | | QTR 2 | | 6 Months | | 6 Months |
| Oil & Gas | 2,043 | | | 2,504 | | | 2,624 | | | 4,547 | | | 5,092 | |
| Chemicals | 194 | | | 184 | | | 253 | | | 378 | | | 472 | |
| Midstream, marketing and other | 77 | | | 131 | | | 187 | | | 208 | | | 301 | |
| Corporate & other | (107 | ) | | (120 | ) | | (134 | ) | | (227 | ) | | (476 | ) |
| Pre-tax income | 2,207 | | | 2,699 | | | 2,930 | | | 4,906 | | | 5,389 | |
| | | | | | | | | | | | | | | |
| Income tax expense | | | | | | | | | | | | | | |
| Federal and state | 254 | | | 446 | | | 557 | | | 700 | | | 927 | |
| Foreign | 621 | | | 693 | | | 554 | | | 1,314 | | | 1,238 | |
| Total | 875 | | | 1,139 | | | 1,111 | | | 2,014 | | | 2,165 | |
| | | | | | | | | | | | | | | |
| Income from continuing operations | 1,332 | | | 1,560 | | | 1,819 | | | 2,892 | | | 3,224 | |
| | | | | | | | | | | | | | | |
| Worldwide effective tax rate | 40% | | 42% | | 38% | | 41% | | 40% |
| | | | | | | | | | | | | | | |
| | | | | | | | | | | | | | | |
| | 2012 | | 2012 | | 2011 | | 2012 | | 2011 |
| CORE RESULTS | QTR 2 | | QTR 1 | | QTR 2 | | 6 Months | | 6 Months |
| Oil & Gas | 2,043 | | | 2,504 | | | 2,624 | | | 4,547 | | | 5,134 | |
| Chemicals | 194 | | | 184 | | | 253 | | | 378 | | | 472 | |
| Midstream, marketing and other | 77 | | | 131 | | | 187 | | | 208 | | | 301 | |
| Corporate & other | (107 | ) | | (120 | ) | | (134 | ) | | (227 | ) | | (313 | ) |
| Pre-tax income | 2,207 | | | 2,699 | | | 2,930 | | | 4,906 | | | 5,594 | |
| | | | | | | | | | | | | | | |
| Income tax expense | | | | | | | | | | | | | | |
| Federal and state | 254 | | | 446 | | | 557 | | | 700 | | | 957 | |
| Foreign | 621 | | | 693 | | | 554 | | | 1,314 | | | 1,225 | |
| Total | 875 | | | 1,139 | | | 1,111 | | | 2,014 | | | 2,182 | |
| | | | | | | | | | | | | | | |
| Core results | 1,332 | | | 1,560 | | | 1,819 | | | 2,892 | | | 3,412 | |
| | | | | | | | | | | | | | | |
| Worldwide effective tax rate | 40% | | 42% | | 38% | | 41% | | 39% |
Investor Relations Supplemental Schedules
| OCCIDENTAL PETROLEUM |
| 2012 Second Quarter Net Income (Loss) |
| Reported Income Comparison |
| | | | | | | | | | | | | |
| | | Second | | First | | | | |
| | | Quarter | | Quarter | | | | |
| | | 2012 | | 2012 | | B / (W) |
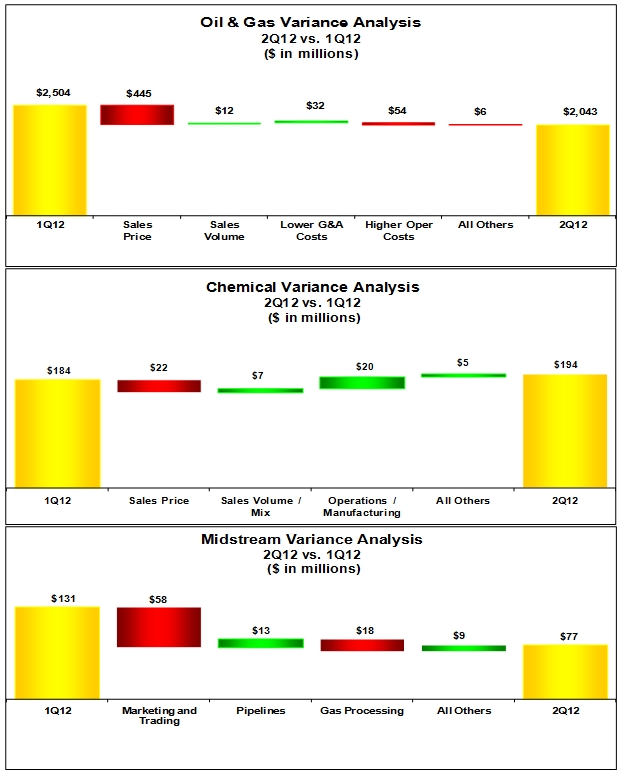
| Oil & Gas | | $ | 2,043 | | | $ | 2,504 | | | $ | (461 | ) |
| Chemical | | | 194 | | | | 184 | | | | 10 | |
| Midstream, marketing and other | | | 77 | | | | 131 | | | | (54 | ) |
| Corporate | | | | | | | | | | | | |
| Interest expense, net | | | (25 | ) | | | (28 | ) | | | 3 | |
| Other | | | (82 | ) | | | (92 | ) | | | 10 | |
| Taxes | | | (875 | ) | | | (1,139 | ) | | | 264 | |
| Income from continuing operations | | | 1,332 | | | | 1,560 | | | | (228 | ) |
| Discontinued operations, net | | | (4 | ) | | | (1 | ) | | | (3 | ) |
| Net Income | | $ | 1,328 | | | $ | 1,559 | | | $ | (231 | ) |
| | | | | | | | | | | | | |
| Earnings Per Common Share | | | | | | | | | | | | |
| Basic | | $ | 1.64 | | | $ | 1.92 | | | $ | (0.28 | ) |
| Diluted | | $ | 1.64 | | | $ | 1.92 | | | $ | (0.28 | ) |
| | | | | | | | | | | | | |
| | | | | | | | | | | | | |
| Worldwide Effective Tax Rate | | | 40% | | | 42% | | | 2% |
| | | | | | | | | | | | | |
| | | | | | | | | | | | | |
| | | | | | | | | | | | | |
| OCCIDENTAL PETROLEUM |
| 2012 Second Quarter Net Income (Loss) |
| Core Results Comparison |
| | | | | | | | | | | | | |
| | | Second | | First | | | | |
| | | Quarter | | Quarter | | | | |
| | | 2012 | | 2012 | | B / (W) |
| Oil & Gas | | $ | 2,043 | | | $ | 2,504 | | | $ | (461 | ) |
| Chemical | | | 194 | | | | 184 | | | | 10 | |
| Midstream, marketing and other | | | 77 | | | | 131 | | | | (54 | ) |
| Corporate | | | | | | | | | | | | |
| Interest expense, net | | | (25 | ) | | | (28 | ) | | | 3 | |
| Other | | | (82 | ) | | | (92 | ) | | | 10 | |
| Taxes | | | (875 | ) | | | (1,139 | ) | | | 264 | |
| Core Results | | $ | 1,332 | | | $ | 1,560 | | | $ | (228 | ) |
| | | | | | | | | | | | | |
| Core Results Per Common Share | | | | | | | | | | | | |
| Basic | | $ | 1.64 | | | $ | 1.92 | | | $ | (0.28 | ) |
| Diluted | | $ | 1.64 | | | $ | 1.92 | | | $ | (0.28 | ) |
| | | | | | | | | | | | | |
| Worldwide Effective Tax Rate | | | 40% | | | 42% | | | 2% |
Investor Relations Supplemental Schedules
Investor Relations Supplemental Schedules
| OCCIDENTAL PETROLEUM |
| 2012 Second Quarter Net Income (Loss) |
| Reported Income Comparison |
| | | | | | | | | | | | | |
| | | Second | | Second | | | | |
| | | Quarter | | Quarter | | | | |
| | | 2012 | | 2011 | | B / (W) |
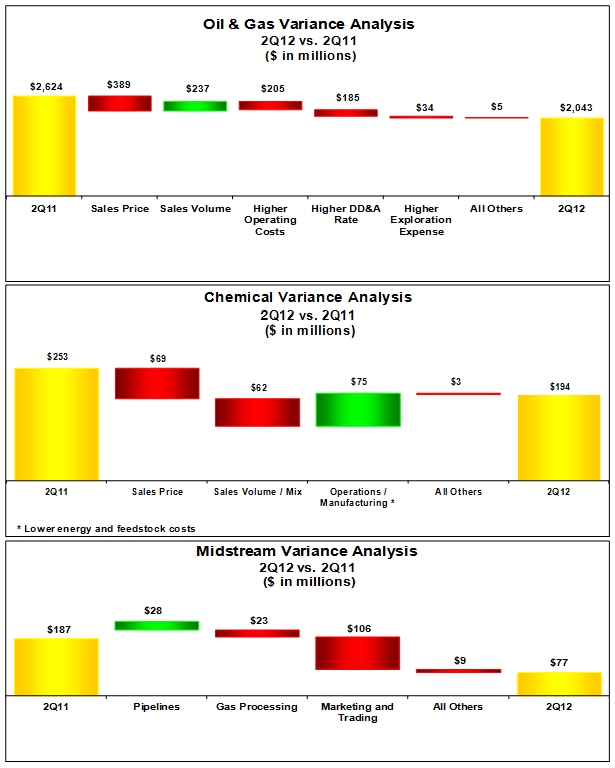
| Oil & Gas | | $ | 2,043 | | | $ | 2,624 | | | $ | (581 | ) |
| Chemical | | | 194 | | | | 253 | | | | (59 | ) |
| Midstream, marketing and other | | | 77 | | | | 187 | | | | (110 | ) |
| Corporate | | | | | | | | | | | | |
| Interest expense, net | | | (25 | ) | | | (22 | ) | | | (3 | ) |
| Other | | | (82 | ) | | | (112 | ) | | | 30 | |
| Taxes | | | (875 | ) | | | (1,111 | ) | | | 236 | |
| Income from continuing operations | | | 1,332 | | | | 1,819 | | | | (487 | ) |
| Discontinued operations, net | | | (4 | ) | | | (2 | ) | | | (2 | ) |
| Net Income | | $ | 1,328 | | | $ | 1,817 | | | $ | (489 | ) |
| | | | | | | | | | | | | |
| Earnings Per Common Share | | | | | | | | | | | | |
| Basic | | $ | 1.64 | | | $ | 2.23 | | | $ | (0.59 | ) |
| Diluted | | $ | 1.64 | | | $ | 2.23 | | | $ | (0.59 | ) |
| | | | | | | | | | | | | |
| | | | | | | | | | | | | |
| Worldwide Effective Tax Rate | | | 40% | | | 38% | | | -2% |
| | | | | | | | | | | | | |
| | | | | | | | | | | | | |
| | | | | | | | | | | | | |
| | | | | | | | | | | | | |
| | | | | | | | | | | | | |
| OCCIDENTAL PETROLEUM |
| 2012 Second Quarter Net Income (Loss) |
| Core Results Comparison |
| | | | | | | | | | | | | |
| | | Second | | Second | | | | |
| | | Quarter | | Quarter | | | | |
| | | 2012 | | 2011 | | B / (W) |
| Oil & Gas | | $ | 2,043 | | | $ | 2,624 | | | $ | (581 | ) |
| Chemical | | | 194 | | | | 253 | | | | (59 | ) |
| Midstream, marketing and other | | | 77 | | | | 187 | | | | (110 | ) |
| Corporate | | | | | | | | | | | | |
| Interest expense, net | | | (25 | ) | | | (22 | ) | | | (3 | ) |
| Other | | | (82 | ) | | | (112 | ) | | | 30 | |
| Taxes | | | (875 | ) | | | (1,111 | ) | | | 236 | |
| Core Results | | $ | 1,332 | | | $ | 1,819 | | | $ | (487 | ) |
| | | | | | | | | | | | | |
| Core Results Per Common Share | | | | | | | | | | | | |
| Basic | | $ | 1.64 | | | $ | 2.23 | | | $ | (0.59 | ) |
| Diluted | | $ | 1.64 | | | $ | 2.23 | | | $ | (0.59 | ) |
| | | | | | | | | | | | | |
| Worldwide Effective Tax Rate | | | 40% | | | 38% | | | -2% |
Investor Relations Supplemental Schedules
Investor Relations Supplemental Schedules
| OCCIDENTAL PETROLEUM |
| SUMMARY OF OPERATING STATISTICS |
| | | | | | | | | | | | | | | |
| | | | Second Quarter | | | Six Months |
| | | | 2012 | | 2011 | | | 2012 | | 2011 |
| NET PRODUCTION PER DAY: | | | | | | | | | | | | | | |
| | | | | | | | | | | | | | | |
| United States | | | | | | | | | | | | | | |
| Crude Oil (MBBL) | | | | | | | | | | | | | | |
| | California | | 88 | | | 78 | | | | 87 | | | 77 | |
| | Permian | | 138 | | | 132 | | | | 139 | | | 132 | |
| Midcontinent and other | | 23 | | | 16 | | | | 20 | | | 15 | |
| | Total | | 249 | | | 226 | | | | 246 | | | 224 | |
| NGL (MBBL) | | | | | | | | | | | | | | |
| | California | | 15 | | | 15 | | | | 15 | | | 15 | |
| | Permian | | 39 | | | 40 | | | | 39 | | | 38 | |
| Midcontinent and other | | 19 | | | 16 | | | | 19 | | | 12 | |
| | Total | | 73 | | | 71 | | | | 73 | | | 65 | |
| Natural Gas (MMCF) | | | | | | | | | | | | | | |
| | California | | 269 | | | 252 | | | | 268 | | | 247 | |
| | Permian | | 151 | | | 143 | | | | 153 | | | 154 | |
| Midcontinent and other | | 420 | | | 366 | | | | 416 | | | 347 | |
| | Total | | 840 | | | 761 | | | | 837 | | | 748 | |
| | | | | | | | | | | | | | | |
| | | | | | | | | | | | | | | |
| Latin America | | | | | | | | | | | | | | |
| | | | | | | | | | | | | | | |
| Crude Oil (MBBL) | Colombia | | 31 | | | 30 | | | | 27 | | | 31 | |
| | | | | | | | | | | | | | | |
| Natural Gas (MMCF) | Bolivia | | 14 | | | 16 | | | | 14 | | | 16 | |
| | | | | | | | | | | | | | | |
| | | | | | | | | | | | | | | |
| Middle East / North Africa | | | | | | | | | | | | | | |
| Crude Oil (MBBL) | | | | | | | | | | | | | | |
| | Bahrain | | 4 | | | 3 | | | | 4 | | | 3 | |
| | Dolphin | | 9 | | | 10 | | | | 9 | | | 10 | |
| | Oman | | 62 | | | 68 | | | | 63 | | | 67 | |
| | Qatar | | 74 | | | 68 | | | | 73 | | | 72 | |
| | Other | | 32 | | | 28 | | | | 37 | | | 43 | |
| | Total | | 181 | | | 177 | | | | 186 | | | 195 | |
| | | | | | | | | | | | | | | |
| NGL (MBBL) | Dolphin | | 9 | | | 11 | | | | 9 | | | 10 | |
| | | | | | | | | | | | | | | |
| Natural Gas (MMCF) | | | | | | | | | | | | | | |
| | Bahrain | | 230 | | | 172 | | | | 224 | | | 172 | |
| | Dolphin | | 194 | | | 203 | | | | 183 | | | 199 | |
| | Oman | | 57 | | | 49 | | | | 57 | | | 50 | |
| | Total | | 481 | | | 424 | | | | 464 | | | 421 | |
| | | | | | | | | | | | | | | |
| | | | | | | | | | | | | | | |
| Barrels of Oil Equivalent (MBOE) | | | 766 | | | 715 | | | | 760 | | | 723 | |
Investor Relations Supplemental Schedules
| OCCIDENTAL PETROLEUM | | | | | |
| SUMMARY OF OPERATING STATISTICS | | | | | |
| | | | | | | | | | | | | | | |
| | | | Second Quarter | | | Six Months |
| | | | 2012 | | 2011 | | | 2012 | | 2011 |
| NET SALES VOLUMES PER DAY: | | | | | | | | | | | | | | |
| United States | | | | | | | | | | | | | | |
| Crude Oil (MBBL) | | | 249 | | | 226 | | | | 246 | | | 224 | |
| NGL (MBBL) | | | 73 | | | 71 | | | | 73 | | | 65 | |
| Natural Gas (MMCF) | | | 835 | | | 761 | | | | 835 | | | 748 | |
| | | | | | | | | | | | | | | |
| Latin America | | | | | | | | | | | | | | |
| Crude Oil (MBBL) | | | 31 | | | 30 | | | | 27 | | | 31 | |
| Natural Gas (MMCF) | | | 14 | | | 16 | | | | 14 | | | 16 | |
| | | | | | | | | | | | | | | |
| Middle East / North Africa | | | | | | | | | | | | | | |
| Crude Oil (MBBL) | | | | | | | | | | | | | | |
| | Bahrain | | 4 | | | 3 | | | | 4 | | | 3 | |
| | Dolphin | | 8 | | | 10 | | | | 8 | | | 10 | |
| | Oman | | 60 | | | 66 | | | | 63 | | | 69 | |
| | Qatar | | 73 | | | 65 | | | | 71 | | | 71 | |
| | Other | | 30 | | | 23 | | | | 32 | | | 36 | |
| | Total | | 175 | | | 167 | | | | 178 | | | 189 | |
| | | | | | | | | | | | | | | |
| NGL (MBBL) | Dolphin | | 9 | | | 11 | | | | 9 | | | 10 | |
| | | | | | | | | | | | | | | |
| Natural Gas (MMCF) | | | 481 | | | 424 | | | | 464 | | | 421 | |
| | | | | | | | | | | | | | | |
| | | | | | | | | | | | | | | |
| Barrels of Oil Equivalent (MBOE) | | | 759 | | | 705 | | | | 752 | | | 717 | |
Investor Relations Supplemental Schedules
| OCCIDENTAL PETROLEUM |
| SUMMARY OF OPERATING STATISTICS |
| | | | | | | | | | | | | | | | | | |
| | | | Second Quarter | | Six Months |
| | | | 2012 | | 2011 | | 2012 | | 2011 |
| | | | | | | | | | | | | | | | | | |
| OIL & GAS: | | | | | | | | | | | | | | | | | |
| PRICES | | | | | | | | | | | | | | | | | |
| United States | | | | | | | | | | | | | | | | | |
| Crude Oil ($/BBL) | | | | 92.34 | | | | 98.74 | | | | 97.88 | | | | 93.45 | |
| NGL ($/BBL) | | | | 43.75 | | | | 61.30 | | | | 49.14 | | | | 58.87 | |
| Natural gas ($/MCF) | | | | 2.09 | | | | 4.27 | | | | 2.46 | | | | 4.24 | |
| | | | | | | | | | | | | | | | | | |
| Latin America | | | | | | | | | | | | | | | | | |
| Crude Oil ($/BBL) | | | | 98.15 | | | | 103.22 | | | | 100.40 | | | | 97.75 | |
| Natural Gas ($/MCF) | | | | 12.06 | | | | 9.55 | | | | 11.84 | | | | 8.88 | |
| | | | | | | | | | | | | | | | | | |
| Middle East / North Africa | | | | | | | | | | | | | | | | | |
| Crude Oil ($/BBL) | | | | 109.70 | | | | 109.11 | | | | 112.28 | | | | 102.05 | |
| NGL ($/BBL) | | | | 29.32 | | | | 33.50 | | | | 34.76 | | | | 33.71 | |
| | | | | | | | | | | | | | | | | | |
| Total Worldwide | | | | | | | | | | | | | | | | | |
| Crude Oil ($/BBL) | | | | 99.34 | | | | 103.12 | | | | 103.63 | | | | 97.38 | |
| NGL ($/BBL) | | | | 42.06 | | | | 57.67 | | | | 47.52 | | | | 55.38 | |
| Natural Gas ($/MCF) | | | | 1.72 | | | | 3.12 | | | | 1.97 | | | | 3.08 | |
| | | | | | | | | | | | | | | | | | |
| | | | | | | | | | | | | | | | | | |
| | | | | | | | | | | | | | | | | | |
| | | | Second Quarter | | Six Months |
| | | | 2012 | | 2011 | | 2012 | | 2011 |
| Exploration Expense | | | | | | | | | | | | | | | | | |
| United States | | | $ | 80 | | | $ | 59 | | | $ | 141 | | | $ | 99 | |
| Latin America | | | | - | | | | - | | | | - | | | | - | |
| Middle East / North Africa | | | | 16 | | | | 3 | | | | 53 | | | | 47 | |
| TOTAL REPORTED | | | $ | 96 | | | $ | 62 | | | $ | 194 | | | $ | 146 | |
| Less - non-core impairments | | | | - | | | | - | | | | - | | | | (35 | ) |
| TOTAL CORE | | | $ | 96 | | | $ | 62 | | | $ | 194 | | | $ | 111 | |
Investor Relations Supplemental Schedules
| OCCIDENTAL PETROLEUM |
| SUMMARY OF OPERATING STATISTICS |
| | | | | | | | | | | | | | | | | |
| | | | | | | | | | | | | | | | | |
| | | Second Quarter | | Six Months |
| Capital Expenditures ($MM) | 2012 | | 2011 | | 2012 | | 2011 |
| Oil & Gas | | | | | | | | | | | | | | | | |
| California | | $ | 580 | | | $ | 413 | | | $ | 1,103 | | | $ | 721 | |
| Permian | | | 508 | | | | 237 | | | | 937 | | | | 453 | |
| Midcontinent and other | | 418 | | | | 234 | | | | 842 | | | | 414 | |
| Latin America | | | 67 | | | | 45 | | | | 109 | | | | 87 | |
| Middle East / North Africa | | 430 | | | | 303 | | | | 858 | | | | 655 | |
| Exploration | | | 183 | | | | 111 | | | | 354 | | | | 176 | |
| Chemicals | | | 75 | | | | 37 | | | | 117 | | | | 59 | |
| Midstream, marketing and other | | 422 | | | | 243 | | | | 754 | | | | 370 | |
| Corporate | | | 30 | | | | 10 | | | | 51 | | | | 23 | |
| | TOTAL | $ | 2,713 | | | $ | 1,633 | | | $ | 5,125 | | | $ | 2,958 | |
| | | | | | | | | | | | | | | | | |
| | | | | | | | | | | | | | | | | |
| Depreciation, Depletion & | Second Quarter | | Six Months |
| Amortization of Assets ($MM) | 2012 | | 2011 | | 2012 | | 2011 |
| Oil & Gas | | | | | | | | | | | | | | | | |
| Domestic | | $ | 582 | | | $ | 410 | | | $ | 1,170 | | | $ | 817 | |
| Latin America | | | 31 | | | | 21 | | | | 56 | | | | 49 | |
| Middle East / North Africa | | 328 | | | | 274 | | | | 663 | | | | 596 | |
| Chemicals | | | 86 | | | | 85 | | | | 171 | | | | 167 | |
| Midstream, marketing and other | | 54 | | | | 44 | | | | 100 | | | | 89 | |
| Corporate | | | 6 | | | | 5 | | | | 12 | | | | 11 | |
| | TOTAL | $ | 1,087 | | | $ | 839 | | | $ | 2,172 | | | $ | 1,729 | |
Investor Relations Supplemental Schedules
| OCCIDENTAL PETROLEUM | |
| CORPORATE | |
| ($ millions) | |
| | | | | | | | | | | | | |
| | | 30-Jun-12 | | 31-Dec-11 |
| | | | | | | | | | | | | |
| CAPITALIZATION | | | | | | | | | | | | |
| | | | | | | | | | | | | |
| Long-Term Debt (including short-term borrowings) | | | $ | 7,620 | | | | | $ | 5,871 | | |
| | | | | | | | | | | | | |
| EQUITY | | | $ | 39,550 | | | | | $ | 37,620 | | |
| | | | | | | | | | | | | |
| Total Debt To Total Capitalization | | | | 16% | | | | | 13% | |
15