EXHIBIT 99.3
Investor Relations Supplemental Schedules

| Investor Relations Supplemental Schedules |
| Summary |
| ($ Millions, except per share amounts) |
| | | | |
| | | | |
| | | | |
| | | | |
| | 4Q 2012 | | 4Q 2011 |
| | | | |
| Core Results | $1,479 | | $1,641 |
| EPS – Diluted | $1.83 | | $2.02 |
| | | | |
| Reported Net Income | $336 | | $1,634 |
| EPS - Diluted | $0.42 | | $2.01 |
| | | | |
| Total Worldwide Sales Volumes (mboe/day) | 784 | | 749 |
| Total Worldwide Production Volumes (mboe/day) | 779 | | 748 |
| | | | |
| Total Worldwide Crude Oil Realizations ($/BBL) | $96.19 | | $99.62 |
| Total Worldwide NGL Realizations ($/BBL) | $45.08 | | $55.25 |
| Domestic Natural Gas Realizations ($/MCF) | $3.09 | | $3.59 |
| | | | |
| Wtd. Average Basic Shares O/S (mm) | 807.1 | | 810.7 |
| Wtd. Average Diluted Shares O/S (mm) | 807.7 | | 811.5 |
| | | | |
| | | | |
| | YTD 2012 | | YTD 2011 |
| | | | |
| Core Results | $5,750 | | $6,828 |
| EPS - Diluted | $7.09 | | $8.39 |
| | | | |
| Reported Net Income | $4,598 | | $6,771 |
| EPS - Diluted | $5.67 | | $8.32 |
| | | | |
| Total Worldwide Sales Volumes (mboe/day) | 764 | | 731 |
| Total Worldwide Production Volumes (mboe/day) | 766 | | 733 |
| | | | |
| Total Worldwide Crude Oil Realizations ($/BBL) | $99.87 | | $97.92 |
| Total Worldwide NGL Realizations ($/BBL) | $45.18 | | $55.53 |
| Domestic Natural Gas Realizations ($/MCF) | $2.62 | | $4.06 |
| | | | |
| Wtd. Average Basic Shares O/S (mm) | 809.3 | | 812.1 |
| Wtd. Average Diluted Shares O/S (mm) | 810.0 | | 812.9 |
| | | | |
| Shares Outstanding (mm) | 805.5 | | 811.0 |
| | | | |
| Cash Flow from Operations | $ 11,300 | | $ 12,300 |
Investor Relations Supplemental Schedules
| OCCIDENTAL PETROLEUM |
| 2012 Fourth Quarter |
| Net Income (Loss) |
| ($ millions, except per share amounts) |
| | | | | | | | | | | | | | |
| | | | | | | | | | | | | | |
| | Reported | | | | | | | | Core |
| | Income | | Significant Items Affecting Income | | Results |
| Oil & Gas | $ | 522 | | | $ | 1,731 | | | Asset impairments and related items | | $ | 2,253 | |
| | | | | | | | | | | | | | |
| | | | | | | | | | | | | | |
| Chemical | | 180 | | | | | | | | | | 180 | |
| | | | | | | | | | | | | | |
| Midstream, marketing and other | | 75 | | | | | | | | | | 75 | |
| | | | | | | | | | | | | | |
| Corporate | | | | | | | | | | | | | |
| Interest expense, net | | (30 | ) | | | | | | | | | (30 | ) |
| | | | | | | | | | | | | | |
| Other | | (134 | ) | | | 20 | | | Litigation reserves | | | (114 | ) |
| | | | | | | | | | | | | | |
| Taxes | | (249 | ) | | | (636 | ) | | Tax effect of adjustments | | | (885 | ) |
| | | | | | | | | | | | | | |
| | | | | | | | | | | | | | |
| Income from continuing operations | | 364 | | | | 1,115 | | | | | | 1,479 | |
| Discontinued operations, net of tax | | (28 | ) | | | 28 | | | Discontinued operations, net | | | - | |
| Net Income | $ | 336 | | | $ | 1,143 | | | | | $ | 1,479 | |
| | | | | | | | | | | | | | |
| | | | | | | | | | | | | | |
| Basic Earnings Per Common Share | | | | | | | | | | | | | |
| Income from continuing operations | $ | 0.45 | | | | | | | | | | | |
| Discontinued operations, net | | (0.03 | ) | | | | | | | | | | |
| Net Income | $ | 0.42 | | | | | | | | | $ | 1.83 | |
| | | | | | | | | | | | | | |
| Diluted Earnings Per Common Share | | | | | | | | | | | | | |
| Income from continuing operations | $ | 0.45 | | | | | | | | | | | |
| Discontinued operations, net | | (0.03 | ) | | | | | | | | | | |
| Net Income | $ | 0.42 | | | | | | | | | $ | 1.83 | |
Investor Relations Supplemental Schedules
| OCCIDENTAL PETROLEUM |
| 2011 Fourth Quarter |
| Net Income (Loss) |
| ($ millions, except per share amounts) |
| | | | | | | | | | | | | | |
| | | | | | | | | | | | | | |
| | Reported | | | | | | | | Core |
| | Income | | Significant Items Affecting Income | | Results |
| Oil & Gas | $ | 2,537 | | | | | | | | | $ | 2,537 | |
| | | | | | | | | | | | | | |
| Chemical | | 144 | | | | | | | | | | 144 | |
| | | | | | | | | | | | | | |
| Midstream, marketing and other | | 70 | | | | | | | | | | 70 | |
| | | | | | | | | | | | | | |
| Corporate | | | | | | | | | | | | | |
| Interest expense, net | | (25 | ) | | | | | | | | | (25 | ) |
| | | | | | | | | | | | | | |
| Other | | (136 | ) | | | | | | | | | (136 | ) |
| | | | | | | | | | | | | | |
| Taxes | | (949 | ) | | | | | | | | | (949 | ) |
| | | | | | | | | | | | | | |
| | | | | | | | | | | | | | |
| Income from continuing operations | | 1,641 | | | | - | | | | | | 1,641 | |
| Discontinued operations, net of tax | | (7 | ) | | | 7 | | | Discontinued operations, net | | | - | |
| Net Income | $ | 1,634 | | | $ | 7 | | | | | $ | 1,641 | |
| | | | | | | | | | | | | | |
| | | | | | | | | | | | | | |
| Basic Earnings Per Common Share | | | | | | | | | | | | | |
| Income from continuing operations | $ | 2.02 | | | | | | | | | | | |
| Discontinued operations, net | | (0.01 | ) | | | | | | | | | | |
| Net Income | $ | 2.01 | | | | | | | | | $ | 2.02 | |
| | | | | | | | | | | | | | |
| Diluted Earnings Per Common Share | | | | | | | | | | | | | |
| Income from continuing operations | $ | 2.02 | | | | | | | | | | | |
| Discontinued operations, net | | (0.01) | | | | | | | | | | | |
| Net Income | $ | 2.01 | | | | | | | | | $ | 2.02 | |
Investor Relations Supplemental Schedules
| OCCIDENTAL PETROLEUM |
| 2012 Twelve Months |
| Net Income (Loss) |
| ($ millions, except per share amounts) |
| | | | | | | | | | | | | | |
| | | | | | | | | | | | | | |
| | Reported | | | | | | | | Core |
| | Income | | Significant Items Affecting Income | | Results |
| Oil & Gas | $ | 7,095 | | | $ | 1,731 | | | Asset impairments and related items | | $ | 8,826 | |
| | | | | | | | | | | | | | |
| | | | | | | | | | | | | | |
| Chemical | | 720 | | | | | | | | | | 720 | |
| | | | | | | | | | | | | | |
| Midstream, marketing and other | | 439 | | | | | | | | | | 439 | |
| | | | | | | | | | | | | | |
| Corporate | | | | | | | | | | | | | |
| Interest expense, net | | (117 | ) | | | | | | | | | (117 | ) |
| | | | | | | | | | | | | | |
| Other | | (384 | ) | | | 20 | | | Litigation reserves | | | (364 | ) |
| | | | | | | | | | | | | | |
| Taxes | | (3,118 | ) | | | (636 | ) | | Tax effect of adjustments | | | (3,754 | ) |
| | | | | | | | | | | | | | |
| | | | | | | | | | | | | | |
| Income from continuing operations | | 4,635 | | | | 1,115 | | | | | | 5,750 | |
| Discontinued operations, net of tax | | (37 | ) | | | 37 | | | Discontinued operations, net | | | - | |
| Net Income | $ | 4,598 | | | $ | 1,152 | | | | | $ | 5,750 | |
| | | | | | | | | | | | | | |
| | | | | | | | | | | | | | |
| Basic Earnings Per Common Share | | | | | | | | | | | | | |
| Income from continuing operations | $ | 5.72 | | | | | | | | | | | |
| Discontinued operations, net | | (0.05 | ) | | | | | | | | | | |
| Net Income | $ | 5.67 | | | | | | | | | $ | 7.09 | |
| | | | | | | | | | | | | | |
| Diluted Earnings Per Common Share | | | | | | | | | | | | | |
| Income from continuing operations | $ | 5.71 | | | | | | | | | | | |
| Discontinued operations, net | | (0.04 | ) | | | | | | | | | | |
| Net Income | $ | 5.67 | | | | | | | | | $ | 7.09 | |
Investor Relations Supplemental Schedules
| OCCIDENTAL PETROLEUM |
| 2011 Twelve Months |
| Net Income (Loss) |
| ($ millions, except per share amounts) |
| | | | | | | | | | | | | | |
| | | | | | | | | | | | | | |
| | Reported | | | | | | | | Core |
| | Income | | Significant Items Affecting Income | | Results |
| Oil & Gas | $ | 10,241 | | | $ | 35 | | | Libya exploration write-off | | $ | 10,283 | |
| | | | | | | (22 | ) | | Gain on sale of Colombia pipeline interest | |
| | | | | | | 29 | | | Foreign tax | | | | |
| | | | | | | | | | | | | | |
| Chemical | | 861 | | | | | | | | | | 861 | |
| | | | | | | | | | | | | | |
| Midstream, marketing and other | | 448 | | | | | | | | | | 448 | |
| | | | | | | | | | | | | | |
| Corporate | | | | | | | | | | | | | |
| Interest expense, net | | (284 | ) | | | 163 | | | Premium on debt extinguishments | | | (121 | ) |
| | | | | | | | | | | | | | |
| Other | | (425 | ) | | | | | | | | | (425 | ) |
| | | | | | | | | | | | | | |
| Taxes | | (4,201 | ) | | | (50 | ) | | Tax effect of adjustments | | | (4,218 | ) |
| | | | | | | 33 | | | State income tax charge | | | | |
| | | | | | | | | | | | | | |
| Income from continuing operations | | 6,640 | | | | 188 | | | | | | 6,828 | |
| Discontinued operations, net of tax | | 131 | | | | (131 | ) | | Discontinued operations, net | | | - | |
| Net Income | $ | 6,771 | | | $ | 57 | | | | | $ | 6,828 | |
| | | | | | | | | | | | | | |
| | | | | | | | | | | | | | |
| Basic Earnings Per Common Share | | | | | | | | | | | | | |
| Income from continuing operations | $ | 8.16 | | | | | | | | | | | |
| Discontinued operations, net | | 0.16 | | | | | | | | | | | |
| Net Income | $ | 8.32 | | | | | | | | | $ | 8.39 | |
| | | | | | | | | | | | | | |
| Diluted Earnings Per Common Share | | | | | | | | | | | | | |
| Income from continuing operations | $ | 8.16 | | | | | | | | | | | |
| Discontinued operations, net | | 0.16 | | | | | | | | | | | |
| Net Income | $ | 8.32 | | | | | | | | | $ | 8.39 | |
Investor Relations Supplemental Schedules
| OCCIDENTAL PETROLEUM |
| Worldwide Effective Tax Rate |
| | | | | | | | | | | | | | | |
| | QUARTERLY | | YEAR-TO-DATE |
| | 2012 | | 2012 | | 2011 | | 2012 | | 2011 |
| REPORTED INCOME | QTR 4 | | QTR 3 | | QTR 4 | | 12 Months | | 12 Months |
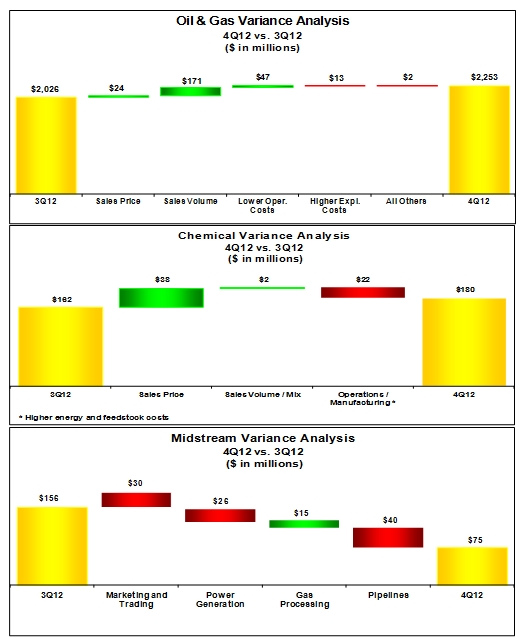
| Oil & Gas | 522 | | | 2,026 | | | 2,537 | | | 7,095 | | | 10,241 | |
| Chemical | 180 | | | 162 | | | 144 | | | 720 | | | 861 | |
| Midstream, marketing and other | 75 | | | 156 | | | 70 | | | 439 | | | 448 | |
| Corporate & other | (164 | ) | | (110 | ) | | (161 | ) | | (501 | ) | | (709 | ) |
| Pre-tax income | 613 | | | 2,234 | | | 2,590 | | | 7,753 | | | 10,841 | |
| | | | | | | | | | | | | | | |
| Income tax expense | | | | | | | | | | | | | | |
| Federal and state | (293 | ) | | 286 | | | 435 | | | 694 | | | 1,795 | |
| Foreign | 542 | | | 569 | | | 514 | | | 2,424 | | | 2,406 | |
| Total | 249 | | | 855 | | | 949 | | | 3,118 | | | 4,201 | |
| | | | | | | | | | | | | | | |
| Income from continuing operations | 364 | | | 1,379 | | | 1,641 | | | 4,635 | | | 6,640 | |
| | | | | | | | | | | | | | | |
| Worldwide effective tax rate | 41% | | 38% | | 37% | | 40% | | 39% |
| | | | | | | | | | | | | | | |
| | | | | | | | | | | | | | | |
| | 2012 | | 2012 | | 2011 | | 2012 | | 2011 |
| CORE RESULTS | QTR 4 | | QTR 3 | | QTR 4 | | 12 Months | | 12 Months |
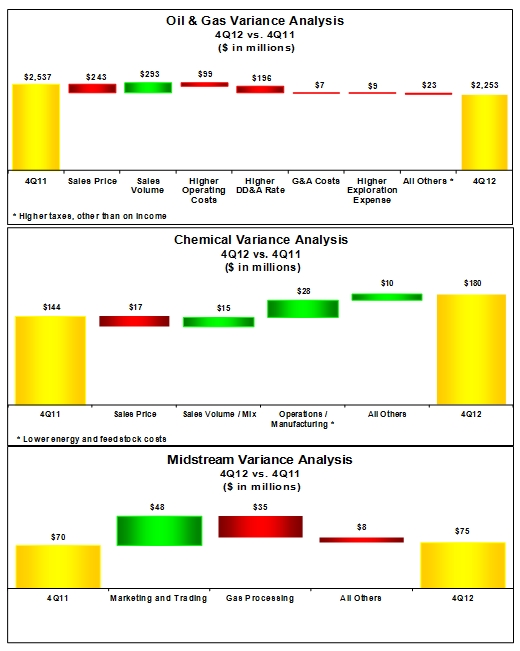
| Oil & Gas | 2,253 | | | 2,026 | | | 2,537 | | | 8,826 | | | 10,283 | |
| Chemical | 180 | | | 162 | | | 144 | | | 720 | | | 861 | |
| Midstream, marketing and other | 75 | | | 156 | | | 70 | | | 439 | | | 448 | |
| Corporate & other | (144 | ) | | (110 | ) | | (161 | ) | | (481 | ) | | (546 | ) |
| Pre-tax income | 2,364 | | | 2,234 | | | 2,590 | | | 9,504 | | | 11,046 | |
| | | | | | | | | | | | | | | |
| Income tax expense | | | | | | | | | | | | | | |
| Federal and state | 343 | | | 286 | | | 435 | | | 1,330 | | | 1,825 | |
| Foreign | 542 | | | 569 | | | 514 | | | 2,424 | | | 2,393 | |
| Total | 885 | | | 855 | | | 949 | | | 3,754 | | | 4,218 | |
| | | | | | | | | | | | | | | |
| Core results | 1,479 | | | 1,379 | | | 1,641 | | | 5,750 | | | 6,828 | |
| | | | | | | | | | | | | | | |
| Worldwide effective tax rate | 37% | | 38% | | 37% | | 39% | | 38% |
Investor Relations Supplemental Schedules
| OCCIDENTAL PETROLEUM |
| 2012 Fourth Quarter Net Income (Loss) |
| Reported Income Comparison |
| | | | | | | | | | | | | |
| | | Fourth | | Third | | | | |
| | | Quarter | | Quarter | | | | |
| | | 2012 | | 2012 | | B / (W) |
| Oil & Gas | | $ | 522 | | | $ | 2,026 | | | $ | (1,504 | ) |
| Chemical | | | 180 | | | | 162 | | | | 18 | |
| Midstream, marketing and other | | | 75 | | | | 156 | | | | (81 | ) |
| Corporate | | | | | | | | | | | | |
| Interest expense, net | | | (30 | ) | | | (34 | ) | | | 4 | |
| Other | | | (134 | ) | | | (76 | ) | | | (58 | ) |
| Taxes | | | (249 | ) | | | (855 | ) | | | 606 | |
| Income from continuing operations | | | 364 | | | | 1,379 | | | | (1,015 | ) |
| Discontinued operations, net | | | (28 | ) | | | (4 | ) | | | (24 | ) |
| Net Income | | $ | 336 | | | $ | 1,375 | | | $ | (1,039 | ) |
| | | | | | | | | | | | | |
| Earnings Per Common Share | | | | | | | | | | | | |
| Basic | | $ | 0.42 | | | $ | 1.69 | | | $ | (1.27 | ) |
| Diluted | | $ | 0.42 | | | $ | 1.69 | | | $ | (1.27 | ) |
| | | | | | | | | | | | | |
| | | | | | | | | | | | | |
| Worldwide Effective Tax Rate | | | 41% | | | 38% | | | -3% |
| | | | | | | | | | | | | |
| | | | | | | | | | | | | |
| | | | | | | | | | | | | |
| OCCIDENTAL PETROLEUM |
| 2012 Fourth Quarter Net Income (Loss) |
| Core Results Comparison |
| | | | | | | | | | | | | |
| | | Fourth | | Third | | | | |
| | | Quarter | | Quarter | | | | |
| | | 2012 | | 2012 | | B / (W) |
| Oil & Gas | | $ | 2,253 | | | $ | 2,026 | | | $ | 227 | |
| Chemical | | | 180 | | | | 162 | | | | 18 | |
| Midstream, marketing and other | | | 75 | | | | 156 | | | | (81 | ) |
| Corporate | | | | | | | | | | | | |
| Interest expense, net | | | (30 | ) | | | (34 | ) | | | 4 | |
| Other | | | (114 | ) | | | (76 | ) | | | (38 | ) |
| Taxes | | | (885 | ) | | | (855 | ) | | | (30 | ) |
| Core Results | | $ | 1,479 | | | $ | 1,379 | | | $ | 100 | |
| | | | | | | | | | | | | |
| Core Results Per Common Share | | | | | | | | | | | | |
| Basic | | $ | 1.83 | | | $ | 1.70 | | | $ | 0.13 | |
| Diluted | | $ | 1.83 | | | $ | 1.70 | | | $ | 0.13 | |
| | | | | | | | | | | | | |
| Worldwide Effective Tax Rate | | | 37% | | | 38% | | | 1% |
Investor Relations Supplemental Schedules
Investor Relations Supplemental Schedules
| OCCIDENTAL PETROLEUM |
| 2012 Fourth Quarter Net Income (Loss) |
| Reported Income Comparison |
| | | | | | | | | | | | | |
| | | Fourth | | Fourth | | | | |
| | | Quarter | | Quarter | | | | |
| | | 2012 | | 2011 | | B / (W) |
| Oil & Gas | | $ | 522 | | | $ | 2,537 | | | $ | (2,015 | ) |
| Chemical | | | 180 | | | | 144 | | | | 36 | |
| Midstream, marketing and other | | | 75 | | | | 70 | | | | 5 | |
| Corporate | | | | | | | | | | | | |
| Interest expense, net | | | (30 | ) | | | (25 | ) | | | (5 | ) |
| Other | | | (134 | ) | | | (136 | ) | | | 2 | |
| Taxes | | | (249 | ) | | | (949 | ) | | | 700 | |
| Income from continuing operations | | | 364 | | | | 1,641 | | | | (1,277 | ) |
| Discontinued operations, net | | | (28 | ) | | | (7 | ) | | | (21 | ) |
| Net Income | | $ | 336 | | | $ | 1,634 | | | $ | (1,298 | ) |
| | | | | | | | | | | | | |
| Earnings Per Common Share | | | | | | | | | | | | |
| Basic | | $ | 0.42 | | | $ | 2.01 | | | $ | (1.59 | ) |
| Diluted | | $ | 0.42 | | | $ | 2.01 | | | $ | (1.59 | ) |
| | | | | | | | | | | | | |
| | | | | | | | | | | | | |
| Worldwide Effective Tax Rate | | | 41% | | | 37% | | | -4% |
| | | | | | | | | | | | | |
| | | | | | | | | | | | | |
| | | | | | | | | | | | | |
| | | | | | | | | | | | | |
| | | | | | | | | | | | | |
| OCCIDENTAL PETROLEUM |
| 2012 Fourth Quarter Net Income (Loss) |
| Core Results Comparison |
| | | | | | | | | | | | | |
| | | Fourth | | Fourth | | | | |
| | | Quarter | | Quarter | | | | |
| | | 2012 | | 2011 | | B / (W) |
| Oil & Gas | | $ | 2,253 | | | $ | 2,537 | | | $ | (284 | ) |
| Chemical | | | 180 | | | | 144 | | | | 36 | |
| Midstream, marketing and other | | | 75 | | | | 70 | | | | 5 | |
| Corporate | | | | | | | | | | | | |
| Interest expense, net | | | (30 | ) | | | (25 | ) | | | (5 | ) |
| Other | | | (114 | ) | | | (136 | ) | | | 22 | |
| Taxes | | | (885 | ) | | | (949 | ) | | | 64 | |
| Core Results | | $ | 1,479 | | | $ | 1,641 | | | $ | (162 | ) |
| | | | | | | | | | | | | |
| Core Results Per Common Share | | | | | | | | | | | | |
| Basic | | $ | 1.83 | | | $ | 2.02 | | | $ | (0.19 | ) |
| Diluted | | $ | 1.83 | | | $ | 2.02 | | | $ | (0.19 | ) |
| | | | | | | | | | | | | |
| Worldwide Effective Tax Rate | | | 37% | | | 37% | | | 0% |
Investor Relations Supplemental Schedules
Investor Relations Supplemental Schedules
| OCCIDENTAL PETROLEUM |
| SUMMARY OF OPERATING STATISTICS |
| | | | | | | | | | | | | | | |
| | | | Fourth Quarter | | | Twelve Months |
| | | | 2012 | | 2011 | | | 2012 | | 2011 |
| NET PRODUCTION PER DAY: | | | | | | | | | | | | | | |
| | | | | | | | | | | | | | | |
| United States | | | | | | | | | | | | | | |
| Crude Oil (MBBL) | | | | | | | | | | | | | | |
| | California | | 92 | | | 84 | | | | 88 | | | 80 | |
| | Permian | | 146 | | | 137 | | | | 142 | | | 134 | |
| Midcontinent and other | | 27 | | | 19 | | | | 25 | | | 16 | |
| | Total | | 265 | | | 240 | | | | 255 | | | 230 | |
| NGL (MBBL) | | | | | | | | | | | | | | |
| | California | | 21 | | | 15 | | | | 17 | | | 15 | |
| | Permian | | 40 | | | 37 | | | | 39 | | | 38 | |
| Midcontinent and other | | 16 | | | 18 | | | | 17 | | | 16 | |
| | Total | | 77 | | | 70 | | | | 73 | | | 69 | |
| Natural Gas (MMCF) | | | | | | | | | | | | | | |
| | California | | 242 | | | 276 | | | | 256 | | | 260 | |
| | Permian | | 162 | | | 167 | | | | 155 | | | 157 | |
| Midcontinent and other | | 396 | | | 390 | | | | 410 | | | 365 | |
| | Total | | 800 | | | 833 | | | | 821 | | | 782 | |
| | | | | | | | | | | | | | | |
| | | | | | | | | | | | | | | |
| Latin America | | | | | | | | | | | | | | |
| | | | | | | | | | | | | | | |
| Crude Oil (MBBL) | Colombia | | 30 | | | 28 | | | | 29 | | | 29 | |
| | | | | | | | | | | | | | | |
| Natural Gas (MMCF) | Bolivia | | 12 | | | 14 | | | | 13 | | | 15 | |
| | | | | | | | | | | | | | | |
| | | | | | | | | | | | | | | |
| Middle East / North Africa | | | | | | | | | | | | | | |
| Crude Oil (MBBL) | | | | | | | | | | | | | | |
| | Bahrain | | 4 | | | 5 | | | | 4 | | | 4 | |
| | Dolphin | | 7 | | | 9 | | | | 8 | | | 9 | |
| | Oman | | 74 | | | 67 | | | | 67 | | | 67 | |
| | Qatar | | 71 | | | 76 | | | | 71 | | | 73 | |
| | Other | | 36 | | | 33 | | | | 36 | | | 38 | |
| | Total | | 192 | | | 190 | | | | 186 | | | 191 | |
| | | | | | | | | | | | | | | |
| NGL (MBBL) | Dolphin | | 7 | | | 9 | | | | 8 | | | 10 | |
| | Other | | - | | | - | | | | 1 | | | - | |
| | Total | | 7 | | | 9 | | | | 9 | | | 10 | |
| | | | | | | | | | | | | | | |
| Natural Gas (MMCF) | | | | | | | | | | | | | | |
| | Bahrain | | 242 | | | 180 | | | | 232 | | | 173 | |
| | Dolphin | | 138 | | | 181 | | | | 163 | | | 199 | |
| | Oman | | 56 | | | 58 | | | | 57 | | | 54 | |
| | Total | | 436 | | | 419 | | | | 452 | | | 426 | |
| | | | | | | | | | | | | | | |
| | | | | | | | | | | | | | | |
| Barrels of Oil Equivalent (MBOE) | | | 779 | | | 748 | | | | 766 | | | 733 | |
Investor Relations Supplemental Schedules
| OCCIDENTAL PETROLEUM | | | | | |
| SUMMARY OF OPERATING STATISTICS | | | | | |
| | | | | | | | | | | | | | | |
| | | | Fourth Quarter | | | Twelve Months |
| | | | 2012 | | 2011 | | | 2012 | | 2011 |
| NET SALES VOLUMES PER DAY: | | | | | | | | | | | | | | |
| United States | | | | | | | | | | | | | | |
| Crude Oil (MBBL) | | | 265 | | | 240 | | | | 255 | | | 230 | |
| NGL (MBBL) | | | 77 | | | 70 | | | | 73 | | | 69 | |
| Natural Gas (MMCF) | | | 800 | | | 833 | | | | 819 | | | 782 | |
| | | | | | | | | | | | | | | |
| Latin America | | | | | | | | | | | | | | |
| Crude Oil (MBBL) | | | 30 | | | 32 | | | | 28 | | | 29 | |
| Natural Gas (MMCF) | | | 12 | | | 14 | | | | 13 | | | 15 | |
| | | | | | | | | | | | | | | |
| Middle East / North Africa | | | | | | | | | | | | | | |
| Crude Oil (MBBL) | | | | | | | | | | | | | | |
| | Bahrain | | 4 | | | 5 | | | | 4 | | | 4 | |
| | Dolphin | | 7 | | | 9 | | | | 8 | | | 9 | |
| | Oman | | 70 | | | 66 | | | | 66 | | | 69 | |
| | Qatar | | 75 | | | 75 | | | | 71 | | | 73 | |
| | Other | | 39 | | | 31 | | | | 36 | | | 34 | |
| | Total | | 195 | | | 186 | | | | 185 | | | 189 | |
| | | | | | | | | | | | | | | |
| NGL (MBBL) | Dolphin | | 7 | | | 10 | | | | 8 | | | 10 | |
| | Other | | 2 | | | - | | | | 1 | | | - | |
| | Total | | 9 | | | 10 | | | | 9 | | | 10 | |
| | | | | | | | | | | | | | | |
| Natural Gas (MMCF) | | | 436 | | | 419 | | | | 452 | | | 426 | |
| | | | | | | | | | | | | | | |
| | | | | | | | | | | | | | | |
| Barrels of Oil Equivalent (MBOE) | | | 784 | | | 749 | | | | 764 | | | 731 | |
Investor Relations Supplemental Schedules
| OCCIDENTAL PETROLEUM |
| SUMMARY OF OPERATING STATISTICS |
| | | | | | | | | | | | | | | | | | |
| | | | Fourth Quarter | | Twelve Months |
| | | | 2012 | | 2011 | | 2012 | | 2011 |
| | | | | | | | | | | | | | | | | | |
| OIL & GAS: | | | | | | | | | | | | | | | | | |
| PRICES | | | | | | | | | | | | | | | | | |
| United States | | | | | | | | | | | | | | | | | |
| Crude Oil ($/BBL) | | | | 87.81 | | | | 94.50 | | | | 93.72 | | | | 92.80 | |
| NGL ($/BBL) | | | | 44.54 | | | | 58.85 | | | | 46.07 | | | | 59.10 | |
| Natural gas ($/MCF) | | | | 3.09 | | | | 3.59 | | | | 2.62 | | | | 4.06 | |
| | | | | | | | | | | | | | | | | | |
| Latin America | | | | | | | | | | | | | | | | | |
| Crude Oil ($/BBL) | | | | 97.95 | | | | 100.66 | | | | 98.35 | | | | 97.16 | |
| Natural Gas ($/MCF) | | | | 11.56 | | | | 11.63 | | | | 11.85 | | | | 10.11 | |
| | | | | | | | | | | | | | | | | | |
| Middle East / North Africa | | | | | | | | | | | | | | | | | |
| Crude Oil ($/BBL) | | | | 107.50 | | | | 106.20 | | | | 108.76 | | | | 104.34 | |
| NGL ($/BBL) | | | | 49.14 | | | | 29.17 | | | | 37.74 | | | | 32.09 | |
| | | | | | | | | | | | | | | | | | |
| Total Worldwide | | | | | | | | | | | | | | | | | |
| Crude Oil ($/BBL) | | | | 96.19 | | | | 99.62 | | | | 99.87 | | | | 97.92 | |
| NGL ($/BBL) | | | | 45.08 | | | | 55.25 | | | | 45.18 | | | | 55.53 | |
| Natural Gas ($/MCF) | | | | 2.35 | | | | 2.76 | | | | 2.06 | | | | 3.01 | |
| | | | | | | | | | | | | | | | | | |
| | | | | | | | | | | | | | | | | | |
| | | | | | | | | | | | | | | | | | |
| | | | Fourth Quarter | | Twelve Months |
| | | | 2012 | | 2011 | | 2012 | | 2011 |
| Exploration Expense | | | | | | | | | | | | | | | | | |
| United States | | | $ | 46 | | | $ | 71 | | | $ | 232 | | | $ | 204 | |
| Latin America | | | | 1 | | | | - | | | | 2 | | | | 1 | |
| Middle East / North Africa | | | | 35 | | | | 2 | | | | 111 | | | | 53 | |
| TOTAL REPORTED | | | $ | 82 | | | $ | 73 | | | $ | 345 | | | $ | 258 | |
| Less - non-core impairments | | | | - | | | | - | | | | - | | | | (35 | ) |
| TOTAL CORE | | | $ | 82 | | | $ | 73 | | | $ | 345 | | | $ | 223 | |
Investor Relations Supplemental Schedules
| OCCIDENTAL PETROLEUM |
| SUMMARY OF OPERATING STATISTICS |
| | | | | | | | | | | | | | | | | |
| | | | | | | | | | | | | | | | | |
| | | Fourth Quarter | | Twelve Months |
| Capital Expenditures ($MM) | | 2012 | | 2011 | | 2012 | | 2011 |
| Oil & Gas | | | | | | | | | | | | | | | | |
| California | | $ | 382 | | | $ | 515 | | | $ | 2,029 | | | $ | 1,717 | |
| Permian | | | 424 | | | | 385 | | | | 1,920 | | | | 1,146 | |
| Midcontinent and other | | | 204 | | | | 433 | | | | 1,324 | | | | 1,158 | |
| Latin America | | | 124 | | | | 79 | | | | 309 | | | | 218 | |
| Middle East / North Africa | | | 638 | | | | 492 | | | | 2,016 | | | | 1,485 | |
| Exploration | | | 108 | | | | 130 | | | | 622 | | | | 421 | |
| Chemical | | | 165 | | | | 116 | | | | 357 | | | | 234 | |
| Midstream, marketing and other | | 440 | | | | 388 | | | | 1,558 | | | | 1,089 | |
| Corporate | | | 25 | | | | 11 | | | | 91 | | | | 50 | |
| | TOTAL | $ | 2,510 | | | $ | 2,549 | | | $ | 10,226 | | | $ | 7,518 | |
| | | | | | | | | | | | | | | | | |
| | | | | | | | | | | | | | | | | |
| Depreciation, Depletion & | | Fourth Quarter | | Twelve Months |
| Amortization of Assets ($MM) | 2012 | | 2011 | | 2012 | | 2011 |
| Oil & Gas | | | | | | | | | | | | | | | | |
| Domestic | | $ | 628 | | | $ | 489 | | | $ | 2,412 | | | $ | 1,754 | |
| Latin America | | | 31 | | | | 23 | | | | 117 | | | | 90 | |
| Middle East / North Africa | | | 385 | | | | 300 | | | | 1,404 | | | | 1,220 | |
| Chemical | | | 88 | | | | 81 | | | | 345 | | | | 330 | |
| Midstream, marketing and other | | 52 | | | | 39 | | | | 206 | | | | 173 | |
| Corporate | | | 7 | | | | 6 | | | | 27 | | | | 24 | |
| | TOTAL | $ | 1,191 | | | $ | 938 | | | $ | 4,511 | | | $ | 3,591 | |
Investor Relations Supplemental Schedules
| OCCIDENTAL PETROLEUM | |
| CORPORATE | |
| ($ millions) | |
| | | | | | | | | | | | | |
| | | 31-Dec-12 | | 31-Dec-11 |
| | | | | | | | | | | | | |
| CAPITALIZATION | | | | | | | | | | | | |
| | | | | | | | | | | | | |
| Long-Term Debt (including short-term borrowings) | | | $ | 7,623 | | | | | $ | 5,871 | | |
| | | | | | | | | | | | | |
| EQUITY | | | $ | 40,048 | | | | | $ | 37,620 | | |
| | | | | | | | | | | | | |
| Total Debt To Total Capitalization | | | | 16% | | | | | 13% | |
15