EXHIBIT 99.3
Investor Relations Supplemental Schedules
| Investor Relations Supplemental Schedules |
| Summary |
| ($ Millions, except per share amounts) |
| | | | |
| | | | |
| | | | |
| | | | |
| | 1Q 2013 | | 1Q 2012 |
| | | | |
| Core Results | $1,359 | | $1,560 |
| EPS - Diluted | $1.69 | | $1.92 |
| | | | |
| Reported Net Income | $1,355 | | $1,559 |
| EPS - Diluted | $1.68 | | $1.92 |
| | | | |
| Total Worldwide Sales Volumes (mboe/day) | 746 | | 745 |
| Total Worldwide Production Volumes (mboe/day) | 763 | | 755 |
| | | | |
| Total Worldwide Crude Oil Realizations ($/BBL) | $98.07 | | $107.98 |
| Total Worldwide NGL Realizations ($/BBL) | $40.27 | | $52.51 |
| Domestic Natural Gas Realizations ($/MCF) | $3.08 | | $2.84 |
| | | | |
| Wtd. Average Basic Shares O/S (mm) | 804.7 | | 810.5 |
| Wtd. Average Diluted Shares O/S (mm) | 805.2 | | 811.3 |
| | | | |
| Cash Flow from Operations | $ 2,700 | | $ 2,800 |
Investor Relations Supplemental Schedules
| OCCIDENTAL PETROLEUM |
| 2013 First Quarter |
| Net Income (Loss) |
| ($ millions, except per share amounts) |
| | | | | | | | | | | | | | |
| | | | | | | | | | | | | | |
| | Reported | | | | | | | | Core |
| | Income | | Significant Items Affecting Income | | Results |
| Oil & Gas | $ | 1,920 | | | | | | | | | $ | 1,920 | |
| | | | | | | | | | | | | | |
| | | | | | | | | | | | | | |
| Chemical | | 159 | | | | | | | | | | 159 | |
| | | | | | | | | | | | | | |
| Midstream, marketing and other | | 215 | | | | | | | | | | 215 | |
| | | | | | | | | | | | | | |
| Corporate | | | | | | | | | | | | | |
| Interest expense, net | | (30 | ) | | | | | | | | | (30 | ) |
| | | | | | | | | | | | | | |
| Other | | (61 | ) | | | | | | | | | (61 | ) |
| | | | | | | | | | | | | | |
| Taxes | | (844 | ) | | | | | | | | | (844 | ) |
| | | | | | | | | | | | | | |
| | | | | | | | | | | | | | |
| Income from continuing operations | | 1,359 | | | | - | | | | | | 1,359 | |
| Discontinued operations, net of tax | | (4 | ) | | | 4 | | | Discontinued operations, net | | | - | |
| Net Income | $ | 1,355 | | | $ | 4 | | | | | $ | 1,359 | |
| | | | | | | | | | | | | | |
| | | | | | | | | | | | | | |
| Basic Earnings Per Common Share | | | | | | | | | | | | | |
| Income from continuing operations | $ | 1.69 | | | | | | | | | | | |
| Discontinued operations, net | | (0.01 | ) | | | | | | | | | | |
| Net Income | $ | 1.68 | | | | | | | | | $ | 1.69 | |
| | | | | | | | | | | | | | |
| Diluted Earnings Per Common Share | | | | | | | | | | | | | |
| Income from continuing operations | $ | 1.69 | | | | | | | | | | | |
| Discontinued operations, net | | (0.01 | ) | | | | | | | | | | |
| Net Income | $ | 1.68 | | | | | | | | | $ | 1.69 | |
Investor Relations Supplemental Schedules
| OCCIDENTAL PETROLEUM |
| 2012 Fourth Quarter |
| Net Income (Loss) |
| ($ millions, except per share amounts) |
| | | | | | | | | | | | | | |
| | | | | | | | | | | | | | |
| | Reported | | | | | | | | Core |
| | Income | | Significant Items Affecting Income | | Results |
| Oil & Gas | $ | 522 | | | $ | 1,731 | | | Asset impairments and related items | | $ | 2,253 | |
| | | | | | | | | | | | | | |
| | | | | | | | | | | | | | |
| Chemical | | 180 | | | | | | | | | | 180 | |
| | | | | | | | | | | | | | |
| Midstream, marketing and other | | 75 | | | | | | | | | | 75 | |
| | | | | | | | | | | | | | |
| Corporate | | | | | | | | | | | | | |
| Interest expense, net | | (30 | ) | | | | | | | | | (30 | ) |
| | | | | | | | | | | | | | |
| Other | | (134 | ) | | | 20 | | | Litigation reserves | | | (114 | ) |
| | | | | | | | | | | | | | |
| Taxes | | (249 | ) | | | (636 | ) | | Tax effect of adjustments | | | (885 | ) |
| | | | | | | | | | | | | | |
| | | | | | | | | | | | | | |
| Income from continuing operations | | 364 | | | | 1,115 | | | | | | 1,479 | |
| Discontinued operations, net of tax | | (28 | ) | | | 28 | | | Discontinued operations, net | | | - | |
| Net Income | $ | 336 | | | $ | 1,143 | | | | | $ | 1,479 | |
| | | | | | | | | | | | | | |
| | | | | | | | | | | | | | |
| Basic Earnings Per Common Share | | | | | | | | | | | | | |
| Income from continuing operations | $ | 0.45 | | | | | | | | | | | |
| Discontinued operations, net | | (0.03 | ) | | | | | | | | | | |
| Net Income | $ | 0.42 | | | | | | | | | $ | 1.83 | |
| | | | | | | | | | | | | | |
| Diluted Earnings Per Common Share | | | | | | | | | | | | | |
| Income from continuing operations | $ | 0.45 | | | | | | | | | | | |
| Discontinued operations, net | | (0.03 | ) | | | | | | | | | | |
| Net Income | $ | 0.42 | | | | | | | | | $ | 1.83 | |
Investor Relations Supplemental Schedules
| OCCIDENTAL PETROLEUM |
| 2012 First Quarter |
| Net Income (Loss) |
| ($ millions, except per share amounts) |
| | | | | | | | | | | | | | |
| | | | | | | | | | | | | | |
| | Reported | | | | | | | | Core |
| | Income | | Significant Items Affecting Income | | Results |
| Oil & Gas | $ | 2,504 | | | | | | | | | $ | 2,504 | |
| | | | | | | | | | | | | | |
| Chemical | | 184 | | | | | | | | | | 184 | |
| | | | | | | | | | | | | | |
| Midstream, marketing and other | | 131 | | | | | | | | | | 131 | |
| | | | | | | | | | | | | | |
| Corporate | | | | | | | | | | | | | |
| Interest expense, net | | (28 | ) | | | | | | | | | (28 | ) |
| | | | | | | | | | | | | | |
| Other | | (92 | ) | | | | | | | | | (92 | ) |
| | | | | | | | | | | | | | |
| Taxes | | (1,139 | ) | | | | | | | | | (1,139 | ) |
| | | | | | | | | | | | | | |
| | | | | | | | | | | | | | |
| Income from continuing operations | | 1,560 | | | | - | | | | | | 1,560 | |
| Discontinued operations, net of tax | | (1 | ) | | | 1 | | | Discontinued operations, net | | | - | |
| Net Income | $ | 1,559 | | | $ | 1 | | | | | $ | 1,560 | |
| | | | | | | | | | | | | | |
| | | | | | | | | | | | | | |
| Basic Earnings Per Common Share | | | | | | | | | | | | | |
| Income from continuing operations | $ | 1.92 | | | | | | | | | | | |
| Discontinued operations, net | | - | | | | | | | | | | | |
| Net Income | $ | 1.92 | | | | | | | | | $ | 1.92 | |
| | | | | | | | | | | | | | |
| Diluted Earnings Per Common Share | | | | | | | | | | | | | |
| Income from continuing operations | $ | 1.92 | | | | | | | | | | | |
| Discontinued operations, net | | - | | | | | | | | | | | |
| Net Income | $ | 1.92 | | | | | | | | | $ | 1.92 | |
Investor Relations Supplemental Schedules
| OCCIDENTAL PETROLEUM |
| Worldwide Effective Tax Rate |
| | | | | | | | | |
| | QUARTERLY |
| | 2013 | | 2012 | | 2012 |
| REPORTED INCOME | QTR 1 | | QTR 4 | | QTR 1 |
| Oil & Gas | 1,920 | | | 522 | | | 2,504 | |
| Chemical | 159 | | | 180 | | | 184 | |
| Midstream, marketing and other | 215 | | | 75 | | | 131 | |
| Corporate & other | (91 | ) | | (164 | ) | | (120 | ) |
| Pre-tax income | 2,203 | | | 613 | | | 2,699 | |
| | | | | | | | | |
| Income tax expense | | | | | | | | |
| Federal and state | 292 | | | (293 | ) | | 446 | |
| Foreign | 552 | | | 542 | | | 693 | |
| Total | 844 | | | 249 | | | 1,139 | |
| | | | | | | | | |
| Income from continuing operations | 1,359 | | | 364 | | | 1,560 | |
| | | | | | | | | |
| Worldwide effective tax rate | 38% | | 41% | | 42% |
| | | | | | | | | |
| | | | | | | | | |
| | 2013 | | 2012 | | 2012 |
| CORE RESULTS | QTR 1 | | QTR 4 | | QTR 1 |
| Oil & Gas | 1,920 | | | 2,253 | | | 2,504 | |
| Chemical | 159 | | | 180 | | | 184 | |
| Midstream, marketing and other | 215 | | | 75 | | | 131 | |
| Corporate & other | (91 | ) | | (144 | ) | | (120 | ) |
| Pre-tax income | 2,203 | | | 2,364 | | | 2,699 | |
| | | | | | | | | |
| Income tax expense | | | | | | | | |
| Federal and state | 292 | | | 343 | | | 446 | |
| Foreign | 552 | | | 542 | | | 693 | |
| Total | 844 | | | 885 | | | 1,139 | |
| | | | | | | | | |
| Core results | 1,359 | | | 1,479 | | | 1,560 | |
| | | | | | | | | |
| Worldwide effective tax rate | 38% | | 37% | | 42% |
Investor Relations Supplemental Schedules

| OCCIDENTAL PETROLEUM |
| 2013 First Quarter Net Income (Loss) |
| Reported Income Comparison |
| | | | | | | | | | | | | |
| | | First | | Fourth | | | | |
| | | Quarter | | Quarter | | | | |
| | | 2013 | | 2012 | | B / (W) |
| Oil & Gas | | $ | 1,920 | | | $ | 522 | | | $ | 1,398 | |
| Chemical | | | 159 | | | | 180 | | | | (21 | ) |
| Midstream, marketing and other | | | 215 | | | | 75 | | | | 140 | |
| Corporate | | | | | | | | | | | | |
| Interest expense, net | | | (30 | ) | | | (30 | ) | | | - | |
| Other | | | (61 | ) | | | (134 | ) | | | 73 | |
| Taxes | | | (844 | ) | | | (249 | ) | | | (595 | ) |
| Income from continuing operations | | | 1,359 | | | | 364 | | | | 995 | |
| Discontinued operations, net | | | (4 | ) | | | (28 | ) | | | 24 | |
| Net Income | | $ | 1,355 | | | $ | 336 | | | $ | 1,019 | |
| | | | | | | | | | | | | |
| Earnings Per Common Share | | | | | | | | | | | | |
| Basic | | $ | 1.68 | | | $ | 0.42 | | | $ | 1.26 | |
| Diluted | | $ | 1.68 | | | $ | 0.42 | | | $ | 1.26 | |
| | | | | | | | | | | | | |
| | | | | | | | | | | | | |
| Worldwide Effective Tax Rate | | | 38% | | | 41% | | | 3% |
| | | | | | | | | | | | | |
| | | | | | | | | | | | | |
| | | | | | | | | | | | | |
| OCCIDENTAL PETROLEUM |
| 2013 First Quarter Net Income (Loss) |
| Core Results Comparison |
| | | | | | | | | | | | | |
| | | First | | Fourth | | | | |
| | | Quarter | | Quarter | | | | |
| | | 2013 | | 2012 | | B / (W) |
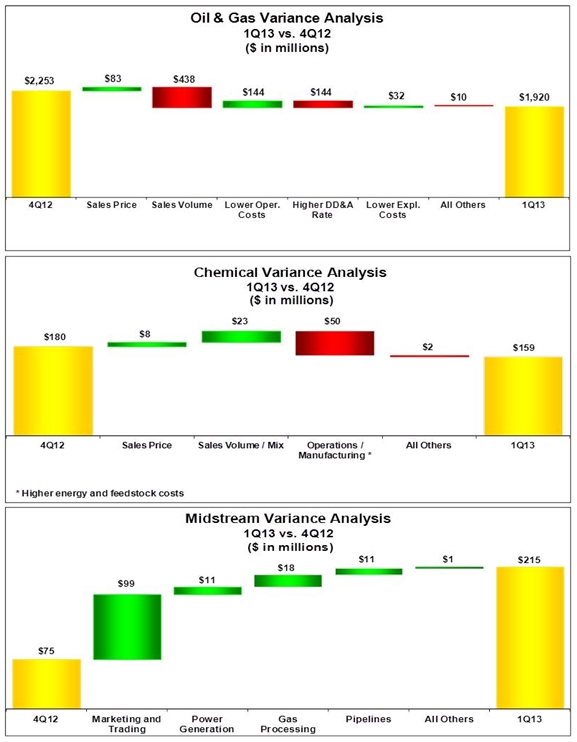
| Oil & Gas | | $ | 1,920 | | | $ | 2,253 | | | $ | (333 | ) |
| Chemical | | | 159 | | | | 180 | | | | (21 | ) |
| Midstream, marketing and other | | | 215 | | | | 75 | | | | 140 | |
| Corporate | | | | | | | | | | | | |
| Interest expense, net | | | (30 | ) | | | (30 | ) | | | - | |
| Other | | | (61 | ) | | | (114 | ) | | | 53 | |
| Taxes | | | (844 | ) | | | (885 | ) | | | 41 | |
| Core Results | | $ | 1,359 | | | $ | 1,479 | | | $ | (120 | ) |
| | | | | | | | | | | | | |
| Core Results Per Common Share | | | | | | | | | | | | |
| Basic | | $ | 1.69 | | | $ | 1.83 | | | $ | (0.14 | ) |
| Diluted | | $ | 1.69 | | | $ | 1.83 | | | $ | (0.14 | ) |
| | | | | | | | | | | | | |
| Worldwide Effective Tax Rate | | | 38% | | | 37% | | | -1% |
Investor Relations Supplemental Schedules
Investor Relations Supplemental Schedules
| OCCIDENTAL PETROLEUM |
| 2013 First Quarter Net Income (Loss) |
| Reported Income Comparison |
| | | | | | | | | | | | | |
| | | First | | First | | | | |
| | | Quarter | | Quarter | | | | |
| | | 2013 | | 2012 | | B / (W) |
| Oil & Gas | | $ | 1,920 | | | $ | 2,504 | | | $ | (584 | ) |
| Chemical | | | 159 | | | | 184 | | | | (25 | ) |
| Midstream, marketing and other | | | 215 | | | | 131 | | | | 84 | |
| Corporate | | | | | | | | | | | | |
| Interest expense, net | | | (30 | ) | | | (28 | ) | | | (2 | ) |
| Other | | | (61 | ) | | | (92 | ) | | | 31 | |
| Taxes | | | (844 | ) | | | (1,139 | ) | | | 295 | |
| Income from continuing operations | | | 1,359 | | | | 1,560 | | | | (201 | ) |
| Discontinued operations, net | | | (4 | ) | | | (1 | ) | | | (3 | ) |
| Net Income | | $ | 1,355 | | | $ | 1,559 | | | $ | (204 | ) |
| | | | | | | | | | | | | |
| Earnings Per Common Share | | | | | | | | | | | | |
| Basic | | $ | 1.68 | | | $ | 1.92 | | | $ | (0.24 | ) |
| Diluted | | $ | 1.68 | | | $ | 1.92 | | | $ | (0.24 | ) |
| | | | | | | | | | | | | |
| | | | | | | | | | | | | |
| Worldwide Effective Tax Rate | | | 38% | | | 42% | | | 4% |
| | | | | | | | | | | | | |
| | | | | | | | | | | | | |
| | | | | | | | | | | | | |
| | | | | | | | | | | | | |
| | | | | | | | | | | | | |
| OCCIDENTAL PETROLEUM |
| 2013 First Quarter Net Income (Loss) |
| Core Results Comparison |
| | | | | | | | | | | | | |
| | | First | | First | | | | |
| | | Quarter | | Quarter | | | | |
| | | 2013 | | 2012 | | B / (W) |
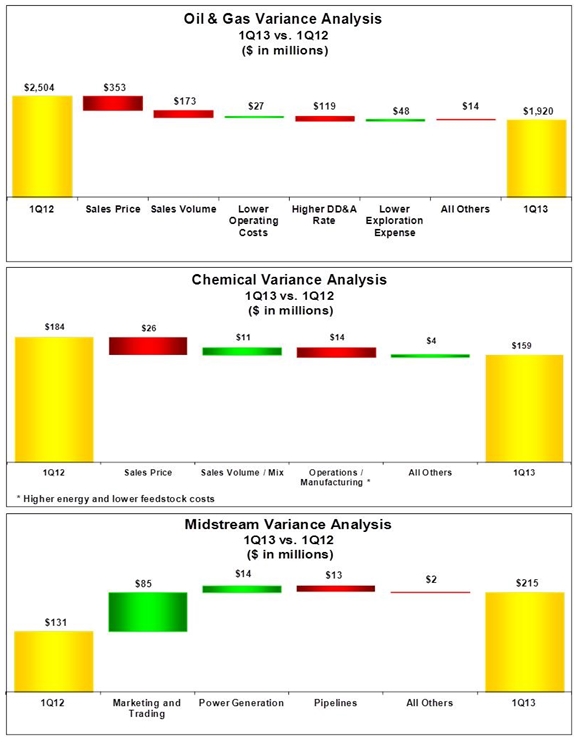
| Oil & Gas | | $ | 1,920 | | | $ | 2,504 | | | $ | (584 | ) |
| Chemical | | | 159 | | | | 184 | | | | (25 | ) |
| Midstream, marketing and other | | | 215 | | | | 131 | | | | 84 | |
| Corporate | | | | | | | | | | | | |
| Interest expense, net | | | (30 | ) | | | (28 | ) | | | (2 | ) |
| Other | | | (61 | ) | | | (92 | ) | | | 31 | |
| Taxes | | | (844 | ) | | | (1,139 | ) | | | 295 | |
| Core Results | | $ | 1,359 | | | $ | 1,560 | | | $ | (201 | ) |
| | | | | | | | | | | | | |
| Core Results Per Common Share | | | | | | | | | | | | |
| Basic | | $ | 1.69 | | | $ | 1.92 | | | $ | (0.23 | ) |
| Diluted | | $ | 1.69 | | | $ | 1.92 | | | $ | (0.23 | ) |
| | | | | | | | | | | | | |
| Worldwide Effective Tax Rate | | | 38% | | | 42% | | | 4% |
Investor Relations Supplemental Schedules
Investor Relations Supplemental Schedules
| OCCIDENTAL PETROLEUM |
| SUMMARY OF OPERATING STATISTICS |
| | | | | | | | |
| | | | First Quarter |
| | | | 2013 | | 2012 |
| NET PRODUCTION PER DAY: | | | | | | | |
| | | | | | | | |
| United States | | | | | | | |
| Oil (MBBL) | | | | | | | |
| | California | | 88 | | | 86 | |
| | Permian | | 148 | | | 139 | |
| Midcontinent and other | | 28 | | | 19 | |
| | Total | | 264 | | | 244 | |
| NGLs (MBBL) | | | | | | | |
| | California | | 20 | | | 15 | |
| | Permian | | 40 | | | 39 | |
| Midcontinent and other | | 18 | | | 18 | |
| | Total | | 78 | | | 72 | |
| Natural Gas (MMCF) | | | | | | | |
| | California | | 260 | | | 267 | |
| | Permian | | 174 | | | 155 | |
| Midcontinent and other | | 383 | | | 412 | |
| | Total | | 817 | | | 834 | |
| | | | | | | | |
| | | | | | | | |
| Latin America | | | | | | | |
| Oil (MBBL) | Colombia | | 29 | | | 24 | |
| | | | | | | | |
| Natural Gas (MMCF) | Bolivia | | 13 | | | 14 | |
| | | | | | | | |
| | | | | | | | |
| Middle East / North Africa | | | | | | | |
| Oil (MBBL) | | | | | | | |
| | Bahrain | | 3 | | | 4 | |
| | Dolphin | | 6 | | | 8 | |
| | Oman | | 65 | | | 64 | |
| | Qatar | | 59 | | | 72 | |
| | Other | | 42 | | | 42 | |
| | Total | | 175 | | | 190 | |
| | | | | | | | |
| NGLs (MBBL) | Dolphin | | 7 | | | 9 | |
| | Total | | 7 | | | 9 | |
| | | | | | | | |
| Natural Gas (MMCF) | | | | | | | |
| | Bahrain | | 244 | | | 219 | |
| | Dolphin | | 134 | | | 173 | |
| | Oman | | 54 | | | 57 | |
| | Total | | 432 | | | 449 | |
| | | | | | | | |
| | | | | | | | |
| Barrels of Oil Equivalent (MBOE) | | | 763 | | | 755 | |
Investor Relations Supplemental Schedules
| OCCIDENTAL PETROLEUM |
| SUMMARY OF OPERATING STATISTICS |
| | | | | | | | |
| | | | First Quarter |
| | | | 2013 | | 2012 |
| NET SALES VOLUMES PER DAY: | | | | | | | |
| United States | | | | | | | |
| Oil (MBBL) | | | 264 | | | 244 | |
| NGLs (MBBL) | | | 78 | | | 72 | |
| Natural Gas (MMCF) | | | 819 | | | 834 | |
| | | | | | | | |
| Latin America | | | | | | | |
| Oil (MBBL) | | | 30 | | | 24 | |
| Natural Gas (MMCF) | | | 13 | | | 14 | |
| | | | | | | | |
| Middle East / North Africa | | | | | | | |
| Oil (MBBL) | | | | | | | |
| | Bahrain | | 3 | | | 4 | |
| | Dolphin | | 6 | | | 8 | |
| | Oman | | 72 | | | 64 | |
| | Qatar | | 51 | | | 70 | |
| | Other | | 24 | | | 34 | |
| | Total | | 156 | | | 180 | |
| | | | | | | | |
| NGLs (MBBL) | Dolphin | | 7 | | | 9 | |
| | Total | | 7 | | | 9 | |
| | | | | | | | |
| Natural Gas (MMCF) | | | 432 | | | 449 | |
| | | | | | | | |
| | | | | | | | |
| Barrels of Oil Equivalent (MBOE) | | | 746 | | | 745 | |
Investor Relations Supplemental Schedules
| OCCIDENTAL PETROLEUM |
| SUMMARY OF OPERATING STATISTICS |
| | | | | | | | | | |
| | | | First Quarter |
| | | | 2013 | | 2012 |
| | | | | | | | | | |
| OIL & GAS: | | | | | | | | | |
| PRICES | | | | | | | | | |
| United States | | | | | | | | | |
| Oil ($/BBL) | | | | 91.57 | | | | 103.52 | |
| NGLs ($/BBL) | | | | 40.59 | | | | 53.95 | |
| Natural gas ($/MCF) | | | | 3.08 | | | | 2.84 | |
| | | | | | | | | | |
| Latin America | | | | | | | | | |
| Oil ($/BBL) | | | | 107.18 | | | | 103.31 | |
| Natural Gas ($/MCF) | | | | 11.60 | | | | 11.63 | |
| | | | | | | | | | |
| Middle East / North Africa | | | | | | | | | |
| Oil ($/BBL) | | | | 107.52 | | | | 114.80 | |
| NGLs ($/BBL) | | | | 36.56 | | | | 40.77 | |
| | | | | | | | | | |
| Total Worldwide | | | | | | | | | |
| Oil ($/BBL) | | | | 98.07 | | | | 107.98 | |
| NGLs ($/BBL) | | | | 40.27 | | | | 52.51 | |
| Natural Gas ($/MCF) | | | | 2.37 | | | | 2.22 | |
| | | | | | | | | | |
| | | | | | | | | | |
| | | | | | | | | | |
| | | | First Quarter |
| | | | 2013 | | 2012 |
| Exploration Expense | | | | | | | | | |
| United States | | | $ | 40 | | | $ | 61 | |
| Middle East / North Africa | | | | 10 | | | | 37 | |
| TOTAL REPORTED | | | $ | 50 | | | $ | 98 | |
Investor Relations Supplemental Schedules
| OCCIDENTAL PETROLEUM |
| SUMMARY OF OPERATING STATISTICS |
| | | | | | | | | |
| | | | | | | | | |
| | | First Quarter |
| Capital Expenditures ($MM) | | 2013 | | 2012 |
| Oil & Gas | | | | | | | | |
| California | | $ | 317 | | | $ | 523 | |
| Permian | | | 435 | | | | 429 | |
| Midcontinent and other | | | 218 | | | | 424 | |
| Latin America | | | 70 | | | | 42 | |
| Middle East / North Africa | | | 547 | | | | 428 | |
| Exploration | | | 78 | | | | 171 | |
| Chemical | | | 65 | | | | 42 | |
| Midstream, marketing and other | | 320 | | | | 332 | |
| Corporate | | | 20 | | | | 21 | |
| | TOTAL | $ | 2,070 | | | $ | 2,412 | |
| | | | | | | | | |
| | | | | | | | | |
| Depreciation, Depletion & | | First Quarter |
| Amortization of Assets ($MM) | 2013 | | 2012 |
| Oil & Gas | | | | | | | | |
| Domestic | | $ | 740 | | | $ | 588 | |
| Latin America | | | 30 | | | | 25 | |
| Middle East / North Africa | | | 345 | | | | 335 | |
| Chemical | | | 85 | | | | 85 | |
| Midstream, marketing and other | | 50 | | | | 46 | |
| Corporate | | | 9 | | | | 6 | |
| | TOTAL | $ | 1,259 | | | $ | 1,085 | |
Investor Relations Supplemental Schedules
| OCCIDENTAL PETROLEUM | |
| CORPORATE | |
| ($ millions) | |
| | | | | | | | | | | | | |
| | | 31-Mar-13 | | 31-Dec-12 |
| | | | | | | | | | | | | |
| CAPITALIZATION | | | | | | | | | | | | |
| | | | | | | | | | | | | |
| Long-Term Debt (including current maturities) | | | $ | 7,624 | | | | | $ | 7,623 | | |
| | | | | | | | | | | | | |
| EQUITY | | | $ | 40,940 | | | | | $ | 40,048 | | |
| | | | | | | | | | | | | |
| Total Debt To Total Capitalization | | | | 16% | | | | | 16% | |
14