EXHIBIT 99.3
Investor Relations Supplemental Schedules

| Investor Relations Supplemental Schedules |
| Summary |
| ($ Millions, except per share amounts) |
| | | | | | | | |
| | | | | | | | |
| | | | | | | | |
| | | | | | | | |
| | 2Q 2013 | | 2Q 2012 |
| | | | | | | | |
| Core Results ($ millions) | | $1,276 | | | $1,332 |
| EPS - Diluted | | $1.58 | | | $1.64 |
| | | | | | | | |
| Reported Net Income ($ millions) | | $1,322 | | | $1,328 |
| EPS - Diluted | | $1.64 | | | $1.64 |
| | | | | | | | |
| Total Worldwide Sales Volumes (mboe/day) | | 764 | | | | 759 | |
| Total Worldwide Production Volumes (mboe/day) | | 772 | | | | 766 | |
| | | | | | | | |
| Total Worldwide Crude Oil Realizations ($/BBL) | | $97.91 | | | $99.34 |
| Total Worldwide NGL Realizations ($/BBL) | | $38.78 | | | $42.06 |
| Domestic Natural Gas Realizations ($/MCF) | | $3.82 | | | $2.09 |
| | | | | | | | |
| Wtd. Average Basic Shares O/S (millions) | | 804.9 | | | 810.3 |
| Wtd. Average Diluted Shares O/S (millions) | | 805.4 | | | 811.0 |
| | | | | | | | |
| | | | | | | | |
| | YTD 2013 | | YTD 2012 |
| | | | | | | | |
| Core Results ($ millions) | | $2,635 | | | $2,892 |
| EPS - Diluted | | $3.27 | | | $3.56 |
| | | | | | | | |
| Reported Net Income ($ millions) | | $2,677 | | | $2,887 |
| EPS - Diluted | | $3.32 | | | $3.55 |
| | | | | | | | |
| Total Worldwide Sales Volumes (mboe/day) | | 755 | | | | 752 | |
| Total Worldwide Production Volumes (mboe/day) | | 768 | | | | 760 | |
| | | | | | | | |
| Total Worldwide Crude Oil Realizations ($/BBL) | | $97.99 | | | $103.63 |
| Total Worldwide NGL Realizations ($/BBL) | | $39.52 | | | $47.52 |
| Domestic Natural Gas Realizations ($/MCF) | | $3.44 | | | $2.46 |
| | | | | | | | |
| Wtd. Average Basic Shares O/S (millions) | | 804.8 | | | 810.4 |
| Wtd. Average Diluted Shares O/S (millions) | | 805.3 | | | 811.2 |
| | | | | | | | |
| Shares Outstanding (millions) | | 805.8 | | | 809.9 |
| | | | | | | | |
| Cash Flow from Operations ($ millions) | $ | 6,200 | | | $ | 6,000 | |
1
Investor Relations Supplemental Schedules
| OCCIDENTAL PETROLEUM |
| 2013 Second Quarter |
| Net Income (Loss) |
| ($ millions, except per share amounts) |
| | | | | | | | | | | | | | |
| | | | | | | | | | | | | | |
| | Reported | | | | | | | | Core |
| | Income | | Significant Items Affecting Income | | Results |
| Oil & Gas | $ | 2,100 | | | | | | | | | $ | 2,100 | |
| | | | | | | | | | | | | | |
| | | | | | | | | | | | | | |
| Chemical | | 275 | | | | (131 | ) | Carbocloro sale gain | | | 144 | |
| | | | | | | | | | | | | | |
| Midstream, marketing and other | | 48 | | | | | | | | | | 48 | |
| | | | | | | | | | | | | | |
| Corporate | | | | | | | | | | | | | |
| Interest expense, net | | (29 | ) | | | | | | | | | (29 | ) |
| | | | | | | | | | | | | | |
| Other | | (166 | ) | | | 55 | | Charge for former executives and consultants (a) | | | (111 | ) |
| | | | | | | | | | | | | | |
| | | | | | | | | | | | | | |
| Taxes | | (901 | ) | | | 25 | | Tax effect of pre-tax adjustments | | | (876 | ) |
| | | | | | | | | | | | | | |
| | | | | | | | | | | | | | |
| Income from continuing operations | | 1,327 | | | | (51 | ) | | | | | 1,276 | |
| Discontinued operations, net of tax | | (5 | ) | | | 5 | | Discontinued operations, net | | | - | |
| Net Income | $ | 1,322 | | | $ | (46 | ) | | | | $ | 1,276 | |
| | | | | | | | | | | | | | |
| | | | | | | | | | | | | | |
| Basic Earnings Per Common Share | | | | | | | | | | | | | |
| Income from continuing operations | $ | 1.65 | | | | | | | | | | | |
| Discontinued operations, net | | (0.01 | ) | | | | | | | | | | |
| Net Income | $ | 1.64 | | | | | | | | | $ | 1.58 | |
| | | | | | | | | | | | | | |
| Diluted Earnings Per Common Share | | | | | | | | | | | | | |
| Income from continuing operations | $ | 1.64 | | | | | | | | | | | |
| Discontinued operations, net | | - | | | | | | | | | | | |
| Net Income | $ | 1.64 | | | | | | | | | $ | 1.58 | |
| | | | | | | | | | | | | | |
| | | | | | | | | | | | | | |
| | | | | | | | | | | | | | |
| (a) Reflects pre-tax charge for the estimated cost related to the employment and post-employment benefits for the |
| Company's former Executive Chairman and termination of certain other employees and consulting arrangements. |
Investor Relations Supplemental Schedules
| OCCIDENTAL PETROLEUM |
| 2012 Second Quarter |
| Net Income (Loss) |
| ($ millions, except per share amounts) |
| | | | | | | | | | | | | | |
| | | | | | | | | | | | | | |
| | Reported | | | | | | | | Core |
| | Income | | Significant Items Affecting Income | | Results |
| Oil & Gas | $ | 2,043 | | | | | | | | | $ | 2,043 | |
| | | | | | | | | | | | | | |
| Chemical | | 194 | | | | | | | | | | 194 | |
| | | | | | | | | | | | | | |
| Midstream, marketing and other | | 77 | | | | | | | | | | 77 | |
| | | | | | | | | | | | | | |
| Corporate | | | | | | | | | | | | | |
| Interest expense, net | | (25 | ) | | | | | | | | | (25 | ) |
| | | | | | | | | | | | | | |
| Other | | (82 | ) | | | | | | | | | (82 | ) |
| | | | | | | | | | | | | | |
| Taxes | | (875 | ) | | | | | | | | | (875 | ) |
| | | | | | | | | | | | | | |
| | | | | | | | | | | | | | |
| Income from continuing operations | | 1,332 | | | | - | | | | | | 1,332 | |
| Discontinued operations, net of tax | | (4 | ) | | | 4 | | Discontinued operations, net | | | - | |
| Net Income | $ | 1,328 | | | $ | 4 | | | | | $ | 1,332 | |
| | | | | | | | | | | | | | |
| | | | | | | | | | | | | | |
| Basic Earnings Per Common Share | | | | | | | | | | | | | |
| Income from continuing operations | $ | 1.64 | | | | | | | | | | | |
| Discontinued operations, net | | - | | | | | | | | | | | |
| Net Income | $ | 1.64 | | | | | | | | | $ | 1.64 | |
| | | | | | | | | | | | | | |
| Diluted Earnings Per Common Share | | | | | | | | | | | | | |
| Income from continuing operations | $ | 1.64 | | | | | | | | | | | |
| Discontinued operations, net | | - | | | | | | | | | | | |
| Net Income | $ | 1.64 | | | | | | | | | $ | 1.64 | |
3
Investor Relations Supplemental Schedules
| OCCIDENTAL PETROLEUM |
| 2013 Six Months |
| Net Income (Loss) |
| ($ millions, except per share amounts) |
| | | | | | | | | | | | | | |
| | | | | | | | | | | | | | |
| | Reported | | | | | | | | Core |
| | Income | | Significant Items Affecting Income | | Results |
| Oil & Gas | $ | 4,020 | | | | | | | | | $ | 4,020 | |
| | | | | | | | | | | | | | |
| Chemical | | 434 | | | | (131 | ) | Carbocloro sale gain | | | 303 | |
| | | | | | | | | | | | | | |
| Midstream, marketing and other | | 263 | | | | | | | | | | 263 | |
| | | | | | | | | | | | | | |
| Corporate | | | | | | | | | | | | | |
| Interest expense, net | | (59 | ) | | | | | | | | | (59 | ) |
| | | | | | | | | | | | | | |
| Other | | (227 | ) | | | 55 | | Charge for former executives and consultants (a) | | | (172 | ) |
| | | | | | | | | | | | | | |
| | | | | | | | | | | | | | |
| Taxes | | (1,745 | ) | | | 25 | | Tax effect of pre-tax adjustments | | | (1,720 | ) |
| | | | | | | | | | | | | | |
| | | | | | | | | | | | | | |
| Income from continuing operations | | 2,686 | | | �� | (51 | ) | | | | | 2,635 | |
| Discontinued operations, net of tax | | (9 | ) | | | 9 | | Discontinued operations, net | | | - | |
| Net Income | | 2,677 | | | | (42 | ) | | | | | 2,635 | |
| | | | | | | | | | | | | | |
| | | | | | | | | | | | | | |
| Basic Earnings Per Common Share | | | | | | | | | | | | | |
| Income from continuing operations | $ | 3.33 | | | | | | | | | | | |
| Discontinued operations, net | | (0.01 | ) | | | | | | | | | | |
| Net Income | $ | 3.32 | | | | | | | | | $ | 3.27 | |
| | | | | | | | | | | | | | |
| Diluted Earnings Per Common Share | | | | | | | | | | | | | |
| Income from continuing operations | $ | 3.33 | | | | | | | | | | | |
| Discontinued operations, net | | (0.01 | ) | | | | | | | | | | |
| Net Income | $ | 3.32 | | | | | | | | | $ | 3.27 | |
| | | | | | | | | | | | | | |
| | | | | | | | | | | | | | |
| (a) Reflects pre-tax charge for the estimated cost related to the employment and post-employment benefits for the |
| Company's former Executive Chairman and termination of certain other employees and consulting arrangements. |
4
Investor Relations Supplemental Schedules
| OCCIDENTAL PETROLEUM |
| 2012 Six Months |
| Net Income (Loss) |
| ($ millions, except per share amounts) |
| | | | | | | | | | | | | | |
| | | | | | | | | | | | | | |
| | Reported | | | | | | | | Core |
| | Income | | Significant Items Affecting Income | | Results |
| Oil & Gas | $ | 4,547 | | | | | | | | | $ | 4,547 | |
| | | | | | | | | | | | | | |
| Chemical | | 378 | | | | | | | | | | 378 | |
| | | | | | | | | | | | | | |
| Midstream, marketing and other | | 208 | | | | | | | | | | 208 | |
| | | | | | | | | | | | | | |
| Corporate | | | | | | | | | | | | | |
| Interest expense, net | | (53 | ) | | | | | | | | | (53 | ) |
| | | | | | | | | | | | | | |
| Other | | (174 | ) | | | | | | | | | (174 | ) |
| | | | | | | | | | | | | | |
| Taxes | | (2,014 | ) | | | | | | | | | (2,014 | ) |
| | | | | | | | | | | | | | |
| | | | | | | | | | | | | | |
| Income from continuing operations | | 2,892 | | | | - | | | | | | 2,892 | |
| Discontinued operations, net of tax | | (5 | ) | | | 5 | | Discontinued operations, net | | | - | |
| Net Income | $ | 2,887 | | | $ | 5 | | | | | $ | 2,892 | |
| | | | | | | | | | | | | | |
| | | | | | | | | | | | | | |
| Basic Earnings Per Common Share | | | | | | | | | | | | | |
| Income from continuing operations | $ | 3.56 | | | | | | | | | | | |
| Discontinued operations, net | | (0.01 | ) | | | | | | | | | | |
| Net Income | $ | 3.55 | | | | | | | | | $ | 3.56 | |
| | | | | | | | | | | | | | |
| Diluted Earnings Per Common Share | | | | | | | | | | | | | |
| Income from continuing operations | $ | 3.56 | | | | | | | | | | | |
| Discontinued operations, net | | (0.01 | ) | | | | | | | | | | |
| Net Income | $ | 3.55 | | | | | | | | | $ | 3.56 | |
5
Investor Relations Supplemental Schedules
| OCCIDENTAL PETROLEUM |
| Worldwide Effective Tax Rate |
| | | | | | | | | | | | | | | |
| | QUARTERLY | | YEAR-TO-DATE |
| | 2013 | | 2013 | | 2012 | | 2013 | | 2012 |
| REPORTED INCOME | QTR 2 | | QTR 1 | | QTR 2 | | 6 Months | | 6 Months |
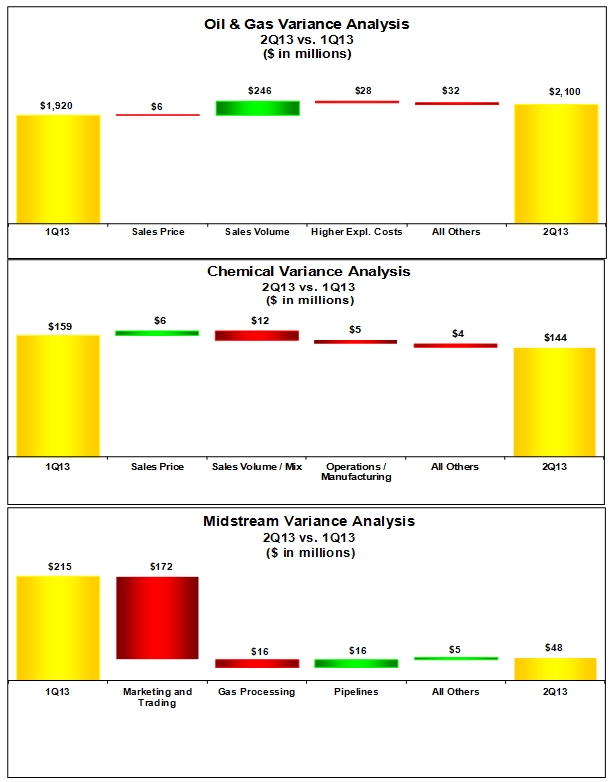
| Oil & Gas | 2,100 | | | 1,920 | | | 2,043 | | | 4,020 | | | 4,547 | |
| Chemical | 275 | | | 159 | | | 194 | | | 434 | | | 378 | |
| Midstream, marketing and other | 48 | | | 215 | | | 77 | | | 263 | | | 208 | |
| Corporate & other | (195 | ) | | (91 | ) | | (107 | ) | | (286 | ) | | (227) | |
| Pre-tax income | 2,228 | | | 2,203 | | | 2,207 | | | 4,431 | | | 4,906 | |
| | | | | | | | | | | | | | | |
| Income tax expense | | | | | | | | | | | | | | |
| Federal and state | 332 | | | 292 | | | 254 | | | 624 | | | 700 | |
| Foreign | 569 | | | 552 | | | 621 | | | 1,121 | | | 1,314 | |
| Total | 901 | | | 844 | | | 875 | | | 1,745 | | | 2,014 | |
| | | | | | | | | | | | | | | |
| Income from continuing operations | 1,327 | | | 1,359 | | | 1,332 | | | 2,686 | | | 2,892 | |
| | | | | | | | | | | | | | | |
| Worldwide effective tax rate | 40% | | 38% | | 40% | | 39% | | 41% |
| | | | | | | | | | | | | | | |
| | | | | | | | | | | | | | | |
| | 2013 | | 2013 | | 2012 | | 2013 | | 2012 |
| CORE RESULTS | QTR 2 | | QTR 1 | | QTR 2 | | 6 Months | | 6 Months |
| Oil & Gas | 2,100 | | | 1,920 | | | 2,043 | | | 4,020 | | | 4,547 | |
| Chemical | 144 | | | 159 | | | 194 | | | 303 | | | 378 | |
| Midstream, marketing and other | 48 | | | 215 | | | 77 | | | 263 | | | 208 | |
| Corporate & other | (140 | ) | | (91 | ) | | (107 | ) | | (231 | ) | | (227 | ) |
| Pre-tax income | 2,152 | | | 2,203 | | | 2,207 | | | 4,355 | | | 4,906 | |
| | | | | | | | | | | | | | | |
| Income tax expense | | | | | | | | | | | | | | |
| Federal and state | 331 | | | 292 | | | 254 | | | 623 | | | 700 | |
| Foreign | 545 | | | 552 | | | 621 | | | 1,097 | | | 1,314 | |
| Total | 876 | | | 844 | | | 875 | | | 1,720 | | | 2,014 | |
| | | | | | | | | | | | | | | |
| Core results | 1,276 | | | 1,359 | | | 1,332 | | | 2,635 | | | 2,892 | |
| | | | | | | | | | | | | | | |
| Worldwide effective tax rate | 41% | | 38% | | 40% | | 39% | | 41% |
6
Investor Relations Supplemental Schedules
| OCCIDENTAL PETROLEUM |
| 2013 Second Quarter Net Income (Loss) |
| Reported Income Comparison |
| | | | | | | | | | | | | |
| | | Second | | First | | | | |
| | | Quarter | | Quarter | | | | |
| | | 2013 | | 2013 | | B / (W) |
| Oil & Gas | | $ | 2,100 | | | $ | 1,920 | | | $ | 180 | |
| Chemical | | | 275 | | | | 159 | | | | 116 | |
| Midstream, marketing and other | | | 48 | | | | 215 | | | | (167 | ) |
| Corporate | | | | | | | | | | | | |
| Interest expense, net | | | (29 | ) | | | (30 | ) | | | 1 | |
| Other | | | (166 | ) | | | (61 | ) | | | (105 | ) |
| Taxes | | | (901 | ) | | | (844 | ) | | | (57 | ) |
| Income from continuing operations | | | 1,327 | | | | 1,359 | | | | (32 | ) |
| Discontinued operations, net | | | (5 | ) | | | (4 | ) | | | (1 | ) |
| Net Income | | $ | 1,322 | | | $ | 1,355 | | | $ | (33 | ) |
| | | | | | | | | | | | | |
| Earnings Per Common Share | | | | | | | | | | | | |
| Basic | | $ | 1.64 | | | $ | 1.68 | | | $ | (0.04 | ) |
| Diluted | | $ | 1.64 | | | $ | 1.68 | | | $ | (0.04 | ) |
| | | | | | | | | | | | | |
| | | | | | | | | | | | | |
| Worldwide Effective Tax Rate | | | 40% | | | 38% | | | -2% |
| | | | | | | | | | | | | |
| | | | | | | | | | | | | |
| | | | | | | | | | | | | |
| OCCIDENTAL PETROLEUM |
| 2013 Second Quarter Net Income (Loss) |
| Core Results Comparison |
| | | | | | | | | | | | | |
| | | Second | | First | | | | |
| | | Quarter | | Quarter | | | | |
| | | 2013 | | 2013 | | B / (W) |
| Oil & Gas | | $ | 2,100 | | | $ | 1,920 | | | $ | 180 | |
| Chemical | | | 144 | | | | 159 | | | | (15 | ) |
| Midstream, marketing and other | | | 48 | | | | 215 | | | | (167 | ) |
| Corporate | | | | | | | | | | | | |
| Interest expense, net | | | (29 | ) | | | (30 | ) | | | 1 | |
| Other | | | (111 | ) | | | (61 | ) | | | (50 | ) |
| Taxes | | | (876 | ) | | | (844 | ) | | | (32 | ) |
| Core Results | | $ | 1,276 | | | $ | 1,359 | | | $ | (83 | ) |
| | | | | | | | | | | | | |
| Core Results Per Common Share | | | | | | | | | | | | |
| Basic | | $ | 1.58 | | | $ | 1.69 | | | $ | (0.11 | ) |
| Diluted | | $ | 1.58 | | | $ | 1.69 | | | $ | (0.11 | ) |
| | | | | | | | | | | | | |
| Worldwide Effective Tax Rate | | | 41% | | | 38% | | | -3% |
7
Investor Relations Supplemental Schedules
8
Investor Relations Supplemental Schedules
| OCCIDENTAL PETROLEUM |
| 2013 Second Quarter Net Income (Loss) |
| Reported Income Comparison |
| | | | | | | | | | | | | |
| | | Second | | Second | | | | |
| | | Quarter | | Quarter | | | | |
| | | 2013 | | 2012 | | B / (W) |
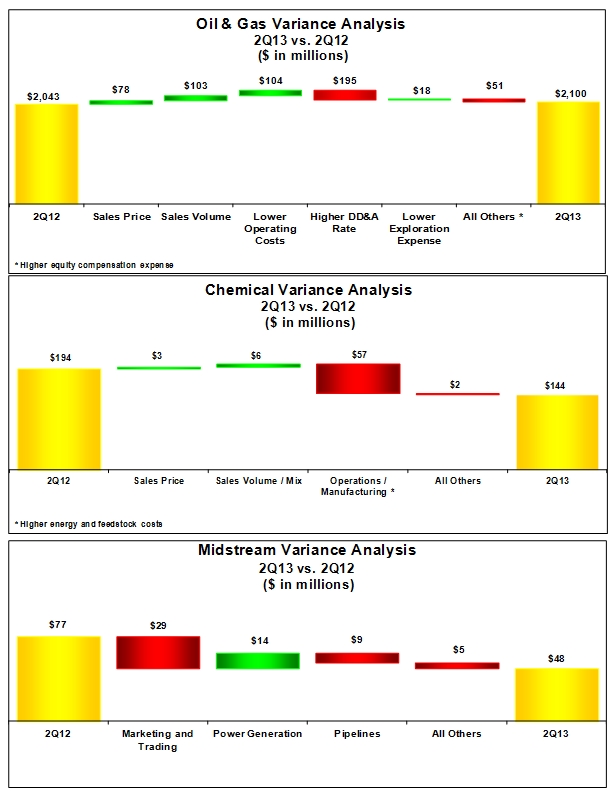
| Oil & Gas | | $ | 2,100 | | | $ | 2,043 | | | $ | 57 | |
| Chemical | | | 275 | | | | 194 | | | | 81 | |
| Midstream, marketing and other | | | 48 | | | | 77 | | | | (29 | ) |
| Corporate | | | | | | | | | | | | |
| Interest expense, net | | | (29 | ) | | | (25 | ) | | | (4 | ) |
| Other | | | (166 | ) | | | (82 | ) | | | (84 | ) |
| Taxes | | | (901 | ) | | | (875 | ) | | | (26 | ) |
| Income from continuing operations | | | 1,327 | | | | 1,332 | | | | (5 | ) |
| Discontinued operations, net | | | (5 | ) | | | (4 | ) | | | (1 | ) |
| Net Income | | $ | 1,322 | | | $ | 1,328 | | | $ | (6 | ) |
| | | | | | | | | | | | | |
| Earnings Per Common Share | | | | | | | | | | | | |
| Basic | | $ | 1.64 | | | $ | 1.64 | | | $ | - | |
| Diluted | | $ | 1.64 | | | $ | 1.64 | | | $ | - | |
| | | | | | | | | | | | | |
| | | | | | | | | | | | | |
| Worldwide Effective Tax Rate | | | 40% | | | 40% | | | 0% |
| | | | | | | | | | | | | |
| | | | | | | | | | | | | |
| | | | | | | | | | | | | |
| | | | | | | | | | | | | |
| | | | | | | | | | | | | |
| OCCIDENTAL PETROLEUM |
| 2013 Second Quarter Net Income (Loss) |
| Core Results Comparison |
| | | | | | | | | | | | | |
| | | Second | | Second | | | | |
| | | Quarter | | Quarter | | | | |
| | | 2013 | | 2012 | | B / (W) |
| Oil & Gas | | $ | 2,100 | | | $ | 2,043 | | | $ | 57 | |
| Chemical | | | 144 | | | | 194 | | | | (50 | ) |
| Midstream, marketing and other | | | 48 | | | | 77 | | | | (29 | ) |
| Corporate | | | | | | | | | | | | |
| Interest expense, net | | | (29 | ) | | | (25 | ) | | | (4 | ) |
| Other | | | (111 | ) | | | (82 | ) | | | (29 | ) |
| Taxes | | | (876 | ) | | | (875 | ) | | | (1 | ) |
| Core Results | | $ | 1,276 | | | $ | 1,332 | | | $ | (56 | ) |
| | | | | | | | | | | | | |
| Core Results Per Common Share | | | | | | | | | | | | |
| Basic | | $ | 1.58 | | | $ | 1.64 | | | $ | (0.06 | ) |
| Diluted | | $ | 1.58 | | | $ | 1.64 | | | $ | (0.06 | ) |
| | | | | | | | | | | | | |
| Worldwide Effective Tax Rate | | | 41% | | | 40% | | | -1% |
9
Investor Relations Supplemental Schedules
Investor Relations Supplemental Schedules
|
| SUMMARY OF OPERATING STATISTICS |
| | | | | | | | | | | | | | | |
| | | | Second Quarter | | | Six Months |
| | | | 2013 | | 2012 | | | 2013 | | 2012 |
| NET PRODUCTION PER DAY: | | | | | | | | | | | | | | |
| | | | | | | | | | | | | | | |
| United States | | | | | | | | | | | | | | |
| Oil (MBBL) | | | | | | | | | | | | | | |
| | California | | 88 | | | 88 | | | | 88 | | | 87 | |
| | Permian | | 145 | | | 138 | | | | 146 | | | 139 | |
| Midcontinent and other | | 28 | | | 23 | | | | 28 | | | 20 | |
| | Total | | 261 | | | 249 | | | | 262 | | | 246 | |
| NGLs (MBBL) | | | | | | | | | | | | | | |
| | California | | 21 | | | 15 | | | | 20 | | | 15 | |
| | Permian | | 39 | | | 39 | | | | 39 | | | 39 | |
| Midcontinent and other | | 17 | | | 19 | | | | 18 | | | 19 | |
| | Total | | 77 | | | 73 | | | | 77 | | | 73 | |
| Natural Gas (MMCF) | | | | | | | | | | | | | | |
| | California | | 260 | | | 269 | | | | 262 | | | 268 | |
| | Permian | | 160 | | | 151 | | | | 168 | | | 153 | |
| Midcontinent and other | | 372 | | | 420 | | | | 378 | | | 416 | |
| | Total | | 792 | | | 840 | | | | 808 | | | 837 | |
| | | | | | | | | | | | | | | |
| | | | | | | | | | | | | | | |
| Latin America | | | | | | | | | | | | | | |
| Oil (MBBL) | Colombia | | 28 | | | 31 | | | | 29 | | | 27 | |
| | | | | | | | | | | | | | | |
| Natural Gas (MMCF) | Bolivia | | 13 | | | 14 | | | | 13 | | | 14 | |
| | | | | | | | | | | | | | | |
| | | | | | | | | | | | | | | |
| Middle East / North Africa | | | | | | | | | | | | | | |
| Oil (MBBL) | | | | | | | | | | | | | | |
| | Dolphin | | 7 | | | 9 | | | | 6 | | | 9 | |
| | Oman | | 67 | | | 62 | | | | 66 | | | 63 | |
| | Qatar | | 75 | | | 74 | | | | 67 | | | 73 | |
| | Other | | 44 | | | 36 | | | | 45 | | | 41 | |
| | Total | | 193 | | | 181 | | | | 184 | | | 186 | |
| | | | | | | | | | | | | | | |
| NGLs (MBBL) | Dolphin | | 7 | | | 9 | | | | 7 | | | 9 | |
| | | | | | | | | | | | | | | |
| Natural Gas (MMCF) | | | | | | | | | | | | | | |
| | Dolphin | | 145 | | | 194 | | | | 139 | | | 183 | |
| | Oman | | 56 | | | 57 | | | | 56 | | | 57 | |
| | Other | | 232 | | | 230 | | | | 238 | | | 224 | |
| | Total | | 433 | | | 481 | | | | 433 | | | 464 | |
| | | | | | | | | | | | | | | |
| | | | | | | | | | | | | | | |
| Barrels of Oil Equivalent (MBOE) | | | 772 | | | 766 | | | | 768 | | | 760 | |
11
Investor Relations Supplemental Schedules
| OCCIDENTAL PETROLEUM | | | | | |
| SUMMARY OF OPERATING STATISTICS | | | | | |
| | | | | | | | | | | | | | | |
| | | | Second Quarter | | | Six Months |
| | | | 2013 | | 2012 | | | 2013 | | 2012 |
| NET SALES VOLUMES PER DAY: | | | | | | | | | | | | | | |
| United States | | | | | | | | | | | | | | |
| Oil (MBBL) | | | 261 | | | 249 | | | | 262 | | | 246 | |
| NGLs (MBBL) | | | 77 | | | 73 | | | | 77 | | | 73 | |
| Natural Gas (MMCF) | | | 795 | | | 835 | | | | 810 | | | 835 | |
| | | | | | | | | | | | | | | |
| Latin America | | | | | | | | | | | | | | |
| Oil (MBBL) | | | 26 | | | 31 | | | | 28 | | | 27 | |
| Natural Gas (MMCF) | | | 13 | | | 14 | | | | 13 | | | 14 | |
| | | | | | | | | | | | | | | |
| Middle East / North Africa | | | | | | | | | | | | | | |
| Oil (MBBL) | | | | | | | | | | | | | | |
| | Dolphin | | 7 | | | 8 | | | | 6 | | | 8 | |
| | Oman | | 63 | | | 60 | | | | 68 | | | 63 | |
| | Qatar | | 80 | | | 73 | | | | 66 | | | 71 | |
| | Other | | 36 | | | 34 | | | | 32 | | | 36 | |
| | Total | | 186 | | | 175 | | | | 172 | | | 178 | |
| | | | | | | | | | | | | | | |
| NGLs (MBBL) | Dolphin | | 7 | | | 9 | | | | 7 | | | 9 | |
| | | | | | | | | | | | | | | |
| Natural Gas (MMCF) | | | 433 | | | 481 | | | | 433 | | | 464 | |
| | | | | | | | | | | | | | | |
| | | | | | | | | | | | | | | |
| Barrels of Oil Equivalent (MBOE) | | | 764 | | | 759 | | | | 755 | | | 752 | |
12
Investor Relations Supplemental Schedules
| OCCIDENTAL PETROLEUM |
| SUMMARY OF OPERATING STATISTICS |
| | | | | | |
| | | | Second Quarter | | Six Months |
| | | | 2013 | | 2012 | | 2013 | | 2012 |
| | | | | | | | | | | | | | | | | | |
| OIL & GAS: | | | | | | | | | | | | | | | | | |
| REALIZED PRICES | | | | | | | | | | | | | | | | | |
| United States | | | | | | | | | | | | | | | | | |
| Oil ($/BBL) | | | | 95.08 | | | | 92.34 | | | | 93.33 | | | | 97.88 | |
| NGLs ($/BBL) | | | | 39.70 | | | | 43.75 | | | | 40.15 | | | | 49.14 | |
Natural gas ($/MCF) | | | | 3.82 | | | | 2.09 | | | | 3.44 | | | | 2.46 | |
| | | | | | | | | | | | | | | | | | |
| Latin America | | | | | | | | | | | | | | | | | |
| Oil ($/BBL) | | | | 98.85 | | | | 98.15 | | | | 103.29 | | | | 100.40 | |
| Natural Gas ($/MCF) | | | | 11.32 | | | | 12.06 | | | | 11.46 | | | | 11.84 | |
| | | | | | | | | | | | | | | | | | |
| Middle East / North Africa | | | | | | | | | | | | | | | | | |
| Oil ($/BBL) | | | | 101.83 | | | | 109.70 | | | | 104.40 | | | | 112.28 | |
| NGLs ($/BBL) | | | | 29.14 | | | | 29.32 | | | | 32.65 | | | | 34.76 | |
| | | | | | | | | | | | | | | | | | |
| Total Worldwide | | | | | | | | | | | | | | | | | |
| Oil ($/BBL) | | | | 97.91 | | | | 99.34 | | | | 97.99 | | | | 103.63 | |
| NGLs ($/BBL) | | | | 38.78 | | | | 42.06 | | | | 39.52 | | | | 47.52 | |
| Natural Gas ($/MCF) | | | | 2.83 | | | | 1.72 | | | | 2.60 | | | | 1.97 | |
| | | | | | | | | | | | | | | | | | |
| INDEX PRICES | | | | | | | | | | | | | | | | | |
| WTI oil ($/BBL) | | | | 94.22 | | | | 93.49 | | | | 94.30 | | | | 98.21 | |
| Brent oil ($/BBL) | | | | 103.35 | | | | 108.90 | | | | 108.00 | | | | 113.63 | |
| NYMEX gas ($/MCF) | | | | 4.00 | | | | 2.28 | | | | 3.68 | | | | 2.55 | |
| | | | | | | | | | | | | | | | | | |
| REALIZED PRICES AS PERCENTAGE OF INDEX PRICES | | | | | | | | | | | | | | | | | |
| Worldwide oil as a percentage of WTI | | | | 104% | | | | 106% | | | | 104% | | | | 106% | |
| Worldwide oil as a percentage of Brent | | | | 95% | | | | 91% | | | | 91% | | | | 91% | |
| Worldwide NGLs as a percentage of WTI | | | | 41% | | | | 45% | | | | 42% | | | | 48% | |
| Domestic natural gas as a percentage of NYMEX | | | | 95% | | | | 91% | | | | 93% | | | | 97% | |
| | | | | | | | | | | | | | | | | | |
| | | | | | | | | | | | | | | | | | |
| | | | | | | | | | | | | | | | | | |
| | | | Second Quarter | | Six Months |
| | | | 2013 | | 2012 | | 2013 | | 2012 |
| Exploration Expense | | | | | | | | | | | | | | | | | |
| United States | | | $ | 45 | | | $ | 80 | | | $ | 85 | | | $ | 141 | |
| Middle East / North Africa | | | | 33 | | | | 16 | | | | 43 | | | | 53 | |
| | | | $ | 78 | | | $ | 96 | | | $ | 128 | | | $ | 194 | |
Investor Relations Supplemental Schedules
| OCCIDENTAL PETROLEUM |
| SUMMARY OF OPERATING STATISTICS |
| | | | | | | | | | | | | | | | | |
| | | | | | | | | | | | | | | | | |
| | | Second Quarter | | Six Months |
| Capital Expenditures ($MM) | | 2013 | | 2012 | | 2013 | | 2012 |
| Oil & Gas | | | | | | | | | | | | | | | | |
| California | | $ | 362 | | | $ | 580 | | | $ | 679 | | | $ | 1,103 | |
| Permian | | | 436 | | | | 508 | | | | 871 | | | | 937 | |
| Midcontinent and other | | | 208 | | | | 418 | | | | 426 | | | | 842 | |
| Latin America | | | 75 | | | | 67 | | | | 145 | | | | 109 | |
| Middle East / North Africa | | | 549 | | | | 430 | | | | 1,096 | | | | 858 | |
| Exploration | | | 103 | | | | 183 | | | | 181 | | | | 354 | |
| Chemical | | | 103 | | | | 75 | | | | 168 | | | | 117 | |
| Midstream, marketing and other | | 336 | | | | 422 | | | | 656 | | | | 754 | |
| Corporate | | | 38 | | | | 30 | | | | 58 | | | | 51 | |
| | TOTAL | | 2,210 | | | | 2,713 | | | | 4,280 | | | | 5,125 | |
| Non-controlling interest contributions | | (39 | ) | | | - | | | | (65 | ) | | | - | |
| | | $ | 2,171 | | | $ | 2,713 | | | $ | 4,215 | | | $ | 5,125 | |
| | | | | | | | | | | | | | | | | |
| | | | | | | | | | | | | | | | | |
| Depreciation, Depletion & | | Second Quarter | | Six Months |
| Amortization of Assets ($MM) | 2013 | | 2012 | | 2013 | | 2012 |
| Oil & Gas | | | | | | | | | | | | | | | | |
| Domestic | | $ | 732 | | | $ | 582 | | | $ | 1,472 | | | $ | 1,170 | |
| Latin America | | | 27 | | | | 31 | | | | 57 | | | | 56 | |
| Middle East / North Africa | | | 395 | | | | 328 | | | | 740 | | | | 663 | |
| Chemical | | | 87 | | | | 86 | | | | 172 | | | | 171 | |
| Midstream, marketing and other | | 52 | | | | 54 | | | | 102 | | | | 100 | |
| Corporate | | | 10 | | | | 6 | | | | 19 | | | | 12 | |
| | TOTAL | $ | 1,303 | | | $ | 1,087 | | | $ | 2,562 | | | $ | 2,172 | |
14
Investor Relations Supplemental Schedules
| OCCIDENTAL PETROLEUM | |
| CORPORATE | |
| ($ millions) | |
| | | | | | | | | | | | | |
| | | 30-Jun-13 | | 31-Dec-12 |
| | | | | | | | | | | | | |
| CAPITALIZATION | | | | | | | | | | | | |
| | | | | | | | | | | | | |
| Long-Term Debt (including current maturities) | | | $ | 7,626 | | | | | $ | 7,623 | | |
| | | | | | | | | | | | | |
| EQUITY | | | $ | 41,850 | | | | | $ | 40,048 | | |
| | | | | | | | | | | | | |
| Total Debt To Total Capitalization | | | | 15% | | | | | 16% | |
15