EXHIBIT 99.3
Investor Relations Supplemental Schedules

Investor Relations Supplemental Schedules
Summary
($ Millions)
| | 1Q 2012 | | 1Q 2011 | |
| | | | | |
Core Results | | $1,560 | | $1,593 | |
EPS - Diluted | | $1.92 | | $1.96 | |
| | | | | |
Reported Net Income | | $1,559 | | $1,549 | |
EPS - Diluted | | $1.92 | | $1.90 | |
| | | | | |
Total Worldwide Sales Volumes (mboe/day) | | 745 | | 728 | |
Total Worldwide Production Volumes (mboe/day) | | 755 | | 730 | |
| | | | | |
Total Worldwide Crude Oil Realizations ($/BBL) | | $107.98 | | $92.14 | |
Total Worldwide NGL Realizations ($/BBL) | | $52.51 | | $52.64 | |
Domestic Natural Gas Realizations ($/MCF) | | $2.84 | | $4.21 | |
| | | | | |
Wtd. Average Basic Shares O/S (mm) | | 810.5 | | 812.6 | |
Wtd. Average Diluted Shares O/S (mm) | | 811.3 | | 813.4 | |
| | | | | |
Shares Outstanding (mm) | | 811.1 | | 812.9 | |
| | | | | |
Cash Flow from Operations | | $ | 2,800 | | $ | 2,200 | |
| | | | | | | |
1
Investor Relations Supplemental Schedules
OCCIDENTAL PETROLEUM
2012 First Quarter
Net Income (Loss)
($ millions)
| | Reported | | | | | | Core |
| | Income | | Significant Items Affecting Income | | Results |
Oil & Gas | | $ | 2,504 | | | | | | $ | 2,504 |
| | | | | | | | |
Chemical | | 184 | | | | | | 184 |
| | | | | | | | |
Midstream, marketing and other | | 131 | | | | | | 131 |
| | | | | | | | |
Corporate | | | | | | | | |
Interest expense, net | | (28) | | | | | | (28) |
| | | | | | | | |
Other | | (92) | | | | | | (92) |
| | | | | | | | |
Taxes | | (1,139) | | | | | | (1,139) |
| | | | | | | | |
Income from continuing operations | | 1,560 | | - | | | | 1,560 |
Discontinued operations, net of tax | | (1) | | 1 | | Discontinued operations, net | | - |
Net Income | | $ | 1,559 | | $ | 1 | | | | $ | 1,560 |
| | | | | | | | |
Basic Earnings Per Common Share | | | | | | | | |
Income from continuing operations | | $ | 1.92 | | | | | | |
Discontinued operations, net | | - | | | | | | |
Net Income | | $ | 1.92 | | | | | | $ | 1.92 |
| | | | | | | | |
Diluted Earnings Per Common Share | | | | | | | | |
Income from continuing operations | | $ | 1.92 | | | | | | |
Discontinued operations, net | | - | | | | | | |
Net Income | | $ | 1.92 | | | | | | $ | 1.92 |
| | | | | | | | | | | |
2
Investor Relations Supplemental Schedules
OCCIDENTAL PETROLEUM
2011 First Quarter
Net Income (Loss)
($ millions)
| | Reported | | | | | | Core |
| | Income | | Significant Items Affecting Income | | Results |
Oil & Gas | | $ | 2,468 | | $ | 35 | | Libya exploration write-off | | $ | 2,510 |
| | | | (22) | | Gain on sale of Colombia pipeline interest | | |
| | | | 29 | | Foreign Tax | | |
| | | | | | | | |
Chemical | | 219 | | | | | | 219 |
| | | | | | | | |
Midstream, marketing and other | | 114 | | | | | | 114 |
| | | | | | | | |
Corporate | | | | | | | | |
Interest expense, net | | (214) | | 163 | | Premium on debt extinguishments | | (51) |
| | | | | | | | |
Other | | (128) | | | | | | (128) |
| | | | | | | | |
Taxes | | (1,054) | | (50) | | Tax effect of adjustments | | (1,071) |
| | | | 33 | | State income tax charge | | |
| | | | | | | | |
Income from continuing operations | | 1,405 | | 188 | | | | 1,593 |
Discontinued operations, net of tax | | 144 | | (144) | | Discontinued operations, net | | - |
Net Income | | $ | 1,549 | | $ | 44 | | | | $ | 1,593 |
| | | | | | | | |
Basic Earnings Per Common Share | | | | | | | | |
Income from continuing operations | | $ | 1.72 | | | | | | |
Discontinued operations, net | | 0.18 | | | | | | |
Net Income | | $ | 1.90 | | | | | | $ | 1.96 |
| | | | | | | | |
Diluted Earnings Per Common Share | | | | | | |
Income from continuing operations | | $ | 1.72 | | | | | | |
Discontinued operations, net | | 0.18 | | | | | | |
Net Income | | $ | 1.90 | | | | | | $ | 1.96 |
3
Investor Relations Supplemental Schedules

OCCIDENTAL PETROLEUM
Worldwide Effective Tax Rate
| | QUARTERLY |
| | 2012 | | 2011 | | | 2011 |
REPORTED INCOME | | QTR 1 | | QTR 4 | | | QTR 1 |
Oil & Gas | | 2,504 | | | 2,537 | | | 2,468 | |
Chemicals | | 184 | | | 144 | | | 219 | |
Midstream, marketing and other | | 131 | | | 70 | | | 114 | |
Corporate & other | | (120 | ) | | (161 | ) | | (342 | ) |
Pre-tax income | | 2,699 | | | 2,590 | | | 2,459 | |
| | | | | | | | | |
Income tax expense | | | | | | | | | |
Federal and state | | 446 | | | 435 | | | 365 | |
Foreign | | 693 | | | 514 | | | 689 | |
Total | | 1,139 | | | 949 | | | 1,054 | |
| | | | | | | | | |
Income from continuing operations | | 1,560 | | | 1,641 | | | 1,405 | |
| | | | | | | | | |
Worldwide effective tax rate | | 42% | | 37% | | 43% |
| | | | | | | | | |
| | 2012 | | 2011 | | 2011 |
CORE RESULTS | | QTR 1 | | QTR 4 | | QTR 1 |
Oil & Gas | | 2,504 | | | 2,537 | | | 2,510 | |
Chemicals | | 184 | | | 144 | | | 219 | |
Midstream, marketing and other | | 131 | | | 70 | | | 114 | |
Corporate & other | | (120 | ) | | (161 | ) | | (179 | ) |
Pre-tax income | | 2,699 | | | 2,590 | | | 2,664 | |
| | | | | | | | | |
Income tax expense | | | | | | | | | |
Federal and state | | 446 | | | 435 | | | 395 | |
Foreign | | 693 | | | 514 | | | 676 | |
Total | | 1,139 | | | 949 | | | 1,071 | |
| | | | | | | | | |
Core results | | 1,560 | | | 1,641 | | | 1,593 | |
| | | | | | | | | |
Worldwide effective tax rate | | 42% | | 37% | | 40% |
4
Investor Relations Supplemental Schedules
OCCIDENTAL PETROLEUM
2012 First Quarter Net Income (Loss)
Reported Income Comparison
| | First | | Fourth | | |
| | Quarter | | Quarter | | |
| | 2012 | | 2011 | | B / (W) |
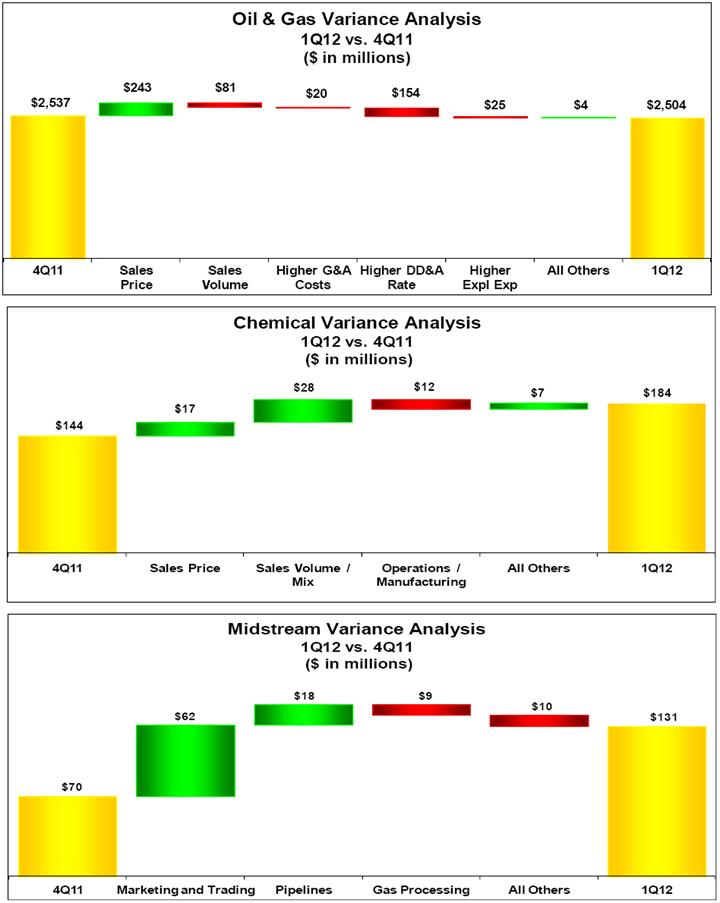
Oil & Gas | | $ | 2,504 | | | $ | 2,537 | | | $ | (33 | ) |
Chemical | | | 184 | | | | 144 | | | | 40 | |
Midstream, marketing and other | | | 131 | | | | 70 | | | | 61 | |
Corporate | | | | | | | | | | | | |
Interest expense, net | | | (28 | ) | | | (25 | ) | | | (3 | ) |
Other | | | (92 | ) | | | (136 | ) | | | 44 | |
Taxes | | | (1,139 | ) | | | (949 | ) | | | (190 | ) |
Income from continuing operations | | | 1,560 | | | | 1,641 | | | | (81 | ) |
Discontinued operations, net | | | (1 | ) | | | (7 | ) | | | 6 | |
Net Income | | $ | 1,559 | | | $ | 1,634 | | | $ | (75 | ) |
| | | | | | | | | | | |
Earnings Per Common Share | | | | | | | | | | | |
Basic | | $ | 1.92 | | | $ | 2.01 | | | $ | (0.09 | ) |
Diluted | | $ | 1.92 | | | $ | 2.01 | | | $ | (0.09 | ) |
| | | | | | | | | |
Worldwide Effective Tax Rate | | 42% | | 37% | | -5% |
| | | | | | | | | |
OCCIDENTAL PETROLEUM
2012 First Quarter Net Income (Loss)
Core Results Comparison
| | First | | Fourth | | |
| | Quarter | | Quarter | | |
| | 2012 | | 2011 | | B / (W) |
Oil & Gas | | $ | 2,504 | | | $ | 2,537 | | | $ | (33 | ) |
Chemical | | | 184 | | | | 144 | | | | 40 | |
Midstream, marketing and other | | | 131 | | | | 70 | | | | 61 | |
Corporate | | | | | | | | | | | | |
Interest expense, net | | | (28 | ) | | | (25 | ) | | | (3 | ) |
Other | | | (92 | ) | | | (136 | ) | | | 44 | |
Taxes | | | (1,139 | ) | | | (949 | ) | | | (190 | ) |
Core Results | | | $1,560 | | | $ | 1,641 | | | $ | (81 | ) |
| | | | | | | | | | | | |
Core Results Per Common Share | | | | | | | | | | | | |
Basic | | $ | 1.92 | | | $ | 2.02 | | | $ | (0.10 | ) |
Diluted | | $ | 1.92 | | | $ | 2.02 | | | $ | (0.10 | ) |
| | | | | | | | | |
Worldwide Effective Tax Rate | | 42% | | 37% | | -5% |
5
Investor Relations Supplemental Schedules
6
Investor Relations Supplemental Schedules

OCCIDENTAL PETROLEUM
2012 First Quarter Net Income (Loss)
Reported Income Comparison
| | First | | First | | | |
| | Quarter | | Quarter | | | |
| | 2012 | | 2011 | | B / (W) | |
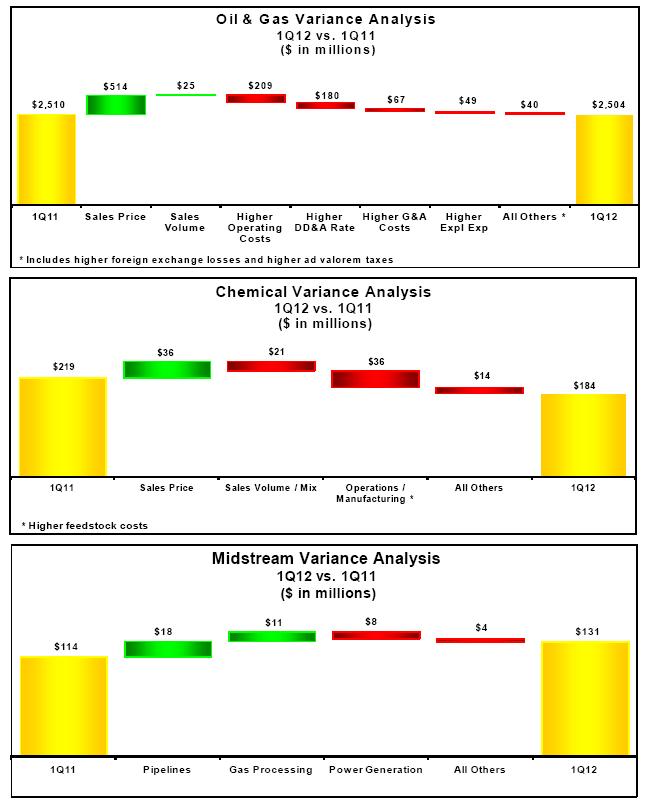
Oil & Gas | | $ | 2,504 | | $ | 2,468 | | $ | 36 | |
Chemical | | 184 | | 219 | | (35) | |
Midstream, marketing and other | | 131 | | 114 | | 17 | |
Corporate | | | | | | | |
Interest expense, net | | (28) | | (214) | | 186 | |
Other | | (92) | | (128) | | 36 | |
Taxes | | (1,139) | | (1,054) | | (85) | |
Income from continuing operations | | 1,560 | | 1,405 | | 155 | |
Discontinued operations, net | | (1) | | 144 | | (145) | |
Net Income | | $ | 1,559 | | $ | 1,549 | | $ | 10 | |
| | | | | | | |
Earnings Per Common Share | | | | | | | |
Basic | | $ | 1.92 | | $ | 1.90 | | $ | 0.02 | |
Diluted | | $ | 1.92 | | $ | 1.90 | | $ | 0.02 | |
| | | | | | | |
Worldwide Effective Tax Rate | | 42% | | 43% | | 1% | |
OCCIDENTAL PETROLEUM
2012 First Quarter Net Income (Loss)
Core Results Comparison
| | First | | First | | | |
| | Quarter | | Quarter | | | |
| | 2012 | | 2011 | | B / (W) | |
Oil & Gas | | $ | 2,504 | | $ | 2,510 | | $ | (6) | |
Chemical | | 184 | | 219 | | (35) | |
Midstream, marketing and other | | 131 | | 114 | | 17 | |
Corporate | | | | | | | |
Interest expense, net | | (28) | | (51) | | 23 | |
Other | | (92) | | (128) | | 36 | |
Taxes | | (1,139) | | (1,071) | | (68) | |
Core Results | | $ | 1,560 | | $ | 1,593 | | $ | (33) | |
| | | | | | | |
Core Results Per Common Share | | | | | | | |
Basic | | $ | 1.92 | | $ | 1.96 | | $ | (0.04) | |
Diluted | | $ | 1.92 | | $ | 1.96 | | $ | (0.04) | |
| | | | | | | |
Worldwide Effective Tax Rate | | 42% | | 40% | | -2% | |
7
Investor Relations Supplemental Schedules
8
Investor Relations Supplemental Schedules
OCCIDENTAL PETROLEUM
SUMMARY OF OPERATING STATISTICS
| | | | First Quarter | |
| | | | 2012 | | 2011 | |
NET PRODUCTION PER DAY: | | | | | | | |
| | | | | | | |
United States | | | | | | | |
Crude Oil (MBBL) | | | | | | | |
| | California | | 86 | | 77 | |
| | Permian | | 139 | | 132 | |
| | Midcontinent and other | | 19 | | 13 | |
| | Total | | 244 | | 222 | |
NGL (MBBL) | | | | | | | |
| | California | | 15 | | 14 | |
| | Permian | | 39 | | 37 | |
| | Midcontinent and other | | 18 | | 8 | |
| | Total | | 72 | | 59 | |
Natural Gas (MMCF) | | | | | | | |
| | California | | 267 | | 242 | |
| | Permian | | 155 | | 165 | |
| | Midcontinent and other | | 412 | | 327 | |
| | Total | | 834 | | 734 | |
| | | | | | | |
Latin America | | | | | | | |
| | | | | | | |
Crude Oil (MBBL) | | Colombia | | 24 | | 31 | |
| | | | | | | |
Natural Gas (MMCF) | | Bolivia | | 14 | | 16 | |
| | | | | | | |
Middle East / North Africa | | | | | | | |
Crude Oil (MBBL) | | | | | | | |
| | Bahrain | | 4 | | 4 | |
| | Dolphin | | 8 | | 9 | |
| | Oman | | 64 | | 67 | |
| | Qatar | | 72 | | 75 | |
| | Other | | 42 | | 57 | |
| | Total | | 190 | | 212 | |
NGL (MBBL) | | | | | | | |
| | Dolphin | | 9 | | 10 | |
| | Other | | - | | 1 | |
| | Total | | 9 | | 11 | |
Natural Gas (MMCF) | | | | | | | |
| | Bahrain | | 219 | | 173 | |
| | Dolphin | | 173 | | 196 | |
| | Oman | | 57 | | 50 | |
| | Total | | 449 | | 419 | |
| | | | | | | |
| | | | | | | |
Barrels of Oil Equivalent (MBOE) | | | | 755 | | 730 | |
9
Investor Relations Supplemental Schedules

OCCIDENTAL PETROLEUM
SUMMARY OF OPERATING STATISTICS
| | | | First Quarter |
| | | | 2012 | | 2011 |
NET SALES VOLUMES PER DAY: | | | | | | |
United States | | | | | | |
Crude Oil (MBBL) | | | | 244 | | 222 |
NGL (MBBL) | | | | 72 | | 59 |
Natural Gas (MMCF) | | | | 834 | | 734 |
| | | | | | |
Latin America | | | | | | |
Crude Oil (MBBL) | | | | 24 | | 33 |
Natural Gas (MMCF) | | | | 14 | | 16 |
| | | | | | |
Middle East / North Africa | | | | | | |
Crude Oil (MBBL) | | | | | | |
| | Bahrain | | 4 | | 4 |
| | Dolphin | | 8 | | 9 |
| | Oman | | 64 | | 71 |
| | Qatar | | 70 | | 76 |
| | Other | | 34 | | 49 |
| | Total | | 180 | | 209 |
| | | | | | |
NGL (MBBL) | | Dolphin | | 9 | | 10 |
| | | | | | |
Natural Gas (MMCF) | | | | 449 | | 419 |
| | | | | | |
| | | | | | |
Barrels of Oil Equivalent (MBOE) | | | | 745 | | 728 |
10
Investor Relations Supplemental Schedules
OCCIDENTAL PETROLEUM
SUMMARY OF OPERATING STATISTICS
| | First Quarter |
| | 2012 | | 2011 |
| | | | |
OIL & GAS: | | | | |
PRICES | | | | |
United States | | | | |
Crude Oil ($/BBL) | | 103.52 | | 88.04 |
NGL ($/BBL) | | 53.95 | | 55.90 |
Natural gas ($/MCF) | | 2.84 | | 4.21 |
| | | | |
Latin America | | | | |
Crude Oil ($/BBL) | | 103.31 | | 92.68 |
Natural Gas ($/MCF) | | 11.63 | | 8.23 |
| | | | |
Middle East / North Africa | | | | |
Crude Oil ($/BBL) | | 114.80 | | 96.44 |
NGL ($/BBL) | | 40.77 | | 33.93 |
| | | | |
Total Worldwide | | | | |
Crude Oil ($/BBL) | | 107.98 | | 92.14 |
NGL ($/BBL) | | 52.51 | | 52.64 |
Natural Gas ($/MCF) | | 2.22 | | 3.05 |
| | | | |
| | | | |
| | First Quarter |
| | 2012 | | 2011 |
Exploration Expense | | | | |
United States | | $ 61 | | $ 40 |
Latin America | | - | | - |
Middle East / North Africa | | 37 | | 44 |
TOTAL REPORTED | | $ 98 | | $ 84 |
Less - non-core impairments | | - | | (35) |
TOTAL CORE | | $ 98 | | $ 49 |
11
Investor Relations Supplemental Schedules
OCCIDENTAL PETROLEUM
SUMMARY OF OPERATING STATISTICS
| | First Quarter |
Capital Expenditures ($MM) | | 2012 | | 2011 |
Oil & Gas | | | | |
California | | $ 523 | | $ 308 |
Permian | | 429 | | 216 |
Midcontinent and other | | 424 | | 180 |
Latin America | | 42 | | 42 |
Middle East / North Africa | | 428 | | 352 |
Exploration | | 171 | | 65 |
Chemicals | | 42 | | 22 |
Midstream, marketing and other | | 332 | | 127 |
Corporate | | 21 | | 13 |
TOTAL | | $ 2,412 | | $ 1,325 |
| | | | |
| | | | |
Depreciation, Depletion & | | First Quarter |
Amortization of Assets ($MM) | | 2012 | | 2011 |
Oil & Gas | | | | |
Domestic | | $ 588 | | $ 407 |
Latin America | | 25 | | 28 |
Middle East / North Africa | | 335 | | 322 |
Chemicals | | 85 | | 82 |
Midstream, marketing and other | | 46 | | 45 |
Corporate | | 6 | | 6 |
TOTAL | | $ 1,085 | | $ 890 |
12
Investor Relations Supplemental Schedules
OCCIDENTAL PETROLEUM
CORPORATE
($ millions)
| | 31-Mar-12 | | 31-Dec-11 | |
| | | | | |
CAPITALIZATION | | | | | |
| | | | | |
Long-Term Debt (including short-term borrowings) | | $ 5,873 | | $ 5,871 | |
| | | | | |
EQUITY | | $ 38,747 | | $ 37,620 | |
| | | | | |
Total Debt To Total Capitalization | | 13% | | 13% | |
13