Exhibit 99.4
Occidental Petroleum Corporation First Quarter 2014 Earnings Conference Call May 5, 2014 |
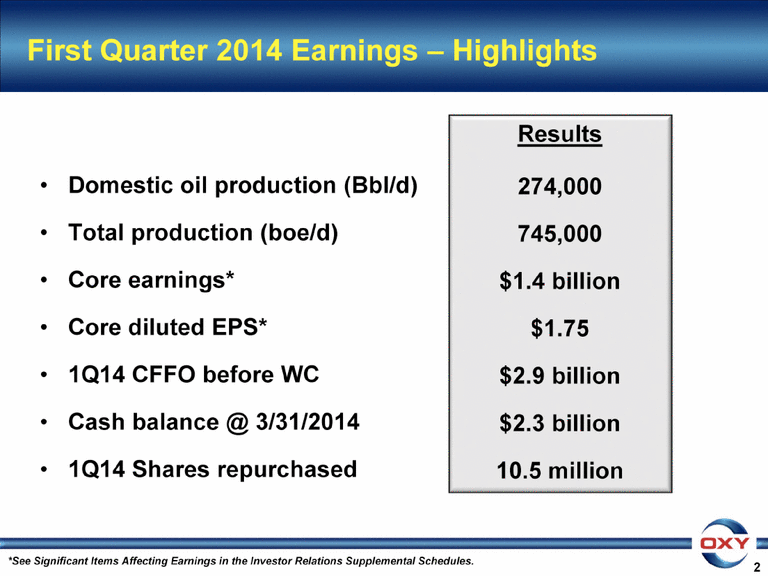
First Quarter 2014 Earnings – Highlights Domestic oil production (Bbl/d) Total production (boe/d) Core earnings* Core diluted EPS* 1Q14 CFFO before WC Cash balance @ 3/31/2014 1Q14 Shares repurchased 2 *See Significant Items Affecting Earnings in the Investor Relations Supplemental Schedules. Results 274,000 745,000 $1.4 billion $1.75 $2.9 billion $2.3 billion 10.5 million |
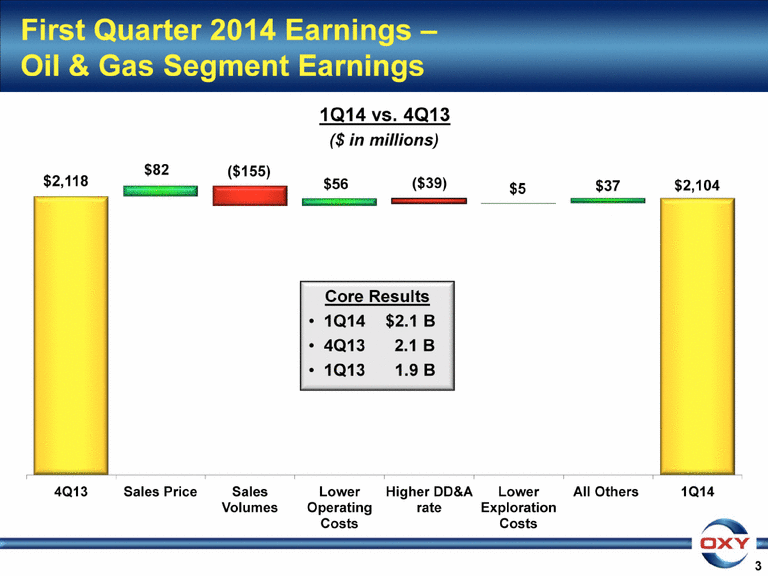
3 1Q14 vs. 4Q13 ($ in millions) Core Results 1Q14 $2.1 B 4Q13 2.1 B 1Q13 1.9 B First Quarter 2014 Earnings – Oil & Gas Segment Earnings $37 |
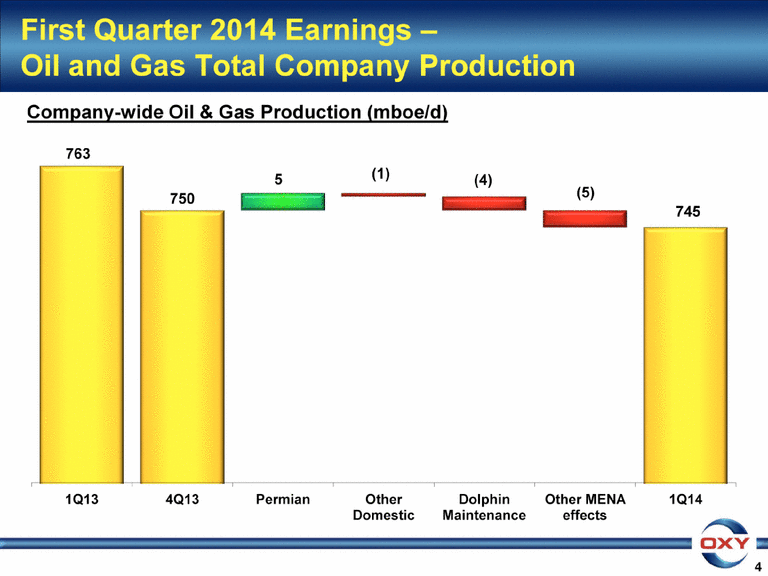
4 First Quarter 2014 Earnings – Oil and Gas Total Company Production 745 (5) (4) (1) 5 763 Company-wide Oil & Gas Production (mboe/d) 750 |
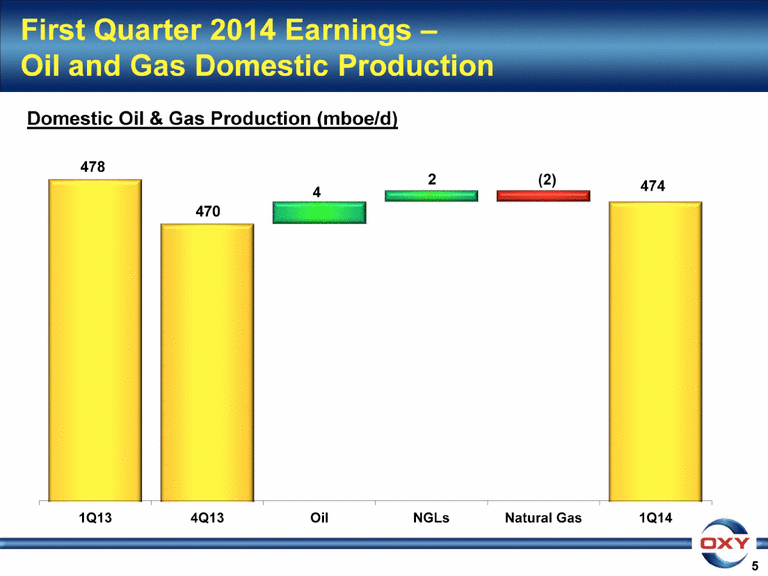
5 2 First Quarter 2014 Earnings – Oil and Gas Domestic Production 478 (2) 470 4 474 Domestic Oil & Gas Production (mboe/d) |
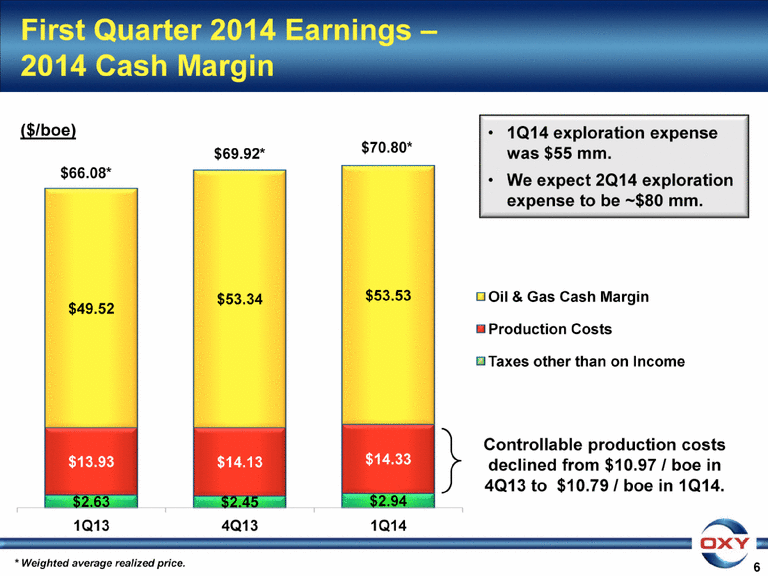
First Quarter 2014 Earnings – 2014 Cash Margin 6 $69.92* $70.80* $66.08* 1Q14 exploration expense was $55 mm. We expect 2Q14 exploration expense to be ~$80 mm. ($/boe) * Weighted average realized price. Controllable production costs declined from $10.97 / boe in 4Q13 to $10.79 / boe in 1Q14. |
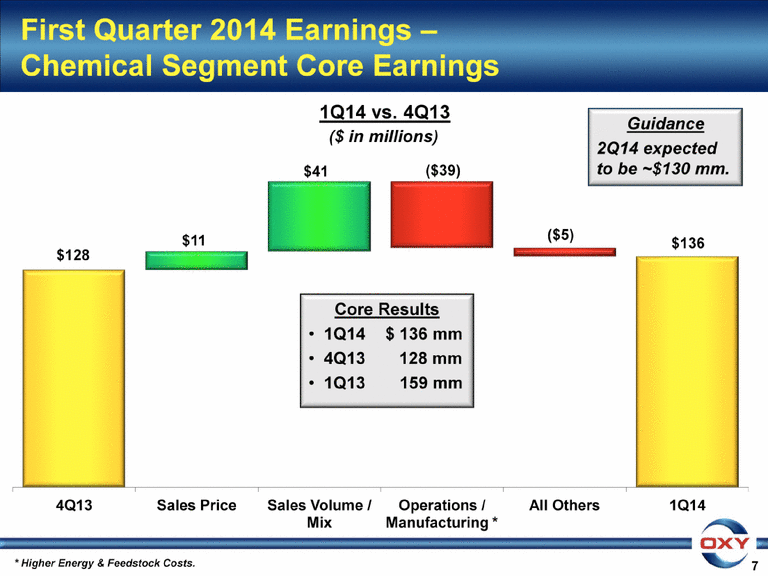
7 1Q14 vs. 4Q13 ($ in millions) Guidance 2Q14 expected to be ~$130 mm. First Quarter 2014 Earnings – Chemical Segment Core Earnings Core Results 1Q14 $ 136 mm 4Q13 128 mm 1Q13 159 mm * Higher Energy & Feedstock Costs. |
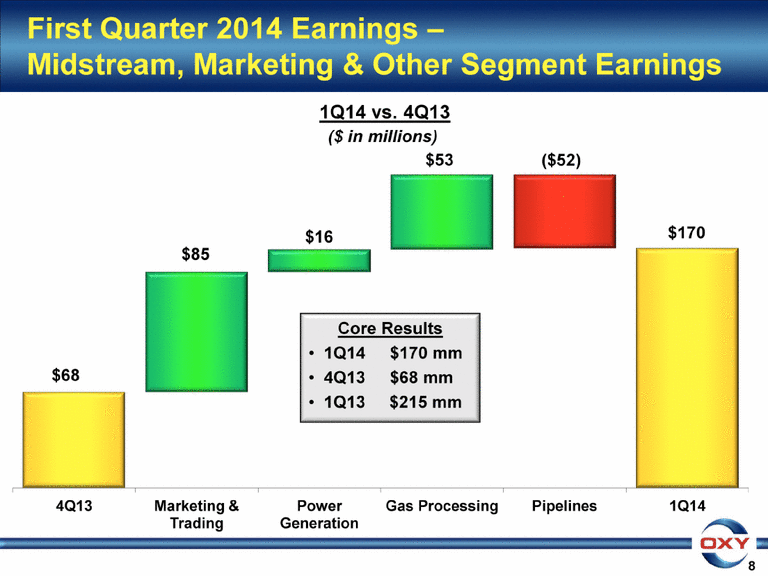
8 1Q14 vs. 4Q13 ($ in millions) First Quarter 2014 Earnings – Midstream, Marketing & Other Segment Earnings Core Results 1Q14 $170 mm 4Q13 $68 mm 1Q13 $215 mm |
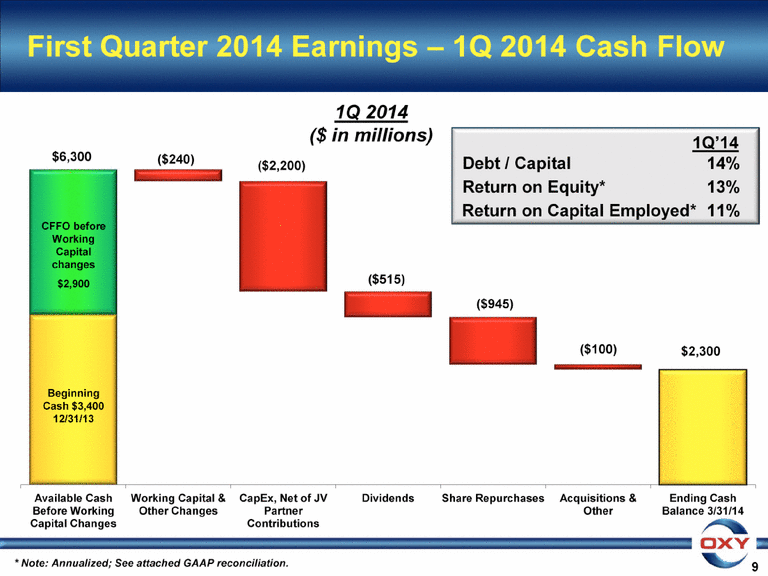
9 First Quarter 2014 Earnings – 1Q 2014 Cash Flow 1Q 2014 ($ in millions) CFFO before Working Capital changes $2,900 ($2,200) Beginning Cash $3,400 12/31/13 $2,300 1Q’14 Debt / Capital 14% Return on Equity* 13% Return on Capital Employed* 11% * Note: Annualized; See attached GAAP reconciliation. ($240) |
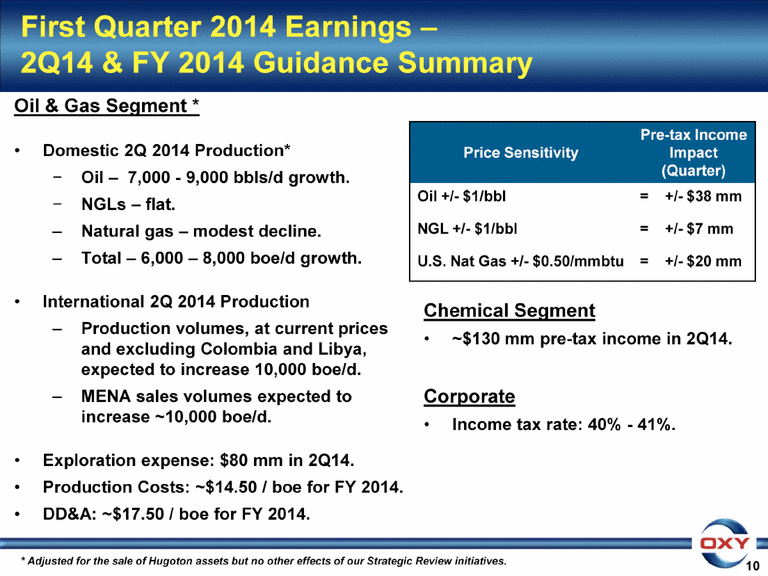
10 First Quarter 2014 Earnings – 2Q14 & FY 2014 Guidance Summary Oil & Gas Segment * Domestic 2Q 2014 Production* Oil – 7,000 - 9,000 bbls/d growth. NGLs – flat. Natural gas – modest decline. Total – 6,000 – 8,000 boe/d growth. International 2Q 2014 Production Production volumes, at current prices and excluding Colombia and Libya, expected to increase 10,000 boe/d. MENA sales volumes expected to increase ~10,000 boe/d. Exploration expense: $80 mm in 2Q14. Production Costs: ~$14.50 / boe for FY 2014. DD&A: ~$17.50 / boe for FY 2014. Price Sensitivity Pre-tax Income Impact (Quarter) Oil +/- $1/bbl = +/- $38 mm NGL +/- $1/bbl = +/- $7 mm U.S. Nat Gas +/- $0.50/mmbtu = +/- $20 mm Chemical Segment ~$130 mm pre-tax income in 2Q14. Corporate Income tax rate: 40% - 41%. * Adjusted for the sale of Hugoton assets but no other effects of our Strategic Review initiatives. |
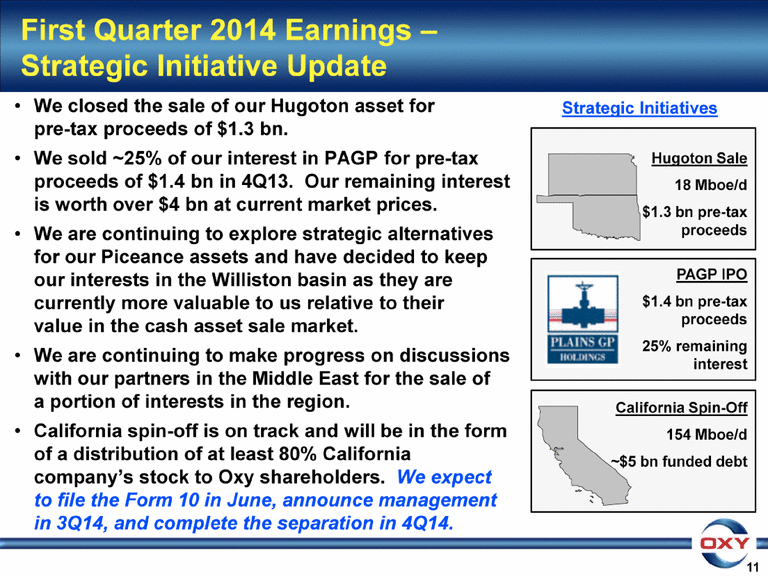
First Quarter 2014 Earnings – Strategic Initiative Update We closed the sale of our Hugoton asset for pre-tax proceeds of $1.3 bn. We sold ~25% of our interest in PAGP for pre-tax proceeds of $1.4 bn in 4Q13. Our remaining interest is worth over $4 bn at current market prices. We are continuing to explore strategic alternatives for our Piceance assets and have decided to keep our interests in the Williston basin as they are currently more valuable to us relative to their value in the cash asset sale market. We are continuing to make progress on discussions with our partners in the Middle East for the sale of a portion of interests in the region. California spin-off is on track and will be in the form of a distribution of at least 80% California company’s stock to Oxy shareholders. We expect to file the Form 10 in June, announce management in 3Q14, and complete the separation in 4Q14. 11 California Spin-Off 154 Mboe/d ~$5 bn funded debt Hugoton Sale 18 Mboe/d $1.3 bn pre-tax proceeds PAGP IPO $1.4 bn pre-tax proceeds 25% remaining interest Strategic Initiatives |
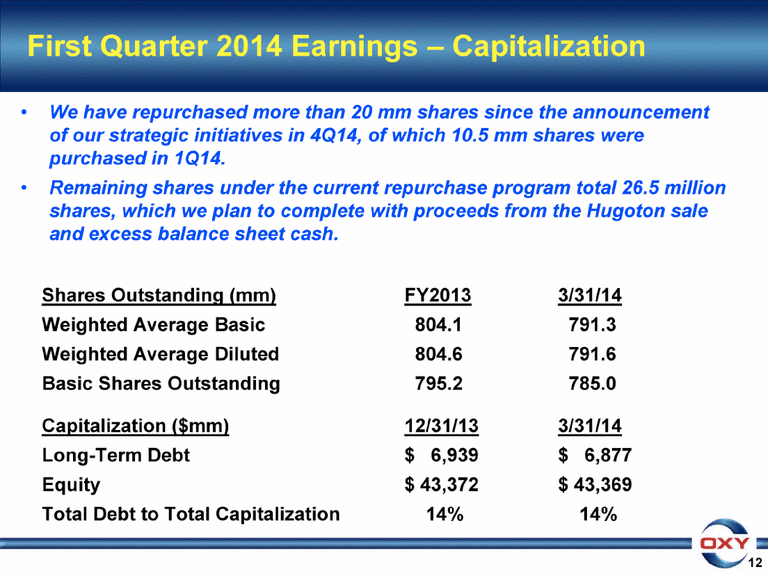
12 First Quarter 2014 Earnings – Capitalization We have repurchased more than 20 mm shares since the announcement of our strategic initiatives in 4Q14, of which 10.5 mm shares were purchased in 1Q14. Remaining shares under the current repurchase program total 26.5 million shares, which we plan to complete with proceeds from the Hugoton sale and excess balance sheet cash. Shares Outstanding (mm) FY2013 3/31/14 Weighted Average Basic 804.1 791.3 Weighted Average Diluted 804.6 791.6 Basic Shares Outstanding 795.2 785.0 Capitalization ($mm) 12/31/13 3/31/14 Long-Term Debt $ 6,939 $ 6,877 Equity $ 43,372 $ 43,369 Total Debt to Total Capitalization 14% 14% |
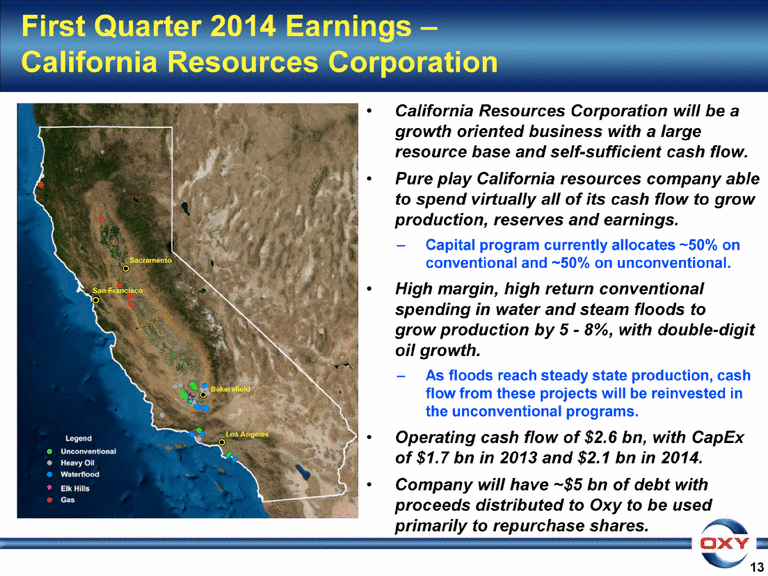
First Quarter 2014 Earnings – California Resources Corporation 13 California Resources Corporation will be a growth oriented business with a large resource base and self-sufficient cash flow. Pure play California resources company able to spend virtually all of its cash flow to grow production, reserves and earnings. Capital program currently allocates ~50% on conventional and ~50% on unconventional. High margin, high return conventional spending in water and steam floods to grow production by 5 - 8%, with double-digit oil growth. As floods reach steady state production, cash flow from these projects will be reinvested in the unconventional programs. Operating cash flow of $2.6 bn, with CapEx of $1.7 bn in 2013 and $2.1 bn in 2014. Company will have ~$5 bn of debt with proceeds distributed to Oxy to be used primarily to repurchase shares. |
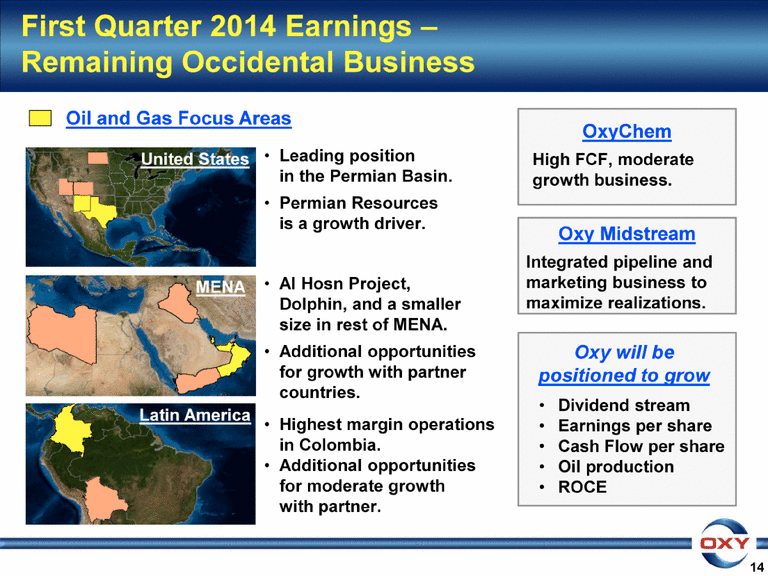
Oil and Gas Focus Areas United States MENA Latin America First Quarter 2014 Earnings – Remaining Occidental Business Leading position in the Permian Basin. Permian Resources is a growth driver. Al Hosn Project, Dolphin, and a smaller size in rest of MENA. Additional opportunities for growth with partner countries. Highest margin operations in Colombia. Additional opportunities for moderate growth with partner. Oxy will be positioned to grow Dividend stream Earnings per share Cash Flow per share Oil production ROCE 14 OxyChem High FCF, moderate growth business. Oxy Midstream Integrated pipeline and marketing business to maximize realizations. |
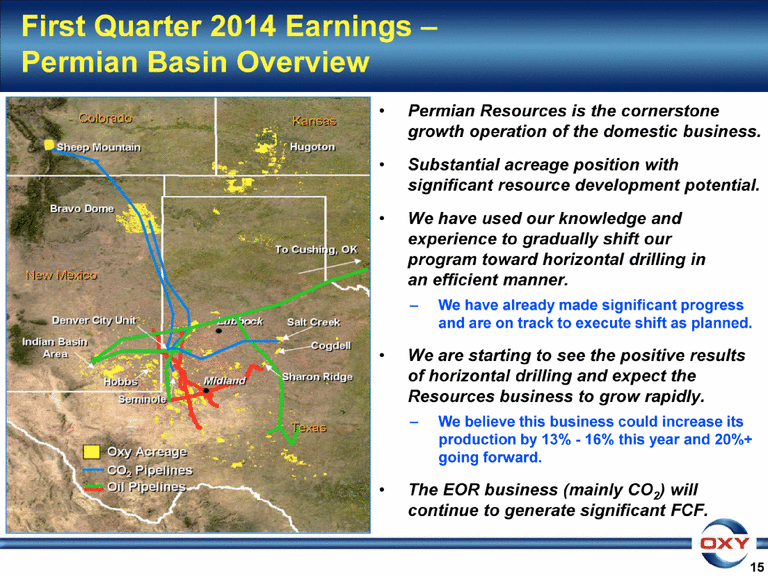
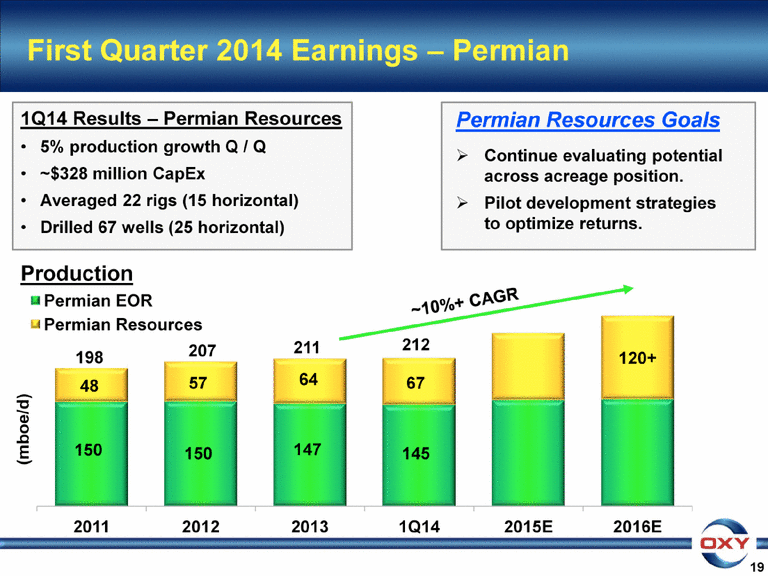
First Quarter 2014 Earnings – Permian Basin Overview 15 Permian Resources is the cornerstone growth operation of the domestic business. Substantial acreage position with significant resource development potential. We have used our knowledge and experience to gradually shift our program toward horizontal drilling in an efficient manner. We have already made significant progress and are on track to execute shift as planned. We are starting to see the positive results of horizontal drilling and expect the Resources business to grow rapidly. We believe this business could increase its production by 13% - 16% this year and 20%+ going forward. The EOR business (mainly CO2) will continue to generate significant FCF. |
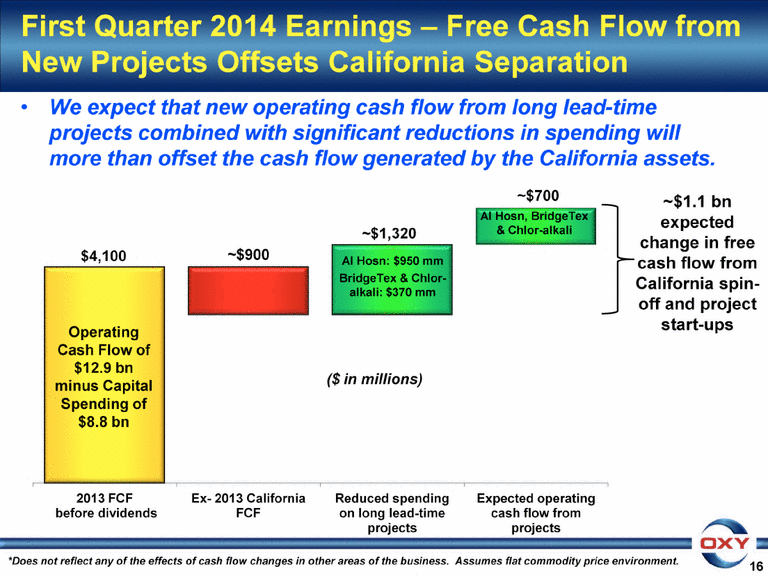
16 First Quarter 2014 Earnings – Free Cash Flow from New Projects Offsets California Separation We expect that new operating cash flow from long lead-time projects combined with significant reductions in spending will more than offset the cash flow generated by the California assets. Operating Cash Flow of $12.9 bn minus Capital Spending of $8.8 bn Al Hosn, BridgeTex & Chlor-alkali *Does not reflect any of the effects of cash flow changes in other areas of the business. Assumes flat commodity price environment. ~$1.1 bn expected change in free cash flow from California spin-off and project start-ups Al Hosn: $950 mm BridgeTex & Chlor-alkali: $370 mm ($ in millions) |
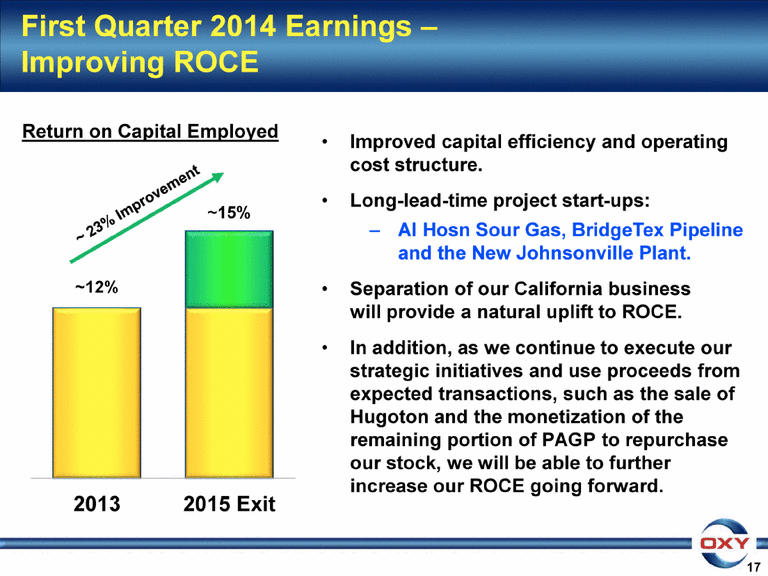
Return on Capital Employed ~ 23% Improvement 17 First Quarter 2014 Earnings – Improving ROCE Improved capital efficiency and operating cost structure. Long-lead-time project start-ups: Al Hosn Sour Gas, BridgeTex Pipeline and the New Johnsonville Plant. Separation of our California business will provide a natural uplift to ROCE. In addition, as we continue to execute our strategic initiatives and use proceeds from expected transactions, such as the sale of Hugoton and the monetization of the remaining portion of PAGP to repurchase our stock, we will be able to further increase our ROCE going forward. |
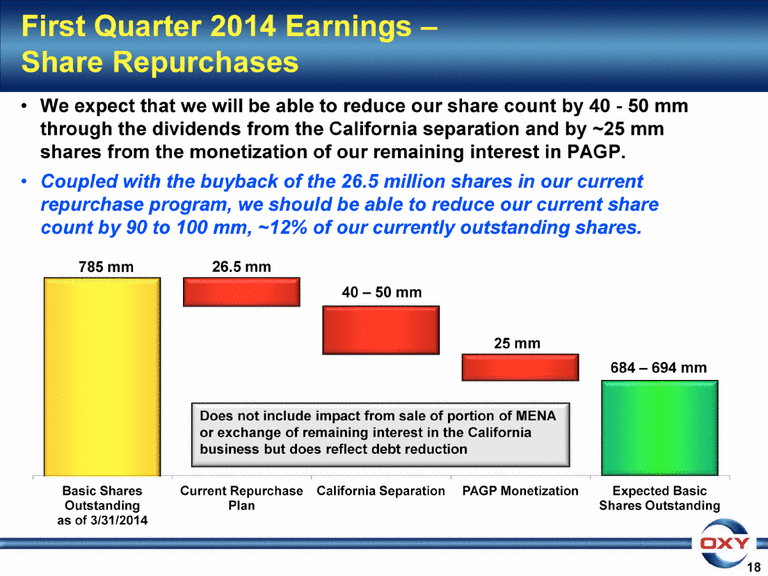
18 First Quarter 2014 Earnings – Share Repurchases We expect that we will be able to reduce our share count by 40 - 50 mm through the dividends from the California separation and by ~25 mm shares from the monetization of our remaining interest in PAGP. Coupled with the buyback of the 26.5 million shares in our current repurchase program, we should be able to reduce our current share count by 90 to 100 mm, ~12% of our currently outstanding shares. Does not include impact from sale of portion of MENA or exchange of remaining interest in the California business but does reflect debt reduction |
First Quarter 2014 Earnings – Permian Permian Resources Goals 19 Continue evaluating potential across acreage position. Pilot development strategies to optimize returns. 211 ~10%+ CAGR Production 150 198 57 48 212 67 145 1Q14 Results – Permian Resources 5% production growth Q / Q ~$328 million CapEx Averaged 22 rigs (15 horizontal) Drilled 67 wells (25 horizontal) |
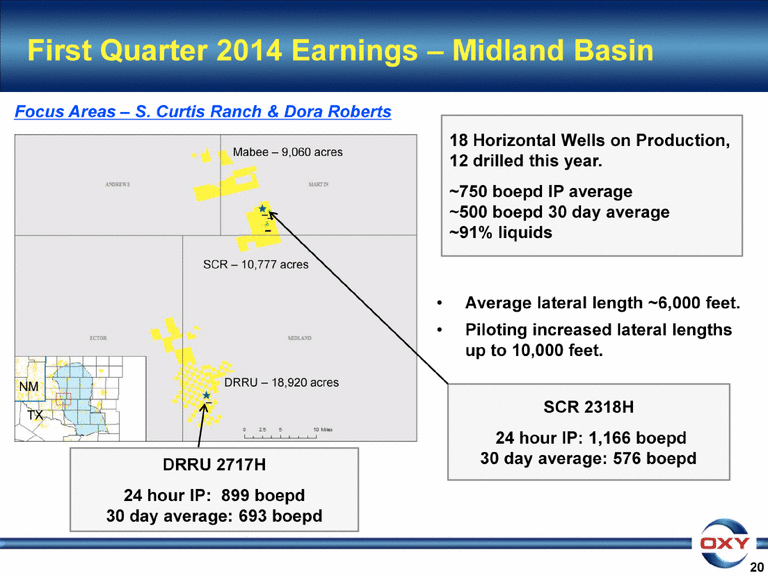
First Quarter 2014 Earnings – Midland Basin 20 Focus Areas – S. Curtis Ranch & Dora Roberts Average lateral length ~6,000 feet. Piloting increased lateral lengths up to 10,000 feet. SCR 2318H 24 hour IP: 1,166 boepd 30 day average: 576 boepd 18 Horizontal Wells on Production, 12 drilled this year. ~750 boepd IP average ~500 boepd 30 day average ~91% liquids DRRU 2717H 24 hour IP: 899 boepd 30 day average: 693 boepd SCR – 10,777 acres Mabee – 9,060 acres DRRU – 18,920 acres NM TX |
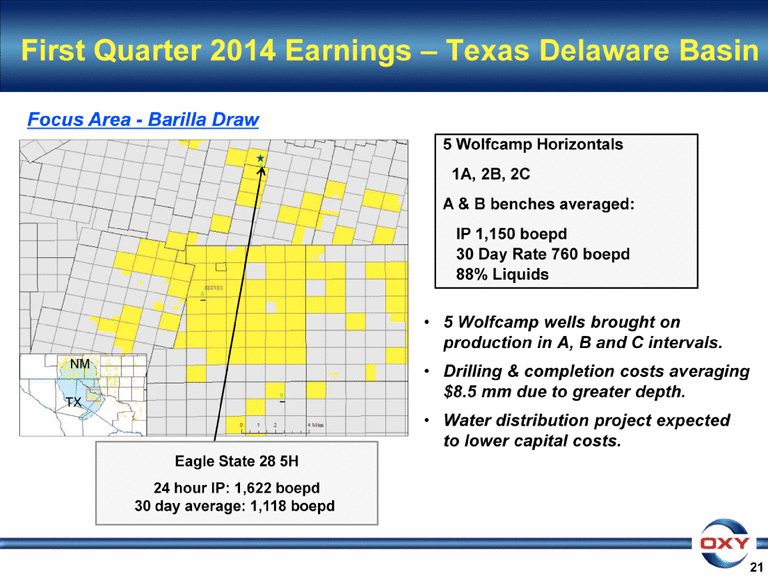
First Quarter 2014 Earnings – Texas Delaware Basin 21 Focus Area - Barilla Draw 5 Wolfcamp wells brought on production in A, B and C intervals. Drilling & completion costs averaging $8.5 mm due to greater depth. Water distribution project expected to lower capital costs. 5 Wolfcamp Horizontals 1A, 2B, 2C A & B benches averaged: IP 1,150 boepd 30 Day Rate 760 boepd 88% Liquids NM TX Eagle State 28 5H 24 hour IP: 1,622 boepd 30 day average: 1,118 boepd |
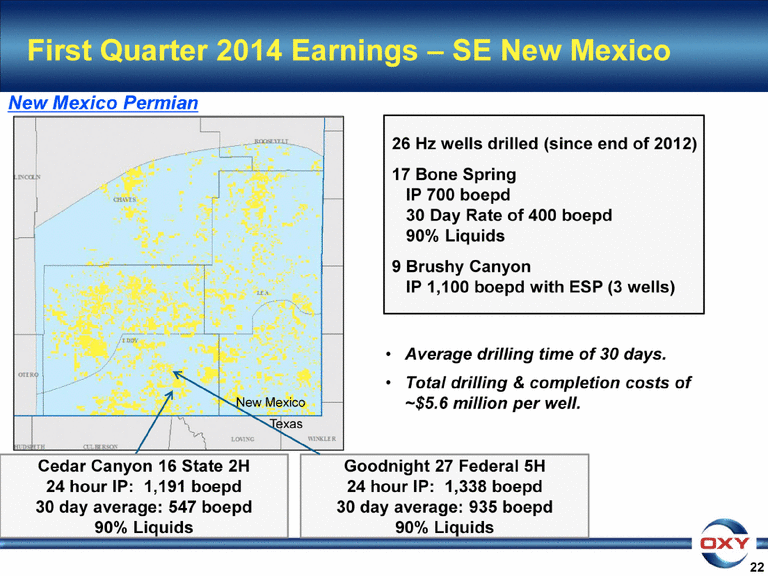
First Quarter 2014 Earnings – SE New Mexico 22 New Mexico Permian 26 Hz wells drilled (since end of 2012) 17 Bone Spring IP 700 boepd 30 Day Rate of 400 boepd 90% Liquids 9 Brushy Canyon IP 1,100 boepd with ESP (3 wells) Average drilling time of 30 days. Total drilling & completion costs of ~$5.6 million per well. New Mexico Texas Cedar Canyon 16 State 2H 24 hour IP: 1,191 boepd 30 day average: 547 boepd 90% Liquids Goodnight 27 Federal 5H 24 hour IP: 1,338 boepd 30 day average: 935 boepd 90% Liquids |
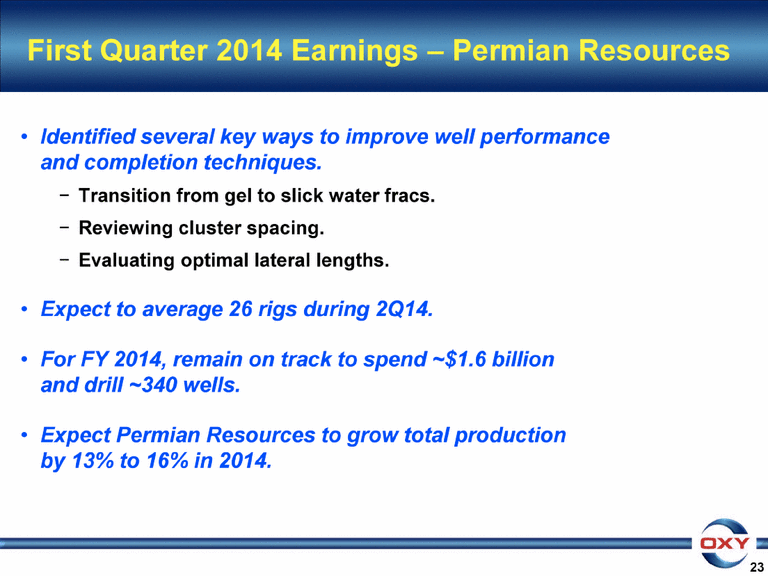
First Quarter 2014 Earnings – Permian Resources 23 Identified several key ways to improve well performance and completion techniques. Transition from gel to slick water fracs. Reviewing cluster spacing. Evaluating optimal lateral lengths. Expect to average 26 rigs during 2Q14. For FY 2014, remain on track to spend ~$1.6 billion and drill ~340 wells. Expect Permian Resources to grow total production by 13% to 16% in 2014. |
First Quarter 2014 Earnings Conference Call Q&A |