UNITED STATES
SECURITIES AND EXCHANGE COMMISSION
WASHINGTON, D. C. 20549
FORM N-CSR
Investment Company Act file number | 811-04760 |
DWS Advisor Funds
(Exact Name of Registrant as Specified in Charter)
One South Street
Baltimore, MD 21202
(Address of principal executive offices) (Zip code)
Registrant’s Telephone Number, including Area Code: (212) 454-7190
Paul Schubert
345 Park Avenue
New York, NY 10154
(Name and Address of Agent for Service)
Date of fiscal year end: | 10/31 |
Date of reporting period: | 10/31/06 |
ITEM 1. REPORT TO STOCKHOLDERS
OCTOBER 31, 2006
Annual Report
to Shareholders
OCTOBER 31, 2006
Annual Report
to Shareholders
 |
Contents
Click Here Performance Summary
Click Here Information About Your Fund's Expenses
Click Here Portfolio Management Review
Click Here Portfolio Summary
Click Here Investment Portfolio
Click Here Financial Statements
Click Here Financial Highlights
Click Here Notes to Financial Statements
Click Here Report of Independent Registered Public Accounting Firm
Click Here Tax Information
Click Here Other Information
Click Here Investment Management Agreement Approval
Click Here Trustees and Officers
Click Here Account Management Resources
This report must be preceded or accompanied by a prospectus. To obtain a prospectus for any of our funds, refer to the Account Management Resources information provided in the back of this booklet. We advise you to consider the fund's objectives, risks, charges and expenses carefully before investing. The prospectus contains this and other important information about the fund. Please read the prospectus carefully before you invest.
Investments in mutual funds involve risk. Some funds have more risk than others. The fund invests in individual bonds whose yields and market values fluctuate so that your investment may be worth more or less than its original cost. Bond investments are subject to interest-rate risk such that when interest rates rise, the prices of the bonds, and thus the value of the bond fund, may decline and the investor may lose principal value. Investors in the fund should be able to withstand fluctuations in the fixed income markets. The yield and value of the fund changes every day and can be affected by changes in interest rates, general market conditions and other political, social and economic developments, as well as specific matters relating to the companies in whose securities a fund invests. Additionally, investing in foreign securities presents certain unique risks not associated with domestic investments, such as currency fluctuation, political and economic changes, and market risks. Derivatives could produce disproportionate losses due to a variety of factors, including the unwillingness or inability of the counterparty to meet its obligations or unexpected price or interest-rate movements. All of these factors may result in greater share price volatility. Please read the fund's prospectus for specific details regarding its investments and risk profile.
DWS Scudder is part of Deutsche Asset Management, which is the marketing name in the US for the asset management activities of Deutsche Bank AG, Deutsche Bank Trust Company Americas, Deutsche Asset Management, Inc., Deutsche Investment Management Americas Inc. and DWS Trust Company.
NOT FDIC/NCUA INSURED NO BANK GUARANTEE MAY LOSE VALUE NOT A DEPOSIT NOT INSURED BY ANY FEDERAL GOVERNMENT AGENCY
Performance Summary October 31, 2006
Classes A, B, C, R and Institutional
All performance shown is historical, assumes reinvestment of all dividend and capital gain distributions and does not guarantee future results. Investment return and principal value fluctuate with changing market conditions so that, when redeemed, shares may be worth more or less than their original cost. Current performance may be lower or higher than the performance quoted. Please visit www.dws-scudder.com for the Fund's most recent month-end performance.
The maximum sales charge for Class A shares is 4.5%. For Class B shares, the maximum contingent deferred sales charge (CDSC) is 4% within the first year after purchase, declining to 0% after six years. Class C shares have no adjustment for front-end sales charges but redemptions within one year of purchase may be subject to a CDSC of 1%. Unadjusted returns do not reflect sales charges and would have been lower if they had. Class R and Institutional Class are not subject to sales charges.
To discourage short-term trading, the Fund imposes a 2% redemption fee on shareholders redeeming shares held less than 15 days, which has the effect of lowering total return.
Returns and rankings during all periods shown for Class A, B, C, R and Institutional Class shares reflect a fee waiver and/or expense reimbursement. Without this waiver/reimbursement, returns and rankings would have been lower.
Performance figures do not reflect the deduction of taxes that a shareholder would pay on fund distributions or the redemption of fund shares. Returns and rankings may differ by share class.
On July 10, 2006, the fund was reorganized from DWS Core Fixed Income Fund, a series of DWS Investments Trust (the "Predecessor Fund"), into DWS Core Fixed Income Fund, a newly created series of the DWS Advisor Funds. This change in the legal entity had no economic impact relative to accounting or tax. Performance shown prior to July 10, 2006 is derived from the historical performance of the Predecessor Fund.
Returns shown for Class A, B and C shares for the periods prior to their inception on June 28, 2002 and for Class R shares for the periods prior to its inception on October 1, 2003 are derived from the historical performance of Institutional Class shares of the DWS Core Fixed Income Fund during such periods and have been adjusted to reflect the higher gross total annual operating expenses of each specific class. Any difference in expenses will affect performance.
Average Annual Total Returns (Unadjusted for Sales Charge) as of 10/31/06 | ||||
DWS Core Fixed Income Fund | 1-Year | 3-Year | 5-Year | 10-Year |
Class A | 4.72% | 4.04% | 4.35% | 6.12% |
Class B | 3.94% | 3.25% | 3.57% | 5.32% |
Class C | 3.94% | 3.26% | 3.57% | 5.32% |
Class R | 4.56% | 3.84% | 4.12% | 5.86% |
Institutional Class | 4.98% | 4.29% | 4.61% | 6.39% |
Lehman Brothers Aggregate Bond Index+ | 5.19% | 3.93% | 4.51% | 6.26% |
Sources: Lipper Inc. and Deutsche Asset Management, Inc.
Net Asset Value and Distribution Information | |||||
| Class A | Class B | Class C | Class R | Institutional Class |
Net Asset Value: 10/31/06 | $ 10.72 | $ 10.71 | $ 10.72 | $ 10.77 | $ 10.72 |
10/31/05 | $ 10.73 | $ 10.72 | $ 10.73 | $ 10.77 | $ 10.73 |
Distribution Information: Twelve Months: Income Dividends as of 10/31/06 | $ .48 | $ .40 | $ .40. | $ .45 | $ .50 |
Capital Gains Distributions as of 10/31/06 | $ .02 | $ .02 | $ .02 | $ .02 | $ .02 |
October Income Dividend | $ .0419 | $ .0350 | $ .0350 | $ .0398 | $ .0441 |
SEC 30-day Yield++ as of 10/31/06 | 4.43% | 3.89% | 3.89% | 4.38% | 4.89% |
Current Annualized Distribution Rate++ as of 10/31/06 | 4.60% | 3.85% | 3.84% | 4.35% | 4.84% |
++ The SEC yield is net investment income per share earned over the month ended October 31, 2006, shown as an annualized percentage of the maximum offering price per share on the last day of the period. The SEC yield is computed in accordance with a standardized method prescribed by the Securities and Exchange Commission. The SEC yields would have been 4.15%, 3.64%, 3.70%, 4.28% and 4.82% for Class A, B, C, R and Institutional Class, respectively, had certain expenses not been reduced. Current annualized distribution rate is the latest monthly dividend shown as an annualized percentage of net asset value on October 31, 2006. Distribution rate simply measures the level of dividends and is not a complete measure of performance. The current annualized distribution rates would have been 4.32%, 3.60%, 3.65%, 4.25% and 4.77% for Class A, B, C, R and Institutional Class, respectively, had certain expenses not been reduced. Yields and distribution rates are historical, not guaranteed and will fluctuate.
Institutional Class Lipper Rankings — Intermediate Investment Grade Debt Funds Category as of 10/31/06 | ||||
Period | Rank |
| Number of Funds Tracked | Percentile Ranking (%) |
1-Year | 125 | of | 485 | 26 |
3-Year | 51 | of | 422 | 12 |
5-Year | 72 | of | 344 | 21 |
10-Year | 16 | of | 149 | 11 |
Source: Lipper Inc. Rankings are historical and do not guarantee future results. Rankings are based on total return with distributions reinvested. Rankings are for Institutional Class shares; other share classes may vary.
Growth of an Assumed $10,000 Investment (Adjusted for Maximum Sales Charge) |
[] DWS Core Fixed Income Fund — Class A [] Lehman Brothers Aggregate Bond Index+ |
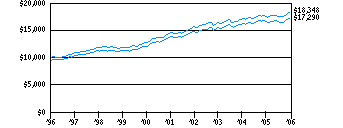 |
Yearly periods ended October 31 |
The Fund's growth of an assumed $10,000 investment is adjusted for the maximum sales charge of 4.50%. This results in a net initial investment of $9,550.
Comparative Results (Adjusted for Maximum Sales Charge) as of 10/31/06 | |||||
DWS Core Fixed Income Fund | 1-Year | 3-Year | 5-Year | 10-Year | |
Class A | Growth of $10,000 | $10,001 | $10,754 | $11,816 | $17,290 |
Average annual total return | .01% | 2.45% | 3.39% | 5.63% | |
Class B | Growth of $10,000 | $10,094 | $10,813 | $11,819 | $16,793 |
Average annual total return | .94% | 2.64% | 3.40% | 5.32% | |
Class C | Growth of $10,000 | $10,394 | $11,012 | $11,919 | $16,799 |
Average annual total return | 3.94% | 3.26% | 3.57% | 5.32% | |
Class R | Growth of $10,000 | $10,456 | $11,198 | $12,237 | $17,666 |
Average annual total return | 4.56% | 3.84% | 4.12% | 5.86% | |
Lehman Brothers Aggregate Bond Index+ | Growth of $10,000 | $10,519 | $11,227 | $12,470 | $18,348 |
Average annual total return | 5.19% | 3.93% | 4.51% | 6.26% | |
The growth of $10,000 is cumulative.
+ Lehman Brothers Aggregate Bond Index is an unmanaged index representing domestic taxable investment grade bonds, with index components for government and corporate securities, mortgage pass-through securities, and asset-backed securities with average maturities of one year or more. Index returns assume reinvestment of dividends and, unlike fund returns, do not reflect any fees or expenses. It is not possible to invest directly into an index.
Growth of an Assumed $1,000,000 Investment |
[] DWS Core Fixed Income Fund — Institutional Class [] Lehman Brothers Aggregate Bond Index+ |
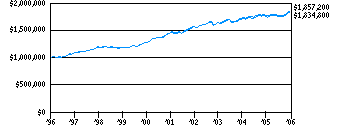 |
Yearly periods ended October 31 |
Comparative Results as of 10/31/06 | |||||
DWS Core Fixed Income Fund | 1-Year | 3-Year | 5-Year | 10-Year | |
Institutional Class | Growth of $1,000,000 | $1,049,800 | $1,134,300 | $1,252,800 | $1,857,200 |
Average annual total return | 4.98% | 4.29% | 4.61% | 6.39% | |
Lehman Brothers Aggregate Bond Index+ | Growth of $1,000,000 | $1,051,900 | $1,122,700 | $1,247,000 | $1,834,800 |
Average annual total return | 5.19% | 3.93% | 4.51% | 6.26% | |
The growth of $1,000,000 is cumulative.
The minimum initial investment for Institutional Class shares is $1,000,000.
+ Lehman Brothers Aggregate Bond Index is an unmanaged index representing domestic taxable investment grade bonds, with index components for government and corporate securities, mortgage pass-through securities, and asset-backed securities with average maturities of one year or more. Index returns assume reinvestment of dividends and, unlike fund returns, do not reflect any fees or expenses. It is not possible to invest directly into an index.
Class S
Class S shares are no longer available to new investors except under certain circumstances. (Please refer to the Fund's Statement of Additional Information.)
All performance shown is historical, assumes reinvestment of all dividend and capital gain distributions and does not guarantee future results. Investment return and principal value fluctuate with changing market conditions so that, when redeemed, shares may be worth more or less than their original cost. Current performance may be lower or higher than the performance quoted. Please visit www.dws-scudder.com the Fund's most recent month-end performance.
To discourage short-term trading, the Fund imposes a 2% redemption fee on shareholders redeeming shares held less than 15 days, which has the effect of lowering total return.
Returns and rankings during all periods shown reflect a fee waiver and/or expense reimbursement. Without this waiver/reimbursement, returns and rankings would have been lower.
Performance figures do not reflect the deduction of taxes that a shareholder would pay on fund distributions or the redemptions of fund shares. Returns and rankings may differ by share class.
On July 10, 2006, the fund was reorganized from DWS Core Fixed Income Fund, a series of DWS Investments Trust (the "Predecessor Fund"), into DWS Core Fixed Income Fund, a newly created series of the DWS Advisor Funds. This change in the legal entity had no economic impact relative to accounting or tax. Performance shown prior to July 10, 2006 is derived from the historical performance of the Predecessor Fund.
Returns shown for Class S shares for the periods prior to its inception on February 1, 2005 are derived from the historical performance of Institutional Class shares of the DWS Core Fixed Income Fund during such periods and have been adjusted to reflect the higher gross total annual operating expenses of Class S. Any difference in expenses will affect performance.
Average Annual Total Returns as of 10/31/06 | ||||
DWS Core Fixed Income Fund | 1-Year | 3-Year | 5-Year | 10-Year |
Class S | 4.73% | 4.08% | 4.40% | 6.18% |
Lehman Brothers Aggregate Bond Index+ | 5.19% | 3.93% | 4.51% | 6.26% |
Sources: Lipper Inc. and Deutsche Asset Management, Inc.
Net Asset Value and Distribution Information | |
| Class S |
Net Asset Value: 10/31/06 | $ 10.71 |
10/31/05 | $ 10.73 |
Distribution Information: Twelve Months: Income Dividends as of 10/31/06 | $ .49 |
Capital Gains distributions as of 10/31/06 | $ .02 |
October Income Dividend | $ .0442 |
SEC 30-day Yield++ as of 10/31/06 | 4.71% |
Current Annualized Distribution Rate++ as of 10/31/06 | 4.86% |
++ The SEC yield is net investment income per share earned over the month ended October 31, 2006, shown as an annualized percentage of the maximum offering price per share on the last day of the period. The SEC yield is computed in accordance with a standardized method prescribed by the Securities and Exchange Commission. The SEC yield would have been 4.53% for Class S had certain expenses not been reduced. Current annualized distribution rate is the latest monthly dividend shown as an annualized percentage of net asset value on October 31, 2006. Distribution rate simply measures the level of dividends and is not a complete measure of performance. The current annualized distribution rate would have been 4.68% had certain expenses not been reduced. Yields and distribution rates are historical, not guaranteed and will fluctuate.
Class S Lipper Rankings — Intermediate Investment Grade Debt Funds Category as of 10/31/06 | ||||
Period | Rank |
| Number of Funds Tracked | Percentile Ranking (%) |
1-Year | 212 | of | 485 | 44 |
Source: Lipper Inc. Rankings are historical and do not guarantee future results. Rankings are based on total return with distributions reinvested. Rankings are for Class S shares; other share classes may vary.
Growth of an Assumed $10,000 Investment |
[] DWS Core Fixed Income Fund — Class S [] Lehman Brothers Aggregate Bond Index+ |
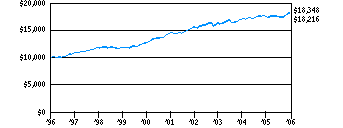 |
Yearly periods ended October 31 |
Comparative Results as of 10/31/06 | |||||
DWS Core Fixed Income Fund | 1-Year | 3-Year | 5-Year | 10-Year | |
Class S | Growth of $10,000 | $10,473 | $11,274 | $12,405 | $18,216 |
Average annual total return | 4.73% | 4.08% | 4.40% | 6.18% | |
Lehman Brothers Aggregate Bond Index+ | Growth of $10,000 | $10,519 | $11,227 | $12,470 | $18,348 |
Average annual total return | 5.19% | 3.93% | 4.51% | 6.26% | |
The growth of $10,000 is cumulative.
+ Lehman Brothers Aggregate Bond Index is an unmanaged index representing domestic taxable investment grade bonds, with index components for government and corporate securities, mortgage pass-through securities, and asset-backed securities with average maturities of one year or more. Index returns assume reinvestment of dividends and, unlike fund returns, do not reflect any fees or expenses. It is not possible to invest directly into an index.
Information About Your Fund's Expenses
As an investor of the Fund, you incur two types of costs: ongoing expenses and transaction costs. Ongoing expenses include management fees, distribution and service (12b-1) fees and other Fund expenses. Examples of transaction costs include sales charges (loads), redemption fees and account maintenance fees, which are not shown in this section. The following tables are intended to help you understand your ongoing expenses (in dollars) of investing in the Fund and to help you compare these expenses with the ongoing expenses of investing in other mutual funds. In the most recent six-month period, Class A, B, C, R, S and Institutional Class of the Fund limited these expenses; had they not done so, expenses would have been higher. The example in the table is based on an investment of $1,000 invested at the beginning of the six-month period and held for the entire period (May 1, 2006 to October 31, 2006).
The tables illustrate your Fund's expenses in two ways:
Actual Fund Return. This helps you estimate the actual dollar amount of ongoing expenses (but not transaction costs) paid on a $1,000 investment in the Fund using the Fund's actual return during the period. To estimate the expenses you paid over the period, simply divide your account value by $1,000 (for example, an $8,600 account value divided by $1,000 = 8.6), then multiply the result by the number in the "Expenses Paid per $1,000" line under the share class you hold.
Hypothetical 5% Fund Return. This helps you to compare your Fund's ongoing expenses (but not transaction costs) with those of other mutual funds using the Fund's actual expense ratio and a hypothetical rate of return of 5% per year before expenses. Examples using a 5% hypothetical fund return may be found in the shareholder reports of other mutual funds. The hypothetical account values and expenses may not be used to estimate the actual ending account balance or expenses you paid for the period.
Please note that the expenses shown in these tables are meant to highlight your ongoing expenses only and do not reflect any transaction costs. The "Expenses Paid per $1,000" line of the tables is useful in comparing ongoing expenses only and will not help you determine the relative total expense of owning different funds. If these transaction costs had been included, your costs would have been higher.
Expenses and Value of a $1,000 Investment for the six months ended October 31, 2006 | ||||||
Actual Fund Return | Class A | Class B | Class C | Class R | Class S | Institutional Class |
Beginning Account Value 5/1/06 | $ 1,000.00 | $ 1,000.00 | $ 1,000.00 | $ 1,000.00 | $ 1,000.00 | $ 1,000.00 |
Ending Account Value 10/31/06 | $ 1,044.90 | $ 1,040.90 | $ 1,040.90 | $ 1,043.50 | $ 1,044.60 | $ 1,046.20 |
Expenses Paid per $1,000* | $ 4.17 | $ 7.92 | $ 7.97 | $ 5.46 | $ 3.61 | $ 2.84 |
Hypothetical 5% Fund Return | Class A | Class B | Class C | Class R | Class S | Institutional Class |
Beginning Account Value 5/1/06 | $ 1,000.00 | $ 1,000.00 | $ 1,000.00 | $ 1,000.00 | $ 1,000.00 | $ 1,000.00 |
Ending Account Value 10/31/06 | $ 1,021.12 | $ 1,017.44 | $ 1,017.39 | $ 1,019.86 | $ 1,021.68 | $ 1,022.43 |
Expenses Paid per $1,000* | $ 4.13 | $ 7.83 | $ 7.88 | $ 5.40 | $ 3.57 | $ 2.80 |
* Expenses are equal to the Fund's annualized expense ratio for each share class, multiplied by the average account value over the period, multiplied by the number of days in the most recent six-month period, then divided by 365.
Annualized Expense Ratios | Class A | Class B | Class C | Class R | Class S | Institutional Class |
DWS Core Fixed Income Fund | .81% | 1.54% | 1.55% | 1.06% | .70% | .55% |
For more information, please refer to the Fund's prospectus.
DWS Core Fixed Income Fund: A Team Approach to Investing
Deutsche Asset Management, Inc. ("DeAM, Inc." or the "Advisor"), which is part of Deutsche Asset Management, is the investment advisor for DWS Core Fixed Income Fund. DeAM, Inc. provides a full range of investment advisory services to institutional and retail clients. DeAM, Inc. is also responsible for selecting brokers and dealers and for negotiating brokerage commissions and dealer charges.
Deutsche Asset Management is a global asset management organization that offers a wide range of investing expertise and resources. This well-resourced global investment platform brings together a wide variety of experience and investment insight across industries, regions, asset classes and investing styles.
DeAM, Inc. is an indirect, wholly owned subsidiary of Deutsche Bank AG. Deutsche Bank AG is a major global banking institution that is engaged in a wide range of financial services, including investment management, mutual funds, retail, private and commercial banking, investment banking and insurance.
Aberdeen Asset Management Inc. ("AAMI"), a US registered investment advisor, is the subadvisor for the fund. AAMI provides a full range of international investment advisory services to institutional and retail clients.
AAMI is a direct, wholly owned subsidiary of Aberdeen Asset Management PLC, the parent company of an asset management group formed in 1983.
The fund's subadvisor is AAMI. The following members of the management team handle the day-to-day operations of the fund.
Portfolio Management Team
Gary W. Bartlett, CFA
CIO for Active Fixed Income and senior portfolio manager specializing in taxable municipal, utility and government fixed income investments: Philadelphia.
Joined Aberdeen Asset Management Inc. in 2005.
Formerly, Managing Director of Deutsche Asset Management; joined Deutsche Asset Management in 1992 after nine years of experience as an analyst and fixed income portfolio manager at PNC Financial and credit analyst at First Pennsylvania Bank.
BA from Bucknell University; MBA from Drexel University.
Warren S. Davis, III
Senior portfolio manager for mortgage- and asset-backed fixed income investments: Philadelphia.
Joined Aberdeen Asset Management Inc. in 2005.
Formerly, Managing Director of Deutsche Asset Management; joined Deutsche Asset Management in 1995 after nine years of experience as a trader, analyst and developer of analytical and risk management systems for PaineWebber and Merrill Lynch.
BS from Pennsylvania State University; MBA from Drexel University.
Thomas J. Flaherty
Senior portfolio manager for corporate and taxable municipal fixed income investments: Philadelphia.
Joined Aberdeen Asset Management Inc. in 2005.
Formerly, Managing Director of Deutsche Asset Management; joined Deutsche Asset Management in 1995 after 10 years of fixed income experience, including vice president for US taxable fixed income securities at Prudential Securities.
BA from SUNY Stony Brook.
J. Christopher Gagnier
Head of Core Plus Fixed Income product and senior portfolio manager for corporate and commercial mortgages: Philadelphia.
Joined Aberdeen Asset Management Inc. in 2005.
Formerly, Managing Director of Deutsche Asset Management; joined Deutsche Asset Management in 1997 after 17 years of experience in fixed income investments at Paine Webber and Continental Bank.
BS from Wharton School of Business; MBA from University of Chicago.
Daniel R. Taylor, CFA
Senior portfolio manager for asset-backed and commercial mortgage fixed income investments: Philadelphia.
Joined Aberdeen Asset Management Inc. in 2005.
Formerly, Managing Director of Deutsche Asset Management; joined Deutsche Asset Management in 1998 after six years of experience as fixed income portfolio manager and senior credit analyst for CoreStates Investment Advisors.
BS from Villanova University.
Timothy C. Vile, CFA
Senior portfolio manager for Core Fixed Income and Global Aggregate Fixed Income: Philadelphia.
Joined Aberdeen Asset Management Inc. in 2005.
Formerly, Managing Director of Deutsche Asset Management; joined Deutsche Asset Management in 1991 as member of Core Fixed Income; seconded to the London office from January 1999 to June 2002 to design and develop the firm's European Credit and Global Aggregate capabilities; before joining Deutsche Asset Management, he had six years of experience that included portfolio manager for fixed income portfolios at Equitable Capital Management.
BS from Susquehanna University.
William T. Lissenden
Portfolio manager for Core Fixed Income: Philadelphia.
Joined Aberdeen Asset Management Inc. in 2005.
Formerly, Director of Deutsche Asset Management; joined Deutsche Asset Management in 2002 after 31 years of experience, including fixed income strategist and director of research at Conseco Capital Management, director of fixed income research and product management at Prudential Securities and national sales manager for fixed income securities at Prudential Securities.
BS from St. Peter's College; MBA from Baruch College.
In the following interview, Gary Bartlett, senior portfolio manager for DWS Core Fixed Income Fund, discusses the recent market environment and strategy in managing the fund during its most recent annual period ended October 31, 2006.
Q: How did the bond market perform?
A: The 12-month period ending October 31, 2006 was one of marked change for the bond market. First, the headline event was the changing of the guard at the US Federal Reserve Board (the Fed) as Alan Greenspan stepped down in January and was succeeded as chairman by Ben Bernanke. Second, although not causally linked, the Fed's monetary policy also changed during the period. After 17 consecutive rate hikes beginning in mid-2004, the Fed paused in mid-2006, signaling the end of the tightening regimen. Third, the shape of the Treasury yield curve also altered dramatically over the last 12 months.1 After beginning the period in a flattening trend, the curve ended the period inverted. The yield on the benchmark 10-year Treasury, despite moving within a wide band of 92 basis points during the year, ended the period only 5 basis points higher at 4.60%. The yield on the two-year Treasury closed at 4.70%, up 32 basis points over the period. All in the context of a Fed target rate that, notwithstanding the cessation of tightening, still climbed 1.50% during the early part of the period and remains fixed at 5.25%.
1 The yield curve is a graph with a left-to-right line that shows how high or low yields are, from the shortest to the longest maturities. Typically (and when the yield curve is characterized as "steep," this is especially true) the line rises from left to right as investors who are willing to tie up their money for a longer period are rewarded with higher yields.
For the period, the Lehman Brothers Aggregate Bond Index returned 5.19%, much coming in these last few months as Treasuries have rallied and the market repriced the future outlook.2 The treasury index posted a return of 4.44% for the 12 months. Generally tighter spreads, albeit slightly, fueled all spread sectors to positive excess returns for the period.3 Mortgages, both commercial and residential, led the way on the strength of lower implied volatility and favorable relative value versus competing sectors.
2 The Lehman Brothers Aggregate Bond Index is an unmanaged index representing domestic taxable investment-grade bonds, with index components for government and corporate securities, mortgage pass-through securities and asset-backed securities with average maturities of one year or more. Index returns assume reinvestment of all distributions and, unlike fund returns, do not reflect any fees or expenses. It is not possible to invest directly into an index.
3 Spread sectors are non-Treasury bond sectors of the fixed-income market.
Q: How did the fund perform?
A: DWS Core Fixed Income Fund Class A shares returned 4.72%. (Returns are unadjusted for sales charges. If sales charges had been included, returns would have been lower. Past performance is no guarantee of future results. Please see pages 4 through 10 for the performance of other share classes and more complete performance information.) This compares with 4.62% for the average fund in the Lipper Intermediate Investment Grade Debt Funds category and 5.19% for the Lehman Brothers Aggregate Bond Index, the fund's benchmark.4
4 The Lipper Intermediate Investment Grade Debt Funds category consists of funds that invest at least 65% of assets in investment-grade debt issues (rated in the top four grades) with dollar-weighted average maturities of five to 10 years. Lipper figures represent the average of the total returns reported by all of the mutual funds designated by Lipper Inc. as falling into this category. It is not possible to invest directly in a Lipper category.
Q: What factors contributed to and detracted from the fund's performance?
A: Our credit positioning, at close-to-index weight in both raw percentage and duration terms, reflects our heightened risk profile, particularly in the context of broadly fair to full market valuations. An area of particular emphasis within our corporate positioning, as well as within the corporate bond market headlines recently, is the broadly defined Hybrid Capital Securities market. This market underperformed early in the year when the regulatory treatment of the securities came under review, causing consternation in the buyer base, and thus widening of their spreads. In recent months, these securities have regained that lost performance, and then some, after it appeared that market participants' and regulators' views of the securities seemed to converge toward our own view of their creditworthiness and structural integrity. In other corporate subsectors, holdings in insurance, which benefited from a benign hurricane season; banks, which reported steady profits; and media cable all aided performance, while holdings in gaming detracted.
Our mortgage positioning remains firmly off-benchmark and purposefully positioned in what we view as the cheapest cash flows in the US mortgage market. A combination of last-cash-flow hybrid adjustable rate mortgages (ARMs) and 10-year PAC bonds (planned amortization class bonds) make up the majority of our mortgage weighting, while the indices consist entirely of agency pass-throughs. Index pass-through mortgages have performed well in the context of excess foreign demand and ever-lower volatility. We have continued to sell into this strength, reflecting our view of the technical overvaluation of pass-throughs, largely as a result of the bid from foreign banks, heavily weighted with US dollars to invest from their trade surplus with the United States. Furthermore, the historically low level of volatility has made mortgage valuations in widely used option-adjusted spread (OAS) valuation models more attractive. These benign volatility levels are unlikely to persist for an extended period and we believe more rational pass-through valuations will result when the normalization ensues. Concomitant with that, valuations of the structured mortgages (PACs) we presently hold should benefit nicely and aid future performance. While hybrid ARMs have detracted from our relative performance during the most recent quarter, they've been a positive contributor relative to the index for the period, and remain a relatively attractive investment in the intermediate part of the curve.
Our positioning in the asset-backed sector again reflects our views on market valuation relative to fundamentals. With valuations particularly full, we remain relatively conservatively positioned largely in one-year and under asset-backed securities, mostly in the home equity loan sector of the asset-backed securities (ABS) market. This strategy has benefited the fund as housing-related ABS have been the top-performing subsectors, delivering excess returns in line with mortgage-backed securities for the period.
We continue to find attractive relative valuation in the commercial mortgage market (CMBS), particularly in the highest quality AAA part of the capital structure, and remain overweight the sector. Commercial property cash flows, and thus, credit fundamentals of CMBS bonds, are improving. CMBS led all spread sectors in excess returns for the period and our overweight was a positive contributor to performance.5
5 "Overweight" means the fund holds a higher weighting in a given sector or security than the benchmark. "Underweight" means the fund holds a lower weighting.
The views expressed in this report reflect those of the portfolio manager only through the end of the period of the report as stated on the cover. The manager's views are subject to change at any time based on market and other conditions and should not be construed as a recommendation. Past performance is no guarantee of future results.
Asset Allocation | 10/31/06 | 10/31/05 |
|
|
|
Commercial and Non-Agency Mortgage-Backed Securities | 29% | 22% |
Corporate Bonds | 13% | 16% |
Collateralized Mortgage Obligations | 12% | 20% |
US Government Agency Sponsored Pass-Throughs | 12% | 7% |
US Treasury Obligations | 11% | 13% |
Asset Backed | 9% | 6% |
Foreign Bonds — US$ Denominated | 5% | 8% |
Municipal Bonds and Notes | 5% | 4% |
Preferred Stocks | 2% | — |
Cash Equivalents | 2% | 3% |
Government National Mortgage Association | — | 1% |
| 100% | 100% |
Corporate and Foreign Bonds Diversification (Excludes Cash Equivalents) | 10/31/06 | 10/31/05 |
|
|
|
Financials | 44% | 47% |
Utilities | 20% | 12% |
Consumer Discretionary | 15% | 12% |
Energy | 10% | 6% |
Telecommunication Services | 5% | 5% |
Materials | 3% | 4% |
Industrials | 2% | 12% |
Information Technology | 1% | — |
Health Care | — | 2% |
| 100% | 100% |
Quality | 10/31/06 | 10/31/05 |
|
|
|
US Government and Agencies | 35% | 41% |
AAA* | 45% | 32% |
AA | 2% | 4% |
A | 5% | 9% |
BBB | 12% | 14% |
BB | 1% | — |
| 100% | 100% |
* Includes cash equivalents
Asset allocation, corporate and foreign bonds diversification and quality are subject to change.
The quality ratings represent the lower of Moody's Investors Services, Inc. ("Moody's") or Standard & Poor's Corporation ("S&P") credit ratings. The ratings of Moody's and S&P represent their opinions as to the quality of the securities they rate. Ratings are relative and subjective and are not absolute standards of quality. The Fund's credit quality does not remove market risk.
Effective Maturity | 10/31/06 | 10/31/05 |
|
|
|
Under 1 year | 10% | 9% |
1-4.99 years | 35% | 39% |
5-9.99 years | 39% | 37% |
10-14.99 years | 5% | 6% |
15 years or greater | 11% | 9% |
| 100% | 100% |
Weighted average effective maturity: 5.6 years and 6.75 years, respectively.
Effective maturity is subject to change.
For more complete details about the Fund's investment portfolio, see page 20. A quarterly Fact Sheet is available upon request. Information concerning portfolio holdings of the Fund as of month end will be posted to www.dws-scudder.com on or after the last day of the following month. Please see the Account Management Resources section for contact information.
Following the Fund's fiscal first and third quarter-end, a complete portfolio holdings listing is filed with the SEC on Form N-Q. The form will be available on the SEC's Web site at www.sec.gov, and it also may be reviewed and copied at the SEC's Public Reference Room in Washington, D.C. Information on the operation of the SEC's Public Reference Room may be obtained by calling (800) SEC-0330.
Investment Portfolio as of October 31, 2006
| Principal Amount ($) | Value ($) |
|
| |
Corporate Bonds 13.1% | ||
Consumer Discretionary 2.7% | ||
Comcast Cable Communications Holdings, Inc., 9.455%, 11/15/2022 | 699,000 | 912,788 |
Comcast MO of Delaware, Inc., 9.0%, 9/1/2008 | 5,597,000 | 5,948,324 |
DaimlerChrysler NA Holding Corp., Series E, 6.019%*, 10/31/2008 | 6,373,000 | 6,393,215 |
Harrah's Operating Co., Inc., 5.625%, 6/1/2015 | 2,220,000 | 1,871,384 |
TCI Communications, Inc., 8.75%, 8/1/2015 | 2,490,000 | 2,949,345 |
Tele-Communications, Inc., 10.125%, 4/15/2022 | 1,980,000 | 2,644,048 |
Time Warner, Inc., 7.57%, 2/1/2024 | 6,258,000 | 6,876,610 |
Viacom, Inc.: |
|
|
5.75%, 4/30/2011 | 3,095,000 | 3,098,853 |
6.25%, 4/30/2016 | 306,000 | 306,475 |
6.875%, 4/30/2036 | 7,700,000 | 7,753,430 |
| 38,754,472 | |
Energy 1.8% | ||
Anadarko Petroleum Corp., 5.79%*, 9/15/2009 | 6,010,000 | 6,018,666 |
Canadian Natural Resources Ltd., 6.5%, 2/15/2037 | 5,960,000 | 6,119,555 |
Conocophillips Canada, 5.625%, 10/15/2016 | 4,025,000 | 4,081,471 |
Constellation Energy Group, 7.6%, 4/1/2032 | 1,490,000 | 1,772,322 |
Enterprise Products Operating LP: |
|
|
4.95%, 6/1/2010 | 2,015,000 | 1,980,852 |
Series B, 5.0%, 3/1/2015 | 657,000 | 620,958 |
Series B, 6.375%, 2/1/2013 | 114,000 | 117,816 |
7.5%, 2/1/2011 | 3,769,000 | 4,038,676 |
Sempra Energy, 4.621%, 5/17/2007 | 545,000 | 542,763 |
| 25,293,079 | |
Financials 4.2% | ||
Agfirst Farm Credit Bank, 8.393%, 12/15/2016 | 10,707,000 | 11,747,463 |
American General Institutional Capital, 144A, 8.125%, 3/15/2046 | 7,382,000 | 9,574,196 |
BFC Finance Corp., Series 96-A, 7.375%, 12/1/2017 | 6,063,000 | 6,839,792 |
Citizens Property Insurance Corp., Series 1997-A, 144A, 6.85%, 8/25/2007 | 5,400,000 | 5,456,905 |
Erac USA Finance Co., 144A, 5.9%, 11/15/2015 | 3,037,000 | 3,071,470 |
ERP Operating LP, 6.95%, 3/2/2011 | 432,000 | 459,617 |
Farmers Insurance Exchange, 144A, 8.625%, 5/1/2024 | 3,510,000 | 4,212,309 |
Lehman Brothers Holdings, Inc., 5.75%, 1/3/2017 | 2,353,000 | 2,381,321 |
Mangrove Bay Pass-Through Trust 144A, 6.102%, 7/15/2033 | 1,535,000 | 1,485,112 |
Merrill Lynch & Co., Inc., 6.05%, 5/16/2016 | 5,685,000 | 5,903,617 |
Nelnet, Inc., 7.4%, 9/29/2036 | 1,700,000 | 1,715,419 |
NLV Financial Corp., 144A, 6.5%, 3/15/2035 | 985,000 | 928,286 |
PNC Funding Corp., 6.875%, 7/15/2007 | 59,000 | 59,547 |
Reinsurance Group of America, Inc. 6.75% | 3,665,000 | 3,625,931 |
Suntrust Preferred Capital I, 5.853%, 12/15/2011 | 1,679,000 | 1,692,519 |
United Dominion Realty Trust, Inc., Series E, (REIT), 3.9%, 3/15/2010 | 1,370,000 | 1,317,103 |
| 60,470,607 | |
Industrials 0.3% | ||
America West Airlines, Inc., Series 99-1, 7.93%, 1/2/2019 | 1,841,289 | 1,983,990 |
Pulte Homes, Inc.: |
|
|
5.25%, 1/15/2014 | 1,150,000 | 1,103,381 |
6.25%, 2/15/2013 | 1,519,000 | 1,549,082 |
| 4,636,453 | |
Materials 0.2% | ||
Newmont Mining Corp., 5.875%, 4/1/2035 | 2,009,000 | 1,890,933 |
Telecommunication Services 0.2% | ||
Ameritech Capital Funding, 6.25%, 5/18/2009 | 10,000 | 10,150 |
AT&T, Inc., 5.875%, 2/1/2012 | 138,000 | 140,959 |
Embarq Corp., 7.995%, 6/1/2036 | 2,625,000 | 2,791,428 |
| 2,942,537 | |
Utilities 3.7% | ||
Baltimore Gas & Electric Co., 144A, 6.35%, 10/1/2036 | 3,170,000 | 3,291,560 |
CC Funding Trust I, 6.9%, 2/16/2007 | 1,321,000 | 1,326,020 |
Centerior Energy Corp., Series B, 7.13%, 7/1/2007 | 173,000 | 174,960 |
Cleveland Electric Illuminating Co., 7.43%, 11/1/2009 | 7,076,000 | 7,493,887 |
Commonwealth Edison Co., Series 98, 6.15%, 3/15/2012 | 3,710,000 | 3,782,864 |
Consolidated Natural Gas Co., 6.0%, 10/15/2010 | 1,865,000 | 1,903,068 |
Consumers Energy Co.: |
|
|
Series F, 4.0%, 5/15/2010 | 5,983,000 | 5,722,638 |
5.0%, 2/15/2012 | 183,000 | 179,101 |
Dominion Resources, Inc.: |
|
|
Series 06-B, 6.3%, 9/30/2066 | 2,830,000 | 2,833,571 |
7.5%, 6/30/2066 | 6,575,000 | 6,987,989 |
Entergy Louisiana LLC, 6.3%, 9/1/2035 | 1,095,000 | 1,081,532 |
Nevada Power Co., Series N, 6.65%, 4/1/2036 | 2,109,000 | 2,221,730 |
Pedernales Electric Cooperative, Series 2002-A, 144A, 6.202%, 11/15/2032 | 5,694,000 | 6,102,146 |
Sierra Pacific Power Co., Series M, 6.0%, 5/15/2016 | 5,135,000 | 5,191,290 |
TXU Corp., 7.46%, 1/1/2015 | 1,879,881 | 1,941,297 |
Xcel Energy, Inc., 7.0%, 12/1/2010 | 1,849,000 | 1,961,563 |
| 52,195,216 | |
Total Corporate Bonds (Cost $180,571,797) | 186,183,297 | |
| ||
Foreign Bonds — US$ Denominated 5.4% | ||
Financials 3.9% | ||
AES El Salvador Trust, 144A, 6.75%, 2/1/2016 | 3,210,000 | 3,186,095 |
Banco Mercantil del Norte SA, Series A, 144A, 6.135%, 10/13/2016 | 2,520,000 | 2,532,355 |
ChinaTrust Commercial Bank, 144A, 5.625%, 12/29/2049 | 3,843,000 | 3,691,048 |
Corp. Andina de Fomento, 5.75%, 1/12/2017 | 2,535,000 | 2,546,788 |
DBS Capital Funding Corp., Series A, 144A, 7.657%, 3/31/2049 | 1,175,000 | 1,273,339 |
Deutsche Telekom International Finance BV, 5.75%, 3/23/2016 | 4,675,000 | 4,618,704 |
Kaupthing Bank, 144A, 7.125%, 5/19/2016 | 1,775,000 | 1,890,826 |
Mantis Reef Ltd., 144A, 4.692%, 11/14/2008 | 5,915,000 | 5,814,475 |
Mizuho Financial Group, (Cayman), 8.375%, 12/29/2049 | 7,450,000 | 7,888,060 |
Oil Insurance Ltd., 144A, 7.558%, 12/29/2049 | 12,040,000 | 12,524,971 |
Royal Bank of Scotland Group PLC, Series 1, 9.118%, 3/31/2049 | 2,725,000 | 3,034,729 |
Skandinaviska Enskilda Banken AB, 144A, 5.471%, 3/29/2049 | 310,000 | 298,555 |
Sumitomo Mitsui Banking Corp., 144A, 5.625%, 10/15/2015 | 5,905,000 | 5,777,930 |
| 55,077,875 | |
Information Technology 0.1% | ||
Seagate Technology HDD Holdings: |
|
|
6.375%, 10/1/2011 | 615,000 | 607,313 |
6.8%, 10/1/2016 | 920,000 | 908,500 |
| 1,515,813 | |
Materials 0.5% | ||
Celulosa Arauco y Constitucion SA: |
|
|
5.625%, 4/20/2015 | 4,683,000 | 4,595,592 |
7.75%, 9/13/2011 | 85,000 | 92,419 |
Sappi Papier Holding AG, 144A, 6.75%, 6/15/2012 | 2,438,000 | 2,345,685 |
| 7,033,696 | |
Telecommunication Services 0.8% | ||
Telecom Italia Capital: |
|
|
4.95%, 9/30/2014 | 1,850,000 | 1,716,004 |
5.25%, 11/15/2013 | 9,183,000 | 8,783,163 |
| 10,499,167 | |
Utilities 0.1% | ||
Scottish Power PLC, 5.81%, 3/15/2025 | 1,492,000 | 1,472,006 |
Total Foreign Bonds — US$ Denominated (Cost $75,498,019) | 75,598,557 | |
| ||
Asset Backed 9.4% | ||
Automobile Receivables 0.2% | ||
MMCA Automobile Trust: |
|
|
"A4", Series 2002-4, 3.05%, 11/16/2009 | 586,397 | 585,167 |
"C", Series 2002-4, 4.56%, 11/16/2009 | 82,913 | 82,801 |
"B", Series 2002-2, 4.67%, 3/15/2010 | 961,585 | 958,746 |
"B", Series 2002-1, 5.37%, 1/15/2010 | 366 | 366 |
Whole Auto Loan Trust, "B", Series 2004-1, 3.13%, 3/15/2011 | 1,605,592 | 1,582,085 |
| 3,209,165 | |
Home Equity Loans 9.1% | ||
Advanta Mortgage Loan Trust, "A6", Series 2000-2, 7.72%, 3/25/2015 | 56,532 | 56,670 |
Chase Funding Mortgage Loan Asset-Backed Certificates, "2A2", Series 2003-4*, 5.62%, 5/25/2033 | 6,066,093 | 6,080,052 |
Citigroup Mortgage Loan Trust, Inc., "A1", Series 2006-WFH4, 5.37%*, 11/25/2036 | 9,960,000 | 9,960,000 |
Countrywide Asset-Backed Certificates: |
|
|
"AF2", Series 2005-7, 4.367%, 11/25/2035 | 8,581,000 | 8,491,738 |
"A1" Series 2006-S6, 5.434%*, 3/25/2034 | 6,645,224 | 6,645,200 |
"A2", Series 2006-15, 5.683%, 10/25/2046 | 10,345,000 | 10,385,261 |
"A6", Series 2006-15, 5.826%, 10/25/2046 | 10,345,000 | 10,490,086 |
"1AF6", Series 2006-11, 6.15%, 9/25/2046 | 6,555,000 | 6,727,594 |
Credit-Based Asset Servicing and Securitization, "AF1B", Series 2005-CB8, 5.451%, 12/25/2035 | 2,946,485 | 2,932,723 |
First Franklin Mortgage Loan Asset Backed Certificates, "A3", Series 2006-FF15, 5.37%*, 11/25/2036 | 7,010,000 | 7,010,000 |
Household Home Equity Loan Trust, "A1F", Series 2006-3, 5.98%, 3/20/2036 | 10,540,000 | 10,539,663 |
JPMorgan Mortgage Acquisition Corp., "A2", Series 2006-CH1, 5.37%*, 11/25/2028 | 10,575,870 | 10,575,870 |
Merrill Lynch Mortgage Investors Trust, "A1A", Series 2005-NCB, 5.451%, 7/25/2036 | 1,802,510 | 1,794,370 |
Option One Mortgage Loan Trust, "2A1", Series 2006-3, 5.36%*, 2/25/2037 | 10,565,000 | 10,565,000 |
Park Place Securities NIM Trust, "A", Series 2005-WCH1, 144A, 4.0%, 2/25/2035 | 48,875 | 48,803 |
Renaissance Home Equity Loan Trust, "AF3", Series 2005-2, 4.499%, 8/25/2035 | 5,428,000 | 5,350,348 |
Residential Asset Mortgage Products, Inc., "AI7", Series 2003-RS9, 5.06%, 10/25/2033 | 7,035,000 | 6,940,113 |
Residential Asset Securities Corp., "AI1", Series 2006-KS3, 5.39%*, 4/25/2036 | 2,980,773 | 2,981,605 |
Residential Funding Mortgage Securities II, "A1" Series 2006-HI4, 5.42%*, 9/25/2036 | 10,406,614 | 10,406,578 |
Securitized Asset Backed NIM Trust, "NIM", Series 2005-FR4, 144A, 6.0%, 1/25/2036 | 937,013 | 933,560 |
| 128,915,234 | |
Manufactured Housing Receivables 0.1% | ||
Green Tree Financial Corp., "A4", Series 1996-2, 7.2%, 4/15/2027 | 1,020,905 | 1,050,274 |
Total Asset Backed (Cost $132,870,382) | 133,174,673 | |
| ||
US Government Agency Sponsored Pass-Throughs 12.1% | ||
Federal Home Loan Mortgage Corp.: |
|
|
3.5%, 8/1/2035 | 7,276,763 | 6,445,297 |
5.0%, 4/1/2035 | 5,007,901 | 4,851,068 |
5.5%, with various maturities from 10/1/2023 until 1/1/2034 | 7,562,071 | 7,531,852 |
6.5%, 1/1/2035 | 4,204,586 | 4,309,146 |
Federal National Mortgage Association: |
|
|
4.5%, with various maturities from 8/1/2033 until 10/1/2033 | 9,021,267 | 8,492,654 |
5.0%, with various maturities from 9/1/2023 until 5/1/2034 | 16,819,497 | 16,358,623 |
5.5%, with various maturities from 7/1/2024 until 4/1/2036 | 45,249,899 | 44,911,059 |
6.0%, with various maturities from 10/1/2022 until 12/1/2099 | 21,922,842 | 22,253,019 |
6.5%, with various maturities from 5/1/2023 until 9/1/2036 | 47,756,264 | 48,733,339 |
7.0%, 8/1/2036 | 6,694,335 | 6,889,347 |
7.13%, 1/1/2012 | 1,702,679 | 1,692,152 |
9.0%, 11/1/2030 | 58,010 | 61,493 |
Total US Government Agency Sponsored Pass-Throughs (Cost $172,836,734) | 172,529,049 | |
| ||
Commercial and Non-Agency Mortgage-Backed Securities 29.4% | ||
ABN AMRO Mortgage Corp., "A5", Series 2003-4, 4.75%, 3/25/2033 | 3,752,009 | 3,710,740 |
American Home Mortgage Investment Trust, "5A3", Series 2005-2, 5.077%, 9/25/2035 | 7,575,000 | 7,504,225 |
Banc of America Commercial Mortgage, Inc.: |
|
|
"A4", Series 2005-5, 5.115%, 10/10/2045 | 9,810,000 | 9,690,778 |
"A1A", Series 2000-1, 7.109%, 11/15/2031 | 33,059 | 33,510 |
Banc of America Mortgage Securities, "2A6", Series 2004-F, 4.148%*, 7/25/2034 | 20,000 | 19,470 |
Bear Stearns Adjustable Rate Mortgage Trust: |
|
|
"2A3", Series 2005-4, 4.45%, 8/25/2035 | 2,805,000 | 2,742,178 |
"2A1", Series 2004-12, 4.472%*, 2/25/2035 | 6,563,604 | 6,472,849 |
"A1", Series 2006-1, 4.625%*, 2/25/2036 | 15,326,402 | 15,026,797 |
Chase Mortgage Finance Corp., "A1", Series 2003-S2, 5.0%, 3/25/2018 | 11,199 | 11,049 |
Citicorp Mortgage Securities, Inc., "1A1", Series 2004-1, 5.25%, 1/25/2034 | 6,426,376 | 6,377,045 |
Citigroup Commercial Mortgage Trust, "A5", Series 2004-C2, 4.733%, 10/15/2041 | 5,349,000 | 5,167,875 |
Citigroup Mortgage Loan Trust, Inc.: |
|
|
"1A2", Series 2006-AR2, 5.552%*, 3/25/2036 | 11,859,351 | 11,897,824 |
"1A3A", Series 2006-AR5, 5.957%*, 7/25/2036 | 6,298,091 | 6,370,873 |
"1CB2", Series 2004-NCM2, 6.75%, 8/25/2034 | 3,344,059 | 3,406,761 |
CitiMortgage Alternative Loan Trust, "A1", Series 2006-A2, 6.0%, 5/25/2036 | 8,130,828 | 8,210,550 |
Countrywide Alternative Loan Trust: |
|
|
"A2", Series 2003-6T2, 5.0%, 6/25/2033 | 18,011 | 17,869 |
"A2", Series 2003-21T1, 5.25%, 12/25/2033 | 4,462,123 | 4,419,897 |
"A4", Series 2004-14T2, 5.5%, 8/25/2034 | 4,325,766 | 4,301,645 |
"A6", Series 2004-14T2, 5.5%, 8/25/2034 | 4,931,292 | 4,903,362 |
"4A3", Series 2005-43, 5.752%*, 10/25/2035 | 4,862,186 | 4,833,012 |
"7A1", Series 2004-J2, 6.0%, 12/25/2033 | 1,525 | 1,518 |
"1A1", Series 2004-J1, 6.0%, 2/25/2034 | 1,026,008 | 1,021,610 |
"A1", Series 2004-35T2, 6.0%, 2/25/2035 | 3,167,952 | 3,169,074 |
"A4", Series 2002-11, 6.25%, 10/25/2032 | 2,952,837 | 2,954,235 |
Countrywide Home Loans: |
|
|
"A15", Series 2002-34, 4.75%, 1/25/2033 | 5,818,131 | 5,727,082 |
"A2", Series 2004-19, 5.25%, 10/25/2034 | 5,547,025 | 5,511,545 |
"A1", Series 2005-29, 5.75%, 12/25/2035 | 8,892,191 | 8,881,457 |
CS First Boston Mortgage Securities Corp., "1A11", Series 2004-4, 5.5%, 8/25/2034 | 4,857,900 | 4,834,736 |
First Horizon Mortgage Pass-Through Trust, "2A1", Series 2005-AR2, 5.127%*, 6/25/2035 | 6,553,576 | 6,532,539 |
GE Capital Commercial Mortgage Corp., "AAB", Series 2005-C3, 4.94%, 7/10/2045 | 2,475,000 | 2,434,851 |
GMAC Mortgage Corp. Loan Trust: |
|
|
"A2", Series 2004-J1, 5.25%, 4/25/2034 | 3,882,116 | 3,864,388 |
"A15", Series 2004-J1, 5.25%, 4/25/2034 | 3,785,497 | 3,767,843 |
Greenwich Capital Commercial Funding Corp., "AAB", Series 2006-GG7, 5.912%*, 7/10/2038 | 3,995,000 | 4,165,934 |
GS Mortgage Securities Corp. II, "A4", Series 2005-GG4, 4.761%, 7/10/2039 | 10,030,000 | 9,688,977 |
GSR Mortgage Loan Trust, "2A4", Series 2006-AR1, 5.192%*, 1/25/2036 | 9,450,000 | 9,392,282 |
JPMorgan Chase Commercial Mortgage Securities Corp., "A4", Series 2005-LDP5, 5.179%*, 12/15/2044 | 11,772,000 | 11,764,168 |
JPMorgan Mortgage Trust: |
|
|
"7A1", Series 2006-A3, 4.583%*, 4/25/2035 | 9,229,796 | 9,080,806 |
"2A4L", Series 2006-A6, 5.584%, 10/25/2036 | 7,185,000 | 7,179,108 |
LB-UBS Commercial Mortgage Trust: |
|
|
"A2", Series 2005-C2, 4.821%, 4/15/2030 | 5,385,000 | 5,334,697 |
"A4", Series 2005-C7, 5.197%, 11/15/2030 | 7,830,000 | 7,786,165 |
Lehman Mortgage Trust: |
|
|
"3A3", Series 2006-1, 5.5%, 2/25/2036 | 6,643,000 | 6,658,545 |
"1A10", Series 2006-3, 6.0%, 7/25/2036 | 6,401,869 | 6,468,754 |
Master Adjustable Rate Mortgages Trust, "B1", Series 2004-13, 3.814%*, 12/21/2034 | 6,349,747 | 6,127,070 |
Master Alternative Loans Trust: |
|
|
"5A1", Series 2005-2, 6.5%, 12/25/2034 | 918,463 | 928,221 |
"8A1", Series 2004-3, 7.0%, 4/25/2034 | 395,448 | 396,438 |
"6A1", Series 2004-5, 7.0%, 6/25/2034 | 1,610,109 | 1,624,177 |
Master Asset Securitization Trust, "2A7", Series 2003-9, 5.5%, 10/25/2033 | 5,474,889 | 5,360,261 |
Merrill Lynch Mortgage Investors Trust, "A2", Series 2005-A5, 4.566%, 6/25/2035 | 3,578,000 | 3,458,361 |
NYC Mortgage Loan Trust, "A3", Series 1996, 144A, 6.75%, 9/25/2019 | 2,350,370 | 2,371,758 |
Residential Accredit Loans, Inc.: |
|
|
"CB", Series 2004-QS2, 5.75%, 2/25/2034 | 1,864,967 | 1,847,483 |
"CB1", Series 2002-QS17, 6.0%, 11/25/2032 | 4,750,813 | 4,795,352 |
Residential Asset Securitization Trust, "A1", Series 2004-A1, 5.25%, 4/25/2034 | 5,249,918 | 5,169,579 |
Structured Adjustable Rate Mortgage Loan: |
|
|
"1A4", Series 2005-22, 5.25%, 12/25/2035 | 6,255,000 | 6,166,492 |
"6A3", Series 2005-21, 5.4%, 11/25/2035 | 5,644,000 | 5,536,502 |
"5A1", Series 2005-18, 5.562%*, 9/25/2035 | 3,074,327 | 3,074,356 |
"7A4", Series 2006-1, 5.62%, 2/25/2036 | 6,132,000 | 6,063,046 |
Structured Asset Securities Corp., "4A1", Series 2005-6, 5.0%, 5/25/2035 | 49,045 | 47,129 |
Wachovia Bank Commercial Mortgage Trust, "AMFX", Series 2005-C20, 5.179%, 7/15/2042 | 12,020,000 | 11,909,628 |
Washington Mutual: |
|
|
"A6", Series 2004-AR5, 3.844%*, 6/25/2034 | 5,237,000 | 5,070,754 |
"A6", Series 2004-AR7, 3.941%*, 7/25/2034 | 25,000 | 24,281 |
"A1", Series 2005-AR3, 4.642%*, 3/25/2035 | 7,009,819 | 6,927,937 |
"1A3", Series 2005-AR14, 5.072%*, 12/25/2035 | 6,100,000 | 6,036,556 |
"1A3", Series 2005-AR16, 5.115%*, 12/25/2035 | 6,220,000 | 6,187,121 |
"1A1", Series 2006-AR2, 5.326%*, 3/25/2037 | 8,963,459 | 8,953,002 |
"1A2", Series 2006-AR12, 5.849%, 10/25/2036 | 6,990,000 | 7,032,863 |
"1A4", Series 2006-AR8, 5.936%*, 8/25/2046 | 4,680,233 | 4,721,753 |
Washington Mutual Mortgage Pass-Through Certificates, "2CB4", Series 2005-7, 5.5%, 8/25/2035 | 6,244,066 | 6,202,475 |
Washington Mutual Mortgage Securities Corp., "1A7", Series 2003-MS8, 5.5%, 5/25/2033 | 655,316 | 652,570 |
Wells Fargo Mortgage Backed Securities Trust: |
|
|
"1A6", Series 2003-1, 4.5%, 2/25/2018 | 6,075 | 6,028 |
"4A2", Series 2005-AR16, 4.992%*, 10/25/2035 | 9,500,000 | 9,407,147 |
"4A4", Series 2005-AR16, 4.992%*, 10/25/2035 | 3,768,804 | 3,740,921 |
"2A5", Series 2006-AR2, 5.092%*, 3/25/2036 | 20,976,248 | 20,868,783 |
"3A2", Series 2006-AR8, 5.238%*, 4/25/2036 | 10,170,000 | 10,150,564 |
"A1", Series 2006-3, 5.5%, 3/25/2036 | 8,596,537 | 8,574,113 |
"A6", Series 2006-AR11, 5.539%, 8/25/2036 | 10,255,000 | 10,318,003 |
"1A3", Series 2006-6, 5.75%, 5/25/2036 | 7,040,276 | 7,065,049 |
Total Commercial and Non-Agency Mortgage-Backed Securities (Cost $417,050,391) | 418,154,396 | |
| ||
Collateralized Mortgage Obligations 12.5% | ||
Fannie Mae Whole Loan: |
|
|
"A2", Series 2004-W4, 5.0%, 6/25/2034 | 7,606,036 | 7,556,310 |
"A23", Series 2004-W10, 5.0%, 8/25/2034 | 8,015,000 | 7,956,428 |
"1A1", Series 2004-W15, 6.0%, 8/25/2044 | 2,968,245 | 2,985,139 |
Federal Home Loan Mortgage Corp.: |
|
|
"KB", Series 2552, 4.25%, 6/15/2027 | 238,140 | 235,610 |
"PN", Series 2544, 4.5%, 3/15/2026 | 4,499,678 | 4,455,065 |
"LN", Series 3145, 4.5%, 10/15/2034 | 7,332,000 | 7,094,722 |
"CA", Series 2526, 5.0%, 6/15/2016 | 1,578 | 1,569 |
"AJ", Series 2849, 5.0%, 5/15/2018 | 4,757,000 | 4,735,048 |
"PE", Series 2721, 5.0%, 1/15/2023 | 14,000 | 13,563 |
"BG", Series 2640, 5.0%, 2/15/2032 | 1,775,000 | 1,718,159 |
"YD", Series 2737, 5.0%, 8/15/2032 | 6,016,056 | 5,823,555 |
"UE", Series 2764, 5.0%, 10/15/2032 | 10,000 | 9,661 |
"EG", Series 2836, 5.0%, 12/15/2032 | 4,295,000 | 4,137,000 |
"PD", Series 2783, 5.0%, 1/15/2033 | 6,108,000 | 5,906,825 |
"TE", Series 2780, 5.0%, 1/15/2033 | 13,771,000 | 13,309,143 |
"NE", Series 2802, 5.0%, 2/15/2033 | 90,000 | 86,962 |
"OE", Series 2840, 5.0%, 2/15/2033 | 5,050,000 | 4,881,012 |
"PD", Series 2893, 5.0%, 2/15/2033 | 30,000 | 28,932 |
"TE", Series 2827, 5.0%, 4/15/2033 | 65,000 | 62,464 |
"PE", Series 2864, 5.0%, 6/15/2033 | 40,000 | 38,688 |
"UE", Series 2911, 5.0%, 6/15/2033 | 10,815,000 | 10,440,795 |
"ND", Series 2950, 5.0%, 6/15/2033 | 11,250,000 | 10,821,136 |
"BG", Series 2869, 5.0%, 7/15/2033 | 1,230,000 | 1,188,574 |
"JG", Series 2937, 5.0%, 8/15/2033 | 55,000 | 52,810 |
"KD", Series 2915, 5.0%, 9/15/2033 | 5,936,000 | 5,739,213 |
"NE", Series 2921, 5.0%, 9/15/2033 | 12,670,000 | 12,166,672 |
"ND", Series 2938, 5.0%, 10/15/2033 | 3,865,000 | 3,730,424 |
"KE", Series 2934, 5.0%, 11/15/2033 | 53,000 | 51,219 |
"QD", Series 3113, 5.0%, 6/15/2034 | 6,725,000 | 6,442,672 |
"YA", Series 2841, 5.5%, 7/15/2027 | 7,552,579 | 7,573,376 |
"PE", Series 2450, 6.0%, 7/15/2021 | 35,132 | 35,455 |
"CH", Series 2322, 6.0%, 2/15/2029 | 5,327,671 | 5,371,065 |
"YB", Series 2205, 6.0%, 5/15/2029 | 655,094 | 656,157 |
"PE", Series 2165, 6.0%, 6/15/2029 | 6,512,716 | 6,589,786 |
Federal National Mortgage Association: |
|
|
"PE", Series 2005-44, 5.0%, 7/25/2033 | 3,625,000 | 3,486,123 |
"BG", Series 2005-12, 5.0%, 10/25/2033 | 2,457,000 | 2,362,433 |
"EC", Series 2005-15, 5.0%, 10/25/2033 | 80,000 | 77,153 |
"HE", Series 2005-22, 5.0%, 10/25/2033 | 25,000 | 24,031 |
"PE", Series 2005-14, 5.0%, 12/25/2033 | 90,000 | 86,739 |
"OG", Series 2001-69, 5.5%, 12/25/2016 | 25,000 | 25,159 |
"J", Series 1998-36, 6.0%, 7/18/2028 | 5,138,560 | 5,137,973 |
"PH", Series 1999-19, 6.0%, 5/25/2029 | 6,442,045 | 6,558,238 |
"Z", Series 2001-14, 6.0%, 5/25/2031 | 19,671 | 20,007 |
"A2", Series 1998-M1, 6.25%, 1/25/2008 | 1,157,151 | 1,161,320 |
"A2", Series 1998-M6, 6.32%, 8/15/2008 | 7,589,632 | 7,695,937 |
"HM", Series 2002-36, 6.5%, 12/25/2029 | 355 | 354 |
Government National Mortgage Association: |
|
|
"GD", Series 2004-26, 5.0%, 11/16/2032 | 4,686,000 | 4,493,001 |
"QE", Series 2004-11, 5.0%, 12/16/2032 | 28,000 | 26,683 |
"VK", Series 2002-41, 6.0%, 6/20/2018 | 4,239,949 | 4,242,244 |
Total Collateralized Mortgage Obligations (Cost $178,398,357) | 177,292,604 | |
| ||
Municipal Bonds and Notes 4.5% | ||
Arkansas, State Development Finance Authority, Collateralized Mortgage Obligation, "4", Series A, Zero Coupon, 7/10/2014 (a) | 382,000 | 248,648 |
Arkansas, State Development Finance Authority, Economic Development Revenue, Series B, 4.85%, 10/1/2012 (a) | 120,000 | 118,358 |
Belmont, CA, Multi-Family Housing Revenue, Redevelopment Agency Tax Allocation, 7.55%, 8/1/2011 (a) | 685,000 | 699,851 |
California, Housing Finance Agency, Single Family Mortgage: |
|
|
Series A-1, 7.9%, 8/1/2007 (a) | 55,000 | 55,329 |
Series A-1, 8.24%, 8/1/2014 (a) | 30,000 | 30,382 |
Contra Costa County, CA, Fire District, Taxable Pension Obligation, 4.76%, 8/1/2013 (a) | 6,240,000 | 6,124,872 |
Contra Costa County, CA, Multi-Family Housing Revenue, Willow Pass Apartments, Series D, 6.8%, 12/1/2015 | 1,335,000 | 1,385,183 |
Fulton, MO, General Obligation, 7.5%, 7/1/2007 (a) | 120,000 | 121,620 |
Hillsborough County, FL, Port District Revenue, Tampa Port Authority Project: |
|
|
Zero Coupon, 6/1/2011 (a) | 53,000 | 42,112 |
Zero Coupon, 12/1/2011 (a) | 53,000 | 41,078 |
Hoboken, NJ: |
|
|
Series B, 4.76%, 2/1/2011 (a) | 335,000 | 329,881 |
Series B, 4.96%, 2/1/2012 (a) | 3,030,000 | 3,002,609 |
Series B, 5.12%, 2/1/2013 (a) | 3,185,000 | 3,167,100 |
Houston, TX, Airport System Revenue, Special Facilities, Rental Car Project, 6.88%, 1/1/2028 (a) | 45,000 | 51,391 |
Lake Mills, IA, Hospital & Healthcare Revenue, Investors Limited, First Mortgage, 144A: |
|
|
Series 1995, 8.0%, 11/1/2006 | 590,000 | 590,000 |
Series 1997, 8.0%, 11/1/2007 | 610,000 | 608,054 |
Los Angeles, CA, Community Redevelopment Agency, Community Redevelopment Financing Authority Revenue, Series L, 6.02%, 9/1/2021 (a) | 6,480,000 | 6,680,621 |
Mississippi, Single Family Housing Revenue, Home Corp. Single Family, 7.75%, 7/1/2024 | 396,397 | 400,722 |
Muskegon County, MI, General Obligation, 5.5%, 6/1/2007 | 4,000,000 | 4,000,240 |
New Mexico, Mortgage Finance Authority, Series 1997-C, 7.43%, 7/1/2029 | 21,000 | 21,159 |
New York, Multi-Family Housing Revenue, Housing Finance Agency, Series C, 8.11%, 11/15/2038 | 2,270,000 | 2,318,283 |
North Miami, FL, Project Revenue, Special Obligation, 7.0%, 1/1/2008 (a) | 125,000 | 128,851 |
Oregon, School Boards Association, Pension Deferred Interest, Series A, Zero Coupon, 6/30/2017 (a) | 17,115,000 | 9,816,479 |
Pleasantville, NJ, School District, 5.25%, 2/15/2020 (a) | 45,000 | 44,257 |
Pomona, California, Pension Obligations, Series AR, 5.732%, 7/1/2025 (a) | 3,745,000 | 3,743,390 |
Sedgwick & Shawnee County, KS, Single Family Revenue, Series B, 8.375%, 6/1/2018 | 35,000 | 35,590 |
Trenton, NJ, Taxable Reference, 5.4%, 4/1/2023 (a) | 5,735,000 | 5,736,262 |
West Virginia, State General Obligation, Jobs Inventory Trust Board: |
|
|
Series A, Zero Coupon, 1/22/2012 | 1,300,000 | 950,339 |
Series A, 144A, Zero Coupon, 6/12/2013 | 1,500,000 | 1,006,530 |
Series C, 144A, Zero Coupon, 7/31/2013 | 3,500,000 | 2,328,900 |
Wilkes Barre, PA, Taxable Notes, Series C, 5.48%, 11/15/2024 (a) | 6,315,000 | 6,254,187 |
Wisconsin, Plover Wisconsin Taxable Bond Anticipation Notes, Series C, 6.25%, 12/1/2008 | 4,325,000 | 4,385,377 |
Total Municipal Bonds and Notes (Cost $62,721,601) | 64,467,655 | |
| ||
US Treasury Obligations 10.9% | ||
US Treasury Bonds: |
|
|
6.0%, 2/15/2026 | 63,567,000 | 72,953,049 |
8.125%, 8/15/2019 | 28,552,000 | 37,719,876 |
US Treasury Notes, 4.25%, 11/15/2013 | 45,655,000 | 44,747,241 |
Total US Treasury Obligations (Cost $152,585,375) | 155,420,166 | |
|
| Value ($) |
|
| |
Preferred Stocks 2.0% | ||
Arch Capital Group Ltd., 8.0%* | 27,897 | 740,144 |
Dresdner Funding Trust I, 144A, 8.151% | 2,455,000 | 2,966,767 |
MUFG Capital Finance 1 Ltd., 6.346% | 9,980,000 | 10,078,742 |
RBS Capital Trust III, 5.512% | 2,153,000 | 2,118,265 |
Wachovia Capital Trust III, 5.8% | 8,135,000 | 8,206,645 |
ZFS Finance USA Trust I 144A, 6.15% | 4,790,000 | 4,817,558 |
Total Preferred Stocks (Cost $28,043,589) | 28,928,121 | |
| ||
Cash Equivalents 2.0% | ||
Cash Management QP Trust, 5.31% (b) (Cost $28,308,861) | 28,308,861 | 28,308,861 |
| % of Net Assets | Value ($) |
|
| |
Total Investment Portfolio (Cost $1,428,885,106)+ | 101.3 | 1,440,057,379 |
Other Assets and Liabilities, Net | (1.3) | (17,210,102) |
Net Assets | 100.0 | 1,422,847,277 |
* Floating rate notes are securities whose yields vary with a designated market index or market rate, such as the coupon-equivalent of the US Treasury bill rate. These securities are shown at their current rate as of October 31, 2006.
+ The cost for federal income tax purposes was $1,432,390,966. At October 31, 2006, net unrealized appreciation for all securities based on tax cost was $7,666,413. This consisted of aggregate gross unrealized appreciation for all securities in which there was an excess of value over tax cost of $19,002,109 and aggregate gross unrealized depreciation for all securities in which there was an excess of tax cost over value of $11,335,696.
(a) Bond is insured by one of these companies.
Insurance Coverage | As a % of Total Investment Portfolio |
Ambac Assurance Corp. | 0.4 |
Financial Security Assurance, Inc. | 0.7 |
Financial Guaranty Insurance Company | 0.4 |
MBIA Corporation | 1.7 |
b) Cash Management QP Trust, an affiliated fund, is managed by Deutsche Investment Management Americas Inc. The rate shown is the annualized seven-day yield at period end.
REIT: Real Estate Investment Trust
Included in the portfolio are investments in mortgage or asset-backed securities which are interests in separate pools of mortgages or assets. Effective maturities of these investments may be shorter than stated maturities due to prepayments. Some separate investments in the Federal Home Loan Mortgage Corp. and Federal National Mortgage Association issues have similar coupon rates and have been aggregated for presentation purposes in the investment portfolio.
144A: Security exempt from registration under Rule 144A of the Securities Act of 1933. These securities may be resold in transactions exempt from registration, normally to qualified institutional buyers.
The accompanying notes are an integral part of the financial statements.
Statement of Assets and Liabilities as of October 31, 2006 | |
Assets | |
Investments: Investments in securities, at value (cost $1,400,576,245) | $ 1,411,748,518 |
Investment in Cash Management QP Trust (cost $28,308,861) | 28,308,861 |
Total investments in securities, at value (cost $1,428,885,106) | 1,440,057,379 |
Receivable for investments sold | 6,130,045 |
Interest receivable | 11,725,210 |
Receivable for Fund shares sold | 4,340,337 |
Dividend receivable | 13,949 |
Foreign taxes recoverable | 738 |
Other assets | 104,848 |
Total assets | 1,462,372,506 |
Liabilities | |
Payable for investments purchased | 26,266,613 |
Dividends payable | 1,084,326 |
Payable for Fund shares redeemed | 2,032,116 |
Accrued management fee | 416,847 |
Payable for investments purchased — mortgage dollar rolls | 8,924,281 |
Other accrued expenses and payables | 801,046 |
Total liabilities | 39,525,229 |
Net assets, at value | $ 1,422,847,277 |
Net Assets | |
Net assets consist of: Distributions in excess of net investment income | (492,334) |
Net unrealized appreciation (depreciation) on investments | 11,172,273 |
Accumulated net realized gain (loss) | (15,151,369) |
Paid-in capital | 1,427,318,707 |
Net assets, at value | $ 1,422,847,277 |
The accompanying notes are an integral part of the financial statements.
Statement of Assets and Liabilities as of October 31, 2006 (continued) | |
Net Asset Value | |
Class A Net Asset Value and redemption price(a) per share ($610,700,643 ÷ 56,967,757 outstanding shares of beneficial interest, $.001 par value, unlimited number of shares authorized) | $ 10.72 |
Maximum offering price per share (100 ÷ 95.5 of $10.72) | $ 11.23 |
Class B Net Asset Value, offering and redemption price(a) (subject to contingent deferred sales charge) per share ($34,843,855 ÷ 3,252,296 outstanding shares of beneficial interest, $.001 par value, unlimited number of shares authorized) | $ 10.71 |
Class C Net Asset Value, offering and redemption price(a) (subject to contingent deferred sales charge) per share ($54,750,045 ÷ 5,108,308 outstanding shares of beneficial interest, $.001 par value, unlimited number of shares authorized) | $ 10.72 |
Class R Net Asset Value, offering and redemption price(a) per share ($10,145,484 ÷ 942,351 outstanding shares of beneficial interest, $.001 par value, unlimited number of shares authorized) | $ 10.77 |
Class S Net Asset Value, offering and redemption price(a) per share ($113,473,546 ÷ 10,592,472 outstanding shares of beneficial interest, $.001 par value, unlimited number of shares authorized) | $ 10.71 |
Institutional Class Net Asset Value, offering and redemption price(a) per share ($598,933,704 ÷ 55,873,644 outstanding shares of beneficial interest, $.001 par value, unlimited number of shares authorized) | $ 10.72 |
(a) Redemption price per share for shares held less than 15 days is equal to net asset value less a 2% redemption fee.
The accompanying notes are an integral part of the financial statements.
Statement of Operations for the year ended October 31, 2006 | |
Investment Income | |
Income: Interest (net of foreign taxes withheld of $1,476) | $ 67,850,842 |
Interest — Cash Management QP Trust | 1,531,764 |
Dividends | 69,209 |
Total Income | 69,451,815 |
Expenses: Management fee | 5,219,854 |
Administration fee | 568,624 |
Services to shareholders | 950,796 |
Administrator service fee | 886,445 |
Distribution and shareholder servicing fees | 2,287,971 |
Custodian fees | 43,269 |
Auditing | 60,882 |
Legal | 54,954 |
Trustees' fees and expenses | 55,355 |
Reports to shareholders and shareholder meeting | 486,902 |
Registration fees | 119,582 |
Other | 110,796 |
Total expenses before expense reductions | 10,845,430 |
Expense reductions | (1,020,571) |
Total expenses after expense reductions | 9,824,859 |
Net investment income | 59,626,956 |
Realized and Unrealized Gain (Loss) on Investment Transactions | |
Net realized gain from: Investments | (14,205,612) |
Net unrealized appreciation (depreciation) during the period on investments | 18,301,392 |
Net gain (loss) on investment transactions | 4,095,780 |
Net increase (decrease) in net assets resulting from operations | $ 63,722,736 |
The accompanying notes are an integral part of the financial statements.
Statement of Changes in Net Assets | ||
| Years Ended October 31, | |
Increase (Decrease) in Net Assets | 2006 | 2005 |
Operations: Net investment income | $ 59,626,956 | $ 47,222,226 |
Net realized gain (loss) on investment transactions | (14,205,612) | 4,096,129 |
Net unrealized appreciation (depreciation) during the period on investment transactions | 18,301,392 | (36,813,378) |
Net increase (decrease) in net assets resulting from operations | 63,722,736 | 14,504,977 |
Distributions to shareholders from: Net investment income: Class A | (23,065,955) | (12,890,760) |
Class B | (1,397,979) | (1,394,285) |
Class C | (2,041,601) | (1,729,590) |
Investment Class | (4,992,612) | (4,614,211) |
Class R | (366,227) | (199,560) |
Class S | (238,037) | (25,881) |
Institutional Class | (27,685,873) | (26,060,857) |
Net realized gains: Class A | (948,827) | (1,062,767) |
Class B | (87,193) | (200,798) |
Class C | (119,822) | (241,099) |
Investment Class | (256,149) | (488,900) |
Class R | (14,250) | (16,115) |
Class S | (3,695) | — |
Institutional Class | (1,243,617) | (3,210,732) |
Fund share transactions: Proceeds from shares sold | 575,314,161 | 579,986,801 |
Reinvestment of distributions | 55,109,124 | 46,483,429 |
Cost of shares redeemed | (433,477,477) | (368,469,303) |
In-kind redemption | — | (76,287,189) |
Redemption fees | 23,829 | 10,304 |
Net increase (decrease) in net assets from Fund share transactions | 196,969,637 | 181,724,042 |
Increase (decrease) in net assets | 198,230,536 | 144,093,464 |
Net assets at beginning of period | 1,224,616,741 | 1,080,523,277 |
Net assets at end of period (including distributions in excess of net investment income of $492,334 and undistributed net investment income of $47,817, respectively) | $ 1,422,847,277 | $ 1,224,616,741 |
The accompanying notes are an integral part of the financial statements.
Class A Years Ended October 31, | 2006 | 2005 | 2004 | 2003 | 2002a |
Selected Per Share Data | |||||
Net asset value, beginning of period | $ 10.73 | $ 11.08 | $ 10.96 | $ 11.08 | $ 10.92 |
Income (loss) from investment operations: Net investment incomeb | .47 | .44 | .46 | .46 | .17 |
Net realized and unrealized gain (loss) on investment transactions | .02 | (.30) | .20 | .03c | .18 |
Total from investment operations | .49 | .14 | .66 | .49 | .35 |
Less distributions from: Net investment income | (.48) | (.44) | (.46) | (.45) | (.19) |
Net realized gain on investment transactions | (.02) | (.05) | (.08) | (.16) | — |
Total distributions | (.50) | (.49) | (.54) | (.61) | (.19) |
Redemption fees | .00*** | .00*** | — | — | — |
Net asset value, end of period | $ 10.72 | $ 10.73 | $ 11.08 | $ 10.96 | $ 11.08 |
Total Return (%)d,e | 4.72 | 1.28 | 6.17 | 4.43 | 3.29** |
Ratios to Average Net Assets and Supplemental Data | |||||
Net assets, end of period ($ millions) | 611 | 431 | 221 | 176 | 19 |
Ratio of expenses before expense reductions (%) | .95 | .81 | .81 | .80 | .83* |
Ratio of expenses after expense reductions (%) | .82 | .80 | .80 | .80 | .79* |
Ratio of net investment income (%) | 4.50 | 4.04 | 4.20 | 4.15 | 4.82* |
Portfolio turnover rate (%) | 166f | 162f,g | 91f | 290 | 152 |
a For the period from June 28, 2002 (commencement of operations of Class A shares) to October 31, 2002. b Based on average shares outstanding during the period. c The amount of net realized and unrealized gain shown for a share outstanding for the period ended October 31, 2003 does not correspond with the aggregate net loss on investments for the period due to the timing of sales and repurchases of the Fund shares in relation to fluctuating market values of the investments of the Fund. d Total return does not reflect the effect of any sales charges. e Total return would have been lower had certain expenses not been reduced. f The portfolio turnover rate including mortgage dollar roll transactions was 173%, 177% and 190% for the years ended October 31, 2006, 2005 and 2004, respectively. g Excludes portfolio securities delivered as a result of processing redemption in-kind transactions. * Annualized ** Not annualized *** Amount is less than $.005. | |||||
Class B Years Ended October 31, | 2006 | 2005 | 2004 | 2003 | 2002a |
Selected Per Share Data | |||||
Net asset value, beginning of period | $ 10.72 | $ 11.07 | $ 10.96 | $ 11.08 | $ 10.92 |
Income (loss) from investment operations: Net investment incomeb | .39 | .36 | .38 | .38 | .14 |
Net realized and unrealized gain (loss) on investment transactions | .02 | (.30) | .20 | .02c | .18 |
Total from investment operations | .41 | .06 | .58 | .40 | .32 |
Less distributions from: Net investment income | (.40) | (.36) | (.39) | (.36) | (.16) |
Net realized gain on investment transactions | (.02) | (.05) | (.08) | (.16) | — |
Total distributions | (.42) | (.41) | (.47) | (.52) | (.16) |
Redemption fees | .00*** | .00*** | — | — | — |
Net asset value, end of period | $ 10.71 | $ 10.72 | $ 11.07 | $ 10.96 | $ 11.08 |
Total Return (%)d | 3.94e | .51e | 5.37 | 3.64 | 3.04e** |
Ratios to Average Net Assets and Supplemental Data | |||||
Net assets, end of period ($ millions) | 35 | 41 | 44 | 43 | 9 |
Ratio of expenses before expense reductions (%) | 1.67 | 1.56 | 1.55 | 1.49 | 1.58* |
Ratio of expenses after expense reductions (%) | 1.57 | 1.55 | 1.55 | 1.49 | 1.54* |
Ratio of net investment income (%) | 3.75 | 3.29 | 3.45 | 3.46 | 4.07* |
Portfolio turnover rate (%) | 166f | 162f,g | 91f | 290 | 152 |
a For the period from June 28, 2002 (commencement of operations of Class B shares) to October 31, 2002. b Based on average shares outstanding during the period. c The amount of net realized and unrealized gain shown for the period ended October 31, 2003 does not correspond with the aggregate net loss on investments for the period due to the timing of sales and repurchases of Fund shares in relation to fluctuating market values of the investments of the Fund. d Total return does not reflect the effect of any sales charges. e Total return would have been lower had certain expenses not been reduced. f The portfolio turnover rate including mortgage dollar roll transactions was 173%, 177% and 190% for the years ended October 31, 2006, 2005 and 2004, respectively. g Excludes portfolio securities delivered as a result of processing redemption in-kind transactions. * Annualized ** Not annualized *** Amount is less than $.005. | |||||
Class C Years Ended October 31, | 2006 | 2005 | 2004 | 2003 | 2002a |
Selected Per Share Data | |||||
Net asset value, beginning of period | $ 10.73 | $ 11.08 | $ 10.96 | $ 11.08 | $ 10.92 |
Income (loss) from investment operations: Net investment incomeb | .39 | .36 | .38 | .38 | .15 |
Net realized and unrealized gain (loss) on investment transactions | .02 | (.30) | .20 | .02c | .17 |
Total from investment operations | .41 | .06 | .58 | .40 | .32 |
Less distributions from: Net investment income | (.40) | (.36) | (.38) | (.36) | (.16) |
Net realized gain on investment transactions | (.02) | (.05) | (.08) | (.16) | — |
Total distributions | (.42) | (.41) | (.46) | (.52) | (.16) |
Redemption fees | .00*** | .00*** | — | — | — |
Net asset value, end of period | $ 10.72 | $ 10.73 | $ 11.08 | $ 10.96 | $ 11.08 |
Total Return (%)d | 3.94e | .52e | 5.40 | 3.73e | 2.96e** |
Ratios to Average Net Assets and Supplemental Data | |||||
Net assets, end of period ($ millions) | 55 | 55 | 52 | 54 | 11 |
Ratio of expenses before expense reductions (%) | 1.63 | 1.56 | 1.53 | 1.55 | 1.58* |
Ratio of expenses after expense reductions (%) | 1.57 | 1.55 | 1.53 | 1.54 | 1.54* |
Ratio of net investment income (%) | 3.75 | 3.29 | 3.47 | 3.41 | 4.07* |
Portfolio turnover rate (%) | 166f | 162f,g | 91f | 290 | 152 |
a For the period from June 28, 2002 (commencement of operations of Class C shares) to October 31, 2002. b Based on average shares outstanding during the period. c The amount of net realized and unrealized gain shown for a share outstanding for the period ended October 31, 2003 does not correspond with the aggregate net loss on investments for the period due to the timing of sales and repurchases of Fund shares in relation to fluctuating market values of the investments of the Fund. d Total return does not reflect the effect of any sales changes. e Total return would have been lower had certain expenses not been reduced. f The portfolio turnover rate including mortgage dollar roll transactions was 173%, 177% and 190% for the years ended October 31, 2006, 2005 and 2004, respectively. g Excludes portfolio securities delivered as a result of processing redemption in-kind transactions. * Annualized ** Not annualized *** Amount is less than $.005. | |||||
Class R Years Ended October 31, | 2006 | 2005 | 2004 | 2003a |
Selected Per Share Data | ||||
Net asset value, beginning of period | $ 10.77 | $ 11.12 | $ 10.99 | $ 11.07 |
Income (loss) from investment operations: Net investment incomeb | .45 | .41 | .43 | .04 |
Net realized and unrealized gain (loss) on investment transactions | .02 | (.30) | .17 | (.12) |
Total from investment operations | .47 | .11 | .60 | (.08) |
Less distributions from: Net investment income | (.45) | (.41) | (.39) | — |
Net realized gain on investment transactions | (.02) | (.05) | (.08) | — |
Total distributions | (.47) | (.46) | (.47) | — |
Redemption fees | .00*** | .00*** | — | — |
Net asset value, end of period | $ 10.77 | $ 10.77 | $ 11.12 | $ 10.99 |
Total Return (%) | 4.56c | 1.04 | 6.00c | (.72)c** |
Ratios to Average Net Assets and Supplemental Data | ||||
Net assets, end of period ($ millions) | 10 | 7 | 3 | .01 |
Ratio of expenses before expense reductions (%) | 1.12 | 1.05 | 1.06 | 1.05* |
Ratio of expenses after expense reductions (%) | 1.08 | 1.05 | 1.04 | 1.05* |
Ratio of net investment income (%) | 4.24 | 3.79 | 3.96 | 3.62* |
Portfolio turnover rate (%) | 166d | 162d,e | 91d | 290 |
a For the period from October 1, 2003 (commencement of operations of Class R shares) to October 31, 2003. b Based on average shares outstanding during the period. c Total return would have been lower had certain expenses not been reduced. d The portfolio turnover rate including mortgage dollar roll transactions was 173%, 177% and 190% for the years ended October 31, 2006, 2005 and 2004, respectively. e Excludes portfolio securities delivered as a result of processing redemption in-kind transactions. * Annualized ** Not annualized *** Amount is less than $.005. | ||||
Class S Years Ended October 31, | 2006 | 2005a |
Selected Per Share Data | ||
Net asset value, beginning of period | $ 10.73 | $ 11.02 |
Income (loss) from investment operations: Net investment incomeb | .49 | .34 |
Net realized and unrealized gain (loss) on investment transactions | .00*** | (.29) |
Total from investment operations | .49 | .05 |
Less distributions from: Net investment income | (.49) | (.34) |
Net realized gain on investment transactions | (.02) | — |
Total distributions | (.51) | (.34) |
Redemption fees | .00*** | .00*** |
Net asset value, end of period | $ 10.71 | $ 10.73 |
Total Return (%)c | 4.73 | .41** |
Ratios to Average Net Assets and Supplemental Data | ||
Net assets, end of period ($ millions) | 113 | 1 |
Ratio of expenses before expense reductions (%) | .93 | .81* |
Ratio of expenses after expense reductions (%) | .67 | .74* |
Ratio of net investment income (%) | 4.65 | 4.12* |
Portfolio turnover rate (%) | 166d | 162d,e |
a For the period from February 1, 2005 (commencement of operations of Class S shares) to October 31, 2005. b Based on average shares outstanding during the period. c Total return would have been lower had certain expenses not been reduced. d The portfolio turnover rate including mortgage dollar roll transactions was 173% and 177% for the periods ended October 31, 2006, and 2005. e Excludes portfolio securities delivered as a result of processing redemption in-kind transactions. * Annualized ** Not annualized *** Amount is less than $.005. | ||
Institutional Class Years Ended October 31, | 2006 | 2005 | 2004 | 2003 | 2002 |
Selected Per Share Data | |||||
Net asset value, beginning of period | $ 10.73 | $ 11.08 | $ 10.96 | $ 11.08 | $ 11.12 |
Income (loss) from investment operations: Net investment incomea | .50 | .47 | .49 | .49 | .61 |
Net realized and unrealized gain (loss) on investment transactions | .01 | (.30) | .19 | .03b | (.03) |
Total from investment operations | .51 | .17 | .68 | .52 | .58 |
Less distributions from: Net investment income | (.50) | (.47) | (.48) | (.48) | (.62) |
Net realized gain on investment transactions | (.02) | (.05) | (.08) | (.16) | — |
Total distributions | (.52) | (.52) | (.56) | (.64) | (.62) |
Redemption fees | .00* | .00* | — | — | — |
Net asset value, end of period | $ 10.72 | $ 10.73 | $ 11.08 | $ 10.96 | $ 11.08 |
Total Return (%)c | 4.98 | 1.52 | 6.43 | 4.70 | 5.49 |
Ratios to Average Net Assets and Supplemental Data | |||||
Net assets, end of period ($ millions) | 599 | 571 | 656 | 755 | 745 |
Ratio of expenses before expense reductions (%) | .61 | .56 | .56 | .55 | .56 |
Ratio of expenses after expense reductions (%) | .58 | .55 | .55 | .55 | .55 |
Ratio of net investment income (%) | 4.74 | 4.29 | 4.45 | 4.40 | 5.60 |
Portfolio turnover rate (%) | 166d | 162d,e | 91d | 290 | 152 |
a Based on average shares outstanding during the period. b The amount of net realized and unrealized gain shown for a share outstanding for the period ended October 31, 2003 does not correspond with the aggregate net loss on investments for the period due to the timing of sales and repurchases of Fund shares in relation to fluctuating market values of the investments of the Fund. c Total return would have been lower had certain expenses not been reduced. d The portfolio turnover rate including mortgage dollar roll transactions was 173%, 177% and 190% for the years ended October 31, 2006, 2005 and 2004, respectively. e Excludes portfolio securities delivered as a result of processing redemption in-kind transactions. * Amount is less than $.005. | |||||
A. Significant Accounting Policies
DWS Core Fixed Income Fund (formerly Scudder Fixed Income Fund) (the "Fund") is a diversified series of DWS Advisor Funds (the "Trust") which is registered under the Investment Company Act of 1940, as amended, (the "1940 Act"), as an open-end investment management company. The Trust is organized as a business trust under the laws of the state of Delaware. On July 10, 2006, DWS Core Fixed Income Fund became a series of DWS Advisor Funds. Prior to July 10, 2006, DWS Core Fixed Income Fund was a series of DWS Investments Trust.
The Fund offers multiple classes of shares which provide investors with different purchase options. Class A shares are offered to investors subject to an initial sales charge. Class B shares are offered without an initial sales charge but are subject to higher ongoing expenses than Class A shares and a contingent deferred sales charge payable upon certain redemptions. Class B shares automatically convert to Class A shares six years after issuance. Class C shares are offered to investors without an initial sales charge but are subject to higher ongoing expenses than Class A shares and a contingent deferred sales charge payable upon certain redemptions within one year of purchase. Class C shares do not convert into another class. Class R shares are only available to participants in certain retirement plans and are offered to investors without an initial sales charge or contingent deferred sales charge. Institutional Class shares are offered to a limited group of investors, are not subject to initial or contingent deferred sales charges and have lower ongoing expenses than other classes. On October 20, 2006, Investment Class shares were converted into Class S shares. Class S shares are not subject to initial or contingent deferred sales charges. Class S shares are no longer available to new investors except under certain circumstances.
Investment income, realized and unrealized gains and losses, and certain fund-level expenses and expense reductions, if any, are borne pro rata on the basis of relative net assets by the holders of all classes of shares, except that each class bears certain expenses unique to that class such as services to shareholders and certain other class-specific expenses. All shares of the Fund have equal rights with respect to voting subject to class-specific arrangements.
The Fund's financial statements are prepared in accordance with accounting principles generally accepted in the United States of America which require the use of management estimates. Actual results could
differ from those estimates. The policies described below are followed consistently by the Fund in the preparation of its financial statements.
Security Valuation. Investments are stated at value determined as of the close of regular trading on the New York Stock Exchange on each day the exchange is open for trading. Debt securities are valued by independent pricing services approved by the Trustees of the Fund. If the pricing services are unable to provide valuations, the securities are valued at the most recent bid quotation or evaluated price, as applicable, obtained from a broker-dealer. Such services may use various pricing techniques which take into account appropriate factors such as yield, quality, coupon rate, maturity, type of issue, trading characteristics and other data, as well as broker quotes.
Equity securities are valued at the most recent sale price or official closing price reported on the exchange (US or foreign) or over-the-counter market on which the security is traded most extensively. Securities for which no sales are reported are valued at the calculated mean between the most recent bid and asked quotations on the relevant market or, if a mean cannot be determined, at the most recent bid quotation.
Money market instruments purchased with an original or remaining maturity of sixty days or less, maturing at par, are valued at amortized cost. Investments in open-end investment companies and Cash Management QP Trust are valued at their net asset value each business day.
Securities and other assets for which market quotations are not readily available or for which the above valuation procedures are deemed not to reflect fair value are valued in a manner that is intended to reflect their fair value as determined in accordance with procedures approved by the Trustees.
In September 2006, FASB released Statement of Financial Accounting Standards No. 157, "Fair Value Measurements" ("FAS 157"). FAS 157 defines fair value, establishes a framework for measuring fair value and expands disclosures about fair value measurements. FAS 157 is effective for fiscal years beginning after November 15, 2007. As of October 31, 2006, management does not believe the adoption of FAS 157 will impact the amounts reported in the financial statements, however, additional disclosures will be required about the inputs used to develop the measurements of fair value and the effect of certain of the measurements reported in the statement of operations for a fiscal period.
Mortgage Dollar Rolls. The Fund may enter into mortgage dollar rolls in which the Fund sells to a bank or broker/dealer (the "counterparty") mortgage-backed securities for delivery in the current month and simultaneously contracts to repurchase similar, but not identical, securities on a fixed date. The counterparty receives all principal and interest payments, including prepayments, made on the security while it is the holder. The Fund receives compensation as consideration for entering into the commitment to repurchase. The compensation is paid in the form of a lower price for the security upon its repurchase, or alternatively, a fee. Mortgage dollar rolls may be renewed with a new sale and repurchase price and a cash settlement made at each renewal without physical delivery of the securities subject to the contract.
Certain risks may arise upon entering into mortgage dollar rolls from the potential inability of counterparties to meet the terms of their commitments. Additionally, the value of such securities may change adversely before the Fund is able to repurchase them. There can be no assurance that the Fund's use of the cash that it receives from a mortgage dollar roll will provide a return that exceeds its costs.
Federal Income Taxes. The Fund's policy is to comply with the requirements of the Internal Revenue Code, as amended, which are applicable to regulated investment companies, and to distribute all of its taxable income to its shareholders. Accordingly, the Fund paid no federal income taxes and no federal income tax provisions were required.
At October 31, 2006, the Fund had a net tax basis capital loss carryforward of approximately $11,645,000 which may be applied against any realized net taxable capital gains of each succeeding year until fully utilized or until October 31,2014, the respective expiration date, which may be subject to certain limitations under sections 382-383 of the Internal Revenue Code.
In July 2006, the Financial Accounting Standards Board (FASB) issued Interpretation No. 48, "Accounting for Uncertainty in Income Taxes — an interpretation of FASB Statement No. 109" (the "Interpretation"). The Interpretation establishes for the Fund a minimum threshold for financial statement recognition of the benefit of positions taken in filing tax returns (including whether the Fund is taxable in certain jurisdictions), and requires certain expanded tax disclosures. The Interpretation is effective for fiscal years beginning after December 15, 2006. Management has begun to evaluate the application of the Interpretation to the Fund and is not in a position at this time to estimate the significance of its impact, if any, on the Fund's financial statements.
Distribution of Income and Gains. Net investment income of the Fund is declared as a daily dividend and distributed to shareholders monthly. Net realized gains from investment transactions, in excess of available capital loss carryforwards, would be taxable to the Fund if not distributed, and, therefore, will be distributed to shareholders at least annually.
The timing and characterization of certain income and capital gains distributions are determined annually in accordance with federal tax regulations which may differ from accounting principles generally accepted in the United States of America. These differences relate primarily to securities sold at a loss. As a result, net investment income (loss) and net realized gain (loss) on investment transactions for a reporting period may differ significantly from distributions during such period. Accordingly, the Fund may periodically make reclassifications among certain of its capital accounts without impacting the net asset value of the Fund.
At October 31, 2006, the Fund's components of distributable earnings (accumulated losses) on a tax-basis were as follows:
Undistributed ordinary income* | $ 591,992 |
Capital loss carryforwards | $ (11,645,000) |
Net unrealized appreciation (depreciation) on investments | $ 7,666,413 |
In addition, the tax character of distributions paid to shareholders by the Fund is summarized as follows:
| Years Ended October 31, | |
| 2006 | 2005 |
Distributions from ordinary income* | $ 61,597,718 | $ 46,915,144 |
Distributions from long-term capital gains | $ 864,119 | $ 5,220,411 |
* For tax purposes short-term capital gains distributions are considered ordinary income distributions.
Redemption Fees. The Fund imposes a redemption fee of 2% of the total redemption amount on all Fund shares redeemed or exchanged within 15 days, of buying them, either by purchase or exchange. This fee is assessed and retained by the Fund for the benefit of the remaining shareholders. The redemption fee is accounted for as an addition to paid-in capital.
Contingencies. In the normal course of business, the Fund may enter into contracts with service providers that contain general indemnification clauses. The Fund's maximum exposure under these arrangements is unknown as this would involve future claims that may be made against the Fund that have not yet been made. However, based on experience, the Fund expects the risk of loss to be remote.
Other. Investment transactions are accounted for on a trade date plus one basis for daily net asset value calculations. However, for financial reporting purposes, investment security transactions are reported on trade date. Interest income is recorded on the accrual basis. Dividend income is recorded on the ex-dividend date. Realized gains and losses from investment transactions are recorded on an identified cost basis. All discounts and premiums are accreted/amortized for both tax and financial reporting purposes.
B. Purchases and Sales of Securities
During the year ended October 31, 2006, purchases and sales of investment securities (excluding short-term investments, US Treasury Obligations and mortgage dollar roll transactions) aggregated $1,049,942,983 and $797,649,380, respectively. Purchases and sales of US Treasury obligations aggregated $1,447,217,133 and $1,407,099,825, respectively. Purchases and sales of mortgage dollar rolls aggregated $79,630,525 and $83,876,448, respectively.
C. Related Parties
DWS Scudder is part of Deutsche Asset Management, which is the marketing name in the US for the asset management activities of Deutsche Bank AG. Deutsche Asset Management, Inc. ("DeAM, Inc." or the "Advisor"), an indirect, wholly owned subsidiary of Deutsche Bank AG, is the Fund's Advisor and Administrator.
On December 1, 2005, Aberdeen Asset Management PLC ("Aberdeen PLC") acquired from Deutsche Bank AG, the parent company of the Advisor, parts of its asset management business and related assets based in London and Philadelphia. As of December 2, 2005, and pursuant to a written contract, Aberdeen Asset Management Inc. ("AAMI"), a direct, wholly owned subsidiary of Aberdeen PLC, serves as subadvisor to the Fund. AAMI is paid for its services by the Advisor from its fee as investment advisor to the Fund.
Management Agreement. Under the Management Agreement, the Advisor directs the investments of the Fund in accordance with its investment objectives, policies and restrictions. The Advisor determines the securities, instruments and other contracts relating to investments to be purchased, sold or entered into by the Fund.
Prior to June 1, 2006, the management fee payable under the Investment Management Agreement was equal to an annual rate of 0.40% of the Fund's average daily net assets, computed and accrued daily and payable monthly.
Effective June 1, 2006, under the Amended and Restated Investment Management Agreement with the Advisor, the Fund pays a monthly management fee based on the Fund's average daily net assets accrued daily and payable monthly, at the following annual rates:
First $1.5 billion of the Fund's average daily net assets | .400% |
Next $1.75 billion of such net assets | .385% |
Next $1.75 billion of such net assets | .370% |
Over $5 billion of such net assets | .355% |
For the period from November 1, 2005 through May 31, 2006, the Advisor and Administrator had contractually agreed to waive all or a portion of their fees and reimburse or pay certain operating expenses of the Fund (excluding certain expenses such as extraordinary expenses, proxy/shareholder meeting costs, taxes, brokerage, interest and organizational and offering expenses) to the extent necessary to maintain the operating expenses of each class as follows:
Class A | .80% |
Class B | 1.55% |
Class C | 1.55% |
Class R | 1.05% |
Class S | .74% |
Institutional Class | .55% |
For the period from June 1, 2006 through September 30, 2006, the Advisor has contractually agreed to waive all or a portion of its management fee and reimburse or pay certain operating expenses of the Fund (excluding certain expenses such as extraordinary expenses, taxes, brokerage, interest, and organizational and offering expenses) to the extent necessary to maintain the operating expenses of each class as follows:
Class A | .80% |
Class B | 1.55% |
Class C | 1.55% |
Class R | 1.05% |
Class S | .77% |
Institutional Class | .55% |
Effective October 1, 2006 through September 30, 2007, the Advisor has contractually agreed to waive all or a portion of its management fee and reimburse or pay certain operating expenses of the Fund (excluding certain expenses such as extraordinary expenses, taxes, brokerage, interest and organizational and offering expenses) to the extent necessary to maintain the operating expenses of each class as follows:
Class A | .80% |
Class B | 1.55% |
Class C | 1.55% |
Class R | 1.05% |
Class S | .55% |
Institutional Class | .55% |
Accordingly, for the year ended October 31, 2006, the Advisor waived a portion of its advisory fee pursuant to the Investment Management Agreement aggregating $37,874 and the amount charged aggregated $5,181,980 which was equivalent to an annual effective rate of 0.40% of the Fund's average daily net assets.
Administrator Service Fee. Prior to June 1, 2006, for its services as Administrator, DeAM, Inc. received a fee (the "Administrator Service Fee") of 0.12% of the average daily net assets of Class A, B, C, Investment Class, Class R and Institutional Class shares and 0.37% of the average daily net assets of Class S shares computed and accrued daily and payable monthly.
For the period November 1, 2005 to May 31, 2006, the Administrator Service Fee was as follows:
Administrator Service Fee | Total Aggregated | Waived |
Class A | $ 330,672 | $ 26,347 |
Class B | 27,083 | 1,055 |
Class C | 38,453 | 1,319 |
Investment Class | 77,954 | — |
Class R | 5,443 | 161 |
Class S | 4,201 | 805 |
Institutional Class | 402,639 | 31,315 |
| $ 886,445 | $ 61,002 |
Effective June 1, 2006, the Administration Services Agreement with DeAM was terminated and the Fund entered into an Administrative Services Agreement with Deutsche Investment Management Americas Inc. ("DeIM"), an indirect wholly owned affiliate of Deutsche Bank AG pursuant to which DeIM provides most administrative services to the Fund. For all services provided under the Administrative Services Agreement, the Fund pays the Advisor an annual fee ("Administration Fee") of 0.10% of the Fund's average daily net assets computed and accrued daily and payable monthly. For the period from June 1, 2006 through October 31, 2006, DeIM received an Administration Fee of $568,624, of which $119,280 is unpaid.
Service Provider Fees. DWS Scudder Investments Service Company ("DWS-SISC"), an affiliate of the Advisor, is the transfer agent, shareholder service agent and dividend-paying agent for Class A, B, C, Investment Class (through October 20, 2006), R and Institutional Class shares of the Fund. DWS Scudder Service Corporation ("DWS-SSC"), an affiliate of the Advisor, is the transfer agent, dividend-paying agent and shareholder service agent for Class S shares of the Fund. Pursuant to a sub-transfer agency agreement among DWS-SISC, DWS-SSC and DST Systems, Inc. ("DST"), DWS-SISC and DWS-SSC have delegated certain transfer agent and dividend-paying agent functions to DST. DWS-SISC and DWS-SSC compensate DST out of the shareholder servicing fee they receive from the Fund. Prior to June 1, 2006, the fees were paid under the Administrator Service Agreement with the Advisor. For the period from June 1, 2006 through October 31, 2006, the amounts charged to the Fund by DWS-SISC and DWS-SSC were as follows:
Services to Shareholders | Total Aggregated | Waived | Unpaid at October 31, 2006 |
Class A | $ 527,720 | $ 527,720 | $ — |
Class B | 28,774 | 28,774 | — |
Class C | 29,119 | 27,682 | 227 |
Investment Class | 96,442 | 81,722 | — |
Class R | 5,110 | 3,214 | 1,896 |
Class S | 4,672 | 4,672 | — |
Institutional Class | 154,991 | 154,991 | — |
| $ 846,828 | $ 828,775 | $ 2,123 |
Distribution Service Agreement. Under the Distribution Service Agreement, in accordance with Rule 12b-1 under the 1940 Act, DWS Scudder Distributors, Inc. ("DWS-SDI"), an affiliate of the Advisor, receives a fee ("Distribution Fee") of 0.75% of average daily net assets of the Class B and C shares, 0.25% of average daily net assets for Class R shares, and 0.25% of average daily net assets for Class A shares (through May 31, 2006). Pursuant to the agreement, DWS-SDI enters into related selling group agreements with various firms at various rates for sales of Class A, B, C and R shares. For the year ended October 31, 2006, the Distribution Fee was as follows:
Distribution Fee | Total Aggregated | Unpaid at October 31, 2006 |
Class A | $ 688,714 | $ 43,559 |
Class B | 280,370 | 22,764 |
Class C | 408,481 | 35,012 |
Class R | 21,398 | 2,827 |
| $ 1,398,963 | $ 104,162 |
In addition, DWS-SDI or an affiliate provides information and administrative services ("Shareholder Servicing Fee") to the shareholders of Class B, Class C, Investment Class (through October 20, 2006), Class R and Class A (effective June 1, 2006) at an annual rate of up to 0.25% of average daily net assets for each such class. DWS-SDI or an affiliate in turn has various agreements with financial services firms that provide these services and pays these fees based upon the assets of shareholder accounts the firms service. For the year ended October 31, 2006, the Shareholder Servicing Fee was as follows:
Shareholder Servicing Fee | Total Aggregated | Waived | Unpaid at October 31, 2006 | Annual Effective Rate |
Class A | $ 586,542 | 62,496 | $ 64,642 | .25% |
Class B | 90,758 | 2,322 | 14,052 | .24% |
Class C | 129,641 | — | 22,901 | .24% |
Investment Class | 63,219 | — | — | .06% |
Class R | 18,848 | — | 4,658 | .22% |
| $ 889,008 | $ 64,818 | $ 106,253 |
|
Underwriting Agreement and Contingent Deferred Sales Charge. DWS-SDI is the principal underwriter for the Fund. Underwriting commissions paid in connection with the distribution of Class A shares for the year ended October 31, 2006, aggregated $44,533.
In addition, DWS-SDI receives any contingent deferred sales charge ("CDSC") from Class B share redemptions occurring within six years of purchase and Class C share redemptions occurring within one year of purchase. There is no such charge upon redemption of any share appreciation or reinvested dividends. The CDSC is based on declining rates ranging from 4% to 1% for Class B and 1% for Class C, of the value of the shares redeemed. For the year ended October 31, 2006, the CDSC for Class B and C shares aggregated $112,649 and $15,898, respectively. A deferred sales charge of up to 1% is assessed on certain redemptions of Class A shares. For the year ended October 31, 2006, DWS-SDI received $1,117.
Cash Management QP Trust. Pursuant to an Exemptive Order issued by the SEC, the Fund may invest in the Cash Management QP Trust (the "QP Trust"), and other affiliated funds managed by the Advisor. The QP Trust seeks to provide as high a level of current income as is consistent with the preservation of capital and the maintenance of liquidity. The QP Trust does not pay its Advisor a management fee for the affiliated funds' investments in the QP Trust.
Typesetting and Filing Service Fees. Under an agreement with DeIM, DeIM is compensated for providing typesetting and certain regulatory filing services to the Fund. For the year ended October 31, 2006, the amount charged to the Fund by DeIM included in the reports to shareholders aggregated $25,120, of which $7,680 is unpaid.
Trustees' Fees and Expenses. As compensation for his or her services, each Independent Trustee receives an aggregated annual fee, plus a fee for each meeting attended (plus reimbursement for reasonable out-of-pocket expenses incurred in connection with his or her attendance at board and committee meetings) from each fund in the Fund Complex for which he or she serves. In addition, the Chairman of the Board and the Chairman of each committee of the Board receive additional compensation for their services. Payment of such fees and expenses is allocated among all such funds described above in direct proportion to their relative net assets.
D. Investing in High Yield Securities
Investing in high yield securities may involve greater risks and considerations not typically associated with investing in US Government bonds and other high quality fixed-income securities. These securities are non-investment grade securities, often referred to as "junk bonds." Economic downturns may disrupt the high yield market and impair the ability of issuers to repay principal and interest. Also, an increase in interest rates would likely have an adverse impact on the value of such obligations. Moreover, high yield securities may be less liquid due to the extent that there is no established retail secondary market and because of a decline in the value of such securities.
E. Expense Reductions
For the year ended October 31, 2006, the Advisor reimbursed the Fund $22,498 which represented a portion of the expected fee savings for the Advisor through May 31, 2006, related to the outsourcing by the Advisor of certain administrative services to an unaffiliated service provider.
In addition, the Fund has entered into an arrangement with its custodian whereby credits realized as a result of uninvested cash balances are used to reduce a portion of the custodian expenses. During the year ended October 31, 2006, custodian fees were reduced by $5,604 for custody credits earned.
F. Line of Credit
The Fund and several other affiliated funds (the "Participants") share in a $750 million revolving credit facility administered by JPMorgan Chase Bank, N.A. for temporary or emergency purposes, including the meeting of redemption requests that otherwise might require the untimely disposition of securities. The Participants are charged an annual commitment fee which is allocated, based upon net assets, among each of the Participants. Interest is calculated at the Federal Funds Rate plus 0.5 percent. The Fund may borrow up to a maximum of 10 percent of its net assets under the agreement.
G. Share Transactions
The following table summarizes share and dollar activity in the Fund:
| Year Ended October 31, 2006 | Year Ended October 31, 2005 | ||
| Shares | Dollars | Shares | Dollars |
Shares sold | ||||
Class A | 28,333,674 | $ 300,646,786 | 26,134,206 | $ 285,992,939 |
Class B | 337,039 | 3,574,285 | 854,685 | 9,348,116 |
Class C | 1,404,504 | 14,920,689 | 1,858,656 | 20,342,908 |
Investment Class | 3,687,723 | 39,086,178 | 5,428,720 | 59,376,657 |
Class R | 489,188 | 5,217,959 | 457,637 | 5,026,365 |
Class S | 388,087 | 4,119,135 | 150,957** | 1,648,646** |
Institutional Class | 19,610,390 | 207,749,129 | 18,103,307 | 198,251,170 |
|
| $ 575,314,161 |
| $ 579,986,801 |
Shares issued to shareholders in reinvestment of distributions | ||||
Class A | 2,057,708 | $ 21,845,263 | 1,147,409 | $ 12,544,388 |
Class B | 106,658 | 1,132,605 | 110,340 | 1,206,975 |
Class C | 139,040 | 1,476,802 | 124,360 | 1,360,572 |
Investment Class | 449,964 | 4,770,294 | 449,748 | 4,910,456 |
Class R | 35,329 | 376,527 | 19,197 | 210,762 |
Class S | 12,407 | 131,671 | 1,989** | 21,685** |
Institutional Class | 2,389,420 | 25,375,962 | 2,397,252 | 26,228,591 |
|
| $ 55,109,124 |
| $ 46,483,429 |
Shares redeemed | ||||
Class A | (13,626,994) | $ (144,628,557) | (7,053,628) | $ (77,148,872) |
Class B | (1,036,239) | (10,997,797) | (1,081,695) | (11,826,956) |
Class C | (1,554,736) | (16,489,030) | (1,591,968) | (17,419,143) |
Investment Class | (4,940,900) | (52,456,196) | (4,233,058) | (46,312,263) |
Class R | (194,584) | (2,069,647) | (142,714) | (1,560,327) |
Class S | (187,676) | (1,993,833) | (16,174)** | (175,679)** |
Institutional Class | (19,323,435) | (204,842,417) | (19,536,850) | (214,026,063) |
|
| (433,477,477) |
| $ (368,469,303) |
Redemption fees | $ 23,829 |
| $ 10,304 | |
In-kind redemption | ||||
Institutional Class | — | $ — | (6,979,615) | $ (76,287,189) |
|
| $ — |
| $ (76,287,189) |
Shares Converted | ||||
Class S | 10,242,882* | 108,778,512* | — | — |
Investment Class | (10,254,469)* | (108,778,512)* | — | — |
|
| $ — |
| $ — |
Net increase (decrease) | ||||
Class A | 16,764,388 | $ 177,874,182 | 20,227,987 | $ 221,392,082 |
Class B | (592,542) | (6,289,005) | (116,670) | (1,271,832) |
Class C | (11,192) | (91,430) | 391,048 | 4,284,627 |
Investment Class | (11,057,682) | (117,372,145) | 1,645,410 | 17,975,332 |
Class R | 329,933 | 3,524,919 | 334,120 | 3,677,376 |
Class S | 10,455,700 | 111,036,616 | 136,772** | 1,494,673** |
Institutional Class | 2,676,375 | 28,286,500 | (6,015,906) | (65,828,216) |
|
| $ 196,969,637 |
| $ 181,724,042 |
* On June 28, 2006, the Board of the Fund approved the conversion of the Investment Class shares into the Class S shares of the Fund. This conversion was completed on October 20, 2006, and these shares are no longer offered.
** For the period February 1, 2005 (commencement of operations of Class S shares) to October 31, 2005.
H. In-Kind Redemption
In certain circumstances, the Fund may distribute portfolio securities rather than cash as payments for a redemption of fund shares (in-kind redemption). For financial reporting purposes, the Fund recognizes a gain on in-kind redemptions to the extent the value of the distributed securities exceeds their costs; the Fund recognizes a loss if cost exceeds value. Gains and losses realized on in-kind redemptions are not recognized for tax purposes, and are reclassified from undistributed realized gain (loss) to paid-in capital. During the year ended October 31, 2005, the Fund realized $1,533,398 of net gain attributable to in-kind redemptions.
I. Regulatory Matters and Litigation
Regulatory Settlements. On December 21, 2006, Deutsche Asset Management ("DeAM") settled proceedings with the Securities and Exchange Commission ("SEC") and the New York Attorney General on behalf of Deutsche Asset Management, Inc. ("DeAM, Inc.") and Deutsche Investment Management Americas Inc. ("DeIM"), the investment advisors to many of the DWS Scudder funds, regarding allegations of improper trading at DeAM and at the legacy Scudder and Kemper organizations prior to their acquisition by DeAM in April 2002. These regulators alleged that although the prospectuses for certain funds in the regulators' view indicated that the funds did not permit market timing, DeAM, Inc. and DeIM breached their fiduciary duty to those funds in that their efforts to limit trading activity in the funds were not effective at certain times. The regulators also alleged that DeAM, Inc. and DeIM breached their fiduciary duty to certain funds by entering into certain market timing arrangements with investors. These trading arrangements originated in businesses that existed prior to the currently constituted DeAM organization, which came together as a result of various mergers of the legacy Scudder, Kemper and Deutsche fund groups, and all of the arrangements were terminated prior to the start of the regulatory investigations that began in the summer of 2003. No current DeAM employee approved these trading arrangements. Under the terms of the settlements, DeAM, Inc. and DeIM neither admit nor deny any wrongdoing.
The terms of the SEC settlement, which identified improper trading in the legacy Deutsche and Kemper mutual funds only, provide for payment of disgorgement in the amount of $17.2 million. The terms of the settlement with the New York Attorney General provide for payment of disgorgement in the amount of $102.3 million, which is inclusive of the amount payable under the SEC settlement, plus a civil penalty in the amount of $20 million. The total amount payable by DeAM, approximately $122.3 million, would be distributed to funds and/or shareholders of the affected funds in accordance with a distribution plan to be developed by a distribution consultant. The funds' investment advisors do not believe these amounts will have a material adverse financial impact on them or materially affect their ability to perform under their investment management agreements with the DWS funds. The above-described amounts are not material to Deutsche Bank, and have already been reserved.
Among the terms of the settled orders, DeAM is subject to certain undertakings regarding the conduct of its business in the future, including: formation of a Code of Ethics Oversight Committee to oversee all matters relating to issues arising under the advisors' Code of Ethics; establishment of an Internal Compliance Controls Committee having overall compliance oversight responsibility of the advisors; engagement of an Independent Compliance Consultant to conduct a comprehensive review of the advisors' supervisory compliance and other policies and procedures designed to prevent and detect breaches of fiduciary duty, breaches of the Code of Ethics and federal securities law violations by the advisors and their employees; and commencing in 2008, the advisors shall undergo a compliance review by an independent third party.
In addition, DeAM is subject to certain further undertakings relating to the governance of the mutual funds, including that: at least 75% of the members of the Boards of Trustees/Directors overseeing the DWS Funds continue to be independent of DeAM; the Chairmen of the DWS Funds' Boards of Trustees/Directors continue to be independent of DeAM; DeAM maintain existing management fee reductions for certain funds for a period of five years and not increase management fees for certain funds during this period; the funds retain a senior officer (or independent consultants) responsible for assisting in the review of fee arrangements and monitoring compliance by the funds and the investment advisors with securities laws, fiduciary duties, codes of ethics and other compliance policies, the expense of which shall be borne by DeAM; and periodic account statements, fund prospectuses and the mutual funds' web site contain additional disclosure and/or tools that assist investors in understanding the fees and costs associated with an investment in the funds and the impact of fees and expenses on fund returns.
DeAM also continues to discuss a settlement with the Illinois Secretary of State regarding market timing matters. As previously disclosed, DeAM expects a settlement with the Illinois Secretary of State to provide for investor education contributions totaling approximately $4 million and a payment in the amount of $2 million to the Securities Audit and Enforcement Fund.
On September 28, 2006, the SEC and the National Association of Securities Dealers ("NASD") announced final agreements in which Deutsche Investment Management Americas Inc. ("DeIM"), Deutsche Asset Management, Inc. ("DeAM, Inc.") and Scudder Distributors, Inc. ("SDI") (now known as DWS Scudder Distributors, Inc.) settled administrative proceedings regarding disclosure of brokerage allocation practices in connection with sales of the Scudder Funds' (now known as the DWS Scudder Funds) shares during 2001-2003. The agreements with the SEC and NASD are reflected in orders which state, among other things, that DeIM and DeAM, Inc. failed to disclose potential conflicts of interest to the fund Boards and to shareholders relating to SDI's use of certain funds' brokerage commissions to reduce revenue sharing costs to broker-dealer firms with whom it had arrangements to market and distribute Scudder Fund shares. These directed brokerage practices were discontinued in October 2003.
Under the terms of the settlements, in which DeIM, DeAM, Inc. and SDI neither admitted nor denied any of the regulators' findings, DeIM, DeAM, Inc. and SDI agreed to pay disgorgement, prejudgment interest and civil penalties in the total amount of $19.3 million. The portion of the settlements distributed to the funds was approximately $17.8 million and was paid to the funds as prescribed by the settlement orders based upon the amount of brokerage commissions from each fund used to satisfy revenue sharing agreements with broker-dealers who sold fund shares. Based on the prescribed settlement order, the Fund was not entitled to a portion of the settlement.
As part of the settlements, DeIM, DeAM, Inc. and SDI also agreed to implement certain measures and undertakings relating to revenue sharing payments including making additional disclosures in the fund Prospectuses or Statements of Additional Information, adopting or modifying relevant policies and procedures and providing regular reporting to the fund Boards.
Private Litigation Matters. The matters alleged in the regulatory settlements described above also serve as the general basis of a number of private class action lawsuits involving the DWS funds. These lawsuits name as defendants various persons, including certain DWS funds, the funds' investment advisors and their affiliates, and certain individuals, including in some cases fund Trustees/Directors, officers, and other parties. Each DWS fund's investment advisor has agreed to indemnify the applicable DWS funds in connection with these lawsuits, or other lawsuits or regulatory actions that may be filed making similar allegations.
Based on currently available information, the funds' investment advisors believe the likelihood that the pending lawsuits will have a material adverse financial impact on a DWS fund is remote and such actions are not likely to materially affect their ability to perform under their investment management agreements with the DWS funds.
Report of Independent Registered Public Accounting Firm
To the Trustees of DWS Advisor Funds and Shareholders of DWS Core Fixed Income Fund:
In our opinion, the accompanying statement of assets and liabilities, including the investment portfolio, and the related statements of operations and of changes in net assets and the financial highlights present fairly, in all material respects, the financial position of DWS Core Fixed Income Fund (formerly Scudder Fixed Income Fund) (the "Fund") at October 31, 2006, and the results of its operations, the changes in its net assets and the financial highlights for each of the periods indicated therein, in conformity with accounting principles generally accepted in the United States of America. These financial statements and financial highlights (hereafter referred to as "financial statements") are the responsibility of the Fund's management; our responsibility is to express an opinion on these financial statements based on our audits. We conducted our audits of these financial statements in accordance with the standards of the Public Company Accounting Oversight Board (United States). Those standards require that we plan and perform the audit to obtain reasonable assurance about whether the financial statements are free of material misstatement. An audit includes examining, on a test basis, evidence supporting the amounts and disclosures in the financial statements, assessing the accounting principles used and significant estimates made by management, and evaluating the overall financial statement presentation. We believe that our audits, which included confirmation of securities at October 31, 2006 by correspondence with the custodian and brokers, provide a reasonable basis for our opinion.
Boston, Massachusetts | PricewaterhouseCoopers LLP |
The Fund paid distributions of $0.01 per share from net long-term capital gains during its year ended October 31, 2006, of which 100% represents 15% rate gains.
Additional information announced by Deutsche Asset Management regarding the terms of the expected settlements referred to in the Market Timing Related Regulatory and Litigation Matters and Other Regulatory Matters in the Notes to Financial Statements will be made available at www.dws-scudder.com/regulatory_settlements, which will also disclose the terms of any final settlement agreements once they are announced.
Investment Management Agreement Approval
The Fund's Trustees approved the continuation of the Fund's current investment management agreement with DeAM, Inc. and the current sub-advisory agreement between DeAM, Inc. and Aberdeen Asset Management, Inc. ("AAMI") in September 2006. The Fund's current investment management agreement was also approved by the Fund's shareholders at a special meeting held in May 2006 as part of an overall plan to standardize and add flexibility to the management agreements for the DWS funds.
In terms of the process that the Trustees followed prior to approving the agreements, shareholders should know that:
At present time, all but one of your Fund's Trustees are independent of DeAM, Inc. and its affiliates.
The Trustees meet frequently to discuss fund matters. Each year, the Trustees dedicate part or all of several meetings to contract review matters. In connection with reviewing the Fund's investment management agreement, the Trustees also review the terms of the Fund's Rule 12b-1 plan, distribution agreement, administration agreement, transfer agency agreement and other material service agreements.
In connection with the Board's 2006 contract review, the Board formed a special committee to facilitate careful review of the funds' contractual arrangements. After reviewing the Fund's arrangements, that committee recommended that the Board vote to approve the continuation of the Fund's investment management agreement and sub-advisory agreement.
The Trustees regularly meet privately with their independent counsel to discuss contract review and other matters. In addition, the Trustees were also advised by two consultants in the course of their 2006 review of the Fund's contractual arrangements.
The sub-advisory fee paid to AAMI is paid by DeAM, Inc. out of its fee and not directly by the Fund.
DeAM, Inc. and its predecessors have managed the Fund since inception, and the Trustees believe that a long-term relationship with a capable, conscientious advisor is in the best interest of shareholders. As you may know, DeAM, Inc. is part of Deutsche Bank, a major global banking institution that is engaged in a wide range of financial services. The Trustees believe that there are significant advantages to being part of a global asset management business that offers a wide range of investing expertise and resources, including hundreds of portfolio managers and analysts with research capabilities in many countries throughout the world.
Shareholders may focus primarily on fund performance and fees, but the Fund's Trustees consider these and many other factors, including the quality and integrity of DeAM, Inc.'s and AAMI's personnel and such other issues as back-office operations, fund valuations, and compliance policies and procedures.
In determining to approve the continuation of the Fund's current investment management agreement, the Board considered all factors that it believes relevant to the interests of Fund shareholders, including:
The investment management fee schedule for the Fund, including (i) comparative information provided by Lipper regarding investment management fee rates paid to other investment advisors by similar funds and (ii) fee rates paid to DeAM, Inc. by similar funds and institutional accounts advised by DeAM, Inc. (if any). With respect to management fees paid to other investment advisors by similar funds, the Trustees noted that the fee rates paid by the Fund were higher than the median (3rd quartile) of the applicable Lipper peer group (based on Lipper data provided as of December 31, 2005). The Board gave a lesser weight to fees paid by similar institutional accounts advised by DeAM, Inc., in light of the material differences in the scope of services provided to mutual funds as compared to those provided to institutional accounts. Taking into account the foregoing, the Board concluded that the fee schedule in effect for the Fund represents reasonable compensation in light of the nature, extent and quality of the investment services being provided to the Fund.
The extent to which economies of scale would be realized as the Fund grows. In this regard, the Board noted that the Fund's investment management fee schedule includes fee breakpoints. The Board concluded that the Fund's fee schedule represents an appropriate sharing between Fund shareholders and DeAM, Inc. of such economies of scale as may exist in the management of the Fund at current asset levels.
The total operating expenses of the Fund. In this regard, the Board noted that the total (net) operating expenses of the Fund (Class A shares) are expected to be lower than the median (2nd quartile) of the applicable Lipper expense universe (based on Lipper data provided as of December 31, 2005, and in each case analyzing Class A expenses less any applicable distribution and/or service plan expenses). The Board considered the expenses of this class to be representative for purposes of evaluating other classes of shares. The Board also considered how the Fund's total (net) operating expenses compared to the total (net) operating expenses of a more customized peer group selected by Lipper (based on such factors as asset size). The Board also noted that the expense limitation agreed to by DeAM, Inc. helped to ensure that the Fund's total (net) operating expenses would be competitive relative to the applicable Lipper universe.
The investment performance of the Fund and DeAM, Inc., both absolute and relative to various benchmarks and industry peer groups. The Board noted that for the one-, three- and five-year periods ended June 30, 2006, the Fund's performance (Institutional Class shares) was in the 2nd quartile, 1st quartile and 1st quartile, respectively, of the applicable Lipper universe. The Board also observed that the Fund has outperformed its benchmark in the three- and five-year periods ended June 30, 2006 and has underperformed its benchmark in the one-year periods ended June 30, 2006. The Board recognized that DeAM, Inc. has made significant changes in its investment personnel and processes in recent years in an effort to improve long-term performance.
The nature, extent and quality of the advisory services provided by DeAM, Inc. and AAMI. The Board considered extensive information regarding DeAM, Inc., including DeAM, Inc.'s personnel (including particularly those personnel with responsibilities for providing services to the Fund), resources, policies and investment processes. The Board also considered the terms of the current investment management agreement and subadvisory agreement, including the scope of services provided under the agreements. In this regard, the Board concluded that the quality and range of services provided by DeAM, Inc. and AAMI have benefited and should continue to benefit the Fund and its shareholders.
The costs of the services to, and profits realized by, DeAM, Inc. and its affiliates from their relationships with the Fund. The Board reviewed information concerning the costs incurred and profits realized by DeAM, Inc. during 2005 from providing investment management services to the Fund (and, separately, to the entire DWS Scudder fund complex), and reviewed with DeAM, Inc. the cost allocation methodology used to determine DeAM, Inc.'s profitability. In analyzing DeAM, Inc.'s costs and profits, the Board also reviewed the fees paid to and services provided by DeAM, Inc. and its affiliates with respect to administrative services, transfer agent services, shareholder servicing and distribution (including fees paid pursuant to 12b-1 plans), as well as information regarding other possible benefits derived by DeAM, Inc. and its affiliates as a result of DeAM, Inc.'s relationship with the Fund. As part of this review, the Board considered information provided by an independent accounting firm engaged to review DeAM, Inc.'s cost allocation methodology and calculations. The Board concluded that the Fund's investment management fee schedule represented reasonable compensation in light of the costs incurred by DeAM, Inc. and its affiliates in providing services to the Fund. The Board also reviewed information regarding the profitability of certain similar investment management firms. The Board noted that while information regarding the profitability of such firms is limited (and in some cases is not necessarily prepared on a comparable basis), Deutsche Asset Management's overall profitability with respect to the DWS Scudder fund complex (after taking into account distribution and other services provided to the funds by DeAM, Inc. and its affiliates) was lower than the overall profitability levels of many comparable firms for which such data was available.
The practices of DeAM, Inc. and AAMI regarding the selection and compensation of brokers and dealers executing portfolio transactions for the Fund. The Board considered that a portion of the Fund's brokerage may be allocated to affiliates of DeAM, Inc. or AAMI, subject to compliance with applicable SEC rules. The Board also reviewed and approved, subject to ongoing review by the Board, a plan whereby a limited portion of the Fund's brokerage may in the future be allocated to brokers who acquire (and provide to DeAM, Inc. and its affiliates) research services from third parties that are generally useful to DeAM, Inc. and its affiliates in managing client portfolios. The Board indicated that it would continue to monitor the allocation of the Fund's brokerage to ensure that the principle of "best price and execution" remains paramount in the portfolio trading process.
DeAM, Inc.'s commitment to and record of compliance, including its written compliance policies and procedures. In this regard, the Board considered DeAM, Inc.'s commitment to indemnify the Fund against any costs and liabilities related to lawsuits or regulatory actions making allegations regarding market timing, revenue sharing, fund valuation or other subjects arising from or relating to pending regulatory inquiries. The Board also considered the significant attention and resources dedicated by DeAM, Inc. to documenting and enhancing its compliance processes in recent years. The Board noted in particular (i) the experience and seniority of DeAM, Inc.'s chief compliance officer, who reports to the Board; (ii) the large number of compliance personnel who report to DeAM, Inc.'s chief compliance officer; and (iii) the substantial commitment of resources by Deutsche Asset Management to compliance matters.
Deutsche Bank's commitment to its US mutual fund business. The Board considered recent and ongoing efforts by Deutsche Bank to restructure its US mutual fund business to improve efficiency and competitiveness and to reduce compliance and operational risk. The Board considered assurances received from Deutsche Bank that it would commit the resources necessary to maintain high-quality services to the Fund and its shareholders while various organizational initiatives are being implemented. The Board also considered Deutsche Bank's strategic plans for its US mutual fund business, the potential benefits to Fund shareholders and Deutsche Bank's management of the DWS fund group, one of Europe's most successful fund groups.
Based on all of the foregoing, the Board determined to continue the Fund's current investment management agreement and sub-advisory agreement, and concluded that the continuation of such agreements was in the best interests of the Fund's shareholders.
In reaching this conclusion the Board did not give particular weight to any single factor identified above. The Board considered these factors over the course of numerous meetings, many of which were in executive session with only the Independent Trustees and their counsel present. It is possible that individual Trustees may have weighed these factors differently in reaching their individual decisions to approve the continuation of the current agreements.
The following table presents certain information regarding the Board Members and Officers of the Trust as of October 31, 2006. Each Board Member's year of birth is set forth in parentheses after his or her name. Unless otherwise noted, (i) each Board Member has engaged in the principal occupation(s) noted in the table for at least the most recent five years, although not necessarily in the same capacity, and (ii) the address of each Independent Board Member is c/o Dawn-Marie Driscoll, PO Box 100176, Cape Coral, FL 33904. The term of office for each Board Member is until the election and qualification of a successor, or until such Board Member sooner dies, resigns, is removed or as otherwise provided in the governing documents of the fund. Because the fund does not hold an annual meeting of shareholders, each Board Member will hold office for an indeterminate period. The Board Members may also serve in similar capacities with other funds in the fund complex.
Independent Board Members | ||
Name, Year of Birth, Position with the Fund and Length of Time Served | Business Experience and Directorships During the Past Five Years | Number of Funds in Fund Complex Overseen |
Dawn-Marie Driscoll (1946) Chairman since 2006 Board Member since 2006 | President, Driscoll Associates (consulting firm); Executive Fellow, Center for Business Ethics, Bentley College; formerly, Partner, Palmer & Dodge (1988-1990); Vice President of Corporate Affairs and General Counsel, Filene's (1978-1988). Directorships: Advisory Board, Center for Business Ethics, Bentley College; Trustee, Southwest Florida Community Foundation (charitable organization). Former Directorships: Investment Company Institute (audit, executive, nominating committees) and Independent Directors Council (governance, executive committees) | 88 |
Henry P. Becton, Jr. (1943) Board Member since 2006 | President, WGBH Educational Foundation. Directorships: Association of Public Television Stations; Becton Dickinson and Company1 (medical technology company); Belo Corporation1 (media company); Boston Museum of Science; Public Radio International. Former Directorships: American Public Television; Concord Academy; New England Aquarium; Mass. Corporation for Educational Telecommunications; Committee for Economic Development; Public Broadcasting Service | 86 |
Keith R. Fox (1954) Board Member since 2006 | Managing General Partner, Exeter Capital Partners (a series of private equity funds). Directorships: Progressive Holding Corporation (kitchen goods importer and distributor); Natural History, Inc. (magazine publisher); Box Top Media Inc. (advertising). Former Directorships: Cloverleaf Transportation Inc. (trucking) | 88 |
Kenneth C. Froewiss (1945) Board Member since 2006 | Clinical Professor of Finance, NYU Stern School of Business (1997-present); Member, Finance Committee, Association for Asian Studies (2002-present); Director, Mitsui Sumitomo Insurance Group (US) (2004-present); prior thereto, Managing Director, J.P. Morgan (investment banking firm) (until 1996) | 88 |
Martin J. Gruber (1937) Board Member since 1999 | Nomura Professor of Finance, Leonard N. Stern School of Business, New York University (since September 1965); Director, Japan Equity Fund, Inc. (since January 1992), Thai Capital Fund, Inc. (since January 2000), Singapore Fund, Inc. (since January 2000). Formerly, Trustee, TIAA (pension funds) (January 1996-January 2000); Trustee, CREF and CREF Mutual Funds (January 2000-March 2005); Chairman, CREF and CREF Mutual Funds (February 2004-March 2005); and Director, S.G. Cowen Mutual Funds (January 1985-January 2001) | 88 |
Richard J. Herring (1946) Board Member since 1999 | Jacob Safra Professor of International Banking and Professor, Finance Department, The Wharton School, University of Pennsylvania (since July 1972); Director, Lauder Institute of International Management Studies (since July 2000); Co-Director, Wharton Financial Institutions Center (since July 2000). Formerly, Vice Dean and Director, Wharton Undergraduate Division (July 1995-June 2000) | 88 |
Graham E. Jones (1933) Board Member since 2002 | Senior Vice President, BGK Realty, Inc. (commercial real estate) (since 1995). Formerly, Trustee of various investment companies managed by Sun Capital Advisors, Inc. (1998-2005), Morgan Stanley Asset Management (1985-2001) and Weiss, Peck and Greer (1985-2005) | 88 |
Rebecca W. Rimel (1951) Board Member since 2002 | President and Chief Executive Officer, The Pew Charitable Trusts (charitable foundation) (1994 to present); Trustee, Thomas Jefferson Foundation (charitable organization) (1994 to present); Trustee, Executive Committee, Philadelphia Chamber of Commerce (2001 to present). Formerly, Executive Vice President, The Glenmede Trust Company (investment trust and wealth management) (1983 to 2004); Board Member, Investor Education (charitable organization) (2004-2005) | 88 |
Philip Saunders, Jr. (1935) Board Member since 21986 | Principal, Philip Saunders Associates (economic and financial consulting) (since November 1988). Formerly, Director, Financial Industry Consulting, Wolf & Company (consulting) (1987-1988); President, John Hancock Home Mortgage Corporation (1984-1986); Senior Vice President of Treasury and Financial Services, John Hancock Mutual Life Insurance Company, Inc. (1982-1986) | 88 |
William N. Searcy, Jr. (1946) Board Member since 2002 | Private investor since October 2003; Trustee of seven open-end mutual funds managed by Sun Capital Advisers, Inc. (since October 1998). Formerly, Pension & Savings Trust Officer, Sprint Corporation1 (telecommunications) (November 1989-September 2003) | 88 |
Jean Gleason Stromberg (1943) Board Member since 2006 | Retired. Formerly, Consultant (1997-2001); Director, US Government Accountability Office (1996-1997); Partner, Fulbright & Jaworski, L.L.P. (law firm) (1978-1996). Directorships: The William and Flora Hewlett Foundation; Service Source, Inc. Former Directorships: Mutual Fund Directors Forum (2002-2004), American Bar Retirement Association (funding vehicle for retirement plans) (1987-1990 and 1994-1996) | 88 |
Carl W. Vogt (1936) Board Member since 2006 | Retired Senior Partner, Fulbright & Jaworski, L.L.P. (law firm); formerly, President (interim) of Williams College (1999-2000); formerly, President of certain funds in the Deutsche Asset Management family of funds (formerly, Flag Investors family of funds) (registered investment companies) (1999-2000). Directorships: Yellow Corporation (trucking); American Science & Engineering (x-ray detection equipment). Former Directorships: ISI Family of Funds (registered investment companies, four funds overseen); National Railroad Passenger Corporation (Amtrak). Formerly, Chairman and Member, National Transportation Safety Board | 86 |
Interested Board Member | ||
Name, Year of Birth, Position with the Fund and Length of Time Served | Business Experience and Directorships During the Past Five Years | Number of Funds in Fund Complex Overseen |
Axel Schwarzer2 (1958) Board Member since 2006 | Managing Director4, Deutsche Asset Management; Head of Deutsche Asset Management Americas; CEO of DWS Scudder; formerly, board member of DWS Investments, Germany (1999-2005); formerly, Head of Sales and Product Management for the Retail and Private Banking Division of Deutsche Bank in Germany (1997-1999); formerly, various strategic and operational positions for Deutsche Bank Germany Retail and Private Banking Division in the field of investment funds, tax driven instruments and asset management for corporates (1989-1996) | 86 |
Officers3 | |
Name, Year of Birth, Position with the Fund and Length of Time Served | Principal Occupation(s) During Past 5 Years and Other Directorships Held |
Michael G. Clark5 (1965) President, 2006-present | Managing Director4, Deutsche Asset Management (2006-present); President of DWS family of funds; formerly, Director of Fund Board Relations (2004-2006) and Director of Product Development (2000-2004), Merrill Lynch Investment Managers; Senior Vice President Operations, Merrill Lynch Asset Management (1999-2000) |
John Millette6 (1962) Vice President and Secretary, 2003-present | Director4, Deutsche Asset Management |
Paul H. Schubert5 (1963) Chief Financial Officer, 2004-present Treasurer, 2005-present | Managing Director4, Deutsche Asset Management (since July 2004); formerly, Executive Director, Head of Mutual Fund Services and Treasurer for UBS Family of Funds (1998-2004); Vice President and Director of Mutual Fund Finance at UBS Global Asset Management (1994-1998) |
Patricia DeFilippis5 (1963) Assistant Secretary, 2005-present | Vice President, Deutsche Asset Management (since June 2005); formerly, Counsel, New York Life Investment Management LLC (2003-2005); legal associate, Lord, Abbett & Co. LLC (1998-2003) |
Elisa D. Metzger5 (1962) Assistant Secretary 2005-present | Director4, Deutsche Asset Management (since September 2005); formerly, Counsel, Morrison and Foerster LLP (1999-2005) |
Caroline Pearson6 (1962) Assistant Secretary, 2002-present | Managing Director4, Deutsche Asset Management |
Scott M. McHugh6 (1971) Assistant Treasurer, 2005-present | Director4, Deutsche Asset Management |
Kathleen Sullivan D'Eramo6 (1957) Assistant Treasurer, 2003-present | Director4, Deutsche Asset Management |
John Robbins5 (1966) Anti-Money Laundering Compliance Officer, 2005-present | Managing Director4, Deutsche Asset Management (since 2005); formerly, Chief Compliance Officer and Anti-Money Laundering Compliance Officer for GE Asset Management (1999-2005) |
Robert Kloby5 (1962) Chief Compliance Officer, 2006-present | Managing Director4, Deutsche Asset Management (2004-present); formerly, Chief Compliance Officer/Chief Risk Officer, Robeco USA (2000-2004); Vice President, The Prudential Insurance Company of America (1988-2000); E.F. Hutton and Company (1984-1988) |
A. Thomas Smith5 (1956) Chief Legal Officer, 2005-present | Managing Director4, Deutsche Asset Management (2004-present); formerly, General Counsel, Morgan Stanley and Van Kampen and Investments (1999-2004); Vice President and Associate General Counsel, New York Life Insurance Company (1994-1999); senior attorney, The Dreyfus Corporation (1991-1993); senior attorney, Willkie Farr & Gallagher (1989-1991); staff attorney, US Securities & Exchange Commission and the Illinois Securities Department (1986-1989) |
1 A publicly held company with securities registered pursuant to Section 12 of the Securities Exchange Act of 1934.
2 The mailing address of Axel Schwarzer is c/o Deutsche Investment Management Americas Inc., 345 Park Avenue, New York, New York 10154. Mr. Schwarzer is an interested Board Member by virtue of his positions with Deutsche Asset Management.
3 As a result of their respective positions held with the Advisor, these individuals are considered "interested persons" of the Advisor within the meaning of the 1940 Act. Interested persons receive no compensation from the funds.
4 Executive title, not a board directorship.
5 Address: 345 Park Avenue, New York, New York 10154.
6 Address: Two International Place, Boston, MA 02110.
The fund's Statement of Additional Information ("SAI") includes additional information about the Board Members. The SAI is available, without charge, upon request. If you would like to request a copy of the SAI, you may do so by calling the following toll-free number: 1-800-621-1048.
For shareholders of Classes A, B, C, Investment and Institutional Classes | |
Automated Information Line | (800) 621-1048 Personalized account information, information on other DWS funds and services via touchtone telephone and for Classes A, B, and C only, the ability to exchange or redeem shares. |
Web Site | www.dws-scudder.com View your account transactions and balances, trade shares, monitor your asset allocation, and change your address, 24 hours a day. Obtain prospectuses and applications, blank forms, interactive worksheets, news about DWS funds, subscription to fund updates by e-mail, retirement planning information, and more. |
For More Information | (800) 621-1048 To speak with a DWS Scudder service representative. |
Written Correspondence | DWS Scudder PO Box 219151 |
Proxy Voting | A description of the fund's policies and procedures for voting proxies for portfolio securities and information about how the fund voted proxies related to its portfolio securities during the 12-month period ended June 30 is available on our Web site — www.dws-scudder.com (click on "proxy voting"at the bottom of the page) — or on the SEC's Web site — www.sec.gov. To obtain a written copy of the fund's policies and procedures without charge, upon request, call us toll free at 1-800-621-1048. |
Principal Underwriter | If you have questions, comments or complaints, contact: DWS Scudder Distributors, Inc. 222 South Riverside Plaza (800) 621-1148 |
| Class A | Class B | Class C | Investment Class | InstitutionalClass |
Nasdaq Symbol | SFXAX | SFXBX | SFXCX | MFISX | MFINX |
CUSIP Number | 23339E 889 | 23339E 871 | 23339E 863 | 23339E 830 | 23339E 848 |
Fund Number | 493 | 693 | 793 | 816 | 593 |
For shareholders of Class R | |
Automated Information Line | DWS Scudder Flex Plan Access (800) 532-8411 24-hour access to your retirement plan account. |
Web Site | www.dws-scudder.com Click "Retirement Plans" to reallocate assets, process transactions and review your funds through our secure online account access. Obtain prospectuses and applications, blank forms, interactive worksheets, news about DWS funds, subscription to fund updates by e-mail, retirement planning information, and more. |
For More Information | (800) 543-5776 To speak with a service representative. |
Written Correspondence | DWS Scudder Investments Service Company 222 South Riverside Plaza |
Proxy Voting | A description of the fund's policies and procedures for voting proxies for portfolio securities and information about how the fund voted proxies related to its portfolio securities during the 12-month period ended June 30 is available on our Web site — www.dws-scudder.com (click on "proxy voting"at the bottom of the page) — or on the SEC's Web site — www.sec.gov. To obtain a written copy of the fund's policies and procedures without charge, upon request, call us toll free at 1-800-621-1048. |
Principal Underwriter | If you have questions, comments or complaints, contact: DWS Scudder Distributors, Inc. 222 South Riverside Plaza (800) 621-1148 |
Nasdaq Symbol | SFXRF |
CUSIP Number | 23339E 855 |
Fund Number | 1504 |
For shareholders of Class S | |
Automated Information Line | (800) 728-3337 Personalized account information, the ability to exchange or redeem shares, and information on other DWS funds and services via touchtone telephone. |
Web Site | www.dws-scudder.com |
| View your account transactions and balances, trade shares, monitor your asset allocation, and change your address, 24 hours a day. Obtain prospectuses and applications, blank forms, interactive worksheets, news about DWS funds, subscription to fund updates by e-mail, retirement planning information, and more. |
For More Information | (800) 728-3337 To speak with a DWS Scudder service representative. |
Written Correspondence | DWS Scudder PO Box 219151 |
Proxy Voting | A description of the fund's policies and procedures for voting proxies for portfolio securities and information about how the fund voted proxies related to its portfolio securities during the 12-month period ended June 30 is available on our Web site — www.dws-scudder.com (click on "proxy voting"at the bottom of the page) — or on the SEC's Web site — www.sec.gov. To obtain a written copy of the fund's policies and procedures without charge, upon request, call us toll free at 1-800-621-1048. |
Principal Underwriter | If you have questions, comments or complaints, contact: DWS Scudder Distributors, Inc. 222 South Riverside Plaza (800) 621-1148 |
| Class S |
Nasdaq Symbol | SFXSX |
Fund Number | 394 |
Notes
Notes
Notes
Notes

| ITEM 2. | CODE OF ETHICS. |
As of the end of the period, October 31, 2006, DWS Core Fixed Income Fund has a code of ethics, as defined in Item 2 of Form N-CSR, that applies to its Principal Executive Officer and Principal Financial Officer.
There have been no amendments to, or waivers from, a provision of the code of ethics during the period covered by this report that would require disclosure under Item 2.
A copy of the code of ethics is filed as an exhibit to this Form N-CSR.
| ITEM 3. | AUDIT COMMITTEE FINANCIAL EXPERT. |
The Funds’ audit committee is comprised solely of trustees who are “independent” (as such term has been defined by the Securities and Exchange Commission (“SEC”) in regulations implementing Section 407 of the Sarbanes-Oxley Act (the “Regulations”)). The Funds’ Board of Trustees has determined that there are several “audit committee financial experts” serving on the Funds’ audit committee. The Board has determined that Keith R Fox, the chair of the Funds’ audit committee, qualifies as an “audit committee financial expert” (as such term has been defined by the Regulations) based on its review of Mr. Fox’s pertinent experience and education. The SEC has stated that the designation or identification of a person as an audit committee financial expert pursuant to this Item 3 of Form N-CSR does not impose on such person any duties, obligations or liability that are greater than the duties, obligations and liability imposed on such person as a member of the audit committee and board of directors in the absence of such designation or identification.
| ITEM 4. | PRINCIPAL ACCOUNTANT FEES AND SERVICES. |
DWS CORE FIXED INCOME FUND
FORM N-CSR DISCLOSURE RE: AUDIT FEES
The following table shows the amount of fees that PricewaterhouseCoopers, LLP (“PWC”), the Fund’s independent registered public accounting firm, billed to the Fund during the Fund’s last two fiscal years. The Audit Committee approved in advance all audit services and non-audit services that PWC provided to the Fund.
The Audit Committee has delegated certain pre-approval responsibilities to its Chairman (or, in his absence, any other member of the Audit Committee).
Services that the Fund’s Independent Registered Public Accounting Firm Billed to the Fund
Fiscal Year | Audit Fees Billed to Fund | Audit-Related | Tax Fees Billed to Fund | All |
2006 | $69,000 | $128 | $0 | $0 |
2005 | $48,650 | $225 | $0 | $0 |
The above “Audit- Related Fees” were billed for agreed upon procedures performed.
Services that the Fund’s Independent Registered Public Accounting Firm Billed to the Adviser and Affiliated Fund Service Providers
The following table shows the amount of fees billed by PWC to Deutsche Investment Management Americas, Inc. (“DeIM” or the “Adviser”), and any entity controlling, controlled by or under common control with DeIM (“Control Affiliate”) that provides ongoing services to the Fund (“Affiliated Fund Service Provider”), for engagements directly related to the Fund’s operations and financial reporting, during the Fund’s last two fiscal years.
Fiscal Year | Audit-Related | Tax Fees Billed to Adviser and Affiliated Fund Service Providers | All |
2006 | $155,500 | $11,930 | $0 |
2005 | $309,400 | $197,605 | $0 |
The “Audit-Related Fees” were billed for services in connection with the agreed-upon procedures related to fund mergers and additional costs related to annual audits and the above “Tax Fees” were billed in connection with tax advice and agreed-upon procedures.
Non-Audit Services
The following table shows the amount of fees that PWC billed during the Fund’s last two fiscal years for non-audit services. The Audit Committee pre-approved all non-audit services that PWC provided to the Adviser and any Affiliated Fund Service Provider that related directly to the Fund’s operations and financial reporting. The Audit Committee requested and received information from PWC about any non-audit services that PWC rendered during the Fund’s last fiscal year to the Adviser and any Affiliated Fund Service Provider. The Committee considered this information in evaluating PWC’s independence.
Fiscal Year | Total (A) | Total Non-Audit Fees billed to Adviser and Affiliated Fund Service Providers (engagements related directly to the operations and financial reporting of the Fund) (B) | Total Non-Audit Fees billed to Adviser and Affiliated Fund Service Providers (all other engagements) (C) | Total of (A), (B) |
2006 | $0 | $11,930 | $0 | $11,930 |
2005 | $0 | $197,605 | $104,635 | $302,240 |
All other engagement fees were billed for services in connection with training seminars and risk management initiatives for DeIM and other related entities that provide support for the operations of the fund.
| ITEM 5. | AUDIT COMMITTEE OF LISTED REGISTRANTS |
| Not Applicable |
| ITEM 6. | SCHEDULE OF INVESTMENTS |
| Not Applicable |
ITEM 7. | DISCLOSURE OF PROXY VOTING POLICIES AND PROCEDURES FOR CLOSED-END MANAGEMENT INVESTMENT COMPANIES. |
| Not Applicable |
ITEM 8. | PORTFOLIO MANAGERS OF CLOSED-END MANAGEMENT INVESTMENT COMPANIES. |
| Not applicable. |
ITEM 9. | PURCHASES OF EQUITY SECURITIES BY CLOSED-END MANAGEMENT INVESTMENT COMPANY AND AFFILIATED PURCHASERS |
| Not Applicable. |
| ITEM 10. | SUBMISSION OF MATTERS TO A VOTE OF SECURITY HOLDERS. |
The Committee on Independent Trustees/Directors selects and nominates Independent Trustees/Directors. Fund shareholders may submit nominees that will be considered by the committee when a Board vacancy occurs. Submissions should be mailed to: c/o Dawn-Marie Driscoll, PO Box 100176, Cape Coral, FL 33910.
| ITEM 11. | CONTROLS AND PROCEDURES. |
(a) | The Chief Executive and Financial Officers concluded that the Registrant’s Disclosure Controls and Procedures are effective based on the evaluation of the Disclosure Controls and Procedures as of a date within 90 days of the filing date of this report. |
(b) | There have been no changes in the registrant’s internal control over financial reporting that occurred during the registrant’s last half-year (the registrant’s second fiscal half-year in the case of the annual report) that has materially affected, or is reasonably likely to materially affect, the registrant’s internal controls over financial reporting. |
| ITEM 12. | EXHIBITS. |
(a)(1) | Code of Ethics pursuant to Item 2 of Form N-CSR is filed and attached hereto as EX-99.CODE ETH. |
(a)(2) | Certification pursuant to Rule 30a-2(a) under the Investment Company Act of 1940 (17 CFR 270.30a-2(a)) is filed and attached hereto as Exhibit 99.CERT. |
(b) | Certification pursuant to Rule 30a-2(b) under the Investment Company Act of 1940 (17 CFR 270.30a-2(b)) is furnished and attached hereto as Exhibit 99.906CERT. |
Form N-CSR Item F
SIGNATURES
Pursuant to the requirements of the Securities Exchange Act of 1934 and the Investment Company Act of 1940, the registrant has duly caused this report to be signed on its behalf by the undersigned, thereunto duly authorized.
Registrant: | DWS Core Fixed Income Fund, a series of DWS Advisor Funds |
By: | /s/Michael G. Clark |
| Michael G. Clark |
President
Date: | December 29, 2006 |
Pursuant to the requirements of the Securities Exchange Act of 1934 and the Investment Company Act of 1940, this report has been signed below by the following persons on behalf of the registrant and in the capacities and on the dates indicated.
Registrant: | DWS Core Fixed Income Fund, a series of DWS Advisor Funds |
By: | /s/Michael G. Clark |
| Michael G. Clark |
President
Date: | December 29, 2006 |
By: | /s/Paul Schubert |
| Paul Schubert |
Chief Financial Officer and Treasurer
Date: | December 29, 2006 |