UNITED STATES
SECURITIES AND EXCHANGE COMMISSION
WASHINGTON, D. C. 20549
FORM N-CSRS
Investment Company Act file number 811-04760
DWS Advisor Funds
(Exact Name of Registrant as Specified in Charter)
One South Street
Baltimore, MD 21202
(Address of principal executive offices) (Zip code)
Registrant’s Telephone Number, including Area Code: (212) 454-7190
Paul Schubert
345 Park Avenue
New York, NY 10154
(Name and Address of Agent for Service)
Date of fiscal year end: | 10/31 |
Date of reporting period: | 4/30/07 |
ITEM 1. REPORT TO STOCKHOLDERS
APRIL 30, 2007
Semiannual Report
to Shareholders
DWS International Select Equity Fund
 |
Contents
Click here Performance Summary Click here Information About Your Fund's Expenses Click here Portfolio Management Review Click here Portfolio Summary Click here Investment Portfolio Click here Financial Statements Click here Financial Highlights Click here Notes to Financial Statements Click here Investment Management Agreement Approval Click here Account Management Resources Click here Privacy Statement |
This report must be preceded or accompanied by a prospectus. To obtain a prospectus for any of our funds, refer to the Account Management Resources information provided in the back of this booklet. We advise you to consider each fund's objectives, risks, charges and expenses carefully before investing. The prospectus contains this and other important information about the fund. Please read the prospectus carefully before you invest.
Investments in mutual funds involve risk. Some funds have more risk than others. Investing in foreign securities presents certain unique risks not associated with domestic investments, such as currency fluctuation, political and economic changes and market risks. Additionally, the fund may focus its investments in certain geographical regions, thereby increasing its vulnerability to developments in that region. All of these factors may result in greater share price volatility. Please read this fund's prospectus for specific details regarding its investments and risk profile.
DWS Scudder is part of Deutsche Asset Management, which is the marketing name in the US for the asset management activities of Deutsche Bank AG, Deutsche Bank Trust Company Americas, Deutsche Investment Management Americas Inc. and DWS Trust Company.
NOT FDIC/NCUA INSURED NO BANK GUARANTEE MAY LOSE VALUE NOT A DEPOSIT NOT INSURED BY ANY FEDERAL GOVERNMENT AGENCY
Performance Summary April 30, 2007
Classes A, B, C, R and Institutional
All performance shown is historical, assumes reinvestment of all dividend and capital gain distributions, and does not guarantee future results. Investment return and principal value fluctuate with changing market conditions so that, when redeemed, shares may be worth more or less than their original cost. Current performance may be lower or higher than the performance quoted. Please visit www.dws-scudder.com for the Fund's most recent month-end performance.
The maximum sales charge for Class A shares is 5.75%. For Class B shares, the maximum contingent deferred sales charge (CDSC) is 4% within the first year after purchase, declining to 0% after six years. Class C shares have no adjustment for front-end sales charges but redemptions within one year of purchase may be subject to a CDSC of 1%. Unadjusted returns do not reflect sales charges and would have been lower if they had. Class R and Institutional Class shares are not subject to sales charges.
The total annual fund operating expense ratios, gross of any fee waivers or expense reimbursements, as stated in the fee table of the prospectus dated March 1, 2007 are 1.50%, 2.38%, 2.22%, 1.84% and 1.07% for Class A, Class B, Class C, Class R and Institutional Class shares, respectively. Please see the Information About Your Fund's Expenses, the Financial Highlights and Notes to the Financial Statements (Note C, Related Parties) sections of this report for gross and net expense related disclosure for the period ended April 30, 2007.
To discourage short-term trading, the Fund imposes a 2% redemption fee on shareholders redeeming shares held less than 15 days, which has the effect of lowering total return.
Returns and rankings during all periods shown reflect a fee waiver and/or expense reimbursement. Without this waiver/reimbursement, returns and rankings would have been lower.
Performance figures do not reflect the deduction of taxes that a shareholder would pay on fund distributions or the redemption of fund shares. Returns and rankings may differ by share class.
On July 10, 2006, the fund was reorganized from DWS International Select Equity Fund, a series of DWS Investments Trust (the "Predecessor Fund"), into DWS International Select Equity Fund, a newly created series of the DWS Advisor Funds. This change in the legal entity had no economic impact relative to accounting or tax. Performance shown prior to July 10, 2006 is derived from the historical performance of the Predecessor Fund.
Returns shown for Class A, B and C shares prior to their inception on February 28, 2001 and for Class R shares prior to inception on July 1, 2003 are derived from the historical performance of Institutional Class shares of DWS International Select Equity Fund during such periods and have been adjusted to reflect the different total annual operating expenses of each specific class. Any difference in expenses will affect performance.
Average Annual Total Returns (Unadjusted for Sales Charge) as of 4/30/07 | |||||
DWS International Select Equity Fund | 6-Month‡ | 1-Year | 3-Year | 5-Year | 10-Year |
Class A | 16.72% | 15.75% | 20.75% | 14.45% | 13.03% |
Class B | 16.28% | 14.85% | 19.86% | 13.58% | 12.11% |
Class C | 16.32% | 14.89% | 19.84% | 13.55% | 12.11% |
Class R | 16.46% | 15.38% | 20.44% | 14.14% | 12.71% |
Institutional Class | 16.97% | 16.25% | 21.12% | 14.74% | 13.29% |
| MSCI EAFE Index+ | 15.46% | 19.81% | 22.51% | 16.64% | 8.72% |
Sources: Lipper Inc. and Deutsche Investment Management Americas Inc.
‡ Total returns shown for periods less than one year are not annualized.Net Asset Value and Distribution Information | |||||
| Class A | Class B | Class C | Class R | Institutional Class |
Net Asset Value: 4/30/07 | $ 12.88 | $ 12.55 | $ 12.55 | $ 12.57 | $ 12.62 |
| 10/31/06 | $ 13.15 | $ 12.80 | $ 12.79 | $ 12.86 | $ 12.92 |
Distribution Information: Six Months as of 4/30/07:Income Dividends | $ .44 | $ .33 | $ .32 | $ .40 | $ .47 |
Capital Gain Distributions | $ 1.79 | $ 1.79 | $ 1.79 | $ 1.79 | $ 1.79 |
Institutional Class Lipper Rankings — International Large-Cap Core Funds Category as of 4/30/07 | ||||
Period | Rank |
| Number of Funds Tracked | Percentile Ranking (%) |
| 1-Year | 108 | of | 208 | 52 |
| 3-Year | 79 | of | 195 | 41 |
| 5-Year | 44 | of | 175 | 25 |
| 10-Year | 1 | of | 85 | 2 |
Source: Lipper Inc. Rankings are historical and do not guarantee future results. Rankings are based on total return with distributions reinvested. Rankings are for Institutional Class shares; other share classes may vary.
Growth of an Assumed $10,000 Investment (Adjusted for Maximum Sales Charge) |
[] DWS International Select Equity Fund — Class A [] MSCI EAFE Index+ |
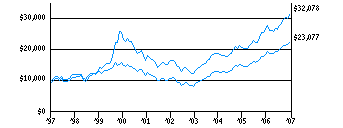 |
Yearly periods ended April 30 |
The Fund's growth of an assumed $10,000 investment is adjusted for the maximum sales charge of 5.75%. This results in a net initial investment of $9,425.
Comparative Results (Adjusted for Maximum Sales Charge) as of 4/30/07 | |||||
DWS International Select Equity Fund | 1-Year | 3-Year | 5-Year | 10-Year | |
Class A | Growth of $10,000 | $10,910 | $16,594 | $18,511 | $32,078 |
| Average annual total return | 9.10% | 18.39% | 13.11% | 12.36% | |
Class B | Growth of $10,000 | $11,194 | $17,018 | $18,803 | $31,369 |
| Average annual total return | 11.94% | 19.39% | 13.46% | 12.11% | |
Class C | Growth of $10,000 | $11,489 | $17,211 | $18,874 | $31,357 |
| Average annual total return | 14.89% | 19.84% | 13.55% | 12.11% | |
Class R | Growth of $10,000 | $11,538 | $17,473 | $19,370 | $33,090 |
| Average annual total return | 15.38% | 20.44% | 14.14% | 12.71% | |
| MSCI EAFE Index+ | Growth of $10,000 | $11,981 | $18,385 | $21,588 | $23,077 |
| Average annual total return | 19.81% | 22.51% | 16.64% | 8.72% | |
The growth of $10,000 is cumulative.
Growth of an Assumed $1,000,000 Investment |
[] DWS International Select Equity Fund — Institutional Class [] MSCI EAFE Index+ |
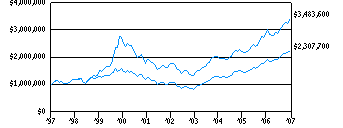 |
Yearly periods ended April 30 |
Comparative Results as of 4/30/07 | |||||
DWS International Select Equity Fund | 1-Year | 3-Year | 5-Year | 10-Year | |
Institutional Class | Growth of $1,000,000 | $1,162,500 | $1,776,700 | $1,988,800 | $3,483,600 |
| Average annual total return | 16.25% | 21.12% | 14.74% | 13.29% | |
| MSCI EAFE Index+ | Growth of $1,000,000 | $1,198,100 | $1,838,500 | $2,158,800 | $2,307,700 |
| Average annual total return | 19.81% | 22.51% | 16.64% | 8.72% | |
The growth of $1,000,000 is cumulative.
The minimum initial investment for Institutional Class shares is $1,000,000.
+ The Morgan Stanley Capital International (MSCI) EAFE Index is an unmanaged, free float-adjusted, market capitalization index that tracks international stock performance in the 21 developed markets of Europe, Australasia and the Far East. The index is calculated using closing local market prices and translates into US dollars using the London close foreign exchange rates. Index returns assume reinvestment of dividends and, unlike Fund returns, do not reflect any fees or expenses. It is not possible to invest directly into an index.Class S
Class S shares are gennerally not available to new investors except under certain circumstances. (Please see the Fund's Statement of Additional Information.)
All performance shown is historical, assumes reinvestment of all dividend and capital gain distributions, and does not guarantee future results. Investment return and principal value fluctuate with changing market conditions so that, when redeemed, shares may be worth more or less than their original cost. Current performance may be lower or higher than the performance quoted. Please visit www.dws-scudder.com for the Fund's most recent month-end performance.
The total annual fund operating expense ratio, gross of any fee waivers or expense reimbursements, as stated in the fee table of the prospectus dated March 1, 2007 is 1.24% for Class S shares. Please see the Information About Your Fund's Expenses, the Financial Highlights and Notes to the Financial Statements (Note C, Related Parties) sections of this report for gross and net expense related disclosure for the period ended April 30, 2007.
To discourage short-term trading, the Fund imposes a 2% redemption fee on shareholders redeeming shares held less than 15 days, which has the effect of lowering total return.
Returns during all periods shown reflect a fee waiver and/or expense reimbursement. Without this waiver/reimbursement, returns would have been lower.
Performance figures do not reflect the deduction of taxes that a shareholder would pay on fund distributions or the redemption of fund shares. Returns may differ by share class.
On July 10, 2006, the fund was reorganized from DWS International Select Equity Fund, a series of DWS Investments Trust (the "Predecessor Fund"), into DWS International Select Equity Fund, a newly created series of the DWS Advisor Funds. This change in the legal entity had no economic impact relative to accounting or tax. Performance shown prior to July 10, 2006 is derived from the historical performance of the Predecessor Fund.
Returns shown for Class S shares for the periods prior to its inception on February 28, 2005 are derived from the historical performance of Institutional Class shares of DWS International Select Equity Fund during such periods and have been adjusted to reflect the higher gross total annual operating expenses of Class S. Any difference in expenses will affect performance.
Average Annual Total Returns as of 4/30/07 | |||||
DWS International Select Equity Fund | 6-Month‡ | 1-Year | 3-Year | 5-Year | 10-Year |
Class S | 16.98% | 16.17% | 20.95% | 14.56% | 13.10% |
| MSCI EAFE Index+ | 15.46% | 19.81% | 22.51% | 16.64% | 8.72% |
Sources: Lipper Inc. and Deutsche Management Americas Inc.
‡ Total returns shown for periods less than one year are not annualized.Net Asset Value and Distribution Information | |
| Class S |
Net Asset Value: 4/30/07 | $ 12.61 |
| 10/31/06 | $ 12.90 |
Distribution Information: Six Months as of 4/30/07:Income Dividends | $ .46 |
Capital Gain Distributions | $ 1.79 |
Class S Lipper Rankings — International Large-Cap Core Funds Category as of 4/30/07 | ||||
Period | Rank |
| Number of Funds Tracked | Percentile Ranking (%) |
| 1-Year | 113 | of | 208 | 55 |
Source: Lipper Inc. Rankings are historical and do not guarantee future results. Rankings are based on total return with distributions reinvested. Rankings are for Class S shares; other share classes may vary.
Growth of an Assumed $10,000 Investment |
[] DWS International Select Equity Fund — Class S [] MSCI EAFE Index+ |
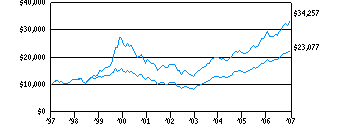 |
Yearly periods ended April 30 |
Comparative Results as of 4/30/07 | |||||
DWS International Select Equity Fund | 1-Year | 3-Year | 5-Year | 10-Year | |
Class S | Growth of $10,000 | $11,617 | $17,693 | $19,735 | $34,257 |
| Average annual total return | 16.17% | 20.95% | 14.56% | 13.10% | |
| MSCI EAFE Index+ | Growth of $10,000 | $11,981 | $18,385 | $21,588 | $23,077 |
| Average annual total return | 19.81% | 22.51% | 16.64% | 8.72% | |
The growth of $10,000 is cumulative.
+ The Morgan Stanley Capital International (MSCI) EAFE Index is an unmanaged, free float-adjusted, market capitalization index that tracks international stock performance in the 21 developed markets of Europe, Australasia and the Far East. The index is calculated using closing local market prices and translates into US dollars using the London close foreign exchange rates. Index returns assume reinvestment of dividends and, unlike Fund returns, do not reflect any fees or expenses. It is not possible to invest directly into an index.Information About Your Fund's Expenses
As an investor of the Fund, you incur two types of costs: ongoing expenses and transaction costs. Ongoing expenses include management fees, distribution and service (12b-1) fees and other Fund expenses. Examples of transaction costs include sales charges (loads), redemption fees and account maintenance fees, which are not shown in this section. The following tables are intended to help you understand your ongoing expenses (in dollars) of investing in the Fund and to help you compare these expenses with the ongoing expenses of investing in other mutual funds. In the most recent six-month period, the Fund limited these expenses; had it not done so, expenses would have been higher. The example in the table is based on an investment of $1,000 invested at the beginning of the six-month period and held for the entire period (November 1, 2006 to April 30, 2007).
The tables illustrate your Fund's expenses in two ways:
Actual Fund Return. This helps you estimate the actual dollar amount of ongoing expenses (but not transaction costs) paid on a $1,000 investment in the Fund using the Fund's actual return during the period. To estimate the expenses you paid over the period, simply divide your account value by $1,000 (for example, an $8,600 account value divided by $1,000 = 8.6), then multiply the result by the number in the "Expenses Paid per $1,000" line under the share class you hold.
Hypothetical 5% Fund Return. This helps you to compare your Fund's ongoing expenses (but not transaction costs) with those of other mutual funds using the Fund's actual expense ratio and a hypothetical rate of return of 5% per year before expenses. Examples using a 5% hypothetical fund return may be found in the shareholder reports of other mutual funds. The hypothetical account values and expenses may not be used to estimate the actual ending account balance or expenses you paid for the period.
Please note that the expenses shown in these tables are meant to highlight your ongoing expenses only and do not reflect any transaction costs. The "Expenses Paid per $1,000" line of the tables is useful in comparing ongoing expenses only and will not help you determine the relative total expense of owning different funds. If these transaction costs had been included, your costs would have been higher.
Expenses and Value of a $1,000 Investment for the six months ended April 30, 2007 | ||||||
Actual Fund Return | Class A | Class B | Class C | Class R | Class S | Institutional Class |
| Beginning Account Value 11/1/06 | $ 1,000.00 | $ 1,000.00 | $ 1,000.00 | $ 1,000.00 | $ 1,000.00 | $ 1,000.00 |
| Ending Account Value 4/30/07 | $ 1,167.20 | $ 1,162.80 | $ 1,163.20 | $ 1,164.60 | $ 1,169.80 | $ 1,169.70 |
| Expenses Paid per $1,000* | $ 7.36 | $ 11.69 | $ 11.37 | $ 8.91 | $ 5.33 | $ 5.00 |
Hypothetical 5% Fund Return | Class A | Class B | Class C | Class R | Class S | Institutional Class |
| Beginning Account Value 11/1/06 | $ 1,000.00 | $ 1,000.00 | $ 1,000.00 | $ 1,000.00 | $ 1,000.00 | $ 1,000.00 |
| Ending Account Value 4/30/07 | $ 1,018.00 | $ 1,013.98 | $ 1,014.28 | $ 1,016.56 | $ 1,019.89 | $ 1,020.18 |
| Expenses Paid per $1,000* | $ 6.85 | $ 10.89 | $ 10.59 | $ 8.30 | $ 4.96 | $ 4.66 |
Annualized Expense Ratios | Class A | Class B | Class C | Class R | Class S | Institutional Class |
| DWS International Select Equity Fund | 1.37% | 2.18% | 2.12% | 1.66% | .99% | .93% |
For more information, please refer to the Fund's prospectus.
In the following interview, Portfolio Manager Matthias Knerr discusses DWS International Select Equity Fund's strategy and the market environment during the six-month period ended April 30, 2007.
Q: How did the international stock markets perform during the semiannual period?
A: Stock prices delivered a strong, steady gain during the past six months due to a confluence of positive factors. Global growth remained robust and continued to improve in regions that had lagged the broader world economy in recent years, most notably Continental Europe. This, in turn, provided a firm underpinning for corporate profits. Further aiding the boom in the global markets was an abundance of liquidity (in other words, the cash available to be put to work in the financial markets). This led to both a surge in merger and acquisition activity and hearty performance from higher-risk asset classes such as the emerging markets. The markets hit a brief speed bump in late February, when concerns about slowing global growth led to a steep sell-off in stock prices. Aside from this abbreviated sell-off, the semiannual period was marked by an almost uninterrupted climb for the global equity markets.
In terms of regional returns, Europe outperformed on the strength of a surge in the German stock market. The Nordic region also performed very well, but equities in the UK lagged. The most notable underperformer was Japan, which was weighed down by concerns that the rebound in the country's economy was losing steam. On a sector basis, industrials, materials and consumer staples were the most significant outperformers, while energy, health care and information technology lagged.
Q: How did the fund perform in this environment?
A: The total return of the fund's Class A shares for the six months ended April 30, 2007 was 16.72%. (Returns are unadjusted for sales charges. If sales charges had been included, return would have been lower. Past performance is no guarantee of future results. Please see pages 4 through 10 for the performance of other share classes and more complete performance information.) The fund's benchmark, the Morgan Stanley Capital International (MSCI) Europe, Australasia, and Far East (EAFE) Index, returned 15.46%, while the average return for the 213 funds in its Lipper peer group — International Large-Cap Core Funds — was 13.91%.1,2 The fund's return has also outpaced the peer group average over the three- and five-year periods.
1 The Morgan Stanley Capital International (MSCI) Europe, Australasia and Far East (EAFE) Index is an unmanaged capitalization-weighted index that tracks international stock performance in the 21 developed markets of Europe, Australasia and the Far East. The index is calculated using closing local market prices and translates into US dollars using the London close foreign exchange rates. Index returns assume reinvestment of dividends and, unlike fund returns, do not reflect any fees or expenses. It is not possible to invest directly into an index.2 The Lipper International Large-Cap Core Funds category is comprised of funds that, by portfolio practice, invest at least 75% of their equity assets in companies strictly outside of the US with market capitalizations (on a three-year weighted basis) greater than the 250th-largest company in the S&P/Citigroup World ex-U.S. Broad Market Index. Large-cap core funds typically have an average price-to-cash flow ratio, price-to-book ratio, and three-year sales-per-share growth value compared to the S&P/Citigroup World ex-U.S. Index. Category returns assume reinvestment of dividends. It is not possible to invest directly into a Lipper category.
Q: What elements of the fund's positioning helped and hurt performance?
A: First, it is important to note that all of the fund's sector and industry weightings are a residual effect of our individual stock investments. Nevertheless, a variation between the weightings of the fund and those of the index can have an impact on performance. For instance, the fund benefited from holding an overweight position in two markets that performed very well, Norway and Sweden, as well as holding an underweight in two markets that trailed the broader markets, Japan and the United Kingdom.3 The largest detractor on a country basis was the fund's underweight in Australia, which performed very well on the strength of the recovery in commodities prices. In terms of stock selection, we delivered the largest degree of outperformance in telecommunications, health care and financials, but our stock picks trailed the benchmark in both information technology and utilities.
3 "Overweight" means the fund holds a higher weighting in a given sector or security than the benchmark. "Underweight" means the fund holds a lower weighting.Q: What individual stocks provided the largest contribution to performance?
A: The largest individual contributor to the fund's outperformance came from its position in Millicom International Cellular SA, one of the fastest-growing cellular telephony companies in the world. Millicom is based in Sweden, but it operates primarily in Latin America and Africa, areas where subscribership is very low compared with the developed world. The dramatic decline in the cost of cellular handsets has allowed the company to provide inexpensive phones to lower-income people, thereby allowing it to expand its services to a population that has historically been underserved. Due to the company's low cost base, its strong subscription growth has translated to a rapid expansion in earnings. We continue to hold the stock in the fund, believing it is still in the early stages of its growth given the growth in the worldwide consumer class and the continued low penetration for phone service in the emerging markets.
The second-best performer for the fund was a recent purchase, AMEC PLC. A UK-based engineering and construction company, AMEC has been poorly managed in the past. However, it is now being led by a new chief executive officer who is restructuring its operations and selling its non-core assets. Our purchase of the stock was based on our view that these efforts will result in higher profit margins in the years ahead, and it has already begun to make a contribution to performance.
Another substantial contributor was Nokian Renkaat Oyj, the Finnish manufacturer and distributor of winter tires. The stock initially weighed on the fund's performance during the winter of 2005-2006, when increased price competition and unseasonably warm weather in the Nordic region weighed on its earnings. Both of these problems have since been alleviated, allowing the share price to better reflect the company's solid niche business and its expansion into the profitable Eastern European and Russian markets. Consumers in these regions are rapidly gaining spending power, leading to the growing importation of cars. We expect the concurrent rise in the demand for tires will continue to support Nokian's earnings growth.
A strong contribution also came from the fund's position in Whitbread PLC, the UK operator of pubs and hotels. The company has been selling its non-core assets and properties to focus on its core hotel and pub business, a move that has been positively received by the market. Also helping its shares is the fact that it owns a great deal of property throughout the United Kingdom, and London in particular, which has allowed it to benefit from the continued rise in real estate prices. In addition, Whitbread has a new chief financial officer (CFO) who appears committed to increasing the company's return on capital. Our decision to build a position in Whitbread on the basis of this turnaround story paid off in the most recent period, during which the stock returned over 41.15% in US dollar terms.
Q: What stocks detracted from performance?
A: The majority of the detractors from performance were stocks based in Japan, where the market lagged its global peers by a wide margin. Stocks such as Daito Trust Construction Co., Ltd., Canon. Inc. and ORIX Corp. were among the fund's leading detractors. Fortunately, our underweight in Japan helped prevent the underperformance of the fund's holdings in the country from having too large of an impact on performance. Also detracting was Gol-Linhas Aereas Inteligentes SA (Gol), the Brazilian discount airliner. Rising competition created downward pricing pressure in the industry, a negative for Gol given its high fixed-cost base.
Q: What are some new opportunities that you have found in recent months?
A: Four stocks appear in the top 20 holdings that are new to the fund: AMEC (mentioned above), 3i Group PLC, KBC Groep NV and Shoppers Drug Mart Corp.
Our other major purchase in the United Kingdom besides AMEC, 3i Group, is a private equity business focused on mid-sized companies. The term "private equity" refers to firms that 1) purchase some or all of the shares of public companies, thereby taking them private, or 2) buy stakes in private businesses with the goal that they will eventually go public. At the mid-sized company level, there are fewer private equity firms participating than there are within the large-cap arena. This is particularly true in Continental Europe and Asia ex-Japan, where 3i is positioning itself to do a larger percentage of its business. Believing that its strong presence in this part of the private equity market will allow 3i to achieve better returns than its competitors, we made a substantial purchase of its shares during the past six months.
KBC Groep is a Belgium-based bank with significant exposure to central and Eastern Europe. Financial services are underpenetrated in these markets and the customer base is generally less sophisticated relative to the more established markets of Europe, meaning that there is a better opportunity for growth. Finally, Shoppers Drug Mart is a Canadian drug chain that is growing quickly and, unlike its US counterparts, does not face the same level of competition or the threat posed by the heavy discounting by Wal-Mart.
We believe these companies, which are not simply the standard large-cap international names, offer unique investment opportunities for our investors while at the same time illustrating our investment process, which delves deeper into markets in order to find the best opportunities to invest in fast-growing, reasonably valued stocks.
Q: How do you see the overall market environment affecting the fund in the months ahead?
A: The United States has carried the world economy on its back for much of this decade. Now, with US growth appearing to slow, the most important question for the global equity markets is whether the rest of the world can pick up the slack. So far, the signs on this front are positive. Looking first at Japan, investors have been concerned by the unsteady nature of the economic recovery. However, the health of corporate Japan is robust due to the weaker yen (which increases the competitiveness of its exports) and the country's proximity to China's booming economy. We believe it is a positive sign that Japanese growth has resumed following 10 years of deflation. We are also encouraged by developments in Continental Europe, where the export-driven economy of recent years is being augmented by improving domestic consumption. Growth has also resumed in the United Kingdom despite the downturn in its housing market during 2005. Perhaps most notably, the emerging-markets economies have delivered stellar growth on the strength of rising export growth, higher commodity prices and the emergence of a middle class.
Overall, we believe the combination of strong underlying fundamentals and attractive valuations creates a favorable environment for individual stock selection. If the correction of late February 2007 is a harbinger of increased market volatility in the months ahead, we intend to take advantage of lower prices to add to the fund's holdings in companies with strong brands, higher-return underlying business, and competitive advantages in the form of their geographic exposure or superior technologies.
The views expressed in this report reflect those of the portfolio managers only through the end of the period of the report as stated on the cover. The management team's views are subject to change at any time based on market and other conditions and should not be construed as a recommendation. Past performance is no guarantee of future results.
Geographical Diversification (As a % of Common and Preferred Stocks) | 4/30/07 | 10/31/06 |
|
|
|
Continental Europe | 52% | 57% |
United Kingdom | 17% | 13% |
Japan | 17% | 22% |
Asia (excluding Japan) | 5% | 3% |
Latin America | 4% | 5% |
Canada | 3% | — |
Australia | 1% | — |
New Zealand | 1% | — |
| 100% | 100% |
Sector Diversification (As a % of Common and Preferred Stocks) | 4/30/07 | 10/31/06 |
|
|
|
Financials | 30% | 28% |
Industrials | 15% | 9% |
Consumer Discretionary | 15% | 16% |
Consumer Staples | 9% | 4% |
Information Technology | 7% | 9% |
Health Care | 7% | 13% |
Energy | 6% | 6% |
Materials | 5% | 8% |
Telecommunication Services | 5% | 5% |
Utilities | 1% | 2% |
| 100% | 100% |
Geographical and sector diversification are subject to change.
Ten Largest Equity Holdings at April 30, 2007 (30.6% of Net Assets) | ||
| 1. Canon, Inc. Provider of visual image and information equipment | Japan | 4.3% |
| 2. AMEC PLC Conducts engineering, construction and property investment | United Kingdom | 4.3% |
| 3. KBC Groep NV Attracts deposits and offers banking and insurance services | Belgium | 3.9% |
| 4. Hypo Real Estate Holding AG Provider of large financing volume and complex real estate projects | Germany | 3.0% |
| 5. Shoppers Drug Mart Corp. Drugstore retailers in Canada | Canada | 2.9% |
| 6. Telefonica SA Provider of telecommunication services | Spain | 2.7% |
| 7. 3i Group PLC An international venture capital company | United Kingdom | 2.7% |
| 8. UniCredito Italiano SpA Provider of commercial banking services | Italy | 2.6% |
| 9. Bayer AG Produces and markets health care products | Germany | 2.1% |
| 10. Banca Italease Provider of diversified banking services | Italy | 2.1% |
Portfolio holdings are subject to change.
For more complete details about the Fund's investment portfolio, see page 21. A quarterly Fact Sheet is available upon request. Information concerning portfolio holdings of the Fund as of month end will be posted to www.dws-scudder.com on or after the last day of the following month. In addition, the Fund's top ten holdings and other information about the Fund is posted on www.dws-scudder.com as of the calendar quarter-end on or after the 15th day following quarter-end. Please see the Account Management Resources section for contact information.
Following the Fund's fiscal first and third quarter-end, a complete portfolio holdings listing is filed with the SEC on Form N-Q. The form will be available on the SEC's Web site at www.sec.gov, and it also may be reviewed and copied at the SEC's Public Reference Room in Washington, D.C. Information on the operation of the SEC's Public Reference Room may be obtained by calling (800) SEC-0330.
Investment Portfolio as of April 30, 2007 (Unaudited)
|
| Value ($) |
|
| |
Common Stocks 94.9% | ||
Australia 0.7% | ||
Leighton Holdings Ltd. (Cost $1,830,913) | 63,000 | 1,798,779 |
Austria 1.5% | ||
Erste Bank der oesterreichischen Sparkassen AG (Cost $2,770,767) | 46,300 | 3,713,325 |
Belgium 3.9% | ||
KBC Groep NV (a) (Cost $9,045,991) | 72,600 | 9,583,761 |
Brazil 2.3% | ||
Gol-Linhas Aereas Inteligentes SA (ADR) (Preferred) (a) | 55,100 | 1,571,452 |
Petroleo Brasileiro SA (ADR) | 40,900 | 4,140,307 |
(Cost $3,830,866) | 5,711,759 | |
Canada 2.9% | ||
Shoppers Drug Mart Corp. (Cost $6,683,463) | 157,000 | 7,156,167 |
China 1.1% | ||
Shanghai Electric Group Co., Ltd. "H" | 6,313,400 | 2,668,376 |
Yangzijiang Shipbuilding Holdings Ltd.* | 80,000 | 69,508 |
(Cost $2,626,727) | 2,737,884 | |
Finland 1.6% | ||
Nokian Renkaat Oyj (a) (Cost $1,731,754) | 129,950 | 3,987,503 |
France 2.3% | ||
Total SA | 58,554 | 4,323,134 |
Vallourec SA | 4,779 | 1,305,644 |
(Cost $3,220,653) | 5,628,778 | |
Germany 10.7% | ||
Bayer AG (a) | 74,527 | 5,107,075 |
E.ON AG (a) | 21,702 | 3,266,633 |
Fresenius Medical Care AG & Co. (a) | 28,199 | 4,247,701 |
GEA Group AG | 87,309 | 2,564,380 |
Hypo Real Estate Holding AG | 112,191 | 7,508,181 |
Merck KGaA (a) | 28,178 | 3,751,701 |
(Cost $15,117,358) | 26,445,671 | |
Greece 2.0% | ||
National Bank of Greece SA (Cost $3,474,004) | 89,100 | 4,969,851 |
Hong Kong 1.5% | ||
Country Garden Holdings Co.* | 74,000 | 66,693 |
Esprit Holdings Ltd. | 307,000 | 3,715,332 |
(Cost $3,240,833) | 3,782,025 | |
Ireland 1.0% | ||
Anglo Irish Bank Corp. PLC (Cost $1,407,525) | 107,804 | 2,422,357 |
Italy 4.7% | ||
Banca Italease (a) | 84,501 | 5,083,845 |
UniCredito Italiano SpA | 639,700 | 6,557,073 |
(Cost $8,299,476) | 11,640,918 | |
Japan 16.5% | ||
Canon, Inc. | 191,350 | 10,698,467 |
Eisai Co., Ltd. | 74,000 | 3,516,856 |
Japan Tobacco, Inc. | 970 | 4,735,252 |
Komatsu Ltd. | 155,000 | 3,676,366 |
Mitsui Fudosan Co., Ltd. | 148,000 | 4,321,851 |
ORIX Corp. | 16,700 | 4,448,562 |
Sumitomo Corp. | 103,000 | 1,751,419 |
Suzuki Motor Corp. | 152,000 | 4,327,657 |
Yamaha Motor Co., Ltd. | 128,000 | 3,381,230 |
(Cost $33,473,755) | 40,857,660 | |
Kazakhstan 0.5% | ||
KazMunaiGas Exploration Production (GDR) 144A* (Cost $859,368) | 58,700 | 1,215,090 |
Korea 1.2% | ||
Samsung Electronics Co., Ltd. (GDR) (REG S) 144A (b) | 600 | 184,200 |
Samsung Electronics Co., Ltd. (GDR) (REG S) 144A (b) | 8,777 | 2,681,619 |
(Cost $1,151,226) | 2,865,819 | |
Luxembourg 1.3% | ||
Millicom International Cellular SA* (a) (Cost $1,308,292) | 37,900 | 3,079,375 |
Mexico 1.6% | ||
Grupo Financiero Banorte SAB de CV "O" (Cost $3,580,435) | 921,600 | 4,006,371 |
Netherlands 2.5% | ||
Akzo Nobel NV | 30,600 | 2,445,178 |
Royal Numico NV (a) | 67,800 | 3,744,568 |
(Cost $5,914,784) | 6,189,746 | |
New Zealand 0.5% | ||
Fletcher Building Ltd. (Cost $1,206,019) | 157,900 | 1,329,729 |
Norway 1.7% | ||
Statoil ASA (a) (Cost $4,027,469) | 148,300 | 4,164,718 |
Pakistan 0.7% | ||
MCB Bank Ltd. (GDR) 144A (Cost $1,332,002) | 85,521 | 1,644,567 |
Spain 3.4% | ||
Obrascon Huarte Lain SA | 37,924 | 1,684,966 |
Telefonica SA | 305,130 | 6,806,238 |
(Cost $7,177,273) | 8,491,204 | |
Sweden 5.5% | ||
Atlas Copco AB "B" (a) | 102,200 | 3,665,232 |
Rezidor Hotel Group AB* | 485,800 | 4,262,948 |
Tele2 AB "B" | 139,400 | 2,383,759 |
Telefonaktiebolaget LM Ericsson "B" | 866,300 | 3,302,553 |
(Cost $10,853,931) | 13,614,492 | |
Switzerland 5.9% | ||
Compagnie Financiere Richemont SA "A" (Unit) | 67,270 | 4,055,428 |
Lonza Group AG (Registered) | 39,725 | 3,865,449 |
Nestle SA (Registered) | 5,006 | 1,983,269 |
Roche Holding AG (Genusschein) | 25,416 | 4,794,477 |
(Cost $10,430,127) | 14,698,623 | |
United Arab Emirates 0.4% | ||
Emaar Properties (Cost $1,078,277) | 322,953 | 945,245 |
United Kingdom 17.0% | ||
3i Group PLC | 291,026 | 6,683,425 |
AMEC PLC | 957,870 | 10,612,817 |
Aviva PLC | 228,727 | 3,588,551 |
Capita Group PLC | 354,648 | 4,980,949 |
Greene King PLC | 180,596 | 3,857,333 |
Standard Chartered PLC | 149,440 | 4,632,679 |
Tesco PLC | 398,769 | 3,664,452 |
Whitbread PLC | 110,825 | 4,161,518 |
(Cost $34,901,406) | 42,181,724 | |
Total Common Stocks (Cost $180,574,694) | 234,863,141 | |
| | ||
Preferred Stocks 1.6% | ||
Germany | ||
Porsche AG (Cost $2,093,886) | 2,274 | 3,810,696 |
| | ||
Rights 0.0% | ||
Brazil | ||
Gol Linhas Aereas Inteligentes SA* (Cost $0) | 2,579 | 0 |
| | ||
Securities Lending Collateral 19.7% | ||
Daily Assets Fund Institutional, 5.33% (c)(d) (Cost $48,804,712) | 48,804,712 | 48,804,712 |
| | ||
Cash Equivalents 3.4% | ||
Cash Management QP Trust, 5.31% (c) (Cost $8,503,214) | 8,503,214 | 8,503,214 |
| % of Net Assets | Value ($) |
|
| |
Total Investment Portfolio (Cost $239,976,506)+ | 119.6 | 295,981,763 |
Other Assets and Liabilities, Net | (19.6) | (48,446,072) |
Net Assets | 100.0 | 247,535,691 |
+ The cost for federal income tax purposes was $244,522,579. At April 30, 2007, net unrealized appreciation for all securities based on tax cost was $51,459,184. This consisted of aggregate gross unrealized appreciation for all securities in which there was an excess of value over tax cost of $52,405,188 and aggregate gross unrealized depreciation for all securities in which there was an excess of tax cost over value of $946,004.
(a) All or a portion of these securities were on loan (see Notes to Financial Statements). The value of all securities loaned at April 30, 2007 amounted to $46,576,763 which is 18.8% of net assets.
(b) Securities with the same description are the same corporate entity but trade on different stock exchanges.
(c) Affiliated fund managed by Deutsche Investment Management Americas Inc. The rate shown is the annualized seven-day yield at period end.
(d) Represents collateral held in connection with securities lending.
144A: Security exempt from registration under Rule 144A of the Securities Act of 1933. These securities may be resold in transactions exempt from registration, normally to qualified institutional buyers.
ADR: American Depositary Receipt
GDR: Global Depositary Receipt
The accompanying notes are an integral part of the financial statements.
Statement of Assets and Liabilities as of April 30, 2007 (Unaudited) | |
Assets | |
| Investments: Investments in securities, at value (cost $182,668,580) — including $46,576,763 of securities loaned | $ 238,673,837 |
Investment in Daily Assets Fund Institutional (cost $48,804,712)* | 48,804,712 |
Investment in Cash Management QP Trust (cost $8,503,214) | 8,503,214 |
| Total investments in securities, at value (cost $239,976,506) | 295,981,763 |
| Foreign currency, at value (cost $12,691) | 12,751 |
| Receivable for investments sold | 1,964,977 |
| Receivable for Fund shares sold | 927,744 |
| Dividends receivable | 888,779 |
| Interest receivable | 64,742 |
| Foreign taxes recoverable | 352,504 |
| Other assets | 90,653 |
| Total assets | 300,283,913 |
Liabilities | |
| Cash overdraft | 6,313 |
| Accrued management fee | 218,255 |
| Payable upon return of securities loaned | 48,804,712 |
| Payable for investments purchased | 3,220,241 |
| Payable for Fund shares redeemed | 201,644 |
| Other accrued expenses and payables | 297,057 |
| Total liabilities | 52,748,222 |
Net assets, at value | $ 247,535,691 |
Net Assets | |
| Net assets consist of: Distributions in excess of net investment income | (4,485,708) |
| Net unrealized appreciation (depreciation) on: Investments | 56,005,257 |
Foreign currency related transactions | 27,772 |
| Accumulated net realized gain (loss) | 34,006,614 |
| Paid-in capital | 161,981,756 |
Net assets, at value | $ 247,535,691 |
The accompanying notes are an integral part of the financial statements.
Statement of Assets and Liabilities as of April 30, 2007 (Unaudited) (continued) | |
Net Asset Value | |
Class A Net Asset Value and redemption price(a) per share ($94,281,877 ÷ 7,317,885 outstanding shares of beneficial interest, $.001 par value, unlimited number of shares authorized) | $ 12.88 |
| Maximum offering price per share (100 ÷ 94.25 of $12.88) | $ 13.67 |
Class B Net Asset Value, offering and redemption price(a) (subject to contingent deferred sales charge) per share ($11,047,631 ÷ 880,064 outstanding shares of beneficial interest, $.001 par value, unlimited number of shares authorized) | $ 12.55 |
Class C Net Asset Value, offering and redemption price(a) (subject to contingent deferred sales charge) per share ($16,173,719 ÷ 1,288,372 outstanding shares of beneficial interest, $.001 par value, unlimited number of shares authorized) | $ 12.55 |
Class R Net Asset Value, offering and redemption price(a) (subject to contingent deferred sales charge) per share ($510,812 ÷ 40,638 outstanding shares of beneficial interest, $.001 par value, unlimited number of shares authorized) | $ 12.57 |
Class S Net Asset Value, offering and redemption price(a) per share ($46,143,642 ÷ 3,660,156 outstanding shares of beneficial interest, $.001 par value, unlimited number of shares authorized) | $ 12.61 |
Institutional Class Net Asset Value, offering and redemption price(a) per share ($79,378,010 ÷ 6,290,125 outstanding shares of beneficial interest, $.001 par value, unlimited number of shares authorized) | $ 12.62 |
The accompanying notes are an integral part of the financial statements.
Statement of Operations for the six months ended April 30, 2007 (Unaudited) | |
Investment Income | |
| Income: Dividends (net of foreign taxes withheld of $238,223) | $ 2,262,349 |
| Interest | 11,301 |
| Interest — Cash Management QP Trust | 85,585 |
| Securities lending income, including income from Daily Assets Fund Institutional, net of borrower rebates | 72,616 |
| Total Income | 2,431,851 |
| Expenses: Management fee | 851,707 |
| Administration fee | 121,672 |
| Distribution service fees | 233,343 |
| Services to shareholders | 199,667 |
| Custodian fees | 76,792 |
| Legal | 3,452 |
| Auditing | 34,209 |
| Trustees' fees and expenses | 3,991 |
| Reports to shareholders | 46,343 |
| Registration fees | 49,615 |
| Other | 39,506 |
| Total expenses before expense reductions | 1,660,297 |
| Expense reductions | (161,568) |
| Total expenses after expense reductions | 1,498,729 |
Net investment income (loss) | 933,122 |
Realized and Unrealized Gain (Loss) on Investment Transactions | |
| Net realized gain (loss) from: Investments | 34,461,010 |
| Foreign currency related transactions | (97,295) |
| | 34,363,715 |
| Net unrealized appreciation (depreciation) during the period on: Investments | 3,452,769 |
| Foreign currency related transactions | 22,651 |
| | 3,475,420 |
Net gain (loss) on investment transactions | 37,839,135 |
Net increase (decrease) in net assets resulting from operations | $ 38,772,257 |
The accompanying notes are an integral part of the financial statements.
Statement of Changes in Net Assets | ||
Increase (Decrease) in Net Assets | Six Months Ended April 30, 2007 (Unaudited) | Year Ended October 31, 2006 |
| Operations: Net investment income (loss) | $ 933,122 | $ 5,190,123 |
| Net realized gain (loss) on investment transactions | 34,363,715 | 134,381,258 |
| Net unrealized appreciation (depreciation) during the period on investment transactions | 3,475,420 | (41,407,114) |
| Net increase (decrease) in net assets resulting from operations | 38,772,257 | 98,164,267 |
| Distributions to shareholders from: Net investment income: Class A | (2,683,760) | — |
Class B | (259,411) | — |
Class C | (376,153) | — |
Class R | (12,732) | — |
Class S | (1,495,440) | — |
Institutional Class | (3,783,973) | — |
| Net realized gains: Class A | (10,880,494) | (13,935,164) |
Class B | (1,429,910) | (641,455) |
Class C | (2,110,414) | (1,054,063) |
Investment Class | — | (2,149,281) |
Class R | (57,573) | (201,760) |
Class S | (5,821,917) | (85,184) |
Institutional Class | (14,348,791) | (6,393,166) |
Premier Class | — | (6,281,652) |
| Fund share transactions: Proceeds from shares sold | 42,632,869 | 124,590,790 |
| Reinvestment of distributions | 37,936,008 | 29,570,843 |
| Cost of shares redeemed | (97,599,189) | (144,230,133) |
| In-kind redemptions | — | (254,376,954) |
| Redemption fees | 3,865 | 77,533 |
| Net increase (decrease) in net assets from Fund share transactions | (17,026,447) | (244,367,921) |
Increase (decrease) in net assets | (21,514,758) | (176,945,379) |
| Net assets at beginning of year | 269,050,449 | 445,995,828 |
| Net assets at end of period (including distributions in excess of net investment income and undistributed net investment income of $4,485,708 and $3,192,639, respectively) | $ 247,535,691 | $ 269,050,449 |
The accompanying notes are an integral part of the financial statements.
Class A Years Ended October 31, | 2007a | 2006 | 2005 | 2004 | 2003 | 2002 |
Selected Per Share Data | ||||||
Net asset value, beginning of period | $ 13.15 | $ 11.28 | $ 10.21 | $ 9.08 | $ 7.56 | $ 8.19 |
Income (loss) from investment operations: Net investment income (loss)b | .03 | .16g | .17d | .06 | .09 | .03 |
Net realized and unrealized gain (loss) on investment transactions | 1.93 | 2.51 | 1.72 | 1.18 | 1.45 | (.66) |
Total from investment operations | 1.96 | 2.67 | 1.89 | 1.24 | 1.54 | (.63) |
Less distributions from: Net investment income | (.44) | — | (.47) | (.11) | (.02) | — |
Net realized gain on investment transactions | (1.79) | (.80) | (.35) | — | — | — |
Total distributions | (2.23) | (.80) | (.82) | (.11) | (.02) | — |
| Redemption fees | .00*** | .00*** | .00*** | .00*** | .00*** | — |
Net asset value, end of period | $ 12.88 | $ 13.15 | $ 11.28 | $ 10.21 | $ 9.08 | $ 7.56 |
| Total Return (%)c | 16.72f** | 23.64f | 18.65 | 13.77 | 20.42 | (7.69)f |
Ratios to Average Net Assets and Supplemental Data | ||||||
| Net assets, end of period ($ millions) | 94 | 80 | 193 | 484 | 360 | .8 |
| Ratio of expenses before expense reductions (%) | 1.46* | 1.41 | 1.33 | 1.36 | 1.33 | 1.42 |
| Ratio of expenses after expense reductions (%) | 1.37* | 1.37 | 1.33 | 1.36 | 1.33 | 1.41 |
| Ratio of net investment income (loss) (%) | .63* | 1.30g | 1.58 | .62 | 1.12 | .34 |
| Portfolio turnover rate (%) | 100* | 140e | 122e | 138 | 160 | 178 |
| a For the six months ended April 30, 2007 (Unaudited). b Based on average shares outstanding during the period. c Total return does not reflect the effect of any sales charges. d Net investment income per share includes non-recurring dividend income amounting to $.05 per share. e Excludes portfolio securities delivered as a result of processing redemption in-kind transactions. f Total return would have been lower had certain expenses not been reduced. g Net investment income per share and the ratio of net investment income include non-recurring dividend income amounting to $0.02 per share and 0.17% of average daily net assets, respectively. * Annualized ** Not annualized *** Amount is less than $.005. | ||||||
Class B Years Ended October 31, | 2007a | 2006 | 2005 | 2004 | 2003 | 2002 |
Selected Per Share Data | ||||||
Net asset value, beginning of period | $ 12.80 | $ 11.08 | $ 9.97 | $ 8.87 | $ 7.42 | $ 8.11 |
Income (loss) from investment operations: Net investment income (loss)b | (.01) | .07g | .07d | (.01) | .03 | (.02) |
Net realized and unrealized gain (loss) on investment transactions | 1.88 | 2.45 | 1.70 | 1.15 | 1.42 | (.67) |
Total from investment operations | 1.87 | 2.52 | 1.77 | 1.14 | 1.45 | (.69) |
Less distributions from: Net investment income | (.33) | — | (.31) | (.04) | — | — |
Net realized gain on investment transactions | (1.79) | (.80) | (.35) | — | — | — |
Total distributions | (2.12) | (.80) | (.66) | (.04) | — | — |
| Redemption fees | .00*** | .00*** | .00*** | .00*** | .00*** | — |
Net asset value, end of period | $ 12.55 | $ 12.80 | $ 11.08 | $ 9.97 | $ 8.87 | $ 7.42 |
| Total Return (%)c | 16.28f** | 22.68f | 17.79 | 12.87 | 19.54 | (8.51)f |
Ratios to Average Net Assets and Supplemental Data | ||||||
| Net assets, end of period ($ millions) | 11 | 11 | 9 | 7 | 3 | .3 |
| Ratio of expenses before reductions (%) | 2.27* | 2.26 | 2.08 | 2.11 | 2.08 | 2.17 |
| Ratio of expenses after expense reductions (%) | 2.18* | 2.14 | 2.08 | 2.11 | 2.08 | 2.16 |
| Ratio of net investment income (loss) (%) | (.18)* | .53g | .83 | (.13) | .37 | (.25) |
| Portfolio turnover rate (%) | 100* | 140e | 122e | 138 | 160 | 178 |
| a For the six months ended April 30, 2007 (Unaudited). b Based on average shares outstanding during the period. c Total return does not reflect the effect of any sales charges. d Net investment income per share includes non-recurring dividend income amounting to $.04 per share. e Excludes portfolio securities delivered as a result of processing redemption in-kind transactions. f Total return would have been lower had certain expenses not been reduced. g Net investment income per share and the ratio of net investment income include non-recurring dividend income amounting to $0.02 per share and 0.17% of average daily net assets, respectively. * Annualized ** Not annualized *** Amount is less than $.005. | ||||||
Class C Years Ended October 31, | 2007a | 2006 | 2005 | 2004 | 2003 | 2002 |
Selected Per Share Data | ||||||
Net asset value, beginning of period | $ 12.79 | $ 11.08 | $ 9.97 | $ 8.86 | $ 7.42 | $ 8.11 |
Income (loss) from investment operations: Net investment income (loss)b | (.01) | .06f | .07d | (.01) | .03 | (.09) |
Net realized and unrealized gain (loss) on investment transactions | 1.88 | 2.45 | 1.69 | 1.16 | 1.41 | (.60) |
Total from investment operations | 1.87 | 2.51 | 1.76 | 1.15 | 1.44 | (.69) |
Less distributions from: Net investment income | (.32) | — | (.30) | (.04) | — | — |
Net realized gain on investment transactions | (1.79) | (.80) | (.35) | — | — | — |
Total distributions | (2.11) | (.80) | (.65) | (.04) | — | — |
| Redemption fees | .00*** | .00*** | .00*** | .00*** | .00*** | — |
Net asset value, end of period | $ 12.55 | $ 12.79 | $ 11.08 | $ 9.97 | $ 8.86 | $ 7.42 |
| Total Return (%)c | 16.32g** | 22.59 | 17.79 | 13.00 | 19.41 | (8.51)g |
Ratios to Average Net Assets and Supplemental Data | ||||||
| Net assets, end of period ($ millions) | 16 | 16 | 16 | 13 | 5 | .6 |
| Ratio of expenses before expense reductions (%) | 2.21* | 2.18 | 2.08 | 2.11 | 2.08 | 2.17 |
| Ratio of expenses after expense reductions (%) | 2.12* | 2.18 | 2.08 | 2.11 | 2.08 | 2.16 |
| Ratio of net investment income (loss) (%) | (.12)* | .49f | .83 | (.13) | .37 | (1.13) |
| Portfolio turnover rate (%) | 100* | 140e | 122e | 138 | 160 | 178 |
| a For the six months ended April 30, 2007 (Unaudited). b Based on average shares outstanding during the period. c Total return does not reflect the effect of any sales charges. d Net investment income per share includes non-recurring dividend income amounting to $.05 per share. e Excludes portfolio securities delivered as a result of processing redemption in-kind transactions. f Net investment income per share and the ratio of net investment income include non-recurring dividend income amounting to $0.02 per share and 0.17% of average daily net assets, respectively. g Total return would have been lower had certain expenses not been reduced. * Annualized ** Not annualized *** Amount is less than $.005. | ||||||
Class R Years Ended October 31, | 2007a | 2006b | 2005b | 2004b | 2003b,c |
Selected Per Share Data | |||||
Net asset value, beginning of period | $ 12.86 | $ 11.07 | $ 9.86 | $ 8.77 | $ 7.51 |
Income (loss) from investment operations: Net investment income (loss)d | .01 | .13h | .11e | .04 | .02 |
Net realized and unrealized gain (loss) on investment transactions | 1.89 | 2.46 | 1.70 | 1.14 | 1.24 |
Total from investment operations | 1.90 | 2.59 | 1.81 | 1.18 | 1.26 |
Less distributions from: Net investment income | (.40) | — | (.41) | (.09) | — |
Net realized gain on investment transactions | (1.79) | (.80) | (.19) | — | — |
Total distributions | (2.19) | (.80) | (.60) | (.09) | — |
| Redemption fees*** | .00 | .00 | .00 | .00 | .00 |
Net asset value, end of period | $ 12.57 | $ 12.86 | $ 11.07 | $ 9.86 | $ 8.77 |
| Total Return (%) | 16.46g** | 23.36g | 18.45 | 13.47 | 16.78** |
Ratios to Average Net Assets and Supplemental Data | |||||
| Net assets, end of period ($ millions) | 1 | 3 | 2 | .4 | .01 |
| Ratio of expenses before expense reductions (%) | 1.72* | 1.70 | 1.55 | 1.61 | 1.58* |
| Ratio of expenses after expense reductions (%) | 1.66* | 1.63 | 1.55 | 1.61 | 1.58* |
| Ratio of net investment income (loss) (%) | .34* | 1.04h | 1.36 | .37 | .89* |
| Portfolio turnover rate (%) | 100* | 140f | 122f | 138 | 160 |
| a For the six months ended April 30, 2007 (Unaudited). b Per share data have been restated to reflect the effects of a 1.82569632 for 1 stock split effective November 11, 2005. c For the period from July 1, 2003 (commencement of operations of Class R shares) to October 31, 2003. d Based on average shares outstanding during the period. e Net investment income per share includes non-recurring dividend income amounting to $.04 per share. f Excludes portfolio securities delivered as a result of processing redemption in-kind transactions. g Total return would have been lower had certain expenses not been reduced. h Net investment income per share and the ratio of net investment income include non-recurring dividend income amounting to $0.02 per share and 0.17% of average daily net assets, respectively. * Annualized ** Not annualized *** Amount is less than $.005. | |||||
Class S Years Ended October 31, | 2007a | 2006b | 2005b,c |
Selected Per Share Data | |||
Net asset value, beginning of period | $ 12.90 | $ 11.07 | $ 11.05 |
Income (loss) from investment operations: Net investment income (loss)d | .06 | .19h | .11e |
Net realized and unrealized gain (loss) on investment transactions | 1.90 | 2.44 | .44 |
Total from investment operations | 1.96 | 2.63 | .55 |
Less distributions from: Net investment income | (.46) | — | (.34) |
Net realized gain on investment transactions | (1.79) | (.80) | (.19) |
Total distributions | (2.25) | (.80) | (.53) |
| Redemption fees*** | .00 | .00 | .00 |
Net asset value, end of period | $ 12.61 | $ 12.90 | $ 11.07 |
| Total Return (%)f | 16.98** | 23.77 | 5.15** |
Ratios to Average Net Assets and Supplemental Data | |||
| Net assets, end of period ($ millions) | 46 | 41 | 5 |
| Ratio of expenses before expense reductions (%) | 1.26* | 1.31 | 1.33* |
| Ratio of expenses after expense reductions (%) | .99* | 1.18 | 1.28* |
| Ratio of net investment income (loss) (%) | 1.01* | 1.49h | 1.47* |
| Portfolio turnover rate (%) | 100* | 140g | 122g |
| a For the six months ended April 30, 2007 (Unaudited). b Per share data have been restated to reflect the effects of a 1.81850854 for 1 stock split effective November 11, 2005. c For the period from February 28, 2005 (commencement of operations of Class S shares) to October 31, 2005. d Based on average shares outstanding during the period. e Net investment income per share includes non-recurring dividend income amounting to $.03 per share. f Total return would have been lower had certain expenses not been reduced. g Excludes portfolio securities delivered as a result of processing redemption in-kind transactions. h Net investment income per share and the ratio of net investment income include non-recurring dividend income amounting to $0.02 per share and 0.17% of average daily net assets, respectively. * Annualized ** Not annualized *** Amount is less than $.005. | |||
Institutional Class Years Ended October 31, | 2007a | 2006b | 2005b | 2004b | 2003b | 2002b |
Selected Per Share Data | ||||||
Net asset value, beginning of period | $ 12.92 | $ 11.07 | $ 9.90 | $ 8.81 | $ 7.34 | $ 7.95 |
Income (loss) from investment operations: Net investment income (loss)c | .06 | .20g | .18e | .08 | .10 | .07 |
Net realized and unrealized gain (loss) on investment transactions | 1.90 | 2.45 | 1.69 | 1.14 | 1.41 | (.67) |
Total from investment operations | 1.96 | 2.65 | 1.87 | 1.22 | 1.51 | (.60) |
Less distributions from: Net investment income | (.47) | — | (.51) | (.13) | (.04) | (.01) |
Net realized gain on investment transactions | (1.79) | (.80) | (.19) | — | — | — |
Total distributions | (2.26) | (.80) | (.70) | (.13) | (.04) | (.01) |
| Redemption fees | .00*** | .00*** | .00*** | .00*** | .00*** | — |
Net asset value, end of period | $ 12.62 | $ 12.92 | $ 11.07 | $ 9.90 | $ 8.81 | $ 7.34 |
| Total Return (%) | 16.97d** | 23.96d | 19.06 | 13.97 | 20.61d | (7.55) |
Ratios to Average Net Assets and Supplemental Data | ||||||
| Net assets, end of period ($ millions) | 79 | 119 | 98 | 96 | 94 | 69 |
| Ratio of expenses before expense reductions (%) | 1.05* | 1.13 | 1.08 | 1.10 | 1.08 | 1.17 |
| Ratio of expenses after expense reductions (%) | .93* | 1.10 | 1.08 | 1.10 | 1.08 | 1.17 |
| Ratio of net investment income (loss) (%) | .1.07* | 1.57g | 1.83 | .88 | 1.37 | .80 |
| Portfolio turnover rate (%) | 100* | 140f | 122f | 138 | 160 | 178 |
| a For the six months ended April 30, 2007 (Unaudited). b Per share data have been restated to reflect the effects of a 1.81761006 for 1 stock split effective November 11, 2005. c Based on average shares outstanding during the period. d Total return would have been lower had certain expenses not been reduced. e Net investment income per share includes non-recurring dividend income amounting to $.04 per share. f Excludes portfolio securities delivered as a result of processing redemption in-kind transactions. g Net investment income per share and the ratio of net investment income include non-recurring dividend income amounting to $0.02 per share and 0.17% of average daily net assets, respectively. * Annualized ** Not annualized *** Amount is less than $.005. | ||||||
Notes to Financial Statements (Unaudited)
A. Significant Accounting Policies
DWS International Select Equity Fund (the "Fund") is a diversified series of DWS Advisor Funds (the "Trust") which is registered under the Investment Company Act of 1940, as amended, (the "1940 Act"), as an open-end management investment company organized as a Delaware business trust.
The Fund offers multiple classes of shares which provide investors with different purchase options. Class A shares are offered to investors subject to an initial sales charge. Class B shares are offered without an initial sales charge but are subject to higher ongoing expenses than Class A shares and a contingent deferred sales charge payable upon certain redemptions. Class B shares automatically convert to Class A shares six years after issuance. Class C shares are offered to investors without an initial sales charge but are subject to higher ongoing expenses than Class A shares and a contingent deferred sales charge payable upon certain redemptions within one year of purchase. Class C shares do not convert into another class. Class R shares are only available to participants in certain retirement plans and are offered to investors without an initial sales charge. Institutional Class shares are offered to a limited group of investors, are not subject to initial or contingent deferred sales charges and have lower ongoing expenses than other classes. Class S shares are not subject to initial or contingent deferred sales charges and are generally not available to new investors except under certain circumstances.
Investment income, realized and unrealized gains and losses, and certain fund-level expenses and expense reductions, if any, are borne pro rata on the basis of relative net assets by the holders of all classes of shares, except that each class bears certain expenses unique to that class such as distribution service fees, services to shareholders and certain other class-specific expenses. Differences in class-level expenses may result in payment of different per share dividends by class. All shares of the Fund have equal rights with respect to voting subject to class-specific arrangements.
The Fund's financial statements are prepared in accordance with accounting principles generally accepted in the United States of America which require the use of management estimates. Actual results could differ from those estimates. The policies described below are followed consistently by the Fund in the preparation of their financial statements.
Security Valuation. Investments are stated at value determined as of the close of regular trading on the New York Stock Exchange on each day the exchange is open for trading. Equity securities are valued at the most recent sale price or official closing price reported on the exchange (US or foreign) or over-the-counter market on which the security is traded most extensively. Securities for which no sales are reported are valued at the calculated mean between the most recent bid and asked quotations on the relevant market or, if a mean cannot be determined, at the most recent bid quotation.
Money market instruments purchased with an original or remaining maturity of sixty days or less, maturing at par, are valued at amortized cost. Investments in open-end investment companies and Cash Management QP Trust are valued at their net asset value each business day.
Securities and other assets for which market quotations are not readily available or for which the above valuation procedures are deemed not to reflect fair value are valued in a manner that is intended to reflect their fair value as determined in accordance with procedures approved by the Trustees. The Fund may use a fair valuation model to value international equity securities in order to adjust for events which may occur between the close of the foreign exchanges and the close of the New York Stock Exchange.
In September 2006, the Financial Accounting Standards Board ("FASB") released Statement of Financial Accounting Standards No. 157, "Fair Value Measurements" ("FAS 157"). FAS 157 defines fair value, establishes a framework for measuring fair value and expands disclosures about fair value measurements. FAS 157 is effective for fiscal years beginning after November 15, 2007. As of April 30, 2007, management does not believe the adoption of FAS 157 will impact the amounts reported in the financial statements, however, additional disclosures will be required about the inputs used to develop the measurements of fair value and the effect of certain of the measurements reported in the statement of operations for a fiscal period.
Securities Lending. The Fund may lend securities to financial institutions. The Fund retains beneficial ownership of the securities it has loaned and continues to receive interest and dividends paid by the issuer of securities and to participate in any changes in their market value. The Fund requires the borrowers of the securities to maintain collateral with the Fund consisting of liquid, unencumbered assets having a value at least equal to the value of the securities loaned. The Fund may invest the cash collateral into a joint trading account in an affiliated money market fund pursuant to an Exemptive Order issued by the SEC. The Fund receives compensation for lending its securities either in the form of fees or by earning interest on invested cash collateral net of borrower rebates and fees paid to the lending agent. Either the Fund or the borrower may terminate the loan. The Fund is subject to all investment risks associated with the value of any cash collateral received, including, but not limited to, interest rate, credit and liquidity risk associated with such investments.
Futures Contracts. A futures contract is an agreement between a buyer or seller and an established futures exchange or its clearinghouse in which the buyer or seller agrees to take or make a delivery of a specific amount of a financial instrument at a specified price on a specific date (settlement date). The Fund may enter into futures contracts as a hedge against anticipated interest rate, currency or equity market changes, and for duration management, risk management and return enhancement purposes.
Upon entering into a futures contract, the Fund is required to deposit with a financial intermediary an amount ("initial margin") equal to a certain percentage of the face value indicated in the futures contract. Subsequent payments ("variation margin") are made or received by the Fund dependent upon the daily fluctuations in the value of the underlying security and are recorded for financial reporting purposes as unrealized gains or losses by the Fund. When entering into a closing transaction, the Fund will realize a gain or loss equal to the difference between the value of the futures contract to sell and the futures contract to buy. Futures contracts are valued at the most recent settlement price.
Certain risks may arise upon entering into futures contracts, including the risk that an illiquid secondary market will limit the Fund's ability to close out a futures contract prior to the settlement date and that a change in the value of a futures contract may not correlate exactly with the changes in the value of the securities or currencies hedged. When utilizing futures contracts to hedge, the Fund gives up the opportunity to profit from favorable price movements in the hedged positions during the term of the contract.
Foreign Currency Translations. The books and records of the Fund are maintained in US dollars. Investment securities and other assets and liabilities denominated in a foreign currency are translated into US dollars at the prevailing exchange rates at period end. Purchases and sales of investment securities, income and expenses are translated into US dollars at the prevailing exchange rates on the respective dates of the transactions.
Net realized and unrealized gains and losses on foreign currency transactions represent net gains and losses between trade and settlement dates on securities transactions, the disposition of forward foreign currency exchange contracts and foreign currencies, and the difference between the amount of net investment income accrued and the US dollar amount actually received. That portion of both realized and unrealized gains and losses on investments that results from fluctuations in foreign currency exchange rates is not separately disclosed but is included with net realized and unrealized gain/appreciation and loss/depreciation on investments.
Federal Income Taxes. The Fund's policy is to comply with the requirements of the Internal Revenue Code, as amended, which are applicable to regulated investment companies, and to distribute all of its taxable income to its shareholders. Accordingly, the Fund paid no federal income taxes and no federal income tax provision was required.
In July 2006, FASB issued Interpretation No. 48 ("FIN 48"), "Accounting for Uncertainty in Income Taxes — an interpretation of FASB Statement No. 109" (the "Interpretation"). The Interpretation establishes for the Fund a minimum threshold for financial statement recognition of the benefit of positions taken in filing tax returns (including whether the Fund is taxable in certain jurisdictions), and requires certain expanded tax disclosures. The Interpretation is effective for fiscal years beginning after December 15, 2006. On December 22, 2006, the SEC indicated that they would not object if a Fund implements FIN 48 in the first required financial statement reporting period for its fiscal year beginning after December 15, 2006. Management has begun to evaluate the application of the Interpretation to the Fund and is not in a position at this time to estimate the significance of its impact, if any, on the Fund's financial statements.
Distribution of Income and Gains. Net investment income of the Fund, if any, is declared and distributed to shareholders annually. Net realized gains from investment transactions, in excess of available capital loss carryforwards, would be taxable to the Fund if not distributed, and, therefore, will be distributed to shareholders at least annually.
The timing and characterization of certain income and capital gains distributions are determined annually in accordance with federal tax regulations which may differ from accounting principles generally accepted in the United States of America. These differences primarily relate to passive foreign investment companies and foreign denominated investments, and certain securities sold at a loss. As a result, net investment income (loss) and net realized gain (loss) on investment transactions for a reporting period may differ significantly from distributions during such period. Accordingly, the Fund may periodically make reclassifications among certain of its capital accounts without impacting the net asset value of the Fund.
The tax character of current year distributions will be determined at the end of the current fiscal year.
Redemption Fees. For the period from November 1, 2006 to March 11, 2007, the redemption or exchange of shares held for less than 30 days were assessed a fee of 2% of the total amount redeemed or exchanged. Effective March 12, 2007, the Fund imposes a redemption fee of 2% of the total redemption amount on all Fund share redeemed or exchanged within 15 days of buying them, either by purchase or exchange. This fee is assessed and retained by the Fund for the benefit of the remaining shareholders. The redemption fee is accounted for as an addition to paid-in-capital.
Expenses. Expenses of the Trust arising in connection with a specific Fund are allocated to that Fund. Other Trust expenses which cannot be directly attributed to a Fund are apportioned among the Funds in the Trust.
Contingencies. In the normal course of business, the Fund may enter into contracts with service providers that contain general indemnification clauses. The Fund's maximum exposure under these arrangements is unknown as this would involve future claims that may be made against the Fund that have not yet been made. However, based on experience, the Fund expects the risk of loss to be remote.
Other. Investment transactions are accounted for a trade date plus one basis for daily net asset value calculations. However, for financial reporting purposes, investment security transactions are reported on trade date. Interest income is recorded on the accrual basis. Dividend income is recorded on the ex-dividend date net of foreign withholding taxes. Certain dividends from foreign securities may be recorded subsequent to the ex-dividend date as soon as the Fund is informed of such dividends. Realized gains and losses from investment transactions are recorded on an identified cost basis.
B. Purchases and Sales of Securities
During the six months ended April 30, 2007, purchases and sales of investment securities (excluding short-term investments and in-kind redemptions) aggregated $121,097,934 and $181,047,191, respectively.
C. Related Parties
DWS Scudder is part of Deutsche Asset Management, which is the marketing name in the US for the asset management activities of Deutsche Bank AG. Deutsche Investment Management Americas Inc. ("DIMA" or the "Advisor"), an indirect, wholly owned subsidiary of Deutsche Bank AG, is the Advisor for the Fund. Prior to January 1, 2007, Deutsche Asset Management Inc. ("DAMI"), an indirect, wholly owned subsidiary of Deutsche Bank AG, was the Advisor for the Fund. Effective January 1, 2007, DAMI merged with DIMA. The Board of the Fund approved a new investment management agreement between the Fund and DIMA. The new investment management agreement is identical in substance to the previous investment management agreement for the Fund, except for the named investment advisor.
Management Agreement. Under the Investment Management Agreement with the Advisor, the Fund pays a monthly management fee based on the Fund's average daily net assets accrued daily and payable monthly, at the following annual rates:
| First $1.5 billion of the Fund's average daily net assets | .700% |
| Next $1.75 billion of such net assets | .685% |
| Next $1.75 billion of such net assets | .670% |
| Over $5.0 billion of such net assets | .655% |
Accordingly, for the six months ended April 30, 2007, the Advisor waived a portion of its management fee pursuant to the Investment Management Agreement aggregating $107,379 and the amount charged aggregated $744,328 which was equivalent to an annualized effective rate of 0.61% of the Fund's average daily net assets.
In addition, for the six months ended April 30, 2007, the Advisor reimbursed the Fund $13,973 of Services to Shareholders from non-affiliated entities for Class S shares.
For the period from November 1, 2006 through September 30, 2007, the Advisor and the Administrator have contractually agreed to waive their fees or reimburse expenses of the Fund (excluding certain expenses such as extraordinary expenses, taxes, brokerage, interest, proxy and organizational and offering expenses) to the extent necessary to maintain the operating expenses of the classes of the Fund as follows:
| Class A | 1.60% |
| Class B | 2.35% |
| Class C | 2.35% |
| Class R | 1.85% |
| Class S | .97% |
| Institutional Class | .92% |
In addition, the period from November 1, 2006 through September 30, 2007, the Advisor and the Administrator have voluntarily agreed to waive their fees or reimburse expenses of the Fund (excluding certain expenses such as extraordinary expenses, taxes, brokerage, interest, proxy and organizational and offering expenses) to the extent necessary to maintain the operating expenses of the classes of the Fund as follows:
| Class A | 1.50% |
| Class B | 2.25% |
| Class C | 2.25% |
| Class R | 1.75% |
Administration Fee. Pursuant to the Administrative Services Agreement with the Advisor, the Advisor provides most administrative services to the Fund. For all services provided under the Administrative Services Agreement, the Fund pays the Advisor an annual fee ("Administration Fee") of 0.10% of the Fund's average daily net assets, computed and accrued daily and payable monthly. For the six months ended April 30, 2007, the Advisor received an Administration Fee of $121,672, of which $20,035 is unpaid.
Service Provider Fees. DWS Scudder Investments Service Company ("DWS-SISC"), an affiliate of the Advisor, is the Fund's transfer agent, dividend-paying agent and shareholder service agent for Class A, B, C, R and Institutional Class shares of the Fund. DWS Scudder Service Corporation ("DWS-SSC"), an affiliate of the Advisor, was the Fund's transfer agent, dividend-paying agent and shareholder service agent for Class S shares of the Fund. Effective April 1, 2007, DWS-SSC merged with DWS-SISC. The Board of the Fund approved a new transfer agency agreement between the Fund and DWS-SISC. The new transfer agency agreement is identical in substance to the previous transfer agency agreement for the Fund, except for the named transfer agent. Pursuant to a sub-transfer agency agreement among DWS-SISC, DWS-SSC (through March 31, 2007) and DST Systems, Inc. ("DST"), DWS-SISC and DWS-SSC compensate DST out of the shareholder servicing fee they receive from the Fund. For the six months ended April 30, 2007, the amounts charged to the Fund by DWS-SISC and DWS-SSC (through March 31, 2007) were as follows:
Services to Shareholders | Total Aggregated | Waived | Unpaid at April 30, 2007 |
| Class A | $ 74,797 | $ — | $ 37,697 |
| Class B | 11,257 | — | 9,156 |
| Class C | 13,645 | — | 6,026 |
| Class R | 496 | — | 185 |
| Class S | 26,203 | 26,203 | — |
| Institutional Class | 14,013 | 14,013 | — |
| $ 140,411 | $ 40,216 | $ 53,064 |
Distribution Service Agreement. Under the Distribution Agreement, in accordance with Rule 12b-1 under the 1940 Act, DWS Scudder Distributors, Inc. ("DWS-SDI"), an affiliate of the Advisor, receives a fee ("Distribution Fee") of 0.75% of the average daily net assets of the Class B and C shares of the Fund, and 0.25% of the average daily net assets of Class R shares. Pursuant to the agreement, DWS-SDI enters into related selling group agreements with various firms at various rates for sales of Class B, C and R shares. For the six months ended April 30, 2007, the Distribution Fee was as follows:
Distribution Fee | Total Aggregated | Unpaid at April 30, 2007 |
| Class B | $ 40,016 | $ 18,836 |
| Class C | 58,512 | 29,266 |
| Class R | 924 | 714 |
| $ 99,452 | $ 48,816 |
In addition, DWS-SDI provides information and administrative services for a fee ("Service Fee") to Class A, B, C and Class R shareholders at an annual rate of up to 0.25% of average daily net assets for each such class. DWS-SDI in turn has various agreements with financial services firms that provide these services and pays these fees based upon the assets of shareholder accounts the firms service. For the six months ended April 30, 2007, the Service Fee was as follows:
Service Fee | Total Aggregated | Unpaid at April 30, 2007 | Annualized Effective Rate |
| Class A | $ 101,285 | $ 23,360 | .24% |
| Class B | 13,100 | 4,401 | .25% |
| Class C | 18,911 | 14,055 | .24% |
| Class R | 594 | 2,540 | .16% |
| $ 133,890 | $ 44,356 |
|
Underwriting Agreement and Contingent Deferred Sales Charge. DWS-SDI is the principal underwriter for the Fund. Underwriting commissions paid in connection with the distribution of Class A shares for the six months ended April 30, 2007 aggregated $7,440.
In addition, DWS-SDI receives any contingent deferred sales charge ("CDSC") from Class B share redemptions occurring within six years of purchase and Class C share redemptions occurring within one year of purchase. There is no such charge upon redemption of any share appreciation or reinvested dividends. The CDSC is based on declining rates ranging from 4% to 1% for Class B and 1% for Class C, of the value of the shares redeemed. For the six months ended April 30, 2007, the CDSC for Class B and C shares aggregated $9,901 and $1,175, respectively. A deferred sales charge of up to 1% is assessed on certain redemptions of Class A.
Typesetting and Filing Service Fees. Under an agreement with DIMA, DIMA is compensated for providing typesetting and certain regulatory filing services to the Fund. For the six months ended April 30, 2007, the amount charged to the Fund by DIMA included in the Statement of Operations under "reports to shareholders" aggregated $27,219, of which $9,969 is unpaid.
Trustees' Fees and Expenses. As compensation for his or her services, each Independent Trustee receives an aggregated annual fee, plus a fee for each meeting attended (plus reimbursement for reasonable out-of-pocket expenses incurred in connection with his or her attendance at board and committee meetings) from each fund in the Fund Complex for which he or she serves. In addition, the Chairperson of the Board and the Chairperson of each committee of the Board receive additional compensation for their services. Payment of such fees and expenses is allocated among all such funds described above in direct proportion to their relative net assets.
Cash Management QP Trust. Pursuant to an Exemptive Order issued by the SEC, the Fund may invest in the Cash Management QP Trust (the "QP Trust") and other affiliated funds managed by the Advisor. The QP Trust seeks to provide as high a level of current income as is consistent with the preservation of capital and the maintenance of liquidity. The QP Trust does not pay the Advisor a management fee for the affiliated fund's investment in the QP Trust.
D. Line of Credit
The Fund and other affiliated funds (the "Participants") share in a $750 million revolving credit facility administered by JPMorgan Chase Bank N.A. for temporary or emergency purposes, including the meeting of redemption requests that otherwise might require the untimely disposition of securities. The Participants are charged an annual commitment fee which is allocated, based upon net assets, among each of the Participants. Interest is calculated at the Federal Funds Rate plus 0.35 percent. The Fund may borrow up to a maximum of 33 percent of its net assets under the agreement.
E. Share Transactions
The following table summarizes share and dollar activity in the Fund:
| Six Months Ended April 30, 2007 | Year Ended October 31, 2006 | ||
| Shares | Dollars | Shares | Dollars |
Shares sold | ||||
| Class A | 1,226,131 | $ 15,591,551 | 3,278,429 | $ 41,260,318 |
| Class B | 51,295 | 617,986 | 171,576 | 2,124,559 |
| Class C | 122,502 | 1,495,857 | 270,624 | 3,301,161 |
| Investment Class** | — | — | 1,600,816* | 19,694,951* |
| Class R | 7,000 | 87,260 | 182,309* | 2,238,212* |
| Class S | 1,116,238 | 13,582,113 | 397,104* | 5,061,158* |
| Institutional Class | 933,395 | 11,258,102 | 2,195,405* | 27,238,029* |
| Premier Class** | — | — | 1,876,098* | 23,672,402* |
| |
| $ 42,632,869 |
| $ 124,590,790 |
Shares issued to shareholders in reinvestment of distributions | ||||
| Class A | 1,087,444 | $ 12,733,975 | 1,044,040 | $ 13,604,052 |
| Class B | 130,840 | 1,496,815 | 43,747 | 557,342 |
| Class C | 183,058 | 2,094,183 | 71,631 | 911,868 |
| Investment Class** | — | — | 153,144* | 1,955,649* |
| Class R | 6,151 | 70,305 | 15,813* | 201,760* |
| Class S | 387,036 | 4,432,695 | 6,104* | 78,016* |
| Institutional Class | 1,492,933 | 17,108,035 | 467,591* | 5,980,504* |
| Premier Class** | — | — | 491,138* | 6,281,652* |
| |
| $ 37,936,008 |
| $ 29,570,843 |
Shares redeemed | ||||
| Class A | (1,110,821) | $ (14,266,438) | (2,729,122) | $ (33,903,986) |
| Class B | (124,665) | (1,517,961) | (223,244) | (2,715,189) |
| Class C | (235,168) | (2,879,405) | (553,317) | (6,711,776) |
| Investment Class** | — | — | (1,981,961)* | (24,543,548)* |
| Class R | (205,414) | (2,672,985) | (169,737)* | (2,090,320)* |
| Class S | (1,012,203) | (12,134,661) | (157,215)* | (2,002,019)* |
| Institutional Class | (5,318,421) | (64,127,739) | (3,039,082)* | (37,712,923)* |
| Premier Class** | — | — | (2,780,932)* | (34,550,372)* |
| |
| $ (97,599,189) |
| $ (144,230,133) |
Shares converted** | ||||
| Investment Class | — | $ — | (2,883,076)* | $ (36,878,755)* |
| Class S | — | — | 2,881,049* | 36,878,755* |
| Institutional Class | — | — | 668,562* | 8,350,306* |
| Premier Class | — | — | (667,814)* | (8,350,306)* |
| |
| $ |
| $ — |
Redemption fees | $ 3,865 |
| $ 77,533 | |
In-kind redemptions | ||||
| Class A | $ | (12,544,593) | $ (165,061,759) | |
| Premier Class | — | — | (7,302,959)* | (89,315,195)* |
| |
| $ |
| $ (254,376,954) |
Net increase (decrease) | ||||
| Class A | 1,202,754 | $ 14,060,055 | (10,951,246) | $ (144,046,791) |
| Class B | 57,470 | 596,847 | (7,922) | (33,190) |
| Class C | 70,392 | 710,641 | (211,062) | (2,498,635) |
| Investment Class** | — | — | (1,733,915)* | (39,751,501)* |
| Class R | (192,263) | (2,515,420) | 28,385* | 350,562* |
| Class S | 491,071 | 5,881,897 | 3,127,041* | 40,016,351* |
| Institutional Class | (2,892,093) | (35,760,467) | 292,476* | 3,857,031* |
| Premier Class** | — | — | (8,384,469)* | (102,261,748)* |
| |
| $ (17,026,447) |
| $ (244,367,921) |
** On August 18, 2006, Premier Class shares converted to Institutional Class shares. On October 20, 2006, Investment Class shares converted to Class S shares.
F. Regulatory Matters and Litigation
Regulatory Settlements. On December 21, 2006, Deutsche Asset Management ("DeAM") settled proceedings with the Securities and Exchange Commission ("SEC") and the New York Attorney General on behalf of Deutsche Asset Management, Inc. ("DAMI") and Deutsche Investment Management Americas Inc. ("DIMA"), the investment advisors to many of the DWS Scudder funds, regarding allegations of improper trading of fund shares at DeAM and at the legacy Scudder and Kemper organizations prior to their acquisition by DeAM in April 2002. These regulators alleged that although the prospectuses for certain funds in the regulators' view indicated that the funds did not permit market timing, DAMI and DIMA breached their fiduciary duty to those funds in that their efforts to limit trading activity in the funds were not effective at certain times. The regulators also alleged that DAMI and DIMA breached their fiduciary duty to certain funds by entering into certain market timing arrangements with investors. These trading arrangements originated in businesses that existed prior to the currently constituted DeAM organization, which came together as a result of various mergers of the legacy Scudder, Kemper and Deutsche fund groups, and all of the arrangements were terminated prior to the start of the regulatory investigations that began in the summer of 2003. No current DeAM employee approved these trading arrangements. Under the terms of the settlements, DAMI and DIMA neither admitted nor denied any wrongdoing.
The terms of the SEC settlement, which identified improper trading in the legacy Deutsche and Kemper mutual funds only, provide for payment of disgorgement in the amount of $17.2 million. The terms of the settlement with the New York Attorney General provide for payment of disgorgement in the amount of $102.3 million, which is inclusive of the amount payable under the SEC settlement, plus a civil penalty in the amount of $20 million. The total amount payable by DeAM, approximately $122.3 million, would be distributed to funds in accordance with a distribution plan to be developed by a distribution consultant. The funds' investment advisors do not believe these amounts will have a material adverse financial impact on them or materially affect their ability to perform under their investment management agreements with the DWS funds. The above-described amounts are not material to Deutsche Bank, and have already been reserved.
Among the terms of the settled orders, DeAM is subject to certain undertakings regarding the conduct of its business in the future, including: formation of a Code of Ethics Oversight Committee to oversee all matters relating to issues arising under the advisors' Code of Ethics; establishment of an Internal Compliance Controls Committee having overall compliance oversight responsibility of the advisors; engagement of an Independent Compliance Consultant to conduct a comprehensive review of the advisors' supervisory compliance and other policies and procedures designed to prevent and detect breaches of fiduciary duty, breaches of the Code of Ethics and federal securities law violations by the advisors and their employees; and commencing in 2008, the advisors shall undergo a compliance review by an independent third party.
In addition, DeAM is subject to certain further undertakings relating to the governance of the mutual funds, including that: at least 75% of the members of the Boards of Trustees/Directors overseeing the DWS Funds continue to be independent of DeAM; the Chairmen of the DWS Funds' Boards of Trustees/Directors continue to be independent of DeAM; DeAM maintain existing management fee reductions for certain funds for a period of five years and not increase management fees for certain funds during this period; the funds retain a senior officer (or independent consultants) responsible for assisting in the review of fee arrangements and monitoring compliance by the funds and the investment advisors with securities laws, fiduciary duties, codes of ethics and other compliance policies, the expense of which shall be borne by DeAM; and periodic account statements, fund prospectuses and the mutual funds' web site contain additional disclosure and/or tools that assist investors in understanding the fees and costs associated with an investment in the funds and the impact of fees and expenses on fund returns.
DeAM has also settled proceedings with the Illinois Secretary of State regarding market timing matters. The terms of the Illinois settlement provide for investor education contributions totaling approximately $4 million and a payment in the amount of $2 million to the Securities Audit and Enforcement Fund.
On September 28, 2006, the SEC and the National Association of Securities Dealers ("NASD") announced final agreements in which Deutsche Investment Management Americas Inc. ("DIMA"), Deutsche Asset Management, Inc. ("DAMI") and Scudder Distributors, Inc. ("SDI") (now known as DWS Scudder Distributors, Inc.) settled administrative proceedings regarding disclosure of brokerage allocation practices in connection with sales of the Scudder Funds' (now known as the DWS Scudder Funds) shares during 2001-2003. The agreements with the SEC and NASD are reflected in orders which state, among other things, that DIMA and DAMI failed to disclose potential conflicts of interest to the fund Boards and to shareholders relating to SDI's use of certain funds' brokerage commissions to reduce revenue sharing costs to broker-dealer firms with whom it had arrangements to market and distribute Scudder Fund shares. These directed brokerage practices were discontinued in October 2003.
Under the terms of the settlements, in which DIMA, DAMI and SDI neither admitted nor denied any of the regulators' findings, DIMA, DAMI and SDI agreed to pay disgorgement, prejudgment interest and civil penalties in the total amount of $19.3 million. The portion of the settlements distributed to the funds was approximately $17.8 million and was paid to the funds as prescribed by the settlement orders based upon the amount of brokerage commissions from each fund used to satisfy revenue sharing agreements with broker-dealers who sold fund shares. Based on the prescribed settlement order, the Fund was not entitled to a portion of the settlement.
As part of the settlements, DIMA, DAMI and SDI also agreed to implement certain measures and undertakings relating to revenue sharing payments including making additional disclosures in the fund Prospectuses or Statements of Additional Information, adopting or modifying relevant policies and procedures and providing regular reporting to the fund Boards.
Private Litigation Matters. The matters alleged in the regulatory settlements described above also serve as the general basis of a number of private class action lawsuits involving the DWS funds. These lawsuits name as defendants various persons, including certain DWS funds, the funds' investment advisors and their affiliates, and certain individuals, including in some cases fund Trustees/Directors, officers, and other parties. Each DWS fund's investment advisor has agreed to indemnify the applicable DWS funds in connection with these lawsuits, or other lawsuits or regulatory actions that may be filed making similar allegations.
Based on currently available information, the funds' investment advisors believe the likelihood that the pending lawsuits will have a material adverse financial impact on a DWS fund is remote and such actions are not likely to materially affect their ability to perform under their investment management agreements with the DWS funds.
Investment Management Agreement Approval
In December 2006, the Board approved an amended and restated investment management agreement with DIMA in connection with the merger of DAMI into DIMA. In determining to approve this agreement, the Board considered Deutsche Bank's representations that this change was administrative in nature, and would not involve any change in operations or services provided to the fund, or to the personnel involved with providing such services. The Board also considered that the terms of the agreement with DIMA were substantially identical to the terms of the fund's prior agreement with DAMI. A discussion of factors considered by the Board in determining to approve the continuation of the fund's prior investment management agreement with DAMI in September 2006 in connection with the Board's annual review of the fund's contractual arrangements is included in the fund's report for the period ended October 31, 2006.
For shareholders of Classes A, B, C and Institutional Class | |
Automated Information Line | (800) 621-1048 Personalized account information, information on other DWS funds and services via touchtone telephone and for Classes A, B and C only, the ability to exchange or redeem shares. |
Web Site | www.dws-scudder.com View your account transactions and balances, trade shares, monitor your asset allocation, and change your address, 24 hours a day.Obtain prospectuses and applications, blank forms, interactive worksheets, news about DWS funds, subscription to fund updates by e-mail, retirement planning information, and more. |
For More Information | (800) 621-1048 To speak with a DWS Scudder service representative. |
Written Correspondence | DWS Scudder PO Box 219151Kansas City, MO 64121-9151 |
Proxy Voting | A description of the fund's policies and procedures for voting proxies for portfolio securities and information about how the fund voted proxies related to its portfolio securities during the 12-month period ended June 30 is available on our Web site — www.dws-scudder.com (click on "proxy voting"at the bottom of the page) — or on the SEC's Web site — www.sec.gov. To obtain a written copy of the fund's policies and procedures without charge, upon request, call us toll free at (800) 621-1048. |
Principal Underwriter | If you have questions, comments or complaints, contact: DWS Scudder Distributors, Inc. 222 South Riverside PlazaChicago, IL 60606-5808 (800) 621-1148 |
| Class A | Class B | Class C | Institutional Class |
Nasdaq Symbol | DBISX | DBIBX | DBICX | MGINX |
CUSIP Number | 23339E 400 | 23339E 509 | 23339E 608 | 23339E 103 |
Fund Number | 499 | 699 | 799 | 559 |
For shareholders of Class R | |
Automated Information Line | DWS Scudder Flex Plan Access (800) 532-8411 24-hour access to your retirement plan account. |
Web Site | www.dws-scudder.com Click "Retirement Plans" to reallocate assets, process transactions and review your funds through our secure online account access.Obtain prospectuses and applications, blank forms, interactive worksheets, news about DWS funds, subscription to fund updates by e-mail, retirement planning information, and more. |
For More Information | (800) 543-5776 To speak with a service representative. |
Written Correspondence | DWS Scudder Investments Service Company 222 South Riverside PlazaChicago, IL 60606-5806 |
Proxy Voting | A description of the fund's policies and procedures for voting proxies for portfolio securities and information about how the fund voted proxies related to its portfolio securities during the 12-month period ended June 30 is available on our Web site — www.dws-scudder.com (click on "proxy voting"at the bottom of the page) — or on the SEC's Web site — www.sec.gov. To obtain a written copy of the fund's policies and procedures without charge, upon request, call us toll free at (800) 621-1048. |
Principal Underwriter | If you have questions, comments or complaints, contact: DWS Scudder Distributors, Inc. 222 South Riverside PlazaChicago, IL 60606-5808 (800) 621-1148 |
| Class R |
Nasdaq Symbol | DBITX |
CUSIP Number | 23339E 806 |
Fund Number | 1501 |
For shareholders of Class S | |
Automated Information Lines | (800) 728-3337 Personalized account information, the ability to exchange or redeem shares, and information on other DWS funds and services via touchtone telephone. |
Web Site | www.dws-scudder.com |
| View your account transactions and balances, trade shares, monitor your asset allocation, and change your address, 24 hours a day. Obtain prospectuses and applications, blank forms, interactive worksheets, news about DWS funds, subscription to fund updates by e-mail, retirement planning information, and more. |
For More Information | (800) 728-3337 To speak with a DWS Scudder service representative. |
Written Correspondence | DWS Scudder PO Box 219151Kansas City, MO 64121-9151 |
Proxy Voting | A description of the fund's policies and procedures for voting proxies for portfolio securities and information about how the fund voted proxies related to its portfolio securities during the 12-month period ended June 30 is available on our Web site — www.dws-scudder.com (click on "proxy voting"at the bottom of the page) — or on the SEC's Web site — www.sec.gov. To obtain a written copy of the fund's policies and procedures without charge, upon request, call us toll free at (800) 621-1048. |
Principal Underwriter | If you have questions, comments or complaints, contact: DWS Scudder Distributors, Inc. 222 South Riverside PlazaChicago, IL 60606-5808 (800) 621-1148 |
| Class S |
Nasdaq Symbol | DBIVX |
Fund Number | 2399 |
This privacy statement is issued by DWS Scudder Distributors, Inc., Deutsche Investment Management Americas Inc., DeAM Investor Services, Inc., DWS Trust Company and the DWS Funds.
We never sell customer lists or individual client information. We consider privacy fundamental to our client relationships and adhere to the policies and practices described below to protect current and former clients' information. Internal policies are in place to protect confidentiality, while allowing client needs to be served. Only individuals who need to do so in carrying out their job responsibilities may access client information. We maintain physical, electronic and procedural safeguards that comply with federal and state standards to protect confidentiality. These safeguards extend to all forms of interaction with us, including the Internet.
In the normal course of business, clients give us nonpublic personal information on applications and other forms, on our websites, and through transactions with us or our affiliates. Examples of the nonpublic personal information collected are name, address, Social Security number and transaction and balance information. To be able to serve our clients, certain of this client information is shared with affiliated and nonaffiliated third party service providers such as transfer agents, custodians, and broker-dealers to assist us in processing transactions and servicing your account with us. In addition, we may disclose all of the information we collect to companies that perform marketing services on our behalf or to other financial institutions with which we have joint marketing agreements. The organizations described above that receive client information may only use it for the purpose designated by the DWS Scudder Companies listed above.
We may also disclose nonpublic personal information about you to other parties as required or permitted by law. For example, we are required or we may provide information to government entities or regulatory bodies in response to requests for information or subpoenas, to private litigants in certain circumstances, to law enforcement authorities, or any time we believe it necessary to protect the firm.
Questions on this policy may be sent to:
DWS Scudder
Attention: Correspondence — Chicago
P.O. Box 219415
Kansas City, MO 64121-9415
September 2006
Notes
Notes
Notes
Notes
Notes

ITEM 2. | CODE OF ETHICS |
|
|
| Not applicable. |
|
|
ITEM 3. | AUDIT COMMITTEE FINANCIAL EXPERT |
|
|
| Not applicable. |
|
|
ITEM 4. | PRINCIPAL ACCOUNTANT FEES AND SERVICES |
|
|
| Not applicable. |
ITEM 5. | AUDIT COMMITTEE OF LISTED REGISTRANTS |
|
|
| Not Applicable |
|
|
ITEM 6. | SCHEDULE OF INVESTMENTS |
|
|
| Not Applicable |
|
|
ITEM 7. | DISCLOSURE OF PROXY VOTING POLICIES AND PROCEDURES FOR CLOSED-END MANAGEMENT INVESTMENT COMPANIES |
|
|
| Not applicable. |
|
|
ITEM 8. | PORTFOLIO MANAGERS OF CLOSED-END MANAGEMENT INVESTMENT COMPANIES |
|
|
| Not applicable. |
ITEM 9. | PURCHASES OF EQUITY SECURITIES BY CLOSED-END MANAGEMENT INVESTMENT COMPANY AND AFFILIATED PURCHASERS |
|
|
| Not Applicable. |
ITEM 10. | SUBMISSION OF MATTERS TO A VOTE OF SECURITY HOLDERS |
|
|
| The Committee on Independent Trustees/Directors selects and nominates Independent Trustees/Directors. Fund shareholders may submit nominees that will be considered by the committee when a Board vacancy occurs. Submissions should be mailed to: c/o Dawn-Marie Driscoll, PO Box 100176, Cape Coral, FL 33910. |
|
|
ITEM 11. | CONTROLS AND PROCEDURES |
|
|
| (a) The Chief Executive and Financial Officers concluded that the Registrant's Disclosure Controls and Procedures are effective based on the evaluation of the Disclosure Controls and Procedures as of a date within 90 days of the filing date of this report. |
|
|
| (b) There have been no changes in the registrant's internal control over financial reporting that occurred during the registrant's last half-year (the registrant's second fiscal half-year in the case of the annual report) that has materially affected, or is reasonably likely to materially affect, the registrant's internal controls over financial reporting. |
|
|
ITEM 12. | EXHIBITS |
|
|
| (a)(1) Certification pursuant to Rule 30a-2(a) under the Investment Company Act of 1940 (17 CFR 270.30a-2(a)) is filed and attached hereto as Exhibit 99.CERT. |
|
|
| (b) Certification pursuant to Rule 30a-2(b) under the Investment Company Act of 1940 (17 CFR 270.30a-2(b)) is furnished and attached hereto as Exhibit 99.906CERT. |
Form N-CSRS Item F
SIGNATURES
Pursuant to the requirements of the Securities Exchange Act of 1934 and the Investment Company Act of 1940, the registrant has duly caused this report to be signed on its behalf by the undersigned, thereunto duly authorized.
Registrant: | DWS International Select Equity Fund, a series of DWS Advisor Funds |
By: | /s/Michael G. Clark |
| Michael G. Clark |
President
Date: | June 27, 2007 |
Pursuant to the requirements of the Securities Exchange Act of 1934 and the Investment Company Act of 1940, this report has been signed below by the following persons on behalf of the registrant and in the capacities and on the dates indicated.
Registrant: | DWS International Select Equity Fund, a series of DWS Advisor Funds |
By: | /s/Michael G. Clark |
| Michael G. Clark |
President
Date: | June 27, 2007 |
By: | /s/Paul Schubert |
| Paul Schubert |
Chief Financial Officer and Treasurer
Date: | June 27, 2007 |