UNITED STATES
SECURITIES AND EXCHANGE COMMISSION
WASHINGTON, D. C. 20549
FORM N-CSRS
Investment Company Act file number 811-04760
DWS Advisor Funds
(Exact Name of Registrant as Specified in Charter)
One South Street
Baltimore, MD 21202
(Address of principal executive offices) (Zip code)
Registrant’s Telephone Number, including Area Code: (212) 454-7190
Paul Schubert
345 Park Avenue
New York, NY 10154
(Name and Address of Agent for Service)
Date of fiscal year end: | 10/31 |
Date of reporting period: | 4/30/07 |
ITEM 1. REPORT TO STOCKHOLDERS
|
|
|
APRIL 30, 2007
Semiannual Report
to Shareholders
DWS Core Fixed Income Fund
 |
Contents
click here Performance Summary click here Information About Your Fund's Expenses click here Portfolio Management Review click here Portfolio Summary click here Investment Portfolio click here Financial Statements click here Financial Highlights click here Notes to Financial Statements click here Investment Management Agreement Approval click here Account Management Resources click here Privacy Statement |
This report must be preceded or accompanied by a prospectus. To obtain a prospectus for any of our funds, refer to the Account Management Resources information provided in the back of this booklet. We advise you to consider the fund's objectives, risks, charges and expenses carefully before investing. The prospectus contains this and other important information about the fund. Please read the prospectus carefully before you invest.
Investments in mutual funds involve risk. Some funds have more risk than others. The fund invests in individual bonds whose yields and market values fluctuate so that your investment may be worth more or less than its original cost. Bond investments are subject to interest-rate risk such that when interest rates rise, the prices of the bonds, and thus the value of the bond fund, may decline and the investor may lose principal value. Investors in the fund should be able to withstand fluctuations in the fixed income markets. The yield and value of the fund changes every day and can be affected by changes in interest rates, general market conditions and other political, social and economic developments, as well as specific matters relating to the companies in whose securities a fund invests. Additionally, investing in foreign securities presents certain unique risks not associated with domestic investments, such as currency fluctuation, political and economic changes, and market risks. Derivatives could produce disproportionate losses due to a variety of factors, including the unwillingness or inability of the counterparty to meet its obligations or unexpected price or interest-rate movements. All of these factors may result in greater share price volatility. Please read the fund's prospectus for specific details regarding its investments and risk profile.
DWS Scudder is part of Deutsche Asset Management, which is the marketing name in the US for the asset management activities of Deutsche Bank AG, Deutsche Bank Trust Company Americas, Deutsche Investment Management Americas Inc. and DWS Trust Company.
NOT FDIC/NCUA INSURED NO BANK GUARANTEE MAY LOSE VALUE NOT A DEPOSIT NOT INSURED BY ANY FEDERAL GOVERNMENT AGENCY
Performance Summary April 30, 2007
Classes A, B, C, R and Institutional
All performance shown is historical, assumes reinvestment of all dividend and capital gain distributions and does not guarantee future results. Investment return and principal value fluctuate with changing market conditions so that, when redeemed, shares may be worth more or less than their original cost. Current performance may be lower or higher than the performance quoted. Please visit www.dws-scudder.com for the Fund's most recent month-end performance.
The maximum sales charge for Class A shares is 4.5%. For Class B shares, the maximum contingent deferred sales charge (CDSC) is 4% within the first year after purchase, declining to 0% after six years. Class C shares have no adjustment for front-end sales charges but redemptions within one year of purchase may be subject to a CDSC of 1%. Unadjusted returns do not reflect sales charges and would have been lower if they had. Class R and Institutional Class are not subject to sales charges.
The total annual fund operating expense ratios, gross of any fee waivers or expense reimbursements, as stated in the fee table of the prospectus dated March 1, 2007 are 1.04%, 1.76%, 1.68%, 1.12% and .62% for Class A, Class B, Class C, Class R and Institutional Class shares, respectively. Please see the Information About Your Fund's Expenses, the Financial Highlights and Notes to the Financial Statements (Note C, Related Parties) sections of this report for gross and net expense related disclosure for the period ended April 30, 2007.
To discourage short-term trading, the Fund imposes a 2% redemption fee on shareholders redeeming shares held less than 15 days, which has the effect of lowering total return.
Returns and rankings during all periods shown for Class A, B, C, R and Institutional Class shares reflect a fee waiver and/or expense reimbursement. Without this waiver/reimbursement, returns and rankings would have been lower.
Performance figures do not reflect the deduction of taxes that a shareholder would pay on fund distributions or the redemption of fund shares. Returns and rankings may differ by share class.
On July 10, 2006, the fund was reorganized from DWS Core Fixed Income Fund, a series of DWS Investments Trust (the "Predecessor Fund"), into DWS Core Fixed Income Fund, a newly created series of the DWS Advisor Funds. This change in the legal entity had no economic impact relative to accounting or tax. Performance shown prior to July 10, 2006 is derived from the historical performance of the Predecessor Fund.
Returns shown for Class A, B and C shares for the periods prior to their inception on June 28, 2002 and Class R shares on October 1, 2003 are derived from the historical performance of Institutional Class shares of DWS Core Fixed Income Fund during such periods and have been adjusted to reflect the higher gross total annual operating expenses of each specific class. Any difference in expenses will affect performance.
Average Annual Total Returns (Unadjusted for Sales Charge) as of 4/30/07 | |||||
DWS Core Fixed Income Fund | 6-Month‡ | 1-Year | 3-Year | 5-Year | 10-Year |
Class A | 2.50% | 7.10% | 4.24% | 4.86% | 6.16% |
Class B | 2.11% | 6.29% | 3.42% | 4.08% | 5.36% |
Class C | 2.12% | 6.30% | 3.44% | 4.08% | 5.37% |
Class R | 2.36% | 6.81% | 4.00% | 4.63% | 5.90% |
Institutional Class | 2.62% | 7.36% | 4.50% | 5.12% | 6.43% |
| Lehman Brothers Aggregate Bond Index+ | 2.64% | 7.36% | 4.40% | 5.06% | 6.35% |
Sources: Lipper Inc. and Deutsche Asset Management, Inc.
‡ Total returns shown for periods less than one year are not annualized.Net Asset Value and Distribution Information | |||||
| Class A | Class B | Class C | Class R | Institutional Class |
Net Asset Value: 4/30/07 | $ 10.74 | $ 10.73 | $ 10.74 | $ 10.79 | $ 10.74 |
| 10/31/06 | $ 10.72 | $ 10.71 | $ 10.72 | $ 10.77 | $ 10.72 |
Distribution Information: Six Months as of 4/30/07:Income Dividends | $ .25 | $ .21 | $ .21 | $ .23 | $ .26 |
| April Income Dividend | $ .0409 | $ .0342 | $ .0343 | $ .0388 | $ .0431 |
| SEC 30-day Yield as of 4/30/07++ | 4.45% | 3.91% | 3.91% | 4.41% | 4.91% |
| Current Annualized Distribution Rate as of 4/30/07++ | 4.63% | 3.88% | 3.89% | 4.38% | 4.88% |
Growth of an Assumed $10,000 Investment (Adjusted for Maximum Sales Charge) |
[] DWS Core Fixed Income Fund — Class A [] Lehman Brothers Aggregate Bond Index+ |
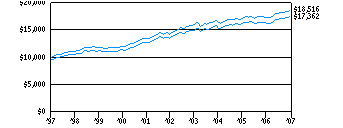 |
Yearly periods ended April 30 |
The Fund's growth of an assumed $10,000 investment is adjusted for the maximum sales charge of 4.50%. This results in a net initial investment of $9,550.
Comparative Results (Adjusted for Maximum Sales Charge) as of 4/30/07 | |||||
DWS Core Fixed Income Fund | 1-Year | 3-Year | 5-Year | 10-Year | |
Class A | Growth of $10,000 | $10,228 | $10,817 | $12,109 | $17,362 |
| Average annual total return | 2.28% | 2.65% | 3.90% | 5.67% | |
Class B | Growth of $10,000 | $10,329 | $10,863 | $12,112 | $16,863 |
| Average annual total return | 3.29% | 2.80% | 3.91% | 5.36% | |
Class C | Growth of $10,000 | $10,630 | $11,069 | $12,216 | $16,870 |
| Average annual total return | 6.30% | 3.44% | 4.08% | 5.37% | |
Class R | Growth of $10,000 | $10,681 | $11,248 | $12,541 | $17,740 |
| Average annual total return | 6.81% | 4.00% | 4.63% | 5.90% | |
| Lehman Brothers Aggregate Bond Index+ | Growth of $10,000 | $10,736 | $11,380 | $12,801 | $18,516 |
| Average annual total return | 7.36% | 4.40% | 5.06% | 6.35% | |
The growth of $10,000 is cumulative.
+ Lehman Brothers Aggregate Bond Index is an unmanaged index representing domestic taxable investment grade bonds, with index components for government and corporate securities, mortgage pass-through securities, and asset-backed securities with average maturities of one year or more. Index returns assume reinvestment of dividends and, unlike Fund returns, do not reflect any fees or expenses. It is not possible to invest directly into an index.Growth of an Assumed $1,000,000 Investment |
[] DWS Core Fixed Income Fund — Institutional Class [] Lehman Brothers Aggregate Bond Index+ |
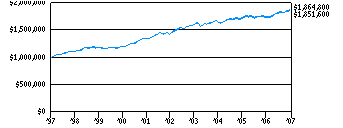 |
Yearly periods ended April 30 |
Comparative Results as of 4/30/07 | |||||
DWS Core Fixed Income Fund | 1-Year | 3-Year | 5-Year | 10-Year | |
Institutional Class | Growth of $1,000,000 | $1,073,600 | $1,141,100 | $1,283,800 | $1,864,800 |
| Average annual total return | 7.36% | 4.50% | 5.12% | 6.43% | |
| Lehman Brothers Aggregate Bond Index+ | Growth of $1,000,000 | $1,073,600 | $1,138,000 | $1,280,100 | $1,851,600 |
| Average annual total return | 7.36% | 4.40% | 5.06% | 6.35% | |
The growth of $1,000,000 is cumulative.
The minimum initial investment for Institutional Class shares is $1,000,000.
+ Lehman Brothers Aggregate Bond Index is an unmanaged index representing domestic taxable investment grade bonds, with index components for government and corporate securities, mortgage pass-through securities, and asset-backed securities with average maturities of one year or more. Index returns assume reinvestment of dividends and, unlike Fund returns, do not reflect any fees or expenses. It is not possible to invest directly into an index.Institutional Class Lipper Rankings — Intermediate Investment Grade Debt Funds Category as of 4/30/07 | ||||
Period | Rank |
| Number of Funds Tracked | Percentile Ranking (%) |
| 1-Year | 112 | of | 530 | 22 |
| 3-Year | 85 | of | 442 | 19 |
| 5-Year | 95 | of | 380 | 25 |
| 10-Year | 21 | of | 174 | 12 |
Source: Lipper Inc. Rankings are historical and do not guarantee future results. Rankings are based on total return with distributions reinvested. Rankings are for Institutional Class shares; other share classes may vary.
Class S
Class S shares are generally not available to new investors except under certain circumstances. (Please refer to the Fund's Statement of Additional Information.)
All performance shown is historical, assumes reinvestment of all dividend and capital gain distributions and does not guarantee future results. Investment return and principal value fluctuate with changing market conditions so that, when redeemed, shares may be worth more or less than their original cost. Current performance may be lower or higher than the performance quoted. Please visit www.dws-scudder.com the Fund's most recent month-end performance.
The total annual fund operating expense ratio, gross of any fee waivers or expense reimbursements, as stated in the fee table of the prospectus dated March 1, 2007 is .68% for Class S shares. Please see the Information About Your Fund's Expenses, the Financial Highlights and Notes to the Financial Statements (Note C, Related Parties) sections of this report for gross and net expense related disclosure for the period ended April 30, 2007.
To discourage short-term trading, the Fund imposes a 2% redemption fee on shareholders redeeming shares held less than 15 days, which has the effect of lowering total return.
Returns and rankings during all periods shown reflect a fee waiver and/or expense reimbursement. Without this waiver/reimbursement, returns and rankings would have been lower.
Performance figures do not reflect the deduction of taxes that a shareholder would pay on fund distributions or the redemptions of fund shares. Returns and rankings may differ by share class.
On July 10, 2006, the fund was reorganized from DWS Core Fixed Income Fund, a series of DWS Investments Trust (the "Predecessor Fund"), into DWS Core Fixed Income Fund, a newly created series of the DWS Advisor Funds. This change in the legal entity had no economic impact relative to accounting or tax. Performance shown prior to July 10, 2006 is derived from the historical performance of the Predecessor Fund.
Returns shown for Class S shares for the periods prior to its inception on February 1, 2005 are derived from the historical performance of Institutional Class shares of the DWS Core Fixed Income Fund during such periods and have been adjusted to reflect the higher gross total annual operating expenses of Class S. Any difference in expenses will affect performance.
Average Annual Total Returns as of 4/30/07 | |||||
DWS Core Fixed Income Fund | 6-Month‡ | 1-Year | 3-Year | 5-Year | 10-Year |
Class S | 2.62% | 7.20% | 4.32% | 4.94% | 6.23% |
| Lehman Brothers Aggregate Bond Index+ | 2.64% | 7.36% | 4.40% | 5.06% | 6.35% |
Sources: Lipper Inc. and Deutsche Asset Management, Inc.
‡ Total returns shown for periods less than one year are not annualized.Net Asset Value and Distribution Information | |
| Class S |
Net Asset Value: 4/30/07 | $ 10.73 |
| 10/31/06 | $ 10.71 |
Distribution Information: Six Months as of 4/30/07:Income Dividends | $ .26 |
| April Income Dividend | $ .0430 |
| SEC 30-day Yield as of 4/30/07++ | 4.91% |
| Current Annualized Distribution Rate as of 4/30/07++ | 4.88% |
Class S Lipper Rankings — Intermediate Investment Grade Debt Funds Category as of 4/30/07 | ||||
Period | Rank |
| Number of Funds Tracked | Percentile Ranking (%) |
| 1-Year | 154 | of | 530 | 30 |
Source: Lipper Inc. Rankings are historical and do not guarantee future results. Rankings are based on total return with distributions reinvested. Rankings are for Class S shares; other share classes may vary.
Growth of an Assumed $10,000 Investment |
[] DWS Core Fixed Income Fund — Class S [] Lehman Brothers Aggregate Bond Index+ |
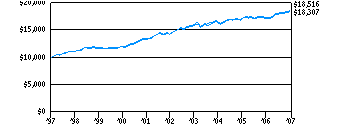 |
Yearly periods ended April 30 |
Comparative Results as of 4/30/07 | |||||
DWS Core Fixed Income Fund | 1-Year | 3-Year | 5-Year | 10-Year | |
Class S | Growth of $10,000 | $10,720 | $11,353 | $12,724 | $18,307 |
| Average annual total return | 7.20% | 4.32% | 4.94% | 6.23% | |
| Lehman Brothers Aggregate Bond Index+ | Growth of $10,000 | $10,736 | $11,380 | $12,801 | $18,516 |
| Average annual total return | 7.36% | 4.40% | 5.06% | 6.35% | |
The growth of $10,000 is cumulative.
+ Lehman Brothers Aggregate Bond Index is an unmanaged index representing domestic taxable investment grade bonds, with index components for government and corporate securities, mortgage pass-through securities, and asset-backed securities with average maturities of one year or more. Index returns assume reinvestment of dividends and, unlike Fund returns, do not reflect any fees or expenses. It is not possible to invest directly into an index.Information About Your Fund's Expenses
As an investor of the Fund, you incur two types of costs: ongoing expenses and transaction costs. Ongoing expenses include management fees, distribution and service (12b-1) fees and other Fund expenses. Examples of transaction costs include sales charges (loads), redemption fees and account maintenance fees, which are not shown in this section. The following tables are intended to help you understand your ongoing expenses (in dollars) of investing in the Fund and to help you compare these expenses with the ongoing expenses of investing in other mutual funds. In the most recent six-month period the Fund limited these expenses; had it not done so, expenses would have been higher. The example in the table is based on an investment of $1,000 invested at the beginning of the six-month period and held for the entire period (November 1, 2006 to April 30, 2007).
The tables illustrate your Fund's expenses in two ways:
Actual Fund Return. This helps you estimate the actual dollar amount of ongoing expenses (but not transaction costs) paid on a $1,000 investment in the Fund using the Fund's actual return during the period. To estimate the expenses you paid over the period, simply divide your account value by $1,000 (for example, an $8,600 account value divided by $1,000 = 8.6), then multiply the result by the number in the "Expenses Paid per $1,000" line under the share class you hold.
Hypothetical 5% Fund Return. This helps you to compare your Fund's ongoing expenses (but not transaction costs) with those of other mutual funds using the Fund's actual expense ratio and a hypothetical rate of return of 5% per year before expenses. Examples using a 5% hypothetical fund return may be found in the shareholder reports of other mutual funds. The hypothetical account values and expenses may not be used to estimate the actual ending account balance or expenses you paid for the period.
Please note that the expenses shown in these tables are meant to highlight your ongoing expenses only and do not reflect any transaction costs. The "Expenses Paid per $1,000" line of the tables is useful in comparing ongoing expenses only and will not help you determine the relative total expense of owning different funds. If these transaction costs had been included, your costs would have been higher.
Expenses and Value of a $1,000 Investment for the six months ended April 30, 2007 | ||||||
Actual Fund Return | Class A | Class B | Class C | Class R | Class S | Institutional Class |
| Beginning Account Value 11/1/06 | $ 1,000.00 | $ 1,000.00 | $ 1,000.00 | $ 1,000.00 | $ 1,000.00 | $ 1,000.00 |
| Ending Account Value 4/30/07 | $ 1,025.00 | $ 1,021.10 | $ 1,021.20 | $ 1,023.60 | $ 1,026.20 | $ 1,026.20 |
| Expenses Paid per $1,000* | $ 4.02 | $ 7.77 | $ 7.77 | $ 5.27 | $ 2.76 | $ 2.76 |
Hypothetical 5% Fund Return | Class A | Class B | Class C | Class R | Class S | Institutional Class |
| Beginning Account Value 11/1/06 | $ 1,000.00 | $ 1,000.00 | $ 1,000.00 | $ 1,000.00 | $ 1,000.00 | $ 1,000.00 |
| Ending Account Value 4/30/07 | $ 1,020.83 | $ 1,017.11 | $ 1,017.11 | $ 1,019.59 | $ 1,022.07 | $ 1,022.07 |
| Expenses Paid per $1,000* | $ 4.01 | $ 7.75 | $ 7.75 | $ 5.26 | $ 2.76 | $ 2.76 |
Annualized Expense Ratios | Class A | Class B | Class C | Class R | Class S | Institutional Class |
| DWS Core Fixed Income Fund | .80% | 1.55% | 1.55% | 1.05% | .55% | .55% |
For more information, please refer to the Fund's prospectus.
In the following interview, Gary Bartlett, senior portfolio manager for DWS Core Fixed Income Fund, discusses the recent market environment and strategy in managing the fund during its most recent semiannual period ended April 30, 2007.
Q: How did the bond market perform?
A: The US Federal Reserve Board (the "Fed") has left the fed funds target rate unchanged at its last seven meetings, including five during the six-month period, as Fed Chairman Bernanke has indicated that future Fed action will be "data dependent." Economic data has been mixed. For its part, the US Treasury market has reacted in stride with the headlines — selling off with signals of a resilient economy or inflationary pressures and rallying as part of a flight to quality or with indications of a weakening economy, most notably due to concern over a spillover from the housing slowdown. For the six-month period ending April 30, 2007, US Treasury yields initially climbed before retreating — and leveling off — late in the period. The benchmark 10-year US Treasury, despite trading in a range of 47 basis points, ended the period yielding 4.62%, up a mere 2 basis points from 4.60% six months earlier. (100 basis points equals one percentage point.) The US Treasury yield curve steepened as both the 2-year and 5-year US Treasury yields declined by 10 bps and 5 bps to end at 4.60% and 4.51%, respectively.1 Indeed the curve, which began the period inverted between two and ten years, ended the period with a slightly positive slope.
1 The yield curve is a graph with a left-to-right line that shows how high or low yields are, from the shortest to the longest maturities. Typically (and when the yield curve is characterized as "steep," this is especially true) the line rises from left to right as investors who are willing to tie up their money for a longer period are rewarded with higher yields.For the six months, the Lehman Brothers US Aggregate Bond Index returned 2.64%, essentially returning its coupon rate for the period.2 At the beginning of the six-month period, the trend of rising rates was accompanied by tightening credit spreads, only for the pattern to reverse later in the period. Within the Lehman Brothers US Aggregate Bond Index, US Treasuries returned 2.19% for the period and all spread sectors posted positive nominal returns, with most delivering positive excess returns relative to comparable duration treasuries.3 Corporates led the way (2.95%) followed by residential mortgage-backed securities (MBS at 2.78%), agencies (2.45%) and asset-back securities (ABS at 2.44%). Only commercial mortgage-backed securities (CMBS at 2.40%) slightly lagged relative to duration-equivalent treasuries.
2 The Lehman Brothers US Aggregate Bond Index is an unmanaged market value-weighted measure of treasury issues, agency issues, corporate bond issues and mortgage securities. Index returns assume reinvestment of dividends and, unlike fund returns, do not reflect any fees or expenses. It is not possible to invest directly into an index.3 Spread sectors are non-Treasury bond sectors of the fixed-income market.
Q: How did the fund perform?
A: DWS Core Fixed Income Fund Class A shares returned 2.50% for the period ended April 30, 2007. (Returns are unadjusted for sales charges. If sales charges had been included, returns would have been lower. Past performance is no guarantee of future results. Please see pages 5 through 11 for the performance of other share classes and more complete performance information.) This compares with 2.53% for the average fund in the Lipper Intermediate Investment Grade Debt Funds category and 2.64% for the Lehman Brothers US Aggregate Bond Index, the fund's benchmark.4
4 The Lipper Intermediate Investment Grade Debt Funds category consists of funds that invest at least 65% of assets in investment-grade debt issues (rated in the top four grades) with dollar-weighted average maturities of five to 10 years. Lipper figures represent the average of the total returns reported by all of the mutual funds designated by Lipper Inc. as falling into this category. Category returns assume reinvestment of dividends. It is not possible to invest directly into a Lipper category.Q: What factors contributed to the fund's performance?
A: Corporates bested all sectors in excess returns and credit spreads were essentially unchanged for the period. But this headline masks a more revealing story. Performance was led by lower-quality issues and subsectors as both industrials and utilities benefited from credit spread tightening. Despite weakness in the subprime mortgage sector and leveraged buyout (LBO) concerns, which drove spreads in financials wider, the sector still managed positive returns. Low-quality credit spread tightening in the face of balance sheet releveraging is, in our view, symptomatic of a global reach for yield precipitated by excess dollar liquidity, rather than a reflection of investors' views on fundamentals. The fund's corporate weighting, and specifically our weighting to BBB-rated corporates, has continued to come down as a reflection of this.5 Notwithstanding, we remain overweight BBBs, which aided performance during the period.6 The industrial sector, specifically telecom and media cable, was another strong performer during the period. Investments in these sectors contributed to performance resulting from our overweight and security selection. Additionally, holdings in utilities aided performance, although our investment in Commonwealth Edison hurt performance late in the period, as rating agencies reacted to concerns about a possible freezing of consumer electric rates in Illinois by downgrading its unsecured debt to below investment grade.
5 Credit quality is a measure of a bond issuer's ability to repay interest and principal in a timely manner. Rating agencies assign letter designations such as AAA, AA, and so forth. The lower the rating, the higher the probability of default.6 "Overweight" means the fund holds a higher weighting in a given sector or security than the benchmark. "Underweight" means the fund holds a lower weighting.
The fund's mortgage portfolio, structurally underweight volatility exposure, dampened results early in the period, but overall contributed positively to performance for the six months as interest rate volatility (finally) spiked from its historically depressed levels. Additionally, the fund's significant exposure to prime quality hybrid adjustable rate mortgages (ARMs) widened during March (in sympathy with subprime hybrid ARM headlines), but remain tighter than beginning of year levels. Mortgage index performance, relative to duration-equivalent treasuries, lagged only corporates for the period, and the portfolio remains slightly overweight in mortgage spread duration.
Asset backed securities (ABS) were negatively impacted by wider interest rate swap spreads (the trading benchmark for the sector) and by underperformance in home equity loan securities (subprime mortgages). While the fund's raw percentage overweight in this subsector appears significant, nearly the entirety of the fund's home equity position is in very short-term, AAA-rated bonds that have experienced minimal impact from the worsening performance of subprime mortgages generally. Further signs of a stabilization in the subprime market helped home equity loan ABS to rebound in April and generally the fund's investments in ABS were a neutral factor for performance. We have pared the fund's investments in ABS, but remain overweight with holdings concentrated in short duration home equity securities where we believe the total rate of return advantage relative to US treasuries remains compelling.
Commercial mortgages underperformed treasuries (-2 bps) during the period, but our significant intra-quarter sales just prior to the spread widening in both swaps and commercial mortgage backed securities (CMBS) helped the fund performance relative to the benchmark. We are currently underweight the sector, but have begun adding back to the fund's positions at or near the recent wider spread levels.
The views expressed in this report reflect those of the portfolio manager only through the end of the period of the report as stated on the cover. The manager's views are subject to change at any time based on market and other conditions and should not be construed as a recommendation. Past performance is no guarantee of future results.
Asset Allocation | 4/30/07 | 10/31/06 |
|
|
|
Commercial and Non-Agency Mortgage-Backed Securities | 30% | 29% |
Government and Agency Obligations | 19% | 11% |
Corporate Bonds | 16% | 18% |
Collateralized Mortgage Obligations | 11% | 12% |
Mortgage Backed Securities Pass-Throughs | 11% | 12% |
Cash Equivalents | 5% | 2% |
Municipal Bonds and Notes | 4% | 5% |
Asset Backed | 4% | 9% |
Preferred Stocks | — | 2% |
| 100% | 100% |
Corporate Bond Diversification (Excludes Cash Equivalents) | 4/30/07 | 10/31/06 |
|
|
|
Financials | 50% | 44% |
Utilities | 30% | 20% |
Energy | 7% | 10% |
Consumer Discretionary | 6% | 15% |
Materials | 3% | 3% |
Telecommunication Services | 2% | 5% |
Information Technology | 1% | 1% |
Industrials | 1% | 2% |
| 100% | 100% |
Quality | 4/30/07 | 10/31/06 |
|
|
|
US Government and Agencies | 30% | 35% |
AAA* | 53% | 45% |
AA | 2% | 2% |
A | 4% | 5% |
BBB | 10% | 12% |
BB | 1% | 1% |
| 100% | 100% |
Asset allocation, corporate bond diversification and quality are subject to change.
The quality ratings represent the lower of Moody's Investors Services, Inc. ("Moody's") or Standard & Poor's Corporation ("S&P") credit ratings. The ratings of Moody's and S&P represent their opinions as to the quality of the securities they rate. Ratings are relative and subjective and are not absolute standards of quality. The Fund's credit quality does not remove market risk.
Effective Maturity | 4/30/07 | 10/31/06 |
|
|
|
Under 1 year | 7% | 10% |
1-4.99 years | 49% | 35% |
5-9.99 years | 32% | 39% |
10-14.99 years | 3% | 5% |
15 years or greater | 9% | 11% |
| 100% | 100% |
Weighted average effective maturity: 6.7 years and 5.6 years, respectively.
Effective maturity is subject to change.
For more complete details about the Fund's investment portfolio, see page 19. A quarterly Fact Sheet is available upon request. Information concerning portfolio holdings of the Fund as of month end will be posted to www.dws-scudder.com on or after the last day of the following month. Please see the Account Management Resources section for contact information.
Following the Fund's fiscal first and third quarter-end, a complete portfolio holdings listing is filed with the SEC on Form N-Q. The form will be available on the SEC's Web site at www.sec.gov, and it also may be reviewed and copied at the SEC's Public Reference Room in Washington, D.C. Information on the operation of the SEC's Public Reference Room may be obtained by calling (800) SEC-0330.
Investment Portfolio as of April 30, 2007 (Unaudited)
| Principal Amount ($) | Value ($) |
|
| |
Corporate Bonds 16.6% | ||
Consumer Discretionary 1.0% | ||
Comcast Cable Holdings LLC, 10.125%, 4/15/2022 | 1,980,000 | 2,696,990 |
DaimlerChrysler NA Holding Corp., Series E, 5.89%*, 10/31/2008 | 656,000 | 659,348 |
TCI Communications, Inc., 8.75%, 8/1/2015 | 2,490,000 | 2,988,232 |
Time Warner, Inc., 7.625%, 4/15/2031 | 3,000,000 | 3,393,354 |
Viacom, Inc.: |
|
|
5.75%, 4/30/2011 | 3,095,000 | 3,137,179 |
6.25%, 4/30/2016 | 306,000 | 310,406 |
6.875%, 4/30/2036 | 1,508,000 | 1,527,210 |
| 14,712,719 | |
Energy 1.2% | ||
Canadian Natural Resources Ltd., 6.5%, 2/15/2037 | 5,960,000 | 6,131,684 |
Enterprise Products Operating LP: |
|
|
4.95%, 6/1/2010 | 2,015,000 | 2,000,657 |
Series B, 5.0%, 3/1/2015 | 657,000 | 631,832 |
Series B, 6.375%, 2/1/2013 | 114,000 | 118,901 |
7.5%, 2/1/2011 | 3,769,000 | 4,046,101 |
Sempra Energy, 4.621%, 5/17/2007 | 545,000 | 544,915 |
TransCanada PipeLines Ltd., 6.35%, 5/15/2067 | 4,900,000 | 4,899,926 |
| 18,374,016 | |
Financials 8.2% | ||
AES El Salvador Trust, 144A, 6.75%, 2/1/2016 | 3,210,000 | 3,234,813 |
Ambac Financial Group, Inc., 6.15%, 2/15/2037 | 635,000 | 608,716 |
American General Institutional Capital, 144A, 8.125%, 3/15/2046 | 7,382,000 | 9,387,903 |
Banco Mercantil del Norte S.A., Series A, 144A, 6.135%, 10/13/2016 | 2,520,000 | 2,552,946 |
BFC Finance Corp., Series 96-A, 7.375%, 12/1/2017 | 5,173,000 | 5,827,488 |
ChinaTrust Commercial Bank, 144A, 5.625%, 12/29/2049 | 841,000 | 825,029 |
Citizens Property Insurance Corp., Series 1997-A, 144A, 6.85%, 8/25/2007 | 5,400,000 | 5,422,324 |
Corp. Andina de Fomento, 5.75%, 1/12/2017 | 4,155,000 | 4,179,128 |
Dresdner Funding Trust I, 144A, 8.151%, 6/30/2031 | 2,455,000 | 2,967,926 |
Farmers Insurance Exchange, 144A, 8.625%, 5/1/2024 | 3,510,000 | 4,191,793 |
Glen Meadow Pass-Through Trust, 144A, 6.505%, 2/12/2067 | 4,070,000 | 4,139,190 |
Health Care Property Investors, Inc., (REIT), 6.0%, 1/30/2017 | 1,855,000 | 1,861,517 |
Mangrove Bay Pass-Through Trust, 144A, 6.102%, 7/15/2033 | 2,980,000 | 2,927,343 |
Mizuho Financial Group, (Cayman), 8.375%, 12/29/2049 | 6,320,000 | 6,663,808 |
Morgan Stanley, 5.45%, 1/9/2017 | 7,355,000 | 7,271,256 |
MUFG Capital Finance 1 Ltd., 6.346%, 7/29/2049 | 9,980,000 | 10,192,963 |
NLV Financial Corp., 144A, 6.5%, 3/15/2035 | 985,000 | 951,907 |
Oil Insurance Ltd., 144A, 7.558%, 12/29/2049 | 12,040,000 | 12,638,749 |
PartnerRe Finance, 6.44%, 12/1/2066 | 4,649,000 | 4,665,151 |
PNC Funding Corp., 6.875%, 7/15/2007 | 59,000 | 59,145 |
Sumitomo Mitsui Banking Corp., 144A, 5.625%, 10/15/2015 | 10,695,000 | 10,550,051 |
SunTrust Preferred Capital I, 5.853%, 12/15/2011 | 1,679,000 | 1,706,462 |
The Travelers Companies, Inc., 6.25%, 3/15/2037 | 1,685,000 | 1,687,298 |
UDR, Inc., Series E, (REIT), 3.9%, 3/15/2010 | 1,370,000 | 1,324,737 |
Wachovia Bank NA, 5.85%, 2/1/2037 | 5,000,000 | 4,957,660 |
Wachovia Capital Trust III, 5.8%, 3/15/2042 | 8,135,000 | 8,256,211 |
White Mountains Re Group, 144A, 6.375%, 3/20/2017 | 4,710,000 | 4,657,017 |
XL Capital Ltd., Series E, 6.5%, 12/31/2049 | 775,000 | 764,941 |
ZFS Finance USA Trust I, 144A, 6.15%, 12/15/2065 | 3,135,000 | 3,199,136 |
| 127,672,608 | |
Industrials 0.1% | ||
America West Airlines, Inc., Series 99-1, 7.93%, 1/2/2019 | 1,710,519 | 1,847,361 |
Information Technology 0.1% | ||
Seagate Technology HDD Holdings: |
|
|
6.375%, 10/1/2011 | 1,665,000 | 1,658,756 |
6.8%, 10/1/2016 | 395,000 | 391,544 |
| 2,050,300 | |
Materials 0.6% | ||
Celulosa Arauco y Constitucion SA, 5.625%, 4/20/2015 | 4,683,000 | 4,628,261 |
Newmont Mining Corp., 5.875%, 4/1/2035 | 2,009,000 | 1,885,627 |
Sappi Papier Holding AG, 144A, 6.75%, 6/15/2012 | 2,438,000 | 2,450,280 |
| 8,964,168 | |
Telecommunication Services 0.4% | ||
Ameritech Capital Funding, 6.25%, 5/18/2009 | 10,000 | 10,130 |
Embarq Corp., 7.995%, 6/1/2036 | 1,054,000 | 1,114,765 |
Sprint Nextel Corp., 6.0%, 12/1/2016 | 2,017,000 | 1,979,524 |
Telecom Italia Capital: |
|
|
4.95%, 9/30/2014 | 661,000 | 629,811 |
5.25%, 11/15/2013 | 2,620,000 | 2,566,141 |
| 6,300,371 | |
Utilities 5.0% | ||
Arizona Public Service Co., 6.875%, 8/1/2036 | 4,195,000 | 4,483,192 |
Baltimore Gas & Electric Co., 144A, 6.35%, 10/1/2036 | 3,170,000 | 3,262,523 |
Centerior Energy Corp., Series B, 7.13%, 7/1/2007 | 173,000 | 173,471 |
Cleveland Electric Illuminating Co., 7.43%, 11/1/2009 | 7,076,000 | 7,432,425 |
Commonwealth Edison Co.: |
|
|
Series 99, 3.7%, 2/1/2008 | 1,855,000 | 1,825,585 |
Series 98, 6.15%, 3/15/2012 | 3,710,000 | 3,764,689 |
6.95%, 7/15/2018 | 1,320,000 | 1,326,948 |
Consolidated Natural Gas Co., 6.0%, 10/15/2010 | 1,865,000 | 1,910,679 |
Constellation Energy Group, 7.6%, 4/1/2032 | 880,000 | 1,013,727 |
Consumers Energy Co.: |
|
|
Series F, 4.0%, 5/15/2010 | 5,983,000 | 5,770,173 |
5.0%, 2/15/2012 | 183,000 | 180,951 |
Dominion Resources, Inc.: |
|
|
Series 06-B, 6.3%, 9/30/2066 | 2,830,000 | 2,893,420 |
7.5%, 6/30/2066 | 6,575,000 | 7,150,326 |
Energy East Corp.: |
|
|
6.75%, 6/15/2012 | 5,070,000 | 5,382,276 |
6.75%, 9/15/2033 | 970,000 | 1,025,169 |
6.75%, 7/15/2036 | 2,615,000 | 2,784,057 |
Integrys Energy Group, Inc., 6.11%, 12/1/2066 | 4,520,000 | 4,497,106 |
Nevada Power Co., Series N, 6.65%, 4/1/2036 | 2,109,000 | 2,211,143 |
Pedernales Electric Cooperative, Series 2002-A, 144A, 6.202%, 11/15/2032 | 5,694,000 | 5,973,291 |
PPL Capital Funding, Inc., Series A, 6.7%, 3/30/2067 | 6,825,000 | 6,829,327 |
Sierra Pacific Power Co., Series M, 6.0%, 5/15/2016 | 5,135,000 | 5,206,289 |
TXU Corp., 7.46%, 1/1/2015 | 1,728,574 | 1,763,647 |
| 76,860,414 | |
Total Corporate Bonds (Cost $251,251,249) | 256,781,957 | |
| ||
Asset Backed 4.4% | ||
Automobile Receivables 0.1% | ||
Whole Auto Loan Trust, "B", Series 2004-1, 3.13%, 3/15/2011 | 1,075,172 | 1,065,340 |
Home Equity Loans 3.7% | ||
Advanta Mortgage Loan Trust, "A6", Series 2000-2, 7.72%, 3/25/2015 | 50,235 | 50,056 |
Chase Funding Mortgage Loan Asset-Backed Certificates, "2A2", Series 2003-4, 5.62%*, 5/25/2033 | 6,066,093 | 6,072,046 |
Citigroup Mortgage Loan Trust, Inc., "A1", Series 2006-WFH4, 5.37%*, 11/25/2036 | 6,849,778 | 6,849,758 |
Countrywide Asset-Backed Certificates: |
|
|
"AF2", Series 2005-7, 4.367%, 11/25/2035 | 5,359,917 | 5,318,017 |
"A6", Series 2006-15, 5.826%, 10/25/2046 | 2,505,000 | 2,511,329 |
"1AF6", Series 2006-11, 6.15%, 9/25/2046 | 6,555,000 | 6,680,096 |
Credit-Based Asset Servicing and Securitization: |
|
|
"AF1B", Series 2005-CB8, 5.451%, 12/25/2035 | 1,554,465 | 1,548,091 |
"A2A", Series 2007-CB2, 5.891%, 2/25/2037 | 8,545,378 | 8,539,278 |
First Franklin Mortgage Loan Asset Backed Certificates, "A3", Series 2006-FF15, 5.37%*, 11/25/2036 | 5,440,253 | 5,439,852 |
Household Home Equity Loan Trust, "A1F", Series 2006-3, 5.98%, 3/20/2036 | 7,368,279 | 7,359,508 |
Merrill Lynch Mortgage Investors Trust, "A1A", Series 2005-NCB, 5.451%, 7/25/2036 | 566,134 | 563,920 |
Renaissance Home Equity Loan Trust, "AF3", Series 2005-2, 4.499%, 8/25/2035 | 5,428,000 | 5,370,297 |
Residential Asset Securities Corp., "AI1", Series 2006-KS3, 5.39%*, 4/25/2036 | 1,468,408 | 1,468,734 |
Securitized Asset Backed NIM Trust, "NIM", Series 2005-FR4, 144A, 6.0%, 1/25/2036 | 538,710 | 537,281 |
| 58,308,263 | |
Manufactured Housing Receivables 0.1% | ||
Green Tree Financial Corp., "A4", Series 1996-2, 7.2%, 4/15/2027 | 881,244 | 903,978 |
Utilities 0.5% | ||
AEP Texas Central Transition Funding Corp., "A3", Series 2006-A, 5.09%, 7/1/2017 | 7,185,000 | 7,175,878 |
Total Asset Backed (Cost $67,374,629) | 67,453,459 | |
| ||
Mortgage Backed Securities Pass-Throughs 10.8% | ||
Federal Home Loan Mortgage Corp.: |
|
|
3.5%, 8/1/2035 | 6,926,734 | 6,078,915 |
5.0%, 4/1/2035 | 4,758,702 | 4,609,435 |
5.5%, with various maturities from 10/1/2023 until 6/1/2034 (a) | 16,468,904 | 16,313,310 |
6.5%, 1/1/2035 | 4,015,534 | 4,148,235 |
Federal National Mortgage Association: |
|
|
4.5%, with various maturities from 8/1/2033 until 10/1/2033 | 8,691,720 | 8,188,563 |
5.0%, with various maturities from 10/1/2033 until 5/1/2034 | 6,267,058 | 6,068,069 |
5.5%, with various maturities from 7/1/2024 until 4/1/2036 (a) | 64,214,285 | 63,666,613 |
6.0%, with various maturities from 10/1/2022 until 4/1/2024 | 11,951,788 | 12,084,845 |
6.5%, with various maturities from 5/1/2023 until 9/1/2036 | 45,094,504 | 46,096,957 |
9.0%, 11/1/2030 | 57,705 | 63,003 |
Total Mortgage Backed Securities Pass-Throughs (Cost $167,211,445) | 167,317,945 | |
| ||
Commercial and Non-Agency Mortgage-Backed Securities 28.7% | ||
ABN AMRO Mortgage Corp., "A5", Series 2003-4, 4.75%, 3/25/2033 | 2,656,175 | 2,634,079 |
American Home Mortgage Investment Trust, "5A3", Series 2005-2, 5.077%, 9/25/2035 | 1,410,000 | 1,397,417 |
Banc of America Commercial Mortgage, Inc.: |
|
|
"A4", Series 2005-5, 5.115%, 10/10/2045 | 9,810,000 | 9,661,886 |
"A1A", Series 2000-1, 7.109%, 11/15/2031 | 25,212 | 25,380 |
Bear Stearns Adjustable Rate Mortgage Trust: |
|
|
"A1", Series 2006-1, 4.625%*, 2/25/2036 | 14,676,764 | 14,420,031 |
"2A1", Series 2006-4, 5.827%*, 10/25/2036 | 5,832,467 | 5,867,467 |
Bear Stearns Commercial Mortgage Securities, Inc., "AAB", Series 2007-PW15, 5.315%, 2/11/2044 | 7,175,000 | 7,163,336 |
Chase Mortgage Finance Corp., "A1", Series 2003-S2, 5.0%, 3/25/2018 | 10,211 | 10,124 |
Citicorp Mortgage Securities, Inc., "1A1", Series 2004-1, 5.25%, 1/25/2034 | 5,833,075 | 5,788,080 |
Citigroup Mortgage Loan Trust, Inc.: |
|
|
"1A2", Series 2006-AR2, 5.54%*, 3/25/2036 | 11,112,561 | 11,112,704 |
"1CB2", Series 2004-NCM2, 6.75%, 8/25/2034 | 3,127,030 | 3,192,012 |
Citigroup/Deutsche Bank Commercial Mortgage Trust, "A4", Series 2007-CD4, 5.322%, 12/11/2049 | 7,400,000 | 7,355,319 |
CitiMortgage Alternative Loan Trust, "A1", Series 2006-A2, 6.0%, 5/25/2036 | 7,805,367 | 7,875,911 |
Countrywide Alternative Loan Trust: |
|
|
"A2", Series 2003-6T2, 5.0%, 6/25/2033 | 8,719 | 8,679 |
"A2", Series 2003-21T1, 5.25%, 12/25/2033 | 3,973,145 | 3,939,120 |
"A4", Series 2004-14T2, 5.5%, 8/25/2034 | 3,713,520 | 3,699,315 |
"A6", Series 2004-14T2, 5.5%, 8/25/2034 | 4,265,584 | 4,247,869 |
"7A1", Series 2004-J2, 6.0%, 12/25/2033 | 1,410 | 1,413 |
"1A1", Series 2004-J1, 6.0%, 2/25/2034 | 855,124 | 852,319 |
"A4", Series 2002-11, 6.25%, 10/25/2032 | 2,390,934 | 2,383,839 |
Countrywide Home Loans: |
|
|
"A15", Series 2002-34, 4.75%, 1/25/2033 | 4,449,900 | 4,384,349 |
"A2", Series 2004-19, 5.25%, 10/25/2034 | 3,126,449 | 3,113,293 |
"1A1", Series 2007-HY1, 5.727%*, 4/25/2037 | 10,965,034 | 11,002,494 |
"A1", Series 2005-29, 5.75%, 12/25/2035 | 8,355,395 | 8,322,642 |
Credit Suisse Mortgage Capital Certificates: |
|
|
"AAB", Series 2006-C5, 5.308%, 12/15/2039 | 6,490,000 | 6,483,440 |
"4A15", Series 2007-3, 5.5%, 4/25/2037 | 7,447,306 | 7,446,687 |
CS First Boston Mortgage Securities Corp., "1A11", Series 2004-4, 5.5%, 8/25/2034 | 3,999,336 | 3,981,200 |
CW Capital Cobalt Ltd., "A3", Series 2007-C2, 5.484%, 4/15/2047 | 5,535,000 | 5,559,807 |
First Horizon Mortgage Pass-Through Trust: |
|
|
"2A1", Series 2005-AR2, 5.124%*, 6/25/2035 | 6,261,347 | 6,226,672 |
"1A2", Series 2006-AR4, 5.519%*, 1/25/2037 | 7,341,893 | 7,336,792 |
GMAC Mortgage Corp. Loan Trust: |
|
|
"A2", Series 2004-J1, 5.25%, 4/25/2034 | 3,528,383 | 3,514,430 |
"A15", Series 2004-J1, 5.25%, 4/25/2034 | 3,336,219 | 3,323,600 |
"4A1", Series 2005-AR6, 5.461%*, 11/19/2035 | 5,853,354 | 5,793,064 |
Greenwich Capital Commercial Funding Corp., "AAB", Series 2006-GG7, 6.113%*, 7/10/2038 | 7,000,000 | 7,270,745 |
GSR Mortgage Loan Trust: |
|
|
"2A4", Series 2006-AR1, 5.188%*, 1/25/2036 | 9,450,000 | 9,419,255 |
"2A1", Series 2007-AR1, 6.03%*, 3/25/2037 | 13,838,076 | 13,965,474 |
Indymac Index Mortgage Loan Trust, "3A1", Series 2006-AR33, 5.814%*, 1/25/2037 | 6,637,446 | 6,653,177 |
JPMorgan Mortgage Trust: |
|
|
"2A4L", Series 2006-A6, 5.575%*, 10/25/2036 | 7,185,000 | 7,217,077 |
"2A1" Series 2006-A5, 5.851%*, 8/25/2036 | 7,360,740 | 7,436,708 |
Lehman Mortgage Trust: |
|
|
"3A3", Series 2006-1, 5.5%, 2/25/2036 | 6,527,016 | 6,436,160 |
"1A10", Series 2006-3, 6.0%, 7/25/2036 | 6,190,937 | 6,258,345 |
Master Adjustable Rate Mortgages Trust, "B1", Series 2004-13, 3.814%*, 12/21/2034 | 6,321,514 | 6,128,567 |
Master Alternative Loans Trust: |
|
|
"5A1", Series 2005-2, 6.5%, 12/25/2034 | 761,101 | 770,733 |
"8A1", Series 2004-3, 7.0%, 4/25/2034 | 273,115 | 275,338 |
"6A1", Series 2004-5, 7.0%, 6/25/2034 | 1,273,874 | 1,316,898 |
Master Asset Securitization Trust, "2A7", Series 2003-9, 5.5%, 10/25/2033 | 5,183,964 | 5,080,285 |
Merrill Lynch Mortgage Investors Trust, "A2", Series 2005-A5, 4.566%, 6/25/2035 | 3,578,000 | 3,517,443 |
NYC Mortgage Loan Trust, "A3", Series 1996, 144A, 6.75%, 9/25/2019 | 1,870,859 | 1,870,859 |
Residential Accredit Loans, Inc.: |
|
|
"CB", Series 2004-QS2, 5.75%, 2/25/2034 | 1,686,326 | 1,658,660 |
"CB1", Series 2002-QS17, 6.0%, 11/25/2032 | 3,989,534 | 3,999,184 |
Residential Asset Securitization Trust, "A1", Series 2004-A1, 5.25%, 4/25/2034 | 4,373,647 | 4,329,596 |
Residential Funding Mortgage Security I, "2A2", Series 2007-SA1, 5.641%*, 2/25/2037 | 10,736,220 | 10,757,088 |
Structured Adjustable Rate Mortgage Loan Trust: |
|
|
"6A3", Series 2005-21, 5.4%, 11/25/2035 | 5,644,000 | 5,604,546 |
"5A1", Series 2005-18, 5.539%*, 9/25/2035 | 2,789,241 | 2,795,408 |
"2A1", Series 2006-1, 5.616%*, 2/25/2036 | 7,564,430 | 7,592,283 |
"7A4", Series 2006-1, 5.62%, 2/25/2036 | 6,132,000 | 6,111,038 |
Structured Asset Securities Corp., "4A1", Series 2005-6, 5.0%, 5/25/2035 | 44,629 | 42,802 |
Wachovia Bank Commercial Mortgage Trust, "A5", Series 2007-C30, 5.342%, 12/15/2043 | 120,000 | 119,503 |
Washington Mutual Mortgage Pass-Through Certificates Trust: |
|
|
"1A3", Series 2005-AR14, 5.064%*, 12/25/2035 | 6,100,000 | 6,063,140 |
"1A3", Series 2005-AR16, 5.112%*, 12/25/2035 | 6,220,000 | 6,185,348 |
"1A1", Series 2006-AR2, 5.318%*, 3/25/2037 | 8,484,559 | 8,446,021 |
"4A1", Series 2007-HY3, 5.357%*, 3/25/2037 | 12,329,003 | 12,283,882 |
"2CB4", Series 2005-7, 5.5%, 8/25/2035 | 6,244,066 | 6,215,832 |
"1A1", Series 2007-HY5, 5.558%*, 5/25/2037 | 7,520,000 | 7,517,944 |
"1A1", Series 2007-HY4, 5.575%*, 4/25/2037 | 11,027,073 | 10,997,782 |
"1A1", Series 2006-AR16, 5.622%*, 12/25/2036 | 9,461,759 | 9,477,134 |
"1A1", Series 2007-HY2, 5.648%*, 12/25/2036 | 7,067,912 | 7,089,365 |
Washington Mutual Mortgage Securities Corp., "1A7", Series 2003-MS8, 5.5%, 5/25/2033 | 443,260 | 441,880 |
Wells Fargo Mortgage Backed Securities Trust: |
|
|
"1A6", Series 2003-1, 4.5%, 2/25/2018 | 1,682 | 1,675 |
"4A4", Series 2005-AR16, 4.991%*, 10/25/2035 | 2,780,367 | 2,764,924 |
"2A5", Series 2006-AR2, 5.09%*, 3/25/2036 | 19,712,588 | 19,538,108 |
"3A2", Series 2006-AR8, 5.238%*, 4/25/2036 | 10,170,000 | 10,153,809 |
"A1", Series 2006-3, 5.5%, 3/25/2036 | 8,168,486 | 8,156,152 |
"A6", Series 2006-AR11, 5.526%*, 8/25/2036 | 10,255,000 | 10,380,052 |
"2A5", Series 2006-AR1, 5.556%*, 3/25/2036 | 8,400,000 | 8,369,842 |
"A1", Series 2006-AR16, 5.683%*, 10/25/2036 | 9,087,635 | 9,115,778 |
"1A3", Series 2006-6, 5.75%, 5/25/2036 | 6,748,392 | 6,776,897 |
Total Commercial and Non-Agency Mortgage-Backed Securities (Cost $443,773,086) | 444,727,507 | |
| ||
Collateralized Mortgage Obligations 11.1% | ||
Fannie Mae Whole Loan: |
|
|
"A23", Series 2004-W10, 5.0%, 8/25/2034 | 8,015,000 | 7,949,808 |
"1A1", Series 2004-W15, 6.0%, 8/25/2044 | 2,557,158 | 2,587,553 |
Federal Home Loan Mortgage Corp.: |
|
|
"LN", Series 3145, 4.5%, 10/15/2034 | 7,276,819 | 7,052,943 |
"PE", Series 2721, 5.0%, 1/15/2023 | 14,000 | 13,668 |
"BG", Series 2640, 5.0%, 2/15/2032 | 1,775,000 | 1,735,981 |
"YD", Series 2737, 5.0%, 8/15/2032 | 6,016,056 | 5,865,443 |
"UE", Series 2764, 5.0%, 10/15/2032 | 10,000 | 9,743 |
"PD", Series 2844, 5.0%, 12/15/2032 | 11,080,000 | 10,776,813 |
"EG", Series 2836, 5.0%, 12/15/2032 | 4,295,000 | 4,171,958 |
"PD", Series 2783, 5.0%, 1/15/2033 | 6,108,000 | 5,926,729 |
"TE", Series 2780, 5.0%, 1/15/2033 | 13,771,000 | 13,412,716 |
"NE", Series 2802, 5.0%, 2/15/2033 | 90,000 | 87,576 |
"OE", Series 2840, 5.0%, 2/15/2033 | 5,050,000 | 4,889,075 |
"PD", Series 2893, 5.0%, 2/15/2033 | 9,696,000 | 9,414,632 |
"TE", Series 2827, 5.0%, 4/15/2033 | 65,000 | 63,205 |
"XD", Series 2941, 5.0%, 5/15/2033 | 10,975,000 | 10,648,481 |
"PE", Series 2864, 5.0%, 6/15/2033 | 40,000 | 38,896 |
"UE", Series 2911, 5.0%, 6/15/2033 | 10,815,000 | 10,494,250 |
"ND", Series 2950, 5.0%, 6/15/2033 | 11,250,000 | 10,885,234 |
"PD", Series 2939, 5.0%, 7/15/2033 | 3,414,000 | 3,311,427 |
"BG", Series 2869, 5.0%, 7/15/2033 | 1,230,000 | 1,195,680 |
"JG", Series 2937, 5.0%, 8/15/2033 | 55,000 | 53,241 |
"KD", Series 2915, 5.0%, 9/15/2033 | 5,936,000 | 5,756,388 |
"NE", Series 2921, 5.0%, 9/15/2033 | 12,670,000 | 12,277,827 |
"ND", Series 2938, 5.0%, 10/15/2033 | 3,865,000 | 3,746,636 |
"KE", Series 2934, 5.0%, 11/15/2033 | 53,000 | 51,379 |
"YA", Series 2841, 5.5%, 7/15/2027 | 6,608,600 | 6,646,401 |
"PE", Series 2450, 6.0%, 7/15/2021 | 31,040 | 31,399 |
"CH", Series 2322, 6.0%, 2/15/2029 | 5,127,294 | 5,146,258 |
"YB", Series 2205, 6.0%, 5/15/2029 | 623,503 | 631,226 |
"PE", Series 2165, 6.0%, 6/15/2029 | 5,962,261 | 6,096,176 |
Federal National Mortgage Association: |
|
|
"PE", Series 2005-44, 5.0%, 7/25/2033 | 3,625,000 | 3,510,883 |
"BG", Series 2005-12, 5.0%, 10/25/2033 | 2,457,000 | 2,381,472 |
"EC", Series 2005-15, 5.0%, 10/25/2033 | 80,000 | 77,541 |
"HE", Series 2005-22, 5.0%, 10/25/2033 | 25,000 | 24,206 |
"PE", Series 2005-14, 5.0%, 12/25/2033 | 90,000 | 87,298 |
"OG", Series 2001-69, 5.5%, 12/25/2016 | 25,000 | 25,235 |
"J", Series 1998-36, 6.0%, 7/18/2028 | 4,785,549 | 4,843,644 |
"PH", Series 1999-19, 6.0%, 5/25/2029 | 5,936,957 | 6,051,125 |
"Z", Series 2001-14, 6.0%, 5/25/2031 | 18,070 | 18,395 |
"A2", Series 1998-M1, 6.25%, 1/25/2008 | 779,271 | 779,002 |
"A2", Series 1998-M6, 6.32%, 8/15/2008 | 3,837,223 | 3,864,376 |
"HM", Series 2002-36, 6.5%, 12/25/2029 | 112 | 112 |
Government National Mortgage Association, "QE", Series 2004-11, 5.0%, 12/16/2032 | 28,000 | 27,225 |
Total Collateralized Mortgage Obligations (Cost $172,436,941) | 172,659,256 | |
| ||
Municipal Bonds and Notes 4.4% | ||
Arkansas, Development Finance Authority, Collateralized Mortgage Obligation, "A4", Series 1988-A, Principal Only, Zero Coupon, 7/10/2014 (b) | 382,000 | 256,184 |
Arkansas, State Development Finance Authority, Economic Development Revenue, Series B, 4.85%, 10/1/2012 (b) | 120,000 | 118,758 |
Belmont, CA, Multi-Family Housing Revenue, Redevelopment Agency Tax Allocation, 7.55%, 8/1/2011 (b) | 685,000 | 699,878 |
California, Housing Finance Agency, Single Family Mortgage: |
|
|
Series A-1, 7.9%, 8/1/2007 (b) | 15,000 | 15,040 |
Series A-1, 8.24%, 8/1/2014 (b) | 20,000 | 20,241 |
Chicago, IL, O'Hare International Airport Revenue, Series C, 5.053%, 1/1/2011 (b) | 7,060,000 | 7,069,602 |
Contra Costa County, CA, Fire District, Taxable Pension Obligation, 4.76%, 8/1/2013 (b) | 6,240,000 | 6,155,011 |
Contra Costa County, CA, Multi-Family Housing Revenue, Willow Pass Apartments, Series D, 6.8%, 12/1/2015 | 1,285,000 | 1,327,122 |
Fulton, MO, General Obligation, 7.5%, 7/1/2007 (b) | 120,000 | 120,406 |
Hoboken, NJ: |
|
|
Series B, 4.76%, 2/1/2011 (b) | 335,000 | 331,164 |
Series B, 4.96%, 2/1/2012 (b) | 3,030,000 | 3,007,911 |
Series B, 5.12%, 2/1/2013 (b) | 3,185,000 | 3,176,114 |
Lake Mills, IA, Hospital & Healthcare Revenue, Investors Limited, First Mortgage, Series 1997, 8.0%, 11/1/2007 | 610,000 | 609,408 |
Los Angeles, CA, Community Redevelopment Agency, Community Redevelopment Financing Authority Revenue, Series L, 6.02%, 9/1/2021 (b) | 6,480,000 | 6,677,575 |
Luzerne County, PA, General Obligation, Series C, 5.2%, 11/15/2013 (b) | 5,645,000 | 5,659,113 |
Mississippi, Single Family Housing Revenue, Home Corp. Single Family, 7.75%, 7/1/2024 | 122,864 | 124,024 |
Muskegon County, MI, General Obligation, 5.5%, 6/1/2007 | 4,000,000 | 4,000,226 |
New York, Multi-Family Housing Revenue, Housing Finance Agency, Series C, 8.11%, 11/15/2038 | 2,270,000 | 2,318,079 |
North Miami, FL, Project Revenue, Special Obligation, 7.0%, 1/1/2008 (b) | 125,000 | 127,871 |
Pleasantville, NJ, School District, 5.25%, 2/15/2020 (b) | 45,000 | 44,195 |
Pomona, CA, Pension Obligation, Series AR, 5.732%, 7/1/2025 (b) | 3,745,000 | 3,701,783 |
Rancho Cordova, CA, Certificates of Partnership, City Hall Acquisition, Series B, 5.65%, 2/1/2024 (b) | 4,340,000 | 4,367,038 |
Riverside, CA, Public Financing Authority, Tax Allocation Revenue, University Corridor, Series D, 5.89%, 8/1/2032 (b) | 3,760,000 | 3,757,142 |
Sedgwick & Shawnee County, KS, Single Family Revenue, Series B, 8.375%, 6/1/2018 | 5,000 | 5,079 |
West Virginia, State General Obligation, Jobs Inventory Trust Board: |
|
|
Series A, Zero Coupon, 1/22/2012 | 1,300,000 | 982,254 |
Series A, 144A, Zero Coupon, 6/12/2013 | 1,500,000 | 1,039,455 |
Series C, 144A, Zero Coupon, 7/31/2013 | 3,500,000 | 2,405,060 |
Wilkes Barre, PA, General Obligation, Series C, 5.48%, 11/15/2024 (b) | 6,315,000 | 6,185,985 |
Wisconsin, Plover Wisconsin Taxable Bond Anticipation Notes, Series C, 6.25%, 12/1/2008 | 4,325,000 | 4,366,866 |
Total Municipal Bonds and Notes (Cost $67,702,886) | 68,668,584 | |
| | ||
Government and Agency Obligations 20.1% | ||
US Treasury Obligations | ||
US Treasury Bonds: |
|
|
6.0%, 2/15/2026 | 63,990,000 | 72,653,670 |
8.75%, 8/15/2020 | 19,902,000 | 27,525,402 |
US Treasury Notes: |
|
|
3.375%, 2/15/2008 | 27,292,000 | 26,949,786 |
4.625%, 12/31/2011 | 125,120,000 | 125,652,761 |
4.625%, 2/29/2012 | 59,106,000 | 59,373,808 |
Total Government and Agency Obligations (Cost $312,141,132) | 312,155,427 | |
|
| Value ($) |
|
| |
Preferred Stocks 0.0% | ||
Arch Capital Group Ltd., 8.0% (Cost $678,982) | 26,915 | 718,295 |
| | ||
Cash Equivalents 5.4% | ||
Cash Management QP Trust, 5.31% (c) (Cost $82,949,243) | 82,949,243 | 82,949,243 |
| % of Net Assets | Value ($) |
|
| |
Total Investment Portfolio (Cost $1,565,519,593)+ | 101.5 | 1,573,431,673 |
Other Assets and Liabilities, Net | (1.5) | (22,674,594) |
Net Assets | 100.0 | 1,550,757,079 |
+ The cost for federal income tax purposes was $1,569,025,453. At April 30, 2007, net unrealized appreciation for all securities based on tax cost was $4,406,220. This consisted of aggregate gross unrealized appreciation for all securities in which there was an excess of value over tax cost of $13,387,355 and aggregate gross unrealized depreciation for all securities in which there was an excess of tax cost over value of $8,981,135.
(a) Mortgage Dollar rolls included.
(b) Bond is insured by one of these companies.
Insurance Coverage | As a % of Total Investment Portfolio |
| Ambac Assurance Corp. | 0.7 |
| Financial Security Assurance, Inc. | 0.4 |
| MBIA Corporation | 2.1 |
REIT: Real Estate Investment Trust
144A: Security exempt from registration under Rule 144A of the Securities Act of 1933. These securities may be resold in transactions exempt from registration, normally to qualified institutional buyers.
Included in the portfolio are investments in mortgage or asset-backed securities which are interests in separate pools of mortgages or assets. Effective maturities of these investments may be shorter than stated maturities due to prepayments. Some separate investments in the Federal Home Loan Mortgage Corp. and Federal National Mortgage Association issues have similar coupon rates and have been aggregated for presentation purposes in the investment portfolio.
The accompanying notes are an integral part of the financial statements.
Statement of Assets and Liabilities as of April 30, 2007 (Unaudited) | |
Assets | |
| Investments: Investments in securities, at value (cost $1,482,570,350) | $ 1,490,482,430 |
Investment in Cash Management QP Trust (cost $82,949,243) | 82,949,243 |
| Total investments in securities, at value (cost $1,565,519,593) | 1,573,431,673 |
| Cash | 6,419,495 |
| Receivable for investments sold | 9,416,526 |
| Interest receivable | 13,436,058 |
| Receivable for Fund shares sold | 4,255,834 |
| Dividend receivable | 13,458 |
| Foreign taxes recoverable | 1,337 |
| Other assets | 125,348 |
| Total assets | 1,607,099,729 |
Liabilities | |
| Payable for investments purchased | 33,751,890 |
| Payable for investments purchased — mortgage dollar rolls | 16,859,226 |
| Dividends payable | 1,170,541 |
| Payable for Fund shares redeemed | 3,357,321 |
| Accrued management fee | 450,951 |
| Other accrued expenses and payables | 752,721 |
| Total liabilities | 56,342,650 |
Net assets, at value | $ 1,550,757,079 |
Net Assets | |
| Net assets consist of: Distributions in excess of net investment income | (466,551) |
| Net unrealized appreciation (depreciation) on investments | 7,912,080 |
| Accumulated net realized gain (loss) | (9,205,532) |
| Paid-in capital | 1,552,517,082 |
Net assets, at value | $ 1,550,757,079 |
The accompanying notes are an integral part of the financial statements.
Statement of Assets and Liabilities as of April 30, 2007 (Unaudited) (continued) | |
Net Asset Value | |
Class A Net Asset Value and redemption price(a) per share ($715,079,533 ÷ 66,586,833 outstanding shares of beneficial interest, $.001 par value, unlimited number of shares authorized) | $ 10.74 |
| Maximum offering price per share (100 ÷ 95.5 of $10.74) | $ 11.25 |
Class B Net Asset Value, offering and redemption price(a) (subject to contingent deferred sales charge) per share ($33,571,405 ÷ 3,127,949 outstanding shares of beneficial interest, $.001 par value, unlimited number of shares authorized) | $ 10.73 |
Class C Net Asset Value, offering and redemption price(a) (subject to contingent deferred sales charge) per share ($61,593,973 ÷ 5,736,585 outstanding shares of beneficial interest, $.001 par value, unlimited number of shares authorized) | $ 10.74 |
Class R Net Asset Value, offering and redemption price(a) per share ($4,601,644 ÷ 426,484 outstanding shares of beneficial interest, $.001 par value, unlimited number of shares authorized) | $ 10.79 |
Class S Net Asset Value, offering and redemption price(a) per share ($128,855,272 ÷ 12,006,802 outstanding shares of beneficial interest, $.001 par value, unlimited number of shares authorized) | $ 10.73 |
Institutional Class Net Asset Value, offering and redemption price(a) per share ($607,055,252 ÷ 56,530,600 outstanding shares of beneficial interest, $.001 par value, unlimited number of shares authorized) | $ 10.74 |
The accompanying notes are an integral part of the financial statements.
Statement of Operations for the six months ended April 30, 2007 (Unaudited) | |
Investment Income | |
| Income: Interest (net of foreign taxes withheld of $1,198) | $ 38,312,091 |
| Interest — Cash Management QP Trust | 1,269,668 |
| Dividends | 27,406 |
| Total Income | 39,609,165 |
| Expenses: Management fee | 2,925,770 |
| Administration fee | 731,546 |
| Services to shareholders | 977,037 |
| Distribution service fees | 1,255,955 |
| Custodian fee | 25,168 |
| Auditing | 54,139 |
| Legal | 21,249 |
| Trustees' fees and expenses | 24,994 |
| Reports to shareholders | 128,051 |
| Registration fees | 66,272 |
| Other | 44,201 |
| Total expenses before expense reductions | 6,254,382 |
| Expense reductions | (909,651) |
| Total expenses after expense reductions | 5,344,731 |
Net investment income | 34,264,434 |
Realized and Unrealized Gain (Loss) on Investment Transactions | |
| Net realized gain from: Investments | 5,945,837 |
| Net unrealized appreciation (depreciation) during the period on investments | (3,260,193) |
Net gain (loss) on investment transactions | 2,685,644 |
Net increase (decrease) in net assets resulting from operations | $ 36,950,078 |
The accompanying notes are an integral part of the financial statements.
Statement of Changes in Net Assets | ||
Increase (Decrease) in Net Assets | Six Months Ended April 30, 2007 (Unaudited) | Year Ended October 31, 2006 |
| Operations: Net investment income | $ 34,264,434 | $ 59,626,956 |
| Net realized gain (loss) on investment transactions | 5,945,837 | (14,205,612) |
| Net unrealized appreciation (depreciation) during the period on investment transactions | (3,260,193) | 18,301,392 |
| Net increase (decrease) in net assets resulting from operations | 36,950,078 | 63,722,736 |
| Distributions to shareholders from: Net investment income: Class A | (15,107,236) | (23,065,955) |
Class B | (651,668) | (1,397,979) |
Class C | (1,110,623) | (2,041,601) |
Investment Class | — | (4,992,612) |
Class R | (123,861) | (366,227) |
Class S | (2,875,949) | (238,037) |
Institutional Class | (14,369,314) | (27,685,873) |
| Net realized gains: Class A | — | (948,827) |
Class B | — | (87,193) |
Class C | — | (119,822) |
Investment Class | — | (256,149) |
Class R | — | (14,250) |
Class S | — | (3,695) |
Institutional Class | — | (1,243,617) |
| Fund share transactions: Proceeds from shares sold | 346,806,903 | 575,314,161 |
| Reinvestment of distributions | 30,574,488 | 55,109,124 |
| Cost of shares redeemed | (252,188,189) | (433,477,477) |
| Redemption fees | 5,173 | 23,829 |
| Net increase (decrease) in net assets from Fund share transactions | 125,198,375 | 196,969,637 |
Increase (decrease) in net assets | 127,909,802 | 198,230,536 |
| Net assets at beginning of period | 1,422,847,277 | 1,224,616,741 |
| Net assets at end of period (including distributions in excess of net investment income of $466,551 and $492,334, respectively) | $ 1,550,757,079 | $ 1,422,847,277 |
The accompanying notes are an integral part of the financial statements.
Class A Years Ended October 31, | 2007a | 2006 | 2005 | 2004 | 2003 | 2002b |
Selected Per Share Data | ||||||
Net asset value, beginning of period | $ 10.72 | $ 10.73 | $ 11.08 | $ 10.96 | $ 11.08 | $ 10.92 |
Income (loss) from investment operations: Net investment incomec | .25 | .47 | .44 | .46 | .46 | .17 |
Net realized and unrealized gain (loss) on investment transactions | .02 | .02 | (.30) | .20 | .03 | .18 |
Total from investment operations | .27 | .49 | .14 | .66 | .49 | .35 |
Less distributions from: Net investment income | (.25) | (.48) | (.44) | (.46) | (.45) | (.19) |
Net realized gain on investment transactions | — | (.02) | (.05) | (.08) | (.16) | — |
Total distributions | (.25) | (.50) | (.49) | (.54) | (.61) | (.19) |
| Redemption fees | .00*** | .00*** | .00*** | — | — | — |
Net asset value, end of period | $ 10.74 | $ 10.72 | $ 10.73 | $ 11.08 | $ 10.96 | $ 11.08 |
| Total Return (%)d,e | 2.50** | 4.72 | 1.28 | 6.17 | 4.43 | 3.29** |
Ratios to Average Net Assets and Supplemental Data | ||||||
| Net assets, end of period ($ millions) | 715 | 611 | 431 | 221 | 176 | 19 |
| Ratio of expenses before expense reductions (%) | .99* | .95 | .81 | .81 | .80 | .83* |
| Ratio of expenses after expense reductions (%) | .80* | .82 | .80 | .80 | .80 | .79* |
| Ratio of net investment income (%) | 4.61* | 4.50 | 4.04 | 4.20 | 4.15 | 4.82* |
| Portfolio turnover rate (%) | 189f* | 166f | 162f,g | 91f | 290 | 152 |
| a For the six months ended April 30, 2007 (Unaudited). b For the period from June 28, 2002 (commencement of operations of Class A shares) to October 31, 2002. c Based on average shares outstanding during the period. d Total return does not reflect the effect of any sales charges. e Total return would have been lower had certain expenses not been reduced. f The portfolio turnover rate including mortgage dollar roll transactions was 197% for the period ended April 30, 2007 and 173%, 177% and 190% for the years ended October 31, 2006, 2005 and 2004, respectively. g Excludes portfolio securities delivered as a result of processing redemption in-kind transactions. * Annualized ** Not annualized *** Amount is less than $.005. | ||||||
Class B Years Ended October 31, | 2007a | 2006 | 2005 | 2004 | 2003 | 2002b |
Selected Per Share Data | ||||||
Net asset value, beginning of period | $ 10.71 | $ 10.72 | $ 11.07 | $ 10.96 | $ 11.08 | $ 10.92 |
Income (loss) from investment operations: Net investment incomec | .21 | .39 | .36 | .38 | .38 | .14 |
Net realized and unrealized gain (loss) on investment transactions | .02 | .02 | (.30) | .20 | .02 | .18 |
Total from investment operations | .23 | .41 | .06 | .58 | .40 | .32 |
Less distributions from: Net investment income | (.21) | (.40) | (.36) | (.39) | (.36) | (.16) |
Net realized gain on investment transactions | — | (.02) | (.05) | (.08) | (.16) | — |
Total distributions | (.21) | (.42) | (.41) | (.47) | (.52) | (.16) |
| Redemption fees | .00*** | .00*** | .00*** | — | — | — |
Net asset value, end of period | $ 10.73 | $ 10.71 | $ 10.72 | $ 11.07 | $ 10.96 | $ 11.08 |
| Total Return (%)d | 2.11e** | 3.94e | .51e | 5.37 | 3.64 | 3.04e** |
Ratios to Average Net Assets and Supplemental Data | ||||||
| Net assets, end of period ($ millions) | 34 | 35 | 41 | 44 | 43 | 9 |
| Ratio of expenses before expense reductions (%) | 1.77* | 1.67 | 1.56 | 1.55 | 1.49 | 1.58* |
| Ratio of expenses after expense reductions (%) | 1.55* | 1.57 | 1.55 | 1.55 | 1.49 | 1.54* |
| Ratio of net investment income (%) | 3.86* | 3.75 | 3.29 | 3.45 | 3.46 | 4.07* |
| Portfolio turnover rate (%) | 189f* | 166f | 162f,g | 91f | 290 | 152 |
| a For the six months ended April 30, 2007 (Unaudited). b For the period from June 28, 2002 (commencement of operations of Class B shares) to October 31, 2002. c Based on average shares outstanding during the period. d Total return does not reflect the effect of any sales charges. e Total return would have been lower had certain expenses not been reduced. f The portfolio turnover rate including mortgage dollar roll transactions was 197% for the period ended April 30, 2007 and 173%, 177% and 190% for the years ended October 31, 2006, 2005 and 2004, respectively. g Excludes portfolio securities delivered as a result of processing redemption in-kind transactions. * Annualized ** Not annualized *** Amount is less than $.005. | ||||||
Class C Years Ended October 31, | 2007a | 2006 | 2005 | 2004 | 2003 | 2002b |
Selected Per Share Data | ||||||
Net asset value, beginning of period | $ 10.72 | $ 10.73 | $ 11.08 | $ 10.96 | $ 11.08 | $ 10.92 |
Income (loss) from investment operations: Net investment incomec | .21 | .39 | .36 | .38 | .38 | .15 |
Net realized and unrealized gain (loss) on investment transactions | .02 | .02 | (.30) | .20 | .02 | .17 |
Total from investment operations | .23 | .41 | .06 | .58 | .40 | .32 |
Less distributions from: Net investment income | (.21) | (.40) | (.36) | (.38) | (.36) | (.16) |
Net realized gain on investment transactions | — | (.02) | (.05) | (.08) | (.16) | — |
Total distributions | (.21) | (.42) | (.41) | (.46) | (.52) | (.16) |
| Redemption fees | .00*** | .00*** | .00*** | — | — | — |
Net asset value, end of period | $ 10.74 | $ 10.72 | $ 10.73 | $ 11.08 | $ 10.96 | $ 11.08 |
| Total Return (%)d | 2.12e** | 3.94e | .52e | 5.40 | 3.73e | 2.96e** |
Ratios to Average Net Assets and Supplemental Data | ||||||
| Net assets, end of period ($ millions) | 62 | 55 | 55 | 52 | 54 | 11 |
| Ratio of expenses before expense reductions (%) | 1.70* | 1.63 | 1.56 | 1.53 | 1.55 | 1.58* |
| Ratio of expenses after expense reductions (%) | 1.55* | 1.57 | 1.55 | 1.53 | 1.54 | 1.54* |
| Ratio of net investment income (%) | 3.86* | 3.75 | 3.29 | 3.47 | 3.41 | 4.07* |
| Portfolio turnover rate (%) | 189f* | 166f | 162f,g | 91f | 290 | 152 |
| a For the six months ended April 30, 2007 (Unaudited). b For the period from June 28, 2002 (commencement of operations of Class C shares) to October 31, 2002. c Based on average shares outstanding during the period. d Total return does not reflect the effect of any sales changes. e Total return would have been lower had certain expenses not been reduced. f The portfolio turnover rate including mortgage dollar roll transactions was 197% for the period ended April 30, 2007 and 173%, 177% and 190% for the years ended October 31, 2006, 2005 and 2004, respectively. g Excludes portfolio securities delivered as a result of processing redemption in-kind transactions. * Annualized ** Not annualized *** Amount is less than $.005. | ||||||
Class R Years Ended October 31, | 2007a | 2006 | 2005 | 2004 | 2003b |
Selected Per Share Data | |||||
Net asset value, beginning of period | $ 10.77 | $ 10.77 | $ 11.12 | $ 10.99 | $ 11.07 |
Income (loss) from investment operations: Net investment incomec | .23 | .45 | .41 | .43 | .04 |
Net realized and unrealized gain (loss) on investment transactions | .02 | .02 | (.30) | .17 | (.12) |
Total from investment operations | .25 | .47 | .11 | .60 | (.08) |
Less distributions from: Net investment income | (.23) | (.45) | (.41) | (.39) | — |
Net realized gain on investment transactions | — | (.02) | (.05) | (.08) | — |
Total distributions | (.23) | (.47) | (.46) | (.47) | — |
| Redemption fees | .00*** | .00*** | .00*** | — | — |
Net asset value, end of period | $ 10.79 | $ 10.77 | $ 10.77 | $ 11.12 | $ 10.99 |
| Total Return (%) | 2.36d** | 4.56d | 1.04 | 6.00d | (.72)d** |
Ratios to Average Net Assets and Supplemental Data | |||||
| Net assets, end of period ($ millions) | 5 | 10 | 7 | 3 | .01 |
| Ratio of expenses before expense reductions (%) | 1.16* | 1.12 | 1.05 | 1.06 | 1.05* |
| Ratio of expenses after expense reductions (%) | 1.05* | 1.08 | 1.05 | 1.04 | 1.05* |
| Ratio of net investment income (%) | 4.36* | 4.24 | 3.79 | 3.96 | 3.62* |
| Portfolio turnover rate (%) | 189e* | 166e | 162e,f | 91e | 290 |
| a For the six months ended April 30, 2007 (Unaudited). b For the period from October 1, 2003 (commencement of operations of Class R shares) to October 31, 2003. c Based on average shares outstanding during the period. d Total return would have been lower had certain expenses not been reduced. e The portfolio turnover rate including mortgage dollar roll transactions was 197% for the period ended April 30, 2007 and 173%, 177% and 190% for the years ended October 31, 2006, 2005 and 2004, respectively. f Excludes portfolio securities delivered as a result of processing redemption in-kind transactions. * Annualized ** Not annualized *** Amount is less than $.005. | |||||
Class S Years Ended October 31, | 2007a | 2006 | 2005b |
Selected Per Share Data | |||
Net asset value, beginning of period | $ 10.71 | $ 10.73 | $ 11.02 |
Income (loss) from investment operations: Net investment incomec | .26 | .49 | .34 |
Net realized and unrealized gain (loss) on investment transactions | .02 | .00*** | (.29) |
Total from investment operations | .28 | .49 | .05 |
Less distributions from: Net investment income | (.26) | (.49) | (.34) |
Net realized gain on investment transactions | — | (.02) | — |
Total distributions | (.26) | (.51) | (.34) |
| Redemption fees | .00*** | .00*** | .00*** |
Net asset value, end of period | $ 10.73 | $ 10.71 | $ 10.73 |
| Total Return (%)d | 2.62** | 4.73 | .41** |
Ratios to Average Net Assets and Supplemental Data | |||
| Net assets, end of period ($ millions) | 129 | 113 | 1 |
| Ratio of expenses before expense reductions (%) | .73* | .93 | .81* |
| Ratio of expenses after expense reductions (%) | .55* | .67 | .74* |
| Ratio of net investment income (%) | 4.86* | 4.65 | 4.12* |
| Portfolio turnover rate (%) | 189e* | 166e | 162e,f |
| a For the six months ended April 30, 2007 (Unaudited). b For the period from February 1, 2005 (commencement of operations of Class S shares) to October 31, 2005. c Based on average shares outstanding during the period. d Total return would have been lower had certain expenses not been reduced. e The portfolio turnover rate including mortgage dollar roll transactions was 197% for the period ended April 30, 2007, 173% and 177% for the years ended October 31, 2006 and 2005. f Excludes portfolio securities delivered as a result of processing redemption in-kind transactions. * Annualized ** Not annualized *** Amount is less than $.005. | |||
Institutional Class Years Ended October 31, | 2007a | 2006 | 2005 | 2004 | 2003 | 2002 |
Selected Per Share Data | ||||||
Net asset value, beginning of period | $ 10.72 | $ 10.73 | $ 11.08 | $ 10.96 | $ 11.08 | $ 11.12 |
Income (loss) from investment operations: Net investment incomeb | .26 | .50 | .47 | .49 | .49 | .61 |
Net realized and unrealized gain (loss) on investment transactions | .02 | .01 | (.30) | .19 | .03 | (.03) |
Total from investment operations | .28 | .51 | .17 | .68 | .52 | .58 |
Less distributions from: Net investment income | (.26) | (.50) | (.47) | (.48) | (.48) | (.62) |
Net realized gain on investment transactions | — | (.02) | (.05) | (.08) | (.16) | — |
Total distributions | (.26) | (.52) | (.52) | (.56) | (.64) | (.62) |
| Redemption fees | .00*** | .00*** | .00*** | — | — | — |
Net asset value, end of period | $ 10.74 | $ 10.72 | $ 10.73 | $ 11.08 | $ 10.96 | $ 11.08 |
| Total Return (%)c | 2.62** | 4.98 | 1.52 | 6.43 | 4.70 | 5.49 |
Ratios to Average Net Assets and Supplemental Data | ||||||
| Net assets, end of period ($ millions) | 607 | 599 | 571 | 656 | 755 | 745 |
| Ratio of expenses before expense reductions (%) | .59* | .61 | .56 | .56 | .55 | .56 |
| Ratio of expenses after expense reductions (%) | .55* | .58 | .55 | .55 | .55 | .55 |
| Ratio of net investment income (%) | 4.86* | 4.74 | 4.29 | 4.45 | 4.40 | 5.60 |
| Portfolio turnover rate (%) | 189d* | 166d | 162d,e | 91d | 290 | 152 |
| a For the six months ended April 30, 2007 (Unaudited). b Based on average shares outstanding during the period. c Total return would have been lower had certain expenses not been reduced. d The portfolio turnover rate including mortgage dollar roll transactions was 197% for the period ended April 30, 2007 and 173%, 177% and 190% for the years ended October 31, 2006, 2005 and 2004, respectively. e Excludes portfolio securities delivered as a result of processing redemption in-kind transactions. * Annualized ** Not annualized *** Amount is less than $.005. | ||||||
Notes to Financial Statements (Unaudited)
A. Significant Accounting Policies
DWS Core Fixed Income Fund (the "Fund") is a diversified series of DWS Advisor Funds (the "Trust") which is registered under the Investment Company Act of 1940, as amended, (the "1940 Act"), as an open-end management investment company. The Trust is organized as a business trust under the laws of the state of Delaware.
The Fund offers multiple classes of shares which provide investors with different purchase options. Class A shares are offered to investors subject to an initial sales charge. Class B shares are offered without an initial sales charge but are subject to higher ongoing expenses than Class A shares and a contingent deferred sales charge payable upon certain redemptions. Class B shares automatically convert to Class A shares six years after issuance. Class C shares are offered to investors without an initial sales charge but are subject to higher ongoing expenses than Class A shares and a contingent deferred sales charge payable upon certain redemptions within one year of purchase. Class C shares do not convert into another class. Class R shares are only available to participants in certain retirement plans and are offered to investors without an initial sales charge or contingent deferred sales charge. Institutional Class shares are offered to a limited group of investors, are not subject to initial or contingent deferred sales charges and have lower ongoing expenses than other classes. Class S shares are not subject to initial or contingent deferred sales charges and are generally not available to new investors except under certain circumstances.
Investment income, realized and unrealized gains and losses, and certain fund-level expenses and expense reductions, if any, are borne pro rata on the basis of relative net assets by the holders of all classes of shares, except that each class bears certain expenses unique to that class such as services to shareholders and certain other class-specific expenses. All shares of the Fund have equal rights with respect to voting subject to class-specific arrangements.
The Fund's financial statements are prepared in accordance with accounting principles generally accepted in the United States of America which require the use of management estimates. Actual results could differ from those estimates. The policies described below are followed consistently by the Fund in the preparation of its financial statements.
Security Valuation. Investments are stated at value determined as of the close of regular trading on the New York Stock Exchange on each day the exchange is open for trading. Debt securities are valued by independent pricing services approved by the Trustees of the Fund. If the pricing services are unable to provide valuations, the securities are valued at the most recent bid quotation or evaluated price, as applicable, obtained from a broker-dealer. Such services may use various pricing techniques which take into account appropriate factors such as yield, quality, coupon rate, maturity, type of issue, trading characteristics and other data, as well as broker quotes.
Equity securities are valued at the most recent sale price or official closing price reported on the exchange (US or foreign) or over-the-counter market on which the security is traded most extensively. Securities for which no sales are reported are valued at the calculated mean between the most recent bid and asked quotations on the relevant market or, if a mean cannot be determined, at the most recent bid quotation.
Money market instruments purchased with an original or remaining maturity of sixty days or less, maturing at par, are valued at amortized cost. Investments in open-end investment companies and Cash Management QP Trust are valued at their net asset value each business day.
Securities and other assets for which market quotations are not readily available or for which the above valuation procedures are deemed not to reflect fair value are valued in a manner that is intended to reflect their fair value as determined in accordance with procedures approved by the Trustees.
In September 2006, the Financial Accounting Standards Board ("FASB") released Statement of Financial Accounting Standards No. 157, "Fair Value Measurements" ("FAS 157"). FAS 157 defines fair value, establishes a framework for measuring fair value and expands disclosures about fair value measurements. FAS 157 is effective for fiscal years beginning after November 15, 2007. As of April 30, 2007, management does not believe the adoption of FAS 157 will impact the amounts reported in the financial statements, however, additional disclosures will be required about the inputs used to develop the measurements of fair value and the effect of certain of the measurements reported in the statement of operations for a fiscal period.
Mortgage Dollar Rolls. The Fund may enter into mortgage dollar rolls in which the Fund sells to a bank or broker/dealer (the "counterparty") mortgage-backed securities for delivery in the current month and simultaneously contracts to repurchase similar, but not identical, securities on a fixed date. The counterparty receives all principal and interest payments, including prepayments, made on the security while it is the holder. The Fund receives compensation as consideration for entering into the commitment to repurchase. The compensation is paid in the form of a lower price for the security upon its repurchase, or alternatively, a fee. Mortgage dollar rolls may be renewed with a new sale and repurchase price and a cash settlement made at each renewal without physical delivery of the securities subject to the contract.
Certain risks may arise upon entering into mortgage dollar rolls from the potential inability of counterparties to meet the terms of their commitments. Additionally, the value of such securities may change adversely before the Fund is able to repurchase them. There can be no assurance that the Fund's use of the cash that it receives from a mortgage dollar roll will provide a return that exceeds its costs.
Federal Income Taxes. The Fund's policy is to comply with the requirements of the Internal Revenue Code, as amended, which are applicable to regulated investment companies, and to distribute all of its taxable income to its shareholders. Accordingly, the Fund paid no federal income taxes and no federal income tax provisions were required.
At October 31, 2006, the Fund had a net tax basis capital loss carryforward of approximately $11,645,000, which may be applied against any realized net taxable capital gains of each succeeding year until fully utilized or until October 31,2014, the respective expiration date, which may be subject to certain limitations under sections 382-383 of the Internal Revenue Code.
In July 2006, FASB issued Interpretation No. 48 ("FIN 48"), "Accounting for Uncertainty in Income Taxes — an interpretation of FASB Statement No. 109" (the "Interpretation"). The Interpretation establishes for the Fund a minimum threshold for financial statement recognition of the benefit of positions taken in filing tax returns (including whether the Fund is taxable in certain jurisdictions), and requires certain expanded tax disclosures. The Interpretation is effective for fiscal years beginning after December 15, 2006. On December 22, 2006, the SEC indicated that they would not object if a Fund implements FIN 48 in the first required financial statement reporting period for its fiscal year beginning after December 15, 2006. Management has begun to evaluate the application of the Interpretation to the Fund and is not in a position at this time to estimate the significance of its impact, if any, on the Fund's financial statements.
Distribution of Income and Gains. Net investment income of the Fund is declared as a daily dividend and distributed to shareholders monthly. Net realized gains from investment transactions, in excess of available capital loss carryforwards, would be taxable to the Fund if not distributed, and, therefore, will be distributed to shareholders at least annually.
The timing and characterization of certain income and capital gains distributions are determined annually in accordance with federal tax regulations which may differ from accounting principles generally accepted in the United States of America. These differences primarily relate primarily to securities sold at a loss. As a result, net investment income (loss) and net realized gain (loss) on investment transactions for a reporting period may differ significantly from distributions during such period. Accordingly, the Fund may periodically make reclassifications among certain of its capital accounts without impacting the net asset value of the Fund.
The tax character of current year distributions will be determined at the end of the current fiscal year.
Redemption Fees. The Fund imposes a redemption fee of 2% of the total redemption amount on all Fund shares redeemed or exchanged within 15 days of buying them, either by purchase or exchange. This fee is assessed and retained by the Fund for the benefit of the remaining shareholders. The redemption fee is accounted for as an addition to paid-in capital.
Contingencies. In the normal course of business, the Fund may enter into contracts with service providers that contain general indemnification clauses. The Fund's maximum exposure under these arrangements is unknown as this would involve future claims that may be made against the Fund that have not yet been made. However, based on experience, the Fund expects the risk of loss to be remote.
Other. Investment transactions are accounted for on a trade date plus one basis for daily net asset value calculations. However, for financial reporting purposes, investment security transactions are reported on trade date. Interest income is recorded on the accrual basis. Dividend income is recorded on the ex-dividend date. Realized gains and losses from investment transactions are recorded on an identified cost basis. All discounts and premiums are accreted/amortized for both tax and financial reporting purposes.
B. Purchases and Sales of Securities
During the six months ended April 30, 2007, purchases and sales of investment securities (excluding short-term investments, US Treasury Obligations and mortgage dollar roll transactions) aggregated $467,590,298 and $534,984,056, respectively. Purchases and sales of US Treasury obligations aggregated $979,823,242 and $823,154,176, respectively. Purchases and sales of mortgage dollar rolls aggregated $66,968,708 and $59,090,909, respectively.
C. Related Parties
DWS Scudder is part of Deutsche Asset Management, which is the marketing name in the US for the asset management activities of Deutsche Bank AG. Deutsche Investment Management Americas Inc. ("DIMA" or the "Advisor"), an indirect, wholly owned subsidiary of Deutsche Bank AG, is the Advisor for the Fund.
Prior to January 1, 2007, Deutsche Asset Management, Inc.("DAMI"),an indirect, wholly owned subsidiary of Deutsche Bank AG, was the Advisor of the Fund. Effective January 1, 2007, DAMI merged with DIMA. The Board of the Fund approved a new investment management agreement between the Fund and DIMA. The new investment management agreement is identical in substance to the previous investment management agreement for the Fund, except for the named investment advisor.
Pursuant to a written contract with the Advisor, Aberdeen Asset Management Inc. ("AAMI"), a direct wholly owned subsidiary of Aberdeen Asset Management PLC ("Aberdeen PLC"), serves as a sub-advisor to the Fund. AAMI is paid by the Advisor for its services as the sub-advisor.
Management Agreement. Under the Investment Management Agreement, the Advisor directs the investments of the Fund in accordance with its investment objectives, policies and restrictions. The Advisor determines the securities, instruments and other contracts relating to investments to be purchased, sold or entered into by the Fund or delegates such responsibility to the Fund's sub-advisor.
Under the Investment Management Agreement with the Advisor, the Fund pays a monthly management fee based on the Fund's average daily net assets accrued daily and payable monthly, at the following annual rates:
| First $1.5 billion of the Fund's average daily net assets | .400% |
| Next $1.75 billion of such net assets | .385% |
| Next $1.75 billion of such net assets | .370% |
| Over $5 billion of such net assets | .355% |
For the period from November 1, 2006 through September 30, 2007, the Advisor has contractually agreed to waive all or a portion of its management fee and reimburse or pay certain operating expenses of the Fund (excluding certain expenses such as extraordinary expenses, taxes, brokerage, interest, proxy and organizational and offering expenses) to the extent necessary to maintain the operating expenses of each class as follows:
| Class A | .99% |
| Class B | 1.74% |
| Class C | 1.74% |
| Class R | 1.24% |
| Class S | .74% |
| Institutional Class | .74% |
In addition for the period from November 1, 2006 through April 30, 2007, the Advisor has agreed to voluntarily waive all or a portion of its management fee and reimburse or pay certain operating expenses (excluding certain expenses such as extraordinary expenses, taxes, brokerage, interest, proxy and organizational and offering expenses) to the extent necessary to maintain the operating expenses of each class as follows:
| Class A | .80% |
| Class B | 1.55% |
| Class C | 1.55% |
| Class R | 1.05% |
| Class S | .55% |
| Institutional Class | .55% |
Accordingly, for the six months ended April 30, 2007, the Advisor waived a portion of its advisory fee pursuant to the Investment Management Agreement aggregating $58,387 and the amount charged aggregated $2,867,383 which was equivalent to an annualized effective rate of 0.39% of the Fund's average daily net assets.
Furthermore, for the six months ended April 30, 2007, the Advisor reimbursed the Fund $27,149 of services to shareholders from non-affiliated entities for Class S shares.
Administration Fee. Pursuant to the Administrative Services Agreement with the DIMA, the Advisor provides most administrative services to the Fund. For all services provided under the Administrative Services Agreement, the Fund pays the Advisor an annual fee ("Administration Fee") of 0.10% of the Fund's average daily net assets, computed and accrued daily and payable monthly. For the six months ended April 30, 2007, the Advisor received an Administration Fee of $731,546, of which $125,650 is unpaid.
Service Provider Fees. DWS Scudder Investments Service Company ("DWS-SISC"), an affiliate of the Advisor, is the Fund's transfer agent, dividend-paying agent and shareholder service agent for Class A, B, C, R and Institutional Class shares of the Fund. DWS Scudder Service Corporation ("DWS-SSC"), an affiliate of the Advisor, was the Fund's transfer agent, dividend-paying agent and shareholder service agent for Class S shares of the Fund. Effective April 1, 2007, DWS-SSC merged with DWS-SISC. The Board of the Fund approved a new transfer agency agreement between the Fund and DWS-SISC. The new transfer agency agreement is identical in substance to the previous transfer agency agreement for the Fund, except for the named transfer agent. Pursuant to a sub-transfer agency agreement among DWS-SISC, DWS-SSC (through March 31, 2007) and DST Systems, Inc. ("DST"), DWS-SISC and DWS-SSC compensate DST out of the shareholder servicing fee they receive from the Fund. For the six months ended April 30, 2007, the amounts charged to the Fund by DWS-SISC and DWS-SSC (through March 31, 2007) were as follows:
Services to Shareholders | Total Aggregated | Waived | Unpaid at April 30, 2007 |
| Class A | $ 520,304 | $ 520,304 | $ — |
| Class B | 30,758 | 30,758 | — |
| Class C | 37,618 | 37,618 | — |
| Class S | 76,096 | 76,096 | — |
| Class R | 3,135 | 2,776 | 314 |
| Institutional Class | 79,680 | 79,680 | — |
| $ 747,591 | $ 747,232 | $ 314 |
Distribution Service Agreement. Under the Distribution Service Agreement, in accordance with Rule 12b-1 under the 1940 Act, DWS Scudder Distributors, Inc. ("DWS-SDI"), an affiliate of the Advisor, receives a fee ("Distribution Fee") of 0.75% of average daily net assets of the Class B and C shares, 0.25% of average daily net assets for Class R shares. Pursuant to the agreement, DWS-SDI enters into related selling group agreements with various firms at various rates for sales of Class A, B, C and R shares. For the six months ended April 30, 2007, the Distribution Fee was as follows:
Distribution Fee | Total Aggregated | Unpaid at April 30, 2007 |
| Class B | $ 126,901 | $ 21,335 |
| Class C | 215,932 | 38,024 |
| Class R | 7,151 | 1,786 |
| $ 349,984 | $ 61,145 |
In addition, DWS-SDI provides information and administrative services for a fee ("Service Fee") to the shareholders of Class B, Class C and Class R at an annual rate of up to 0.25% of average daily net assets for each such class. DWS-SDI in turn has various agreements with financial services firms that provide these services and pays these fees based upon the assets of shareholder accounts the firms service. For the six months ended April 30, 2007, the Service Fee was as follows:
Service Fee | Total Aggregated | Waived | Unpaid at April 30, 2007 | Annualized Effective Rate |
| Class A | $ 787,045 | 66,898 | $ 250,376 | .22% |
| Class B | 41,763 | 4,293 | 13,251 | .22% |
| Class C | 70,340 | 3,575 | 23,412 | .23% |
| Class R | 6,823 | — | 2,733 | .24% |
| $ 905,971 | $ 74,766 | $ 289,772 |
|
Underwriting Agreement and Contingent Deferred Sales Charge. DWS-SDI is the principal underwriter for the Fund. Underwriting commissions paid in connection with the distribution of Class A shares for the six months ended April 30, 2007, aggregated $14,397.
In addition, DWS-SDI receives any contingent deferred sales charge ("CDSC") from Class B share redemptions occurring within six years of purchase and Class C share redemptions occurring within one year of purchase. There is no such charge upon redemption of any share appreciation or reinvested dividends. The CDSC is based on declining rates ranging from 4% to 1% for Class B and 1% for Class C, of the value of the shares redeemed. For the six months ended April 30, 2007, the CDSC for Class B and C shares aggregated $40,964 and $5,790, respectively. A deferred sales charge of up to 0.85% is assessed on certain redemptions of Class A shares. For the six months ended April 30, 2007, DWS-SDI received $23 for Class A shares.
Cash Management QP Trust. Pursuant to an Exemptive Order issued by the SEC, the Fund may invest in the Cash Management QP Trust (the "QP Trust"), and other affiliated funds managed by the Advisor. The QP Trust seeks to provide as high a level of current income as is consistent with the preservation of capital and the maintenance of liquidity. The QP Trust does not pay the Advisor a management fee for the affiliated funds' investments in the QP Trust.
Typesetting and Filing Service Fees. Under an agreement with DIMA, DIMA is compensated for providing typesetting and certain regulatory filing services to the Fund. For the six months ended April 30, 2007, the amount charged to the Fund by DIMA included in the Statement of Operations under "reports to shareholders" aggregated $25,342, of which $9,256 is unpaid.
Trustees' Fees and Expenses. As compensation for his or her services, each Independent Trustee receives an aggregated annual fee, plus a fee for each meeting attended (plus reimbursement for reasonable out-of-pocket expenses incurred in connection with his or her attendance at board and committee meetings) from each fund in the Fund Complex for which he or she serves. In addition, the Chairperson of the Board and the Chairperson of each committee of the Board receive additional compensation for their services. Payment of such fees and expenses is allocated among all such funds described above in direct proportion to their relative net assets.
D. Investing in High Yield Securities
Investing in high yield securities may involve greater risks and considerations not typically associated with investing in US Government bonds and other high quality fixed-income securities. These securities are non-investment grade securities, often referred to as "junk bonds." Economic downturns may disrupt the high yield market and impair the ability of issuers to repay principal and interest. Also, an increase in interest rates would likely have an adverse impact on the value of such obligations. Moreover, high yield securities may be less liquid due to the extent that there is no established retail secondary market and because of a decline in the value of such securities.
E. Fee Reductions
The Fund has entered into an arrangement with its custodian whereby credits realized as a result of uninvested cash balances are used to reduce a portion of the custodian expenses. During the six months ended April 30, 2007, the Fund's custodian fees were reduced by $2,117, for custodian credits earned.
F. Line of Credit
The Fund and other affiliated funds (the "Participants") share in a $750 million revolving credit facility administered by JPMorgan Chase Bank, N.A. for temporary or emergency purposes, including the meeting of redemption requests that otherwise might require the untimely disposition of securities. The Participants are charged an annual commitment fee which is allocated, based upon net assets, among each of the Participants. Interest is calculated at the Federal Funds Rate plus 0.35 percent. The Fund may borrow up to a maximum of 10 percent of its net assets under the agreement.
G. Share Transactions
The following table summarizes share and dollar activity in the Fund:
| Six Months Ended April 30, 2007 | Year Ended October 31, 2006 | ||
| Shares | Dollars | Shares | Dollars |
Shares sold | ||||
| Class A | 17,349,422 | $ 186,126,161 | 28,333,674 | $ 300,646,786 |
| Class B | 187,285 | 2,008,005 | 337,039 | 3,574,285 |
| Class C | 1,319,231 | 14,157,387 | 1,404,504 | 14,920,689 |
| Investment Class* | — | — | 3,687,723 | 39,086,178 |
| Class R | 88,090 | 948,867 | 489,188 | 5,217,959 |
| Class S | 2,774,514 | 29,752,618 | 388,087 | 4,119,135 |
| Institutional Class | 10,619,916 | 113,813,865 | 19,610,390 | 207,749,129 |
| |
| $ 346,806,903 |
| $ 575,314,161 |
Shares issued to shareholders in reinvestment of distributions | ||||
| Class A | 1,298,717 | $ 13,917,439 | 2,057,708 | $ 21,845,263 |
| Class B | 46,535 | 498,499 | 106,658 | 1,132,605 |
| Class C | 68,815 | 737,350 | 139,040 | 1,476,802 |
| Investment Class* | — | — | 449,964 | 4,770,294 |
| Class R | 11,070 | 119,225 | 35,329 | 376,527 |
| Class S | 210,404 | 2,254,230 | 12,407 | 131,671 |
| Institutional Class | 1,217,607 | 13,047,745 | 2,389,420 | 25,375,962 |
| |
| $ 30,574,488 |
| $ 55,109,124 |
Shares redeemed | ||||
| Class A | (9,029,063) | $ (96,706,728) | (13,626,994) | $ (144,628,557) |
| Class B | (358,167) | (3,838,168) | (1,036,239) | (10,997,797) |
| Class C | (759,769) | (8,145,934) | (1,554,736) | (16,489,030) |
| Investment Class* | — | — | (4,940,900) | (52,456,196) |
| Class R | (615,027) | (6,626,332) | (194,584) | (2,069,647) |
| Class S | (1,570,588) | (16,822,449) | (187,676) | (1,993,833) |
| Institutional Class | (11,180,567) | (120,048,578) | (19,323,435) | (204,842,417) |
| |
| $ (252,188,189) |
| (433,477,477) |
Redemption fees | $ 5,173 |
| $ 23,829 | |
Shares converted* | ||||
| Class S | — | — | 10,242,882 | 108,778,512 |
| Investment Class | — | — | (10,254,469) | (108,778,512) |
| |
| $ — |
| $ — |
Net increase (decrease) | ||||
| Class A | 9,619,076 | $ 103,337,864 | 16,764,388 | $ 177,874,182 |
| Class B | (124,347) | (1,331,664) | (592,542) | (6,289,005) |
| Class C | 628,277 | 6,748,915 | (11,192) | (91,430) |
| Investment Class* | — | — | (11,057,682) | (117,372,145) |
| Class R | (515,867) | (5,558,043) | 329,933 | 3,524,919 |
| Class S | 1,414,330 | 15,185,661 | 10,455,700 | 111,036,616 |
| Institutional Class | 656,956 | 6,815,642 | 2,676,375 | 28,286,500 |
| |
| $ 125,198,375 |
| $ 196,969,637 |
H. Regulatory Matters and Litigation
Regulatory Settlements. On December 21, 2006, Deutsche Asset Management ("DeAM") settled proceedings with the Securities and Exchange Commission ("SEC") and the New York Attorney General on behalf of Deutsche Asset Management, Inc. ("DAMI") and Deutsche Investment Management Americas Inc. ("DIMA"), the investment advisors to many of the DWS Scudder funds, regarding allegations of improper trading of fund shares at DeAM and at the legacy Scudder and Kemper organizations prior to their acquisition by DeAM in April 2002. These regulators alleged that although the prospectuses for certain funds in the regulators' view indicated that the funds did not permit market timing, DAMI and DIMA breached their fiduciary duty to those funds in that their efforts to limit trading activity in the funds were not effective at certain times. The regulators also alleged that DAMI and DIMA breached their fiduciary duty to certain funds by entering into certain market timing arrangements with investors. These trading arrangements originated in businesses that existed prior to the currently constituted DeAM organization, which came together as a result of various mergers of the legacy Scudder, Kemper and Deutsche fund groups, and all of the arrangements were terminated prior to the start of the regulatory investigations that began in the summer of 2003. No current DeAM employee approved these trading arrangements. Under the terms of the settlements, DAMI and DIMA neither admitted nor denied any wrongdoing.
The terms of the SEC settlement, which identified improper trading in the legacy Deutsche and Kemper mutual funds only, provide for payment of disgorgement in the amount of $17.2 million. The terms of the settlement with the New York Attorney General provide for payment of disgorgement in the amount of $102.3 million, which is inclusive of the amount payable under the SEC settlement, plus a civil penalty in the amount of $20 million. The total amount payable by DeAM, approximately $122.3 million, would be distributed to funds in accordance with a distribution plan to be developed by a distribution consultant. The funds' investment advisors do not believe these amounts will have a material adverse financial impact on them or materially affect their ability to perform under their investment management agreements with the DWS funds. The above-described amounts are not material to Deutsche Bank, and have already been reserved.
Among the terms of the settled orders, DeAM is subject to certain undertakings regarding the conduct of its business in the future, including: formation of a Code of Ethics Oversight Committee to oversee all matters relating to issues arising under the advisors' Code of Ethics; establishment of an Internal Compliance Controls Committee having overall compliance oversight responsibility of the advisors; engagement of an Independent Compliance Consultant to conduct a comprehensive review of the advisors' supervisory compliance and other policies and procedures designed to prevent and detect breaches of fiduciary duty, breaches of the Code of Ethics and federal securities law violations by the advisors and their employees; and commencing in 2008, the advisors shall undergo a compliance review by an independent third party.
In addition, DeAM is subject to certain further undertakings relating to the governance of the mutual funds, including that: at least 75% of the members of the Boards of Trustees/Directors overseeing the DWS Funds continue to be independent of DeAM; the Chairmen of the DWS Funds' Boards of Trustees/Directors continue to be independent of DeAM; DeAM maintain existing management fee reductions for certain funds for a period of five years and not increase management fees for certain funds during this period; the funds retain a senior officer (or independent consultants) responsible for assisting in the review of fee arrangements and monitoring compliance by the funds and the investment advisors with securities laws, fiduciary duties, codes of ethics and other compliance policies, the expense of which shall be borne by DeAM; and periodic account statements, fund prospectuses and the mutual funds' web site contain additional disclosure and/or tools that assist investors in understanding the fees and costs associated with an investment in the funds and the impact of fees and expenses on fund returns.
DeAM has also settled proceedings with the Illinois Secretary of State regarding market timing matters. The terms of the Illinois settlement provide for investor education contributions totaling approximately $4 million and a payment in the amount of $2 million to the Securities Audit and Enforcement Fund.
On September 28, 2006, the SEC and the National Association of Securities Dealers ("NASD") announced final agreements in which Deutsche Investment Management Americas Inc. ("DIMA"), Deutsche Asset Management, Inc. ("DAMI") and Scudder Distributors, Inc. ("SDI") (now known as DWS Scudder Distributors, Inc.) settled administrative proceedings regarding disclosure of brokerage allocation practices in connection with sales of the Scudder Funds' (now known as the DWS Scudder Funds) shares during 2001-2003. The agreements with the SEC and NASD are reflected in orders which state, among other things, that DIMA and DAMI failed to disclose potential conflicts of interest to the fund Boards and to shareholders relating to SDI's use of certain funds' brokerage commissions to reduce revenue sharing costs to broker-dealer firms with whom it had arrangements to market and distribute Scudder Fund shares. These directed brokerage practices were discontinued in October 2003.
Under the terms of the settlements, in which DIMA, DAMI and SDI neither admitted nor denied any of the regulators' findings, DIMA, DAMI and SDI agreed to pay disgorgement, prejudgment interest and civil penalties in the total amount of $19.3 million. The portion of the settlements distributed to the funds was approximately $17.8 million and was paid to the funds as prescribed by the settlement orders based upon the amount of brokerage commissions from each fund used to satisfy revenue sharing agreements with broker-dealers who sold fund shares. Based on the prescribed settlement order, the Fund was not entitled to a portion of the settlement.
As part of the settlements, DIMA, DAMI and SDI also agreed to implement certain measures and undertakings relating to revenue sharing payments including making additional disclosures in the fund Prospectuses or Statements of Additional Information, adopting or modifying relevant policies and procedures and providing regular reporting to the fund Boards.
Private Litigation Matters. The matters alleged in the regulatory settlements described above also serve as the general basis of a number of private class action lawsuits involving the DWS funds. These lawsuits name as defendants various persons, including certain DWS funds, the funds' investment advisors and their affiliates, and certain individuals, including in some cases fund Trustees/Directors, officers, and other parties. Each DWS fund's investment advisor has agreed to indemnify the applicable DWS funds in connection with these lawsuits, or other lawsuits or regulatory actions that may be filed making similar allegations.
Based on currently available information, the funds' investment advisors believe the likelihood that the pending lawsuits will have a material adverse financial impact on a DWS fund is remote and such actions are not likely to materially affect their ability to perform under their investment management agreements with the DWS funds.
Investment Management Agreement Approval
In December 2006, the Board approved an amended and restated investment management agreement with DIMA in connection with the merger of DAMI into DIMA. In determining to approve this agreement, the Board considered Deutsche Bank's representations that this change was administrative in nature, and would not involve any change in operations or services provided to the fund, or to the personnel involved with providing such services. The Board also considered that the terms of the agreement with DIMA were substantially identical to the terms of the fund's prior agreement with DAMI. A discussion of factors considered by the Board in determining to approve the continuation of the fund's prior investment management agreement with DAMI in September 2006 in connection with the Board's annual review of the fund's contractual arrangements is included in the fund's report for the period ended October 31, 2006.
For shareholders of Classes A, B, C and Institutional Class | |
Automated Information Line | (800) 621-1048 Personalized account information, information on other DWS funds and services via touchtone telephone and for Classes A, B, and C only, the ability to exchange or redeem shares. |
Web Site | www.dws-scudder.com View your account transactions and balances, trade shares, monitor your asset allocation, and change your address, 24 hours a day.Obtain prospectuses and applications, blank forms, interactive worksheets, news about DWS funds, subscription to fund updates by e-mail, retirement planning information, and more. |
For More Information | (800) 621-1048 To speak with a DWS Scudder service representative. |
Written Correspondence | DWS Scudder PO Box 219151Kansas City, MO 64121-9151 |
Proxy Voting | A description of the fund's policies and procedures for voting proxies for portfolio securities and information about how the fund voted proxies related to its portfolio securities during the 12-month period ended June 30 is available on our Web site — www.dws-scudder.com (click on "proxy voting"at the bottom of the page) — or on the SEC's Web site — www.sec.gov. To obtain a written copy of the fund's policies and procedures without charge, upon request, call us toll free at (800) 621-1048. |
Principal Underwriter | If you have questions, comments or complaints, contact: DWS Scudder Distributors, Inc. 222 South Riverside PlazaChicago, IL 60606-5808 (800) 621-1148 |
| Class A | Class B | Class C | Institutional Class |
Nasdaq Symbol | SFXAX | SFXBX | SFXCX | MFINX |
CUSIP Number | 23339E 889 | 23339E 871 | 23339E 863 | 23339E 848 |
Fund Number | 493 | 693 | 793 | 593 |
For shareholders of Class R | |
Automated Information Line | DWS Scudder Flex Plan Access (800) 532-8411 24-hour access to your retirement plan account. |
Web Site | www.dws-scudder.com Click "Retirement Plans" to reallocate assets, process transactions and review your funds through our secure online account access.Obtain prospectuses and applications, blank forms, interactive worksheets, news about DWS funds, subscription to fund updates by e-mail, retirement planning information, and more. |
For More Information | (800) 543-5776 To speak with a service representative. |
Written Correspondence | DWS Scudder Investments Service Company 222 South Riverside PlazaChicago, IL 60606-5806 |
Proxy Voting | A description of the fund's policies and procedures for voting proxies for portfolio securities and information about how the fund voted proxies related to its portfolio securities during the 12-month period ended June 30 is available on our Web site — www.dws-scudder.com (click on "proxy voting"at the bottom of the page) — or on the SEC's Web site — www.sec.gov. To obtain a written copy of the fund's policies and procedures without charge, upon request, call us toll free at (800) 621-1048. |
Principal Underwriter | If you have questions, comments or complaints, contact: DWS Scudder Distributors, Inc. 222 South Riverside PlazaChicago, IL 60606-5808 (800) 621-1148 |
Nasdaq Symbol | SFXRF |
CUSIP Number | 23339E 855 |
Fund Number | 1504 |
For shareholders of Class S | |
Automated Information Line | (800) 728-3337 Personalized account information, the ability to exchange or redeem shares, and information on other DWS funds and services via touchtone telephone. |
Web Site | www.dws-scudder.com |
| View your account transactions and balances, trade shares, monitor your asset allocation, and change your address, 24 hours a day. Obtain prospectuses and applications, blank forms, interactive worksheets, news about DWS funds, subscription to fund updates by e-mail, retirement planning information, and more. |
For More Information | (800) 728-3337 To speak with a DWS Scudder service representative. |
Written Correspondence | DWS Scudder PO Box 219151Kansas City, MO 64121-9151 |
Proxy Voting | A description of the fund's policies and procedures for voting proxies for portfolio securities and information about how the fund voted proxies related to its portfolio securities during the 12-month period ended June 30 is available on our Web site — www.dws-scudder.com (click on "proxy voting"at the bottom of the page) — or on the SEC's Web site — www.sec.gov. To obtain a written copy of the fund's policies and procedures without charge, upon request, call us toll free at (800) 621-1048. |
Principal Underwriter | If you have questions, comments or complaints, contact: DWS Scudder Distributors, Inc. 222 South Riverside PlazaChicago, IL 60606-5808 (800) 621-1148 |
| Class S |
Nasdaq Symbol | SFXSX |
Fund Number | 2394 |
This privacy statement is issued by DWS Scudder Distributors, Inc., Deutsche Investment Management Americas Inc., DeAM Investor Services, Inc., DWS Trust Company and the DWS Funds.
We never sell customer lists or individual client information. We consider privacy fundamental to our client relationships and adhere to the policies and practices described below to protect current and former clients' information. Internal policies are in place to protect confidentiality, while allowing client needs to be served. Only individuals who need to do so in carrying out their job responsibilities may access client information. We maintain physical, electronic and procedural safeguards that comply with federal and state standards to protect confidentiality. These safeguards extend to all forms of interaction with us, including the Internet.
In the normal course of business, clients give us nonpublic personal information on applications and other forms, on our websites, and through transactions with us or our affiliates. Examples of the nonpublic personal information collected are name, address, Social Security number and transaction and balance information. To be able to serve our clients, certain of this client information is shared with affiliated and nonaffiliated third party service providers such as transfer agents, custodians, and broker-dealers to assist us in processing transactions and servicing your account with us. In addition, we may disclose all of the information we collect to companies that perform marketing services on our behalf or to other financial institutions with which we have joint marketing agreements. The organizations described above that receive client information may only use it for the purpose designated by the DWS Scudder Companies listed above.
We may also disclose nonpublic personal information about you to other parties as required or permitted by law. For example, we are required or we may provide information to government entities or regulatory bodies in response to requests for information or subpoenas, to private litigants in certain circumstances, to law enforcement authorities, or any time we believe it necessary to protect the firm.
Questions on this policy may be sent to:
DWS Scudder
Attention: Correspondence — Chicago
P.O. Box 219415
Kansas City, MO 64121-9415
September 2006
Notes
Notes
Notes
Notes

ITEM 2. | CODE OF ETHICS |
|
|
| Not applicable. |
|
|
ITEM 3. | AUDIT COMMITTEE FINANCIAL EXPERT |
|
|
| Not applicable. |
|
|
ITEM 4. | PRINCIPAL ACCOUNTANT FEES AND SERVICES |
|
|
| Not applicable. |
ITEM 5. | AUDIT COMMITTEE OF LISTED REGISTRANTS |
|
|
| Not Applicable |
|
|
ITEM 6. | SCHEDULE OF INVESTMENTS |
|
|
| Not Applicable |
|
|
ITEM 7. | DISCLOSURE OF PROXY VOTING POLICIES AND PROCEDURES FOR CLOSED-END MANAGEMENT INVESTMENT COMPANIES |
|
|
| Not applicable. |
|
|
ITEM 8. | PORTFOLIO MANAGERS OF CLOSED-END MANAGEMENT INVESTMENT COMPANIES |
|
|
| Not applicable. |
ITEM 9. | PURCHASES OF EQUITY SECURITIES BY CLOSED-END MANAGEMENT INVESTMENT COMPANY AND AFFILIATED PURCHASERS |
|
|
| Not Applicable. |
ITEM 10. | SUBMISSION OF MATTERS TO A VOTE OF SECURITY HOLDERS |
|
|
| The Committee on Independent Trustees/Directors selects and nominates Independent Trustees/Directors. Fund shareholders may submit nominees that will be considered by the committee when a Board vacancy occurs. Submissions should be mailed to: c/o Dawn-Marie Driscoll, PO Box 100176, Cape Coral, FL 33910. |
|
|
ITEM 11. | CONTROLS AND PROCEDURES |
|
|
| (a) The Chief Executive and Financial Officers concluded that the Registrant's Disclosure Controls and Procedures are effective based on the evaluation of the Disclosure Controls and Procedures as of a date within 90 days of the filing date of this report. |
|
|
| (b) There have been no changes in the registrant's internal control over financial reporting that occurred during the registrant's last half-year (the registrant's second fiscal half-year in the case of the annual report) that has materially affected, or is reasonably likely to materially affect, the registrant's internal controls over financial reporting. |
|
|
ITEM 12. | EXHIBITS |
|
|
| (a)(1) Certification pursuant to Rule 30a-2(a) under the Investment Company Act of 1940 (17 CFR 270.30a-2(a)) is filed and attached hereto as Exhibit 99.CERT. |
|
|
| (b) Certification pursuant to Rule 30a-2(b) under the Investment Company Act of 1940 (17 CFR 270.30a-2(b)) is furnished and attached hereto as Exhibit 99.906CERT. |
Form N-CSRS Item F
SIGNATURES
Pursuant to the requirements of the Securities Exchange Act of 1934 and the Investment Company Act of 1940, the registrant has duly caused this report to be signed on its behalf by the undersigned, thereunto duly authorized.
Registrant: | DWS Core Fixed Income Fund, a series of DWS Advisor Funds |
By: | /s/Michael G. Clark |
| Michael G. Clark |
President
Date: | June 27, 2007 |
Pursuant to the requirements of the Securities Exchange Act of 1934 and the Investment Company Act of 1940, this report has been signed below by the following persons on behalf of the registrant and in the capacities and on the dates indicated.
Registrant: | DWS Core Fixed Income Fund, a series of DWS Advisor Funds |
By: | /s/Michael G. Clark |
| Michael G. Clark |
President
Date: | June 27, 2007 |
By: | /s/Paul Schubert |
| Paul Schubert |
Chief Financial Officer and Treasurer
Date: | June 27, 2007 |