UNITED STATES
SECURITIES AND EXCHANGE COMMISSION
WASHINGTON, D. C. 20549
FORM N-CSR
Investment Company Act file number 811-04760
DWS Advisor Funds
(Exact Name of Registrant as Specified in Charter)
345 Park Avenue
New York, NY 10154-0004
(Address of Principal Executive Offices) (Zip Code)
Registrant’s Telephone Number, including Area Code: (201) 593-6408
Paul Schubert
100 Plaza One
Jersey City, NJ 07311
(Name and Address of Agent for Service)
Date of fiscal year end: 10/31
Date of reporting period: 10/31/2010
| ITEM 1. | REPORT TO STOCKHOLDERS |
OCTOBER 31, 2010 Annual Report to Shareholders |
| DWS Diversified International Equity Fund |
 |
Contents
4 Performance Summary 7 Information About Your Fund's Expenses 9 Portfolio Management Review 14 Portfolio Summary 16 Investment Portfolio 30 Statement of Assets and Liabilities 32 Statement of Operations 33 Statement of Changes in Net Assets 34 Financial Highlights 40 Notes to Financial Statements 51 Report of Independent Registered Public Accounting Firm 52 Tax Information 53 Investment Management Agreement Approval 58 New Sub-Advisory Agreement Approval 61 Summary of Management Fee Evaluation by Independent Fee Consultant 65 Board Members and Officers 69 Account Management Resources |
This report must be preceded or accompanied by a prospectus. To obtain a summary prospectus, if available, or prospectus for any of our funds, refer to the Account Management Resources information provided in the back of this booklet. We advise you to consider the fund's objectives, risks, charges and expenses carefully before investing. The summary prospectus and prospectus contain this and other important information about the fund. Please read the prospectus carefully before you invest.
Investing in foreign securities, particularly those of emerging markets, presents certain risks, such as currency fluctuations, political and economic changes, and market risks. Stocks may decline in value. See the prospectus for details.
DWS Investments is part of Deutsche Bank's Asset Management division and, within the US, represents the retail asset management activities of Deutsche Bank AG, Deutsche Bank Trust Company Americas, Deutsche Investment Management Americas Inc. and DWS Trust Company.
NOT FDIC/NCUA INSURED NO BANK GUARANTEE MAY LOSE VALUE NOT A DEPOSIT NOT INSURED BY ANY FEDERAL GOVERNMENT AGENCY
Average Annual Total Returns as of 10/31/10 | ||||
| Unadjusted for Sales Charge | 1-Year | 3-Year | 5-Year | 10-Year |
| Class A | 13.65% | -12.04% | 2.08% | 2.17% |
| Class B | 12.75% | -12.72% | 1.29% | 1.33% |
| Class C | 12.75% | -12.71% | 1.30% | 1.33% |
| Adjusted for the Maximum Sales Charge | ||||
Class A (max 5.75% load) | 7.12% | -13.76% | 0.88% | 1.57% |
Class B (max 4.00% CDSC) | 9.75% | -13.16% | 1.17% | 1.33% |
Class C (max 1.00% CDSC) | 12.75% | -12.71% | 1.30% | 1.33% |
| No Sales Charges | ||||
| Class R | 13.35% | -12.13% | 1.96% | 1.93% |
| Class S | 13.72% | -11.76% | 2.38% | 2.30% |
| Institutional Class | 14.10% | -11.66% | 2.48% | 2.44% |
MSCI EAFE Index + | 8.36% | -9.60% | 3.31% | 3.17% |
Sources: Lipper Inc. and Deutsche Investment Management Americas Inc.
Performance in the Average Annual Total Returns table above and the Growth of an Assumed $10,000 Investment line graph that follows is historical and does not guarantee future results. Investment return and principal fluctuate, so your shares may be worth more or less when redeemed. Current performance may differ from performance data shown. Please visit www.dws-investments.com for the Fund's most recent month-end performance. Performance includes reinvestment of all distributions. Unadjusted returns do not reflect sales charges and would have been lower if they had.
The gross expense ratios of the Fund, as stated in the fee table of the prospectus dated March 1, 2010 are 1.64%, 2.61%, 2.47%, 1.89%, 1.36% and 1.25% for Class A, Class B, Class C, Class R, Class S and Institutional Class shares, respectively, and may differ from the expense ratios disclosed in the Financial Highlights tables in this report.
The Fund may charge a 2% fee for redemptions of shares held less than 15 days.
Index returns assume reinvestment of dividends and, unlike Fund returns, do not reflect any fees or expenses. It is not possible to invest directly into an index.
Performance figures do not reflect the deduction of taxes that a shareholder would pay on fund distributions or the redemption of fund shares.
Returns shown for Class A, B and C shares prior to their inception on February 28, 2001, for Class R shares prior to their inception on July 1, 2003 and for Class S shares prior to their inception on February 28, 2005 are derived from the historical performance of Institutional Class shares of the predecessor Fund's original share class during such periods and have been adjusted to reflect the different total annual operating expenses of each specific class. Any difference in expenses will affect performance.
Growth of an Assumed $10,000 Investment (Adjusted for Maximum Sales Charge) |
[] DWS Diversified International Equity Fund — Class A [] MSCI EAFE Index+ |
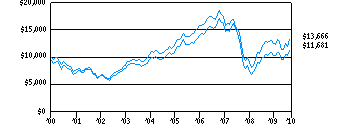 |
| Yearly periods ended October 31 |
The Fund's growth of an assumed $10,000 investment is adjusted for the maximum sales charge of 5.75%. This results in a net initial investment of $9,425.
The growth of $10,000 is cumulative.
Performance of other share classes will vary based on the sales charges and the fee structure of those classes.
+ The Morgan Stanley Capital International (MSCI) EAFE Index is an unmanaged, free float-adjusted, market capitalization index that tracks international stock performance in the 21 developed markets of Europe, Australasia and the Far East. The index is calculated using closing local market prices and translates into US dollars using the London close foreign exchange rates.
| Net Asset Value and Distribution Information | ||||||||||||||||||||||||
| Class A | Class B | Class C | Class R | Class S | Institutional Class | |||||||||||||||||||
Net Asset Value: 10/31/10 | $ | 7.36 | $ | 7.08 | $ | 7.08 | $ | 7.16 | $ | 7.15 | $ | 7.17 | ||||||||||||
| 10/31/09 | $ | 6.56 | $ | 6.31 | $ | 6.31 | $ | 6.40 | $ | 6.40 | $ | 6.40 | ||||||||||||
Distribution Information: Twelve Months as of 10/31/10: Income Dividends | $ | .09 | $ | .03 | $ | .03 | $ | .09 | $ | .12 | $ | .12 | ||||||||||||
Lipper Rankings — International Large-Cap Core Funds Category as of 10/31/10 | ||||
| Period | Rank | Number of Fund Classes Tracked | Percentile Ranking (%) | |
Class A 1-Year | 42 | of | 380 | 12 |
| 3-Year | 238 | of | 319 | 75 |
| 5-Year | 180 | of | 253 | 71 |
Class B 1-Year | 60 | of | 380 | 16 |
| 3-Year | 264 | of | 319 | 83 |
| 5-Year | 204 | of | 253 | 81 |
Class C 1-Year | 60 | of | 380 | 16 |
| 3-Year | 263 | of | 319 | 83 |
| 5-Year | 203 | of | 253 | 80 |
Class R 1-Year | 45 | of | 380 | 12 |
| 3-Year | 243 | of | 319 | 76 |
| 5-Year | 188 | of | 253 | 75 |
Class S 1-Year | 38 | of | 380 | 10 |
| 3-Year | 233 | of | 319 | 73 |
| 5-Year | 162 | of | 253 | 64 |
Institutional Class 1-Year | 33 | of | 380 | 9 |
| 3-Year | 229 | of | 319 | 72 |
| 5-Year | 159 | of | 253 | 63 |
| 10-Year | 73 | of | 137 | 53 |
Source: Lipper Inc. Rankings are historical and do not guarantee future results. Rankings are based on total return unadjusted for sales charges with distributions reinvested. If sales charges had been included, rankings might have been less favorable.
As an investor of the Fund, you incur two types of costs: ongoing expenses and transaction costs. Ongoing expenses include management fees, distribution and service (12b-1) fees and other Fund expenses. Examples of transaction costs include sales charges (loads), redemption fees and account maintenance fees, which are not shown in this section. The following tables are intended to help you understand your ongoing expenses (in dollars) of investing in the Fund and to help you compare these expenses with the ongoing expenses of investing in other mutual funds. In the most recent six-month period, Class A, B and S shares limited these expenses; had they not done so, expenses would have been higher. The example in the table is based on an investment of $1,000 invested at the beginning of the six-month period and held for the entire period (May 1, 2010 to October 31, 2010).
The tables illustrate your Fund's expenses in two ways:
•Actual Fund Return. This helps you estimate the actual dollar amount of ongoing expenses (but not transaction costs) paid on a $1,000 investment in the Fund using the Fund's actual return during the period. To estimate the expenses you paid over the period, simply divide your account value by $1,000 (for example, an $8,600 account value divided by $1,000 = 8.6), then multiply the result by the number in the "Expenses Paid per $1,000" line under the share class you hold.
• Hypothetical 5% Fund Return. This helps you to compare your Fund's ongoing expenses (but not transaction costs) with those of other mutual funds using the Fund's actual expense ratio and a hypothetical rate of return of 5% per year before expenses. Examples using a 5% hypothetical fund return may be found in the shareholder reports of other mutual funds. The hypothetical account values and expenses may not be used to estimate the actual ending account balance or expenses you paid for the period.
Please note that the expenses shown in these tables are meant to highlight your ongoing expenses only and do not reflect any transaction costs. The "Expenses Paid per $1,000" line of the tables is useful in comparing ongoing expenses only and will not help you determine the relative total expense of owning different funds. An account maintenance fee of $6.25 per quarter for Class S shares may apply for certain accounts whose balances do not meet the applicable minimum initial investment. This fee is not included in these tables. If it was, the estimate of expenses paid for Class S shares during the period would be higher, and account value during the period would be lower, by this amount.
Expenses and Value of a $1,000 Investment for the six months ended October 31, 2010 | ||||||||||||||||||||||||
| Actual Fund Return | Class A | Class B | Class C | Class R | Class S | Institutional Class | ||||||||||||||||||
| Beginning Account Value 5/1/10 | $ | 1,000.00 | $ | 1,000.00 | $ | 1,000.00 | $ | 1,000.00 | $ | 1,000.00 | $ | 1,000.00 | ||||||||||||
| Ending Account Value 10/31/10 | $ | 1,087.10 | $ | 1,082.60 | $ | 1,082.60 | $ | 1,084.80 | $ | 1,086.60 | $ | 1,089.70 | ||||||||||||
| Expenses Paid per $1,000* | $ | 8.36 | $ | 11.97 | $ | 12.23 | $ | 9.67 | $ | 7.52 | $ | 5.85 | ||||||||||||
| Hypothetical 5% Fund Return | Class A | Class B | Class C | Class R | Class S | Institutional Class | ||||||||||||||||||
| Beginning Account Value 5/1/10 | $ | 1,000.00 | $ | 1,000.00 | $ | 1,000.00 | $ | 1,000.00 | $ | 1,000.00 | $ | 1,000.00 | ||||||||||||
| Ending Account Value 10/31/10 | $ | 1,017.19 | $ | 1,013.71 | $ | 1,013.46 | $ | 1,015.93 | $ | 1,018.00 | $ | 1,019.61 | ||||||||||||
| Expenses Paid per $1,000* | $ | 8.08 | $ | 11.57 | $ | 11.82 | $ | 9.35 | $ | 7.27 | $ | 5.65 | ||||||||||||
* Expenses are equal to the Fund's annualized expense ratio for each share class, multiplied by the average account value over the period, multiplied by the number of days in the most recent six-month period, then divided by 365.
| Annualized Expense Ratios | Class A | Class B | Class C | Class R | Class S | Institutional Class |
| DWS Diversified International Equity Fund | 1.59% | 2.28% | 2.33% | 1.84% | 1.43% | 1.11% |
For more information, please refer to the Fund's prospectus.
DWS Diversified International Equity Fund: A Team Approach to Investing
Deutsche Investment Management Americas Inc. ("DIMA" or the "Advisor"), which is part of Deutsche Asset Management, is the investment advisor for DWS Diversified International Equity Fund. DIMA and its predecessors have more than 90 years of experience managing mutual funds and DIMA provides a full range of investment advisory services to both institutional and retail clients.
DIMA is an indirect, wholly owned subsidiary of Deutsche Bank AG. Deutsche Bank AG is a major global banking institution that is engaged in a wide range of financial services, including investment management, mutual funds, retail, private and commercial banking, investment banking and insurance.
DWS Investments is the retail brand name of the US asset management activities of Deutsche Bank AG and DIMA, representing a wide range of investing expertise and resources. This well-resourced global investment platform brings together a wide variety of experience and investment insight across industries, regions, asset classes and investing styles.
QS Investors, LLC ("QS Investors"), New York, New York, is the subadvisor for the fund. QS Investors manages and advises assets on behalf of institutional clients and retail funds, providing global expertise in research, portfolio management and quantitative analysis. On August 1, 2010, members of the Advisor's Quantitative Strategies Group, including members of the fund's portfolio management team, separated from the Advisor and formed QS Investors as a separate investment advisory firm unaffiliated with the Advisor (the "Separation").
Portfolio Management Team
Robert Wang
Russell Shtern, CFA
Portfolio Managers, QS Investors
Market Overview and Fund Performance
The views expressed in the following discussion reflect those of the portfolio management team only through the end of the period of the report as stated on the cover. The management team's views are subject to change at any time based on market and other conditions and should not be construed as a recommendation. Past performance is no guarantee of future results. Current and future portfolio holdings are subject to risk.
The international equity markets rose 8.36% during the past year, as measured by the MSCI EAFE Index (the fund's benchmark).1
This 12-month return, while positive, obscures the various difficulties that weighed on market sentiment for the majority of the reporting period. Throughout the first half of 2010, stocks were pressured by concerns about the European debt crisis, the possibility of a "double-dip" recession in the world economy and the Chinese government's efforts to cool the country's overheating economy. As late as June 30, in fact, the MSCI EAFE Index was down 10.22% compared to where it stood at the beginning of the fund's reporting period on November 1, 2009.
This loss was more than made up for by the strong performance of the international markets in the final four months of the period. During this time, stocks were lifted by a favorable combination of accommodative central bank policies and positive developments on the economic front. In Europe, for example, economic news consistently surprised to the upside despite the debt problems of the region's smaller countries. Germany, in particular, was a source of much better than expected growth. The emerging-market economies also remained robust, enhancing results for multinationals doing business in those areas. These factors helped investors grow more comfortable with the economic picture, bringing cash off the sidelines and driving equity prices sharply higher.
Despite the late rally, the MSCI EAFE Index finished the year behind the 16.52% gain of US equities, as measured by the Standard & Poor's 500® (S&P 500) Index.2 While the US economy has its share of difficulties, investors viewed its market as a relative safe haven given the turmoil in Europe and the continued sluggishness in Japan.
In this environment, the Class A shares of the fund produced a return of 13.65% and outpaced both the 8.36% return of the benchmark and the 10.34% average return of the funds in its Lipper peer group, Lipper International Large-Cap Core Funds.3 (Returns are unadjusted for sales charges. If sales charges had been included, returns would have been lower. Past performance is no guarantee of future results. Please see pages 4 through 6 for the performance of other share classes and for more complete performance information.)
Positive Contributors to Fund Performance
The fund's underweights in the financial sector, particularly in Spain, Japan and Italy, were an important factor in its strong performance.4 Financial stocks lagged the broader market by a wide margin, finishing the year with a negative return and lagging the benchmark by nearly 10 percentage points. The sector was hit hard by concerns about sluggish economic growth and European banks' exposure to the sovereign debt crisis. The fund's total weighting in financials was only a little over one-third of the benchmark weight, which added quite a bit to our relative performance.
Of the 182 country/sector baskets into which we divide the universe of international equities, we generated the largest degree of outperformance via our overweight in the Danish health care sector. Novo Nordisk A/S, the Denmark-based pharmaceutical giant, delivered strong earnings and maintained positive future earnings guidance. The result was a return of over 60% for Danish health care, a positive given that our average weight in the sector was more than 1.2 percentage points above its weighting in the MSCI EAFE Index.
A substantial underweight in UK energy also was a substantial positive contributor to performance, as shares of BP lagged sharply due to the Gulf oil spill disaster. UK energy finished the annual period with a loss, so our lower exposure to this market segment had a large positive impact on our relative performance.
Other positive elements of our positioning included overweights to Finland industrials, German consumer staples and Singapore consumer discretionary.
The fund's position in the emerging markets also made a strong contribution to its return. We achieved exposure to the developing countries by investing in two exchanged-traded funds, or ETFs — Vanguard Emerging Markets ETF and iShares MSCI Emerging Markets Index Fund.5,6 The MCSI Emerging Markets Index returned 23.56% during the past 12 months, outperforming the MSCI EAFE Index by a wide margin.7
Negative Contributors to Fund Performance
As would be expected at a time of such strong performance for the fund, relatively few factors stood out as meaningful detractors. One element of the fund's positioning that kept it from producing a better return was its underweight in materials, the best performer of the 10 major sectors in the MSCI EAFE Index. Specifically, underweights in the UK and Australian materials stood out as being negatives for performance.
Similarly, our underweight in the industrials sector, which produced a return more than double that of the benchmark, weighed on the fund's relative performance. Our underweight in German Industrials, which was boosted by rising exports to the emerging world, was the largest detractor in this market segment.
Other detractors of note included our overweight to Japan energy, an underweight to France consumer discretionary and an overweight to Greece consumer discretionary. Overall, the fund's small overweight to Greece, together with its slight overweights in Ireland and Portugal, were a negative at a time in which the smaller European markets were hit hard by concerns about rising government debt.
Outlook and Positioning
When the fund's risk units are combined, its largest sector overweight is in telecommunications, while its most significant underweight is in industrials. The fund's largest deviation from the benchmark on the country level is in the United Kingdom, where its weighting is only a little over one-third that of the MSCI EAFE Index.
We believe the proprietary investment process being used by DWS Diversified International Equity Fund makes this a unique product within the universe of international mutual funds. For investors looking for a way to diversify their domestic portfolios, this fund offers a compelling combination of extensive diversification, low turnover and an approach that looks beyond market capitalization to structure a more optimized portfolio.
1 The Morgan Stanley Capital International (MSCI) EAFE Index is an unmanaged, free float-adjusted, market capitalization index that tracks international stock performance in the 21 developed markets of Europe, Australasia and the Far East. The index is calculated using closing local market prices and translates into US dollars using the London close foreign exchange rates.
2 The Standard & Poor's 500 (S&P 500) Index is an unmanaged, capitalization-weighted index of 500 stocks. The index is designed to measure performance of the broad domestic economy through changes in the aggregate market value of 500 stocks representing all major industries.
3 The Lipper International Large-Cap Core Funds category is comprised of funds that, by portfolio practice, invest at least 75% of their equity assets in companies strictly outside of the US with market capitalizations (on a three-year weighted basis) greater than the 250th-largest company in the S&P/Citigroup World ex-U.S. Broad Market Index. Large-cap core funds typically have an average price-to-cash flow ratio, price-to-book ratio and three-year sales-per-share growth value compared to the S&P/Citigroup World ex-U.S. Broad Market Index. Category returns assume reinvestment of dividends. It is not possible to invest directly in a Lipper category.
4 "Overweight" means the fund holds a higher weighting in a given sector or security than the benchmark. "Underweight" means the fund holds a lower weighting.
5 The Vanguard Emerging Markets ETF invests in stocks of companies located in emerging markets around the world, such as Brazil, Russia, China, Korea and Taiwan. The fund seeks to closely track the return of the MSCI Emerging Markets Index over the long term.
6 The iShares MSCI Emerging Markets Index Fund seeks to provide investment results that correspond generally to the price and yield performance, before fees and expenses, of publicly traded securities in emerging markets, as represented by the MSCI Emerging Markets Index.
7 The Morgan Stanley Capital International (MSCI) Emerging Markets Index is an unmanaged, capitalization-weighted index of companies in a universe of 26 emerging markets. The index is calculated using closing local market prices and translates into US dollars using the London close foreign exchange rates.
Index returns assume reinvestment of dividends and, unlike fund returns, do not reflect any fees or expenses. It is not possible to invest directly into an index.
Geographical Diversification (As a % of Investment Portfolio excluding Cash Equivalents and Securities Lending Collateral) | 10/31/10 | 10/31/09 |
| Continental Europe | 50% | 55% |
| Japan | 19% | 15% |
| Emerging Markets | 10% | 7% |
| United Kingdom | 7% | 8% |
| Canada | 5% | 5% |
| Australia | 5% | 6% |
| Asia (excluding Japan) | 4% | 4% |
| 100% | 100% |
Sector Diversification (As a % of Common, Preferred Stocks and Rights) | 10/31/10 | 10/31/09 |
| Telecommunication Services | 17% | 16% |
| Consumer Staples | 12% | 14% |
| Industrials | 11% | 9% |
| Materials | 11% | 8% |
| Financials | 10% | 10% |
| Health Care | 9% | 14% |
| Energy | 8% | 6% |
| Utilities | 8% | 8% |
| Consumer Discretionary | 8% | 9% |
| Information Technology | 6% | 6% |
| 100% | 100% |
Geographical and sector diversification are subject to change.
Ten Largest Equity Holdings at October 31, 2010 (13.5% of Net Assets) | Country | Percent |
1. Telefonica SA Provider of telecommunication services | Spain | 1.5% |
2. Koninklijke (Royal) KPN NV Provider of telecommunication services | Netherlands | 1.5% |
3. Telecom Italia SpA Offers fixed-line and mobile telephone and data transmission services | Italy | 1.5% |
4. Deutsche Telekom AG Offers fixed-line and mobile telephone and information technology | Germany | 1.5% |
5. France Telecom SA Provides telecommunication services to residential and commercial | France | 1.5% |
6. Swisscom AG Operates in public telecommunications networks and application services | Switzerland | 1.4% |
7. Nestle SA A multinational company that markets a wide range of food products | Switzerland | 1.3% |
8. Vodafone Group PLC Provides a range of mobile telecommunications services | United Kingdom | 1.2% |
9. Sanofi-Aventis Manufactures prescription pharmaceuticals | France | 1.2% |
10. JX Holdings, Inc. Refines and distributes petroleum and petrochemical products | Japan | 0.9% |
Portfolio holdings are subject to change.
For more complete details about the Fund's investment portfolio, see page 16. A quarterly Fact Sheet is available upon request. Please see the Account Management Resources section for contact information.
Following the Fund's fiscal first and third quarter-end, a complete portfolio holdings listing is filed with the SEC on Form N-Q. The form will be available on the SEC's Web site at www.sec.gov, and it also may be reviewed and copied at the SEC's Public Reference Room in Washington, D.C. Information on the operation of the SEC's Public Reference Room may be obtained by calling (800) SEC-0330. The Fund's portfolio holdings are also posted on www.dws-investments.com from time to time. Please see the Fund's current prospectus for more information.
| Shares | Value ($) | |||||||
| Common Stocks 89.6% | ||||||||
| Australia 4.3% | ||||||||
| Aristocrat Leisure Ltd. | 16,232 | 55,810 | ||||||
| Asciano Group* | 50,500 | 77,416 | ||||||
| Australia & New Zealand Banking Group Ltd. | 4,792 | 116,458 | ||||||
| BHP Billiton Ltd. | 12,568 | 516,076 | ||||||
| Brambles Ltd. | 20,322 | 126,804 | ||||||
| Cochlear Ltd. | 1,299 | 90,368 | ||||||
| Commonwealth Bank of Australia | 2,498 | 119,654 | ||||||
| Crown Ltd. | 14,986 | 122,281 | ||||||
| CSL Ltd. | 12,170 | 391,370 | ||||||
| CSR Ltd. | 39,764 | 70,891 | ||||||
| Dart Energy Ltd.* | 9,045 | 10,189 | ||||||
| Fairfax Media Ltd. | 50,627 | 71,908 | ||||||
| Foster's Group Ltd. | 17,412 | 99,607 | ||||||
| Intoll Group (Units) | 58,316 | 85,971 | ||||||
| Leighton Holdings Ltd. | 2,950 | 106,051 | ||||||
| National Australia Bank Ltd. | 3,004 | 74,918 | ||||||
| Newcrest Mining Ltd. | 2,210 | 86,506 | ||||||
| Origin Energy Ltd. | 13,493 | 210,680 | ||||||
| QBE Insurance Group Ltd. | 2,961 | 49,830 | ||||||
| Rio Tinto Ltd. | 1,671 | 135,349 | ||||||
| Santos Ltd. | 12,702 | 157,021 | ||||||
| Sonic Healthcare Ltd. | 9,957 | 106,214 | ||||||
| TABCORP Holdings Ltd. | 24,015 | 173,606 | ||||||
| Tatts Group Ltd. | 45,213 | 110,721 | ||||||
| Telstra Corp., Ltd. | 182,582 | 477,525 | ||||||
| Toll Holdings Ltd. | 12,446 | 75,587 | ||||||
| Transurban Group (Units) | 22,648 | 116,249 | ||||||
| Wesfarmers Ltd. | 7,327 | 237,851 | ||||||
| Westfield Group (REIT) (Units) | 5,187 | 62,902 | ||||||
| Westpac Banking Corp. | 4,641 | 103,196 | ||||||
| Woodside Petroleum Ltd. | 7,895 | 336,409 | ||||||
| Woolworths Ltd. | 7,587 | 210,693 | ||||||
| WorleyParsons Ltd. | 3,338 | 75,040 | ||||||
| (Cost $3,267,328) | 4,861,151 | |||||||
| Austria 0.5% | ||||||||
| Erste Group Bank AG | 5,502 | 248,339 | ||||||
| Immofinanz AG* | 30,838 | 121,465 | ||||||
| Raiffeisen Bank International AG | 1,841 | 103,773 | ||||||
| Vienna Insurance Group AG Wiener Versicherung Gruppe | 1,439 | 77,398 | ||||||
| (Cost $313,291) | 550,975 | |||||||
| Belgium 1.5% | ||||||||
| Ageas | 42,133 | 129,537 | ||||||
| Anheuser-Busch InBev NV | 9,756 | 611,503 | ||||||
| Colruyt SA | 1,215 | 68,453 | ||||||
| Compagnie Nationale a Portefeuille | 1,238 | 66,002 | ||||||
| Delhaize Group | 1,678 | 117,216 | ||||||
| Groupe Bruxelles Lambert SA | 1,780 | 157,637 | ||||||
| KBC Groep NV* | 3,094 | 134,591 | ||||||
| Solvay SA | 2,573 | 272,486 | ||||||
| Umicore | 4,196 | 197,509 | ||||||
| (Cost $1,160,861) | 1,754,934 | |||||||
| Bermuda 0.2% | ||||||||
| Seadrill Ltd. (Cost $96,482) | 7,900 | 239,296 | ||||||
| Canada 5.1% | ||||||||
| Agnico-Eagle Mines Ltd. | 800 | 62,045 | ||||||
| Bank of Montreal | 1,500 | 88,582 | ||||||
| Bank of Nova Scotia | 2,200 | 117,927 | ||||||
| Barrick Gold Corp. | 5,200 | 250,440 | ||||||
| BCE, Inc. | 5,400 | 181,130 | ||||||
| Bombardier, Inc. "B" | 15,800 | 78,698 | ||||||
| Cameco Corp. | 2,100 | 64,962 | ||||||
| Canadian Imperial Bank of Commerce | 1,000 | 76,704 | ||||||
| Canadian National Railway Co. | 3,700 | 239,653 | ||||||
| Canadian Natural Resources Ltd. | 3,800 | 138,341 | ||||||
| Canadian Pacific Railway Ltd. | 1,800 | 117,329 | ||||||
| Canadian Tire Corp., Ltd. "A" | 1,300 | 75,956 | ||||||
| Canadian Utilities Ltd. "A" | 3,700 | 177,726 | ||||||
| Cenovus Energy, Inc. | 3,100 | 86,261 | ||||||
| CGI Group, Inc. "A"* | 7,300 | 112,302 | ||||||
| EnCana Corp. | 2,200 | 62,145 | ||||||
| Fortis, Inc. | 8,500 | 269,777 | ||||||
| Goldcorp, Inc. | 3,200 | 142,885 | ||||||
| Imperial Oil Ltd. | 1,700 | 65,373 | ||||||
| Kinross Gold Corp. | 3,300 | 59,374 | ||||||
| Loblaw Companies Ltd. | 1,400 | 59,822 | ||||||
| Magna International, Inc. "A" | 1,034 | 93,515 | ||||||
| Manulife Financial Corp. | 3,500 | 44,303 | ||||||
| Metro, Inc. "A" | 1,200 | 55,064 | ||||||
| Nexen, Inc. | 2,400 | 51,064 | ||||||
| Open Text Corp.* | 2,500 | 110,599 | ||||||
| Potash Corp. of Saskatchewan, Inc. | 1,201 | 173,619 | ||||||
| Research In Motion Ltd.* | 12,800 | 728,040 | ||||||
| Rogers Communications, Inc. "B" (a) | 7,400 | 269,619 | ||||||
| Royal Bank of Canada | 2,200 | 117,323 | ||||||
| Saputo, Inc. | 3,200 | 122,302 | ||||||
| Shaw Communications, Inc. "B" | 5,600 | 120,082 | ||||||
| Shoppers Drug Mart Corp. | 4,700 | 178,802 | ||||||
| SNC-Lavalin Group, Inc. | 1,700 | 86,842 | ||||||
| Suncor Energy, Inc. | 4,632 | 148,420 | ||||||
| Talisman Energy, Inc. | 4,700 | 85,207 | ||||||
| Teck Resources Ltd. "B" | 2,200 | 98,363 | ||||||
| Telus Corp. | 2,200 | 93,056 | ||||||
| Thomson Reuters Corp. (b) | 1,660 | 63,495 | ||||||
| Thomson Reuters Corp. (b) | 3,500 | 133,665 | ||||||
| Toronto-Dominion Bank | 1,500 | 108,025 | ||||||
| TransAlta Corp. | 11,700 | 236,891 | ||||||
| Viterra, Inc.* | 9,400 | 90,046 | ||||||
| Yamana Gold, Inc. | 4,100 | 45,105 | ||||||
| (Cost $4,373,068) | 5,780,879 | |||||||
| Cyprus 0.1% | ||||||||
| Bank of Cyprus Public Co., Ltd. (Cost $76,032) | 13,968 | 65,126 | ||||||
| Denmark 2.3% | ||||||||
| A P Moller-Maersk AS "A" | 15 | 126,062 | ||||||
| A P Moller-Maersk AS "B" | 35 | 303,746 | ||||||
| Carlsberg AS "B" | 7,108 | 777,382 | ||||||
| Coloplast AS "B" | 412 | 51,018 | ||||||
| Danske Bank AS* | 16,333 | 434,380 | ||||||
| DSV AS | 4,924 | 100,904 | ||||||
| Novo Nordisk AS "B" | 5,349 | 563,042 | ||||||
| Tryg AS | 1,368 | 68,935 | ||||||
| Vestas Wind Systems AS* | 4,936 | 157,529 | ||||||
| (Cost $1,649,357) | 2,582,998 | |||||||
| Finland 3.2% | ||||||||
| Fortum Oyj | 31,777 | 900,909 | ||||||
| Kone Oyj "B" | 7,073 | 379,002 | ||||||
| Metso Corp. | 6,052 | 286,978 | ||||||
| Nokia Oyj | 48,883 | 527,954 | ||||||
| Outokumpu Oyj | 6,381 | 114,655 | ||||||
| Pohjola Bank PLC | 5,629 | 71,254 | ||||||
| Rautaruukki Oyj | 4,639 | 92,135 | ||||||
| Sampo Oyj "A" | 15,675 | 439,165 | ||||||
| Stora Enso Oyj "R" | 25,731 | 255,701 | ||||||
| UPM-Kymmene Oyj | 22,893 | 380,757 | ||||||
| Wartsila Oyj | 3,847 | 269,854 | ||||||
| (Cost $2,519,019) | 3,718,364 | |||||||
| France 8.0% | ||||||||
| Air Liquide SA | 3,654 | 472,659 | ||||||
| Alcatel-Lucent* | 38,699 | 135,838 | ||||||
| Atos Origin SA* | 1,476 | 68,254 | ||||||
| AXA SA | 5,548 | 101,000 | ||||||
| BNP Paribas | 2,540 | 185,773 | ||||||
| Bouygues SA | 1,486 | 65,490 | ||||||
| Cap Gemini | 3,086 | 157,437 | ||||||
| Carrefour SA | 8,018 | 432,764 | ||||||
| Casino Guichard-Perrachon SA | 1,359 | 127,673 | ||||||
| Compagnie de Saint-Gobain | 2,434 | 113,689 | ||||||
| Credit Agricole SA | 4,088 | 66,996 | ||||||
| DANONE SA | 7,614 | 481,906 | ||||||
| Dassault Systemes SA | 1,476 | 113,212 | ||||||
| Electricite de France | 1,237 | 56,686 | ||||||
| Essilor International SA | 3,271 | 218,433 | ||||||
| France Telecom SA | 69,395 | 1,667,522 | ||||||
| GDF Suez | 9,471 | 378,052 | ||||||
| Iliad SA | 569 | 64,067 | ||||||
| L'Oreal SA | 3,228 | 379,007 | ||||||
| Lafarge SA | 2,900 | 165,727 | ||||||
| LVMH Moet Hennessy Louis Vuitton SA | 1,095 | 171,605 | ||||||
| Neopost SA | 952 | 79,089 | ||||||
| Pernod Ricard SA | 2,747 | 243,581 | ||||||
| Sanofi-Aventis | 19,555 | 1,365,732 | ||||||
| Schneider Electric SA | 1,225 | 173,905 | ||||||
| Societe Generale | 1,590 | 95,213 | ||||||
| Suez Environnement Co. | 2,266 | 44,295 | ||||||
| Technip SA | 1,173 | 98,592 | ||||||
| Total SA | 15,689 | 852,585 | ||||||
| Unibail-Rodamco SE (REIT) | 516 | 107,510 | ||||||
| Vallourec SA | 903 | 93,719 | ||||||
| Veolia Environnement | 2,694 | 79,133 | ||||||
| Vinci SA | 2,195 | 117,251 | ||||||
| Vivendi | 4,324 | 123,342 | ||||||
| (Cost $7,202,941) | 9,097,737 | |||||||
| Germany 5.6% | ||||||||
| Allianz SE (Registered) | 2,189 | 274,320 | ||||||
| BASF SE | 5,040 | 366,727 | ||||||
| Bayer AG (Registered) | 4,967 | 370,679 | ||||||
| Bayerische Motoren Werke (BMW) AG | 750 | 53,769 | ||||||
| Beiersdorf AG | 5,201 | 338,846 | ||||||
| Daimler AG (Registered)* | 3,585 | 236,657 | ||||||
| Deutsche Boerse AG | 974 | 68,540 | ||||||
| Deutsche Post AG (Registered) | 4,805 | 89,614 | ||||||
| Deutsche Telekom AG (Registered) | 115,115 | 1,667,860 | ||||||
| E.ON AG | 9,755 | 305,483 | ||||||
| Fresenius Medical Care AG & Co. KGaA | 1,148 | 73,131 | ||||||
| Henkel AG & Co. KGaA | 6,761 | 335,794 | ||||||
| Infineon Technologies AG* | 12,292 | 96,763 | ||||||
| K+S AG | 894 | 62,226 | ||||||
| Linde AG | 1,077 | 155,068 | ||||||
| MAN SE | 914 | 100,496 | ||||||
| Merck KGaA | 516 | 42,982 | ||||||
| Metro AG | 6,641 | 465,475 | ||||||
| Muenchener Rueckversicherungs-Gesellschaft AG (Registered) | 988 | 154,492 | ||||||
| RWE AG | 1,974 | 141,492 | ||||||
| SAP AG | 6,931 | 361,457 | ||||||
| Siemens AG (Registered) | 3,723 | 425,312 | ||||||
| Suedzucker AG | 4,908 | 116,126 | ||||||
| ThyssenKrupp AG | 2,079 | 76,505 | ||||||
| (Cost $4,420,961) | 6,379,814 | |||||||
| Greece 0.3% | ||||||||
| Alpha Bank A.E.* | 11,610 | 76,916 | ||||||
| EFG Eurobank Ergasias* | 10,218 | 63,286 | ||||||
| National Bank of Greece SA* | 13,361 | 146,349 | ||||||
| Piraeus Bank SA* | 8,032 | 41,809 | ||||||
| (Cost $499,716) | 328,360 | |||||||
| Hong Kong 2.4% | ||||||||
| Cathay Pacific Airways Ltd. | 42,000 | 112,975 | ||||||
| Cheung Kong (Holdings) Ltd. | 4,000 | 61,048 | ||||||
| CLP Holdings Ltd. | 21,000 | 170,682 | ||||||
| Esprit Holdings Ltd. | 25,800 | 138,133 | ||||||
| Genting Singapore PLC* | 213,000 | 357,112 | ||||||
| Hang Seng Bank Ltd. | 5,400 | 78,793 | ||||||
| Hong Kong & China Gas Co., Ltd. | 72,300 | 174,238 | ||||||
| Hong Kong Exchanges & Clearing Ltd. | 6,100 | 134,257 | ||||||
| HongKong Electric Holdings Ltd. | 21,500 | 136,052 | ||||||
| Hutchison Whampoa Ltd. | 40,000 | 394,775 | ||||||
| Li & Fung Ltd. | 38,000 | 200,265 | ||||||
| MTR Corp., Ltd. | 41,500 | 157,942 | ||||||
| Noble Group Ltd. | 40,181 | 57,743 | ||||||
| NWS Holdings Ltd. | 27,000 | 63,675 | ||||||
| Shangri-La Asia Ltd. | 42,000 | 94,824 | ||||||
| Sun Hung Kai Properties Ltd. | 9,000 | 153,614 | ||||||
| Swire Pacific Ltd. "A" | 8,500 | 120,406 | ||||||
| Television Broadcasts Ltd. | 8,000 | 42,625 | ||||||
| Yue Yuen Industrial (Holdings) Ltd. | 19,000 | 68,144 | ||||||
| (Cost $1,665,518) | 2,717,303 | |||||||
| Ireland 0.7% | ||||||||
| CRH PLC (b) | 9,730 | 166,637 | ||||||
| CRH PLC (b) | 32,910 | 563,620 | ||||||
| Experian PLC | 9,145 | 106,311 | ||||||
| (Cost $830,449) | 836,568 | |||||||
| Italy 3.9% | ||||||||
| A2A SpA | 26,463 | 43,129 | ||||||
| Assicurazioni Generali SpA | 4,657 | 102,086 | ||||||
| Atlantia SpA | 8,831 | 201,818 | ||||||
| Enel SpA | 59,729 | 341,044 | ||||||
| Eni SpA | 27,415 | 617,749 | ||||||
| Fiat SpA | 18,669 | 315,960 | ||||||
| Finmeccanica SpA | 18,030 | 251,695 | ||||||
| Intesa Sanpaolo | 33,805 | 118,918 | ||||||
| Luxottica Group SpA | 3,194 | 94,376 | ||||||
| Mediaset SpA | 17,879 | 131,885 | ||||||
| Prysmian SpA | 9,207 | 178,503 | ||||||
| Saipem SpA | 2,945 | 130,876 | ||||||
| Snam Rete Gas SpA | 6,936 | 37,576 | ||||||
| Telecom Italia SpA | 696,810 | 1,068,742 | ||||||
| Telecom Italia SpA (RSP) | 515,535 | 631,419 | ||||||
| Terna - Rete Elettrica Nationale SpA | 7,834 | 36,145 | ||||||
| UBI Banca - Unione di Banche Italiane ScpA | 5,181 | 54,695 | ||||||
| UniCredit SpA | 60,011 | 156,439 | ||||||
| (Cost $3,620,208) | 4,513,055 | |||||||
| Japan 19.4% | ||||||||
| AEON Co., Ltd. | 13,000 | 153,150 | ||||||
| Ajinomoto Co., Inc. | 19,000 | 181,335 | ||||||
| Alfresa Holdings Corp. | 1,300 | 54,685 | ||||||
| Asahi Breweries Ltd. | 8,600 | 173,667 | ||||||
| Asahi Glass Co., Ltd. | 5,000 | 48,030 | ||||||
| Asahi Kasei Corp. | 21,000 | 123,437 | ||||||
| Astellas Pharma, Inc. | 8,600 | 319,975 | ||||||
| Canon, Inc. | 12,150 | 561,675 | ||||||
| Central Japan Railway Co. | 11 | 83,248 | ||||||
| Chubu Electric Power Co., Inc. | 12,200 | 308,677 | ||||||
| Chugai Pharmaceutical Co., Ltd. | 5,200 | 91,050 | ||||||
| Chugoku Electric Power Co., Inc. | 8,600 | 173,560 | ||||||
| Cosmo Oil Co., Ltd. | 69,000 | 186,069 | ||||||
| Dai-ichi Life Insurance Co., Ltd. | 49 | 59,431 | ||||||
| Daiichi Sankyo Co., Ltd. | 13,200 | 279,682 | ||||||
| Daikin Industries Ltd. | 2,600 | 90,501 | ||||||
| Denso Corp. | 2,300 | 71,598 | ||||||
| Dowa Holdings Co., Ltd. | 10,000 | 60,768 | ||||||
| East Japan Railway Co. | 1,798 | 111,160 | ||||||
| Eisai Co., Ltd. | 6,000 | 206,387 | ||||||
| Electric Power Development Co., Ltd. | 3,600 | 106,698 | ||||||
| FamilyMart Co., Ltd. | 1,300 | 46,139 | ||||||
| FANUC Ltd. | 1,000 | 144,774 | ||||||
| FUJIFILM Holdings Corp. | 4,100 | 136,803 | ||||||
| Fujitsu Ltd. | 16,000 | 109,358 | ||||||
| Hisamitsu Pharmaceutical Co., Inc. | 5,200 | 213,247 | ||||||
| Hitachi Ltd. | 44,000 | 199,031 | ||||||
| Hokkaido Electric Power Co., Inc. | 4,900 | 103,091 | ||||||
| Hokuriku Electric Power Co. | 5,600 | 135,912 | ||||||
| Honda Motor Co., Ltd. | 3,100 | 113,144 | ||||||
| HOYA Corp. | 4,300 | 100,567 | ||||||
| Idemitsu Kosan Co., Ltd. | 2,400 | 201,914 | ||||||
| INPEX Corp. | 165 | 858,115 | ||||||
| ITOCHU Corp. | 11,000 | 96,508 | ||||||
| Japan Petroleum Exploration Co., Ltd. | 3,100 | 118,460 | ||||||
| Japan Tobacco, Inc. | 100 | 311,048 | ||||||
| JFE Holdings, Inc. | 6,200 | 193,543 | ||||||
| JSR Corp. | 4,400 | 76,168 | ||||||
| JX Holdings, Inc. | 176,990 | 1,040,341 | ||||||
| Kansai Electric Power Co., Inc. | 14,200 | 359,632 | ||||||
| Kao Corp. | 11,200 | 284,349 | ||||||
| KDDI Corp. | 86 | 463,291 | ||||||
| Keyence Corp. | 200 | 49,584 | ||||||
| Kikkoman Corp. | 7,000 | 75,506 | ||||||
| Kirin Holdings Co., Ltd. | 19,000 | 260,669 | ||||||
| Kobe Steel Ltd. | 32,000 | 70,386 | ||||||
| Komatsu Ltd. | 7,200 | 176,443 | ||||||
| Kubota Corp. | 13,000 | 115,670 | ||||||
| Kuraray Co., Ltd. | 8,000 | 114,627 | ||||||
| Kyocera Corp. | 1,400 | 139,704 | ||||||
| Kyowa Hakko Kirin Co., Ltd. | 6,000 | 58,755 | ||||||
| Kyushu Electric Power Co., Inc. | 7,300 | 172,997 | ||||||
| Lawson, Inc. | 1,800 | 81,869 | ||||||
| Marubeni Corp. | 9,000 | 56,593 | ||||||
| Medipal Holdings Corp. | 5,500 | 64,248 | ||||||
| MEIJI Holdings Co., Ltd. | 2,400 | 110,799 | ||||||
| Mitsubishi Chemical Holdings Corp. (a) | 20,000 | 103,144 | ||||||
| Mitsubishi Corp. | 6,100 | 146,682 | ||||||
| Mitsubishi Electric Corp. | 12,000 | 112,589 | ||||||
| Mitsubishi Estate Co., Ltd. | 7,000 | 122,654 | ||||||
| Mitsubishi Heavy Industries Ltd. | 22,000 | 80,104 | ||||||
| Mitsubishi Materials Corp.* | 23,000 | 72,027 | ||||||
| Mitsubishi Tanabe Pharma Corp. | 7,000 | 114,477 | ||||||
| Mitsubishi UFJ Financial Group, Inc. | 67,700 | 315,490 | ||||||
| Mitsui & Co., Ltd. | 8,500 | 133,621 | ||||||
| Mitsui Fudosan Co., Ltd. | 7,000 | 132,310 | ||||||
| Mitsui O.S.K Lines Ltd. | 13,000 | 83,360 | ||||||
| Mizuho Financial Group, Inc. | 188,100 | 273,490 | ||||||
| MS&AD Insurance Group Holdings, Inc. | 3,100 | 74,466 | ||||||
| Murata Manufacturing Co., Ltd. | 2,100 | 118,087 | ||||||
| NEC Corp. | 21,000 | 58,457 | ||||||
| Nidec Corp. | 500 | 49,459 | ||||||
| Nintendo Co., Ltd. | 800 | 207,282 | ||||||
| Nippon Meat Packers, Inc. | 6,000 | 69,790 | ||||||
| Nippon Steel Corp. | 68,000 | 213,794 | ||||||
| Nippon Telegraph & Telephone Corp. | 15,405 | 699,705 | ||||||
| Nissan Motor Co., Ltd. | 10,500 | 92,643 | ||||||
| Nisshin Seifun Group, Inc. | 7,500 | 92,830 | ||||||
| Nissin Foods Holdings Co., Ltd. | 2,300 | 83,345 | ||||||
| Nitto Denko Corp. | 2,400 | 89,773 | ||||||
| NKSJ Holdings, Inc.* | 10,000 | 68,721 | ||||||
| Nomura Holdings, Inc. | 26,800 | 139,212 | ||||||
| NTT DoCoMo, Inc. | 462 | 777,942 | ||||||
| OJI Paper Co., Ltd. | 14,000 | 64,720 | ||||||
| Olympus Corp. | 6,000 | 157,326 | ||||||
| Ono Pharmaceutical Co., Ltd. | 2,100 | 89,251 | ||||||
| ORIX Corp. | 930 | 84,829 | ||||||
| Osaka Gas Co., Ltd. | 34,000 | 128,445 | ||||||
| Panasonic Corp. | 7,900 | 116,139 | ||||||
| Ricoh Co., Ltd. | 7,000 | 97,950 | ||||||
| Santen Pharmaceutical Co., Ltd. | 2,800 | 96,662 | ||||||
| Sapporo Holdings Ltd. | 14,000 | 55,151 | ||||||
| Seven & I Holdings Co., Ltd. | 16,000 | 372,412 | ||||||
| Sharp Corp. | 6,000 | 59,277 | ||||||
| Shikoku Electric Power Co., Inc. | 5,300 | 156,820 | ||||||
| Shin-Etsu Chemical Co., Ltd. | 4,900 | 248,136 | ||||||
| Shionogi & Co., Ltd. | 7,000 | 121,958 | ||||||
| Shiseido Co., Ltd. | 6,800 | 142,135 | ||||||
| Showa Shell Sekiyu K.K. | 16,800 | 141,340 | ||||||
| SMC Corp. | 300 | 45,856 | ||||||
| Softbank Corp. | 24,400 | 785,336 | ||||||
| Sony Corp. | 3,500 | 117,000 | ||||||
| Sumitomo Chemical Co., Ltd. | 19,000 | 82,876 | ||||||
| Sumitomo Corp. | 6,800 | 86,194 | ||||||
| Sumitomo Electric Industries Ltd. | 8,900 | 113,586 | ||||||
| Sumitomo Metal Industries Ltd. | 52,000 | 120,840 | ||||||
| Sumitomo Metal Mining Co., Ltd. | 10,000 | 158,817 | ||||||
| Sumitomo Mitsui Financial Group, Inc. | 7,300 | 218,810 | ||||||
| Sumitomo Realty & Development Co., Ltd. | 3,000 | 65,391 | ||||||
| Suzuken Co., Ltd. | 2,400 | 75,487 | ||||||
| Takeda Pharmaceutical Co., Ltd. | 14,600 | 684,006 | ||||||
| TDK Corp. | 1,700 | 97,073 | ||||||
| Terumo Corp. | 3,300 | 167,522 | ||||||
| Tohoku Electric Power Co., Inc. | 7,900 | 177,399 | ||||||
| Tokio Marine Holdings, Inc. | 4,200 | 118,375 | ||||||
| Tokyo Electric Power Co., Inc. | 21,500 | 514,322 | ||||||
| Tokyo Electron Ltd. | 1,600 | 90,369 | ||||||
| Tokyo Gas Co., Ltd. | 44,000 | 207,233 | ||||||
| TonenGeneral Sekiyu K.K. | 30,000 | 267,305 | ||||||
| Toray Industries, Inc. | 19,000 | 110,029 | ||||||
| Toshiba Corp. | 37,000 | 185,299 | ||||||
| Toyo Suisan Kaisha Ltd. | 3,000 | 64,347 | ||||||
| Toyota Motor Corp. | 4,800 | 170,538 | ||||||
| Tsumura & Co. | 2,000 | 61,538 | ||||||
| Unicharm Corp. | 3,000 | 114,639 | ||||||
| UNY Co., Ltd. | 10,700 | 89,222 | ||||||
| Yahoo Japan Corp. | 220 | 76,988 | ||||||
| Yakult Honsha Co., Ltd. | 3,400 | 99,418 | ||||||
| Yamazaki Baking Co., Ltd. | 5,000 | 60,954 | ||||||
| (Cost $19,534,888) | 22,182,842 | |||||||
| Luxembourg 0.5% | ||||||||
| ArcelorMittal | 10,072 | 323,751 | ||||||
| Millicom International Cellular SA (SDR) | 1,537 | 145,194 | ||||||
| Tenaris SA | 6,332 | 131,312 | ||||||
| (Cost $397,528) | 600,257 | |||||||
| Macau 0.2% | ||||||||
| Sands China Ltd.* | 44,000 | 95,592 | ||||||
| Wynn Macau Ltd.* | 44,000 | 97,295 | ||||||
| (Cost $129,836) | 192,887 | |||||||
| Netherlands 5.5% | ||||||||
| AEGON NV* | 14,094 | 89,331 | ||||||
| Akzo Nobel NV | 5,456 | 323,946 | ||||||
| ASML Holding NV | 17,303 | 570,992 | ||||||
| Heineken Holding NV | 1,828 | 78,718 | ||||||
| Heineken NV | 3,980 | 201,744 | ||||||
| ING Groep NV (CVA)* | 34,642 | 369,807 | ||||||
| Koninklijke (Royal) KPN NV | 102,051 | 1,704,415 | ||||||
| Koninklijke Ahold NV | 20,474 | 282,962 | ||||||
| Koninklijke DSM NV | 4,034 | 215,710 | ||||||
| Koninklijke Philips Electronics NV | 12,371 | 374,146 | ||||||
| Randstad Holding NV* | 2,331 | 110,954 | ||||||
| Reed Elsevier NV | 23,506 | 306,284 | ||||||
| Royal Dutch Shell PLC "A" | 6,055 | 196,567 | ||||||
| Royal Dutch Shell PLC "B" | 4,565 | 146,185 | ||||||
| TNT NV | 6,985 | 185,685 | ||||||
| Unilever NV (CVA) | 28,715 | 851,466 | ||||||
| Wolters Kluwer NV | 9,956 | 226,489 | ||||||
| (Cost $4,414,146) | 6,235,401 | |||||||
| Norway 2.9% | ||||||||
| Aker Solutions ASA | 5,200 | 79,200 | ||||||
| DnB NOR ASA | 34,848 | 478,397 | ||||||
| Norsk Hydro ASA | 61,794 | 378,365 | ||||||
| Orkla ASA | 46,627 | 451,414 | ||||||
| Renewable Energy Corp. ASA* | 31,164 | 108,392 | ||||||
| Statoil ASA | 26,200 | 572,172 | ||||||
| Telenor ASA | 35,100 | 566,061 | ||||||
| Yara International ASA | 12,319 | 647,859 | ||||||
| (Cost $2,120,212) | 3,281,860 | |||||||
| Portugal 0.4% | ||||||||
| EDP — Energias de Portugal SA (Cost $416,006) | 126,069 | 482,347 | ||||||
| Singapore 1.6% | ||||||||
| CapitaLand Ltd. | 20,000 | 60,110 | ||||||
| ComfortDelGro Corp., Ltd. | 60,000 | 68,608 | ||||||
| DBS Group Holdings Ltd. | 14,000 | 150,351 | ||||||
| Jardine Cycle & Carriage Ltd. | 5,000 | 151,819 | ||||||
| K-Green Trust (Units)* | 3,600 | 3,004 | ||||||
| Keppel Corp., Ltd. | 18,000 | 138,793 | ||||||
| Oversea-Chinese Banking Corp., Ltd. | 25,000 | 174,032 | ||||||
| Singapore Airlines Ltd. | 8,000 | 97,783 | ||||||
| Singapore Exchange Ltd. | 9,000 | 61,191 | ||||||
| Singapore Press Holdings Ltd. | 54,000 | 173,144 | ||||||
| Singapore Technologies Engineering Ltd. | 26,000 | 66,492 | ||||||
| Singapore Telecommunications Ltd. | 207,000 | 494,190 | ||||||
| United Overseas Bank Ltd. | 11,000 | 158,418 | ||||||
| (Cost $1,056,035) | 1,797,935 | |||||||
| Spain 4.3% | ||||||||
| Abertis Infraestructuras SA | 7,875 | 155,528 | ||||||
| ACS, Actividades de Construccion y Servicios SA (a) | 3,077 | 161,496 | ||||||
| Banco Bilbao Vizcaya Argentaria SA | 10,748 | 141,363 | ||||||
| Banco Santander SA | 20,621 | 264,933 | ||||||
| EDP Renovaveis SA* | 18,164 | 105,395 | ||||||
| Enagas | 3,019 | 66,536 | ||||||
| Ferrovial SA | 13,731 | 156,556 | ||||||
| Gamesa Corp. Tecnologica SA* | 4,653 | 32,380 | ||||||
| Gas Natural SDG SA | 2,866 | 41,963 | ||||||
| Gestevision Telecinco SA | 4,101 | 52,317 | ||||||
| Iberdrola Renovables SA | 11,028 | 37,282 | ||||||
| Iberdrola SA | 40,326 | 340,122 | ||||||
| Iberia Lineas Aereas de Espana SA* | 15,085 | 66,198 | ||||||
| Industria de Diseno Textil SA | 6,830 | 570,455 | ||||||
| Red Electrica Corporacion SA | 1,496 | 75,155 | ||||||
| Repsol YPF SA | 30,966 | 858,737 | ||||||
| Telefonica SA (a) | 63,828 | 1,723,415 | ||||||
| Zardoya Otis SA | 4,076 | 67,906 | ||||||
| (Cost $3,548,168) | 4,917,737 | |||||||
| Sweden 3.2% | ||||||||
| AB SKF "B" | 4,661 | 120,369 | ||||||
| Assa Abloy AB "B" | 2,785 | 71,380 | ||||||
| Atlas Copco AB "A" | 7,373 | 154,090 | ||||||
| Atlas Copco AB "B" | 4,269 | 81,422 | ||||||
| Boliden AB | 10,318 | 175,168 | ||||||
| Electrolux AB "B" | 4,265 | 103,438 | ||||||
| Hennes & Mauritz AB "B" | 15,428 | 543,704 | ||||||
| Holmen AB "B" | 3,342 | 106,119 | ||||||
| Husqvarna AB "B" | 7,514 | 52,837 | ||||||
| Modern Times Group "B" | 937 | 67,206 | ||||||
| Nordea Bank AB | 17,258 | 190,029 | ||||||
| Sandvik AB | 9,845 | 148,420 | ||||||
| Scania AB "B" | 3,839 | 81,612 | ||||||
| Skandinaviska Enskilda Banken AB "A" | 7,816 | 60,554 | ||||||
| Skanska AB "B" | 4,563 | 87,303 | ||||||
| SSAB AB "A" | 8,107 | 113,662 | ||||||
| SSAB AB "B" | 4,850 | 60,047 | ||||||
| Svenska Cellulosa AB "B" | 22,883 | 354,910 | ||||||
| Svenska Handelsbanken AB "A" | 4,265 | 139,450 | ||||||
| Tele2 AB "B" | 5,895 | 129,732 | ||||||
| Telefonaktiebolaget LM Ericsson "B" | 35,525 | 390,370 | ||||||
| TeliaSonera AB | 31,497 | 262,882 | ||||||
| Volvo AB "B"* | 9,438 | 127,801 | ||||||
| (Cost $2,239,466) | 3,622,505 | |||||||
| Switzerland 6.4% | ||||||||
| ABB Ltd. (Registered)* | 13,938 | 288,660 | ||||||
| Actelion Ltd. (Registered)* | 1,372 | 68,471 | ||||||
| Adecco SA (Registered) | 1,178 | 65,840 | ||||||
| Aryzta AG | 1,449 | 64,274 | ||||||
| Compagnie Financiere Richemont SA "A" | 8,323 | 415,114 | ||||||
| Credit Suisse Group AG (Registered) | 3,127 | 129,173 | ||||||
| Geberit AG (Registered) | 473 | 90,606 | ||||||
| Givaudan SA (Registered) | 143 | 147,352 | ||||||
| Holcim Ltd. (Registered) | 3,392 | 211,472 | ||||||
| Nestle SA (Registered) | 26,542 | 1,453,802 | ||||||
| Novartis AG (Registered) | 12,482 | 723,640 | ||||||
| Roche Holding AG (Genusschein) | 4,163 | 611,304 | ||||||
| SGS SA (Registered) | 46 | 73,624 | ||||||
| Sika AG (Bearer) | 50 | 99,080 | ||||||
| Sonova Holding AG (Registered) | 361 | 41,821 | ||||||
| STMicroelectronics NV | 15,190 | 132,853 | ||||||
| Swatch Group AG (Bearer) | 527 | 201,417 | ||||||
| Swatch Group AG (Registered) | 1,152 | 80,074 | ||||||
| Swiss Reinsurance Co., Ltd. (Registered) | 1,017 | 48,884 | ||||||
| Swisscom AG (Registered) | 3,955 | 1,652,254 | ||||||
| Syngenta AG (Registered) | 1,250 | 345,765 | ||||||
| UBS AG (Registered)* | 9,994 | 169,199 | ||||||
| Xstrata PLC | 7,134 | 138,260 | ||||||
| Zurich Financial Services AG | 437 | 106,980 | ||||||
| (Cost $4,602,580) | 7,359,919 | |||||||
| United Kingdom 7.1% | ||||||||
| Anglo American PLC | 3,139 | 146,266 | ||||||
| ARM Holdings PLC | 46,593 | 271,234 | ||||||
| AstraZeneca PLC | 11,220 | 562,633 | ||||||
| Autonomy Corp. PLC* | 6,950 | 162,813 | ||||||
| BAE Systems PLC | 30,972 | 171,068 | ||||||
| Barclays PLC | 14,664 | 64,522 | ||||||
| BG Group PLC | 7,947 | 154,780 | ||||||
| BHP Billiton PLC | 7,861 | 278,814 | ||||||
| BP PLC | 37,256 | 254,191 | ||||||
| British American Tobacco PLC | 4,235 | 161,506 | ||||||
| British Sky Broadcasting Group PLC | 9,667 | 109,436 | ||||||
| BT Group PLC | 82,046 | 202,064 | ||||||
| Cable & Wireless Communications PLC | 33,681 | 28,846 | ||||||
| Cable & Wireless Worldwide PLC | 9,881 | 11,115 | ||||||
| Capita Group PLC | 7,861 | 96,549 | ||||||
| Centrica PLC | 29,479 | 156,917 | ||||||
| Compass Group PLC | 16,735 | 137,161 | ||||||
| Diageo PLC | 5,955 | 109,924 | ||||||
| GlaxoSmithKline PLC | 40,158 | 785,679 | ||||||
| HSBC Holdings PLC | 15,258 | 158,696 | ||||||
| Imperial Tobacco Group PLC | 2,868 | 91,865 | ||||||
| Inmarsat PLC | 7,165 | 74,855 | ||||||
| International Power PLC | 12,345 | 82,546 | ||||||
| Kingfisher PLC | 20,918 | 79,706 | ||||||
| Marks & Spencer Group PLC | 12,065 | 82,627 | ||||||
| National Grid PLC | 20,716 | 195,846 | ||||||
| Next PLC | 1,899 | 69,529 | ||||||
| Pearson PLC | 6,852 | 104,798 | ||||||
| Reckitt Benckiser Group PLC | 996 | 55,714 | ||||||
| Reed Elsevier PLC | 11,153 | 95,610 | ||||||
| Rio Tinto PLC | 4,492 | 290,502 | ||||||
| Rolls-Royce Group PLC* | 14,930 | 154,902 | ||||||
| Rolls-Royce Group PLC "C"* | 955,520 | 1,531 | ||||||
| SABMiller PLC | 2,992 | 97,011 | ||||||
| Scottish & Southern Energy PLC | 6,568 | 121,345 | ||||||
| Severn Trent PLC | 3,041 | 67,975 | ||||||
| Shire PLC | 4,779 | 112,644 | ||||||
| Smith & Nephew PLC | 11,211 | 98,622 | ||||||
| Smiths Group PLC | 5,574 | 106,464 | ||||||
| Standard Chartered PLC | 2,621 | 75,827 | ||||||
| Tesco PLC | 10,973 | 75,051 | ||||||
| The Sage Group PLC | 42,573 | 183,776 | ||||||
| Unilever PLC | 2,855 | 82,299 | ||||||
| United Utilities Group PLC | 7,244 | 70,921 | ||||||
| Vodafone Group PLC | 511,174 | 1,391,208 | ||||||
| William Morrison Supermarkets PLC | 11,099 | 52,251 | ||||||
| Wolseley PLC* | 2,160 | 57,558 | ||||||
| WPP PLC | 10,408 | 121,077 | ||||||
| (Cost $5,697,669) | 8,118,274 | |||||||
Total Common Stocks (Cost $75,851,765) | 102,218,524 | |||||||
| Preferred Stocks 0.6% | ||||||||
| Germany | ||||||||
| Fresenius SE | 721 | 64,635 | ||||||
| Henkel AG & Co. KGaA | 9,193 | 542,244 | ||||||
| Volkswagen AG | 722 | 108,527 | ||||||
Total Preferred Stocks (Cost $348,126) | 715,406 | |||||||
| Rights 0.0% | ||||||||
| Australia | ||||||||
| TABCORP Holdings Ltd., Expiration Date 11/10/2010* (Cost $0) | 2,668 | 2,953 | ||||||
| Exchange-Traded Funds 9.9% | ||||||||
| iShares MSCI Emerging Markets Index (a) | 122,000 | 5,627,860 | ||||||
| Vanguard Emerging Markets (a) | 120,050 | 5,621,942 | ||||||
Total Exchange-Traded Funds (Cost $7,945,513) | 11,249,802 | |||||||
| Securities Lending Collateral 9.8% | ||||||||
| Daily Assets Fund Institutional, 0.26% (c) (d) (Cost $11,148,295) | 11,148,295 | 11,148,295 | ||||||
| Cash Equivalents 0.2% | ||||||||
| Central Cash Management Fund, 0.20% (c) (Cost $274,268) | 274,268 | 274,268 | ||||||
| % of Net Assets | Value ($) | |||||||
Total Investment Portfolio (Cost $95,567,967)+ | 110.1 | 125,609,248 | ||||||
| Other Assets and Liabilities, Net | (10.1 | ) | (11,517,073 | ) | ||||
| Net Assets | 100.0 | 114,092,175 | ||||||
* Non-income producing security.
+ The cost for federal income tax purposes was $96,768,347. At October 31, 2010, net unrealized appreciation for all securities based on tax cost was $28,840,901. This consisted of aggregate gross unrealized appreciation for all securities in which there was an excess of value over tax cost of $31,233,479 and aggregate gross unrealized depreciation for all securities in which there was an excess of tax cost over value of $2,392,578.
(a) All or a portion of these securities were on loan (see Notes to Financial Statements). The value of all securities loaned at October 31, 2010 amounted to $10,871,622, which is 9.5% of net assets.
(b) Securities with the same description are the same corporate entity but trade on different stock exchanges.
(c) Affiliated fund managed by Deutsche Investment Management Americas Inc. The rate shown is the annualized seven-day yield at period end.
(d) Represents collateral held in connection with securities lending. Income earned by the Fund is net of borrower rebates.
CVA: Certificaten Van Aandelen
MSCI: Morgan Stanley Capital International
REIT: Real Estate Investment Trust
RSP: Risparmio (Convertible Savings Shares)
SDR: Swedish Depositary Receipt
At October 31, 2010, open futures contracts purchased were as follows:
| Futures | Currency | Expiration Date | Contracts | Notional Value ($) | Unrealized Appreciation ($) | |||||||||
| DJ Euro Stoxx 50 Index | EUR | 12/17/2010 | 9 | 355,619 | 6,138 | |||||||||
| FTSE 100 Index | GBP | 12/17/2010 | 1 | 90,709 | 1,995 | |||||||||
| Nikkei 225 Index | USD | 12/9/2010 | 3 | 137,775 | 1,500 | |||||||||
| Total unrealized appreciation | 9,633 | |||||||||||||
| Currency Abbreviations |
EUR Euro GBP British Pound USD United States Dollar |
For information on the Fund's policy and additional disclosures regarding futures contracts, please refer to the Derivatives Section of Note B in the accompanying Notes to Financial Statements.
Fair Value Measurements
Various inputs are used in determining the value of the Fund's investments. These inputs are summarized in three broad levels. Level 1 includes quoted prices in active markets for identical securities. Level 2 includes other significant observable inputs (including quoted prices for similar securities, interest rates, prepayment speeds and credit risk). Level 3 includes significant unobservable inputs (including the Fund's own assumptions in determining the fair value of investments). The inputs or methodology used for valuing securities are not necessarily an indication of the risk associated with investing in those securities.
The following is a summary of the inputs used as of October 31, 2010 in valuing the Fund's investments. For information on the Fund's policy regarding the valuation of investments, please refer to the Security Valuation section of Note A in the accompanying Notes to Financial Statements.
| Assets | Level 1 | Level 2 | Level 3 | Total | ||||||||||||
| Common Stock and/or Other Equity Investments (e) | ||||||||||||||||
| Australia | $ | — | $ | 4,864,104 | $ | — | $ | 4,864,104 | ||||||||
| Austria | — | 550,975 | — | 550,975 | ||||||||||||
| Belgium | — | 1,754,934 | — | 1,754,934 | ||||||||||||
| Bermuda | — | 239,296 | — | 239,296 | ||||||||||||
| Canada | 5,780,879 | — | — | 5,780,879 | ||||||||||||
| Cyprus | — | 65,126 | — | 65,126 | ||||||||||||
| Denmark | — | 2,582,998 | — | 2,582,998 | ||||||||||||
| Finland | — | 3,718,364 | — | 3,718,364 | ||||||||||||
| France | — | 9,097,737 | — | 9,097,737 | ||||||||||||
| Germany | — | 7,095,220 | — | 7,095,220 | ||||||||||||
| Greece | — | 328,360 | — | 328,360 | ||||||||||||
| Hong Kong | — | 2,717,303 | — | 2,717,303 | ||||||||||||
| Ireland | — | 836,568 | — | 836,568 | ||||||||||||
| Italy | — | 4,513,055 | — | 4,513,055 | ||||||||||||
| Japan | — | 22,182,842 | — | 22,182,842 | ||||||||||||
| Luxembourg | — | 600,257 | — | 600,257 | ||||||||||||
| Macau | — | 192,887 | — | 192,887 | ||||||||||||
| Netherlands | — | 6,235,401 | — | 6,235,401 | ||||||||||||
| Norway | — | 3,281,860 | — | 3,281,860 | ||||||||||||
| Portugal | — | 482,347 | — | 482,347 | ||||||||||||
| Singapore | — | 1,797,935 | — | 1,797,935 | ||||||||||||
| Spain | — | 4,917,737 | — | 4,917,737 | ||||||||||||
| Sweden | — | 3,622,505 | — | 3,622,505 | ||||||||||||
| Switzerland | — | 7,359,919 | — | 7,359,919 | ||||||||||||
| United Kingdom | — | 8,116,743 | 1,531 | 8,118,274 | ||||||||||||
| Exchange-Traded Funds | 11,249,802 | — | — | 11,249,802 | ||||||||||||
| Short-Term Investments (e) | 11,422,563 | — | — | 11,422,563 | ||||||||||||
| Derivatives (f) | 9,633 | — | — | 9,633 | ||||||||||||
| Total | $ | 28,462,877 | $ | 97,154,473 | $ | 1,531 | $ | 125,618,881 | ||||||||
There have been no significant transfers in and out of Level 1 and Level 2 fair value measurements during the year ended October 31, 2010.
(e) See Investment Portfolio for additional detailed categorizations.
(f) Derivatives include unrealized appreciation (deprecation) on open futures contracts.
Level 3 Reconciliation
The following is a reconciliation of the Fund's Level 3 investments for which significant unobservable inputs were used in determining value:
| Common Stocks | ||||
| United Kingdom | ||||
| Balance as of October 31, 2009 | $ | — | ||
| Realized gain (loss) | — | |||
| Change in unrealized appreciation (depreciation) | 18 | |||
| Amortization premium/discount | — | |||
| Net purchases (sales) | 1,513 | |||
| Transfers into Level 3 | — | |||
| Transfers (out) of Level 3 | — | |||
| Balance as of October 31, 2010 | $ | 1,531 | ||
| Net change in unrealized appreciation (depreciation) from investments still held as of October 31, 2010 | $ | 18 | ||
Transfers between price levels are recognized at the beginning of the reporting period.
The accompanying notes are an integral part of the financial statements.
| as of October 31, 2010 | ||||
| Assets | ||||
Investments: Investments in securities, at value (cost $84,145,404) — including $10,871,622 of securities loaned | $ | 114,186,685 | ||
| Investment in Daily Assets Fund Institutional (cost $11,148,295)* | 11,148,295 | |||
| Investment in Central Cash Management Fund (cost $274,268) | 274,268 | |||
| Total investments, at value (cost $95,567,967) | 125,609,248 | |||
| Foreign currency, at value (cost $120,391) | 124,317 | |||
| Cash | 5,572 | |||
| Deposits with broker for open futures contracts | 119,754 | |||
| Receivable for investments sold | 2,970 | |||
| Dividends receivable | 250,472 | |||
| Interest receivable | 1,103 | |||
| Receivable for Fund shares sold | 27,081 | |||
| Receivable for variation margin on open futures contracts | 9,633 | |||
| Foreign taxes recoverable | 80,752 | |||
| Other assets | 23,645 | |||
| Total assets | 126,254,547 | |||
| Liabilities | ||||
| Payable upon return of securities loaned | 11,148,295 | |||
| Payable for investments purchased | 1,531 | |||
| Payable for Fund shares redeemed | 672,036 | |||
| Accrued management fee | 115,731 | |||
| Other accrued expenses and payables | 224,779 | |||
| Total liabilities | 12,162,372 | |||
| Net assets, at value | $ | 114,092,175 | ||
| Net Assets Consist of | ||||
| Undistributed net investment income | 2,090,301 | |||
Net unrealized appreciation (depreciation) on: Investments | 30,041,281 | |||
| Futures | 9,633 | |||
| Foreign currency | 20,042 | |||
| Accumulated net realized gain (loss) | (85,748,740 | ) | ||
| Paid-in capital | 167,679,658 | |||
| Net assets, at value | $ | 114,092,175 | ||
* Represents collateral on securities loaned.
The accompanying notes are an integral part of the financial statements.
Statement of Assets and Liabilities as of October 31, 2010 (continued) | ||||
| Net Asset Value | ||||
Class A Net Asset Value and redemption price(a) per share ($37,229,232 ÷ 5,060,325 outstanding shares of beneficial interest, $.001 par value, unlimited number of shares authorized) | $ | 7.36 | ||
| Maximum offering price per share (100 ÷ 94.25 of $7.36) | $ | 7.81 | ||
Class B Net Asset Value, offering and redemption price(a) (subject to contingent deferred sales charge) per share ($1,788,922 ÷ 252,608 outstanding shares of beneficial interest, $.001 par value, unlimited number of shares authorized) | $ | 7.08 | ||
Class C Net Asset Value, offering and redemption price(a) (subject to contingent deferred sales charge) per share ($5,683,343 ÷ 802,700 outstanding shares of beneficial interest, $.001 par value, unlimited number of shares authorized) | $ | 7.08 | ||
Class R Net Asset Value, offering and redemption price(a) (subject to contingent deferred sales charge) per share ($1,885,922 ÷ 263,465 outstanding shares of beneficial interest, $.001 par value, unlimited number of shares authorized) | $ | 7.16 | ||
Class S Net Asset Value, offering and redemption price(a) per share ($15,988,941 ÷ 2,235,911 outstanding shares of beneficial interest, $.001 par value, unlimited number of shares authorized) | $ | 7.15 | ||
Institutional Class Net Asset Value, offering and redemption price(a) per share ($51,515,815 ÷ 7,182,612 outstanding shares of beneficial interest, $.001 par value, unlimited number of shares authorized) | $ | 7.17 | ||
(a) Redemption price per share for shares held less than 15 days is equal to net asset value less a 2% redemption fee.
The accompanying notes are an integral part of the financial statements.
| for the year ended October 31, 2010 | ||||
| Investment Income | ||||
Income: Dividends (net of foreign taxes withheld of $594,239) | $ | 3,505,112 | ||
| Interest | 578 | |||
| Income distributions — Central Cash Management Fund | 4,713 | |||
| Securities lending income, including income from Daily Assets Fund Institutional, net of borrower rebates | 155,533 | |||
| Total income | 3,665,936 | |||
Expenses: Management fee | 883,339 | |||
| Administration fee | 126,191 | |||
| Services to shareholders | 236,405 | |||
| Distribution and service fees | 183,540 | |||
| Custodian fee | 99,256 | |||
| Professional fees | 71,296 | |||
| Trustees' fees and expenses | 7,641 | |||
| Reports to shareholders | 43,867 | |||
| Registration fees | 83,841 | |||
| Other | 54,930 | |||
| Total expenses before expense reductions | 1,790,306 | |||
| Expense reductions | (16,774 | ) | ||
| Total expenses after expense reductions | 1,773,532 | |||
| Net investment income (loss) | 1,892,404 | |||
| Realized and Unrealized Gain (Loss) | ||||
Net realized gain (loss) from: Investments | 4,734,632 | |||
| Futures | 29,434 | |||
| Foreign currency | (40,507 | ) | ||
| 4,723,559 | ||||
Change in net unrealized appreciation (depreciation) on: Investments | 6,471,398 | |||
| Futures | 98,742 | |||
| Foreign currency | (30,235 | ) | ||
| 6,539,905 | ||||
| Net gain (loss) | 11,263,464 | |||
| Net increase (decrease) in net assets resulting from operations | $ | 13,155,868 | ||
The accompanying notes are an integral part of the financial statements.
| Years Ended October 31, | ||||||||
| Increase (Decrease) in Net Assets | 2010 | 2009 | ||||||
Operations: Net investment income (loss) | $ | 1,892,404 | $ | 1,883,080 | ||||
| Net realized gain (loss) | 4,723,559 | (48,350,261 | ) | |||||
| Change in net unrealized appreciation (depreciation) | 6,539,905 | 66,654,456 | ||||||
| Net increase (decrease) in net assets resulting from operations | 13,155,868 | 20,187,275 | ||||||
Distributions to shareholders from: Net investment income: Class A | (607,533 | ) | (1,800,755 | ) | ||||
| Class B | (14,636 | ) | (140,465 | ) | ||||
| Class C | (31,068 | ) | (233,767 | ) | ||||
| Class R | (18,405 | ) | (24,212 | ) | ||||
| Class S | (379,373 | ) | (964,835 | ) | ||||
| Institutional Class | (1,199,659 | ) | (1,756,423 | ) | ||||
| Total distributions | (2,250,674 | ) | (4,920,457 | ) | ||||
Fund share transactions: Proceeds from shares sold | 34,163,345 | 33,523,003 | ||||||
| Reinvestment of distributions | 2,206,830 | 4,705,394 | ||||||
| Cost of shares redeemed | (59,434,068 | ) | (52,120,288 | ) | ||||
| Redemption fees | 89 | 1,698 | ||||||
| Net increase (decrease) in net assets from Fund share transactions | (23,063,804 | ) | (13,890,193 | ) | ||||
| Increase from regulatory settlements (see Note G) | 431,742 | — | ||||||
| Increase (decrease) in net assets | (11,726,868 | ) | 1,376,625 | |||||
| Net assets at beginning of year | 125,819,043 | 124,442,418 | ||||||
| Net assets at end of period (including undistributed net investment income of $2,090,301 and $2,021,863, respectively) | $ | 114,092,175 | $ | 125,819,043 | ||||
The accompanying notes are an integral part of the financial statements.
Class A Years Ended October 31, | 2010 | 2009 | 2008 | 2007 | 2006 | |||||||||||||||
| Selected Per Share Data | ||||||||||||||||||||
| Net asset value, beginning of period | $ | 6.56 | $ | 5.66 | $ | 14.53 | $ | 13.15 | $ | 11.28 | ||||||||||
Income (loss) from investment operations: Net investment income (loss)a | .08 | .08 | .22 | b | .14 | .16 | b | |||||||||||||
| Net realized and unrealized gain (loss) | .79 | 1.04 | (6.18 | ) | 3.47 | 2.51 | ||||||||||||||
| Total from investment operations | .87 | 1.12 | (5.96 | ) | 3.61 | 2.67 | ||||||||||||||
Less distributions from: Net investment income | (.09 | ) | (.22 | ) | (.07 | ) | (.44 | ) | — | |||||||||||
| Net realized gains | — | — | (2.84 | ) | (1.79 | ) | (.80 | ) | ||||||||||||
| Total distributions | (.09 | ) | (.22 | ) | (2.91 | ) | (2.23 | ) | (.80 | ) | ||||||||||
| Increase from regulatory settlements | .02 | g | — | — | — | — | ||||||||||||||
| Redemption fees | .00 | * | .00 | * | .00 | * | .00 | * | .00 | * | ||||||||||
| Net asset value, end of period | $ | 7.36 | $ | 6.56 | $ | 5.66 | $ | 14.53 | $ | 13.15 | ||||||||||
Total Return (%)c,e | 13.65 | 20.98 | (50.51 | )f | 31.76 | 23.64 | ||||||||||||||
| Ratios to Average Net Assets and Supplemental Data | ||||||||||||||||||||
| Net assets, end of period ($ millions) | 37 | 47 | 46 | 101 | 80 | |||||||||||||||
| Ratio of expenses before expense reductions (%) | 1.61 | 1.62 | 1.55 | 1.45 | 1.41 | |||||||||||||||
| Ratio of expenses after expense reductions (%) | 1.60 | 1.41 | 1.38 | 1.36 | 1.37 | |||||||||||||||
| Ratio of net investment income (%) | 1.31 | 1.53 | 2.22 | b | 1.08 | 1.30 | b | |||||||||||||
| Portfolio turnover rate (%) | 28 | 152 | 154 | 119 | 140 | d | ||||||||||||||
a Based on average shares outstanding during the period. b Net investment income per share and the ratio of net investment income include non-recurring dividend income amounting to $0.12 and $0.02 per share and 1.27% and 0.17% of average daily net assets for the years ended October 31, 2008 and 2006, respectively. c Total return does not reflect the effect of any sales charges. d Excludes portfolio securities delivered as a result of processing redemption in-kind transactions. e Total return would have been lower had certain expenses not been reduced. f Includes a reimbursement from the Advisor to reimburse the effect of losses incurred as a result of certain operation errors during the period. Excluding this reimbursement, total return would have been (50.68)%. g Includes a non-recurring payment from the Advisor, which amounted to $0.013 per share, recorded as a result of the Advisor's settlement with the SEC and NY Attorney General in connection with certain trading arrangements (see Note G). The Fund also received $0.01 per share of non-affiliated regulatory settlements. Excluding these non-recurring payments, total return would have been 0.35% lower. * Amount is less than $.005. | ||||||||||||||||||||
Class B Years Ended October 31, | 2010 | 2009 | 2008 | 2007 | 2006 | |||||||||||||||
| Selected Per Share Data | ||||||||||||||||||||
| Net asset value, beginning of period | $ | 6.31 | $ | 5.44 | $ | 14.10 | $ | 12.80 | $ | 11.08 | ||||||||||
Income (loss) from investment operations: Net investment income (loss)a | .04 | .04 | .14 | b | .04 | .07 | b | |||||||||||||
| Net realized and unrealized gain (loss) | .74 | 1.00 | (5.96 | ) | 3.38 | 2.45 | ||||||||||||||
| Total from investment operations | .78 | 1.04 | (5.82 | ) | 3.42 | 2.52 | ||||||||||||||
Less distributions from: Net investment income | (.03 | ) | (.17 | ) | — | (.33 | ) | — | ||||||||||||
| Net realized gains | — | — | (2.84 | ) | (1.79 | ) | (.80 | ) | ||||||||||||
| Total distributions | (.03 | ) | (.17 | ) | (2.84 | ) | (2.12 | ) | (.80 | ) | ||||||||||
| Increase from regulatory settlements | .02 | g | — | — | — | — | ||||||||||||||
| Redemption fees | .00 | * | .00 | * | .00 | * | .00 | * | .00 | * | ||||||||||
| Net asset value, end of period | $ | 7.08 | $ | 6.31 | $ | 5.44 | $ | 14.10 | $ | 12.80 | ||||||||||
Total Return (%)c,e | 12.75 | 20.07 | (50.89 | )f | 30.74 | 22.68 | ||||||||||||||
| Ratios to Average Net Assets and Supplemental Data | ||||||||||||||||||||
| Net assets, end of period ($ millions) | 2 | 3 | 5 | 12 | 11 | |||||||||||||||
| Ratio of expenses before reductions (%) | 2.47 | 2.59 | 2.34 | 2.23 | 2.26 | |||||||||||||||
| Ratio of expenses after expense reductions (%) | 2.32 | 2.25 | 2.18 | 2.14 | 2.14 | |||||||||||||||
| Ratio of net investment income (loss) (%) | .59 | .69 | 1.42 | b | .30 | .53 | b | |||||||||||||
| Portfolio turnover rate (%) | 28 | 152 | 154 | 119 | 140 | d | ||||||||||||||
a Based on average shares outstanding during the period. b Net investment income per share and the ratio of net investment income include non-recurring dividend income amounting to $0.12 and $0.02 per share and 1.27% and 0.17% of average daily net assets for the years ended October 31, 2008 and 2006, respectively. c Total return does not reflect the effect of any sales charges. d Excludes portfolio securities delivered as a result of processing redemption in-kind transactions. e Total return would have been lower had certain expenses not been reduced. f Includes a reimbursement from the Advisor to reimburse the effect of losses incurred as a result of certain operation errors during the period. Excluding this reimbursement, total return would have been (51.06)%. g Includes a non-recurring payment from the Advisor, which amounted to $0.011 per share, recorded as a result of the Advisor's settlement with the SEC and NY Attorney General in connection with certain trading arrangements (see Note G). The Fund also received $0.01 per share of non-affiliated regulatory settlements. Excluding these non-recurring payments, total return would have been 0.35% lower. * Amount is less than $.005. | ||||||||||||||||||||
Class C Years Ended October 31, | 2010 | 2009 | 2008 | 2007 | 2006 | |||||||||||||||
| Selected Per Share Data | ||||||||||||||||||||
| Net asset value, beginning of period | $ | 6.31 | $ | 5.44 | $ | 14.11 | $ | 12.79 | $ | 11.08 | ||||||||||
Income (loss) from investment operations: Net investment income (loss)a | .04 | .04 | .15 | b | .05 | .06 | b | |||||||||||||
| Net realized and unrealized gain (loss) | .74 | 1.01 | (5.98 | ) | 3.38 | 2.45 | ||||||||||||||
| Total from investment operations | .78 | 1.05 | (5.83 | ) | 3.43 | 2.51 | ||||||||||||||
Less distributions from: Net investment income | (.03 | ) | (.18 | ) | — | (.32 | ) | — | ||||||||||||
| Net realized gains | — | — | (2.84 | ) | (1.79 | ) | (.80 | ) | ||||||||||||
| Total distributions | (.03 | ) | (.18 | ) | (2.84 | ) | (2.11 | ) | (.80 | ) | ||||||||||
| Increase from regulatory settlements | .02 | g | — | — | — | — | ||||||||||||||
| Redemption fees | .00 | * | .00 | * | .00 | * | .00 | * | .00 | * | ||||||||||
| Net asset value, end of period | $ | 7.08 | $ | 6.31 | $ | 5.44 | $ | 14.11 | $ | 12.79 | ||||||||||
Total Return (%)c | 12.75 | 19.94 | e | (50.81 | )e,f | 30.78 | e | 22.59 | ||||||||||||
| Ratios to Average Net Assets and Supplemental Data | ||||||||||||||||||||
| Net assets, end of period ($ millions) | 6 | 6 | 8 | 18 | 16 | |||||||||||||||
| Ratio of expenses before expense reductions (%) | 2.34 | 2.45 | 2.27 | 2.18 | 2.18 | |||||||||||||||
| Ratio of expenses after expense reductions (%) | 2.34 | 2.24 | 2.10 | 2.10 | 2.18 | |||||||||||||||
| Ratio of net investment income (loss) (%) | .57 | .70 | 1.50 | b | .34 | .49 | b | |||||||||||||
| Portfolio turnover rate (%) | 28 | 152 | 154 | 119 | 140 | d | ||||||||||||||
a Based on average shares outstanding during the period. b Net investment income per share and the ratio of net investment income include non-recurring dividend income amounting to $0.12 and $0.02 per share and 1.27% and 0.17% of average daily net assets for the years ended October 31, 2008 and 2006, respectively. c Total return does not reflect the effect of any sales charges. d Excludes portfolio securities delivered as a result of processing redemption in-kind transactions. e Total return would have been lower had certain expenses not been reduced. f Includes a reimbursement from the Advisor to reimburse the effect of losses incurred as a result of certain operation errors during the period. Excluding this reimbursement, total return would have been (50.98)%. g Includes a non-recurring payment from the Advisor, which amounted to $0.012 per share, recorded as a result of the Advisor's settlement with the SEC and NY Attorney General in connection with certain trading arrangements (see Note G). The Fund also received $0.01 per share of non-affiliated regulatory settlements. Excluding these non-recurring payments, total return would have been 0.35% lower. * Amount is less than $.005. | ||||||||||||||||||||
Class R Years Ended October 31, | 2010 | 2009 | 2008 | 2007 | 2006 | a | ||||||||||||||
| Selected Per Share Data | ||||||||||||||||||||
| Net asset value, beginning of period | $ | 6.40 | $ | 5.50 | $ | 14.19 | $ | 12.86 | $ | 11.07 | ||||||||||
Income (loss) from investment operations: Net investment income (loss)b | .07 | .08 | .22 | c | .13 | .13 | c | |||||||||||||
| Net realized and unrealized gain (loss) | .76 | 1.03 | (6.04 | ) | 3.39 | 2.46 | ||||||||||||||
| Total from investment operations | .83 | 1.11 | (5.82 | ) | 3.52 | 2.59 | ||||||||||||||
Less distributions from: Net investment income | (.09 | ) | (.21 | ) | (.03 | ) | (.40 | ) | — | |||||||||||
| Net realized gains | — | — | (2.84 | ) | (1.79 | ) | (.80 | ) | ||||||||||||
| Total distributions | (.09 | ) | (.21 | ) | (2.87 | ) | (2.19 | ) | (.80 | ) | ||||||||||
| Increase from regulatory settlements | .02 | g | — | — | — | — | ||||||||||||||
| Redemption fees | .00 | * | .00 | * | .00 | * | .00 | * | .00 | * | ||||||||||
| Net asset value, end of period | $ | 7.16 | $ | 6.40 | $ | 5.50 | $ | 14.19 | $ | 12.86 | ||||||||||
| Total Return (%) | 13.35 | 21.19 | e | (50.62 | )e,f | 31.66 | e | 23.36 | e | |||||||||||
| Ratios to Average Net Assets and Supplemental Data | ||||||||||||||||||||
| Net assets, end of period ($ millions) | 2 | 1 | 1 | 1 | 3 | |||||||||||||||
| Ratio of expenses before expense reductions (%) | 1.79 | 1.62 | 1.64 | 1.52 | 1.70 | |||||||||||||||
| Ratio of expenses after expense reductions (%) | 1.79 | 1.41 | 1.47 | 1.44 | 1.63 | |||||||||||||||
| Ratio of net investment income (%) | 1.12 | 1.52 | 2.13 | c | 1.00 | 1.04 | c | |||||||||||||
| Portfolio turnover rate (%) | 28 | 152 | 154 | 119 | 140 | d | ||||||||||||||
a Per share data have been restated to reflect the effects of a 1.82569632 for 1 stock split effective November 11, 2005. b Based on average shares outstanding during the period. c Net investment income per share and the ratio of net investment income include non-recurring dividend income amounting to $0.12 and $0.02 per share and 1.27% and 0.17% of average daily net assets for the years ended October 31, 2008 and 2006, respectively. d Excludes portfolio securities delivered as a result of processing redemption in-kind transactions. e Total return would have been lower had certain expenses not been reduced. f Includes a reimbursement from the Advisor to reimburse the effect of losses incurred as a result of certain operation errors during the period. Excluding this reimbursement, total return would have been (50.79)%. g Includes a non-recurring payment from the Advisor, which amounted to $0.013 per share, recorded as a result of the Advisor's settlement with the SEC and NY Attorney General in connection with certain trading arrangements (see Note G). The Fund also received $0.01 per share of non-affiliated regulatory settlements. Excluding these non-recurring payments, total return would have been 0.35% lower. * Amount is less than $.005. | ||||||||||||||||||||
Class S Years Ended October 31, | 2010 | 2009 | 2008 | 2007 | 2006 | a | ||||||||||||||
| Selected Per Share Data | ||||||||||||||||||||
| Net asset value, beginning of period | $ | 6.40 | $ | 5.51 | $ | 14.25 | $ | 12.90 | $ | 11.07 | ||||||||||
Income (loss) from investment operations: Net investment income (loss)b | .10 | .11 | .26 | c | .19 | .19 | c | |||||||||||||
| Net realized and unrealized gain (loss) | .75 | 1.02 | (6.04 | ) | 3.41 | 2.44 | ||||||||||||||
| Total from investment operations | .85 | 1.13 | (5.78 | ) | 3.60 | 2.63 | ||||||||||||||
Less distributions from: Net investment income | (.12 | ) | (.24 | ) | (.12 | ) | (.46 | ) | — | |||||||||||
| Net realized gains | — | — | (2.84 | ) | (1.79 | ) | (.80 | ) | ||||||||||||
| Total distributions | (.12 | ) | (.24 | ) | (2.96 | ) | (2.25 | ) | (.80 | ) | ||||||||||
| Increase from regulatory settlements | .02 | g | — | — | — | — | ||||||||||||||
| Redemption fees | .00 | * | .00 | * | .00 | * | .00 | * | .00 | * | ||||||||||
| Net asset value, end of period | $ | 7.15 | $ | 6.40 | $ | 5.51 | $ | 14.25 | $ | 12.90 | ||||||||||
Total Return (%)e | 13.72 | 21.75 | (50.38 | )f | 32.29 | 23.77 | ||||||||||||||
| Ratios to Average Net Assets and Supplemental Data | ||||||||||||||||||||
| Net assets, end of period ($ millions) | 16 | 21 | 24 | 58 | 41 | |||||||||||||||
| Ratio of expenses before expense reductions (%) | 1.42 | 1.34 | 1.36 | 1.22 | 1.31 | |||||||||||||||
| Ratio of expenses after expense reductions (%) | 1.39 | .94 | .97 | .98 | 1.18 | |||||||||||||||
| Ratio of net investment income (%) | 1.52 | 1.99 | 2.63 | c | 1.46 | 1.49 | c | |||||||||||||
| Portfolio turnover rate (%) | 28 | 152 | 154 | 119 | 140 | d | ||||||||||||||
a Per share data have been restated to reflect the effects of a 1.81850854 for 1 stock split effective November 11, 2005. b Based on average shares outstanding during the period. c Net investment income per share and the ratio of net investment income include non-recurring dividend income amounting to $0.12 and $0.02 per share and 1.27% and 0.17% of average daily net assets for the periods ended October 31, 2008 and 2006, respectively. d Excludes portfolio securities delivered as a result of processing redemption in-kind transactions. e Total return would have been lower had certain expenses not been reduced. f Includes a reimbursement from the Advisor to reimburse the effect of losses incurred as a result of certain operation errors during the period. Excluding this reimbursement, total return would have been (50.55)%. g Includes a non-recurring payment from the Advisor, which amounted to $0.012 per share, recorded as a result of the Advisor's settlement with the SEC and NY Attorney General in connection with certain trading arrangements (see Note G). The Fund also received $0.01 per share of non-affiliated regulatory settlements. Excluding these non-recurring payments, total return would have been 0.35% lower. * Amount is less than $.005. | ||||||||||||||||||||
Institutional Class Years Ended October 31, | 2010 | 2009 | 2008 | 2007 | 2006 | a | ||||||||||||||
| Selected Per Share Data | ||||||||||||||||||||
| Net asset value, beginning of period | $ | 6.40 | $ | 5.52 | $ | 14.26 | $ | 12.92 | $ | 11.07 | ||||||||||
Income (loss) from investment operations: Net investment income (loss)b | .12 | .11 | .26 | d | .19 | .20 | d | |||||||||||||
| Net realized and unrealized gain (loss) | .75 | 1.01 | (6.03 | ) | 3.41 | 2.45 | ||||||||||||||
| Total from investment operations | .87 | 1.12 | (5.77 | ) | 3.60 | 2.65 | ||||||||||||||
Less distributions from: Net investment income | (.12 | ) | (.24 | ) | (.13 | ) | (.47 | ) | — | |||||||||||
| Net realized gains | — | — | (2.84 | ) | (1.79 | ) | (.80 | ) | ||||||||||||
| Total distributions | (.12 | ) | (.24 | ) | (2.97 | ) | (2.26 | ) | (.80 | ) | ||||||||||
| Increase from regulatory settlements | .02 | g | — | — | — | — | ||||||||||||||
| Redemption fees | .00 | * | .00 | * | .00 | * | .00 | * | .00 | * | ||||||||||
| Net asset value, end of period | $ | 7.17 | $ | 6.40 | $ | 5.52 | $ | 14.26 | $ | 12.92 | ||||||||||
| Total Return (%) | 14.10 | 21.61 | c | (50.31 | )c,f | 32.27 | c | 23.96 | c | |||||||||||
| Ratios to Average Net Assets and Supplemental Data | ||||||||||||||||||||
| Net assets, end of period ($ millions) | 52 | 47 | 42 | 98 | 119 | |||||||||||||||
| Ratio of expenses before expense reductions (%) | 1.13 | 1.23 | 1.13 | 1.04 | 1.13 | |||||||||||||||
| Ratio of expenses after expense reductions (%) | 1.13 | .94 | .92 | .93 | 1.10 | |||||||||||||||
| Ratio of net investment income (%) | 1.78 | 1.99 | 2.68 | d | 1.51 | 1.57 | d | |||||||||||||
| Portfolio turnover rate (%) | 28 | 152 | 154 | 119 | 140 | e | ||||||||||||||
a Per share data have been restated to reflect the effects of a 1.81761006 for 1 stock split effective November 11, 2005. b Based on average shares outstanding during the period. c Total return would have been lower had certain expenses not been reduced. d Net investment income per share and the ratio of net investment income include non-recurring dividend income amounting to $0.12 and $0.02 per share and 1.27% and 0.17% of average daily net assets for the years ended October 31, 2008 and 2006, respectively. e Excludes portfolio securities delivered as a result of processing redemption in-kind transactions. f Includes a reimbursement from the Advisor to reimburse the effect of losses incurred as a result of certain operation errors during the period. Excluding this reimbursement, total return would have been (50.48)%. g Includes a non-recurring payment from the Advisor, which amounted to $0.013 per share, recorded as a result of the Advisor's settlement with the SEC and NY Attorney General in connection with certain trading arrangements (see Note G). The Fund also received $0.01 per share of non-affiliated regulatory settlements. Excluding these non-recurring payments, total return would have been 0.35% lower. * Amount is less than $.005. | ||||||||||||||||||||
A. Organization and Significant Accounting Policies
DWS Diversified International Equity Fund (the "Fund") is a diversified series of DWS Advisor Funds (the "Trust") which is registered under the Investment Company Act of 1940, as amended, (the "1940 Act"), as an open-end management investment company organized as a Massachusetts business trust.
The Fund offers multiple classes of shares which provide investors with different purchase options. Class A shares are offered to investors subject to an initial sales charge. Class B shares of the Fund are closed to new purchases, except exchanges or the reinvestment of dividends or other distributions. Class B shares were offered to investors without an initial sales charge and are subject to higher ongoing expenses than Class A shares and a contingent deferred sales charge payable upon certain redemptions. Class B shares automatically convert to Class A shares six years after issuance. Class C shares are offered to investors without an initial sales charge but are subject to higher ongoing expenses than Class A shares and a contingent deferred sales charge payable upon certain redemptions within one year of purchas e. Class C shares do not automatically convert into another class. Class R shares are only available to participants in certain retirement plans and are offered to investors without an initial sales charge. Institutional Class shares are offered to a limited group of investors, are not subject to initial or contingent deferred sales charges and have lower ongoing expenses than other classes. Class S shares are not subject to initial or contingent deferred sales charges and are generally not available to new investors except under certain circumstances.
Investment income, realized and unrealized gains and losses, and certain fund-level expenses and expense reductions, if any, are borne pro rata on the basis of relative net assets by the holders of all classes of shares, except that each class bears certain expenses unique to that class such as distribution and service fees, services to shareholders and certain other class-specific expenses. Differences in class-level expenses may result in payment of different per share dividends by class. All shares of the Fund have equal rights with respect to voting subject to class-specific arrangements.
The Fund's financial statements are prepared in accordance with accounting principles generally accepted in the United States of America which require the use of management estimates. Actual results could differ from those estimates. The policies described below are followed consistently by the Fund in the preparation of their financial statements.
Security Valuation. Investments are stated at value determined as of the close of regular trading on the New York Stock Exchange on each day the exchange is open for trading.
Various inputs are used in determining the value of the Fund's investments. These inputs are summarized in three broad levels. Level 1 includes quoted prices in active markets for identical securities. Level 2 includes other significant observable inputs (including quoted prices for similar securities, interest rates, prepayment speeds, and credit risk). Level 3 includes significant unobservable inputs (including the Fund's own assumptions in determining the fair value of investments). The inputs or methodology used for valuing securities are not necessarily an indication of the risk associated with investing in those securities.
Equity securities and exchange traded funds ("ETFs") are valued at the most recent sale price or official closing price reported on the exchange (US or foreign) or over-the-counter market on which they trade and are categorized as Level 1 securities. Securities or ETFs for which no sales are reported are valued at the calculated mean between the most recent bid and asked quotations on the relevant market or, if a mean cannot be determined, at the most recent bid quotation. For certain international equity securities, in order to adjust for events which may occur between the close of the foreign exchanges and the close of the New York Stock Exchange, a fair valuation model may be used. This fair valuation model takes into account comparisons to the valuation of American Depository Receipts (ADRs), exchange-traded funds , futures contracts and certain indices and these securities are categorized as Level 2.
Futures contracts are generally valued at the settlement prices established each day on the exchange on which they are traded and are categorized as Level 1.
Money market instruments purchased with an original or remaining maturity of sixty days or less, maturing at par, are valued at amortized cost, which approximates value, and are categorized as Level 2. Investments in open-end investment companies are valued at their net asset value each business day and are categorized as Level 1.
Securities and other assets for which market quotations are not readily available or for which the above valuation procedures are deemed not to reflect fair value are valued in a manner that is intended to reflect their fair value as determined in accordance with procedures approved by the Board and are generally categorized as Level 3. In accordance with the Fund's valuation procedures, factors used in determining value may include, but are not limited to, the type of the security; the size of the holding; the initial cost of the security; the existence of any contractual restrictions on the security's disposition; the price and extent of public trading in similar securities of the issuer or of comparable companies; quotations or evaluated prices from broker-dealers and/or pricing services; information obtained from the issuer, analysts, and/or the appropriate stock exchange (for exchange-traded securities); an analysis of the company's or issuer's financial statements; an evaluation of the forces that influence the issuer and the market(s) in which the security is purchased and sold and with respect to debt securities; the maturity, coupon, creditworthiness, currency denomination and the movement of the market in which the security is normally traded. The value determined under these procedures may differ from published values for the same securities.
Disclosure about the classification of fair value measurements is included in a table following the Fund's Investment Portfolio.
Securities Lending. The Fund lends securities to certain financial institutions. The Fund retains beneficial ownership of the securities it has loaned and continues to receive interest and dividends paid by the issuer of securities and to participate in any changes in their market value. The Fund requires the borrowers of the securities to maintain collateral with the Fund consisting of either cash or liquid, unencumbered assets having a value at least equal to the value of the securities loaned. When the collateral falls below specified amounts, the lending agent will use its best effort to obtain additional collateral on the next business day to meet required amounts under the security lending agreement. The Fund may invest the cash collateral into a joint trading account in an affiliated money market fund pursuant to Exemptive Orders issued by the SEC. The Fund receives compensation for lending its securities either in the form of fees or by earning interest on invested cash collateral net of borrower rebates and fees paid to a lending agent. Either the Fund or the borrower may terminate the loan. There may be risks of delay and costs in recovery of securities or even loss of rights in the collateral should the borrower of the securities fail financially. The Fund is also subject to all investment risks associated with the reinvestment of any cash collateral received, including, but not limited to, interest rate, credit and liquidity risk associated with such investments.
Foreign Currency Translations. The books and records of the Fund are maintained in US dollars. Investment securities and other assets and liabilities denominated in a foreign currency are translated into US dollars at the prevailing exchange rates at period end. Purchases and sales of investment securities, income and expenses are translated into US dollars at the prevailing exchange rates on the respective dates of the transactions.
Net realized and unrealized gains and losses on foreign currency transactions represent net gains and losses between trade and settlement dates on securities transactions, foreign currencies, and the difference between the amount of net investment income accrued and the US dollar amount actually received. That portion of both realized and unrealized gains and losses on investments that results from fluctuations in foreign currency exchange rates is not separately disclosed but is included with net realized and unrealized gain/appreciation and loss/depreciation on investments.
Taxes. The Fund's policy is to comply with the requirements of the Internal Revenue Code, as amended, which are applicable to regulated investment companies, and to distribute all of its taxable income to its shareholders.
Additionally, based on the Fund's understanding of the tax rules and rates related to income, gains and transactions for the foreign jurisdictions in which it invests, the Fund will provide for foreign taxes, and where appropriate, deferred foreign taxes.
At October 31, 2010, the Fund had a net tax basis capital loss carryforward of approximately $84,778,000, which may be applied against any realized net taxable capital gains of each succeeding year until fully utilized or until October 31, 2016 ($34,501,000) and October 31, 2017 ($50,277,000), the respective expiration dates, whichever occurs first.
During the year ended October 31, 2010 the Fund utilized $4,898,000 of prior year capital loss carryforward.
The Fund has reviewed the tax positions for each of the open tax years as of October 31, 2010 and has determined that no provision for income tax is required in the Fund's financial statements. The Fund's federal tax returns for the prior three fiscal years remain open subject to examination by the Internal Revenue Service.
Distribution of Income and Gains. Net investment income of the Fund, if any, is declared and distributed to shareholders annually. Net realized gains from investment transactions, in excess of available capital loss carryforwards, would be taxable to the Fund if not distributed, and, therefore, will be distributed to shareholders at least annually.
The timing and characterization of certain income and capital gains distributions are determined annually in accordance with federal tax regulations which may differ from accounting principles generally accepted in the United States of America. These differences primarily relate to net investment losses incurred by the Fund, certain securities sold at a loss and regulatory settlements. As a result, net investment income (loss) and net realized gain (loss) on investment transactions for a reporting period may differ significantly from distributions during such period. Accordingly, the Fund may periodically make reclassifications among certain of its capital accounts without impacting the net asset value of the Fund.
At October 31, 2010, the Fund's components of distributable earnings (accumulated loss) on a tax-basis were as follows:
| Undistributed ordinary income* | $ | 2,535,639 | ||
| Capital loss carryforwards | $ | (84,778,000 | ) | |
| Net unrealized appreciation (depreciation) on investments | $ | 28,840,901 |
In addition, the tax character of distributions paid to shareholders by the Fund are summarized as follows:
| Years Ended October 31, | ||||||||
| 2010 | 2009 | |||||||
| Distributions from ordinary income* | $ | 2,250,674 | $ | 4,920,457 | ||||
| Distributions from long-term capital gains | $ | — | $ | — | ||||
* For tax purposes, short-term capital gains distributions are considered ordinary income distributions.
Redemption Fees. The Fund imposes a redemption fee of 2% of the total redemption amount on all Fund share redeemed or exchanged within 15 days of buying them, either by purchase or exchange. This fee is assessed and retained by the Fund for the benefit of the remaining shareholders. The redemption fee is accounted for as an addition to paid-in-capital.
Expenses. Expenses of the Trust arising in connection with a specific Fund are allocated to that Fund. Other Trust expenses which cannot be directly attributed to a Fund are apportioned among the Funds in the Trust.
Contingencies. In the normal course of business, the Fund may enter into contracts with service providers that contain general indemnification clauses. The Fund's maximum exposure under these arrangements is unknown as this would involve future claims that may be made against the Fund that have not yet been made. However, based on experience, the Fund expects the risk of loss to be remote.
Other. Investment transactions are accounted for a trade date plus one basis for daily net asset value calculations. However, for financial reporting purposes, investment transactions are reported on trade date. Interest income is recorded on the accrual basis. Dividend income is recorded on the ex-dividend date net of foreign withholding taxes. Certain dividends from foreign securities may be recorded subsequent to the ex-dividend date as soon as the Fund is informed of such dividends. Realized gains and losses from investment transactions are recorded on an identified cost basis.
B. Derivative Instruments
Futures Contracts. A futures contract is an agreement between a buyer or seller and an established futures exchange or its clearinghouse in which the buyer or seller agrees to take or make a delivery of a specific amount of a financial instrument at a specified price on a specific date (settlement date). For the year ended October 31, 2010, the Fund used futures contracts as a means of gaining exposure to a particular asset class or to keep cash on hand to meet shareholder redemptions or other needs while maintaining exposure to the stock market.
Futures contracts are valued at the most recent settlement price. Upon entering into a futures contract, the Fund is required to deposit with a financial intermediary cash or securities ("initial margin") in an amount equal to a certain percentage of the face value indicated in the futures contract. Subsequent payments ("variation margin") are made or received by the Fund dependent upon the daily fluctuations in the value and are recorded for financial reporting purposes as unrealized gains or losses by the Fund. Gains or losses are realized when the contract expires or is closed. Since all futures contracts are exchange traded, counterparty risk is minimized as the exchange's clearinghouse acts as the counterparty, and guarantees the futures against default.
Certain risks may arise upon entering into futures contracts, including the risk that an illiquid market will limit the Fund's ability to close out a futures contract prior to the settlement date and that a change in the value of a futures contract may not correlate exactly with the changes in the value of the underlying hedged security, index or currency. Risk of loss may exceed amounts recognized in the Statement of Assets and Liabilities.
A summary of the open futures contracts as of October 31, 2010 is included in a table following the Fund's Investment Portfolio. For the year ended October 31, 2010, the Fund invested in futures contracts with a total notional value generally indicative of a range from approximately $584,000 to $5,675,000.
The following tables summarize the value of the Fund's derivative instruments held as of October 31, 2010 and the related location in the accompanying Statement of Assets and Liabilities, presented by primary underlying risk exposure:
| Asset Derivative | Futures Contracts | |||
| Equity Contracts (a) | $ | 9,633 | ||
The above derivative is located in the following Statement of Assets and Liabilities account:
(a) Net unrealized appreciation on futures contracts. Asset of receivable for variation margin on open futures contracts reflects unsettled variation margin.
Additionally, the amount of unrealized and realized gains and losses on derivative instruments recognized in Fund earnings during the year ended October 31, 2010 and the related location in the accompanying Statement of Operations is summarized in the following tables by primary underlying risk exposure:
| Realized Gain (Loss) | Futures Contracts | |||
| Equity Contracts (a) | $ | 29,434 | ||
The above derivative is located in the following Statement of Operations account:
(a) Net realized gain (loss) from futures contracts
| Change in Net Unrealized Appreciation (Depreciation) | Futures Contracts | |||
| Equity Contracts (a) | $ | 98,742 | ||
The above derivative is located in the following Statement of Operations account:
(a) Change in net unrealized appreciation (depreciation) on futures contracts
C. Purchases and Sales of Securities
During the year ended October 31, 2010, purchases and sales of investment securities (excluding short-term investments) aggregated $33,440,809 and $51,229,030, respectively.
D. Related Parties
Management Agreement. Under the Investment Management Agreement with Deutsche Investment Management Americas Inc. ("DIMA" or the "Advisor"), an indirect, wholly owned subsidiary of Deutsche Bank AG, the Advisor directs the investments of the Fund in accordance with its investment objectives, policies and restrictions. The Advisor determines the securities, instruments and other contracts relating to investments to be purchased, sold or entered into by the Fund or delegates such responsibility to the Fund's subadvisor.
QS Investors, LLC ("QS Investors") acts as investment subadvisor to the Fund. On August 1, 2010, members of the Advisor's Quantitative Strategies Group, including members of the Fund's portfolio management team, separated from the Advisor and formed QS Investors as a separate investment advisory firm unaffiliated with the Advisor (the "Separation"). As an investment subadvisor to the Fund, QS Investors makes investment decisions and buys and sells securities for the Fund. QS Investors is paid by the Advisor, not the Fund, for the services QS Investors provides to the Fund.
Under the Investment Management Agreement with the Advisor, the Fund pays a monthly management fee based on the Fund's average daily net assets, computed and accrued daily and payable monthly, at the following annual rates:
| First $1.5 billion of the Fund's average daily net assets | .700 | % | ||
| Next $1.75 billion of such net assets | .685 | % | ||
| Next $1.75 billion of such net assets | .670 | % | ||
| Over $5.0 billion of such net assets | .655 | % |
Accordingly, for the year ended October 31, 2010, the fee pursuant to the Investment Management Agreement was equivalent to an annual effective rate of 0.70% of the Fund's average daily net assets.
For the period from November 1, 2009 through September 30, 2010, the Advisor had contractually agreed to waive its fees and/or reimburse certain operating expenses of the Fund to the extent necessary to maintain the operating expenses (excluding certain expenses such as extraordinary expenses, taxes, brokerage and interest) of each class as follows:
| Class A | 1.60% |
| Class B | 2.35% |
| Class C | 2.35% |
| Class R | 1.85% |
| Class S | 1.35% |
Effective October 1, 2010 through September 30, 2011, the Advisor has contractually agreed to waive its fees and/or reimburse certain operating expenses of Class B shares to the extent necessary to maintain the operating expenses (excluding certain expenses such as extraordinary expenses, taxes, brokerage and interest) at 2.44%.
Administration Fee. Pursuant to an Administrative Services Agreement, DIMA provides most administrative services to the Fund. For all services provided under the Administrative Services Agreement, the Fund pays the Advisor an annual fee ("Administration Fee") of 0.10% of the Fund's average daily net assets, computed and accrued daily and payable monthly. For the year ended October 31, 2010, the Administration Fee was $126,191, of which $9,704 is unpaid.
Service Provider Fees. DWS Investments Service Company ("DISC"), an affiliate of the Advisor, is the transfer agent, dividend-paying agent and shareholder service agent for the Fund. Pursuant to a sub-transfer agency agreement between DISC and DST Systems, Inc. ("DST"), DISC has delegated certain transfer agent, dividend-paying agent and shareholder service agent functions to DST. DISC compensates DST out of the shareholder servicing fee they receive from the Fund. For the year ended October 31, 2010, the amounts charged to the Fund by DISC were as follows:
| Services to Shareholders | Total Aggregated | Waived | Unpaid at October 31, 2010 | |||||||||
| Class A | $ | 86,197 | $ | 6,537 | $ | 27,256 | ||||||
| Class B | 6,432 | 3,422 | 3,010 | |||||||||
| Class C | 11,811 | — | 3,371 | |||||||||
| Class R | 371 | — | 79 | |||||||||
| Class S | 29,631 | 6,815 | 14,638 | |||||||||
| Institutional Class | 12,232 | — | 2,722 | |||||||||
| $ | 146,674 | $ | 16,774 | $ | 51,076 | |||||||
Distribution and Service Fees. Under the Fund's Class B and Class C 12b-1 Plans, DWS Investments Distributors, Inc. ("DIDI"), an affiliate of the Advisor, receives a fee ("Distribution Fee") of 0.75% of the average daily net assets of each of Class B and C shares of the Fund, and 0.25% of the average daily net assets of Class R shares. In accordance with the Fund's Underwriting and Distribution Services Agreement, DIDI enters into related selling group agreements with various firms at various rates for sales of Class B, C and R shares. For the year ended October 31, 2010, the Distribution Fee was as follows:
| Distribution Fee | Total Aggregated | Unpaid at October 31, 2010 | ||||||
| Class B | $ | 17,453 | $ | 1,150 | ||||
| Class C | 44,046 | 3,573 | ||||||
| Class R | 4,029 | 392 | ||||||
| $ | 65,528 | $ | 5,115 | |||||
In addition, DIDI provides information and administrative services for a fee ("Service Fee") to Class A, B, C and Class R shareholders at an annual rate of up to 0.25% of average daily net assets for each such class. DIDI in turn has various agreements with financial services firms that provide these services and pays these fees based upon the assets of shareholder accounts the firms service. For the year ended October 31, 2010, the Service Fee was as follows:
| Service Fee | Total Aggregated | Unpaid at October 31, 2010 | Annual Effective Rate | |||||||||
| Class A | $ | 95,816 | $ | 21,484 | .23 | % | ||||||
| Class B | 5,604 | 1,107 | .24 | % | ||||||||
| Class C | 14,427 | 3,359 | .25 | % | ||||||||
| Class R | 2,165 | 916 | .13 | % | ||||||||
| $ | 118,012 | $ | 26,866 | |||||||||
Underwriting Agreement and Contingent Deferred Sales Charge. DIDI is the principal underwriter for the Fund. Underwriting commissions paid in connection with the distribution of Class A shares for the year ended October 31, 2010 aggregated $2,381.
In addition, DIDI receives any contingent deferred sales charge ("CDSC") from Class B share redemptions occurring within six years of purchase and Class C share redemptions occurring within one year of purchase. There is no such charge upon redemption of any share appreciation or reinvested dividends. The CDSC is based on declining rates ranging from 4% to 1% for Class B and 1% for Class C, of the value of the shares redeemed. For the year ended October 31, 2010, the CDSC for Class B and C shares aggregated $4,629 and $232, respectively. A deferred sales charge of up to 1% is assessed on certain redemptions of Class A shares. For the year ended October 31, 2010, DIDI received $36 for Class A shares.
Typesetting and Filing Service Fees. Under an agreement with DIMA, DIMA is compensated for providing typesetting and certain regulatory filing services to the Fund. For the year ended October 31, 2010, the amount charged to the Fund by DIMA included in the Statement of Operations under "reports to shareholders" aggregated $23,394, of which $8,632 is unpaid.
Trustees' Fees and Expenses. The Fund paid each Trustee not affiliated with the Advisor retainer fees plus specified amounts for various committee services and for the Board Chairperson.
Affiliated Cash Management Vehicles. The Fund may invest uninvested cash balances in Central Cash Management Fund and other affiliated money market funds managed by the Advisor. The Fund indirectly bears its proportionate share of the expenses of the underlying money market funds. Central Cash Management Fund does not pay the Advisor an investment management fee. Central Cash Management Fund seeks a high level of current income consistent with liquidity and the preservation of capital.
E. Line of Credit
The Fund and other affiliated funds (the "Participants") share in a $450 million revolving credit facility provided by a syndication of banks. The Fund may borrow for temporary or emergency purposes, including the meeting of redemption requests that otherwise might require the untimely disposition of securities. The Participants are charged an annual commitment fee which is allocated based on net assets, among each of the Participants. Interest is calculated at a rate per annum equal to the sum of the Federal Funds Rate plus 1.25 percent plus if LIBOR exceeds the Federal Funds Rate the amount of such excess. The Fund may borrow up to a maximum of 33 percent of its net assets under the agreement.
F. Share Transactions
The following table summarizes share and dollar activity in the Fund:
| Year Ended October 31, 2010 | Year Ended October 31, 2009 | |||||||||||||||
| Shares | Dollars | Shares | Dollars | |||||||||||||
| Shares sold | ||||||||||||||||
| Class A | 1,136,026 | $ | 7,697,068 | 2,122,437 | $ | 11,469,222 | ||||||||||
| Class B | 14,961 | 98,115 | 79,932 | 412,368 | ||||||||||||
| Class C | 109,226 | 709,473 | 128,067 | 674,912 | ||||||||||||
| Class R | 115,125 | 763,713 | 155,624 | 847,012 | ||||||||||||
| Class S | 392,486 | 2,548,526 | 1,063,581 | 5,575,935 | ||||||||||||
| Institutional Class | 3,429,834 | 22,346,450 | 2,497,667 | 14,543,554 | ||||||||||||
| $ | 34,163,345 | $ | 33,523,003 | |||||||||||||
| Shares issued to shareholders in reinvestment of distributions | ||||||||||||||||
| Class A | 87,598 | $ | 592,160 | 340,172 | $ | 1,731,478 | ||||||||||
| Class B | 1,963 | 12,855 | 24,066 | 118,644 | ||||||||||||
| Class C | 4,135 | 27,086 | 39,502 | 194,744 | ||||||||||||
| Class R | 2,451 | 16,153 | 4,879 | 24,201 | ||||||||||||
| Class S | 56,027 | 367,535 | 190,424 | 940,693 | ||||||||||||
| Institutional Class | 181,561 | 1,191,041 | 343,246 | 1,695,634 | ||||||||||||
| $ | 2,206,830 | $ | 4,705,394 | |||||||||||||
| Shares redeemed | ||||||||||||||||
| Class A | (3,336,931 | ) | $ | (22,201,101 | ) | (3,380,507 | ) | $ | (17,964,031 | ) | ||||||
| Class B | (276,864 | ) | (1,791,427 | ) | (440,870 | ) | (2,281,767 | ) | ||||||||
| Class C | (314,137 | ) | (2,027,314 | ) | (577,126 | ) | (2,974,272 | ) | ||||||||
| Class R | (56,211 | ) | (363,599 | ) | (65,029 | ) | (375,741 | ) | ||||||||
| Class S | (1,505,443 | ) | (9,559,355 | ) | (2,317,373 | ) | (11,992,294 | ) | ||||||||
| Institutional Class | (3,741,567 | ) | (23,491,272 | ) | (3,092,506 | ) | (16,532,183 | ) | ||||||||
| $ | (59,434,068 | ) | $ | (52,120,288 | ) | |||||||||||
| Redemption fees | $ | 89 | $ | 1,698 | ||||||||||||
| Net increase (decrease) | ||||||||||||||||
| Class A | (2,113,307 | ) | $ | (13,911,814 | ) | (917,898 | ) | $ | (4,763,303 | ) | ||||||
| Class B | (259,940 | ) | (1,680,457 | ) | (336,872 | ) | (1,750,755 | ) | ||||||||
| Class C | (200,776 | ) | (1,290,744 | ) | (409,557 | ) | (2,104,332 | ) | ||||||||
| Class R | 61,365 | 416,267 | 95,474 | 495,472 | ||||||||||||
| Class S | (1,056,930 | ) | (6,643,275 | ) | (1,063,368 | ) | (5,474,660 | ) | ||||||||
| Institutional Class | (130,172 | ) | 46,219 | (251,593 | ) | (292,615 | ) | |||||||||
| $ | (23,063,804 | ) | $ | (13,890,193 | ) | |||||||||||
G. Regulatory Settlements
On December 21, 2006, the Advisor settled proceedings with the SEC and the New York Attorney General regarding alleged improper trading of fund shares. In accordance with the distribution plan, developed by a distribution consultant, settlement proceeds were distributed to affected shareholders of the Fund, and unclaimed proceeds were then paid to the Fund in the amount of $242,396. In addition, the Fund received $189,346 of non-affiliated regulatory settlements. These payments are included in "Increase from regulatory settlements" in the Statement of Changes in Net Assets.
To the Trustees of DWS Advisor Funds and Shareholders of DWS Diversified International Equity Fund:
In our opinion, the accompanying statement of assets and liabilities, including the investment portfolio, and the related statements of operations and of changes in net assets and the financial highlights present fairly, in all material respects, the financial position of DWS Diversified International Equity Fund (the "Fund") at October 31, 2010, the results of its operations, the changes in its net assets and the financial highlights for each of the periods indicated therein, in conformity with accounting principles generally accepted in the United States of America. These financial statements and financial highlights (hereafter referred to as "financial statements") are the responsibility of the Fund's management. Our responsibility is to express an opinion on these financial statements based on our audits. We condu cted our audits of these financial statements in accordance with the standards of the Public Company Accounting Oversight Board (United States). Those standards require that we plan and perform the audit to obtain reasonable assurance about whether the financial statements are free of material misstatement. An audit includes examining, on a test basis, evidence supporting the amounts and disclosures in the financial statements, assessing the accounting principles used and significant estimates made by management, and evaluating the overall financial statement presentation. We believe that our audits, which included confirmation of securities at October 31, 2010 by correspondence with the custodian and brokers, provide a reasonable basis for our opinion.
Boston, Massachusetts December 21, 2010 | PricewaterhouseCoopers LLP |
For corporate shareholders, 7% of the ordinary dividends (i.e., income dividends plus short-term capital gains) paid during the Fund's fiscal year ended October 31, 2010, qualified for the dividends received deduction.
The Fund paid foreign taxes of $506,309 and earned $2,495,201 of foreign source income during the year ended October 31, 2010. Pursuant to Section 853 of the Internal Revenue Code, the Fund designates $0.03 per share as foreign taxes paid and $0.16 per share as income earned from foreign sources for the year ended October 31, 2010.
For federal income tax purposes, the Fund designates $4,509,000, or the maximum amount allowable under tax law, as qualified dividend income.
Please consult a tax advisor if you have questions about federal or state income tax laws, or on how to prepare your tax returns. If you have specific questions about your account, please call (800) 621-1048.
The Board of Trustees, including the Independent Trustees, approved the renewal of your Fund's investment management agreement (the "Agreement") with Deutsche Investment Management Americas Inc. ("DWS") and sub-advisory agreement (the "Sub-Advisory Agreement" and together with the Agreement, the "Agreements") between DWS and QS Investors, LLC ("QS Investors") in September 2010.
In terms of the process that the Board followed prior to approving the Agreements, shareholders should know that:
• In September 2010, all of the Fund's Trustees were independent of DWS and its affiliates.
• The Trustees meet frequently to discuss fund matters. Each year, the Trustees dedicate substantial time to contract review matters. Over the course of several months, the Board's Contract Committee, in coordination with the Board's Fixed Income and Quant Oversight Committee, reviewed comprehensive materials received from DWS, independent third parties and independent counsel. These materials included an analysis of the Fund's performance, fees and expenses, and profitability compiled by the Fund's independent fee consultant. The Board also received extensive information throughout the year regarding performance of the Fund.
• The Independent Trustees regularly meet privately with their independent counsel to discuss contract review and other matters. In addition, the Independent Trustees were also advised by the Fund's independent fee consultant in the course of their review of the Fund's contractual arrangements and considered a comprehensive report prepared by the independent fee consultant in connection with their deliberations (the "IFC Report").
• In connection with reviewing the Agreements, the Board also reviewed the terms of the Fund's Rule 12b-1 plan, distribution agreement, administrative services agreement, transfer agency agreement and other material service agreements.
• Based on its evaluation of the information provided, the Contract Committee presented its findings and recommendations to the Independent Trustees as a group. The Independent Trustees reviewed the Contract Committee's findings and recommendations and presented their recommendations to the full Board.
In connection with the contract review process, the Contract Committee and the Board considered the factors discussed below, among others. The Board also considered that DWS and its predecessors have managed the Fund since its inception, and the Board believes that a long-term relationship with a capable, conscientious advisor is in the best interests of the Fund. The Board considered, generally, that shareholders chose to invest or remain invested in the Fund knowing that DWS managed the Fund, and that the Agreement was approved by the Fund's shareholders. DWS is part of Deutsche Bank, a major global banking institution that is engaged in a wide range of financial services. The Board believes that there are significant advantages to being part of a global asset management business that offers a wide range of investin g expertise and resources, including hundreds of portfolio managers and analysts with research capabilities in many countries throughout the world.
While shareholders may focus primarily on fund performance and fees, the Fund's Board considers these and many other factors, including the quality and integrity of DWS's and QS Investors' personnel and such other issues as back-office operations, fund valuations, and compliance policies and procedures. In addition, in connection with approving the continuation of the Fund's Sub-Advisory Agreement, the Board noted it had engaged in a comprehensive review of the agreement in connection with its initial approval in May 2010.
Nature, Quality and Extent of Services. The Board considered the terms of the Agreements, including the scope of advisory services provided under the Agreements. The Board noted that, under the Agreements, DWS and QS Investors provide portfolio management services to the Fund and that, pursuant to a separate administrative services agreement, DWS provides administrative services to the Fund. The Board considered the experience and skills of senior management and investment personnel, the resources made available to such personnel, the ability of DWS to attract and retain high-quality personnel, and the organizational depth and stability of DWS. The Board reviewed the Fund's performance over short-term and long-term periods and compared those retu rns to various agreed-upon performance measures, including market indices and a peer universe compiled by the independent fee consultant using information supplied by Lipper Inc. ("Lipper"). The Board also noted that it has put into place a process of identifying "Focus Funds" (e.g., funds performing poorly relative to their benchmark or a peer universe compiled by Lipper), and receives more frequent reporting and information from DWS regarding such funds, along with DWS's remedial plans to address underperformance. The Board believes this process is an effective manner of identifying and addressing underperforming funds. Based on the information provided, the Board noted that for the one-, three- and five-year periods ended December 31, 2009, the Fund's performance (Class A shares) was in the 3rd quartile, 4th quartile and 4th quartile, respectively, of the applicable Lipper universe (the 1st quartile being the best performers and the 4th quartile being the worst performers). The Board also observed that th e Fund has underperformed its benchmark in the one-, three- and five-year periods ended December 31, 2009.
On the basis of this evaluation and the ongoing review of investment results by the Board, the Board concluded that the nature, quality and extent of services provided by DWS and QS Investors historically have been and continue to be satisfactory.
Fees and Expenses. The Board considered the Fund's investment management fee schedule, sub-advisory fee schedule, operating expenses, and total expense ratios, and comparative information provided by Lipper and the independent fee consultant regarding investment management fee rates paid to other investment advisors by similar funds (1st quartile being the most favorable and 4th quartile being the least favorable). With respect to management fees paid to other investment advisors by similar funds, the Board noted that the contractual fee rates paid by the Fund, which include the 0.10% fee paid to DWS under the Fund's administrative services agreement, were lower than the median (1st quartile) of the applicable Lipper peer group (based on Lipper d ata provided as of December 31, 2009). With respect to the sub-advisory fee paid to QS Investors, the Board noted that the fee is paid by DWS out of its fee and not directly by the Fund. The Board noted that the Fund's Class A shares total (net) operating expenses (excluding 12b-1 fees) were expected to be lower than the median (2nd quartile) of the applicable Lipper expense universe (based on Lipper data provided as of December 31, 2009, and analyzing Lipper expense universe Class A expenses less any applicable 12b-1 fees) ("Lipper Universe Expenses"). The Board also reviewed data comparing each share class's total (net) operating expenses to the applicable Lipper Universe Expenses. The Board considered the Fund's management fee rate as compared to fees charged by DWS and certain of its affiliates for comparable mutual funds and considered differences in fund and fee structures between the DWS Funds. The Board also considered how the Fund's total (net) operating expenses compared to the total (net) operatin g expenses of a more customized peer group selected by Lipper (based on such factors as asset size). The Board also noted that the expense limitation agreed to by DWS helped to ensure that the Fund's total (net) operating expenses would remain competitive.
The information considered by the Board as part of its review of management fees included information regarding fees charged by DWS and its affiliates to similar institutional accounts and to similar funds offered primarily to European investors ("DWS Europe funds"), in each case as applicable. The Board observed that advisory fee rates for institutional accounts generally were lower than the management fees charged by similarly managed DWS US mutual funds ("DWS Funds"), but also took note of the differences in services provided to DWS Funds as compared to institutional accounts. In the case of DWS Europe funds, the Board observed that fee rates for DWS Europe funds generally were higher than for similarly managed DWS Funds, but noted that differences in the types of services provided to DWS Funds relative to DWS Euro pe funds made it difficult to compare such fees.
On the basis of the information provided, the Board concluded that management fees were reasonable and appropriate in light of the nature, quality and extent of services provided by DWS and QS Investors.
Profitability. The Board reviewed detailed information regarding revenues received by DWS under the Agreement. The Board considered the estimated costs and pre-tax profits realized by DWS from advising the DWS Funds, as well as estimates of the pre-tax profits attributable to managing the Fund in particular. The Board also received information regarding the estimated enterprise-wide profitability of DWS and its affiliates with respect to all fund services in totality and by fund. The Board reviewed DWS's methodology in allocating its costs to the management of the Fund. Based on the information provided, the Board concluded that the pre-tax profits realized by DWS in connection with the management of the Fund were not unreasonable. The Board also reviewed information regarding the profitability of certain similar investment management firms. The Board noted that while information regarding the profitability of such firms is limited (and in some cases is not necessarily prepared on a comparable basis), DWS and its affiliates' overall profitability with respect to the DWS fund complex (after taking into account distribution and other services provided to the funds by DWS and its affiliates) was lower than the overall profitability levels of many comparable firms for which such data was available. The Board did not consider the profitability of QS Investors with respect to the Fund. The Board noted that DWS pays QS Investors' fee out of its management fee, and its understanding that the Fund's sub-advisory fee schedule was the product of an arm's length negotiation with DWS.
Economies of Scale. The Board considered whether there are economies of scale with respect to the management of the Fund and whether the Fund benefits from any economies of scale. The Board noted that the Fund's management fee schedule includes fee breakpoints. The Board concluded that the Fund's fee schedule represents an appropriate sharing between the Fund and DWS of such economies of scale as may exist in the management of the Fund at current asset levels.
Other Benefits to DWS and QS Investors and Their Affiliates. The Board also considered the character and amount of other incidental benefits received by DWS and QS Investors and their affiliates, including any fees received by DWS for administrative services provided to the Fund and any fees received by an affiliate of DWS for distribution services. The Board also considered benefits to DWS and QS Investors related to brokerage and soft-dollar allocations, including allocating brokerage to pay for research generated by parties other than the executing broker dealers, which pertain primarily to funds investing in equity securities, along with the incidental public relations benefits to DWS and QS Investors related to DWS Funds advertising and cros s-selling opportunities among DWS products and services. The Board concluded that management fees were reasonable in light of these fallout benefits.
Compliance. The Board considered the significant attention and resources dedicated by DWS to documenting and enhancing its compliance processes in recent years. The Board noted in particular (i) the experience and seniority of both DWS's chief compliance officer and the Fund's chief compliance officer; (ii) the large number of DWS compliance personnel; and (iii) the substantial commitment of resources by DWS and its affiliates to compliance matters. The Board also considered the attention and resources dedicated by DWS to the oversight of the investment sub-advisor's compliance program and compliance with the applicable fund policies and procedures.
Based on all of the information considered and the conclusions reached, the Board unanimously determined that the continuation of the Agreements is in the best interests of the Fund. In making this determination the Board did not give particular weight to any single factor identified above. The Board considered these factors over the course of numerous meetings, certain of which were in executive session with only the Independent Trustees and their counsel present. It is possible that individual Trustees may have weighed these factors differently in reaching their individual decisions to approve the continuation of the Agreements.
The Board of Trustees, including the Independent Trustees, unanimously approved the New Sub-Advisory Agreement (the "New Agreement") between Deutsche Investment Management Americas Inc. ("DWS") and QS Investors, LLC ("QS Investors") in May 2010.
In terms of the process that the Board followed prior to approving the New Agreement, shareholders should know that:
• In May 2010, all of the Fund's Trustees were independent of DWS and its affiliates.
• The Board engaged in a comprehensive review of the operational, financial and investment capabilities of QS Investors and the terms of the proposed Separation. As part of this review, the Board also reviewed and considered the terms of the New Agreement.
• To facilitate its review, the Board created several ad hoc subcommittees, each focused on different aspects of the Board's consideration of the Separation, and each comprised solely of Independent Trustees.
• The Board and its subcommittees conducted numerous meetings between January 2010 and May 2010 to review and discuss the Separation, including the New Agreement, and were assisted in this review by their independent legal counsel and fund counsel.
• In the course of its review, the Board requested and received substantial additional information.
• As part of its review process, the Board and its subcommittees met with various representatives of DWS and QS Investors, including key investment personnel and other members of senior management.
• The Board requested and evaluated all information that it deemed reasonably necessary to evaluate the New Agreement.
In connection with the approval of the New Agreement, the Board considered the factors described below, among others.
Continuity of Investment Management Services. In reviewing the New Agreement, the Board considered that it had renewed the investment management agreement between DWS and the Fund as part of the annual contract renewal process (the "Annual Review") in September 2009, at which time it had determined that such renewal was in the best interests of the Fund, given the nature, quality and extent of services provided by DWS (among other considerations). In considering the New Agreement, the Board noted that in light of the transition of the group within DWS responsible for day-to-day portfolio management of the Fund to a separate, unaffiliated firm (i.e., QS Investors), it was necessary to approve a sub-advisory agreement between DWS and QS Investors t o secure continued access to these same personnel and services. The Board also considered that, despite the change in corporate identity of the portfolio management services provider and the fact that it would no longer be affiliated with DWS, the nature, quality and extent of services provided to the Fund are not expected to change under the New Agreement.
Fees and Expenses. The Board noted that it had concluded during the Annual Review that the overall investment management fees paid by the Fund are reasonable and appropriate in light of the nature, quality and extent of services provided. The Board considered that, under the New Agreement, QS Investors' sub-advisory fee would be paid by DWS out of its management fee and not directly by the Fund, and therefore there would be no change in the Fund's overall investment management fees under the New Agreement.
Profitability. The Board noted that it had considered the profitability of DWS during the Annual Review. The Board did not consider the profitability of QS Investors to be a material factor. In particular, the Board noted that QS Investors has not yet commenced operations, and that any projections of profitability are likely to be of limited value. The Board also noted that DWS would pay QS Investors' sub-advisory fee out of its management fee, and further noted that the sub-advisory fee arrangement with respect to the Fund was the product of an arm's length negotiation.
Other Benefits to QS Investors. The Board noted that it had considered fallout benefits to DWS during the Annual Review in its determination that management fees paid were reasonable. The Board also considered the character and amount of incidental benefits expected to be realized by QS Investors in light of the New Agreement, including the incidental public relations benefits to QS Investors related to DWS US mutual funds advertising and cross-selling opportunities among DWS products and services. The Board noted that QS Investors did not propose to implement a "soft dollar" program. The Board reaffirmed its determination from the Annual Review process that management fees paid were reasonable in light of fallout benefits to its investment advis ory service providers.
Compliance. The Board considered QS Investors' proposed compliance program and resources. The Board also considered that DWS would oversee QS Investors' compliance program and its compliance with applicable Fund policies and procedures, and considered the attention and resources DWS would dedicate to that oversight. The Board also noted that it had considered DWS's compliance monitoring capabilities in connection with the Annual Review, at which time it had noted (i) the experience and seniority of both DWS's chief compliance officer and the Fund's chief compliance officer; (ii) the large number of DWS compliance personnel; and (iii) the substantial commitment of resources by DWS and its affiliates to compliance matters.
Based on all of the information considered and the conclusions reached, the Board unanimously (including the Independent Trustees) determined that the terms of the New Agreement are fair and reasonable and that the approval of the New Agreement is in the best interests of the Fund. In reaching this conclusion, the Board did not give particular weight to any single factor identified above. It is possible that individual Trustees may have weighed these factors differently in reaching their individual decisions to approve the New Agreement.
October 3, 2010
Pursuant to an Order entered into by Deutsche Investment Management Americas and affiliates (collectively, "DeAM") with the Attorney General of New York, I, Thomas H. Mack, have been appointed the Independent Fee Consultant for the DWS Funds (formerly the DWS Scudder Funds). My duties include preparing an annual written evaluation of the management fees DeAM charges the Funds, considering among other factors the management fees charged by other mutual fund companies for like services, management fees DeAM charges other clients for like services, DeAM's costs of supplying services under the management agreements and related profit margins, possible economies of scale if a Fund grows larger, and the nature and quality of DeAM's services, including fund performance. This rep ort summarizes my evaluation for 2010, including my qualifications, the evaluation process for each of the DWS Funds, consideration of certain complex-level factors, and my conclusions. I served in substantially the same capacity in 2007, 2008, and 2009.
Qualifications
For more than 35 years I have served in various professional capacities within the investment management business. I have held investment analysis and advisory positions, including securities analyst, portfolio strategist and director of investment policy with a large investment firm. I have also performed business management functions, including business development, financial management and marketing research and analysis.
Since 1991, I have been an independent consultant within the asset management industry. I have provided services to over 125 client organizations, including investment managers, mutual fund boards, product distributors and related organizations. Over the past ten years I have completed a number of assignments for mutual fund boards, specifically including assisting boards with management contract renewal.
I hold a Master of Business Administration degree, with highest honors, from Harvard University and Master of Science and Bachelor of Science (highest honors) degrees from the University of California at Berkeley. I am an independent director and audit committee financial expert for two closed-end mutual funds and have served in various leadership and financial oversight capacities with non-profit organizations.
Evaluation of Fees for each DWS Fund
My work focused primarily on evaluating, fund-by-fund, the fees charged to each of the 118 publicly offered Fund portfolios in the DWS Fund family. For each Fund, I considered each of the key factors mentioned above, as well as any other relevant information. In doing so I worked closely with the Funds' Independent Directors in their annual contract renewal process, as well as in their approval of contracts for several new funds (documented separately).
In evaluating each Fund's fees, I reviewed comprehensive materials provided by or on behalf of DeAM, including expense information prepared by Lipper Analytical, comparative performance information, profitability data, manager histories, and other materials. I also accessed certain additional information from the Lipper and Morningstar databases and drew on my industry knowledge and experience.
To facilitate evaluating this considerable body of information, I prepared for each Fund a document summarizing the key data elements in each area as well as additional analytics discussed below. This made it possible to consider each key data element in the context of the others.
In the course of contract renewal, DeAM agreed to implement a number of fee and expense adjustments requested by the Independent Directors which will favorably impact future fees and expenses, and my evaluation includes the effects of these changes.
Fees and Expenses Compared with Other Funds
The competitive fee and expense evaluation for each fund focused on two primary comparisons:
The Fund's contractual management fee (the advisory fee plus the administration fee where applicable) compared with those of a group of typically 12-15 funds in the same Lipper investment category (e.g. Large Capitalization Growth) having similar distribution arrangements and being of similar size.
The Fund's total expenses compared with a broader universe of funds from the same Lipper investment category and having similar distribution arrangements.
These two comparisons provide a view of not only the level of the fee compared with funds of similar scale but also the total expense the Fund bears for all the services it receives, in comparison with the investment choices available in the Fund's investment category and distribution channel. The principal figure-of-merit used in these comparisons was the subject Fund's percentile ranking against peers.
DeAM's Fees for Similar Services to Others
DeAM provided management fee schedules for all of its US domiciled fund and non-fund investment management accounts in any of the investment categories where there is a DWS Fund. These similar products included the other DWS Funds, non-fund pooled accounts, institutional accounts and sub-advisory accounts. Using this information, I calculated for each Fund the fee that would be charged to each similar product, at the subject Fund's asset level.
Evaluating information regarding non-fund products is difficult because there are varying levels of services required for different types of accounts, with mutual funds generally requiring considerably more regulatory and administrative types of service as well as having more frequent cash flows than other types of accounts. Also, while mutual fund fees for similar fund products can be expected to be similar, there will be some differences due to different pricing conditions in different distribution channels (e.g. retail funds versus those used in variable insurance products), differences in underlying investment processes and other factors.
Costs and Profit Margins
DeAM provided a detailed profitability analysis for each Fund. After making some adjustments so that the presentation would be more comparable to the available industry figures, I reviewed profit margins from investment management alone, from investment management plus other fund services (excluding distribution) provided to the Funds by DeAM (principally shareholder services), and DeAM profits from all sources, including distribution. A later section comments on overall profitability.
Economies of Scale
Economies of scale — an expected decline in management cost per dollar of fund assets as fund assets grow — are very rarely quantified and documented because of inherent difficulties in collecting and analyzing relevant data. However, in virtually every investment category that I reviewed, larger funds tend to have lower fees and lower total expenses than smaller funds. To see how each DWS Fund compares with this industry observation, I reviewed:
The trend in Fund assets over the last five years and the accompanying trend in total expenses. This shows if the Fund has grown and, if so, whether total expense (management fees as well as other expenses) have declined as a percent of assets.
Whether the Fund has break-points in its management fee schedule, the extent of the fee reduction built into the schedule and the asset levels where the breaks take effect, and in the case of a sub-advised Fund how the Fund's break-points compare with those of the sub-advisory fee schedule.
How the Fund's contractual fee schedule compares with trends in the industry data. To accomplish this, I constructed a chart showing how actual latest-fiscal-year contractual fees of the Fund and of other similar funds relate to average fund assets, with the subject Fund's contractual fee schedule superimposed.
Quality of Service — Performance
The quality-of-service evaluation focused on investment performance, which is the principal result of the investment management service. Each Fund's performance was reviewed over the past 1, 3, 5 and 10 years, as applicable, and compared with that of other funds in the same investment category and with a suitable market index.
In addition, I calculated and reviewed risk-adjusted returns relative to an index of similar mutual funds' returns and a suitable market index. The risk-adjusted returns analysis provides a way of determining the extent to which the Fund's return comparisons are mainly the product of investment value-added (or lack thereof) or alternatively taking considerably more or less risk than is typical in its investment category.
I also received and considered the history of portfolio manager changes for each Fund, as this provided an important context for evaluating the performance results.
Complex-Level Considerations
While this evaluation was conducted mainly at the individual fund level, there are some issues relating to the reasonableness of fees that can alternatively be considered across the whole fund complex:
I reviewed DeAM's profitability analysis for all DWS Funds, with a view toward determining if the allocation procedures used were reasonable and how profit levels compared with public data for other investment managers.
I considered whether DeAM and affiliates receive any significant ancillary or "fall-out" benefits that should be considered in interpreting the direct profitability results. These would be situations where serving as the investment manager of the Funds is beneficial to another part of the Deutsche Bank organization.
I considered how aggregated DWS Fund expenses had varied over the years, by asset class and in the context of trends in asset levels.
I reviewed the structure of the DeAM organization, trends in staffing levels, and information on compensation of investment management and other professionals compared with industry data.
Findings
Based on the process and analysis discussed above, which included reviewing a wide range of information from management and external data sources and considering among other factors the fees DeAM charges other clients, the fees charged by other fund managers, DeAM's costs and profits associated with managing the Funds, economies of scale, possible fall-out benefits, and the nature and quality of services provided, in my opinion the management fees charged the DWS Funds are reasonable.

Thomas H. Mack
The following table presents certain information regarding the Board Members and Officers of the Trust as of October 31, 2010. Each Board Member's year of birth is set forth in parentheses after his or her name. Unless otherwise noted, (i) each Board Member has engaged in the principal occupation(s) noted in the table for at least the most recent five years, although not necessarily in the same capacity; and (ii) the address of each Independent Board Member is c/o Paul K. Freeman, Independent Chairman, DWS Funds, PO Box 101833, Denver, CO 80250-1833. Except as otherwise noted below, the term of office for each Board Member is until the election and qualification of a successor, or until such Board Member sooner dies, resigns, is removed or as otherwise provided in the governing documents of the fund. Because the fund does not hold an annual meeting of shareholders, each Board Member will hold office for an indeterminate period. The Board Members may also serve in similar capacities with other funds in the fund complex. The Length of Time Served represents the year in which the Board Member joined the board of one or more DWS funds now overseen by the Board.
| Independent Board Members | ||
Name, Year of Birth, Position with the Fund and Length of Time Served1 | Business Experience and Directorships During the Past Five Years | Number of Funds in DWS Fund Complex Overseen |
Paul K. Freeman (1950) Chairperson since 2009 Board Member since 1993 | Consultant, World Bank/Inter-American Development Bank; Governing Council of the Independent Directors Council (governance, education committees); formerly, Project Leader, International Institute for Applied Systems Analysis (1998-2001); Chief Executive Officer, The Eric Group, Inc. (environmental insurance) (1986-1998) | 123 |
John W. Ballantine (1946) Board Member since 1999 | Retired; formerly, Executive Vice President and Chief Risk Management Officer, First Chicago NBD Corporation/The First National Bank of Chicago (1996-1998); Executive Vice President and Head of International Banking (1995-1996). Directorships: Healthways, Inc. (provider of disease and care management services); Portland General Electric (utility company); Stockwell Capital Investments PLC (private equity). Former Directorships: First Oak Brook Bancshares, Inc. and Oak Brook Bank; Prisma Energy International | 123 |
Henry P. Becton, Jr. (1943) Board Member since 1990 | Vice Chair and former President, WGBH Educational Foundation. Directorships: Association of Public Television Stations; Lead Director, Becton Dickinson and Company3 (medical technology company); Lead Director, Belo Corporation3 (media company); Public Radio International; Public Radio Exchange (PRX); The PBS Foundation. Former Directorships: Boston Museum of Science; American Public Television; Concord Academy; New England Aquarium; Mass. Corporation for Educational Telecommunications; Committee for Economic De velopment; Public Broadcasting Service | 123 |
Dawn-Marie Driscoll (1946) Board Member since 1987 | President, Driscoll Associates (consulting firm); Executive Fellow, Center for Business Ethics, Bentley University; formerly, Partner, Palmer & Dodge (1988-1990); Vice President of Corporate Affairs and General Counsel, Filene's (1978-1988). Directorships: Trustee of 22 open-end mutual funds managed by Sun Capital Advisers, Inc. (since 2007); Director of ICI Mutual Insurance Company (since 2007); Advisory Board, Center for Business Ethics, Bentley University; Trustee, Southwest Florida Community Foundation (charitable organization). Former Directorships: Investment Company Institute (audit, executive, nominating committees) and Independent Directors Council (governance, executive committees) | 123 |
Keith R. Fox (1954) Board Member since 1996 | Managing General Partner, Exeter Capital Partners (a series of private investment funds). Directorships: Progressive Holding Corporation (kitchen goods importer and distributor); Box Top Media Inc. (advertising); The Kennel Shop (retailer); former Chairman, National Association of Small Business Investment Companies | 123 |
Kenneth C. Froewiss (1945) Board Member since 2001 | Adjunct Professor of Finance, NYU Stern School of Business (September 2009-present; Clinical Professor from 1997-September 2009); Member, Finance Committee, Association for Asian Studies (2002-present); Director, Mitsui Sumitomo Insurance Group (US) (2004-present); prior thereto, Managing Director, J.P. Morgan (investment banking firm) (until 1996) | 123 |
Richard J. Herring (1946) Board Member since 1990 | Jacob Safra Professor of International Banking and Professor, Finance Department, The Wharton School, University of Pennsylvania (since July 1972); Co-Director, Wharton Financial Institutions Center (since July 2000); Director, Japan Equity Fund, Inc. (since September 2007), Thai Capital Fund, Inc. (since September 2007), Singapore Fund, Inc. (since September 2007); Independent Director of Barclays Bank Delaware (since September 2010). Formerly, Vice Dean and Director, Wharton Undergraduate Division (July 1995-June 2000); Director, Lauder Institute of International Management Studies (July 2000-June 2006) | 123 |
William McClayton (1944) Board Member since 2004+ | Private equity investor (since October 2009); previously, Managing Director, Diamond Management & Technology Consultants, Inc. (global consulting firm) (2001-2009); Directorship: Board of Managers, YMCA of Metropolitan Chicago; formerly: Senior Partner, Arthur Andersen LLP (accounting) (1966-2001); Trustee, Ravinia Festival | 123 |
Rebecca W. Rimel (1951) Board Member since 1995 | President and Chief Executive Officer, The Pew Charitable Trusts (charitable organization) (1994 to present); Trustee, Thomas Jefferson Foundation (charitable organization) (1994 to present); Trustee, Executive Committee, Philadelphia Chamber of Commerce (2001-2007); Trustee, Pro Publica (2007-present) (charitable organization); Director, CardioNet, Inc.2 (2009-present) (health care). Formerly, Executive Vice President, The Glenmede Trust Company (investment trust and wealth management) (1983-2004); Board Member, Investor Education (charitable organization) (2004-2005); Director, Viasys Health Care2 (January 2007-June 2007) | 123 |
William N. Searcy, Jr. (1946) Board Member since 1993 | Private investor since October 2003; Trustee of 22 open-end mutual funds managed by Sun Capital Advisers, Inc. (since October 1998). Formerly, Pension & Savings Trust Officer, Sprint Corporation2 (telecommunications) (November 1989-September 2003) | 123 |
Jean Gleason Stromberg (1943) Board Member since 1997 | Retired. Formerly, Consultant (1997-2001); Director, Financial Markets US Government Accountability Office (1996-1997); Partner, Fulbright & Jaworski, L.L.P. (law firm) (1978-1996). Directorships: The William and Flora Hewlett Foundation. Former Directorships: Service Source, Inc., Mutual Fund Directors Forum (2002-2004), American Bar Retirement Association (funding vehicle for retirement plans) (1987-1990 and 1994-1996) | 123 |
Robert H. Wadsworth (1940) Board Member since 1999 | President, Robert H. Wadsworth & Associates, Inc. (consulting firm) (1983 to present); Director, The Phoenix Boys Choir Association | 126 |
Officers4 | |
Name, Year of Birth, Position with the Fund and Length of Time Served5 | Principal Occupation(s) During Past 5 Years and Other Directorships Held |
Michael G. Clark6 (1965) President, 2006-present | Managing Director3, Deutsche Asset Management (2006-present); President of DWS family of funds; Director, ICI Mutual Insurance Company (since October 2007); formerly, Director of Fund Board Relations (2004-2006) and Director of Product Development (2000-2004), Merrill Lynch Investment Managers; Senior Vice President Operations, Merrill Lynch Asset Management (1999-2000) |
Ingo Gefeke7 (1967) Executive Vice President since 2010 | Managing Director3, Deutsche Asset Management; Global Head of Distribution and Product Management, DWS Global Head of Trading and Securities Lending. Member of the Board of Directors of DWS Investment GmbH Frankfurt (since July 2009) and DWS Holding & Service GmbH Frankfurt (since January 2010); formerly, Global Chief Administrative Officer, Deutsche Asset Management (2004-2009); Global Chief Operating Officer, Global Transaction Banking, Deutsche Bank AG, New York (2001-2004); Chief Operating Officer, Global Banking Division Americas, Deutsche Bank AG, New York (1999-2001); Central Management, Global Banking Services, Deutsche Bank AG, Frankfurt (1998-1999); Relationship Management, Deutsche Bank AG, Tokyo, Japan (1997-1998) |
John Millette8 (1962) Vice President and Secretary, 1999-present | Director3, Deutsche Asset Management |
Paul H. Schubert6 (1963) Chief Financial Officer, 2004-present Treasurer, 2005-present | Managing Director3, Deutsche Asset Management (since July 2004); formerly, Executive Director, Head of Mutual Fund Services and Treasurer for UBS Family of Funds (1998-2004); Vice President and Director of Mutual Fund Finance at UBS Global Asset Management (1994-1998) |
Caroline Pearson8 (1962) Chief Legal Officer, April 2010-present | Managing Director3, Deutsche Asset Management; formerly, Assistant Secretary for DWS family of funds (1997-2010) |
Rita Rubin9 (1970) Assistant Secretary, 2009-present | Vice President and Counsel, Deutsche Asset Management (since October 2007); formerly, Vice President, Morgan Stanley Investment Management (2004-2007) |
Paul Antosca8 (1957) Assistant Treasurer, 2007-present | Director3, Deutsche Asset Management (since 2006); Vice President, The Manufacturers Life Insurance Company (U.S.A.) (1990-2006) |
Jack Clark8 (1967) Assistant Treasurer, 2007-present | Director3, Deutsche Asset Management (since 2007); formerly, Vice President, State Street Corporation (2002-2007) |
Diane Kenneally8 (1966) Assistant Treasurer, 2007-present | Director3, Deutsche Asset Management |
John Caruso10 (1965) Anti-Money Laundering Compliance Officer, 2010-present | Managing Director3, Deutsche Asset Management |
Robert Kloby9 (1962) Chief Compliance Officer, 2006-present | Managing Director3, Deutsche Asset Management |
1 The length of time served represents the year in which the Board Member joined the board of one or more DWS funds currently overseen by the Board.
2 A publicly held company with securities registered pursuant to Section 12 of the Securities Exchange Act of 1934.
3 Executive title, not a board directorship.
4 As a result of their respective positions held with the Advisor, these individuals are considered "interested persons" of the Advisor within the meaning of the 1940 Act. Interested persons receive no compensation from the fund.
5 The length of time served represents the year in which the officer was first elected in such capacity for one or more DWS funds.
6 Address: 100 Plaza One, Jersey City, NJ 07311.
7 The mailing address of Mr. Gefeke is 345 Park Avenue, New York, New York 10154. In addition, Mr. Gefeke is an interested Board Member of certain DWS funds by virtue of his positions with Deutsche Asset Management. As an interested person, Mr. Gefeke receives no compensation from the fund.
8 Address: One Beacon Street, Boston, MA 02108.
9 Address: 280 Park Avenue, New York, New York 10017.
10 Address: 60 Wall Street, New York, New York 10005.
The fund's Statement of Additional Information ("SAI") includes additional information about the Board Members. The SAI is available, without charge, upon request. If you would like to request a copy of the SAI, you may do so by calling the following toll-free number: (800) 621-1048.
| For shareholders of Classes A, B, C, S and Institutional Class | ||
| For More Information | The automated telephone system allows you to access personalized account information and obtain information on other DWS funds using either your voice or your telephone keypad. Certain account types within Classes A, B, C and S also have the ability to purchase, exchange or redeem shares using this system. For more information, contact your financial advisor. You may also access our automated telephone system or speak with a DWS Investments representative by calling the appropriate number below: For shareholders of Classes A, B, C and Institutional Class: (800) 621-1048 For shareholders of Class S: (800) 728-3337 | |
| Web Site | www.dws-investments.com View your account transactions and balances, trade shares, monitor your asset allocation, and change your address, 24 hours a day. Obtain prospectuses and applications, blank forms, interactive worksheets, news about DWS funds, subscription to fund updates by e-mail, retirement planning information, and more. | |
| Written Correspondence | DWS Investments PO Box 219151 Kansas City, MO 64121-9151 | |
| Proxy Voting | The fund's policies and procedures for voting proxies for portfolio securities and information about how the fund voted proxies related to its portfolio securities during the 12-month period ended June 30 are available on our Web site — www.dws-investments.com (click on "proxy voting"at the bottom of the page) — or on the SEC's Web site — www.sec.gov. To obtain a written copy of the fund's policies and procedures without charge, upon request, call us toll free at (800) 621-1048. | |
| Principal Underwriter | If you have questions, comments or complaints, contact: DWS Investments Distributors, Inc. 222 South Riverside Plaza Chicago, IL 60606-5808 (800) 621-1148 | |
| Class A | Class B | Class C | Class S | Institutional Class | ||
| Nasdaq Symbol | DBISX | DBIBX | DBICX | DBIVX | MGINX | |
| CUSIP Number | 23339E 400 | 23339E 509 | 23339E 608 | 23339E 707 | 23339E 103 | |
| Fund Number | 499 | 699 | 799 | 2399 | 559 |
| For shareholders of Class R | ||
| Automated Information Line | DWS Investments Flex Plan Access (800) 532-8411 24-hour access to your retirement plan account. | |
| Web Site | www.dws-investments.com Click "Retirement Plans" to reallocate assets, process transactions and review your funds through our secure online account access. Obtain prospectuses and applications, blank forms, interactive worksheets, news about DWS funds, subscription to fund updates by e-mail, retirement planning information, and more. | |
| For More Information | (800) 543-5776 To speak with a service representative. | |
| Written Correspondence | DWS Investments Service Company 222 South Riverside Plaza Chicago, IL 60606-5806 | |
| Proxy Voting | A description of the fund's policies and procedures for voting proxies for portfolio securities and information about how the fund voted proxies related to its portfolio securities during the 12-month period ended June 30 is available on our Web site — www.dws-investments.com (click on "proxy voting"at the bottom of the page) — or on the SEC's Web site — www.sec.gov. To obtain a written copy of the fund's policies and procedures without charge, upon request, call us toll free at (800) 621-1048. | |
| Principal Underwriter | If you have questions, comments or complaints, contact: DWS Investments Distributors, Inc. 222 South Riverside Plaza Chicago, IL 60606-5808 (800) 621-1148 | |
| Class R | ||
| Nasdaq Symbol | DBITX | |
| CUSIP Number | 23339E 806 | |
| Fund Number | 1501 |
Notes
Notes
Notes
Notes
Notes
Notes

| ITEM 2. | CODE OF ETHICS |
As of the end of the period covered by this report, the registrant has adopted a code of ethics, as defined in Item 2 of Form N-CSR, that applies to its Principal Executive Officer and Principal Financial Officer. There have been no amendments to, or waivers from, a provision of the code of ethics during the period covered by this report that would require disclosure under Item 2. A copy of the code of ethics is filed as an exhibit to this Form N-CSR. | |
| ITEM 3. | AUDIT COMMITTEE FINANCIAL EXPERT |
| The fund’s audit committee is comprised solely of trustees who are "independent" (as such term has been defined by the Securities and Exchange Commission ("SEC") in regulations implementing Section 407 of the Sarbanes-Oxley Act (the "Regulations")). The fund’s Board of Trustees has determined that there are several "audit committee financial experts" (as such term has been defined by the Regulations) serving on the fund’s audit committee including Mr. William McClayton, the chair of the fund’s audit committee. An “audit committee financial expert” is not an “expert” for any purpose, including for purposes of Section 11 of the Securities Act of 1933 and the designation or identification of a person as an “audit committee financial expert” does not impose on su ch person any duties, obligations or liability that are greater than the duties, obligations and liability imposed on such person as a member of the audit committee and board of directors in the absence of such designation or identification. | |
| ITEM 4. | PRINCIPAL ACCOUNTANT FEES AND SERVICES |
DWS DIVERSIFIED INTERNATIONAL EQUITY FUND
FORM N-CSR DISCLOSURE RE: AUDIT FEES
The following table shows the amount of fees that PricewaterhouseCoopers, LLP (“PWC”), the Fund’s independent registered public accounting firm, billed to the Fund during the Fund’s last two fiscal years. The Audit Committee approved in advance all audit services and non-audit services that PWC provided to the Fund.
Services that the Fund’s Independent Registered Public Accounting Firm Billed to the Fund
| Fiscal Year Ended October 31, | Audit Fees Billed to Fund | Audit-Related Fees Billed to Fund | Tax Fees Billed to Fund | All Other Fees Billed to Fund | ||||||||||||
| 2010 | $ | 61,438 | $ | 0 | $ | 0 | $ | 3,204 | ||||||||
| 2009 | $ | 55,438 | $ | 0 | $ | 0 | $ | 4,859 | ||||||||
Services that the Fund’s Independent Registered Public Accounting Firm Billed to the Adviser and Affiliated Fund Service Providers
The following table shows the amount of fees billed by PWC to Deutsche Investment Management Americas Inc. (“DeIM” or the “Adviser”), and any entity controlling, controlled by or under common control with DeIM (“Control Affiliate”) that provides ongoing services to the Fund (“Affiliated Fund Service Provider”), for engagements directly related to the Fund’s operations and financial reporting, during the Fund’s last two fiscal years.
| Fiscal Year October 31, | Audit-Related Fees Billed to Adviser and Affiliated Fund Service Providers | Tax Fees Billed to Adviser and Affiliated Fund Service Providers | All Other Fees Billed to Adviser and Affiliated Fund Service Providers | |||||||||
| 2010 | $ | 7,500 | $ | 0 | $ | 0 | ||||||
| 2009 | $ | 2,000 | $ | 0 | $ | 0 | ||||||
The “Audit-Related Fees” were billed for services in connection with the agreed-upon procedures.
Non-Audit Services
The following table shows the amount of fees that PWC billed during the Fund’s last two fiscal years for non-audit services. The Audit Committee pre-approved all non-audit services that PWC provided to the Adviser and any Affiliated Fund Service Provider that related directly to the Fund’s operations and financial reporting. The Audit Committee requested and received information from PWC about any non-audit services that PWC rendered during the Fund’s last fiscal year to the Adviser and any Affiliated Fund Service Provider. The Committee considered this information in evaluating PWC’s independence.
| Fiscal Year Ended October 31, | Total Non-Audit Fees Billed to Fund (A) | Total Non-Audit Fees billed to Adviser and Affiliated Fund Service Providers (engagements related directly to the operations and financial reporting of the Fund) (B) | Total Non-Audit Fees billed to Adviser and Affiliated Fund Service Providers (all other engagements) (C) | Total of (A), (B) and (C) | ||||||||||||
| 2010 | $ | 3,204 | $ | 0 | $ | 100,000 | $ | 103,204 | ||||||||
| 2009 | $ | 4,859 | $ | 0 | $ | 0 | $ | 4,859 | ||||||||
All other engagement fees were billed for services in connection with an internal control review of a subadvisor.
Audit Committee Pre-Approval Policies and Procedures. Generally, each Fund’s Audit Committee must pre approve (i) all services to be performed for a Fund by a Fund’s Independent Registered Public Accounting Firm and (ii) all non-audit services to be performed by a Fund’s Independent Registered Public Accounting Firm for the DIMA Entities with respect to operations and financial reporting of the Fund, except that the Chairperson or Vice Chairperson of each Fund’s Audit Committee may grant the pre-approval for non-audit services described in items (i) and (ii) above for non-prohibited services for engagements of less than $100,000. All such delegated pre approvals shall be presented to each Fund’s Audit Committee no later than the next Audit Committee meeting.
There were no amounts that were approved by the Audit Committee pursuant to the de minimis exception under Rule 2-01 of Regulation S-X.
According to the registrant’s principal Independent Registered Public Accounting Firm, all of the principal Independent Registered Public Accounting Firm's hours spent on auditing the registrant's financial statements were attributed to work performed by full-time permanent employees of the principal Independent Registered Public Accounting Firm.
***
| ITEM 5. | AUDIT COMMITTEE OF LISTED REGISTRANTS | |
| Not applicable | ||
| ITEM 6. | SCHEDULE OF INVESTMENTS | |
| Not applicable | ||
| ITEM 7. | DISCLOSURE OF PROXY VOTING POLICIES AND PROCEDURES FOR CLOSED-END MANAGEMENT INVESTMENT COMPANIES | |
| Not applicable | ||
| ITEM 8. | PORTFOLIO MANAGERS OF CLOSED-END MANAGEMENT INVESTMENT COMPANIES | |
| Not applicable | ||
| ITEM 9. | PURCHASES OF EQUITY SECURITIES BY CLOSED-END MANAGEMENT INVESTMENT COMPANY AND AFFILIATED PURCHASERS | |
| Not Applicable. | ||
| ITEM 10. | SUBMISSION OF MATTERS TO A VOTE OF SECURITY HOLDERS | |
| There were no material changes to the procedures by which shareholders may recommend nominees to the Fund’s Board. The primary function of the Nominating and Governance Committee is to identify and recommend individuals for membership on the Board and oversee the administration of the Board Governance Guidelines. Shareholders may recommend candidates for Board positions by forwarding their correspondence by U.S. mail or courier service to Paul K. Freeman, Independent Chairman, DWS Funds, P.O. Box 101833, Denver, CO 80250-1833. | ||
| ITEM 11. | CONTROLS AND PROCEDURES | |
| (a) | The Chief Executive and Financial Officers concluded that the Registrant’s Disclosure Controls and Procedures are effective based on the evaluation of the Disclosure Controls and Procedures as of a date within 90 days of the filing date of this report. | |
| (b) | There have been no changes in the registrant’s internal control over financial reporting that occurred during the second fiscal quarter of the period covered by this report that has materially affected, or is reasonably likely to materially affect, the registrant’s internal controls over financial reporting. | |
| ITEM 12. | EXHIBITS | |
| (a)(1) | Code of Ethics pursuant to Item 2 of Form N-CSR is filed and attached hereto as EX-99.CODE ETH. | |
| (a)(2) | Certification pursuant to Rule 30a-2(a) under the Investment Company Act of 1940 (17 CFR 270.30a-2(a)) is filed and attached hereto as Exhibit 99.CERT. | |
| (b) | Certification pursuant to Rule 30a-2(b) under the Investment Company Act of 1940 (17 CFR 270.30a-2(b)) is furnished and attached hereto as Exhibit 99.906CERT. | |
Form N-CSR Item F
SIGNATURES
Pursuant to the requirements of the Securities Exchange Act of 1934 and the Investment Company Act of 1940, the registrant has duly caused this report to be signed on its behalf by the undersigned, thereunto duly authorized.
| Registrant: | DWS Diversified International Equity Fund, a series of DWS Advisor Funds |
| By: | /s/Michael G. Clark Michael G. Clark President |
| Date: | December 28, 2010 |
Pursuant to the requirements of the Securities Exchange Act of 1934 and the Investment Company Act of 1940, this report has been signed below by the following persons on behalf of the registrant and in the capacities and on the dates indicated.
| By: | /s/Michael G. Clark Michael G. Clark President |
| Date: | December 28, 2010 |
| By: | /s/Paul Schubert Paul Schubert Chief Financial Officer and Treasurer |
| Date: | December 28, 2010 |