Table of Contents
AS FILED WITH THE SECURITIES AND EXCHANGE COMMISSION ON AUGUST 2, 2004.
SECURITIES ACT FILE NO. 333-
SECURITIES AND EXCHANGE COMMISSION
WASHINGTON, DC 20549
FORM N-14
REGISTRATION STATEMENT
UNDER
THE SECURITIES ACT OF 1933 x
PRE-EFFECTIVE AMENDMENT NO. ¨
POST-EFFECTIVE AMENDMENT NO. ¨
SCUDDER ADVISOR FUNDS
(EXACT NAME OF REGISTRANT AS SPECIFIED IN CHARTER)
One South Street, Baltimore, MD 21202
(ADDRESS OF PRINCIPAL EXECUTIVE OFFICES) (ZIP CODE)
410-895-5000
(REGISTRANT’S AREA CODE AND TELEPHONE NUMBER)
John Millette, Secretary
Scudder Advisor Funds
One South Street, Baltimore, MD 21202
(NAME AND ADDRESS OF AGENT FOR SERVICE)
WITH COPIES TO:
| Burton M. Leibert, Esq. | Cathy G. O’Kelly, Esq. | |
Mary C. Carty, Esq. | David A. Sturms, Esq. | |
Willkie Farr & Gallagher LLP | Vedder, Price, Kaufman & Kammholz, P.C. | |
787 Seventh Avenue | 222 North LaSalle Street | |
New York, New York 10019-6099 | Chicago, Illinois 60601 |
APPROXIMATE DATE OF PROPOSED PUBLIC OFFERING: As soon as practicable after the effective date of this Registration Statement.
TITLE OF SECURITIES BEING REGISTERED:
Shares of Beneficial Interest ($0.001 par value) of the Registrant
The Registrant has registered an indefinite amount of securities under the Securities Act of 1933, as amended, pursuant to Section 24(f) under the Investment Company Act of 1940, as amended; accordingly, no fee is payable herewith because of reliance upon Section 24(f).
The Registrant hereby amends this Registration Statement on such date or dates as may be necessary to delay its effective date until the Registrant shall file a further amendment which specifically states that this Registration Statement shall thereafter become effective in accordance with Section 8(a) of the Securities Act of 1933 or until the Registration Statement shall become effective on such date as the Commission, acting pursuant to said Section 8(a), may determine.
Table of Contents

SCUDDER DYNAMIC GROWTH FUND |
Q&A
Q What is happening?
A Deutsche Asset Management has initiated a program to reorganize and combine selected funds within the Scudder fund family.
Q What issue am I being asked to vote on?
A You are being asked to vote on a proposal to merge Scudder Dynamic Growth Fund into Scudder Mid Cap Growth Fund. The funds are managed by largely the same portfolio management team, have similar investment objectives and seek to achieve their objectives through similar types of investments. Both funds invest in stocks of medium-sized companies, although Scudder Dynamic Growth Fund may invest a larger percentage of its assets in smaller-sized companies.
After carefully reviewing the proposal, your fund’s Board has determined that this action is in the best interest of the fund. The Board [unanimously] recommends that you vote “FOR” this proposal.
Q Why has this proposal been made for my fund?
A As discussed in the enclosed Prospectus/Proxy Statement, the combination of the two funds is the consolidation of similar funds that are categorized in the same peer group, compete in the same distribution channels and are managed by largely the same portfolio management team. The merger is intended to create a more streamlined line-up of Scudder funds, which Deutsche Asset Management believes may help enhance investment performance and increase the efficiency of Deutsche Asset Management’s operations. The merger may also result in greater cost efficiencies and the potential for economies of scale for the combined fund and its shareholders.
Q Will I have to pay taxes as a result of the merger?
A The merger is expected to be a tax-free transaction, and will not take place unless special tax counsel provides an opinion to that effect. As a result of the merger, however,

Table of Contents
Q&A continued
your fund may lose the benefit of certain tax losses that could have been used to offset or defer future gains.
If you choose to redeem or exchange your shares before or after the merger, the redemption or exchange will generate taxable gain or loss; therefore, you should consult a tax advisor before doing so. Of course, you may also be subject to capital gains or losses as a result of the normal operations of your fund whether or not the transaction occurs.
Q Upon merger, will I own the same number of shares?
A The aggregate value of your shares will not change as a result of the transaction. It is likely that the number of shares you own will change as a result of the transaction because your shares will be exchanged at the net asset value per share of Scudder Mid Cap Growth Fund, which will probably be different from the net asset value per share of Scudder Dynamic Growth Fund.
Q Will any fund pay for the proxy solicitation and legal costs associated with this solicitation?
A No. Deutsche Asset Management will bear these costs.
Q When would the merger take place?
A If approved, the merger would occur on or about November 15, 2004 or as soon as reasonably practicable after shareholder approval is obtained. Shortly after completion of the merger, shareholders whose accounts are affected by the merger will receive a confirmation statement reflecting their new account number and number of shares owned.
Q How can I vote?
A You can vote in any one of four ways:
| n | Through the internet by going to the website listed on your proxy card; |
| n | By telephone, with a toll-free call to the number listed on your proxy card; |
| n | By mail, by sending the enclosed proxy card, signed and dated, to us in the enclosed envelope; or |
| n | In person, by attending the special meeting. |
We encourage you to vote over the internet or by telephone, using the voting control number that appears on your proxy card. Whichever method you choose, please take the time to read the full text of the proxy statement before you vote.
2
Table of Contents
Q If I send my proxy in now as requested, can I change my vote later?
A You may revoke your proxy at any time before it is voted by: (1) sending a written revocation to the Secretary of the fund as explained in the proxy statement; or (2) forwarding a later-dated proxy that is received by the fund at or prior to the special meeting; or (3) attending the special meeting and voting in person. Even if you plan to attend the special meeting, we ask that you return the enclosed proxy. This will help us ensure that an adequate number of shares are present for the special meeting to be held.
Q Will I be able to continue to track my fund’s performance in the newspaper, on the Internet or through the voice response system (ScudderACCESS)?
A Yes. You will be able to continue to track your fund’s performance through all these means.
Q What is the Board’s recommendation?
A Your fund’s Board [unanimously] recommends that all shareholders vote “FOR” the approval of the merger.
Q Whom should I call for additional information about this Prospectus/Proxy Statement?
A Please call Georgeson Shareholder Communications Inc., your fund’s proxy solicitor, at 1-888-288-5518.
Q&A continued
3
Table of Contents
A Message from the Fund’s Chief Executive Officer
, 2004
Dear Shareholder:
I am writing to you to ask for your vote on an important matter that affects your investment in Scudder Dynamic Growth Fund (“Dynamic Growth Fund”). While you are, of course, welcome to join us at the Dynamic Growth Fund shareholders’ meeting, most shareholders cast their vote by filling out and signing the enclosed proxy card, or by voting by telephone or through the Internet.
We are asking for your vote on the following matter:
Approval of a proposed merger of Dynamic Growth Fund into Scudder Mid Cap Growth Fund (“Mid Cap Growth Fund”). In this merger, your shares of Dynamic Growth Fund would, in effect, be exchanged, on a tax-free basis, for shares of Mid Cap Growth Fund with an equal net asset value.
The proposed merger is part of a program initiated by Deutsche Asset Management. This program is intended to provide a more streamlined selection of investment options that is consistent with the changing needs of investors. If approved by fund shareholders, this program will enable Deustche Asset Management to:
| • | Eliminate redundancies within the Scudder fund family by reorganizing and combining certain funds; and |
| • | Focus its investment resources on a core set of mutual funds that best meet investor needs. |
In determining to recommend approval of the merger, the Trustees of Dynamic Growth Fund considered the following factors, among others:
| • | Deutsche Asset Management’s overall program to reorganize and combine selected funds within the Scudder fund family gives the portfolio management team the opportunity to focus its efforts on managing the combined Fund and offers a uniform distribution platform for the combined Fund; |
| • | Dynamic Growth Fund shareholders will have the opportunity to continue to invest in a substantially larger Fund with similar investment policies; |
| • | shareholders will have the potential for economies of scale; |
| • | Deutsche Asset Management’s agreement to pay all costs associated with the merger; and |
| • | the merger would be a tax-free reorganization for the shareholders. |
The investment objective and policies of Dynamic Growth Fund are similar to those of Mid Cap Growth Fund.
Table of Contents
If the merger is approved, the Board expects that the proposed changes will take effect during the fourth calendar quarter of this year.
Included in this booklet is information about the upcoming shareholders’ meeting:
| • | A Notice of a Special Meeting of Shareholders, which summarizes the issue for which you are being asked to provide voting instructions; |
| • | A Prospectus/Proxy Statement, which provides detailed information on Mid Cap Growth Fund, the specific proposal being considered at the shareholders’ meeting, and why the proposal is being made. |
Whether or not you plan to be present at the meeting, we need your vote. We urge you to review the enclosed materials thoroughly. Once you’ve determined how you would like your interests to be represented, please promptly complete, sign, date and return the enclosed proxy card, vote by telephone or record your voting instructions on the Internet. A postage-paid envelope is enclosed for mailing, and telephone and Internet voting instructions are listed at the top of your proxy card.
I’m sure that you, like most people, lead a busy life and are tempted to put this proxy aside for another day. Please don’t. Your prompt return of the enclosed proxy card(s) (or your voting by telephone or through the Internet) may save the necessity and expense of further solicitations.
Your vote is important to us. We appreciate the time and consideration I am sure you will give this important matter. If you have questions about the proposal, please call Dynamic Growth Fund’s proxy solicitor at 1-888-288-5518 or contact your financial advisor. Thank you for your continued support of Scudder Investments.
Sincerely yours,

Julian F. Sluyters
Chief Executive Officer
Scudder Dynamic Growth Fund
ii
Table of Contents
NOTICE OF A SPECIAL MEETING OF SHAREHOLDERS
This is the formal agenda for your fund’s shareholder meeting. It tells you what matters will be voted on and the time and place of the meeting in the event you choose to attend in person.
To the Shareholders of Scudder Dynamic Growth Fund:
A Special Meeting of Shareholders of Scudder Dynamic Growth Fund (“Dynamic Growth Fund”) will be held on November 4, 2004 at 4:00 p.m. Eastern time at One South Street, Baltimore, Maryland 21202 (the “Meeting”), to consider the following (the “Proposal”):
| Proposal: | Approving an Agreement and Plan of Reorganization and the transactions it contemplates, including the transfer of all of the assets of Scudder Dynamic Growth Fund to Scudder Mid Cap Growth Fund in exchange for the issuance and delivery of shares of Scudder Mid Cap Growth Fund and the assumption by Scudder Mid Cap Growth Fund of all liabilities of Scudder Dynamic Growth Fund, and the distribution of such shares, on a tax-free basis, to the shareholders of Scudder Dynamic Growth Fund in complete termination and liquidation of Scudder Dynamic Growth Fund. |
The persons named as proxies will vote in their discretion on any other business that may properly come before the Meeting or any adjournments or postponements thereof.
Holders of record of shares of Dynamic Growth Fund at the close of business on August 18, 2004 are entitled to vote at the Meeting and at any adjournments or postponements thereof.
In the event that the necessary quorum to transact business or the vote required to approve the merger is not obtained at the Meeting, the persons named as proxies may propose one or more adjournments of the Meeting in accordance with applicable law to permit such further solicitation of proxies as may be deemed necessary or advisable. Any such adjournment as to a matter will require the affirmative vote of the holders of a majority of Dynamic Growth Fund’s shares present in person or by proxy at the Meeting. The persons named as proxies will vote FOR any such adjournment those proxies which they are entitled to vote in favor of the Proposal and will vote AGAINST any such adjournment those proxies to be voted against the Proposal.
By order of the Trustees

John Millette
Secretary
, 2004
WE URGE YOU TO MARK, SIGN, DATE AND MAIL THE ENCLOSED PROXY IN THE POSTAGE-PAID ENVELOPE PROVIDED OR RECORD YOUR VOTING INSTRUCTIONS BY TELEPHONE OR VIA THE INTERNET SO THAT YOU WILL BE REPRESENTED AT THE MEETING.
Table of Contents
INSTRUCTIONS FOR SIGNING PROXY CARDS
The following general rules for signing proxy cards may be of assistance to you and avoid the time and expense involved in validating your vote if you fail to sign your proxy card properly.
| 1. | Individual Accounts: Sign your name exactly as it appears in the registration on the proxy card. |
| 2. | Joint Accounts: Either party may sign, but the name of the party signing should conform exactly to the name shown in the registration on the proxy card. |
| 3. | All Other Accounts: The capacity of the individual signing the proxy card should be indicated unless it is reflected in the form of registration. For example: |
Registration | Valid Signature | |
Corporate Accounts | ||
(1) ABC Corp. | ABC Corp. John Doe, Treasurer | |
(2) ABC Corp. | John Doe, Treasurer | |
(3) ABC Corp. | John Doe | |
(4) ABC Corp. Profit Sharing Plan | John Doe, Trustee | |
Partnership Accounts | ||
(1) The XYZ Partnership | Jane B. Smith, Partner | |
(2) Smith and Jones, | Jane B. Smith, General Partner | |
Trust Accounts | ||
(1) ABC Trust Account | Jane B. Doe, Trustee | |
(2) Jane B. Doe, Trustee u/t/d 12/28/78 | Jane B. Doe | |
Custodial or Estate Accounts | ||
(1) John B. Smith, Cust. f/b/o John B. Smith Jr. UGMA/UTMA | John B. Smith | |
(2) Estate of John B. Smith | John B. Smith, Jr., Executor | |
Table of Contents
IMPORTANT INFORMATION
FOR SHAREHOLDERS OF
SCUDDER DYNAMIC GROWTH FUND
This document contains a prospectus/proxy statement and a proxy card. A proxy card is, in essence, a ballot. When you vote your proxy, it tells us how to vote on your behalf on an important issue relating to your fund. If you complete and sign the proxy (or tell us how you want to vote by voting by telephone or through the Internet), we’ll vote exactly as you tell us. If you simply sign the proxy, we’ll vote it in accordance with the Trustees’ recommendation on page .
We urge you to review the Prospectus/Proxy Statement carefully, and either fill out your proxy card and return it to us through the mail (in the postage paid envelope provided), vote by telephone or record your voting instructions through the Internet. You may receive more than one proxy card since several shareholder meetings are being held as part of the broader restructuring program of the Scudder fund family. If so, please vote each one. Your prompt return of the enclosed proxy card(s) (or voting by telephone or through the Internet) may save the necessity and expense of further solicitations.
We want to know how you would like to vote and welcome your comments. Please take a few minutes to read these materials and return your proxy to us.
Table of Contents
| Page | ||
| ii | ||
| iv | ||
| 1 | ||
| 3 | ||
| 9 | ||
| 16 | ||
| 17 | ||
| 24 | ||
Regulatory and Litigation Matters | 28 | |
| A-1 | ||
Proxy card enclosed.
If you have any questions, please call Georgeson Shareholder Communications Inc., Scudder Dynamic Growth Fund’s proxy solicitor, at 1-888-288-5518 or contact your financial advisor.
i
Table of Contents
, 2004
Acquisition of the assets of: | By and in exchange for shares of: | |
Scudder Dynamic Growth Fund a series of Scudder Dynamic Growth Fund | Scudder Mid Cap Growth Fund a series of Scudder Advisor Funds | |
222 S. Riverside Plaza Chicago, IL 60606 (617) 295-2572 | One South Street Baltimore, MD 21202 (410) 895-5000 | |
This Prospectus/Proxy Statement is being furnished in connection with the proposed merger of Scudder Dynamic Growth Fund (“Dynamic Growth Fund”) into Scudder Mid Cap Growth Fund (“Mid Cap Growth Fund”). Dynamic Growth Fund and Mid Cap Growth Fund are referred to in this Prospectus/Proxy Statement collectively as the “Funds,” and each is referred to herein individually as a “Fund.” As a result of the proposed merger, each shareholder of Dynamic Growth Fund will receive that number of full and fractional shares of the corresponding class of Mid Cap Growth Fund equal in aggregate value as of the date of the merger to the total value of such shareholder’s Dynamic Growth Fund shares.
This Prospectus/Proxy Statement is being mailed on or about September 7, 2004. It explains concisely what you should know before voting on the matter described in this Prospectus/Proxy Statement or investing in Mid Cap Growth Fund, a diversified series of an open-end management investment company. Please read it carefully and keep it for future reference.
The securities offered by this Prospectus/Proxy Statement have not been approved or disapproved by the SEC, nor has the SEC passed upon the accuracy or adequacy of this Prospectus/Proxy Statement. Any representation to the contrary is a criminal offense.
The following documents have been filed with the Securities and Exchange Commission (“SEC”) and are incorporated into this Prospectus/Proxy Statement by reference:
| • | Mid Cap Growth Fund’s Class A, B, C and R prospectus and Institutional Class prospectus, each dated February 1, 2004, each as supplemented from time to time, the applicable copy of which is included with this Prospectus/Proxy Statement; |
| • | Dynamic Growth Fund’s Class A, B and C prospectus dated December 1, 2003, and Institutional Class supplement dated December 1, 2003, each as supplemented from time to time; |
| • | The audited financial statements and related Independent Registered Public Accounting Firm’s report for Dynamic Growth Fund contained in the annual report for the fiscal year ended September 30, 2003 and financial statements contained in the semi-annual report for the semi-annual period ended March 31, |
1
Table of Contents
2004. Mid Cap Growth Fund’s annual report for the fiscal year ended September 30, 2003 and semi-annual report for the semi-annual period ended March 31, 2004. The semi-annual report of Mid Cap Growth Fund accompanies this Prospectus/Proxy Statement; and |
| • | the statement of additional information relating to the proposed merger, dated , 2004 (the “Merger SAI”). |
Shareholders may receive free copies of the Funds’ annual reports, either Fund’s Prospectuses or statements of additional information and/or the Merger SAI, request other information about a Fund, or make shareholder inquiries by contacting their financial advisor or by calling the corresponding Fund at the phone number listed above.
Like shares of Dynamic Growth Fund, shares of Mid Cap Growth Fund are not deposits or obligations of, or guaranteed or endorsed by, any financial institution, are not insured by the Federal Deposit Insurance Corporation, the Federal Reserve Board or any other agency, and involve risk, including the possible loss of the principal amount invested.
This document will give you the information you need to vote on the proposal. Much of the information is required disclosure under rules of the SEC; some of it is technical. If there is anything you don’t understand, please contact Georgeson Shareholder Communications Inc., Dynamic Growth Fund’s proxy solicitor, at 1-888-288-5518, or contact your financial advisor.
You may review and copy information about the Funds at the SEC’s public reference room at 450 Fifth Street, NW, Washington, D.C. You may call the SEC at 1-202-942-8090 for information about the operation of the public reference room. You may also review and copy information about the Funds at the SEC’s public reference facilities located at 233 Broadway, New York, NY (1-646-428-1500) and 175 W. Jackson Boulevard, Suite 900, Chicago, IL (1-312-353-7390). You may obtain copies of this information, with payment of a duplication fee, by electronic request at the following e-mail address: publicinfo@sec.gov, or by writing the SEC’s Public Reference Branch, Officer of Consumer Affairs and Information Services, Securities and Exchange Commission, Washington, D.C. 20549-0102. You may also access reports and other information about the Funds on the EDGAR database on the SEC’s Internet site at http://www.sec.gov.
2
Table of Contents
The responses to the questions that follow provide an overview of key points typically of concern to shareholders considering a proposed merger between mutual funds. These responses are qualified in their entirety by the remainder of this Prospectus/Proxy Statement, which you should read carefully because it contains additional information and further details regarding the proposed merger.
| What | is being proposed? |
The Trustees of Scudder Dynamic Growth Fund (the “Trust”), of which Dynamic Growth Fund is the sole series, are recommending that shareholders approve the transactions contemplated by the Agreement and Plan of Reorganization (as described below), which we refer to as a merger of Dynamic Growth Fund into Mid Cap Growth Fund. If approved by shareholders, all of the assets of Dynamic Growth Fund will be transferred to Mid Cap Growth Fund solely in exchange for the issuance and delivery to Dynamic Growth Fund of shares of Mid Cap Growth Fund (“Merger Shares”) with a value equal to the value of Dynamic Growth Fund’s assets net of liabilities and for the assumption by Mid Cap Growth Fund of all liabilities of Dynamic Growth Fund. Immediately following the transfer, the appropriate class of Merger Shares received by Dynamic Growth Fund will be distributed pro rata to each of its shareholders of record.
Deutsche Asset Management proposed this combination as part of its overall product rationalization program to reorganize and combine selected funds within the Scudder fund family. The Scudder fund family is made up of a group of funds that were managed by different investment advisors over the years and that have come together as a result of various corporate transactions that have taken place over time. As a result of these corporate transactions, there are a number of redundant funds within the Scudder fund family. In addition, the funds in the Scudder fund family do not currently have the same share class structure. Deutsche Asset Management’s overall program is designed to reorganize and combine funds in order to, among other reasons, eliminate redundant funds. Deutsche Asset Management’s program is also designed to expand product offerings across more share classes and adjust or eliminate share classes in order to implement the same share class structure across the Scudder fund family. Deutsche Asset Management believes this program may help enhance investment performance and increase the efficiency of its operations.
| What | will happen to my shares of Dynamic Growth Fund as a result of the merger? |
Your shares of Dynamic Growth Fund will, in effect, be exchanged on a tax-free basis for shares of the same class of Mid Cap Growth Fund with an equal aggregate net asset value on the date of the merger.
| Why | have the Trustees of the Trust recommended that I approve the merger? |
The Trustees considered the following factors in determining to recommend that shareholders of Dynamic Growth Fund approve the merger:
| • | Deutsche Asset Management’s overall program to reorganize and combine selected funds in the Scudder fund family as described above. |
| • | The merger offers Dynamic Growth Fund shareholders the opportunity to continue to invest in a substantially larger fund with similar investment policies. Deutsche Investment Management Americas Inc. (“DeIM”), Dynamic Growth |
3
Table of Contents
Fund’s investment advisor, has advised the Trustees that Dynamic Growth Fund and Mid Cap Growth Fund have similar investment objectives, policies and strategies. In addition, DeIM has advised the Trustees that both Funds have the same lead portfolio manager and two other portfolio managers in common. |
| • | The merger is intended to create a more streamlined line-up of Scudder funds, which Deutsche Asset Management believes may help enhance investment performance and increase the efficiency of Deutsche Asset Management’s operations. The merger may also result in greater cost efficiencies and the potential for economies of scale for the combined fund and its shareholders. |
| • | Deutsche Asset Management’s agreement to pay all costs associated with the merger. |
| • | The merger is structured as a tax-free reorganization for federal income tax purposes. Shareholders are not expected to recognize any gain or loss for federal income tax purposes directly as a result of the merger. |
[The Trustees of the Trust have concluded that: (1) the merger is in the best interests of Dynamic Growth Fund, and (2) the interests of the existing shareholders of Dynamic Growth Fund will not be diluted as a result of the merger. Accordingly, the Trustees [unanimously] recommend that shareholders approve the Agreement and Plan of Reorganization effecting the merger.]
How do the investment goals, policies and restrictions of the two Funds compare?
As noted and further described under “Investment Strategies and Risk Factors,” the investment objectives, policies and restrictions of the Funds are similar. The investment goal of Dynamic Growth Fund is maximum appreciation on investors’ capital. To pursue its investment goal, under normal market conditions, Dynamic Growth Fund invests at least 65% of its total assets in stocks whose market capitalizations are $8.5 billion or less. Dynamic Growth Fund seeks to invest in small to medium-sized companies that may benefit from technological advances, new marketing methods and economic and demographic changes.
The investment goal of Mid Cap Growth Fund is long-term capital growth. To pursue its investment goal, under normal market conditions, Mid Cap Growth Fund invests at least 80% of its assets, determined at the time of purchase, in companies with market caps within the market capitalization range of the Russell Mid Cap Growth Index ($1.3 to $13.25 billion as of June 30, 2004) or securities with equity characteristics that provide exposure to those companies. Mid Cap Growth Fund invests primarily in equity securities of medium-sized growth-oriented companies.
The most significant difference in the way the Funds are managed is that Mid Cap Growth Fund is required to invest at least 80% of its assets in mid cap companies, while Dynamic Growth Fund may invest in both small and mid cap companies as long as at least 65% of its assets are invested in stocks whose market capitalizations are $8.5 billion or less.
Please also see “Investment Strategies and Risk Factors” below for a more detailed comparison of the Funds’ investment policies and restrictions.
The following table sets forth a summary of the composition of the investment portfolio of each Fund as of March 31, 2004, and of Mid Cap Growth Fund on a pro forma combined basis, giving effect to the proposed merger:
4
Table of Contents
Portfolio Composition (March 31, 2004)
| Average Market Capitalization (000) | ||
Dynamic Growth Fund | 3,656 | |
Mid Cap Growth Fund | 3,515 | |
Mid Cap Growth Fund—Pro Forma Combined1 | 3,555 |
| 1 | Reflects the blended characteristics of Dynamic Growth Fund and Mid Cap Growth Fund as of March 31, 2004. The portfolio composition and characteristics of the merged fund will change consistent with its stated investment objectives and policies. |
How do the management fees and other expenses of the two Funds compare, and what are they estimated to be following the merger?
The following tables summarize the fees and expenses you may pay when investing in the Funds, the expenses that each Fund incurred for the twelve months ended March 31, 2004, and the pro forma expenses of Mid Cap Growth Fund assuming consummation of the merger and a new management fee schedule as of that date. The management fee for Dynamic Growth Fund is performance-based and payable at an annual rate of 0.65% of average daily net assets. The fee is then adjusted upward or downward by a maximum of 0.30% based upon the performance of the Fund’s Class A shares of beneficial interest compared with the performance of the S&P 500 Stock Index. The total adjusted fee on an annual basis can range from 0.35% to 0.95% of average daily net assets. The management fee for Mid Cap Growth Fund is 0.65% of average daily net assets for the first $500 million in assets, 0.625% of average daily net assets on the next $1 billion in assets, 0.60% of average daily net assets on the next $1 billion in assets, 0.55% of average daily net assets on the next $10 billion in assets and 0.51% of average daily net assets on assets exceeding $12.5 billion. Mid Cap Growth’s management fee does not include any adjustments based on performance. As a result, if the merger is approved, the resulting management fee will not have a performance fee adjustment. As shown below, the merger is expected to result in decreased total expenses for shareholders of both Funds. However, there can be no assurance that the merger will result in expense savings.
Shareholder Fees (fees paid directly from your investment)
| Class A | Class B | Class C | Institutional Class | ||||||||
Maximum Sales Charge (Load) | |||||||||||
Imposed on Purchases | |||||||||||
Dynamic Growth Fund | 5.75 | % | None | None | None | ||||||
Mid Cap Growth Fund | 5.75 | % | None | None | None | ||||||
Maximum Contingent Deferred Sales Charge (Load) (as a percentage of redemption proceeds) | |||||||||||
Dynamic Growth Fund | None1 | 4.00 | % | 1.00 | % | None | |||||
Mid Cap Growth Fund | None1 | 4.00 | % | 1.00 | % | None |
5
Table of Contents
Annual Fund Operating Expenses
(expenses that are deducted from Fund assets)
| Management Fees | Distribution/ (12b-1) Fees2 | Other Expenses3 | Total Operating | Less Expense Waiver/ Reimbursement | Net Annual Fund Operating Expenses | |||||||||||||
Dynamic Growth Fund | ||||||||||||||||||
Class A | 0.76 | % | 0.24 | % | 0.39 | % | 1.39 | % | 0.00 | %4 | 1.39 | %4 | ||||||
Class B | 0.76 | % | 0.98 | % | 0.91 | % | 2.65 | % | 0.16 | %4 | 2.49 | %4 | ||||||
Class C | 0.76 | % | 0.99 | % | 0.78 | % | 2.53 | % | 0.03 | %4 | 2.50 | %4 | ||||||
Institutional Class | 0.76 | % | None | 1.49 | % | 2.25 | % | 1.24 | 4 | 1.01 | %4 | |||||||
Mid Cap Growth Fund | ||||||||||||||||||
Class A | 0.65 | % | 0.25 | % | 0.43 | % | 1.33 | % | 0.08 | %5 | 1.25 | %5 | ||||||
Class B | 0.65 | % | 1.00 | % | 0.43 | % | 2.08 | % | 0.08 | %5 | 2.00 | %5 | ||||||
Class C | 0.65 | % | 1.00 | % | 0.43 | % | 2.08 | % | 0.08 | %5 | 2.00 | %5 | ||||||
Institutional Class | 0.65 | % | None | 0.43 | % | 1.08 | % | 0.08 | %5 | 1.00 | %5 | |||||||
Mid Cap Growth Fund (Pro forma combined) | ||||||||||||||||||
Class A | 0.64 | %6 | 0.25 | % | 0.44 | % | 1.33 | % | 0.08 | % | 1.25 | %7 | ||||||
Class B | 0.64 | %6 | 1.00 | % | 0.44 | % | 2.08 | % | 0.08 | % | 2.00 | %7 | ||||||
Class C | 0.64 | %6 | 1.00 | % | 0.44 | % | 2.08 | % | 0.08 | % | 2.00 | %7 | ||||||
Institutional Class | 0.64 | %6 | None | 0.44 | % | 1.08 | % | 0.08 | % | 1.00 | %7 |
| 1 | The redemption of shares purchased at net asset value under the Large Order NAV Purchase Privilege may be subject to a contingent deferred sales charge of 1.00% if redeemed within 12 months of purchase and 0.50% if redeemed within 12 to 18 months following purchase. Please see the applicable Fund’s Prospectus for more details. |
| 2 | Includes a shareholder servicing fee for Class B and C shares of up to 0.25%. |
| 3 | Restated and estimated to reflect the termination of the fixed administrative fee. |
| 4 | Through September 30, 2005, Dynamic Growth Fund’s investment advisor has contractually agreed to waive all or a portion of its management fee and reimburse or pay operating expenses of each Fund to the extent necessary to maintain total operating expenses at 1.50% for Class A, Class B and Class C shares and 1.00% for Institutional Class shares, excluding certain expenses such as Rule 12b-1 and/or service fees, extraordinary expenses, taxes, brokerage, interest and trustee and trustee counsel fees, and organizational and offering expenses. |
| 5 | Through , Mid Cap Growth Fund’s investment advisor and administrator have contractually agreed to waive their fees or reimburse expenses so that total operating expenses will not exceed 1.25% for Class A shares, 2.00% for Class B and C shares and 1.00% for Institutional Class shares. |
6
Table of Contents
| 6 | Subject to Board approval on August 8, 2004. |
| 7 | Through , 2007, Mid Cap Growth Fund’s investment advisor and administrator have contractually agreed to waive their fees or reimburse expenses so that total operating expenses will not exceed 1.00% for Class A, B, C and Institutional Class shares, excluding certain expenses such as Rule 12b-1 and/or service fees, extraordinary expenses, taxes, brokerage, interest and trustee and trustee counsel fees, and organizational and offering expenses. |
The tables are provided to help you understand the expenses of investing in the Funds and your share of the operating expenses that each Fund incurs and that Deutsche Asset Management, Inc. (“DeAM”) expects the combined Fund to incur in the first year following the merger.
Examples
These examples translate the expenses shown in the preceding table into dollar amounts. Based on the costs above, this examples help you compare the costs of investing in the Funds. The examples make certain assumptions. They assume that the expenses above remain the same. They also assume that you invest $10,000 in a Fund, earned 5% annual returns, and reinvested all dividends and distributions. This is only an example; actual expenses will be different.
| 1 Year | 3 Years | 5 Years | 10 Years | |||||||||
Dynamic Growth Fund | ||||||||||||
Class A | $ | 708 | $ | 989 | $ | 1,291 | $ | 2,146 | ||||
Class B* 1 | $ | 652 | $ | 1,108 | $ | 1,591 | $ | 2,380 | ||||
Class C* 1 | $ | 353 | $ | 783 | $ | 1,341 | $ | 2,859 | ||||
Institutional Class 1 | $ | 103 | $ | 584 | $ | 1,091 | $ | 2,488 | ||||
Class B** 1 | $ | 252 | $ | 808 | $ | 1,391 | $ | 2,380 | ||||
Class C** 1 | $ | 253 | $ | 783 | $ | 1,341 | $ | 2,859 | ||||
Mid Cap Growth Fund | ||||||||||||
Class A 1 | $ | 695 | $ | 966 | $ | 1,257 | $ | 2,083 | ||||
Class B* 1 | $ | 603 | $ | 945 | $ | 1,313 | $ | 2,041 | ||||
Class C* 1 | $ | 303 | $ | 645 | $ | 1,113 | $ | 2,409 | ||||
Institutional Class 1 | $ | 102 | $ | 337 | $ | 590 | $ | 1,315 | ||||
Class B** 1 | $ | 203 | $ | 645 | $ | 1,113 | $ | 2,041 | ||||
Class C** 1 | $ | 203 | $ | 645 | $ | 1,113 | $ | 2,409 | ||||
Mid Cap Growth Fund (Pro forma combined) | ||||||||||||
Class A 2 | �� | $ | 695 | $ | 950 | $ | 1,240 | $ | 2,065 | |||
Class B* 2 | $ | 603 | $ | 928 | $ | 1,296 | $ | 2,023 | ||||
Class C* 2 | $ | 303 | $ | 628 | $ | 1,096 | $ | 2,391 | ||||
Institutional Class 2 | $ | 102 | $ | 319 | $ | 572 | $ | 1,297 | ||||
Class B** 2 | $ | 203 | $ | 628 | $ | 1,096 | $ | 2,023 | ||||
Class C** 2 | $ | 203 | $ | 628 | $ | 1,096 | $ | 2,391 | ||||
| (1) | Includes one year of capped expenses in each period. |
| (2) | Includes three years of capped expenses in each period. |
| * | Assumes you sold your shares at the end of each period. |
| ** | Assumes you kept your shares. |
7
Table of Contents
What are the federal income tax consequences of the proposed merger?
For federal income tax purposes, generally no gain or loss is expected to be recognized by Dynamic Growth Fund or its shareholders as a direct result of the merger. For a discussion of taxes that you may incur indirectly as a result of the merger (e.g., due to differences in the Funds’ portfolio turnover rates and net investment income), please see “Information about the Proposed Merger — Federal Income Tax Consequences” below.
Will my dividends be affected by the merger?
The merger will not result in a change in dividend policy.
Do the procedures for purchasing, redeeming and exchanging shares of the two Funds differ?
The procedures for purchasing and redeeming Class A, B and C shares of each Fund, and for exchanging shares of each Fund for shares of other Scudder funds, are identical. The investment minimum for Mid Cap Growth Fund’s Institutional Class shares is $1 million. This investment minimum will be waived for all existing Dynamic Growth Fund Institutional Class shareholders. Institutional Class shareholders of Dynamic Growth Fund may only exchange their shares for (i) shares of Scudder Money Funds—Scudder Money Market Fund if they have purchased shares because they are participants in tax-exempt retirement plans of DeIM and its affiliates and (ii) Institutional Class shares of other Scudder funds, while Institutional Class shareholders of Mid Cap Growth Fund do not have these restrictions on exchanges.
How will I be notified of the outcome of the merger?
If the proposed merger is approved by shareholders, you will receive confirmation after the reorganization is completed, indicating your new account number, the number of Merger Shares you are receiving and the procedures for surrendering your certificates, if you have any. Otherwise, you will be notified in the next annual report of Dynamic Growth Fund.
Will the number of shares I own change?
The number of shares you own will most likely change, but the total value of the shares of Mid Cap Growth Fund you receive will equal the total value of the shares of
8
Table of Contents
Dynamic Growth Fund that you hold at the time of the merger. Even though the net asset value per share of each Fund is likely to be different, the total value of each shareholder’s holdings will not change as a result of the merger.
What percentage of shareholders’ votes is required to approve the merger?
Approval of the merger will require the “yes” vote of the holders of a majority of the outstanding shares of Dynamic Growth Fund.
The Trustees of the Trust believe that the proposed merger is in the best interests of Dynamic Growth Fund. Accordingly, the Trustees [unanimously] recommend that shareholders vote “FOR” approval of the proposed merger.
INVESTMENT STRATEGIES AND RISK FACTORS
What are the main investment strategies and related risks of Dynamic Growth Fund and how do they compare with those of Mid Cap Growth Fund?
Investment Objectives and Strategies. Dynamic Growth Fund and Mid Cap Growth Fund have similar investment objectives, policies and restrictions. Both Funds are managed by the same lead portfolio manager and have two other portfolio managers in common. The investment goal of Dynamic Growth Fund is maximum appreciation on investors’ capital. To pursue its investment goal, under normal market conditions, Dynamic Growth Fund invests at least 65% of its total assets in stocks whose market capitalizations are $8.5 billion or less. Dynamic Growth Fund seeks to invest in small to medium-sized companies that may benefit from technological advances, new marketing methods and economic and demographic changes.
The investment goal of Mid Cap Growth Fund is long-term capital growth. To pursue its investment goal, under normal market conditions, Mid Cap Growth Fund invests at least 80% of its total assets, determined at the time of purchase, in companies with market caps within the market capitalization range of the Russell Mid Cap Growth Index or securities with equity characteristics that provide exposure to those companies. Mid Cap Growth Fund invests primarily in equity securities of medium-sized growth-oriented companies.
The Funds have each adopted certain fundamental and non-fundamental investment policies. Each Fund has substantially similar investment policies. Each Fund may invest in foreign securities. Dynamic Growth Fund may invest up to 25% of its total assets in foreign securities, but Mid Cap Growth may only invest up to 20% of its total assets in foreign securities.
The most significant difference in the way the Funds are managed is that Mid Cap Growth Fund is required to invest at least 80% of its assets in mid cap companies, while Dynamic Growth Fund may invest in both small and mid cap companies as long as at least 65% of its assets are invested in stocks whose market capitalizations are $8.5 billion or less.
For a more detailed description of the investment techniques used by the Dynamic Growth Fund and the Mid Cap Growth Fund, please see each Fund’s Prospectus and SAI.
9
Table of Contents
Primary Risks.
Mid Cap Growth Fund
As with any stock mutual fund, you may lose money by investing in Mid Cap Growth Fund. Certain risks associated with an investment in Mid Cap Growth Fund are summarized below. Subject to limited exceptions, the risks of an investment in Mid Cap Growth Fund are substantially similar to the risks of an investment in Dynamic Growth Fund. More detailed descriptions of the risks associated with an investment in Mid Cap Growth Fund can be found in the Fund’s Prospectus and SAI.
The value of your investment in Mid Cap Growth Fund will change with changes in the values of the investments held by Mid Cap Growth Fund. A wide array of factors can affect those values. In this summary, we describe the principal risks that may affect Mid Cap Growth Fund’s investments as a whole. Mid Cap Growth Fund could be subject to additional principal risks because the types of investments it makes can change over time.
There are several risk factors that could hurt Mid Cap Growth Fund’s performance, cause you to lose money or cause Mid Cap Growth Fund’s performance to trail that of other investments.
Stock Market Risk. As with most stock funds, one of the most important factors with Mid Cap Growth Fund is how stock markets perform – in this case, the medium-sized capitalization portion of the US stock market. When stock prices fall, you should expect the value of your investment to fall as well. Because a stock represents ownership in its issuer, stock prices can be hurt by poor management, shrinking product demand and other business risks. These may affect single companies as well as groups of companies. In addition, movements in financial markets may adversely affect a stock’s price regardless of how well the company performs. The market as a whole may not favor the types of investments the Fund makes and the Fund may not be able to get an attractive price for them.
Security Selection Risk. A risk that pervades all investing is the risk that the securities the managers have selected will not perform to expectations. The managers could be incorrect in their analysis of companies, sectors, economic trends or other matters.
Medium-Sized Company Risk. Medium-sized company stocks tend to experience steeper price fluctuations—down as well as up—than stocks of larger companies. A shortage of reliable information—the same information gap that creates opportunity—can also pose added risk. Industry-wide reversals may have a greater impact on medium-sized companies, since they lack a large company’s financial resources. Medium-sized company stocks are typically less liquid than large company stocks: when things are going poorly, it is harder to find a buyer for a medium-sized company’s shares.
Foreign Securities Risk. Foreign securities may be more volatile than their US counterparts, for reasons such as currency fluctuations and political and economic uncertainty.
10
Table of Contents
Pricing Risk. At times, market conditions might make it hard to value some investments. For example, if the Fund has valued its securities too highly, you may end up paying too much for Fund shares when you buy into the Fund. If the Fund underestimates the prices of its securities, you may not receive the full value for your Fund shares when you sell.
Securities Lending Risk. Any loss in the market price of securities loaned by the Fund that occurs during the term of the loan would be borne by the Fund and would adversely affect the Fund’s performance. Also, there may be delays in recovery of securities loaned or even a loss of rights in the collateral should the borrower of the securities fail financially while the loan is outstanding. However, loans will be made only to borrowers selected by the Fund’s delegate after a review of relevant facts and circumstances, including the creditworthiness of the borrower.
Another factor that could affect performance:
| • | derivatives risk—derivatives could produce disproportionate losses due to a variety of factors, including the unwillingness or inability of the counterparty to meet its obligations or unexpected price as interest rate movements. |
Dynamic Growth Fund
In addition to stock market risk described above, Dynamic Growth Fund also has as its principal risk factors growth investing risk and industry risk.
Growth Investing Risk. Since growth companies usually reinvest a large portion of earnings in their own businesses, growth stocks may lack the dividends associated with value stocks that might otherwise cushion their decline in a falling market. Earnings disappointments in growth stocks often result in sharp price declines because investors buy these stocks because of their potential for superior earnings growth. Growth stocks may also be out of favor for certain periods in relation to value stocks.
Industry Risk. While the Fund does not concentrate in any industry, to the extent that the Fund has exposure to a given industry or sector, any factors affecting that industry or sector could affect the value of portfolio securities. For example, manufacturers of consumer goods could be hurt by a rise in unemployment, or technology companies could be hurt by such factors as market saturation, price competition and rapid obsolescence.
Other factors that could affect the Fund’s performance include:
| • | the managers could be incorrect in their analysis of industries, companies, economic trends, the relative attractiveness of different sizes of stocks, geographical trends or other factors |
| • | foreign securities risk (see above) |
| • | derivatives risk (see above) |
Performance Information. The following information provides some indication of the risks of investing in the Funds. The bar charts show year-to-year changes in Fund performance. The table following the charts compares the Funds’ performance to each other’s and to that of a broad measure of market performance.
11
Table of Contents
The bar charts show how the performance for each Fund’s Class A shares has varied from year to year, which may give some idea of risk. The bar charts do not reflect sales loads; if they did, total returns would be lower. The table shows how each Fund’s performance compares with a broad-based market index (which, unlike a Fund, does not have any fees or expenses). The performance of the Dynamic Growth Fund is compared to the Russell Mid Cap Growth Index and the performance of the Mid Cap Growth Fund is compared to the S&P Mid Cap 400 Index and to the Russell Mid Cap Growth Index. The table includes the effects of maximum sales loads. The performance of the Funds and the indexes varies over time. All figures assume reinvestment of dividends and distributions (in the case of after-tax returns, reinvested net of assumed tax rates.) For Mid Cap Growth Fund, the inception date for Class A, B and C shares was June 28, 2002. The performance figures for Class A, B and C shares before their inception date are based on the historical performance of the fund’s original share class (Investment Class), adjusted to reflect both the higher gross total annual operating expenses and current applicable sales charges of Classes A, B and C. For Dynamic Growth Fund, the inception date for Class B and C shares is May 31, 1994. Performance figures for periods prior to that date are based on the historical performance of the Fund’s original share class (Class A), adjusted to reflect the higher gross total annual operating expenses and the current applicable sales charges of Classes B and C. The table shows returns on a before-tax and after-tax basis. After-tax returns are shown for Class A only and will vary for other classes. After-tax returns are calculated using the historical highest individual federal marginal income tax rates and do not reflect the impact of state and local taxes. Actual after-tax returns depend on an investor’s situation and may differ from those shown in the table.
Calendar Year Total Returns for Class A Shares
Dynamic Growth Fund*
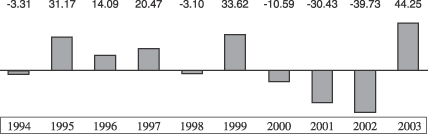
| * | On October 15, 2001, the fund changed its name from Scudder Small Capitalization Equity Fund to Scudder Dynamic Growth Fund. At the same time, the fund changed its investment strategy to invest at least 65% of total assets in companies whose market capitalizations are $8.5 billion or less. Previously, the fund invested at least 65% of total assets in small capitalization stocks similar in size to those comprising the Russell 2000 Index. Consequently, the fund’s performance prior to that date may have been different if the current investment strategy had been in place. |
For the periods included in the chart:
Best Quarter: 32.09%; Q4 1999
Worst Quarter: –32.96%, Q3 2001
12
Table of Contents
Mid Cap Growth Fund
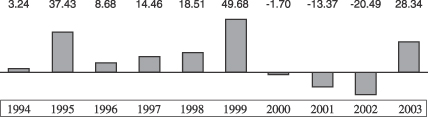
For the periods included in the chart:
Best Quarter: 29.95%; Q4 1999
Worst Quarter: –19.58%, Q3 1998
Class A year-to-date performance through June 30, 2004 was -1.84% for Dynamic Growth Fund and 0.48% for Mid Cap Growth Fund.
Average Annual Total Returns (for periods ending 12/31/03)
| 1 year | 5 years | 10 years or since inception* | |||||||
Dynamic Growth Fund | |||||||||
Class A (Return before Taxes) | 35.95 | % | –7.39 | % | 1.41 | % | |||
Class A (Return after Taxes on Distributions) | 35.95 | % | –8.57 | % | –0.74 | % | |||
Class A (Return after Taxes on Distributions and Sale of Fund Shares) | 23.37 | % | –6.11 | % | 0.57 | % | |||
Class B (Return before Taxes) | 40.08 | % | –7.41 | % | 0.89 | % | |||
Class C (Return before Taxes) | 43.00 | % | –7.00 | % | 1.12 | % | |||
Institutional Class | 44.96 | % | –5.78 | % | 1.54 | % | |||
Index** (Reflects no deductions for fees, expenses or taxes) | 42.71 | % | 2.01 | % | 9.40 | % | |||
Mid Cap Growth Fund | |||||||||
Class A (Return before Taxes) | 20.96 | % | 4.16 | % | 9.87 | % | |||
Class A (Return after Taxes on Distributions) | 20.96 | % | –4.06 | % | –2.05 | % | |||
Class A (Return after Taxes on Distributions and Sale of Fund Shares) | 11.61 | % | –3.98 | % | –2.16 | % | |||
Class B (Return before Taxes) | 24.42 | % | 4.26 | % | 9.47 | % | |||
Class C (Return before Taxes) | 27.42 | % | 4.43 | % | 9.47 | % | |||
Institutional Class (Return before Taxes)*** | 28.67 | % | 5.66 | % | 10.82 | % | |||
Index**** (Reflects no deductions for fees, | 35.62 | % | 9.21 | % | 13.93 | % | |||
Index** (Reflects no deductions for fees, | 42.71 | % | 2.01 | % | 9.40 | % |
| * | Institutional Class of Dynamic Growth Fund commenced operations on July 3, 1995. Index comparison begins on June 20, 1995. Institutional Class shares are not subject to a sales charge. |
13
Table of Contents
| ** | The Russell Mid Cap Growth Index is an unmanaged capitalization-weighted index of medium and medium/small companies in the Russell Index chosen for their growth orientation. Effective on or about August 20, 2004, the Russell Mid Cap Growth Index replaced the S&P Mid Cap 400 Index as Mid Cap Growth Fund’s benchmark index because the advisor believes that it is more appropriate to measure the fund’s performance against the Russell Mid Cap Growth Index as it more accurately reflects the fund’s investment strategy. |
| *** | As of the close of business on August 31, 2000, Scudder Equity Appreciation Fund—Institutional Class became Scudder Mid Cap Fund—Institutional Class. Scudder Equity Appreciation Fund—Institutional Class was managed by the same investment management team with the same objective, policies and strategies as Scudder Mid Cap Fund. Performance for the period prior to August 31, 2000 reflects the performance of Scudder Equity Appreciation Fund—Institutional Class. |
| **** | The S&P Mid Cap 400 Index is an unmanaged index that tracks the stock movement of 400 mid-sized companies. |
Current performance may be higher or lower than the performance data quoted above. For more recent performance information, call your financial representative or call (800) 621-1048 or visit the Scudder website at www.scudder.com.
14
Table of Contents
Capitalization. The following table shows the capitalization of each Fund as of March 31, 2004, and of the Mid Cap Growth Fund on a pro forma combined basis, giving effect to the proposed acquisition of assets at net asset value as of that date1:
| (Unaudited) | |||||||||||||
| Scudder Mid Cap Growth Fund | Scudder Dynamic Growth Fund | Pro Forma Adjustments | Pro Forma Combined | ||||||||||
Net Assets | |||||||||||||
Class A | $ | 251,208,765 | $ | 223,858,184 | $ | $ | 475,066,949 | ||||||
Class B | 9,098,577 | 32,679,806 | 41,778,383 | ||||||||||
Class C | 7,617,266 | 10,617,849 | 18,235,115 | ||||||||||
Class I2 | — | 240,120 | (240,120 | ) | — | ||||||||
Investment Class | 43,174,425 | — | 43,174,425 | ||||||||||
Class R | 319,093 | — | 319,093 | ||||||||||
Institutional Class | 358,692,630 | — | 240,120 | 358,932,750 | |||||||||
Total Net Assets | $ | 670,110,756 | $ | 267,395,959 | $ | — | $ | 937,506,715 | |||||
Shares Outstanding | |||||||||||||
Class A | 19,937,440 | 68,926,673 | (51,160,150 | ) | 37,703,963 | ||||||||
Class B | 731,900 | 11,775,386 | (9,146,279 | ) | 3,361,007 | ||||||||
Class C | 612,778 | 3,740,624 | (2,886,412 | ) | 1,466,990 | ||||||||
Class I | — | 69,730 | (69,730 | ) | — | ||||||||
Investment Class | 3,425,192 | — | 3,425,192 | ||||||||||
Class R | 25,349 | — | 25,349 | ||||||||||
Institutional Class | 28,202,197 | — | 18,877 | 28,221,074 | |||||||||
Net Asset Value per Share | |||||||||||||
Class A | $ | 12.60 | $ | 3.25 | $ | 12.60 | |||||||
Class B | $ | 12.43 | $ | 2.78 | $ | 12.43 | |||||||
Class C | $ | 12.43 | $ | 2.84 | $ | 12.43 | |||||||
Class I | $ | — | $ | 3.44 | $ | — | |||||||
Investment Class | $ | 12.60 | $ | — | $ | 12.60 | |||||||
Class R | $ | 12.59 | $ | — | $ | 12.59 | |||||||
Institutional Class | $ | 12.72 | $ | — | $ | 12.72 | |||||||
| 1) | Assumes the Reorganization had been consummated on March 31, 2004, and is for information purposes only. No assurance can be given as to how many shares of the Scudder Mid Cap Growth Fund will be received by the shareholders of the Scudder Dynamic Growth Fund on the date the Reorganization takes place, and the foregoing should not be relied upon to reflect the number of shares of the Scudder Mid Cap Growth Fund that actually will be received on or after such date. |
| 2) | The “Class I” shares of Dynamic Growth Fund were renamed “Institutional Class” shares on August 13, 2004. |
Unaudited pro forma combined financial statements of the Funds as of March 31, 2004, and for the twelve-month period then ended, are included in the Merger SAI. Because the Agreement provides that Mid Cap Growth Fund will be the surviving Fund following the merger and because Mid Cap Growth Fund’s investment objective and policies will remain unchanged, the pro forma combining financial statements reflect the transfer of the assets and liabilities of Dynamic Growth Fund to Mid Cap Growth
15
Table of Contents
Fund as contemplated by the Agreement and Plan of Reorganization between the Funds, dated as of , 2004 (the “Agreement”).
OTHER COMPARISONS BETWEEN THE FUNDS
Investment advisors. DeAM is the investment advisor for Mid Cap Growth Fund and DeIM is the investment advisor for Dynamic Growth Fund. Each advisor makes investment decisions for the applicable Fund, buys and sells securities for the Fund and conducts the research that leads to the purchase and sale decisions. Each advisor is a wholly owned subsidiary of Deutsche Bank AG. Deutsche Bank AG is a major global banking institution that is engaged in a wide range of financial services, including investment management, mutual fund, retail, private and commercial banking, investment banking and insurance. The Funds have the same lead portfolio manager and two other portfolio managers in common.
The management fee for Dynamic Growth Fund is performance-based and payable at an annual rate of 0.65% of average daily net assets. The fee is then adjusted upward or downward by a maximum of 0.30% based upon the performance of the Fund’s Class A shares of beneficial interest compared with the performance of the S&P 500 Stock Index. The total adjusted fee on an annual basis can range from 0.35% to 0.95% of average daily net assets. The management fee for Mid Cap Growth Fund is 0.65% of average daily net assets on the first $500 million in assets, 0.625% of average daily net assets on the next $1 billion in assets, 0.60% of average daily net assets on the next $1 billion in assets, 0.55% of average daily net assets on the next $10 billion in assets and 0.51% of average daily net assets on assets exceeding $12.5 billion. Mid Cap Growth Fund’s management fee does not include any adjustments based on performance. If the merger is approved, the resulting management fee will not have a performance fee adjustment.
Distribution and Service Fees. Pursuant to separate Underwriting and Distribution Services Agreements, Scudder Distributors, Inc. (“SDI”), 222 South Riverside Plaza, Chicago, Illinois 60606, an affiliate of each Fund’s investment advisor, is the principal underwriter and distributor for the Class A, Class B and Class C shares of each Fund and acts as agent of each Fund in the continuing offer of such shares. Mid Cap Growth Fund has adopted distribution plans on behalf of the Class A, B and C shares in accordance with Rule 12b-1 under the Investment Company Act of 1940, as amended (the “1940 Act”), that are substantially similar to the distribution plans for Class B and C shares, and the service plan for Class A shares of Dynamic Growth Fund.
Pursuant to the Services Agreement with Mid Cap Growth Fund, which is substantially identical to the services agreement for Class B and C shares of Dynamic Growth Fund, SDI receives a shareholder services fee of up to 0.25% per year with respect to the Class A, B and C shares of Mid Cap Growth Fund. SDI uses the fee to compensate financial services firms for providing personal services and maintaining accounts for their customers that hold these classes of shares of Mid Cap Growth Fund, and may retain any portion of the fee not paid to such firms to compensate itself for administrative functions performed for the Fund. All amounts are payable monthly and are based on the average daily net assets of each Fund attributable to the relevant class of shares. Mid Cap Growth Fund’s 12b-1 and service fee structure will remain in effect following the merger.
16
Table of Contents
Trustees and Officers. The Trustees of the Trust are different from those of Scudder Advisor Funds, of which Mid Cap Growth Fund is a series. As described in the Mid Cap Growth Fund’s SAI, which is available upon request, the following individuals comprise the Board of Trustees of Scudder Advisor Funds:
Richard R. Burt
S. Leland Dill
Martin J. Gruber
Joseph R. Hardiman
Richard J. Herring
Graham E. Jones
Rebecca W. Rimel
Philip Saunders, Jr.
William N. Searcy
Robert H. Wadsworth
In addition, certain officers of Dynamic Growth Fund are different from those of Mid Cap Growth Fund.
Service Providers. State Street Bank and Trust Company (“SSB”) serves as the custodian for both Funds. Scudder Investments Service Company (“SISC”) serves as transfer agent for Mid Cap Growth, and although SSB serves as Dynamic Growth Fund’s transfer agent, SSB has contracted with SISC to perform all of SSB’s duties as transfer agent. The Investment Company Capital Corporation is the administrator for Mid Cap Growth Fund, while SDI serves as the administrator for Dynamic Growth Fund. Dynamic Growth Fund’s Independent Registered Public Accounting Firm is Ernst & Young LLP and Mid Cap Growth Fund’s Independent Registered Public Accounting Firm is PricewaterhouseCoopers LLP.
Fund Accounting Fees. For Mid Cap Growth Fund, the fund accounting fees are paid by the administrator from the fees collected in the administration fee. For Dynamic Growth Fund, its advisor pays the fund accounting costs from fees collected in the management fee. If the merger is approved, fund accounting fees will continue to be paid by the administrator out of fees collected from the administration fee.
Charter Documents. Each Fund is a series of a Massachusetts business trust. There are no significant differences between the Fund’s organizational documents with respect to the rights of shareholders contained therein.
INFORMATION ABOUT THE PROPOSED MERGER
General. The shareholders of Dynamic Growth Fund are being asked to approve a merger between Dynamic Growth Fund and Mid Cap Growth Fund pursuant to the Agreement, a copy of which is attached to this Prospectus/Proxy Statement as Appendix A.
The merger is structured as a transfer of all of the assets of Dynamic Growth Fund to Mid Cap Growth Fund in exchange for the assumption by Mid Cap Growth Fund of all of the liabilities of Dynamic Growth Fund and for the issuance and delivery to Dynamic Growth Fund of Merger Shares of Mid Cap Growth Fund equal in aggregate value to the net value of the assets transferred to Mid Cap Growth Fund.
17
Table of Contents
After receipt of the Merger Shares, Dynamic Growth Fund will distribute them to its shareholders, in proportion to their existing shareholdings, in complete liquidation of Dynamic Growth Fund, and the legal existence of Dynamic Growth Fund as a series and as a trust will be terminated. Each shareholder of Dynamic Growth Fund will receive a number of full and fractional Merger Shares of the same class(es) as, and equal in value at the date of the exchange to the aggregate value of, the shareholder’s Dynamic Growth Fund shares.
Prior to the date of the transfer, Dynamic Growth Fund will declare a distribution to shareholders which, together with all previous distributions, will have the effect of distributing to shareholders all of its investment company income (computed without regard to the deduction for dividends paid) and net realized capital gains, if any, through the date of the transfer.
The Trustees of the Trust have voted [unanimously] to approve the Agreement and the proposed merger and to recommend that shareholders also approve the merger. The actions contemplated by the Agreement and the related matters described therein will be consummated only if approved by the affirmative vote of a majority of the outstanding voting securities of Dynamic Growth Fund.
In the event that the merger does not receive the required shareholder approval, Dynamic Growth Fund will continue to be managed as a separate Fund in accordance with its current investment objective and policies, and the Trustees of the Trust may consider such alternatives as may be in the best interests of the Fund’s shareholders.
Background and Trustees’ Considerations Relating to the Proposed Merger. Deutsche Asset Management discussed the proposed merger with the Trustees of the Trust at a meeting held on February 13, 2004. The merger was presented to the Trustees and considered by them as part of a broader program initiated by Deutsche Asset Management to consolidate its mutual fund lineup. This initiative includes the following major components:
| (i) | The merger of selected funds within the Scudder fund family having similar investment objectives and policies; |
| (ii) | The liquidation of certain small funds which have not achieved market acceptance and which are unlikely to reach an efficient operating size; and |
| (iii) | The creation of new classes of shares of each fund into which a Scudder fund is merging in order to allow current Scudder fund shareholders to continue holding a class of shares with similar rights, privileges and expense structures as they currently possess. |
The Trustees of the Trust, including all Trustees who are not “interested persons” of the Fund (as defined by the 1940 Act), conducted a thorough review of the potential implications of this program for Dynamic Growth Fund as well as the various other funds for which they serve as trustees or directors. They were assisted in this review by their independent legal counsel. Following the February 13, 2004 meeting, the Trustees met on several occasions to review and discuss this program both among themselves and with representatives of Deutsche Asset Management. In the course of their review, the Trustees requested and received substantial additional information and suggested numerous changes to Deutsche Asset Management’s program, many of which were accepted.
18
Table of Contents
Following the conclusion of this process, the Trustees of the Trust, the independent trustees/directors of other funds involved and Deutsche Asset Management reached general agreement on the elements of a restructuring plan as it affects shareholders of various funds and, where required, agreed to submit elements of the plan for approval to shareholders of those funds.
[On August , 2004, the Trustees of the Trust, including [all] Trustees who are not “interested persons” of the Fund (as defined by the 1940 Act), approved the terms of the merger. The Trustees also [unanimously] agreed to recommend that the merger be approved by the Fund’s shareholders. In making this determination, the Trustees examined all factors that they considered relevant, including information regarding comparative expense ratios, management fees and the tax consequences of the merger to Dynamic Growth Fund and its shareholders.
In determining to recommend that the shareholders of Dynamic Growth Fund approve the merger, the Trustees considered, among other factors: (a) the fees and expense ratios of the Funds, including comparisons between the expenses of Dynamic Growth Fund and the estimated operating expense ratio of the combined Fund, and between the estimated operating expense ratio of the combined Fund and other mutual funds with similar investment objectives, and in particular noted that the combined Fund’s total operating expense ratio was anticipated to be lower than that of Dynamic Growth Fund currently; (b) the terms and conditions of the merger and whether the merger would result in the dilution of shareholder interests; (c) the compatibility of Dynamic Growth Fund’s and Mid Cap Growth Fund’s investment objectives, policies, restrictions and portfolios; (d) that the service features available to shareholders of each Fund were identical on a class level; (e) the costs to be borne by the combined Fund and DeAM as a result of the merger, and in particular that DeAM would bear all costs of the merger; (f) prospects for the combined Fund to attract additional assets; (g) the tax consequences of the merger on Dynamic Growth Fund and its shareholders and, in particular, that the merger would be a tax-free reorganization; and (h) the respective investment performances of the two Funds.
The Trustees also gave consideration to possible economies of scale that might be realized from the merger. The Trustees considered the impact of the merger on the total expenses to be borne by shareholders of Dynamic Growth Fund. The Trustees also considered that the merger would permit the shareholders of Dynamic Growth Fund to continue to pursue similar investment goals in a larger fund.
The Trustees also considered that the Dynamic Growth Fund has a management fee with a performance fee adjustment and that the Mid Cap Growth Fund does not. The Trustees noted that currently the base management fee for the Dynamic Growth Fund is the same as the current management fee for the Mid Cap Growth Fund, but that DeAM had agreed to add break-points to the management fee schedule of the Mid Cap Growth Fund for the two years following the merger. The Trustees also noted that the combined Fund will have a management fee with the same base as that of the Dynamic Growth Fund but that the management fee rate of the combined Fund will decline as assets of the Fund grow. Accordingly, the Trustees noted that while the Dynamic Growth Fund’s management fee decreased when the Dynamic Growth Fund underperformed the S&P 500 Stock Index, the combined Fund’s management fee will decrease as assets grow. The Trustees considered that the management fee of the combined Fund will generally be the same as that of the Dynamic Growth Fund when the Fund performs in line with
19
Table of Contents
the S&P 500 Stock Index. However, assuming the current level of assets of the combined Fund, the management fee of the combined Fund will generally be lower than that of the Dynamic Growth Fund when the Fund outperforms the S&P 500 Stock Index and will generally be higher than that of the Dynamic Growth Fund when the Fund underperforms the S&P 500 Stock Index.
The Trustees also considered the potential tax consequences to shareholders as a result of differences in the Funds’ realized or unrealized capital gains or losses and capital loss carry-forwards. Although the merger will be achieved on a federally tax-free basis (see “Federal Income Tax Consequences”), there are differences in the Funds’ unrealized gains or losses, tax loss carryovers and portfolio turnover rates which may affect the timing and amount of any future capital gain distributions paid to shareholders.
6/30/04 Gain (Loss) | 6/30/04 Unrealized Gain (Loss) as % of 6/30/04 Net Assets | 6/30/04 Loss Carryovers | 6/30/04 Loss Carryovers as % of 6/30/04 Net Assets | 6/30/04 Portfolio Turnover Rate | ||||||||||
Dynamic Growth Fund | $ | 35,424,782 | 14 | % | $ | 318,660,000 | 11 | % | % | |||||
Mid Cap Growth Fund | $ | 112,258,164 | 17 | % | $ | 70,496,000 | 127 | % | % | |||||
The Dynamic Growth Fund’s capital loss carryovers are larger than the Fund, and the Fund is losing assets, thus making it unlikely that the Fund’s carryovers will be able to be used in their entirety before they expire. To the extent it is prudent from an investment perspective, DeAM intends to realize gains in the Dynamic Growth Fund prior to the merger and apply capital loss carryovers against them for the benefit of current shareholders.
After the merger, the Dynamic Growth Fund’s capital loss carryovers will be available to Mid Cap Growth Fund to offset its capital gains, although the amount of these losses which may offset Mid Cap Growth Fund’s capital gains in any given year may be limited. As a result of this limitation, it is possible that Mid Cap Growth Fund may not be able to use these losses as rapidly as the Dynamic Growth Fund might have, and part or all of these losses may not be usable at all. The ability of Mid Cap Growth Fund or the Dynamic Growth Fund to absorb losses in the future depends on a variety of factors that cannot be known in advance, including the existence of capital gains against which these losses may be offset. Net capital losses of regulated investment companies generally expire at the end of the eighth taxable year after they arise, if not previously absorbed by that time; therefore, it is possible that some or all of these losses will expire unused. In addition, the benefits of any capital loss carryovers currently are available only to the shareholders of each Fund respectively. After the merger, however, these benefits will inure to all the shareholders of Mid Cap Growth Fund.
The Trustees considered the possibility that shareholders of the Dynamic Growth Fund in taxable accounts could incur indirect costs as a result of future capital gain distributions or the loss of current tax loss carryovers (shareholders in tax deferred retirement accounts are not affected). They concluded that such future tax
20
Table of Contents
consequences are not quantifiable or predictable due to uncertainties as to the amount of any actual future realization of capital gains or losses in view of future changes in portfolio values, and the differing consequences of future capital gain distributions to each shareholder whose tax liability (if any) is determined by the net effect of a multitude of considerations that are individual to that shareholder. Shareholders should, however, review their own tax situation to determine what potential effect, if any, the tax differences shown above may have on them.
Based on all of the foregoing, the Trustees concluded that Dynamic Growth Fund’s participation in the merger would be in the best interests of the Fund and would not dilute the interests of the Fund’s existing shareholders. The Trustees of the Trust, including the Trustees who are not “interested persons” of the Fund (as defined in the 1940 Act), [unanimously] recommend that shareholders of the Fund approve the Merger.]
Agreement and Plan of Reorganization. The proposed merger will be governed by the Agreement, a copy of which is attached as Appendix A. The Agreement provides that Scudder Advisor Funds, on behalf of Mid Cap Growth Fund, will acquire all of the assets of Dynamic Growth Fund in exchange for the assumption by Mid Cap Growth Fund of all of the liabilities of Dynamic Growth Fund and for the issuance of Merger Shares equal in value to the value of the transferred assets net of assumed liabilities. The Merger Shares will be issued on the next full business day (the “Exchange Date”) following the time as of which the Funds’ shares are valued for determining net asset value for the merger (4:00 pm, Eastern time, on November 12, 2004, or such other date and time as may be agreed upon by the parties). The following discussion of the Agreement is qualified in its entirety by the full text of the Agreement.
Dynamic Growth Fund will sell all of its assets to Mid Cap Growth Fund, and in exchange Mid Cap Growth Fund will assume all of the liabilities of Dynamic Growth Fund and deliver to Mid Cap Growth Fund a number of full and fractional Merger Shares of each class having an aggregate net asset value equal to the value of the assets of Dynamic Growth Fund attributable to shares of beneficial interest of the corresponding class of Dynamic Growth Fund less the value of the liabilities of Dynamic Growth Fund assumed by Mid Cap Growth Fund attributable to shares of beneficial interest of such class of Dynamic Growth Fund. Immediately following the Exchange Date, Dynamic Growth Fund will distribute pro rata to its shareholders of record as of the close of business on the Exchange Date the full and fractional Merger Shares received by Dynamic Growth Fund, with Merger Shares of each class being distributed to holders of shares of beneficial interest of the corresponding class of Dynamic Growth Fund. This distribution will be accomplished by the establishment of accounts on the share records of Mid Cap Growth Fund in the name of such Dynamic Growth Fund shareholders, each account representing the respective number of full and fractional Merger Shares of each class due the respective shareholder. New certificates for Merger Shares will not be issued.
The Trustees of the Trust and of Scudder Advisor Funds have each determined that the interests of their respective Fund’s shareholders will not be diluted as a result of the transactions contemplated by the Agreement, and the Trustees of the Trust and Scudder Advisor Funds have each determined that the proposed merger is in the best interests of their respective Fund.
21
Table of Contents
The consummation of the merger is subject to the conditions set forth in the Agreement. The Agreement may be terminated and the merger abandoned at any time, before or after approval by the shareholders, prior to the Exchange Date, by mutual consent of Mid Cap Growth Fund and Dynamic Growth Fund or, if any condition set forth in the Agreement has not been fulfilled and has not been waived by the party entitled to its benefits, by such party.
Except for the trading costs associated with the liquidation described above, the fees and expenses for the merger and related transactions are estimated to be $609,841. All fees and expenses (other than trading costs), including legal and accounting expenses, portfolio transfer taxes (if any) or other similar expenses incurred in connection with the consummation of the merger and related transactions contemplated by the Agreement, will be borne by Deutsche Asset Management.
Description of the Merger Shares. Merger Shares will be issued to Dynamic Growth Fund’s shareholders in accordance with the Agreement as described above. The Merger Shares are Class A, Class B, Class C and Institutional Class shares of beneficial interest of Mid Cap Growth Fund. Each class of Merger Shares has the same characteristics as shares of beneficial interest of the corresponding class of Dynamic Growth Fund. Dynamic Growth Fund shareholders receiving Class A Merger Shares will not pay an initial sales charge on such shares of beneficial interest. Your Merger Shares will be subject to a contingent deferred sales charge and/or redemption fee only to the extent that your Dynamic Growth Fund shares of beneficial interest were so subject. In other words, for those classes of shares of beneficial interest subject to a contingent deferred sales charge, your Merger Shares will be treated as having been purchased on the date you purchased your Dynamic Growth Fund shares of beneficial interest and for the price you originally paid. For purposes of determining any automatic conversion date, the Merger Shares will be treated as having been purchased on the date you originally purchased your Dynamic Growth Fund shares of beneficial interest (so that the conversion date of the shares will be unaffected by the merger). For more information on the characteristics of each class of Merger Shares, please see the Mid Cap Growth Fund Prospectus applicable to your class of shares of beneficial interest, a copy of which is included with the mailing of this Prospectus/Proxy Statement.
Under Massachusetts law, shareholders of a Massachusetts business trust could, under certain circumstances, be held personally liable for the obligations of a Fund. Each Trust’s Declaration of Trust, however, disclaims shareholder liability for acts or obligations of the relevant Fund and requires that notice of such disclaimer be given in each agreement, obligation, or instrument entered into or executed by the Fund or the Trust’s Trustees. Moreover, each Declaration of Trust provides for indemnification out of Fund property for all loss and expense of any shareholder held personally liable for the obligations of a Fund, and each Fund will be covered by insurance which the Trustees consider adequate to cover foreseeable tort claims. Thus, the risk of a shareholder incurring financial loss on account of shareholder liability is considered by DeAM remote and not material, since it is limited to circumstances in which a disclaimer is inoperative and the relevant Fund itself is unable to meet its obligations.
Federal Income Tax Consequences. As a condition to each Fund’s obligation to consummate the reorganization, each Fund will receive a tax opinion from Willkie Farr & Gallagher LLP (which opinion would be based on certain factual representations and
22
Table of Contents
certain customary assumptions), to the effect that, on the basis of the existing provisions of the Code, current administrative rules and court decisions, for federal income tax purposes:
| • | The acquisition by Mid Cap Growth Fund of all of the assets of Dynamic Growth Fund solely in exchange for Merger Shares and the assumption by Mid Cap Growth Fund of all of the liabilities of Dynamic Growth Fund, followed by the distribution by Dynamic Growth Fund to its shareholders of Merger Shares in complete liquidation of Dynamic Growth Fund, all pursuant to the Agreement, constitutes a reorganization within the meaning of Section 368(a) of the Code, and Mid Cap Growth Fund and Dynamic Growth Fund will each be a “party to a reorganization” within the meaning of Section 368(b) of the Code. |
| • | Under Section 361 of the Code, dynamic Growth Fund will not recognize gain or loss upon the transfer of its assets to Mid Cap Growth Fund in exchange for Merger Shares and the assumption of the Dynamic Growth Fund liabilities by Mid Cap Growth Fund, and Dynamic Growth Fund will not recognize gain or loss upon the distribution to its shareholders of the Merger Shares in liquidation of Dynamic Growth Fund. |
| • | Under Section 354 of the Code, shareholders of Dynamic Growth Fund will not recognize gain or loss on the receipt of Merger Shares solely in exchange for Dynamic Growth Fund shares. |
| • | Under Section 358 of the Code, the aggregate basis of the Merger Shares received by each shareholder of Dynamic Growth Fund will be the same as the aggregate basis of Dynamic Growth Fund shares exchanged therefor. |
| • | Under Section 1223(1) of the Code, the holding period of the Merger Shares received by each Dynamic Growth Fund shareholder will include the holding period of Dynamic Growth Fund shares exchanged therefor, provided that the Dynamic Growth Fund shareholder held the Dynamic Growth Fund shares at the time of the reorganization as a capital asset. |
| • | Under Section 1032 of the Code, Mid Cap Growth Fund will not recognize gain or loss upon the receipt of assets of Dynamic Growth Fund in exchange for Merger Shares and the assumption by Mid Cap Growth Fund of all of the liabilities of Dynamic Growth Fund. |
| • | Under Section 362(b) of the Code, the basis of the assets of Dynamic Growth Fund transferred to Mid Cap Growth Fund in the reorganization will be the same in the hands of Mid Cap Growth Fund as the basis of such assets in the hands of Dynamic Growth Fund immediately prior to the transfer. |
| • | Under Section 1223(2) of the Code, the holding periods of the assets of Dynamic Growth Fund transferred to Mid Cap Growth Fund in the reorganization in the hands of Mid Cap Growth Fund will include the periods during which such assets were held by Dynamic Growth Fund. |
The portfolio turnover rate for Mid Cap Growth Fund, i.e., the ratio of the lesser of annual sales or purchases to the monthly average value of the portfolio (excluding from both the numerator and the denominator securities with maturities at the time of acquisition of one year or less), for the fiscal year ended September 30, 2003 was 82%. The portfolio turnover rate for Dynamic Growth Fund for the fiscal year ended
23
Table of Contents
September 30, 2003 was 134%. A higher portfolio turnover rate involves greater brokerage and transaction expenses to a fund and may result in the realization of net capital gains, which would be taxable to shareholders when distributed.
Each Fund intends to distribute dividends from its investment company taxable income and net capital gains after utilization of capital loss carryforwards, if any, in December of each year. An additional distribution may be made if necessary. Shareholders of each Fund can have their dividends and distributions automatically invested in additional shares of beneficial interest of the same class of that Fund, or a different fund in the same family of funds, at net asset value and credited to the shareholder’s account on the payment date or, at the shareholder’s election, sent to the shareholder by check. If the Agreement is approved by Dynamic Growth Fund’s shareholders, the Fund will pay its shareholders a distribution of all undistributed net investment company taxable income and undistributed net capital gains immediately prior to the Closing (as defined in the Agreement).
While as noted above, shareholders are not expected to recognize any gain or loss upon the exchange of their shares in the merger, differences in the Funds’ portfolio turnover rates, and net investment income and net realized capital gains may result in future taxable distributions to shareholders arising indirectly from the merger.
The Trustees of the Trust, including the independent Trustees, [unanimously] recommend approval of the merger.
INFORMATION ABOUT VOTING AND THE SHAREHOLDER MEETING
General. This Prospectus/Proxy Statement is furnished in connection with the proposed merger of Dynamic Growth Fund into Mid Cap Growth Fund and the solicitation of proxies by and on behalf of the Trustees of Dynamic Growth Fund for use at the Meeting of Shareholders (the “Meeting”). The Meeting is to be held on November 4, 2004, at 4:00 p.m., Eastern time, at One South Street, Baltimore, MD, or at such later time as is made necessary by adjournment. The Notice of the Meeting, the combined Prospectus/Proxy Statement and the enclosed form of proxy are being mailed to shareholders on or about September , 2004.
As of August 18, 2004, Dynamic Growth Fund had the following shares outstanding:
Share Class | Number of Shares | |
Class A | ||
Class B | ||
Class C | ||
Institutional Class |
The Trustees of the Trust know of no matters other than those set forth herein to be brought before the Meeting. If, however, any other matters properly come before the Meeting, it is the Trustees’ intention that proxies will be voted on such matters in accordance with the judgment of the persons named in the enclosed form of proxy.
Photographic identification is required for admission to the Meeting.
24
Table of Contents
Required Vote. Proxies are being solicited from Dynamic Growth Fund’s shareholders by its Trustees for the Meeting. Unless revoked, all valid proxies will be voted in accordance with the specification thereon or, in the absence of specifications, “FOR” approval of the Agreement. The transactions contemplated by the Agreement will be consummated only if approved by the affirmative vote of the holders of a majority of the outstanding shares of Dynamic Growth Fund. Proxies from Mid Cap Growth Fund’s shareholders are not being solicited because their approval or consent is not necessary for the merger.
Record Date, Quorum and Method of Tabulation. Only shareholders of record of Dynamic Growth Fund at the close of business on August 18, 2004 (the “Record Date”) will be entitled to vote at the Meeting or any adjournment thereof. Each share of beneficial interest is entitled to one vote, with fractional shares voting proportionally.
The holders of at least 30% of the shares of Dynamic Growth Fund outstanding at the close of business on the Record Date present in person or represented by proxy will constitute a quorum for the transaction of business at the Meeting. In the event that the necessary quorum to transact business or the vote required to approve the proposal is not obtained at the Meeting, the persons named as proxies may propose one or more adjournments of the Meeting in accordance with applicable law to permit further solicitation of proxies. Any such adjournment as to a matter will require the affirmative vote of the holders of a majority of Dynamic Growth Fund’s shares present in person or by proxy at the Meeting. The persons named as proxies will vote in favor of any such adjournment those proxies which they are entitled to vote in favor of the proposal and will vote against any such adjournment those proxies to be voted against the proposal.
Votes cast by proxy or in person at the meeting will be counted by persons appointed by Dynamic Growth Fund as tellers for the Meeting. The tellers will count the total number of votes cast “FOR” approval of the proposal for purposes of determining whether sufficient affirmative votes have been cast.
The tellers will count shares represented by proxies that reflect abstentions and “broker non-votes” (i.e., shares held by brokers or nominees as to which (i) instructions have not been received from the beneficial owners or the persons entitled to vote, and (ii) the broker or nominee does not have the discretionary voting power on a particular matter) as shares that are present and entitled to vote on the matter for purposes of determining the presence of a quorum. Abstentions and broker non-votes will therefore have the effect of a negative vote on the proposal. Accordingly, shareholders are urged to forward their voting instructions promptly.
Share Ownership. As of August 18, 2004, the officers and Trustees of each Fund as a group beneficially owned less than 1% of the outstanding shares of such Fund. To the best of the knowledge of Dynamic Growth Fund, the following shareholders owned of record or beneficially 5% or more of the outstanding shares of beneficial interest of any class of Dynamic Growth Fund as of such date:
Class | Shareholder Name and Address | Percentage Owned | ||
Class A | ||||
Class B | ||||
Class C | ||||
Institutional Class |
25
Table of Contents
To the best of the knowledge of Mid Cap Growth Fund, the following shareholders owned beneficially or of record 5% or more of the outstanding shares of beneficial interest of an class of Mid Cap Growth Fund as of such date:
Class | Shareholder Name and Address | Percentage Owned | ||
Class A | ||||
Class B | ||||
Class C | ||||
Class R | ||||
Institutional Class | ||||
Investment Class |
Solicitation of Proxies. In addition to soliciting proxies by mail, certain officers and representatives of Dynamic Growth Fund, officers and employees of DeIM and certain financial services firms and their representatives, who will receive no extra compensation for their services, may solicit proxies by telephone, telegram or personally.
All properly executed proxies received in time for the Meeting will be voted as specified in the proxy or, if no specification is made, in favor of the proposal.
Georgeson Shareholder Communications Inc. (“Georgeson”) has been engaged to assist in the solicitation of proxies, at an estimated cost of up to $77,000. As the Meeting date approaches, certain shareholders of Dynamic Growth Fund may receive a telephone call from a representative of Georgeson if their votes have not yet been received. Authorization to permit Georgeson to execute proxies may be obtained by telephonic or electronically transmitted instructions from shareholders of Dynamic Growth Fund. Proxies that are obtained telephonically will be recorded in accordance with the procedures described below. The Trustees believe that these procedures are reasonably designed to ensure that both the identity of the shareholder casting the vote and the voting instructions of the shareholder are accurately determined.
In all cases where a telephonic proxy is solicited, the Georgeson representative is required to ask for each shareholder’s full name and address, or zip code or employer identification number, or both, and to confirm that the shareholder has received the proxy materials in the mail. If the shareholder is a corporation or other entity, the Georgeson representative is required to ask for the person’s title and confirmation that the person is authorized to direct the voting of the shares of beneficial interest. If the information solicited agrees with the information provided to Georgeson, then the Georgeson representative has the responsibility to explain the process, read the proposal on the proxy card, and ask for the shareholder’s instructions on the proposal. Although the Georgeson representative is permitted to answer questions about the process, he or she is not permitted to recommend to the shareholder how to vote, other than to read any recommendation set forth in the Proxy Statement/Prospectus. Georgeson will record the shareholder’s instructions on the card. Within 72 hours, the shareholder will be sent a letter or mailgram to confirm his or her vote and asking the shareholder to call Georgeson immediately if his or her instructions are not correctly reflected in the confirmation.
26
Table of Contents
Shareholders may also provide their voting instructions through telephone touch-tone voting or Internet voting. These options require shareholders to input a control number which is located on each voting instruction card. After inputting this number, shareholders will be prompted to provide their voting instructions on the proposal. Shareholders will have an opportunity to review their voting instructions and make any necessary changes before submitting their voting instructions and terminating their telephone call or Internet link. Shareholders who vote via the Internet, in addition to confirming their voting instructions prior to submission, will also receive an e-mail confirming their instructions upon request.
If a shareholder wishes to participate in the Meeting, but does not wish to give a proxy by telephone or electronically, the shareholder may still submit the proxy card originally sent with the Proxy Statement/Prospectus or attend in person. Should shareholders require additional information regarding the proxy or a replacement proxy card, they may contact Georgeson toll-free at 1-888-288-5518. Any proxy given by a shareholder is revocable until voted at the Meeting.
Revocation of Proxies. Proxies, including proxies given by telephone or over the Internet, may be revoked at any time before they are voted either (i) by a written revocation received by the Secretary of Dynamic Growth Fund, (ii) by properly submitting a later-dated proxy that is received by the Fund at or prior to the Meeting or (iii) by attending the Meeting and voting in person. Merely attending the Meeting without voting, however, will not revoke any previously given proxy.
Adjournment. If sufficient votes in favor of the proposal set forth in the Notice of the Meeting are not received by the time scheduled for the Meeting, the persons named as proxies may propose one or more adjournments of the Meeting for a period or periods of not more than 60 days in the aggregate to permit further solicitation of proxies. Any adjournment will require the affirmative vote of a majority of the votes cast on the question in person or by proxy at the session of the Meeting to be adjourned. The persons named as proxies will vote in favor of such adjournment those proxies which they are entitled to vote in favor of the proposal. They will vote against any such adjournment those proxies required to be voted against the proposal.
27
Table of Contents
REGULATORY AND LITIGATION MATTERS
Since at least July 2003, federal, state and industry regulators have been conducting ongoing inquiries and investigations (“inquiries”) into the mutual fund industry, and have requested information from numerous mutual fund companies, including Scudder Investments/Deutsche Asset Management funds. We are unable to determine what the outcome of these inquiries will be or what the effect, if any, would be on the funds or their advisors. Publicity about mutual fund practices arising from these industry-wide inquiries serve as the general basis of a number of private lawsuits against the Scudder funds/Deutsche Asset Management funds (“Scudder funds”). These lawsuits, which previously have been reported in the press, involve purported class action and derivative lawsuits, making various allegations and naming as defendants various persons, including certain Scudder funds, Deutsche Asset Management and its affiliates, certain individuals, including in some cases fund Trustees, and other parties. Deutsche Asset Management has undertaken to bear all liabilities and expenses incurred by the Scudder funds in connection with these lawsuits, or other lawsuits or regulatory actions that may be filed making allegations similar to these lawsuits regarding fund valuation, market timing, revenue sharing or other subjects of the pending inquiries. Based on currently available information, Deutsche Asset Management believes the likelihood that the pending lawsuits will have a material adverse financial impact on a Scudder fund is remote and such actions are not likely to materially affect its ability to perform under its investment management agreements with the Scudder funds.
28
Table of Contents
EXHIBIT A
FORM OF AGREEMENT AND PLAN OF REORGANIZATION
THIS AGREEMENT AND PLAN OF REORGANIZATION (the “Agreement”) is made as of this [ ] day of [ ], 2004, by and among Scudder Advisor Funds (the “Acquiring Trust”), a Massachusetts business trust, on behalf of Scudder Mid Cap Growth Fund (the “Acquiring Fund”), a separate series of the Acquiring Trust, Scudder Dynamic Growth Fund (the “Acquired Trust” and, together with the Acquiring Trust, each a “Trust” and collectively the “Trusts”), a Massachusetts business trust, on behalf of Scudder Dynamic Growth Fund (the “Acquired Fund” and, together with the Acquiring Fund, each a “Fund” and collectively the “Funds”), the only series of the Acquired Trust, and Deutsche Asset Management, Inc. (“DeAM”), investment adviser to the Acquiring Fund (for purposes of Paragraph 10.2 of the Agreement only). The principal place of business of the Acquiring Trust is One South Street, Baltimore, Maryland 21202. The principal place of business of the Acquired Trust is 222 South Riverside Plaza, Chicago, Illinois 60606.
This Agreement is intended to be and is adopted as a plan of reorganization and liquidation within the meaning of Section 368(a) of the Internal Revenue Code of 1986, as amended (the “Code”). The reorganization (the “Reorganization”) will consist of the transfer of all or substantially all of the assets of the Acquired Fund to the Acquiring Fund in exchange solely for Class A, Class B, Class C and Institutional Class voting shares of beneficial interest ($.01 par value per share) of the Acquiring Fund (the “Acquiring Fund Shares”), the assumption by the Acquiring Fund of all of the liabilities of the Acquired Fund and the distribution of the Acquiring Fund Shares to the Class A, Class B, Class C and Institutional Class shareholders of the Acquired Fund in complete liquidation of the Acquired Fund as provided herein, all upon the terms and conditions hereinafter set forth in this Agreement.
NOW, THEREFORE, in consideration of the premises and of the covenants and agreements hereinafter set forth, the parties hereto covenant and agree as follows:
| 1. | Transfer of Assets of the Acquired Fund to the Acquiring Fund in Consideration For Acquiring Fund Shares, the Assumption of All Acquired Fund Liabilities and the Liquidation of the Acquired Fund |
1.1. Subject to the terms and conditions herein set forth and on the basis of the representations and warranties contained herein, the Acquired Fund agrees to transfer to the Acquiring Fund all or substantially all of the Acquired Fund’s assets as set forth in section 1.2, and the Acquiring Fund agrees in consideration therefor (i) to deliver to the Acquired Fund that number of full and fractional Class A, Class B, Class C and Institutional Class Acquiring Fund Shares determined by dividing the value of the Acquired Fund’s assets net of any liabilities of the Acquired Fund with respect to the Class A, Class B, Class C and Institutional Class shares of the Acquired Fund, computed in the manner and as of the time and date set forth in section 2.1, by the net asset value of one Acquiring Fund Share of the corresponding class, computed in the manner and as of the time and date set forth in section 2.2; and (ii) to assume all of the liabilities of the Acquired Fund, including, but not limited to, any deferred compensation to the Acquired Fund Board members. All Acquiring Fund Shares delivered to the Acquired Fund shall be delivered at net asset value without a sales load, commission or other similar fee being imposed. Such transactions shall take place at the closing provided for in section 3.1 (the “Closing”).
A-1
Table of Contents
1.2. The assets of the Acquired Fund to be acquired by the Acquiring Fund (the “Assets”) shall consist of all assets, including, without limitation, all cash, cash equivalents, securities, commodities and futures interests and dividends or interest or other receivables that are owned by the Acquired Fund and any deferred or prepaid expenses shown on the unaudited statement of assets and liabilities of the Acquired Fund prepared as of the effective time of the Closing in accordance with generally accepted accounting principles (“GAAP”) applied consistently with those of the Acquired Fund’s most recent audited balance sheet. The Assets shall constitute at least 90% of the fair market value of the net assets, and at least 70% of the fair market value of the gross assets, held by the Acquired Fund immediately before the Closing (excluding for these purposes assets used to pay the dividends and other distributions paid pursuant to section 1.4).
1.3. The Acquired Fund will endeavor, to the extent practicable, to discharge all of its liabilities and obligations that are accrued prior to the Closing Date as defined in section 3.1.
1.4. On or as soon as practicable prior to the Closing Date as defined in section 3.1, the Acquired Fund will declare and pay to its shareholders of record one or more dividends and/or other distributions so that it will have distributed substantially all of its investment company taxable income (computed without regard to any deduction for dividends paid) and realized net capital gain, if any, for the current taxable year through the Closing Date.
1.5. Immediately after the transfer of Assets provided for in section 1.1, the Acquired Fund will distribute to the Acquired Fund’s shareholders of record with respect to each class of its shares (the “Acquired Fund Shareholders”), determined as of the Valuation Time (as defined in section 2.1), on a pro rata basis within that class, the Acquiring Fund Shares of the same class received by the Acquired Fund pursuant to section 1.1 and will completely liquidate. Such distribution and liquidation will be accomplished with respect to each class of the Acquired Fund by the transfer of the Acquiring Fund Shares then credited to the account of the Acquired Fund on the books of the Acquiring Fund to open accounts on the share records of the Acquiring Fund in the names of the Acquired Fund Shareholders. The Acquiring Fund shall have no obligation to inquire as to the validity, propriety or correctness of such records, but shall assume that such transaction is valid, proper and correct. The aggregate net asset value of Class A, Class B, Class C and Institutional Class Acquiring Fund Shares to be so credited to the Class A, Class B, Class C and Institutional Class Acquired Fund Shareholders shall, with respect to each class, be equal to the aggregate net asset value of the Acquired Fund shares of the same class owned by such shareholders as of the Valuation Time. All issued and outstanding shares of the Acquired Fund will simultaneously be cancelled on the books of the Acquired Fund, although share certificates representing interests in Class A, Class B, Class C and Institutional Class shares of the Acquired Fund will represent a number of Acquiring Fund Shares after the Closing Date as determined in accordance with section 2.3. The Acquiring Fund will not issue certificates representing Acquiring Fund Shares.
1.6. Ownership of Acquiring Fund Shares will be shown on the books of the Acquiring Fund. Shares of the Acquiring Fund will be issued in the manner described in the Acquiring Fund’s then-current prospectus and statement of additional information.
A-2
Table of Contents
1.7. Any reporting responsibility of the Acquired Fund including, without limitation, the responsibility for filing of regulatory reports, tax returns, or other documents with the Securities and Exchange Commission (the “Commission”), any state securities commission, and any federal, state or local tax authorities or any other relevant regulatory authority, is and shall remain the responsibility of the Acquired Fund.
1.8. All books and records of the Acquired Fund, including all books and records required to be maintained under the Investment Company Act of 1940, as amended (the “1940 Act”), and the rules and regulations thereunder, shall be available to the Acquiring Fund from and after the Closing Date and shall be turned over to the Acquiring Fund as soon as practicable following the Closing Date.
| 2. | Valuation |
2.1. The value of the Assets shall be computed as of the close of regular trading on The New York Stock Exchange, Inc. (the “NYSE”) on the business day immediately preceding the Closing Date, as defined in section 3.1 (the “Valuation Time”) after the declaration and payment of any dividends and/or other distributions on that date, using the valuation procedures set forth in the Acquiring Trust’s Declaration of Trust, as amended, and the Acquiring Fund’s then-current prospectus or statement of additional information, copies of which have been delivered to the Acquired Fund.
2.2. The net asset value of a Class A, Class B, Class C or Institutional Class Acquiring Fund Share shall be the net asset value per share computed with respect to that class as of the Valuation Time using the valuation procedures referred to in section 2.1.
2.3. The number of Class A, Class B, Class C and Institutional Class Acquiring Fund Shares to be issued (including fractional shares, if any) in consideration for the Assets shall be determined with respect to each such class by dividing the value of the Assets with respect to Class A, Class B, Class C and Institutional Class shares of the Acquired Fund, as the case may be, determined in accordance with section 2.1 by the net asset value of an Acquiring Fund Share of the same class determined in accordance with section 2.2.
2.4. All computations of value hereunder shall be made by or under the direction of each Fund’s respective accounting agent, if applicable, in accordance with its regular practice and the requirements of the 1940 Act and shall be subject to confirmation by each Fund’s respective independent accountants upon the reasonable request of the other Fund.
| 3. | Closing and Closing Date |
3.1. The Closing of the transactions contemplated by this Agreement shall be November 15, 2004, or such later date as the parties may agree in writing (the “Closing Date”). All acts taking place at the Closing shall be deemed to take place simultaneously
A-3
Table of Contents
as of 9:00 a.m., Eastern time, on the Closing Date, unless otherwise agreed to by the parties. The Closing shall be held at the Acquiring Fund’s offices of One South Street, Baltimore, Maryland 21202, or at such other place and time as the parties may agree.
3.2. The Acquired Fund shall deliver to the Acquiring Fund on the Closing Date a schedule of Assets.
3.3. State Street Bank and Trust Company (“State Street”), custodian for the Acquired Fund, shall deliver at the Closing a certificate of an authorized officer stating that (a) the Assets shall have been delivered in proper form to State Street, custodian for the Acquiring Fund, prior to or on the Closing Date and (b) all necessary taxes in connection with the delivery of the Assets, including all applicable federal and state stock transfer stamps, if any, have been paid or provision for payment has been made. The Acquired Fund’s portfolio securities represented by a certificate or other written instrument shall be presented by the custodian for the Acquired Fund to the custodian for the Acquiring Fund for examination no later than five business days preceding the Closing Date and transferred and delivered by the Acquired Fund as of the Closing Date by the Acquired Fund for the account of Acquiring Fund duly endorsed in proper form for transfer in such condition as to constitute good delivery thereof. The Acquired Fund’s portfolio securities and instruments deposited with a securities depository, as defined in Rule 17f-4 under the 1940 Act, shall be delivered as of the Closing Date by book entry in accordance with the customary practices of such depositories and the custodian for the Acquiring Fund. The cash to be transferred by the Acquired Fund shall be delivered by wire transfer of federal funds on the Closing Date.
3.4. State Street, as transfer agent for the Acquired Fund, on behalf of the Acquired Fund, shall deliver at the Closing a certificate of an authorized officer stating that its records contain the names and addresses of the Acquired Fund Shareholders and the number and percentage ownership (to three decimal places) of outstanding Class A, Class B, Class C and Institutional Class Acquired Fund shares owned by each such shareholder immediately prior to the Closing. The Acquiring Fund shall issue and deliver a confirmation evidencing the Acquiring Fund Shares to be credited on the Closing Date to the Acquired Fund or provide evidence satisfactory to the Acquired Fund that such Acquiring Fund Shares have been credited to the Acquired Fund’s account on the books of the Acquiring Fund. At the Closing, each party shall deliver to the other such bills of sale, checks, assignments, share certificates, if any, receipts or other documents as such other party or its counsel may reasonably request to effect the transactions contemplated by this Agreement.
3.5. In the event that immediately prior to the Valuation Time (a) the NYSE or another primary trading market for portfolio securities of the Acquiring Fund or the Acquired Fund shall be closed to trading or trading thereupon shall be restricted, or (b) trading or the reporting of trading on such Exchange or elsewhere shall be disrupted so that, in the judgment of the Board members of either party to this Agreement, accurate appraisal of the value of the net assets with respect to the Class A, Class B, Class C and Institutional Class shares of the Acquiring Fund or the Acquired Fund is impracticable, the Closing Date shall be postponed until the first business day after the day when trading shall have been fully resumed and reporting shall have been restored.
3.6. The liabilities of the Acquired Fund shall include all of the Acquired Fund’s liabilities, debts, obligations, and duties of whatever kind or nature, whether absolute,
A-4
Table of Contents
accrued, contingent, or otherwise, whether or not arising in the ordinary course of business, whether or not determinable at the Closing Date, and whether or not specifically referred to in this Agreement, including but not limited to, any deferred compensation to the Acquired Fund’s Board members.
| 4. | Representations and Warranties |
4.1. The Acquired Trust, on behalf of the Acquired Fund, represents and warrants to the Acquiring Fund as follows:
(a) The Acquired Trust is a voluntary association with transferable shares commonly referred to as a Massachusetts business trust duly organized and validly existing under the laws of The Commonwealth of Massachusetts with power under the Acquired Trust’s Declaration of Trust, as amended, to own all of its properties and assets and to carry on its business as it is now being conducted and, subject to approval of shareholders of the Acquired Fund, to carry out the Agreement. The Acquired Fund, the only active series of the Acquired Trust, is duly designated in accordance with the applicable provisions of the Acquired Trust’s Declaration of Trust. The Acquired Trust and Acquired Fund are qualified to do business in all jurisdictions in which they are required to be so qualified, except jurisdictions in which the failure to so qualify would not have material adverse effect on the Acquired Trust or Acquired Fund. The Acquired Fund has all material federal, state and local authorizations necessary to own all of the properties and assets and to carry on its business as now being conducted, except authorizations which the failure to so obtain would not have a material adverse effect on the Acquired Fund;
(b) The Acquired Trust is registered with the Commission as an open-end management investment company under the 1940 Act, and such registration is in full force and effect and the Acquired Fund is in compliance in all material respects with the 1940 Act and the rules and regulations thereunder;
(c) No consent, approval, authorization, or order of any court or governmental authority is required for the consummation by the Acquired Fund of the transactions contemplated herein, except such as have been obtained under the Securities Act of 1933, as amended (the “1933 Act”), the Securities Exchange Act of 1934, as amended (the “1934 Act”), and the 1940 Act and such as may be required by state securities laws;
(d) The Acquired Trust is not, and the execution, delivery and performance of this Agreement by the Acquired Trust will not result (i) in violation of Massachusetts law or of the Acquired Trust’s Declaration of Trust, as amended, or By-Laws, (ii) in a violation or breach of, or constitute a default under, any material agreement, indenture, instrument, contract, lease or other undertaking to which the Acquired Fund is a party or by which it is bound, and the execution, delivery and performance of this Agreement by the Acquired Fund will not result in the acceleration of any obligation, or the imposition of any penalty, under any agreement, indenture, instrument, contract, lease, judgment or decree to which the Acquired Fund is a party or by which it is bound, or (iii) in the creation or imposition of any lien, charge or encumbrance on any property or assets of the Acquired Fund;
(e) Other than as disclosed on a schedule provided by the Acquired Fund, no material litigation or administrative proceeding or investigation of or before any
A-5
Table of Contents
court or governmental body is presently pending or to its knowledge threatened against the Acquired Fund or any properties or assets held by it. The Acquired Fund knows of no facts which might form the basis for the institution of such proceedings which would materially and adversely affect its business, other than as disclosed in the foregoing schedule, and is not a party to or subject to the provisions of any order, decree or judgment of any court or governmental body which materially and adversely affects its business or its ability to consummate the transactions herein contemplated;
(f) The Statements of Assets and Liabilities, Operations, and Changes in Net Assets, the Financial Highlights, and the Investment Portfolio of the Acquired Fund at and for the fiscal year ended September 30, 2003, have been audited by Ernst & Young LLP, Independent Registered Public Accountants, and are in accordance with GAAP consistently applied, and such statements (a copy of each of which has been furnished to the Acquiring Fund) present fairly, in all material respects, the financial position of the Acquired Fund as of such date in accordance with GAAP, and there are no known contingent liabilities of the Acquired Fund required to be reflected on a balance sheet (including the notes thereto) in accordance with GAAP as of such date not disclosed therein;
(g) Since September 30, 2003, there has not been any material adverse change in the Acquired Fund’s financial condition, assets, liabilities or business other than changes occurring in the ordinary course of business, or any incurrence by the Acquired Fund of indebtedness maturing more than one year from the date such indebtedness was incurred except as otherwise disclosed to and accepted in writing by the Acquiring Fund. For purposes of this subsection (g), a decline in net asset value per share of the Acquired Fund due to declines in market values of securities in the Acquired Fund’s portfolio, the discharge of Acquired Fund liabilities, or the redemption of Acquired Fund shares by Acquired Fund Shareholders shall not constitute a material adverse change;
(h) At the date hereof and at the Closing Date, all federal and other tax returns and reports of the Acquired Fund required by law to have been filed by such dates (including any extensions) shall have been filed and are or will be correct in all material respects, and all federal and other taxes shown as due or required to be shown as due on said returns and reports shall have been paid or provision shall have been made for the payment thereof, and, to the best of the Acquired Fund’s knowledge, no such return is currently under audit and no assessment has been asserted with respect to such returns;
(i) For each taxable year of its operation (including the taxable year ending on the Closing Date), the Acquired Fund has met the requirements of Subchapter M of the Code for qualification as a regulated investment company and has elected to be treated as such, has been eligible to and has computed its federal income tax under Section 852 of the Code, and will have distributed all of its investment company taxable income and net capital gain (as defined in the Code) that has accrued through the Closing Date;
(j) All issued and outstanding shares of the Acquired Fund (i) have been offered and sold in every state and the District of Columbia in compliance in all material respects with applicable registration requirements of the 1933 Act and state securities laws, (ii) are, and on the Closing Date will be, duly and validly issued and outstanding, fully paid and non-assessable and not subject to preemptive or dissenter’s rights (recognizing that, under Massachusetts law,
A-6
Table of Contents
Acquired Fund Shareholders, under certain circumstances, could be held personally liable for obligations of the Acquired Fund), and (iii) will be held at the time of the Closing by the persons and in the amounts set forth in the records of State Street, as provided in section 3.4. The Acquired Fund does not have outstanding any options, warrants or other rights to subscribe for or purchase any of the Acquired Fund shares, nor is there outstanding any security convertible into any of the Acquired Fund shares;
(k) At the Closing Date, the Acquired Fund will have good and marketable title to the Acquired Fund’s assets to be transferred to the Acquiring Fund pursuant to section 1.2 and full right, power, and authority to sell, assign, transfer and deliver such assets hereunder free of any liens or other encumbrances, except those liens or encumbrances as to which the Acquiring Fund has received notice at or prior to the Closing, and upon delivery and payment for such assets, the Acquiring Fund will acquire good and marketable title thereto, subject to no restrictions on the full transfer thereof, including such restrictions as might arise under the 1933 Act and the 1940 Act, except those restrictions as to which the Acquiring Fund has received notice and necessary documentation at or prior to the Closing;
(l) The execution, delivery and performance of this Agreement will have been duly authorized prior to the Closing Date by all necessary action on the part of the Board members of the Acquired Trust (including the determinations required by Rule 17a-8(a) under the 1940 Act), and, subject to the approval of the Acquired Fund Shareholders, this Agreement constitutes a valid and binding obligation of the Acquired Trust, on behalf of the Acquired Fund, enforceable in accordance with its terms, subject, as to enforcement, to bankruptcy, insolvency, fraudulent transfer, reorganization, moratorium and other laws relating to or affecting creditors’ rights and to general equity principles;
(m) The information to be furnished by the Acquired Fund for use in applications for orders, registration statements or proxy materials or for use in any other document filed or to be filed with any federal, state or local regulatory authority (including the National Association of Securities Dealers, Inc. (the “NASD”)), which may be necessary in connection with the transactions contemplated hereby, shall be accurate and complete in all material respects and shall comply in all material respects with federal securities and other laws and regulations applicable thereto;
(n) The current prospectus and statement of additional information of the Acquired Fund conform in all material respects to the applicable requirements of the 1933 Act and the 1940 Act and the rules and regulations of the Commission thereunder and do not include any untrue statement of a material fact or omit to state any material fact required to be stated therein or necessary to make the statements therein, in light of the circumstances under which they were made, not materially misleading; and
(o) The proxy statement of the Acquired Fund to be included in the Registration Statement referred to in section 5.7 (the “Proxy Statement”), insofar as it relates to the Acquired Fund, will, on the effective date of the Registration Statement and on the Closing Date, (i) comply in all material respects with the provisions and regulations of the 1933 Act, the 1934 Act and the 1940 Act, as applicable, and (ii) not contain any untrue statement of a material fact or omit to state a material fact required to be stated therein or necessary to make the statements therein, in light of the circumstances under which such statements are
A-7
Table of Contents
made, not materially misleading; provided, however, that the representations and warranties in this section shall not apply to statements in or omissions from the Proxy Statement and the Registration Statement made in reliance upon and in conformity with information that was furnished or should have been furnished by the Acquiring Fund for use therein.
4.2. The Acquiring Trust, on behalf of the Acquiring Fund, represents and warrants to the Acquired Fund as follows:
(a) The Acquiring Trust is a voluntary association with transferable shares commonly referred to as a Massachusetts business trust duly organized and validly existing under the laws of The Commonwealth of Massachusetts with power under the Acquiring Trust’s Declaration of Trust, as amended, to own all of its properties and assets and to carry on its business as it is now being conducted and to carry out the Agreement. The Acquiring Fund is a separate series of the Acquiring Trust duly designated in accordance with the applicable provisions of the Acquiring Trust’s Declaration of Trust. The Acquiring Trust and Acquiring Fund are qualified to do business in all jurisdictions in which they are required to be so qualified, except jurisdictions in which the failure to so qualify would not have material adverse effect on the Acquiring Trust or Acquiring Fund. The Acquiring Fund has all material federal, state and local authorizations necessary to own all of the properties and assets and to carry on its business as now being conducted, except authorizations which the failure to so obtain would not have a material adverse effect on the Acquiring Fund;
(b) The Acquiring Trust is registered with the Commission as an open-end management investment company under the 1940 Act, and such registration is in full force and effect and the Acquiring Fund is in compliance in all material respects with the 1940 Act and the rules and regulations thereunder;
(c) No consent, approval, authorization, or order of any court or governmental authority is required for the consummation by the Acquiring Fund of the transactions contemplated herein, except such as have been obtained under the 1933 Act, the 1934 Act and the 1940 Act and such as may be required by state securities laws;
(d) The Acquiring Trust is not, and the execution, delivery and performance of this Agreement by the Acquiring Trust will not result (i) in violation of Massachusetts law or of the Acquiring Trust’s Declaration of Trust, as amended, or By-Laws, (ii) in a violation or breach of, or constitute a default under, any material agreement, indenture, instrument, contract, lease or other undertaking known to counsel to which the Acquiring Fund is a party or by which it is bound, and the execution, delivery and performance of this Agreement by the Acquiring Fund will not result in the acceleration of any obligation, or the imposition of any penalty, under any agreement, indenture, instrument, contract, lease, judgment or decree to which the Acquiring Fund is a party or by which it is bound, or (iii) in the creation or imposition of any lien, charge or encumbrance on any property or assets of the Acquiring Fund;
(e) Other than as disclosed on a schedule provided by the Acquiring Fund, no material litigation or administrative proceeding or investigation of or before any court or governmental body is presently pending or to its knowledge threatened against the Acquiring Fund or any properties or assets held by it. The Acquiring Fund knows of no facts which might form the basis for the institution of such
A-8
Table of Contents
proceedings which would materially and adversely affect its business, other than as disclosed in the foregoing schedule, and is not a party to or subject to the provisions of any order, decree or judgment of any court or governmental body which materially and adversely affects its business or its ability to consummate the transactions herein contemplated;
(f) The Statements of Assets and Liabilities, Operations, and Changes in Net Assets, the Financial Highlights, and the Investment Portfolio of the Acquiring Fund at and for the fiscal year ended September 30, 2003, have been audited by PricewaterhouseCoopers LLP, Independent Registered Public Accountants, and are in accordance with GAAP consistently applied, and such statements (a copy of each of which has been furnished to the Acquired Fund) present fairly, in all material respects, the financial position of the Acquiring Fund as of such date in accordance with GAAP, and there are no known contingent liabilities of the Acquiring Fund required to be reflected on a balance sheet (including the notes thereto) in accordance with GAAP as of such date not disclosed therein;
(g) Since September 30, 2003, there has not been any material adverse change in the Acquiring Fund’s financial condition, assets, liabilities or business other than changes occurring in the ordinary course of business, or any incurrence by the Acquiring Fund of indebtedness maturing more than one year from the date such indebtedness was incurred except as otherwise disclosed to and accepted in writing by the Acquired Fund. For purposes of this subsection (g), a decline in net asset value per share of the Acquiring Fund due to declines in market values of securities in the Acquiring Fund’s portfolio, the discharge of Acquiring Fund liabilities, or the redemption of Acquiring Fund shares by Acquiring Fund shareholders shall not constitute a material adverse change;
(h) At the date hereof and at the Closing Date, all federal and other tax returns and reports of the Acquiring Fund required by law to have been filed by such dates (including any extensions) shall have been filed and are or will be correct in all material respects, and all federal and other taxes shown as due or required to be shown as due on said returns and reports shall have been paid or provision shall have been made for the payment thereof, and, to the best of the Acquiring Fund’s knowledge, no such return is currently under audit and no assessment has been asserted with respect to such returns;
(i) For each taxable year of its operation, the Acquiring Fund has met the requirements of Subchapter M of the Code for qualification as a regulated investment company and has elected to be treated as such, has been eligible to and has computed its federal income tax under Section 852 of the Code, and will do so for the taxable year including the Closing Date;
(j) All issued and outstanding shares of the Acquiring Fund (i) have been offered and sold in every state and the District of Columbia in compliance in all material respects with applicable registration requirements of the 1933 Act and state securities laws and (ii) are, and on the Closing Date will be, duly and validly issued and outstanding, fully paid and non-assessable, and not subject to preemptive or dissenter’s rights (recognizing that, under Massachusetts law, Acquiring Fund shareholders, under certain circumstances, could be held personally liable for the obligations of the Acquiring Fund). The Acquiring Fund does not have outstanding any options, warrants or other rights to subscribe for or purchase any of the Acquiring Fund shares, nor is there outstanding any security convertible into any of the Acquiring Fund shares;
A-9
Table of Contents
(k) The Acquiring Fund Shares to be issued and delivered to the Acquired Fund, for the account of the Acquired Fund Shareholders, pursuant to the terms of this Agreement, will at the Closing Date have been duly authorized and, when so issued and delivered, will be duly and validly issued and outstanding Acquiring Fund Shares, and will be fully paid and non-assessable (recognizing that, under Massachusetts law, Acquiring Fund shareholders, under certain circumstances, could be held personally liable for the obligations of the Acquiring Fund);
(l) At the Closing Date, the Acquiring Fund will have good and marketable title to the Acquiring Fund’s assets, free of any liens or other encumbrances, except those liens or encumbrances as to which the Acquired Fund has received notice at or prior to the Closing;
(m) The execution, delivery and performance of this Agreement will have been duly authorized prior to the Closing Date by all necessary action on the part of the Board members of the Acquiring Trust (including the determinations required by Rule 17a-8(a) under the 1940 Act) and this Agreement will constitute a valid and binding obligation of the Acquiring Trust, on behalf of the Acquiring Fund, enforceable in accordance with its terms, subject, as to enforcement, to bankruptcy, insolvency, fraudulent transfer, reorganization, moratorium and other laws relating to or affecting creditors’ rights and to general equity principles;
(n) The information to be furnished by the Acquiring Fund for use in applications for orders, registration statements or proxy materials or for use in any other document filed or to be filed with any federal, state or local regulatory authority (including the NASD), which may be necessary in connection with the transactions contemplated hereby, shall be accurate and complete in all material respects and shall comply in all material respects with federal securities and other laws and regulations applicable thereto;
(o) The current prospectus and statement of additional information of the Acquiring Fund conform in all material respects to the applicable requirements of the 1933 Act and the 1940 Act and the rules and regulations of the Commission thereunder and do not include any untrue statement of a material fact or omit to state any material fact required to be stated therein or necessary to make the statements therein, in light of the circumstances under which they were made, not materially misleading;
(p) The Proxy Statement to be included in the Registration Statement, only insofar as it relates to the Acquiring Fund, will, on the effective date of the Registration Statement and on the Closing Date, (i) comply in all material respects with the provisions and regulations of the 1933 Act, the 1934 Act, and the 1940 Act and (ii) not contain any untrue statement of a material fact or omit to state a material fact required to be stated therein or necessary to make the statements therein, in light of the circumstances under which such statements were made, not materially misleading; provided, however, that the representations and warranties in this section shall not apply to statements in or omissions from the Proxy Statement and the Registration Statement made in reliance upon and in conformity with information that was furnished or should have been furnished by the Acquired Fund for use therein; and
(q) The Acquiring Fund agrees to use all reasonable efforts to obtain the approvals and authorizations required by the 1933 Act, the 1940 Act and such of the state securities laws as may be necessary in order to continue its operations after the Closing Date.
A-10
Table of Contents
| 5. | Covenants of the Acquiring Fund and the Acquired Fund |
5.1. The Acquiring Fund and the Acquired Fund each covenants to operate its business in the ordinary course between the date hereof and the Closing Date, it being understood that (a) such ordinary course of business will include (i) the declaration and payment of customary dividends and other distributions and (ii) such changes as are contemplated by the Funds’ normal operations; and (b) each Fund shall retain exclusive control of the composition of its portfolio until the Closing Date. No party shall take any action that would, or reasonably would be expected to, result in any of its representations and warranties set forth in this Agreement being or becoming untrue in any material respect. The Acquired Fund and Acquiring Fund covenant and agree to coordinate the respective portfolios of the Acquired Fund and Acquiring Fund from the date of the Agreement up to and including the Closing Date in order that at Closing, when the Assets are added to the Acquiring Fund’s portfolio, the resulting portfolio will meet the Acquiring Fund’s investment objective, policies and restrictions, as set forth in the Acquiring Fund’s prospectus, a copy of which has been delivered to the Acquired Fund.
5.2. Upon reasonable notice, the Acquiring Trust’s officers and agents shall have reasonable access to the Acquired Fund’s books and records necessary to maintain current knowledge of the Acquired Fund and to ensure that the representations and warranties made by the Acquired Fund are accurate.
5.3. The Acquired Fund covenants to call a meeting of the Acquired Fund Shareholders entitled to vote thereon to consider and act upon this Agreement and to take all other reasonable action necessary to obtain approval of the transactions contemplated herein. Such meeting shall be scheduled for no later than , 2004.
5.4. The Acquired Fund covenants that the Acquiring Fund Shares to be issued hereunder are not being acquired for the purpose of making any distribution thereof other than in accordance with the terms of this Agreement.
5.5. The Acquired Fund covenants that it will assist the Acquiring Fund in obtaining such information as the Acquiring Fund reasonably requests concerning the beneficial ownership of the Acquired Fund shares.
5.6. Subject to the provisions of this Agreement, the Acquiring Fund and the Acquired Fund will each take, or cause to be taken, all actions, and do or cause to be done, all things reasonably necessary, proper, and/or advisable to consummate and make effective the transactions contemplated by this Agreement.
5.7. Each Fund covenants to prepare in compliance with the 1933 Act, the 1934 Act and the 1940 Act the Registration Statement on Form N-14 (the “Registration Statement”) in connection with the meeting of the Acquired Fund Shareholders to consider approval of this Agreement and the transactions contemplated herein. The Acquiring Trust will file the Registration Statement, including the Proxy Statement, with the Commission. The Acquired Fund will provide the Acquiring Fund with information reasonably necessary for the preparation of a prospectus, which will include the Proxy Statement referred to in section 4.1(o), all to be included in the Registration Statement, in compliance in all material respects with the 1933 Act, the 1934 Act and the 1940 Act.
A-11
Table of Contents
5.8. The Acquired Fund covenants that it will, from time to time, as and when reasonably requested by the Acquiring Fund, execute and deliver or cause to be executed and delivered all such assignments and other instruments, and will take or cause to be taken such further action as the Acquiring Fund may reasonably deem necessary or desirable in order to vest in and confirm the Acquiring Fund’s title to and possession of all the assets and otherwise to carry out the intent and purpose of this Agreement.
5.9. The Acquiring Fund covenants to use all reasonable efforts to obtain the approvals and authorizations required by the 1933 Act and 1940 Act, and such of the state securities laws as it deems appropriate in order to continue its operations after the Closing Date and to consummate the transactions contemplated herein; provided, however, that the Acquiring Fund may take such actions it reasonably deems advisable after the Closing Date as circumstances change.
5.10. The Acquiring Fund covenants that it will, from time to time, as and when reasonably requested by the Acquired Fund, execute and deliver or cause to be executed and delivered all such assignments, assumption agreements, releases, and other instruments, and will take or cause to be taken such further action, as the Acquired Fund may reasonably deem necessary or desirable in order to (i) vest and confirm to the Acquired Fund title to and possession of all Acquiring Fund shares to be transferred to the Acquired Fund pursuant to this Agreement and (ii) assume the liabilities from the Acquired Fund.
5.11. As soon as reasonably practicable after the Closing, the Acquired Fund shall make a liquidating distribution to its shareholders consisting of the Acquiring Fund Shares received at the Closing.
5.12. The Acquiring Fund and the Acquired Fund shall each use its reasonable best efforts to fulfill or obtain the fulfillment of the conditions precedent to effect the transactions contemplated by this Agreement as promptly as practicable.
5.13. The intention of the parties is that the transaction will qualify as a reorganization within the meaning of Section 368(a) of the Code. Neither the Trusts, the Acquiring Fund nor the Acquired Fund shall take any action, or cause any action to be taken (including, without limitation, the filing of any tax return) that is inconsistent with such treatment or results in the failure of the transaction to qualify as a reorganization within the meaning of Section 368(a) of the Code. At or prior to the Closing Date, the Trusts, the Acquiring Fund and the Acquired Fund will take such action, or cause such action to be taken, as is reasonably necessary to enable Willkie Farr & Gallagher to render the tax opinion contemplated herein in section 8.5.
5.14. At or immediately prior to the Closing, the Acquired Fund may declare and pay to its stockholders a dividend or other distribution in an amount large enough so that it will have distributed substantially all (and in any event not less than 98%) of its investment company taxable income (computed without regard to any deduction for dividends paid) and realized net capital gain, if any, for the current taxable year through the Closing Date.
5.15. The Acquiring Fund agrees to identify in writing prior to the Closing Date any assets of the Acquired Fund that it does not wish to acquire because they are not
A-12
Table of Contents
consistent wit the current investment strategy of the Acquiring Fund, and the Acquired Fund agrees to dispose of such assets prior to the Closing Date.
| 6. | Conditions Precedent to Obligations of the Acquired Fund |
The obligations of the Acquired Fund to consummate the transactions provided for herein shall be subject, at its election, to the performance by the Acquiring Fund of all the obligations to be performed by it hereunder on or before the Closing Date, and, in addition thereto, the following further conditions:
6.1. All representations and warranties of the Acquiring Trust, on behalf of the Acquiring Fund, contained in this Agreement shall be true and correct in all material respects as of the date hereof and, except as they may be affected by the transactions contemplated by this Agreement, as of the Closing Date, with the same force and effect as if made on and as of the Closing Date; and there shall be (i) no pending or threatened litigation brought by any person (other than the Acquired Fund, its adviser or any of their affiliates) against the Acquiring Fund or its investment adviser(s), Board members or officers arising out of this Agreement and (ii) no facts known to the Acquiring Fund which the Acquiring Fund reasonably believes might result in such litigation.
6.2. The Acquiring Fund shall have delivered to the Acquired Fund on the Closing Date a certificate executed in its name by the Acquiring Trust’s President or a Vice President, in a form reasonably satisfactory to the Acquired Trust, on behalf of the Acquired Fund, and dated as of the Closing Date, to the effect that the representations and warranties of the Acquiring Fund made in this Agreement are true and correct on and as of the Closing Date, except as they may be affected by the transactions contemplated by this Agreement, and as to such other matters as the Acquired Fund shall reasonably request.
6.3. The Acquired Fund shall have received on the Closing Date an opinion of Willkie Farr & Gallagher LLP, in a form reasonably satisfactory to the Acquired Fund, and dated as of the Closing Date, to the effect that:
(a) The Acquiring Trust has been formed and is legally existing as a business trust; (b) the Acquiring Fund has the power as a Massachusetts business trust to carry on its business as presently conducted in accordance with the description thereof in the Acquiring Fund’s registration statement under the 1940 Act; (c) the Agreement has been duly authorized, executed and delivered by the Acquiring Trust, on behalf of the Acquiring Fund, and constitutes a valid and legally binding obligation of the Acquiring Trust, on behalf of the Acquiring Fund, enforceable in accordance with its terms, subject to bankruptcy, insolvency, fraudulent transfer, reorganization, moratorium and laws of general applicability relating to or affecting creditors’ rights and to general equity principles; (d) the execution and delivery of the Agreement did not, and the issuance of Acquiring Fund Shares pursuant to the Agreement will not, violate the Acquiring Trust’s Declaration of Trust, as amended, or By-laws; and (e) to the knowledge of such counsel, and without any independent investigation, (i) other than as disclosed on the schedule provided by the Acquiring Fund pursuant to section 4.2 of the Agreement, the Acquiring Trust is not subject to any litigation or other proceedings that might have a materially adverse effect on the operations of the Acquiring Trust, (ii) the Acquiring Trust is duly registered as an
A-13
Table of Contents
investment company with the Commission and is not subject to any stop order; and (iii) all regulatory consents, authorizations, approvals or filings required to be obtained or made by the Acquiring Fund under the federal laws of the United States or the laws of The Commonwealth of Massachusetts for the issuance of Acquiring Fund Shares, pursuant to the Agreement have been obtained or made.
The delivery of such opinion is conditioned upon receipt by Willkie Farr & Gallagher LLP of customary representations it shall reasonably request of each of the Acquiring Trust and the Acquired Trust.
6.4. The Acquiring Fund shall have performed all of the covenants and complied with all of the provisions required by this Agreement to be performed or complied with by the Acquiring Fund on or before the Closing Date.
6.5. The Acquiring Fund shall have adopted a new investment management agreement and entered into an expense cap agreement with DeAM limiting the expenses of the Class A, Class B, Class C and Institutional Class shares of the Acquiring Fund to %, %, % and %, respectively, for the two year period ending , 2006, in a form satisfactory to the Acquired Fund.
| 7. | Conditions Precedent to Obligations of the Acquiring Fund |
The obligations of the Acquiring Fund to consummate the transactions provided for herein shall be subject, at its election, to the performance by the Acquired Fund of all of the obligations to be performed by it hereunder on or before the Closing Date and, in addition thereto, the following further conditions:
7.1. All representations and warranties of the Acquired Trust, on behalf of the Acquired Fund, contained in this Agreement shall be true and correct in all material respects as of the date hereof and, except as they may be affected by the transactions contemplated by this Agreement, as of the Closing Date, with the same force and effect as if made on and as of the Closing Date; and there shall be (i) no pending or threatened litigation brought by any person (other than the Acquiring Fund, its adviser or any of their affiliates) against the Acquired Fund or its investment adviser(s), Board members or officers arising out of this Agreement and (ii) no facts known to the Acquired Fund which the Acquired Fund reasonably believes might result in such litigation.
7.2. The Acquired Fund shall have delivered to the Acquiring Fund a statement of the Acquired Fund’s assets and liabilities as of the Closing Date, certified by the Treasurer of the Acquired Fund.
7.3. The Acquired Fund shall have delivered to the Acquiring Fund on the Closing Date a certificate executed in its name by the Acquired Trust’s President or a Vice President, in a form reasonably satisfactory to the Acquiring Trust, on behalf of the Acquiring Fund, and dated as of the Closing Date, to the effect that the representations and warranties of the Acquired Trust with respect to the Acquired Fund made in this Agreement are true and correct on and as of the Closing Date, except as they may be affected by the transactions contemplated by this Agreement, and as to such other matters as the Acquiring Fund shall reasonably request.
7.4. The Acquiring Fund shall have received on the Closing Date an opinion of Vedder, Price, Kaufman & Kammholz, P.C., in a form reasonably satisfactory to the Acquiring Fund, and dated as of the Closing Date, to the effect that:
(a) The Acquired Trust has been duly formed and is an existing business trust; (b) the Acquired Fund has the power to carry on its business as presently
A-14
Table of Contents
conducted in accordance with the description thereof in the Acquired Trust’s registration statement under the 1940 Act; (c) the Agreement has been duly authorized, executed and delivered by the Acquired Trust, on behalf of the Acquired Fund, and constitutes a valid and legally binding obligation of the Acquired Trust, on behalf of the Acquired Fund, enforceable in accordance with its terms, subject to bankruptcy, insolvency, fraudulent transfer, reorganization, moratorium and laws of general applicability relating to or affecting creditors’ rights and to general equity principles; (d) the execution and delivery of the Agreement did not, and the exchange of the Acquired Fund’s assets for Acquiring Fund Shares pursuant to the Agreement will not, violate the Acquired Trust’s Declaration of Trust, as amended, or By-laws; and (e) to the knowledge of such counsel, and without any independent investigation, (i) other than as disclosed on the schedule provided by the Acquired Fund pursuant to section 3.2 of the Agreement, the Acquired Trust is not subject to any litigation or other proceedings that might have a materially adverse effect on the operations of the Acquired Trust, (ii) the Acquired Trust is duly registered as an investment company with the Commission and is not subject to any stop order, and (iii) all regulatory consents, authorizations, approvals or filings required to be obtained or made by the Acquired Fund under the federal laws of the United States or the laws of The Commonwealth of Massachusetts for the exchange of the Acquired Fund’s assets for Acquiring Fund Shares, pursuant to the Agreement have been obtained or made.
The delivery of such opinion is conditioned upon receipt by Vedder, Price, Kaufman & Kammholz, P.C. of customary representations it shall reasonably request of each of the Acquiring Trust and the Acquired Trust.
7.5. The Acquired Fund shall have performed all of the covenants and complied with all of the provisions required by this Agreement to be performed or complied with by the Acquired Fund on or before the Closing Date.
| 8. | Further Conditions Precedent to Obligations of the Acquiring Fund and the Acquired Fund |
If any of the conditions set forth below have not been met on or before the Closing Date with respect to the Acquired Fund or the Acquiring Fund, the other party to this Agreement shall, at its option, not be required to consummate the transactions contemplated by this Agreement:
8.1. This Agreement and the transactions contemplated herein shall have been approved by the requisite vote of the holders of the outstanding shares of the Acquired Fund in accordance with the provisions of the Acquired Trust’s Declaration of Trust, as amended, and By-Laws, applicable Massachusetts law and the 1940 Act, and certified copies of the resolutions evidencing such approval shall have been delivered to the Acquiring Fund. Notwithstanding anything herein to the contrary, neither the Acquiring Fund nor the Acquired Fund may waive the conditions set forth in this section 8.1.
8.2. On the Closing Date, no action, suit or other proceeding shall be pending or to its knowledge threatened before any court or governmental agency in which it is sought to restrain or prohibit, or obtain material damages or other relief in connection with, this Agreement or the transactions contemplated herein.
A-15
Table of Contents
8.3. All consents of other parties and all other consents, orders and permits of federal, state and local regulatory authorities deemed necessary by the Acquiring Fund or the Acquired Fund to permit consummation, in all material respects, of the transactions contemplated hereby shall have been obtained, except where failure to obtain any such consent, order or permit would not involve a risk of a material adverse effect on the assets or properties of the Acquiring Fund or the Acquired Fund, provided that either party hereto may for itself waive any of such conditions.
8.4. The Registration Statement shall have become effective under the 1933 Act and no stop orders suspending the effectiveness thereof shall have been issued and, to the best knowledge of the parties hereto, no investigation or proceeding for that purpose shall have been instituted or be pending, threatened or contemplated under the 1933 Act.
8.5. The parties shall have received an opinion of Willkie Farr & Gallagher LLP addressed to each of the Acquiring Fund and the Acquired Fund, in a form reasonably satisfactory to each such party to this Agreement, substantially to the effect that, based upon certain facts, assumptions and representations of the parties, for federal income tax purposes: (i) the acquisition by the Acquiring Fund of all of the assets of the Acquired Fund solely in exchange for Acquiring Fund Shares and the assumption by the Acquiring Fund of all of the liabilities of the Acquired Fund, followed by the distribution by the Acquired Fund to its shareholders of Acquiring Fund Shares in complete liquidation of the Acquired Fund, all pursuant to the Agreement, constitutes a reorganization within the meaning of Section 368(a) of the Code, and the Acquiring Fund and the Acquired Fund will each be a “party to a reorganization” within the meaning of Section 368(b) of the Code; (ii) Under Section 361 of the Code the Acquired Fund will not recognize gain or loss upon the transfer of its assets to the Acquiring Fund in exchange for Acquiring Fund Shares and the assumption of the Acquired Fund liabilities by the Acquiring Fund, and the Acquired Fund will not recognize gain or loss upon the distribution to its shareholders of the Acquiring Fund Shares in liquidation of the Acquired Fund; (iii) Under Section 354 of the Code Acquired Fund Shareholders will not recognize gain or loss on the receipt of Acquiring Fund Shares solely in exchange for the Acquired Fund shares; (iv) Under Section 358 of the Code the aggregate basis of the Acquiring Fund Shares received by each Acquired Fund Shareholder will be the same as the aggregate basis of the Acquired Fund shares exchanged therefore; (v) Under Section 1223(1) of the Code the holding period of the Acquiring Fund Shares received by each Acquired Fund Shareholder will include the holding period of Acquired Fund Shares exchanged therefor, provided that the Acquired Fund Shareholder held the Acquired Fund Shares at the time of the reorganization as a capital asset; (vi) Under Section 1032 of the Code the the Acquiring Fund will not recognize gain or loss upon the receipt of assets of the Acquired Fund in exchange for Acquiring Fund Shares and the assumption by the Acquiring Fund of all of the liabilities of the Acquired Fund; (vii) Under Section 362(b) of the Code the basis of the assets of the Acquired Fund transferred to the Acquiring Fund in the reorganization will be the same in the hands of the Acquiring Fund as the basis of such assets in the hands of the Acquired Fund immediately prior to the transfer; and (viii) Under Section 1223(2) of the Code the holding periods of the assets of the Acquired Fund transferred to the Acquiring Fund in the reorganization in the hands of the Acquiring Fund will include the periods during which such assets were held by the Acquired Fund. The delivery of such opinion is conditioned upon receipt by Willkie Farr & Gallagher LLP of representations it shall request of each of the Acquiring Trust and Acquired Trust. Notwithstanding anything herein to the contrary, neither the Acquiring Fund nor the Acquired Fund may waive the condition set forth in this section 8.5.
A-16
Table of Contents
| 9. | Indemnification |
9.1. The Acquiring Fund agrees to indemnify and hold harmless the Acquired Fund and each of the Acquired Trust’s Board members and officers from and against any and all losses, claims, damages, liabilities or expenses (including, without limitation, the payment of reasonable legal fees and reasonable costs of investigation) to which jointly and severally, the Acquired Fund or any of its Board members or officers may become subject, insofar as any such loss, claim, damage, liability or expense (or actions with respect thereto) arises out of or is based on any breach by the Acquiring Fund of any of its representations, warranties, covenants or agreements set forth in this Agreement.
9.2. The Acquired Fund agrees to indemnify and hold harmless the Acquiring Fund and each of the Acquiring Trust’s Board members and officers from and against any and all losses, claims, damages, liabilities or expenses (including, without limitation, the payment of reasonable legal fees and reasonable costs of investigation) to which jointly and severally, the Acquiring Fund or any of its Board members or officers may become subject, insofar as any such loss, claim, damage, liability or expense (or actions with respect thereto) arises out of or is based on any breach by the Acquired Fund of any of its representations, warranties, covenants or agreements set forth in this Agreement.
| 10. | Fees and Expenses |
10.1. Each of the Acquiring Trust, on behalf of the Acquiring Fund, and the Acquired Trust, on behalf of the Acquired Fund, represents and warrants to the other that it has no obligations to pay any brokers or finders fees in connection with the transactions provided for herein.
10.2. DeAM or its affiliates will bear all the expenses associated with the Reorganization.
| 11. | Entire Agreement |
The Acquiring Fund and the Acquired Fund agree that neither party has made any representation, warranty or covenant not set forth herein and that this Agreement constitutes the entire agreement between the parties.
| 12. | Termination |
12.1. This Agreement may be terminated and the transactions contemplated hereby may be abandoned by either party by (i) mutual agreement of the parties, or (ii) by either party if the Closing shall not have occurred on or before [December , 2004], unless such date is extended by mutual agreement of the parties, or (iii) by either party if the other party shall have materially breached its obligations under this Agreement or made a material and intentional misrepresentation herein or in connection herewith. In the event of any such termination, this Agreement shall become void and there shall be no liability hereunder on the part of any party or their respective Board members or officers, except for any such material breach or intentional misrepresentation, as to each of which all remedies at law or in equity of the party adversely affected shall survive.
| 13. | Amendments |
This Agreement may be amended, modified or supplemented in such manner as may be mutually agreed upon in writing by any authorized officer of the Acquired Fund and any authorized officer of the Acquiring Fund; provided, however, that following the meeting of the Acquired Fund Shareholders called by the Acquired Fund pursuant to section 5.3 of this Agreement, no such amendment may have the effect of changing the
A-17
Table of Contents
provisions for determining the number of the Acquiring Fund Shares to be issued to the Acquired Fund Shareholders under this Agreement to the detriment of such shareholders without their further approval.
| 14. | Notices |
Any notice, report, statement or demand required or permitted by any provisions of this Agreement shall be in writing and shall be deemed duly given if delivered by hand (including by Federal Express or similar express courier) or transmitted by facsimile or three days after being mailed by prepaid registered or certified mail, return receipt requested, addressed to the Acquired Fund, 222 South Riverside Plaza, Chicago, Illinois 60606, with a copy to Vedder, Price, Kaufman & Kammholz, P.C., 222 N. LaSalle Street, Chicago, Illinois 60601, Attention: Cathy G. O’Kelly, Esq., or to the Acquiring Fund, One South Street, Baltimore, Maryland 21202, with a copy to Willkie Farr & Gallagher LLP, 787 Seventh Avenue, New York, New York 10019, Attention: Burton Leibert, Esq., or to any other address that the Acquired Fund or the Acquiring Fund shall have last designated by notice to the other party.
| 15. | Headings; Counterparts; Assignment; Limitation of Liability |
15.1. The Article and section headings contained in this Agreement are for reference purposes only and shall not affect in any way the meaning or interpretation of this Agreement.
15.2. This Agreement may be executed in any number of counterparts, each of which shall be deemed an original.
15.3. This Agreement shall bind and inure to the benefit of the parties hereto and their respective successors and assigns, but no assignment or transfer hereof or of any rights or obligations hereunder shall be made by any party without the written consent of the other party. Nothing herein expressed or implied is intended or shall be construed to confer upon or give any person, firm or corporation, other than the parties hereto and the shareholders of the Acquiring Fund and the Acquired Fund and their respective successors and assigns, any rights or remedies under or by reason of this Agreement.
15.4. References in this Agreement to each Trust mean and refer to the Board members of each Trust from time to time serving under its Declaration of Trust on file with the Secretary of State of The Commonwealth of Massachusetts, as the same may be amended from time to time, pursuant to which each Trust conducts its business. It is expressly agreed that the obligations of each Trust hereunder shall not be binding upon any of the Board members, shareholders, nominees, officers, agents, or employees of the Trusts or the Funds personally, but bind only the respective property of the Funds, as provided in each Trust’s Declaration of Trust. Moreover, no series of either Trust other than the Funds shall be responsible for the obligations of the Trusts hereunder, and all persons shall look only to the assets of the Funds to satisfy the obligations of the Trusts hereunder. The execution and the delivery of this Agreement have been authorized by each Trust’s Board members, on behalf of the applicable Fund, and this Agreement has been signed by authorized officers of each Fund acting as such, and neither such authorization by such Board members, nor such execution and delivery by such officers, shall be deemed to have been made by any of them individually or to impose any liability on any of them personally, but shall bind only the respective property of the Funds, as provided in each Trust’s Declaration of Trust.
A-18
Table of Contents
Notwithstanding anything to the contrary contained in this Agreement, the obligations, agreements, representations and warranties with respect to each Fund shall constitute the obligations, agreements, representations and warranties of that Fund only (the “Obligated Fund”), and in no event shall any other series of the Trusts or the assets of any such series be held liable with respect to the breach or other default by the Obligated Fund of its obligations, agreements, representations and warranties as set forth herein.
15.5. This Agreement shall be governed by, and construed and enforced in accordance with, the laws of The Commonwealth of Massachusetts, without regard to its principles of conflicts of laws.
IN WITNESS WHEREOF, each of the parties hereto has caused this Agreement to be executed by an authorized officer and its seal to be affixed thereto and attested by its Secretary or Assistant Secretary.
Attest: | SCUDDER ADVISOR FUNDS on behalf of Scudder Mid Cap Growth Fund | |
Secretary | By: Its: | |
Attest: | SCUDDER DYNAMIC GROWTH FUND on behalf of Scudder Dynamic Growth Fund | |
Secretary | By: Its: | |
AGREED TO AND ACKNOWLEDGED WITH RESPECT TO PARAGRAPH 10.2 HERETO
DEUTSCHE ASSET MANAGEMENT, INC. | ||
By:
Its: | ||
A-19
Table of Contents
| SCUDDER | To vote by Telephone | To vote by Internet | ||||||
INVESTMENTS P.O. BOX 9132 HINGHAM, MA 02043-9132 |
1) |
Read the Proxy Statement and have the Proxy card on reverse at hand. |
1) |
Read the Proxy Statement and have the Proxy card on reverse at hand. | ||||
| 2) | Call 1-800-____. | 2) | Go to Web site www.___.com | |||||
3) |
Enter the 14-digit control number shown below and follow the simple instructions. |
3) |
Enter the 14-digit control number shown below and follow the simple instructions. |
DO NOT RETURN YOUR PROXY CARD IF YOU VOTE BY PHONE OR INTERNET
*** CONTROL NUMBER: 999 999 999 999 99 ***
| SCUDDER DYNAMIC GROWTH FUND | SCUDDER DYNAMIC GROWTH FUND PROXY FOR THE SPECIAL MEETING OF SHAREHOLDERS One South Street, Baltimore, Maryland 21202 4:00 p.m., Eastern time, on November 4, 2004 |
The undersigned hereby appoints Philip J. Collora, Daniel O. Hirsch, John Millette and Caroline Pearson, and each of them, with full power of substitution, as proxy or proxies of the undersigned to vote all shares of the Fund that the undersigned is entitled in any capacity to vote at the above-stated special meeting, and at any and all adjournments or postponements thereof (the ‘Special Meeting’), on the matter set forth in the Notice of Special Meeting of Shareholders and on this Proxy Card, and, in their discretion, upon all matters incident to the conduct of the Special Meeting and upon such other matters as may properly be brought before the Special Meeting. This proxy revokes all prior proxies given by the undersigned.
All properly executed proxies will be voted as directed. If no instructions are indicated on a properly executed proxy the proxy will be voted FOR approval of the Proposal. All ABSTAIN votes will be counted in determining the existence of a quorum at the Special Meeting.
Receipt of the Notice of Special Meeting and the related Proxy Statement/Prospectus is hereby acknowledged.
UNLESS VOTING BY TELEPHONE OR INTERNET,
Dated:
Signature(s) (Title(s), if applicable) (Sign in the Box)
Joint owners should EACH sign. Please sign EXACTLY as your name(s) appears on this proxy card. When signing as attorney, trustee, executor, administrator, guardian or corporate officer, please give your FULL title |
Scudder Dynamic Growth Fund
YOUR VOTE IS IMPORTANT. PLEASE SIGN, DATE AND MAIL THIS PROXY
CARD PROMPTLY USING THE ENCLOSED ENVELOPE.
Please fill in a box as shown using black or blue ink or number 2 pencil. x
PLEASE DO NOT USE FINE POINT PENS.
THIS PROXY IS SOLICITED ON BEHALF OF THE BOARD OF TRUSTEES WITH RESPECT TO YOUR FUND. THE FOLLOWING MATTER IS PROPOSED BY YOUR FUND. THE BOARD OF TRUSTEES RECOMMENDS A VOTE FOR THE PROPOSAL.
| Vote on Proposal | FOR | AGAINST | ABSTAIN | |||
| Approve an Agreement and Plan of Reorganization and the transactions it contemplates, including the transfer of all of the assets of Scudder Dynamic Growth Fund to Scudder Mid Cap Growth Fund, in exchange for the issuance and delivery of shares of Scudder Mid Cap Growth Fund and the assumption by Scudder Mid Cap Growth Fund of all liabilities of Scudder Dynamic Growth Fund, and the distribution of such shares, on a tax-free basis, to the shareholders of Scudder Dynamic Growth Fund in complete termination and liquidation of Scudder Dynamic Growth Fund. | ¨ | ¨ | ¨ | |||
The appointed proxies will vote on any other business as may properly come before the Special Meeting.
THIS PROXY CARD IS VALID ONLY WHEN SIGNED AND DATED ON REVERSE SIDE.
Scudder Dynamic Growth Fund
Table of Contents
PART B
INFORMATION REQUIRED IN THE
STATEMENT OF ADDITIONAL INFORMATION
1
Table of Contents
STATEMENT OF ADDITIONAL INFORMATION
One South Street
Baltimore, MD 21202
1-410-895-5000
RELATING TO THE ACQUISITION BY SCUDDER ADVISOR FUNDS—SCUDDER
MID CAP GROWTH FUND (THE “ACQUIRING FUND”)
OF THE ASSETS OF SCUDDER DYNAMIC GROWTH FUND—SCUDDER DYNAMIC
GROWTH FUND (THE “ACQUIRED FUND”).
Dated: August , 2004
This Statement of Additional Information, relating specifically to the proposed transfer of all of the assets of the Acquired Fund to the Acquiring Fund, in exchange for shares of beneficial interest of the Acquiring Fund and the assumption by the Acquiring Fund of all of the liabilities of the Acquired Fund, consists of this cover page and the following described documents, each of which accompanies this Statement of Additional Information.
The unaudited pro forma financial statements are intended to present the financial condition and related results of operations of the Acquiring Fund and the Acquired Fund as if the merger had been consummated on March 31, 2004.
| 1. | Statement of Additional Information for the Acquiring Fund, dated February 1, 2004, as supplemented from time to time. |
| 2. | Statement of Additional Information for the Acquired Fund, dated December 1, 2003, as supplemented from time to time. |
| 3. | Annual Report of the Acquiring Fund for the year ended September 30, 2003. |
| 4. | Semi-Annual Report of the Acquiring Fund for the semi-annual period ended March 31, 2004. |
| 5. | Annual Report of the Acquired Fund for the year ended September 30, 2003. |
| 6. | Semi-Annual Report of the Acquired Fund for the semi-annual period ended March 31, 2004. |
This Statement of Additional Information is not a prospectus. A Prospectus/Proxy Statement, dated August , 2004, relating to the above-referenced matter may be obtained without charge by calling or writing the Acquiring Fund at the telephone number or address set forth above. This Statement of Additional Information should be read in conjunction with, and is hereby incorporated by reference into, the Prospectus/Proxy Statement.
2
Table of Contents
Pro Forma
Portfolio of Investments
as of March 31, 2004
(Unaudited)
| Dynamic Growth Par/Share Amount | Mid Cap Growth Par/Share Amount | Pro Forma Combined Par/Shares Amount | Dynamic Growth Market Value ($) | Mid Cap Growth Market Value ($) | Pro Forma Combined Market Value ($) | |||||||
Common Stocks 94.5% | ||||||||||||
Consumer Discretionary 22.2% | ||||||||||||
Automobiles 1.5% | ||||||||||||
Thor Industries, Inc. | 147,400 | 359,800 | 507,200 | 3,959,164 | 9,664,228 | 13,623,392 | ||||||
Hotels Restaurants & Leisure 5.3% | ||||||||||||
Alliance Gaming Corp. | 171,100 | 423,900 | 595,000 | 5,497,443 | 13,619,907 | 19,117,350 | ||||||
GTECH Holdings Corp. | 100,300 | 238,000 | 338,300 | 5,931,742 | 14,075,320 | 20,007,062 | ||||||
The Cheesecake Factory, Inc. | 58,000 | 166,500 | 224,500 | 2,675,540 | 7,680,645 | 10,356,185 | ||||||
| 14,104,725 | 35,375,872 | 49,480,597 | ||||||||||
Household Durables 6.2% | ||||||||||||
Harman International Industries, Inc. | 99,600 | 240,500 | 340,100 | 7,928,160 | 19,143,800 | 27,071,960 | ||||||
Leggett & Platt, Inc. | 448,200 | 448,200 | 10,626,822 | 10,626,822 | ||||||||
Tempur-Pedic International, Inc. | 397,900 | 894,900 | 1,292,800 | 6,223,156 | 13,996,236 | 20,219,392 | ||||||
| 14,151,316 | 43,766,858 | 57,918,174 | ||||||||||
Media 1.0% | ||||||||||||
Entercom Communications Corp. | 79,800 | 141,600 | 221,400 | 3,612,546 | 6,410,232 | 10,022,778 | ||||||
Multiline Retail 1.1% | ||||||||||||
Tuesday Morning Corp. | 301,100 | 301,100 | 0 | 10,375,906 | 10,375,906 | |||||||
Specialty Retail 4.7% | ||||||||||||
Advance Auto Parts, Inc. | 105,400 | 250,200 | 355,600 | 4,286,618 | 10,175,634 | 14,462,252 | ||||||
Chico’s FAS, Inc. | 122,300 | 303,000 | 425,300 | 5,674,720 | 14,059,200 | 19,733,920 | ||||||
Regis Corp. | 61,300 | 151,900 | 213,200 | 2,724,172 | 6,750,436 | 9,474,608 | ||||||
| 12,685,510 | 30,985,270 | 43,670,780 | ||||||||||
Textiles, Apparel & Luxury Goods 2.4% | ||||||||||||
Columbia Sportswear Co. | 125,400 | 272,700 | 398,100 | 6,952,176 | 15,118,488 | 22,070,664 | ||||||
Consumer Staples 2.9% | ||||||||||||
Beverages 1.3% | ||||||||||||
Constellation Brands, Inc. “A” | 111,100 | 261,900 | 373,000 | 3,566,310 | 8,406,990 | 11,973,300 | ||||||
Food Products 1.6% | ||||||||||||
Dean Foods Co. | 123,900 | 333,450 | 457,350 | 4,138,260 | 11,137,230 | 15,275,490 | ||||||
Energy 5.3% | ||||||||||||
Energy Equipment & Services 5.3% | ||||||||||||
BJ Services Co. | 76,300 | 76,300 | 3,301,501 | 15,222,386 | 18,523,887 | |||||||
Rowan Companies, Inc. | 287,300 | 287,300 | 6,059,157 | 11,947,485 | 18,006,642 | |||||||
Smith International, Inc. | 241,800 | 241,800 | 12,938,718 | 12,938,718 | ||||||||
Table of Contents
| Dynamic Growth Par/Share Amount | Mid Cap Growth Par/Share Amount | Pro Forma Combined Par/Shares Amount | Dynamic Growth Market Value ($) | Mid Cap Growth Market Value ($) | Pro Forma Combined Market Value ($) | |||||||
| 9,360,658 | 40,108,589 | 49,469,247 | ||||||||||
Financials 12.9% | ||||||||||||
Consumer Finance 1.0% | ||||||||||||
Providian Financial Corp. | 218,800 | 486,600 | 705,400 | 2,866,280 | 6,374,460 | 9,240,740 | ||||||
Diversified Financial Services 11.0% | ||||||||||||
Ameritrade Holding Corp. | 392,800 | 392,800 | 6,049,120 | 6,049,120 | ||||||||
CapitalSource, Inc. | 484,700 | 484,700 | 10,881,515 | 10,881,515 | ||||||||
Chicago Mercantile Exchange | 42,700 | 58,100 | 100,800 | 4,130,798 | 5,620,594 | 9,751,392 | ||||||
Friedman, Billings, Ramsey Group, Inc. “A” | 556,600 | 556,600 | 15,022,634 | 15,022,634 | ||||||||
Investment Technology Group, Inc. | 259,400 | 309,100 | 568,500 | 3,968,820 | 4,729,230 | 8,698,050 | ||||||
Investors Financial Services Corp. | 163,100 | 355,000 | 518,100 | 6,739,292 | 14,668,600 | 21,407,892 | ||||||
Labranche & Co., Inc. | 183,800 | 433,500 | 617,300 | 2,060,398 | 4,859,535 | 6,919,933 | ||||||
Legg Mason, Inc. | 161,200 | 161,200 | 14,956,136 | 14,956,136 | ||||||||
The First Marblehead Corp. | 309,400 | 309,400 | 9,111,830 | 9,111,830 | ||||||||
| 22,948,428 | 79,650,074 | 102,798,502 | ||||||||||
Insurance 0.9% | ||||||||||||
Assurant, Inc. | 125,900 | 125,900 | 3,166,385 | 3,166,385 | ||||||||
Axis Capital Holdings Ltd. | 191,300 | 191,300 | 5,652,915 | 5,652,915 | ||||||||
| 0 | 8,819,300 | 8,819,300 | ||||||||||
Health Care 10.2% | ||||||||||||
Biotechnology 6.7% | ||||||||||||
Genzyme Corp. (General Division) | 184,300 | 184,300 | 8,669,472 | 8,669,472 | ||||||||
Gilead Sciences, Inc. | 184,500 | 184,500 | 10,289,565 | 10,289,565 | ||||||||
Invitrogen Corp. | 113,700 | 113,700 | 8,151,153 | 8,151,153 | ||||||||
Martek Biosciences Corp. | 107,200 | 107,200 | 6,110,400 | 6,110,400 | ||||||||
MedImmune, Inc. | 118,100 | 118,100 | 2,725,748 | 2,725,748 | ||||||||
Millennium Pharmaceuticals, Inc. | 177,400 | 177,400 | 2,998,060 | 2,998,060 | ||||||||
Neurocrine Biosciences, Inc. | 77,500 | 77,500 | 4,580,250 | 4,580,250 | ||||||||
Protein Design Labs, Inc. | 782,300 | 782,300 | 18,634,386 | 18,634,386 | ||||||||
| 24,565,611 | 37,593,423 | 62,159,034 | ||||||||||
Health Care Equipment & Supplies 0.5% | ||||||||||||
Kinetic Concepts, Inc. | 66,100 | 40,100 | 106,200 | 2,964,585 | 1,798,485 | 4,763,070 | ||||||
Health Care Providers & Services 0.7% | ||||||||||||
Caremark Rx, Inc. | 203,300 | 203,300 | 6,759,725 | 6,759,725 | ||||||||
Coventry Health Care, Inc. | 252,900 | 252,900 | 10,705,257 | 10,705,257 | ||||||||
| 6,759,725 | 10,705,257 | 17,464,982 | ||||||||||
Pharmaceuticals 2.3% | ||||||||||||
Barr Laboratories, Inc. | 184,350 | 184,350 | 8,461,665 | 8,461,665 | ||||||||
Celgene Corp. | 154,200 | 154,200 | 7,347,630 | 7,347,630 | ||||||||
NPS Pharmaceuticals, Inc. | 200,326 | 200,326 | 5,719,307 | 5,719,307 | ||||||||
| 13,066,937 | 8,461,665 | 21,528,602 | ||||||||||
Table of Contents
| Dynamic Growth Par/Share Amount | Mid Cap Growth Par/Share Amount | Pro Forma Combined Par/Shares Amount | Dynamic Growth Market Value ($) | Mid Cap Growth Market Value ($) | Pro Forma Combined Market Value ($) | |||||||
Industrials 9.7% | ||||||||||||
Airlines 1.1% | ||||||||||||
JetBlue Airways Corp. | 264,000 | 264,000 | 6,676,560 | 6,676,560 | ||||||||
SkyWest, Inc. | 187,600 | 187,600 | 3,609,424 | 3,609,424 | ||||||||
| 3,609,424 | 6,676,560 | 10,285,984 | ||||||||||
Commercial Services & Supplies 7.6% | ||||||||||||
Corinthian Colleges, Inc. | 266,900 | 664,200 | 931,100 | 8,823,714 | 21,958,452 | 30,782,166 | ||||||
Hewitt Associates, Inc. “A” | 248,000 | 248,000 | 7,938,480 | 7,938,480 | ||||||||
ITT Educational Services, Inc. | 110,400 | 279,700 | 390,100 | 3,444,480 | 8,726,640 | 12,171,120 | ||||||
Stericycle, Inc. | 113,600 | 299,900 | 413,500 | 5,436,896 | 14,353,214 | 19,790,110 | ||||||
| 17,705,090 | 52,976,786 | 70,681,876 | ||||||||||
Road & Rail 1.0% | ||||||||||||
Swift Transportation Co., Inc. | 216,800 | 323,500 | 540,300 | 3,722,456 | 5,554,495 | 9,276,951 | ||||||
Information Technology 24.0% | ||||||||||||
Communications Equipment 3.2% | ||||||||||||
Adaptec, Inc. | 621,900 | 621,900 | 5,447,844 | 5,447,844 | ||||||||
Advanced Fibre Communications, Inc. | 648,800 | 648,800 | 14,293,064 | 14,293,064 | ||||||||
Emulex Corp. | 202,400 | 202,400 | 4,309,096 | 4,309,096 | ||||||||
Foundry Networks, Inc. | 123,300 | 123,300 | 2,117,061 | 2,117,061 | ||||||||
QLogic Corp. | 113,500 | 113,500 | 3,746,635 | 3,746,635 | ||||||||
| 15,620,636 | 14,293,064 | 29,913,700 | ||||||||||
Computers & Peripherals 0.4% | ||||||||||||
Network Appliance, Inc. | 198,400 | 198,400 | 4,255,680 | 0 | 4,255,680 | |||||||
Electronic Equipment & Instruments 5.7% | ||||||||||||
AVX Corp. | 746,300 | 746,300 | 12,306,487 | 12,306,487 | ||||||||
Jabil Circuit, Inc. | 198,600 | 335,700 | 534,300 | 5,844,798 | 9,879,651 | 15,724,449 | ||||||
Tech Data Corp. | 412,100 | 412,100 | 16,871,374 | 16,871,374 | ||||||||
Vishay Intertechnology, Inc. | 376,500 | 376,500 | 8,034,510 | 8,034,510 | ||||||||
| 13,879,308 | 39,057,512 | 52,936,820 | ||||||||||
IT Consulting & Services 0.9% | ||||||||||||
Cognizant Technology Solutions Corp. | 186,200 | 186,200 | 0 | 8,425,550 | 8,425,550 | |||||||
Semiconductors & Semiconductor Equipment 8.1% | ||||||||||||
Applied Micro Circuits Corp. | 1,080,700 | 1,269,100 | 2,349,800 | 6,214,025 | 7,297,325 | 13,511,350 | ||||||
Fairchild Semiconductor International, Inc. | 598,900 | 598,900 | 14,391,567 | 14,391,567 | ||||||||
Linear Technology Corp. | 139,100 | 139,100 | 5,149,482 | 5,149,482 | ||||||||
LTX Corp. | 476,800 | 476,800 | 7,199,680 | 7,199,680 | ||||||||
Microchip Technology, Inc. | 142,500 | 142,500 | 3,784,800 | 3,784,800 | ||||||||
National Semiconductor Corp. | 100,000 | 100,000 | 4,443,000 | 4,443,000 | ||||||||
Teradyne, Inc. | 240,400 | 490,900 | 731,300 | 5,728,732 | 11,698,147 | 17,426,879 | ||||||
Varian Semiconductor Equipment Associates, Inc. | 97,700 | 97,700 | 4,103,400 | 4,103,400 | ||||||||
Xilinx, Inc. | 150,300 | 150,300 | 5,711,400 | 5,711,400 | ||||||||
| 35,134,839 | 40,586,719 | 75,721,558 | ||||||||||
Table of Contents
| Dynamic Growth Par/Share Amount | Mid Cap Growth Par/Share Amount | Pro Forma Combined Par/Shares Amount | Dynamic Growth Market Value ($) | Mid Cap Growth Market Value($) | Pro Forma Combined Market Value ($) | |||||||
Software 5.7% | ||||||||||||
Cognos, Inc. | 241,500 | 241,500 | 7,500,990 | 7,500,990 | ||||||||
Intuit, Inc. | 126,300 | 126,300 | 5,668,344 | 5,668,344 | ||||||||
Symantec Corp. | 459,200 | 459,200 | 21,260,960 | 21,260,960 | ||||||||
TIBCO Software, Inc. | 1,276,100 | 1,276,100 | 10,425,737 | 10,425,737 | ||||||||
VERITAS Software Corp. | 306,500 | 306,500 | 8,247,915 | 8,247,915 | ||||||||
| 13,169,334 | 39,934,612 | 53,103,946 | ||||||||||
Materials 5.0% | ||||||||||||
Containers & Packaging 2.8% | ||||||||||||
Packaging Corp. of America | 271,300 | 893,000 | 1,164,300 | 6,120,528 | 20,146,080 | 26,266,608 | ||||||
Metals & Mining 2.2% | ||||||||||||
Peabody Energy Corp. | 244,600 | 244,600 | 11,376,346 | 11,376,346 | ||||||||
United States Steel Corp. | 71,200 | 163,900 | 235,100 | 2,653,624 | 6,108,553 | 8,762,177 | ||||||
Telecommunications Services 1.2% | 2,653,624 | 17,484,899 | 20,138,523 | |||||||||
Wireless Telecommunication Services 1.2% | ||||||||||||
Nextel Partners, Inc. “A” | 285,400 | 616,700 | 902,100 | 3,613,164 | 7,807,422 | 11,420,586 | ||||||
Total Common Stocks (Cost $212,049,742, $511,618,694 and $723,668,436, respectively) | 265,186,314 | 617,896,026 | 883,082,340 | |||||||||
Preferred Stock 50.0% | ||||||||||||
Information Technology 0.0% | ||||||||||||
Software 0.0% | ||||||||||||
fusionOne | 690,608 | 690,608 | 99,448 | 99,448 | ||||||||
Planetweb, Inc. “E” | 413,603 | 413,603 | 0 | 0 | 0 | |||||||
| 99,448 | 0 | 99,448 | ||||||||||
Telecommunication Services 0.0% | ||||||||||||
Diversified Telecommunication Services 0.0% | ||||||||||||
Convergent Networks, Inc. | 345,565 | 345,565 | 44,923 | 0 | 44,923 | |||||||
Total Preferred Stocks (Cost $6,000,002, $0 and $6,000,002, respectively) | 144,371 | 0 | 144,371 | |||||||||
Cash Equivalents 5.5% | ||||||||||||
Scudder Cash Management QP Trust 1.10% | 1,665,341 | 49,552,887 | 51,218,228 | 1,665,341 | 49,552,887 | 51,218,228 | ||||||
Total Cash Equivalents (Cost $ 1,665,341, $49,552,887 and $51,218,228, respectively) | 1,665,341 | 49,552,887 | 51,218,228 | |||||||||
Total Investment Portfolio (Cost $219,715,085, $561,171,581 and $780,886,666, respectively) | 266,996,026 | 667,448,913 | 934,444,939 | |||||||||
Table of Contents
PRO FORMA CAPITALIZATION (UNAUDITED)
The following table sets forth the unaudited capitalization of Scudder Mid Cap Growth Fund and Scudder Dynamic Growth Fund as of March 31, 2004 as adjusted giving effect to the Reorganization discussed herein (1).
| Scudder Mid Cap Growth Fund | Scudder Dynamic Growth Fund | Pro Forma Adjustments | Pro Forma Combined | ||||||||||
Net Assets | |||||||||||||
Class A | $ | 251,208,765 | $ | 223,858,184 | $ | $ | 475,066,949 | ||||||
Class B | 9,098,577 | 32,679,806 | 41,778,383 | ||||||||||
Class C | 7,617,266 | 10,617,849 | 18,235,115 | ||||||||||
Class I (2) | — | 240,120 | (240,120 | ) | — | ||||||||
Investment Class | 43,174,425 | — | 43,174,425 | ||||||||||
Class R | 319,093 | — | 319,093 | ||||||||||
Institutional Class | 358,692,630 | — | 240,120 | 358,932,750 | |||||||||
Total Net Assets | $ | 670,110,756 | $ | 267,395,959 | $ | — | $ | 937,506,715 | |||||
Shares Outstanding | |||||||||||||
Class A | 19,937,440 | 68,926,673 | (51,160,150 | ) | 37,703,963 | ||||||||
Class B | 731,900 | 11,775,386 | (9,146,279 | ) | 3,361,007 | ||||||||
Class C | 612,778 | 3,740,624 | (2,886,412 | ) | 1,466,990 | ||||||||
Class I | — | 69,730 | (69,730 | ) | — | ||||||||
Investment Class | 3,425,192 | — | 3,425,192 | ||||||||||
Class R | 25,349 | — | 25,349 | ||||||||||
Institutional Class | 28,202,197 | — | 18,877 | 28,221,074 | |||||||||
Net Asset Value per Share | |||||||||||||
Class A | $ | 12.60 | $ | 3.25 | $ | 12.60 | |||||||
Class B | $ | 12.43 | $ | 2.78 | $ | 12.43 | |||||||
Class C | $ | 12.43 | $ | 2.84 | $ | 12.43 | |||||||
Class I | $ | — | $ | 3.44 | $ | — | |||||||
Investment Class | $ | 12.60 | $ | — | $ | 12.60 | |||||||
Class R | $ | 12.59 | $ | — | $ | 12.59 | |||||||
Institutional Class | $ | 12.72 | $ | — | $ | 12.72 | |||||||
| 1) | Assumes the Reorganization had been consummated on March 31, 2004, and is for information purposes only. No assurance can be given as to how many shares of the Scudder Mid Cap Growth Fund will be received by the shareholders of the Scudder Dynamic Growth Fund on the date the Reorganization takes place, and the foregoing should not be relied upon to reflect the number of shares of the Scudder Mid Cap Growth Fund that actually will be received on or after such date. |
| 2) | The “Class I” shares of Dynamic Growth Fund were renamed “Institutional Class” shares on August 13, 2004. |
Table of Contents
PRO FORMA FINANCIAL STATEMENTS (UNAUDITED)
PRO FORMA COMBINING CONDENSED STATEMENT OF ASSETS
AND LIABILITIES AS OF MARCH 31, 2004 (UNAUDITED)
| Scudder Mid Cap Growth Fund | Scudder Dynamic Growth Fund | Pro Forma Adjustments | Pro Forma Combined | ||||||||||
Investments, at value | $ | 667,448,913 | $ | 266,996,026 | $ | $ | 934,444,939 | ||||||
Cash | 18,496 | — | 18,496 | ||||||||||
Other assets less liabilities | 2,643,347 | 399,933 | — | 3,043,280 | |||||||||
Total Net assets | $ | 670,110,756 | $ | 267,395,959 | $ | — | $ | 937,506,715 | |||||
Net Assets | |||||||||||||
Class A | $ | 251,208,765 | $ | 223,858,184 | $ | $ | 475,066,949 | ||||||
Class B | 9,098,577 | 32,679,806 | 41,778,383 | ||||||||||
Class C | 7,617,266 | 10,617,849 | 18,235,115 | ||||||||||
Class I (9) | — | 240,120 | (240,120 | ) | — | ||||||||
Investment Class | 43,174,425 | — | 43,174,425 | ||||||||||
Class R | 319,093 | — | 319,093 | ||||||||||
Institutional Class | 358,692,630 | — | 240,120 | 358,932,750 | |||||||||
Total Net Assets | $ | 670,110,756 | $ | 267,395,959 | $ | — | $ | 937,506,715 | |||||
Shares Outstanding | |||||||||||||
Class A | 19,937,440 | 68,926,673 | (51,160,150 | ) | 37,703,963 | ||||||||
Class B | 731,900 | 11,775,386 | (9,146,279 | ) | 3,361,007 | ||||||||
Class C | 612,778 | 3,740,624 | (2,886,412 | ) | 1,466,990 | ||||||||
Class I (9) | — | 69,730 | (69,730 | ) | — | ||||||||
Investment Class | 3,425,192 | — | 3,425,192 | ||||||||||
Class R | 25,349 | — | 25,349 | ||||||||||
Institutional Class | 28,202,197 | — | 18,877 | 28,221,074 | |||||||||
Net Asset Value per Share | |||||||||||||
Class A | $ | 12.60 | $ | 3.25 | $ | 12.60 | |||||||
Class B | $ | 12.43 | $ | 2.78 | $ | 12.43 | |||||||
Class C | $ | 12.43 | $ | 2.84 | $ | 12.43 | |||||||
Class I | $ | 3.44 | |||||||||||
Investment Class | $ | 12.60 | $ | 12.60 | |||||||||
Class R | $ | 12.59 | $ | 12.59 | |||||||||
Institutional Class | $ | 12.72 | $ | 12.72 | |||||||||
Table of Contents
PRO FORMA COMBINING CONDENSED STATEMENT OF OPERATIONS
FOR THE TWELVE MONTH PERIOD ENDED MARCH 31, 2004 (UNAUDITED)
| Scudder Mid Cap Growth Fund | Scudder Dynamic Growth Fund | Pro Forma Adjustments | Pro Forma Combined | |||||||||||||
Investment Income: | ||||||||||||||||
Dividends | $ | 2,179,388 | $ | 401,201 | $ | — | $ | 2,580,589 | ||||||||
Interest | 390,203 | 112,755 | — | 502,958 | ||||||||||||
Total Investment Income | 2,569,591 | 513,956 | — | 3,083,547 | ||||||||||||
Expenses | ||||||||||||||||
Management fee | 3,744,647 | 2,043,395 | (381,292 | )(2) | 5,406,750 | |||||||||||
Administrator service fee | 2,420,560 | — | 1,054,519 | (3) | 3,475,079 | |||||||||||
Administrative fee | — | 484,367 | (484,367 | )(4) | — | |||||||||||
Services to Shareholders | — | 493,249 | (493,249 | )(5) | — | |||||||||||
Custodian Fees | — | 6,041 | (6,041 | )(5) | — | |||||||||||
Distribution service fees | 639,425 | 984,290 | 1,623,715 | |||||||||||||
Auditing | 66,782 | 25,893 | (22,554 | )(6) | 70,121 | |||||||||||
Legal | 17,986 | 3,891 | 3,926 | (7) | 25,803 | |||||||||||
Trustees’ fees and expenses | 14,156 | 36,056 | (10,009 | )(7) | 40,203 | |||||||||||
Reports to shareholders | 13,101 | 38,487 | 53,803 | (6) | 105,391 | |||||||||||
Registration fees | 66,278 | 28,372 | 2,242 | (6) | 96,892 | |||||||||||
Other expenses | 25,474 | 6,197 | 31,671 | |||||||||||||
Total expenses before reductions | 7,008,409 | 4,150,238 | (283,022 | ) | 10,875,625 | |||||||||||
Expense reductions | (423,081 | ) | (35,557 | ) | (240,298 | )(8) | (698,936 | ) | ||||||||
Expenses, net | 6,585,328 | 4,114,681 | (523,320 | ) | 10,176,689 | |||||||||||
Net investment income (loss) | (4,015,737 | ) | (3,600,725 | ) | 523,320 | (7,093,142 | ) | |||||||||
Net Realized and Unrealized Gain (Loss) | ||||||||||||||||
Net realized gain (loss) on investments | 51,555,348 | 30,512,758 | — | 82,068,106 | ||||||||||||
Net unrealized appreciation (depreciation) during the period on investments | 113,180,511 | 60,943,500 | — | 174,124,011 | ||||||||||||
Net gain (loss) on investment transactions | 164,735,859 | 91,456,258 | — | 256,192,117 | ||||||||||||
Net increase in net assets from operations | $ | 160,720,122 | $ | 87,855,533 | $ | 523,320 | $ | 249,098,975 | ||||||||
Notes to Pro Forma Combining Financial Statements
(Unaudited)
March 31, 2004
| 1. | These financial statements set forth the unaudited pro forma condensed Statement of Assets and Liabilities as of March 31, 2004, and the unaudited pro forma condensed Statement of Operations for the twelve month period ended March 31, 2004 for Scudder Mid Cap Growth Fund and Scudder Dynamic Growth Fund as adjusted giving effect to the Reorganization as if it had occurred at the beginning of the period. These statements have been derived from the books and records utilized in calculating daily net asset value for each fund. |
Table of Contents
| 2. | Represents reduction in management fees resulting from the utilization of Mid Cap Growth Fund’s management agreement for the pro-forma combined net assets. |
| 3. | Represents increase in Administrator’s Service Fee due to the increase in net assets resulting from the Reorganization. |
| 4. | Represents a reduction in expense as Mid Cap Growth Fund does not have an Administrative Fee. |
| 5. | Represents decrease in expenses as a result these expenses being covered under the Mid Cap Growth Fund’s Administrator’s Service Fee. |
| 6. | Represents estimated increase in expenses as a result of Mid Cap Growth Fund being responsible for certain expenses formerly covered under the Administrative Fee of Scudder Dynamic Growth Fund. |
| 7. | Represents estimated increase (decrease) in expense resulting from the Reorganization. |
| 8. | Represents increase in expense reductions as a result of the implementation of Mid Cap Growth Fund’s expense limitations. |
| 9. | The “Class I” shares will be exchanged for “Institutional Class” shares upon the completion of the Reorganization. |
Table of Contents

Small/Aggressive Growth II
Prospectus
February 1, 2004
Scudder Micro Cap Fund
Classes A, B and C
Scudder Mid Cap Fund
Classes A, B, C and R
Scudder Small Cap Fund
Classes A, B, C and R
As with all mutual funds, the Securities and Exchange Commission (SEC) does not approve or disapprove these shares or determine whether the information in this prospectus is truthful or complete. It is a criminal offense for anyone to inform you otherwise.
Table of Contents
Contents
| How the Funds Work | ||
| 4 | Scudder Micro Cap Fund | |
| 11 | Scudder Mid Cap Fund | |
| 19 | Scudder Small Cap Fund | |
| 27 | Other Policies and Secondary Risks | |
| 29 | Who Manages and Oversees the Funds | |
| 31 | Financial Highlights | |
| How to Invest in the Funds | ||
| 42 | Choosing a Share Class | |
| 49 | How to Buy Class A, B and C Shares | |
| 50 | How to Exchange or Sell Class A, B and C Shares | |
| 51 | How to Buy or Sell Class R Shares | |
| 52 | Policies You Should Know About | |
| 60 | Understanding Distributions and Taxes | |
Table of Contents
How the Funds Work
On the next few pages, you’ll find information about each fund’s investment goal, the main strategies each uses to pursue that goal and the main risks that could affect performance.
Whether you are considering investing in a fund or are already a shareholder, you’ll probably want to look this information over carefully. You may want to keep it on hand for reference as well.
Classes A, B and C shares are generally intended for investors seeking the advice and assistance of a financial advisor. Class R shares are only available to participants in certain retirement plans.
Remember that mutual funds are investments, not bank deposits. They’re not insured or guaranteed by the FDIC or any other government agency. Their share prices will go up and down and you could lose money by investing in them.
Table of Contents
| Class A | Class B | Class C | ||||
ticker symbol | SMFAX | SMFBX | SMFCX | |||
fund number | 489 | 689 | 789 | |||
Scudder Micro Cap Fund
The Fund’s Main Investment Strategy
The fund seeks capital appreciation.
Under normal circumstances, the fund invests at least 80% of its assets, determined at the time of purchase, in stocks and other securities with equity characteristics of US micro capitalization companies. For the purposes of this 80% limitation, the micro capitalization equity universe is defined as the bottom 5% of the total domestic equity market capitalization (at the time of investment) using a minimum market capitalization of $10 million. The fund may invest up to 20% of its total assets in the securities of foreign companies that would be considered to be in the bottom 5% in terms of market capitalization in the US equity market (subject to a $10 million market capitalization minimum).
The fund invests primarily in equity securities of US micro capitalization growth-oriented companies. The managers focus on individual security selection rather than industry selection. The managers use an active process which combines financial analysis with company visits to evaluate management and strategies.
Company research lies at the heart of our investment process. The managers use a “bottom-up” approach to picking securities. This approach focuses on individual stock selection rather than industry selection.
OTHER INVESTMENTS The fund is permitted, but not required, to use various types of derivatives (contracts whose value is based on, for example, indexes, currencies or securities). In particular, the fund may use futures, options and covered call options. To the extent the fund invests in foreign securities, the fund may enter into forward currency exchange contracts and buy and sell currency options to hedge
against currency exchange rate fluctuations. The fund may also use derivatives in circumstances where the managers believe they offer an economical means of gaining exposure to a particular asset class or to help meet shareholder redemptions or other needs while maintaining exposure to the market. (See “Other Policies and Secondary Risks” for more information.)
4 | Scudder Micro Cap Fund
Table of Contents
| n | The managers focus on undervalued stocks with fast-growing earnings and superior near-to-intermediate term performance potential. |
| n | The managers emphasize individual selection of smaller stocks across all economic sectors, early in their growth cycles and with the potential to be the blue chips of the future. |
| n | The managers generally seek companies with a leading or dominant position in their niche markets, a high rate of return on invested capital and the ability to finance a major part of future growth from internal sources. |
| n | The managers screen the bottom 5% of the total domestic equity market capitalization (subject to a $10 million capitalization minimum) for micro cap companies with growth and profitability. |
The fund may also invest up to 20% of its assets in high quality debt instruments and money market instruments with remaining maturities of one year or less, including repurchase agreements. The fund may invest up to 5% of its net assets in non-convertible bonds and preferred stocks that the managers believe to be of high quality.
The managers will normally sell a stock when they believe its potential risks have increased, its price is unlikely to go higher, its fundamental factors have changed, other investments offer better opportunities or in the course of adjusting the fund’s emphasis on a given industry.
Scudder Micro Cap Fund | 5
Table of Contents
The Main Risks of Investing in the Fund
There are several risk factors that could hurt the fund’s performance, cause you to lose money or make the fund perform less well than other investments.
Stock Market Risk. As with most stock funds, the most important factor with this fund is how stock markets perform — in this case, the micro capitalization portion of the US stock market. When stock prices fall, you should expect the value of your investments to fall as well. Because a stock represents ownership in its issuer, stock prices can be hurt by poor management, shrinking product demand and other business risks. These may affect single companies as well as groups of companies. In addition, movements in financial markets may adversely affect a stock’s price, regardless of how well the company performs. The market as a whole may not favor the types of investments the fund makes, and the fund may not be able to get an attractive price for them.
Security Selection Risk. A risk that pervades all investing is the risk that the securities the managers have selected will not perform to expectations. The managers could be incorrect in their analysis of companies, sectors, economic trends or other matters.
Micro Capitalization Company Risk. The fund’s investments in micro capitalization companies will be more susceptible to share price fluctuations since micro capitalization company stocks tend to experience steeper fluctuations in price — down as well as up — than the stocks of larger companies. A shortage of reliable information — the same information gap that creates opportunity in micro company investing — can also pose added risk. Industry-wide reversals may have a greater impact on micro capitalization companies, since they lack a large company’s financial resources. Micro capitalization companies may have limited product lines and markets. They may also have shorter operating histories and more volatile businesses. Finally, micro capitalization company stocks are typically less liquid than large company stocks. Particularly when they are performing poorly, a micro capitalization company’s shares may be more difficult to sell.
This fund is designed for investors with long-term goals who can tolerate capital fluctuation in pursuit of capital appreciation.
6 | Scudder Micro Cap Fund
Table of Contents
Foreign Securities Risk. Foreign securities may be more volatile than their US counterparts, for reasons such as currency fluctuations and political and economic uncertainty.
Pricing Risk. At times, market conditions might make it hard to value some investments. For example, if the fund has valued its securities too highly, you may end up paying too much for fund shares when you buy into the fund. If the fund underestimates the prices of its securities, you may not receive the full market value for your fund shares when you sell.
Another factor that could affect performance:
| n | derivatives could produce disproportionate losses (see “Secondary risks” for more information) |
Scudder Micro Cap Fund | 7
Table of Contents
The Fund’s Performance History
While a fund’s past performance (before and after taxes) isn’t necessarily a sign of how it will do in the future, it can be valuable for an investor to know.
The bar chart shows how the performance for the fund’s Class A shares has varied from year to year, which may give some idea of risk. The bar chart does not reflect sales loads; if it did, total returns would be lower. The table shows how fund performance compares with a broad-based market index (which, unlike the fund, does not have any fees or expenses). The table includes the effects of maximum sales loads. The performance of both the fund and the index varies over time. All figures assume reinvestment of dividends and distributions (in the case of after-tax returns, reinvested net of assumed tax rates).
The inception date for Class A, B and C shares is June 28, 2002. In the bar chart, the performance figures for Class A before that date are based on the historical performance of the fund’s original share class (Institutional Class), adjusted to reflect the higher gross total annual operating expenses of Class A.
In the table, the performance figures for each share class prior to its inception are based on the historical performance of the Institutional Class, adjusted to reflect both the higher gross total annual operating expenses and the current applicable sales charges for Class A, B and C. Institutional Class shares are offered in a different prospectus, which is available upon request.
The table shows returns on a before-tax and after-tax basis. After-tax returns are shown for Class A only and will vary for Class B and C. After-tax returns are calculated using the historical highest individual federal marginal income tax rates and do not reflect the impact of state and local taxes. Actual after-tax returns depend on an investor’s tax situation and may differ from those shown in the table. After-tax returns shown are not relevant to investors who hold their shares through tax-deferred arrangements, such as 401(k) plans or individual retirement accounts.
Scudder Micro Cap Fund
| Annual Total Returns (%) as of 12/31 each year | Class A |
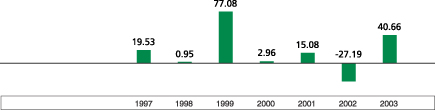
For the periods included in the bar chart:
Best Quarter: 29.66%, Q4 1999 | Worst Quarter: –24.17%, Q3 1998 |
8 | Scudder Micro Cap Fund
Table of Contents
| Average Annual Total Returns (%) as of 12/31/2003 | ||||||
| 1 Year | 5 Years | Since Inception* | ||||
| Class A | ||||||
Return before Taxes | 32.58 | 15.16 | 13.79 | |||
Return after Taxes on Distributions | 32.58 | 2.14 | 1.51 | |||
Return after Taxes on Distributions and Sale of Fund Shares | 19.16 | -0.02 | -0.59 | |||
| Class B (Return before Taxes) | 36.69 | 15.56 | 13.89 | |||
| Class C (Return before Taxes) | 38.30 | 15.44 | 13.73 | |||
| Index (reflects no deductions for fees, expenses or taxes) | 47.25 | 7.13 | 7.72 | |||
Index: Russell 2000 Index is an unmanaged index that tracks the common stock price movement of the 2,000 smallest companies of the Russell 3000 Index, which measures the performance of the 3,000 largest US companies based on total market capitalization.
| * | Since December 18, 1996 (inception date of Institutional Class). Index comparison begins on December 31, 1996. |
Total returns from inception through 2003 would have been lower if operating expenses hadn’t been reduced.
Current performance may be higher or lower than the performance data quoted above. For more recent performance information, call your financial representative or (800) 621-1048 or visit our Web site at www.scudder.com.
The Return after Taxes on Distributions assumes that an investor holds fund shares at the end of the period. The number only represents the fund’s taxable distributions, not a shareholder’s gain or loss from selling fund shares.
The Return after Taxes on Distributions and Sale of Fund Shares assumes that an investor sold his or her fund shares at the end of the period. The number reflects both the fund’s taxable distributions and a shareholder’s gain or loss from selling fund shares.
Scudder Micro Cap Fund | 9
Table of Contents
How Much Investors Pay
This table describes the fees and expenses that you may pay if you buy and hold fund shares.
| Fee Table | Class A | Class B | Class C | ||||||
| Shareholder Fees, paid directly from your investment | |||||||||
| Maximum Cumulative Sales Charge (Load) | 5.75 | % | 4.00 | % | 2.00 | % | |||
| Maximum Sales Charge (Load) Imposed on Purchases (as % of offering price) | 5.75 | None | 1.00 | ||||||
| Maximum Contingent Deferred Sales Charge (Load) (as % of redemption proceeds) | None | * | 4.00 | 1.00 | |||||
| Annual Operating Expenses, deducted from fund assets | |||||||||
| Management Fee | 1.50 | % | 1.50 | % | 1.50 | % | |||
| Distribution/Service (12b-1) Fee | 0.25 | 0.75 | 0.75 | ||||||
| Other Expenses** | 0.41 | 0.66 | 0.66 | ||||||
| Total Annual Operating Expenses | 2.16 | 2.91 | 2.91 | ||||||
| Less Fee Waivers/Expense Reimbursements*** | 0.42 | 0.42 | 0.42 | ||||||
| Total Net Annual Operating Expenses | 1.74 | 2.49 | 2.49 | ||||||
| * | The redemption of shares purchased at net asset value under the Large Order NAV Purchase Privilege (see “Policies You Should Know About — Policies about transactions”) may be subject to a contingent deferred sales charge of 1.00% if redeemed within one year of purchase and 0.50% if redeemed during the second year following purchase. |
| ** | Includes a 0.25% shareholder servicing fee for Class B and Class C shares. |
| *** | The advisor and administrator have contractually agreed to waive their fees or reimburse expenses until January 31, 2005, so that total operating expenses will not exceed 1.74% for Class A shares and 2.49% for Class B and C shares. |
Based on the costs above (including one year of capped expenses in each period), this example helps you compare the expenses of each share class to those of other mutual funds. This example assumes the expenses above remain the same. It also assumes that you invested $10,000, earned 5% annual returns, and reinvested all dividends and distributions. This is only an example; actual expenses will be different.
| Example | 1 Year | 3 Years | 5 Years | 10 Years | ||||||||
| Expenses, assuming you sold your shares at the end of each period | ||||||||||||
| Class A shares | $ | 742 | $ | 1,174 | $ | 1,631 | $ | 2,894 | ||||
| Class B shares | 652 | 1,161 | 1,696 | 2,863 | ||||||||
| Class C shares | 450 | 953 | 1,581 | 3,271 | ||||||||
| Expenses, assuming you kept your shares | ||||||||||||
| Class A shares | $ | 742 | $ | 1,174 | $ | 1,631 | $ | 2,894 | ||||
| Class B shares | 252 | 861 | 1,496 | 2,863 | ||||||||
| Class C shares | 350 | 953 | 1,581 | 3,271 | ||||||||
10 | Scudder Micro Cap Fund
Table of Contents
| Class A | Class B | Class C | Class R | |||||
ticker symbol | SMCAX | SMCBX | SMCCX | SMCRX | ||||
fund number | 483 | 683 | 783 | 1500 | ||||
Scudder Mid Cap Fund
The Fund’s Main Investment Strategy
The fund seeks long-term capital growth.
Under normal circumstances, the fund invests at least 80% of its assets, determined at the time of purchase, in companies with market caps within the market capitalization range of the S&P Mid-Cap 400 Index or securities with equity characteristics that provide exposure to those companies. It may also invest in convertible securities when it is more advantageous than investing in a company’s common stock. The managers believe these companies contain the greatest concentration of businesses with significant growth prospects.
The fund invests primarily in equity securities of medium-sized growth-oriented companies. The managers focus on individual security selection rather than industry selection. The managers use an active process which combines financial analysis with company visits to evaluate management and strategies.
The fund may also invest up to 20% of its assets in stocks and other securities of companies based outside the US.
Company research lies at the heart of the investment process. The managers use a “bottom-up” approach to picking securities. This approach focuses on individual stock selection rather than industry selection.
Scudder Mid Cap Fund | 11
OTHER INVESTMENTS The fund is permitted, but not required, to use various types of derivatives (contracts whose value is based on, for example, indexes, currencies or securities). In particular, the fund may use futures, options and covered call options. The fund may use derivatives in circumstances where the managers believe they offer an economical means of gaining exposure to a particular asset class or to help meet shareholder redemptions or other needs while maintaining exposure to the market. (See “Other Policies and Secondary Risks” for more information.)
Table of Contents
| n | The managers focus on undervalued stocks with fast-growing earnings and superior near-to-intermediate term performance potential. |
| n | The managers emphasize individual selection of medium-sized stocks across all economic sectors, early in their growth cycles and with the potential to be the blue chips of the future. |
| n | The managers generally seek companies with leading or dominant position in their niche markets, a high rate of return on invested capital and the ability to finance a major part of future growth from internal sources. |
| n | The managers screen within the market capitalization range of the S&P Mid-Cap 400 Index for medium-sized companies with growth and profitability potential. |
The fund follows a disciplined selling process to try to lessen risk. We may sell a security if one or more of the following conditions take place:
| n | there is a material change in the company’s fundamentals; or |
| n | the stock price reaches the managers’ expectations. |
12 | Scudder Mid Cap Fund
Table of Contents
The Main Risks of Investing in the Fund
There are several risk factors that could hurt the fund’s performance, cause you to lose money or make the fund perform less well than other investments.
Stock Market Risk. As with most stock funds, the most important factor with this fund is how stock markets perform—in this case, the medium-sized capitalization portion of the US stock market. When stock prices fall, you should expect the value of your investment to fall as well. Because a stock represents ownership in its issuer, stock prices can be hurt by poor management, shrinking product demand and other business risks. These may affect single companies as well as groups of companies. In addition, movements in financial markets may adversely affect a stock’s price, regardless of how well the company performs. The market as a whole may not favor the types of investments the fund makes and the fund may not be able to get an attractive price for them.
Security Selection Risk. A risk that pervades all investing is the risk that the securities the managers have selected will not perform to expectations. The managers could be incorrect in their analysis of companies, sectors, economic trends or other matters.
Medium-Sized Company Risk. Medium-sized company stocks tend to experience steeper price fluctuations — down as well as up — than stocks of larger companies. A shortage of reliable information — the same information gap that creates opportunity — can pose added risk. Industry-wide reversals may have a greater impact on medium-sized companies, since they usually lack a large company’s financial resources. Medium-sized company stocks are typically less liquid than large company stocks: when things are going poorly, it is harder to find a buyer for a medium-sized company’s shares.
Foreign Securities Risk. Foreign securities may be more volatile than their US counterparts, for reasons such as currency fluctuations and political and economic uncertainty.
Pricing Risk. At times, market conditions might make it hard to value some investments. For example, if the fund has valued its securities too highly, you may end up paying too much for fund shares when you buy into
This fund is designed for investors with long-term goals who can tolerate capital fluctuation in pursuit of long-term capital growth.
Scudder Mid Cap Fund | 13
Table of Contents
the fund. If the fund underestimates the prices of its securities, you may not receive the full market value for your fund shares when you sell.
Another factor that could affect performance:
| n | derivatives could produce disproportionate losses (see “Secondary risks” for more information) |
14 | Scudder Mid Cap Fund
Table of Contents
The Fund’s Performance History
While a fund’s past performance (before and after taxes) isn’t necessarily a sign of how it will do in the future, it can be valuable for an investor to know.
The bar chart shows how the performance for the fund’s Class A shares has varied from year to year, which may give some idea of risk. The bar chart does not reflect sales loads; if it did, total returns would be lower. The table shows how fund performance compares with a broad-based market index (which, unlike the fund, does not have any fees or expenses). The table includes the effects of maximum sales loads. The performance of both the fund and the index varies over time. All figures assume reinvestment of dividends and distributions (in the case of after-tax returns, reinvested net of assumed tax rates).
The inception date for Class A, B and C shares was June 28, 2002. The inception date for Class R shares was July 1, 2003. In the bar chart, the performance figures for Class A before its inception date are based on the historical performance of the fund’s original share class (Investment Class), adjusted to reflect the higher gross total annual operating expenses of Class A.
In the table, the performance figures for each share class prior to its inception are based on the historical performance of Investment Class, adjusted to reflect both the higher gross total annual operating expenses for Class A, B, C or R and the current applicable sales charges of Classes A, B and C. Investment Class shares are offered in a different prospectus, which is available upon request.
The table shows returns on a before-tax and after-tax basis. After-tax returns are shown for Class A only and will vary for Class B and C. After-tax returns are calculated using the historical highest individual federal marginal income tax rates and do not reflect the impact of state and local taxes. Actual after-tax returns depend on an investor’s tax situation and may differ from those shown in the table. After-tax returns shown are not relevant for Class R shares or for investors who hold their shares through tax-deferred arrangements, such as 401(k) plans or individual retirement accounts.
Scudder Mid Cap Fund
| Annual Total Returns (%) as of 12/31 each year | Class A |
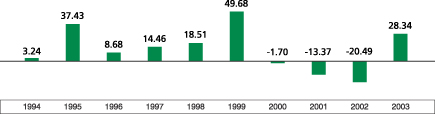
For the periods included in the bar chart:
Best Quarter: 29.95%, Q4 1999 | Worst Quarter: –19.58%, Q3 1998 |
Scudder Mid Cap Fund | 15
Table of Contents
| Average Annual Total Returns (%) as of 12/31/2003 | ||||||
| 1 Year | 5 Years | 10 Years | ||||
| Class A | ||||||
Return before Taxes | 20.96 | 4.16 | 9.87 | |||
Return after Taxes on Distributions | 20.96 | -4.06 | -2.05 | |||
Return after Taxes on Distributions | 11.61 | -3.98 | -2.16 | |||
| Class B (Return before Taxes) | 23.42 | 4.26 | 9.47 | |||
| Class C (Return before Taxes) | 26.15 | 4.22 | 9.36 | |||
| Class R (Return before Taxes) | 27.81 | 5.10 | 10.23 | |||
| Index (reflects no deductions for fees, expenses or taxes) | 35.62 | 9.21 | 13.93 | |||
Index: S&P Mid Cap 400 Index is an unmanaged index that tracks the stock movement of 400 mid-sized US companies.
Total returns from inception through 2003 would have been lower if operating expenses hadn’t been reduced.
Current performance may be higher or lower than the performance data quoted above. For more recent performance information, call your financial representative or (800) 621-1048 or visit our Web site at www.scudder.com.
The Return after Taxes on Distributions assumes that an investor holds fund shares at the end of the period. The number only represents the fund’s taxable distributions, not a shareholder’s gain or loss from selling fund shares.
The Return after Taxes on Distributions and Sale of Fund Shares assumes that an investor sold his or her fund shares at the end of the period. The number reflects both the fund’s taxable distributions and a shareholder’s gain or loss from selling fund shares.
16 | Scudder Mid Cap Fund
Table of Contents
How Much Investors Pay
This table describes the fees and expenses that you may pay if you buy and hold fund shares.
| Fee Table | Class A | Class B | Class C | Class R | ||||||||
| Shareholder Fees, paid directly from your investment | ||||||||||||
| Maximum Cumulative Sales Charge (Load) | 5.75 | % | 4.00 | % | 2.00 | % | None | |||||
| Maximum Sales Charge (Load) Imposed on Purchases (as % of offering price) | 5.75 | None | 1.00 | None | ||||||||
| Maximum Contingent Deferred Sales Charge (Load) (as % of redemption proceeds) | None1 | 4.00 | 1.00 | None | ||||||||
| Annual Operating Expenses, deducted from fund assets | ||||||||||||
| Management Fee | 0.65 | % | 0.65 | % | 0.65 | % | 0.65 | % | ||||
| Distribution (12b-1) Fee2 | 0.25 | 0.75 | 0.75 | 0.50 | ||||||||
| Other Expenses3,5 | 0.44 | 0.69 | 0.69 | 0.44 | ||||||||
| Total Annual Operating Expenses | 1.34 | 2.09 | 2.09 | 1.59 | ||||||||
| Less Expense Waiver/Reimbursement4 | 0.09 | 0.09 | 0.09 | 0.09 | ||||||||
| Total Net Annual Operating Expenses | 1.25 | 2.00 | 2.00 | 1.50 | ||||||||
| 1 | The redemption of shares purchased at net asset value under the Large Order NAV Purchase Privilege (see “Policies You Should Know About — Policies about transactions”) may be subject to a contingent deferred sales charge of 1.00% if redeemed within one year of purchase and 0.50% if redeemed during the second year following purchase. |
| 2 | Includes a shareholder servicing fee for Class R shares of up to 0.25%. |
| 3 | Includes a shareholder servicing fee for Class B and Class C shares of up to 0.25%. |
| 4 | The advisor and administrator have contractually agreed to waive their fees or reimburse expenses until January 31, 2005, so that total operating expenses will not exceed 1.25% for Class A shares, 2.00% for Class B and C shares and 1.50% for Class R shares. |
| 5 | Estimated for Class R since Class R shares had only three months of operations during the fund’s last fiscal year. |
Scudder Mid Cap Fund | 17
Table of Contents
Based on the costs above (including one year of capped expenses in each period), this example helps you compare the expenses of each share class to those of other mutual funds. This example assumes the expenses above remain the same. It also assumes that you invested $10,000, earned 5% annual returns, and reinvested all dividends and distributions. This is only an example; actual expenses will be different.
| Example | 1 Year | 3 Years | 5 Years | 10 Years | ||||||||
| Expenses, assuming you sold your shares at the end of each period | ||||||||||||
| Class A shares | $ | 695 | $ | 967 | $ | 1,259 | $ | 2,088 | ||||
| Class B shares | 603 | 946 | 1,315 | 2,046 | ||||||||
| Class C shares | 401 | 740 | 1,204 | 2,490 | ||||||||
| Class R shares | 153 | 493 | 857 | 1,882 | ||||||||
| Expenses, assuming you kept your shares | ||||||||||||
| Class A shares | $ | 695 | $ | 967 | $ | 1,259 | $ | 2,088 | ||||
| Class B shares | 203 | 646 | 1,115 | 2,046 | ||||||||
| Class C shares | 301 | 740 | 1,204 | 2,490 | ||||||||
| Class R shares | 153 | 493 | 857 | 1,882 | ||||||||
18 | Scudder Mid Cap Fund
Table of Contents
| Class A | Class B | Class C | Class R | |||||
ticker symbol | SSDAX | SSDBX | SSDCX | SSDRX | ||||
fund number | 471 | 671 | 771 | 1511 | ||||
Scudder Small Cap Fund
The Fund’s Main Investment Strategy
The fund seeks long-term capital growth.
Under normal circumstances, the fund invests at least 80% of its assets, determined at the time of purchase, in stocks and other securities with equity characteristics of US smaller capitalization companies. For purposes of this 80% investment limitation, the small capitalization equity securities universe is defined as the bottom 20% of the total domestic equity market capitalization (at the time of investment), using a minimum market capitalization of $10 million.
The fund invests primarily in equity securities of US smaller capitalization companies. The managers focus on individual security selection rather than industry selection. In managing the fund, we use a “bottom-up” approach in selecting portfolio securities. The fund’s portfolio management team uses an active investment process to evaluate company growth prospects and competitive strategies. Each portfolio manager has specific sector responsibilities with investment discretion over the securities within sectors.
The fund may also invest up to 20% of its assets in the stocks of non-US companies and large capitalization stocks.
Company research lies at the heart of our investment process. The managers use a “bottom-up” approach to picking securities. This approach focuses on individual stock selection.
OTHER INVESTMENTS The fund is permitted, but not required, to use various types of derivatives (contracts whose value is based on, for example, indexes, currencies or securities). In particular, the fund may use futures, options and covered call options. The fund may use derivatives in circumstances where the managers believe they offer an economical means of gaining exposure to a particular asset class or to help meet shareholder redemptions or other needs while maintaining exposure to the market. (See “Other Policies and Secondary Risks” for more information.)
Scudder Small Cap Fund | 19
Table of Contents
| n | The managers focus on stocks with superior growth prospects and above average near-to-intermediate term performance potential. |
| n | The managers emphasize individual selection of smaller stocks across all economic sectors, early in their growth cycles and with the potential to be the blue chips of the future. |
| n | The managers generally seek companies with a leading or dominant position in their niche markets, a high rate of return on invested capital and the ability to finance a major part of future growth from internal sources. |
| n | The managers screen the bottom 20% of the total domestic equity market capitalization, using a minimum market capitalization of $10 million, utilizing specific criteria for each individual sector. |
The managers look primarily for financial attributes that set these companies apart:
| n | estimated above-average growth in revenues and earnings; and |
| n | a balance sheet that can support this growth potential with sufficient working capital and manageable levels of debt. |
The managers will normally sell a stock when they believe it has one or more of the following signs of negative change:
| n | decelerating revenue or earnings growth; |
| n | loss of market share; |
| n | increasing levels of debt or decreasing levels of cash flow and working capital; and |
| n | a stock price that lags behind competitors’. |
20 | Scudder Small Cap Fund
Table of Contents
The Main Risks of Investing in the Fund
There are several risk factors that could hurt the fund’s performance, cause you to lose money or make the fund perform less well than other investments.
Stock Market Risk. As with most stock funds, the most important factor with this fund is how stock markets perform — in this case, the small company portion of the US stock market. When stock prices fall, you should expect the value of your investment to fall as well. Because a stock represents ownership in its issuer, stock prices can be hurt by poor management, shrinking product demand and other business risks. These may affect single companies as well as groups of companies. In addition, movements in financial markets may adversely affect a stock’s price, regardless of how well the company performs. The market as a whole may not favor the types of investments the fund makes and the fund may not be able to get an attractive price for them.
Security Selection Risk. A risk that pervades all investing is the risk that the securities the managers have selected will not perform to expectations. The managers could be incorrect in their analysis of companies, sectors, economic trends or other matters.
Small Company Capitalization Risk. Small company stocks tend to experience steeper price fluctuations — down as well as up — than the stocks of larger companies. A shortage of reliable information —the same information gap that creates opportunity — can also pose added risk. Industry-wide reversals may have a greater impact on small companies, since they lack a large company’s financial resources. Small company stocks are typically less liquid than large company stocks: when things are going poorly, it is harder to find a buyer for a small company’s shares.
Foreign Securities Risk. Foreign securities may be more volatile than their US counterparts, for reasons such as currency fluctuations and political and economic uncertainty.
Pricing Risk. At times, market conditions might make it hard to value some investments. For example, if the fund has valued its securities too highly, you may end up paying too much for fund shares when you buy into the fund. If the fund underestimates the prices of its
Scudder Small Cap Fund | 21
Table of Contents
securities, you may not receive the full market value for your fund shares when you sell.
Another factor that could affect performance:
| n | derivatives could produce disproportionate losses (see “Secondary risks” for more information) |
22 | Scudder Small Cap Fund
Table of Contents
The Fund’s Performance History
While a fund’s past performance (before and after taxes) isn’t necessarily a sign of how it will do in the future, it can be valuable for an investor to know.
The bar chart shows how the performance for the fund’s Class A shares has varied from year to year, which may give some idea of risk. The bar chart does not reflect sales loads; if it did, total returns would be lower. The table shows how fund performance compares with a broad-based market index (which, unlike the fund, does not have any fees or expenses). The table includes the effects of maximum sales loads. The performance of both the fund and the index varies over time. All figures assume reinvestment of dividends and distributions (in the case of after-tax returns, reinvested net of assumed tax rates).
The inception date for Class A, B and C shares was June 28, 2002. The inception date for Class R shares was October 1, 2003. In the bar chart, the performance figures for Class A before its inception date are based on the historical performance of the fund’s original share class (Investment Class), adjusted to reflect the higher gross total annual operating expenses of Class A.
In the table, the performance figures for each share class prior to its inception are based on the historical performance of Investment Class, adjusted to reflect both the higher gross total annual operating expenses for Class A, B, C or R and the current applicable sales charge of Classes A, B, and C. Investment Class shares are offered in a different prospectus, which is available upon request.
The table shows returns on a before-tax and after-tax basis. After-tax returns are shown for Class A only and will vary for Class B and C. After-tax returns are calculated using the historical highest individual federal marginal income tax rates and do not reflect the impact of state and local taxes. Actual after-tax returns depend on an investor’s tax situation and may differ from those shown in the table. After-tax returns shown are not relevant for Class R shares or for investors who hold their shares through tax-deferred arrangements, such as 401(k) plans or individual retirement accounts.
Scudder Small Cap Fund
| Annual Total Returns (%) as of 12/31 each year | Class A |
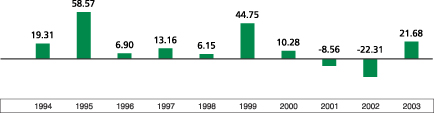
For the periods included in the bar chart:
Best Quarter: 30.11%, Q3 1997 | Worst Quarter: –24.39%, Q3 1998 |
Scudder Small Cap Fund | 23
Table of Contents
| Average Annual Total Returns (%) as of 12/31/2003 | ||||||
| 1 Year | 5 Years | 10 Years | ||||
| Class A | ||||||
Return before Taxes | 14.68 | 5.39 | 12.19 | |||
Return after Taxes on Distributions | 14.68 | –2.61 | –1.32 | |||
Return after Taxes on Distributions | 7.53 | –3.01 | –3.16 | |||
| Class B (Return before Taxes) | 16.80 | 5.70 | 12.02 | |||
| Class C (Return before Taxes) | 19.53 | 5.64 | 11.90 | |||
| Class R (Return before Taxes) | 21.43 | 6.28 | 12.45 | |||
| Index (reflects no deductions for fees, expenses or taxes) | 47.25 | 7.13 | 9.47 | |||
Index: Russell 2000 Index is an unmanaged index that tracks the common stock price movement of the 2000 smallest companies of the Russell 3000 Index, which measures the performance of the 3000 largest US companies based on total market capitalization.
Current performance may be higher or lower than the performance data quoted above. Total returns from inception through 2003 would have been lower if operating expenses hadn’t been reduced.
For more recent performance information, call your financial representative or (800) 621-1048 or visit our Web site at www.scudder.com.
The Return after Taxes on Distributions assumes that an investor holds fund shares at the end of the period. The number only represents the fund’s taxable distributions, not a shareholder’s gain or loss from selling fund shares.
The Return after Taxes on Distributions and Sale of Fund Shares assumes that an investor sold his or her fund shares at the end of the period. The number reflects both the fund’s taxable distributions and a shareholder’s gain or loss from selling fund shares.
24 | Scudder Small Cap Fund
Table of Contents
How Much Investors Pay
This table describes the fees and expenses that you may pay if you buy and hold fund shares.
| Fee Table | Class A | Class B | Class C | Class R | ||||||||
| Shareholder Fees, paid directly from your investment | ||||||||||||
| Maximum Cumulative Sales Charge (Load) | 5.75 | % | 4.00 | % | 2.00 | % | None | |||||
| Maximum Sales Charge (Load) Imposed on Purchases (as % of offering price) | 5.75 | None | 1.00 | None | ||||||||
| Maximum Contingent Deferred Sales Charge (Load) (as % of redemption proceeds) | None1 | 4.00 | 1.00 | None | ||||||||
| Annual Operating Expenses, deducted from fund assets | ||||||||||||
| Management Fee | 0.65 | % | 0.65 | % | 0.65 | % | 0.65 | % | ||||
| Distribution (12b-1) Fee2 | 0.25 | 0.75 | 0.75 | 0.50 | ||||||||
| Other Expenses3,5 | 0.47 | 0.72 | 0.72 | 0.47 | ||||||||
| Total Annual Operating Expenses | 1.37 | 2.12 | 2.12 | 1.62 | ||||||||
| Less Fee Waiver/Expense Reimbursement4 | 0.12 | 0.12 | 0.12 | 0.12 | ||||||||
| Total Net Annual Operating Expenses | 1.25 | 2.00 | 2.00 | 1.50 | ||||||||
| 1 | The redemption of shares purchased at net asset value under the Large Order NAV Purchase Privilege (see “Policies You Should Know About — Policies about transactions”) may be subject to a contingent deferred sales charge of 1.00% if redeemed within one year of purchase and 0.50% if redeemed during the second year following purchase. |
| 2 | Includes a shareholder servicing fee for Class R shares of up to 0.25%. |
| 3 | Includes a shareholder servicing fee for Class B and Class C shares of up to 0.25%. |
| 4 | The advisor and administrator have contractually agreed to waive their fees or reimburse expenses until January 31, 2005, so that total operating expenses will not exceed 1.25% for Class A shares, 2.00% for Class B and C shares and 1.50% for Class R shares. |
| 5 | Estimated for Class R since no Class R shares were issued as of the fund’s fiscal year end. |
Scudder Small Cap Fund | 25
Table of Contents
| Example | 1 Year | 3 Years | 5 Years | 10 Years | ||||||||
| Expenses, assuming you sold your shares at the end of each period | ||||||||||||
| Class A shares | $ | 695 | $ | 973 | $ | 1,271 | $ | 2,117 | ||||
| Class B shares | 603 | 952 | 1,328 | 2,075 | ||||||||
| Class C shares | 401 | 746 | 1,217 | 2,518 | ||||||||
| Class R shares | 153 | 499 | 870 | 1,912 | ||||||||
| Expenses, assuming you kept your shares | ||||||||||||
| Class A shares | $ | 695 | $ | 973 | $ | 1,271 | $ | 2,117 | ||||
| Class B shares | 203 | 652 | 1,128 | 2,075 | ||||||||
| Class C shares | 301 | 746 | 1,217 | 2,518 | ||||||||
| Class R shares | 153 | 499 | 870 | 1,912 | ||||||||
26 | Scudder Small Cap Fund
Based on the costs above (including one year of capped expenses in each period), this example helps you compare the expenses of each share class to those of other mutual funds. This example assumes the expenses above remain the same. It also assumes that you invested $10,000, earned 5% annual returns, and reinvested all dividends and distributions. This is only an example; actual expenses will be different.
Table of Contents
Other Policies and Secondary Risks
While the sections on the previous pages describe the main points of each fund’s strategy and risks, there are a few other issues to know about.
Other policies
| n | Although major changes tend to be infrequent, a fund’s Board could change that fund’s investment goal without seeking shareholder approval. In addition, the applicable Board will provide shareholders with at least 60 days’ notice prior to making any changes to the 80% investment policy, as described herein, of each fund. |
| n | The funds may trade securities actively. This could raise transaction costs (thus lowering return) and could result in higher taxable distributions. |
| n | As a temporary defensive measure, each fund could shift up to 100% of assets into investments such as money market investments or other short-term bonds that offer comparable safety, or cash (Scudder Micro Cap Fund only). In addition, as a temporary defensive position, Scudder Mid Cap Fund and Scudder Small Cap Fund may each invest up to 100% of assets in the common stock of larger companies, or in fixed-income securities. This could prevent losses, but, while engaged in a temporary defensive position, a fund may not achieve its investment objective. However, the portfolio managers may choose not to use these strategies for various reasons, even in very volatile market conditions. |
| n | Each fund’s equity investments are mainly common stocks, but may also include other types of equities such as preferred or convertible securities. |
| n | Each fund may use hedging transactions to attempt to reduce specific risks. For example, to protect a fund against circumstances that would normally cause the fund’s portfolio securities to decline in value, the fund may buy or sell a derivative contract that would normally increase in value under the same circumstances. A fund’s ability to hedge may be limited by the costs of the derivatives contracts. A fund may attempt to lower the cost of hedging by entering into transactions that provide only limited protection, |
Other Policies and Secondary Risks | 27
Table of Contents
including transactions that (1) hedge only a portion of the fund, (2) use derivatives contracts that cover a narrow range of circumstances or (3) involve the sale of derivatives contracts with different terms. |
Secondary risks
Derivatives Risk. Although not one of its principal investment strategies, each fund may invest in certain types of derivatives. Risks associated with derivatives include: the risk that the derivative is not well correlated with the security, index or currency to which it relates; derivatives used for risk management may not have the intended effects and may result in losses or missed opportunities; the risk that the fund will be unable to sell the derivative because of an illiquid secondary market; and the risk that the derivatives transaction could expose the fund to the effects of leverage, which could increase the fund’s exposure to the market and magnify potential losses. There is no guarantee that these derivatives activities will be employed or that they will work, and their use could cause lower returns or even losses to a fund.
For more information
This prospectus doesn’t tell you about every policy or risk of investing in the funds.
If you want more information on a fund’s allowable securities and investment practices and the characteristics and risks of each one, you may want to request a copy of the Statement of Additional Information (the back cover tells you how to do this).
Keep in mind that there is no assurance that any mutual fund will achieve its goal.
28 | Other Policies and Secondary Risks
Table of Contents
Who Manages and Oversees the Funds
Scudder Investments is part of Deutsche Asset Management, which is the marketing name in the US for the asset management activities of Deutsche Bank AG, Deutsche Investment Management Americas Inc., Deutsche Asset Management, Inc. (“DeAM, Inc.”), Deutsche Asset Management Investment Services Ltd., Deutsche Bank Trust Company Americas and Scudder Trust Company.
The investment advisor
DeAM, Inc. is the investment advisor for each fund. Under the supervision of each fund’s Board of Trustees, DeAM, Inc., with headquarters at 345 Park Avenue, New York, NY 10154, makes each fund’s investment decisions, buys and sells securities for each fund and conducts the research that leads to these purchase and sale decisions. DeAM, Inc. provides a full range of global investment advisory services to institutional and retail clients. DeAM, Inc. is also responsible for selecting brokers and dealers and for negotiating brokerage commissions and dealer charges.
Deutsche Asset Management is a global asset management organization that offers a wide range of investing expertise and resources, including hundreds of portfolio managers and analysts and an office network that reaches the world’s major investment centers. This well-resourced global investment platform brings together a wide variety of experience and investment insight across industries, regions, assets classes and investing styles.
DeAM, Inc. is an indirect wholly owned subsidiary of Deutsche Bank AG. Deutsche Bank AG is a major global banking institution that is engaged in a wide range of financial services, including investment management, mutual fund, retail, private and commercial banking, investment banking and insurance.
Who Manages and Oversees the Funds | 29
Table of Contents
The advisor receives a management fee from each fund. Below are the actual rates paid by each fund net of fee waivers for the most recent fiscal year, as a percentage of each fund’s average daily net assets:
| Fund Name | Fee Paid | |
| Scudder Micro Cap Fund | 1.09% | |
| Scudder Mid Cap Fund | 0.56% | |
| Scudder Small Cap Fund | 0.52% |
The portfolio managers
The following people handle the day-to-day management of each fund.
| Audrey M. T. Jones, CFA | Bob Grandhi, CFA | |
| Managing Director of Deutsche Asset Management and Lead Manager of each fund. | Director of Deutsche Asset Management and Manager of each fund. | |
nJoined the advisor in 1986 and each fund at its inception. n32 years of investment industry experience. Doris R. Klug, CFA Director of Deutsche Asset Management and Manager of each fund. nJoined the advisor in 2000. nVice President of Mutual of America from 1993 to 2000. n23 years experience of financial industry experience. nMBA from New York University Stern School of Business. | nJoined the advisor in 2001. nPortfolio manager at Monument Funds Group and Daiwa Securities from 2000 to 2001 and 1990 to 2000, respectively. n27 years of financial industry experience. nMBA from Illinois Institute of Technology. Samuel A. Dedio Director of Deutsche Asset Management and Manager of each fund. nJoined Deutsche Asset Management in 1999, formerly serving as analyst at Ernst & Young, LLP, Evergreen Asset Management and Standard & Poor’s Corp. nPortfolio manager for US Small- and Mid-Cap Active Equity Group and senior small cap analyst for technology. n13 years of investment industry experience. nMS in Accounting from American University’s Kogod School of Business. nJoined the funds in 2002. |
30 | Who Manages and Oversees the Funds
Table of Contents
Financial Highlights | 31
Financial Highlights
These tables are designed to help you understand each fund’s financial performance in recent years. The figures in the first part of each table are for a single share. The total return figures represent the percentage that an investor in a particular fund would have earned (or lost), assuming all dividends and distributions were reinvested. This information has been audited by PricewaterhouseCoopers LLP, independent auditors, whose reports, along with each fund’s financial statements, are included in that fund’s annual report (see “Shareholder reports” on the back cover).
Scudder Micro Cap Fund — Class A
| Years Ended September 30, | 2003 | 2002a | ||||||
| Selected Per Share Data | ||||||||
| Net asset value, beginning of period | $ | 14.07 | $ | 18.24 | ||||
| Income (loss) from investment operations: | ||||||||
Net investment income (loss)b | (.18 | ) | .03 | |||||
Net realized and unrealized gain (loss) on investment transactions | 4.80 | (4.20 | ) | |||||
Total from investment operations | 4.62 | (4.17 | ) | |||||
| Net asset value, end of period | $ | 18.69 | $ | 14.07 | ||||
| Total Return (%)c | 32.84 | (22.86 | )** | |||||
| Ratios to Average Net Assets and Supplemental Data | ||||||||
| Net assets, end of period ($ millions) | 11 | .6 | ||||||
| Ratio of expenses before expense reductions (%) | 2.16 | 2.22 | * | |||||
| Ratio of expenses after expense reductions (%) | 1.74 | 1.74 | * | |||||
| Ratio of net investment income (loss) (%) | (1.09 | ) | .70 | * | ||||
| Portfolio turnover rate (%) | 74 | 66 | ||||||
| a | For the period June 28, 2002 (commencement of sales of Class A shares) to September 30, 2002. |
| b | Based on average shares outstanding during the period. |
| c | Total return would have been lower had certain expenses not been reduced. Total return does not reflect the effect of any sales charges. |
| * | Annualized |
| ** | Not annualized |
Table of Contents
Scudder Micro Cap Fund — Class B
| Years Ended September 30, | 2003 | 2002a | ||||||
| Selected Per Share Data | ||||||||
| Net asset value, beginning of period | $ | 14.04 | $ | 18.24 | ||||
| Income (loss) from investment operations: | ||||||||
Net investment income (loss)b | (.30 | ) | (.00 | )c | ||||
Net realized and unrealized gain (loss) on investment transactions | 4.78 | (4.20 | ) | |||||
Total from investment operations | 4.48 | (4.20 | ) | |||||
| Net asset value, end of period | $ | 18.52 | $ | 14.04 | ||||
| Total Return (%)d | 31.91 | (23.03 | )** | |||||
| Ratios to Average Net Assets and Supplemental Data | ||||||||
| Net assets, end of period ($ millions) | 3 | .3 | ||||||
| Ratio of expenses before expense reductions (%) | 2.91 | 2.97 | * | |||||
| Ratio of expenses after expense reductions (%) | 2.49 | 2.49 | * | |||||
| Ratio of net investment income (loss) (%) | (1.84 | ) | (.05 | )* | ||||
| Portfolio turnover rate (%) | 74 | 66 | ||||||
| a | For the period June 28, 2002 (commencement of sales of Class B shares) to September 30, 2002. |
| b | Based on average shares outstanding during the period. |
| c | Amount is less than $0.005. |
| d | Total return would have been lower had certain expenses not been reduced. Total return does not reflect the effect of any sales charges. |
| * | Annualized |
| ** | Not annualized |
32 | Financial Highlights
Table of Contents
Scudder Micro Cap Fund — Class C
| Years Ended September 30, | 2003 | 2002a | ||||||
| Selected Per Share Data | ||||||||
| Net asset value, beginning of period | $ | 14.04 | $ | 18.24 | ||||
| Income (loss) from investment operations: | ||||||||
Net investment income (loss)b | (.31 | ) | (.00 | )c | ||||
Net realized and unrealized gain (loss) on investment transactions | 4.78 | (4.20 | ) | |||||
Total from investment operations | 4.47 | (4.20 | ) | |||||
| Net asset value, end of period | $ | 18.51 | $ | 14.04 | ||||
| Total Return (%)d | 31.84 | (23.03 | )** | |||||
| Ratios to Average Net Assets and Supplemental Data | ||||||||
| Net assets, end of period ($ millions) | 5 | .3 | ||||||
| Ratio of expenses before expense reductions (%) | 2.91 | 2.97 | * | |||||
| Ratio of expenses after expense reductions (%) | 2.49 | 2.49 | * | |||||
| Ratio of net investment income (loss) (%) | (1.81 | ) | (.05 | )* | ||||
| Portfolio turnover rate (%) | 74 | 66 | ||||||
| a | For the period June 28, 2002 (commencement of sales of Class C shares) to September 30, 2002. |
| b | Based on average shares outstanding during the period. |
| c | Amount is less than $0.005. |
| d | Total return would have been lower had certain expenses not been reduced. Total return does not reflect the effect of any sales charges. |
| * | Annualized |
| ** | Not annualized |
Financial Highlights | 33
Table of Contents
Scudder Mid Cap Fund — Class A
| Years Ended September 30, | 2003 | 2002a | ||||||
| Selected Per Share Data | ||||||||
| Net asset value, beginning of period | $ | 9.31 | $ | 11.49 | ||||
| Income (loss) from investment operations: | ||||||||
Net investment income (loss)b | (.08 | ) | (.01 | ) | ||||
Net realized and unrealized gain (loss) on investment transactions | 2.23 | (2.17 | ) | |||||
Total from investment operations | 2.15 | (2.18 | ) | |||||
| Net asset value, end of period | $ | 11.46 | $ | 9.31 | ||||
| Total Return (%)c | 23.09 | (18.97 | )** | |||||
| Ratios to Average Net Assets and Supplemental Data | ||||||||
| Net assets, end of period ($ millions) | 212 | .6 | ||||||
| Ratio of expenses before expense reductions (%) | 1.34 | 1.48 | * | |||||
| Ratio of expenses after expense reductions (%) | 1.25 | 1.25 | * | |||||
| Ratio of net investment income (loss) (%) | (.74 | ) | (.63 | )* | ||||
| Portfolio turnover rate (%) | 82 | 120 | d | |||||
| a | For the period June 28, 2002 (commencement of sales of Class A shares) to September 30, 2002. |
| b | Based on average shares outstanding during the period. |
| c | Total return would have been lower had certain expenses not been reduced. Total return does not reflect the effect of any sales charges. |
| d | On March 28, 2002, the Capital Appreciation Portfolio was closed. This ratio includes the purchase and sale of portfolio securities of the Mid Cap Fund as a stand-alone fund in addition to the Capital Appreciation Portfolio. |
| * | Annualized |
| ** | Not annualized |
34 | Financial Highlights
Table of Contents
Scudder Mid Cap Fund — Class B
| Years Ended September 30, | 2003 | 2002a | ||||||
| Selected Per Share Data | ||||||||
| Net asset value, beginning of period | $ | 9.29 | $ | 11.49 | ||||
| Income (loss) from investment operations: | ||||||||
Net investment income (loss)b | (.15 | ) | (.03 | ) | ||||
Net realized and unrealized gain (loss) on investment transactions | 2.21 | (2.17 | ) | |||||
Total from investment operations | 2.06 | (2.20 | ) | |||||
| Net asset value, end of period | $ | 11.35 | $ | 9.29 | ||||
| Total Return (%)c | 22.17 | (19.15 | )** | |||||
| Ratios to Average Net Assets and Supplemental Data | ||||||||
| Net assets, end of period ($ millions) | 6 | .3 | ||||||
| Ratio of expenses before expense reductions (%) | 2.09 | 2.22 | * | |||||
| Ratio of expenses after expense reductions (%) | 2.00 | 2.00 | * | |||||
| Ratio of net investment income (loss) (%) | (1.49 | ) | (1.38 | )* | ||||
| Portfolio turnover rate (%) | 82 | 120d | ||||||
| a | For the period June 28, 2002 (commencement of sales of Class B shares) to September 30, 2002. |
| b | Based on average shares outstanding during the period. |
| c | Total return would have been lower had certain expenses not been reduced. Total return does not reflect the effect of any sales charges. |
| d | On March 28, 2002, the Capital Appreciation Portfolio was closed. This ratio includes the purchase and sale of portfolio securities of the Mid Cap Fund as a stand-alone fund in addition to the Capital Appreciation Portfolio. |
| * | Annualized |
| ** | Not annualized |
Financial Highlights | 35
Table of Contents
Scudder Mid Cap Fund — Class C
| Years Ended September 30, | 2003 | 2002a | ||||||
| Selected Per Share Data | ||||||||
| Net asset value, beginning of period | $ | 9.29 | $ | 11.49 | ||||
| Income (loss) from investment operations: | ||||||||
Net investment income (loss)b | (.16 | ) | (.03 | ) | ||||
Net realized and unrealized gain (loss) on investment transactions | 2.22 | (2.17 | ) | |||||
Total from investment operations | 2.06 | (2.20 | ) | |||||
| Net asset value, end of period | $ | 11.35 | $ | 9.29 | ||||
| Total Return (%)c | 22.17 | (19.15 | )** | |||||
| Ratios to Average Net Assets and Supplemental Data | ||||||||
| Net assets, end of period ($ millions) | 5 | .1 | ||||||
| Ratio of expenses before expense reductions (%) | 2.09 | 2.20 | * | |||||
| Ratio of expenses after expense reductions (%) | 2.00 | 2.00 | * | |||||
| Ratio of net investment income (loss) (%) | 1.49 | (1.38 | )* | |||||
| Portfolio turnover rate (%) | 82 | 120d | ||||||
| a | For the period June 28, 2002 (commencement of sales of Class C shares) to September 30, 2002. |
| b | Based on average shares outstanding during the period. |
| c | Total return would have been lower had certain expenses not been reduced. Total return does not reflect the effect of any sales charges. |
| d | On March 28, 2002, the Capital Appreciation Portfolio was closed. This ratio includes the purchase and sale of portfolio securities of the Mid Cap Fund as a stand-alone fund in addition to the Capital Appreciation Portfolio. |
| * | Annualized |
| ** | Not annualized |
36 | Financial Highlights
Table of Contents
Scudder Mid Cap Fund — Class R
| 2003a | ||||
| Selected Per Share Data | ||||
| Net asset value, beginning of period | $ | 10.78 | ||
| Income (loss) from investment operations: | ||||
Net investment income (loss)b | (.03 | ) | ||
Net realized and unrealized gain (loss) on investment transactions | .70 | |||
Total from investment operations | .67 | |||
| Net asset value, end of period | $ | 11.45 | ||
| Total Return (%) | 6.22 | ** | ||
| Ratios to Average Net Assets and Supplemental Data | ||||
| Net assets, end of period ($ millions) | .01 | |||
| Ratio of expenses, before expense reductions (%) | 1.59 | * | ||
| Ratio of expenses, after expense reductions (%) | 1.50 | * | ||
| Ratio of net investment income (loss) (%) | (1.12 | )* | ||
| Portfolio turnover rate (%) | 82 | |||
| a | For the period July 1, 2003 (commencement of sales of Class R shares) to September 30, 2003. |
| b | Based on average shares outstanding during the period. |
| * | Annualized |
| ** | Not annualized |
Financial Highlights | 37
Table of Contents
Scudder Small Cap Fund — Class A
| Years Ended September 30, | 2003 | 2002a | ||||||
| Selected Per Share Data | ||||||||
| Net asset value, beginning of period | $ | 16.58 | $ | 20.69 | ||||
| Income (loss) from investment operations: | ||||||||
Net investment income (loss)b | (.16 | ) | (.03 | ) | ||||
Net realized and unrealized gain (loss) on investment transactions | 3.32 | (4.08 | ) | |||||
Total from investment operations | 3.16 | (4.11 | ) | |||||
| Net asset value, end of period | $ | 19.74 | $ | 16.58 | ||||
| Total Return (%)c | 19.06 | (19.86 | )** | |||||
| Ratios to Average Net Assets and Supplemental Data | ||||||||
| Net assets, end of period ($ millions) | 25 | .6 | ||||||
| Ratio of expenses before expense reductions (%) | 1.37 | 1.37 | * | |||||
| Ratio of expenses after expense reductions (%) | 1.25 | 1.25 | * | |||||
| Ratio of net investment income (loss) (%) | (.90 | ) | (.75 | )* | ||||
| Portfolio turnover rate (%) | 74 | 87d | ||||||
| a | For the period June 28, 2002 (commencement of sales of Class A shares) to September 30, 2002. |
| b | Based on average shares outstanding during the period. |
| c | Total return would have been lower had certain expenses not been reduced. Total return does not reflect the effect of any sales charges. |
| d | On March 28, 2002, the Small Cap Portfolio was closed. This ratio includes the purchase and sale of portfolio securities of the Small Cap Fund as a stand-alone fund in addition to the Small Cap Portfolio. |
| * | Annualized |
| ** | Not annualized |
38 | Financial Highlights
Table of Contents
Scudder Small Cap Fund — Class B
| Years Ended September 30, | 2003 | 2002a | ||||||
| Selected Per Share Data | ||||||||
| Net asset value, beginning of period | $ | 16.55 | $ | 20.69 | ||||
| Income (loss) from investment operations: | ||||||||
Net investment income (loss)b | (.30 | ) | (.06 | ) | ||||
Net realized and unrealized gain (loss) on investment transactions | 3.31 | (4.08 | ) | |||||
Total from investment operations | 3.01 | (4.14 | ) | |||||
| Net asset value, end of period | $ | 19.56 | $ | 16.55 | ||||
| Total Return (%)c | 18.19 | (20.01 | )** | |||||
| Ratios to Average Net Assets and Supplemental Data | ||||||||
| Net assets, end of period ($ millions) | 2 | .3 | ||||||
| Ratio of expenses before expense reductions (%) | 2.12 | 2.12 | * | |||||
| Ratio of expenses after expense reductions (%) | 2.00 | 2.00 | * | |||||
| Ratio of net investment income (loss) (%) | (1.65 | ) | (1.50 | )* | ||||
| Portfolio turnover rate (%) | 74 | 87d | ||||||
| a | For the period June 28, 2002 (commencement of sales of Class B shares) to September 30, 2002. |
| b | Based on average shares outstanding during the period. |
| c | Total return would have been lower had certain expenses not been reduced. Total return does not reflect the effect of any sales charges. |
| d | On March 28, 2002, the Small Cap Portfolio was closed. This ratio includes the purchase and sale of portfolio securities of the Small Cap Fund as a stand-alone fund in addition to the Small Cap Portfolio. |
| * | Annualized |
| ** | Not annualized |
Financial Highlights | 39
Table of Contents
Scudder Small Cap Fund — Class C
| Years Ended September 30, | 2003 | 2002a | ||||||
| Selected Per Share Data | ||||||||
| Net asset value, beginning of period | $ | 16.55 | $ | 20.69 | ||||
| Income (loss) from investment operations: | ||||||||
Net investment income (loss) | (.30 | ) | (.06 | )b | ||||
Net realized and unrealized gain (loss) on investment transactions | 3.31 | (4.08 | ) | |||||
Total from investment operations | 3.01 | (4.14 | ) | |||||
| Net asset value, end of period | $ | 19.56 | $ | 16.55 | ||||
| Total Return (%)c | 18.19 | (20.01 | )** | |||||
| Ratios to Average Net Assets and Supplemental Data | ||||||||
| Net assets, end of period ($ millions) | 2 | .1 | ||||||
| Ratio of expenses before expense reductions (%) | 2.12 | 2.12 | * | |||||
| Ratio of expenses after expense reductions (%) | 2.00 | 2.00 | * | |||||
| Ratio of net investment income (loss) (%) | (1.65 | ) | (1.50 | )* | ||||
| Portfolio turnover rate (%) | 74 | 87 | d | |||||
| a | For the period June 28, 2002 (commencement of sales of Class C shares) to September 30, 2002. |
| b | Based on average shares outstanding during the period. |
| c | Total return would have been lower had certain expenses not been reduced. Total return does not reflect the effect of any sales charges. |
| d | On March 28, 2002, the Small Cap Portfolio was closed. This ratio includes the purchase and sale of portfolio securities of the Small Cap Fund as a stand-alone fund in addition to the Small Cap Portfolio. |
| * | Annualized |
| ** | Not annualized |
40 | Financial Highlights
Table of Contents
How to Invest in the Funds
The following pages tell you about many of the services, choices and benefits of being a shareholder. You’ll also find information on how to check the status of your account using the method that’s most convenient for you.
You can find out more about the topics covered here by speaking with your financial advisor or a representative of your workplace retirement plan or other investment provider.
Table of Contents
42 | Choosing a Share Class
Choosing a Share Class
This prospectus offers four share classes for each fund, except Scudder Micro Cap Fund, which offers three classes. Each class has its own fees and expenses, offering you a choice of cost structures. The funds offer other classes of shares separately. Class A, Class B and Class C shares are intended for investors seeking the advice and assistance of a financial advisor, who will typically receive compensation for those services. Class R shares are only available to participants in certain retirement plans.
Before you invest, take a moment to look over the characteristics of each share class, so that you can be sure to choose the class that’s right for you. You may want to ask your financial advisor to help you with this decision.
We describe each share class in detail on the following pages. But first, you may want to look at the table below, which gives you a brief comparison of the main features of each class.
| Classes A, B, C and R features | Points to help you compare | |
Class A nSales charges of up to 5.75%, charged when you buy shares nIn most cases, no charges when you sell shares nUp to 0.25% annual distribution fee |
nSome investors may be able to reduce or eliminate their sales charges; see next page nTotal annual operating expenses are lower than those for Class B or Class C | |
Class B nNo charges when you buy shares nDeferred sales charge declining from 4.00%, charged when you sell shares you bought within the last six years n0.75% annual distribution fee and 0.25% shareholder servicing fee |
nThe deferred sales charge rate falls to zero after six years nShares automatically convert to Class A after six years, which means lower annual expenses going forward | |
Class C nSales charge of 1.00% charged when you buy shares nDeferred sales charge of 1.00%, charged when you sell shares you bought within the last year n0.75% annual distribution fee and 0.25% shareholder servicing fee |
nThe deferred sales charge rate is lower than Class B, but your shares never convert to Class A, so annual expenses remain higher | |
Class R nNo charges when you buy or sell shares n0.25% annual distribution fee and 0.25% annual shareholder servicing fee |
nClass R is only available to participants in certain retirement plans |
Your financial advisor will typically be paid a fee when you buy shares and may receive different levels of compensation depending upon which class of shares you buy. In addition to these payments, a fund’s advisor or its affiliates may provide compensation to your financial advisor for distribution, administrative and promotional services.
Table of Contents
Choosing a Share Class | 43
Class A shares
Class A shares have a 12b-1 plan, under which a distribution fee of up to 0.25% is deducted from class assets each year. Because distribution fees are continuous in nature, these fees may, over time, increase the cost of your investment and may cost you more than paying other types of sales charges.
Class A shares have a sales charge that varies with the amount you invest:
| Your investment | Front-end Sales Charge as a % of offering price* | Front-end Sales Charge as a % of | ||
| Up to $50,000 | 5.75% | 6.10% | ||
| $50,000–$99,999 | 4.50 | 4.71 | ||
| $100,000–$249,999 | 3.50 | 3.63 | ||
| $250,000–$499,999 | 2.60 | 2.67 | ||
| $500,000–$999,999 | 2.00 | 2.04 | ||
| $1 million or more | See below and next page |
| * | The offering price includes the sales charge. |
You may be able to lower your Class A sales charges if:
| n | you plan to invest at least $50,000 over the next 24 months (“letter of intent”) |
| n | the amount of shares you already own (including shares in certain other funds) plus the amount you’re investing now is at least $50,000 (“cumulative discount”) |
| n | you are investing a total of $50,000 or more in several funds at once (“combined purchases”) |
The point of these three features is to let you count investments made at other times and in certain other funds for purposes of calculating your present sales charge. Any time you can use the privileges to “move” your investment into a lower sales charge category in the table above, it’s generally beneficial for you to do so. You can take advantage of these methods by filling in the appropriate sections of your application or by speaking with your financial advisor.
Class A shares may make sense for long-term investors, especially those who are eligible for reduced or eliminated sales charges.
Table of Contents
You may be able to buy Class A shares without sales charges when you are:
| n | reinvesting dividends or distributions |
| n | investing through certain workplace retirement plans |
| n | participating in an investment advisory program under which you pay a fee to an investment advisor or other firm for portfolio management services |
| n | exchanging an investment in Class A shares of another fund for an investment in the fund unless the fund in which you are investing has a higher sales load, in which case you would be required to pay the difference |
| n | a current or former director or trustee of the Deutsche or Scudder mutual funds |
| n | an employee, the employee’s spouse or life partner and children or step-children age 21 or younger of Deutsche Bank or its affiliates or a sub-advisor to any fund in the Scudder family of funds or a broker dealer authorized to sell shares of the funds |
There are a number of additional provisions that apply in order to be eligible for a sales charge waiver. Each fund may waive the sales charges for investors in other situations as well. Your financial advisor or Shareholder Services can answer your questions and help you determine if you are eligible.
If you’re investing $1 million or more, either as a lump sum or through one of the sales charge reduction features described on the previous page, you may be eligible to buy Class A shares without sales charges. However, you may be charged a contingent deferred sales charge (CDSC) of 1.00% on any shares you sell within the first year of owning them and a similar charge of 0.50% on shares you sell within the second year of owning them (“Large Order NAV Purchase Privilege”). This CDSC is waived under certain circumstances (see “Policies You Should Know About”). Your financial advisor or Shareholder Services can answer your questions and help you determine if you’re eligible.
44 | Choosing a Share Class
Table of Contents
Choosing a Share Class | 45
Class B shares
With Class B shares, you pay no up-front sales charges. Class B shares have a 12b-1 plan, under which a distribution fee of 0.75% deducted from class assets each year. Class B shares also deduct a 0.25% shareholder servicing fee from class assets each year. This means the annual expenses for Class B shares are somewhat higher (and their performance correspondingly lower) compared to Class A shares. After six years, Class B shares automatically convert to Class A shares which has the net effect of lowering the annual expenses from the seventh year on. However, unlike Class A shares, your entire investment goes to work immediately.
Class B shares have a CDSC. This charge declines over the years you own shares and disappears completely after six years of ownership. But for any shares you sell within those six years, you may be charged as follows:
| Year after you bought shares | CDSC on shares you sell | |
| First year | 4.00% | |
| Second or third year | 3.00 | |
| Fourth or fifth year | 2.00 | |
| Sixth year | 1.00 | |
| Seventh year and later | None (automatic conversion to Class A) |
This CDSC is waived under certain circumstances (see “Policies You Should Know About”). Your financial advisor or Shareholder Services can answer your questions and help you determine if you’re eligible.
While Class B shares don’t have any front-end sales charges, their higher annual expenses mean that over the years you could end up paying more than the equivalent of the maximum allowable front-end sales charge.
Class B shares may make sense for long-term investors who prefer to see all of their investment go to work right away and can accept somewhat higher annual expenses.
Table of Contents
46 | Choosing a Share Class
Class C shares
Class C shares have a 12b-1 plan under which a distribution fee of 0.75% is deducted from class assets each year. Class C shares also deduct a 0.25% shareholder servicing fee from class assets each year. Because of these fees, the annual expenses for Class C shares are similar to those of Class B shares, but higher than those for Class A shares (and the performance of Class C shares is correspondingly lower than that of Class A shares).
Unlike Class B shares, Class C shares do NOT automatically convert to Class A shares after six years, so they continue to have higher annual expenses.
Class C shares also have an up-front sales charge of 1.00%.
Front-end Sales Charge as a % of offering price* | Front-end Sales Charge as a % of your net investment | |
| 1.00% | 1.01% |
| * | The offering price includes the sales charge. |
You may be able to buy Class C shares without an up-front sales charge when you purchase Class C shares in connection with the following types of transactions:
| n | Additional purchases of Class C shares made in an existing account and in the same fund by existing Class C shareowners as of January 31, 2003; |
| n | Exchanges of Class C shares made in an existing account by current Class C shareowners as of January 31, 2003; |
| n | Purchases of Class C shares through certain omnibus accounts which have entered into an agreement with the advisor and/or the distributor; |
| n | Purchases of Class C shares through certain retirement plans which have entered into an agreement with the advisor and/or the distributor; and |
| n | Purchases of Class C shares through certain broker-dealers which have entered into an agreement with the advisor and/or the distributor. |
Class C shares may appeal to investors who plan to sell some or all shares within six years of buying them or who aren’t certain of their investment time horizon.
Table of Contents
Your financial advisor or Shareholder Services can answer your questions and help you determine if you are eligible for an up-front sales charge waiver.
Class C shares have a CDSC, but only on shares you sell within one year of buying them:
| Year after you bought shares | CDSC on shares you sell | |
| First year | 1.00% | |
| Second year and later | None |
This CDSC is waived under certain circumstances (see “Policies You Should Know About”). Your financial advisor or Shareholder Services can answer your questions and help you determine if you’re eligible.
Because Class C shares have an up-front sales charge and higher annual expenses, you could end up paying more than the equivalent of the maximum allowable front-end sales charge.
Choosing a Share Class | 47
Table of Contents
Class R shares
Class R shares have no initial sales charges or deferred sales charges. Class R shares have a 12b-1 plan, under which each year a distribution fee of 0.25% and a shareholder servicing fee of up to 0.25% are deducted from class assets. Because distribution fees are continuous in nature, these fees may, over time, increase the cost of your investment and may cost you more than paying other types of sales charges.
Eligibility requirements
You may buy Class R shares if you are a participant in any of the following types of employer-sponsored plans that offer Class R shares of the fund:
| n | All section 401(a) and 457 plans |
| n | Certain section 403(b)(7) plans |
| n | 401(k), profit sharing, money purchase pension and defined benefit plans |
| n | Non-qualified deferred compensation plans |
48 | Choosing a Share Class
Table of Contents
How to Buy Class A, B and C Shares
Once you’ve chosen a share class, use these instructions to make investments.
| First investment | Additional investments | |
$1,000 or more for regular accounts $500 or more for IRAs | $50 or more for regular accounts and IRA accounts $50 or more with an Automatic Investment Plan | |
Through a financial advisor nContact your advisor using the method that’s most convenient for you |
nContact your advisor using the method that’s most convenient for you | |
By mail or express mail (see below) nFill out and sign an application nSend it to us at the appropriate address, along with an investment check |
nSend a check made out to “Scudder Funds” and a Scudder investment slip to us at the appropriate address below nIf you don’t have an investment slip, simply include a letter with your name, account number, the full name of the fund and the share class and your investment instructions | |
By wire nCall (800) 621-1048 for instructions |
nCall (800) 621-1048 for instructions | |
By phone Not available |
nCall (800) 621-1048 for instructions | |
With an automatic investment plan Not available |
nTo set up regular investments from a bank checking account, call | |
On the Internet Not available |
nCall (800) 621-1048 to establish Internet access nGo to www.scudder.com and register nFollow the instructions for buying shares with money from your bank account |
Regular mail:
First Investment: Scudder Investments, PO Box 219356, Kansas City, MO 64121-9356 Additional Investments: Scudder Investments, PO Box 219154, Kansas City, MO 64121-9154
Express, registered or certified mail:
Scudder Investments, 811 Main Street, Kansas City, MO 64105-2005
Fax number: (800) 821-6234 (for exchanging and selling only)
How to Buy Shares | 49
Table of Contents
How to Exchange or Sell Class A, B and C Shares
Use these instructions to exchange or sell shares in your account.
| Exchanging into another fund | Selling shares | |
$1,000 or more to open a new account ($500 for IRAs) $50 or more for exchanges between existing accounts | Some transactions, including most for over $100,000, can only be ordered in writing with a signature guarantee; if you’re in doubt, see page 55 | |
Through a financial advisor nContact your advisor by the method that’s most convenient for you |
nContact your advisor by the method that’s most convenient for you | |
By phone or wire nCall (800) 621-1048 for instructions |
nCall (800) 621-1048 for instructions | |
By mail, express mail or fax (see previous page) Write a letter that includes: nthe fund, class and account number you’re exchanging out of nthe dollar amount or number of shares you want to exchange nthe name and class of the fund you want to exchange into nyour name(s), signature(s) and address, as they appear on your account na daytime telephone number |
Write a letter that includes: nthe fund, class and account number from which you want to sell shares nthe dollar amount or number of shares you want to sell nyour name(s), signature(s) and address, as they appear on your account na daytime telephone number | |
With an automatic exchange plan nTo set up regular exchanges from a fund account, call (800) 621-1048 |
Not available | |
With an automatic withdrawal plan Not available |
nTo set up regular cash payments from a fund account, call (800) 621-1048 | |
On the Internet nCall (800) 621-1048 to establish Internet access nGo to www.scudder.com and log in nFollow the instructions for making on-line exchanges |
nCall (800) 621-1048 to establish Internet access nGo to www.scudder.com and log in nFollow the instructions for making on-line redemptions |
50 | How to Exchange or Sell Shares
Table of Contents
How to Buy or Sell Class R Shares
If your plan sponsor has selected Class R shares as an investment option, you may buy Class R shares through your securities dealer or through any financial institution that is authorized to act as a shareholder servicing agent (“financial advisor”). Contact them for details on how to enter and pay for your order. Financial advisors include brokers or any other bank, dealer or other institution that has a sub-shareholder servicing agreement with the funds. Financial advisors may charge additional fees to investors for those services not otherwise included in their sub-distribution or servicing agreement, such as cash management or special trust or retirement investment reporting. The funds’ advisor or administrator may provide compensation to financial advisors for distribution, administrative and promotional services.
There are no minimum investments with respect to Class R shares.
Instructions for buying and selling shares must generally be submitted by your employer-sponsored plan, not by plan participants for whose benefit the shares are held. Please contact your financial advisor for information on how to open a fund account.
Buying and Selling Shares | 51
Table of Contents
Policies You Should Know About
Along with the instructions on the previous pages, the policies below may affect you as a shareholder. Some of this information, such as the section on dividends and taxes, applies to all investors, including those investing through investment providers.
If you are investing through an investment provider, check the materials you received from them about how to buy and sell shares. As a general rule, you should follow the information in those materials wherever it contradicts the information given here. Please note that an investment provider may charge fees separate from those charged by each fund.
In either case, keep in mind that the information in this prospectus applies only to each fund’s Class A, Class B, Class C and, as applicable, Class R shares. The funds have other share classes, which are described in separate prospectuses and have different fees, requirements and services.
In order to reduce the amount of mail you receive and to help reduce expenses, we generally send a single copy of any shareholder report and prospectus to each household. If you do not want the mailing of these documents to be combined with those for other members of your household, please contact your financial advisor or call (800) 621-1048.
Policies about transactions
Each fund is open for business each day the New York Stock Exchange is open. Each fund calculates its share price for each class every business day, as of the close of regular trading on the New York Stock Exchange (typically 4 p.m. Eastern time, but sometimes earlier, as in the case of scheduled half-day trading or unscheduled suspensions of trading). You can place an order to buy or sell shares at any time.
To help the government fight the funding of terrorism and money laundering activities, Federal law requires all financial institutions to obtain, verify, and record information that identifies each person who opens an account. What this means to you: When you open an account, we will ask for your name, address, date of birth, and other information that will allow us to identify you. Some or all of this information will be used to verify the identity of all persons opening an account.
52 | Policies You Should Know About
Table of Contents
We might request additional information about you (which may include certain documents, such as articles of incorporation for companies) to help us verify your identity, and in some cases the information and/or documents may be required to conduct the verification. The information and documents will be used solely to verify your identity.
We will attempt to collect any missing required and requested information by contacting you or your financial intermediary. If we are unable to obtain this information within the time frames established by the fund, then we may reject your application and order.
Each fund will not invest your purchase until all required and requested identification information has been provided and your application has been submitted in “good order.” After we receive all the information, your application is deemed to be in good order and we accept your purchase, you will receive the net asset value per share next calculated (less any applicable sales charges).
If we are unable to verify your identity within time frames established by each fund, after a reasonable effort to do so, you will receive written notification.
The funds generally will not accept new account applications to establish an account with a non-US address (APO/FPO and US territories are acceptable) or for a non-resident alien.
Because orders placed through investment providers must be forwarded to the transfer agent before they can be processed, you’ll need to allow extra time. A representative of your investment provider should be able to tell you when your order will be processed. It is the responsibility of your financial advisor to forward your order to the transfer agent in a timely manner.
IRA Rollovers. You may complete a direct rollover from an employer-sponsored plan offering Class R shares to an IRA account by reinvesting up to the full amount of your distribution in Class A shares of any Scudder Fund at net asset value. Subsequent purchases of Class A shares will be made at the public offering price as described in the prospectus for Class A shares. Please note that if you terminate your participation in an employer-sponsored plan and transfer all of your Class R shares, you will lose the privilege of
Policies You Should Know About | 53
Table of Contents
purchasing Class R shares in the future. Rollovers to a Scudder Class R share IRA are not permitted.
ScudderACCESS, the Scudder Automated Information Line, is available 24 hours a day by calling (800) 972-3060. You can use ScudderACCESS to get information on Scudder funds generally and on accounts held directly at Scudder. You can also use it to make exchanges and sell shares.
QuickBuy/QuickSell let you set up a link between a Scudder account and a bank account. Once this link is in place, you can move money between the two with a phone call. You’ll need to make sure your bank has Automated Clearing House (ACH) services. Transactions take two to three days to be completed and there is a $50 minimum and a $250,000 maximum. To set up QuickBuy/QuickSell on a new account, see the account application; to add it to an existing account, call (800) 621-1048.
Telephone and electronic transactions. You are automatically entitled to telephone and electronic transaction privileges, but you may elect not to have them when you open your account or by contacting Shareholder Services at a later date.
Since many transactions may be initiated by telephone or electronically, it’s important to understand that as long as we take reasonable steps to ensure that an order to purchase or redeem shares is genuine, such as recording calls or requesting personalized security codes or other information, we are not responsible for any losses that may occur as a result. For transactions conducted over the Internet, we recommend the use of a secure Internet browser. In addition, you should verify the accuracy of your confirmation statements immediately after you receive them.
Exchanges are a shareholder privilege, not a right: we may reject any exchange order or require a shareholder to own shares of a fund for 15 days before we process the purchase order for the other fund, particularly when there appears to be a pattern of “market timing” or other frequent purchases and sales. We may also reject or limit purchase orders, for these or other reasons. However, there is no assurance that
54 | Policies You Should Know About
Table of Contents
these policies will be effective in limiting the practice of market timing in all cases.
The funds accept payment for shares only in US dollars by check, bank or Federal Funds wire transfer, or by electronic bank transfer. Please note that we cannot accept cash, traveler’s checks, starter checks, money orders, third party checks, checks drawn on foreign banks, or checks issued by credit card companies or Internet-based companies.
When you ask us to send or receive a wire, please note that while we don’t charge a fee to send or receive wires, it’s possible that your bank may do so. Wire transactions are generally completed within 24 hours. The funds can only send wires of $1,000 or more and accept wires of $50 or more.
We do not issue share certificates. However, if you currently have shares in certificated form, you must include the share certificates properly endorsed or accompanied by a duly executed stock power when exchanging or redeeming shares. You may not exchange or redeem shares in certificate form by telephone or via the Internet.
When you want to sell more than $100,000 worth of shares or send proceeds to a third party or to a new address, you’ll usually need to place your order in writing and include a signature guarantee. The only exception is if you want money wired to a bank account that is already on file with us; in that case, you don’t need a signature guarantee. Also, you don’t generally need a signature guarantee for an exchange, although we may require one in certain other circumstances.
A signature guarantee is simply a certification of your signature — a valuable safeguard against fraud. You can get a signature guarantee from an eligible guarantor institution, including commercial banks, savings and loan, trust companies, credit unions, member firms of a national stock exchange, or any member or participant of an approved signature guarantor program. Note that you can’t get a signature guarantee from a notary public and we must be provided with the original guarantee.
Policies You Should Know About | 55
Table of Contents
Selling shares of trust accounts and business or organization accounts may require additional documentation. Please contact your financial advisor for more information.
When you sell shares that have a CDSC, we calculate the CDSC as a percentage of what you paid for the shares (less any initial sales charge) or what you are selling them for — whichever results in the lower charge to you. In processing orders to sell shares, we turn to the shares with the lowest CDSC first. Exchanges from one fund into another don’t affect CDSCs: for each investment you make, the date you first bought shares is the date we use to calculate a CDSC on that particular investment.
There are certain cases in which you may be exempt from a CDSC. Among others, these include:
| n | the death or disability of an account owner (including a joint owner) |
| n | withdrawals made through an automatic withdrawal plan. Such withdrawals may be made at a maximum of 12% per year of the net asset value of the account |
| n | withdrawals related to certain retirement or benefit plans |
| n | redemptions for certain loan advances, hardship provisions or returns of excess contributions from retirement plans |
| n | for Class A shares purchased through the Large Order NAV Purchase Privilege, redemption of shares whose dealer of record at the time of the investment notifies Scudder Distributors Inc., the fund’s distributor, that the dealer waives the applicable commission |
| n | for Class C shares, redemption of shares purchased through a dealer-sponsored asset allocation program maintained on an omnibus record-keeping system, provided the dealer of record has waived the advance of the first year distribution and service fees applicable to such shares and has agreed to receive such fees quarterly |
In each of these cases, there are a number of additional provisions that apply in order to be eligible for a CDSC waiver. Your financial advisor or Shareholder Services can answer your questions and help you determine if you are eligible.
56 | Policies You Should Know About
Table of Contents
If you sell shares in a Scudder fund and then decide to invest with Scudder again within six months, you can take advantage of the “reinstatement feature.” With this feature, you can put your money back into the same class of a Scudder fund at its current NAV and for purposes of sales charges it will be treated as if it had never left Scudder. You’ll be reimbursed (in the form of fund shares) for any CDSC you paid when you sold. Future CDSC calculations will be based on your original investment date, rather than your reinstatement date. There is also an option that lets investors who sold Class B shares buy Class A shares with no sales charge, although they won’t be reimbursed for any CDSC they paid. You can only use the reinstatement feature once for any given group of shares. To take advantage of this feature, contact Shareholder Services or your financial advisor.
Money from shares you sell is normally sent out within one business day of when your order is processed (not when it is received), although it could be delayed for up to seven days. There are also two circumstances when it could be longer: when you are selling shares you bought recently by check and that check hasn’t cleared yet (maximum delay: 10 days) or when unusual circumstances prompt the SEC to allow further delays. Certain expedited redemption processes may also be delayed when you are selling recently purchased shares.
You may obtain additional information about other ways to sell your shares by contacting your investment provider.
Policies You Should Know About | 57
Table of Contents
How the funds calculate share price
To calculate net asset value per share or NAV, each share class uses the following equation:
TOTAL ASSETS - TOTAL LIABILITIES | = | NAV | ||
| TOTAL NUMBER OF SHARES OUTSTANDING |
The price at which you buy shares is the NAV, although for Class A and Class C shares it will be adjusted to allow for any applicable sales charges (see “Choosing a Share Class”).
The price at which you sell shares is also the NAV, although for Class B and Class C investors a CDSC may be taken out of the proceeds (see “Choosing a Share Class”).
We typically value securities using market quotations or information furnished by a pricing service. However, we may use methods approved by a fund’s Board that are intended to reflect fair value when a market quotation or pricing service information is not readily available or when a security’s value is believed to have been materially affected by a significant event, such as a natural disaster, an economic event like a bankruptcy filing, or a substantial fluctuation in domestic or foreign markets that has occurred after the close of the exchange or market on which the security is principally traded (for example, a foreign exchange or market). In such a case, a fund’s value for a security is likely to be different from the last quoted market price or pricing service information.
To the extent that a fund invests in securities that are traded primarily in foreign markets, the value of its holdings could change at a time when you aren’t able to buy or sell fund shares. This is because some foreign markets are open on days or at times when the funds don’t price their shares.
Other rights we reserve
You should be aware that we may do any of the following:
| n | withdraw or suspend the offering of shares at any time |
| n | withhold a portion of your distributions as federal income tax if we have been notified by the IRS that you are subject to backup withholding or if you fail to provide us with a correct taxpayer ID |
58 | Policies You Should Know About
Table of Contents
number or certification that you are exempt from backup withholding |
| n | reject a new account application if you don’t provide any required or requested identifying information, or for other reasons |
| n | refuse, cancel or rescind any purchase or exchange order; freeze any account (meaning you will not be able to purchase fund shares in your account); suspend account services; and/or involuntarily redeem your account if we think that the account is being used for fraudulent or illegal purposes; one or more of these actions will be taken when, at our sole discretion, they are deemed to be in the fund’s best interest or when the fund is requested or compelled to do so by governmental authority or by applicable law |
| n | close and liquidate your account if we are unable to verify your identity, or for other reasons; if we decide to close your account, your fund shares will be redeemed at the net asset value per share next calculated after we determine to close your account (less any applicable sales charges or redemption fees); you may be subject to gain or loss on the redemption of fund shares and you may incur tax liability |
| n | for Class A, B and C shares, close your account and send you the proceeds if your balance falls below $1,000; we will give you 60 days’ notice so you can either increase your balance or close your account (these policies don’t apply to most retirement accounts, if you have an automatic investment plan, to investors with $100,000 or more in Scudder fund shares or in any case, where a fall in share price created the low balance) |
| n | pay you for shares you sell by “redeeming in kind,” that is, by giving you marketable securities (which typically will involve brokerage costs for you to liquidate) rather than cash; the fund generally won’t make a redemption in kind unless your requests over a 90-day period total more than $250,000 or 1% of the value of a fund’s net assets, whichever is less |
| n | change, add or withdraw various services, fees and account policies (for example, we may change or terminate the exchange privilege or adjust a fund’s investment minimums at any time) |
| n | suspend or postpone redemptions during periods when the New York Stock Exchange is closed (other than customary closings), trading is restricted or when an emergency exists that prevents the fund from disposing of its portfolio securities or pricing its shares |
Policies You Should Know About | 59
Table of Contents
Understanding Distributions and Taxes
By law, a mutual fund is required to pass through to its shareholders virtually all of its net earnings. A fund can earn money in two ways: by receiving interest, dividends or other income from securities it holds and by selling securities for more than it paid for them. (A fund’s earnings are separate from any gains or losses stemming from your own purchase of shares.) A fund may not always pay a distribution for a given period.
Each fund intends to pay dividends and distributions to its shareholders annually in December and, if necessary, may do so at other times as well.
For federal income tax purposes, income and capital gains distributions are generally taxable. However, distributions by a fund to retirement plans that qualify for tax-exempt treatment under federal income tax laws will not be taxable.
You can choose how to receive your dividends and distributions. You can have them all automatically reinvested in fund shares (at NAV), all deposited directly to your bank account or all sent to you by check, have one type reinvested and the other sent to you by check or have them invested in a different fund. Tell us your preference on your application. If you don’t indicate a preference, your dividends and distributions will all be reinvested without applicable sales charges. Distributions are taxable whether you receive them in cash or reinvest them in additional shares. For Class R shares and retirement plans, reinvestment (at NAV) is the only option.
Buying and selling fund shares will usually have tax consequences for you (except for Class R shares in an IRA or other tax-advantaged account). Your sale of shares may result in a capital gain or loss for you; whether long-term or short-term depends on how long you owned the shares. For tax purposes, an exchange is the same as a sale.
Because each shareholder’s tax situation is unique, ask your tax professional about the tax consequences of your investments, including any state and local tax consequences.
60 | Understanding Distributions and Taxes
Table of Contents
The tax status of a fund’s earnings you receive and your own fund transactions generally depends on their type:
| Generally taxed at capital gain rates: | Generally taxed at ordinary income rates: | |
Distributions from a fund ngains from the sale of securities held nqualified dividend income |
ngains from the sale of securities held by the fund for one year or less nall other taxable income | |
Transactions involving fund shares ngains from selling fund shares held |
ngains from selling fund shares held for one year or less |
Any investments in foreign securities may be subject to foreign withholding taxes. In that case, each fund’s yield on those securities would be decreased. Shareholders generally will not be entitled to claim a credit or deduction with respect to foreign taxes. In addition, any investments in foreign securities or foreign currencies may increase or accelerate each fund’s recognition of ordinary income and may affect the timing or amount of each fund’s distributions.
For taxable years beginning on or before December 31, 2008, distributions of investment income designated by each fund as derived from qualified dividend income are eligible for taxation in the hands of individuals at long-term capital gain rates. Qualified dividend income generally includes dividends from domestic and some foreign corporations. In addition, each fund must meet holding period and other requirements with respect to the dividend paying stocks in its portfolio and the shareholder must meet holding period and other requirements with respect to the fund’s shares for the lower rates to apply.
For taxable years beginning on or before December 31, 2008, long-term capital gain rates applicable to individuals have been reduced to 15%. For more information, see the Statement of Additional Information, under “Taxes.”
Your fund will send you detailed tax information every January. These statements tell you the amount and the tax category of any dividends or distributions you received. They also have certain
Understanding Distributions and Taxes | 61
Table of Contents
details on your purchases and sales of shares. Dividends or distributions declared in the last quarter of a given year are taxed in that year, even though you may not receive the money until the following January.
If you invest right before a fund pays a dividend, you’ll be getting some of your investment back as a taxable dividend. You can avoid this, if you want, by investing after the fund declares a dividend. In tax-advantaged retirement accounts you don’t need to worry about this.
Corporations may be able to take a dividends-received deduction for a portion of income dividends they receive.
62 | Understanding Distributions and Taxes
Table of Contents
Notes
Table of Contents
To Get More Information
Shareholder reports — These include commentary from each fund’s management team about recent market conditions and the effects of a fund’s strategies on its performance. They also have detailed performance figures, a list of everything each fund owns and its financial statements. Shareholders get these reports automatically.
Statement of Additional Information (SAI) — This tells you more about each fund’s features and policies, including additional risk information. The SAI is incorporated by reference into this document (meaning that it’s legally part of this prospectus).
For a free copy of any of these documents or to request other information about a fund, call (800) 621-1048, or contact Scudder Investments at the address listed below. These documents and other information about each fund are available from the EDGAR Database on the SEC’s Internet site at www.sec.gov. If you like, you may obtain copies of this information, after paying a copying fee, by e-mailing a request to publicinfo@sec.gov or by writing the SEC at the address listed below. You can also review and copy these documents and other information about each fund, including each fund’s SAI, at the SEC’s Public Reference Room in Washington, D.C. Information on the operation of the SEC’s Public Reference Room may be obtained by calling (202) 942-8090.
Scudder Investments
222 South Riverside Plaza
Chicago, IL 60606-5808
www.scudder.com
(800) 621-1048
Distributor
Scudder Distributors, Inc.
222 South Riverside Plaza
Chicago, IL 60606-5808


SEC
Public Reference Section
Washington, D.C. 20549-0102
www.sec.gov
(202) 942-8090
| SEC File Numbers: | ||
| Scudder Micro Cap Fund | 811-08006 | |
| Scudder Mid Cap Fund | 811-04760 | |
| Scudder Small Cap Fund | 811-04760 |
Printed on recycled paper. (02/01/04) SSAGF2–1
Table of Contents

SCUDDER
INVESTMENTS
Small/Aggressive Growth II
Institutional Class
Prospectus
February 1, 2004
Scudder Micro Cap Fund
Scudder Mid Cap Fund
As with all mutual funds, the Securities and Exchange Commission (SEC) does not approve or disapprove these shares or determine whether the information in this prospectus is truthful or complete. It is a criminal offense for anyone to inform you otherwise.
Table of Contents
Contents
| How the Funds Work | ||
| 4 | Scudder Micro Cap Fund | |
| 11 | Scudder Mid Cap Fund | |
| 18 | Other Policies and Secondary Risks | |
| 20 | Who Manages and Oversees the Funds | |
| 22 | Financial Highlights | |
| How to Invest in the Funds | ||
| 25 | Buying and Selling Institutional Class Shares | |
| 30 | Policies You Should Know About | |
| 36 | Understanding Distributions and Taxes | |
Table of Contents
How the Funds Work
On the next few pages, you’ll find information about each fund’s investment goal, the main strategies each uses to pursue that goal and the main risks that could affect performance.
Whether you are considering investing in a fund or are already a shareholder, you’ll probably want to look this information over carefully. You may want to keep it on hand for reference as well.
Remember that mutual funds are investments, not bank deposits. They’re not insured or guaranteed by the FDIC or any other government agency. Their share prices will go up and down and you could lose money by investing in them.
Table of Contents
| Institutional Class | ||
ticker symbol | MGMCX | |
fund number | 589 | |
The Fund’s Main Investment Strategy
The fund seeks capital appreciation.
Under normal circumstances, the fund invests at least 80% of its assets, determined at the time of purchase, in stocks and other securities with equity characteristics of US micro capitalization companies. For the purposes of this 80% limitation, the micro capitalization equity universe is defined as the bottom 5% of the total domestic equity market capitalization (at the time of investment) using a minimum market capitalization of $10 million. The fund may invest up to 20% of its total assets in the securities of foreign companies that would be considered to be in the bottom 5% in terms of market capitalization in the US equity market (subject to a $10 million market capitalization minimum).
The fund invests primarily in equity securities of US micro capitalization growth-oriented companies. The managers focus on individual security selection rather than industry selection. The managers use an active process which combines financial analysis with company visits to evaluate management and strategies.
Company research lies at the heart of our investment process. The managers use a “bottom-up” approach to picking securities. This approach focuses on individual stock selection rather than industry selection.
OTHER INVESTMENTS The fund is permitted, but not required, to use various types of derivatives (contracts whose value is based on, for example, indexes, currencies or securities). In particular, the fund may use futures, options and covered call options. To the extent the fund invests in foreign securities, the fund may enter into forward currency exchange contracts and buy and sell currency options to hedge
against currency exchange rate fluctuations. The fund may also use derivatives in circumstances where the managers believe they offer an economical means of gaining exposure to a particular asset class or to help meet shareholder redemptions or other needs while maintaining exposure to the market. (See “Other Policies and Secondary Risks” for more information.)
4 | Scudder Micro Cap Fund
Table of Contents
| n | The managers focus on undervalued stocks with fast-growing earnings and superior near-to-intermediate term performance potential. |
| n | The managers emphasize individual selection of smaller stocks across all economic sectors, early in their growth cycles and with the potential to be the blue chips of the future. |
| n | The managers generally seek companies with a leading or dominant position in their niche markets, a high rate of return on invested capital and the ability to finance a major part of future growth from internal sources. |
| n | The managers screen the bottom 5% of the total domestic equity market capitalization (subject to a $10 million capitalization minimum) for micro cap companies with growth and profitability. |
The fund may also invest up to 20% of its assets in high quality debt instruments and money market instruments with remaining maturities of one year or less, including repurchase agreements. The fund may invest up to 5% of its net assets in non-convertible bonds and preferred stocks that the managers believe to be of high quality.
The managers will normally sell a stock when they believe its potential risks have increased, its price is unlikely to go higher, its fundamental factors have changed, other investments offer better opportunities or in the course of adjusting the fund’s emphasis on a given industry.
Scudder Micro Cap Fund | 5
Table of Contents
The Main Risks of Investing in the Fund
There are several risk factors that could hurt the fund’s performance, cause you to lose money or make the fund perform less well than other investments.
Stock Market Risk. As with most stock funds, the most important factor with this fund is how stock markets perform—in this case, the micro capitalization portion of the US stock market. When stock prices fall, you should expect the value of your investment to fall as well. Because a stock represents ownership in its issuer, stock prices can be hurt by poor management, shrinking product demand and other business risks. These may affect single companies as well as groups of companies. In addition, movements in financial markets may adversely affect a stock’s price, regardless of how well the company performs. The market as a whole may not favor the types of investments the fund makes, and the fund may not be able to get an attractive price for them.
Security Selection Risk. A risk that pervades all investing is the risk that the securities the managers have selected will not perform to expectations. The managers could be incorrect in their analysis of companies, sectors, economic trends or other matters.
Micro Capitalization Company Risk. The fund’s investments in micro capitalization companies will be more susceptible to share price fluctuations since micro capitalization company stocks tend to experience steeper fluctuations in price—down as well as up—than the stocks of larger companies. A shortage of reliable information—the same information gap that creates opportunity in micro company investing—can also pose added risk. Industry-wide reversals may have a greater impact on micro capitalization companies, since they lack a large company’s financial resources. Micro capitalization companies may have limited product lines and markets. They may also have shorter operating histories and more volatile businesses. Finally, micro capitalization company stocks are typically less liquid than large company stocks. Particularly when they are performing poorly, a micro capitalization company’s shares may be more difficult to sell.
This fund is designed for investors with long-term goals who can tolerate capital fluctuation in pursuit of capital appreciation.
6 | Scudder Micro Cap Fund
Table of Contents
Foreign Securities Risk. Foreign securities may be more volatile than their US counterparts, for reasons such as currency fluctuations and political and economic uncertainty.
Pricing Risk. At times, market conditions might make it hard to value some investments. For example, if the fund has valued its securities too highly, you may end up paying too much for fund shares when you buy into the fund. If the fund underestimates the prices of its securities, you may not receive the full market value for your fund shares when you sell.
Another factor that could affect performance:
| n | derivatives could produce disproportionate losses (see “Secondary risks” for more information) |
Scudder Micro Cap Fund | 7
Table of Contents
The Fund’s Performance History
While a fund’s past performance (before and after taxes) isn’t necessarily a sign of how it will do in the future, it can be valuable for an investor to know.
The bar chart shows how the performance for the fund’s Institutional Class shares has varied from year to year, which may give some idea of risk. The table shows how fund performance compares with a broad-based market index (which, unlike the fund, does not have any fees or expenses). The performance of both the fund and the index varies over time. All figures assume reinvestment of dividends and distributions (in the case of after-tax returns, reinvested net of assumed tax rates).
The table shows returns on a before-tax and after-tax basis. After-tax returns are calculated using the historical highest individual federal marginal income tax rates and do not reflect the impact of state and local taxes. Actual after-tax returns depend on an investor’s tax situation and may differ from those shown in the table. After-tax returns shown are not relevant to investors who hold their shares through tax-deferred arrangements, such as 401(k) plans or individual retirement accounts.
Scudder Micro Cap Fund
| Annual Total Returns (%) as of 12/31 each year | Institutional Class |
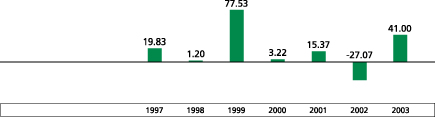
For the periods included in the bar chart:
Best Quarter: 29.74%, Q4 1999 | Worst Quarter: -24.12%, Q3 1998 |
8 | Scudder Micro Cap Fund
Table of Contents
| Average Annual Total Returns (%) as of 12/31/2003 | ||||||
| 1 Year | 5 Years | Since Inception* | ||||
| Institutional Class | ||||||
Return before Taxes | 41.00 | 16.80 | 15.03 | |||
Return after Taxes on Distributions | 41.00 | 15.41 | 13.79 | |||
Return after Taxes on Distributions | 26.65 | 13.94 | 12.57 | |||
| Index (reflects no deductions for fees, expenses or taxes) | 47.25 | 7.13 | 7.72 | |||
Index: Russell 2000 Index is an unmanaged index that tracks the common stock price movement of the 2,000 smallest companies of the Russell 3000 Index, which measures the performance of the 3,000 largest US companies based on total market capitalization.
| * | The class commenced operations on December 18, 1996. Index comparison begins on December 31, 1996. |
Total returns from inception through 2003 would have been lower if operating expenses hadn’t been reduced.
Current performance may be higher or lower than the performance data quoted above. For more recent performance information, call your financial advisor or (800) 621-1048 or visit our Web site at www.scudder.com.
The Return after Taxes on Distributions assumes that an investor holds fund shares at the end of the period. The number only represents the fund’s taxable distributions, not a shareholder’s gain or loss from selling fund shares.
The Return after Taxes on Distributions and Sale of Fund Shares assumes that an investor sold his or her fund shares at the end of the period. The number reflects both the fund’s taxable distributions and a shareholder’s gain or loss from selling fund shares.
Scudder Micro Cap Fund | 9
Table of Contents
How Much Investors Pay
This table describes the fees and expenses that you may pay if you buy and hold Institutional Class shares of the fund.
| Fee Table | |||
| Shareholder Fees, paid directly from your investment | None | ||
| Annual Operating Expenses, deducted from fund assets | |||
| Management Fee | 1.50 | % | |
| Distribution/Service (12b-1) Fee | None | ||
| Other Expenses | 0.41 | ||
| Total Annual Operating Expenses | 1.91 | ||
| Less Fee Waiver/Expense Reimbursements* | 0.42 | ||
| Total Net Annual Operating Expenses | 1.49 |
| * | The advisor and administrator have contractually agreed to waive their fees or reimburse expenses until January 31, 2005 so that total operating expenses will not exceed 1.49%. |
Based on the costs above (including one year of capped expenses in each period), this example helps you compare the expenses of the share class to those of other mutual funds. This example assumes the expenses above remain the same. It also assumes that you invested $10,000, earned 5% annual returns, and reinvested all dividends and distributions. This is only an example; actual expenses will be different.
| Example | 1 Year | 3 Years | 5 Years | 10 Years | ||||
| Institutional Class | $152 | $559 | $993 | $2,199 |
10 | Scudder Micro Cap Fund
Table of Contents
| Institutional Class | ||
ticker symbol | BTEAX | |
fund number | 583 | |
The Fund’s Main Investment Strategy
The fund seeks long-term capital growth.
Under normal circumstances, the fund invests at least 80% of its assets, determined at the time of purchase, in companies with market caps within the market capitalization range of the S&P Mid-Cap 400 Index or securities with equity characteristics that provide exposure to those companies. It may also invest in convertible securities when it is more advantageous than investing in a company’s common stock. The managers believe these companies contain the greatest concentration of businesses with significant growth prospects.
The fund invests primarily in equity securities of medium-sized growth-oriented companies. The managers focus on individual security selection rather than industry selection. The managers use an active process which combines financial analysis with company visits to evaluate management and strategies.
The fund may also invest up to 20% of its assets in stocks and other securities of companies based outside the US.
Company research lies at the heart of the investment process. The managers use a “bottom-up” approach to picking securities. This approach focuses on individual stock selection rather than industry selection.
OTHER INVESTMENTS The fund is permitted, but not required, to use various types of derivatives (contracts whose value is based on, for example, indexes, currencies or securities). In particular, the fund may use futures, options and covered call options. The fund may use derivatives in circumstances where the managers believe they offer an economical means of gaining exposure to a particular asset class or to help meet shareholder redemptions or other needs while maintaining exposure to the market. (See “Other Policies and Secondary Risks” for more information.)
Scudder Mid Cap Fund | 11
Table of Contents
| n | The managers focus on undervalued stocks with fast-growing earnings and superior near-to-intermediate term performance potential. |
| n | The managers emphasize individual selection of medium-sized stocks across all economic sectors, early in their growth cycles and with the potential to be the blue chips of the future. |
| n | The managers generally seek companies with leading or dominant position in their niche markets, a high rate of return on invested capital and the ability to finance a major part of future growth from internal sources. |
| n | The managers screen within the market capitalization range of the S&P Mid-Cap 400 Index for medium-sized companies with growth and profitability potential. |
The fund follows a disciplined selling process to try to lessen risk. We may sell a security if one or more of the following conditions take place:
| n | there is a material change in the company’s fundamentals; or |
| n | the stock price reaches the managers’ expectations. |
12 | Scudder Mid Cap Fund
Table of Contents
The Main Risks of Investing in the Fund
There are several risk factors that could hurt the fund’s performance, cause you to lose money or make the fund perform less well than other investments.
Stock Market Risk. As with most stock funds, the most important factor with this fund is how stock markets perform—in this case, the medium-sized capitalization performance of the U.S. stock market. When stock prices fall, you should expect the value of your investment to fall as well. Because a stock represents ownership in its issuer, stock prices can be hurt by poor management, shrinking product demand and other business risks. These may affect single companies as well as groups of companies. In addition, movements in financial markets may adversely affect a stock’s price, regardless of how well the company performs. The market as a whole may not favor the types of investments the fund makes and the fund may not be able to get an attractive price for them.
Security Selection Risk. A risk that pervades all investing is the risk that the securities the managers have selected will not perform to expectations. The managers could be incorrect in their analysis of companies, sectors, economic trends or other matters.
This fund is designed for investors with long-term goals who can tolerate capital fluctuation in pursuit of long-term capital growth.
Medium-Sized Company Risk. Medium-sized company stocks tend to experience steeper price fluctuations—down as well as up—than stocks of larger companies. A shortage of reliable information—the same information gap that creates opportunity—can pose added risk. Industry-wide reversals may have a greater impact on medium-sized companies, since they usually lack a large company’s financial resources. Medium-sized company stocks are typically less liquid than large company stocks: when things are going poorly, it is harder to find a buyer for a medium-sized company’s shares.
Foreign Securities Risk. Foreign securities may be more volatile than their US counterparts, for reasons such as currency fluctuations and political and economic uncertainty.
Pricing Risk. At times, market conditions might make it hard to value some investments. For example, if the fund has valued its securities too highly, you may end
Scudder Mid Cap Fund | 13
Table of Contents
up paying too much for fund shares when you buy into the fund. If the fund underestimates the prices of its securities, you may not receive the full market value for your fund shares when you sell.
Another factor that could affect performance:
| n | derivatives could produce disproportionate losses (see “Secondary risks” for more information) |
14 | Scudder Mid Cap Fund
Table of Contents
The Fund’s Performance History
While a fund’s past performance (before and after taxes) isn’t necessarily a sign of how it will do in the future, it can be valuable for an investor to know.
The bar chart shows how the performance for the fund’s Institutional Class shares has varied from year to year, which may give some idea of risk. The following bar chart and table includes the performance of Equity Appreciation—Institutional Class shares. Equity Appreciation—Institutional Class became Mid Cap—Institutional Class as of the close of business on August 31, 2000. Equity Appreciation—Institutional Class was managed by the same investment management team with the same objective, policies and strategies as Mid Cap. The bar chart shows Equity Appreciation—Institutional Class shares’ actual return for each full calendar year since January 1, 1994. Performance for periods after August 31, 2000 reflect the performance of the Mid Cap—Institutional Class. The table shows how fund performance compares with a broad-based market index (which, unlike the fund, does not have any fees or expenses). The performance of both the fund and the index varies over time. All figures assume reinvestment of dividends and distributions (in the case of after-tax returns, reinvested net of assumed tax rates).
The table shows returns on a before-tax and after-tax basis. After-tax returns are calculated using the historical highest individual federal marginal income tax rates and do not reflect the impact of state and local taxes. Actual after-tax returns depend on an investor’s tax situation and may differ from those shown in the table. After-tax returns shown are not relevant to investors who hold their shares through tax-deferred arrangements, such as 401(k) plans or individual retirement accounts.
Scudder Mid Cap Fund
| Annual Total Returns (%) as of 12/31 each year | Institutional Class |
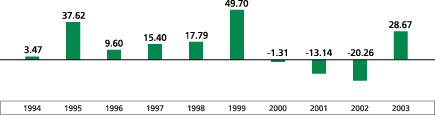
For the periods included in the bar chart:
Best Quarter: 31.08%, Q4 1999 | Worst Quarter: -19.38%, Q3 2001 |
Scudder Mid Cap Fund | 15
Table of Contents
| Average Annual Total Returns (%) as of 12/31/2003 | ||||||
| 1 Year | 5 Years | 10 Years | ||||
| Institutional Class | ||||||
Return before Taxes | 28.67 | 5.66 | 10.82 | |||
Return after Taxes on Distributions | 28.67 | 3.47 | 9.14 | |||
Return after Taxes on Distributions | 18.64 | 4.06 | 8.88 | |||
| Index (reflects no deductions for fees, expenses or taxes) | 35.62 | 9.21 | 13.93 | |||
Index: S&P Mid-Cap 400 Index is an unmanaged index that tracks the stock movement of 400 mid-sized US companies.
| * | Institutional Class commenced operations on August 31, 2000. Performance from January 1, 1994 through August 30, 2000 reflects actual returns of Equity Appreciation—Institutional Class shares. |
Total returns from inception through 2003 would have been lower if operating expenses hadn’t been reduced.
Current performance may be higher or lower than the performance data quoted above. For more recent performance information, call your financial advisor or (800) 621-1048 or visit our Web site at www.scudder.com.
The Return after Taxes on Distributions assumes that an investor holds fund shares at the end of the period. The number only represents the fund’s taxable distributions, not a shareholder’s gain or loss from selling fund shares.
The Return after Taxes on Distributions and Sale of Fund Shares assumes that an investor sold his or her fund shares at the end of the period. The number reflects both the fund’s taxable distributions and a shareholder’s gain or loss from selling fund shares.
16 | Scudder Mid Cap Fund
Table of Contents
How Much Investors Pay
This table describes the fees and expenses that you may pay if you buy and hold Institutional Class shares of the fund.
| Fee Table | |||
| Shareholder Fees, paid directly from your investment | None | ||
| Annual Operating Expenses, deducted from fund assets | |||
| Management Fee | 0.65 | % | |
| Distribution/Service (12b-1) Fee | None | ||
| Other Expenses | 0.44 | ||
| Total Annual Operating Expenses | 1.09 | ||
| Less Fee Waiver/Expense Reimbursements** | 0.09 | ||
| Total Net Annual Operating Expenses | 1.00 |
| ** | The advisor and administrator have contractually agreed to waive their fees or reimburse expenses until January 31, 2005 so that total operating expenses will not exceed 1.00%. |
Based on the costs above (including one year of capped expenses in each period), this example helps you compare the expenses of the share class to those of other mutual funds. This example assumes the expenses above remain the same. It also assumes that you invested $10,000, earned 5% annual returns, and reinvested all dividends and distributions. This is only an example; actual expenses will be different.
| Example | 1 Year | 3 Years | 5 Years | 10 Years | ||||
| Institutional Class | $102 | $338 | $592 | $1,321 |
Scudder Mid Cap Fund | 17
Table of Contents
Other Policies and Secondary Risks
While the sections on the previous pages describe the main points of each fund’s strategy and risks, there are a few other issues to know about.
Other policies
| n | Although major changes tend to be infrequent, a fund’s Board could change that fund’s investment goal without seeking shareholder approval. In addition, the applicable Board will provide shareholders with at least 60 days’ notice prior to making any changes to the 80% investment policy, as described herein, of each fund. |
| n | The funds may trade securities actively. This could raise transaction costs (thus lowering return) and could result in higher taxable distributions. |
| n | As a temporary defensive measure, each fund could shift up to 100% of assets into investments such as money market investments or other short-term bonds that offer comparable safety, or cash (Scudder Micro Cap Fund only). In addition, as a temporary defensive position, Scudder Mid Cap Fund may invest up to 100% of assets in the common stock of larger companies, or in fixed-income securities. This could prevent losses, but, while engaged in a temporary defensive position, a fund may not achieve its investment objective. However, the portfolio managers may choose not to use these strategies for various reasons, even in very volatile market conditions. |
| n | Each fund’s equity investments are mainly common stocks, but may also include other types of equities such as preferred or convertible securities. |
| n | Each fund may use hedging transactions to attempt to reduce specific risks. For example, to protect a fund against circumstances that would normally cause the fund’s portfolio securities to decline in value, the fund may buy or sell a derivative contract that would normally increase in value under the same circumstances. A fund’s ability to hedge may be limited by the costs of the derivatives contracts. A fund may attempt to lower the cost of hedging by entering into transactions that provide only limited protection, including transactions that (1) hedge only a portion of the fund, (2) use derivatives contracts that cover a narrow range of circumstances or (3) involve the sale of derivatives contracts with different terms. |
18 | Other Policies and Secondary Risks
Table of Contents
Secondary risks
Derivatives Risk. Although not one of its principal investment strategies, each fund may invest in certain types of derivatives. Risks associated with derivatives include: the risk that the derivative is not well correlated with the security, index or currency to which it relates; derivatives used for risk management may not have the intended effects and may result in losses or missed opportunities; the risk that the fund will be unable to sell the derivative because of an illiquid secondary market; and the risk that the derivatives transaction could expose the fund to the effects of leverage, which could increase the fund’s exposure to the market and magnify potential losses. There is no guarantee that these derivatives activities will be employed or that they will work, and their use could cause lower returns or even losses to the fund.
For more information
This prospectus doesn’t tell you about every policy or risk of investing in the funds.
If you want more information on a fund’s allowable securities and investment practices and the characteristics and risks of each one, you may want to request a copy of the Statement of Additional Information (the back cover tells you how to do this).
Keep in mind that there is no assurance that any mutual fund will achieve its goal.
Other Policies and Secondary Risks | 19
Table of Contents
Who Manages and Oversees the Funds
Scudder Investments is part of Deutsche Asset Management, which is the marketing name in the US for the asset management activities of Deutsche Bank AG, Deutsche Investment Management Americas Inc., Deutsche Asset Management, Inc. (“DeAM, Inc.”), Deutsche Asset Management Investment Services Ltd., Deutsche Bank Trust Company Americas and Scudder Trust Company.
The investment advisor
DeAM, Inc. is the investment advisor for each fund. Under the supervision of each fund’s Board of Trustees, DeAM, Inc., with headquarters at 345 Park Avenue, New York, NY 10154, makes each fund’s investment decisions, buys and sells securities for each fund and conducts the research that leads to these purchase and sale decisions. DeAM, Inc. provides a full range of global investment advisory services to institutional and retail clients. DeAM, Inc. is also responsible for selecting brokers and dealers and for negotiating brokerage commissions and dealer charges.
Deutsche Asset Management is a global asset management organization that offers a wide range of investing expertise and resources, including hundreds of portfolio managers and analysts and an office network that reaches the world’s major investment centers. This well-resourced global investment platform brings together a wide variety of experience and investment insight across industries, regions, asset classes and investing styles.
DeAM, Inc. is an indirect wholly owned subsidiary of Deutsche Bank AG. Deutsche Bank AG is a major global banking institution that is engaged in a wide range of financial services, including investment management, mutual fund, retail, private and commercial banking, investment banking and insurance.
20 | Who Manages and Oversees the Funds
Table of Contents
The advisor receives a management fee from each fund. Below are the actual rates paid by each fund net of fee waivers for the most recent fiscal year, as a percentage of each fund’s average daily net assets:
| Fund Name | Fee Paid | |
| Scudder Micro Cap Fund | 1.09% | |
| Scudder Mid Cap Fund | 0.56% |
The portfolio managers
The following people handle the day-to-day management of each fund.
Audrey M. T. Jones, CFA Managing Director of Deutsche Asset Management and Lead Manager of each fund. nJoined the advisor in 1986 and each fund at its inception. n32 years of investment industry experience.
Doris R. Klug, CFA Director of Deutsche Asset Management and Manager of each fund. nJoined the advisor in 2000. nVice President of Mutual of America from 1993 to 2000. n23 years of financial industry experience. nMBA from New York University Stern School of Business. | Bob Grandhi, CFA Director of Deutsche Asset Management and Manager of each fund. nJoined the advisor in 2001. nPortfolio manager at Monument Funds Group and Daiwa Securities from 2000 to 2001 and 1990 to 2000, respectively. n27 years of financial industry experience. nMBA from Illinois Institute of Technology.
Samuel A. Dedio Director of Deutsche Asset Management and Manager of each fund. nJoined Deutsche Asset Management in 1999, formerly serving as analyst at Ernst & Young, LLP, Evergreen Asset Management and Standard & Poor’s Corp. nPortfolio manager for US Small- and Mid-Cap Active Equity Group and senior small cap analyst for technology. n13 years of investment industry experience. nMS in Accounting from American University’s Kogod School of Business. nJoined the funds in 2002. |
Who Manages and Oversees the Funds | 21
Table of Contents
These tables are designed to help you understand each fund’s financial performance in recent years. The figures in the first part of each table are for a single share. The total return figures represent the percentage that an investor in a particular fund would have earned (or lost), assuming all dividends and
distributions were reinvested. This information has been audited by PricewaterhouseCoopers LLP, independent auditors, whose reports, along with each fund’s financial statements, are included in that fund’s annual report (see “Shareholder reports” on the back cover).
Scudder Micro Cap Fund — Institutional Class
| Years Ended September 30, | 2003 | 2002 | 2001 | 2000 | 1999a | 1998b | ||||||||||||||||||
| Selected Per Share Data | ||||||||||||||||||||||||
| Net asset value, beginning of period | $ | 14.22 | $ | 17.21 | $ | 24.52 | $ | 16.16 | $ | 9.90 | $ | 12.62 | ||||||||||||
| Income (loss) from investment operations: | ||||||||||||||||||||||||
Net investment income (loss) | (.14 | )c | (.14 | )c | (.13 | ) | (.14 | ) | (.14 | ) | (.05 | ) | ||||||||||||
Net realized and unrealized gain (loss) on investment transactions | 4.85 | (2.85 | ) | (5.35 | ) | 9.91 | 6.40 | (2.18 | ) | |||||||||||||||
Total from investment operations | 4.71 | (2.99 | ) | (5.48 | ) | 9.77 | 6.26 | (2.23 | ) | |||||||||||||||
Less distributions from: Net realized gains on | — | — | (1.83 | ) | (1.41 | ) | — | (.49 | ) | |||||||||||||||
| Net asset value, end of period | $ | 18.93 | $ | 14.22 | $ | 17.21 | $ | 24.52 | $ | 16.16 | $ | 9.90 | ||||||||||||
| Total Return (%)d | 33.12 | (17.37 | ) | (22.55 | ) | 64.49 | 63.23 | ** | (18.16 | ) | ||||||||||||||
Ratios to Average Net Assets and Supplemental Data |
| |||||||||||||||||||||||
Net assets, end of period ($ millions) | 79 | 52 | 33 | 37 | 17 | 14 | ||||||||||||||||||
| Ratio of expenses before expense reductions (%) | 1.91 | 1.96 | 1.98 | 2.30 | 3.00 | * | 2.59 | |||||||||||||||||
| Ratio of expenses after expense reductions (%) | 1.49 | 1.49 | 1.49 | 1.49 | 1.49 | * | 1.49 | |||||||||||||||||
| Ratio of net investment income (loss) (%) | (.84 | ) | (.77 | ) | (.78 | ) | (.78 | ) | (1.07 | )* | (.75 | ) | ||||||||||||
| Portfolio turnover rate (%) | 74 | 66 | 79 | 137 | 115 | 85 | ||||||||||||||||||
| a | For the eleven months ended September 30, 1999. |
| b | For the year ended October 31, 1998. |
| c | Based on average shares outstanding during the period. |
| d | Total return would have been lower had certain expenses not been reduced. |
| * | Annualized |
| ** | Not annualized |
22 | Financial Highlights
Table of Contents
Scudder Mid Cap Fund — Institutional Class
| Years Ended September 30, | 2003 | 2002 | 2001 | 2000a | ||||||||||||
| Selected Per Share Data | ||||||||||||||||
| Net asset value, beginning of period | $ | 9.36 | $ | 10.69 | $ | 17.57 | $ | 18.60 | ||||||||
| Income (loss) from investment operations: | ||||||||||||||||
Net investment income (loss) | (.05 | )b | (.04 | )b | .01 | (.00 | )c | |||||||||
Net realized and unrealized gain | 2.24 | (1.29 | ) | (6.42 | ) | (1.03 | ) | |||||||||
Total from investment operations | 2.19 | (1.33 | ) | (6.41 | ) | (1.03 | ) | |||||||||
| Less distributions from: | ||||||||||||||||
Net realized gains on investment transactions | — | — | (.47 | ) | — | |||||||||||
| Net asset value, end of period | $ | 11.55 | $ | 9.36 | $ | 10.69 | $ | 17.57 | ||||||||
| Total Return (%)d | 23.40 | (12.44 | ) | (37.15 | ) | 55.50e | ** | |||||||||
| Ratios to Average Net Assets and Supplemental Data | ||||||||||||||||
| Net assets, end of period ($ millions) | 323 | 164 | 231 | 414 | ||||||||||||
| Ratio of expenses before expense reductions (%) | 1.09 | 1.14 | f | 1.18 | f | 1.45 | f* | |||||||||
| Ratio of expenses after expense reductions (%) | 1.00 | 1.00 | f | 1.00 | f | 1.00 | f* | |||||||||
| Ratio of net investment income (loss) (%) | (.49 | ) | (.30 | ) | .04 | (.17 | )* | |||||||||
| Portfolio turnover rate (%) | 82 | 120g | 251 | 146 | ||||||||||||
| a | For the period August 31, 2000 (commencement of sales of Institutional Class shares) to September 30, 2000. |
| b | Based on average shares outstanding during the period. |
| c | Amount is less than $.005. |
| d | Total return would have been lower had certain expenses not been reduced. |
| e | At the close of business on August 31, 2000, shares of Equity Appreciation — Institutional Class merged into Institutional Class shares of Mid Cap. Equity Appreciation — Institutional Class was managed by the same investment management team with the same objectives, policies and strategies as Mid Cap. The performance shown reflects Equity Appreciation — Institutional Class shares’ actual returns from its inception on October 12, 1993. Performance for periods after August 31, 2000 reflects the performance of the Mid Cap Fund — Institutional Class. |
| f | The expense ratio of the Capital Appreciation Portfolio is included in this ratio. |
| g | On March 28, 2002, the Capital Appreciation Portfolio was closed. This ratio includes the purchase and sale of portfolio securities of the Mid Cap Fund as a stand-alone fund in addition to the Capital Appreciation Portfolio. |
| * | Annualized |
| ** | Not annualized |
Financial Highlights | 23
Table of Contents
How to Invest in the Funds
The following pages tell you how to invest in these funds and what to expect as a shareholder. If you’re investing directly with Scudder, all of this information applies to you.
If you’re investing through a service agent — for example, a workplace retirement plan, financial supermarket or financial advisor — your service agent may have its own policies or instructions and you should follow those.
Table of Contents
Buying and Selling Institutional Class Shares
You may buy Institutional Class shares through your securities dealer or through any financial institution that is authorized to act as a shareholder servicing agent (“service agent”). Contact them for details on how to enter and pay for your order. Each fund’s advisor, administrator or their affiliates may provide compensation to service agents for distribution, administrative and promotional services.
You may also buy Institutional Class shares by sending your check (along with a completed Application Form) directly to the transfer agent. Your purchase order may not be accepted if the fund withdraws the offering of fund shares, the sale of fund shares has been suspended or if it is determined that your purchase would be detrimental to the interests of the fund’s shareholders.
Eligibility requirements
You may buy Institutional Class shares if you are any of the following:
| n | An eligible institution (e.g., a financial institution, corporation, trust, estate or educational, religious or charitable institution). |
| n | An employee benefit plan with assets of at least $50 million. |
| n | A registered investment advisor or financial planner purchasing on behalf of clients and charging an asset-based or hourly fee. |
| n | A client of the private banking division of Deutsche Bank AG. |
| n | A current or former director or trustee of the Deutsche or Scudder mutual funds. |
| n | An employee, the employee’s spouse or life partner and children or step-children age 21 or younger of Deutsche Bank or its affiliates or a sub-advisor to any fund in the Scudder family of funds or a broker-dealer authorized to sell shares in the funds. |
Buying and Selling Institutional Class Shares | 25
Table of Contents
Investment minimums
Your initial investment must be at least $250,000. There are no minimum subsequent investment requirements.
The minimum initial investment is waived for:
| n | Investment advisory affiliates of Deutsche Bank Securities, Inc. or Scudder or Deutsche funds purchasing shares for the accounts of their investment advisory clients. |
| n | Employee benefit plans with assets of at least $50 million. |
| n | Clients of the private banking division of Deutsche Bank AG. |
| n | A current or former director or trustee of the Deutsche or Scudder mutual funds. |
| n | An employee, the employee’s spouse or life partner and children or step-children age 21 or younger of Deutsche Bank or its affiliates or a sub-advisor to any fund in the Scudder family of funds or a broker-dealer authorized to sell shares of the funds. |
Each fund and its service providers reserve the right to waive or modify the above eligibility requirements and investment minimums from time to time at their discretion.
How to contact the Transfer Agent
| By Phone: | (800) 730-1313 | |
| First Investments By Mail: | Scudder Investments Service Company P.O. Box 219356 Kansas City, MO 64121-9356 | |
| Additional Investments By Mail: | Scudder Investments Service Company P.O. Box 219154 Kansas City, MO 64121-9154 | |
| By Overnight Mail: | Scudder Investments Service Company 811 Main Street Kansas City, MO 64105-2005 | |
| By Fax (for exchanging and selling shares only): | (800) 821-6234 |
You can reach ScudderACCESS, the Scudder automated information line, 24 hours a day, 7 days a week by calling (800) 972-3060.
26 | Buying and Selling Institutional Class Shares
Table of Contents
How to open your fund account
| Mail: | Complete and sign the account application that accompanies this prospectus. (You may obtain additional applications by calling the transfer agent.) Mail the completed application along with a check payable to the fund you have selected to the transfer agent. Be sure to include the fund number. The addresses are shown under “How to contact the Transfer Agent.” | |
| Wire: | Call the transfer agent to set up a wire account. | |
| Fund name and Fund number: | Scudder Micro Cap Fund — Institutional Class — 589 Scudder Mid Cap Fund — Institutional Class — 583 |
Please note that your account cannot become activated until we receive a completed application.
How to buy and sell shares
MAIL:
Buying: Send your check, payable to the fund you have selected, to the transfer agent. Be sure to include the fund number and your account number on the check. (For fund numbers, see “How to open your fund account.”) The addresses are shown above under “How to contact the Transfer Agent.” If you are investing in more than one fund, make your check payable to “Scudder Funds” and include your account number, the names and numbers of the funds you have selected, and the dollar amount or percentage you would like invested in each fund.
Selling: Send a signed letter to the transfer agent with your name, your fund number and account number, the fund’s name, and either the number of shares you wish to sell or the dollar amount you wish to receive. You must leave at least $250,000 worth of shares in your account to keep it open. Unless exchanging into another Scudder fund, you must submit a written authorization to sell shares in a retirement account.
Buying and Selling Institutional Class Shares | 27
Table of Contents
WIRE:
Buying: You may buy shares by wire only if your account is authorized to do so. Please note that you or your service agent must call Shareholder Services at (800) 730-1313 to notify us in advance of a wire transfer purchase. Inform Shareholder Services of the amount of your purchase and receive a trade confirmation number. Instruct your bank to send payment by wire using the wire instructions noted below. All wires must be received by 4:00 p.m. (Eastern time) the next business day following your purchase.
| Bank Name: | Deutsche Bank Trust Company Americas | |
| Routing No: | 021001033 | |
| Attn: | Scudder Funds | |
| DDA No: | 00-226-296 | |
| FBO: | (Account name) (Account number) | |
| Credit: | (fund name and number) (See “How to open your fund account.”) |
Refer to your account statement for the account name and number. Wire transfers normally take two or more hours to complete. Wire transfers may be restricted on holidays and at certain other times. If your wire is not received by 4:00 p.m. (Eastern time) on the next business day after the fund receives your request to purchase shares, your transaction will be canceled at your expense and risk.
Selling: You may sell shares by wire only if your account is authorized to do so. You will be paid for redeemed shares by wire transfer of funds to your service agent or bank upon receipt of a duly authorized redemption request as promptly as feasible. For your protection, you may not change the destination bank account over the phone. To sell by wire, contact your service agent or Shareholder Services at (800) 730-1313. Inform Shareholder Services of the amount of your redemption and receive a trade confirmation number. The minimum redemption by wire is $1,000. The fund and its service agents reserve the right to waive the minimum from time to time at their discretion. We must receive your order by 4:00 p.m. (Eastern time) to wire your account the next business day.
28 | Buying and Selling Institutional Class Shares
Table of Contents
TELEPHONE TRANSACTIONS:
You may place orders to buy and sell over the phone by calling your service agent or Shareholder Services at (800) 730-1313. If your shares are in an account with the transfer agent, you may (1) redeem by check in an amount up to $100,000, or by wire (minimum $1,000), or (2) exchange the shares for Institutional Class shares of another Scudder fund by calling Shareholder Services.
You may make regular investments from a bank checking account. For more information on setting up an automatic investment plan or payroll investment plan, call Shareholder Services at 1-800-730-1313.
Buying and Selling Institutional Class Shares | 29
Table of Contents
Policies You Should Know About
Along with the instructions on the previous pages, the policies below may affect you as a shareholder. Some of this information, such as the section on distributions and taxes, applies to all investors, including those investing through investment providers.
If you are investing through an investment provider, check the materials you received from them about how to buy and sell shares. As a general rule, you should follow the information in those materials wherever it contradicts the information given here. Please note that an investment provider may charge fees separate from those charged by a fund.
In either case, keep in mind that the information in this prospectus applies only to each fund’s Institutional Class shares. The funds have other share classes, which are described in separate prospectuses and have different fees, requirements and services.
In order to reduce the amount of mail you receive and to help reduce expenses, we generally send a single copy of any shareholder report and prospectus to each household. If you do not want the mailing of these documents to be combined with those for other members of your household, please contact your service agent or call (800) 730-1313.
Policies about transactions
Each fund is open for business each day the New York Stock Exchange is open. Each fund calculates its share price every business day, as of the close of regular trading on the New York Stock Exchange (typically 4:00 p.m. Eastern time, but sometimes earlier, as in the case of scheduled half-day trading or unscheduled suspensions of trading). You can place an order to buy or sell shares at any time.
To help the government fight the funding of terrorism and money laundering activities. Federal law requires all financial institutions to obtain, verify, and record information that identifies each person who opens an account. What this means to you: When you open an account, we will ask for your name, address, date of birth, and other information that will allow us to identify you. Some or all of this information will be used to verify the identity of all persons opening an account.
30 | Policies You Should Know About
Table of Contents
We might request additional information about you (which may include certain documents, such as articles of incorporation for companies) to help us verify your identity; and in some cases the information and/or documents may be required to conduct the verification. The information and documents will be used solely to verify your identity.
We will attempt to collect any missing required and requested information by contacting you or your financial intermediary. If we are unable to obtain this information within the time frames established by the fund, then we may reject your application and order.
Each fund will not invest your purchase until all required and requested identification information has been provided and your application has been submitted in “good order.” After we receive all the information, your application is deemed to be in good order and we accept your purchase, you will receive the net asset value per share next calculated.
If we are unable to verify your identity within time frames established by each fund, after a reasonable effort to do so, you will receive written notification.
The funds generally will not accept new account applications to establish an account with a non-US address (APO/FPO and US territories acceptable) or for a non-resident alien.
Because orders placed through investment providers must be forwarded to the transfer agent before they can be processed, you’ll need to allow extra time. A representative of your investment provider should be able to tell you when your order will be processed. It is the responsibility of your service agent to forward your order to the transfer agent in a timely manner.
ScudderACCESS, the Scudder Automated Information Line, is available 24 hours a day by calling (800) 972-3060. You can use ScudderACCESS to get information on Scudder funds generally and on accounts held directly at Scudder. You can also use it to make exchanges and sell shares.
QuickBuy/QuickSell let you set up a link between a Scudder account and a bank account. Once this link is in place, you can move money between the two with a phone call. You’ll need to make sure your bank has Automated Clearing House (ACH) services. Transactions
Policies You Should Know About | 31
Table of Contents
take two to three days to be completed and there is a $50 minimum and $250,000 maximum. To set up QuickBuy/QuickSell on a new account, see the account application; to add it to an existing account, call (800) 730-1313.
Telephone and electronic transactions. You are automatically entitled to telephone and electronic transaction privileges, but you may elect not to have them when you open your account or by contacting Shareholder Services at a later date.
If you ever have difficulty placing an order by phone or fax, you can always send us your order in writing.
Since many transactions may be initiated by telephone or electronically, it’s important to understand that as long as we take reasonable steps to ensure that an order to purchase or redeem shares is genuine, such as recording calls or requesting personalized security codes or other information, we are not responsible for any losses that may occur as a result. For transactions conducted over the Internet, we recommend the use of a secure Internet browser. In addition, you should verify the accuracy of your confirmation statements immediately after you receive them.
Exchanges are a shareholder privilege, not a right: we may reject any exchange order or require a shareholder to own shares of a fund for 15 days before we process the purchase order for the other fund particularly when there appears to be a pattern of “market timing” or other frequent purchases and sales. We may also reject or limit purchase orders for these or other reasons. However, there is no assurance that these policies will be effective in limiting the practice of market timing in all cases.
If you pay for shares by check and the check fails to clear, or if you order shares by phone and fail to pay for them by 4:00 p.m. (Eastern time) the next business day, we have the right to cancel your order, hold you liable or charge you or your account for any losses or fees the fund or its agents have incurred. To sell shares, you must state whether you would like to receive the proceeds by wire or check.
The funds accept payment for shares only in US dollars by check, bank or Federal Funds wire transfer, or by electronic bank transfer. Please note that we cannot accept cash, traveler’s checks, starter checks, money orders, third party checks, checks drawn on
32 | Policies You Should Know About
Table of Contents
foreign banks, or checks issued by credit card companies or Internet-based companies.
When you ask us to send or receive a wire, please note that while we don’t charge a fee to send or receive wires, it’s possible that your bank may do so. Wire transactions are generally completed within 24 hours. The funds can only send wires of $1,000 or more and accept wires of $50 or more.
Money from shares you sell is normally sent out within one business day of when your order is processed (not when it is received), although it could be delayed for up to seven days. There are also two circumstances when it could be longer: when you are selling shares you bought recently by check and that check hasn’t cleared yet (maximum delay: 10 days) or when unusual circumstances prompt the SEC to allow further delays. Certain expedited redemption processes may also be delayed when you are selling recently purchased shares.
You may obtain additional information about other ways to sell your shares by contacting your investment provider.
We do not issue share certificates. However, if you currently have shares in certificated form, you must include the share certificates properly endorsed or accompanied by a duly executed stock power when exchanging or redeeming shares. You may not exchange or redeem shares in certificate form by telephone or via the Internet.
When you want to sell more than $100,000 worth of shares or send proceeds to a third party or to a new address, you’ll usually need to place your order in writing and include a signature guarantee. The only exception is if you want money wired to a bank account that is already on file with us; in that case, you don’t need a signature guarantee. Also, you don’t generally need a signature guarantee for an exchange, although we may require one in certain other circumstances.
A signature guarantee is simply a certification of your signature—a valuable safeguard against fraud. You can get a signature guarantee from an eligible guarantor institution, including commercial banks, savings and loans, trust companies, credit unions, member firms of a national stock exchange, or any member or participant of an approved signature guarantor program. Note that you can’t get a
Policies You Should Know About | 33
Table of Contents
signature guarantee from a notary public and we must be provided with the original guarantee.
Selling shares of trust accounts and business or organization accounts may require additional documentation. Please contact your service agent or Shareholder Services for more information.
How the funds calculate share price
To calculate the net asset value per share or NAV, the share class uses the following equation:
TOTAL ASSETS - TOTAL LIABILITIES | = | NAV | ||
| TOTAL NUMBER OF SHARES OUTSTANDING |
The price at which you sell shares is also the NAV.
We typically value securities using market quotations or information furnished by a pricing service. However, we may use methods approved by a fund’s Board that are intended to reflect fair value when a market quotation or pricing service information is not readily available or when a security’s value is believed to have been materially affected by a significant event, such as a natural disaster, an economic event like a bankruptcy filing, or a substantial fluctuation in domestic or foreign markets that has occurred after the close of the exchange or market on which the security is principally traded (for example, a foreign exchange or market). In such a case, the fund’s value for a security is likely to be different from the last quoted market price or pricing service information.
To the extent that a fund invests in securities that are traded primarily in foreign markets, the value of its holdings could change at a time when you aren’t able to buy or sell fund shares. This is because some foreign markets are open on days or at times when the funds don’t price their shares.
Other rights we reserve
You should be aware that we may do any of the following:
| n | withdraw or suspend the offering of shares at any time |
| n | withhold a portion of your distributions as federal income tax if we have been notified by the IRS that you are subject to backup withholding, or if you fail to provide us with a correct taxpayer ID |
34 | Policies You Should Know About
Table of Contents
number or certification that you are exempt from backup withholding |
| n | redeem your shares and close your account on 60 days’ notice if it fails to meet the minimum account balance requirement of $250,000 for any reason other than a change in market value |
| n | reject a new account application if you don’t provide any required or requested identifying information, or for other reasons |
| n | refuse, cancel or rescind any purchase or exchange order; freeze any account (meaning you will not be able to purchase fund shares in your account); suspend account services; and /or involuntarily redeem your account if we think that the account is being used for fraudulent or illegal purposes; one or more of these actions will be taken when, at our sole discretion, they are deemed to be in the fund’s best interest or when the fund is requested or compelled to do so by government law or authority or by applicable law |
| n | close and liquidate your account if we are unable to verify your identity, or for other reasons; if we decide to close your account, your fund shares will be redeemed at the net asset value per share next calculated after we determine to close your account (less any applicable redemption fees); you may be subject to gain or loss on the redemption of your fund shares and may incur tax liability |
| n | pay you for shares you sell by “redeeming in kind,” that is, by giving you marketable securities (which typically will involve brokerage costs for you to liquidate) rather than cash; the fund generally won’t make a redemption in kind unless your requests over a 90-day period total more than $250,000 or 1% of the value of the fund’s net assets, whichever is less |
| n | change, add or withdraw various services, fees and account policies (for example, we may change or terminate the exchange privilege or adjust a fund’s investment minimums at any time) |
| n | suspend or postpone redemptions during periods when the New York Stock Exchange is closed (other than customary closings), trading is restricted or when an emergency exists that prevents the fund from disposing of its portfolio securities or pricing its shares |
Policies You Should Know About | 35
Table of Contents
Understanding Distributions and Taxes
By law, a mutual fund is required to pass through to its shareholders virtually all of its net earnings. A fund can earn money in two ways: by receiving interest, dividends or other income from securities it holds and by selling securities for more than it paid for them. (A fund’s earnings are separate from any gains or losses stemming from your own purchase of shares.) A fund may not always pay a distribution for a given period.
Each fund intends to pay dividends and distributions to its shareholders annually in December and, if necessary, may do so at other times as well.
For federal income tax purposes, income and capital gains distributions are generally taxable. However, distributions by a fund to retirement plans that qualify for tax-exempt treatment under federal income tax laws will not be taxable.
You can choose how to receive your dividends and distributions. You can have them all automatically reinvested in fund shares (at NAV), all deposited directly to your bank account or all sent to you by check, have one type reinvested and the other sent to you by check or have them invested in a different fund. Tell us your preference on your application. If you don’t indicate a preference, your dividends and distributions will all be reinvested. Distributions are taxable whether you receive them in cash or reinvest them in additional shares. For retirement plans, reinvestment is the only option.
Because each shareholder's tax situation is unique, ask your tax professional about the tax consequences of your investments, including any state and local tax consequences.
Buying and selling fund shares will usually have tax consequences for you (except in an IRA or other tax-advantaged account). Your sale of shares may result in a capital gain or loss for you; whether long-term or short-term depends on how long you owned the shares. For tax purposes, an exchange is the same as a sale.
36 | Understanding Distributions and Taxes
Table of Contents
The tax status of a fund’s earnings you receive and your own fund transactions generally depends on their type:
| Generally taxed at capital gains rates: | Generally taxed at ordinary income rates: | |
Distributions from a fund ngains from the sale of securities held by the fund for more than one year nqualified dividend income |
ngains from the sale of securities held by the fund for one year or less nall other taxable income | |
Transactions involving fund shares ngains from selling fund shares held for more than one year |
ngains from selling fund shares held for one year or less |
Any investments in foreign securities may be subject to foreign withholding taxes. In that case, each fund’s yield on those securities would be decreased. Shareholders generally will not be entitled to claim a credit or deduction with respect to foreign taxes. In addition, any investments in foreign securities or foreign currencies may increase or accelerate each fund’s recognition of ordinary income and may affect the timing or amount of each fund’s distributions.
For taxable years beginning on or before December 31, 2008, distributions of investment income designated by each fund as derived from qualified dividend income are eligible for taxation in the hands of individuals at long-term capital gain rates. Qualified dividend income generally includes dividends from domestic and some foreign corporations. In addition, each fund must meet holding period and other requirements with respect to the dividend paying stocks in its portfolio and the shareholder must meet holding period and other requirements with respect to the fund’s shares for the lower rates to apply.
For taxable years beginning on or before December 31, 2008, long-term capital gain rates applicable to individuals have been reduced to 15%. For more information, see the Statement of Additional Information, under “Taxes.”
Your fund will send you detailed tax information every January. These statements tell you the amount and the tax category of any dividends or distributions you received. They also have certain
Understanding Distributions and Taxes | 37
Table of Contents
details on your purchases and sales of shares. Dividends or distributions declared in the last quarter of a given year are taxed in that year, even though you may not receive the money until the following January.
If you invest right before a fund pays a dividend, you’ll be getting some of your investment back as a taxable dividend. You can avoid this, if you want, by investing after the fund declares a dividend. In tax-advantaged retirement accounts you don’t need to worry about this.
Corporations may be able to take a dividends-received deduction for a portion of income dividends they receive.
38 | Understanding Distributions and Taxes
Table of Contents
Notes
Table of Contents
To Get More Information
Shareholder reports — These include commentary from each fund’s management team about recent market conditions and the effects of a fund’s strategies on its performance. They also have detailed performance figures, a list of everything each fund owns, and its financial statements. Shareholders get these reports automatically.
Statement of Additional Information (SAI) — This tells you more about each fund’s features and policies, including additional risk information. The SAI is incorporated by reference into this document (meaning that it’s legally part of this prospectus).
For a free copy of any of these documents or to request other information about a fund, call (800) 621-1048, or contact Scudder Investments at the address listed below. These documents and other information about each fund are available from the EDGAR Database on the SEC’s Internet site at www.sec.gov. If you like, you may obtain copies of this information, after paying a copying fee, by e-mailing a request to publicinfo@sec.gov or by writing the SEC at the address listed below. You can also review and copy these documents and other information about each fund, including each fund’s SAI, at the SEC’s Public Reference Room in Washington, D.C. Information on the operation of the SEC’s Public Reference Room may be obtained by calling (202) 942-8090.
Scudder Investments
222 South Riverside Plaza
Chicago, IL 60606-5808
www.scudder.com
(800) 621-1048
Distributor
Scudder Distributors, Inc.
222 South Riverside Plaza
Chicago, IL 60606-5808


SEC
Public Reference Section
Washington, D.C. 20549-0102
www.sec.gov
(202) 942-8090
| SEC File Numbers: | ||
| Scudder Micro Cap Fund | 811–08006 | |
| Scudder Mid Cap Fund | 811–04760 |
Printed on recycled paper. (02/01/04) SSAGF2–1–IN
Table of Contents
| SCUDDER | ||
| INVESTMENTS |
Supplement to the currently effective Class C prospectus of each of the listed funds:
Scudder 21st Century Growth Fund
Scudder Aggressive Growth Fund
Scudder Blue Chip Fund
Scudder California Tax-Free Income Fund
Scudder Capital Growth Fund
Scudder Dynamic Growth Fund
Scudder Fixed Income Fund
Scudder Flag Investors Equity Partners Fund
Scudder Flag Investors Value Builder Fund
Scudder Florida Tax-Free Income Fund
Scudder Global Biotechnology Fund
Scudder Global Fund
Scudder Growth Fund
Scudder Growth and Income Fund
Scudder Health Care Fund
Scudder High Income Fund
Scudder High Income Opportunity Fund
Scudder High Yield Tax-Free Fund
Scudder Income Fund
Scudder Intermediate Tax/AMT Free Fund
Scudder International Fund
Scudder Japanese Equity Fund
Scudder Large Company Growth Fund
Scudder Large Company Value Fund
Scudder Managed Municipal Bond Fund
Scudder Massachusetts Tax-Free Fund
Scudder Micro Cap Fund
Scudder Mid Cap Fund
Scudder New York Tax-Free Income Fund
Scudder Pathway Series — Conservative Portfolio
Scudder Pathway Series — Growth Portfolio
Scudder Pathway Series — Moderate Portfolio
Scudder PreservationPlus Income Fund
Scudder S&P 500 Stock Fund
Scudder Select 500 Fund
Scudder Short Duration Fund
Scudder Short-Term Bond Fund
Scudder Small Cap Fund
Scudder Small Company Stock Fund
Scudder Small Company Value Fund
Scudder Strategic Income Fund
Scudder Tax Advantaged Dividend Fund
Scudder Technology Fund
Scudder Technology Innovation Fund
Scudder Top 50 US Fund
Scudder U.S. Government Securities Fund
Table of Contents
The following information supplements each of the above-listed funds’ currently effective Class C prospectus:
Effective March 1, 2004, the 1.00% front-end sales charge (load) imposed on purchases of Class C shares of the fund was eliminated. Class C shares of the fund are offered at net asset value and will continue to be subject to a contingent deferred sales charge of 1.00% (for shares sold within one year of purchase) and Rule 12b-1 fees, as described in each prospectus. The following replaces the “Shareholder Fees” information for Class C shares of each fund as set forth in the Fee Table under “How Much Investors Pay”:
Shareholder Fees, paid directly from your investment
Maximum Sales Charge (Load) Imposed on Purchases (as % of offering price) | None | ||
Maximum Contingent Deferred Sales Charge (Load) (as % of redemption proceeds) | 1.00 | % |
The following information updates the expense example information for Class C shares in the “How Much Investors Pay” section of each fund’s prospectus to reflect the elimination of the 1.00% front-end sales charge (load):
Example | Expenses, assuming you sold your shares at the end of each period | Expenses, assuming you kept your shares | ||||||||||||||
| 1 Year | 3 Years | 5 Years | 10 Years | 1 Year | 3 Years | 5 Years | 10 Years | |||||||||
Scudder 21st Century Growth Fund | 352 | 983 | 1,735 | 3,716 | 252 | 983 | 1,735 | 3,716 | ||||||||
Scudder Aggressive Growth Fund | 353 | 937 | 1,645 | 3,524 | 253 | 937 | 1,645 | 3,524 | ||||||||
Scudder Blue Chip Fund | 303 | 663 | 1,149 | 2,490 | 203 | 663 | 1,149 | 2,490 | ||||||||
Scudder California Tax-Free Income Fund | 262 | 502 | 866 | 1,889 | 162 | 502 | 866 | 1,889 | ||||||||
Scudder Capital Growth Fund | 303 | 795 | 1,412 | 3,079 | 203 | 795 | 1,412 | 3,079 | ||||||||
Scudder Dynamic Growth Fund | 355 | 967 | 1,702 | 3,643 | 255 | 967 | 1,702 | 3,643 | ||||||||
Scudder Fixed Income Fund | 258 | 490 | 845 | 1,845 | 158 | 490 | 845 | 1,845 | ||||||||
Scudder Flag Investors Equity Partners Fund | 300 | 618 | 1,062 | 2,296 | 200 | 618 | 1,062 | 2,296 | ||||||||
Scudder Flag Investors Value Builder Fund | 290 | 588 | 1,011 | 2,190 | 190 | 588 | 1,011 | 2,190 | ||||||||
Table of Contents
Example | Expenses, assuming you sold your shares at the end of each period | Expenses, assuming you kept your shares | ||||||||||||||||||||||
| 1 Year | 3 Years | 5 Years | 10 Years | 1 Year | 3 Years | 5 Years | 10 Years | |||||||||||||||||
Scudder Florida Tax-Free Income Fund | $ | 280 | $ | 557 | $ | 959 | $ | 2,084 | $ | 180 | $ | 557 | $ | 959 | $ | 2,084 | ||||||||
Scudder Global Biotechnology Fund | 328 | 1,548 | 2,827 | 5,860 | 228 | 1,548 | 2,827 | 5,860 | ||||||||||||||||
Scudder Global Fund | 349 | 871 | 1,518 | 3,254 | 249 | 871 | 1,518 | 3,254 | ||||||||||||||||
Scudder Growth Fund | 302 | 773 | 1,371 | 2,989 | 202 | 773 | 1,371 | 2,989 | ||||||||||||||||
Scudder Growth and Income Fund | 299 | 671 | 1,170 | 2,544 | 199 | 671 | 1,170 | 2,544 | ||||||||||||||||
Scudder Health Care Fund | 343 | 802 | 1,441 | 3,158 | 243 | 802 | 1,441 | 3,158 | ||||||||||||||||
Scudder High Income Fund | 276 | 545 | 939 | 2,041 | 176 | 545 | 939 | 2,041 | ||||||||||||||||
Scudder High Income Opportunity Fund | 308 | 643 | 1,103 | 2,379 | 208 | 643 | 1,103 | 2,379 | ||||||||||||||||
Scudder High Yield Tax-Free Fund | 280 | 557 | 959 | 2,084 | 180 | 557 | 959 | 2,084 | ||||||||||||||||
Scudder Income Fund | 294 | 613 | 1,070 | 2,339 | 194 | 613 | 1,070 | 2,339 | ||||||||||||||||
Scudder Intermediate Tax/AMT Free Fund | 270 | 526 | 907 | 1,976 | 170 | 526 | 907 | 1,976 | ||||||||||||||||
Scudder International Fund | 338 | 752 | 1,292 | 2,769 | 238 | 752 | 1,292 | 2,769 | ||||||||||||||||
Scudder Japanese Equity Fund | 318 | 876 | 1,559 | 3,380 | 218 | 876 | 1,559 | 3,380 | ||||||||||||||||
Scudder Large Company Growth Fund | 306 | 865 | 1,548 | 3,371 | 206 | 865 | 1,548 | 3,371 | ||||||||||||||||
Scudder Large Company Value Fund | 305 | 782 | 1,386 | 3,018 | 205 | 782 | 1,386 | 3,018 | ||||||||||||||||
Scudder Managed Municipal Bond Fund | 259 | 493 | 850 | 1,856 | 159 | 493 | 850 | 1,856 | ||||||||||||||||
Scudder Massachusetts Tax-Free Fund | 282 | 563 | 970 | 2,105 | 182 | 563 | 970 | 2,105 | ||||||||||||||||
Scudder Micro Cap Fund | 352 | 861 | 1,496 | 3,203 | 252 | 861 | 1,496 | 3,203 | ||||||||||||||||
Scudder Mid Cap Fund | 303 | 646 | 1,115 | 2,414 | 203 | 646 | 1,115 | 2,414 | ||||||||||||||||
Scudder New York Tax-Free Income Fund | 265 | 511 | 881 | 1,922 | 165 | 511 | 881 | 1,922 | ||||||||||||||||
Scudder Pathway Series — Conservative Portfolio | 279 | 602 | 1,051 | 2,298 | 179 | 602 | 1,051 | 2,298 | ||||||||||||||||
Scudder Pathway Series — Growth Portfolio | 286 | 644 | 1,129 | 2,467 | 186 | 644 | 1,129 | 2,467 | ||||||||||||||||
Scudder Pathway Series — Moderate Portfolio | $ | 284 | $ | 607 | $ | 1,056 | $ | 2,302 | $ | 184 | $ | 607 | $ | 1,056 | $ | 2,302 | ||||||||
Scudder PreservationPlus Income Fund | 328 | 705 | 1,209 | 2,594 | 228 | 705 | 1,209 | 2,594 | ||||||||||||||||
Scudder S&P 500 Stock Fund | 282 | 657 | 1,159 | 2,540 | 182 | 657 | 1,159 | 2,540 | ||||||||||||||||
Scudder Select 500 Fund | 297 | 609 | 1,047 | 2,264 | 197 | 609 | 1,047 | 2,264 | ||||||||||||||||
Scudder Short Duration Fund | 258 | 508 | 883 | 1,936 | 158 | 508 | 883 | 1,936 | ||||||||||||||||
Scudder Short-Term Bond Fund | 283 | 566 | 975 | 2,116 | 183 | 566 | 975 | 2,116 | ||||||||||||||||
Scudder Small Cap Fund | 303 | 652 | 1,128 | 2,442 | 203 | 652 | 1,128 | 2,442 | ||||||||||||||||
Scudder Small Company Stock Fund | 351 | 838 | 1,451 | 3,105 | 251 | 838 | 1,451 | 3,105 | ||||||||||||||||
Scudder Small Company Value Fund | 329 | 706 | 1,210 | 2,595 | 229 | 706 | 1,210 | 2,595 | ||||||||||||||||
Scudder Strategic Income Fund | 300 | 618 | 1,062 | 2,296 | 200 | 618 | 1,062 | 2,296 | ||||||||||||||||
Scudder Tax Advantaged Dividend Fund | 279 | 652 | 1,152 | 2,528 | 179 | 652 | 1,152 | 2,528 | ||||||||||||||||
Scudder Technology Fund | 318 | 673 | 1,154 | 2,483 | 218 | 673 | 1,154 | 2,483 | ||||||||||||||||
Scudder Technology Innovation Fund | 359 | 847 | 1,510 | 3,286 | 259 | 847 | 1,510 | 3,286 | ||||||||||||||||
Scudder Top 50 US Fund | 293 | 891 | 1,613 | 3,525 | 193 | 891 | 1,613 | 3,525 | ||||||||||||||||
Scudder U.S. Government Securities Fund | 267 | 517 | 892 | 1,944 | 167 | 517 | 892 | 1,944 | ||||||||||||||||
All other references to a front-end sales charge imposed on purchases of Class C shares that appear in the fund’s current prospectus are hereby deleted.
April 8, 2004
SMF-3620
Table of Contents
| SCUDDER | ||
INVESTMENTS |
Supplement to the Currently Effective Prospectuses of each of the Listed Funds:
Scudder International Equity Fund
Scudder Mid Cap Fund
Scudder Small Cap Fund
The following information supplements the “The Fund’s Main Investment Strategy” section of the prospectus.
The fund may lend its investment securities up to 30% of its total assets to approved institutional borrowers who need to borrow securities in order to complete certain transactions.
The following information supplements the “The Main Risks of Investing in the Fund” section of the prospectus.
Securities Lending Risk. Any loss in the market price of securities loaned by the fund that occurs during the term of the loan would be borne by the fund and would adversely affect the fund’s performance. Also, there may be delays in recovery of securities loaned or even a loss of rights in the collateral should the borrower of the securities fail financially while the loan is outstanding. However, loans will be made only to borrowers selected by the fund’s delegate after a review of relevant facts and circumstances, including the creditworthiness of the borrower.
Please Retain This Supplement for Future Reference
April 27, 2004
SMF-3623
Table of Contents
| SCUDDER | ||
INVESTMENTS |
Supplement to the currently effective Prospectus for each of the listed funds:
Scudder 21st Century Growth Fund
Scudder Aggressive Growth Fund
Scudder Development Fund
Scudder Dynamic Growth Fund
Scudder Micro Cap Fund
Scudder Mid Cap Fund
Scudder Small Cap Fund
The people listed below handle the day-to-day management of each fund effective May 3, 2004. Ms. Jones is retiring on June 30, 2004. Effective July 1, 2004, Mr. Dedio and Mr. Janis will become Co-Lead Portfolio Managers of each fund.
Audrey M.T. Jones, CFA Managing Director of Deutsche Asset Management and Lead Portfolio Manager of the funds through June 30, 2004.
• Joined Deutsche Asset Management in 1986.
• Portfolio manager with a primary focus on the credit sensitive, communications services, energy, process industries and transportation sectors.
• Over 30 years of investment industry experience.
• BBA, Pace University Lubin School of Business.
• Joined Scudder 21st Century Growth Fund, Scudder Aggressive Growth Fund, Scudder Development Fund and Scudder Dynamic Growth Fund in 2002 and Scudder Micro Cap Fund, Scudder Mid Cap Fund and Scudder Small Cap Fund at each fund’s inception.
Samuel A. Dedio Managing Director of Deutsche Asset Management and Portfolio Manager of the funds.
• Joined Deutsche Asset Management in 1999 after eight years of experience, formerly serving as analyst at Ernst & Young, LLP, Evergreen Asset Management and Standard & Poor’s Corp.
• Portfolio manager for US small- and mid-cap equity and senior small cap analyst for health care and technology.
• MS, American University, Kogod School of Business.
• Joined the funds in 2002. | Robert S. Janis Managing Director of Deutsche Asset Management and Portfolio Manager of the funds.
• Joined Deutsche Asset Management and the funds in 2004.
• Previously served as portfolio manager for ten years at Credit Suisse Asset Management (or at its predecessor Warburg Pincus Asset Management).
• Portfolio manager for US small- and mid-cap equity and senior small cap analyst for consumer discretionary, staples and capital goods sectors.
• Over 20 years of investment industry experience.
• MBA, University of Pennsylvania, Wharton School. |
May 3, 2004
SMF-3624
PS50/67-2A-054
Table of Contents
SCUDDER | ||
INVESTMENTS |
Supplement to the currently effective prospectus of each of the listed funds:
Cash Account Trust
Government & Agency Securities Portfolio
Money Market Portfolio
Tax-Exempt Portfolio
Cash Equivalent Fund
Government & Agency Securities Portfolio
Money Market Portfolio
Tax-Exempt Portfolio
Cash Management Fund Institutional
Cash Management Fund Investment
Cash Reserve Fund, Inc.
Prime Series
Treasury Series
Tax-Free Series
Cash Reserves Fund Institutional
Daily Assets Fund Institutional
Investors Cash Trust
Government & Agency Securities Portfolio
Treasury Portfolio
Investors Municipal Cash Fund
Investors Florida Municipal Cash Fund
Investors Michigan Municipal Cash Fund
Investors New Jersey Municipal Cash Fund
Investors Pennsylvania Municipal Cash Fund
Tax-Exempt New York Money Market Fund
Money Market Fund Investment
NY Tax Free Money Fund Investment
Scudder 21st Century Growth Fund
Scudder Aggressive Growth Fund
Scudder Balanced Fund
Scudder Blue Chip Fund
Scudder California Tax-Free Income Fund
Scudder Capital Growth Fund
Scudder Cash Investment Trust
Scudder Cash Reserves Fund
Scudder Development Fund
Scudder-Dreman Financial Services Fund
Scudder-Dreman High Return Equity Fund
Scudder-Dreman Small Cap Value Fund
Scudder Dynamic Growth Fund
Scudder EAFE Equity Index Fund
Scudder Emerging Markets Debt Fund
Scudder Emerging Markets Growth Fund
Scudder Emerging Markets Income Fund
Scudder Equity 500 Index Fund
Scudder European Equity Fund
Scudder Fixed Income Fund
Scudder Flag Investors Communications Fund
Scudder Flag Investors Equity Partners Fund
Scudder Flag Investors Value Builder Fund
Scudder Florida Tax-Free Income Fund
Scudder Focus Value + Growth Fund
Scudder Global Biotechnology Fund
Scudder Global Bond Fund
Scudder Global Discovery Fund
Scudder Global Fund
Scudder GNMA Fund
Scudder Gold and Precious Metals Fund
Scudder Greater Europe Growth Fund
Scudder Growth and Income Fund
Scudder Growth Fund
Scudder Health Care Fund
Scudder High Income Fund
Scudder High Income Opportunity Fund
Scudder High Income Plus Fund
Scudder High Yield Tax-Free Fund
Scudder Income Fund
Scudder Intermediate Tax/AMT Free Fund
Scudder International Equity Fund
Scudder International Fund
Scudder International Select Equity Fund
Scudder Japanese Equity Fund
Scudder Large Cap Value Fund
Scudder Large Company Growth Fund
Scudder Large Company Value Fund
Scudder Latin America Fund
Scudder Lifecycle Long Range Fund
Scudder Lifecycle Mid Range Fund
Scudder Lifecycle Short Range Fund
Scudder Managed Municipal Bond Fund
Scudder Massachusetts Tax-Free Fund
Scudder Micro Cap Fund
Scudder Mid Cap Fund
Scudder Money Funds
Scudder Government & Agency Money Fund
Scudder Money Market Fund
Scudder Tax-Exempt Money Fund
Scudder Money Market Series
Scudder Municipal Bond Fund
Scudder New Europe Fund
Scudder New York Tax-Free Income Fund
Scudder Pacific Opportunities Fund
Scudder Pathway Series: Conservative Portfolio
Scudder Pathway Series: Growth Portfolio
Scudder Pathway Series: Moderate Portfolio
Scudder PreservationPlus Fund
Scudder PreservationPlus Income Fund
Scudder Retirement Fund — Series V
Scudder Retirement Fund — Series VI
Scudder Retirement Fund — Series VII
Scudder RREEF Real Estate Securities Fund
Scudder S&P 500 Index Fund
Scudder S&P 500 Stock Fund
Scudder Select 500 Fund
Scudder Short Duration Fund
Scudder Short-Term Bond Fund
Scudder Short-Term Municipal Bond Fund
Scudder Small Cap Fund
Scudder Small Company Stock Fund
Scudder Small Company Value Fund
Scudder Strategic Income Fund
Scudder Target 2010 Fund
Scudder Target 2011 Fund
Scudder Target 2012 Fund
Scudder Target 2013 Fund
Scudder Tax Advantaged Dividend Fund
Scudder Tax Free Money Fund
Scudder Technology Fund
Scudder Technology Innovation Fund
Scudder Top 50 US Fund
Scudder Total Return Fund
Scudder Total Return Bond Fund
Scudder US Bond Index Fund
Scudder US Government Securities Fund
Scudder US Treasury Money Fund
Scudder YieldWise Funds
Scudder YieldWise Government & Agency Money Fund
Scudder YieldWise Money Fund
Scudder YieldWise Municipal Money Fund
Scudder Worldwide 2004 Fund
Tax Free Money Fund Investment
Tax-Exempt California Money Market Fund
Treasury Money Fund Institutional
Treasury Money Fund Investment
June 1, 2004
SMF-3627
PSMEGA-2A-064
Table of Contents
The following information is added to each fund’s prospectus under the heading “Who Manages and Oversees the Funds”:
Regulatory and Litigation Matters
Since at least July 2003, federal, state and industry regulators have been conducting ongoing inquiries and investigations (“inquiries”) into the mutual fund industry, and have requested information from numerous mutual fund companies, including Scudder Investments. We are unable to determine what the outcome of these inquiries will be or what the effect, if any, would be on the funds or their advisors. Publicity about mutual fund practices arising from these industry-wide inquiries serve as the general basis of a number of private lawsuits against the Scudder funds. These lawsuits, which previously have been reported in the press, involve purported class action and derivative lawsuits, making various allegations and naming as defendants various persons, including certain Scudder funds, Deutsche Asset Management (“DeAM”) and its affiliates, certain individuals, including in some cases fund Trustees/Directors, and other parties. DeAM has undertaken to bear all liabilities and expenses incurred by the Scudder funds in connection with these lawsuits, or other lawsuits or regulatory actions that may be filed making allegations similar to these lawsuits regarding fund valuation, market timing, revenue sharing or other subjects of the pending inquiries. Based on currently available information, DeAM believes the likelihood that the pending lawsuits will have a material adverse financial impact on a Scudder fund is remote and such actions are not likely to materially affect its ability to perform under its investment management agreements with the Scudder funds.
Table of Contents
SCUDDER | ||
INVESTMENTS |
Supplement to the currently effective Prospectus of each of the listed funds:
Scudder Japanese Equity Fund
Scudder Lifecycle Long Range Fund
Scudder Lifecycle Mid Range Fund
Scudder Lifecycle Short Range Fund
Scudder Micro Cap Fund
Scudder Mid Cap Fund
Scudder Small Cap Fund
For Scudder Micro Cap Fund only:
The following supplements the information in the currently effective Class A, B, C, Institutional Class and Investment Class prospectuses of Scudder Micro Cap Fund:
Average Annual Total Returns (%) as of 12/31/2003
| 1 Year | 5 Years | Since Inception For Classes A, B, | Since Inception For Investment Class** | |||||
Index 2 (reflects no deductions for fees, expenses or taxes) | 48.54 | 0.86 | 2.56 | 0.73 |
Index 2: Russell 2000 Growth Index is an unmanaged capitalization-weighted measure of 2,000 of the smallest capitalized US companies with a greater-than-average growth orientation and whose common stocks trade on the NYSE, AMEX and Nasdaq.***
| * | Since December 18, 1996 (inception date of Institutional Class). The inception date for Class A, B and C shares is June 28, 2002. The performance figures for Class A, B and C shares prior to inception are based on the historical performance of the Institutional Class, adjusted to reflect both the higher gross total annual operating expenses and the current applicable sales charges of Class A, B and C shares. Index comparison begins on December 31, 1996. |
| ** | Since August 21, 1997 (inception date of Investment Class). Index comparison begins on August 30, 1997. |
| *** | Effective on or about July 1, 2004, the Russell 2000 Growth Index will replace the Russell 2000 Index as the fund’s benchmark index because the advisor believes it is more appropriate to measure the fund’s performance against the Russell 2000 Growth Index as it more accurately reflects the fund’s investment strategy. |
For Scudder Small Cap Fund only:
Effective on or about July 1, 2004, Scudder Small Cap Fund will change its name to Scudder Small Cap Growth Fund. The fund’s name is being changed to better reflect the fund’s investment strategy. This change does not represent a change in the fund’s goal or investment strategy.
The following supplements the information in the currently effective Class A, B, C, R and Investment Class prospectuses of Scudder Small Cap Fund:
Average Annual Total Returns (%) as of 12/31/2003
| 1 Year | 5 Years | 10 Years | ||||
Index 2 (reflects no deductions for fees, expenses or taxes) | 48.54 | 0.86 | 5.43 |
Index 2: Russell 2000 Growth Index is an unmanaged capitalization-weighted measure of 2,000 of the smallest capitalized US companies with a greater-than-average growth orientation and whose common stocks trade on the NYSE, AMEX and Nasdaq.*
| * | Effective on or about July 1, 2004, the Russell 2000 Growth Index will replace the Russell 2000 Index as the fund’s benchmark index because the advisor believes it is more appropriate to measure the fund’s performance against the Russell 2000 Growth Index as it more accurately reflects the fund’s investment strategy. |
June 11, 2004
SMF-3629
Table of Contents
For Scudder Mid Cap Fund only:
Effective on or about August 20, 2004, Scudder Mid Cap Fund will change its name to Scudder Mid Cap Growth Fund.
Effective on or about August 20, 2004, the fund’s 80% investment policy will be changed as follows:
The fund’s current investment policy states that, under normal circumstances, the fund invests at least 80% of its assets, determined at the time of purchase, in companies with market caps within the market capitalization range of the S&P Mid Cap 400 Index or securities with equity characteristics that provide exposure to those companies. This policy will be revised as follows: Under normal circumstances, the fund invests at least 80% of its assets, determined at the time of purchase, in companies with market caps within the market capitalization range of the Russell Mid Cap Growth Index or securities with equity characteristics that provide exposure to those companies. The fund will provide shareholders with at least 60 days’ notice prior to making any changes to this revised 80% investment policy.
The following supplements the information in the currently effective Class A, B, C, R, Investment Class and Institutional Class prospectuses of Scudder Mid Cap Fund:
Average Annual Total Returns (%) as of 12/31/2003
| 1 Year | 5 Years | 10 Years | ||||
Index 2 (reflects no deductions for fees, expenses or taxes) | 42.71 | 2.01 | 9.40 |
Index 2: Russell Mid Cap Growth Index, an unmanaged capitalization-weighted index of medium and medium/small companies in the Russell 1000 Index chosen for their growth orientation.*
| * | Effective on or about August 20, 2004, the Russell Mid Cap Growth Index will replace the S&P Mid Cap 400 Index as the fund’s benchmark index because the advisor believes it is more appropriate to measure the fund’s performance against the Russell Mid Cap Growth Index as it more accurately reflects the fund’s investment strategy. |
For Scudder Japanese Equity Fund, Scudder Lifecycle Short Range Fund, Scudder Lifecycle Mid Range Fund and Scudder Lifecycle Long Range Fund only:
On or about August 20, 2004, Scudder Japanese Equity Fund, Scudder Lifecycle Short Range Fund, Scudder Lifecycle Mid Range Fund and Scudder Lifecycle Long Range Fund, each currently a feeder fund in a master-feeder structure, will receive all of their assets from their respective master portfolios and convert to stand-alone funds. The respective master portfolios hold no other investments and will be closed after the conversion of the feeder funds.
2
Table of Contents
SCUDDER | ||
INVESTMENTS |
Supplement to the currently effective prospectus of each of the listed funds:
Scudder 21st Century Growth Fund
Scudder Aggressive Growth Fund
Scudder Blue Chip Fund
Scudder Capital Growth Fund
Scudder-Dreman Financial Services Fund
Scudder-Dreman High Return Equity Fund
Scudder-Dreman Small Cap Value Fund
Scudder Dynamic Growth Fund
Scudder Emerging Markets Growth Fund
Scudder European Equity Fund
Scudder Flag Investors Communications Fund
Scudder Flag Investors Equity Partners Fund
Scudder Flag Investors Value Builder Fund
Scudder Focus Value + Growth Fund
Scudder Global Biotechnology Fund
Scudder Global Discovery Fund
Scudder Global Fund
Scudder Gold and Precious Metals Fund
Scudder Greater Europe Growth Fund
Scudder Growth and Income Fund
Scudder Growth Fund
Scudder Health Care Fund
Scudder International Equity Fund
Scudder International Fund
Scudder International Select Equity Fund
Scudder Japanese Equity Fund
Scudder Large Cap Value Fund
Scudder Large Company Growth Fund
Scudder Large Company Value Fund
Scudder Latin America Fund
Scudder Micro Cap Fund
Scudder Mid Cap Fund
Scudder New Europe Fund
Scudder Pacific Opportunities Fund
Scudder Pathway Series: Conservative Portfolio
Scudder Pathway Series: Growth Portfolio
Scudder Pathway Series: Moderate Portfolio
Scudder RREEF Real Estate Securities Fund
Scudder S&P 500 Stock Fund
Scudder Small Cap Growth Fund
Scudder Small Company Stock Fund
Scudder Small Company Value Fund
Scudder Target 2013 Fund
Scudder Tax Advantaged Dividend Fund
Scudder Technology Fund
Scudder Technology Innovation Fund
Scudder Top 50 US Fund
Scudder Total Return Fund
The following replaces similar information in each fund’s prospectus under the heading “How Much Investors Pay”:
The redemption of shares purchased at net asset value under the Large Order NAV Purchase Privilege (see “Policies You Should Know About — Policies about transactions”) may be subject to a contingent deferred sales charge of 1.00% if redeemed within 12 months of purchase and 0.50% if redeemed within 12 to 18 months following purchase.
The following replaces similar information in each fund’s prospectus under the heading “Choosing a Share Class”:
If you’re investing $1 million or more, either as a lump sum or through one of the sales charge reduction features, you may be eligible to buy Class A shares without sales charges. However, you may be charged a contingent deferred sales charge (CDSC) of 1.00% on any shares you sell within 12 months of owning them and a similar charge of 0.50% on shares you sell within 12 to 18 months of owning them (“Large Order NAV Purchase Privilege”). This CDSC is waived under certain circumstances (see “Policies You Should Know About”). Your financial advisor or Shareholder Services can answer your questions and help you determine if you’re eligible.
July 1, 2004
Table of Contents
SCUDDER
INVESTMENTS
Supplement to the Currently Effective Prospectuses of each of the Listed Funds:
| Scudder Greater Europe Growth Fund | Scudder Gold & Precious Metals Fund | |
| Scudder Growth & Income Fund | Scudder Global Fund | |
| Scudder Large Company Growth Fund | Scudder Health Care Fund | |
| Scudder Large Company Value Fund | Scudder Technology Innovation Fund | |
| Scudder Emerging Market Growth Fund | Scudder Development Fund | |
| Scudder Capital Growth Fund | Scudder Micro Cap Fund | |
| Scudder Select 500 Fund | Scudder International Select Equity Fund | |
| Scudder Global Discovery Fund | Scudder European Equity Fund | |
| Scudder International Fund | Scudder Flag Investors Equity Partners Fund |
The following information supplements the “The Fund’s Main Investment Strategy” section of the prospectus.
The fund may lend its investment securities up to 33 1/3% of its total assets to approved institutional borrowers who need to borrow securities in order to complete certain transactions.
The following information supplements the “The Main Risks of Investing in the Fund” section of the prospectus.
Securities Lending Risk. Any loss in the market price of securities loaned by the fund that occurs during the term of the loan would be borne by the fund and would adversely affect the fund’s performance. Also, there may be delays in recovery of securities loaned or even a loss of rights in the collateral should the borrower of the securities fail financially while the loan is outstanding. However, loans will be made only to borrowers selected by the fund’s delegate after a review of relevant facts and circumstances, including the creditworthiness of the borrower.
Please Retain This Supplement for Future Reference
April 27, 2004
Table of Contents
STATEMENT OF ADDITIONAL INFORMATION
February 1, 2004
Scudder Advisor Funds
Mid Cap Fund – Investment Class
Mid Cap Fund – Institutional Class
Mid Cap Fund – Class A Shares
Mid Cap Fund – Class B Shares
Mid Cap Fund – Class C Shares
Mid Cap Fund – Class R Shares
Small Cap Fund – Investment Class
Small Cap Fund – Class A Shares
Small Cap Fund – Class B Shares
Small Cap Fund – Class C Shares
Small Cap Fund – Class R Shares
Scudder Advisor Funds (the “Trust”) is an open-end, management investment company consisting of a number of separate investment funds. The shares of Mid Cap Fund and Small Cap Fund (each, a “Fund” and together the “Funds”) – are described herein. Mid Cap Fund currently offers six classes of shares, Investment Class, Institutional Class and Class A, B, C and R Shares. Small Cap Fund currently offers five classes of shares, Investment Class, Class A, B, C and R Shares. Each of the Funds is a separate series of the Trust.
Prior to March 28, 2002, Mid Cap Fund and Small Cap Fund invested all of their investable assets in diversified open-end management investment companies having the same investment objectives as each Fund. These investment companies were Capital Appreciation Portfolio and Small Cap Portfolio, respectively (each, a “Portfolio” and collectively, the “Portfolios”). Since March 28, 2002 each Fund is now operating as a stand-alone mutual fund that directly acquires and manages its own portfolio of securities. Mid Cap Fund and Small Cap Fund may in the future seek to achieve their investment objectives by investing all of their net assets in investment companies having the same investment policies and restrictions as those applicable to each Fund.
Shares of the Funds are sold by Scudder Distributors, Inc. (“SDI”), the Trust’s Distributor, to clients and customers (including affiliates and correspondents) of Deutsche Asset Management, Inc. (“DeAM, Inc.”), the Funds’ investment advisor (the “Advisor”), and to clients and customers of other organizations.
The Prospectuses for Mid Cap Fund and Small Cap Fund are dated February 1, 2004 (collectively, the “Prospectuses”). The Prospectuses provide the basic information investors should know before investing. This Statement of Additional Information (“SAI”), which is not a Prospectus, is intended to provide additional information regarding the activities and operations of the Trust and should be read in conjunction with that Fund’s Prospectus. You may request a copy of a prospectus or a paper copy of this SAI, if you have received it electronically, free of charge by calling the Trust at the telephone number listed below or by contacting any Service
Table of Contents
Agent (which is any broker, financial advisor, bank, dealer or other institution or financial intermediary that has a sub-shareholder servicing agreement with DeAM, Inc.). This SAI is not an offer of any Fund for which an investor has not received a Prospectus. Capitalized terms not otherwise defined in this SAI have the meanings accorded to them in the Trust’s Prospectuses. The audited financial statements for each Fund for the fiscal year ended September 30, 2003, are incorporated herein by reference to the Annual Reports to shareholders for the Funds dated September 30, 2003. A copy of the Funds’ Annual Report may be obtained without charge by calling 1-800-621-1048 (Institutional shares, call 900-730-1313).
Table of Contents
| 1 | ||
| 1 | ||
| 1 | ||
| 4 | ||
| 6 | ||
| 10 | ||
| 17 | ||
| 22 | ||
| 31 | ||
| 31 | ||
PURCHASE AND REDEMPTION OF SHARES | 35 | |
| 35 | ||
| 37 | ||
| 44 | ||
| 47 | ||
| 48 | ||
| 50 | ||
NET ASSET VALUE | 51 | |
| 53 | ||
| 53 | ||
| 54 | ||
| 56 | ||
| 56 | ||
| 57 | ||
Ownership in Securities of the Advisors and Related Companies | 58 | |
| 62 | ||
| 64 | ||
| 65 | ||
| 66 | ||
| 68 | ||
| 68 | ||
| 68 | ||
i
Table of Contents
| 71 | ||
| 72 | ||
| 73 | ||
| 74 | ||
| 74 | ||
| 80 | ||
| 81 | ||
| 81 | ||
| 82 | ||
| 83 | ||
| 83 | ||
| 83 | ||
| 84 | ||
| 84 | ||
| 84 | ||
| 85 | ||
| 85 | ||
ii
Table of Contents
INVESTMENT OBJECTIVES, RESTRICTIONS AND POLICIES
Both Mid Cap Fund’s and Small Cap Fund’s investment objectives are long-term capital growth. The production of any current income is secondary to each Fund’s investment objective, and there can, of course, be no assurance that either Fund will achieve its investment objective.
Under normal circumstances, Mid Cap Fund invests at least 80% of its assets, determined at the time of purchase, in companies with market caps within the market capitalization range of the S&P Mid-Cap 400 Index or securities with equity characteristics that provide exposure to those companies.
Under normal circumstances, Small Cap Fund invests at least 80% of its assets, determined at the time of purchase, in the stock, and other securities with equity characteristics, of smaller capitalization companies. The Advisor defines the small capitalization equity securities universe as the bottom 20% of the total domestic equity market capitalization (at the time of investment), using a minimum market capitalization of $10 million.
Fundamental Policies. The following investment restrictions are “fundamental policies” of each Fund and may not be changed with respect to the Fund without the approval of a “majority of the outstanding voting securities” of the Fund, as the case may be. “Majority of the outstanding voting securities” under the 1940 Act, and as used in this SAI, means, with respect to the Fund, the lesser of (i) 67% or more of the outstanding voting securities of the Fund present at a meeting, if the holders of more than 50% of the outstanding voting securities of the Fund are present or represented by proxy or (ii) more than 50% of the outstanding voting securities of the Fund. Whenever the Trust is requested to vote on a fundamental policy of a Fund, the Trust will hold a meeting of the corresponding Fund’s shareholders and will cast its vote as instructed by that Fund’s shareholders. The Fund’s shareholders who do not vote will not affect the Trust’s votes at the Fund’s meeting. The percentage of the Trust’s votes representing Fund’s shareholders not voting will be voted by the Trustees of the Trust in the same proportion as the Fund’s shareholders who do, in fact, vote.
No Fund may (except that no investment restriction of a Fund shall prevent a Fund from investing all of its assets in an open-end investment company with substantially the same investment objectives):
| (1) | borrow money or mortgage or hypothecate assets of the Fund, in excess of 5% of the Fund’s total assets (taken at cost); except that in an amount not to exceed 1/3 of the current value of the Fund’s net assets, it may borrow money (but only as a temporary measure for extraordinary or emergency purposes) in the case of the Small Cap Fund and Mid Cap Fund and enter into reverse repurchase agreements or dollar roll transactions; and except that it may pledge, mortgage or hypothecate not more than 1/3 of such assets to secure such borrowings (it is intended that money would be borrowed only from banks and only either to accommodate requests for the withdrawal of beneficial interests (redemption of shares) while effecting an orderly liquidation of portfolio securities or to |
Table of Contents
maintain liquidity in the event of an unanticipated failure to complete a portfolio security transaction or other similar situations) or reverse repurchase agreements, provided that collateral arrangements with respect to options and futures, including deposits of initial deposit and variation margin, are not considered a pledge of assets for purposes of this restriction; and except that assets may be pledged to secure letters of credit solely for the purpose of participating in a captive insurance company sponsored by the Investment Company Institute; for additional related restrictions, see clause (i) under the caption “Additional Restrictions” below (as an operating policy, the Fund may not engage in dollar-roll transactions); |
| (2) | underwrite securities issued by other persons except insofar as the Fund (Trust) may technically be deemed an underwriter under the 1933 Act in selling a portfolio security; |
| (3) | make loans to other persons except: (a) through the lending of the Fund’s portfolio securities and provided that any such loans not exceed 30% of the Fund’s total assets (taken at market value); (b) through the use of repurchase agreements or the purchase of short-term obligations; or (c) by purchasing a portion of an issue of debt securities of types distributed publicly or privately; |
| (4) | purchase or sell real estate (including limited partnership interests but excluding securities secured by real estate or interests therein), interests in oil, gas or mineral leases, commodities or commodity contracts (except futures and option contracts) in the ordinary course of business (except that the Fund may hold and sell, for the Fund’s portfolio, real estate acquired as a result of the Fund’s ownership of securities); |
| (5) | concentrate its investments in any particular industry (excluding US government securities), but if it is deemed appropriate for the achievement of a Fund’s investment objective(s), up to 25% of its total assets may be invested in any one industry; and |
| (6) | issue any senior security (as that term is defined in the 1940 Act) if such issuance is specifically prohibited by the 1940 Act or the rules and regulations promulgated thereunder, provided that collateral arrangements with respect to options and futures, including deposits of initial deposit and variation margin, are not considered to be the issuance of a senior security for purposes of this restriction. |
| (7) | with respect to 75% of each Fund’s total assets, invest more than 5% of its total assets in the securities of any one issuer (excluding cash and cash equivalents, US government securities and the securities of other investments companies) or own more than 10% of the voting securities of any issuer. |
Additional Restrictions. In order to comply with certain statutes and policies, the Fund will not as a matter of non-fundamental operating policy
| (i) | borrow money (including through reverse repurchase or forward roll transactions), except that the Fund may borrow for temporary or emergency purposes up to 1/3 of its net assets; |
- 2 -
Table of Contents
| (ii) | pledge, mortgage or hypothecate for any purpose in excess of 10% of the Fund’s total assets (taken at market value), provided that collateral arrangements with respect to options and futures, including deposits of initial deposit and variation margin, and reverse repurchase agreements are not considered a pledge of assets for purposes of this restriction; |
| (iii) | purchase any security or evidence of interest therein on margin, except that such short-term credit as may be necessary for the clearance of purchases and sales of securities may be obtained and except that deposits of initial deposit and variation margin may be made in connection with the purchase, ownership, holding or sale of futures; |
| (iv) | sell securities it does not own (short sales) such that the dollar amount of such short sales at any one time exceeds 25% of the net equity of the Fund, and the value of securities of any one issuer in which the Fund is short exceeds the lesser of 2.0% of the value of the Fund’s net assets or 2.0% of the securities of any class of any US issuer and, provided that short sales may be made only in those securities which are fully listed on a national securities exchange or a foreign exchange (This provision does not include the sale of securities that the Fund contemporaneously owns or where the Fund has the right to obtain securities equivalent in kind and amount to those sold, i.e., short sales against the box.) (The Funds currently do not engage in short selling); |
| (v) | invest for the purpose of exercising control or management of another company; |
| (vi) | purchase securities issued by any investment company except by purchase in the open market where no commission or profit to a sponsor or dealer results from such purchase other than the customary broker’s commission, or except when such purchase, though not made in the open market, is part of a plan of merger or consolidation; provided, however, that securities of any investment company will not be purchased for the Fund if such purchase at the time thereof would cause: (a) more than 10% of the Fund’s total assets (taken at the greater of cost or market value) to be invested in the securities of such issuers; (b) more than 5% of the Fund’s total assets (taken at the greater of cost or market value) to be invested in any one investment company; or (c) more than 3% of the outstanding voting securities of any such issuer to be held for the Fund, unless permitted to exceed these limitations an exemptive order of the SEC; provided further, that except in t case of a merger or consolidation, the Fund shall not purchase securities of any open-end investment company unless (1) the Advisor waives the investment advisory fee with respect to assets invested in other open-end investment companies and (2) the Fund incurs no sales charge in connection with the investment; |
| (vii) | invest more than 15% of the Fund’s net assets (taken at the greater of cost or market value) in securities that are illiquid or not readily marketable (excluding Rule 144A securities deemed by the Board to be liquid). |
| (viii) | write puts and calls on securities unless each of the following conditions are met: (a) the security underlying the put or call is within the investment policies of the Fund and the option is issued by the OCC, except for put and call options issued by non-US entities or listed on non-US securities or commodities exchanges; (b) the aggregate value of the |
- 3 -
Table of Contents
obligations underlying the puts determined as of the date the options are sold shall not exceed 5% of the Fund’s net assets; (c) the securities subject to the exercise of the call written by the Fund must be owned by the Fund at the time the call is sold and must continue to be owned by the Fund until the call has been exercised, has lapsed, or the Fund has purchased a closing call, and such purchase has been confirmed, thereby extinguishing the Fund’s obligation to deliver securities pursuant to the call it has sold; and (d) at the time a put is written, the Fund establishes a segregated account with its custodian consisting of cash or liquid securities equal in value to the amount the Fund will be obligated to pay upon exercise of the put (this account must be maintained until the put is exercised, has expired, or the Fund has purchased a closing put, which is a put of the same series as the one previously written); |
| (ix) | buy and sell puts and calls on securities, stock index futures or options on stock index futures, or financial futures or options on financial futures unless such options are written by other persons and: (a) the options or futures are offered through the facilities of a national securities association or are listed on a national securities or commodities exchange, except for put and call options issued by non-US entities or listed on non-US securities or commodities exchanges; (b) the aggregate premiums paid on all such options which are held at any time do not exceed 20% of the Fund’s total net assets; and (c) the aggregate margin deposits required on all such futures or options thereon held at any time do not exceed 5% of the Fund’s total assets. |
There will be no violation of any investment restriction (except with respect to fundamental investment restriction (1) above) if that restriction is complied with at the time the relevant action is taken, notwithstanding a later change in the market value of an investment, in net or total assets or in the change of securities rating of the investment, or any other later change.
The following is a chart of the various types of securities and investment strategies each Fund may employ. Unless otherwise indicated, each Fund is permitted, but not obligated, to pursue any of the following strategies and does not represent that these techniques are available now or will be available at any time in the future. If a Fund’s investment in a particular type of security is limited to a certain percentage of a Fund’s assets, that percentage limitation is listed in the chart. Following the chart, there is a description of how each type of security and investment strategies may be used by each Fund.
INVESTMENT PRACTICE | Mid Cap Fund | Small Cap | ||
KEY TO TABLE: | ||||
I Permitted without stated limit | ||||
II Permitted without stated limit, but not expected to be used to a significant extent | ||||
X Not permitted | ||||
20% Italic type (e.g. 20%) represents an investment limitation as a percentage of net fund assets; does not indicate actual use
20% Roman type (e.g. 20%) represents an investment limitation as a percentage of total fund assets; does not indicate actual use
- 4 -
Table of Contents
INVESTMENT PRACTICE | Mid Cap Fund | Small Cap | ||
EQUITY SECURITIES | ||||
Common Stock | I | I | ||
Warrants | I | I | ||
Preferred Stock | I | I | ||
Convertible Securities | I | I | ||
Medium Capitalization Stocks | I | II | ||
Small Capitalization Stocks | II | I | ||
Micro Capitalization Stocks | II | II | ||
FIXED INCOME SECURITIES & MONEY MARKET INSTRUMENTS | ||||
Short-Term Instruments | 35% (total)- | 35% (total)- | ||
Obligations of Banks and Other Financial Institutions | 35% (total) | 35% (total) | ||
Certificates of Deposit and Banker’s Acceptances | 35% (total) | 35% (total) | ||
Commercial Paper | 35% (total) | 35% (total) | ||
Variable Rate Master Demand Notes | 35%, (total) | 35% (total) | ||
U.S. Government Securities | I | I | ||
Custodial Receipts | X | X | ||
Zero Coupon Securities and Deferred Interest Bonds | II | II | ||
Variable Rate Securities | X | X | ||
Inverse Floating Rate Securities | X | X | ||
Lower-Rated Debt Securities | X | X | ||
Registered Loans | X | X | ||
Put Bonds | X | X | ||
Other Debt Obligations | X | X | ||
DERIVATIVE SECURITIES (OPTIONS) | ||||
Options on Securities | I | I | ||
Options on Securities Indices | I | I | ||
Options on Non-US Securities Indices | I | I | ||
DERIVATIVE SECURITIES (FUTURES CONTRACTS AND OPTIONS ON FUTURES CONTRACTS) | ||||
Futures Contracts | I | I | ||
Futures Contracts on Securities Indices | I | I | ||
Options on Futures Contracts (including Contracts on Security Indices) | I | I | ||
DERIVATIVE SECURITIES (HEDGING STRATEGIES) | ||||
Hedging Strategies | II | II | ||
MORTGAGE-BACKED AND ASSET-BACKED SECURITIES | ||||
Government Guaranteed Mortgage-Backed Securities | II | II | ||
Ginnie Mae Certificates | I | I | ||
Fannie Mae Certificates | I | I | ||
Freddie Mac Certificates | I | I | ||
Multi-Class Mortgage-Backed Securities (CMOs and REMICs) | X | X | ||
Private Issued Mortgage-Backed Securities | X | X | ||
- 5 -
Table of Contents
INVESTMENT PRACTICE | Mid Cap Fund | Small Cap | ||
Mortgage Pass-Through Securities | X | X | ||
Stripped-Mortgage Backed Securities | X | X | ||
Adjustable Rate Mortgages | X | X | ||
Asset-Backed Securities | I | I | ||
SECURITIES OF NON-U.S. ISSUERS | ||||
Foreign Securities & Depository Receipts (ADRs, EDRs, GDRs and IDRs) | I | I | ||
Foreign Corporate Debt Securities | II | II | ||
Foreign Government Debt Securities | II | II | ||
Investments in Emerging Markets | X | X | ||
CURRENCY MANAGEMENT | ||||
Currency Exchange Transactions | I | I | ||
Currency Hedging Transactions | I | I | ||
Cross Hedging | II | II | ||
Forward Currency Exchange Contracts | I | I | ||
Options on Foreign Currencies | I | I | ||
Rating Services | I | I | ||
OTHER INVESTMENTS AND INVESTMENT PRACTICES | ||||
Illiquid Securities | 15% (net) | 15% (net) | ||
TBA Commitments | X | X | ||
When-Issued and Delayed Delivery Securities | I | I | ||
Repurchase Agreements | I | I | ||
Reverse Repurchase Agreements | 33 1/3% (net) | 33 1/3% (net) | ||
Mortgage Dollar Rolls | 33 1/3% (net) | 33 1/3% (net) | ||
Lending of Portfolio Securities | 30% (total) | 30% (total) | ||
Borrowing | 33 1/3% (net) | 33 1/3%8 (net) | ||
Short Sales | 25% (net) | 25% (net) | ||
Concentration of Investment. | 25% (total) | 25% (total) | ||
Other Investment Companies | 10% (total) | 10% (total) | ||
Temporary Defensive Investments | I | I | ||
General. The Funds may invest in equity securities listed on any domestic or non-US securities exchange or traded in the over-the-counter market as well as certain restricted or unlisted securities. As used herein, “equity securities” include common stock, preferred stock, trust or limited partnership interests, rights and warrants (to subscribe to or purchase such securities) and convertible securities (consisting of debt securities or preferred stock that may be converted into common stock or that carry the right to purchase common stock).
Common Stocks. Common stocks, the most familiar type of equity securities, represent an equity (i.e., ownership) interest in a corporation. They may or may not pay dividends or carry voting rights. Common stock occupies the moat junior position in a company’s capital structure. Although equity securities have a history of long-term growth in value, their prices fluctuate based on changes in a company’s financial condition, as well as changes in overall market and
- 6 -
Table of Contents
economic conditions. This affects the value of the shares of the Funds, and thus the value of your investment. Smaller companies are especially sensitive to these factors.
Warrants. The Funds may invest in warrants. Warrants are securities that give the holder the right but not the obligation to buy a specified number of shares of common stock at a specified price, which is often higher than the market price at the time of issuance, for a specified period (or in perpetuity). Warrants may be issued in units with other securities or separately, and may be freely transferable and traded on exchanges. Investing in warrants can provide a greater potential for profit or loss than an equivalent investment in the underlying security, and, thus is a speculative investment. At the time of issue, the cost of a warrant is substantially less than the cost of the underlying security itself, and price movements in the underlying security are generally magnified in the price movements of the warrant. This leveraging effect enables the investor to gain exposure to the underlying security with a relatively low capital investment. This leveraging increases an investor’s risk, however, in the event of a decline in the value of the underlying security and can result in a complete loss of the amount invested in the warrant.
While the market value of a warrant tends to be more volatile than that of the securities underlying the warrant, changes in the market value of a warrant may not necessarily correlate with that of the underlying security. A warrant ceases to have value if it is not exercised prior to the expiration date, if any, to which the warrant is subject. The purchase of warrants involves a risk that the Funds could lose the purchase value of a warrant if the right to subscribe to additional shares is not exercised prior to the warrant’s expiration. Also, the purchase of warrants involves the risk that the effective price paid for the warrant added to the subscription price of the related security may exceed the value of the subscribed security’s market price such as when there is no movement in the level of the underlying security. The value of a warrant may decline because of a decline in the value of the underlying security, the passage of time, changes in interest rates or in the dividend or other policies of the company whose equity underlies the warrant or a change in the perception as to the future price of the underlying security, or any combination thereof. Also, warrants do not entitle the holder to dividends or voting rights with respect to the underlying securities and do not represent any rights in the assets of the issuing company.
Preferred Stock. The Funds may invest in preferred stock. Preferred stock has a preference (i.e., ranks higher) in liquidation (and generally dividends) over common stock but is subordinated (i.e., ranks lower) in liquidation to fixed income securities. Dividends on preferred stock may be cumulative, and in such cases, all cumulative dividends usually must be paid prior to dividend payments to common stockholders. Because of this preference, preferred stocks generally entail less risk than common stocks. As a general rule the market value of preferred stocks with fixed dividend rates and no conversion rights moves inversely with interest rates and perceived credit risk, with the price determined by the dividend rate. Some preferred stocks are convertible into other securities (e.g., common stock) at a fixed price and ratio or upon the occurrence of certain events. The market price of convertible preferred stocks generally reflects an element of conversion value. Because many preferred stocks lack a fixed maturity date, these securities generally fluctuate substantially in value when interest rates change; such fluctuations often exceed those of long-term bonds of the same issuer. Some preferred stocks pay an adjustable dividend that may be based on an index, formula, auction procedure or other dividend rate reset
- 7 -
Table of Contents
mechanism. In the absence of credit deterioration, adjustable rate preferred stocks tend to have more stable market values than fixed rate preferred stocks.
All preferred stocks are also subject to the same types of credit risks as corporate bonds. In addition, because preferred stock is subordinate to debt securities and other obligations of an issuer, deterioration in the credit rating of the issuer will cause greater changes in the value of a preferred stock than in a more senior debt security with similar yield characteristics. Preferred stocks may be rated by the Standard & Poor’s Division of The McGraw-Hill Companies, Inc. (“S&P”) and Moody’s Investors Service, Inc. (“Moody’s”) although there is no minimum rating which a preferred stock must have to be an eligible investment for the Fund. Generally, however, the preferred stocks in which the Fund invests will be rated at least CCC by S&P or Caa by Moody’s or, if unrated, of comparable quality in the opinion of the Advisor. Preferred stocks rated CCC by S&P are regarded as predominantly speculative with respect to the issuer’s capacity to pay preferred stock obligations and represent the highest degree of speculation among securities rated between BB and CCC; preferred stocks rated Caa by Moody’s are likely to be in arrears on dividend payments. Moody’s rating with respect to preferred stocks does not purport to indicate the future status of payments of dividends.
Convertible Securities. A convertible security is a bond or preferred stock which may be converted at a stated price within a specific period of time into a specified number of shares of common stock of the same or different issuer. Convertible securities are senior to common stock in a corporation’s capital structure, but are generally subordinate to non-convertible debt securities. While providing a fixed income stream, generally higher in yield than in the income derived from a common stock but lower than that afforded by a non-convertible debt security, a convertible security also affords an investor the opportunity, through its conversion feature, to participate in the capital appreciation of common stock into which it is convertible.
The terms of any convertible security determine its ranking in a company’s capital structure. In the case of subordinated convertible debentures, the holders’ claims on assets and earnings are subordinated to the claims of other creditors, and are senior to the claims of preferred and common shareholders. In the case of convertible preferred stock, the holders’ claims on assets and earnings are subordinated to the claims of all creditors and are senior to the claims of common shareholders. In general, the market value of a convertible security is the greater of its investment value (its value as a fixed income security) or its conversion value (the value of the underlying shares of common stock if the security is converted). As a fixed income security, the market value of a convertible security generally increases when interest rates decline and generally decreases when interest rates rise; however, the price of a convertible security generally increases as the market value of the underlying stock increases, and generally decreases as the market value of the underlying stock declines. Investments in convertible securities generally entail less risk than investments in the common stock of the same issuer.
Medium-Capitalization and Small-Capitalization Stocks. Lesser known companies with medium- and small-market capitalizations frequently offer greater growth potential than larger, more mature, better-known companies. Investments in such companies involve considerations that are not applicable to investing in securities of established, larger capitalization issuers including reduced and less reliable information about the issuer, less stringent financial
- 8 -
Table of Contents
disclosure requirements and higher brokerage commissions and fees and greater market risk in general.
In addition, investing in the securities of these companies also involves the possibility of greater portfolio price volatility. Among the reasons for the greater price volatility of such companies are the less certain growth prospects of medium and smaller firms, the greater illiquidity in the markets for the stocks of such companies and the greater sensitivity of such companies to changing economic conditions in their respective geographic region.
For example, securities of these companies involve higher investment risk than that normally associated with larger firms due to the greater business risks of small size and limited product lines, markets, distribution channels and financial and managerial resources.
In addition, many medium- and small-market capitalization companies are not well-known to the investing public, do not have significant institutional ownership and are followed by relatively few securities analysts. Also, the securities of smaller capitalization companies traded on the over-the-counter market may have fewer market makers, wider spreads between their quoted bid and ask prices and lower trading volumes, resulting in comparatively greater price volatility and less liquidity than exists for securities of larger capitalization companies.
Investing in Foreign Securities. Each Fund will, under normal market conditions, invest a significant portion of its assets in foreign securities. Investors should realize that investing in securities of foreign issuers involves considerations not typically associated with investing in securities of companies organized and operated in the United States. Investors should realize that the value of the Funds’ foreign investments may be adversely affected by changes in political or social conditions, diplomatic relations, confiscatory taxation, expropriation, nationalization, limitation on the removal of funds or assets, or imposition or (or change in) exchange control or tax regulations in foreign countries. In addition, changes in government administrations or economic or monetary policies in the United States or abroad could result in appreciation or depreciation of portfolio securities and could favorably or unfavorably affect the Funds’ operations, Furthermore, the economies of individual foreign nations may differ from the US economy, whether favorably or unfavorably, in areas such as growth or gross national product, rate of inflation, capital reinvestment, resource self-sufficiency or balance of payments position; it may also be more difficult to obtain and enforce a judgment against a foreign issuer. In general, less information is publicly available with respect to foreign issuers than is available with respect to US companies. Most foreign companies are also not subject to the uniform accounting and financial reporting requirements applicable to issuers in the Untied States. Any foreign investments made by the Funds must be made in compliance with US and foreign currency restrictions and tax laws restricting the amounts and types of foreign investments.
The Funds’ foreign investments may be less liquid and their prices may be more volatile than comparable investments in securities of US companies. The settlement periods for foreign securities, which are often longer than those for securities of US issuers, may affect portfolio liquidity. Furthermore, there may be less government supervision and regulation of securities exchanges, brokers and issuers in foreign countries than in the United States.
- 9 -
Table of Contents
Trading in Foreign Securities. Trading in foreign securities may be completed at times which vary from the closing of the NYSE. In computing the net asset values, the Funds value foreign securities at the latest closing price on the exchange on which they are traded immediately prior to the closing of the NYSE. Similarly, foreign securities quoted in foreign currencies are translated into US dollars at the foreign exchange rates.
Occasionally, events that affect values and exchange rates may occur between the times at which they are determined and the closing of the NYSE. If such events materially affect the value of portfolio securities, these securities may be valued at their fair value as determined in good faith by the Trustees, although the actual calculation may be done by others.
Fixed Income Securities and Money Market Instruments
General. Although not a principal investment, each Fund may invest in a broad range of domestic and foreign fixed income (debt) securities. Fixed income securities, including (but not limited to) bonds, are used by issuers to borrow money from investors. The issuer pays the investor a fixed or variable rate of interest, and must repay the amount borrowed at maturity. Some debt securities, such as zero coupon bonds, do not pay current interest, but are purchased at a discount from their face values.
The value of fixed income securities in the Fund’s securities portfolio generally varies inversely with changes in interest rates. Prices of fixed income securities with longer effective maturities are more sensitive to interest rate changes than those with shorter effective maturities.
To the extent that a Fund does so in periods of declining interest rates, the yield (the income generated over a stated period of time) of a Fund that invests in fixed income securities may tend to be higher than prevailing market rates, and in periods of rising interest rates, the yield of a Fund may tend to be lower. Also, when interest rates are falling, the inflow of net new money to such a Fund from the continuous sale of its shares will likely be invested in portfolio instruments producing lower yields than the balance of a Fund’s investment portfolio, thereby reducing the yield of the Fund. In periods of rising interest rates, the opposite can be true. To the extent a fund invests in fixed income securities, the net asset value can generally be expected to change as general levels of interest rates fluctuate.
Fixed Income Security Risk. Fixed income securities generally expose a Fund to four types of risk: (1) interest rate risk (the potential for fluctuations in bond prices due to changing interest rates); (2) income risk (the potential for a decline in the Fund’s income due to falling market interest rates); (3) credit risk (the possibility that a bond issuer will fail to make timely payments of either interest or principal to the Fund); and (4) prepayment risk or call risk (the likelihood that, during period of falling interest rates, securities with high stated interest rates will be prepaid, or “called” prior to maturity, requiring the Fund to invest the proceeds at generally lower interest rates).
Short-Term Instruments. When a Fund experiences large cash inflows, for example, through the sale of securities and attractive investments are unavailable in sufficient quantities, the Funds may hold short-term investments (or shares of money market mutual funds) for a limited time pending availability of such investments. Each Fund may invest up to 35% of its total assets in
- 10 -
Table of Contents
high quality short-term investments with remaining maturities of 397 days or less, or in money market mutual funds, to meet anticipated redemptions and expenses for day to day operating purposes. In addition, when in the Advisor’s opinion it is advisable to adopt a temporary defensive position because of unusual and adverse market or other conditions, up to 100% of either Fund’s assets may be invested in such short-term instruments.
Short-term instruments consist of foreign and domestic: (1) short-term obligations of sovereign governments, their agencies, instrumentalities, authorities or political subdivisions; (2) other short-term debt securities rated AA or higher by S&P or Aa or higher by Moody’s or, if unrated, are deemed to be of comparable quality in the opinion of the Advisor; (3) commercial paper; (4) bank obligations, including negotiable certificates of deposit, time deposits and banker’s acceptances; and (5) repurchase agreements. At the time a Fund invests in commercial paper, bank obligations or repurchase agreements, the issuer or the issuer’s parent must have outstanding debt rated AA or higher by S&P or Aa or higher by Moody’s; outstanding commercial paper or bank obligations rated A-1 by S&P or Prime-1 by Moody’s; or, if no such ratings are available, the instrument must be deemed to be of comparable quality in the opinion of Bankers Trust. These instruments may be denominated in US dollars or in foreign currencies.
Other US government securities that the Funds may invest in include (but are not limited to) securities issued or guaranteed by the Federal Housing Administration, Farmers Home Loan Administration, Export-Import Bank of the US, Small Business Administration, General Services Administration, Central Bank for Cooperatives, Federal Farm Credit Banks, Federal Intermediate Credit Banks, Federal Land Banks, Maritime Administration, Tennessee Valley Authority, District of Columbia Armory Board and Student Loan Marketing Association. Because the US government is not obligated by law to provide support to an instrumentality it sponsors, a Fund will invest in obligations issued by such an instrumentality only if the Advisor determines that the credit risk with respect to the instrumentality does not make its securities unsuitable for investment by a Fund.
Each Fund may also invest in separately traded principal and interest component of securities guaranteed or issued by the US Government or its agencies, instrumentalities or sponsored enterprises if such components trade independently under the Separate Trading of Registered Interest and Principal of Securities program (“STRIPS”) or any similar program sponsored by the US Government. STRIPS are sold as zero coupon securities. See “Zero Coupon Securities.”
Certificates of Deposit and Bankers’ Acceptances. Certificates of deposit are receipts issued by a depository institution in exchange for the deposit of funds. The issuer agrees to pay the amount deposited plus interest to the bearer of the receipt on the date specified on the certificate. The certificate usually can be traded in the secondary market prior to maturity.
Bankers’ acceptances typically arise from short-term credit arrangements designed to enable businesses to obtain funds to finance commercial transactions. Generally, an acceptance is a time draft drawn on a bank by an exporter or an importer to obtain a stated amount of funds to pay for specific merchandise. The draft is then “accepted” by a bank that, in effect, unconditionally guarantees to pay the face value of the instrument on its maturity date. The acceptance may then be held by the accepting bank as an earning asset or it may be sold in the
- 11 -
Table of Contents
secondary market at the going rate of discount for a specific maturity. Although maturities for acceptances can be as long as 270 days, most acceptances have maturities of six months or less.
Commercial Paper. The Funds may invest in fixed rate or variable rate commercial paper, issued by US or foreign entities. Commercial paper consists of short-term (usually from 1 to 270 days) unsecured promissory notes issued by US or foreign corporations in order to finance their current operations. Any commercial paper issued by a foreign entity corporation and purchased by the Fund must be US dollar-denominated and must not be subject to foreign withholding tax at the time of purchase.
Commercial paper when purchased by the Funds must be rated in the highest short-term rating category by any two NRSROs (or one NRSRO if that NRSRO is the only such NRSRO which rates such security) or, if not so rated, must be believed by the Advisor, acting under the supervision of the Board of Trustees of the Funds, to be of comparable quality. Investing in foreign commercial paper generally involves risks similar to those described above relating to obligations of foreign banks or foreign branches and subsidiaries of US and foreign banks.
The Funds may also invest in variable rate master demand notes. A variable amount master demand note (which is a type of commercial paper) represents a direct borrowing arrangement involving periodically fluctuating rates of interest under a letter agreement between a commercial paper issuer and an institutional lender pursuant to which the lender may determine to invest varying amounts.
For a description of commercial paper ratings, see the Appendix to this SAI.
US Government Securities. The Funds may invest in obligations issued or guaranteed by the US government and include: (1) direct obligations of the US Treasury and (2) obligations issued by US government agencies and instrumentalities. Included among direct obligations of the US are Treasury Bills, Treasury Notes and Treasury Bonds, which differ in terms of their interest rates, maturities and dates of issuance. Treasury Bills have maturities of less than one year, Treasury Notes have maturities of one to 10 years and Treasury Bonds generally have maturities of greater than 10 years at the date of issuance. Included among the obligations issued by agencies and instrumentalities of the US are: instruments that are supported by the full faith and credit of the US (such as certificates issued by the Government National Mortgage Association (“GNMA” or “Ginnie Mae”)); instruments that are supported by the right of the issuer to borrow from the US Treasury (such as securities of Federal Home Loan Banks); and instruments that are supported solely by the credit of the instrumentality (such as Federal National Mortgage Association (“FNMA” or “Fannie Mae”) and Federal Home Loan Mortgage Corporation (“FHLMC” or “Freddie Mac”).
Investments in American, European, Global and International Depository Receipts. The Funds may invest in non-US securities in the form of American Depository Receipts (“ADRs”), European Depository Receipts (“EDRs”), Global Depository Receipts (“GDRs”), or International Depository Receipts (“IDRs”). ADRs are receipts typically issued by a US bank or trust company which evidence ownership of underlying securities issued by a foreign corporation. EDRs and IDRs are receipts issued in Europe typically by non-US banking and trust companies that evidence ownership of either foreign or US securities. GDRs are receipts
- 12 -
Table of Contents
issued by either a US or non-US banking institution evidencing ownership of the underlying non-US securities . Generally, ADRs, in registered form, are designed for use in US securities markets and EDRs, GDRs and IDRs, in bearer form, are designed for use in European and international securities markets. An ADR, EDR, GDR or IDR may be denominated in a currency different from the currency in which the underlying foreign security is denominated.
Zero Coupon Securities and Deferred Interest Bonds. The Funds may invest in zero coupon securities and deferred interest bonds. Zero coupon and deferred interest bonds are debt obligations which are issued at a significant discount from face value. The original discount approximates the total amount of interest the bonds will accrue and compound over the period until maturity or the first interest accrual date at a rate of interest reflecting the market rate of the security at the time of issuance. Zero coupon securities are redeemed at face value at their maturity date without interim cash payments of interest or principal. The amount of this discount is accrued over the life of the security, and the accrual constitutes the income earned on the security for both accounting and tax purposes. Because of these features, the market prices of zero coupon securities are generally more volatile than the market prices of securities that have similar maturity but that pay interest periodically.
While zero coupon bonds do not require the periodic payment of interest, deferred interest bonds generally provide for a period of delay before the regular payment of interest begins. Although this period of delay is different for each deferred interest bond, a typical period is approximately one-third of the bond’s term to maturity. Such investments benefit the issuer by mitigating its initial need for cash to meet debt service, but some also provide a higher rate of return to attract investors who are willing to defer receipt of such cash.
The Funds will accrue income on such investments for tax and accounting purposes, as required, which is distributable to shareholders and which, because no cash is generally received at the time of accrual, may require the liquidation of other portfolio securities to satisfy the Funds’ distribution obligations. See “Taxes.”
Repurchase Agreements. The Funds may engage in repurchase agreement transactions with member banks of the Federal Reserve System and certain non-bank dealers, including governmental securities dealers approved by the Funds’ Board of Trustees. Under the terms of a typical repurchase agreement, the Funds would acquire any underlying security for a relatively short period (usually not more than one week), subject to an obligation of the seller to repurchase, and the Funds to resell, the obligation at an agreed price and time, thereby determining the yield during the Funds’ holding period. This arrangement results in a fixed rate of return that is not subject to market fluctuations during the Funds’ holding period. The value of the underlying securities will be at least equal at all times to the total amount of the repurchase obligations, including interest. Each Fund bears a risk of loss in the event of default by or bankruptcy of the other party to a repurchase agreement. The Funds may be delayed in, or prevented from, exercising its rights to dispose of the collateralized securities. To the extent that, in the meantime, the value of the securities repurchased had decreased or the value of the securities had increased, the Funds could experience a loss. The Advisor reviews the creditworthiness of those banks and dealers with which the Fund enters into repurchase agreements and monitors on an ongoing basis the value of the securities subject to repurchase
- 13 -
Table of Contents
agreements to ensure that it is maintained at the required level. A repurchase agreement is considered to be a loan under the 1940 Act.
Reverse Repurchase Agreements. Each Fund may borrow funds for temporary or emergency purposes, such as meeting larger than anticipated redemption requests, and not for leverage, by among other things, agreeing to sell portfolio securities to financial institutions such as member banks of the Federal Reserve System and certain non-bank dealers and to repurchase them at a mutually agreed date and price (a “reverse repurchase agreement”). At the time a Fund enters into a reverse repurchase agreement it will segregate cash or liquid securities having a value equal to the repurchase price, including accrued interest. The segregated assets will be marked-to-market daily and additional assets will be segregated on any day in which the assets fall below the repurchase price (plus accrued interest). A Fund’s liquidity and ability to manage its assets might be affected when it sets aside cash or portfolio securities to cover such commitments. Reverse repurchase agreements involve the risk that the market value of the securities sold by a Fund may decline below the repurchase price of those securities. In the event the buyer of securities under a reverse repurchase agreement files for bankruptcy or becomes insolvent, such buyer or its trustee or receiver may receive an extension of time to determine whether to enforce a Fund’s obligation to repurchase the securities, and the Fund’s use of the proceeds of the reverse repurchase agreement may effectively be restricted pending such decision. Reverse repurchase agreements are considered to be borrowings by a Fund.
Mortgage Dollar Rolls. The Funds may enter into mortgage “dollar rolls” in which a Fund sell securities for delivery in the current month and simultaneously contracts to repurchase substantially similar, but not identical (same type, coupon and maturity), securities on a specified future date. During the roll period, each Fund forgoes principal and interest paid on the securities. The Funds are compensated by the difference between the current sales price and the lower forward price for the future purchase (often referred to as the “drop”) or fee income and by the interest earned on the cash proceeds of the initial sale. A “covered roll” is a specific type of dollar roll for which there is an offsetting cash position or a cash equivalent security position which matures on or before the forward settlement date of the dollar roll transaction. The Funds may enter into both covered and uncovered rolls. At the time a Fund enter into dollar roll transactions, it will segregate cash or liquid securities having a value not less than the repurchase price (including accrued interest) and will subsequently monitor the segregated assets to ensure that its value is maintained.
Illiquid Securities. Historically, illiquid securities have included securities subject to contractual or legal restrictions on resale because they have not been registered under the Securities Act of 1933, as amended (the “1933 Act”); securities which are otherwise not readily marketable and repurchase agreements having a maturity of longer than seven days. Securities which have not been registered under the 1933 Act are referred to as private placements or restricted securities and are purchased directly from the issuer or in the secondary market. Non-publicly traded securities (including Rule 144A Securities, discussed in greater detail below) may involve a high degree of business and financial risk and may result in substantial losses. These securities may be less liquid than publicly traded securities, and it may take longer to liquidate these positions than would be the case for publicly traded securities. Companies whose securities are not publicly traded may not be subject to the disclosure and other investor protection requirements applicable to companies whose securities are publicly traded. Limitations on resale may have an
- 14 -
Table of Contents
adverse effect on the marketability of portfolio securities and a mutual fund might be unable to dispose of restricted or other illiquid securities promptly or at reasonable prices and might thereby experience difficulty satisfying redemptions within seven days. An investment in illiquid securities is subject to the risk that should a Fund desire to sell any of these securities when a ready buyer is not available at a price that is deemed to be representative of their value, the value of the Fund’s net assets could be adversely affected.
Mutual funds do not typically hold a significant amount of these restricted or other illiquid securities because of the potential for delays on resale and uncertainty in valuation. A mutual fund might also have to register such restricted securities in order to dispose of them resulting in additional expense and delay. Adverse market conditions could impede such a public offering of securities.
A large institutional market has developed for certain securities that are not registered under the 1933 Act, including repurchase agreements, commercial paper, non-US securities, municipal securities and corporate bonds and notes. Institutional investors depend on an efficient institutional market in which the unregistered security can be readily resold or on an issuer’s ability to honor a demand for repayment. The fact that there are contractual or legal restrictions on resale of such investments to the general public or to certain institutions may not be indicative of their liquidity.
The Securities and Exchange Commission (the “SEC”) has adopted Rule 144A, which allows a broader institutional trading market for securities otherwise subject to restriction on their resale to the general public. Rule 144A establishes a “safe harbor” from the registration requirements of the 1933 Act for resales of certain securities to qualified institutional buyers (“Rule 144A Securities”). The Advisor anticipates that the market for certain restricted securities such as institutional commercial paper will expand further as a result of this regulation and the development of automated systems for the trading, clearance and settlement of unregistered securities of domestic and non-US issuers, such as the PORTAL System sponsored by the NASD Inc.
An investment in Rule 144A Securities will be considered illiquid and therefore subject to a Fund’s limit on the purchase of illiquid securities unless the Board determines or its delegates determine that the Rule 144A Securities are liquid in reaching liquidity decisions, the Board and its delegates may consider, inter alia, the following factors: (i) the unregistered nature of the security; (ii) the frequency of trades and quotes for the security; (iii) the number of dealers wishing to purchase or sell the security and the number of other potential purchasers; (iv) dealer undertakings to make a market in the security and (v) the nature of the security and the nature of the marketplace trades (e.g., the time needed to dispose of the security, the method of soliciting offers and the mechanics of the transfer).
Investing in Rule 144A Securities could have the effect of increasing the level of illiquidity in the Funds to the extent that qualified institutional buyers are unavailable or uninterested in purchasing such securities from the Funds. The Board has adopted guidelines and delegated to the Advisor the daily function of determining and monitoring the liquidity of Rule 144A Securities, although the Board will retain ultimate responsibility for any liquidity determinations.
- 15 -
Table of Contents
When-Issued and Delayed Delivery Securities. The Funds may purchase securities on a when-issued or delayed delivery basis. Delivery of and payment for these securities can take place a month or more after the date of the purchase commitment. The payment obligation and the interest rate that will be received on when-issued and delayed-delivery securities are fixed at the time the buyer enters into the commitment. Due to fluctuations in the value of securities purchased or sold on a when-issued or delayed-delivery basis, the yields obtained on such securities may be higher or lower than the yields available in the market on the dates when the investments are actually delivered to the buyers. When-issued securities may include securities purchased on a “when,” “as,” and “if issued” basis, under which the issuance of the security depends on the occurrence of a subsequent event, such as approval of a merger, corporate reorganization or debt restructuring. The value of such securities is subject to market fluctuation during this period and no interest or income, as applicable, accrues to the Funds until settlement takes place.
At the time when each Fund makes the commitment to purchase securities on a when-issued or delayed delivery basis, it will record the transaction, reflect the value each day of such securities in determining its net asset value and, if applicable, calculate the maturity for the purposes of average maturity from that date. At the time of settlement a when-issued security may be valued at less than the purchase price. To facilitate such acquisitions, a Fund identifies on its books cash or liquid assets in an amount at least equal to such commitments. It may be expected that a Fund’s net assets will fluctuate to a greater degree when it sets aside portfolio securities to cover such purchase commitments than when it sets aside cash. On delivery dates for such transactions, a Fund will meet its obligations from maturities or sales of the segregated securities and/or from cash flow. If a Fund chooses to dispose of the right to acquire a when-issued security prior to its acquisition, it could, as with the disposition of any other portfolio obligation, incur a gain or loss due to market fluctuation. It is the current policy of the Funds not to enter into when-issued commitments exceeding in the aggregate 15% of the market value of the respective Fund’s total assets, less liabilities other than the obligations created by when-issued commitments. When a Fund engages in when-issued or delayed-delivery transactions, it relies on the other party to consummate the trade. Failure of the seller to do so may result in a Fund’s incurring a loss or missing an opportunity to obtain a price considered to be advantageous.
Lending of Portfolio Securities. Each Fund may lend up to 30% of the total value of its portfolio securities (taken at market value) to approved institutional borrowers who need to borrow securities in order to complete certain transactions, such as covering short sales, avoiding failures to deliver securities or completing arbitrage operations. By lending its investment securities, the fund attempts to increase its net investment income through the receipt of interest on the loan. Any gain or loss in the market price of the securities loaned that might occur during the term of the loan would belong to the fund. The fund may lend its investment securities so long as the terms, structure and the aggregate amount of such loans are not inconsistent with the 1940 Act or the rules and regulations or interpretations of the SEC thereunder, which currently require that (a) the borrower pledge and maintain with the fund collateral consisting of liquid, unencumbered assets having a value at all times not less than 100% of the value of the securities loaned, (b) the borrower add to such collateral whenever the price of the securities loaned rises (i.e., the borrower “marks to the market” on a daily basis), (c) the loan be made subject to termination by the fund at any time, and (d) the fund receives reasonable interest on the loan (which may include the fund investing any cash collateral in interest bearing short-term investments), and
- 16 -
Table of Contents
distributions on the loaned securities and any increase in their market value. There may be risks of delay in recovery of the securities or even loss of rights in the collateral should the borrower of the securities fail financially. However, loans will be made only to borrowers selected y the fund’s delegate after a commercially reasonable review of relevant facts and circumstances, including the creditworthiness of the borrower.
At the present time, the staff of the SEC does not object if an investment company pays reasonable negotiated fees in connection with loaned securities, so long as such fees are set forth in a written contract and approved by the investment company’s Board of Trustees. In addition, voting rights may pass with the loaned securities, but if a material event occurs affecting an investment on loan, the loan must be called and the securities voted. Pursuant to an exemptive order granted by the SEC, cash collateral received by the Funds may be invested in a money market fund managed by the Advisor (or one of its affiliates).
Payments received by a Fund in lieu of any dividends paid on the loaned securities will not be treated as “qualified dividend income” for purposes of determining what portion of the Fund’s dividends received by individuals may be taxed at the rates generally applicable to long-term capital gains. See “Taxes.”
Other Investment Companies. Each Fund may invest in the aggregate no more than 10% of its total assets, calculated at the time of purchase, in the securities of other US-registered investment companies. In addition, a Fund may not invest more than 5t of its total assets in the securities of any one such investment company or acquire more than 3% of the voting securities of any other such investment company. A Fund will indirectly bear its proportionate share of any management or other fees paid by investment companies in which it invests, in addition to its own fees.
Investment of Uninvested Cash Balances. Each Fund may have cash balances that have not been invested in portfolio securities (“Uninvested Cash”). Uninvested Cash may result from a variety of sources, including dividends or interest received from portfolio securities, unsettled securities transactions, reserves held for investment strategy purposes, scheduled maturity of investments, liquidation of investment securities to meet anticipated redemptions or dividend payments, and new cash received from investors. Uninvested Cash may be invested directly in money market instruments or other short-term debt obligations. Pursuant to an exemptive order issued by the SEC, a Fund may use Uninvested Cash to purchase shares of affiliated funds, including money market funds and Scudder Cash Management QP Trust, or entities for which the Advisor may act as investment advisor now or in the future that operate as cash management investment vehicles but are excluded from the definition of investment company pursuant to Section 3(c)(1) or 3(c)(7) of the 1940 Act (collectively, the “Central Funds”) in excess of the limitations of Section 12(d)(1) of the 1940 Act. Investment by a Fund in shares of the Central Funds will comply with Rule 2a-7 under the 1940 Act and will be in accordance with a Fund’s investment policies and restrictions.
A Fund will invest Uninvested Cash in Central Funds only to the extent that the Fund’s aggregate investment in the Central Funds does not exceed 25% of its total assets. Purchase and sales of shares of Central Funds are made at net asset value.
General. Each Fund may invest in various instruments that are commonly known as “derivatives.” Generally, a derivative is a financial arrangement, the value of which is based on, or “derived” from, a traditional security, asset or market index. Some “derivatives” such as mortgage-related and other asset-backed securities are in many respects like any other investment, although they may be more volatile and/or less liquid than more traditional debt securities. There are, in fact, many different types of derivatives and many different ways to use them. There is a range of risks associated with those uses. For example, a Fund may use futures and options as a low-cost method of gaining exposure to a particular securities market without investing directly in those securities and for traditional hedging purposes to attempt to protect the Fund from exposure to changing interest rates, securities prices or currency exchange rates and for cash management or other investment purposes. The use of derivatives may result in leverage, which tends to magnify the effects of an instrument’s price changes as market conditions change. Leverage involves the use of a small amount of money to control a large amount of financial assets, and can in some circumstances, lead to significant losses. Each Fund will limit the leverage created by its use of derivative for investment purposes by “covering” such positions as required by the Commission. The Advisor may use derivatives in circumstances where the Advisor believes they offer an economical means of gaining exposure to a particular asset class. Derivatives will not be used to increase portfolio risk above the level
- 17 -
Table of Contents
that could be achieved using only traditional investment securities or to acquire exposure to changes in the value of assets or indexes that by themselves would not be purchased for a Fund. The use of derivatives for non-hedging purposes may be considered speculative.
Each Fund’s investment in options, futures or forward contracts, and similar strategies depend on the Advisor’s judgment as to the potential risks and rewards of different types of strategies. Options and futures can be volatile investments, and may not perform as expected. If the Advisor applies a hedge at an inappropriate time or judges price trends incorrectly, options and futures strategies may lower a Fund’s return. A Fund could also experience losses if the prices of its options and futures positions were poorly correlated with its other investments, or if it could not close out its positions because of an illiquid secondary market. Options and futures traded on foreign exchanges generally are not regulated by US authorities, and may offer less liquidity and less protection to a Fund in the event of default by the other party to the contract.
Options on Securities. Each Fund may purchase and write (sell) put and call options on stocks. A call option gives the purchaser of the option the right to buy, and obligates the writer to sell, the underlying stock at the exercise price at any time during the option period. Similarly, a put option gives the purchaser of the option the right to sell, and obligates the writer to buy, the underlying stock at the exercise price at any time during the option period.
Both Funds may write (sell) covered call and put options to a limited extent on its portfolio securities (“covered options”) in an attempt to increase income through the premiums it receives for writing the option(s). However, in return for the premium, a Fund may forgo the benefits of appreciation on securities sold or may pay more than the market price on securities acquired pursuant to call and put options written by a Fund.
A call option written by a Fund is “covered” if the Fund owns the underlying security covered by the call or has an absolute and immediate right to acquire that security without additional cash consideration (or for additional cash consideration held in a segregated account by its custodian) upon conversion or exchange of other securities held in its portfolio. A call option is also covered if the Fund holds a call option on the same security and in the same principal amount as the written call option where the exercise price of the call option so held (a) is equal to or less than the exercise price of the written call option or (b) is greater than the exercise price of the written call option if the difference is segregated by the Fund in cash or liquid securities.
When a Fund writes a covered call option, it gives the purchaser of the option the right to buy the underlying security at the price specified in the option (the “exercise price”) by exercising the option at any time during the option period. If the option expires unexercised, a Fund will realize income in an amount equal to the premium received for writing the option. If the option is exercised, a decision over which a Fund has no control, a Fund must sell the underlying security to the option holder at the exercise price. By writing a covered call option, a Fund forgoes, in exchange for the premium less the commission (“net premium”), the opportunity to profit during the option period from an increase in the market value of the underlying security above the exercise price. In addition, a Fund may continue to hold a stock which might otherwise have been sold to protect against depreciation in the market price of the stock.
- 18 -
Table of Contents
A put option written by a Fund is “covered” when, among other things, cash or liquid securities acceptable to the broker are placed in a segregated account to fulfill the obligations undertaken. when a Fund writes a covered put option, it gives the purchaser of the option the right to sell the underlying security to the Fund at the specified exercise price at any time during the option period. If the option expires unexercised, a Fund will realize income in the amount of the net premium received for writing the option. If the put option is exercised, a decision over which a Fund has no control, the Fund must purchase the underlying security from the option holder at the exercise price. By writing a covered put option, a Fund, in exchange for the net premium received, accepts the risk of a decline in the market value of the underlying security below the exercise price. A Fund will only write put options involving securities for which a determination is made at the time the option is written that the Fund wishes to acquire the securities at the exercise price.
A Fund may terminate its obligation as the writer of a call or put option by purchasing an option with the same exercise price and expiration date as the option previously written. This transaction is called a “closing purchase transaction.” Each Fund will realize a profit or loss on a closing purchase transaction if the amount paid to purchase an option is less or more, as the case may be, than the amount received from the sale thereof. To close out a position as a purchaser of an option, a Fund may enter into a “closing sale transaction” which involves liquidating the Fund’s position by selling the option previously purchased. Where a Fund cannot effect a closing purchase transaction, it may be forced to incur brokerage commissions or dealer spreads in selling securities it receives or it may be forced to hold underlying securities until an option is exercised or expires.
When a Fund writes an option, an amount equal to the net premium received by the Fund is included in the liability section of the Fund’s Statement of Assets and Liabilities as a deferred credit. The amount of the deferred credit will be subsequently marked to market to reflect the current market value of the option written. The current market value of a traded option is the last sale price or, in the absence of a sale, the mean between the closing bid and asked price. If an option expires on its stipulated expiration date or if a Fund enters into a closing purchase transaction, a Fund will realize a gain (or loss if the cost of a closing purchase transaction exceeds the premium received when the option was sold), and the deferred credit related to such option will be eliminated. If a call option is exercised, a Fund will realize a gain or loss from the sale of the underlying security and the proceeds of the sale will be increased by the premium originally received. The writing of covered call options may be deemed to involve the pledge of the securities against which the option is being written. Securities against which call options are written will be identified on a Fund’s books.
Both Funds may also purchase call and put options on any securities in which it may invest. A Fund would normally purchase a call option in anticipation of an increase in the market value of such securities. The purchase of a call option would entitle the Fund, in exchange for the premium paid, to purchase a security at a specified price during the option period. The Fund would ordinarily have a gain if the value of the securities increased above the exercise price sufficiently to cover the premium and would have a loss if the value of the securities remained at or below the exercise price during the option period.
- 19 -
Table of Contents
Both Funds would normally purchase put options in anticipation of a decline in the market value of securities in its portfolio (“protective puts”) or securities of the type in which it is permitted to invest. The purchase of a put option would entitle each Fund, in exchange for the premium paid, to sell a security, which may or may not be held by the Fund at a specified price during the option period. The purchase of protective puts is designed merely to offset or hedge against a decline in the market value of the Fund. Put options also may be purchased by a Fund for the purpose of affirmatively benefiting from a decline in the price of securities that the Fund do not own. A Fund would ordinarily recognize a gain if the value of the securities decreased below the exercise price sufficiently to cover the premium and would recognize a loss if the value of the securities remained at or above the exercise price. Gains and losses on the purchase of protective put options would tend to be offset by countervailing changes in the value of underlying portfolio securities.
The hours of trading for options on securities may not conform to the hours during which the underlying securities are traded. To the extent that the option markets close before the markets for the underlying securities, significant price and rate movements can take place in the underlying securities markets that cannot be reflected in the option markets. It is impossible to predict the volume of trading that may exist in such options, and there can be no assurance that viable exchange markets will develop or continue.
Each Fund may also engage in options transactions in the over-the-counter (“OTC”) market with broker-dealers who make markets in these options. At present, approximately ten broker-dealers, including several of the largest primary dealers in US government securities, make these markets. The ability to terminate OTC option positions is more limited than with exchange-traded option positions because the predominant market is the issuing broker rather than an exchange, and may involve the risk that broker-dealers participating in such transactions will not fulfill their obligations. To reduce this risk, a Fund will purchase such options only from broker-dealers who are primary US government securities dealers recognized by the Federal Reserve Bank of New York and who agree to (and are expected to be capable of) entering into closing transactions, although there can be no guarantee that any such option will be liquidated at a favorable price prior to expiration. The Advisor will monitor the creditworthiness of dealers with whom the Fund enters into such options transactions under the general supervision of the Fund’s Board of Trustees. Unless the Trustees conclude otherwise, a Fund intends to treat OTC options purchased and the assets used to “cover” OTC options written as not readily marketable and therefore subject to the Fund’s limit on investments in illiquid securities.
Options on Securities Indices. Each Fund may also purchase and write exchange-listed and OTC put and call options on securities indices. A securities index measures the movement of a certain group of securities by assigning relative values to the securities included in the index, fluctuating with changes in the market values of the securities included in the index. Some securities index options are based on a broad market index, such as the NYSE Composite Index, or a narrower market index such as the S&P 100. Indices may also be based on a particular industry or market segment.
Options on securities indices are similar to options on securities except that (1) the expiration cycles of securities index options are monthly, while those of securities options are currently quarterly, and (2) the delivery requirements are different. Instead of giving the right to take or
- 20 -
Table of Contents
make delivery of stock at a specified price, an option on a securities index gives the holder the right to receive a cash “exercise settlement amount” equal to (a) the amount, if any, by which the fixed exercise price of the option exceeds (in the case of a put) or is less than (in the case of a call) the closing value of the underlying index on the date of exercise, multiplied by (b) a fixed “index multiplier.” Receipt of this cash amount will depend upon the closing level of the securities index upon which the option is based being greater than, in the case of a call, or less than, in the case of a put, the exercise price of the index and the exercise price of the option times a specified multiple. The writer of the option is obligated, in return for the premium received, to make delivery of this amount. Securities index options may be offset by entering into closing transactions as described above for securities options.
As discussed in “Options on Securities,” each Fund would normally purchase a call option in anticipation of an increase in the market value of the relevant index. The purchase of a call option would entitle the Fund, in exchange for the premium paid, to purchase the underlying securities at a specified price during the option period. The Fund would ordinarily have a gain if the value of the underlying securities increased above the exercise price sufficiently to cover the premium and would have a loss if the value of the securities remained at or below the exercise price during the option period.
As discussed in “Options on Securities,” each Fund would normally purchase put options in anticipation of a decline in the market value of the relevant index (“protective puts”). The purchase of a put option would entitle the Fund, in exchange for the premium paid, to sell the underlying securities at a specified price during the option period. The purchase of protective puts is designed merely to offset or hedge against a decline in the market value of the index. The Fund would ordinarily recognize a gain if the value of the index decreased below the exercise price sufficiently to cover the premium and would recognize a loss if the value of the index remained at or above the exercise price. Gains and losses on the purchase of protective put options would tend to be offset by countervailing changes in the value of the index.
Because the value of an index option depends upon movements in the level of the index rather than the price of a particular stock, whether a Fund will realize a gain or loss from the purchase or writing of options on an index depends upon movements in the level of stock prices in the stock market generally or, in the case of certain indices, in an industry or market segment, rather than movements in the price of a particular stock. Accordingly, successful use by a Fund of options on stock indices will be subject to the Advisor’s ability to predict correctly movements in the direction of the stock market generally or of a particular industry. This requires different skills and techniques than predicting changes in the price of individual stocks.
Options on securities indices entail risks in addition to the risks of options on securities. The absence of a liquid secondary market to close out options positions on securities indices is more likely to occur, although a Fund generally will only purchase or write such an option if the Advisor believes the option can be closed out. Use of options on securities indices also entails the risk that trading in such options may be interrupted if trading in certain securities included in the index is interrupted. A Fund will not purchase such options unless the Advisor believes the market is sufficiently developed such that the risk of trading in such options is no greater than the risk of trading in options on securities.
- 21 -
Table of Contents
Price movements in a Fund’s investment portfolio may not correlate precisely with movements in the level of an index and, therefore, the use of options on indices cannot serve as a complete hedge. Because options on securities indices require settlement in cash, the Advisor may be forced to liquidate portfolio securities to meet settlement obligations. The Fund’s activities in index options may also be restricted by the requirements of the Internal Revenue Code of 1986, as amended (the “Code”) for qualification as a regulated investment company.
In addition, the hours of trading for options on the securities indices may not conform to the hours during which the underlying securities are traded. To the extent that the option markets close before the markets for the underlying securities, significant price and rate movements can take place in the underlying securities markets that cannot be reflected in the option markets. It is impossible to predict the volume of trading that may exist in such options, and there can be no assurance that viable exchange markets will develop or continue.
Futures Contracts and Options on Futures Contracts
General. Each Fund may enter into futures contracts on securities, securities indices, foreign currencies and interest rates, and purchase and write (sell) options thereon which are traded on exchanges designated by the Commodity Futures Trading Commission (the “CFTC”) or, if consistent with CFTC regulations, on foreign exchanges. These futures contracts are standardized contracts for the future delivery of, among other things, a commodity, a non-US currency, an interest rate sensitive security or, in the case of index futures contracts or certain other futures contracts, a cash settlement with reference to a specified multiplier times the change in the index. An option on a futures contract gives the purchaser the right, in return for the premium paid, to assume a position in a futures contract.
Each Fund may enter into futures contracts and options on futures contracts on securities, securities indices and currencies both to manage its exposure to changing interest rates, security prices and currency exchange rates and as an efficient means of managing allocations between asset classes.
The successful use of futures contracts and options thereon draws upon the Advisor’s skill and experience with respect to such instruments and are subject to special risk considerations. A liquid secondary market for any futures or options contract may not be available when a futures or options position is sought to be closed. In addition, there may be an imperfect correlation between movements in the securities or currency in the Fund. Successful use of futures or options contracts is further dependent on the Advisor’s ability to predict correctly movements in the securities or foreign currency markets and no assurance can be given that its judgment will be correct.
Futures Contracts. Futures contracts are contracts to purchase or sell a fixed amount of an underlying instrument, commodity or index at a fixed time and place in the future. US futures contracts have been designed by exchanges which have been designated “contracts markets” by the CFTC, and must be executed through a futures commission merchant, or brokerage firm, which is a member of the relevant contract market. Futures contracts trade on a number of exchange markets, and, through their clearing corporations, the exchanges guarantee performance of the contracts as between the clearing members of the exchange. Each Fund may
- 22 -
Table of Contents
enter into contracts for the purchase or sale for future delivery of fixed-income securities, foreign currencies, or financial indices including any index of US government securities, foreign government securities or corporate debt securities. Each Fund may enter into futures contracts which are based on debt securities that are backed by the full faith and credit of the US government, such as long-term US Treasury Bonds, Treasury Notes and US Treasury Bills. The Fund may also enter into futures contracts which are based on bonds issued by governments other than the US government. Futures contracts on foreign currencies may be used to hedge against securities that are denominated in foreign currencies.
At the same time a futures contract is entered into, a Fund must allocate cash or liquid securities as a deposit payment (“initial margin”). Daily thereafter, the futures contract is valued and the payment of “variation margin” may be required, since each day the Fund would provide or receive cash that reflects any decline or increase in the contract’s value.
At the time of delivery of securities pursuant to such a contract, adjustments are made to recognize differences in value arising from the delivery of securities with a different interest rate from that specified in the contract. In some, but not many cases, securities called for by a futures contract may not have been issued when the contract was written.
Although futures contracts (other than those that settle in cash, such as index futures) by their terms call for the actual delivery or acquisition of the instrument underlying the contract, in most cases the contractual obligation is fulfilled by offset before the date of the contract without having to make or take delivery of the instrument underlying the contract. The offsetting of a contractual obligation is accomplished by entering into an opposite position in an identical futures contract on the commodities exchange on which the futures contract was entered into (or a linked exchange) calling for delivery in the same month. Such a transaction, which is effected through a member of an exchange, cancels the obligation to make or take delivery of the instrument underlying the contract. Since all transactions in the futures market are made, offset or fulfilled through a clearinghouse associated with the exchange on which the contracts are traded, a Fund will incur brokerage fees when it enters into futures contracts.
The purpose of the acquisition or sale of a futures contract, in cases where a Fund holds or intends to acquire fixed-income securities, is to attempt to protect the Fund from fluctuations in interest or foreign exchange rates without actually buying or selling fixed-income securities or foreign currencies. For example, if interest rates were expected to increase (which thus would cause the prices of debt securities to decline), a Fund might enter into futures contracts for the sale of debt securities. Such a sale would have much the same effect as selling an equivalent value of the debt securities owned by a Fund. If interest rates did increase, the value of the debt security in a Fund would decline, but the value of the futures contracts to a Fund would increase at approximately the same rate, thereby keeping the net asset value of a Fund from declining as much as it otherwise would have. A Fund could accomplish similar results by selling debt securities and investing in bonds with short maturities when interest rates are expected to increase. However, since the futures market is more liquid than the cash market, the use of futures contracts as an investment technique allows a Fund to maintain a defensive position without having to sell its portfolio securities.
- 23 -
Table of Contents
Similarly, when it is expected that interest rates may decline (thus increasing the value of debt securities), futures contracts may be purchased to attempt to hedge against anticipated purchases of debt securities at higher prices. Since the fluctuations in the value of futures contracts should be similar to those of debt securities, a Fund could take advantage of the anticipated rise in the value of debt securities without actually buying them until the market had stabilized. At that time, the futures contracts could be liquidated and a Fund could then buy debt securities on the cash market. The segregated assets maintained to cover a Fund’s obligations with respect to such futures contracts will consist of cash or liquid securities acceptable to the broker from its portfolio in an amount equal to the difference between the fluctuating market value of such futures contracts and the aggregate value of the initial and variation margin payments made by a Fund with respect to such futures contracts.
The ordinary spreads between prices in the cash and futures market, due to differences in the nature of those markets, are subject to distortions. First, all participants in the futures market are subject to initial deposit and variation margin requirements. Rather than meeting additional variation margin requirements, investors may close futures contracts through offsetting transactions which could distort the normal relationship between the cash and futures markets. Second, the liquidity of the futures market depends on most participants entering into offsetting transactions rather than making or taking delivery. To the extent that many participants decide to make or take delivery, liquidity in the futures market could be reduced, thus producing distortion. Third, from the point of view of speculators, the margin deposit requirements in the futures market are less onerous than margin requirements in the securities market. Therefore, increased participation by speculators in the futures market may cause temporary price distortions. Due to the possibility of distortion, a correct forecast of securities price, general interest rate or currency exchange rate trends by the Advisor may still not result in a successful transaction.
In addition, futures contracts entail significant risks. Although the Advisor believes that use of such contracts will benefit a Fund, if the Advisor’s investment judgment about the general direction of interest rates or an index is incorrect, a Fund’s overall performance would be poorer than if it had not entered into any such contract. For example, if a Fund has hedged against the possibility of an increase in interest rates or a decrease in an index which would adversely affect the value of securities held in its portfolio and interest rates decrease or securities prices increase instead, a Fund will lose part or all of the benefit of the increased value of its securities which it has hedged because it will have offsetting losses in its futures positions. In addition, in such situations, if a Fund has insufficient cash, it may have to sell securities from its portfolio to meet daily variation margin requirements. Such sales of securities may be, but will not necessarily be, at increased prices which reflect the rising market. The Fund may have to sell securities at a time when it may be disadvantageous to do so.
Options on Futures Contracts. Each Fund may purchase and write (sell) options on futures contracts for hedging purposes. For example, as with the purchase of futures contracts, when a Fund is not fully invested, it may purchase a call option on an interest rate sensitive futures contract to hedge against a potential price increase on debt securities due to declining interest rates.
- 24 -
Table of Contents
The purchase of a call option on a futures contract is similar in some respects to the purchase of a call option on an index or individual security. Depending on the pricing of the option compared to either the price of the futures contract upon which it is based or the price of the underlying debt securities, it may or may not be less risky than ownership of the futures contract or underlying debt securities.
The writing of a call option on a futures contract may constitute a partial hedge against declining prices of the underlying portfolio securities which are the same as or correlate with the security or foreign currency that is deliverable upon exercise of the futures contract. If the futures price at expiration of the option is below the price specified in the premium received for writing the option (“exercise price”), a Fund will retain the full amount of the net premium (the premium received for writing the option less any commission), which provides a partial hedge against any decline that may have occurred in a Fund’s holdings.
The writing of a put option on an index futures contract may constitute a partial hedge against increasing prices of the underlying securities or foreign currency that are deliverable upon exercise of the futures contract. If the futures price at expiration of the option is higher than the exercise price, a Fund will retain the full amount of the option net premium, which provides a partial hedge against any increase in the price of securities that a Fund intends to purchase.
If a put or call option a Fund has written is exercised, a Fund will incur a loss that will be reduced by the amount of the net premium it receives. Depending on the degree of correlation between changes in the value of its portfolio securities and changes in the value of its futures positions, the Fund’s losses from existing options on futures may to some extent be reduced or increased by changes in the value of portfolio securities.
The purchase of a call or put option on a futures contract with respect to an index is similar in some respects to the purchase of a call or protective put option on an index. For example, the Fund may purchase a put option on an index futures contract to hedge against the risk of lowering securities values.
The amount of risk a Fund assumes when it purchases an option on a futures contract with respect to an index is the premium paid for the option plus related transaction costs. In addition to the correlation risks discussed above, the purchase of such an option also entails the risk that changes in the value of the underlying futures contract will not be fully reflected in the value of the option purchased.
Futures Contracts on Securities Indices. Each Fund may also enter into futures contracts providing for the making and acceptance of a cash settlement based upon changes in the value of an index of US or non-US securities. This investment technique may be used as a low-cost method of gaining exposure to a particular securities market without investing directly in those securities or to hedge against anticipated future change in general market prices which otherwise might either adversely affect the value of securities held by a Fund or adversely affect the prices of securities which are intended to be purchased at a later date for a Fund or as an efficient means of managing allocation between asset classes. A futures contract may also be entered into to close out or offset an existing futures position.
- 25 -
Table of Contents
When used for hedging purposes, each futures contract on a securities index transaction involves the establishment of a position which, the Advisor believes, will move in a direction opposite to that of the investment being hedged. If these hedging transactions are successful, the futures positions taken for a Fund will rise in value by an amount which approximately offsets the decline in value of the portion of a Fund’s investments that are being hedged. Should general market prices move in an unexpected manner, the full anticipated benefits of futures contracts may not be achieved or a loss may be realized.
Currency Exchange Contracts. Because each Fund may buy and sell securities denominated in currencies other than the US dollar and receives interest, dividends and sale proceeds in currencies other than the US dollar, a Fund from time to time may enter into currency exchange transactions to convert to and from different foreign currencies and to convert foreign currencies to and from the US dollar. A Fund either enters into these transactions on a spot (i.e., cash) basis at the spot rate prevailing in the foreign currency exchange market or uses forward contracts to purchase or sell foreign currencies.
Forward Currency Exchange Contracts. A forward currency exchange contract is an obligation by a Fund to purchase or sell a specific currency at a future date, which may be any fixed number of days from the date of the contract. Forward currency exchange contracts establish an exchange rate at a future date. These contracts are transferable in the interbank market conducted directly between currency traders (usually large commercial banks and brokerages) and their customers. A forward currency exchange contract may not have a deposit requirement and may be traded at a net price without commission. A Fund maintains with its custodian a segregated account of cash or liquid securities in an amount at least equal to its obligations under each forward currency exchange contract. Neither spot transactions nor forward currency exchange contracts eliminate fluctuations in the prices of the Fund’s securities or in foreign exchange rates, or prevent loss if the prices of these securities should decline.
Each Fund may enter into foreign currency hedging transactions in an attempt to protect against changes in currency exchange rates between the trade and settlement dates of specific securities transactions or changes in currency exchange rates that would adversely affect a portfolio position or an anticipated investment position. Since consideration of the prospect for currency parities will be incorporated into the Advisor’s long-term investment decisions, a Fund will not routinely enter into currency hedging transactions with respect to security transactions; however, the Advisor believes that it is important to have the flexibility to enter into currency hedging transactions when it determines that the transactions would be in the Fund’s best interest. Although these transactions tend to minimize the risk of loss due to a decline in the value of the hedged currency, at the same time they tend to limit any potential gain that might be realized should the value of the hedged currency increase. The precise matching of the forward contract amounts and the value of the securities involved will not generally be possible because the future value of such securities in foreign currencies will change as a consequence of market movements in the value of such securities between the date the forward contract is entered into and the date it matures. The projection of currency market movements is extremely difficult, and the successful execution of a hedging strategy is highly uncertain.
While these contracts are not presently regulated by the CFTC, the CFTC may in the future assert authority to regulate forward contracts. In such event the Fund’s ability to utilize forward
- 26 -
Table of Contents
contracts may be restricted. Forward contracts may reduce the potential gain from a positive change in the relationship between the US dollar and foreign currencies. Unanticipated changes in currency prices may result in poorer overall performance for the Fund than if it had not entered into such contracts. The use of currency forward contracts may not eliminate fluctuations in the underlying US dollar equivalent value of the prices of or rates of return on the Fund’s foreign currency denominated portfolio securities and the use of such techniques will subject the Fund to certain risks.
The matching of the increase in value of a forward contract and the decline in the US dollar equivalent value of the foreign currency denominated asset that is the subject of the hedge generally will not be precise. In addition, a Fund may not always be able to enter into currency forward contracts at attractive prices and this will limit the Fund’s ability to use such contract to hedge or cross-hedge its assets. Also, with regard to a Fund’s use of cross-hedges, there can be no assurance that historical correlations between the movement of certain foreign currencies relative to the US dollar will continue. Thus, at any time poor correlation may exist between movements in the exchange rates of the foreign currencies underlying the Fund’s cross-hedges and the movements in the exchange rates of the foreign currencies in which the Fund’s assets that are the subject of such cross-hedges are denominated.
Options on Foreign Currencies. Both Funds may write covered put and call options and purchase put call options on foreign currencies for the purpose of protecting against declines in the dollar value of portfolio securities and against increases in the dollar cost of securities to be acquired. The Funds may use options on currencies to cross-hedge, which involves writing or purchasing options on one currency to hedge against changes in exchange rates for a different, but related currency. As with other types of options, however, the writing of an option on foreign currency will constitute only a partial hedge up to the amount of the premium received, and a Fund could be required to purchase or sell foreign currencies at disadvantageous exchange rates, thereby incurring losses. The purchase of an option on foreign currency may be used to hedge against fluctuations in exchange rates although, in the event of exchange rate movements adverse to a Fund’s position, it may forfeit the entire amount of the premium plus related transaction costs. In addition each Fund may purchase call options on currency when the Advisor anticipates that the currency will appreciate in value.
Both Funds may also write options on foreign currencies for the same types of hedging purposes. For example, where the Fund anticipate a decline in the dollar value of foreign currency denominated securities due to adverse fluctuations in exchange rates it could, instead of purchasing a put option, write a call option on the relevant currency. If the expected decline occurs, the options will most likely not be exercised, and the diminution in value of portfolio securities will be offset by the amount of the premium received.
Similarly, instead of purchasing a call option to hedge against an anticipated increase in the dollar cost of securities to be acquired, a Fund could write a put option on the relevant currency which, if rates move in the manner projected, will expire unexercised and allow the Fund to hedge such increased cost up to the amount of the premium. As in the case of other types of options, however, the writing of a foreign currency option will constitute only a partial hedge up to the amount of the premium, and only if rates move in the expected direction. If this does not occur, the option may be exercised and the Fund would be required to purchase or sell the
- 27 -
Table of Contents
underlying currency at a loss which may not be offset by the amount of the premium. Through the writing of options on foreign currencies, each Fund also may be required to forego all or a portion of the benefits which might otherwise have been obtained from favorable movements in exchange rates.
Both Funds may write covered call options on foreign currencies. A call option written on a foreign currency by the Fund is “covered” if a Fund owns the underlying foreign currency covered by the call or has an absolute and immediate right to acquire that foreign currency without additional cash consideration (or for additional cash consideration identified on the Fund’s books) upon conversion or exchange of other foreign currency held in its portfolio. A call option is also covered if a Fund has a call on the same foreign currency and in the same principal amount as the call written where the exercise price of the call held (a) is equal to or less than the exercise price of the call written or (b) is greater than the exercise price of the call written if the difference is segregated by the Fund in cash or liquid securities.
Both Funds also may write call options on foreign currencies that are not covered for cross-hedging purposes. A call option on a foreign currency is for cross-hedging purposes if it is not covered, but is designed to provide a hedge against a decline in the US dollar value of a security which the Funds owns or has the right to acquire and which is denominated in the currency underlying the option due to an adverse change in the exchange rate. In such circumstances, the Fund collateralizes the option by segregating cash or liquid securities in an amount not less than the value of the underlying foreign currency in US dollars marked to market daily.
There is no assurance that a liquid secondary market will exist for any particular option, or at any particular time. If a Fund is unable to effect a closing purchase transaction with respect to covered options it has written, the Fund will not be able to sell the underlying currency or dispose of assets held in a segregated account until the options expire or are exercised. Similarly, if the Fund is unable to effect a closing sale transaction with respect to options it has purchased, it would have to exercise the options in order to realize any profit and will incur transaction costs upon the purchase or sale of underlying currency. Each Fund pays brokerage commissions or spreads in connection with its options transactions.
As in the case of forward contracts, certain options on foreign currencies are traded over-the-counter and involve liquidity and credit risks which may not be present in the case of exchange-traded currency options. In some circumstances, the Fund’s ability to terminate OTC options may be more limited than with exchange-traded options. It is also possible that broker-dealers participating in OTC options transactions will not fulfill their obligations. The Funds intend to treat OTC options as not readily marketable and therefore subject to the Funds’ limitation with respect to illiquid securities.
Asset Coverage. Both Funds will comply with the segregation or coverage guidelines established by the SEC and other applicable regulatory bodies with respect to certain transactions, including (but not limited to) options written on securities and indexes; currency, interest rate and security index futures contracts and options on these futures contracts; and forward currency contracts. These guidelines may, in certain instances, require segregation by a Fund of cash or liquid securities to the extent the Fund’s obligations with respect to these strategies are not otherwise covered through ownership of the underlying security or financial
- 28 -
Table of Contents
instrument, by other portfolio positions or by other means consistent with applicable regulatory policies. Unless the transaction is covered, the segregated assets must at all times equal or exceed a Fund’s obligations with respect to these strategies. Segregated assets cannot be sold or transferred unless equivalent assets are substituted in their place or it is no longer necessary to segregate them. As a result, there is a possibility that segregation of a large percentage of a Fund’s assets could impede portfolio management or the Fund’s ability to meet redemption requests or other current obligations.
For example, a call option written on securities may require a Fund to hold the securities subject to the call (or securities convertible into the securities without additional consideration) or to segregate assets (as described above) sufficient to purchase and deliver the securities if the call is exercised. A call option written on an index may require a Fund to own portfolio securities that correlate with the index or to segregate assets (as described above) equal to the excess of the index value over the exercise price on a current basis. A put option written by a Fund may require the Fund to segregate assets (as described above) equal to the exercise price. A Fund could purchase a put option if the strike price of that option is the same or higher than the strike price of a put option sold by a Fund. If a Fund holds a futures contract, a Fund could purchase a put option on the same futures contract with a strike price as high or higher than the price of the contract held. A Fund may enter into fully or partially offsetting transactions so that its net position, coupled with any segregated assets (equal to any remaining obligation), equals its net obligation. Asset coverage may be achieved by other means when consistent with applicable regulatory policies.
The Board of Trustees of the Funds has adopted the requirement that futures contracts and options on futures contracts be used as a hedge and that stock index futures may be used on a continual basis to equitize cash so that a Fund may maintain 100% equity exposure. The Funds are operated by persons who have claimed an exclusion from the definition of the term “commodity pool operator” under the Commodity Exchange Act and, therefore, who are not subject to registration or regulation under the Commodity Exchange Act.
The use of options, futures and foreign currency contracts is a highly specialized activity which involves investment techniques and risks that are different from those associated with ordinary portfolio transactions. Gains and losses on investments in options and futures depend on the Advisor’s ability to predict the direction of stock prices, interest rates, currency movements and other economic factors. The loss that may be incurred by a Fund in entering into futures contracts and written options thereon and forward currency contracts is potentially unlimited. There is no assurance that higher than anticipated trading activity or other unforeseen events might not, at times, render certain facilities of an options clearing entity or other entity performing the regulatory and liquidity functions of an options clearing entity inadequate, and thereby result in the institution by an exchange of special procedures which may interfere with the timely execution of customers’ orders. Most futures exchanges limit the amount of fluctuation permitted in a futures contract’s prices during a single trading day. Once the limit has been reached no further trades may be made that day at a price beyond the limit. The price limit will not limit potential losses, and may in fact prevent the prompt liquidation of futures positions, ultimately resulting in further losses. Options and futures traded on foreign exchanges generally are not regulated by US authorities, and may offer less liquidity and less protection to a Fund in the event of default by the other party to the contract.
- 29 -
Table of Contents
Except as set forth above under “Derivative Securities: Futures Contracts and Options on Futures Contracts,” there is no limit on the percentage of the assets of a Fund that may be at risk with respect to futures contracts and related options or forward currency contracts. A Fund may not invest more than 25% of its total assets in purchased protective put options. A Fund’s transactions in options, forward currency contracts, futures contracts and options on futures contracts may be limited by the requirements for qualification of a Fund as a regulated investment company for tax purposes. See “Taxes.” There can be no assurance that the use of these portfolio strategies will be successful.
The Funds’ active management techniques involve (1) liquidity risk (contractual positions cannot be easily closed out in the event of market changes or generally in the absence of a liquid secondary market), (2) correlation risk (changes in the value of hedging positions may not match the securities market and foreign currency fluctuations intended to be hedged), and (3) market risk (an incorrect prediction of securities prices or exchange rates by the Advisor may cause the Funds to perform worse than if such positions had not been taken). In addition, the ability to terminate OTC options is more limited than with exchange traded options and may involve the risk that the counter party to the option will not fulfill its obligations.
Investment Restriction on Futures Transactions. A Fund will not enter into any futures contracts or options on futures contracts if immediately thereafter the amount of margin deposits on all the futures contracts of the Fund and premiums paid on outstanding options on futures contracts owned by the Fund (other than those entered into for bona fide hedging purposes) would exceed 5t of the market value of the net assets of the Fund.
A Fund’s investment objective is not a fundamental policy and may be changed upon notice to, but without the approval of, the Fund’s shareholders. If there is a change in the Fund’s investment objective, the Fund’s shareholders should consider whether the Fund remains an appropriate investment in light of their then-current needs. Shareholders of a Fund will receive 30 days’ prior written notice with respect to any change in the investment objective of the Fund.
Rating Services. The ratings of rating services represent their opinions as to the quality of the securities that they undertake to rate. It should be emphasized, however, that ratings are relative and subjective and are not absolute standards of quality. Although these ratings are an initial criterion for selection of portfolio investments, the Advisor also makes its own evaluation of these securities, subject to review by the Board of Trustees. After purchase by a Fund, an obligation may cease to be rated or its rating may be reduced below the minimum required for purchase by the Fund. Neither event would require a Fund to eliminate the obligation from its portfolio, but the Advisor will consider such an event in its determination of whether a Fund should continue to hold the obligation. A description of the ratings is included in the Appendix herein.
- 30 -
Table of Contents
The portfolio turnover rates for the fiscal years ended 2002 and 2003 were as follows:
| 2003 | 2002 | |||
Mid Cap Fund | 120 | 821 | ||
Small Cap Fund | 87 | 742 |
| 1. | On March 28, 2002, the Capital Appreciation Portfolio was closed. This ratio includes the purchase and sale of portfolio securities of the Mid Cap Fund as a stand-alone fund in addition to the Capital Appreciation Portfolio. |
| 2. | On March 28, 2002, the Small Cap Portfolio was closed. This ratio includes the purchase and sale of portfolio securities of the Small Cap Fund as a stand-alone fund in addition to the Small Cap Portfolio. |
These rates will vary from year to year. High turnover rates increase transaction costs and may increase investable capital gains. The Advisor considers these effects when evaluating the anticipated benefits of short-term investing.
Portfolio Transactions and Brokerage Commissions
The Advisor is responsible for placing the orders for the purchase and sale of portfolio securities, including the allocation of brokerage.
The primary objective of the Advisor in placing orders for the purchase and sale of securities for a Fund is to obtain the most favorable net results, taking into account such factors, among others, as price, commission (where applicable), size or order, difficulty of execution and skill required of the executing broker-dealer. The Advisor seeks to evaluate the overall reasonableness of brokerage commissions paid with commissions charged on comparable transactions, as well as by comparing commissions paid by a Fund to reported commissions paid by others. The Advisor routinely reviews commission rates, execution and settlement services performed and makes internal and external comparisons.
When selecting a broker-dealer to effect portfolio transactions on behalf of the Fund, the Advisor may, provided that it can be done consistently with the policy of obtaining the most favorable net results, consider the activities of the broker-dealer in selling shares of any Scudder-branded (funds marketed with the Scudder name), open-end investment company. The Advisor has informed the Board of each Scudder-branded, open-end investment company of these practices and has undertaken to provide to the Boards regular reports about its selection of broker-dealers to effect Fund transactions. The Advisor believes that these reports are important because it recognizes that it or its affiliates may derive some benefit from these practices. The Advisor and its affiliates expect that the Fund will benefit by the direction of orders of the fund to broker-dealers in consideration of those broker-dealers’ sales of the Scudder-branded, open-end funds in general.
A Fund’s purchases and sales of fixed-income securities are generally placed by the Advisor with primary market makers for these securities on a net basis, without any brokerage commission being paid by a Fund. Trading does, however, involve transaction costs. Transactions with dealers serving as primary market makers reflect the spread between the bid and asked prices. Purchases of underwritten issues may be made, which will include an underwriting fee paid to the underwriter. In effecting transactions in over-the-counter securities, orders are placed with the principal market makers for the security being traded unless, after exercising care, it appears that more favorable results are available elsewhere.
- 31 -
Table of Contents
When it can be done consistently with the policy of obtaining the most favorable net results, the Advisor may place such orders with broker-dealers who supply research services to the Advisor or a Fund. The term “research services,” may include, but is not limited to, advice as to the value of securities; the advisability of investing in, purchasing or selling securities; the availability of securities or purchasers or sellers of securities; and analyses and reports concerning issuers, industries, securities, economic factors and trends, portfolio strategy and the performance of accounts. The Advisor is authorized when placing portfolio transactions, if applicable, for a Fund to pay a brokerage commission in excess of that which another broker-dealer might charge for executing the same transaction on account of execution services and the receipt of research services. The Advisor has negotiated arrangements, which are not applicable to most fixed income transactions, with certain broker-dealers pursuant to which a broker-dealer will provide research services to the Advisor in exchange for the direction by the Advisor of brokerage transactions to the broker-dealer. These arrangements regarding receipt of research services generally apply to equity security transactions. Although certain research services from broker-dealers may be useful to a Fund and to the Advisor, it is the opinion of the Advisor that such information only supplements its own research effort since the information must still be analyzed, weighed and reviewed by the Advisor’s staff. Such information may be useful to the Advisor in providing services to clients other than a Fund and not at all such information is used by the Advisor in connection with a Fund. Conversely, such information provided to the Advisor by broker-dealers through whom other clients of the Advisor effect securities transactions may be useful to the Advisor in providing services to a Fund.
In certain instances there may be securities which are suitable for a Fund as well as for one or more of the Advisor’s other clients. Investment decisions for a Fund and for the Advisor’s other clients are made with a view to achieving their respective investment objectives. It may develop that a particular security is bought or sold for only one client even though it might be held by, or bought or sold for, other clients. Likewise, a particular security may be bought for one or more clients when one or more clients are selling that same security. Some simultaneous transactions are inevitable when several clients receive investment advice from the same investment advisor, particularly when the same security is suitable for the investment objectives of more than one client. When two or more clients are simultaneously engaged in the purchase or sale of the same security, the securities are allocated among clients in a manner believed to be equitable to each. It is recognized that in some cases this system could have a an adverse effect on the price of or size of the position obtainable security for the Fund. However, it is believed that the ability of a Fund to participate in volume transactions will produce better executions for a Fund.
- 32 -
Table of Contents
Pursuant to procedures determined by the Trustees and subject to the general policies of the Fund and Section 17(e) of the 940 Act, the Advisor may place securities transactions with brokers with whom it is affiliated (“Affiliated Brokers”).
For the fiscal years ended September 30, 2003, 2002 and 2001, the Funds paid the following in brokerage commissions:
2003 | 2002 | 2001 | ||||
Mid Cap Fund | $ | $ | $1,629,680 (paid by Capital Appreciation Portfolio) | |||
Small Cap Fund | $ | $ | $749,529 (paid by Small Cap Portfolio |
- 33 -
Table of Contents
Securities of Regular Broker-Dealers. At September 30, 2003, the Funds held securities of their regular broker-dealers as follows:
Name of Regular Broker or Dealer or Parent (Issuer) | Value of Securities Owned as of September 30, 2003 ($) |
Securities of Regular Broker-Dealers. At September 30, 2003, the Funds held securities of their regular broker-dealers as follows:
Name of Regular Broker or Dealer or Parent (Issuer) | Value of Securities Owned as of September 30, 2003 | |
| Mid Cap Fund | ||
| Legg Mason, Inc. | $18,006,680 | |
| LaBranche & Co., Inc. | $6,329,000 | |
| Chicago Mercantile Exchange | $3,997,861 | |
| Small Cap Fund | ||
| Affiliated Managers Group Inc. | $7,102,680 | |
LaBranche & Co., Inc. | $5,001,960 | |
| National Financial Partners Corp. | $3,312,900 | |
- 34 -
Table of Contents
PURCHASE AND REDEMPTION OF SHARES
Scudder Distributors, Inc. (“SDI”) serves as the distributor of the Funds’ shares pursuant to the Distribution Agreement. The terms and conditions of the Distribution Agreement are exactly the same as the Distribution Agreement with ICC Distributors, Inc., the former distributor of the Funds. SDI enters into a Selling Group Agreement with certain broker-dealers (each a “Participating Dealer”). If a Participating Dealer previously had agreements in place with SDI and ICC Distributors, Inc., the SDI Agreement controls. If the Participating Dealer did not have an agreement with SDI, then the terms of the assigned ICC Distributors, Inc. agreement remain in effect. These Selling Group Agreements may be terminated by their terms or by the terms of the Distribution Agreement, as applicable. SDI is a wholly owned subsidiary of Deutsche Bank AG. The address for SDI is 222 South Riverside Plaza, Chicago, IL 60606.
Shares of the funds are distributed by SDI. Mid Cap Fund offers six classes of shares, Investment, Institutional, and Class A, B, C and R Shares. Small Cap Fund offers five classes of shares, Investment, and Class A, B, C and R Shares. General information on how to buy shares of a Fund is set forth in “How to Invest in the Funds” in the Funds’ Prospectuses. The following supplements that information.
Policies and procedures affecting transactions in Fund shares can be changed at any time without notice, subject to applicable law. Transactions may be contingent upon proper completion of application forms and other documents by shareholders and their receipt by a Fund’s agents. Transaction delays in processing (and changing account features) due to circumstances within or beyond the control of a Fund and its agents may occur. Shareholders (or their financial service firms) are responsible for all losses and fees resulting from bad checks, cancelled orders or the failure to consummate transactions effected pursuant to instructions reasonably believed to genuine.
A distribution will be reinvested in shares of the same Fund and class if the distribution check is returned as undeliverable.
Orders will be confirmed at a price based on the net asset value of each Fund next determined after receipt in good order by SDI of the order accompanied by payment. However, orders received by dealers or other financial services firms prior to the determination of net asset value and received in good order by SDI prior to the close of its business day will be confirmed at a price based on the net asset value effective on that day (“trade date”).
Certificates. Share certificates will not be issued. Share certificates now in a shareholder’s possession may be sent to the transfer agent for cancellation and book-entry credit to such shareholder’s account. Certain telephone and other procedures require book-entry holdings. Shareholders with outstanding certificates bear the risk of loss.
Use of Financial Services Firms. Investment dealers and other firms provide varying arrangements for their clients to purchase and redeem each Fund’s shares, including higher minimum investments, and may assess transaction or other fees. Firms may arrange with their clients for other investment or administrative services. Such firms may independently establish
- 35 -
Table of Contents
and charge additional amounts to their clients for such services. Firms also may hold each Fund’s shares in nominee or street name as agent for and on behalf of their customers. In such instances, each Fund’s transfer agent, Scudder Investments Service Company (“SISC”) will have no information with respect to or control over the accounts of specific shareholders. Such shareholders may obtain access to their accounts and information about their accounts only from their firm. Certain of these firms may receive compensation from each Fund through the Shareholder Service Agent for record-keeping and other expenses relating to these nominee accounts. In addition, certain privileges with respect to the purchase and redemption of shares or the reinvestment of dividends may not be available through such firms. Some firms may participate in a program allowing them access to their clients’ accounts for servicing including, without limitation, transfers of registration and dividend payee changes; and may perform functions such as generation of confirmation statements and disbursement of cash dividends Such firms, including affiliates of SDI, may receive compensation from each Fund through the Shareholder Service Agent for these services.
The Funds will be deemed to have received a purchase or redemption order when an authorized broker, service organization or, if applicable, an authorized designee, accepts the order. Shares of the fund may be purchased or redeemed on any business day at the net asset value next determined after receipt of the order, in good order, by the Transfer Agent. Investors who invest through authorized brokers, service organizations or their designated intermediaries should submit purchase and redemption orders directly to their broker, service organization or designated intermediary. The broker or intermediary may charge you a transaction fee.
Telephone and Electronic Transaction Procedures. Shareholders have various telephone, Internet, wire and other electronic privileges available. Each Fund or its agents may be liable for any losses, expenses or costs arising out of fraudulent or unauthorized instructions pursuant to these privileges unless each Fund or its agents reasonably believe, based upon reasonable verification procedures, that the instructions were genuine. Verification procedures include recording instructions, requiring certain identifying information before acting upon instructions and sending written confirmations. During periods when it is difficult to contact the Shareholder Service Agent, it may be difficult to use telephone, wire and other privileges.
QuickBuy and QuickSell (not applicable to Class R shares). QuickBuy and QuickSell permits the transfer of money via the Automated Clearing House System (minimum $50, maximum $250,000) from or to a shareholder’s bank, savings and loan, or credit union account in connection with the purchase or redemption of Fund shares. Shares purchased by check or through QuickBuy and QuickSell or Direct Deposit may not be redeemed under this privilege until such Shares have been owned for at least 10 days. QuickBuy and QuickSell cannot be used with passbook savings accounts or for certain tax-deferred plans such as IRAs.
Tax-Sheltered Retirement Plans. The Shareholder Service Agent provides retirement plan services and documents and SDI can establish investor accounts in any of the following types of retirement plans:
| • | Traditional, Roth and Education IRAs. This includes Savings Incentive Match Plan for Employees of Small Employers (“SIMPLE”), Simplified Employee Pension Plan (“SEP”) IRA accounts and prototype documents. |
- 36 -
Table of Contents
| • | 403(b)(7) Custodial Accounts. This type of plan is available employees of most non-profit organizations. |
| • | Prototype money purchase pension and profit-sharing plans may be adopted by employers. |
Brochures describing these plans as well as model defined benefit plans, 457 plans, 401(k) plans, simple 401(k) plans and materials for establishing them are available from the Shareholder Service Agent upon request. Additional fees and transaction policies and procedures may apply to such plans. Investors should consult with their own tax advisors before establishing a retirement plan.
Each Fund reserves the right to withdraw all or any part of the offering made by its prospectus and to reject purchase orders for any reason. Also, from time to time, each Fund may temporarily suspend the offering of any class of its shares to new investors. During the period of such suspension, persons who are already shareholders of such class of such Fund may be permitted to continue to purchase additional shares of such class and to have dividends reinvested.
Each Fund reserves the right to reject new account applications without a correct certified Social Security or tax identification number. Each Fund also reserves the right, following 30 days’ notice, to redeem all shares in accounts without a correct certified Social Security or tax identification number.
Fees generally charged to IRA accounts will be charged to accounts of Deutsche or Scudder employees and directors.
Financial Services Firms’ Compensation. Banks and other financial services firms may provide administrative services related to order placement and payment to facilitate transactions in shares of each Fund for their clients, and SDI may pay them a transaction fee up to the level of the discount or commission allowable or payable to dealers.
SDI may, from time to time, pay or allow to firms a 1% commission on the amount of shares of each Fund sold under the following conditions: (i) the purchased shares are held in a Scudder IRA account, (ii) the shares are purchased as a direct “roll over” of a distribution from a qualified retirement plan account maintained on a participant subaccount record keeping system provided by SISC, (iii) the registered representative placing the trade is a member of Executive Council, a group of persons designated by SDI in acknowledgment of their dedication to the employee benefit plan area; and (iv) the purchase is not otherwise subject to a commission. Furthermore, SDI may, from time to time, pay or allow to firms a .25% commission on the amount of Class R shares of each Fund sold.
In addition to the discounts or commissions described herein and the prospectus, SDI may pay or allow additional discounts, commissions or promotional incentives, in the form of cash, to firms that sell shares of each Fund. In some instances, such amounts may be offered only to certain
- 37 -
Table of Contents
firms that sell or are expected to sell during specified time periods certain minimum amounts of shares of each Fund, or other Funds underwritten by SDI.
SDI may re-allow to dealers up to the full applicable Class A sales charge during periods and for transactions specified in such notice and such re-allowances may be based upon attainment of minimum sales levels. During periods when 90% or more of the sales charge is re-allowed, such dealers may be deemed to be underwriters as that term is defined in the 1933 Act. SDI may in its discretion compensate investment dealers or other financial services firms in connection with the sale of Class A shares of each Fund at net asset value in accordance with the Large Order NAV Purchase Privilege and one of the three following compensation schedules up to the following amounts:
Compensation Schedule #1(1) | Compensation schedule #2(2) | Compensation Schedule #3(2)(3) | ||||||||||
Amount of Shares Sold | As a Percentage of Net Asset Value | Amount of Shares Sold | As a Percentage of Net Asset Value | Amount of Shares Sold | As a Percentage of Net Asset Value | |||||||
$1 million to $5 million | 1.00 | % | Under $15 million | 0.75 | % | Over $15 million | 0.25% – 0.50% | |||||
Over $5 million to $50 million | 0.50 | % | — | — | — | — | ||||||
Over $50 million | 0.25 | % | — | — | — | — | ||||||
| (1) | The commission schedule will be reset on a calendar year basis for sales of shares pursuant to the Large Order NAV Purchase Privilege to employer-sponsored employee benefit plans using the small plan subaccount record keeping system, made available through Scudder Investments Service Company. For purposes of determining the appropriate commission percentage to be applied to a particular sale under the foregoing schedule, SDI will consider the cumulative amount invested by the purchaser in each Fund and other Funds listed under “Special Features – Class A Shares – Combined Purchases,” including purchases pursuant to the “Combined Purchases,” “Letter of Intent” and “Cumulative Discount” features referred to above. |
| (2) | Compensation Schedules 2 and 3 apply to employer sponsored employee benefit plans using the OmniPlus subaccount record keeping system. The Compensation Schedule will be determined based on the value of the conversion assets. Conversion from “Compensation Schedule #2” to “Compensation Schedule #3” is not an automatic process. Plans whose assets grow beyond $15 million will convert to Compensation Schedule 3 after being re-underwritten. When a plan’s assets grow to exceeding exceed $15 million, the Plan Sponsor may request to be re-underwritten by contacting their Client Relationship Manager to discuss a conversion to Compensation Schedule #3. |
| (3) | Compensation Schedule 3 is based on individual plan underwriting criteria. In most cases, the investment dealers are compensated at a rate of 0.25%. However, certain underwriting factors, such as the number of enrollment and education meetings conducted by Scudder staff, the number of non-Scudder funds the plan chooses, and the per participant record keeping fee, can increase the fee paid up to 0.50%. |
The privilege of purchasing Class A shares of each Fund at net asset value under the Large Order NAV Purchase Privilege is not available if another net asset value purchase privilege also applies.
SDI compensates firms for sales of Class B shares at the time of sale at a commission rate of up to 3.75% of the amount of Class B shares purchased. SDI is compensated by each Fund for services as distributor and principal underwriter for Class B shares. SDI advances to firms the first year distribution fee at a rate of 0.75% of the purchase price of Class C shares. For periods after the first year, SDI currently pays firms for sales of Class C shares of distribution fee, payable quarterly, at an annual rate of 0.75% of net assets attributable to Class C shares
- 38 -
Table of Contents
maintained and serviced by the firm. SDI is compensated by each Fund for services as distributor and principal underwriter for Class C shares.
Class A Purchases. The sales charge scale is applicable to purchases made at one time by any “purchaser” which includes: an individual; or an individual, his or her spouse and children under the age of 21; or a trustee or other fiduciary of a single trust estate or single fiduciary account; or an organization exempt from federal income tax under Section 501(c)(3) or (13) of the Code; or a pension, profit-sharing or other employee benefit plan whether or not qualified under Section 401 of the Code; or other organized group of persons whether incorporated or not, provided the organization has been in existence for at least six months and has some purpose other than the purchase of redeemable securities of a registered investment company at a discount. In order to qualify for a lower sales charge, all orders from an organized group must be placed through a single investment dealer or other firm and identified as originating from a qualifying purchaser.
Initial Sales Charge Alternatives - Class A Shares. The public offering price of Class A shares for purchasers choosing the initial sales charge alternative is the net asset value plus a sales charge, as set forth below.
| Sales Charge | |||||||||
Amount of Purchase | As a Percentage of Offering Price | As a Percentage of Net Asset Value* | Allowed to Dealers as a Percentage of Offering Price | ||||||
Less than $50,000 | 5.75 | % | 6.10 | % | 5.20 | % | |||
$50,000 but less than $100,000 | 4.50 | 4.71 | 4.00 | ||||||
$100,000 but less than $250,000 | 3.50 | 3.63 | 3.00 | ||||||
$250,000 but less than $500,000 | 2.60 | 2.67 | 2.25 | ||||||
$500,000 but less than $1 million | 2.00 | 2.04 | 1.75 | ||||||
$1 million and over | 0.00 | ** | 0.00 | ** | 0.00 | *** | |||
| * | Rounded to the nearest one-hundredth percent. |
| ** | Redemption of shares may be subject to a contingent deferred sales charge as discussed below. |
| *** | Commission is payable by SDI as discussed below. |
Class A NAV Sales. Class A shares may be sold at net asset value to:
| (a) | a current or former director or trustee of Deutsche or Scudder Mutual Funds, |
| (b) | an employee, the employee’s spouse or life partner and children or step-children age 21 or younger of Deutsche Bank or its affiliates or a sub-advisor to any fund in the Scudder Family of Funds or a broker-dealer authorized to sell shares of each Funds; |
| (c) | registered representatives and employees of broker-dealers having selling group agreements with SDI and officers, directors and employees of service agents of each Fund, for themselves or their spouses or dependent children; |
| (d) | certain professionals who assist in the promotion of Scudder Funds pursuant to personal services contracts with SDI, for themselves or members of their families. SDI in its |
- 39 -
Table of Contents
discretion may compensate financial services firms for sales of Class A shares under this privilege at a commission rate of 0.50& of the amount of Class A shares purchased; |
| (e) | any trust, pension, profit-sharing or other benefit plan for only such persons listed under the preceding section (a); |
| (f) | persons who purchase such shares through bank trust departments that process such trades through an automated, integrated mutual fund clearing program provided by a third party clearing firm; |
| (g) | persons who purchase shares of each Fund through SDI as part of an automated billing and wage deduction program administered by RewardsPlus of America for the benefit of employees of participating employer groups; |
| (h) | selected employees (including their spouses and dependent children) of banks and other financial services firms that provide administrative services related to order placement and payment to facilitate transactions in shares of each Fund for their clients pursuant to an agreement with SDI or one of its affiliates. Only those employees of such banks and other firms who as part of their usual duties provide services related to transactions in Fund shares qualify; |
| (i) | unit investment trusts sponsored by Ranson & Associates, Inc. and unitholders of unit investment trusts sponsored by Ranson & Associates, Inc. or its predecessors through reinvestment programs described in the prospectuses of such trusts that have such programs; |
| (j) | through certain investment advisors registered under the Investment Advisors Act of 1940 and other financial services firms acting solely as agent for their clients, that adhere to certain standards established by SDI, including a requirement that such shares be sold for the benefit of their clients participating in an investment advisory program or agency commission program under which such clients pay a fee to the investment advisor or other firm for portfolio management or agency brokerage services. Such shares are sold for investment purposes and on the condition that they will not be resold except through redemption or repurchase by each Fund; |
| (k) | (1) employer sponsored employee benefit plans using the Flex subaccount recordkeeping system (“Flex Plans”), established prior to October 1, 2003, provided that the Flex Plan is a participant-directed plan that has not less than 200 eligible employees; (2) a participant-directed qualified retirement plan described in Code Section 401(a), a participant-directed non-qualified deferred compensation plan described in Code Section 457 or a participant-directed qualified retirement plan described in Code Section 403(b)(7) which is not sponsored by a K-12 school district, provided that the amount invested in Class A shares of the fund or other Scudder Funds totals at least $1,000,000, including purchases of Class A shares pursuant to the “Combined Purchases,” “Letter of Intent” and “Cumulative Discount” features referred to below (collectively, the “Large Order NAV Purchase Privilege”); or (3) if you are investing $1 million or more, either as a lump sum |
- 40 -
Table of Contents
or through the Large Order NAV Purchase Privilege (if no other net asset value purchase privilege applies); and |
| (l) | in connection with the acquisition of the assets of or merger or consolidation with another investment company, or to shareholders in connection with the investment or reinvestment of income and capital gain dividends, and under other circumstances deemed appropriate by SDI and consistent with regulatory requirements. |
Class A shares also may be purchased at net asset value in any amount by members of the plaintiff class in the proceeding known as Howard and Audrey Tabankin, et al. v. Kemper Short-Term Global Income Fund, et al., Case No. 93 C 5231 (N.D. IL). This privilege is generally non-transferable and continues for the lifetime of individual class members and for a ten-year period for non-individual class members. To make a purchase at net asset value under this privilege, the investor must, at the time of purchase, submit a written request that the purchase be processed at net asset value pursuant to this privilege specifically identifying the purchaser as a member of the “Tabankin Class.” Shares purchased under this privilege will be maintained in a separate account that includes only shares purchased under this privilege. For more details concerning this privilege, class members should refer to the Notice of (1) Proposed Settlement with Defendants; and (2) Hearing to Determine Fairness of Proposed Settlement, dated August 31, 1995, issued in connection with the aforementioned court proceeding. For sales of Fund shares at net asset value pursuant to this privilege, SDI may in its discretion pay investment dealers and other financial services firms a concession, payable quarterly, at an annual rate of up to 0.25% of net assets attributable to such shares maintained and serviced by the firm, A firm becomes eligible for the concession based upon assets in accounts attributable to shares purchased under this privilege in the month after the month of purchase and the concession continues until terminated by SDI. The privilege of purchasing Class A shares of each Fund at net asset value under this privilege is not available if another net asset value purchase privilege also applies.
Class A Quantity Discounts. An investor or the investor’s dealer or other financial services firm must notify the Shareholder Service Agent or SDI whenever a quantity discount or reduced sales charge is applicable to a purchase.
For purposes of the Combined Purchases, Letter of Intent and Cumulative Discount features described below, employer sponsored employee benefit plans using the subaccount record keeping system made available through the Shareholder Service Agent may include: (a) Money Market Funds as “Scudder Funds”, (b) all classes of shares of any Scudder Fund and (c) the value of any other plan investments, such as guaranteed investment contracts and employer stock, maintained on such subaccount record keeping system.
Combined Purchases. Each Fund’s Class A shares (or the equivalent) may be purchased at the rate applicable to the sales charge discount bracket attained by combining concurrent investments in Class A shares of any Scudder Funds that bear a sales charge.
Letter of Intent. The same reduced sales charges for Class A shares, as shown in the applicable prospectus, also apply to the aggregate amount of purchases of Class A shares of Scudder Funds that bear a sales charge made by any purchaser within a 24-month period under a written Letter
- 41 -
Table of Contents
of Intent (“Letter”) provided by SDI. The Letter, which imposes no obligation to purchase or sell additional Class A shares, provides for a price adjustment depending upon the actual amount purchased within such period. The Letter provides that the first purchase following execution of the Letter must be at least 5t of the amount of the intended purchase, and that 5% of the amount of the intended purchase normally will be held in escrow in the form of shares pending completion of the intended purchase. If the total investments under the Letter are less than the intended amount and thereby qualify only for a higher sales charge than actually paid, the appropriate number of escrowed shares are redeemed and the proceeds used toward satisfaction of the obligation to pay the increased sales charge. The Letter for an employer-sponsored employee benefit plan maintained on the subaccount record keeping system available through the Shareholder Service Agent may have special provisions regarding payment of any increased sales charge resulting from a failure to complete the intended purchase under the Letter. A shareholder may include the value (at the maximum offering price) of all shares of such Scudder Funds held of record as of the initial purchase date under the Letter as an “accumulation credit” toward the completion of the Letter, but no price adjustment will be made on such shares.
Class A Cumulative Discount. Class A shares of each Fund may also be purchased at the rate applicable to the discount bracket attained by adding to the cost of shares being purchased, the value of all Class A shares of Scudder Funds that bear a sales charge (computed at the maximum offering price at the time of the purchase for which the discount is applicable) already owned by the investor.
Multi-Class Suitability. SDI has established the following procedure regarding the purchase of Class A, Class B and Class C Shares. These procedures do not reflect in any way the suitability of a particular class of shares for a particular investor and should not be relied upon as such. A suitability determination must be made by investors with the assistance of their financial advisor.
The following provisions apply to the sale of Class A, Class B and Class C Shares to Flex Plans. Class B Shares will not be sold to Flex Plans established on the Flex subaccount recordkeeping system after October 1, 2003. Orders for Class B Shares or Class C Shares for Flex Plans (not including plans under Code Section 403 (b) (7) sponsored by a K-12 school district) established on the Flex subaccount recordkeeping system prior to October 1, 2002 will be invested instead in Class A Shares at net asset value when the combined subaccount value in the fund or other Scudder Funds or other eligible assets is in excess of $5 million including purchases pursuant to the “Combined Purchases,” “Letter of Intent” and “Cumulative Discount” features described above. Flex Plans established prior to October 1, 2002 with eligible assets of less than $5 million may continue to purchase Class B Shares or Class C Shares until October 1, 2005. Flex Plans set-up on the Flex subaccount recordkeeping system after October 1, 2002 will automatically begin purchasing Class A shares at net asset value once the plan’s eligible assets reach $1 million. After October 1, 2005, all Flex Plans with eligible assets over $1 million must begin purchasing Class A Shares.
- 42 -
Table of Contents
Class C Purchases. Class C shares will be offered at net asset value plus an up-front sales charge of 1.00% of the offering price. Class C shares will continue to be subject to a contingent deferred sales charge and Rule 12b-1 distribution and/or service fee as more fully described in each fund’s currently effective prospectus. The up-front sales charge does not apply to reinvested dividends or distributions.
You may be able to buy Class C shares without an up-front sales charge when you purchase Class C shares in connection with the following types of transactions:
| • | Additional purchases of Class C shares made in an existing account and in the same fund(s) by existing Class C shareowners as of January 31, 2003; |
| • | Exchanges of Class C shares made in an existing account by current Class C shareowners as of January 31, 2003; |
| • | Purchases of Class C shares through certain omnibus accounts which have entered into an agreement with the Advisor and/or SDI; |
| • | Purchases of Class C shares through certain retirement plans which have entered into an agreement with the Advisor and/or SDI; and |
| • | Purchases of Class C shares through certain broker-dealers which have entered into an agreement with the Advisor and/or SDI. |
Your financial advisor or Shareholder Services can answer your questions and help you determine if you are eligible for a sales charge waiver.
Purchase of Class R, Institutional and Investment Class Shares. Information on how to buy shares is set forth in the section entitled “How to Invest in the Funds” in each Fund’s Prospectuses. The following supplements that information. The minimum initial investment for Institutional Class shares is $250,000. There is no minimum subsequent investment requirement for the Institutional Class shares. The minimum initial investment for Investment Class shares is $1,000 and the minimum subsequent investment is $50. There are no minimum investments for Class R shares.
Investment Class shares are subject to an annual shareholder servicing fee of 0.25%. Class R shares are subject to an annual distribution and shareholder servicing fee of 0.50% (0.25% distribution fee, 0.25% shareholder service fee). These minimum amounts may be changed at any time in management’s discretion.
In order to make an initial investment in Investment Class shares of each Fund, an investor must establish an account with a service organization. Investors may invest in Institutional Class shares by setting up an account directly with SISC or through an authorized service agent. Investors who establish shareholder accounts directly with SISC should submit purchase and redemption orders as described in the prospectus. Investors may invest in Class R shares through certain retirement and other plans. Additionally, each Fund has authorized brokers to accept purchase and redemption orders for Institutional and Investment Class and Class R shares for
- 43 -
Table of Contents
each Fund. Brokers, including authorized brokers of service organizations, are, in turn, authorized to designate other intermediaries to accept purchase and redemption orders on each Fund’s behalf. Investors who invest through brokers, service organizations or their designated intermediaries may be subject to minimums established by their broker, service organization or designated intermediary.
Investors who invest through authorized brokers, service organizations or their designated intermediaries should submit purchase and redemption orders directly to their broker, service organization or designated intermediary. The broker or intermediary may charge you a transaction fee. Each Fund will be deemed to have received a purchase or redemption order when an authorized broker, service organization or, if applicable, an authorized designee, accepts the order. Shares of each Fund may be purchased or redeemed on any Business Day at the net asset value next determined after receipt of the order, in good order, by SISC.
To sell shares in a retirement account, your request must be made in writing, except for exchanges to other eligible funds in the Scudder Investments family of funds, which can be requested by phone or in writing. For information on retirement distributions, contact your Service Agent or call the Shareholder Service Agent at 1-800-621-1048. To sell shares by bank wire you will need to sign up for these services in advance when completing your account application.
Automatic Investment Plan. A shareholder may purchase additional shares of each Fund through an automatic investment program. With the Direct Deposit Purchase Plan (“Direct Deposit”), investments are made automatically (minimum $50 and maximum $250,000) from the shareholder’s account at a bank, savings and loan or credit union into the shareholder’s Fund account. Termination by a shareholder will become effective within thirty days after the Shareholder Service Agent has received the request. A Fund may immediately terminate a shareholder’s Plan in the event that any item is unpaid by the shareholder’s financial institution.
Payroll Investment Plans. A shareholder may purchase shares through Payroll Direct Deposit or Government Direct Deposit. Under these programs, all or a portion of a shareholder’s net pay or government check is invested each payment period. A shareholder may terminate participation in these programs by giving written notice to the shareholder’s employer or government agency, as appropriate. (A reasonable time to act is required.) A Fund is not responsible for the efficiency of the employer or government agency making the payment or any financial institutions transmitting payments.
To sell shares in a retirement account, your request must be made in writing, except for exchanges to other eligible funds in the Scudder Investments family of funds, which can be requested by phone or in writing. For information on retirement distributions, contact your Service Agent or call the Transfer Agent at 1-800-621-1048.
Each Fund may suspend the right of redemption or delay payment more than seven days (a) during any period when the Exchange is closed other than customary weekend and holiday closings or during any period in which trading on the Exchange is restricted, (b) during any
- 44 -
Table of Contents
period when an emergency exists as a result of which (i) disposal of each Fund’s investments is not reasonably practicable, or (ii) it is not reasonably practicable for a Fund to determine the value of its net assets, or (c) for such other periods as the SEC may by order permit for the protection of a Fund’s shareholders.
A request for repurchase (confirmed redemption) may be communicated by a shareholder through a financial services firm to SDI, which firms must promptly submit orders to be effective.
Redemption requests must be unconditional. Redemption requests (and a stock power for certificated shares) must be duly endorsed by the account holder. As specified in the prospectus, signatures may need to be guaranteed by a commercial bank, trust company, savings and loan association, federal savings bank, member firm of a national securities exchange or other financial institution permitted by SEC rule. Additional documentation may be required, particularly from institutional and fiduciary account holders, such as corporations, custodians (e.g., under the Uniform Transfers to Minors Act), executors, administrators, trustees or guardians.
If the proceeds of the redemption (prior to the imposition of any contingent deferred sales charge) are $100,000 or less and the proceeds are payable to the shareholder of record at the address of record, normally a telephone request or a written request by any one account holder without a signature guarantee is sufficient for redemptions by individual or joint account holders, and trust, executor and guardian account holders (excluding custodial accounts for gifts and transfers to minors), provided the trustee, executor or guardian is named in the account registration. Other institutional account holders and guardian account holders of custodial accounts for gifts and transfers to minors may exercise this special privilege of redeeming shares by telephone request or written request without signature guarantee subject to the same conditions as individual account holders, provided that this privilege has been pre-authorized by the institutional account holder or guardian account holder by written instruction to the Shareholder Service Agent with signatures guaranteed. This privilege may not be used to redeem shares held in certificated form and may not be used if the shareholder’s account has had an address change within 15 days of the redemption request.
Wires. Delivery of the proceeds of a wire redemption of $250,000 or more may be delayed by a Fund for up to seven days if a Fund or the Shareholder Service Agent deems it appropriate under then-current market conditions. The ability to send wires is limited by the business hours and holidays of the firms involved. Each Fund is not responsible for the efficiency of the federal wire system or the account holder’s financial services firm or bank. The account holder is responsible for any charges imposed by the account holder’s firm or bank. To change the designated account to receive wire redemption proceeds, send a written request to each Fund Shareholder Service Agent with signatures guaranteed as described above or contact the firm through which Fund shares were purchased.
Automatic Withdrawal Plan. The owner of $5,000 or more of a class of a Fund’s shares at the offering price (net asset value plus, in the case of Class A shares, the initial sales charge) may provide for the payment from the owner’s account of any requested dollar amount to be paid to the owner or a designated payee monthly, quarterly, semiannually or annually. The $5,000
- 45 -
Table of Contents
minimum account size is not applicable to IRAs. The minimum periodic payment is $50. The maximum annual rate at which shares, subject to CDSC may be redeemed is 12% of the net asset value of the account. Shares are redeemed so that the payee should receive payment approximately the first of the month. Investors using this Plan must reinvest Fund distributions.
The purchase of Class A shares while participating in a systematic withdrawal plan will ordinarily be disadvantageous to the investor because the investor will be paying a sales charge on the purchase of shares at the same time that the investor is redeeming shares upon which a sales charge may have already been paid. Therefore, a Fund will not knowingly permit additional investments of less than $2,000 if the investor is at the same time making systematic withdrawals.
Contingent Deferred Sales Charge (CDSC). The following example will illustrate the operation of the CDSC. Assume that an investor makes a single purchase of $10,000 of each Fund’s Class B shares and that 16 months later the value of the shares has grown by $1,000 through reinvested dividends and by an additional $1,000 of share appreciation to a total of $12,000. If the investor were then to redeem the entire $12,000 in share value, the CDSC would be payable only with respect to $10,000 because neither the $1,000 of reinvested dividends nor the $1,000 of share appreciation is subject to the charge. The charge would be at the rate of 3.00% ($300) because it was in the second year after the purchase was made.
The rate of the CDSC is determined by the length of the period of ownership. Investments are tracked on a monthly basis. The period of ownership for this purpose begins the first day of the month in which the order for the investment is received. For example, an investment made in March 2004 will be eligible for the second year’s charge if redeemed on or after March 1, 2005. In the event no specific order is requested when redeeming shares subject to a CDSC, the redemption will be made first from shares representing reinvested dividends and then from the earliest purchase of shares. SDI receives any CDSC directly. The charge will not be imposed upon redemption of reinvested dividends or share appreciation.
The Class A CDSC will be waived in the event of:
| (a) | redemptions by a participant-directed qualified retirement plan described in Code Section 401(a), a participant-directed non-qualified deferred compensation plan described in Code Section 457 or a participant-directed qualified retirement plan described in Code Section 403(b)(7) which is not sponsored by a K-12 school district; |
| (b) | redemptions by employer-sponsored employee benefit plans using the subaccount record keeping system made available through the Shareholder Service Agent; |
| (c) | redemption of shares of a shareholder (including a registered joint owner) who has died; |
| (d) | redemption of shares of a shareholder (including a registered joint owner) who after purchase of the shares being redeemed becomes totally disabled (as evidenced by a determination by the federal Social Security Administration); |
| (e) | redemptions under each Fund’s Automatic Withdrawal Plan at a maximum of 12% per year of the net asset value of the account; and |
- 46 -
Table of Contents
| (f) | redemptions of shares whose dealer of record at the time of the investment notifies SDI that the dealer waives the discretionary commission applicable to such Large Order NAV Purchase. |
The Class B CDSC will be waived for the circumstances set forth in items (c), (d) and (e) for Class A shares. In addition, this CDSC will be waived:
| (a) | for redemptions made pursuant to any IRA systematic withdrawal based on the shareholder’s life expectancy including, but not limited to, substantially equal periodic payments described in Internal Revenue Code Section 72(t)(2)(A)(iv) prior to age 59 1/2; |
| (b) | for redemptions to satisfy required minimum distributions after age 70 1/2 from an IRA account (with the maximum amount subject to this waiver being based only upon the shareholder’s Scudder IRA accounts); and |
| (c) | in connection with the following redemptions of shares held by employer sponsored employee benefit plans maintained on the subaccount record keeping system made available by the Shareholder Service Agent: (1) to satisfy participant loan advances (note that loan repayments constitute new purchases for purposes of the CDSC and the conversion privilege), (2) in connection with retirement distributions (limited at any one time to 10% of the total value of plan assets invested in each Fund), (3) in connection with distributions qualifying under the hardship provisions of the Internal Revenue Code and (4) representing returns of excess contributions to such plans. |
The Class C CDSC will be waived for the circumstances set forth in items (b), (c), (d) and (e) for Class A shares and for the circumstances set forth in items (a) and (b) for Class B shares. In addition, this CDSC will be waived for:
| (a) | redemption of shares by an employer sponsored employee benefit plan that offers funds in addition to Scudder Funds and whose dealer of record has waived the advance of the first year administrative service and distribution fees applicable to such shares and agrees to receive such fees quarterly, and |
| (b) | redemption of shares purchased through a dealer-sponsored asset allocation program maintained on an omnibus record-keeping system provided the dealer of record had waived the advance of the first year administrative services and distribution fees applicable to such shares and has agreed to receive such fees quarterly. |
Shareholders may request an exchange of their shares for shares of the corresponding class of other Scudder Funds or Deutsche Funds without imposition of a sales charge, subject to the provisions below. Investors may realize a taxable gain or loss in connection with the exchange. For purposes of calculating any CDSC, amounts exchanged retain their original cost and purchase date.
Shares of Scudder or Deutsche money market funds and the Scudder Cash Reserve Fund that were acquired by purchase (not including shares acquired by dividend reinvestment) are subject
- 47 -
Table of Contents
to the applicable sales charge on exchange. Series of Scudder Target Fund are available on exchange only during the Offering Period for such series as described in the applicable prospectus. Cash Equivalent Fund, Tax-Exempt California Money Market Fund, Cash Account Trust, Investors Municipal Cash Fund and Investors Cash Trust are available on exchange only through a financial services firm having a services agreement with SDI. You may exchange from the following money market funds into the same class of a Scudder fund, if available, at net asset value, subject to the conditions detailed in each fund’s prospectus: Cash Management Fund Investment, Tax Free Money Fund Investment, New York Tax Free Money Fund Investment, Treasury Money Fund Investment, Money Market Fund Investment, Cash Management Fund Institutional, Cash Reserves Fund Institutional and Treasury Money Fund Institutional.
Shares of a Scudder Fund with a value in excess of $1,000,000 (except Scudder or Deutsche Money Market Funds and the Scudder Cash Reserves Fund) acquired by exchange through another Scudder Fund, or from a Money Market Fund, may not be exchanged thereafter until they have been owned for 15 days (the “15-Day Hold Policy”). In addition, shares of a Scudder Fund with a value of $1,000,000 or less (except Scudder Cash Reserves Fund) acquired by exchange from another Scudder Fund, or from a money market fund, may not be exchanged thereafter until they have been owned for 15 days, if, in the Advisor’s judgment, the exchange activity may have an adverse effect on each Fund. In particular, a pattern of exchanges that coincides with a “market timing” strategy may be disruptive to the Scudder Fund and therefore may be subject to the 15-Day Hold Policy. For purposes of determining whether the 15-Day Hold Policy applies to a particular exchange, the value of the shares to be exchanged shall be computed by aggregating the value of shares being exchanged for all accounts under common control, discretion or advice, including, without limitation, accounts administered by a financial services firm offering market timing, asset allocation or similar services.
Shareholders must obtain prospectuses of each Fund they are exchanging into from dealers, other firms or SDI.
Automatic Exchange Plan (not applicable to Class R shares). The owner of $1,000 or more of any class of shares of a Scudder Fund may authorize the automatic exchange of a specified amount ($50 minimum) of such shares for shares of the same class of another such Scudder Fund. Exchanges will be made automatically until the shareholder or each Fund terminates the privilege. Exchanges are subject to the terms and conditions described above.
Multi-Class Conversions. For purposes of conversion to Class A shares, shares purchased through the reinvestment of dividends and other distributions paid with respect to Class B shares in a shareholder’s Fund account will be converted to Class A shares on a pro rata basis.
Each Fund intends to follow the practice of distributing substantially all of its investment company taxable income, which includes any excess of net realized short-term capital gains over net realized long-term capital losses. A Fund may follow the practice of distributing the entire excess of net realized long-term capital gains over net realized short-term capital losses. However, each Fund may retain all or part of such gain for reinvestment, after paying the related federal taxes for which shareholders may then be able to claim a credit against their federal tax
- 48 -
Table of Contents
liability. If a Fund does not distribute the amount of capital gain and/or ordinary income required to be distributed by an excise tax provision of the Code, each Fund may be subject to that excise tax. In certain circumstances, a Fund may determine that it is in the interest of shareholders to distribute less than the required amount.
Each Fund intends to distribute dividends from its net investment income, excluding short-term capital gains, annually in December. Each Fund intends to distribute net realized capital gains after utilization of capital loss carryforwards, if any, in December to prevent application of a federal excise tax. An additional distribution may be made, if necessary.
Any dividends or capital gains distributions declared in October, November or December with a record date in such a month and paid during the following January will be treated by shareholders for federal income tax purposes as if received on December 31 of the calendar year declared.
The level of income dividends per share (as a percentage of net asset value) will be lower for Class B and Class C Shares than for Class A Shares primarily as a result of the higher distribution services fee applicable to Class B and Class C Shares. Distributions of capital gains, if any, will be paid in the same amount for each class.
Income dividends and capital gain distributions, if any, of a Fund will be credited to shareholder accounts in full and fractional shares of the same class of a Fund at net asset value on the reinvestment date, except that, upon written request to the Shareholder Service Agent, a shareholder may select one of the following options:
| (1) | To receive income including short-term capital gain dividends in cash and long-term capital gain dividends in shares of the same class at net asset value; or |
| (2) | To receive income dividends and capital gain distributions in cash. |
Dividends and distributions will be reinvested in Shares of the same class of each Fund unless shareholders indicate in writing that they wish to receive them in cash or in shares of other Scudder Funds with multiple classes of shares or Scudder Funds as provided in the prospectus. To use this privilege of investing dividends of each Fund in shares of another Scudder Fund, shareholders must maintain a minimum account value of $1,000 in each Fund distributing the dividends. Each Fund will reinvest dividend and distribution checks (and future dividends) in shares of that same Fund and class if checks are returned as undeliverable. Dividends and other distributions of each Fund in the aggregate amount of $10 or less are automatically reinvested in shares of each Fund unless the shareholder requests that such policy not be applied to the shareholder’s account.
If an investment is in the form of a retirement plan, all dividends and capital gains distributions must be reinvested into the shareholder’s account.
If a shareholder has elected to reinvest any dividends and/or other distributions, such distributions will be made in shares of that Fund and confirmations will be mailed to each shareholder. If a shareholder has chosen to receive cash, a check will be sent. Dividends of
- 49 -
Table of Contents
investment company taxable income and distributions of net realized capital gains are taxable, whether made in shares or cash.
Each dividend and distribution is accompanied by a brief explanation of the form and character of the distribution. The characterization of dividends and distributions on such correspondence may differ from the characterization for federal tax purposes. In January of each year, each Fund issues to each shareholder a statement of the federal income tax status of all dividends and distributions in the prior calendar year.
Each Fund may at any time vary its foregoing dividend and distribution practices and, therefore, reserves the right from time to time to either distribute or retain for reinvestment such of its net investment income and its net short-term and long-term capital gains as its Board determines appropriate under the then current circumstances. In particular, and without limiting the foregoing, a Fund may make additional dividends of net investment income or distributions of capital gain net income in order to satisfy the minimum distribution requirements contained in the Code.
Redemptions and Purchases In-Kind
The Trust, on behalf of each Fund, reserves the right, if conditions exist which make cash payments undesirable, to honor any request for redemption or withdrawal by making payment in whole or in part in readily marketable securities chosen by the Trust, or a Fund, as the case may be, and valued as they are for purposes of computing the Fund’s net asset value, as the case may be (a redemption in- kind). If payment is made to a Fund’s shareholder in securities, an investor, including the Fund, may incur transaction expenses in converting these securities into cash. The Trust, on behalf of each Fund, has elected, however, to be governed by Rule 18f-1 under the 1940 Act as a result of which each Fund is obligated to redeem shares or beneficial interests, as the case may be, with respect to any one investor during any 90-day period, solely in cash up to the lesser of $250,000 or 1% of the net asset value of the Fund at the beginning of the period.
Each Fund has advised the Trust that the Fund will not redeem in-kind except in circumstances in which the Fund is permitted to redeem in-kind or unless requested by the Fund.
Each investor in a Fund, may add to or reduce its investment in the Fund on each day the Fund determines its net asset value. At the close of each such business day, the value of each investor’s beneficial interest in the Fund will be determined by multiplying the net asset value of the Fund by the percentage effective for that day, which represents that investor’s share of the aggregate beneficial interests in the Fund. Any additions or withdrawals which are to be effected as of the close of business on that day will then be effected. The investor’s percentage of the aggregate beneficial interests in the Fund will then be recomputed as the percentage equal to the fraction (i) the numerator of which is the value of such investor’s investment in the Fund as of the close of business on such day plus or minus the amount of net additions to or withdrawals from the investor’s investment in the Fund effected as of the close of business on such day, and (ii) the denominator of which is the aggregate net asset value of the Fund as of the close of business on such day plus or minus the amount of net additions to or withdrawals from the aggregate investments in the Fund by all investors in the Fund. The percentage so determined
- 50 -
Table of Contents
will then be applied to determine the value of the investor’s interest in the Fund as the close of business on the following business day.
Each Fund may, at its own option, accept securities in payment for shares. The securities delivered in payment for shares are valued by the method described under “Valuation of Securities” as of the day the Fund receives the securities. This may be a taxable transaction to the shareholder. (Consult your tax advisor for future tax guidance.) Securities may be accepted in payment for shares only if they are, in the judgment of the Advisor, appropriate investments for the Fund. In addition, securities accepted in payment for shares must: (1) meet the investment objective and policies of the acquiring Fund; (ii) be acquired by the applicable Fund for investment and not for resale; (iii) be liquid securities which are not restricted as to transfer either by law or liquidity of the market; and (iv) if stock, have a value which is readily ascertainable as evidenced by a listing on a stock exchange, over-the-counter market or by readily available market quotations from a dealer in such securities. Each Fund reserves the right to accept or reject at its own option any and all securities offered in payment for its shares.
Each Fund reserves the right to redeem all of its shares, if the Fund’s Board of Trustees votes to liquidate and terminate the Fund.
NET ASSET VALUE
The net asset value per share of each Fund is computed as of the close of regular trading on the New York Stock Exchange (the “Exchange”) on each day the Exchange is open for trading (the “Value Time”). The Exchange is scheduled to be closed on the following holidays: New Year’s Day, Dr. Martin Luther King, Jr. Day, Presidents’ Day, Good Friday, Memorial Day, Independence Day, Labor Day, Thanksgiving and Christmas, and on the preceding Friday or subsequent Monday when one of these holidays falls on a Saturday or Sunday, respectively. Net asset value per share is determined separately for each class of shares by dividing the value of the total assets of the Fund attributable to the shares of that class, less all liabilities attributable to that class, by the total number of shares of that class outstanding. The per share net asset value may be lower for certain classes of the Fund because of higher expenses borne by these classes.
An equity security is valued at its most recent sale price on the relevant exchange or over-the-counter (“OTC”) market as of the Value Time. Lacking any sales, the security is valued at the calculated mean between the most recent bid quotation and the most recent asked quotation (the “Calculated Mean”) on such exchange or OTC market as of the Value Time. If it is not possible to determine the Calculated Mean, the security is valued at the most recent bid quotation on such exchange or OTC market as of the Value Time. In the case of certain foreign exchanges or OTC markets, the closing price reported by the exchange or OTC market (which may sometimes be referred to by the exchange or one or more pricing agents as the “official close” or the “official closing price” or other similar term) will be considered the most recent sale price. If a security is traded on more than one exchange, or upon one or more exchanges and in the OTC market, quotations are taken from the market in which the security is traded most extensively.
Debt securities are valued as follows. Money market instruments purchased with an original or remaining maturity of 60 days or less, maturing at par, are valued at amortized cost. Other money market instruments are valued based on information obtained from an approved pricing agent or, if such information is not readily available, by using matrix pricing techniques (formula
- 51 -
Table of Contents
driven calculations based primarily on current market yields). Bank loans are valued at prices supplied by an approved pricing agent (which are intended to reflect the mean between the bid and asked prices), if available, and otherwise at the mean of the most recent bid and asked quotations or evaluated prices, as applicable, based on quotations or evaluated prices obtained from one or more broker-dealers. Privately placed debt securities, other than Rule 144A debt securities, initially are valued at cost and thereafter based on all relevant factors including type of security, size of holding and restrictions on disposition. Municipal debt securities are valued at prices supplied by an approved pricing agent (which are intended to reflect the bid price), if available, and otherwise at the average of the most recent bid quotations or evaluated prices obtained from two broker-dealers. Other debt securities are valued at prices supplied by an approved pricing agent, if available, and otherwise at the most recent bid quotation or evaluated price, as applicable, obtained from one or more broker-dealers. If it is not possible to value a particular debt security pursuant to the above methods, the security is valued on the basis of factors including (but not limited to) maturity, coupon, creditworthiness, currency denomination, and the movement of the market in which the security is normally traded.
An exchange–traded option contract on securities, currencies and other financial instruments is valued at its most recent sale price on the relevant exchange. Lacking any sales, the option contract is valued at the Calculated Mean. If it is not possible to determine the Calculated Mean, the option contract is valued at the most recent bid quotation in the case of a purchased option contract or the most recent asked quotation in the case of a written option contract, in each case as of the Value Time. An option contract on securities, currencies and other financial instruments traded in the OTC market is valued on the Value Date at the evaluated price provided by the broker-dealer with which it was traded. Futures contracts (and options thereon) are valued at the most recent settlement price, if available, on the exchange on which they are traded most extensively. With the exception of stock index futures, contracts which trade on the Chicago Mercantile Exchange, closing settlement times are prior to the close of trading on the New York Stock Exchange. For stock index futures contracts which trade on the Chicago Mercantile Exchange, closing settlement prices are normally available at approximately 4:20 p.m. Eastern time. If no settlement price is available, the last traded price on such exchange will be used.
Following the valuations of securities or other portfolio assets in terms of the currency in which the market quotation used is expressed (“Local Currency”), the value of these portfolio assets in terms of U.S. dollars is calculated by converting the Local Currency into U.S. dollars at the prevailing currency exchange rate on the valuation date.
If market quotations for Fund assets are not readily available or the value of the Fund asset as determined in accordance with Board approved procedures does not represent the fair market value of the Fund asset, the value of the Fund asset is taken to be an amount which, in the opinion of the Fund’s Pricing Committee (or, in some cases, the Board’s Valuation Committee), represents fair market value. The value of other holdings is determined in a manner which is intended to fairly reflect the fair market value of the asset on the valuation date, based on valuation procedures adopted by the Fund’s Board and overseen primarily by the Fund’s Pricing Committee.
- 52 -
Table of Contents
MANAGEMENT OF THE TRUST AND FUNDS
The overall business and affairs of the Trust are managed by the Board of Trustees. The Board approves all significant agreements between the Trust/Fund and persons or companies furnishing services to the Fund, including the Fund’s agreements with its investment advisor, distributor, custodian and transfer agent. The Board of Trustees and the executive officers are responsible for managing the Fund’s affairs and for exercising the Fund’s powers except those reserved for the shareholders and those assigned to the Advisor or other service providers. Each Trustee holds office until he or she resigns, is removed or a successor is elected and qualified. Each officer is elected to serve until he or she resigns, is removed or a successor has been duly elected and qualified.
The following information is provided for each Trustee and Officer of the Trust. The first section of the table lists information for each Trustee who is not an “interested person” of the Trust and Funds (as defined in the 1940 Act) (a “Non-Interested Trustee”). Information for each Interested Trustee (the “Interested Trustee”) follows. The Interested Trustees are considered to be interested persons as defined by the 1940 Act because of their employment with either a Fund’s Advisor and/or underwriter or their affiliates. The mailing address for the Trustees and Officers with respect to Trust/Fund operations is One South Street, Baltimore, Maryland 21202. The following individuals hold the same position with the Fund and the Trust.
- 53 -
Table of Contents
Name, Date of Birth, Position with the Funds and Length of Time Served1, 2 | Business Experience and Directorships During the Past 5 Years | Number of Funds in the Fund Complex Overseen | ||
Richard R. Burt 2/3/47 Trustee since 2002 | Chairman, Diligence LLC (international information collection and risk management firm) (September 2000 to present); Chairman, IEP Advisors, Inc. (July 1998 to present); Chairman of the Board, Weirton Steel Corporation’3 (April 1996 to present); Member of the Board, Hollinger International, Inc.’3 (publishing) (September 1995 to present), HCL Technologies Limited (information technology) (April 1999 to present), UBS Mutual Funds (formerly known as Brinson and Mitchell Hutchins families of funds) (registered investment companies) (September 1995 to present); and Member, Textron Inc.A3 International Advisory Council (July 1996 to present). Formerly, Partner, McKinsey & Company (consulting) (1991-1994) and US Chief Negotiator in Strategic Arms Reduction Talks (START) with former Soviet Union and US Ambassador to the Federal Republic of Germany (1985-1991); Member of the Board, Homestake Mining”3 (mining and exploration) (1998-February 2001), Archer Daniels Midland Company”3 (agribusiness operations) (October 1996-June 2001) and Anchor Gaming (gaming software and equipment) (March 1999-December 2001). | 68 | ||
S. Leland Dill 3/28/30 Trustee since 1986 | Trustee, Phoenix Zweig Series Trust (since September 1989), Phoenix Euclid Market Neutral Funds (since May 1998) (registered investment companies); Retired (since 1986). Formerly, Partner, KPMG Peat Marwick (June 1956-June 1986); Director, Vintners International Company Inc. (wine vintners) (June 1989-May 1992), Coutts (USA) International (January 1992-March 2000), Coutts Trust Holdings Ltd., Coutts Group(private bank) (March 1991-March 1999); General Partner, Pemco (investment company) (June 1979-June 1986). | 66 | ||
Martin J. Gruber 7/15/37 Trustee since 1999 | Nomura Professor of Finance, Leonard N. Stern School of Business, New York University (since September 1964); Trustee, CREF (pension fund) (since January 2000); Director, Japan Equity Fund, Inc. (since January 1992), Thai Capital Fund, Inc. (since January 2000) and Singapore Fund, Inc. (since January 2000) (registered investment companies). Formerly, Trustee, TIAA (pension fund) (January 1996-January 2000) S.G. Cowen Mutual Funds (January 1985-January 2001). | 66 | ||
Joseph R. Hardiman 5/27/37 Trustee since 2002 | Private Equity Investor (January 1997 to present); Director, Corvis CorporationA3 (optical networking equipment) (July 2000 to present), Brown Investment Advisory & Trust Company (investment advisor) (February 2001 to present), The Nevis Fund (registered investment company) (July 1999 to present), and ISI Family of Funds (registered investment companies) (March 1998 to present). Formerly, Director, Soundview Technology Group Inc. (investment banking) (July 1998 to January 2004); Director, Circon Corp.3 (medical instruments) (November 1998-January 1999); President and Chief Executive Officer, The National Association of Securities Dealers, Inc. and The NASDAQ Stock Market, Inc. | 66 | ||
- 54 -
Table of Contents
| (1987-1997); Chief Operating Officer of Alex. Brown & Sons incorporated (now Deutsche Bank Securities Inc.) (1985-1987); General Partner, Alex. Brown & Sons Incorporated (now Deutsche Bank Securities Inc.) (1976-1985). | ||||
Richard J. Herring 2/18/46 Trustee since 1999 | Jacob Safra Professor of International Banking and Professor, Finance Department, The Wharton School, University of Pennsylvania (since July 1972); Director, Lauder Institute of International Management Studies (since July 2000); Co-Director, Wharton Financial Institutions Center(since July 2000). Formerly, Vice Dean and Director, Wharton Undergraduate Division (July 1995-June 2000). | 66 | ||
Graham E. Jones 1/31/33 Trustee since 2002 | Senior Vice President, BGK Realty, Inc. (commercial real estate) (since 1995); Trustee, 8 open-end mutual funds managed by Weiss, Peck & Greer (since 1985) and Trustee of 18 open-end mutual funds managed by Sun Capital Advisers, Inc. (since 1998). | 66 | ||
Rebecca W. Rimel 4/10/51 Trustee since 2002 | President and Chief Executive Officer, The Pew Charitable Trusts (charitable foundation) (1994 to present); Executive Vice President, The Glenmede Trust Company (investment trust and wealth management) (1983 to present). Formerly, Executive Director, The Pew Charitable Trusts (1988-1994); Director, ISI Family of Funds (registered investment companies) (1997-1999) and Director, The Glenmede Trust Company (investment trust and wealth management, (1994-2002). | 66 | ||
Philip Saunders, Jr. 10/11/35 Trustee since 1986 | Principal, Philip Saunders Associates (economic and financial consulting) (since November 1988). Formerly, Director, Financial Industry Consulting, Wolf & Company (consulting) (1987-1988); President, John Hancock Home Mortgage Corporation (1984-1986); Senior Vice President of Treasury and Financial Services, John Hancock Mutual Life Insurance Company, Inc. (1982-1986). | 66 | ||
William N. Searcy 9/03/46 Trustee since 2002 | Private investor since October 2003; Trustee of 18 open-end mutual funds managed by Sun Capital Advisers, Inc. (since October 1998). Formerly Pension & Savings Trust Officer, Sprint Corporation3 (telecommunications) | 84 | ||
Robert H. Wadsworth 1/29/40 Trustee since 2002 | President, Robert H. Wadsworth Associates, Inc. (consulting firm) (1982 to present). Formerly, President and Trustee, Trust for Investment Managers (registered investment company) (1999-2002). President, Investment Company Administration, L.L.C. (1992*-July 2001); President, Treasurer and Director, First Fund Distributors, Inc. (1990-January 2002); Vice President, Professionally Managed Portfolios (1991-2002) and Advisors Series Trust (1996-2002) (registered investment companies); President, Guinness Flight Investment Funds, Inc.(registered investment companies).
* Inception date of the corporation which was the predecessor to the LLC. | 69 | ||
- 55 -
Table of Contents
Name, Date of Birth, | Business Experience and Directorships During the Past 5 Years | Number of Funds in the Fund Complex Overseen | ||
Richard T. Hale4 7/17/45 Chairman since 2002 Trustee since 1999 | Managing Director, Deutsche Investment Management Americas Inc. (2003–present); Managing Director, Deutsche Bank Securities Inc. (formerly Deutsche Banc Alex. Brown Inc.) and Deutsche Asset Management (1999 to present); Director and President, Investment Company Capital Corp. (registered investment advisor) (1996 to present); Director, Deutsche Global Funds, Ltd. (2000 to present), CABEI Fund (2000 to present), North American Income Fund (2000 to present) (registered investment companies); Director, Scudder Global Opportunities Fund (since 2003); Director/Officer Deutsche/Scudder Mutual Funds (various dates); President, Montgomery Street Securities, Inc. (2002 to present) (registered investment companies); Vice President, Deutsche Asset Management, Inc. (2000 to present). Formerly, Director, ISI Family of Funds (registered investment company; 4 funds overseen) (1992-1999). | 201 |
Officers
Name, Date of Birth, Position with the Funds and Length of Time Served1,2 | Business Experience and Directorships During the Past 5 Years | |
Brenda Lyons5 2/21/63 President since 2003 | Managing Director, Deutsche Asset Management. | |
Kenneth Murphy5 10/13/63 Vice President and Anti- Money Laundering Compliance Officer since 2002 | Vice President, Deutsche Asset Management (September 2000-present). Vice President, Scudder Distributors, Inc. (September 2000-present); Formerly, Director, John Hancock Signature Services (1992-2001) | |
John Millette5 (8/23/62) Secretary since 2003 | Director, Deutsche Asset Management. | |
Charles A. Rizzo3 8/5/57 Treasurer since 2002 | Director, Deutsche Asset Management (April 2000 to present). Formerly, Vice President and Department Head, BT Alex. Brown Incorporated (now Deutsche Bank Securities Inc.) (1998-1999); Senior Manager, Coopers & Lybrand L.L.P. (now PricewaterhouseCoopers LLP) (1993-1998). | |
Daniel O. Hirsch 3/27/54 Assistant Secretary since 2003 | Managing Director, Deutsche Asset Management (2002-present) and Director, Deutsche Global Funds Ltd. (2002-present). Formerly, Director, Deutsche Asset Management (1999-2002), Principal, BT Alex. Brown Incorporated (now Deutsche Bank Securities Inc.) (1998-1999); Assistant General Counsel, United States Securities and Exchange Commission (1993-1998). | |
Bruce A. Rosenblum 9/14/60 Vice President since 2003 Assistant Secretary since 2002 | Director, Deutsche Asset Management. | |
- 56 -
Table of Contents
Caroline Pearson5 4/1/62 Assistant Secretary since 2002 | Managing Director, Deutsche Asset Management. | |
Salvatore Schiavone5 11/03/65 Assistant Treasurer since 2003 | Director, Deutsche Asset Management. | |
Lucinda Stebbins5 11/19/45 Assistant Treasurer since 2003 | Director, Deutsche Asset Management. | |
Kathleen Sullivan D’Eramo5 1/25/57 Assistant Treasurer since 2003 | Director, Deutsche Asset Management. | |
| (1) | Unless otherwise indicated, the mailing address of each Trustee and Officer with respect to fund operations is one South Street, Baltimore, MD 21202. |
| (2) | Length of time served represents the date that each Trustee or Officer first began serving in that position with the Trust of which these funds are a series. |
| (3) | A publicly held company with securities registered pursuant to Section 12 of the Securities Exchange Act of 1934. |
| (4) | Mr. Hale is a Trustee who is an “interested person” within the meaning of Section 2(a)(19) of the 1940 Act. Mr. Hale is Vice President of the Advisor and a Managing Director of Deutsche Asset Management, the US asset management unit of Deutsche Bank and its affiliates. |
| (5) | Address: Two International Place, Boston, MA 02110. |
Each officer of the Funds also holds similar positions for other investment companies for which DeAM, Inc. or an affiliate serves as the Advisor.
Trustee Ownership in the Funds1
Trustee | Dollar Range of Beneficial Ownership in the Funds | Aggregate Dollar Range of Ownership as of December 31, 2003 in all Funds Overseen by Trustee in the Fund Complex2 | ||
Independent Trustees | ||||
Richard R. Burt | $0 | Over $100,000 | ||
S. Leland Dill | $0 | Over $100,000 | ||
Martin J. Gruber | $0 | Over $100,000 | ||
Joseph R. Hardiman | $1-$10,000 | Over 100,000 | ||
Richard J. Herring | $0 | $50,001-$100,000 | ||
Graham E. Jones | $0 | Over $100,000 | ||
Rebecca W. Rimel | $0 | Over $100,000 | ||
Philip Saunders, Jr. | $50,001-$100,000 Small Cap Fund | Over $100,000 | ||
William N. Searcy | $0 | Over $100,000 | ||
Robert H. Wadsworth | $10,001-$50,000 | Over $100,000 | ||
Interested Trustee | ||||
Richard T. Hale | $0 | Over $100,000 | ||
| (1) | The amount shown includes share equivalents of funds which the board member is deemed to be invested pursuant to the Fund’s deferred compensation plan. The inclusion therein of any shares deemed beneficially owned does not constitute an admission of beneficial ownership of the shares. |
- 57 -
Table of Contents
| (2) | Securities beneficially owned as defined under the 1934 Act include direct and/or indirect ownership of securities where the trustee’s economic interest is tied to the securities, employment ownership and securities when the trustee can exert voting power and when the trustee has authority to sell the securities. The dollar ranges are: None, $1-$10,000, $10,001-$50,000, $50,001-$100,000, over $100,000. |
Ownership in Securities of the Advisors and Related Companies
As reported to the Fund, the information in the following table reflects ownership by the Independent Directors and their immediate family members of certain securities as of December 31, 2003. An immediate family member can be a spouse, children residing in the same household including step and adoptive children and any dependents. The securities represent ownership in an investment advisor or principal underwriter of the Fund and any persons (other than a registered investment company) directly or indirectly controlling, controlled by, or under common control with an investment advisor or principal underwriter of the Fund (including Deutsche Bank AG).
Independent Trustee | Owner and Relationship to Trustee | Company | Title of Class | Value of Securities on an Aggregate Basis | Percent of Class on an Aggregate Basis | |||||
Richard R. Burt | — | None | — | — | — | |||||
S. Leland Dill | — | None | — | — | — | |||||
Martin J. Gruber | — | None | — | — | — | |||||
Joseph R. Hardiman | — | None | — | — | — | |||||
Richard J. Herring | — | None | — | — | — | |||||
Graham E. Jones | — | None | — | — | — | |||||
Rebecca W. Rimel | — | None | — | — | — | |||||
Philip Saunders, Jr. | — | None | — | — | — | |||||
William N. Searcy | — | None | — | — | — | |||||
Robert H. Wadsworth | — | None | — | — | — |
DeAM, Inc. reimbursed the Funds and Portfolios for a portion of their Trustees’ fees for the period above. See “Investment Advisor” and “Administrator” below.
As of January , 2004, the Trustees and Officers of the Trust and the Funds owned in the aggregate less than 1% of the shares of any Fund or the Trust (all series taken together).
As of December 31, 2003, the following shareholders owned of record 5% or more of the outstanding shares of a class of a Fund. Each such shareholder may be deemed to be the beneficial owner of such shares.
- 58 -
Table of Contents
Fund/Class | Name Of Shareholder | Number of Shares Held | Percentage of Outstanding Shares of Class | |||
Mid Cap Fund
Class A | The Manufacturers Life Insurance Company (USA) 250 Bloor St East 7th Floor Toronto, Ontario Canada M4w1e5 | 16,025,817 | 82% | |||
Mid Cap Fund
Institutional Class | Scudder Trust Company Ttee FBO DB Matched Savings Plan Attn Asset Recon Dept # 063115 PO Box 1757 Salem, NH 03079-1143 | 11,300,980 | 40% | |||
Mid Cap Fund
Institutional Class | Northern Trust Co Ttee FBO Nortel Networks Long Term Investment Plan-Dv PO Box 92994 Chicago, IL 60675-2994 | 11,705,709 | 41% | |||
Mid Cap Fund
Institutional Class | State Street Corporation As Trustee For 34 Exchange Pl # 3064 Jersey City, NJ 07302-3885 | 4,676,847 | 16% | |||
Mid Cap Fund
Investment Class | Scudder Trust Co FBO Flying J Inc 401k Pl #062893 Attn: Asset Recon P.O. Box 1757 Salem, NH 03079-1143 | 237,273 | 7% | |||
- 59 -
Table of Contents
Mid Cap Fund Investment Class | Scudder Trust Company FBO Photronics P/S & Sav Plan Attn Asset Recon Dept #062147 PO Box 1757 Salem, NH 03079-1143 | 252,339 | 7% | |||
Mid Cap Fund
Class R | Deutsche Investment Management Americas Inc Attn Enrique Cuesta 345 Park Ave Fl 26 New York, NY 10154-0004 | 928 | 12% | |||
Mid Cap Fund
Class R | Marion Donnelly Cust FBO Fehr & Peers Assoc Inc 401k Psp 3685 Mt Diablo Blvd Ste 301 Lafayette, CA 94549-3763 | 5,298 | 68% | |||
Mid Cap Fund
Class R | Ginnisnet Enterprises Llc 401k Dennis Wulff Ttee FBO Dennis Wulff 13 Riverstone Dr Hiram, GA 30141-4569 | 1,191 | 15% | |||
Small Cap Fund
Class A | Scudder Trust Co FBO Davita Inc Retirement Svgs Pl #063014 Attn Asset Recon PO Box 1757 Salem, NH 03079-1143 | 202,823 | 14% | |||
- 60 -
Table of Contents
Small Cap Fund
Class A | Jennifer Ferrari Ttee State Street Bank And Trust FBO ADP 401k Daily Valuation Prod A 4 Becker Farm Rd # 580 Roseland, NJ 07068-1739 | 88,468 | 6% | |||
Small Cap Fund
Class A | State Street Bank & Trust Co Ttee FBO Robert W Baird & Co Inc 805 Pennsylvania Ave Kansas City, MO 64105-1307 | 94,412 | 7% | |||
Small Cap Fund
Investment Class | Charles Schwab & Co Omnibus Account Reinvest Attn: Mutual Fund Acct Mgmt Team 101 Montgomery Street 333-8 San Francisco, CA 94104 | 1,551,796 | 10% | |||
Small Cap Fund
Investment Class | Scudder Trust Company Ttee FBO DB Matched Savings Plan Attn Asset Recon Dept # 063115 PO Box 1757 Salem, NH 03079-1143 | 4,448,449 | 30% | |||
Small Cap Fund
Investment Class | Scudder Trust Company FBO Farmers Group Inc Employees Profit Sharing Savings Plan Attn Asset Recon Dept # 062733 PO Box 1757 Salem, NH 03079-1143 | 828,950 | 6% | |||
- 61 -
Table of Contents
Small Cap Fund
Investment Class | State Street Corp As Ttee For Westinghouse Savannah River/Bechtel Savannah River Inc Savings And Investment Plan 34 Exchange Pl # 3064 Jersey City, NJ 07302-3885 | 24% | ||||
Small Cap Fund
Class R | Scudder Trust Company FBO Applied Energy Solutions LLC 401(K) Plan Attn Asset Recon Dept # 063163 Po Box 1757 Salem, NH 03079-1143 | 11,629 | 81% | |||
Information Concerning Committees and Meetings of Trustees
The Board of Trustees of the Trust met 5 times during the calendar year ended December 31, 2002 and each Trustee attended at least 75% of the meetings of the Boards and meetings of the committees of the Boards of Trustees on which such Trustee served.
Board Committee. The Trust’s Board currently has the following committee:
Audit and Compliance Committee. The Audit and Compliance Committee selects the independent auditors for the Fund, confers with the independent auditors regarding the Fund’s financial statements, the results of audits and related matters, and performs such other tasks as it deems necessary or appropriate. The Audit and Compliance Committee approves all significant services proposed to be performed by the independent auditors and considers the possible effect to such services on their independence. The members of the Audit Compliance Committee are S. Leland Dill (Chairman) and all of the Non-Interested Trustees. The Audit and Compliance Committee met seven times during the calendar year ended December 31, 2003.
Nominating and Governance Committee. The primary responsibilities of the Nominating and Governance Committee, consisting of all the Independent Trustees, are to make recommendations of the Board on issues related to the composition and operation of the Board, and communicate with management on those issues. The Nominating and Governance Committee also evaluates and nominates Board member candidates. The Nominating and Governance Committee, which meets as often as deemed appropriate by the Committee, met once during the last calendar year.
Valuation Committee. The Valuation Committee is authorized to act for the Board of Trustees in connection with the valuation of securities held by the Fund in accordance with the Fund’s Valuation Procedures. Messrs. Hale, Saunders and Wadsworth are members of the Committee with Messrs. Burt, Dill, Gruber, Hardiman, Herring, Jones, Searcy and Ms. Rimel as alternates. Two Trustees are required to constitute a quorum for meetings of the Valuation Committee. The Valuation Committee met four times during the most recent calendar year.
Additional Committees. On February 25, 2003, the Board of Trustees organized a Fixed Income, Equity and Operations Committees. The members of the Fixed Income Committee are Messrs. Jones and Searcy and Ms. Rimel. The members of the Equity Committee are Messrs. Burt, Gruber, Hardiman and Herring. The member of the Operations Committee are Messrs. Dill. Saunders and Wadsworth. The Fixed Income, Equity and Operations Committee are Messrs. Dill, Saunders and Wadsworth. The Fixed Income, Equity and Operation Committees periodically review the investment performance and operations of the Fund. The Fixed Income Committee met five times, the Equity Committee met five times and the Operations Committee met eight times during the most recent calender year.
- 62 -
Table of Contents
Governance Committee, which meets as often as deemed appropriate by the Committee, met during the last fiscal year.
Valuation Committee. The Valuation Committee is authorized to act for the Board of Trustees in connection with the valuation of securities held by the Fund in accordance with the Fund’s Valuation Procedures. Messrs. Hale, Saunders and Wadsworth are members of the Committee with Messrs. Burt, Dill, Gruber, Hardiman, Herring, Jones, Searcy and Ms. Rimel as alternates. Two Trustees are required to constitute a quorum for meetings of the Valuation Committee. The Valuation Committee met times during the most recent fiscal year.
Additional Committees. On February 25, 2003, the Board of Trustees organized a Fixed Income, Equity and Operations Committees. The members of the Fixed Income Committee are Messrs. Jones and Searcy and Ms. Rimel. The members of the Equity Committee are Messrs. Burt, Gruber, Hardiman and Herring. The members of the Operations Committee are Messrs. Dill, Saunders and Wadsworth. The Fixed Income, Equity and Operations Committees periodically review the investment performance and operations of the Fund.
Remuneration. Officers of the Funds receive no direct remuneration from the Funds. Officers and Trustees of the Funds who are officers or trustees of Deutsche Asset Management or the Advisor may be considered to have received remuneration indirectly. As compensation for his or her services, each Trustee who is not an “interested person” of the Funds (as defined in the Investment Company Act) (an “Independent Trustee”) receives an aggregate annual fee, plus a fee for each meeting attended (plus reimbursement for reasonable out-of-pocket expenses incurred in connection with his or her attendance at board and committee meetings) from each fund in the Fund Complex for which he or she serves. In addition, the Chairmen of the Fund Complex’s Audit Committee and Executive Committee receive an annual fee for their services. Payment of such fees and expenses is allocated among all such funds described above in direct proportion to their relative net assets.
Members of the Board of Trustees who are employees of the Advisor or its affiliates receive no direct compensation from either Fund, although they are compensated as employees of the Advisor, or its affiliates, and as a result may be deemed to participate in fees paid by either Fund. The following table shows compensation received by each Trustee from the Fund and aggregate compensation from the Fund Complex during the calendar year ended December 31, 2003.
Name of Trustee | Compensation Mid Cap | Pension or Retirement Benefits Accrued as Part of Fund Expenses | Total Compensation Paid to Trustees from the Fund and the Fund Complex2 | |||
Richard R. Burt4 | $0 | |||||
S. Leland Dill | $0 | |||||
Martin J. Gruber | $0 | |||||
Richard T. Hale | $0 | |||||
Joseph R. Hardiman4 | $0 | |||||
Richard J. Herring | $0 | |||||
Graham E. Jones | $0 | |||||
Rebecca W. Rimel3 | $0 | |||||
Philip Saunders, Jr.3 | $0 | |||||
William N. Searcyl | $0 | |||||
Robert H. Wadsworth3 | $0 |
- 63 -
Table of Contents
DeAM, Inc., 345 Park Avenue, New York, New York 10154, is the Funds’ investment advisor. Under the Investment Advisory Agreement, the Trust on behalf of each Fund is obligated to pay the Advisor a monthly fee at an annual rate of 0.65% of each Fund’s average daily net assets.
DeAM, Inc. is a wholly owned subsidiary of Deutsche Bank AG. Deutsche Bank AG is a banking company with limited liability organized under the laws of the Federal Republic of Germany. Deutsche Bank AG is the parent company of a group consisting of banks, capital markets companies, fund management companies, mortgage banks, a property finance company,
- 64 -
Table of Contents
installments financing and leasing companies, insurance companies, research and consultancy companies and other domestic and foreign companies.
Affiliates of DeAM, Inc., may have deposit, loan and other commercial banking relationships with the issuers of obligations which may be purchased on behalf of the Funds, including outstanding loans to such issuers which could be repaid in whole or in part with the proceeds of securities so purchased. Such affiliates deal, trade and invest for their own accounts in such obligations and are among the leading dealers of various types of such obligations. DeAM, Inc. has informed the Funds that, in making its investment decisions, it does not obtain or use material inside information in its possession or in the possession of any of its affiliates. In making investment recommendations for the Funds, DeAM, Inc. will not inquire or take into consideration whether an issuer of securities proposed for purchase or sale by the Funds is a customer of DeAM, Inc, its parent or its subsidiaries or affiliates. Also, in dealing with its customers, DeAM, Inc, its parent, subsidiaries, and affiliates will not inquire or take into consideration whether securities of such customers are held by any fund managed by DeAM, Inc. or any such affiliate.
For the fiscal years ended September 30, 2003, 2002 and 2001, the Advisor accrued $2,547,503, $1,711,513 and $1,863,032, respectively, in compensation for investment advisory services provided to Mid Cap Fund. During the same periods, the Advisor reimbursed $321,036, $375,474 and $252,865, respectively to the Fund to cover expenses.
For the fiscal year ended September 30, 2001, the Advisor accrued $2,216,885 in compensation for investment advisory services provided to Capital Appreciation Portfolio. During the same periods, the Advisor reimbursed $520,549 to the Portfolio to cover expenses.
For the fiscal years ended September 30, 2003 and 2002, the Advisor accrued $1,338,854 and $1,705,414 in compensation for investment advisory services provided for Small Cap Fund. During the same periods, the Advisor reimbursed $290,635 and $388,089, respectively, to the Fund to cover expenses.
For the fiscal year ended September 30, 2001 the Advisor accrued $1,803,294 in compensation for investment advisory services provided to Small Cap Portfolio. During the same period, the Advisor reimbursed $453,459 to the Portfolio to cover expenses.
The Investment Advisory Agreement with respect to each Fund has an initial term of two years and continues in effect from year to year thereafter if such continuance is specifically approved at least annually by the Funds’ Board of Trustees or by a majority of the outstanding voting securities of such Fund, and in either event, by a majority of the Independent Trustees of the Funds’ Board who have no direct or indirect financial interest in such agreements, with such Independent Trustees casting votes in person at a meeting called for such purpose. In approving each Fund’s Investment Advisory Agreement, the Board, including the Independent Trustees, carefully considered (1) the nature and quality of services to be provided to each Fund; (2) the Advisor’s compensation and profitability for providing such services; (3) the indirect costs and benefits of providing the advisory services; (4) the extent to which economies of scale are shared among the Funds through breakpoints or otherwise; and (5) comparative information on fees and
- 65 -
Table of Contents
expenses of similar mutual funds. Specifically, the Board considered the fact that the Advisor benefited, at least indirectly, from certain securities lending, custody and brokerage relationships between the Fund and affiliates of the Advisor (and that the Board received information regularly about these relationships). The Board also considered the nature and extent of benefits that the Advisor received from (i) arrangements to sweep each Fund’s excess cash at the end of the day into an affiliated money market fund and (ii) the brokerage and research services it received from broker-dealers who executed portfolio transactions for the Fund. After requesting and reviewing such information, as they deemed necessary, the Board concluded that the approval of the Investment Advisory Agreement was in the best interests of the Fund and its shareholders. Each Fund or the Advisor may terminate the Investment Advisory Agreement on sixty days’ written notice without penalty. The Investment Advisory Agreement will terminate automatically in the event of assignment (as defined in the 1940 Act).
Portfolio Management
The Fund is managed by a team of investment professionals who each play an important role in the Fund’s management process. Team members work together to develop investment strategies and select securities for the Fund’s portfolio. This team works for the Advisor or its affiliates and is supported by a large staff of economists, research analysts, traders and other investment specialists. The Advisors believe its team approach benefits Fund investors by bringing together many disciplines and leveraging its extensive resources. Team members with primary responsibility for management of the Fund, as well as team members who have other ongoing management responsibilities for the Fund, are identified in the Fund’s prospectus, as of the date of the Fund’s prospectus. Composition of the team may change over time, and Fund shareholders and investors will be notified of changes affecting individuals with primary Fund management responsibility.
Under an administration agreement dated July 1, 2001, Investment Company Capital Corporation (“ICCC” or “the Administrator”) calculates the net asset value of the Funds, calculates the value of the assets of the Funds, and generally assists the Board of Trustees of the Trust in all aspects of the administration and operation of the Trust. The Administration Agreement provides for the Trust to pay ICCC a fee, accrued daily and paid monthly, equal on an annual basis to 0.65% of the average daily net assets of each Fund’s Investment Class and 0.40% of the average daily net assets of Mid Cap Fund’s Institutional Class and each Fund’s Class A, B, and R shares.
Under the Administration Agreement, the Administrator may delegate one or more of its responsibilities to others at the Administrator’s expense.
Under the administration agreement, the administrator is obligated on a continuous basis to provide such administrative services as the Board of Trustees of the Trust and each Fund reasonably deem necessary for the proper administration of the Trust or a Fund. The administrator will generally assist in all aspects of the Fund’s operations; supply and maintain office facilities (which may be in ICCC’s own offices), statistical and research data, data processing services, clerical, accounting, bookkeeping and recordkeeping services (including
- 66 -
Table of Contents
without limitation the maintenance of such books and records as are required under the 1940 Act and the rules thereunder, except as maintained by other agents), executive and administrative services, and stationery and office supplies; prepare reports to shareholders or investors; prepare and file tax returns; supply financial information and supporting data for reports to and filings with the SEC and various state Blue Sky authorities; supply supporting documentation for meetings of the Board of Trustees; provide monitoring reports and assistance regarding compliance with Declarations of Trust, by-laws, investment objectives and policies and with Federal and state securities laws; arrange for appropriate insurance coverage; calculate net asset values, net income and realized capital gains or losses; and negotiate arrangements with, and supervise and coordinate the activities of, agents and others to supply services. The following fees were paid for the fiscal year ended September 30, 2003:
Mid Cap Fund | Administrator Service Fee | ||
Class A | $ | 526,014 | |
Class B | $ | 1,555 | |
Class C | $ | 7,395 | |
Investment Class | $ | 206,613 | |
Institutional Class | $ | 909,522 | |
Class R* | $ | 11 | |
| * | for the period from July 1, 2003 (commencement of sales of Class A shares) to September 30, 2003 |
Small Cap Fund | Administrator Service Fee | ||
Class A | $ | 50,534 | |
Class B | $ | 4,855 | |
Class C | $ | 4,025 | |
Investment Class | $ | 1,561,958 | |
No Class R shares of Small Cap Fund were issued during the fiscal year ended September 30, 2003.
For the fiscal years ended September 30, 2002 and 2001, the administrator accrued $ and $1,527,506, respectively, in compensation for administrative and other services provided to the Mid Cap Fund. During the same periods, the administrator reimbursed $ and $117,302, respectively, to cover expenses. For the fiscal year ended September 30, 2002, the administrator received $348,234 in compensation for administrative and other services provided to Capital Appreciation Portfolio.
For the fiscal years ended September 30, 2002 and 2001, the administrator accrued $ and $1,803,294, respectively, in compensation for administrative and other services provided to the Small Cap Fund. During the same periods, the administrator reimbursed $ and $453,459, respectively, to cover expenses. For the 2002 fiscal year, the administrator received $281,662, in compensation for administrative and other services provided to Small Cap Portfolio.
- 67 -
Table of Contents
State Street Bank and Trust Company, 225 Franklin Street, Boston, Massachusetts 02110, serves as Custodian for the Trust and the Funds pursuant to a Custodian Agreement. As Custodian, it holds the Funds’ assets. Prior to April 25, 2003, Deutsche Bank Trust Company Americas served as the Funds’ Custodian.
Scudder Investments Service Company (“SISC”) serves as transfer agent of the Trust and of the Funds pursuant to a transfer agency agreement. Under its transfer agency agreement with the Trust, SISC maintains the shareholder account records for the Funds, handles certain communications between shareholders and the Trust and causes to be distributed any dividends and distributions payable by the Trust. SISC may be reimbursed by the Funds for its out-of-pocket expenses. Prior to December 16, 2002, ICCC acted as the Funds’ transfer and dividend disbursing agent. SISC provides the same services that ICCC provided to the Fund and is entitled to receive the same rate of compensation.
Pursuant to a sub-transfer agency agreement between SISC and DST Systems, Inc. (“DST”), SISC has delegated certain transfer agent and dividend paying agent functions to DST. The costs and expenses of such delegation are borne by SISC, not by the Funds.
Scudder Distributors, Inc. (“SDI”) is the principal distributor for shares of the Funds. SDI is a registered broker-dealer and is affiliated with DeAM, Inc. The principal business address of SDI is 222 South Riverside Plaza, Chicago, IL 60606.
Class A, B, C and R Shares Only. In addition, with respect to Class A, B, C and R Shares of the Funds, these classes may enter into Shareholder Servicing Agreements with certain financial institutions to act as Shareholder Servicing Agents, pursuant to which the Distributor will allocate a portion of its distribution fee as compensation for such financial institutions’ ongoing shareholder services. The Funds may also enter into Shareholder Servicing Agreements pursuant to which the Advisor or its affiliates will provide compensation out of its own resources for ongoing shareholder services. Currently, banking laws and regulations do not prohibit a financial holding company affiliate from acting as distributor or Shareholder Servicing Agent or in other capacities for investment companies. Should future legislative, judicial or administrative action prohibit or restrict the activities of the Shareholder Servicing Agents in connection with the Shareholder Servicing Agreements, the Trust may be required to alter materially or discontinue its arrangements with the Shareholder Servicing Agents. Such financial institutions may impose separate fees in connection with these services and investors should review the Prospectuses and this Statement of Additional Information in conjunction with any such institution’s fee schedule.
- 68 -
Table of Contents
For the year ended September 30, 2003, the Shareholder Servicing Fee was as follows:
Mid Cap Fund
Shareholder Servicing Fee | Total | Effective Rate | ||||
Class B | $ | 7,222 | 0.25 | % | ||
Class C | $ | 4,622,429 | 0.25 | % | ||
Class R | $ | 6 | 0.25 | % | ||
| Small Cap Fund | ||||||
Class B | $ | 3,035 | 0.25 | % | ||
Class C | 2,515 | 0.25 | % | |||
As compensation for providing distribution and shareholder services as described above for the Class A Shares, the Distributor receives an annual fee, paid monthly, equal to 0.25% of the average daily net assets of the Class A Shares. With respect to the Class A Shares, the Distributor expects to allocate up to all of its fee to Participating Dealers and Shareholder Servicing Agents. As compensation for providing distribution and shareholder services as described above for the Class B and C Shares, the Distributor receives an annual fee, paid monthly, equal to 0.75% of their respective average daily net. In addition, with respect to the Class B and C Shares, the Distributor receives a shareholder servicing fee at an annual rate of 0.25% of their respective average daily net assets. As compensation for providing distribution and shareholder services as described above for Class R Shares, the Distributor receives an annual fee, paid monthly, equal to 0.50% of the average daily net assets of the Class R Shares. (See the Prospectus.)
For the year ended September 30, 2003, the Distribution Fee was as follows:
Mid Cap Fund
Class A | $ | 328,755 | |
Class B | 21,667 | ||
Class C | 13,866 | ||
Class R | 6 |
Small Cap Fund
Class A | $ | 31,465 | |
Class B | 9,104 | ||
Class C | 7,546 |
Pursuant to Rule 12b-1 under the 1940 Act, investment companies may pay distribution expenses, directly or indirectly, only pursuant to a plan adopted by the investment company’s board of directors and approved by their shareholders. The Funds have adopted plans of distribution for their Class A, B, C and R Shares (the “Plans”). Under each plan, the Funds pay a fee to the Distributor for distribution and other shareholder servicing assistance as set forth in the Distribution Agreement, and the Distributor is authorized to make payments out of its fee to Participating Dealers and Shareholder Servicing Agents. The Plans will remain in effect from year to year as specifically approved (a) at least annually by the Board of Trustees and (b) by the
- 69 -
Table of Contents
affirmative vote of a majority of the Independent Trustees, by votes cast in person at a meeting called for such purpose.
In approving the Plans, the Trustees concluded, in the exercise of reasonable business judgment, that there was a reasonable likelihood that the Plans would benefit the Funds and their shareholders. The Plans will be renewed only if the Trustees make a similar determination in each subsequent year. The Plans may not be amended to increase materially the fee to be paid pursuant to the Distribution Agreement without the approval of the shareholders of the Mid Cap and Small Cap Funds. The Plans may be terminated at any time by the vote of a majority of the Independent Trustees or by a vote of a majority of the respective Funds’ outstanding shares.
During the continuance of the Plans, the Trustees will be provided for their review, at least quarterly, a written report concerning the payments made under the Plans to the Distributor pursuant to the Distribution Agreement and to Participating Dealers pursuant to any Sub-Distribution Agreements. Such reports shall be made by the persons authorized to make such payments. In addition, during the continuance of the Plans, the selection and nomination of the Independent Trustees will be committed to the discretion of the Independent Trustees then in office.
Under the Plans, amounts allocated to Participating Dealers and Shareholder Servicing Agents may not exceed amounts payable to the Distributor under the Plans. Payments under the Plans are made as described above regardless of the Distributor’s actual cost of providing distribution services and may be used to pay the Distributor’s overhead expenses. If the cost of providing distribution services to the Class A or Class R Shares is less than 0.25% of the classes’ average daily net assets for any period or if the cost of providing distribution services to the Class B and C Shares is less than 0.75% of the Classes’ respective average daily net assets for any period, the unexpended portion of the distribution fees may be retained by the Distributor. The Plans do not provide for any charges to the Funds for excess amounts expended by the Distributor and, if any of the Plans is terminated in accordance with its terms, the obligation of the Funds to make payments to the Distributor pursuant to such Plan will cease and the Funds will not be required to make any payments past the date the Distribution Agreement terminates with respect to that Class. In return for payments received pursuant to the Plans, the Distributor pays the distribution-related expenses of the Funds including one or more of the following: advertising expenses; printing and mailing of prospectuses to other than current shareholders; compensation to dealers and sales personnel; and interest, carrying or other financing charges.
The Distributor received commissions on the sale of the Mid Cap Fund’s Class A and Class C Shares and contingent deferred sales charges on the Fund’s Class A, Class B and Class C Shares and retained from such commissions and sales charges the following amounts:
For Fiscal Year Ended September 30, 2003 | ||||||
| Received | Retained | |||||
Class A Commission | $ | 15,448 | $ | |||
Class C Commission | $ | 54 | ||||
Class A Contingent Deferred Sales Charge | $ | 0 | N/A | |||
Class B Contingent Deferred Sales Charge | $ | 4,297 | $ | 4,297 | ||
Class C Contingent Deferred Sales Charge | $ | 358 | $ | 358 | ||
The Distributor received commissions on the sale of the Small Cap Fund’s Class A and Class C Shares and contingent deferred sales charges on the Fund’s Class A, Class B and Class C Shares and retained from such commissions and sales charges the following amounts:
For Fiscal Year Ended September 30, 2003 | ||||||
Class A Commission | $ | 7,697 | $ | 7 | ||
Class C Commission | $ | 3 | ||||
Class A Contingent Deferred Sales Charge | $ | 0 | N/A | |||
Class B Contingent Deferred Sales Charge | $ | 764 | $ | 764 | ||
Class C Contingent Deferred Sales Charge | $ | 226 | $ | 226 | ||
- 70 -
Table of Contents
SISC acts as a Service Agent pursuant to its agreement with the Trust and receives no additional compensation from the Funds for such shareholder services. The service fees of any other Service Agents, including broker-dealers, will be paid by SISC from its fees. The services provided by a Service Agent may include establishing and maintaining shareholder accounts, processing purchase and redemption transactions, arranging for bank wires, performing shareholder sub-accounting, answering client inquiries regarding the Trust, assisting clients in
- 71 -
Table of Contents
changing dividend options, account designations and addresses, providing periodic statements showing the client’s account balance, transmitting proxy statements, periodic reports, updated prospectuses and other communications to shareholders and, with respect to meetings of shareholders, collecting, tabulating and forwarding to the Trust executed proxies and obtaining such other information and performing such other services as the Transfer Agent or the Service Agent’s clients may reasonably request and agree upon with the Service Agent. Service Agents may separately charge their clients additional fees only to cover provision of additional or more comprehensive services not already provided under the agreement with the SISvC, or of the type or scope not generally offered by a mutual fund, such as cash management services or enhanced retirement or trust reporting. In addition, investors may be charged a transaction fee if they effect transactions in Fund shares through a Service Agent. Each Service Agent has agreed to transmit to shareholders, who are its customers, appropriate disclosures of any fees that it may charge them directly.
Counsel and Independent Accountants
Willkie Farr & Gallagher LLP, 787 Seventh Avenue, New York, NY 10019, serves as Counsel to the Trust and each Fund. PricewaterhouseCoopers LLP, 160 Federal Street, Boston, MA 02110 acts as Independent Accountants of the Trust and each Fund.
- 72 -
Table of Contents
The Trust was organized on July 21, 1986 under the laws of the Commonwealth of Massachusetts. Each Fund is a mutual fund: an investment that pools shareholders’ money and invests it toward a specified goal. The Trust offers shares of beneficial interest of separate series, par value $0.001 per share. The shares of the other series of the Trust are offered through separate prospectuses and SAIs. No series of shares has any preference over any other series. The Trust reserves the right to add additional series in the future. The Trust also reserves the right to issue more than one class of shares of each Fund.
When matters are submitted for shareholder vote, shareholders of each Fund will have one vote for each full share held and proportionate, fractional votes for fractional shares held. A separate vote of each Fund is required on any matter affecting the Fund on which shareholders are entitled to vote. Shareholders of each Fund are not entitled to vote on Trust matters that do not affect the Fund. All series of the Trust will vote together on certain matters, such as electing Trustees. There normally will be no meetings of shareholders for the purpose of electing Trustees unless and until such time as less than a majority of Trustees holding office have been elected by shareholders, at which time the Trustees then in office, will call a shareholders’ meeting for the election of Trustees. Any Trustee may be removed from office upon the vote of shareholders holding at least two-thirds of the Trust’s outstanding shares at a meeting called for that purpose. The Trustees are required to call such a meeting upon the written request of shareholders holding at least 10% of the Trust’s outstanding shares. The Trust will also assist shareholders in communicating with one another as provided for in the 1940 Act.
Each series in the Trust will not be involved in any vote involving a Fund in which it does not invest its assets. Shareholders of all of the series of the Trust will, however, vote together to elect Trustees of the Trust and for certain other matters. Under certain circumstances, the shareholders of one or more series could control the outcome of these votes.
Shares of the Trust do not have cumulative voting rights, which means that holders of more than 50% of the shares voting for the election of Trustees can elect all Trustees. Shares are transferable but have no preemptive, conversion or subscription rights.
Shareholders generally vote by Fund, except with respect to the election of Trustees.
Massachusetts law provides that shareholders could under certain circumstances be held personally liable for the obligations of the Trust. However, the Trust’s Declaration of Trust disclaims shareholder liability for acts or obligations of the Trust and requires that notice of this disclaimer be given in each agreement, obligation or instrument entered into or executed by the Trust or a Trustee. The Declaration of Trust provides for indemnification from the Trust’s property for all losses and expenses of any shareholder held personally liable for the obligations of the Trust. Thus, the risk of a shareholder’s incurring financial loss on account of shareholder liability is limited to circumstances in which the Trust itself would be unable to meet its obligations, a possibility that the Trust believes is remote. Upon payment of any liability incurred by the Trust, the shareholder paying the liability will be entitled to reimbursement from the general assets of the Trust. The Trustees intend to conduct the operations of the Trust in a
- 73 -
Table of Contents
manner so as to avoid, as far as possible, ultimate liability of the shareholders for liabilities of the Trust.
The Trust was organized under the name BT Investment Funds and assumed its current name of Scudder Advisor Funds on May 19, 2003.
Each Fund has delegated proxy voting responsibilities to its investment advisor, subject to the Board’s general oversight. The Fund has delegated proxy voting to the Advisor with the direction that proxies should be voted consistent with the Fund’s best economic interests. The Advisor has adopted its own Proxy Voting Policies and Procedures (“Policies”), and Proxy Voting Guidelines (“Guidelines”) for this purpose. The Policies address, among other things, conflicts of interest that may arise between the interests of the Fund, and the interests of the Advisor and its affiliates, including the Fund’s principal underwriter. Guidelines set forth the Advisor’s general position on various proposals, such as:
| • | Shareholder Rights — The Advisor generally votes against proposals that restrict shareholder rights. |
| • | Corporate Governance — The advisor generally votes for confidential and cumulative voting and against supermajority voting requirements for charter and bylaw amendments. |
| • | Anti-Takeover Matters — The Advisor generally votes for proposals that require shareholder ratification of poison pills or that request boards to redeem poison pills, and votes “against” the adoption of poison pills if they are submitted for shareholder ratification. The Advisor generally votes for fair price proposals. |
| • | Compensation Matters — The Advisor generally votes for executive cash compensation proposals, unless they are unreasonably excessive. The Advisor generally votes against stock option plans that do not meet the Advisor’s criteria. |
| • | Routine Matters — The Advisor generally votes for the ratification of auditors, procedural matters related to the annual meeting, and changes in company name, and against bundled proposals and adjournment. |
The general provisions described above do not apply to investment companies. The Advisor generally votes proxies solicited by investment companies in accordance with the recommendations of an independent third-party, except for proxies solicited by or with respect to investment companies for which the Advisor or an affiliate serves as investment advisor or principal underwriter (“affiliated investment companies”). The Advisor votes affiliated investment company proxies in the same proportion as the vote of the investment company’s other shareholders (sometimes called “mirror” or “echo” voting). Master fund proxies solicited from feeder funds are voted in accordance with applicable requirements of the Investment Company Act of 1940.
- 74 -
Table of Contents
Although the Guidelines set forth the Advisor’s general voting positions on various proposals, the Advisor may, consistent with the Fund’s best interests, determine under some circumstances to vote contrary to those positions.
The Guidelines on a particular issue may or may not reflect the view of individual members of the Board, or of a majority of the Board. In addition, the Guidelines may reflect a voting position that differs from the actual practices of the public companies within the Deutsche Bank organization or of the investment companies for which the Advisor or an affiliate serves as investment advisor or sponsor.
The Advisor may consider the views of a portfolio company’s management in deciding how to vote a proxy or in establishing general voting positions for the Guidelines, but management’s views are not determinative.
As mentioned above, the Policies describe the way in which the Advisor resolves conflicts of interest. To resolve conflicts, the advisor, under normal circumstances, votes proxies in accordance with its Guidelines. If the Advisor departs from the Guidelines with respect to a particular proxy or if the Guidelines do not specifically address a certain proxy proposal, a proxy voting committee established by the advisor will vote the proxy. Before voting any such proxy, however, the advisor’s conflicts review committee will conduct an investigation to determine whether any potential conflicts of interest exist in connection with the particular proxy proposal. If the conflicts review committee determines that the advisor has a material conflict of interest, or certain individuals on the proxy voting committee should be recused from participating in a particular proxy vote, it will inform the proxy voting committee. If notified that the Advisor has a material conflict, or fewer than three voting members are eligible to participate in the proxy vote, typically the advisor will engage an independent third party to vote the proxy or follow the proxy voting recommendations of an independent third party.
Under certain circumstances, the Advisor may not be able to vote proxies or the Advisor may find that the expected economic costs from voting outweigh the benefits associated with voting. For example, the Advisor may not vote proxies on certain foreign securities due to local restrictions or customs. The Advisor generally does not vote proxies on securities subject to share blocking restrictions.
TAXES
The following is intended to be a general summary of certain federal income tax consequences of investing in a Fund. It is not intended as a complete discussion of all such consequences, nor does it purport to deal with all categories of investors. Investors are therefore advised to consult with their tax advisors before making an investment in a Fund.
Taxation of the Fund. Each Fund has elected to be treated as a regulated investment company under Subchapter M of the Code and has qualified as such since its inception. Each Fund intends to continue to so qualify in each taxable year as required under the Code in order to avoid payment of federal income tax at the Fund level. In order to qualify as a regulated investment company, a Fund must meet certain requirements regarding the source of its income, the diversification of its assets, and the distribution of its income:
| (a) | Each Fund must derive at least 90% of its gross income from dividends, interest, payments with respect to certain securities loans, and gains from the sale of stock, securities and foreign currencies, or other income (including but not limited to gains from options, futures, or forward contracts) derived with respect to its business of investing in such stock, securities, or currencies. |
- 75 -
Table of Contents
| (b) | Each Fund must diversify its holdings so that, at the end of each quarter of its taxable year, (i) at least 50% of the market value of the Fund’s assets is represented by cash and cash items, US government securities, securities of other regulated investment companies, and other securities limited in respect of any one issuer of such other securities to a value not greater than 5% of the value of the Fund’s total assets and to not more than 10% of the outstanding voting securities of such issuer, and (ii) not more than 25% of the value of its assets is invested in the securities (other than those of the US Government or other regulated investment companies) of any one issuer or of two or more issuers that the Fund controls and that are engaged in the same, similar, or related trades or businesses. |
| (c) | Each Fund is required to distribute to its shareholders at least 90% of its taxable and tax-exempt net investment income (including the excess of net short-term capital gain over net long-term capital losses) and generally is not subject to federal income tax to the extent that it distributes annually such net investment income and net realized capital gains in the manner required under the Code. |
If for any taxable year a Fund does not qualify for the special federal income tax treatment afforded regulated investment companies, all of its taxable income will be subject to federal income tax at regular corporate rates (without any deduction for distributions to its shareholders), and all distributions from earnings and profits, including any distributions of net tax-exempt income and net long-term capital gains, will be taxable to shareholders as ordinary income. Such distributions would be eligible (i) to be treated as qualified dividend income in the case of shareholders taxed as individuals and (ii) for the dividends received deduction in the case of corporate shareholders. In addition, a Fund could be required to recognize unrealized gains, pay substantial taxes and interest and make substantial distributions before requalifying as a regulated investment company that is accorded special tax treatment.
Each Fund is subject to a 4% nondeductible excise tax on amounts required to be but that are not distributed under a prescribed formula. The formula requires payment to shareholders during a calendar year of distributions representing at least 98% of a Fund’s taxable ordinary income for the calendar year and at least 98% of the excess of its capital gains over capital losses realized during the one-year period ending October 31 (in most cases) of such year as well as amounts that were neither distributed nor taxed to the Fund during the prior calendar year. Although each Fund’s distribution policies should enable it to avoid excise tax liability, a Fund may retain (and be subject to income or excise tax on) a portion of its capital gain or other income if it appears to be in the interest of the Fund.
Taxation of Fund distributions. Distributions from a Fund generally will be taxable to shareholders as ordinary income to the extent derived from investment income and net short-term capital gains. Distributions of net capital gains (that is, the excess of net gains from the sale
- 76 -
Table of Contents
of capital assets held more than one year over net losses from the sale of capital assets held for not more than one year) properly designated as capital gain dividends will be taxable to shareholders as long-term capital gain, regardless of how long a shareholder has held the shares in the Fund.
Long-term capital gain rates applicable to individuals have been temporarily reduced—in general, to 15% with lower rates applying to taxpayers in the 10% and 15% rate brackets—for taxable years beginning on or before December 31, 2008.
For taxable years beginning on or before December 31, 2008, “qualified dividend income” received by an individual will be taxed at the rates applicable to long-term capital gain. Qualified dividend income does not include interest from fixed-income securities. In order for some portion of the dividends received by a shareholder of a Fund to be qualified dividend income, the Fund must meet holding period and other requirements with respect to some portion of the dividend-paying stocks in its portfolio and the shareholder must meet holding period and other requirements with respect to the Fund’s shares. A dividend will not be treated as qualified dividend income (at either the Fund or shareholder level) (1) if the dividend is received with respect to any share of stock held for fewer than 61 days during the 120-day period beginning on the date which is 60 days before the date on which such share becomes ex-dividend with respect to such dividend (or, in the case of certain preferred stock, 91 days during the 180-day period beginning 90 days before such date), (2) to the extent that the recipient is under an obligation (whether pursuant to a short sale or otherwise) to make related payments with respect to positions in substantially similar or related property, or (3) if the recipient elects to have the dividend income treated as investment income for purposes of the limitation on deductibility of investment interest. In order for a dividend paid by a foreign corporation to constitute “qualified dividend income,” the foreign corporation must (1) be eligible for the benefits of a comprehensive income tax treaty with the United States (or the stock on which the dividend is paid must be readily tradable on an established securities market in the United States), and (2) not be treated as a foreign personal holding company, foreign investment company, or passive foreign investment company.
In general, distributions of investment income designated by a Fund as derived from qualified dividend income will be treated as qualified dividend income by a shareholder taxed as an individual, provided the shareholder meets the holding period and other requirements described above with respect to the Fund’s shares.
If the aggregate qualified dividends received by a Fund during any taxable year are 95% or more of its gross income (excluding net long-term capital gain over net short-term capital loss), then 100% of the Fund’s dividends (other than properly designated capital gain dividends) will be eligible to be treated as qualified dividend income. For this purpose, the only gain included in the term “gross income” is the excess of net short-term capital gain over net long-term capital loss.
Capital gains distributions may be reduced if a Fund has capital loss carryforwards available. Any capital loss carryforwards and any post-October loss deferrals to which a Fund is entitled are disclosed in the Fund’s annual and semi-annual reports to shareholders.
- 77 -
Table of Contents
All distributions by a Fund result in a reduction in the net asset value of the Fund’s shares. Should a distribution reduce the net asset value below a shareholder’s cost basis, such distribution would nevertheless be taxable to the shareholder as ordinary income or capital gain as described above, even though, from an investment standpoint, it may constitute a partial return of capital. In particular, investors should be careful to consider the tax implications of buying shares just prior to a distribution. The price of shares purchased at that time includes the amount of the forthcoming distribution. Those purchasing just prior to a distribution will receive a partial return of capital upon the distribution, which will nevertheless be taxable to them.
Sale or redemption of shares. The sale, exchange or redemption of shares of a Fund may give rise to a gain or loss. In general, any gain or loss realized upon a taxable disposition of shares will be treated as long-term capital gain or loss if the shares have been held for more than 12 months. Otherwise, the gain or loss on the taxable disposition of shares of a Fund will be treated as short-term capital gain or loss. However, any loss realized upon a taxable disposition of shares held for six months or less will be treated as long-term, rather than short-term, to the extent of any long-term capital gain distributions received (or deemed received) by the shareholder with respect to the shares. All or a portion of any loss realized upon a taxable disposition of shares of a Fund will be disallowed if other substantially identical shares of the Fund are purchased within 30 days before or after the disposition. In such a case, the basis of the newly purchased shares will be adjusted to reflect the disallowed loss.
Dividends received deduction. Dividends from domestic corporations may comprise a substantial part of a Fund’s gross income. If any such dividends constitute a portion of a Fund’s gross income, a portion of the income distributions of the Fund may be eligible for the 70% deduction for dividends received by corporations. Shareholders will be informed of the portion of dividends which so qualify. The dividends-received deduction is reduced to the extent the shares of the Fund with respect to which the dividends are received are treated as debt-financed under federal income tax law and is eliminated if either those shares or the shares of the Fund are deemed to have been held by the Fund or the shareholder, as the case may be, for less than 46 days during the 90-day period beginning 45 days before the shares become ex-dividend.
Foreign Taxation. Foreign withholding or other foreign taxes with respect to income (possibly including, in some cases, capital gains) on certain foreign securities may occur. These taxes may be reduced or eliminated under the terms of an applicable US income tax treaty. As it is not expected that more than 50% of the value of either Fund’s total assets will consist of securities issued by foreign corporations, the Funds will not be eligible to pass through to shareholders their proportionate share of any foreign taxes paid, with the result that shareholders will not be able to include in income, and will not be entitled to take any credits or deductions for such foreign taxes.
Passive Foreign Investment Companies. Equity investments by a Fund in certain “passive foreign investment companies” (“PFICs”) could potentially subject the Fund to a US federal income tax (including interest charges) on distributions received from the company or on proceeds received from the disposition of shares in the company, which tax cannot be eliminated by making distributions to Fund shareholders. However, a Fund may elect to avoid the imposition of that tax. For example, a Fund may elect to treat a PFIC as a “qualified electing fund” (a “QEF election”), in which case the Fund will be required to include its share of the
- 78 -
Table of Contents
company’s income and net capital gains annually, regardless of whether it receives any distribution from the company. A Fund also may make an election to mark the gains (and to a limited extent losses) in such holdings “to the market” as though it had sold and repurchased its holdings in those PFICs on the last day of the Fund’s taxable year. Such gains and losses are treated as ordinary income and loss. The QEF and mark-to-market elections may accelerate the recognition of income (without the receipt of cash) and increase the amount required to be distributed by a Fund to avoid taxation. Making either of these elections therefore may require a Fund to liquidate other investments (including when it is not advantageous to do so) to meet its distribution requirement, which also may accelerate the recognition of gain and affect the Fund’s total return. Dividends paid by PFICs will not be eligible to be treated as “qualified dividend income.”
Tax effects of certain transactions. A Fund’s use of options, futures contracts, forward contracts (to the extent permitted) and certain other strategic transactions will be subject to special tax rules (including mark-to-market, constructive sale, straddle, wash sale, short sale and other rules), the effect of which may be to accelerate income, defer losses, cause adjustments in the holding periods of portfolio securities, convert capital gains into ordinary income and convert short-term capital losses into long-term capital losses. These rules could therefore affect the amount, timing and character of distributions to investors.
Transactions in foreign currencies, foreign investment currency-denominated debt securities and certain foreign currency options, futures contracts, forward contracts and similar instruments (to the extent permitted) may give rise to ordinary income or loss to the extent such income or loss results from fluctuations in the value of the foreign currency concerned.
A Fund’s investment in zero coupon bonds and other debt obligations having original issue discount may cause the Fund to recognize taxable income in excess of any cash received from the investment.
Under current law, a Fund serves to block unrelated business taxable income (“UBTI”) from being realized by its tax-exempt shareholders. Notwithstanding the foregoing, a tax-exempt shareholder could realize UBTI by virtue of its investment in a Fund if either: (1) the Fund invests in real estate investment trusts that hold residual interests in real estate mortgage investment conduits; or (2) shares in the Fund constitute debt-financed property in the hands of the tax-exempt shareholder within the meaning of Code Section 514(b). If a charitable remainder trust (as defined in Code Section 664) realizes any UBTI for a taxable year, it will lose its tax-exempt status for the year.
Other Tax Considerations. Under the backup withholding provisions of the Code, redemption proceeds as well as distributions may be subject to federal income tax withholding for certain shareholders, including those who fail to furnish a Fund with their taxpayer identification numbers and certifications as to their tax status.
Shareholders of a Fund may be subject to state and local taxes on distributions received from the Fund and on redemptions of the Fund’s shares. Any shareholder who is not a US Person (as such term is defined in the Code) should consider the US and foreign tax consequences of ownership of shares of a Fund, including the possibility that such a shareholder may be subject to
- 79 -
Table of Contents
a flat US withholding tax rate of 30% (or a potentially lower rate under an applicable income tax treaty) on amounts constituting ordinary income received by him or her, where such amounts are treated as income from US sources under the Code.
Special tax rules apply to investments through defined contribution plans and other tax-qualified plans. Shareholders should consult their tax advisers to determine the suitability of shares of a Fund as an investment through such plans and the precise effect of an investment on their particular tax situation.
Under recently promulgated Treasury regulations, if a shareholder recognizes a loss with respect to a Fund’s shares of $2 million or more for an individual shareholder or $10 million or more for a corporate shareholder, the shareholder must file with the Internal Revenue Service a disclosure statement on Form 8886. Direct shareholders of portfolio securities are in many cases excepted from this reporting requirement, but under current guidance, shareholders of a regulated investment company are not excepted. Future guidance may extend the current exception from this reporting requirement to shareholders of most or all regulated investment companies. The fact that a loss is reportable under these regulations does not affect the legal determination of whether the taxpayer’s treatment of the loss is proper. Shareholders should consult their tax advisors to determine the applicability of these regulations in light of their individual circumstances.
Registration Statement. The Trust has filed with the SEC, a Registration Statement under the Securities Act of 1933, as amended, with respect to the securities of the Funds and certain other series of the Trust. If further information is desired with respect to the Trust, the Funds or such other series, reference is made to the Registration Statement and the exhibits filed as a part thereof.
Each Fund’s financial statements for the year ended September 30, 2003 are included in, and incorporated by reference into, this Statement of Additional Information.
A copy of the Funds’ Annual Report and Semiannual Report may be obtained without charge by contacting the Service Center at 1-800-621-1048.
- 80 -
Table of Contents
Description of Moody’s Corporate Bond Ratings:
Aaa – Bonds rated Aaa are judged to be of the best quality. They carry the smallest degree of investment risk and are generally referred to as “gilt edge.” Interest payments are protected by a large or by an exceptionally stable margin and principal is secure. While the various protective elements are likely to change, such changes as can be visualized are most unlikely to impair the fundamentally strong position of such issues.
Aa – Bonds rated Aa are judged to be of high quality by all standards. Together with the Aaa group they comprise what are generally known as high-grade bonds. They are rated lower than the best bonds because margins of protection may not be as large as in Aaa securities or fluctuation of protective elements may be of greater amplitude or there may be other elements present which make the long-term risks appear somewhat larger than in Aaa securities.
A – Bonds rated A possess many favorable investment attributes and are to be considered as upper-medium-grade obligations. Factors giving security to principal and interest are considered adequate but elements may be present which suggest a susceptibility to impairment sometime in the future.
Baa – Bonds rated Baa are considered as medium-grade obligations, i.e. they are neither highly protected nor poorly secured. Interest payments and principal security appear adequate for the present but certain protective elements may be lacking or may be characteristically unreliable over any great length of time. Such, bonds lack outstanding investment characteristics and in fact have speculative characteristics as well.
Ba – Bonds rated Ba are judged to have speculative elements. Their future cannot be considered as well assured. Often the protection of interest and principal payments may be very moderate and thereby not well safeguarded during both (good and bad times over the future). Uncertainty of position characterizes bonds in this class.
B – Bonds rated B generally lack characteristics of a desirable investment. Assurance of interest and principal payments or of maintenance of other terms of the contract over any long period of time may be small.
Caa – Bonds rated Caa are of poor standing. Such issues may be in default or there may be present elements of danger with respect to principal or interest.
Ca – Bonds rated Ca represent obligations which are speculative in a high degree. Such issues are often in default or have other marked short-comings.
C – Bonds rated C are the lowest-rated class of bonds and can be regarded as having extremely poor prospects of ever attaining any real investment standing.
Moody’s applies numerical modifiers, 1, 2, and 3, in each generic rating classification from Aa through B in its corporate bond system. The modifier 1 indicates that the security ranks in the
- 81 -
Table of Contents
higher end of its generic rating category; the modifier 2 indicates a mid-range ranking; and the modifier 3 indicates that the issue ranks in the lower end of its generic rating category.
Description of S&P Corporate Bond Ratings:
AAA – Debt rated AAA has the highest rating assigned by Standard & Poor’s to a debt obligation. Capacity to pay interest and repay principal is extremely strong.
AA – Debt rated AA has a very strong capacity to pay interest and repay principal and differs from the higher-rated issues only in small degree.
A – Debt rated A has a strong capacity to pay interest and repay principal, although it is somewhat more susceptible to the adverse effects of changes in circumstances and economic conditions.
BBB – Debt rated BBB is regarded as having an adequate capacity to pay interest and repay principal. Whereas it normally exhibits adequate protection parameters, adverse economic conditions or changing circumstances are more likely to lead to weakened capacity to pay interest and repay principal for debt in this category than in higher-rated categories.
BB – Debt rate BB has less near-term vulnerability to default than other speculative issues. However, it faces major ongoing uncertainties or exposure to adverse business, financial, or economic conditions which could lead to inadequate capacity to meet timely interest and principal payments.
B – Debt rated B has a greater vulnerability to default but currently has the capacity to meet interest payments and principal repayments. Adverse business, financial, or economic conditions will likely impair capacity or willingness to pay interest and repay principal. The B rating category is also used for debt subordinated to senior debt that is assigned an actual or implied BB- rating.
CCC – Debt rated CCC has a currently identifiable vulnerability to default, and is dependent upon favorable business, financial, and economic conditions to meet timely payment of interest and repayment of principal. In the event of adverse business, financial, or economic conditions, it is not likely to have the capacity to pay interest and repay principal.
CC – Debt rated CC is typically applied to debt subordinated to senior debt which is assigned an actual or implied CCC debt rating.
C – The rating C is typically applied to debt subordinated to senior debt which is assigned an actual or implied CCC- debt rating. The C rating may be used to cover a situation where a bankruptcy petition has been filed but debt service payments are continued.
CI – The rating CI is reserved for income bonds on which no interest is being paid.
D – Debt rated D is in payment default. The D rating category is used when interest payments or principal payments are not made on the date due even if the applicable grace period has not expired, unless S&P believes that such payments will be made during such grace period. The D
- 82 -
Table of Contents
rating will also be used upon the filing of a bankruptcy petition if debt service payments are jeopardized.
Description of S&P Commercial Paper Ratings:
Commercial paper rated A-1 by S&P indicates that the degree of safety regarding timely payment is either overwhelming or very strong. Those issues determined to possess overwhelming safety characteristics are denoted A-1+.,
Description of Moody’s Commercial Paper Ratings:
The rating Prime-1 is the highest commercial paper rating assigned by Moody’s. Issuers rated Prime-1 (or related supporting institutions) are considered to have a superior capacity for repayment of short-term promissory obligations.
Description of S&P Municipal Bond Ratings:
AAA – Prime – These are obligations of the highest quality. They have the strongest capacity for timely payment of debt service.
General Obligations Bonds – In a period of economic stress, the issuers will suffer the smallest declines in income and will be least susceptible to autonomous decline. Debt burden is moderate. A strong revenue structure appears more than adequate to meet future expenditure requirements. Quality of management appears superior.
Revenue Bonds – Debt service coverage has been, and is expected to remain, substantial, stability of the pledged revenues is also exceptionally strong due to the competitive position of the municipal enterprise or to the nature of the revenues. Basic security provisions (including rate covenant, earnings test for issuance of additional bonds and debt service reserve requirements) are rigorous. There is evidence of superior management.
AA – High Grade – The investment characteristics of bonds in this group are only slightly less marked than those of the prime quality issues. Bonds rated AA have the second strongest capacity for payment of debt service.
A – Good Grade – Principal and interest payments on bonds in this category are regarded as safe although the bonds are somewhat more susceptible to the adverse effects of changes in circumstances and economic conditions than bonds in higher rated categories. This rating describes the third strongest capacity for payment of debt service. Regarding municipal bonds, the rating differs from the two higher ratings because:
General Obligation Bonds – There is some weakness, either in the local economic base, in debt burden, in the balance between revenues and expenditures, or in quality of management. Under certain adverse circumstances, any one such weakness might impair the ability of the issuer to meet debt obligations at some future date.
Revenue Bonds – Debt service coverage is good, but not exceptional. Stability of the pledged revenues could show some variations because of increased competition or economic influences
- 83 -
Table of Contents
on revenues. Basic security provisions, while satisfactory, are less stringent. Management performance appearance appears adequate.
S&P’s letter ratings may be modified by the addition of a plus or a minus sign, which is used to show relative standing within the major rating categories, except in the AAA rating category.
Description of Moody’s Municipal Bond Ratings:
Aaa – Bonds which are rated Aaa are judged to be of the best quality. They carry the smallest degree of investment risk and are generally referred to as “gilt edge Interest payments are protected by a large or by an exceptionally stable margin and principal is secure. While the various protective elements are likely to change, such changes as can be visualized are most unlikely to impair the fundamentally strong position of such issues.
Aa – Bonds which are rated As are judged to be of high quality by all standards. Together with the Aaa group they comprise what are generally known as high grade bonds. They are rated lower than the best bonds because margins of protection may not be as large as in Aaa securities, or fluctuation of protective elements may be of greater amplitude, or there may be other elements present which make the long-term risks appear somewhat larger than in Aaa securities.
A – Bonds which are rated A possess many favorable investment attributes and are to be considered as upper medium grade obligations. Factors giving security to principal and interest are considered adequate, but elements may be present which suggest a susceptibility to impairment sometime in the future.
Moody’s may apply the numerical modifier in each generic rating classification from Aa through B. The modifier 1 indicates that the security within its generic rating classification possesses the strongest investment attributes.
Description of S&P Municipal Note Ratings:
Municipal notes with maturities of three years or less are usually given note ratings (designated SP-1, or -2) to distinguish more clearly the credit quality of notes as compared to bonds. Notes rated SP-1 have a very strong or strong capacity to pay principal and interest. Those issues determined to possess overwhelming safety characteristics are given the designation of SP-1, Notes rates SP-2 have a satisfactory capacity to pay principal and interest.
Description of Moody’s Municipal Note Ratings:
Moody’s ratings for state and municipal notes and other short-term loans are designated Moody’s Investment Grade (MIG) and for variable rate demand obligations are designated Variable Moody’s Investment Grade (VMIG). This distinction recognizes the differences between short-term credit risk and long-term risk. Loans bearing the designation MIG 1/VMIG 1 are of the best quality, enjoying strong protection from established cash flows of funds for their servicing or from established cash flows of funds for their servicing or from established and broad-based access to the market for refinancing, or both. Loans bearing the designation MIG2/VMIG2 are of high quality, with ample margins of protection, although not as large as the preceding group.
- 84 -
Table of Contents
S&P’s Commercial Paper Ratings:
A is the highest commercial paper rating category utilized by S&P, which uses the numbers 1, 1, 2 and 3 to denote relative strength within it’s A classification. Commercial paper issues rated A by S&P have the following characteristics: Liquidity ratios are better than industry average. Long-term debt ratings is A or better. The issuer has access to at least two additional channels of borrowing. Basic earnings and cash flow are in an upward tread. Typically, the issuer is a strong company in a well-established industry and has superior management.
Moody’s Commercial Paper Ratings:
Issuers rated Prime-1 (or related supporting institutions) have a superior capacity for repayment of short-term promissory obligations. Prime-1 repayment capacity will normally be evidenced by the following characteristics: leasing market positions in well-established industries; high rates of return on funds employed; conservative capitalization structures with moderate reliance on debt and ample asset protection; broad margins in earnings coverage of fixed financial charges and high internal cash generation; well-established access to a range of financial markets and assured sources of alternate liquidity.
Issuers rated Prime-2 (or related supporting institutions) have a strong capacity for repayment of short-term promissory obligations. This will normally be evidenced by many of the characteristics cited above but to a lesser degree. Earnings trends and coverage ratios, while sound, will be more subject to variation. Capitalization characteristics, while still appropriate, may be more affected by external conditions. Ample alternate liquidity is maintained. Issuers rates Prime-3 (or related supporting institutions) have an acceptable capacity for repayment of short-term promissory obligations. The effect of industry characteristics and market composition may be more pronounced. Variability in earnings and profitability may result in changes in the level of debt protection measurements and the requirement for relatively high financial leverage. Adequate alternate liquidity is maintained.
- 85 -
Table of Contents
STATEMENT OF ADDITIONAL INFORMATION
February 1, 2004
Investment Advisor
DEUTSCHE ASSET MANAGEMENT, INC.
345 Park Avenue
New York, NY 10154
Custodian
STATE STREET BANK AND TRUST COMPANY CO.
225 Franklin Street
Boston, MA 02110
Distributor
SCUDDER DISTRIBUTORS, INC.
222 South Riverside Plaza
Chicago, IL 60606
Transfer Agent
SCUDDER INVESTMENTS SERVICE COMPANY
222 South Riverside Plaza
Chicago, IL 60606
Administrator
INVESTMENT COMPANY CAPITAL CORP.
One South Street
Baltimore, MD 21202
Independent Accountants
PRICEWATERHOUSECOOPERS LLP
160 Federal Street
Boston, MA 02110
Counsel
WILLKIE FARR & GALLAGHER LLP
787 Seventh Avenue
New York, NY 10019
No person has been authorized to give any information or to make any representations other than those contained in the Trust’s Prospectuses, its Statements of Additional information or the Trust’s official sales literature in connection with the offering of the Trust’s shares and, if given or made, such other information or representations must not be relied on as having been authorized by the Trust. Neither the Prospectuses nor this Statement of Additional Information constitutes an offer in any state in which, or to any person to whom, such offer may not lawfully be made.
- 86 -
Table of Contents
CUSIPs:
Scudder Mid Cap Fund
Class A: 81111R 882
Class B: 81111R 874
Class C: 81111R 866
Class R: 811111 718
Institutional Class: 81111R 858
Investment Class: 8111IR 841
Scudder Small Cap Fund
Class A: 81111R 791
Class B: 81111R 783
Class C: 81111R 775
Class R: 81111R 718
Institutional Class: 81111R 775
Investment Class: 81111R 726
- 87 -
Table of Contents
Supplement to the currently effective Statements of Additional Information of each of the listed funds:
Scudder 21st Century Growth Fund
Scudder Aggressive Growth Fund
Scudder Blue Chip Fund
Scudder California Tax-Free Income Fund
Scudder Capital Growth Fund
Scudder Contrarian Fund
Scudder-Dreman High Return Equity Fund
Scudder-Dreman Small Cap Value Fund
Scudder Dynamic Growth Fund
Scudder Fixed Income Fund
Scudder Flag Investors Communications Fund
Scudder Flag Investors Equity Partners Fund
Scudder Flag Investors Value Builder Fund
Scudder Florida Tax-Free Income Fund
Scudder Global Biotechnology Fund
Scudder Global Fund
Scudder Growth Fund
Scudder Growth and Income Fund
Scudder Health Care Fund
Scudder High Income Fund
Scudder High Income Opportunity Fund
Scudder High Yield Tax-Free Fund
Scudder Income Fund
Scudder Intermediate Tax/AMT Free Fund
Scudder International Fund
Scudder Japanese Equity Fund
Scudder Large Company Growth Fund
Scudder Large Company Value Fund
Scudder Managed Municipal Bond Fund
Scudder Massachusetts Tax-Free Fund
Scudder Micro Cap Fund
Scudder Mid Cap Fund
Scudder New York Tax-Free Income Fund
Scudder Pathway Series — Conservative Portfolio
Scudder Pathway Series — Growth Portfolio
Scudder Pathway Series — Moderate Portfolio
Scudder PreservationPlus Income Fund
Scudder RREEF Real Estate Securities Fund
Scudder S&P 500 Stock Fund
Scudder Select 500 Fund
Scudder Short Duration Fund
Scudder Short-Term Bond Fund
Scudder Small Cap Fund
Scudder Small Company Stock Fund
Scudder Small Company Value Fund
Scudder Strategic Income Fund
Scudder Tax Advantaged Dividend Fund
Scudder Technology Fund
Scudder Technology Innovation Fund
Scudder Top 50 US Fund
Scudder U.S. Government Securities Fund
The following information supplements the Purchases and Redemptions of Shares section of each of the above-listed funds’ Statements of Additional Information:
Purchase of Class C Shares. As of March 1, 2004, Class C shares of the fund will be offered at net asset value. No initial sales charge will be imposed. Class C shares sold without an initial sales charge will allow the full amount of the investor’s purchase payment to be invested in Class C shares for his or her account. Class C shares will continue to be subject to a contingent deferred sales charge of 1.00% (for shares sold within one year of purchase) and Rule 12b-1 fees, as described in each prospectus and Statement of Additional Information.
March 1, 2004
Table of Contents
Supplement to the currently effective Statement of Additional Information of each of the listed funds:
Cash Account Trust
| — | Government Securities Portfolio |
| — | Money Market Portfolio |
| — | Tax-Exempt Portfolio |
Cash Equivalent Fund
| — | Government Securities Portfolio |
| — | Money Market Portfolio |
| — | Tax-Exempt Portfolio |
Cash Management Fund Institutional
Cash Management Fund Investment
Cash Reserve Fund, Inc.
| — | Prime Series |
| — | Treasury Series |
| — | Tax-Free Series |
Cash Reserves Fund Institutional
Daily Assets Fund Institutional
Investors Cash Trust
| — | Government Securities Portfolio |
| — | Treasury Portfolio |
Investors Municipal Cash Fund
| — | Investors Florida Municipal Cash Fund |
| — | Investors Michigan Municipal Cash Fund |
| — | Investors New Jersey Municipal Cash Fund |
| — | Investors Pennsylvania Municipal Cash Fund |
| — | Tax-Exempt New York Money Market Fund |
Money Market Fund Investment
NY Tax Free Money Fund Investment
Scudder 21st Century Growth Fund
Scudder Aggressive Growth Fund
Scudder Balanced Fund
Scudder Blue Chip Fund
Scudder California Tax-Free Income Fund
Scudder Capital Growth Fund
Scudder Cash Investment Trust
Scudder Cash Reserves Fund
Scudder Development Fund
Scudder-Dreman Financial Services Fund
Scudder-Dreman High Return Equity Fund
Scudder-Dreman Small Cap Value Fund
Scudder Dynamic Growth Fund
Scudder EAFE Equity Index Fund
Scudder Emerging Markets Debt Fund
Scudder Emerging Markets Growth Fund
Scudder Emerging Markets Income Fund
Scudder Equity 500 Index Fund
Scudder European Equity Fund
Scudder Fixed Income Fund
Scudder Flag Investors Communications Fund
Scudder Flag Investors Equity Partners Fund
Scudder Flag Investors Value Builder Fund
Scudder Florida Tax-Free Income Fund
Scudder Focus Value + Growth Fund
Scudder Global Biotechnology Fund
Scudder Global Bond Fund
Scudder Global Discovery Fund
Scudder Global Fund
Scudder GNMA Fund
Scudder Gold and Precious Metals Fund
Scudder Greater Europe Growth Fund
Scudder Growth and Income Fund
Scudder Growth Fund
Scudder Health Care Fund
Scudder High Income Fund
Scudder High Income Opportunity Fund
Scudder High Income Plus Fund
Scudder High Yield Tax-Free Fund
Scudder Income Fund
Scudder Intermediate Tax/AMT Free Fund
Scudder International Equity Fund
Scudder International Fund
Scudder International Select Equity Fund
Scudder Japanese Equity Fund
Scudder Large Cap Value Fund
Scudder Large Company Growth Fund
Scudder Large Company Value Fund
Scudder Latin America Fund
Scudder Lifecycle Long Range Fund
Scudder Lifecycle Mid Range Fund
Scudder Lifecycle Short Range Fund
Scudder Managed Municipal Bond Fund
Scudder Massachusetts Tax-Free Fund
Scudder Micro Cap Fund
Scudder Mid Cap Fund
Scudder Money Funds
| — | Scudder Government Money Fund |
| — | Scudder Money Market Fund |
| — | Scudder Tax-Exempt Money Fund |
Scudder Money Market Series
Scudder Municipal Bond Fund
Scudder New Europe Fund
Scudder New York Tax-Free Income Fund
Scudder Pacific Opportunities Fund
Scudder Pathway Series: Conservative Portfolio
Scudder Pathway Series: Growth Portfolio
Scudder Pathway Series: Moderate Portfolio
Scudder PreservationPlus Fund
Scudder PreservationPlus Income Fund
Scudder Retirement Fund — Series V
Scudder Retirement Fund — Series VI
Scudder Retirement Fund — Series VII
Scudder RREEF Real Estate Securities Fund
Scudder S&P 500 Index Fund
Scudder S&P 500 Stock Fund
Scudder Select 500 Fund
Scudder Short Duration Fund
Scudder Short-Term Bond Fund
Scudder Short-Term Municipal Bond Fund
Scudder Small Cap Fund
Scudder Small Company Stock Fund
Scudder Small Company Value Fund
Scudder Strategic Growth Fund
Scudder Strategic Income Fund
Scudder Target 2010 Fund
Scudder Target 2011 Fund
Scudder Target 2012 Fund
Scudder Target 2013 Fund
Scudder Tax Advantaged Dividend Fund
Scudder Tax-Exempt California Money Market Fund
Scudder Tax Free Money Fund
Scudder Technology Fund
Scudder Technology Innovation Fund
Scudder Top 50 US Fund
Scudder Total Return Fund
Scudder US Bond Index Fund
Scudder US Government Securities Fund
Scudder US Treasury Money Fund
Scudder Variable Series I
| — | Scudder 21st Century Growth Portfolio |
| — | Scudder Balanced Portfolio |
| — | Scudder Bond Portfolio |
| — | Scudder Capital Growth Portfolio |
| — | Scudder Global Discovery Portfolio |
| — | Scudder Growth and Income Portfolio |
| — | Scudder Health Sciences Portfolio |
| — | Scudder International Portfolio |
| — | Scudder Money Market Portfolio |
Table of Contents
Scudder Variable Series II
| — | Scudder Aggressive Growth Portfolio |
| — | Scudder Blue Chip Portfolio |
| — | Scudder Contrarian Value Portfolio |
| — | Scudder Fixed Income Portfolio |
| — | Scudder Global Blue Chip Portfolio |
| — | Scudder Government Securities Portfolio |
| — | Scudder Growth Portfolio |
| — | Scudder High Income Portfolio |
| — | Scudder International Select Equity Portfolio |
| — | Scudder Money Market Portfolio |
| — | Scudder Small Cap Growth Portfolio |
| — | Scudder Strategic Income Portfolio |
| — | Scudder Technology Growth Portfolio |
| — | Scudder Total Return Portfolio |
| — | SVS Davis Venture Value Portfolio |
| — | SVS Dreman Financial Services Portfolio |
| — | SVS Dreman High Return Equity Portfolio |
| — | SVS Dreman Small Cap Value Portfolio |
| — | SVS Eagle Focused Large Cap Growth Portfolio |
| — | SVS Focus Value + Growth Portfolio |
| — | SVS Index 500 Portfolio |
| — | SVS INVESCO Dynamic Growth Portfolio |
| — | SVS Janus Growth and Income Portfolio |
| — | SVS Janus Growth Opportunities Portfolio |
| — | SVS MFS Strategic Value Portfolio |
| — | SVS Oak Strategic Equity Portfolio |
| — | SVS Turner Mid Cap Growth Portfolio |
Scudder Yieldwise Funds
| — | Scudder Yieldwise Government Money Fund |
| — | Scudder Yieldwise Money Fund |
| — | Scudder Yieldwise Municipal Money Fund |
Scudder Worldwide 2004 Fund
Tax Free Money Fund Investment
Treasury Money Fund Institutional
Treasury Money Fund Investment
The following information is added to each Fund’s Statement of Additional Information:
Information concerning portfolio holdings of a Scudder Fund as of a month-end is available upon request no earlier than the 16th day after month-end. Please call Scudder Investments at the number appearing on the front cover of this Statement of Additional Information to make such a request.
PLEASE RETAIN THIS SUPPLEMENT FOR FUTURE REFERENCE
April 29, 2004
Table of Contents
Scudder 21st Century Growth Fund
Scudder Aggressive Growth Fund
Scudder Blue Chip Fund
Scudder California Tax-Free Income Fund
Scudder Capital Growth Fund
Scudder-Dreman Financial Services Fund
Scudder-Dreman High Return Equity Fund
Scudder-Dreman Small Cap Value Fund
Scudder Dynamic Growth Fund
Scudder Emerging Markets Growth Fund
Scudder Emerging Markets Income Fund
Scudder European Equity Fund
Scudder Fixed Income Fund
Scudder Flag Investors Communications Fund
Scudder Flag Investors Equity Partners Fund
Scudder Flag Investors Value Builder Fund
Scudder Florida Tax-Free Income Fund
Scudder Focus Value + Growth Fund
Scudder Global Fund
Scudder Global Biotechnology Fund
Scudder Global Bond Fund
Scudder Global Discovery Fund
Scudder Gold and Precious Metals Fund
Scudder Greater Europe Growth Fund
Scudder Growth Fund
Scudder Growth and Income Fund
Scudder Health Care Fund
Scudder High Income Fund
Scudder High Income Opportunity Fund
Scudder High Yield Tax-Free Fund
Scudder Income Fund
Scudder Intermediate Tax/AMT Free Fund
Scudder International Fund
Scudder International Equity Fund
Scudder International Select Equity Fund
Scudder Japanese Equity Fund
Scudder Large Cap Value Fund
Scudder Large Company Growth Fund
Scudder Large Company Value Fund
Scudder Latin America Fund
Scudder Managed Municipal Bond Fund
Scudder Massachusetts Tax-Free Fund
Scudder Micro Cap Fund
Scudder Mid Cap Fund
Scudder New Europe Fund
Scudder New York Tax-Free Income Fund
Scudder Pacific Opportunities Fund
Scudder Pathway Series — Conservative Portfolio
Scudder Pathway Series — Growth Portfolio
Scudder Pathway Series — Moderate Portfolio
Scudder PreservationPlus Income Fund
Scudder RREEF Real Estate Securities Fund
Scudder S&P 500 Stock Fund
Scudder Select 500 Fund
Scudder Short Duration Fund
Scudder Short-Term Bond Fund
Scudder Short-Term Municipal Bond Fund
Scudder Small Cap Fund
Scudder Small Company Stock Fund
Scudder Small Company Value Fund
Scudder Strategic Income Fund
Scudder Tax Advantaged Dividend Fund
Scudder Technology Fund
Scudder Technology Innovation Fund
Scudder Top 50 US Fund
Scudder Total Return Fund
Scudder U.S. Government Securities Fund
Supplement to the currently effective Statements of Additional Information of the above listed Funds:
The following replaces the two paragraphs in each Fund’s Statement of Additional Information under “Purchase and Redemption of Shares — Multi-Class Suitability” on the effective dates provided below:
A. Effective July 1, 2004:
SDI has established the following procedures regarding the purchase of Class A, Class B and Class C shares. Orders to purchase Class B shares of $100,000 or more and orders to purchase Class C shares of $500,000 or more will be declined with the exception of orders received from firms acting for clients whose shares will be held in an omnibus account and employer-sponsored employee benefit plans using the Flex subaccount record keeping system (“Flex System”) maintained by ADP under an alliance with SDI and its affiliates (“Scudder Flex Plans”).
Table of Contents
B. Effective October 1, 2004:
The following provisions apply to Scudder Flex Plans.
a. Class B Share Plans. Class B shares have not been sold to Scudder Flex Plans that were established on the Flex System after October 1, 2003. Orders to purchase Class B shares for a Scudder Flex Plan established on the Flex System prior to October 1, 2003 that has regularly been purchasing Class B shares will be invested instead in Class A shares at net asset value when the combined subaccount value in Scudder Funds or other eligible assets held by the plan is $100,000 or more. This provision will be imposed for the first purchase after eligible plan assets reach the $100,000 threshold.
b. Class C Share Plans. Orders to purchase Class C shares for a Scudder Flex Plan, regardless of when such plan was established on the Flex System, will be invested instead in Class A shares at net asset value when the combined subaccount value in Scudder Funds or other eligible assets held by the plan is $1 million or more. This provision will be imposed for the first purchase after eligible plan assets reach the $1 million threshold.
The procedures described in A and B above do not reflect in any way the suitability of a particular class of shares for a particular investor and should not be relied upon as such. A suitability determination must be made by investors with the assistance of their financial representative.
June 18, 2004
Table of Contents
[Scudder Investments logo]
Scudder Mid Cap Fund
Scudder Small Cap Fund
Scudder Micro Cap Fund
Annual Report to Shareholders
September 30, 2003
| 3 | ||
| 9 | ||
| 9 | ||
| 13 | ||
| 14 | ||
| 15 | ||
| 19 | ||
| 25 | ||
| 30 | ||
| 31 | ||
| 31 | ||
| 35 | ||
| 36 | ||
| 37 | ||
| 40 | ||
| 42 | ||
| 47 | ||
| 48 | ||
| 48 | ||
| 52 | ||
| 53 | ||
| 54 | ||
| 58 | ||
| 63 | ||
| 68 | ||
| 69 | ||
| 71 | ||
Scudder Investments is part of Deutsche Asset Management, which is the marketing name in the US for the asset management activities of Deutsche Bank AG, Deutsche Investment Management Americas Inc., Deutsche Asset Management Inc., Deutsche Asset Management Investment Services Ltd., Deutsche Bank Trust Company Americas and Scudder Trust Company.
This report must be preceded or accompanied by a prospectus. To obtain a prospectus for any of our funds, refer to the Account Management Resources information provided in the back of this booklet. The prospectus contains more complete information, including a description of the risks of investing in the fund, management fees and expenses. Please read it carefully before you invest or send money.
Fund shares are not FDIC-insured and are not deposits or other obligations of, or guaranteed by, any bank. Fund shares involve investment risk, including possible loss of principal.
2
Table of Contents
Scudder Mid, Small and Micro Cap Funds: A Team Approach to Investing
Deutsche Asset Management, Inc. (“DeAM, Inc.” or the “Advisor”), which is part of Deutsche Asset Management, is the investment advisor for Scudder Mid, Small and Micro Cap Funds. DeAM, Inc. provides a full range of investment advisory services to institutional and retail clients. DeAM, Inc. is also responsible for selecting brokers and dealers and for negotiating brokerage commissions and dealer charges.
Deutsche Asset Management is a global asset management organization that offers a wide range of investing expertise and resources. This well-resourced global investment platform brings together a wide variety of experience and investment insight across industries, regions, asset classes and investing styles.
DeAM, Inc. is an indirect, wholly owned subsidiary of Deutsche Bank AG. Deutsche Bank AG is a major global banking institution that is engaged in a wide range of financial services, including investment management, mutual funds, retail, private and commercial banking, investment banking and insurance.
Portfolio Management Team
Audrey M.T. Jones, CFA
Managing Director of Deutsche Asset Management and Lead Manager of each fund.
| • | Joined Deutsche Asset Management in 1986 and each fund at its inception. |
| • | 31 years of investment industry experience. |
| • | BBA from Pace University Lubin School of Business. |
3
Table of Contents
Doris R. Klug, CFA
Director of Deutsche Asset Management and Manager of each fund.
| • | Joined Deutsche Asset Management in 2000. |
| • | Vice President of Mutual of America from 1993 to 2000. |
| • | 22 years of financial industry experience. |
| • | MBA from New York University Stern School of Business. |
Bob Grandhi, CFA
Director of Deutsche Asset Management and Manager of each fund.
| • | Joined Deutsche Asset Management in 2001. |
| • | Portfolio manager at Monument Funds Group and Daiwa Securities from 2000 to 2001 and 1990 to 2000, respectively. |
| • | 26 years of financial industry experience. |
| • | MBA from Illinois Institute of Technology. |
Samuel A. Dedio
| • | Director of Deutsche Asset Management and Manager of each fund. |
| • | Joined Deutsche Asset Management in 1999 after eight years of experience, formerly serving as analyst at Ernst & Young, LLP, Evergreen Asset Management and Standard & Poor’s Corp. |
| • | Portfolio manager for US small- and mid-cap equity and senior small cap analyst for technology. |
| • | MS, American University. |
| • | Joined the funds in 2002. |
In the following interview, Portfolio Managers Audrey M.T. Jones, Doris R. Klug and Bob Grandhi discuss the three funds’ strategies and the market environment during the 12-month period ended September 30, 2003.
Q: How did Scudder Micro Cap Fund, Scudder Small Cap Fund and Scudder Mid Cap Fund perform for their fiscal year?
A: Each of the three funds underperformed its index benchmark and peer group for the 12 months ended September 30, 2003. Scudder Micro Cap Fund produced a total return of 32.84% and Scudder Small Cap Fund produced a total return of 19.06% (for both, Class A shares unadjusted for sales charge) for the annual period, as compared with 36.50% for the Russell 2000 Index. Scudder Mid Cap Fund produced a total return of 23.09% (Class A shares unadjusted for sales charge) for the annual period, as compared with 26.81% for the Standard & Poor’s (S&P) MidCap 400 Index. The Lipper Small-Cap Growth Funds category average return was 34.06% for the 12-month period and the Lipper Mid-Cap Growth Funds category average return was 27.72%.1 (Please see the Performance Summary that begins on page 15 (Mid Cap), page 42 (Small Cap) and page 66 (Micro Cap) for standardized performance for all share classes.)
| 1 | Source: Lipper Inc. The Lipper Small-Cap Growth Funds category includes portfolios that invest at least 75% of equity assets in companies with market capitalizations less than 300% of the dollar-weighted median market capitalization of the smallest 500 of the middle 1,000 securities of the S&P SuperComposite 1500 Index. These portfolios typically have above-average price-to-earnings ratios and price-to-book ratios compared with the S&P SmallCap 600 Index. The Lipper Mid-Cap Growth Funds category includes portfolios that invest at least 75% of equity assets in companies with market capitalizations of less than 300% of the dollar-weighted median market capitalization of the middle 1,000 securities of the S&P SuperComposite 1500 Index. These portfolios typically have above-average price-to-earnings ratios and price-to-book ratios compared with the S&P MidCap 400 Index. It is not possible to invest directly in an index or a Lipper category. |
4
Table of Contents
The funds’ underperformance relative to their benchmarks was primarily due to mixed results from specific stock selection and sector positioning. Relative performance was also affected by the fact that the smallest, most illiquid, noninstitutional-quality securities in the small-cap equity universe, primarily stocks of companies with little or no real earnings, outperformed not only the larger, more profitable and investable, institutional-quality micro-cap and small-cap securities but also the large-cap and mid-cap equity segments during the second half of the fiscal year.
Q: What were the best and worst stock performers for each of the funds?
A: In Scudder Micro Cap Fund, the top contributing securities during the annual period were primarily in the technology sector where investors saw improved earnings on the horizon. These included Applied Films Corp., Informatica Corp.,* Avid Technologies Inc.,* ChipPAC, Inc., ManTech International Corp. and ANSYS, Inc. ANSYS is an international provider of analysis and engineering software. The company successfully acquired a leading supplier of computational fluid dynamics software, which should expand its client base. Other winners for the fund included Connetics Corp. and Advanced Neuromodulation Systems, Inc. in health care, Newcastle Investment Corp. in financial services, and online advertising firm Valueclick, Inc. Most of the fund’s disappointments were in health care, which included Medical Staffing Network Holdings, Inc.* and Isis Pharmaceuticals, Inc.* Isis saw its stock drop precipitously during the first quarter of 2003 after news broke that the phase three-clinical trial results for its experimental lung cancer drug were disappointing. Modtech Holdings, Inc.* in producer durables, and Tropical Sportswear International Corp.,* Hancock Fabrics, Inc.* and A.T. Cross Co.* in consumer discretionary also detracted from fund performance.
| * | Position was sold as of September 30, 2003. |
As with Scudder Micro Cap Fund, most of the top contributing stocks in Scudder Small Cap Fund for the fiscal year were in technology. Among the best performers in the sector were DSP Group Inc., Fairchild Semiconductor International Inc., Titan Corp.,* Integrated Circuit Systems Inc.,* Applied Films Corp., Zoran Corp. and Documentum Inc. Documentum, an enterprise management software provider, contributed significantly to the fund’s portfolio. Its stock headed up following a series of upbeat announcements, including record revenue results for the year and decisions by several major organizations to use Documentum products. In other sectors, ITT Educational Services Inc. within industrials and JetBlue Airways Corp.* and Swift Transportation Co.* within transportation also boosted fund returns. On the other hand, the fund’s detractors were primarily from health care: Province Healthcare Co.,* Trimeris, Inc.,* InterMune, Inc.* and Accredo Health, Inc.* Labranche & Co., Inc. in financial services, Mercury Computer Systems, Inc.* and Activision, Inc.* in technology, and BJ’s Wholesale Club, Inc.* in consumer discretionary were also poor performers. During the first quarter of 2003, BJ’s Wholesale Club warned that their fiscal 2004 earnings would fall short of expectations due to the slow economy and competition.
| * | Position was sold as of September 30, 2003. |
5
Table of Contents
In Scudder Mid Cap Fund, the top contributing securities for the 12 months came from a wide variety of industries. Winners included Symantec Corp., Linear Technology Corp. and Advanced Fibre Communications, Inc. and Mercury Interactive Corp. in technology. Mercury, a provider of performance management software for Internet applications, saw its stock rise after it received a prestigious industry award and high marks from the press. Additional gains came from Legg Mason, Inc. in financial services, BJ Services Co. in energy, Swift Transportation Co. in transportation, Celgene Corp. and Genzyme Corp. in health care, and Harman International Industries, Inc. in producer durables. Most of the bottom contributing securities were in health care and financial services. These stocks were Labranche & Co., North Fork Bancorp,* IDEC Pharmaceuticals Corp.,* Investment Technology Group, Inc., Triad Hospitals, Inc.* and Laboratory Corp. of America.* Although Labranche & Co., an older financial specialty firm providing clearing, brokerage and execution services, has suffered from lower trading volumes on the market, we still believe in the company’s fundamentals.
| * | Position was sold as of September 30, 2003. |
Q: How were the funds positioned by sector, and what impact did this have on their results?
A: For the annual period, Scudder Micro Cap Fund’s strong stock selection and overweighting in technology, underweighting in financial services, and effective stock selection in transportation and consumer staples boosted relative performance the most. On the other hand, the fund’s stock selection in consumer discretionary and health care detracted from performance.
Scudder Small Cap Fund was helped during the 12 months by an overweighting in technology, underweighting in financial services, and effective stock selection in transportation and producer durables. However, these positive contributions to performance were not enough to outweigh the negative contributions from overweightings in energy and in materials and processing, and from poor stock selection in consumer discretionary, health care and technology.
Scudder Mid Cap Fund’s strong stock selection in consumer staples, energy, and materials and processing added to performance, as did its overweighting in technology and underweighting in consumer discretionary. However, poor stock selection in financial services, health care and producer durables detracted from performance.
Q: What were the major factors affecting small-cap and mid-cap equities during the annual period?
A: Continuing the trend begun in 1999, the smaller-cap equity market, as measured by the Russell 2000 Index, outperformed its large-cap brethren, as measured by the S&P 500 index, for the 12 months ended September 30, 2003. While smaller-cap stocks were the best-performing segment of the equity markets for the fiscal year, mid-cap stocks, as measured by the S&P MidCap 400 Index, also outperformed large-cap stocks for the annual period. Still, for the 12-month period, US equities across all capitalizations produced strong double-digit returns. Within the annual period, the smaller- and mid-cap equity markets, like the broader equity markets, saw divergent performance.
After bottoming in early October 2002, US equities rebounded sharply in the fourth calendar quarter of 2002, with the Russell 2000 Index increasing 6.16% and the S&P MidCap 400 Index increasing 5.83%. During October, despite economic indicators that showed dropping retail sales, declining manufacturing activity and a contracting labor market, the US equity markets responded with their best-performing month since March 2000. Within the small-cap and mid-cap market segments, growth stocks and riskier sectors returned to favor, as investors focused primarily on technology and telecommunications securities. In November, the Federal Reserve Board reduced the targeted federal funds rate by 50 basis points to a low of 1.25% in an effort to jump-start an economy that it thought may be decelerating. However, in a move probably meant to quell overreaction to this interest rate cut and to boost confidence about a potential economic recovery, the Federal Reserve Board also shifted from a
6
Table of Contents
loosening to a neutral stance. Also boosting the powerful equity rally during these weeks was the release of more tentatively positive economic data. For example, transportation and nondefense capital goods orders increased. Third-quarter gross domestic product (GDP) was revised upward to a stronger-than-expected 4.0%. Consumer confidence also rebounded after five months of decline. Even more positive was the fact that business spending for equipment and software increased a strong 6.6% for November, while consumers continued to take advantage of low interest rates to purchase and refinance homes. As in October, the technology and telecommunications sectors led the equity market advance in November. During December, concerns over a possible conflict with Iraq and rising tensions between North Korea and the United States adversely affected investor and consumer confidence, detracting from equity market performance. Economic data remained generally positive, but the equity markets declined during the month, primarily as a result of the technology sector’s giving back some of its prior two months’ gains.
For the first calendar quarter of 2003, US equities across all market capitalizations declined, with the Russell 2000 Index down 4.49% and the S&P MidCap 400 Index down 4.44%. Small-cap and mid-cap stocks, which are less liquid than large-cap stocks, were particularly hard hit during the quarter, as the looming war with Iraq led investors to pull money out of the equity markets and shift to more defensive instruments. Atypically in a declining equity environment, growth stocks outperformed value stocks across the broad equity market. During January, the economy took a backseat in investors’ minds as the nation’s attention was focused on the geopolitical tensions with Iraq and North Korea. In fact, at its January meeting, the Federal Reserve Board indicated that with the prospect of military conflict, monetary policy would have limited impact as an economic stimulus. Rising oil prices, falling consumer spending, and declining consumer and investor sentiment added to the geopolitical concerns in February. US manufacturing contracted in March after four months of expansion, primarily due to higher oil prices and uncertainty regarding near-term consumer spending. Equity markets initially responded favorably to the actual confrontation of coalition troops with the Iraqi military in March, but the markets paused later in the month as expectations of a swift resolution to the war declined.
For the second calendar quarter of 2003, US equities across all market capitalizations rebounded strongly, with the Russell 2000 Index up 23.42% and the S&P MidCap 400 Index up 17.63%. During April, despite high unemployment, ongoing contraction in the manufacturing sector and dropping retail sales, there were signs of improvement in the economy. Factory orders increased for the third month in a row, with the nondefense capital goods component, an important barometer of business capital spending, on the rise. In addition, with the conclusion of major military operations in Iraq and generally positive corporate earnings announcements, consumer and investor confidence improved. The broader equity markets responded favorably, with the small-cap segment leading the way. In May, economic signals continued to be mixed. Manufacturing activity remained low, but in spite of both adverse weather conditions in most of the nation and a late spring, healthy sales gains were seen in several industries, including electronics, retail and restaurants. The equity markets continued to perform well, with the smallcap segment (Russell 2000 Index) outperforming midcap (S&P MidCap 400 Index) and largecap (Russell 1000 Index). In June, the Federal Reserve Board reduced interest rates by 25 basis points. Manufacturing continued to contract, but there was growth in the services segment of the economy. For the quarter as a whole, smallcap stocks outperformed the other equity segments. Growth-oriented stocks (Russell 2000 Growth Index) marginally outperformed value-oriented stocks (Russell 2000 Value Index) within small-caps. Within mid-caps, the reverse was true, with value-oriented stocks (S&P MidCap 400/Barra Value Index) outperforming their growth-oriented counterparts (S&P MidCap 400/Barra Growth Index).2
| 2 | The Russell 1000 Index is an unmanaged index that measures the performance of 1,000 large-company stocks. |
The Russell 2000 Growth Index is an unmanaged, capitalization-weighted index containing the growth stocks in the Russell 2000 Index.
The Russell 2000 Value Index is an unmanaged group of small-cap companies with low price-to-book and price-to-earnings ratios.
The S&P MidCap 400/Barra Value Index is comprised of stocks of the S&P MidCap 400 Index with high price-to-book ratios relative to the index as a whole.
The S&P MidCap 400/Barra Growth Index is comprised of stocks of the S&P MidCap 400 Index with low price-to-book ratios relative to the index as a whole.
Index returns assume reinvestment of all distributions and do not reflect fees or expenses. It is not possible to invest directly in an index.
7
Table of Contents
In the last quarter of the fiscal year, the US equity market across all capitalizations remained in positive territory. The Russell 2000 Index was up 9.08% for the three months ended September 30, 2003, and the S&P MidCap 400 Index was up 6.59%. During July and August, most indicators continued to point toward improvement in the US economy. Second-quarter GDP expanded at a 3.3% (revised) rate, fueled by consumer purchases, business investment and an increase in defense spending. The manufacturing sector expanded, and industrial production, specifically in high-technology products, had its best growth rate since September 2000. The services sector of the economy also continued to grow, while corporate earnings announcements were generally positive. However, unemployment remained above 6%, mortgage refinancing activity slowed and consumer confidence declined. Overall, the equity markets responded favorably, with the small-cap segment leading the way. During September, the US equity markets lost some ground, due primarily to concerns regarding the upcoming corporate earnings announcement season, weakness in the US dollar and rising energy prices. As in the previous quarter, small-cap stocks outperformed the other equity segments for the third calendar quarter, and growth-oriented stocks outperformed value-oriented stocks within the small-cap sector. Within the mid-cap sector, again the reverse was true, with value-oriented stocks outperforming their growth-oriented counterparts.
Q: What investment strategies do you intend to pursue in the funds?
A: We continue to seek to invest in fundamentally sound companies with strong balance sheets.
Despite the recent and anticipated high volatility in the stock market, we remain disciplined in our investment process. Our investment strategy continues to:
| • | focus on smaller-cap and mid-cap companies with above-average growth prospects selling at reasonable valuations with the potential to be the blue chips of the future |
| • | focus on individual stock selection, with the goal of providing value-added performance relative to the universe of small- and mid-cap US companies |
| • | use extensive and intensive fundamental research to seek companies with innovation, leading or dominant positions in their niche markets, a high rate of return on invested capital and the ability to finance a major part of future growth from internal sources |
| • | strictly adhere to our sell discipline to reduce exposure to stocks with diminished appreciation potential |
| • | seek to use the volatility of the marketplace to our investors’ advantage by initiating or adding to positions on weakness |
It is also important to remember that investors should take a long-term view when investing in these segments of the market, as returns can be volatile in the short term. We will continue to monitor economic conditions and their effect on financial markets as we seek capital growth over the long term.
The views expressed in this report reflect those of the portfolio managers only through the end of the period of the report as stated on the cover. The managers’ views are subject to change at any time based on market and other conditions and should not be construed as a recommendation.
8
Table of Contents
Performance Summary September 30, 2003
Average Annual Total Returns* (Unadjusted for Sales Charge)
Scudder Mid Cap Fund | 1-Year | 3-Year | 5-Year | 10-Year | ||||||||
Class A(a) | 23.09 | % | -12.33 | % | 8.77 | % | 9.45 | % | ||||
Class B(a) | 22.17 | % | -13.12 | % | 7.75 | % | 8.39 | % | ||||
Class C(a) | 22.17 | % | -13.12 | % | 7.75 | % | 8.39 | % | ||||
Investment Class+ | 23.09 | % | -12.33 | % | 8.77 | % | 9.45 | % | ||||
S&P MidCap 400 Index++ | 26.81 | % | -.71 | % | 11.96 | % | 12.82 | % |
Scudder Mid Cap Fund | 1-Year | 3-Year | 5-Year | Life of Class** | ||||||||
Institutional Class(d)+ | 23.40 | % | -12.10 | % | 8.79 | % | 9.66 | % | ||||
S&P MidCap 400 Index++ | 26.81 | % | -.71 | % | 11.96 | % | 12.90 | % |
Sources: Lipper Inc. and Deutsche Asset Management, Inc.
| + | Investment Class and Institutional Class shares are not subject to sales charges. |
Net Asset Value
| Class A | Class B | Class C | Investment Class | Class R | Institutional Class | |||||||||||||
Net Asset Value: | ||||||||||||||||||
9/30/03 | $ | 11.46 | $ | 11.35 | $ | 11.35 | $ | 11.46 | $ | 11.45 | $ | 11.55 | ||||||
7/1/03 (commencement of sales for Class R) | — | — | — | — | $ | 10.78 | — | |||||||||||
9/30/02 | $ | 9.31 | $ | 9.29 | $ | 9.29 | $ | 9.31 | $ | — | $ | 9.36 | ||||||
Investment Class Lipper Rankings* - Mid-Cap Growth Funds Category
Period | Rank | Number of Funds Tracked | Percentile Ranking | |||||
1-Year | 343 | of | 497 | 69 | ||||
3-Year | 105 | of | 368 | 29 | ||||
5-Year | 52 | of | 233 | 23 | ||||
10-Year | 13 | of | 73 | 18 |
Rankings are historical and do not guarantee future results. Rankings are based on total return with distributions reinvested.
Source: Lipper Inc.
9
Table of Contents
Scudder Mid Cap Fund
Growth of an Assumed $10,000 Investment*(b) (Adjusted for Sales Charge)
[] Scudder Mid Cap Fund - Class A(c)
[] S&P MidCap 400 Index++
[GRAPHIC APPEARS HERE]
Yearly periods ended September 30
Comparative Results* (Adjusted for Sales Charge)
Scudder Mid Cap Fund | 1-Year | 3-Year | 5-Year | 10-Year | ||||||||||||||
Class A(c) | Growth of $10,000 Average annual total return | | $11,602 16.02 | % | | $6,351 -14.04 | % | | $14,349 7.49 | % | | $23,250 8.80 | % | |||||
Class B(c) | Growth of $10,000 Average annual total return | | $11,817 18.17 | % | | $6,364 -13.99 | | | $14,424 7.60 | % | | $22,384 8.39 | % | |||||
Class C(c) | Growth of $10,000 Average annual total return | | $12,095 20.95 | % | | $6,492 -13.41 | % | | $14,378 7.53 | % | | $22,161 8.28 | % | |||||
S&P MidCap 400 Index++ | Growth of $10,000 Average annual total return | | $12,681 26.81 | % | | $9,789 -.71 | % | | $17,594 11.96 | % | | $33,404 12.82 | % | |||||
The growth of $10,000 is cumulative.
10
Table of Contents
Scudder Mid Cap Fund
Growth of an Assumed $10,000 Investment*
[] Scudder Mid Cap Fund - Investment Class
[] S&P MidCap 400 Index++
[GRAPHIC APPEARS HERE]
Yearly periods ended September 30
Comparative Results*
Scudder Mid Cap Fund | 1-Year | 3-Year | 5-Year | 10-Year | ||||||||||||||
Investment Class | Growth of $10,000 Average annual total return | $ | 12,309 23.09 | % | $ | 6,738 -12.33 | % | $ | 15,225 8.77 | % | $ | 24,669 9.45 | % | |||||
S&P MidCap 400 Index++ | Growth of $10,000 Average annual total return | $ | 12,681 26.81 | % | $ | 9,789 -.71 | % | $ | 17,594 11.96 | % | $ | 33,404 12.82 | % | |||||
Scudder Mid Cap Fund | 1-Year | 3-Year | 5-Year | Life of Class** | ||||||||||||||
Institutional Class(d) | Growth of $250,000 Average annual total return | $ | 308,500 23.40 | % | $ | 169,775 -12.10 | % | $ | 381,025 8.79 | % | $ | 626,775 9.66 | % | |||||
S&P MidCap 400 Index++ | Growth of $250,000 Average annual total return | $ | 317,025 26.81 | % | $ | 244,725 -.71 | % | $ | 439,850 11.96 | % | $ | 832,400 12.90 | % | |||||
The growth of $10,000/$250,000 is cumulative.
The minimum investment for Institutional Class shares is $250,000.
11
Table of Contents
Notes to Performance Summary
| * | Returns and rankings during all periods shown reflect a fee waiver and/or expense reimbursement. Without this waiver/reimbursement, returns and rankings would have been lower. |
| ** | Institutional Class commenced operations on October 12, 1993. Index returns begin October 31, 1993. |
| a | Returns shown for Class A, B and C shares for the periods prior to their inception on June 28, 2002 are derived from the historical performance of Investment Class shares of the Scudder Mid Cap Fund during such periods and have been adjusted to reflect the higher gross total annual operating expenses and the current applicable sales charges of each specific class. Any difference in expenses will affect performance. |
| b | The Fund’s growth of an assumed $10,000 investment is adjusted for the maximum sales charge of 5.75%. This results in a net investment of $9,425. |
| c | Returns shown for Class A, B and C shares for the periods prior to their inception on June 28, 2002 are derived from the historical performance of Investment Class shares of the Scudder Mid Cap Fund during such periods and have been adjusted to reflect the higher gross total annual operating expenses and the current applicable sales charges of each specific class. Returns for Class A reflect the current maximum initial sales charge of 5.75%. Class B share performance is adjusted for the applicable contingent deferred sales charge (“CDSC”), which is 4% within the first year after purchase, declining to 0% after six years. Returns for Class C reflect an initial sales charge of 1%. Redemptions on Class C shares within one year of purchase may be subject to a CDSC of 1%. Any difference in expenses will affect performance. |
| d | At the close of business on August 31, 2000, shares of Equity Appreciation - Institutional Class merged into Institutional Class shares of Mid Cap Fund. Equity Appreciation - Institutional Class was managed by the same investment management team with the same objectives, policies and strategies as Mid Cap. The performance shown reflects Equity Appreciation - Institutional Class shares’ actual returns from its inception on October 12, 1993. Performance for periods after August 31, 2000 reflect the performance of the Mid Cap Fund - Institutional Class. |
| ++ | S&P MidCap 400 Index is an unmanaged index that tracks the stock movement of 400 mid-sized US companies. Index returns assume reinvestment of dividends and, unlike Fund returns, do not reflect any fees or expenses. It is not possible to invest directly into an index. |
All performance is historical, assumes reinvestment of all dividends and capital gains, and is not indicative of future results. Investment return and principal value will fluctuate, so an investor’s shares, when redeemed, may be worth more or less than when purchased. Performance figures do not reflect the deduction of taxes that a shareholder would pay on fund distributions or the redemption of fund shares. Returns and rankings may differ by share class.
Investments in funds involve risk. Some funds have more risk than others. These include funds that allow exposure to or otherwise concentrate investments in certain sectors, geographic regions, security types, market capitalization or foreign securities (e.g., political or economic instability, which can be accentuated in emerging market countries). Please read this fund’s prospectus for specific details regarding its investments and risk profile.
Please call (800) 621-1048 for the Fund’s most up-to-date performance. On the Web, go to scudder.com.
12
Table of Contents
Portfolio Summary September 30, 2003
Scudder Mid Cap Fund
Asset Allocation | 9/30/03 | 9/30/02 | ||||
Common Stocks | 96 | % | 98 | % | ||
Cash Equivalents, net | 4 | % | 2 | % | ||
| 100 | % | 100 | % | |||
Sector Diversification (Excludes Cash Equivalents) | 9/30/03 | 9/30/02 | ||||
Information Technology | 24 | % | 11 | % | ||
Health Care | 17 | % | 13 | % | ||
Consumer Discretionary | 14 | % | 11 | % | ||
Industrials | 13 | % | 20 | % | ||
Financials | 11 | % | 17 | % | ||
Consumer Staples | 7 | % | 9 | % | ||
Energy | 7 | % | 8 | % | ||
Materials | 6 | % | 11 | % | ||
Telecommunication Services | 1 | % | — | |||
| 100 | % | 100 | % | |||
Ten Largest Equity Holdings at September 30, 2003 (27.8% of Portfolio) | |||
1. Celgene Corp. Producer of pharmaceuticals | 3.8 | % | |
2. Swift Transportation Co., Inc. Provider of truckload carrier services | 3.0 | % | |
3. Legg Mason, Inc. Provider of various financial services | 3.0 | % | |
4. Packaging Corp. of America Manufacturer of containerboard and corrugated packaging products | 2.9 | % | |
5. Chico’s FAS, Inc. Seller of private label women’s casual clothing | 2.7 | % | |
6. Rowan Companies, Inc. Driller of oil and gas wells in the United States and internationally | 2.5 | % | |
7. Investors Financial Services Corp. Provider of services to financial asset managers | 2.5 | % | |
8. Harmon International Industries, Inc. Incorporator, designer, manufacturer and marketer of high fidelity audio and video products | 2.5 | % | |
9. BJ Services Co. Provider of pressure pumping and other oilfield services for the petroleum industry | 2.5 | % | |
10. Symantec Corp. Producer of software products | 2.4 | % |
Asset allocation, sector diversification and portfolio holdings are subject to change.
For more complete details about the fund’s investment portfolio, see page 20. A quarterly Fact Sheet and Portfolio Holdings are available upon request.
13
Table of Contents
| Investment Portfolio as of September 30, 2003 | The accompanying notes are an integral part of the financial statements. |
Scudder Mid Cap Fund | Shares | Value ($) | ||||
Common Stocks 96.0% | ||||||
Consumer Discretionary 13.7% | ||||||
Hotel Restaurants & Leisure 4.2% | ||||||
GTECH Holdings Corp. | 278,900 | 11,950,865 | ||||
The Cheesecake Factory, Inc.* | 336,200 | 12,160,354 | ||||
| 24,111,219 | ||||||
Household Durables 4.2% | ||||||
Harman International Industries, Inc. | 149,900 | 14,742,665 | ||||
Leggett & Platt, Inc. | 448,200 | 9,694,566 | ||||
| 24,437,231 | ||||||
Media 0.3% | ||||||
Citadel Broadcasting Corp.* | 94,300 | 1,863,368 | ||||
Specialty Retail 3.8% | ||||||
Chico’s FAS, Inc.* | 523,700 | 16,046,168 | ||||
Regis Corp. | 182,000 | 5,842,200 | ||||
| 21,888,368 | ||||||
Textiles, Apparel & Luxury Goods 1.2% | ||||||
Columbia Sportswear Co.* | 134,871 | 7,114,445 | ||||
Consumer Staples 6.8% | ||||||
Beverages 1.1% | ||||||
Constellation Brands, Inc. “A”* | 203,300 | 6,198,617 | ||||
Food & Drug Retailing 3.7% | ||||||
Performance Food Group Co.* | 303,600 | 12,359,556 | ||||
Whole Foods Market, Inc.* | 165,200 | 9,115,736 | ||||
| 21,475,292 | ||||||
Food Products 2.0% | ||||||
Dean Foods Co.* | 373,650 | 11,594,360 | ||||
Energy 6.6% | ||||||
Energy Equipment & Services | ||||||
BJ Services Co.* | 427,800 | 14,617,926 | ||||
Rowan Companies, Inc.* | 614,100 | 15,094,578 | ||||
Smith International, Inc.* | 241,800 | 8,699,964 | ||||
| 38,412,468 | ||||||
Financials 11.1% | ||||||
Diversified Financials 8.5% | ||||||
CapitalSource, Inc.* | 30,300 | 530,250 | ||||
Chicago Mercantile Exchange | 58,100 | 3,997,861 | ||||
Investment Technology Group, Inc.* | 309,100 | 5,928,538 | ||||
Investors Financial Services Corp. | 473,200 | 14,858,480 | ||||
Labranche & Co., Inc. | 433,500 | 6,329,100 | ||||
Legg Mason, Inc. | 249,400 | 18,006,680 | ||||
| 49,650,909 | ||||||
Insurance 2.6% | ||||||
Arthur J. Gallagher & Co. | 356,300 | 10,076,164 | ||||
Axis Capital Holdings Ltd. | 191,300 | 4,772,935 | ||||
| 14,849,099 | ||||||
Health Care 16.0% | ||||||
Biotechnology 9.6% | ||||||
Celgene Corp.* | 521,700 | 22,605,261 | ||||
Genzyme Corp. (General Division)* | 184,300 | 8,523,875 | ||||
Gilead Sciences, Inc.* | 194,500 | 10,878,385 | ||||
MedImmune, Inc.* | 221,700 | 7,318,317 | ||||
Protein Design Labs, Inc.* | 448,600 | 6,217,596 | ||||
| 55,543,434 | ||||||
Health Care Equipment & Supplies 2.0% | ||||||
DENTSPLY International, Inc. | 258,600 | 11,595,624 | ||||
Health Care Providers & Services 1.5% | ||||||
Coventry Health Care, Inc.* | 168,600 | 8,891,964 | ||||
Pharmaceuticals 2.9% | ||||||
Barr Laboratories, Inc.* | 122,900 | 8,383,009 | ||||
Mylan Laboratories, Inc. | 226,200 | 8,742,630 | ||||
| 17,125,639 | ||||||
Industrials 12.3% | ||||||
Aerospace & Defense 1.7% | ||||||
Alliant Techsystems, Inc.* | 207,500 | 9,970,375 | ||||
Airlines 1.9% | ||||||
Southwest Airlines Co. | 628,800 | 11,129,760 | ||||
Commercial Services & Supplies 4.7% | ||||||
Corinthian Colleges, Inc.* | 201,600 | 11,523,456 | ||||
Hewitt Associates, Inc. “A”* | 248,000 | 6,038,800 | ||||
ITT Educational Services, Inc.* | 201,400 | 9,651,088 | ||||
| 27,213,344 | ||||||
Construction & Engineering 0.9% | ||||||
Jacobs Engineering Group, Inc.* | 110,200 | 4,970,020 | ||||
Road & Rail 3.1% | ||||||
Swift Transportation Co., Inc.* | 794,300 | 18,022,667 | ||||
Information Technology 22.7% | ||||||
Communications Equipment 3.6% | ||||||
Advanced Fibre Communications, Inc.* | 648,800 | 13,605,336 | ||||
Sonus Networks, Inc.* | 1,041,300 | 7,216,209 | ||||
| 20,821,545 | ||||||
Computers & Peripherals 1.6% | ||||||
Maxtor Corp.* | 755,400 | 9,193,218 | ||||
Electronic Equipment & Instruments 1.5% | ||||||
Jabil Circuit, Inc.* | 335,700 | 8,744,985 | ||||
IT Consulting & Services 1.4% | ||||||
Affiliated Computer Services, Inc. “A”* | 172,100 | 8,379,549 | ||||
Semiconductor Equipment & Products 8.0% | ||||||
Integrated Circuit Systems* | 271,300 | 8,149,852 | ||||
Lam Research Corp.* | 378,200 | 8,377,130 | ||||
Linear Technology Corp. | 327,500 | 11,727,775 | ||||
Microchip Technology, Inc. | 450,400 | 10,782,576 | ||||
Novellus Systems, Inc.* | 229,900 | 7,759,125 | ||||
| 46,796,458 | ||||||
Software 6.6% | ||||||
Mentor Graphics Corp.* | 478,300 | 8,384,599 | ||||
Mercury Interactive Corp.* | 205,900 | 9,349,919 | ||||
Symantec Corp.* | 229,600 | 14,469,392 | ||||
Take-Two Interactive Software, Inc.* | 175,700 | 6,003,669 | ||||
| 38,207,579 | ||||||
Materials 6.0% | ||||||
Containers & Packaging 3.0% | ||||||
Packaging Corp. of America* | 893,000 | 17,342,060 | ||||
Metals & Mining 3.0% | ||||||
Nucor Corp. | 221,400 | 10,157,832 | ||||
Peabody Energy Corp. | 244,600 | 7,673,102 | ||||
| 17,830,934 | ||||||
Telecommunication Services 0.8% | ||||||
Wireless Telecommunication Services | ||||||
Nextel Partners, Inc. “A”* | 616,700 | 4,841,095 | ||||
Total Common Stocks (Cost $475,210,424) | 558,215,626 | |||||
Cash Equivalents 5.9 % | ||||||
Cash Management Fund Institutional, 0.88% (b) (Cost $33,956,640) | 33,956,640 | 33,956,640 | ||||
| % of Net Assets | Value ($) | |||||
Total Investment Portfolio (Cost $509,167,064) (a) | 101.9 | 592,172,266 | ||||
Other Assets and Liabilities, Net | (1.9 | ) | (10,904,179 | ) | ||
Net Assets | 100.0 | 581,268,087 | ||||
| * | Non-income producing security. |
| (a) | The cost for federal income tax purposes was $509,788,944. At September 30, 2003, net unrealized appreciation for all securities based on tax cost was $82,383,322. This consisted of aggregate gross unrealized appreciation for all securities in which there was an excess of value over tax cost of $90,821,918 and aggregate gross unrealized depreciation for all securities in which there was an excess of tax cost over value of $8,438,596. |
| (b) | Cash Management Fund Institutional, an affiliated fund, is also managed by Deutsche Asset Management, Inc. The rate shown is the annualized seven-day yield at period end. |
The accompanying notes are an integral part of the financial statements.
14
Table of Contents
Scudder Mid Cap Fund
Statement of Assets and Liabilities as of September 30, 2003
Assets | ||||
Investments: | ||||
Investments in securities, at value (cost $475,210,424) | $ | 558,215,626 | ||
Investment in Cash Management Fund Institutional (cost $33,956,640) | 33,956,640 | |||
Total investments insecurities, at value (cost $509,167,064) | 592,172,266 | |||
Receivable for investments sold | 1,360,730 | |||
Dividends receivable | 279,531 | |||
Receivable for Fund shares sold | 808,950 | |||
Total assets | 594,621,477 | |||
Liabilities | ||||
Payable for investments purchased | 10,019,721 | |||
Payable for Fund shares redeemed | 2,718,970 | |||
Accrued investment advisory fee | 271,032 | |||
Other accrued expenses and payables | 343,667 | |||
Total liabilities | 13,353,390 | |||
Net assets, at value | $ | 581,268,087 | ||
Net Assets | ||||
Net assets consist of: | ||||
Net unrealized appreciation (depreciation) on investments | 83,005,202 | |||
Accumulated net realized gain (loss) | (100,800,204 | ) | ||
Paid-in capital | 599,063,089 | |||
Net assets, at value | $ | 581,268,087 | ||
The accompanying notes are an integral part of the financial statements.
15
Table of Contents
Scudder Mid Cap Fund
Statement of Assets and Liabilities as of September 30, 2003 (continued)
Net Asset Value | |||
Class A | |||
Net Asset Value and redemption price per share ($211,790,114 / 18,479,793 shares of capital stock outstanding, $.001 par value, unlimited number of shares authorized) | $ | 11.46 | |
Maximum offering price per share (100 / 94.25 of $11.46) | $ | 12.16 | |
Class B | |||
Net Asset Value, offering and redemption price (subject to contingent deferred sales charge) per share ($6,236,910 / 549,600 shares of capital stock outstanding, $.001 par value, unlimited number of shares authorized) | $ | 11.35 | |
Class C | |||
Net Asset Value and redemption price (subject to contingent deferred sales charge) per share ($4,648,135 / 409,524 shares of capital stock outstanding, $.001 par value, unlimited number of shares authorized) | $ | 11.35 | |
Maximum offering price per share (100 / 99.00 of $11.35) | $ | 11.46 | |
Investment Class | |||
Net Asset Value, offering and redemption price per share ($35,971,787 / 3,137,717 shares of capital stock outstanding, $.001 par value, unlimited number of shares authorized) | $ | 11.46 | |
Class R | |||
Net Asset Value, offering and redemption price per share ($10,630 / 928 shares of capital stock outstanding, $.001 par value, unlimited number of shares authorized) | $ | 11.45 | |
Institutional Class | |||
Net Asset Value, offering and redemption price per share ($322,610,511 / 27,923,065 shares of capital stock outstanding, $.001 par value, unlimited number of shares authorized) | $ | 11.55 |
The accompanying notes are an integral part of the financial statements.
16
Table of Contents
Scudder Mid Cap Fund
Statement of Operations for the year ended September 30, 2003
Investment Income | ||||
Income: | ||||
Dividends | $ | 1,763,431 | ||
Interest - Cash Management Fund Institutional | 283,424 | |||
Total Income | 2,046,855 | |||
Expenses: | ||||
Investment advisory fee | 2,547,503 | |||
Administrator service fee | 1,661,110 | |||
Distribution and shareholder servicing fees | 376,144 | |||
Auditing | 26,877 | |||
Legal | 8,433 | |||
Trustees’ fees and expenses | 8,038 | |||
Reports to shareholders | 25,712 | |||
Registration fees | 82,792 | |||
Other | 20,543 | |||
Total expenses, before expense reductions | 4,757,152 | |||
Expense reductions | (321,036 | ) | ||
Total expenses, after expense reductions | 4,436,116 | |||
Net investment income (loss) | (2,389,261 | ) | ||
Realized and Unrealized Gain (Loss) on Investment Transactions | ||||
Net realized gain (loss) from investments | (5,611,344 | ) | ||
Net unrealized appreciation (depreciation) during the period on investments | 98,214,735 | |||
Net gain (loss) on investment transactions | 92,603,391 | |||
Net increase (decrease) in net assets resulting from operations | $ | 90,214,130 | ||
The accompanying notes are an integral part of the financial statements.
17
Table of Contents
Scudder Mid Cap Fund
Statement of Changes in Net Assets
| Years Ended September 30, | ||||||||
| 2003 | 2002(a) | |||||||
Increase (Decrease) in Net Assets | ||||||||
Operations: | ||||||||
Net investment income (loss) | $ | (2,389,261 | ) | $ | (897,136 | ) | ||
Net realized gain (loss) on investment transactions | (5,611,344 | ) | (24,871,595 | ) | ||||
Net unrealized appreciation (depreciation) on investment transactions during the period | 98,214,735 | 2,831,687 | ||||||
Net increase (decrease) in net assets resulting from operations | 90,214,130 | (22,937,044 | ) | |||||
Fund share transactions: Proceeds from shares sold | 272,735,092 | 69,734,491 | ||||||
In-kind subscription | 103,862,346 | — | ||||||
Cost of shares redeemed | (79,546,144 | ) | (120,143,004 | ) | ||||
Net increase (decrease) in net assets from Fund share transactions | 297,051,294 | (50,408,513 | ) | |||||
Increase (decrease) in net assets | 387,265,424 | (73,345,557 | ) | |||||
Net assets at beginning of period | 194,002,663 | 267,348,220 | ||||||
Net assets at end of period | $ | 581,268,087 | $ | 194,002,663 | ||||
| a | On March 28, 2002, the Capital Appreciation Portfolio closed. The Statement of Changes in Net Assets includes the Fund’s information as a stand-alone and feeder fund for the respective period. |
The accompanying notes are an integral part of the financial statements.
18
Table of Contents
Scudder Mid Cap Fund
Class A
Years Ended September 30, | 2003 | 2002a | ||||||
Selected Per Share Data | ||||||||
Net asset value, beginning of period | $ | 9.31 | $ | 11.49 | ||||
Income (loss) from investment operations: | ||||||||
Net investment income (loss)b | (.08 | ) | (.01 | ) | ||||
Net realized and unrealized gain (loss) on investment transactions | 2.23 | (2.17 | ) | |||||
Total from investment operations | 2.15 | (2.18 | ) | |||||
Net asset value, end of period | $ | 11.46 | $ | 9.31 | ||||
Total Return (%)c | 23.09 | (18.97 | )** | |||||
Ratios to Average Net Assets and Supplemental Data | ||||||||
Net assets, end of period ($ millions) | 212 | .6 | ||||||
Ratio of expenses before expense reductions (%) | 1.34 | 1.48 | * | |||||
Ratio of expenses after expense reductions (%) | 1.25 | 1.25 | * | |||||
Ratio of net investment income (loss) (%) | (.74 | ) | (.63 | )* | ||||
Portfolio turnover rate (%) | 82 | 120d | ||||||
| a | For the period June 28, 2002 (commencement of sales of Class A shares) to September 30, 2002. |
| b | Based on average shares outstanding during the period. |
| c | Total return would have been lower had certain expenses not been reduced. Total return does not reflect the effect of any sales charges. |
| d | On March 28, 2002, the Capital Appreciation Portfolio was closed. This ratio includes the purchase and sale of portfolio securities of the Mid Cap Fund as a stand-alone fund in addition to the Capital Appreciation Portfolio. |
| * | Annualized |
| ** | Not annualized |
19
Table of Contents
Scudder Mid Cap Fund
Class B
Years Ended September 30, | 2003 | 2002a | ||||||
Selected Per Share Data | ||||||||
Net asset value, beginning of period | $ | 9.29 | $ | 11.49 | ||||
Income (loss) from investment operations: | ||||||||
Net investment income (loss)b | (.15 | ) | (.03 | ) | ||||
Net realized and unrealized gain (loss) on investment transactions | 2.21 | (2.17 | ) | |||||
Total from investment operations | 2.06 | (2.20 | ) | |||||
Net asset value, end of period | $ | 11.35 | $ | 9.29 | ||||
Total Return (%)c | 22.17 | (19.15 | )** | |||||
Ratios to Average Net Assets and Supplemental Data | ||||||||
Net assets, end of period ($ millions) | 6 | .3 | ||||||
Ratio of expenses before expense reductions (%) | 2.09 | 2.22 | * | |||||
Ratio of expenses after expense reductions (%) | 2.00 | 2.00 | * | |||||
Ratio of net investment income (loss) (%) | (1.49 | ) | (1.38 | )* | ||||
Portfolio turnover rate (%) | 82 | 120d | ||||||
| a | For the period June 28, 2002 (commencement of sales of Class B shares) to September 30, 2002. |
| b | Based on average shares outstanding during the period. |
| c | Total return would have been lower had certain expenses not been reduced. Total return does not reflect the effect of any sales charges. |
| d | On March 28, 2002, the Capital Appreciation Portfolio was closed. This ratio includes the purchase and sale of portfolio securities of the Mid Cap Fund as a stand-alone fund in addition to the Capital Appreciation Portfolio. |
| * | Annualized |
| ** | Not annualized |
20
Table of Contents
Scudder Mid Cap Fund
Class C
Years Ended September 30, | 2003 | 2002a | ||||||
Selected Per Share Data | ||||||||
Net asset value, beginning of period | $ | 9.29 | $ | 11.49 | ||||
Income (loss) from investment operations: | ||||||||
Net investment income (loss)b | (.16 | ) | (.03 | ) | ||||
Net realized and unrealized gain (loss) on investment transactions | 2.22 | (2.17 | ) | |||||
Total from investment operations | 2.06 | (2.20 | ) | |||||
Net asset value, end of period | $ | 11.35 | $ | 9.29 | ||||
Total Return (%)c | 22.17 | (19.15 | )** | |||||
Ratios to Average Net Assets and Supplemental Data | ||||||||
Net assets, end of period ($ millions) | 5 | .1 | ||||||
Ratio of expenses before expense reductions (%) | 2.09 | 2.20 | * | |||||
Ratio of expenses after expense reductions (%) | 2.00 | 2.00 | * | |||||
Ratio of net investment income (loss) (%) | (1.49 | ) | (1.38 | )* | ||||
Portfolio turnover rate (%) | 82 | 120d | ||||||
| a | For the period June 28, 2002 (commencement of sales of Class C shares) to September 30, 2002. |
| b | Based on average shares outstanding during the period. |
| c | Total return would have been lower had certain expenses not been reduced. Total return does not reflect the effect of any sales charges. |
| d | On March 28, 2002, the Capital Appreciation Portfolio was closed. This ratio includes the purchase and sale of portfolio securities of the Mid Cap Fund as a stand-alone fund in addition to the Capital Appreciation Portfolio. |
| * | Annualized |
| ** | Not annualized |
21
Table of Contents
Scudder Mid Cap Fund
Investment Class
Years Ended September 30, | 2003 | 2002 | 2001 | 2000 | 1999 | |||||||||||||||
Selected Per Share Data | ||||||||||||||||||||
Net asset value, beginning of period | $ | 9.31 | $ | 10.66 | $ | 17.57 | $ | 14.77 | $ | 11.38 | ||||||||||
Income (loss) from investment operations: | ||||||||||||||||||||
Net investment income (loss) | (.08 | )a | (.06 | )a | (.03 | ) | (.06 | ) | (.07 | ) | ||||||||||
Net realized and unrealized gain (loss) on investment transactions | 2.23 | (1.29 | ) | (6.41 | ) | 6.79 | 4.99 | |||||||||||||
Total from investment operations | 2.15 | (1.35 | ) | (6.44 | ) | 6.73 | �� | 4.92 | ||||||||||||
Less distributions from: | ||||||||||||||||||||
Net realized gains on investment transactions | — | — | (.47 | ) | (3.93 | ) | (1.53 | ) | ||||||||||||
Net asset value, end of period | $ | 11.46 | $ | 9.31 | $ | 10.66 | $ | 17.57 | $ | 14.77 | ||||||||||
Total Return (%)b | 23.09 | (12.66 | ) | (37.26 | ) | 53.65 | 47.05 | |||||||||||||
Ratios to Average Net Assets and Supplemental Data | ||||||||||||||||||||
Net assets, end of period ($ millions) | 36 | 29 | 36 | 48 | 29 | |||||||||||||||
Ratio of expenses before expense reductions (%) | 1.34 | 1.39c | 1.43c | 1.70c | 1.88c | |||||||||||||||
Ratio of expenses after expense reductions (%) | 1.25 | 1.25c | 1.25c | 1.25c | 1.25c | |||||||||||||||
Ratio of net investment income (loss) (%) | (.74 | ) | (.55 | ) | (.21 | ) | (.40 | ) | (.58 | ) | ||||||||||
Portfolio turnover rate (%) | 82 | 120d | 251 | 146 | 155 | |||||||||||||||
| a | Based on average shares outstanding during the period. |
| b | Total return would have been lower had certain expenses not been reduced. |
| c | The expense ratio of the Capital Appreciation Portfolio is included in this ratio. |
| d | On March 28, 2002, the Capital Appreciation Portfolio was closed. This ratio includes the purchase and sale of portfolio securities of the Mid Cap Fund as a stand-alone fund in addition to the Capital Appreciation Portfolio. |
| * | Annualized |
| ** | Not annualized |
22
Table of Contents
Scudder Mid Cap Fund
Class R
| 2003a | ||||
Selected Per Share Data | ||||
Net asset value, beginning of period | $ | 10.78 | ||
Income (loss) from investment operations: | ||||
Net investment income (loss)b | (.03 | ) | ||
Net realized and unrealized gain (loss) on investment transactions | .70 | |||
Total from investment operations | .67 | |||
Net asset value, end of period | $ | 11.45 | ||
Total Return (%) | 6.22 | ** | ||
Ratios to Average Net Assets and Supplemental Data | ||||
Net assets, end of period ($ millions) | .01 | |||
Ratio of expenses, before expense reductions (%) | 1.59 | * | ||
Ratio of expenses, after expense reductions (%) | 1.50 | * | ||
Ratio of net investment income (loss) (%) | (1.12 | )* | ||
Portfolio turnover rate (%) | 82 | |||
| a | For the period July 1, 2003 (commencement of sales of Class R shares) to September 30, 2003. |
| b | Based on average shares outstanding during the period. |
| * | Annualized |
| ** | Not annualized |
23
Table of Contents
Scudder Mid Cap Fund
Institutional Class
Years Ended September 30, | 2003 | 2002 | 2001 | 2000a | ||||||||||||
Selected Per Share Data | ||||||||||||||||
Net asset value, beginning of period | $ | 9.36 | $ | 10.69 | $ | 17.57 | $ | 18.60 | ||||||||
Income (loss) from investment operations: | ||||||||||||||||
Net investment income (loss) | (.05 | )b | (.04 | )b | .01 | (.00 | )c | |||||||||
Net realized and unrealized gain (loss) on investment transactions | 2.24 | (1.29 | ) | (6.42 | ) | (1.03 | ) | |||||||||
Total from investment operations | 2.19 | (1.33 | ) | (6.41 | ) | (1.03 | ) | |||||||||
Less distributions from: | ||||||||||||||||
Net realized gains on investment transactions | — | — | (.47 | ) | — | |||||||||||
Net asset value, end of period | $ | 11.55 | $ | 9.36 | $ | 10.69 | $ | 17.57 | ||||||||
Total Return (%)d | 23.40 | (12.44 | ) | (37.15 | ) | 55.50 | e** | |||||||||
Ratios to Average Net Assets and Supplemental Data | ||||||||||||||||
Net assets, end of period ($ millions) | 323 | 164 | 231 | 414 | ||||||||||||
Ratio of expenses before expense reductions (%) | 1.09 | 1.14 | f | 1.18 | f | 1.45 | f* | |||||||||
Ratio of expenses after expense reductions (%) | 1.00 | 1.00 | f | 1.00 | f | 1.00 | f* | |||||||||
Ratio of net investment income (loss) (%) | (.49 | ) | (.30 | ) | .04 | (.17 | )* | |||||||||
Portfolio turnover rate (%) | 82 | 120 | g | 251 | 146 | |||||||||||
| a | For the period August 31, 2000 (commencement of sales of Institutional Class shares) to September 30, 2000. |
| b | Based on average shares outstanding during the period. |
| c | Amount is less than $.005. |
| d | Total return would have been lower had certain expenses not been reduced. |
| e | At the close of business on August 31, 2000, shares of Equity Appreciation - Institutional Class merged into Institutional Class shares of Mid Cap. Equity Appreciation - Institutional Class was managed by the same investment management team with the same objectives, policies and strategies as Mid Cap. The performance shown reflects Equity Appreciation - Institutional Class shares’ actual returns from its inception on October 12, 1993. Performance for periods after August 31, 2000 reflect the performance of the Mid Cap Fund - Institutional Class. |
| f | The expense ratio of the Capital Appreciation Portfolio is included in this ratio. |
| g | On March 28, 2002, the Capital Appreciation Portfolio was closed. This ratio includes the purchase and sale of portfolio securities of the Mid Cap Fund as a stand-alone fund in addition to the Capital Appreciation Portfolio. |
| * | Annualized |
| ** | Not annualized |
24
Table of Contents
Scudder Mid Cap Fund
A. Significant Accounting Policies
Mid Cap Fund (“Scudder Mid Cap Fund” or the “Fund”) is a diversified series of Scudder Advisor Funds, formerly BT Investment Funds, which is registered under the Investment Company Act of 1940, as amended (the “1940 Act”), as an open-end management investment company organized as a Massachusetts business trust.
On March 8, 2001, the Board of Trustees approved dissolving the Mid Cap master-feeder structure, and converting Mid Cap to a stand-alone fund. On March 28, 2002, the Mid Cap Fund received assets with a value of $300,358,968 which included unrealized appreciation of $36,563,688 from the Capital Appreciation Portfolio in a tax free exchange for its beneficial ownership in the Portfolio. Activity prior to this conversion is included in the Statement of Operations.
The Fund offers multiple classes of shares which provide investors with different purchase options. Class A shares are offered to investors subject to an initial sales charge. Class B shares are offered without an initial sales charge but are subject to higher ongoing expenses than Class A shares and a contingent deferred sales charge payable upon certain redemptions. Class B shares automatically convert to Class A shares six years after issuance. Class C shares are offered to investors subject to an initial sales charge and are subject to higher ongoing expenses than Class A shares and a contingent deferred sales charge payable upon certain redemptions within one year of purchase. Prior to February 3, 2003, Class C shares were offered without an initial sales charge. Class C shares do not convert into another class. Investment Class shares are not subject to initial or contingent deferred sales charges. Institutional Class shares are offered to a limited group of investors, are not subject to initial or contingent deferred sales charges and have lower ongoing expenses than other classes. On July 1, 2003, the Fund commenced offering Class R shares which are offered to investors without an initial sales charge.
Investment income, realized and unrealized gains and losses, and certain fund-level expenses and expense reductions, if any, are borne pro rata on the basis of relative net assets by the holders of all classes of shares, except that each class bears certain expenses unique to that class such as distribution fees, service fees, administrator fees and certain other class-specific expenses. Differences in class-level expenses may result in payment of different per share dividends by class. All shares of the Fund have equal rights with respect to voting subject to class-specific arrangements.
The Fund’s financial statements are prepared in accordance with accounting principles generally accepted in the United States of America which require the use of management estimates. Actual results could differ from those estimates. The policies described below are followed consistently by the Fund in the preparation of its financial statements.
Security Valuation. Investments are stated at value determined as of the close of regular trading on the New York Stock Exchange on each day the exchange is open for trading. Equity securities are valued at the most recent sale price reported on the exchange (US or foreign) or over-the-counter market on which the security is traded most extensively. Securities for which no sales are reported are valued at the calculated mean between the most recent bid and asked quotations on the relevant market or, if a mean cannot be determined, at the most recent bid quotation.
Investments in open-end investment companies are valued at their net asset value each business day.
Securities and other assets for which market quotations are not readily available or for which the above valuation procedures are deemed not to reflect fair value are valued in a manner that is intended to reflect their fair value as determined in accordance with procedures approved by the Trustees.
Federal Income Taxes. The Fund’s policy is to comply with the requirements of the Internal Revenue Code, as amended, which are applicable to regulated investment companies, and to distribute all of its taxable income to its shareholders. Accordingly, the Fund paid no federal income taxes and no federal income tax provision was required.
At September 30, 2003 the Fund had a net tax basis capital loss carryforward of approximately $100,178,000, which may be applied against any realized net taxable capital gains of each succeeding year until fully utilized or until September 30, 2009 ($16,640,000), September 30, 2010 ($54,208,000) and September 30, 2011 ($29,330,000), the respective expiration dates, whichever occurs first.
Distribution of Income and Gains. Distributions of net investment income, if any, are made annually. Net realized gains from investment transactions, in excess of available capital loss carryforwards, would be taxable to the Fund if not distributed, and, therefore, will be distributed to shareholders at least annually.
25
Table of Contents
The timing and characterization of certain income and capital gains distributions are determined annually in accordance with federal tax regulations which may differ from accounting principles generally accepted in the United States of America. These differences primarily relate to securities sold at a loss. As a result, net investment income (loss) and net realized gain (loss) on investment transactions for a reporting period may differ significantly from distributions during such period. Accordingly, the Fund may periodically make reclassifications among certain of its capital accounts without impacting the net asset value of the Fund.
At September 30, 2003, the Fund’s components of distributable earnings (accumulated losses) on a tax-basis were as follows:
Undistributed ordinary income* | $ | — | ||
Undistributed net long-term capital gains | $ | — | ||
Capital loss carryforwards | $ | (100,178,000 | ) | |
Net unrealized appreciation (depreciation) on investments | $ | 82,383,322 |
| * | For tax purposes, short-term capital gains distributions are considered ordinary income distributions. |
Other. Investment transactions are accounted for on the trade date. Interest income is recorded on the accrual basis. Dividend income is recorded on the ex-dividend date. Realized gains and losses from investment transactions are recorded on an identified cost basis.
B. Purchases and Sales of Securities
During the year ended September 30, 2003, purchases and sales of investment securities (excluding short-term investments) aggregated $584,240,162 and $309,446,031, respectively.
C. Related Parties
Scudder Investments is part of Deutsche Asset Management, which is the marketing name in the US for the asset management activities of Deutsche Bank AG. Deutsche Asset Management, Inc. (“DeAM, Inc.” or the “Advisor”), an indirect, wholly owned subsidiary of Deutsche Bank AG, is the Fund’s Advisor. Investment Company Capital Corporation (“ICCC” or the “Administrator”), also an indirect, wholly owned subsidiary of Deutsche Bank AG, is the Fund’s Administrator.
Investment Advisory Agreement. Under the Investment Advisory Agreement, the Advisor directs the investments of the Fund in accordance with its investment objectives, policies and restrictions. The Advisor determines the securities, instruments and other contracts relating to investments to be purchased, sold or entered into by the Fund. The investment advisory fee payable under the Investment Advisory Agreement is equal to an annual rate of 0.65% of the Fund’s average daily net assets, computed and accrued daily and payable monthly. The Fund did not impose a portion of its advisory fees equivalent to the advisory fees charged on assets invested in the affiliated money market fund, Cash Management Fund Institutional.
For the year ended September 30, 2003, the Advisor and Administrator have agreed to waive their fees or reimburse expenses to the extent necessary to maintain the annualized expenses of the classes of the Fund as follows:
Class A | 1.25 | % | |
Class B | 2.00 | % | |
Class C | 2.00 | % | |
Investment Class | 1.25 | % | |
Class R | 1.50 | % | |
Institutional Class | 1.00 | % |
26
Table of Contents
Accordingly, for the year ended September 30, 2003, the Advisor waived a portion of its fee pursuant to the an Expense Limitation Agreement aggregating $321,036 and the amount imposed aggregated $2,226,467, which was equivalent to an annual effective rate of 0.56% of the Fund’s average daily net assets.
Administrator. For its services as Administrator, ICCC receives a fee (the “Administrator Service Fee”) of 0.65% of the average daily net assets for the Investment Class shares and 0.40% of average daily net assets for Class A, B, C, R and Institutional shares for the Fund, computed and accrued daily and payable monthly. For the year ended September 30, 2003, the Administrator Service Fee was as follows:
Administrator Service Fee | Total Aggregated | Unpaid at September 30, 2003 | ||||
Class A | $ | 526,014 | $ | 69,580 | ||
Class B | 11,555 | 1,287 | ||||
Class C | 7,395 | 890 | ||||
Investment Class | 206,613 | 24,072 | ||||
Class R | 11 | 6 | ||||
Institutional Class | 909,522 | 103,184 | ||||
| $ | 1,661,110 | $ | 199,019 | |||
Distribution Agreement. Under the Distribution Agreement, in accordance with Rule 12b-1 under the 1940 Act, Scudder Distributors, Inc. (“SDI”), an affiliate of the Advisor, receives a fee (“Distribution Fee”) of 0.25% of the average daily net assets of the Class A and R shares and 0.75% of average daily net assets of the Class B and C shares. Pursuant to the agreement, SDI enters into related selling group agreements with various firms at various rates for sales of Class B and C shares. For the year ended September 30, 2003, the Distribution Fee was as follows:
Distribution Fee | Total Aggregated | Unpaid at September 30, 2003 | ||||
Class A | $ | 328,755 | $ | 29,849 | ||
Class B | 21,667 | 3,772 | ||||
Class C | 13,866 | 2,759 | ||||
Class R | 6 | — | ||||
| $ | 364,294 | $ | 36,380 | |||
In addition, SDI provides information and administrative services (“Shareholder Servicing Fee”) to Class B, C and R shareholders at an annual rate of 0.25% of average daily net assets for each such class. SDI in turn has various agreements with financial services firms that provide these services and pays these fees based upon the assets of shareholder accounts the firms service. For the year ended September 30, 2003, the Shareholder Servicing Fee was as follows:
Shareholder Servicing Fee | Total Aggregated | Unpaid at September 30, 2003 | Effective Rate | ||||||
Class B | $ | 7,222 | $ | 606 | .25 | % | |||
Class C | 4,622 | 429 | .25 | % | |||||
Class R | 6 | 4 | .25 | % | |||||
| $ | 11,850 | $ | 1,039 | ||||||
27
Table of Contents
Underwriting Agreement and Contingent Deferred Sales Charge. SDI is the principal underwriter for Class A, B and C shares. Underwriting commissions paid in connection with the distribution of Class A and C shares for the year ended September 30, 2003 aggregated $15,448 and $54, respectively.
In addition, SDI receives any contingent deferred sales charge (“CDSC”) from Class B share redemptions occurring within six years of purchase and Class C share redemptions occurring within one year of purchase. There is no such charge upon redemption of any share appreciation or reinvested dividends. The CDSC is based on declining rates ranging from 4% to 1% for Class B and 1% for Class C, of the value of the shares redeemed. For the year ended September 30, 2003, the CDSC for the Fund’s Class B and C shares was $4,297 and $358, respectively.
Other. The Fund may invest in Cash Management Fund Institutional, an open-end management investment company managed by DeAM, Inc.
Trustees’ Fees and Expenses. The Fund pays each Trustee not affiliated with the Advisor retainer fees plus specified amounts for attended board and committee meetings.
D. Line of Credit
Prior to April 11, 2003, the Fund and several other affiliated funds (the “Participants”) shared in a $200 million revolving credit facility administered by a syndicate of banks for temporary or emergency purposes, including the meeting of redemption requests that otherwise might require the untimely disposition of securities. The Participants were charged an annual commitment fee which was allocated, pro rata based upon net assets, among each of the Participants. Interest was calculated at the Federal Funds Rate plus 0.625 percent.
Effective April 11, 2003, the Fund and several other affiliated funds (the “Participants”) entered into a $1.25 billion revolving credit facility administered by J.P. Morgan Chase Bank for temporary or emergency purposes, including the meeting of redemption requests that otherwise might require the untimely disposition of securities. The Participants are charged an annual commitment fee which is allocated, pro rata based upon net assets, among each of the Participants. Interest is calculated at the Federal Funds Rate plus 0.5 percent. The Fund may borrow up to a maximum of 33 percent of its net assets under the agreement.
28
Table of Contents
E. Share Transactions
The following table summarizes share and dollar activity in the Fund:
Year Ended September 30, 2003 | Year Ended September 30, 2002* | |||||||||||||
| Shares | Dollars | Shares | Dollars | |||||||||||
Shares sold | ||||||||||||||
Class A | 19,601,740 | $ | 199,012,862 | 69,836 | $ | 695,167 | ||||||||
Class B | 576,020 | 5,883,977 | 28,140 | 279,519 | ||||||||||
Class C | 432,633 | 4,390,031 | 10,305 | 103,507 | ||||||||||
Investment Class | 1,330,437 | 13,297,401 | 1,607,119 | 18,568,851 | ||||||||||
Class R** | 933 | 10,052 | — | — | ||||||||||
Institutional Class | 4,698,398 | 50,140,769 | 4,380,586 | 50,087,447 | ||||||||||
| $ | 272,735,092 | $ | 69,734,491 | |||||||||||
In-kind subscription | ||||||||||||||
Institutional Class | 10,955,944 | $ | 103,862,346 | — | — | |||||||||
| $ | 103,862,346 | — | ||||||||||||
Shares redeemed | �� | |||||||||||||
Class A | (1,186,677 | ) | $ | (12,330,075 | ) | (5,106 | ) | $ | (51,176 | ) | ||||
Class B | (54,560 | ) | (555,530 | ) | — | — | ||||||||
Class C | (33,414 | ) | (349,493 | ) | — | — | ||||||||
Investment Class | (1,318,483 | ) | (13,349,817 | ) | (1,852,563 | ) | (21,525,713 | ) | ||||||
Class R** | (5 | ) | (56 | ) | — | — | ||||||||
Institutional Class | (5,242,506 | ) | (52,961,173 | ) | (8,510,615 | ) | (98,566,115 | ) | ||||||
| $ | (79,546,144 | ) | $ | (120,143,004 | ) | |||||||||
Net increase (decrease) | ||||||||||||||
Class A | 18,415,063 | $ | 186,682,787 | 64,730 | $ | 643,991 | ||||||||
Class B | 521,460 | 5,328,447 | 28,140 | 279,519 | ||||||||||
Class C | 399,219 | 4,040,538 | 10,305 | 103,507 | ||||||||||
Investment Class | 11,954 | (52,416 | ) | (245,444 | ) | (2,956,862 | ) | |||||||
Class R** | 928 | 9,996 | — | — | ||||||||||
Institutional Class | 10,411,836 | 101,041,942 | (4,130,029 | ) | (48,478,668 | ) | ||||||||
| $ | 297,051,294 | $ | (50,408,513 | ) | ||||||||||
| * | For Class A, B and C shares for the period June 28, 2002 (commencement of sales) to September 30, 2002. |
| ** | For the period July 1, 2003 (commencement of sales of Class R shares) to September 30, 2003. |
F. In-Kind Subscription
As part of Deutsche Bank’s effort to consolidate various legacy retirement plans, Deutsche Bank implemented a program to transfer various plan assets as a means to streamline the number of investment options offered to employee plan participants. As part of the consolidation program, on March 28, 2003 the Scudder Mid Cap Fund accepted securities and cash in payment for fund shares (received an in-kind subscription) from the BT Partnershare retirement plan in accordance with the Fund’s purchase in-kind procedures. The transaction represented a percentage of the Fund’s net assets at March 31, 2003 as follows:
| Purchase Amount | % of Net Assets | ||||
Mid Cap Fund | $ | 103,862,346 | 37 | ||
G. Other Information
Effective April 25, 2003, State Street Bank and Trust Company (“State Street”) is the Fund’s custodian. Prior to April 25, 2003, Deutsche Bank Trust Company Americas (formerly Bankers Trust Company), an affiliate of the Fund’s Advisor and Administrator, served as custodian for the Fund.
29
Table of Contents
Report of Independent Auditors
To the Trustees of Scudder Advisor Funds (formerly BT Investment Funds) and Shareholders of Mid Cap Fund:
In our opinion, the accompanying statement of assets and liabilities, including the investment portfolio, and the related statements of operations and of changes in net assets and the financial highlights present fairly, in all material respects, the financial position of Mid Cap Fund (the “Fund”) at September 30, 2003, and the results of its operations, the changes in its net assets and the financial highlights for each of the periods indicated therein, in conformity with accounting principles generally accepted in the United States of America. These financial statements and financial highlights (hereafter referred to as “financial statements”) are the responsibility of the Fund’s management; our responsibility is to express an opinion on these financial statements based on our audits. We conducted our audits of these financial statements in accordance with auditing standards generally accepted in the United States of America, which require that we plan and perform the audit to obtain reasonable assurance about whether the financial statements are free of material misstatement. An audit includes examining, on a test basis, evidence supporting the amounts and disclosures in the financial statements, assessing the accounting principles used and significant estimates made by management, and evaluating the overall financial statement presentation. We believe that our audits, which included confirmation of securities at September 30, 2003 by correspondence with the custodian and brokers, provide a reasonable basis for our opinion.
Boston, Massachusetts November 24, 2003 | PricewaterhouseCoopers LLP |
30
Table of Contents
Performance Summary September 30, 2003
Average Annual Total Returns* (Unadjusted for Sales Charge)
Scudder Small Cap Fund | 1-Year | 3-Year | 5-Year | Life of Fund** | ||||||||
Class A(a) | 19.06 | % | -7.87 | % | 10.16 | % | 12.41 | % | ||||
Class B(a) | 18.19 | % | -8.56 | % | 9.34 | % | 11.57 | % | ||||
Class C(a) | 18.19 | % | -8.56 | % | 9.34 | % | 11.57 | % | ||||
Investment Class+ | 19.13 | % | -7.87 | % | 10.16 | % | 12.42 | % | ||||
Russell 2000 Index++ | 36.50 | % | -.82 | % | 7.46 | % | 8.07 | % |
| Source: | Lipper Inc. and Deutsche Asset Management, Inc. |
| + | Investment Class shares are not subject to sales charges. |
Net Asset Value
| Class A | Class B | Class C | Investment Class | |||||||||
Net Asset Value: | ||||||||||||
9/30/03 | $ | 19.74 | $ | 19.56 | $ | 19.56 | $ | 19.74 | ||||
9/30/02 | $ | 16.58 | $ | 16.55 | $ | 16.55 | $ | 16.57 | ||||
Investment Class Lipper Rankings* - Small-Cap Growth Funds Category
Period | Rank | Number of Funds Tracked | Percentile Ranking | |||||
1-Year | 442 | of | 465 | 95 | ||||
3-Year | 100 | of | 361 | 28 | ||||
5-Year | 61 | of | 250 | 25 |
Rankings are historical and do not guarantee future results. Rankings are based on total return with distributions reinvested.
Source: Lipper Inc.
31
Table of Contents
Scudder Small Cap Fund
Growth of an Assumed $10,000 Investment*(b) (Adjusted for Sales Charge)
[] Scudder Small Cap Fund - Class A(c)
[] Russell 2000 Index++
[GRAPHIC APPEARS HERE]
Yearly periods ended September 30
Comparative Results* (Adjusted for Sales Charge)
Scudder Small Cap Fund | 1-Year | 3-Year | 5-Year | Life of Fund** | ||||||||||||||
Class A(c) | Growth of $10,000 Average annual total return | $ | 11,228 12.28 | % | $ | 7,369 -9.67 | % | $ | 15,288 8.86 | % | $ | 30,188 11.75 | % | |||||
Class B(c) | Growth of $10,000 Average annual total return | $ | 11,426 14.26 | % | $ | 7,429 -9.43 | % | $ | 15,527 9.20 | % | $ | 29,721 11.57 | % | |||||
Class C(c) | Growth of $10,000 Average annual total return | $ | 11,708 17.08 | % | $ | 7,570 -8.86 | % | $ | 15,471 9.12 | % | $ | 29,423 11.46 | % | |||||
Russell 2000 Index++ | Growth of $10,000 Average annual total return | $ | 13,650 36.50 | % | $ | 9,755 -.82 | % | $ | 14,332 7.46 | % | $ | 21,590 8.07 | % | |||||
The growth of $10,000 is cumulative.
32
Table of Contents
Scudder Small Cap Fund
Growth of an Assumed $10,000 Investment*
[] Scudder Small Cap Fund - Investment Class
[] Russell 2000 Index++
[GRAPHIC APPEARS HERE]
Yearly periods ended September 30
Comparative Results*
Scudder Small Cap Fund | 1-Year | 3-Year | 5-Year | Life of Fund** | ||||||||||||||
Investment Class | Growth of $10,000 Average annual total return | $ | 11,913 19.13 | % | $ | 7,819 -7.87 | % | $ | 16,221 10.16 | % | $ | 32,029 12.42 | % | |||||
Russell 2000 Index++ | Growth of $10,000 Average annual total return | $ | 13,650 36.50 | % | $ | 9,755 -.82 | % | $ | 14,332 7.46 | % | $ | 21,590 8.07 | % | |||||
The growth of $10,000 is cumulative.
33
Table of Contents
Notes to Performance Summary
| * | Returns and rankings during all periods shown reflect a fee waiver and/or expense reimbursement. Without this waiver/reimbursement, returns and rankings would have been lower. |
| ** | The Fund commenced operations on October 21, 1993. Index returns begin October 31, 1993. |
| a | Returns shown for Class A, B and C shares for the periods prior to their inception on June 28, 2002 are derived from the historical performance of Investment Class shares of the Scudder Small Cap Fund during such periods and have been adjusted to reflect the higher gross total annual operating expenses of each specific class. Any difference in expenses will affect performance. |
| b | The Fund’s growth of an assumed $10,000 investment is adjusted for the maximum sales charge of 5.75%. This results in a net investment of $9,425. |
| c | Returns shown for Class A, B and C shares for the periods prior to their inception on June 28, 2002 are derived from the historical performance of Investment Class shares of the Scudder Small Cap Fund during such periods and have been adjusted to reflect the higher gross total annual operating expenses and the current applicable sales charges of each specific class. Returns for Class A reflect the current maximum initial sales charge of 5.75%. Class B share performance is adjusted for the applicable contingent deferred sales charge (“CDSC”), which is 4% within the first year after purchase, declining to 0% after six years. Returns for Class C reflect an initial sales charge of 1%. Redemptions on Class C shares within one year of purchase may be subject to a CDSC of 1%. Any difference in expenses will affect performance. |
| ++ | Russell 2000 Index is an unmanaged index that tracks the common stock price movement of the 2000 smallest companies of the Russell 3000 Index, which measures the performance of the 3000 largest US companies based on total market capitalization. |
Index returns assume reinvestment of dividends and, unlike Fund returns, do not reflect any fees or expenses. It is not possible to invest directly into an index.
All performance is historical, assumes reinvestment of all dividends and capital gains, and is not indicative of future results. Investment return and principal value will fluctuate, so an investor’s shares, when redeemed, may be worth more or less than when purchased. Performance figures do not reflect the deduction of taxes that a shareholder would pay on fund distributions or the redemption of fund shares. Returns and rankings may differ by share class.
Investments in funds involve risk. Some funds have more risk than others. These include funds that allow exposure to or otherwise concentrate investments in certain sectors, geographic regions, security types, market capitalization or foreign securities (e.g., political or economic instability, which can be accentuated in emerging market countries). Please read this fund’s prospectus for specific details regarding its investments and risk profile.
Please call (800) 621-1048 for the Fund’s most up-to-date performance. On the Web, go to scudder.com.
34
Table of Contents
Portfolio Summary September 30, 2003
Scudder Small Cap Fund
Asset Allocation | 9/30/03 | 9/30/02 | ||||
Common Stocks | 94 | % | 99 | % | ||
Cash Equivalents, net | 6 | % | 1 | % | ||
| 100 | % | 100 | % | |||
Sector Diversification (Excludes Cash Equivalents) | 9/30/03 | 9/30/02 | ||||
Information Technology | 27 | % | 14 | % | ||
Industrials | 18 | % | 22 | % | ||
Health Care | 15 | % | 14 | % | ||
Financials | 13 | % | 10 | % | ||
Consumer Discretionary | 12 | % | 13 | % | ||
Materials | 5 | % | 10 | % | ||
Consumer Staples | 5 | % | 6 | % | ||
Energy | 4 | % | 8 | % | ||
Utilities | 1 | % | 3 | % | ||
| 100 | % | 100 | % | |||
Ten Largest Equity Holdings at September 30, 2003 (26.9% of Portfolio) | |||
1. Documentum Inc. Developer of software products | 3.4 | % | |
2. Fairchild Semiconductor Corp. Designer, developer and marketer of semiconductors | 3.2 | % | |
3. ITT Educational Services, Inc. Provider of technology-oriented postsecondary degree programs | 3.1 | % | |
4. DSP Group, Inc. Developer of digital signal processing solutions for telecommunications and computers | 3.0 | % | |
5. Zoran Corp. Manufacturer of integrated circuits and software | 2.5 | % | |
6. United Natural Foods, Inc. Distributor of natural foods and related products | 2.5 | % | |
7. CACI International, Inc. Provider of information technology products and services | 2.4 | % | |
8. Cooper Companies, Inc. Producer of medical products | 2.3 | % | |
9. Swift Transportation Co., Inc. Provider of truckload carrier services | 2.3 | % | |
10. Packaging Corp. of America Manufacturer of containerboard and corrugated packaging products | 2.2 | % |
Asset allocation, sector diversification and portfolio holdings are subject to change.
For more complete details about the fund’s investment portfolio, see page 47. A quarterly Fact Sheet and Portfolio Holdings are available upon request.
35
Table of Contents
Investment Portfolio as of September 30, 2003
Scudder Small Cap Fund | Shares | Value ($) | ||||
Common Stocks 94.0% | ||||||
Consumer Discretionary 11.2% | ||||||
Automobiles 1.3% | ||||||
Thor Industries, Inc. | 83,200 | 4,494,464 | ||||
Hotels, Restaurants & Leisure 4.1% | ||||||
Shuffle Master, Inc.* | 248,500 | 6,754,230 | ||||
The Cheesecake Factory, Inc.* | 204,000 | 7,378,680 | ||||
| 14,132,910 | ||||||
Household Durables 1.7% | ||||||
Furniture Brands International, Inc.* | 245,900 | 5,926,190 | ||||
Media 1.1% | ||||||
Harris Interactive, Inc.* | 457,300 | 3,219,392 | ||||
Journal Communications, Inc. “A”* | 35,400 | 585,870 | ||||
| 3,805,262 | ||||||
Specialty Retail 1.6% | ||||||
Jo-Ann Stores, Inc. “A”* | 124,500 | 3,473,550 | ||||
Tractor Supply Co.* | 59,400 | 1,948,914 | ||||
| 5,422,464 | ||||||
Textiles, Apparel & Luxury Goods 1.4% | ||||||
Gildan Activewear, Inc.* | 163,200 | 4,589,184 | ||||
Consumer Staples 4.3% | ||||||
Food & Drug Retailing | ||||||
Performance Food Group Co.* | 146,100 | 5,947,731 | ||||
United Natural Foods, Inc.* | 264,600 | 8,782,074 | ||||
| 14,729,805 | ||||||
Energy 4.1% | ||||||
Energy Equipment & Services 2.1% | ||||||
FMC Technologies, Inc.* | 330,400 | 7,077,168 | ||||
Oil & Gas 2.0% | ||||||
Ultra Petroleum Corp.* | 241,900 | 3,374,505 | ||||
Western Gas Resources, Inc. | 95,700 | 3,636,600 | ||||
| 7,011,105 | ||||||
Financials 12.6% | ||||||
Banks 1.0% | ||||||
First Niagara Financial Group | 239,200 | 3,611,920 | ||||
Diversified Financials 6.5% | ||||||
Affiliated Managers Group, Inc.* | 113,100 | 7,102,680 | ||||
Investment Technology Group, Inc.* | 363,800 | 6,977,684 | ||||
Labranche & Co., Inc. | 342,600 | 5,001,960 | ||||
National Financial Partners Corp.* | 122,700 | 3,312,900 | ||||
| 22,395,224 | ||||||
Insurance 3.6% | ||||||
Direct General Corp.* | 136,600 | 3,424,562 | ||||
Platinum Underwriters Holdings Ltd. | 218,700 | 6,145,470 | ||||
Scottish Re Group Ltd. | 107,700 | 2,600,955 | ||||
| 12,170,987 | ||||||
Real Estate 1.5% | ||||||
LNR Property Corp. (REIT) | 122,300 | 5,008,185 | ||||
Health Care 13.7% | ||||||
Biotechnology 5.0% | ||||||
IDEXX Laboratories, Inc.* | 129,900 | 5,519,451 | ||||
Martek Biosciences Corp.* | 101,900 | 5,367,073 | ||||
Neurocrine Biosciences, Inc.* | 130,300 | 6,452,456 | ||||
| 17,338,980 | ||||||
Health Care Equipment & Supplies 6.5% | ||||||
Cooper Companies, Inc. | 198,300 | 8,080,725 | ||||
Edwards Lifesciences Corp.* | 241,700 | 6,545,236 | ||||
Integra LifeSciences Holdings Corp.* | 269,400 | 7,621,326 | ||||
| 22,247,287 | ||||||
Pharmaceuticals 2.2% | ||||||
NPS Pharmaceuticals, Inc.* | 265,900 | 7,405,315 | ||||
Industrials 17.3% | ||||||
Aerospace & Defense 1.1% | ||||||
EDO Corp. | 189,300 | 3,833,325 | ||||
Airlines 2.5% | ||||||
Frontier Airlines, Inc.* | 216,800 | 3,568,528 | ||||
SkyWest, Inc. | 284,500 | 4,927,540 | ||||
| 8,496,068 | ||||||
Commercial Services & Supplies 4.1% | ||||||
ABM Industries, Inc. | 240,700 | 3,405,905 | ||||
ITT Educational Services, Inc.* | 224,100 | 10,738,872 | ||||
| 14,144,777 | ||||||
Construction & Engineering 2.0% | ||||||
Insituform Technologies, Inc.* | 191,900 | 3,408,144 | ||||
Quanta Services, Inc.* | 425,100 | 3,515,577 | ||||
| 6,923,721 | ||||||
Machinery 1.4% | ||||||
Joy Global, Inc.* | 311,300 | 4,887,410 | ||||
Road & Rail 6.2% | ||||||
Heartland Express, Inc.* | 252,721 | 6,070,358 | ||||
Swift Transportation Co., Inc.* | 350,100 | 7,943,769 | ||||
USF Corp. | 228,900 | 7,203,483 | ||||
| 21,217,610 | ||||||
Information Technology 25.0% | ||||||
Communications Equipment 4.2% | ||||||
Avocent Corp.* | 228,600 | 6,924,294 | ||||
Enterasys Networks, Inc.* | 1,862,400 | 7,449,600 | ||||
| 14,373,894 | ||||||
Computers & Peripherals 1.7% | ||||||
Applied Films Corp.* | 196,900 | 5,853,837 | ||||
IT Consulting & Services 2.5% | ||||||
CACI International, Inc. “A”* | 198,900 | 8,522,865 | ||||
Semiconductor Equipment & Products 10.7% | ||||||
AMIS Holdings, Inc.* | 18,100 | 334,126 | ||||
DSP Group, Inc.* | 415,600 | 10,352,596 | ||||
Fairchild Semiconductor Corp.* | 672,600 | 11,151,708 | ||||
Sigmatel, Inc.* | 10,100 | 208,161 | ||||
Skyworks Solutions, Inc.* | 669,800 | 6,095,180 | ||||
Zoran Corp.* | 451,150 | 8,797,425 | ||||
| 36,939,196 | ||||||
Software 5.9% | ||||||
Borland Software Corp.* | 589,200 | 5,426,532 | ||||
Documentum, Inc.* | 554,400 | 11,814,264 | ||||
THQ, Inc.* | 182,000 | 2,988,440 | ||||
| 20,229,236 | ||||||
Materials 4.9% | ||||||
Containers & Packaging 2.3% | ||||||
Packaging Corp. of America * | 397,700 | 7,723,334 | ||||
Metals & Mining 2.6% | ||||||
Peabody Energy Corp. | 189,100 | 5,932,067 | ||||
Steel Dynamics, Inc.* | 201,600 | 3,052,224 | ||||
| 8,984,291 | ||||||
Utilities 0.9% | ||||||
Water Utilities | ||||||
Philadelphia Suburban Corp. | 127,875 | 3,079,230 | ||||
Total Common Stocks (Cost $291,098,066) | 322,575,244 | |||||
Cash Equivalents 7.7% | ||||||
Cash Management Fund Institutional, 0.88% (b) (Cost $26,534,901) | 26,534,901 | 26,534,901 | ||||
| % of Net Assets | Value ($) | |||||
Total Investment Portfolio (Cost $317,632,967) (a) | 101.7 | 349,110,145 | ||||
Other Assets and Liabilities, Net | (1.7 | ) | (5,699,671 | ) | ||
Net Assets | 100.0 | 343,410,474 | ||||
| * | Non-income producing security. |
| (a) | The cost for federal income tax purposes was $318,213,519. At September 30, 2003, net unrealized appreciation for all securities based on tax cost was $30,896,626. This consisted of aggregate gross unrealized appreciation for all securities in which there was an excess of value over tax cost of $37,266,577 and aggregate gross unrealized depreciation for all securities in which there was an excess of tax cost over value of $6,369,951. |
| (b) | Cash Management Fund Institutional, an affiliated fund, is also managed by Deutsche Asset Management, Inc. The rate shown is the annualized seven-day yield at period end. |
The accompanying notes are an integral part of the financial statements.
36
Table of Contents
Scudder Small Cap Fund
Statement of Assets and Liabilities as of September 30, 2003
Assets | ||||
Investments: | ||||
Investments in securities, at value (cost $291,098,066) | $ | 322,575,244 | ||
Investment in Cash Management Fund Institutional (cost $26,534,901) | 26,534,901 | |||
Total Investments in securities, at value (cost $317,632,967) | 349,110,145 | |||
Receivable for investments sold | 3,114,191 | |||
Dividends receivable | 31,839 | |||
Interest receivable | 9,066 | |||
Receivable for Fund shares sold | 3,208,109 | |||
Other assets | 16,680 | |||
Total assets | 355,490,030 | |||
Liabilities | ||||
Payable for investments purchased | 9,055,506 | |||
Payable for Fund shares redeemed | 2,644,799 | |||
Accrued investment advisory fee | 153,221 | |||
Other accrued expenses and payables | 226,030 | |||
Total liabilities | 12,079,556 | |||
Net assets, at value | $ | 343,410,474 | ||
Net Assets | ||||
Net assets consist of: | ||||
Accumulated net investment loss | (1,483 | ) | ||
Net unrealized appreciation (depreciation) on investments | 31,477,178 | |||
Accumulated net realized gain (loss) | (29,192,954 | ) | ||
Paid-in capital | 341,127,733 | |||
Net assets, at value | $ | 343,410,474 | ||
The accompanying notes are an integral part of the financial statements.
37
Table of Contents
Scudder Small Cap Fund
Statement of Assets and Liabilities as of September 30, 2003 (continued)
Net Asset Value | |||
Class A | |||
Net Asset Value and redemption price per share ($25,481,953 / 1,290,837 shares of capital stock outstanding, $.001 par value, unlimited number of shares authorized) | $ | 19.74 | |
Maximum offering price per share (100 / 94.25 of $19.74) | $ | 20.94 | |
Class B | |||
Net Asset Value, offering and redemption price (subject to contingent deferred sales charge) per share ($2,287,203 / 116,927 shares of capital stock outstanding, $.001 par value, unlimited number of shares authorized) | $ | 19.56 | |
Class C | |||
Net Asset Value and redemption price (subject to contingent deferred sales charge) per share ($2,411,464 / 123,276 shares of capital stock outstanding, $.001 par value, unlimited number of shares authorized) | $ | 19.56 | |
Maximum offering price per share (100 / 99.00 of $19.56) | $ | 19.76 | |
Investment Class | |||
Net Asset Value, offering and redemption price per share ($313,229,854 / 15,870,787 shares of capital stock outstanding, $.001 par value, unlimited number of shares authorized) | $ | 19.74 |
The accompanying notes are an integral part of the financial statements.
38
Table of Contents
Scudder Small Cap Fund
Statement of Operations for the year ended September 30, 2003
Investment Income | ||||
Income: | ||||
Dividends | $ | 708,464 | ||
Interest - Cash Management Fund Institutional | 192,661 | |||
Total Income | 901,125 | |||
Expenses: Investment advisory fee | 1,629,489 | |||
Administrator service fee | 1,621,183 | |||
Distribution and shareholder servicing fees | 53,665 | |||
Auditing | 40,830 | |||
Legal | 43,676 | |||
Trustees’ fees and expenses | 9,562 | |||
Reports to shareholders | 20,172 | |||
Registration fees | 60,971 | |||
Other | 16,130 | |||
Total expenses, before expense reductions | 3,495,678 | |||
Expense reductions | (290,635 | ) | ||
Total expenses, after expense reductions | 3,205,043 | |||
Net investment income (loss) | (2,303,918 | ) | ||
Realized and Unrealized Gain (Loss) on Investment Transactions | ||||
Net realized gain (loss) from investments | (14,930,010 | ) | ||
Net unrealized appreciation (depreciation) during the period on investments | 66,694,997 | |||
Net gain (loss) on investment transactions | 51,764,987 | |||
Net increase (decrease) in net assets resulting from operations | $ | 49,461,069 | ||
The accompanying notes are an integral part of the financial statements.
Scudder Small Cap Fund
Statement of Changes in Net Assets
Years Ended September 30, | ||||||||
Increase (Decrease) in Net Assets | 2003 | 2002(a) | ||||||
Operations: | ||||||||
Net investment income (loss) | $ | (2,303,918 | ) | $ | (1,694,071 | ) | ||
Net realized gain (loss) on investment transactions | (14,930,010 | ) | (10,281,057 | ) | ||||
Net unrealized appreciation (depreciation) on investment transactions during the period | 66,694,997 | (29,062,702 | ) | |||||
Net increase (decrease) in net assets resulting from operations | 49,461,069 | (41,037,830 | ) | |||||
Fund share transactions: Proceeds from shares sold | 183,028,197 | 127,606,069 | ||||||
In-kind subscription | 52,899,162 | — | ||||||
Cost of shares redeemed | (146,431,067 | ) | (123,423,158 | ) | ||||
Net increase (decrease) in net assets from Fund share transactions | 89,496,292 | 4,182,911 | ||||||
Increase (decrease) in net assets | 138,957,361 | (36,854,919 | ) | |||||
Net assets at beginning of period | 204,453,113 | 241,308,032 | ||||||
Net assets at end of period (including accumulated net investment loss of $1,483 at September 30, 2003) | $ | 343,410,474 | $ | 204,453,113 | ||||
| a | On March 28, 2002, the Small Cap Portfolio closed. The Statement of Changes in Net Assets includes the Fund’s information as a stand-alone and feeder fund for the respective period. |
The accompanying notes are an integral part of the financial statements.
39
Table of Contents
Scudder Small Cap Fund
Class A
Years Ended September 30, | 2003 | 2002a | ||||||
Selected Per Share Data | ||||||||
Net asset value, beginning of period | $ | 16.58 | $ | 20.69 | ||||
Income (loss) from investment operations: | ||||||||
Net investment income (loss)b | (.16 | ) | (.03 | ) | ||||
Net realized and unrealized gain (loss) on investment transactions | 3.32 | (4.08 | ) | |||||
Total from investment operations | 3.16 | (4.11 | ) | |||||
Net asset value, end of period | $ | 19.74 | $ | 16.58 | ||||
Total Return (%)c | 19.06 | (19.86 | )** | |||||
Ratios to Average Net Assets and Supplemental Data | ||||||||
Net assets, end of period ($ millions) | 25 | .6 | ||||||
Ratio of expenses before expense reductions (%) | 1.37 | 1.37 | * | |||||
Ratio of expenses after expense reductions (%) | 1.25 | 1.25 | * | |||||
Ratio of net investment income (loss) (%) | (.90 | ) | (.75 | )* | ||||
Portfolio turnover rate (%) | 74 | 87d | ||||||
| a | For the period June 28, 2002 (commencement of sales of Class A shares) to September 30, 2002. |
| b | Based on average shares outstanding during the period. |
| c | Total return would have been lower had certain expenses not been reduced. Total return does not reflect the effect of any sales charges. |
| d | On March 28, 2002, the Small Cap Portfolio was closed. This ratio includes the purchase and sale of portfolio securities of the Small Cap Fund as a stand-alone fund in addition to the Small Cap Portfolio. |
| * | Annualized |
| ** | Not annualized |
Scudder Small Cap Fund
Class B
Years Ended September 30, | 2003 | 2002a | ||||||
Selected Per Share Data | ||||||||
Net asset value, beginning of period | $ | 16.55 | $ | 20.69 | ||||
Income (loss) from investment operations: | (.30 | ) | (.06 | ) | ||||
Net investment income (loss)b | ||||||||
Net realized and unrealized gain (loss) on investment transactions | 3.31 | (4.08 | ) | |||||
Total from investment operations | 3.01 | (4.14 | ) | |||||
Net asset value, end of period | $ | 19.56 | $ | 16.55 | ||||
Total Return (%)c | 18.19 | (20.01 | )** | |||||
Ratios to Average Net Assets and Supplemental Data | ||||||||
Net assets, end of period ($ millions) | 2 | .3 | ||||||
Ratio of expenses before expense reductions (%) | 2.12 | 2.12 | * | |||||
Ratio of expenses after expense reductions (%) | 2.00 | 2.00 | * | |||||
Ratio of net investment income (loss) (%) | (1.65 | ) | (1.50 | )* | ||||
Portfolio turnover rate (%) | 74 | 87d | ||||||
| a | For the period June 28, 2002 (commencement of sales of Class B shares) to September 30, 2002. |
| b | Based on average shares outstanding during the period. |
| c | Total return would have been lower had certain expenses not been reduced. Total return does not reflect the effect of any sales charges. |
| d | On March 28, 2002, the Small Cap Portfolio was closed. This ratio includes the purchase and sale of portfolio securities of the Small Cap Fund as a stand-alone fund in addition to the Small Cap Portfolio. |
| * | Annualized |
| ** | Not annualized |
40
Table of Contents
Scudder Small Cap Fund
Class C
Years Ended September 30, | 2003 | 2002a | ||||||
Selected Per Share Data | ||||||||
Net asset value, beginning of period | $ | 16.55 | $ | 20.69 | ||||
Income (loss) from investment operations: | ||||||||
Net investment income (loss)b | (.30 | ) | (.06 | ) | ||||
Net realized and unrealized gain (loss) on investment transactions | 3.31 | (4.08 | ) | |||||
Total from investment operations | 3.01 | (4.14 | ) | |||||
Net asset value, end of period | $ | 19.56 | $ | 16.55 | ||||
Total Return (%)c | 18.19 | (20.01 | )** | |||||
Ratios to Average Net Assets and Supplemental Data | ||||||||
Net assets, end of period ($ millions) | 2 | .1 | ||||||
Ratio of expenses before expense reductions (%) | 2.12 | 2.12 | * | |||||
Ratio of expenses after expense reductions (%) | 2.00 | 2.00 | * | |||||
Ratio of net investment income (loss) (%) | (1.65 | ) | (1.50 | )* | ||||
Portfolio turnover rate (%) | 74 | 87d | ||||||
| a | For the period June 28, 2002 (commencement of sales of Class C shares) to September 30, 2002. |
| b | Based on average shares outstanding during the period. |
| c | Total return would have been lower had certain expenses not been reduced. Total return does not reflect the effect of any sales charges. |
| d | On March 28, 2002, the Small Cap Portfolio was closed. This ratio includes the purchase and sale of portfolio securities of the Small Cap Fund as a stand-alone fund in addition to the Small Cap Portfolio. |
| * | Annualized |
| ** | Not annualized |
Scudder Small Cap Fund
Investment Class
Years Ended September 30, | 2003 | 2002 | 2001 | 2000 | 1999 | |||||||||||||||
Selected Per Share Data | ||||||||||||||||||||
Net asset value, beginning of period | $ | 16.57 | $ | 19.73 | $ | 26.95 | $ | 21.89 | $ | 14.96 | ||||||||||
Income (loss) from investment operations: | ||||||||||||||||||||
Net investment income (loss) | (.16 | )a | (.13 | )a | (.12 | ) | (.15 | ) | (.15 | ) | ||||||||||
Net realized and unrealized gain (loss) on investment transactions | 3.33 | (3.03 | ) | (5.53 | ) | 8.53 | 7.13 | |||||||||||||
Total from investment operations | 3.17 | (3.16 | ) | (5.65 | ) | 8.38 | 6.98 | |||||||||||||
Less distributions from: | ||||||||||||||||||||
Net realized gains on investment transactions | — | — | (1.57 | ) | (3.32 | ) | (.05 | ) | ||||||||||||
Net asset value, end of period | $ | 19.74 | $ | 16.57 | $ | 19.73 | $ | 26.95 | $ | 21.89 | ||||||||||
Total Return (%)b | 19.13 | (16.02 | ) | (21.77 | ) | 41.59 | 46.52 | |||||||||||||
Ratios to Average Net Assets and Supplemental Data | ||||||||||||||||||||
Net assets, end of period ($ millions) | 313 | 204 | 241 | 292 | 216 | |||||||||||||||
Ratio of expenses before expense reductions (%) | 1.37 | 1.40c | 1.46c | 1.44c | 1.46c | |||||||||||||||
Ratio of expenses after expense reductions (%) | 1.25 | 1.25c | 1.25c | 1.25c | 1.25c | |||||||||||||||
Ratio of net investment income (loss) (%) | (.90 | ) | (.63 | ) | (.53 | ) | (.60 | ) | (.74 | ) | ||||||||||
Portfolio turnover rate (%) | 74 | 87d | 109 | 136 | 159 | |||||||||||||||
| a | Based on average shares outstanding during the period. |
| b | Total return would have been lower had certain expenses not been reduced. |
| c | The expense ratio of the Small Cap Portfolio is included in this ratio. |
| d | On March 28, 2002, the Small Cap Portfolio was closed. This ratio includes the purchase and sale of portfolio securities of the Small Cap Fund as a stand-alone fund in addition to the Small Cap Portfolio. |
41
Table of Contents
Scudder Small Cap Fund
A. Significant Accounting Policies
Small Cap Fund (“Scudder Small Cap Fund” or the “Fund”) is a diversified series of Scudder Advisor Funds, formerly BT Investment Funds, which is registered under the Investment Company Act of 1940, as amended (the “1940 Act”) as an open-end management investment company organized as a Massachusetts business trust.
On March 8, 2001, the Board of Trustees approved dissolving the Small Cap master-feeder structure, and converting Small Cap to a stand-alone fund. On March 28, 2002, the Small Cap Fund received assets with a value of $288,943,058 which included unrealized appreciation of $33,181,553 from the Small Cap Portfolio of the BT Investment Portfolios in a tax free exchange for its beneficial ownership in the Portfolio. Activity prior to this conversion is included in the statement of operations.
The Fund offers multiple classes of shares which provide investors with different purchase options. Class A shares are offered to investors subject to an initial sales charge. Class B shares are offered without an initial sales charge but are subject to higher ongoing expenses than Class A shares and a contingent deferred sales charge payable upon certain redemptions. Class B shares automatically convert to Class A shares six years after issuance. Class C shares are offered to investors subject to an initial sales charge and are subject to higher ongoing expenses than Class A shares and a contingent deferred sales charge payable upon certain redemptions within one year of purchase. Prior to February 3, 2003, Class C shares were offered without an initial sales charge. Class C shares do not convert into another class. Investment Class shares are not subject to initial or contingent deferred sales charges.
Investment income, realized and unrealized gains and losses, and certain fund-level expenses and expense reductions, if any, are borne pro rata on the basis of relative net assets by the holders of all classes of shares, except that each class bears certain expenses unique to that class such as distribution fees, service fees, administrator fees and certain other class-specific expenses. Differences in class-level expenses may result in payment of different per share dividends by class. All shares of the Fund have equal rights with respect to voting subject to class-specific arrangements.
The Fund’s financial statements are prepared in accordance with accounting principles generally accepted in the United States of America which require the use of management estimates. Actual results could differ from those estimates. The policies described below are followed consistently by the Fund in the preparation of its financial statements.
Security Valuation. Investments are stated at value determined as of the close of regular trading on the New York Stock Exchange on each day the exchange is open for trading. Equity securities are valued at the most recent sale price reported on the exchange (US or foreign) or over-the-counter market on which the security is traded most extensively. Securities for which no sales are reported are valued at the calculated mean between the most recent bid and asked quotations on the relevant market or, if a mean cannot be determined, at the most recent bid quotation.
Investments in open-end investment companies are valued at their net asset value each business day.
Securities and other assets for which market quotations are not readily available or for which the above valuation procedures are deemed not to reflect fair value are valued in a manner that is intended to reflect their fair value as determined in accordance with procedures approved by the Trustees.
Federal Income Taxes. The Fund’s policy is to comply with the requirements of the Internal Revenue Code, as amended, which are applicable to regulated investment companies, and to distribute all of its taxable income to its shareholders. Accordingly, the Fund paid no federal income taxes and no federal income tax provision was required.
At September 30, 2003 the Fund had a net tax basis capital loss carryforward of approximately $17,532,000, which may be applied against any realized net taxable capital gains of each succeeding year until fully utilized or until September 30, 2008 ($232,000), September 30, 2009 ($66,000), September 30, 2010 ($4,518,000) and September 30, 2011 ($12,716,000), the respective expiration dates, whichever occurs first.
In addition, from November 1, 2002 through September 30, 2003, the Fund incurred approximately $11,080,000 of net realized capital losses. As permitted by tax regulations, the Fund intends to elect to defer these losses and treat them as arising in the fiscal year ending September 30, 2004.
42
Table of Contents
Distribution of Income and Gains. Distributions of net investment income, if any, are made annually. Net realized gains from investment transactions, in excess of available capital loss carryforwards, would be taxable to the Fund if not distributed, and, therefore, will be distributed to shareholders at least annually.
The timing and characterization of certain income and capital gains distributions are determined annually in accordance with federal tax regulations which may differ from accounting principles generally accepted in the United States of America. These differences primarily relate to securities sold at a loss. As a result, net investment income (loss) and net realized gain (loss) on investment transactions for a reporting period may differ significantly from distributions during such period. Accordingly, the Fund may periodically make reclassifications among certain of its capital accounts without impacting the net asset value of the Fund.
At September 30, 2003, the Fund’s components of distributable earnings (accumulated losses) on a tax-basis were as follows:
Undistributed ordinary income* | $ | — | ||
Undistributed net long-term capital gains | $ | — | ||
Capital loss carryforwards | $ | (17,532,000 | ) | |
Net unrealized appreciation (depreciation) on investments | $ | 30,896,626 |
| * | For tax purposes, short-term capital gains distributions are considered ordinary income distributions. |
Other. Investment transactions are accounted for on the trade date. Interest income is recorded on the accrual basis. Dividend income is recorded on the ex-dividend date. Realized gains and losses from investment transactions are recorded on an identified cost basis.
B. Purchases and Sales of Securities
During the year ended September 30, 2003, purchases and sales of investment securities (excluding short-term investments) aggregated $248,171,143 and $178,607,321, respectively.
C. Related Parties
Scudder Investments is part of Deutsche Asset Management, which is the marketing name in the US for the asset management activities of Deutsche Bank AG. Deutsche Asset Management, Inc. (“DeAM, Inc.” or the “Advisor”), an indirect, wholly owned subsidiary of Deutsche Bank AG, is the Fund’s Advisor. Investment Company Capital Corporation (“ICCC” or the “Administrator”), also an indirect, wholly owned subsidiary of Deutsche Bank AG, is the Fund’s Administrator.
Investment Advisory Agreement. Under the Investment Advisory Agreement, the Advisor directs the investments of the Fund in accordance with its investment objectives, policies and restrictions. The Advisor determines the securities, instruments and other contracts relating to investments to be purchased, sold or entered into by the Fund. The investment advisory fee payable under the Investment Advisory Agreement is equal to an annual rate of 0.65% of the Fund’s average daily net assets, computed and accrued daily and payable monthly. The Fund did not impose a portion of its advisory fees equivalent to the advisory fees charged on assets invested in the affiliated money market fund, Cash Management Fund Institutional.
For the year ended September 30, 2003, the Advisor and Administrator have contractually agreed to waive their fees or reimburse expenses to the extent necessary to maintain the annualized expenses of the classes of the Fund as follows:
Class A | 1.25 | % | |
Class B | 2.00 | % | |
Class C | 2.00 | % | |
Investment Class | 1.25 | % |
43
Table of Contents
Accordingly, for the year ended September 30, 2003, the Advisor waived a portion of its advisory fee pursuant to the Expense Limitation Agreement aggregating $290,635 and the amount imposed aggregated $1,338,854 which was equivalent to an annual effective rate of 0.52% of the Fund’s average daily net assets.
Administrator. For its services as Administrator, ICCC receives a fee (the “Administrator Service Fee”) of 0.65% of the average daily net assets for the Investment Class and 0.40% of average daily net assets for Class A, B and C shares for the Fund, computed and accrued daily and payable monthly. For the year ended September 30, 2003, the Administrator Service Fee for the Fund was as follows:
Administrator Service Fee | Total Aggregated | Unpaid at September 30, | ||||
Class A | $ | 50,345 | $ | 8,673 | ||
Class B | 4,855 | 753 | ||||
Class C | 4,025 | 763 | ||||
Investment Class | 1,561,958 | 174,610 | ||||
| $ | 1,621,183 | $ | 184,799 | |||
Distribution Agreement. Under the Distribution Agreement, in accordance with Rule 12b-1 under the 1940 Act, Scudder Distributors, Inc. (“SDI”), an affiliate of the Advisor, receives a fee (“Distribution Fee”) of 0.25% of the average daily net assets of the Class A shares and 0.75% of average daily net assets of the Class B and C shares. Pursuant to the agreement, SDI enters into related selling group agreements with various firms at various rates for sales of Class B and C shares. For the year ended September 30, 2003, the Distribution Fee was as follows:
Distribution Fee | Total Aggregated | Unpaid at September 30, | ||||
Class A | $ | 31,465 | $ | 10,521 | ||
Class B | 9,104 | 1,418 | ||||
Class C | 7,546 | 1,437 | ||||
| $ | 48,115 | $ | 13,376 | |||
In addition, SDI provides information and administrative services (“Shareholder Servicing Fee”) to Class B and C shareholders at an annual rate of 0.25% of average daily net assets for each such class. SDI in turn has various agreements with financial services firms that provide these services and pays these fees based upon the assets of shareholder accounts the firms service. For the year ended September 30, 2003, the Shareholder Servicing Fee was as follows:
Shareholder Servicing Fee | Total Aggregated | Unpaid at September 30, | Effective Rate | ||||||
Class B | $ | 3,035 | $ | 891 | .25 | % | |||
Class C | 2,515 | 888 | .25 | % | |||||
| $ | 5,550 | $ | 1,779 | ||||||
44
Table of Contents
Underwriting Agreement and Contingent Deferred Sales Charge. SDI is the principal underwriter for Class A, B and C shares. Underwriting commissions paid in connection with the distribution of Class A and C shares for the year ended September 30, 2003 aggregated $7,697 and $3, respectively.
In addition, SDI receives any contingent deferred sales charge (“CDSC”) from Class B share redemptions occurring within six years of purchase and Class C share redemptions occurring within one year of purchase. There is no such charge upon redemption of any share appreciation or reinvested dividends. The CDSC is based on declining rates ranging from 4% to 1% for Class B and 1% for Class C, of the value of the shares redeemed. For the year ended September 30, 2003, the CDSC for the Fund’s Class B and C shares was $764 and $226, respectively.
Other. The Fund may invest in Cash Management Fund Institutional, an open-end management investment company managed by DeAM, Inc.
Trustees’ Fees and Expenses. The Fund pays each Trustee not affiliated with the Advisor retainer fees plus specified amounts for attended board and committee meetings.
D. Line of Credit
Prior to April 11, 2003, the Fund and several other affiliated funds (the “Participants”) shared in a $200 million revolving credit facility administered by a syndicate of banks for temporary or emergency purposes, including the meeting of redemption requests that otherwise might require the untimely disposition of securities. The Participants were charged an annual commitment fee which was allocated, pro rata based upon net assets, among each of the Participants. Interest was calculated at the Federal Funds Rate plus 0.625 percent.
Effective April 11, 2003, the Fund and several other affiliated funds (the “Participants”) entered into a $1.25 billion revolving credit facility administered by J.P. Morgan Chase Bank for temporary or emergency purposes, including the meeting of redemption requests that otherwise might require the untimely disposition of securities. The Participants are charged an annual commitment fee which is allocated, pro rata based upon net assets, among each of the Participants. Interest is calculated at the Federal Funds Rate plus 0.5 percent. The Fund may borrow up to a maximum of 33 percent of its net assets under the agreement.
E. Share Transactions
The following table summarizes share and dollar activity in the Fund:
Year Ended September 30, 2003 | Year Ended September 30, 2002* | |||||||||||||
| Shares | Dollars | Shares | Dollars | |||||||||||
Shares sold | ||||||||||||||
Class A | 1,752,188 | $ | 31,091,653 | 38,793 | $ | 678,078 | ||||||||
Class B | 122,357 | 2,190,104 | 26,331 | 472,503 | ||||||||||
Class C | 124,742 | 2,254,363 | 3,974 | 71,873 | ||||||||||
Investment Class | 7,905,657 | 147,492,077 | 6,018,756 | 126,383,615 | ||||||||||
| $ | 183,028,197 | $ | 127,606,069 | |||||||||||
In-kind subscription | ||||||||||||||
Investment Class | 3,329,085 | $ | 52,899,162 | — | — | |||||||||
| $ | 52,899,162 | — | ||||||||||||
Shares redeemed | ||||||||||||||
Class A | (496,536 | ) | $ | (9,283,647 | ) | (3,608 | ) | $ | (61,727 | ) | ||||
Class B | (21,791 | ) | (392,644 | ) | (9,970 | ) | (169,972 | ) | ||||||
Class C | (5,440 | ) | (100,282 | ) | — | — | ||||||||
Investment Class | (7,646,213 | ) | (136,654,494 | ) | (5,964,113 | ) | (123,191,459 | ) | ||||||
| $ | (146,431,067 | ) | $ | (123,423,158 | ) | |||||||||
Net increase (decrease) | ||||||||||||||
Class A | 1,255,652 | $ | 21,808,006 | 35,185 | $ | 616,351 | ||||||||
Class B | 100,566 | 1,797,460 | 16,361 | 302,531 | ||||||||||
Class C | 119,302 | 2,154,081 | 3,974 | 71,873 | ||||||||||
Investment Class | 3,588,529 | 63,736,745 | 54,643 | 3,192,156 | ||||||||||
| $ | 89,496,292 | $ | 4,182,911 | |||||||||||
| * | For Class A, B and C shares for the period June 28, 2002 (commencement of sales) to September 30, 2002. |
45
Table of Contents
F. In-Kind Subscription
As part of Deutsche Bank’s effort to consolidate various legacy retirement plans, Deutsche Bank implemented a program to transfer various plan assets as a means to streamline the number of investment options offered to employee plan participants. As part of the consolidation program, on March 28, 2003 the Scudder Small Cap Fund accepted securities and cash in payment for fund shares (received an in-kind subscription) from the BT Partnershare retirement plan in accordance with the Fund’s purchase in-kind procedures. The transaction represented a percentage of the Fund’s net assets at March 31, 2003 as follows:
| Purchase Amount | % of Net Assets | ||||
Small Cap Fund | $ | 52,899,162 | 25 | ||
G. Other Information
Effective June 13, 2003, State Street Bank and Trust Company (���State Street”) is the Fund’s custodian. Prior to June 13, 2003, Deutsche Bank Trust Company Americas (formerly Bankers Trust Company), an affiliate of the Fund’s Advisor and Administrator, served as custodian for the Fund.
46
Table of Contents
Report of Independent Auditors
To the Trustees of Scudder Advisor Funds (formerly BT Investment Funds) and Shareholders of Small Cap Fund:
In our opinion, the accompanying statement of assets and liabilities, including the investment portfolio, and the related statements of operations and of changes in net assets and the financial highlights present fairly, in all material respects, the financial position of Small Cap Fund (the “Fund”) at September 30, 2003, and the results of its operations, the changes in its net assets and the financial highlights for each of the periods indicated therein, in conformity with accounting principles generally accepted in the United States of America. These financial statements and financial highlights (hereafter referred to as “financial statements”) are the responsibility of the Fund’s management; our responsibility is to express an opinion on these financial statements based on our audits. We conducted our audits of these financial statements in accordance with auditing standards generally accepted in the United States of America, which require that we plan and perform the audit to obtain reasonable assurance about whether the financial statements are free of material misstatement. An audit includes examining, on a test basis, evidence supporting the amounts and disclosures in the financial statements, assessing the accounting principles used and significant estimates made by management, and evaluating the overall financial statement presentation. We believe that our audits, which included confirmation of securities at September 30, 2003 by correspondence with the custodian and brokers, provide a reasonable basis for our opinion.
Boston, Massachusetts November 24, 2003 | PricewaterhouseCoopers LLP |
47
Table of Contents
Performance Summary September 30, 2003
Average Annual Total Returns* (Unadjusted for Sales Charge)
Scudder Micro Cap Fund | 1-Year | 3-Year | 5-Year | Life of Class** | ||||||||
Class A(a) | 32.84 | % | -5.41 | % | 18.08 | % | 13.23 | % | ||||
Class B(a) | 31.91 | % | -6.11 | % | 17.20 | % | 12.38 | % | ||||
Class C(a) | 31.84 | % | -6.11 | % | 17.20 | % | 12.38 | % | ||||
Institutional Class+ | 33.12 | % | -5.20 | % | 18.36 | % | 13.52 | % | ||||
Russell 2000 Index++ | 36.50 | % | -.82 | % | 7.46 | % | 5.87 | % |
Scudder Micro Cap Fund | 1-Year | 3-Year | 5-Year | Life of Class*** | ||||||||
Investment Class+ | 32.79 | % | -5.41 | % | 18.10 | % | 11.27 | % | ||||
Russell 2000 Index++ | 36.50 | % | -.82 | % | 7.46 | % | 3.68 | % |
Sources: Lipper Inc. and Deutsche Asset Management, Inc.
| + | Institutional Class and Investment Class shares are not subject to sales charges. |
Net Asset Value
| Class A | Class B | Class C | Investment Class | Institutional Class | |||||||||||
Net Asset Value: | |||||||||||||||
9/30/03 | $ | 18.69 | $ | 18.52 | $ | 18.51 | $ | 18.67 | $ | 18.93 | |||||
9/30/02 | $ | 14.07 | $ | 14.04 | $ | 14.04 | $ | 14.06 | $ | 14.22 | |||||
Institutional Class Lipper Rankings* - Small-Cap Growth Funds Category
Period | Rank | Number of Funds Tracked | Percentile Ranking | |||||
1-Year | 221 | of | 465 | 48 | ||||
3-Year | 67 | of | 361 | 19 | ||||
5-Year | 19 | of | 250 | 8 |
Rankings are historical and do not guarantee future results. Rankings are based on total return with distributions reinvested.
Source: Lipper Inc.
48
Table of Contents
Scudder Micro Cap Fund
Growth of an Assumed $10,000 Investment*(b) (Adjusted for Sales Charge)
[] Scudder Micro Cap Fund - Class A(c)
[] Russell 2000 Index++
[GRAPHIC APPEARS HERE]
Yearly periods ended September 30
Comparative Results* (Adjusted for Sales Charge)
Scudder Micro Cap Fund | 1-Year | 3-Year | 5-Year | Life of Class** | ||||||||||||||
Class A(c) | Growth of $10,000 Average annual total return | $ | 12,522 25.22 | % | $ | 7,975 -7.26 | % | $ | 21,635 16.69 | % | $ | 21,905 12.25 | % | |||||
Class B(c) | Growth of $10,000 Average annual total return | $ | 12,884 28.84 | % | $ | 8,124 -6.69 | % | $ | 22,015 17.10 | % | $ | 22,085 12.38 | % | |||||
Class C(c) | Growth of $10,000 Average annual total return | $ | 13,061 30.61 | % | $ | 8,193 -6.43 | % | $ | 21,894 16.97 | % | $ | 21,864 12.22 | % | |||||
Russell 2000 Index++ | Growth of $10,000 Average annual total return | $ | 13,650 36.50 | % | $ | 9,755 -.82 | % | $ | 14,332 7.46 | % | $ | 14,694 5.87 | % | |||||
The growth of $10,000 is cumulative.
49
Table of Contents
Scudder Micro Cap Fund
Growth of an Assumed $250,000 Investment
[] Scudder Micro Cap Fund - Institutional Class
[] Russell 2000 Index++
[GRAPHIC APPEARS HERE]
Yearly periods ended September 30
Comparative Results*
Scudder Micro Cap Fund | 1-Year | 3-Year | 5-Year | Life of Class** | ||||||||||||||
Institutional Class | Growth of $250,000 Average annual total return | $ | 332,800 33.12 | % | $ | 212,975 -5.20 | % | $ | 580,650 18.36 | % | $ | 590,600 13.52 | % | |||||
Russell 2000 Index++ | Growth of $250,000 Average annual total return | $ | 341,250 36.50 | % | $ | 243,875 -.82 | % | $ | 358,300 7.46 | % | $ | 367,350 5.87 | % | |||||
| 1-Year | 3-Year | 5-Year | Life of Class*** | |||||||||||||||
Investment Class | Growth of $10,000 Average annual total return | $ | 13,279 32.79 | % | $ | 8,463 -5.41 | % | $ | 22,977 18.10 | % | $ | 19,195 11.27 | % | |||||
Russell 2000 Index++ | Growth of $10,000 Average annual total return | $ | 13,650 36.50 | % | $ | 9,755 -.82 | % | $ | 14,332 7.46 | % | $ | 12,456 3.68 | % | |||||
The growth of $10,000/$250,000 is cumulative.
The minimum investment for Institutional Class shares is $250,000.
50
Table of Contents
Notes to Performance Summary
| * | Returns and rankings during all periods shown reflect a fee waiver and/or expense reimbursement. Without this waiver/reimbursement, returns and rankings would have been lower. |
| ** | The Fund commenced operations on December 18, 1996. Index returns begin December 31, 1996. |
| *** | Investment Class commenced operations on August 21, 1997. Index returns begin August 31, 1997. |
| a | Returns shown for Class A, B and C shares for the periods prior to their inception on June 28, 2002, are derived from the historical performance of Institutional Class shares of the Scudder Micro Cap Fund during such periods and have been adjusted to reflect the higher gross total annual operating expenses of each specific class. Any difference in expenses will affect performance. |
| b | The Fund’s growth of an assumed $10,000 investment is adjusted for the maximum sales charge of 5.75%. This results in a net investment of $9,425. |
| c | Returns shown for Class A, B and C shares for the periods prior to their inception on June 28, 2002, are derived from the historical performance of Institutional Class shares of the Scudder Micro Cap Fund during such periods and have been adjusted to reflect the higher gross total annual operating expenses and the current applicable sales charges of each specific class. Returns for Class A reflect the current maximum initial sales charges of 5.75%. Class B share performance is adjusted for the applicable contingent deferred sales charge (“CDSC”), which is 4% within the first year after purchase, declining to 0% after six years. Returns for Class C reflect an initial sales charge of 1%. Redemptions on Class C shares within one year of purchase may be subject to a CDSC of 1%. Any difference in expenses will affect performance. |
| ++ | Russell 2000 Index is an unmanaged index that tracks the common stock price movement of the 2,000 smallest companies of the Russell 3000 Index, which measures the performance of the 3,000 largest US companies based on total market capitalization. Index returns assume reinvestment of dividends and, unlike Fund returns, do not reflect any fees or expenses. It is not possible to invest directly into an index. |
All performance is historical, assumes reinvestment of all dividends and capital gains, and is not indicative of future results. Investment return and principal value will fluctuate, so an investor’s shares, when redeemed, may be worth more or less than when purchased. Performance figures do not reflect the deduction of taxes that a shareholder would pay on fund distributions or the redemption of fund shares. Returns and rankings may differ by share class
Investments in funds involve risk. Some funds have more risk than others. These include funds that allow exposure to or otherwise concentrate investments in certain sectors, geographic regions, security types, market capitalization or foreign securities (e.g., political or economic instability, which can be accentuated in emerging market countries). Please read this fund’s prospectus for specific details regarding its investments and risk profile.
Please call (800) 621-1048 for the Fund’s most up-to-date performance. On the Web, go to scudder.com.
51
Table of Contents
Portfolio Summary September 30, 2003
Scudder Micro Cap Fund
Asset Allocation | 9/30/03 | 9/30/02 | ||||
Common Stocks | 96 | % | 88 | % | ||
Cash Equivalents, net | 4 | % | 12 | % | ||
| 100 | % | 100 | % | |||
Sector Diversification (Excludes Cash Equivalents) | 9/30/03 | 9/30/02 | ||||
Information Technology | 38 | % | 20 | % | ||
Health Care | 18 | % | 17 | % | ||
Consumer Discretionary | 15 | % | 23 | % | ||
Industrials | 10 | % | 8 | % | ||
Financials | 10 | % | 17 | % | ||
Energy | 3 | % | 11 | % | ||
Consumer Staples | 3 | % | 1 | % | ||
Utilities | 3 | % | 3 | % | ||
| 100 | % | 100 | % | |||
Ten Largest Equity Holdings at September 30, 2003 (30.8% of Portfolio) | |||
1. ANSYS, Inc. Developer of software solutions for design analysis | 4.0 | % | |
2. Connetics Corp. Producer of pharmaceuticals | 3.5 | % | |
3. Applied Films Corp. Manufacturer of film coatings for media presentations | 3.3 | % | |
4. Harris Interactive, Inc. Provider of consulting services | 3.2 | % | |
5. ChipPAC, Inc. Provider of semiconductor packaging and test services | 3.0 | % | |
6. ManTech International Corp. Provider of information technology and technical services to the federal government | 2.9 | % | |
7. Wabash National Corp. Manufacturer and marketer of truck trailers | 2.8 | % | |
8. United Natural Foods, Inc. Distributor of natural foods and related products | 2.8 | % | |
9. Valueclick, Inc. Provider of Internet advertising solutions for publisher of web sites and online advertisers | 2.7 | % | |
10. Southwestern Energy Co. Distributors of natural gas and oil | 2.6 | % |
Asset allocation, sector diversification and portfolio holdings are subject to change.
For more complete details about the fund’s investment portfolio, see page 71. A quarterly Fact Sheet and Portfolio Holdings are available upon request.
52
Table of Contents
Investment Portfolio as of September 30, 2003
Scudder Micro Cap Fund | Shares | Value ($) | ||||
Common Stocks 95.7% | ||||||
Consumer Discretionary 13.9% | ||||||
Auto Components 2.2% | ||||||
Keystone Automotive Industries, Inc.* | 118,200 | 2,564,940 | ||||
Hotels, Restaurants & Leisure 4.3% | ||||||
Red Robin Gourmet Burgers* | 78,100 | 1,988,426 | ||||
Shuffle Master, Inc.* | 109,300 | 2,970,774 | ||||
| 4,959,200 | ||||||
Media 3.2% | ||||||
Harris Interactive, Inc.* | 533,200 | 3,753,728 | ||||
Specialty Retail 3.3% | ||||||
Hancock Fabrics, Inc. | 130,500 | 2,059,290 | ||||
Jos. A. Bank Clothiers, Inc.* | 39,700 | 1,745,609 | ||||
| 3,804,899 | ||||||
Textiles, Apparel & Luxury Goods 0.9% | ||||||
Quaker Fabric Corp. | 155,400 | 1,053,612 | ||||
Consumer Staples 2.8% | ||||||
Food & Drug Retailing | ||||||
United Natural Foods, Inc.* | 96,300 | 3,196,197 | ||||
Energy 2.9% | ||||||
Energy Equipment & Services 0.9% | ||||||
Dril-Quip, Inc.* | 59,400 | 1,003,860 | ||||
Oil & Gas 2.0% | ||||||
Quicksilver Resources, Inc.* | 48,200 | 1,177,526 | ||||
Ultra Petroleum Corp.* | 86,100 | 1,201,095 | ||||
| 2,378,621 | ||||||
Financials 9.2% | ||||||
Banks 7.0% | ||||||
BankUnited Financial Corp. “A”* | 43,000 | 906,440 | ||||
Dime Community Bancshares | 64,600 | 1,485,800 | ||||
Fidelity Bancshares, Inc. | 79,400 | 2,085,044 | ||||
Mercantile Bank Corp. | 37,200 | 1,235,040 | ||||
Wintrust Financial Corp. | 63,400 | 2,388,278 | ||||
| 8,100,602 | ||||||
Diversified Financials 0.9% | ||||||
Encore Capital Group Inc.* | 90,100 | 1,054,170 | ||||
Insurance 0.2% | ||||||
Direct General Corp.* | 7,100 | 177,997 | ||||
Real Estate 1.1% | ||||||
Newcastle Investment Corp. (REIT) | 56,900 | 1,308,131 | ||||
Health Care 17.5% | ||||||
Biotechnology 2.4% | ||||||
United Therapeutics Corp.* | 121,100 | 2,735,649 | ||||
Health Care Equipment & Supplies 5.6% | ||||||
Advanced Neuromodulation Systems, Inc.* | 64,500 | 2,573,550 | ||||
Kensey Nash Corp.* | 92,600 | 2,174,248 | ||||
Zoll Medical Corp.* | 54,900 | 1,759,545 | ||||
| 6,507,343 | ||||||
Health Care Providers & Services 3.9% | ||||||
Centene Corp.* | 82,100 | 2,495,019 | ||||
Sierra Health Services, Inc.* | 99,800 | 2,050,890 | ||||
| 4,545,909 | ||||||
Pharmaceuticals 5.6% | ||||||
Adolor Corp.* | 132,500 | 2,431,375 | ||||
Connetics Corp.* | 223,300 | 4,032,798 | ||||
| 6,464,173 | ||||||
Industrials 10.0% | ||||||
Aerospace & Defense 0.6% | ||||||
EDO Corp. | 31,800 | 643,950 | ||||
Air Freight & Logistics 0.0% | ||||||
Dynamex, Inc.* | 103 | 928 | ||||
Commercial Services & Supplies 3.6% | ||||||
Bright Horizons Family Solutions, Inc.* | 29,500 | 1,178,525 | ||||
CoStar Group, Inc.* | 76,700 | 1,994,200 | ||||
Marten Transport Ltd.* | 38,000 | 991,800 | ||||
| 4,164,525 | ||||||
Machinery 4.5% | ||||||
Lindsay Manufacturing Co. | 101,500 | 2,040,150 | ||||
Wabash National Corp.* | 201,300 | 3,210,735 | ||||
| 5,250,885 | ||||||
Road & Rail 1.3% | ||||||
Celadon Group, Inc.* | 115,300 | 1,481,605 | ||||
Information Technology 36.7% | ||||||
Communications Equipment 2.6% | ||||||
F5 Networks, Inc.* | 156,300 | 3,007,212 | ||||
Computers & Peripherals 3.3% | ||||||
Applied Films Corp.* | 130,300 | 3,873,819 | ||||
Electronic Equipment & Instruments 4.5% | ||||||
Craftmade International, Inc. | 119,400 | 2,807,094 | ||||
Identix, Inc.* | 197,345 | 1,032,115 | ||||
OSI Systems, Inc.* | 78,700 | 1,361,510 | ||||
| 5,200,719 | ||||||
Internet Software & Services 6.9% | ||||||
Digitas, Inc.* | 387,100 | 2,810,346 | ||||
Valueclick, Inc.* | 371,800 | 3,126,838 | ||||
WebMethods, Inc.* | 260,100 | 2,075,598 | ||||
| 8,012,782 | ||||||
IT Consulting & Services 2.9% | ||||||
ManTech International Corp. “A”* | 135,000 | 3,358,800 | ||||
Semiconductor Equipment & Products 4.0% | ||||||
ChipPAC, Inc.* | 586,500 | 3,454,485 | ||||
Power Integrations, Inc.* | 33,300 | 1,106,892 | ||||
Sigmatel, Inc.* | 3,800 | 78,318 | ||||
| 4,639,695 | ||||||
Software 12.5% | ||||||
Agile Software Corp.* | 261,300 | 2,487,576 | ||||
ANSYS, Inc.* | 129,400 | 4,598,876 | ||||
Group 1 Software, Inc.* | 149,300 | 2,682,921 | ||||
Intervideo, Inc.* | 87,900 | 1,885,455 | ||||
RSA Security, Inc.* | 128,000 | 1,827,840 | ||||
Tradestation Group, Inc.* | 123,100 | 919,803 | ||||
| 14,402,471 | ||||||
Utilities 2.7% | ||||||
Gas Utilities | ||||||
Southwestern Energy Co.* | 169,100 | 3,060,710 | ||||
Total Common Stocks (Cost $85,372,981) | 110,707,132 | |||||
| Principal Amount ($) | Value ($) | |||||
Certificate of Deposit 4.7% | ||||||
State Street Bank, 0.5%, 10/1/2003 (Cost $5,417,000) | 5,417,000 | 5,417,000 | ||||
Scudder Micro Cap Fund | % of Net Assets | Value ($) | ||||
Total Investment Portfolio (Cost $90,789,981) (a) | 100.4 | 116,124,132 | ||||
Other Assets and Liabilities, Net | (0.4 | ) | (407,535 | ) | ||
Net Assets | 100.0 | 115,716,597 | ||||
| * | Non-income producing security. |
| (a) | The cost for federal income tax purposes was $91,019,471. At September 30, 2003, net unrealized appreciation for all securities based on tax cost was $25,104,661. This consisted of aggregate gross unrealized appreciation for all securities in which there was an excess of value over tax cost of $26,028,448 and aggregate gross unrealized depreciation for all securities in which there was an excess of tax cost over value of $923,787. |
The accompanying notes are an integral part of the financial statements.
53
Table of Contents
Scudder Micro Cap Fund
Statement of Assets and Liabilities as of September 30, 2003
Assets | ||||
Investments in securities, at value (cost $90,789,981) | $ | 116,124,132 | ||
Cash | 532 | |||
Receivable for investments sold | 2,284,249 | |||
Dividends receivable | 31,330 | |||
Interest receivable | 75 | |||
Receivable for Fund shares sold | 382,128 | |||
Other assets | 36,399 | |||
Total assets | 118,858,845 | |||
Liabilities | ||||
Payable for investments purchased | 2,846,737 | |||
Payable for Fund shares redeemed | 137,380 | |||
Accrued investment advisory fee | 82,516 | |||
Other accrued expenses and payables | 75,615 | |||
Total liabilities | 3,142,248 | |||
Net assets, at value | $ | 115,716,597 | ||
Net Assets | ||||
Net assets consist of: | ||||
Accumulated net investment loss | (1,374 | ) | ||
Net unrealized appreciation (depreciation) on investments | 25,334,151 | |||
Accumulated net realized gain (loss) | (14,810,291 | ) | ||
Paid-in capital | 105,194,111 | |||
Net assets, at value | $ | 115,716,597 | ||
The accompanying notes are an integral part of the financial statements.
54
Table of Contents
Scudder Micro Cap Fund
Statement of Assets and Liabilities as of September 30, 2003 (continued)
Net Asset Value | |||
Class A | |||
Net Asset Value and redemption price per share ($10,913,274 / 584,019 shares of capital stock outstanding, $.001 par value, unlimited number of shares authorized) | $ | 18.69 | |
Maximum offering price per share (100 / 94.25 of $18.69) | $ | 19.83 | |
Class B | |||
Net Asset Value, offering and redemption price (subject to contingent deferred sales charge) per share ($3,249,551 / 175,498 shares of capital stock outstanding, $.001 par value, unlimited number of shares authorized) | $ | 18.52 | |
Class C | |||
Net Asset Value and redemption price (subject to contingent deferred sales charge) per share ($4,829,878 / 260,868 shares of capital stock outstanding, $.001 par value, unlimited number of shares authorized) | $ | 18.51 | |
Maximum offering price per share (100 / 99.00 of $18.51) | $ | 18.70 | |
Investment Class | |||
Net Asset Value, offering and redemption price per share ($17,900,207 / 958,622 shares of capital stock outstanding, $.001 par value, unlimited number of shares authorized) | $ | 18.67 | |
Institutional Class | |||
Net Asset Value, offering and redemption price per share ($78,823,687 / 4,163,470 shares of capital stock outstanding, $.001 par value, unlimited number of shares authorized) | $ | 18.93 |
The accompanying notes are an integral part of the financial statements.
55
Table of Contents
Scudder Micro Cap Fund
Statement of Operations for the year ended September 30, 2003
Investment Income | ||||
Dividends | $ | 512,410 | ||
Interest | 77,252 | |||
Total Income | 589,662 | |||
Expenses: Investment advisory fee | 1,365,253 | |||
Administrator service fee | 200,237 | |||
Distribution and shareholder servicing fees | 86,082 | |||
Custody fees | 26,404 | |||
Auditing | 21,236 | |||
Legal | 18,865 | |||
Reports to shareholders | 18,829 | |||
Trustees’ fees and expenses | 2,210 | |||
Registration fees | 72,323 | |||
Other | 7,327 | |||
Total expenses, before expense reductions | 1,818,766 | |||
Expense reductions | (376,573 | ) | ||
Total expenses, after expense reductions | 1,442,193 | |||
Net investment income (loss) | (852,531 | ) | ||
Realized and Unrealized Gain (Loss) on Investment Transactions | ||||
Net realized gain (loss) from investments | (10,409,423 | ) | ||
Net unrealized appreciation (depreciation) during the period on investments | 39,153,860 | |||
Net gain (loss) on investment transactions | 28,744,437 | |||
Net increase (decrease) in net assets resulting from operations | $ | 27,891,906 | ||
The accompanying notes are an integral part of the financial statements.
56
Table of Contents
Scudder Micro Cap Fund
Statement of Changes in Net Assets
Years Ended September 30, | |||||||
Increase (Decrease) in Net Assets | 2003 | 2002 | |||||
Operations: | |||||||
Net investment income (loss) | $ | (852,531 | ) | (531,729 | ) | ||
Net realized gain (loss) on investment transactions | (10,409,423 | ) | (3,304,242 | ) | |||
Net unrealized appreciation (depreciation) on investment transactions during the period | 39,153,860 | (14,343,769 | ) | ||||
Net increase (decrease) in net assets resulting from operations | 27,891,906 | (18,179,740 | ) | ||||
Fund share transactions: | |||||||
Proceeds from shares sold | 62,524,070 | 68,206,169 | |||||
Cost of shares redeemed | (40,548,787 | ) | (24,000,880 | ) | |||
Net increase (decrease) in net assets from Fund share transactions | 21,975,283 | 44,205,289 | |||||
Increase (decrease) in net assets | 49,867,189 | 26,025,549 | |||||
Net assets at beginning of period | 65,849,408 | 39,823,859 | |||||
Net assets at end of period (including accumulated net investment loss of $1,374 and $547, respectively) | $ | 115,716,597 | 65,849,408 | ||||
The accompanying notes are an integral part of the financial statements.
57
Table of Contents
Scudder Micro Cap Fund
Class A
Years Ended September 30, | 2003 | 2002a | ||||||
Selected Per Share Data | ||||||||
Net asset value, beginning of period | $ | 14.07 | $ | 18.24 | ||||
Income (loss) from investment operations: | ||||||||
Net investment income (loss)b | (.18 | ) | .03 | |||||
Net realized and unrealized gain (loss) on investment transactions | 4.80 | (4.20 | ) | |||||
Total from investment operations | 4.62 | (4.17 | ) | |||||
Net asset value, end of period | $ | 18.69 | $ | 14.07 | ||||
Total Return (%)c | 32.84 | (22.86 | )** | |||||
Ratios to Average Net Assets and Supplemental Data | ||||||||
Net assets, end of period ($ millions) | 11 | .6 | ||||||
Ratio of expenses before expense reductions (%) | 2.16 | 2.22 | * | |||||
Ratio of expenses after expense reductions (%) | 1.74 | 1.74 | * | |||||
Ratio of net investment income (loss) (%) | (1.09 | ) | .70 | * | ||||
Portfolio turnover rate (%) | 74 | 66 | ||||||
| a | For the period June 28, 2002 (commencement of sales of Class A shares) to September 30, 2002. |
| b | Based on average shares outstanding during the period. |
| c | Total return would have been lower had certain expenses not been reduced. Total return does not reflect the effect of any sales charges. |
| * | Annualized |
| ** | Not annualized |
58
Table of Contents
Scudder Micro Cap Fund
Class B
Years Ended September 30, | 2003 | 2002a | ||||||
Selected Per Share Data | ||||||||
Net asset value, beginning of period | $ | 14.04 | $ | 18.24 | ||||
Income (loss) from investment operations: | ||||||||
Net investment income (loss)b | (.30 | ) | (.00 | )c | ||||
Net realized and unrealized gain (loss) on investment transactions | 4.78 | (4.20 | ) | |||||
Total from investment operations | 4.48 | (4.20 | ) | |||||
Net asset value, end of period | $ | 18.52 | $ | 14.04 | ||||
Total Return (%)d | 31.91 | (23.03 | )** | |||||
Ratios to Average Net Assets and Supplemental Data | ||||||||
Net assets, end of period ($ millions) | 3 | .3 | ||||||
Ratio of expenses before expense reductions (%) | 2.91 | 2.97 | * | |||||
Ratio of expenses after expense reductions (%) | 2.49 | 2.49 | * | |||||
Ratio of net investment income (loss) (%) | (1.84 | ) | (.05 | )* | ||||
Portfolio turnover rate (%) | 74 | 66 | ||||||
| a | For the period June 28, 2002 (commencement of sales of Class B shares) to September 30, 2002. |
| b | Based on average shares outstanding during the period. |
| c | Amount is less than $0.005. |
| d | Total return would have been lower had certain expenses not been reduced. Total return does not reflect the effect of any sales charges. |
| * | Annualized |
| ** | Not annualized |
59
Table of Contents
Scudder Micro Cap Fund
Class C
Years Ended September 30, | 2003 | 2002a | ||||||
Selected Per Share Data | ||||||||
Net asset value, beginning of period | $ | 14.04 | $ | 18.24 | ||||
Income (loss) from investment operations: | ||||||||
Net investment income (loss)b | (.31 | ) | (.00 | )c | ||||
Net realized and unrealized gain (loss) on investment transactions | 4.78 | (4.20 | ) | |||||
Total from investment operations | 4.47 | (4.20 | ) | |||||
Net asset value, end of period | $ | 18.51 | $ | 14.04 | ||||
Total Return (%)d | 31.84 | (23.03 | )** | |||||
Ratios to Average Net Assets and Supplemental Data | ||||||||
Net assets, end of period ($ millions) | 5 | .3 | ||||||
Ratio of expenses before expense reductions (%) | 2.91 | 2.97 | * | |||||
Ratio of expenses after expense reductions (%) | 2.49 | 2.49 | * | |||||
Ratio of net investment income (loss) (%) | (1.84 | ) | (.05 | )* | ||||
Portfolio turnover rate (%) | 74 | 66 | ||||||
| a | For the period June 28, 2002 (commencement of sales of Class C shares) to September 30, 2002. |
| b | Based on average shares outstanding during the period. |
| c | Amount is less than $0.005. |
| d | Total return would have been lower had certain expenses not been reduced. Total return does not reflect the effect of any sales charges. |
| * | Annualized |
| ** | Not annualized |
60
Table of Contents
Scudder Micro Cap Fund
Investment Class
Years Ended September 30, | 2003 | 2002 | 2001 | 2000 | 1999a | 1998b | ||||||||||||||||||
Selected Per Share Data | ||||||||||||||||||||||||
Net asset value, beginning of period | $ | 14.06 | $ | 17.05 | $ | 24.36 | $ | 16.12 | $ | 9.88 | $ | 12.62 | ||||||||||||
Income (loss) from investment operations: | ||||||||||||||||||||||||
Net investment income (loss) | (.17 | )c | (.18 | )c | (.15 | ) | (.14 | ) | (.14 | ) | (.06 | ) | ||||||||||||
Net realized and unrealized gain (loss) on investment transactions | 4.78 | (2.81 | ) | (5.33 | ) | 9.79 | 6.38 | (2.19 | ) | |||||||||||||||
Total from investment operations | 4.61 | (2.99 | ) | (5.48 | ) | 9.65 | 6.24 | (2.25 | ) | |||||||||||||||
Less distributions from: | ||||||||||||||||||||||||
Net realized gains on investment transactions | — | — | (1.83 | ) | (1.41 | ) | — | (.49 | ) | |||||||||||||||
Net asset value, end of period | $ | 18.67 | $ | 14.06 | $ | 17.05 | $ | 24.36 | $ | 16.12 | $ | 9.88 | ||||||||||||
Total Return (%)d | 32.79 | (17.54 | ) | (22.71 | ) | 63.87 | 63.16 | ** | (18.33 | ) | ||||||||||||||
Ratios to Average Net Assets and Supplemental Data | ||||||||||||||||||||||||
Net assets, end of period ($ millions) | 18 | 12 | 7 | 5 | 1 | 1 | ||||||||||||||||||
Ratio of expenses before expense reductions (%) | 2.16 | 2.21 | 2.23 | 2.55 | 3.25 | * | 2.68 | |||||||||||||||||
Ratio of expenses after expense reductions (%) | 1.74 | 1.74 | 1.74 | 1.74 | 1.74 | * | 1.74 | |||||||||||||||||
Ratio of net investment income (loss) (%) | (1.09 | ) | (1.02 | ) | (1.03 | ) | (1.05 | ) | (1.29 | )* | (.98 | ) | ||||||||||||
Portfolio turnover rate (%) | 74 | 66 | 79 | 137 | 115 | 85 | ||||||||||||||||||
| a | For the eleven months ended September 30, 1999. |
| b | For the year ended October 31, 1998. |
| c | Based on average shares outstanding during the period. |
| d | Total return would have been lower had certain expenses not been reduced. |
| * | Annualized |
| ** | Not annualized |
61
Table of Contents
Scudder Micro Cap Fund
Institutional Class
Years Ended September 30, | 2003 | 2002 | 2001 | 2000 | 1999a | 1998b | ||||||||||||||||||
Selected Per Share Data | ||||||||||||||||||||||||
Net asset value, beginning of period | $ | 14.22 | $ | 17.21 | $ | 24.52 | $ | 16.16 | $ | 9.90 | $ | 12.62 | ||||||||||||
Income (loss) from investment operations: | ||||||||||||||||||||||||
Net investment income (loss) | (.14 | )c | (.14 | )c | (.13 | ) | (.14 | ) | (.14 | ) | (.05 | ) | ||||||||||||
Net realized and unrealized gain (loss) on investment transactions | 4.85 | (2.85 | ) | (5.35 | ) | 9.91 | 6.40 | (2.18 | ) | |||||||||||||||
Total from investment operations | 4.71 | (2.99 | ) | (5.48 | ) | 9.77 | 6.26 | (2.23 | ) | |||||||||||||||
Less distributions from: | ||||||||||||||||||||||||
Net realized gains on investment transactions | — | — | (1.83 | ) | (1.41 | ) | — | (.49 | ) | |||||||||||||||
Net asset value, end of period | $ | 18.93 | $ | 14.22 | $ | 17.21 | $ | 24.52 | $ | 16.16 | $ | 9.90 | ||||||||||||
Total Return (%)d | 33.12 | (17.37 | ) | (22.55 | ) | 64.49 | 63.23 | ** | (18.16 | ) | ||||||||||||||
Ratios to Average Net Assets and Supplemental Data | ||||||||||||||||||||||||
Net assets, end of period ($ millions) | 79 | 52 | 33 | 37 | 17 | 14 | ||||||||||||||||||
Ratio of expenses before expense reductions (%) | 1.91 | 1.96 | 1.98 | 2.30 | 3.00 | * | 2.59 | |||||||||||||||||
Ratio of expenses after expense reductions (%) | 1.49 | 1.49 | 1.49 | 1.49 | 1.49 | * | 1.49 | |||||||||||||||||
Ratio of net investment income (loss) (%) | (.84 | ) | (.77 | ) | (.78 | ) | (.78 | ) | (1.07 | )* | (.75 | ) | ||||||||||||
Portfolio turnover rate (%) | 74 | 66 | 79 | 137 | 115 | 85 | ||||||||||||||||||
| a | For the eleven months ended September 30, 1999. |
| b | For the year ended October 31, 1998. |
| c | Based on average shares outstanding during the period. |
| d | Total return would have been lower had certain expenses not been reduced. |
| * | Annualized |
| ** | Not annualized |
62
Table of Contents
Scudder Micro Cap Fund
A. Significant Accounting Policies
Micro Cap Fund (“Scudder Micro Cap Fund” or the “Fund”) is a diversified series of Scudder MG Investments Trust (the “Trust”), formerly Morgan Grenfell Investment Trust, which is registered under the Investment Company Act of 1940, as amended (the “1940 Act”), as an open-end management investment company organized as a Delaware business trust.
The Fund offers multiple classes of shares which provide investors with different purchase options. Class A shares are offered to investors subject to an initial sales charge. Class B shares are offered without an initial sales charge but are subject to higher ongoing expenses than Class A shares and a contingent deferred sales charge payable upon certain redemptions. Class B shares automatically convert to Class A shares six years after issuance. Class C shares are offered to investors subject to an initial sales charge and are subject to higher ongoing expenses than Class A shares and a contingent deferred sales charge payable upon certain redemptions within one year of purchase. Prior to February 3, 2003, Class C shares were offered without an initial sales charge. Class C shares do not convert into another class. Investment Class shares are not subject to initial or contingent deferred sales charges. Institutional Class shares are offered to a limited group of investors, are not subject to initial or contingent deferred sales charges and have lower ongoing expenses than other classes.
Investment income, realized and unrealized gains and losses, and certain fund-level expenses and expense reductions, if any, are borne pro rata on the basis of relative net assets by the holders of all classes of shares, except that each class bears certain expenses unique to that class such as distribution fees, service fees and certain other class-specific expenses. Differences in class-level expenses may result in payment of different per share dividends by class. All shares of the Fund have equal rights with respect to voting subject to class-specific arrangements.
The Fund’s financial statements are prepared in accordance with accounting principles generally accepted in the United States of America which require the use of management estimates. Actual results could differ from those estimates. The policies described below are followed consistently by the Fund in the preparation of its financial statements.
Security Valuation. Investments are stated at value determined as of the close of regular trading on the New York Stock Exchange on each day the exchange is open for trading. Equity securities are valued at the most recent sale price reported on the exchange (US or foreign) or over-the-counter market on which the security is traded most extensively. Securities for which no sales are reported are valued at the calculated mean between the most recent bid and asked quotations on the relevant market or, if a mean cannot be determined, at the most recent bid quotation.
63
Table of Contents
Investments in open-end investment companies are valued at their net asset value each business day.
Securities and other assets for which market quotations are not readily available or for which the above valuation procedures are deemed not to reflect fair value are valued in a manner that is intended to reflect their fair value as determined in accordance with procedures approved by the Trustees.
Federal Income Taxes. The Fund’s policy is to comply with the requirements of the Internal Revenue Code, as amended, which are applicable to regulated investment companies, and to distribute all of its taxable income to its shareholders. Accordingly, the Fund paid no federal income taxes and no federal income tax provision was required.
At September 30, 2003 the Fund had a net tax basis capital loss carryforward of approximately $6,650,000 which may be applied against any realized net taxable capital gains of each succeeding year until fully utilized or until September 30, 2010 ($1,687,000) and September 30, 2011 ($4,963,000), the respective expiration dates, whichever occurs first.
In addition, from November 1, 2002 through September 30, 2003, the Fund incurred approximately $7,931,000 of net realized capital losses. As permitted by tax regulations, the Fund intends to elect to defer these losses and treat them as arising in the fiscal year ending September 30, 2004.
Distribution of Income and Gains. Distributions of net investment income, if any, are made annually. Net realized gains from investment transactions, in excess of available capital loss carryforwards, would be taxable to the Fund if not distributed, and, therefore, will be distributed to shareholders at least annually.
The timing and characterization of certain income and capital gains distributions are determined annually in accordance with federal tax regulations which may differ from accounting principles generally accepted in the United States of America. These differences primarily relate to securities sold at a loss. As a result, net investment income (loss) and net realized gain (loss) on investment transactions for a reporting period may differ significantly from distributions during such period. Accordingly, the Fund may periodically make reclassifications among certain of its capital accounts without impacting the net asset value of the Fund.
At September 30, 2003, the Fund’s components of distributable earnings (accumulated losses) on a tax-basis were as follows:
Undistributed ordinary income* | $ | — | ||
Undistributed net long-term capital gains | $ | — | ||
Capital loss carryforwards | $ | (6,650,000 | ) | |
Net unrealized appreciation (depreciation) on investments | $ | 25,104,661 |
| * | For tax purposes, short-term capital gains distributions are considered ordinary income distributions. |
Other. Investment transactions are accounted for on the trade date. Interest income is recorded on the accrual basis. Dividend income is recorded on the ex-dividend date. Realized gains and losses from investment transactions are recorded on an identified cost basis.
B. Purchases and Sales of Securities
During the year ended September 30, 2003, purchases and sales of investment securities (excluding short-term investments) aggregated $84,659,941 and $60,965,632, respectively.
64
Table of Contents
C. Related Parties
Scudder Investments is part of Deutsche Asset Management, which is the marketing name in the US for the asset management activities of Deutsche Bank AG. Deutsche Asset Management, Inc. (“DeAM, Inc.” or the “Advisor”), an indirect, wholly owned subsidiary of Deutsche Bank AG, is the Fund’s Advisor and is also the Fund’s Administrator.
Investment Advisory Agreement. Under the Investment Advisory Agreement the Advisor directs the investments of the Fund in accordance with its investment objectives, policies and restrictions. The Advisor determines the securities, instruments and other contracts relating to investments to be purchased, sold or entered into by the Fund. The investment advisory fee payable under the Investment Advisory Agreement is equal to an annual rate of 1.50% for the Fund, computed and accrued daily and payable monthly.
For the year ended September 30, 2003, the Advisor and Administrator have contractually agreed to waive their fees or reimburse expenses to the extent necessary to maintain the annualized expenses of the classes of the Fund as follows:
Class A | 1.74 | % | |
Class B | 2.49 | % | |
Class C | 2.49 | % | |
Investment Class | 1.74 | % | |
Institutional Class | 1.49 | % |
Accordingly, for the year ended September 30, 2003, the Advisor waived a portion of its fee pursuant to an Expense Limitation Agreement aggregating $376,573 and the amount imposed aggregated $988,680 which was equivalent to an annual effective rate of 1.09% of the Fund’s average daily net assets.
Administrator. For its services as Administrator, DeAM, Inc. receives a fee (the “Administrator Service Fee”) of 0.22% of the average daily net assets of the Fund, computed and accrued daily and payable monthly. For the year ended September 30, 2003, the Administrator Service Fee was $200,237 of which $22,134 is unpaid.
Distribution Agreement. Under the Distribution Agreement, in accordance with Rule 12b-1 under the 1940 Act, Scudder Distributors, Inc. (“SDI”), an affiliate of the Advisor, receives a fee (“Distribution Fee”) of 0.25% of the average daily net assets of the Class A shares and 0.75% of average daily net assets of the Class B and C shares. Pursuant to the agreement, SDI enters into related selling group agreements with various firms at various rates for sales of Class B and C shares. For the year ended September 30, 2003, the Distribution Fee was as follows:
Distribution Fee | Total Aggregated | Unpaid at September 30, 2003 | ||||
Class A | $ | 13,595 | $ | 4,133 | ||
Class B | 12,290 | 1,937 | ||||
Class C | 15,770 | 2,998 | ||||
| $ | 41,655 | $ | 9,068 | |||
65
Table of Contents
In addition, SDI provides information and administrative services (“Shareholder Servicing Fee”) to Class B, C and Investment Class shareholders at an annual rate of 0.25% of average daily net assets for each such class. SDI in turn has various agreements with financial services firms that provide these services and pays these fees based upon the assets of shareholder accounts the firms service. For the year ended September 30, 2003, the Shareholder Servicing Fee was as follows:
Shareholder Servicing Fee | Total Aggregated | Unpaid at September 30, | Effective Rate | ||||||
Class B | $ | 4,096 | $ | 1,214 | .25 | % | |||
Class C | 5,257 | 1,829 | .25 | % | |||||
Investment Class | 35,074 | 11,184 | .25 | % | |||||
| $ | 44,427 | $ | 14,227 | ||||||
Underwriting Agreement and Contingent Deferred Sales Charge. SDI is the principal underwriter for Class A, B and C shares. Underwriting commissions paid in connection with the distribution of Class A shares for the year ended September 30, 2003 aggregated $11,765. There were no underwriting commissions paid in connection with the distribution of Class C shares for the year ended September 30, 2003.
In addition, SDI receives any contingent deferred sales charge (“CDSC”) from Class B share redemptions occurring within six years of purchase and Class C share redemptions occurring within one year of purchase. There is no such charge upon redemption of any share appreciation or reinvested dividends. The CDSC is based on declining rates ranging from 4% to 1% for Class B and 1% for Class C, of the value of the shares redeemed. For the year ended September 30, 2003, the CDSC for the Fund’s Class B and Class C shares was $3,200 and $531, respectively.
Trustees’ Fees and Expenses. The Fund pays each Trustee not affiliated with the Advisor retainer fees plus specified amounts for attended board and committee meetings.
D. Line of Credit
Prior to April 11, 2003, the Fund and several other affiliated funds (the “Participants”) shared in a $200 million revolving credit facility administered by a syndicate of banks for temporary or emergency purposes, including the meeting of redemption requests that otherwise might require the untimely disposition of securities. The Participants were charged an annual commitment fee which was allocated, pro rata based upon net assets, among each of the Participants. Interest was calculated at the Federal Funds Rate plus 0.625 percent.
Effective April 11, 2003, the Fund and several other affiliated funds (the “Participants”) entered into a $1.25 billion revolving credit facility administered by J.P. Morgan Chase Bank for temporary or emergency purposes, including the meeting of redemption requests that otherwise might require the untimely disposition of securities. The Participants are charged an annual commitment fee which is allocated, pro rata based upon net assets, among each of the Participants. Interest is calculated at the Federal Funds Rate plus 0.5 percent. The Fund may borrow up to a maximum of 33 percent of its net assets under the agreement.
66
Table of Contents
E. Share Transactions
The following table summarizes share and dollar activity in the Fund:
Year Ended September 30, 2003 | Year Ended September 30, 2002* | |||||||||||||
| Shares | Dollars | Shares | Dollars | |||||||||||
Shares sold | ||||||||||||||
Class A | 580,974 | $ | 9,280,233 | 81,108 | $ | 1,208,109 | ||||||||
Class B | 176,480 | 2,818,390 | 18,588 | 278,040 | ||||||||||
Class C | 269,304 | 4,320,522 | 17,886 | 270,877 | ||||||||||
Investment Class | 678,872 | 11,349,080 | 977,800 | 18,792,257 | ||||||||||
Institutional Class | 2,203,386 | 34,755,845 | 2,558,588 | 47,656,886 | ||||||||||
| $ | 62,524,070 | $ | 68,206,169 | |||||||||||
Shares redeemed | ||||||||||||||
Class A | (74,483 | ) | $ | (1,221,233 | ) | (3,580 | ) | $ | (51,589 | ) | ||||
Class B | (19,570 | ) | (309,042 | ) | — | — | ||||||||
Class C | (26,322 | ) | (416,546 | ) | — | — | ||||||||
Investment Class | (561,094 | ) | (9,441,743 | ) | (524,990 | ) | (9,299,332 | ) | ||||||
Institutional Class | (1,726,837 | ) | (29,160,223 | ) | (801,665 | ) | (14,649,959 | ) | ||||||
| $ | (40,548,787 | ) | $ | (24,000,880 | ) | |||||||||
Net increase (decrease) | ||||||||||||||
Class A | 506,491 | $ | 8,059,000 | 77,528 | $ | 1,156,520 | ||||||||
Class B | 156,910 | 2,509,348 | 18,588 | 278,040 | ||||||||||
Class C | 242,982 | 3,903,976 | 17,886 | 270,877 | ||||||||||
Investment Class | 117,778 | 1,907,337 | 452,810 | 9,492,925 | ||||||||||
Institutional Class | 476,549 | 5,595,622 | 1,756,923 | 33,006,927 | ||||||||||
| $ | 21,975,283 | $ | 44,205,289 | |||||||||||
| * | For Class A, B and C shares for the period June 28, 2002 (commencement of sales ) to September 30, 2002. |
F. Other Information
Effective April 7, 2003, State Street Bank and Trust Company (“State Street”) is the Fund’s custodian. Prior to April 7, 2003, Brown Brothers Harriman & Co., 40 Water Street, Boston, MA 02110, served as custodian for the Fund.
67
Table of Contents
Report of Independent Auditors
To the Trustees of Scudder MG Investments Trust (formerly Morgan Grenfell Investment Trust) and Shareholders of Micro Cap Fund:
In our opinion, the accompanying statement of assets and liabilities, including the investment portfolio, and the related statements of operations and of changes in net assets and the financial highlights present fairly, in all material respects, the financial position of Micro Cap Fund (the “Fund”) at September 30, 2003, and the results of its operations, the changes in its net assets and the financial highlights for each of the periods indicated therein, in conformity with accounting principles generally accepted in the United States of America. These financial statements and financial highlights (hereafter referred to as “financial statements”) are the responsibility of the Fund’s management; our responsibility is to express an opinion on these financial statements based on our audits. We conducted our audits of these financial statements in accordance with auditing standards generally accepted in the United States of America, which require that we plan and perform the audit to obtain reasonable assurance about whether the financial statements are free of material misstatement. An audit includes examining, on a test basis, evidence supporting the amounts and disclosures in the financial statements, assessing the accounting principles used and significant estimates made by management, and evaluating the overall financial statement presentation. We believe that our audits, which included confirmation of securities at September 30, 2003 by correspondence with the custodian and brokers, provide a reasonable basis for our opinion.
Boston Massachusetts November 24, 2003 | PricewaterhouseCoopers LLP |
68
Table of Contents
Independent Trustees
Name, Date of Birth, Position with the Funds and Length of Time Served1,2 | Business Experience and Directorships During the Past 5 Years | Number of Funds in the Fund Complex Overseen | ||
Richard R. Burt 2/3/47 Trustee since 2002 | Chairman, Diligence LLC (international information-collection and risk-management firm) (September 2000 to present); Chairman, IEP Advisors, Inc. (July 1998 to present); Chairman of the Board, Weirton Steel Corporation3 (April 1996 to present); Member of the Board, Hollinger International, Inc.3 (publishing) (1995 to present), HCL Technologies Limited (information technology) (April 1999 to present), UBS Mutual Funds (formerly known as Brinson and Mitchell Hutchins families of funds) (registered investment companies) (September 1995 to present); and Member, Textron Inc.3 International Advisory Council (July 1996 to present). Formerly, Partner, McKinsey & Company (consulting) (1991-1994) and US Chief Negotiator in Strategic Arms Reduction Talks (START) with former Soviet Union and US Ambassador to the Federal Republic of Germany (1985-1991); Member of the Board, Homestake Mining3 (mining and exploration) (1998-February 2001), Archer Daniels Midland Company3 (agribusiness operations) (October 1996-June 2001) and Anchor Gaming (gaming software and equipment) (March 1999-December 2001). | 68 | ||
S. Leland Dill 3/28/30 Trustee since 1986 for the Scudder Advisor Funds Trustee since 2002 for the Scudder MG Investments Trust | Trustee, Phoenix Zweig Series Trust (since September 1989), Phoenix Euclid Market Neutral Funds (since May 1998) (registered investment companies); Retired (since 1986). Formerly, Partner, KPMG Peat Marwick (June 1956-June 1986); Director, Vintners International Company Inc. (wine vintner) (June 1989-May 1992), Coutts (USA) International (January 1992-March 2000), Coutts Trust Holdings Ltd., Coutts Group (private bank) (March 1991-March 1999); General Partner, Pemco (investment company) (June 1979-June 1986). | 66 | ||
Martin J. Gruber 7/15/37 Trustee since 1999 for the Scudder Advisor Funds Trustee since 2002 for the Scudder MG Investments Trust | Nomura Professor of Finance, Leonard N. Stern School of Business, New York University (since September 1964); Trustee, CREF (pension fund) (since January 2000); Director, Japan Equity Fund, Inc. (since January 1992), Thai Capital Fund, Inc. (since January 2000) and Singapore Fund, Inc. (since January 2000) (registered investment companies). Formerly, Trustee, TIAA (pension fund) (January 1996-January 2000); Director, S.G. Cowen Mutual Funds (January 1985-January 2001). | 66 | ||
Joseph R. Hardiman 5/27/37 Trustee since 2002 | Private Equity Investor (January 1997 to present); Director, Soundview Technology Group Inc. (investment banking) (July 1998 to present), Corvis Corporation3 (optical networking equipment) (July 2000 to present), Brown Investment Advisory & Trust Company (investment advisor) (February 2001 to present), The Nevis Fund (registered investment company) (July 1999 to present), and ISI Family of Funds (registered investment companies) (March 1998 to present). Formerly, Director, Circon Corp.3 (medical instruments) (November 1998-January 1999); President and Chief Executive Officer, The National Association of Securities Dealers, Inc. and The NASDAQ Stock Market, Inc. (1987-1997); Chief Operating Officer of Alex. Brown & Sons Incorporated (now Deutsche Bank Securities Inc.) (1985-1987); General Partner, Alex. Brown & Sons Incorporated (now Deutsche Bank Securities Inc.) (1976-1985). | 66 | ||
Richard J. Herring 2/18/46 Trustee since 1999 for the Scudder Advisor Funds Trustee since 2002 for the Scudder MG Investments Trust | Jacob Safra Professor of International Banking and Professor, Finance Department, The Wharton School, University of Pennsylvania (since July 1972); Director, Lauder Institute of International Management Studies (since July 2000); Co-Director, Wharton Financial Institutions Center (since July 2000). Formerly, Vice Dean and Director, Wharton Undergraduate Division (July 1995-June 2000). | 66 | ||
Graham E. Jones 1/31/33 Trustee since 2002 for the Scudder Advisor Funds Trustee since 1993 for the Scudder MG Investments Trust | Senior Vice President, BGK Realty, Inc. (commercial real estate) (since 1995); Trustee, 8 open-end mutual funds managed by Weiss, Peck & Greer (since 1985) and Trustee of 18 open-end mutual funds managed by Sun Capital Advisers, Inc. (since 1998). | 66 | ||
Rebecca W. Rime l4/10/51 Trustee since 2002 | President and Chief Executive Officer, The Pew Charitable Trusts (charitable foundation) (1994 to present); Executive Vice President, The Glenmede Trust Company (investment trust and wealth management) (1983 to present). Formerly, Executive Director, The Pew Charitable Trusts (1988-1994); Director, ISI Family of Funds (registered investment companies) (1997-1999) and Director, The Glenmede Trust Company (investment trust and wealth management) (1994-2002). | 66 | ||
Philip Saunders, Jr. 10/11/35 Trustee since 1986 for the Scudder Advisor Funds Trustee since 2002 for the Scudder MG Investments Trust | Principal, Philip Saunders Associates (economic and financial consulting) (since November 1988). Formerly, Director, Financial Industry Consulting, Wolf & Company (consulting) (1987-1988); President, John Hancock Home Mortgage Corporation (1984-1986); Senior Vice President of Treasury and Financial Services, John Hancock Mutual Life Insurance Company, Inc. (1982-1986). | 66 | ||
William N. Searcy 9/03/46 Trustee since 2002 for the Scudder Advisor Funds Trustee since 1993 for the Scudder MG Investments Trust | Pension & Savings Trust Officer, Sprint Corporation3 (telecommunications) (since November 1989); Trustee of 22 open-end mutual funds managed by Sun Capital Advisers, Inc. (since October 1998). | 66 | ||
Robert H. Wadsworth 1/29/40 Trustee since 2002 | President, Robert H. Wadsworth Associates, Inc. (consulting firm) (May 1982 to present). Formerly, President and Trustee, Trust for Investment Managers (registered investment company) (April 1999-June 2002); President, Investment Company Administration, L.L.C. (January 1992*-July 2001); President, Treasurer and Director, First Fund Distributors, Inc. (June 1990-January 2002); Vice President, Professionally Managed Portfolios (May 1991-January 2002) and Advisors Series Trust (October 1996-January 2002) (registered investment companies); President, Guinness Flight Investment Funds, Inc. (registered investment company) (June 1994-November1998). * Inception date of the corporation which was the predecessor to the L.L.C. | 69 | ||
69
Table of Contents
Interested Trustee
Name, Date of Birth, | Business Experience and Directorships During the Past 5 Years | Number of Funds in the Fund Complex Overseen | ||
Richard T. Hale4 7/17/45 Chairman since 2002 and Trustee since 1999 for the Scudder Advisor Funds Trustee since 2002 for the Scudder MG Investments Trust | Managing Director, Deutsche Investment Management Americas Inc. (2003-present); Managing Director, Deutsche Bank Securities Inc. (formerly Deutsche Banc Alex. Brown Inc.) and Deutsche Asset Management (1999 to present); Director and President, Investment Company Capital Corp. (registered investment advisor) (1996 to present); Director, Deutsche Global Funds, Ltd. (2000 to present), CABEI Fund (2000 to present), North American Income Fund (2000 to present) (registered investment companies); Director, Scudder Global Opportunities Fund (since 2003); Director/Officer Deutsche/Scudder Mutual Funds (various dates); President, Montgomery Street Income Securities, Inc. (2002 to present) (registered investment companies); Vice President, Deutsche Asset Management, Inc. (2000 to present). Formerly, Director, ISI Family of Funds (registered investment companies; 4 funds overseen) (1992-1999). | 201 |
Officers
Name, Date of Birth, Position with | Business Experience and Directorships During the Past 5 Years | |
Richard T. Hale4 7/17/45 President since 2003 | See information presented under Interested Director. | |
Kenneth Murphy5 10/13/63 Vice President and Anti-Money Laundering Compliance Officer since 2002 | Vice President, Deutsche Asset Management (September 2000-present); Vice President, Scudder Distributors, Inc. (December 2002-present). Formerly, Director, John Hancock Signature Services (1992-2000). | |
Daniel O. Hirsch 3/27/54 Vice President since 2000 and Secretary since 1999 for the Scudder Advisor Funds Vice President since 2001 and Secretary since 1999 for the Scudder MG Investments Trust | Managing Director, Deutsche Asset Management (2002-present) and Director, Deutsche Global Funds Ltd. (2002-present). Formerly, Director, Deutsche Asset Management (1999-2002); Principal, BT Alex. Brown Incorporated (now Deutsche Bank Securities Inc.) (1998-1999); Assistant General Counsel, United States Securities and Exchange Commission (1993-1998). | |
Charles A. Rizzo5 8/5/57 Treasurer since 2002 | Director, Deutsche Asset Management (April 2000 to present); Formerly, Vice President and Department Head, BT Alex. Brown Incorporated (now Deutsche Bank Securities Inc.) (1998-1999); Senior Manager, Coopers & Lybrand L.L.P. (now PricewaterhouseCoopers LLP) (1993-1998). | |
Salvatore Schiavone5 11/03/65 Assistant Treasurer since 2003 | Director, Deutsche Asset Management. | |
Lucinda H. Stebbins5 11/19/45 Assistant Treasurer since 2003 | Director, Deutsche Asset Management. | |
Kathleen Sullivan D’Eramo5 1/25/57 Assistant Treasurer since 2003 | Director, Deutsche Asset Management. | |
John Millette5 8/23/62 Assistant Secretary since 2003 | Director, Deutsche Asset Management. | |
Caroline Pearson5 4/01/62 Assistant Secretary since 2002 | Managing Director, Deutsche Asset Management. | |
Bruce A. Rosenblum 9/14/60 Assistant Secretary since 2002 | Director, Deutsche Asset Management. | |
| 1 | Unless otherwise indicated, the mailing address of each Trustee and Officer with respect to fund operations is One South Street, Baltimore, MD 21202. |
| 2 | Length of time served represents the date that each Trustee or Officer first began serving in that position with Scudder Advisor Funds of which Scudder Small and Mid Cap Funds are a series, and Scudder MG Investments Trust of which Scudder Micro Cap Fund is a series. |
| 3 | A publicly held company with securities registered pursuant to Section 12 of the Securities Exchange Act of 1934. |
| 4 | Mr. Hale is a Trustee who is an “interested person” within the meaning of Section 2(a)(19) of the 1940 Act. Mr. Hale is Vice President of Deutsche Asset Management, Inc. and a Managing Director of Deutsche Asset Management, the US asset management unit of Deutsche Bank AG and its affiliates. |
| 5 | Address: Two International Place, Boston, Massachusetts. |
The fund’s Statement of Additional Information includes additional information about the fund’s directors. To receive your free copy of the Statement of Additional Information, call toll-free: 1-800-621-1048.
70
Table of Contents
For shareholders of Classes A, B, C, Investment and Institutional Classes
| Automated Information Lines | ScudderACCESS (800) 972-3060
Personalized account information, information on other Scudder funds and services via touchtone telephone and for Classes A, B, and C only, the ability to exchange or redeem shares. | |
| Web Site | scudder.com
View your account transactions and balances, trade shares, monitor your asset allocation, and change your address, 24 hours a day. Obtain prospectuses and applications, blank forms, interactive worksheets, news about Scudder funds, subscription to fund updates by e-mail, retirement planning information, and more. | |
| For More Information | (800) 621-1048
To speak with a Scudder service representative. | |
| Written Correspondence | Scudder Investments
PO Box 219356 Kansas City, MO 64121-9356 | |
| Proxy Voting | A description of the fund’s policies and procedures for voting proxies for portfolio securities can be found on our Web site - scudder.com (type “proxy voting” in the search field) - or on the SEC’s Web site - www.sec.gov. To obtain a written copy without charge, call us toll free at (800) 621-1048. | |
| Principal Underwriter | If you have questions, comments or complaints, contact:
Scudder Distributors, Inc.
222 South Riverside Plaza Chicago, IL 60606-5808 (800) 621-1148 | |
For shareholders of Class R
| Automated Information Lines | Scudder Flex Plan Access (800) 532-8411
24-hour access to your retirement plan account. | |
| Web Site | scudder.com
Click “Retirement Plans” to reallocate assets, process transactions and review your funds through our secure online account access. Obtain prospectuses and applications, blank forms, interactive worksheets, news about Scudder funds, subscription to fund updates by e-mail, retirement planning information, and more. | |
| For More Information | (800) 543-5776
To speak with a Scudder service representative. | |
| Written Correspondence | Scudder Retirement Services
222 South Riverside Plaza Chicago, IL 60606-5806 | |
| Proxy Voting | A description of the fund’s policies and procedures for voting proxies for portfolio securities can be found on our Web site - scudder.com (type “proxy voting” in the search field) - or on the SEC’s Web site - www.sec.gov. To obtain a written copy without charge, call us toll free at (800) 543-5776. | |
| Principal Underwriter | If you have questions, comments or complaints, contact:
Scudder Distributors, Inc.
222 South Riverside Plaza Chicago, IL 60606-5808 (800) 621-1148 | |
71
Table of Contents
Scudder Mid Cap Fund | Scudder Small Cap Fund | Scudder Micro Cap Fund | ||||||
Class A | Nasdaq Symbol | SMCAX | SSDAX | SMFAX | ||||
| CUSIP Number | 81111R 882 | 81111R 791 | 81116P 634 | |||||
Class B | Nasdaq Symbol | SMCBX | SSDBX | SMFBX | ||||
| CUSIP Number | 81111R 874 | 81111R 783 | 81116P 626 | |||||
Class C | Nasdaq Symbol | SMCCX | SSDCX | SMFCX | ||||
| CUSIP Number | 81111R 866 | 81111R 775 | 81116P 618 | |||||
Class R* | Nasdaq Symbol | SMCRX | SSDRX | N/A | ||||
| CUSIP Number | 81111R726 | 81111R718 | N/A | |||||
Investment Class | Nasdaq Symbol | BTCAX | BTSCX | MMFSX | ||||
| CUSIP Number | 81111R 841 | 81111R 767 | 81116P 584 | |||||
Institutional Class | Nasdaq Symbol | BTEAX | N/A | MGMCX | ||||
| CUSIP Number | 81111R 858 | N/A | 81116P 592 |
| * | Scudder Mid Cap Fund Class R shares commenced operations on July 1, 2003. Scudder Small Cap Fund Class R shares commenced operations on October 1, 2003. |
[GRAPHIC APPEARS HERE]
72
Table of Contents
[Scudder Investments logo]
Scudder Mid Cap Fund
Scudder Small Cap Fund
Scudder Micro Cap Fund
Semiannual Report to Shareholders
March 31, 2004
Contents
| Portfolio Management Review | 3 | |
| 7 | ||
| 7 | ||
| 10 | ||
| 11 | ||
| 12 | ||
| 16 | ||
| 22 | ||
| 27 | ||
| 27 | ||
| 30 | ||
| 31 | ||
| 32 | ||
| 36 | ||
| 41 | ||
| 46 | ||
| 46 | ||
| 50 | ||
| 51 | ||
| 52 | ||
| 56 | ||
| 61 | ||
| 65 | ||
| 66 | ||
This report must be preceded or accompanied by a prospectus. To obtain a prospectus for any of our funds, refer to the Account Management Resources information provided in the back of this booklet. We advise you to consider the fund’s objectives, risks, charges and expenses carefully before investing. The prospectus contains this and other important information about each fund. Please read the prospectus carefully before you invest.
Investments in mutual funds involve risk. Some funds have more risk than others. Scudder Mid Cap Fund is subject to stock market risk. Stocks of medium-sized companies involve greater risk than securities of larger, more-established companies, as they often have limited product lines, markets or financial resources and may be subject to more erratic and abrupt market movements. Scudder Small Cap Fund is subject to stock market risk. Stocks of small companies involve greater risk than securities of larger, more-established companies, as they often have limited product lines, markets or financial resources and may be subject to more erratic and abrupt market movements. Scudder Micro Cap Fund is subject to stock market risk. Stocks of micro capitalization companies (minimum market capitalization of $10 million) involve greater risk than securities of larger, more-established companies, as they often have limited product lines, markets or financial resources and may be subject to more erratic and abrupt market movements. Please read each fund’s prospectus for specific details regarding its investments and risk profile.
Scudder Investments is part of Deutsche Asset Management, which is the marketing name in the US for the asset management activities of Deutsche Bank AG, Deutsche Investment Management Americas Inc., Deutsche Asset Management Inc., Deutsche Asset Management Investment Services Ltd., Deutsche Bank Trust Company Americas and Scudder Trust Company.
Fund shares are not FDIC-insured and are not deposits or other obligations of, or guaranteed by, any bank. Fund shares involve investment risk, including possible loss of principal.
2
Table of Contents
In the following interview, Lead Portfolio Manager Audrey M.T. Jones and Portfolio Managers Samuel Dedio and Robert Janis discuss the three funds’ performance, strategies and the market environment during the six-month period ended March 31, 2004. Ms. Jones is retiring on June 30, 2004. Effective July 1, 2004, Mr. Dedio and Mr. Janis will become co-lead Portfolio Managers of each fund.
Q: How did Scudder Micro Cap Fund, Scudder Small Cap Fund and Scudder Mid Cap Fund perform for their most recent semiannual period?
A: Each of the three funds underperformed its index benchmark and peer group for the six-month period ended March 31, 2004. Scudder Micro Cap Fund posted a 16.21% total return for the semiannual period and Scudder Small Cap Fund posted a 13.63% total return, compared with the 21.69% return of the Russell 2000 Index. Scudder Mid Cap Fund returned 9.95% for the six-month period, compared with the 18.92% return of the S&P MidCap 400 Index. (All fund returns are for Class A shares, unadjusted for sales charges. If sales charges had been included, returns would have been lower.) The Lipper Small-Cap Growth Funds category average return was 17.13% for the six-month period, the Lipper Small-Cap Core Funds category average return was 21.79% and the Lipper Mid-Cap Growth Funds category average return was 15.36%.1 Past performance is no guarantee of future results. Please see the Performance Summary that begins on page 11 (Scudder Mid Cap Fund), page 37 (Scudder Small Cap Fund) and page 61 (Scudder Micro Cap Fund) for standardized performance for all share classes and for additional performance information.
| 1 | Source: Lipper Inc. The Lipper Small-Cap Growth Funds category includes portfolios that invest at least 75% of equity assets in companies with market capitalizations of less than 300% of the dollar-weighted median market capitalization of the smallest 500 of the middle 1,000 securities of the S&P SuperComposite 1500 Index. These portfolios typically have above-average price-to-earnings ratios and price-to-book ratios compared with the S&P SmallCap 600 Index. |
The Lipper Small-Cap Core Funds category includes portfolios that invest at least 35% of their equity assets in companies with market capitalizations (on a three-year weighted basis) less that 300% of the dollar-weighted median of the smallest 500 of the middle 1,000 securities of the S&P SuperComposite 1500 Index. Small-cap core funds have more latitude in the companies in which they invest. These funds typically have an average price-earnings ratio, price-to-book ratio, and three-year sales-per-share growth value, compared to the S&P SmallCap 600 Index.
The Lipper Mid-Cap Growth Funds category includes portfolios that invest at least 75% of equity assets in companies with market capitalizations of less than 300% of the dollar-weighted median market capitalization of the middle 1,000 securities of the S&P SuperComposite 1500 Index. These portfolios typically have above-average price-to-earnings ratios and price-to-book ratios compared with the S&P MidCap 400 Index. It is not possible to invest directly in an index or a Lipper category.
The funds’ underperformance relative to their benchmarks was due mainly to mixed results from specific stock selections and sector positioning. Performance was also negatively affected by the fact that the most illiquid, most speculative and smallest companies, many without real earnings, were snapped up by investors during the six-month period after having been beaten down from 2000 to 2002. By contrast, we have kept a steady, long-term focus on high-quality companies with consistent operating results, strong balance sheets and a stable history of operations.
3
Table of Contents
Q: What were the best and worst stock performers for each of the three funds?
A: For Scudder Micro Cap Fund, the top contributing securities were Wabash National Corp. and Shuffle Master, Inc. Wabash National Corp. manufactures standard as well as customized truck trailers, freight vans, refrigerated trailers, railway cars, parts and equipment. In a move to strengthen its balance sheet, in October Wabash National Corp. announced the planned sale of a substantial portion of the remaining finance contracts in its finance portfolio. The company also reported solid third-quarter results. And in February, Wabash National Corp. announced strong fourth-quarter as well as year-end results, with increased year-over-year net sales. Shuffle Master, Inc. manufactures automatic card-shuffling systems as well as gaming-related devices, including game tables. In an effort to focus on its core competencies, Shuffle Master, Inc. sold its slot assets for a profit in February. Later that same month, the company announced two acquisitions which analysts expected to immediately benefit the company’s earnings and a 30% year-over-year increase in both revenues and operating income.
Both of the companies that detracted the most from Scudder Micro Cap Fund’s performance during the period - InterVideo, Inc. and GRIC Communications Inc. - are part of the technology sector. InterVideo, Inc., which the fund sold in December, is a provider of DVD software that allows users to record, edit and play digital multimedia content on personal computers as well as consumer electronics. The company posted disappointing earnings back in November and was subsequently downgraded by a leading technology analyst. GRIC Communications, Inc., which the fund purchased during the first quarter, provides software as well as managed security services that allow customers to manage Internet-based transactions and communications worldwide. GRIC Communications, Inc. is one of the few micro-cap companies that participate in the Wi-Fi market, where businesspersons connect to the Internet on a remote basis at “hot spots” around the world. GRIC Communications, Inc. has been winning multiyear contracts from blue chip companies such as Procter & Gamble. We believe that recent selling by two large institutional investors - GRIC Communications, Inc. has only $150 million in market capitalization - has hurt the stock’s short-term performance. We will be monitoring this holding carefully over the coming months.
For Scudder Mid Cap Fund, the two stocks that contributed most to performance during the six-month period were Harman International Industries, Inc. and Symantec Corp. Harman International Industries, Inc. designs and manufactures high-fidelity audio products as well as “infotainment” systems for professional, consumer and automotive markets worldwide. In January, Harman International Industries, Inc. announced record results for the fiscal second quarter, with a 24% year-over-year increase in net sales and a 50% year-over-year increase in net income. Symantec Corp. provides content as well as network security software and solutions to individuals, businesses and service providers, and is perhaps best known for its Norton antivirus software. In January the company beat analysts’ earnings expectations based on strong sales of the software and raised its earnings expectations for the next fiscal quarter. Symantec Corp. was subsequently upgraded by two major brokerage firms.
The most disappointing stocks for Scudder Mid Cap Fund were ITT Education Services, Inc. and Maxtor Corp. ITT Educational Services, Inc. is a for-profit provider of technology-oriented associates, bachelors and masters degree programs, as well as nondegree curricula. Despite record enrollments and strong earnings per share, the company’s stock price dropped sharply in late February upon news that federal agents were searching its headquarters and other facilities for information related to placement, retention, graduation rates, attendance figures and student grades. No official charges have been filed against ITT Educational Services, Inc., which has been cooperating with the investigation. We are continuing to monitor this situation closely. Maxtor Corp. designs and manufactures computer disk drives for personal computers and Intel-based servers as well as consumer electronics. In January, despite the company’s announcement that it had narrowly exceeded top- and bottom-line expectations for the fourth quarter, Maxtor’s stock price was negatively affected by rival-firm Seagate Technology’s
4
Table of Contents
announcement that it was going to miss earnings expectations due to inventory and pricing pressures. Maxtor Corp. then announced lower-than-expected first-quarter earnings guidance, citing the same issues that had affected Seagate Technology. After we sold the fund’s position in Maxtor Corp. in February, the company announced the resignation of its CFO, and Seagate Technology issued more disappointing results, again dragging down the subsector.
The two stocks that contributed the most to Scudder Small Cap Fund’s results during the period were Fairchild Semiconductor Corp. and Documentum, Inc. (As of March 31, 2004, the fund’s position in Documentum, Inc. was sold.) Fairchild Semiconductor Corp. develops memory semiconductors for the personal computer, telecom, consumer electronics, automotive and industrial markets. In October and again in January, Fairchild Semiconductor Corp. beat analysts’ earnings estimates by 4 cents per share and benefited from an analyst’s upgrade. The company also acquired the RF Components Division of Raytheon Company, which gives it immediate entry into the advanced radio frequency market. In March, Fairchild raised its first-quarter sales forecast, driven by continued strong demand for its power semiconductors. During the first quarter, we sold the fund’s position as Fairchild hit our price target and its market capitalization grew beyond the fund’s market-cap size guidelines. Documentum, Inc. is a software company that provides enterprise content-management solutions. In mid-October, EMC announced the signing of a definitive agreement to acquire Documentum, Inc. Following the announcement, the fund took profits in this stock.
Detracting the most from Scudder Small Cap Fund’s performance were Enterasys Networks, Inc. and ITT Educational Services, Inc. Enterasys Networks, Inc. is the largest of four former subsidiaries of Cabletron Systems Company. Enterasys Networks, Inc. was the section of Cabletron Systems Company focused on networking solutions, including switching, routing and security. In January, Bank of America reported that it expected Foundry Networks, Inc., another significant player in this market, to gain market share at the expense of companies such as Enterasys Networks, Inc. and Nortel Networks Corp. In March, Enterasys Networks, Inc. lowered its revenue forecast due to an expected decline in service revenue as well as increased competition. It also announced a plan to cut costs. The fund sold the security in March, purchasing in its place a competitor that we felt possessed a stronger business outlook.
Q: What impact did sector positioning and stock selection have on the funds’ results?
A: During the semiannual period, Scudder Micro Cap Fund’s sector allocation caused its underperformance versus its benchmark. The fund benefited from an overweight (its relatively larger stake than the benchmark index) in energy and an underweight (its relatively smaller stake than the benchmark index) in consumer stocks but was hurt by its underweight in process industries and its overweight in transportation. Overall stock selection also had a negative effect on performance during the period. Favorable stock selection in the consumer and transportation sectors was more than offset by stock selection in technology and health care.
For Scudder Mid Cap Fund, sector allocation also had a net negative effect on performance. The fund benefited from underweights in the capital goods and consumer sectors, but overweights in technology and transportation detracted from returns. Stock selection was the main driver of the fund’s underperformance versus the S&P MidCap 400 Index for the period. Stock selection in the credit-sensitive2 and energy sectors outpaced benchmark counterparts, though stock selection in the technology and consumer sectors lagged the benchmark.
| 2 | The credit-sensitive sector includes financials and other companies affected by interest rates. |
5
Table of Contents
In the case of Scudder Small Cap Fund, sector positioning and stock selection also detracted from performance over the period. The fund benefited from overweights in the energy and consumer sectors but was hurt by an overweight in technology and an underweight in capital goods. However, stock selection was the main detractor, as favorable stock selection in energy and service companies was more than offset by stock selection in the technology and credit-sensitive sectors.
Q: What were the major factors affecting small-cap and mid-cap equities during the period?
A: Over the six-month period, stocks - especially small-cap stocks - provided strong returns. Signs that the US economy was beginning to emerge from its slowdown appeared in the second and third quarters of 2003, and the equity market began a strong rebound. During the fourth quarter, the government reported the largest year-over-year profit growth in 19 years, and stocks continued to surge. In January, the Federal Reserve Board left interest rates unchanged at 1%. However, employment growth remained sluggish as the unemployment rate declined from 5.9% to 5.7%. In February, the economy continued to improve as fourth-quarter gross domestic product (the total market value of all goods and services produced in the United States) grew at a solid 4.1% rate, primarily as a result of stronger business equipment and software spending, higher inventory investment and greater export volume. Inflation remained subdued, rising by 0.5% in January, and industrial production benefited from these supports, rising 0.8%. The consumer continued to support the economy, as same-store sales rose 5.8% in January and retail sales, excluding autos, also remained solid. On the other hand, consumer confidence faltered somewhat as a result of negative political-economic news, a slow job recovery environment and the recent increase in energy prices. The small-cap equity segment continued to outperform the other size segments, with value outperforming growth. As always, the consumer remains the key to economic recovery, but for the recovery to be sustained, there has to be a revival in business investment spending in addition to stable labor market conditions.
Q: In light of the results for the most recent period, what investment strategies will you be pursuing going forward?
A: We continue to seek fundamentally sound companies with strong balance sheets. We will also remain disciplined in our investment process. Within our investment strategy, we will continue to:
| • | Focus on small-cap companies with above-average growth prospects selling at reasonable valuations with the potential to be the blue chips of the future |
| • | Focus on individual stock selection with the goal of providing value-added performance relative to the universe of smaller US companies |
| • | Use extensive and intensive fundamental research to identify companies with innovation, leading or dominant positions in their markets, a high rate of return on invested capital, and/or the ability to finance a major part of growth from internal sources |
| • | Strictly adhere to our sell discipline to reduce exposure to stocks with diminished appreciation potential |
We will continue to monitor economic conditions and their effect on financial markets as we seek capital growth over the long term.
The views expressed in this report reflect those of the portfolio managers only through the end of the period of the report as stated on the cover. The managers’ views are subject to change at any time based on market and other conditions and should not be construed as a recommendation.
6
Table of Contents
Performance Summary March 31, 2004
All performance shown is historical, assumes reinvestment of all dividends and capital gains, and does not guarantee future results. Investment return and principal value fluctuate with changing market conditions so that, when redeemed, shares may be worth more or less than their original cost. Current performance may be lower or higher than the performance quoted. Please visit scudder.com for the product’s most recent month-end performance.
The maximum sales charge for Class A shares is 5.75%. For Class B shares, the maximum contingent deferred sales charge (CDSC) is 4% within the first year after purchase, declining to 0% after six years. Class C shares have no adjustment for front-end sales charges but redemptions within one year of purchase may be subject to a CDSC of 1%. Unadjusted returns do not reflect sales charges and would have been lower if they had. Investment Class, Class R and Institutional Class shares are not subject to sales charges.
Returns and rankings during all periods shown reflect a fee waiver and/or expense reimbursement. Without this waiver/reimbursement, returns and rankings would have been lower.
Performance figures do not reflect the deduction of taxes that a shareholder would pay on fund distributions or the sale of fund shares. Returns and rankings may differ by share class.
Returns shown for Class A, B and C shares prior to June 28, 2002 and Class R prior to July 1, 2003 are derived from the historical performance of Investment Class shares of the Scudder Mid Cap Fund during such periods and have been adjusted to reflect the higher gross total annual operating expenses and the current applicable sales charges of each specific class. Any difference in expenses will affect performance.
At the close of business on August 31, 2000, shares of Equity Appreciation - Institutional Class merged into Institutional Class shares of Mid Cap Fund. Equity Appreciation - Institutional Class was managed by the same investment management team with the same objectives, policies and strategies as Mid Cap. The performance shown reflects Equity Appreciation - Institutional Class shares’ actual returns from its inception on October 12, 1993. Performance for periods after August 31, 2000 reflect the performance of the Mid Cap Fund - Institutional Class.
Average Annual Total Returns (Unadjusted for Sales Charge) as of 3/31/04
Scudder Mid Cap Fund | 6-Month++ | 1-Year | 3-Year | 5-Year | 10-Year | ||||||||||
Class A | 9.95 | % | 35.63 | % | 2.91 | % | 4.17 | % | 10.90 | % | |||||
Class B | 9.52 | % | 34.67 | % | 2.02 | % | 3.21 | % | 9.84 | % | |||||
Class C | 9.52 | % | 34.67 | % | 2.02 | % | 3.21 | % | 9.84 | % | |||||
Investment Class | 9.95 | % | 35.63 | % | 2.91 | % | 4.17 | % | 10.90 | % | |||||
Class R | 9.96 | % | 35.05 | % | 2.59 | % | 3.87 | % | 10.61 | % | |||||
Institutional Class | 10.13 | % | 36.04 | % | 3.18 | % | 4.51 | % | 11.19 | % | |||||
S&P MidCap 400 Index+ | 18.92 | % | 49.10 | % | 10.71 | % | 11.76 | % | 14.93 | % |
Sources: Lipper Inc. and Deutsche Asset Management, Inc.
| ++ | Total returns shown for periods less than one year are not annualized. |
Net Asset Value
| Class A | Class B | Class C | Investment Class | Class R | Institutional Class | |||||||||||||
Net Asset Value: | ||||||||||||||||||
3/31/04 | $ | 12.60 | $ | 12.43 | $ | 12.43 | $ | 12.60 | $ | 12.59 | $ | 12.72 | ||||||
9/30/03 | $ | 11.46 | $ | 11.35 | $ | 11.35 | $ | 11.46 | $ | 11.45 | $ | 11.55 | ||||||
7
Table of Contents
Investment Class Lipper Rankings - Mid-Cap Growth Funds Category as of 3/31/04
Period | Rank | Number of Funds Tracked | Percentile Ranking | |||||
1-Year | 393 | of | 497 | 79 | ||||
3-Year | 125 | of | 399 | 32 | ||||
5-Year | 103 | of | 249 | 42 | ||||
10-Year | 26 | of | 92 | 28 |
Source: Lipper Inc. Rankings are historical and do not guarantee future results. Rankings are based on total return with distributions reinvested. Rankings are for Investment Class shares; other share classes may vary.
Scudder Mid Cap Fund
Growth of an Assumed $10,000 Investment (Adjusted for Maximum Sales Charge)
[] Scudder Mid Cap Fund - Class A
[] S&P MidCap 400 Index+
[GRAPHIC APPEASRS HERE]
Yearly periods ended March 31
The Fund’s growth of an assumed $10,000 investment is adjusted for the maximum sales charge of 5.75%. This results in a net investment of $9,425.
Comparative Results (Adjusted for Maximum Sales Charge) as of 3/31/04
Scudder Mid Cap Fund | 1-Year | 3-Year | 5-Year | 10-Year | ||||||||||||||
Class A | Growth of $10,000 Average annual total return | $ | 12,783 27.83 | % | $ | 10,273 .90 | % | $ | 11,561 2.94 | % | $ | 26,526 10.25 | % | |||||
Class B | Growth of $10,000 Average annual total return | $ | 13,167 31.67 | % | $ | 10,419 1.38 | % | $ | 11,623 3.05 | % | $ | 25,565 9.84 | % | |||||
Class C | Growth of $10,000 Average annual total return | $ | 13,467 34.67 | % | $ | 10,619 2.02 | % | $ | 11,714 3.21 | % | $ | 25,565 9.84 | % | |||||
S&P MidCap 400 Index+ | Growth of $10,000 Average annual total return | $ | 14,910 49.10 | % | $ | 13,569 10.71 | % | $ | 17,434 11.76 | % | $ | 40,222 14.93 | % | |||||
The growth of $10,000 is cumulative.
8
Table of Contents
Scudder Mid Cap Fund
Growth of an Assumed $10,000 Investment (Adjusted for Maximum Sales Charge)
[] Scudder Mid Cap Fund - Investment Class
[] S&P MidCap 400 Index+
[GRAPHIC APPEARS HERE]
Yearly periods ended March 31
Comparative Results as of 3/31/04
Scudder Mid Cap Fund | 1-Year | 3-Year | 5-Year | 10-Year | ||||||||||||||
Investment Class | Growth of $10,000 Average annual total return | $ | 13,563 35.63 | % | $ | 10,900 2.91 | % | $ | 12,267 4.17 | % | $ | 28,144 10.90 | % | |||||
Class R | Growth of $10,000 Average annual total return | $ | 13,505 35.05 | % | $ | 10,799 2.59 | % | $ | 12,092 3.87 | % | $ | 27,400 10.61 | % | |||||
S&P MidCap 400 Index+ | Growth of $10,000 Average annual total return | $ | 14,910 49.10 | % | $ | 13,569 10.71 | % | $ | 17,434 11.76 | % | $ | 40,222 14.93 | % | |||||
Scudder Mid Cap Fund | 1-Year | 3-Year | 5-Year | 10-Year | ||||||||||||||
Institutional Class | Growth of $250,000 Average annual total return | $ | 340,100 36.04 | % | $ | 274,600 3.18 | % | $ | 311,650 4.51 | % | $ | 722,025 11.19 | % | |||||
S&P MidCap 400 Index+ | Growth of $250,000 Average annual total return | $ | 372,750 49.10 | % | $ | 339,225 10.71 | % | $ | 435,850 11.76 | % | $ | 1,005,550 14.93 | % | |||||
| The | growth of $10,000/$250,000 is cumulative. |
| The | minimum investment for Institutional Class shares is $250,000. |
| + | S&P MidCap 400 Index is an unmanaged index that tracks the stock movement of 400 mid-sized US companies. Index returns assume reinvestment of dividends and, unlike Fund returns, do not reflect any fees or expenses. It is not possible to invest directly into an index. |
9
Table of Contents
Portfolio Summary March 31, 2004
Scudder Mid Cap Fund
Asset Allocation | 3/31/04 | 9/30/03 | ||||
Common Stocks | 92 | % | 96 | % | ||
Cash Equivalents, net | 8 | % | 4 | % | ||
| 100 | % | 100 | % | |||
Sector Diversification (Excludes Cash Equivalents) | 3/31/04 | 9/30/03 | �� | |||
Consumer Discretionary | 25 | % | 14 | % | ||
Information Technology | 23 | % | 24 | % | ||
Financials | 15 | % | 11 | % | ||
Industrials | 11 | % | 13 | % | ||
Health Care | 10 | % | 17 | % | ||
Energy | 6 | % | 7 | % | ||
Materials | 6 | % | 6 | % | ||
Consumer Staples | 3 | % | 7 | % | ||
Telecommunication Services | 1 | % | 1 | % | ||
| 100 | % | 100 | % | |||
Ten Largest Equity Holdings at March 31, 2004 (26.8% of Portfolio) | |||
1. Corinthian Colleges, Inc. Provider of higher education | 3.3 | % | |
2. Symantec Corp. Producer of software products | 3.2 | % | |
3. Packaging Corp. of America Manufacturer of containerboard and corrugated packaging products | 3.0 | % | |
4. Harman International Industries, Inc. Manufacturer of high fidelity audio and video components | 2.9 | % | |
5. Protein Design Labs, Inc. Developer of human and humanized antibodies | 2.8 | % | |
6. Tech Data Corp. Distributor of microcomputer, hardware and software | 2.5 | % | |
7. BJ Services Co. Provider of pressure pumping and other oilfield services for the petroleum industry | 2.3 | % | |
8. Columbia Sportswear Co. Manufacturer of active outdoor apparel | 2.3 | % | |
9. Friedman, Billings, Ramsey Group, Inc. “A” Operator of property management services | 2.3 | % | |
10. Legg Mason, Inc. Provider of various financial services | 2.2 | % |
Asset allocation, sector diversification and portfolio holdings are subject to change.
For more complete details about the fund’s investment portfolio, see page 16. A quarterly Fact Sheet is available upon request. Information concerning portfolio holdings of the Fund as of month end is available upon request on the 16th of the following month. Please see the Account Management Resources section for contact information.
10
Table of Contents
Investment Portfolio as of March 31, 2004 (Unaudited)
Scudder Mid Cap Fund | Shares | Value ($) | ||
Common Stocks 92.2% | ||||
Consumer Discretionary 22.6% | ||||
Automobiles 1.4% | ||||
Thor Industries, Inc. | 359,800 | 9,664,228 | ||
Hotels Restaurants & Leisure 5.3% | ||||
Alliance Gaming Corp.* | 423,900 | 13,619,907 | ||
GTECH Holdings Corp. | 238,000 | 14,075,320 | ||
The Cheesecake Factory, Inc.* | 166,500 | 7,680,645 | ||
| 35,375,872 | ||||
Household Durables 6.5% | ||||
Harman International Industries, Inc. | 240,500 | 19,143,800 | ||
Leggett & Platt, Inc. | 448,200 | 10,626,822 | ||
Tempur-Pedic International, Inc.* | 894,900 | 13,996,236 | ||
| 43,766,858 | ||||
Media 1.0% | ||||
Entercom Communications Corp.* | 141,600 | 6,410,232 | ||
Multiline Retail 1.5% | ||||
Tuesday Morning Corp.* | 301,100 | 10,375,906 | ||
Specialty Retail 4.6% | ||||
Advance Auto Parts, Inc.* | 250,200 | 10,175,634 | ||
Chico’s FAS, Inc.* | 303,000 | 14,059,200 | ||
Regis Corp. | 151,900 | 6,750,436 | ||
| 30,985,270 | ||||
Textiles, Apparel & Luxury Goods 2.3% | ||||
Columbia Sportswear Co.* | 272,700 | 15,118,488 | ||
Consumer Staples 2.9% | ||||
Beverages 1.2% | ||||
Constellation Brands, Inc. “A”* | 261,900 | 8,406,990 | ||
Food Products 1.7% | ||||
Dean Foods Co.* | 333,450 | 11,137,230 | ||
Energy 6.0% | ||||
Energy Equipment & Services | ||||
BJ Services Co.* | 351,800 | 15,222,386 | ||
Rowan Companies, Inc.* | 566,500 | 11,947,485 | ||
Smith International, Inc.* | 241,800 | 12,938,718 | ||
| 40,108,589 | ||||
Financials 14.2% | ||||
Consumer Finance 1.0% | ||||
Providian Financial Corp.* | 486,600 | 6,374,460 | ||
Diversified Financial Services 11.9% | ||||
CapitalSource, Inc.* | 484,700 | 10,881,515 | ||
Chicago Mercantile Exchange | 58,100 | 5,620,594 | ||
Friedman, Billings, Ramsey Group, Inc. “A” | 556,600 | 15,022,634 | ||
Investment Technology Group, Inc.* | 309,100 | 4,729,230 | ||
Investors Financial Services Corp. | 355,000 | 14,668,600 | ||
Labranche & Co., Inc.* | 433,500 | 4,859,535 | ||
Legg Mason, Inc. | 161,200 | 14,956,136 | ||
The First Marblehead Corp.* | 309,400 | 9,111,830 | ||
| 79,850,074 | ||||
Insurance 1.3% | ||||
Assurant, Inc.* | 125,900 | 3,166,385 | ||
Axis Capital Holdings Ltd. | 191,300 | 5,652,915 | ||
| 8,819,300 | ||||
Health Care 8.8% | ||||
Biotechnology 5.6% | ||||
Genzyme Corp. (General Division)* | 184,300 | 8,669,472 | ||
Gilead Sciences, Inc.* | 184,500 | 10,289,565 | ||
Protein Design Labs, Inc.* | 782,300 | 18,634,386 | ||
| 37,593,423 | ||||
Health Care Equipment & Supplies 0.3% | ||||
Kinetic Concepts, Inc.* | 40,100 | 1,798,485 | ||
Health Care Providers & Services 1.6% | ||||
Coventry Health Care, Inc.* | 252,900 | 10,705,257 | ||
Pharmaceuticals 1.3% | ||||
Barr Laboratories, Inc.* | 184,350 | 8,461,665 | ||
Industrials 9.7% | ||||
Airlines 1.0% | ||||
JetBlue Airways Corp.* | 264,000 | 6,676,560 | ||
Commercial Services & Supplies 7.9% | ||||
Corinthian Colleges, Inc.* | 664,200 | 21,958,452 | ||
Hewitt Associates, Inc. “A”* | 248,000 | 7,938,480 | ||
ITT Educational Services, Inc.* | 279,700 | 8,726,640 | ||
Stericycle, Inc.* | 299,900 | 14,353,214 | ||
| 52,976,786 | ||||
Road & Rail 0.8% | ||||
Swift Transportation Co., Inc.* | 323,500 | 5,554,495 | ||
Information Technology 21.2% | ||||
Communications Equipment 2.1% | ||||
Advanced Fibre Communications, Inc.* | 648,800 | 14,293,064 | ||
Electronic Equipment & Instruments 5.8% | ||||
AVX Corp. | 746,300 | 12,306,487 | ||
Jabil Circuit, Inc.* | 335,700 | 9,879,651 | ||
Tech Data Corp.* | 412,100 | 16,871,374 | ||
| 39,057,512 | ||||
IT Consulting & Services 1.3% | ||||
Cognizant Technology Solutions Corp.* | 186,200 | 8,425,550 | ||
Semiconductors & Semiconductor Equipment 6.0% | ||||
Applied Micro Circuits Corp.* | 1,269,100 | 7,297,325 | ||
Fairchild Semiconductor International, Inc.* | 598,900 | 14,391,567 | ||
LTX Corp.* | 476,800 | 7,199,680 | ||
Teradyne, Inc.* | 490,900 | 11,698,147 | ||
| 40,586,719 | ||||
Software 6.0% | ||||
Symantec Corp.* | 459,200 | 21,260,960 | ||
TIBCO Software, Inc.* | 1,276,100 | 10,425,737 | ||
VERITAS Software Corp.* | 306,500 | 8,247,915 | ||
| 39,934,612 | ||||
Materials 5.6% | ||||
Containers & Packaging 3.0% | ||||
Packaging Corp. of America | 893,000 | 20,146,080 | ||
Metals & Mining 2.6% | ||||
Peabody Energy Corp. | 244,600 | 11,376,346 | ||
United States Steel Corp. | 163,900 | 6,108,553 | ||
| 17,484,899 | ||||
Telecommunication Services 1.2% | ||||
Wireless Telecommunication Services | ||||
Nextel Partners, Inc. “A”* | 616,700 | 7,807,422 | ||
Total Common Stocks (Cost $511,618,694) | 617,896,026 | |||
Cash Equivalents 7.4% | ||||
Scudder Cash Management QP Trust 1.10% (b) (Cost $49,552,887) | 49,552,887 | 49,552,887 | ||
Scudder Mid Cap Fund | % of Net Assets | Value ($) | ||
Total Investment Portfolio (Cost $561,171,581) (a) | 99.6 | 667,448,913 | ||
Other Assets and Liabilities, Net | 0.4 | 2,661,843 | ||
Net Assets | 100.0 | 670,110,756 | ||
| * | Non-income producing security. |
| (a) | The cost for federal income tax purposes was $561,784,722. At March 31, 2004, net unrealized appreciation for all securities based on tax cost was $105,664,191. This consisted of aggregate gross unrealized appreciation for all securities in which there was an excess of value over tax cost of $128,237,239 and aggregate gross unrealized depreciation for all securities in which there was an excess of tax cost over value of $22,573,048. |
| (b) | Scudder Cash Management QP Trust, is also managed by Deutsche Investment Management Americas Inc. The rate shown is the annualized seven-day yield at period end. |
The accompanying notes are an integral part of the financial statements.
11
Table of Contents
Scudder Mid Cap Fund
Statement of Assets and Liabilities as of March 31, 2004 (Unaudited)
Assets | ||||
Investments: | ||||
Investments in securities, at value (cost $511,618,694) | $ | 617,896,026 | ||
Investment in Scudder Cash Management QP Trust (cost $49,552,887) | 49,552,887 | |||
Total investments in securities, at value (cost $561,171,581) | 667,448,913 | |||
Cash | 18,496 | |||
Receivable for investments sold | 3,325,280 | |||
Dividends receivable | 444,828 | |||
Interest receivable | 43,819 | |||
Receivable for Fund shares sold | 686,098 | |||
Other assets | 80,659 | |||
Total assets | 672,048,093 | |||
Liabilities | ||||
Payable for investments purchased | 132,638 | |||
Payable for Fund shares redeemed | 1,077,676 | |||
Accrued investment advisory fee | 352,269 | |||
Other accrued expenses and payables | 374,754 | |||
Total liabilities | 1,937,337 | |||
Net assets, at value | $ | 670,110,756 | ||
Net Assets | ||||
Net assets consist of: Accumulated net investment loss | (2,207,361 | ) | ||
Net unrealized appreciation (depreciation) on investments | 106,277,332 | |||
Accumulated net realized gain (loss) | (63,641,371 | ) | ||
Paid-in capital | 629,682,156 | |||
Net assets, at value | $ | 670,110,756 | ||
The accompanying notes are an integral part of the financial statements.
12
Table of Contents
Scudder Mid Cap Fund
Statement of Assets and Liabilities as of March 31, 2004 (Unaudited) (continued)
Net Asset Value | |||
Class A | |||
Net Asset Value and redemption price per share ($251,208,765 / 19,937,440 shares of capital stock outstanding, $.001 par value, unlimited number of shares authorized) | $ | 12.60 | |
Maximum offering price per share (100 / 94.25 of $12.60) | $ | 13.37 | |
Class B | |||
Net Asset Value, offering and redemption price (subject to contingent deferred sales charge) per share ($9,098,577 / 731,900 shares of capital stock outstanding, $.001 par value, unlimited number of shares authorized) | $ | 12.43 | |
Class C | |||
Net Asset Value, offering and redemption price (subject to contingent deferred sales charge) per share ($7,617,266 / 612,778 shares of capital stock outstanding, $.001 par value, unlimited number of shares authorized) | $ | 12.43 | |
Investment Class | |||
Net Asset Value, offering and redemption price per share ($43,174,425 / 3,425,192 shares of capital stock outstanding, $.001 par value, unlimited number of shares authorized) | $ | 12.60 | |
Class R | |||
Net Asset Value, offering and redemption price per share ($319,093 / 25,349 shares of capital stock outstanding, $.001 par value, unlimited number of shares authorized) | $ | 12.59 | |
Institutional Class | |||
Net Asset Value, offering and redemption price per share ($358,692,630 / 28,202,197 shares of capital stock outstanding, $.001 par value, unlimited number of shares authorized) | $ | 12.72 |
The accompanying notes are an integral part of the financial statements.
13
Table of Contents
Scudder Mid Cap Fund
Statement of Operations for the six months ended March 31, 2004 (Unaudited)
Investment Income | ||||
Income: | ||||
Dividends | $ | 1,207,587 | ||
Interest - Cash Management Fund Institutional | 48,733 | |||
Interest - Scudder Cash Management QP Trust | 228,221 | |||
Total Income | 1,484,541 | |||
Expenses: | ||||
Investment advisory fee | 2,081,331 | |||
Administrator service fee | 1,353,290 | |||
Distribution and shareholder servicing fees | 375,787 | |||
Auditing | 54,588 | |||
Legal | 14,365 | |||
Trustees’ fees and expenses | 11,013 | |||
Reports to shareholders | 1,830 | |||
Registration fees | 12,400 | |||
Other | 9,381 | |||
Total expenses, before expense reductions | 3,913,985 | |||
Expense reductions | (222,083 | ) | ||
Total expenses, after expense reductions | 3,691,902 | |||
Net investment income (loss) | (2,207,361 | ) | ||
Realized and Unrealized Gain (Loss) on Investment Transactions | ||||
Net realized gain (loss) from investments | 37,158,833 | |||
Net unrealized appreciation (depreciation) during the period on investments | 23,272,130 | |||
Net gain (loss) on investment transactions | 60,430,963 | |||
Net increase (decrease) in net assets resulting from operations | $ | 58,223,602 | ||
The accompanying notes are an integral part of the financial statements.
14
Table of Contents
Scudder Mid Cap Fund
Statement of Changes in Net Assets
Increase (Decrease) in Net Assets | Six Months Ended March 31, 2004 (Unaudited) | Year Ended September 30, 2003 | ||||||
Operations: | ||||||||
Net investment income (loss) | $ | (2,207,361 | ) | $ | (2,389,261 | ) | ||
Net realized gain (loss) on investment transactions | 37,158,833 | (5,611,344 | ) | |||||
Net unrealized appreciation (depreciation) on investment transactions during the period | 23,272,130 | 98,214,735 | ||||||
Net increase (decrease) in net assets resulting from operations | 58,223,602 | 90,214,130 | ||||||
Fund share transactions: Proceeds from shares sold | 87,344,856 | 272,735,092 | ||||||
In-kind subscription | — | 103,862,346 | ||||||
Cost of shares redeemed | (56,725,789 | ) | (79,546,144 | ) | ||||
Net increase (decrease) in net assets from Fund share transactions | 30,619,067 | 297,051,294 | ||||||
Increase (decrease) in net assets | 88,842,669 | 387,265,424 | ||||||
Net assets at beginning of period | 581,268,087 | 194,002,663 | ||||||
Net assets at end of period (including accumulated net investment loss of $2,207,361 at March 31, 2004) | $ | 670,110,756 | $ | 581,268,087 | ||||
The accompanying notes are an integral part of the financial statements.
15
Table of Contents
Scudder Mid Cap Fund
Class A
Years Ended September 30, | 2004a | 2003 | 2002b | |||||||||
Selected Per Share Data | ||||||||||||
Net asset value, beginning of period | $ | 11.46 | $ | 9.31 | $ | 11.49 | ||||||
Income (loss) from investment operations: | ||||||||||||
Net investment income (loss)c | (.05 | ) | (.08 | ) | (.01 | ) | ||||||
Net realized and unrealized gain (loss) on investment transactions | 1.19 | 2.23 | (2.17 | ) | ||||||||
Total from investment operations | 1.14 | 2.15 | (2.18 | ) | ||||||||
Net asset value, end of period | $ | 12.60 | $ | 11.46 | $ | 9.31 | ||||||
Total Return (%)d | 9.95 | ** | 23.09 | (18.97 | )** | |||||||
Ratios to Average Net Assets and Supplemental Data | ||||||||||||
Net assets, end of period ($ millions) | 251 | 212 | .6 | |||||||||
Ratio of expenses before expense reductions (%) | 1.32 | * | 1.34 | 1.48 | * | |||||||
Ratio of expenses after expense reductions (%) | 1.25 | * | 1.25 | 1.25 | * | |||||||
Ratio of net investment income (loss) (%) | (.79 | )* | (.74 | ) | (.63 | )* | ||||||
Portfolio turnover rate (%) | 97 | * | 82 | 120 | e | |||||||
| a | For the six months ended March 31, 2004 (Unaudited). |
| b | For the period June 28, 2002 (commencement of operations of Class A shares) to September 30, 2002. |
| c | Based on average shares outstanding during the period. |
| d | Total return would have been lower had certain expenses not been reduced. Total return does not reflect the effect of any sales charges. |
| e | On March 28, 2002, the Capital Appreciation Portfolio was closed. This ratio includes the purchase and sale of portfolio securities of the Mid Cap Fund as a stand-alone fund in addition to the Capital Appreciation Portfolio. |
| * | Annualized |
| ** | Not annualized |
16
Table of Contents
Scudder Mid Cap Fund
Class B
Years Ended September 30, | 2004a | 2003 | 2002b | |||||||||
Selected Per Share Data | ||||||||||||
Net asset value, beginning of period | $ | 11.35 | $ | 9.29 | $ | 11.49 | ||||||
Income (loss) from investment operations: | ||||||||||||
Net investment income (loss)c | (.09 | ) | (.15 | ) | (.03 | ) | ||||||
Net realized and unrealized gain (loss) on investment transactions | 1.17 | 2.21 | (2.17 | ) | ||||||||
Total from investment operations | 1.08 | 2.06 | (2.20 | ) | ||||||||
Net asset value, end of period | $ | 12.43 | $ | 11.35 | $ | 9.29 | ||||||
Total Return (%)d | 9.52 | ** | 22.17 | (19.15 | )** | |||||||
Ratios to Average Net Assets and Supplemental Data | ||||||||||||
Net assets, end of period ($ millions) | 9 | 6 | .3 | |||||||||
Ratio of expenses before expense reductions (%) | 2.07 | * | 2.09 | 2.22 | * | |||||||
Ratio of expenses after expense reductions (%) | 2.00 | * | 2.00 | 2.00 | * | |||||||
Ratio of net investment income (loss) (%) | (1.54 | )* | (1.49 | ) | (1.38 | )* | ||||||
Portfolio turnover rate (%) | 97 | * | 82 | 120e | ||||||||
| a | For the six months ended March 31, 2004 (Unaudited). |
| b | For the period June 28, 2002 (commencement of operations of Class B shares) to September 30, 2002. |
| c | Based on average shares outstanding during the period. |
| d | Total return would have been lower had certain expenses not been reduced. Total return does not reflect the effect of any sales charges. |
| e | On March 28, 2002, the Capital Appreciation Portfolio was closed. This ratio includes the purchase and sale of portfolio securities of the Mid Cap Fund as a stand-alone fund in addition to the Capital Appreciation Portfolio. |
| * | Annualized |
| ** | Not annualized |
17
Table of Contents
Scudder Mid Cap Fund
Class C
Years Ended September 30, | 2004a | 2003 | 2002b | |||||||||
Selected Per Share Data | ||||||||||||
Net asset value, beginning of period | $ | 11.35 | $ | 9.29 | $ | 11.49 | ||||||
Income (loss) from investment operations: | ||||||||||||
Net investment income (loss)c | (.09 | ) | (.16 | ) | (.03 | ) | ||||||
Net realized and unrealized gain (loss) on investment transactions | 1.17 | 2.22 | (2.17 | ) | ||||||||
Total from investment operations | 1.08 | 2.06 | (2.20 | ) | ||||||||
Net asset value, end of period | $ | 12.43 | $ | 11.35 | $ | 9.29 | ||||||
Total Return (%)d | 9.52 | ** | 22.17 | (19.15 | )** | |||||||
Ratios to Average Net Assets and Supplemental Data | ||||||||||||
Net assets, end of period ($ millions) | 8 | 5 | .1 | |||||||||
Ratio of expenses before expense reductions (%) | 2.07 | * | 2.09 | 2.20 | * | |||||||
Ratio of expenses after expense reductions (%) | 2.00 | * | 2.00 | 2.00 | * | |||||||
Ratio of net investment income (loss) (%) | (1.54 | )* | (1.49 | ) | (1.38 | )* | ||||||
Portfolio turnover rate (%) | 97 | * | 82 | 120e | ||||||||
| a | For the six months ended March 31, 2004 (Unaudited). |
| b | For the period June 28, 2002 (commencement of operations of Class C shares) to September 30, 2002. |
| c | Based on average shares outstanding during the period. |
| d | Total return would have been lower had certain expenses not been reduced. Total return does not reflect the effect of any sales charges. |
| e | On March 28, 2002, the Capital Appreciation Portfolio was closed. This ratio includes the purchase and sale of portfolio securities of the Mid Cap Fund as a stand-alone fund in addition to the Capital Appreciation Portfolio. |
| * | Annualized |
| ** | Not annualized |
18
Table of Contents
Scudder Mid Cap Fund
Investment Class
Years Ended September 30, | 2004a | 2003 | 2002 | 2001 | 2000 | 1999 | ||||||||||||||||||
Selected Per Share Data | ||||||||||||||||||||||||
Net asset value, beginning of period | $ | 11.46 | $ | 9.31 | $ | 10.66 | $ | 17.57 | $ | 14.77 | $ | 11.38 | ||||||||||||
Income (loss) from investment operations: | ||||||||||||||||||||||||
Net investment income (loss) | (.05 | )b | (.08 | )b | (.06 | )b | (.03 | ) | (.06 | ) | (.07 | ) | ||||||||||||
Net realized and unrealized gain (loss) on investment transactions | 1.19 | 2.23 | (1.29 | ) | (6.41 | ) | 6.79 | 4.99 | ||||||||||||||||
Total from investment operations | 1.14 | 2.15 | (1.35 | ) | (6.44 | ) | 6.73 | 4.92 | ||||||||||||||||
Less distributions from: | ||||||||||||||||||||||||
Net realized gains on investment transactions | — | — | — | (.47 | ) | (3.93 | ) | (1.53 | ) | |||||||||||||||
Net asset value, end of period | $ | 12.60 | $ | 11.46 | $ | 9.31 | $ | 10.66 | $ | 17.57 | $ | 14.77 | ||||||||||||
Total Return (%)c | 9.95 | ** | 23.09 | (12.66 | ) | (37.26 | ) | 53.65 | 47.05 | |||||||||||||||
Ratios to Average Net Assets and Supplemental Data | ||||||||||||||||||||||||
Net assets, end of period ($ millions) | 43 | 36 | 29 | 36 | 48 | 29 | ||||||||||||||||||
Ratio of expenses before expense reductions (%) | 1.32 | * | 1.34 | 1.39d | 1.43d | 1.70d | 1.88d | |||||||||||||||||
Ratio of expenses after expense reductions (%) | 1.25 | * | 1.25 | 1.25d | 1.25d | 1.25d | 1.25d | |||||||||||||||||
Ratio of net investment income (loss) (%) | (.79 | )* | (.74 | ) | (.55 | ) | (.21 | ) | (.40 | ) | (.58 | ) | ||||||||||||
Portfolio turnover rate (%) | 97 | * | 82 | 120e | 251 | 146 | 155 | |||||||||||||||||
| a | For the six months ended March 31, 2004 (Unaudited). |
| b | Based on average shares outstanding during the period. |
| c | Total return would have been lower had certain expenses not been reduced. |
| d | The expense ratio of the Capital Appreciation Portfolio is included in this ratio. |
| e | On March 28, 2002, the Capital Appreciation Portfolio was closed. This ratio includes the purchase and sale of portfolio securities of the Mid Cap Fund as a stand-alone fund in addition to the Capital Appreciation Portfolio. |
| * | Annualized |
| ** | Not annualized |
19
Table of Contents
Scudder Mid Cap Fund
Class R
| 2004a | 2003b | |||||||
Selected Per Share Data | ||||||||
Net asset value, beginning of period | $ | 11.45 | $ | 10.78 | ||||
Income (loss) from investment operations: | ||||||||
Net investment income (loss)c | (.06 | ) | (.03 | ) | ||||
Net realized and unrealized gain (loss) on investment transactions | 1.20 | .70 | ||||||
Total from investment operations | 1.14 | .67 | ||||||
Net asset value, end of period | $ | 12.59 | $ | 11.45 | ||||
Total Return (%)d | 9.96 | ** | 6.22 | ** | ||||
Ratios to Average Net Assets and Supplemental Data | ||||||||
Net assets, end of period ($ millions) | .03 | .01 | ||||||
Ratio of expenses, before expense reductions (%) | 1.58 | * | 1.59 | * | ||||
Ratio of expenses, after expense reductions (%) | 1.50 | * | 1.50 | * | ||||
Ratio of net investment income (loss) (%) | (1.04 | )* | (1.12 | )* | ||||
Portfolio turnover rate (%) | 97 | * | 82 | |||||
| a | For the six months ended March 31, 2004 (Unaudited). |
| b | For the period July 1, 2003 (commencement of operations of Class R shares) to September 30, 2003. |
| c | Based on average shares outstanding during the period. |
| d | Total return would have been lower had certain expenses not been reduced. |
| * | Annualized |
| ** | Not annualized |
20
Table of Contents
Scudder Mid Cap Fund
Institutional Class
Years Ended September 30, | 2004a | 2003 | 2002 | 2001 | 2000b | |||||||||||||||
Selected Per Share Data | ||||||||||||||||||||
Net asset value, beginning of period | $ | 11.55 | $ | 9.36 | $ | 10.69 | $ | 17.57 | $ | 18.60 | ||||||||||
Income (loss) from investment operations: | ||||||||||||||||||||
Net investment income (loss) | (.03 | )c | (.05 | )c | (.04 | )c | .01 | (.00 | )d | |||||||||||
Net realized and unrealized gain (loss) on investment transactions | 1.20 | 2.24 | (1.29 | ) | (6.42 | ) | (1.03 | ) | ||||||||||||
Total from investment operations | 1.17 | 2.19 | (1.33 | ) | (6.41 | ) | (1.03 | ) | ||||||||||||
Less distributions from: | ||||||||||||||||||||
Net realized gains on investment transactions | — | — | — | (.47 | ) | — | ||||||||||||||
Net asset value, end of period | $ | 12.72 | $ | 11.55 | $ | 9.36 | $ | 10.69 | $ | 17.57 | ||||||||||
Total Return (%)e | 10.13 | ** | 23.40 | (12.44 | ) | (37.15 | ) | 55.50 | f** | |||||||||||
Ratios to Average Net Assets and Supplemental Data | ||||||||||||||||||||
Net assets, end of period ($ millions) | 359 | 323 | 164 | 231 | 414 | |||||||||||||||
Ratio of expenses before expense reductions (%) | 1.07 | * | 1.09 | 1.14 | g | 1.18 | g | 1.45 | g* | |||||||||||
Ratio of expenses after expense reductions (%) | 1.00 | * | 1.00 | 1.00 | g | 1.00 | g | 1.00 | g* | |||||||||||
Ratio of net investment income (loss) (%) | (.54 | )* | (.49 | ) | (.30 | ) | .04 | (.17 | )* | |||||||||||
Portfolio turnover rate (%) | 97 | * | 82 | 120h | 251 | 146 | ||||||||||||||
| a | For the six months ended March 31, 2004 (Unaudited). |
| b | For the period August 31, 2000 (commencement of operations of Institutional Class shares) to September 30, 2000. |
| c | Based on average shares outstanding during the period. |
| d | Amount is less than $.005. |
| e | Total return would have been lower had certain expenses not been reduced. |
| f | At the close of business on August 31, 2000, shares of Equity Appreciation - Institutional Class merged into Institutional Class shares of Mid Cap. Equity Appreciation - Institutional Class was managed by the same investment management team with the same objectives, policies and strategies as Mid Cap. The performance shown reflects Equity Appreciation - Institutional Class shares’ actual returns from its inception on October 12, 1993. Performance for periods after August 31, 2000 reflect the performance of the Mid Cap Fund - Institutional Class. |
| g | The expense ratio of the Capital Appreciation Portfolio is included in this ratio. |
| h | On March 28, 2002, the Capital Appreciation Portfolio was closed. This ratio includes the purchase and sale of portfolio securities of the Mid Cap Fund as a stand-alone fund in addition to the Capital Appreciation Portfolio. |
| * | Annualized |
| ** | Not annualized |
21
Table of Contents
Notes to Financial Statements (Unaudited)
Scudder Mid Cap Fund
A. Significant Accounting Policies
Mid Cap Fund (“Scudder Mid Cap Fund” or the “Fund”) is a diversified series of Scudder Advisor Funds (the “Trust”), which is registered under the Investment Company Act of 1940, as amended (the “1940 Act”), as an open-end management investment company organized as a Massachusetts business trust.
The Fund offers multiple classes of shares which provide investors with different purchase options. Class A shares are offered to investors subject to an initial sales charge. Class B shares are offered without an initial sales charge but are subject to higher ongoing expenses than Class A shares and a contingent deferred sales charge payable upon certain redemptions. Class B shares automatically convert to Class A shares six years after issuance. Class C shares are offered to investors without an initial sales charge and are subject to higher ongoing expenses than Class A shares and a contingent deferred sales charge payable upon certain redemptions within one year of purchase. Prior to March 1, 2004, Class C shares were offered with an initial sales charge. Class C shares do not convert into another class. Investment Class shares are not subject to initial or contingent deferred sales charges. Class R shares are only available to participants in certain retirement plans and are offered to investors without an initial sales charge. Institutional Class shares are offered to a limited group of investors, are not subject to initial or contingent deferred sales charges and have lower ongoing expenses than other classes.
Investment income, realized and unrealized gains and losses, and certain fund-level expenses and expense reductions, if any, are borne pro rata on the basis of relative net assets by the holders of all classes of shares, except that each class bears certain expenses unique to that class such as distribution fees, service fees, administrator fees and certain other class-specific expenses. Differences in class-level expenses may result in payment of different per share dividends by class. All shares of the Fund have equal rights with respect to voting subject to class-specific arrangements.
The Fund’s financial statements are prepared in accordance with accounting principles generally accepted in the United States of America which require the use of management estimates. Actual results could differ from those estimates. The policies described below are followed consistently by the Fund in the preparation of its financial statements.
Security Valuation. Investments are stated at value determined as of the close of regular trading on the New York Stock Exchange on each day the exchange is open for trading. Equity securities are valued at the most recent sale price or official closing price reported on the exchange (US or foreign) or over-the-counter market on which the security is traded most extensively. Securities for which no sales are reported are valued at the calculated mean between the most recent bid and asked quotations on the relevant market or, if a mean cannot be determined, at the most recent bid quotation.
Money market instruments purchased with an original or remaining maturity of sixty days or less, maturing at par, are valued at amortized cost. Investments in open-end investment companies and Scudder Cash Management QP Trust are valued at their net asset value each business day.
Securities and other assets for which market quotations are not readily available or for which the above valuation procedures are deemed not to reflect fair value are valued in a manner that is intended to reflect their fair value as determined in accordance with procedures approved by the Trustees.
Federal Income Taxes. The Fund’s policy is to comply with the requirements of the Internal Revenue Code, as amended, which are applicable to regulated investment companies, and to distribute all of its taxable income to its shareholders. Accordingly, the Fund paid no federal income taxes and no federal income tax provision was required.
At September 30, 2003 the Fund had a net tax basis capital loss carryforward of approximately $100,178,000, which may be applied against any realized net taxable capital gains of each succeeding year until fully utilized or until September 30, 2009 ($16,640,000), September 30, 2010 ($54,208,000) and September 30, 2011 ($29,330,000), the respective expiration dates, whichever occurs first.
Distribution of Income and Gains. Distributions of net investment income, if any, are made annually. Net realized gains from investment transactions, in excess of available capital loss carryforwards, would be taxable to the Fund if not distributed, and, therefore, will be distributed to shareholders at least annually.
The timing and characterization of certain income and capital gains distributions are determined annually in accordance with federal tax regulations which may differ from accounting principles generally accepted in the United States of America. These differences primarily relate to securities sold at a loss. As a result, net investment income (loss) and net realized gain (loss) on investment transactions for a reporting period may differ significantly from distributions during such period. Accordingly, the Fund may periodically make reclassifications among certain of its capital accounts without impacting the net asset value of the Fund.
22
Table of Contents
The tax character of current year distributions, if any, will be determined at the end of the current fiscal year.
Other. Investment transactions are accounted for on a trade date plus one basis for daily net asset value calculations. However, for financial reporting purposes, investment security transactions are reported on trade date. Interest income is recorded on the accrual basis. Dividend income is recorded on the ex-dividend date. Realized gains and losses from investment transactions are recorded on an identified cost basis.
Expenses. Expenses of the Trust arising in connection with a specific Fund are allocated to that Fund. Other Trust expenses which cannot be directly attributed to a Fund are apportioned among the Funds in the Trust.
B. Purchases and Sales of Securities
During the six months ended March 31, 2004, purchases and sales of investment securities (excluding short-term investments) aggregated $292,872,422 and $293,622,985, respectively.
C. Related Parties
Scudder Investments is part of Deutsche Asset Management, which is the marketing name in the US for the asset management activities of Deutsche Bank AG. Deutsche Asset Management, Inc. (“DeAM, Inc.” or the “Advisor”), an indirect, wholly owned subsidiary of Deutsche Bank AG, is the Fund’s Advisor. Investment Company Capital Corporation (“ICCC” or the “Administrator”), also an indirect, wholly owned subsidiary of Deutsche Bank AG, is the Fund’s Administrator.
Investment Advisory Agreement. Under the Investment Advisory Agreement, the Advisor directs the investments of the Fund in accordance with its investment objectives, policies and restrictions. The Advisor determines the securities, instruments and other contracts relating to investments to be purchased, sold or entered into by the Fund. The investment advisory fee payable under the Investment Advisory Agreement is equal to an annual rate of 0.65% of the Fund’s average daily net assets, computed and accrued daily and payable monthly. The Fund did not impose a portion of its advisory fees equivalent to the advisory fees charged on assets invested in the affiliated money market fund, Cash Management Fund Institutional.
For the six months ended March 31, 2004, the Advisor and Administrator have agreed to waive their fees or reimburse expenses to the extent necessary to maintain the annualized expenses of the classes of the Fund as follows:
Class A | 1.25 | % | |
Class B | 2.00 | % | |
Class C | 2.00 | % | |
Investment Class | 1.25 | % | |
Class R | 1.50 | % | |
Institutional Class | 1.00 | % |
Accordingly, for the six months ended March 31, 2004, the Advisor waived a portion of its fee pursuant to the an Expense Limitation Agreement aggregating $222,083 and the amount imposed aggregated $1,859,248, which was equivalent to an annualized effective rate of 0.57% of the Fund’s average daily net assets.
23
Table of Contents
Administrator. For its services as Administrator, ICCC receives a fee (the “Administrator Service Fee”) of 0.65% of the average daily net assets for the Investment Class shares and 0.40% of average daily net assets for Class A, B, C, R and Institutional Class shares for the Fund, computed and accrued daily and payable monthly. For the six months ended March 31, 2004, the Administrator Service Fee was as follows:
Administrator Service Fee | Total Aggregated | Unpaid at March 31, 2004 | ||||
Class A | $ | 480,322 | $ | 95,632 | ||
Class B | 16,774 | 3,290 | ||||
Class C | 13,353 | 2,709 | ||||
Investment Class | 134,831 | 29,593 | ||||
Class R | 215 | 153 | ||||
Institutional Class | 707,795 | 134,311 | ||||
| $ | 1,353,290 | $ | 265,688 | |||
Distribution Agreement. Under the Distribution Agreement, in accordance with Rule 12b-1 under the 1940 Act, Scudder Distributors, Inc. (“SDI”), an affiliate of the Advisor, receives a fee (“Distribution Fee”) of 0.25% of the average daily net assets of the Class A and R shares and 0.75% of average daily net assets of the Class B and C shares. Pursuant to the agreement, SDI enters into related selling group agreements with various firms at various rates for sales of Class B and C shares. For the six months ended March 31, 2004, the Distribution Fee was as follows:
Distribution Fee | Total Aggregated | Unpaid at March 31, 2004 | ||||
Class A | $ | 300,201 | $ | 58,262 | ||
Class B | 31,451 | 5,931 | ||||
Class C | 25,037 | 4,881 | ||||
Class R | 134 | 96 | ||||
| $ | 356,823 | $ | 69,170 | |||
In addition, SDI provides information and administrative services (“Shareholder Servicing Fee”) to Class B, C and R shareholders at an annual rate of 0.25% of average daily net assets for each such class. SDI in turn has various agreements with financial services firms that provide these services and pays these fees based upon the assets of shareholder accounts the firms service. For the six months ended March 31, 2004, the Shareholder Servicing Fee was as follows:
Shareholder Servicing Fee | Total Aggregated | Unpaid at March 31, 2004 | Effective Rate | ||||||
Class B | $ | 10,484 | $ | 2,029 | .25 | % | |||
Class C | 8,346 | 1,640 | .25 | % | |||||
Class R | 134 | 85 | .25 | % | |||||
| $ | 18,964 | $ | 3,754 | ||||||
24
Table of Contents
Underwriting Agreement and Contingent Deferred Sales Charge. SDI is the principal underwriter for the Fund. Underwriting commissions paid in connection with the distribution of Class A and C shares for the six months ended March 31, 2004 aggregated $14,502 and $158, respectively.
In addition, SDI receives any contingent deferred sales charge (“CDSC”) from Class B share redemptions occurring within six years of purchase and Class C share redemptions occurring within one year of purchase. There is no such charge upon redemption of any share appreciation or reinvested dividends. The CDSC is based on declining rates ranging from 4% to 1% for Class B and 1% for Class C, of the value of the shares redeemed. For the six months ended March 31, 2004, the CDSC for the Fund’s Class B and C shares was $4,894 and $491, respectively. A deferred sales charge of up to 1% is assessed on certain redemptions of Class A shares. For the six months ended March 31, 2004, SDI received $40.
Other. The Fund may invest in Cash Management Fund Institutional, an open-end management investment company managed by DeAM, Inc.
Trustees’ Fees and Expenses. As compensation for his or her services, each Independent Trustee receives an aggregate annual fee, plus a fee for each meeting attended (plus reimbursement for reasonable out-of-pocket expenses incurred in connection with his or her attendance at board and committee meetings) from each Fund in the Fund Complex for which he or she serves. In addition, the Chairman of the Fund Complex’s Audit Committee receives an annual fee for his services.
Scudder Cash Management QP Trust. Pursuant to an Exemptive Order issued by the SEC, the Fund may invest in the Scudder Cash Management QP Trust (the “QP Trust”) and other affiliated funds managed by the Advisor. The QP Trust seeks to provide as high a level of current income as is consistent with the preservation of capital and the maintenance of liquidity. The QP Trust does not pay the Advisor a management fee for the affiliated funds’ investments in the QP Trust.
D. Line of Credit
The Fund and several other affiliated funds (the “Participants”) share in a $1.25 billion revolving credit facility administered by J.P. Morgan Chase Bank for temporary or emergency purposes, including the meeting of redemption requests that otherwise might require the untimely disposition of securities. The Participants are charged an annual commitment fee which is allocated, based upon net assets, among each of the Participants. Interest is calculated at the Federal Funds Rate plus 0.5 percent. The Fund may borrow up to a maximum of 33 percent of its net assets under the agreement.
25
Table of Contents
E. Share Transactions
The following table summarizes share and dollar activity in the Fund:
| Six Months Ended March 31, 2004 | Year Ended September 30, 2003 | |||||||||||||
| Shares | Dollars | Shares | Dollars | |||||||||||
Shares sold | ||||||||||||||
Class A | 2,722,111 | $ | 33,765,791 | 19,601,740 | $ | 199,012,862 | ||||||||
Class B | 276,701 | 3,400,844 | 576,020 | 5,883,977 | ||||||||||
Class C | 257,215 | 3,145,840 | 432,633 | 4,390,031 | ||||||||||
Investment Class | 829,834 | 10,392,167 | 1,330,437 | 13,297,401 | ||||||||||
Class R | 28,492 | 365,280 | 933 | ** | 10,052 | ** | ||||||||
Institutional Class | 2,878,295 | 36,274,934 | 4,698,398 | 50,140,769 | ||||||||||
| $ | 87,344,856 | $ | 272,735,092 | |||||||||||
In-kind subscription | ||||||||||||||
Institutional Class | — | — | 10,955,944 | $ | 103,862,346 | |||||||||
| — | $ | 103,862,346 | ||||||||||||
Shares redeemed | ||||||||||||||
Class A | (1,264,464 | ) | $ | (15,628,665 | ) | (1,186,677 | ) | $ | (12,330,075 | ) | ||||
Class B | (94,401 | ) | (1,152,653 | ) | (54,560 | ) | (555,530 | ) | ||||||
Class C | (53,961 | ) | (658,582 | ) | (33,414 | ) | (349,493 | ) | ||||||
Investment Class | (542,359 | ) | (6,722,589 | ) | (1,318,483 | ) | (13,349,817 | ) | ||||||
Class R | (4,071 | ) | (52,048 | ) | (5 | )** | (56 | )** | ||||||
Institutional Class | (2,599,163 | ) | (32,511,252 | ) | (5,242,506 | ) | (52,961,173 | ) | ||||||
| $ | (56,725,789 | ) | $ | (79,546,144 | ) | |||||||||
Net increase (decrease) | ||||||||||||||
Class A | 1,457,647 | $ | 18,137,126 | 18,415,063 | $ | 186,682,787 | ||||||||
Class B | 182,300 | 2,248,191 | 521,460 | 5,328,447 | ||||||||||
Class C | 203,254 | 2,487,258 | 399,219 | 4,040,538 | ||||||||||
Investment Class | 287,475 | 3,669,578 | 11,954 | (52,416 | ) | |||||||||
Class R | 24,421 | 313,232 | 928 | ** | 9,996 | ** | ||||||||
Institutional Class | 279,132 | 3,763,682 | 10,411,836 | 101,041,942 | ||||||||||
| $ | 30,619,067 | $ | 297,051,294 | |||||||||||
| ** | For the period July 1, 2003 (commencement of operations of Class R shares) to September 30, 2003. |
F. In-Kind Subscription
As part of Deutsche Bank’s effort to consolidate various legacy retirement plans, Deutsche Bank implemented a program to transfer various plan assets as a means to streamline the number of investment options offered to employee plan participants. As part of the consolidation program, on March 28, 2003 the Scudder Mid Cap Fund accepted securities and cash in payment for fund shares (received an in-kind subscription) from the BT Partnershare retirement plan in accordance with the Fund’s purchase in-kind procedures. The transaction represented a percentage of the Fund’s net assets at March 31, 2003 as follows:
| Purchase Amount | % of Net Assets | ||||
Mid Cap Fund | $ | 103,862,346 | 37 | ||
26
Table of Contents
G. Regulatory Matters and Litigation
Since at least July 2003, federal, state and industry regulators have been conducting ongoing inquiries and investigations (“inquiries”) into the mutual fund industry, and have requested information from numerous mutual fund companies, including Scudder Investments. We are unable to determine what the outcome of these inquiries will be or what the effect, if any, would be on the funds or their advisers. Publicity about mutual fund practices arising from these industry wide inquiries serve as the general basis of a number of private lawsuits against the Scudder Funds. These lawsuits, which previously have been reported in the press, involve purported class action and derivative lawsuits, making various allegations and naming as defendants various persons, including certain Scudder funds, Deutsche Asset Management (“DeAM”) and its affiliates, certain individuals, including in some cases Fund Trustees/Directors, and other parties. DeAM has undertaken to bear all liabilities and expenses incurred by the Scudder funds in connection with these lawsuits, or other lawsuits or regulatory actions that may be filed making allegations similar to these lawsuits regarding fund valuation, market timing, revenue sharing or other subjects of the pending inquiries. Based on currently available information, DeAM believes the likelihood that the pending lawsuits will have a material adverse financial impact on a Scudder fund is remote and such actions are not likely to materially affect its ability to perform under its investment management agreements with the Scudder funds.
Performance Summary March 31, 2004
All performance shown is historical, assumes reinvestment of all dividends and capital gains, and does not guarantee future results. Investment return and principal value fluctuate with changing market conditions so that, when redeemed, shares may be worth more or less than their original cost. Current performance may be lower or higher than the performance quoted. Please visit scudder.com for the product’s most recent month-end performance.
The maximum sales charge for Class A shares is 5.75%. For Class B shares, the maximum contingent deferred sales charge (CDSC) is 4% within the first year after purchase, declining to 0% after six years. Class C shares have no adjustment for front-end sales charges but redemptions within one year of purchase may be subject to a CDSC of 1%. Unadjusted returns do not reflect sales charges and would have been lower if they had. Investment Class and Class R shares are not subject to sales charges.
Returns and rankings during all periods shown reflect a fee waiver and/or expense reimbursement. Without this waiver/reimbursement, returns and rankings would have been lower.
Performance figures do not reflect the deduction of taxes that a shareholder would pay on fund distributions or the sale of fund shares. Returns and rankings may differ by share class.
Returns shown for Class A, B and C shares prior to June 28, 2002 and Class R shares prior to October 1, 2003 are derived from the historical performance of Investment Class shares of the Scudder Small Cap Fund during such periods and have been adjusted to reflect the higher gross total annual operating expenses and the current applicable sales charge of each specific class. Any difference in expenses will affect performance.
Average Annual Total Returns (Unadjusted for Sales Charge) as of 3/31/04
Scudder Small Cap Fund | 6-Month++ | 1-Year | 3-Year | 5-Year | 10-Year | ||||||||||
Class A | 13.63 | % | 42.05 | % | .48 | % | 6.46 | % | 13.23 | % | |||||
Class B | 13.29 | % | 41.15 | % | -.24 | % | 5.68 | % | 12.39 | % | |||||
Class C | 13.29 | % | 41.15 | % | -.24 | % | 5.68 | % | 12.39 | % | |||||
Investment Class | 13.73 | % | 42.18 | % | .51 | % | 6.48 | % | 13.24 | % | |||||
Class R | 13.74 | % | 41.93 | % | .20 | % | 6.12 | % | 12.84 | % | |||||
Russell 2000 Index+ | 21.69 | % | 63.83 | % | 10.90 | % | 9.66 | % | 10.44 | % |
| Source: | Lipper Inc. and Deutsche Asset Management, Inc. |
| ++ | Total returns shown for periods less than one year are not annualized. |
27
Table of Contents
Scudder Small Cap Fund
Net Asset Value
| Class A | Class B | Class C | Investment Class | Class R | |||||||||||
Net Asset Value: | |||||||||||||||
3/31/04 | $ | 22.44 | $ | 22.16 | $ | 22.16 | $ | 22.45 | $ | 22.47 | |||||
10/1/03 (commencement of operations for Class R) | $ | — | $ | — | $ | — | $ | — | $ | 20.06 | |||||
9/30/03 | $ | 19.74 | $ | 19.56 | $ | 19.56 | $ | 19.74 | $ | — | |||||
Investment Class Lipper Rankings - Small-Cap Growth Funds Category as of 3/31/04
Period | Rank | Number of Funds Tracked | Percentile Ranking | |||||
1-Year | 437 | of | 488 | 90 | ||||
3-Year | 312 | of | 406 | 77 | ||||
5-Year | 141 | of | 270 | 53 | ||||
10-Year | 11 | of | 73 | 15 |
Source: Lipper Inc. Rankings are historical and do not guarantee future results. Rankings are based on total return with distributions reinvested. Rankings are for the Investment Class shares; other classes may vary.
Growth of an Assumed $10,000 Investment (Adjusted for Maximum Sales Charge)
[] Scudder Small Cap Fund - Class A
[] Russell 2000 Index+
[GRAPHIC APPEARS HERE]
Yearly periods ended March 31
The Fund’s growth of an assumed $10,000 investment is adjusted for the maximum sales charge of 5.75%. This results in a net investment of $9,425.
The growth of $10,000 is cumulative.
28
Table of Contents
Scudder Small Cap Fund
Comparative Results (Adjusted for Maximum Sales Charge) as of 3/31/04
Scudder Small Cap Fund | 1-Year | 3-Year | 5-Year | 10-Year | ||||||||||||||
Class A | Growth of $10,000 Average annual total return | $ | 13,388 33.88 | % | $ | 9,561 -1.48 | % | $ | 12,887 5.20 | % | $ | 32,637 12.56 | % | |||||
Class B | Growth of $10,000 Average annual total return | $ | 13,815 38.15 | % | $ | 9,729 -.91 | % | $ | 13,084 5.52 | % | $ | 32,158 12.39 | % | |||||
Class C | Growth of $10,000 Average annual total return | $ | 14,115 41.15 | % | $ | 9,929 -.24 | % | $ | 13,184 5.68 | % | $ | 32,158 12.39 | % | |||||
Russell 2000 Index+ | Growth of $10,000 Average annual total return | $ | 16,383 63.83 | % | $ | 13,639 10.90 | % | $ | 15,855 9.66 | % | $ | 26,988 10.44 | % | |||||
Growth of an Assumed $10,000 Investment
[] Scudder Small Cap Fund - Investment Class
[] Russell 2000 Index+
[GRAPHIC APPEARS HERE]
Yearly periods ended March 31
Comparative Results as of 3/31/04
Scudder Small Cap Fund | 1-Year | 3-Year | 5-Year | 10-Year | ||||||||||||||
Investment Class | Growth of $10,000 Average annual total return | $ | 14,218 42.18 | % | $ | 10,154 .51 | % | $ | 13,686 6.48 | % | $ | 34,659 13.24 | % | |||||
Class R | Growth of $10,000 Average annual total return | $ | 14,193 41.93 | % | $ | 10,061 .20 | % | $ | 13,461 6.12 | % | $ | 33,465 12.84 | % | |||||
Russell 2000 Index+ | Growth of $10,000 Average annual total return | $ | 16,383 63.83 | % | $ | 13,639 10.90 | % | $ | 15,855 9.66 | % | $ | 26,988 10.44 | % | |||||
| The | growth of $10,000 is cumulative. |
| + | Russell 2000 Index is an unmanaged index that tracks the common stock price movement of the 2000 smallest companies of the Russell 3000 Index, which measures the performance of the 3000 largest US companies based on total market capitalization. |
Index returns assume reinvestment of dividends and, unlike Fund returns, do not reflect any fees or expenses. It is not possible to invest directly into an index.
29
Table of Contents
Portfolio Summary March 31, 2004
Scudder Small Cap Fund
Asset Allocation | 3/31/04 | 9/30/03 | ||||
Common Stocks | 93 | % | 94 | % | ||
Cash Equivalents, net | 7 | % | 6 | % | ||
| 100 | % | 100 | % | |||
Sector Diversification (Excludes Cash Equivalents) | 3/31/04 | 9/30/03 | ||||
Information Technology | 27 | % | 27 | % | ||
Consumer Discretionary | 20 | % | 12 | % | ||
Health Care | 15 | % | 15 | % | ||
Financials | 13 | % | 13 | % | ||
Industrials | 10 | % | 18 | % | ||
Materials | 6 | % | 5 | % | ||
Energy | 5 | % | 4 | % | ||
Consumer Staples | 4 | % | 5 | % | ||
Utilities | — | 1 | % | |||
| 100 | % | 100 | % | |||
Ten Largest Equity Holdings at March 31, 2004 (24.4% of Portfolio) | |||
1. United Natural Foods, Inc. Distributor of natural foods and related products | 3.6 | % | |
2. Cooper Companies, Inc. Producer of medical products | 2.7 | % | |
3. DSP Group, Inc. Developer of digital signal processing solutions for telecommunications and computers | 2.7 | % | |
4. Affiliated Managers Group, Inc. Operator of integrated asset management services | 2.4 | % | |
5. Jos. A. Bank Clothiers, Inc. Manufacturer of classic men’s clothing | 2.2 | % | |
6. Joy Global, Inc. Manufacturer of mining equipment | 2.2 | % | |
7. Skyworks Solutions, Inc. Provider of front-end modules, radio frequency systems | 2.2 | % | |
8. Microsemi Corp. Manufacturer of semiconductors | 2.2 | % | |
9. Avocent Corp. Supplier of connectivity solutions | 2.2 | % | |
10. Packaging Corp. of America Manufacturer of containerboard and corrugated packaging products | 2.0 | % | |
Asset allocation, sector diversification and portfolio holdings are subject to change.
For more complete details about the fund’s investment portfolio, see page 41. A quarterly Fact Sheet is available upon request. Information concerning portfolio holdings of the Fund as of month end is available upon request on the 16th of the following month. Please see the Account Management Resources section for contact information.
30
Table of Contents
Investment Portfolio as of March 31, 2004 (Unaudited)
Scudder Small Cap Fund | Shares | Value ($) | ||
Common Stocks 92.6% | ||||
Consumer Discretionary 18.1% | ||||
Automobiles 1.3% | ||||
Thor Industries, Inc. | 196,200 | 5,269,932 | ||
Hotels Restaurants & Leisure 6.2% | ||||
Alliance Gaming Corp.* | 220,300 | 7,078,239 | ||
Panera Bread Co. “A”* | 143,800 | 5,596,696 | ||
RARE Hospitality International, Inc.* | 145,200 | 4,029,300 | ||
Shuffle Master, Inc.* | 161,800 | 7,522,082 | ||
| 24,226,317 | ||||
Household Durables 1.2% | ||||
Furniture Brands International, Inc. | 148,000 | 4,765,600 | ||
Internet & Catalog Retail 0.9% | ||||
Sharper Image Corp.* | 108,100 | 3,521,898 | ||
Media 2.0% | ||||
Harris Interactive, Inc.* | 457,300 | 3,855,039 | ||
Journal Communications, Inc. “A” | 201,100 | 4,022,000 | ||
| 7,877,039 | ||||
Multiline Retail 0.9% | ||||
Fred’s, Inc. | 141,100 | 3,424,497 | ||
Specialty Retail 3.7% | ||||
Cost Plus, Inc.* | 138,700 | 5,790,725 | ||
Jos. A. Bank Clothiers, Inc.* | 242,800 | 8,740,800 | ||
| 14,531,525 | ||||
Textiles, Apparel & Luxury Goods 1.9% | ||||
Carter’s, Inc.* | 125,200 | 3,579,468 | ||
Gildan Activewear, Inc. “A”* | 125,000 | 3,918,750 | ||
| 7,498,218 | ||||
Consumer Staples 3.5% | ||||
Food & Drug Retailing | ||||
United Natural Foods, Inc.* | 289,300 | 13,912,437 | ||
Energy 5.0% | ||||
Energy Equipment & Services 1.9% | ||||
FMC Technologies, Inc.* | 271,800 | 7,346,754 | ||
Oil & Gas 3.1% | ||||
Ultra Petroleum Corp.* | 241,900 | 7,259,419 | ||
Western Gas Resources, Inc. | 95,700 | 4,866,345 | ||
| 12,125,764 | ||||
Financials 12.5% | ||||
Banks 0.8% | ||||
First Niagara Financial Group | 239,200 | 3,265,080 | ||
Diversified Financial Services 9.4% | ||||
Affiliated Managers Group, Inc.* | 169,650 | 9,259,497 | ||
Investment Technology Group, Inc.* | 363,800 | 5,566,140 | ||
Labranche & Co., Inc.* | 342,600 | 3,840,546 | ||
National Financial Partners Corp. | 181,100 | 5,840,475 | ||
Piper Jaffray Companies, Inc.* | 127,300 | 6,893,295 | ||
The First Marblehead Corp.* | 183,400 | 5,401,130 | ||
TNS, Inc.* | 17,900 | 342,785 | ||
| 37,143,868 | ||||
Insurance 2.3% | ||||
Direct General Corp. | 136,600 | 4,944,920 | ||
Platinum Underwriters Holdings Ltd. | 124,700 | 3,996,635 | ||
| 8,941,555 | ||||
Health Care 13.9% | ||||
Biotechnology 3.4% | ||||
Martek Biosciences Corp.* | 101,900 | 5,808,300 | ||
Neurocrine Biosciences, Inc.* | 130,300 | 7,700,730 | ||
| 13,509,030 | ||||
Health Care Equipment & Supplies 4.7% | ||||
Cooper Companies, Inc. | 198,300 | 10,708,200 | ||
Edwards Lifesciences Corp.* | 241,700 | 7,722,315 | ||
| 18,430,515 | ||||
Health Care Providers & Services 2.5% | ||||
Beverly Enterprises, Inc.* | 945,100 | 6,048,640 | ||
Centene Corp.* | 119,800 | 3,664,682 | ||
| 9,713,322 | ||||
Pharmaceuticals 3.3% | ||||
NeighborCare, Inc.* | 231,000 | 5,601,750 | ||
NPS Pharmaceuticals, Inc.* | 265,900 | 7,591,445 | ||
| 13,193,195 | ||||
Industrials 9.5% | ||||
Airlines 1.7% | ||||
Frontier Airlines, Inc.* | 105,200 | 1,096,184 | ||
SkyWest, Inc. | 284,500 | 5,473,780 | ||
| 6,569,964 | ||||
Commercial Services & Supplies 0.9% | ||||
ITT Educational Services, Inc.* | 115,600 | 3,606,720 | ||
Construction & Engineering 0.8% | ||||
Quanta Services, Inc.* | 425,100 | 3,009,708 | ||
Electrical Equipment 0.8% | ||||
General Cable Corp.* | 418,600 | 3,089,268 | ||
Machinery 2.2% | ||||
Joy Global, Inc. | 311,300 | 8,738,191 | ||
Road & Rail 2.1% | ||||
Heartland Express, Inc. | 210,521 | 4,795,668 | ||
USF Corp. | 106,400 | 3,641,008 | ||
| 8,436,676 | ||||
Transportation Infrastructure 1.0% | ||||
Overnite Corp. | 168,200 | 3,868,600 | ||
Information Technology 24.8% | ||||
Communications Equipment 4.8% | ||||
Avocent Corp.* | 228,600 | 8,410,194 | ||
Equinix, Inc.* | 55,900 | 2,024,195 | ||
Extreme Networks, Inc.* | 389,900 | 2,811,179 | ||
Westell Technologies, Inc. “A” | 754,700 | 5,509,310 | ||
| 18,754,878 | ||||
Computers & Peripherals 1.4% | ||||
Applied Films Corp.* | 196,900 | 5,493,510 | ||
Electronic Equipment & Instruments 1.1% | ||||
Global Imaging Systems, Inc.* | 128,000 | 4,252,160 | ||
IT Consulting & Services 1.5% | ||||
CACI International, Inc. “A”* | 136,500 | 5,869,500 | ||
Semiconductors & Semiconductor Equipment 13.2% | ||||
AMIS Holdings, Inc.* | 360,000 | 5,842,800 | ||
Cree, Inc.* | 278,900 | 6,219,470 | ||
DSP Group, Inc.* | 415,600 | 10,693,388 | ||
LTX Corp.* | 402,100 | 6,071,710 | ||
Micrel, Inc.* | 436,200 | 5,823,270 | ||
Microsemi Corp.* | 626,000 | 8,563,680 | ||
Skyworks Solutions, Inc.* | 734,800 | 8,567,768 | ||
| 51,782,086 | ||||
Software 2.8% | ||||
THQ, Inc.* | 182,000 | 3,681,860 | ||
Universal Technical Institute, Inc.* | 188,800 | 7,561,440 | ||
| 11,243,300 | ||||
Materials 5.3% | ||||
Chemicals 0.3% | ||||
Compass Minerals International, Inc. | 78,300 | 1,283,337 | ||
Containers & Packaging 2.0% | ||||
Packaging Corp. of America | 350,000 | 7,896,000 | ||
Metals & Mining 3.0% | ||||
Peabody Energy Corp. | 141,400 | 6,576,514 | ||
Steel Dynamics, Inc.* | 201,600 | 4,995,648 | ||
| 11,572,162 | ||||
Total Common Stocks (Cost $307,916,540) | 364,162,606 | |||
Cash Equivalents 6.8% | ||||
Scudder Cash Management QP Trust 1.10% (b) (Cost $26,484,466) | 26,484,466 | 26,484,466 | ||
| % of Net Assets | Value ($) | |||
Total Investment Portfolio (Cost $334,401,006) (a) | 99.4 | 390,647,072 | ||
Other Assets and Liabilities, Net | 0.6 | 2,516,783 | ||
Net Assets | 100.0 | 393,163,855 | ||
| * | Non-income producing security. |
| (a) | The cost for federal income tax purposes was $334,630,943. At March 31, 2004, net unrealized appreciation for all securities based on tax cost was $56,016,129. This consisted of aggregate gross unrealized appreciation for all securities in which there was an excess of value over tax cost of $68,646,633 and aggregate gross unrealized depreciation for all securities in which there was an excess of tax cost over value of $12,630,504. |
| (b) | Scudder Cash Management QP Trust, is also managed by Deutsche Investment Management Americas Inc. The rate shown is the annualized seven-day yield at period end. |
The accompanying notes are an integral part of the financial statements.
31
Table of Contents
Scudder Small Cap Fund
Statement of Assets and Liabilities as of March 31, 2004 (Unaudited)
Assets | ||||
Investments: | ||||
Investments in securities, at value (cost $307,916,540) | $ | 364,162,606 | ||
Investment in Scudder Cash Management QP Trust (cost $26,484,466) | 26,484,466 | |||
Total investments in securities, at value (cost $334,401,006) | 390,647,072 | |||
Receivable for investments sold | 754,100 | |||
Dividends receivable | 103,957 | |||
Interest receivable | 20,555 | |||
Receivable for Fund shares sold | 5,440,434 | |||
Other assets | 5,847 | |||
Total assets | 396,971,965 | |||
Liabilities | ||||
Payable for Fund shares redeemed | 3,450,404 | |||
Accrued investment advisory fee | 141,017 | |||
Other accrued expenses and payables | 216,689 | |||
Total liabilities | 3,808,110 | |||
Net assets, at value | $ | 393,163,855 | ||
Net Assets | ||||
Net assets consist of: | ||||
Accumulated net investment loss | (1,801,283 | ) | ||
Net unrealized appreciation (depreciation) on investments | 56,246,066 | |||
Accumulated net realized gain (loss) | (6,643,098 | ) | ||
Paid-in capital | 345,362,170 | |||
Net assets, at value | $ | 393,163,855 | ||
The accompanying notes are an integral part of the financial statements.
32
Table of Contents
Scudder Small Cap Fund
Statement of Assets and Liabilities as of March 31, 2004 (Unaudited) (continued)
Net Asset Value | |||
Class A | |||
Net Asset Value and redemption price per share ($33,538,055 / 1,494,303 shares of capital stock outstanding, $.001 par value, unlimited number of shares authorized) | $ | 22.44 | |
Maximum offering price per share (100 / 94.25 of $22.44) | $ | 23.81 | |
Class B | |||
Net Asset Value, offering and redemption price (subject to contingent deferred sales charge) per share ($3,108,090 / 140,238 shares of capital stock outstanding, $.001 par value, unlimited number of shares authorized) | $ | 22.16 | |
Class C | |||
Net Asset Value, offering and redemption price (subject to contingent deferred sales charge) per share ($4,315,950 / 194,743 shares of capital stock outstanding, $.001 par value, unlimited number of shares authorized) | $ | 22.16 | |
Investment Class | |||
Net Asset Value, offering and redemption price per share ($351,033,375 / 15,639,470 shares of capital stock outstanding, $.001 par value, unlimited number of shares authorized) | $ | 22.45 | |
Class R | |||
Net Asset Value, offering and redemption price per share ($1,168,385 / 51,992 shares of capital stock outstanding, $.001 par value, unlimited number of shares authorized) | $ | 22.47 |
The accompanying notes are an integral part of the financial statements.
33
Table of Contents
Scudder Small Cap Fund
Statement of Operations for the six months ended March 31, 2004 (Unaudited)
Investment Income | ||||
Income: | ||||
Dividends | $ | 487,664 | ||
Interest - Cash Management Fund Institutional | 39,586 | |||
Interest - Scudder Cash Management QP Trust | 49,777 | |||
Total Income | 577,027 | |||
Expenses: | 1,216,836 | |||
Investment advisory fee | ||||
Administrator service fee | 1,173,709 | |||
Distribution and shareholder servicing fees | 70,517 | |||
Auditing | 31,130 | |||
Legal | 7,380 | |||
Trustees’ fees and expenses | 8,981 | |||
Reports to shareholders | 7,810 | |||
Registration fees | 32,818 | |||
Other | 8,994 | |||
Total expenses, before expense reductions | 2,558,175 | |||
Expense reductions | (181,348 | ) | ||
Total expenses, after expense reductions | 2,376,827 | |||
Net investment income (loss) | (1,799,800 | ) | ||
Realized and Unrealized Gain (Loss) on Investment Transactions | ||||
Net realized gain (loss) from investments | 22,549,856 | |||
Net unrealized appreciation (depreciation) during the period on investments | 24,768,888 | |||
Net gain (loss) on investment transactions | 47,318,744 | |||
Net increase (decrease) in net assets resulting from operations | $ | 45,518,944 | ||
The accompanying notes are an integral part of the financial statements.
34
Table of Contents
Scudder Small Cap Fund
Statement of Changes in Net Assets
Increase (Decrease) in Net Assets | Six Months Ended March 31, 2004 | Year Ended September 30, | ||||||
Operations: | ||||||||
Net investment income (loss) | $ | (1,799,800 | ) | $ | (2,303,918 | ) | ||
Net realized gain (loss) on investment transactions | 22,549,856 | (14,930,010 | ) | |||||
Net unrealized appreciation (depreciation) on investment transactions during the period | 24,768,888 | 66,694,997 | ||||||
Net increase (decrease) in net assets resulting from operations | 45,518,944 | 49,461,069 | ||||||
Fund share transactions: | ||||||||
Proceeds from shares sold | 90,677,829 | 183,028,197 | ||||||
In-kind subscription | — | 52,899,162 | ||||||
Cost of shares redeemed | (86,443,392 | ) | (146,431,067 | ) | ||||
Net increase (decrease) in net assets from Fund share transactions | 4,234,437 | 89,496,292 | ||||||
Increase (decrease) in net assets | 49,753,381 | 138,957,361 | ||||||
Net assets at beginning of period | 343,410,474 | 204,453,113 | ||||||
Net assets at end of period (including accumulated net investment loss of $1,801,283 and $1,483, respectively) | $ | 393,163,855 | $ | 343,410,474 | ||||
The accompanying notes are an integral part of the financial statements.
35
Table of Contents
Scudder Small Cap Fund
Class A
Years Ended September 30, | 2004a | 2003 | 2002b | |||||||||
Selected Per Share Data | ||||||||||||
Net asset value, beginning of period | $ | 19.74 | $ | 16.58 | $ | 20.69 | ||||||
Income (loss) from investment operations: | ||||||||||||
Net investment income (loss)c | (.10 | ) | (.16 | ) | (.03 | ) | ||||||
Net realized and unrealized gain (loss) on investment transactions | 2.80 | 3.32 | (4.08 | ) | ||||||||
Total from investment operations | 2.70 | 3.16 | (4.11 | ) | ||||||||
Net asset value, end of period | $ | 22.44 | $ | 19.74 | $ | 16.58 | ||||||
Total Return (%)d | 13.68 | ** | 19.06 | (19.86 | )** | |||||||
Ratios to Average Net Assets and Supplemental Data | ||||||||||||
Net assets, end of period ($ millions) | 34 | 25 | .6 | |||||||||
Ratio of expenses before expense reductions (%) | 1.35 | * | 1.37 | 1.37 | * | |||||||
Ratio of expenses after expense reductions (%) | 1.25 | * | 1.25 | 1.25 | * | |||||||
Ratio of net investment income (loss) (%) | (.94 | )* | (.90 | ) | (.75 | )* | ||||||
Portfolio turnover rate (%) | 94 | * | 74 | 87e | ||||||||
| a | For the six months ended March 31, 2004 (Unaudited). |
| b | For the period June 28, 2002 (commencement of operations of Class A shares) to September 30, 2002. |
| c | Based on average shares outstanding during the period. |
| d | Total return would have been lower had certain expenses not been reduced. Total return does not reflect the effect of any sales charges. |
| e | On March 28, 2002, the Small Cap Portfolio was closed. This ratio includes the purchase and sale of portfolio securities of the Small Cap Fund as a stand-alone fund in addition to the Small Cap Portfolio. |
| * | Annualized |
| ** | Not annualized |
36
Table of Contents
Scudder Small Cap Fund
Class B
Years Ended September 30, | 2004a | 2003 | 2002b | |||||||||
Selected Per Share Data | ||||||||||||
Net asset value, beginning of period | $ | 19.56 | $ | 16.55 | $ | 20.69 | ||||||
Income (loss) from investment operations: | ||||||||||||
Net investment income (loss)c | (.18 | ) | (.30 | ) | (.06 | ) | ||||||
Net realized and unrealized gain (loss) on investment transactions | 2.78 | 3.31 | (4.08 | ) | ||||||||
Total from investment operations | 2.60 | 3.01 | (4.14 | ) | ||||||||
Net asset value, end of period | $ | 22.16 | $ | 19.56 | $ | 16.55 | ||||||
Total Return (%)d | 13.29 | ** | 18.19 | (20.01 | )** | |||||||
Ratios to Average Net Assets and Supplemental Data | ||||||||||||
Net assets, end of period ($ millions) | 3 | 2 | .3 | |||||||||
Ratio of expenses before expense reductions (%) | 2.10 | * | 2.12 | 2.12 | * | |||||||
Ratio of expenses after expense reductions (%) | 2.00 | * | 2.00 | 2.00 | * | |||||||
Ratio of net investment income (loss) (%) | (1.69 | )* | (1.65 | ) | (1.50 | )* | ||||||
Portfolio turnover rate (%) | 94 | * | 74 | 87 | e | |||||||
| a | For the six months ended March 31, 2004 (Unaudited). |
| b | For the period June 28, 2002 (commencement of operations of Class B shares) to September 30, 2002. |
| c | Based on average shares outstanding during the period. |
| d | Total return would have been lower had certain expenses not been reduced. Total return does not reflect the effect of any sales charges. |
| e | On March 28, 2002, the Small Cap Portfolio was closed. This ratio includes the purchase and sale of portfolio securities of the Small Cap Fund as a stand-alone fund in addition to the Small Cap Portfolio. |
| * | Annualized |
| ** | Not annualized |
37
Table of Contents
Scudder Small Cap Fund
Class C
Years Ended September 30, | 2004a | 2003 | 2002b | |||||||||
Selected Per Share Data | ||||||||||||
Net asset value, beginning of period | $ | 19.56 | $ | 16.55 | $ | 20.69 | ||||||
Income (loss) from investment operations: | ||||||||||||
Net investment income (loss)c | (.18 | ) | (.30 | ) | (.06 | ) | ||||||
Net realized and unrealized gain (loss) on investment transactions | 2.78 | 3.31 | (4.08 | ) | ||||||||
Total from investment operations | 2.60 | 3.01 | (4.14 | ) | ||||||||
Net asset value, end of period | $ | 22.16 | $ | 19.56 | $ | 16.55 | ||||||
Total Return (%)d | 13.29 | ** | 18.19 | (20.01 | )** | |||||||
Ratios to Average Net Assets and Supplemental Data | ||||||||||||
Net assets, end of period ($ millions) | 4 | 2 | .1 | |||||||||
Ratio of expenses before expense reductions (%) | 2.10 | * | 2.12 | 2.12 | * | |||||||
Ratio of expenses after expense reductions (%) | 2.00 | * | 2.00 | 2.00 | * | |||||||
Ratio of net investment income (loss) (%) | (1.69 | )* | (1.65 | ) | (1.50 | )* | ||||||
Portfolio turnover rate (%) | 94 | * | 74 | 87 | e | |||||||
| a | For the six months ended March 31, 2004 (Unaudited). |
| b | For the period June 28, 2002 (commencement of operations of Class C shares) to September 30, 2002. |
| c | Based on average shares outstanding during the period. |
| d | Total return would have been lower had certain expenses not been reduced. Total return does not reflect the effect of any sales charges. |
| e | On March 28, 2002, the Small Cap Portfolio was closed. This ratio includes the purchase and sale of portfolio securities of the Small Cap Fund as a stand-alone fund in addition to the Small Cap Portfolio. |
| * | Annualized |
| ** | Not annualized |
38
Table of Contents
Scudder Small Cap Fund
Investment Class
Years Ended September 30, | 2004a | 2003 | 2002 | 2001 | 2000 | 1999 | ||||||||||||||||||
Selected Per Share Data | ||||||||||||||||||||||||
Net asset value, beginning of period | $ | 19.74 | $ | 16.57 | $ | 19.73 | $ | 26.95 | $ | 21.89 | $ | 14.96 | ||||||||||||
Income (loss) from investment operations: | ||||||||||||||||||||||||
Net investment income (loss) | (.10 | )b | (.16 | )b | (.13 | )b | (.12 | ) | (.15 | ) | (.15 | ) | ||||||||||||
Net realized and unrealized gain (loss) on investment transactions | 2.81 | 3.33 | (3.03 | ) | (5.53 | ) | 8.53 | 7.13 | ||||||||||||||||
Total from investment operations | 2.71 | 3.17 | (3.16 | ) | (5.65 | ) | 8.38 | 6.98 | ||||||||||||||||
Less distributions from: | ||||||||||||||||||||||||
Net realized gains on investment transactions | — | — | — | (1.57 | ) | (3.32 | ) | (.05 | ) | |||||||||||||||
Net asset value, end of period | $ | 22.45 | $ | 19.74 | $ | 16.57 | $ | 19.73 | $ | 26.95 | $ | 21.89 | ||||||||||||
Total Return (%)c | 13.73 | ** | 19.13 | (16.02 | ) | (21.77 | ) | 41.59 | 46.52 | |||||||||||||||
Ratios to Average Net Assets and Supplemental Data | ||||||||||||||||||||||||
Net assets, end of period ($ millions) | 351 | 313 | 204 | 241 | 292 | 216 | ||||||||||||||||||
Ratio of expenses before expense reductions (%) | 1.35 | * | 1.37 | 1.40 | d | 1.46 | d | 1.44 | d | 1.46 | d | |||||||||||||
Ratio of expenses after expense reductions (%) | 1.25 | * | 1.25 | 1.25 | d | 1.25 | d | 1.25 | d | 1.25 | d | |||||||||||||
Ratio of net investment income (loss) (%) | (.94 | )* | (.90 | ) | (.63 | ) | (.53 | ) | (.60 | ) | (.74 | ) | ||||||||||||
Portfolio turnover rate (%) | 94 | * | 74 | 87e | 109 | 136 | 159 | |||||||||||||||||
| a | For the six months ended March 31, 2004 (Unaudited). |
| b | Based on average shares outstanding during the period. |
| c | Total return would have been lower had certain expenses not been reduced. |
| d | The expense ratio of the Small Cap Portfolio is included in this ratio. |
| e | On March 28, 2002, the Small Cap Portfolio was closed. This ratio includes the purchase and sale of portfolio securities of the Small Cap Fund as a stand-alone fund in addition to the Small Cap Portfolio. |
| * | Annualized |
| ** | Not annualized |
39
Table of Contents
Scudder Small Cap Fund
Class R
| 2004a | ||||
Selected Per Share Data | ||||
Net asset value, beginning of period | $ | 20.06 | ||
Income (loss) from investment operations: | ||||
Net investment income (loss)b | (.14 | ) | ||
Net realized and unrealized gain (loss) on investment transactions | 2.55 | |||
Total from investment operations | 2.41 | |||
Net asset value, end of period | $ | 22.47 | ||
Total Return (%)c | 12.01 | ** | ||
Ratios to Average Net Assets and Supplemental Data | ||||
Net assets, end of period ($ millions) | 1 | |||
Ratio of expenses before expense reductions (%) | 1.60 | * | ||
Ratio of expenses after expense reductions (%) | 1.50 | * | ||
Ratio of net investment income (loss) (%) | (1.19 | )* | ||
Portfolio turnover rate (%) | 94 | * | ||
| a | For the period October 1, 2003 (commencement of operations of Class R shares) to March 31, 2004 (Unaudited). |
| b | Based on average shares outstanding during the period. |
| c | Total return would have been lower had certain expenses not been reduced. |
| * | Annualized |
| ** | Not annualized |
40
Table of Contents
Notes to Financial Statements (Unaudited)
Scudder Small Cap Fund
A. Significant Accounting Policies
Small Cap Fund (“Scudder Small Cap Fund” or the “Fund”) is a diversified series of Scudder Advisor Funds (the “Trust”), which is registered under the Investment Company Act of 1940, as amended (the “1940 Act”) as an open-end management investment company organized as a Massachusetts business trust.
The Fund offers multiple classes of shares which provide investors with different purchase options. Class A shares are offered to investors subject to an initial sales charge. Class B shares are offered without an initial sales charge but are subject to higher ongoing expenses than Class A shares and a contingent deferred sales charge payable upon certain redemptions. Class B shares automatically convert to Class A shares six years after issuance. Class C shares are offered to investors without an initial sales charge and are subject to higher ongoing expenses than Class A shares and a contingent deferred sales charge payable upon certain redemptions within one year of purchase. Prior to March 1, 2004, Class C shares were offered with an initial sales charge. Class C shares do not convert into another class. Investment Class shares are not subject to initial or contingent deferred sales charges. On October 1, 2003, the Fund commenced offering Class R shares which are only available to participants in certain retirement plans and are offered to investors without an initial sales charge.
Investment income, realized and unrealized gains and losses, and certain fund-level expenses and expense reductions, if any, are borne pro rata on the basis of relative net assets by the holders of all classes of shares, except that each class bears certain expenses unique to that class such as distribution fees, service fees, administrator fees and certain other class-specific expenses. Differences in class-level expenses may result in payment of different per share dividends by class. All shares of the Fund have equal rights with respect to voting subject to class-specific arrangements.
The Fund’s financial statements are prepared in accordance with accounting principles generally accepted in the United States of America which require the use of management estimates. Actual results could differ from those estimates. The policies described below are followed consistently by the Fund in the preparation of its financial statements.
Security Valuation. Investments are stated at value determined as of the close of regular trading on the New York Stock Exchange on each day the exchange is open for trading. Equity securities are valued at the most recent sale price or official closing price reported on the exchange (US or foreign) or over-the-counter market on which the security is traded most extensively. Securities for which no sales are reported are valued at the calculated mean between the most recent bid and asked quotations on the relevant market or, if a mean cannot be determined, at the most recent bid quotation.
Money market investments purchased with an original or remaining maturity of sixty days or less, maturing at par, are valued at amortized cost. Investments in open-end investment companies and Scudder Cash Management QP Trust are valued at their net asset value each business day.
41
Table of Contents
Securities and other assets for which market quotations are not readily available or for which the above valuation procedures are deemed not to reflect fair value are valued in a manner that is intended to reflect their fair value as determined in accordance with procedures approved by the Trustees.
Federal Income Taxes. The Fund’s policy is to comply with the requirements of the Internal Revenue Code, as amended, which are applicable to regulated investment companies, and to distribute all of its taxable income to its shareholders. Accordingly, the Fund paid no federal income taxes and no federal income tax provision was required.
At September 30, 2003 the Fund had a net tax basis capital loss carryforward of approximately $17,532,000, which may be applied against any realized net taxable capital gains of each succeeding year until fully utilized or until September 30, 2008 ($232,000), September 30, 2009 ($66,000), September 30, 2010 ($4,518,000) and September 30, 2011 ($12,716,000), the respective expiration dates, whichever occurs first.
In addition, from November 1, 2002 through September 30, 2003, the Fund incurred approximately $11,080,000 of net realized capital losses. As permitted by tax regulations, the Fund intends to elect to defer these losses and treat them as arising in the fiscal year ending September 30, 2004.
Distribution of Income and Gains. Distributions of net investment income, if any, are made annually. Net realized gains from investment transactions, in excess of available capital loss carryforwards, would be taxable to the Fund if not distributed, and, therefore, will be distributed to shareholders at least annually.
The timing and characterization of certain income and capital gains distributions are determined annually in accordance with federal tax regulations which may differ from accounting principles generally accepted in the United States of America. These differences primarily relate to securities sold at a loss. As a result, net investment income (loss) and net realized gain (loss) on investment transactions for a reporting period may differ significantly from distributions during such period. Accordingly, the Fund may periodically make reclassifications among certain of its capital accounts without impacting the net asset value of the Fund.
The tax character of current year distributions, if any, will be determined at the end of the current fiscal year.
Expenses. Expenses of the Trust arising in connection with a specific Fund are allocated to that Fund. Other Trust expenses which cannot be directly attributed to a Fund are apportioned among the Funds in the Trust.
Other. Investment transactions are accounted for on a trade date plus one basis for daily net asset value calculations. However, for financial reporting purposes, investment security transactions are reported on trade date. Interest income is recorded on the accrual basis. Dividend income is recorded on the ex-dividend date. Realized gains and losses from investment transactions are recorded on an identified cost basis.
B. Purchases and Sales of Securities
During the six months ended March 31, 2004, purchases and sales of investment securities (excluding short-term investments) aggregated $167,044,097 and $172,775,479, respectively.
42
Table of Contents
C. Related Parties
Scudder Investments is part of Deutsche Asset Management, which is the marketing name in the US for the asset management activities of Deutsche Bank AG. Deutsche Asset Management, Inc. (“DeAM, Inc.” or the “Advisor”), an indirect, wholly owned subsidiary of Deutsche Bank AG, is the Fund’s Advisor. Investment Company Capital Corporation (“ICCC” or the “Administrator”), also an indirect, wholly owned subsidiary of Deutsche Bank AG, is the Fund’s Administrator.
Investment Advisory Agreement. Under the Investment Advisory Agreement, the Advisor directs the investments of the Fund in accordance with its investment objectives, policies and restrictions. The Advisor determines the securities, instruments and other contracts relating to investments to be purchased, sold or entered into by the Fund. The investment advisory fee payable under the Investment Advisory Agreement is equal to an annual rate of 0.65% of the Fund’s average daily net assets, computed and accrued daily and payable monthly. The Fund did not impose a portion of its advisory fees equivalent to the advisory fees charged on assets invested in the affiliated money market fund, Cash Management Fund Institutional.
For the six months ended March 31, 2004, the Advisor and Administrator have contractually agreed to waive their fees or reimburse expenses to the extent necessary to maintain the annualized expenses of the classes of the Fund as follows:
Class A | 1.25 | % | |
Class B | 2.00 | % | |
Class C | 2.00 | % | |
Investment Class | 1.25 | % | |
Class R | 1.50 | % |
Accordingly, for the six months ended March 31, 2004, the Advisor waived a portion of its advisory fee pursuant to the Expense Limitation Agreement aggregating $181,348 and the amount imposed aggregated $1,035,488 which was equivalent to an annualized effective rate of 0.55% of the Fund’s average daily net assets.
Administrator. For its services as Administrator, ICCC receives a fee (the “Administrator Service Fee”) of 0.65% of the average daily net assets for the Investment Class and 0.40% of average daily net assets for Class A, B, C and R shares for the Fund, computed and accrued daily and payable monthly. For the six months ended March 31, 2004, the Administrator Service Fee for the Fund was as follows:
Administrator Service Fee | Total Aggregated | Unpaid at March 31, 2004 | ||||
Class A | $ | 60,378 | $ | 11,342 | ||
Class B | 5,681 | 1,066 | ||||
Class C | 7,012 | 1,421 | ||||
Investment Class | 1,099,801 | 197,685 | ||||
Class R | 837 | 837 | ||||
| $ | 1,173,709 | $ | 212,351 | |||
43
Table of Contents
Distribution Agreement. Under the Distribution Agreement, in accordance with Rule 12b-1 under the 1940 Act, Scudder Distributors, Inc. (“SDI”), an affiliate of the Advisor, receives a fee (“Distribution Fee”) of 0.25% of the average daily net assets of the Class A and R shares and 0.75% of average daily net assets of the Class B and C shares. Pursuant to the agreement, SDI enters into related selling group agreements with various firms at various rates for sales of Class B and C shares. For the six months ended March 31, 2004, the Distribution Fee was as follows:
Distribution Fee | Total Aggregated | Unpaid at March 31, 2004 | ||||
Class A | $ | 37,736 | $ | 6,806 | ||
Class B | 10,653 | 2,060 | ||||
Class C | 13,148 | 2,738 | ||||
Class R | 523 | 523 | ||||
| $ | 62,060 | $ | 12,127 | |||
In addition, SDI provides information and administrative services (“Shareholder Servicing Fee”) to Class B, C and R shareholders at an annual rate of up to 0.25% of average daily net assets for each such class. SDI in turn has various agreements with financial services firms that provide these services and pays these fees based upon the assets of shareholder accounts the firms service. For the six months ended March 31, 2004, the Shareholder Servicing Fee was as follows:
Shareholder Servicing Fee | Total Aggregated | Unpaid at March 31, 2004 | Effective Rate | ||||||
Class B | $ | 3,551 | $ | 636 | .25 | % | |||
Class C | 4,383 | 849 | .25 | % | |||||
Class R | 523 | 284 | .25 | % | |||||
| $ | 8,457 | $ | 1,769 | ||||||
Underwriting Agreement and Contingent Deferred Sales Charge. SDI is the principal underwriter for the Fund. Underwriting commissions paid in connection with the distribution of Class A shares for the six months ended March 31, 2004 aggregated $6,237. There were no underwriting commissions paid in connection with the distribution of Class C shares for the six months ended March 31, 2004.
In addition, SDI receives any contingent deferred sales charge (“CDSC”) from Class B share redemptions occurring within six years of purchase and Class C share redemptions occurring within one year of purchase. There is no such charge upon redemption of any share appreciation or reinvested dividends. The CDSC is based on declining rates ranging from 4% to 1% for Class B and 1% for Class C, of the value of the shares redeemed. For the six months ended March 31, 2004, the CDSC for the Fund’s Class B and C shares was $3,466 and $246, respectively. A deferred sales charge of up to 1% is assessed on certain redemptions of Class A shares. For the six months ended March 31, 2004, SDI received $556.
Other. The Fund may invest in Cash Management Fund Institutional, an open-end management investment company managed by DeAM, Inc.
Trustees’ Fees and Expenses. As compensation for his or her services, each Independent Trustee receives an aggregate annual fee, plus a fee for each meeting attended (plus reimbursement for reasonable out-of-pocket expenses incurred in connection with his or her attendance at board and committee meetings) from each Fund in the Fund Complex for which he or she serves. In addition, the Chairman of the Fund Complex’s Audit Committee receives an annual fee for his services.
Scudder Cash Management QP Trust. Pursuant to an Exemptive Order issued by the SEC, the Fund may invest in the Scudder Cash Management QP Trust (the “QP Trust”) and other affiliated funds managed by the Advisor. The QP Trust seeks to provide as high a level of current income as is consistent with the preservation of capital and the maintenance of liquidity. The QP Trust does not pay the Advisor a management fee for the affiliated funds’ investments in the QP Trust.
44
Table of Contents
D. Line of Credit
The Fund and several other affiliated funds (the “Participants”) share in a $1.25 billion revolving credit facility administered by J.P. Morgan Chase Bank for temporary or emergency purposes, including the meeting of redemption requests that otherwise might require the untimely disposition of securities. The Participants are charged an annual commitment fee which is allocated, based upon net assets, among each of the Participants. Interest is calculated at the Federal Funds Rate plus 0.5 percent. The Fund may borrow up to a maximum of 33 percent of its net assets under the agreement.
E. Share Transactions
The following table summarizes share and dollar activity in the Fund:
Six Months Ended March 31, 2004 | Year Ended September 30, 2003 | |||||||||||||
| Shares | Dollars | Shares | Dollars | |||||||||||
| Shares sold | ||||||||||||||
Class A | 887,989 | $ | 19,374,920 | 1,752,188 | $ | 31,091,653 | ||||||||
Class B | 50,138 | 1,075,647 | 122,357 | 2,190,104 | ||||||||||
Class C | 85,905 | 1,844,379 | 124,742 | 2,254,363 | ||||||||||
Investment Class | 3,023,850 | 67,125,427 | 7,905,657 | 147,492,077 | ||||||||||
Class R | 55,877 | * | 1,257,456 | * | — | — | ||||||||
| $ | 90,677,829 | $ | 183,028,197 | |||||||||||
| In-kind subscription | ||||||||||||||
Investment Class | — | — | 3,329,085 | $ | 52,899,162 | |||||||||
| — | $ | 52,899,162 | ||||||||||||
| Shares redeemed | ||||||||||||||
Class A | (684,523 | ) | $ | (14,870,341 | ) | (496,536 | ) | $ | (9,283,647 | ) | ||||
Class B | (26,827 | ) | (577,269 | ) | (21,791 | ) | (392,644 | ) | ||||||
Class C | (14,438 | ) | (319,694 | ) | (5,440 | ) | (100,282 | ) | ||||||
Investment Class | (3,255,167 | ) | (70,588,113 | ) | (7,646,213 | ) | (136,654,494 | ) | ||||||
Class R | (3,885 | )* | (87,975 | )* | — | — | ||||||||
| $ | (86,443,392 | ) | $ | (146,431,067 | ) | |||||||||
| Net increase (decrease) | ||||||||||||||
Class A | 203,466 | $ | 4,504,579 | 1,255,652 | $ | 21,808,006 | ||||||||
Class B | 23,311 | 498,378 | 100,566 | 1,797,460 | ||||||||||
Class C | 71,467 | 1,524,685 | 119,302 | 2,154,081 | ||||||||||
Investment Class | (231,317 | ) | (3,462,686 | ) | 3,588,529 | 63,736,745 | ||||||||
Class R | 51,992 | * | 1,169,481 | * | — | — | ||||||||
| $ | 4,234,437 | $ | 89,496,292 | |||||||||||
| * | For the period October 1, 2003 (commencement of operations of Class R shares) to March 31, 2004. |
F. In-Kind Subscription
As part of Deutsche Bank’s effort to consolidate various legacy retirement plans, Deutsche Bank implemented a program to transfer various plan assets as a means to streamline the number of investment options offered to employee plan participants. As part of the consolidation program, on March 28, 2003 the Scudder Small Cap Fund accepted securities and cash in payment for fund shares (received an in-kind subscription) from the BT Partnershare retirement plan in accordance with the Fund’s purchase in-kind procedures. The transaction represented a percentage of the Fund’s net assets at March 31, 2003 as follows:
| Purchase Amount | % of Net Assets | ||||
Small Cap Fund | $ | 52,899,162 | 25 | ||
G. Regulatory Matters and Litigation
Since at least July 2003, federal, state and industry regulators have been conducting ongoing inquiries and investigations (“inquiries”) into the mutual fund industry, and have requested information from numerous mutual fund companies, including Scudder Investments. We are unable to determine what the outcome of these inquiries will be or what the effect, if any, would be on the funds or their advisers. Publicity about mutual fund practices arising from these industry wide inquiries serve as the general basis of a number of private lawsuits against the Scudder Funds. These lawsuits, which previously have been reported in the press, involve purported class action and derivative lawsuits, making various allegations and naming as defendants various persons, including certain Scudder funds, Deutsche Asset Management (“DeAM”) and its affiliates, certain individuals, including in some cases Fund Trustees/Directors, and other parties. DeAM has undertaken to bear all liabilities and expenses incurred by the Scudder funds in connection with these lawsuits, or other lawsuits or regulatory actions that may be filed making allegations similar to these lawsuits regarding fund valuation, market timing, revenue sharing or other subjects of the pending inquiries. Based on currently available information, DeAM believes the likelihood that the pending lawsuits will have a material adverse financial impact on a Scudder fund is remote and such actions are not likely to materially affect its ability to perform under its investment management agreements with the Scudder funds.
45
Table of Contents
Performance Summary March 31, 2004
All performance shown is historical, assumes reinvestment of all dividends and capital gains, and does not guarantee future results. Investment return and principal value fluctuate with changing market conditions so that, when redeemed, shares may be worth more or less than their original cost. Current performance may be lower or higher than the performance quoted. Please visit scudder.com for the product’s most recent month-end performance.
The maximum sales charge for Class A shares is 5.75%. For Class B shares, the maximum contingent deferred sales charge (CDSC) is 4% within the first year after purchase, declining to 0% after six years. Class C shares have no adjustment for front-end sales charges but redemptions within one year of purchase may be subject to a CDSC of 1%. Unadjusted returns do not reflect sales charges and would have been lower if they had. Institutional Class and Investment Class shares are not subject to sales charges.
Returns and rankings during all periods shown reflect a fee waiver and/or expense reimbursement. Without this waiver/reimbursement, returns and rankings would have been lower.
Performance figures do not reflect the deduction of taxes that a shareholder would pay on fund distributions or the sale of fund shares. Returns and rankings may differ by share class.
Returns shown for Class A, B and C shares for the periods prior to June 28, 2002 are derived from the historical performance of Institutional Class shares of the Scudder Micro Cap Fund during such periods and have been adjusted to reflect the higher gross total annual operating expenses and the current applicable sales charge of each specific class. Any difference in expenses will affect performance.
Average Annual Total Returns (Unadjusted for Sales Charge) as of 3/31/04
Scudder Micro Cap Fund | 6-Month++ | 1-Year | 3-Year | 5-Year | Life of Class* | ||||||||||
Class A | 16.21 | % | 51.99 | % | 7.87 | % | 16.89 | % | 14.62 | % | |||||
Class B | 15.77 | % | 50.77 | % | 7.07 | % | 16.02 | % | 13.76 | % | |||||
Class C | 15.88 | % | 50.95 | % | 7.08 | % | 16.03 | % | 13.76 | % | |||||
Institutional Class | 16.38 | % | 52.42 | % | 8.12 | % | 17.17 | % | 14.90 | % | |||||
Russell 2000 Index+ | 21.69 | % | 63.83 | % | 10.90 | % | 9.66 | % | 8.35 | % |
Scudder Micro Cap Fund | 6-Month++ | 1-Year | 3-Year | 5-Year | Life of Class** | ||||||||||
Investment Class | 16.28 | % | 52.03 | % | 7.86 | % | 16.88 | % | 12.92 | % | |||||
Russell 2000 Index+ | 21.69 | % | 63.83 | % | 10.90 | % | 9.66 | % | 6.52 | % |
Sources: Lipper Inc. and Deutsche Asset Management, Inc.
| ++ | Total returns shown for periods less than one year are not annualized. |
| * | The Fund commenced operations on December 18, 1996. Index returns begin December 31, 1996. |
| ** | Investment Class commenced operations on August 21, 1997. Index returns begin August 31, 1997. |
46
Table of Contents
Scudder Micro Cap Fund
Net Asset Value
| Class A | Class B | Class C | Investment Class | Institutional Class | |||||||||||
Net Asset Value: | |||||||||||||||
3/31/04 | $ | 21.72 | $ | 21.44 | $ | 21.45 | $ | 21.71 | $ | 22.03 | |||||
9/30/03 | $ | 18.69 | $ | 18.52 | $ | 18.51 | $ | 18.67 | $ | 18.93 | |||||
Institutional Class Lipper Rankings - Small-Cap Core Funds Category as of 3/31/04
Period | Rank | Number of Funds Tracked | Percentile Ranking | |||||
1-Year | 413 | of | 526 | 79 | ||||
3-Year | 351 | of | 419 | 84 | ||||
5-Year | 63 | of | 296 | 22 |
Source: Lipper Inc. Rankings are historical and do not guarantee future results. Rankings are based on total return with distributions reinvested. Rankings are for Institutional Class shares; other share classes may vary.
Growth of an Assumed $10,000 Investment (Adjusted for Maximum Sales Charge)
[] Scudder Micro Cap Fund - Class A
[] Russell 2000 Index+
[GRAPHIC APPEARS HERE]
Yearly periods ended March 31
The Fund’s growth of an assumed $10,000 investment is adjusted for the maximum sales charge of 5.75%. This results in a net investment of $9,425.
The growth of $10,000 is cumulative.
| * | The Fund commenced operations on December 18, 1996. Index returns begin December 31, 1996. |
47
Table of Contents
Scudder Micro Cap Fund
Comparative Results (Adjusted for Maximum Sales Charge) as of 3/31/04
Scudder Micro Cap Fund | 1-Year | 3-Year | 5-Year | Life of Class* | ||||||||||||||
Class A | Growth of $10,000 Average annual total return | $ | 14,325 43.25 | % | $ | 11,830 5.76 | % | $ | 20,567 15.51 | % | $ | 25,470 13.69 | % | |||||
Class B | Growth of $10,000 Average annual total return | $ | 14,777 47.77 | % | $ | 12,074 6.48 | % | $ | 20,922 15.91 | % | $ | 25,581 13.76 | % | |||||
Class C | Growth of $10,000 Average annual total return | $ | 15,095 50.95 | % | $ | 12,280 7.08 | % | $ | 21,032 16.03 | % | $ | 25,592 13.76 | % | |||||
Russell 2000 Index+ | Growth of $10,000 Average annual total return | $ | 16,383 63.83 | % | $ | 13,639 10.90 | % | $ | 15,855 9.66 | % | $ | 17,881 8.35 | % | |||||
The growth of $10,000 is cumulative.
Growth of an Assumed $250,000 Investment
[] Scudder Micro Cap Fund - Institutional Class
[] Russell 2000 Index+
[GRAPHIC APPEARS HERE]
Yearly periods ended March 31
The growth of $250,000 is cumulative.
| * | The Fund commenced operations on December 18, 1996. Index returns begin December 31, 1996. |
48
Table of Contents
Scudder Micro Cap Fund
Comparative Results as of 3/31/04
Scudder Micro Cap Fund | 1-Year | 3-Year | 5-Year | Life of Class* | ||||||||||||||
| Institutional Class | Growth of $250,000 Average annual total return | $ | 381,050 52.42 | % | $ | 315,950 8.12 | % | $ | 552,050 17.17 | % | $ | 687,625 14.90 | % | |||||
| Russell 2000 Index+ | Growth of $250,000 Average annual total return | $ | 409,575 63.83 | % | $ | 340,975 10.90 | % | $ | 396,375 9.66 | % | $ | 447,025 8.35 | % | |||||
| 1-Year | 3-Year | 5-Year | Life of Class** | |||||||||||||||
| Investment Class | Growth of $10,000 Average annual total return | $ | 15,203 52.03 | % | $ | 12,549 7.86 | % | $ | 21,809 16.88 | % | $ | 22,321 12.92 | % | |||||
| Russell 2000 Index+ | Growth of $10,000 Average annual total return | $ | 16,383 63.83 | % | $ | 13,639 10.90 | % | $ | 15,855 9.66 | % | $ | 15,158 6.52 | % | |||||
The growth of $10,000/$250,000 is cumulative.
The minimum investment for Institutional Class shares is $250,000.
| * | The Fund commenced operations on December 18, 1996. Index returns begin December 31, 1996. |
| ** | Investment Class commenced operations on August 21, 1997. Index returns begin August 31, 1997. |
| + | Russell 2000 Index is an unmanaged index that tracks the common stock price movement of the 2,000 smallest companies of the Russell 3000 Index, which measures the performance of the 3,000 largest US companies based on total market capitalization. Index returns assume reinvestment of dividends and, unlike Fund returns, do not reflect any fees or expenses. It is not possible to invest directly into an index. |
49
Table of Contents
Portfolio Summary March 31, 2004
Scudder Micro Cap Fund
Asset Allocation | 3/31/04 | 9/30/03 | ||||
Common Stocks | 89 | % | 96 | % | ||
Cash Equivalents, net | 9 | % | 4 | % | ||
Preferred Stocks | 2 | % | — | |||
| 100 | % | 100 | % | |||
Sector Diversification (Excludes Cash Equivalents) | 3/31/04 | 9/30/03 | ||||
Information Technology | 31 | % | 38 | % | ||
Consumer Discretionary | 17 | % | 15 | % | ||
Industrials | 15 | % | 10 | % | ||
Financials | 14 | % | 10 | % | ||
Health Care | 12 | % | 18 | % | ||
Energy | 6 | % | 3 | % | ||
Materials | 3 | % | — | |||
Consumer Staples | 2 | % | 3 | % | ||
Utilities | — | 3 | % | |||
| 100 | % | 100 | % | |||
Ten Largest Equity Holdings at March 31, 2004 (26.7% of Portfolio) | |||
1. Jos. A. Bank Clothiers, Inc. Manufacturer of classic men’s clothing | 3.7 | % | |
2. ANSYS, Inc. Developer of software solutions for design analysis | 3.2 | % | |
3. Connetics Corp. Producer of pharmaceuticals | 3.1 | % | |
4. Harris Interactive, Inc. Provider of consulting services | 2.8 | % | |
5. Digitas, Inc. Provider of integrated strategy, technology and marketing solutions | 2.5 | % | |
6. Keystone Automotive Industries, Inc. Distributor of aftermarket collision replacement parts for automobiles and light trucks | 2.5 | % | |
7. United Natural Foods, Inc. Distributor of natural foods and related products | 2.4 | % | |
8. NS Group, Inc. Manufacturer of specialty steel products for the energy industry | 2.2 | % | |
9. Education Lending Group, Inc. Provider of financial aid products to schools | 2.2 | % | |
10. Cache, Inc. Retail stores specializing in high fashion apparel and accessories | 2.1 | % | |
Asset allocation, sector diversification and portfolio holdings are subject to change.
For more complete details about the fund’s investment portfolio, see page 66. A quarterly Fact Sheet is available upon request. Information concerning portfolio holdings of the Fund as of month end is available upon request on the 16th of the following month. Please see the Account Management Resources section for contact information.
50
Table of Contents
Investment Portfolio as of March 31, 2004 (Unaudited)
Scudder Micro Cap Fund | Shares | Value ($) | ||
Common Stocks 89.1% | ||||
Consumer Discretionary 15.6% | ||||
Auto Components 2.4% | ||||
Keystone Automotive Industries, Inc.* | 143,400 | 3,923,424 | ||
Hotels Restaurants & Leisure 2.7% | ||||
Red Robin Gourmet Burgers* | 47,700 | 1,354,680 | ||
Shuffle Master, Inc.* | 65,400 | 3,040,446 | ||
| 4,395,126 | ||||
Media 2.8% | ||||
Harris Interactive, Inc.* | 529,500 | 4,463,685 | ||
Specialty Retail 7.7% | ||||
Cache, Inc.* | 103,200 | 3,402,504 | ||
Hancock Fabrics, Inc. | 193,100 | 3,068,359 | ||
Jos. A. Bank Clothiers, Inc.* | 161,850 | 5,826,600 | ||
| 12,297,463 | ||||
Consumer Staples 2.4% | ||||
Food & Drug Retailing | ||||
United Natural Foods, Inc.* | 78,700 | 3,784,683 | ||
Energy 5.4% | ||||
Energy Equipment & Services 0.6% | ||||
Dril-Quip, Inc.* | 59,400 | 976,536 | ||
Oil & Gas 4.8% | ||||
Brigham Exploration Co.* | 198,600 | 1,459,710 | ||
Carrizo Oil & Gas, Inc.* | 432,400 | 3,134,900 | ||
Southwestern Energy Co.* | 128,900 | 3,109,068 | ||
| 7,703,678 | ||||
Financials 10.7% | ||||
Banks 4.5% | ||||
Dime Community Bancshares | 96,900 | 1,971,915 | ||
Fidelity Bancshares, Inc. | 43,600 | 1,597,940 | ||
Franklin Bank Corp.* | 125,800 | 2,338,622 | ||
Mercantile Bank Corp. | 37,200 | 1,320,600 | ||
| 7,229,077 | ||||
Diversified Financial Services 3.0% | ||||
Encore Capital Group, Inc.* | 147,100 | 2,443,331 | ||
Marlin Business Services, Inc.* | 135,800 | 2,285,514 | ||
TNS, Inc.* | 7,100 | 135,965 | ||
| 4,864,810 | ||||
Insurance 2.5% | ||||
Donegal Group, Inc. “A” | 137,300 | 2,751,492 | ||
Navigators Group, Inc.* | 41,800 | 1,203,004 | ||
| 3,954,496 | ||||
Real Estate 0.7% | ||||
Capital Lease Funding, Inc.* | 42,300 | 542,286 | ||
Government Properties Trust, Inc. | 42,300 | 557,091 | ||
| 1,099,377 | ||||
Health Care 10.8% | ||||
Health Care Equipment & Supplies 2.4% | ||||
Advanced Neuromodulation Systems, Inc.* | 46,500 | 1,678,185 | ||
Zoll Medical Corp.* | 54,900 | 2,194,902 | ||
| 3,873,087 | ||||
Health Care Providers & Services 4.1% | ||||
Centene Corp.* | 82,100 | 2,511,439 | ||
Gentiva Health Services, Inc.* | 106,100 | 1,643,489 | ||
Sierra Health Services, Inc.* | 66,200 | 2,409,680 | ||
| 6,564,608 | ||||
Pharmaceuticals 4.3% | ||||
Adolor Corp.* | 132,500 | 1,991,475 | ||
Connetics Corp.* | 223,300 | 4,950,561 | ||
| 6,942,036 | ||||
Industrials 13.6% | ||||
Aerospace & Defense 0.9% | ||||
EDO Corp. | 63,100 | 1,519,448 | ||
Commercial Services & Supplies 5.1% | ||||
Bright Horizons Family Solutions, Inc.* | 68,300 | 3,221,028 | ||
Concorde Careet Colleges Inc.* | 35,750 | 858,000 | ||
CoStar Group, Inc.* | 76,700 | 2,829,463 | ||
Marten Transport Ltd.* | 70,050 | 1,330,950 | ||
| 8,239,441 | ||||
Electrical Equipment 2.7% | ||||
General Cable Corp.* | 282,300 | 2,083,374 | ||
Ultralife Batteries, Inc.* | 105,800 | 2,256,714 | ||
| 4,340,088 | ||||
Machinery 2.1% | ||||
Wabash National Corp.* | 139,600 | 3,294,560 | ||
Road & Rail 1.7% | ||||
Celadon Group, Inc.* | 163,300 | 2,715,679 | ||
Transportation Infrastructure 1.1% | ||||
Quality Distribution, Inc.* | 123,600 | 1,742,760 | ||
Information Technology 28.1% | ||||
Communications Equipment 2.1% | ||||
Equinix, Inc.* | 18,800 | 680,767 | ||
Westell Technologies, Inc. “A” | 370,600 | 2,705,380 | ||
| 3,386,147 | ||||
Computers & Peripherals 5.1% | ||||
Applied Films Corp.* | 116,700 | 3,255,930 | ||
Synaptics, Inc.* | 167,400 | 2,936,196 | ||
TransAct Technologies, Inc.* | 53,600 | 2,087,720 | ||
| 8,279,846 | ||||
Electronic Equipment & Instruments 5.8% | ||||
Craftmade International, Inc. | 125,500 | 3,396,030 | ||
Identix, Inc.* | 197,345 | 1,140,457 | ||
Keithley Instruments, Inc. | 154,300 | 3,195,553 | ||
OSI Systems, Inc.* | 78,700 | 1,574,000 | ||
| 9,306,040 | ||||
Internet Software & Services 4.0% | ||||
Digitas, Inc.* | 387,100 | 3,983,259 | ||
WebMethods, Inc.* | 260,100 | 2,444,940 | ||
| 6,428,199 | ||||
IT Consulting & Services 2.9% | ||||
GRIC Communications, Inc.* | 402,300 | 1,347,705 | ||
ManTech International Corp. “A”* | 74,400 | 1,524,456 | ||
Modem Media, Inc.* | 277,400 | 1,803,100 | ||
| 4,675,261 | ||||
Software 8.2% | ||||
Agile Software Corp.* | 261,300 | 2,286,375 | ||
ANSYS, Inc.* | 129,400 | 5,142,356 | ||
Docucorp International, Inc.* | 97,500 | 1,144,650 | ||
Open Solutions, Inc.* | 146,900 | 3,243,552 | ||
Tradestation Group, Inc.* | 192,600 | 1,296,198 | ||
| 13,113,131 | ||||
Materials 2.5% | ||||
Chemicals 0.3% | ||||
Compass Minerals International, Inc. | 26,500 | 434,335 | ||
Metals & Mining 2.2% | ||||
NS Group, Inc.* | 272,400 | 3,541,200 | ||
Total Common Stocks (Cost $113,970,559) | 143,088,221 | |||
Preferred Stock 2.2% | ||||
Financials 2.2% | ||||
Diversified Financials | ||||
Education Lending Group, Inc.* (Cost $2,644,187) | 219,900 | 3,478,818 | ||
Cash Equivalents 8.0% | ||||
Scudder Cash Management QP Trust 1.10% (b) (Cost $12,939,139) | 12,939,140 | 12,939,139 | ||
| % of Net Assets | Value ($) | |||
Total Investment Portfolio (Cost $129,553,885) (a) | 99.3 | 159,506,178 | ||
Other Assets and Liabilities, Net | 0.7 | 1,017,784 | ||
Net Assets | 100.0 | 160,523,962 | ||
| * | Non-income producing security. |
| (a) | The cost for federal income tax purposes was $129,755,156. At March 31, 2004, net unrealized appreciation for all securities based on tax cost was $29,751,022. This consisted of aggregate gross unrealized appreciation for all securities in which there was an excess of value over tax cost of $33,819,681 and aggregate gross unrealized depreciation for all securities in which there was an excess of tax cost over value of $4,068,659. |
| (b) | Scudder Cash Management QP Trust, is also managed by Deutsche Investment Management Americas Inc. The rate shown is the annualized seven-day yield at period end. |
The accompanying notes are an integral part of the financial statements.
51
Table of Contents
Scudder Micro Cap Fund
Statement of Assets and Liabilities as of March 31, 2004 (Unaudited)
Assets | ||||
Investments: | ||||
Investments in securities, at value (cost $116,614,746) | $ | 146,567,039 | ||
Investment in Scudder Cash Management QP Trust (cost $12,939,139) | 12,939,139 | |||
Total investments in securities, at value (cost $129,553,885) | 159,506,178 | |||
Receivable for investments sold | 1,172,675 | |||
Dividends receivable | 48,320 | |||
Interest receivable | 7,860 | |||
Receivable for Fund shares sold | 503,203 | |||
Other assets | 28,333 | |||
Total assets | 161,266,569 | |||
Liabilities |
| |||
Payable for investments purchased | 321,245 | |||
Payable for Fund shares redeemed | 244,334 | |||
Accrued investment advisory fee | 74,617 | |||
Other accrued expenses and payables | 102,411 | |||
Total liabilities | 742,607 | |||
Net assets, at value | $ | 160,523,962 | ||
Net Assets | ||||
Net assets consist of: | ||||
Accumulated net investment loss | (969,811 | ) | ||
Net unrealized appreciation (depreciation) on investments | 29,952,293 | |||
Accumulated net realized gain (loss) | 1,134,467 | |||
Paid-in capital | 130,407,013 | |||
Net assets, at value | $ | 160,523,962 | ||
The accompanying notes are an integral part of the financial statements.
52
Table of Contents
Scudder Micro Cap Fund
Statement of Assets and Liabilities as of March 31, 2004 (Unaudited) (continued)
| Net Asset Value | |||
Class A | |||
Net Asset Value and redemption price per share ($24,748,017 / 1,139,375 shares of capital stock outstanding, $.001 par value, unlimited number of shares authorized) | $ | 21.72 | |
Maximum offering price per share (100 / 94.25 of $21.72) | $ | 23.05 | |
Class B | |||
Net Asset Value, offering and redemption price (subject to contingent deferred sales charge) per share ($5,528,473 / 257,817 shares of capital stock outstanding, $.001 par value, unlimited number of shares authorized) | $ | 21.44 | |
Class C | |||
Net Asset Value, offering and redemption price (subject to contingent deferred sales charge) per share ($14,519,793 / 676,986 shares of capital stock outstanding, $.001 par value, unlimited number of shares authorized) | $ | 21.45 | |
Investment Class | |||
Net Asset Value, offering and redemption price per share ($21,674,395 / 998,535 shares of capital stock outstanding, $.001 par value, unlimited number of shares authorized) | $ | 21.71 | |
Institutional Class | |||
Net Asset Value, offering and redemption price per share ($94,053,284 / 4,268,384 shares of capital stock outstanding, $.001 par value, unlimited number of shares authorized) | $ | 22.03 |
The accompanying notes are an integral part of the financial statements.
53
Table of Contents
Scudder Micro Cap Fund
Statement of Operations for the six months ended March 31, 2004 (Unaudited)
Investment Income | ||||
Dividends | $ | 183,079 | ||
Interest - Scudder Cash Management QP Trust | 35,492 | |||
Interest | 10,579 | |||
Total Income | 229,150 | |||
Expenses: | ||||
Investment advisory fee | 1,077,645 | |||
Administrator service fee | 158,057 | |||
Distribution and shareholder servicing fees | 125,447 | |||
Custody fees | 3,312 | |||
Auditing | 36,490 | |||
Legal | 2,090 | |||
Trustees’ fees and expenses | 3,631 | |||
Reports to shareholders | 7,470 | |||
Registration fees | 45,235 | |||
Other | 1,801 | |||
Total expenses, before expense reductions | 1,461,178 | |||
Expense reductions | (263,591 | ) | ||
Total expenses, after expense reductions | 1,197,587 | |||
Net investment income (loss) | (968,437 | ) | ||
Realized and Unrealized Gain (Loss) on Investment Transactions | ||||
Net realized gain (loss) from investments | 15,944,758 | |||
Net unrealized appreciation (depreciation) during the period on investments | 4,618,142 | |||
Net gain (loss) on investment transactions | 20,562,900 | |||
Net increase (decrease) in net assets resulting from operations | $ | 19,594,463 | ||
The accompanying notes are an integral part of the financial statements.
54
Table of Contents
Scudder Micro Cap Fund
Statement of Changes in Net Assets
Increase (Decrease) in Net Assets | Six Months Ended March 31, 2004 | Year Ended September 30, | ||||||
Operations: | ||||||||
Net investment income (loss) | $ | (968,437 | ) | $ | (852,531 | ) | ||
Net realized gain (loss) on investment transactions | 15,944,758 | (10,409,423 | ) | |||||
Net unrealized appreciation (depreciation) on investment transactions during the period | 4,618,142 | 39,153,860 | ||||||
Net increase (decrease) in net assets resulting from operations | 19,594,463 | 27,891,906 | ||||||
Fund share transactions: | ||||||||
Proceeds from shares sold | 52,264,307 | 62,524,070 | ||||||
Cost of shares redeemed | (27,051,405 | ) | (40,548,787 | ) | ||||
Net increase (decrease) in net assets from Fund share transactions | 25,212,902 | 21,975,283 | ||||||
Increase (decrease) in net assets | 44,807,365 | 49,867,189 | ||||||
Net assets at beginning of period | 115,716,597 | 65,849,408 | ||||||
Net assets at end of period (including accumulated net investment loss of $969,811 and $1,374, respectively) | 160,523,962 | $ | 115,716,597 | |||||
The accompanying notes are an integral part of the financial statements.
55
Table of Contents
Scudder Micro Cap Fund
Class A
Years Ended September 30, | 2004a | 2003 | 2002b | |||||||||
Selected Per Share Data | ||||||||||||
Net asset value, beginning of period | $ | 18.69 | $ | 14.07 | $ | 18.24 | ||||||
Income (loss) from investment operations: | ||||||||||||
Net investment income (loss)c | (.15 | ) | (.18 | ) | .03 | |||||||
Net realized and unrealized gain (loss) on investment transactions | 3.18 | 4.80 | (4.20 | ) | ||||||||
Total from investment operations | 3.03 | 4.62 | (4.17 | ) | ||||||||
Net asset value, end of period | $ | 21.72 | $ | 18.69 | $ | 14.07 | ||||||
Total Return (%)d | 16.21 | ** | 32.84 | (22.86 | )** | |||||||
Ratios to Average Net Assets and Supplemental Data | ||||||||||||
Net assets, end of period ($ millions) | 25 | 11 | .6 | |||||||||
Ratio of expenses before expense reductions (%) | 2.11 | * | 2.16 | 2.22 | * | |||||||
Ratio of expenses after expense reductions (%) | 1.74 | * | 1.74 | 1.74 | * | |||||||
Ratio of net investment income (loss) (%) | (1.42 | )* | (1.09 | ) | .70 | * | ||||||
Portfolio turnover rate (%) | 78 | * | 74 | 66 | ||||||||
| a | For the six months ended March 31, 2004 (Unaudited). |
| b | For the period June 28, 2002 (commencement of operations of Class A shares) to September 30, 2002. |
| c | Based on average shares outstanding during the period. |
| d | Total return would have been lower had certain expenses not been reduced. Total return does not reflect the effect of any sales charges. |
| * | Annualized |
| ** | Not annualized |
56
Table of Contents
Scudder Micro Cap Fund
Class B
Years Ended September 30, | 2004a | 2003 | 2002b | |||||||||
Selected Per Share Data | ||||||||||||
Net asset value, beginning of period | $ | 18.52 | $ | 14.04 | $ | 18.24 | ||||||
Income (loss) from investment operations: | ||||||||||||
Net investment income (loss)c | (.23 | ) | (.30 | ) | (.00 | )d | ||||||
Net realized and unrealized gain (loss) on investment transactions | 3.15 | 4.78 | (4.20 | ) | ||||||||
Total from investment operations | 2.92 | 4.48 | (4.20 | ) | ||||||||
Net asset value, end of period | $ | 21.44 | $ | 18.52 | $ | 14.04 | ||||||
Total Return (%)e | 15.77 | ** | 31.91 | (23.03 | )** | |||||||
Ratios to Average Net Assets and Supplemental Data | ||||||||||||
Net assets, end of period ($ millions) | 6 | 3 | .3 | |||||||||
Ratio of expenses before expense reductions (%) | 2.86 | * | 2.91 | 2.97 | * | |||||||
Ratio of expenses after expense reductions (%) | 2.49 | * | 2.49 | 2.49 | * | |||||||
Ratio of net investment income (loss) (%) | (2.17 | )* | (1.84 | ) | (.05 | )* | ||||||
Portfolio turnover rate (%) | 78 | * | 74 | 66 | ||||||||
| a | For the six months ended March 31, 2004 (Unaudited). |
| b | For the period June 28, 2002 (commencement of operations of Class B shares) to September 30, 2002. |
| c | Based on average shares outstanding during the period. |
| d | Amount is less than $0.005. |
| e | Total return would have been lower had certain expenses not been reduced. Total return does not reflect the effect of any sales charges. |
| * | Annualized |
| ** | Not annualized |
57
Table of Contents
Scudder Micro Cap Fund
Class C
Years Ended September 30, | 2004a | 2003 | 2002b | |||||||||
Selected Per Share Data | ||||||||||||
Net asset value, beginning of period | $ | 18.51 | $ | 14.04 | $ | 18.24 | ||||||
Income (loss) from investment operations: | ||||||||||||
Net investment income (loss)c | (.23 | ) | (.31 | ) | (.00 | )d | ||||||
Net realized and unrealized gain (loss) on investment transactions | 3.17 | 4.78 | (4.20 | ) | ||||||||
Total from investment operations | 2.94 | 4.47 | (4.20 | ) | ||||||||
Net asset value, end of period | $ | 21.45 | $ | 18.51 | $ | 14.04 | ||||||
Total Return (%)e | 15.88 | ** | 31.84 | (23.03 | )** | |||||||
Ratios to Average Net Assets and Supplemental Data | ||||||||||||
Net assets, end of period ($ millions) | 15 | 5 | .3 | |||||||||
Ratio of expenses before expense reductions (%) | 2.86 | * | 2.91 | 2.97 | * | |||||||
Ratio of expenses after expense reductions (%) | 2.49 | * | 2.49 | 2.49 | * | |||||||
Ratio of net investment income (loss) (%) | (2.17 | )* | (1.84 | ) | (.05 | )* | ||||||
Portfolio turnover rate (%) | 78 | * | 74 | 66 | ||||||||
| a | For the six months ended March 31, 2004 (Unaudited). |
| b | For the period June 28, 2002 (commencement of operations of Class C shares) to September 30, 2002. |
| c | Based on average shares outstanding during the period. |
| d | Amount is less than $0.005. |
| e | Total return would have been lower had certain expenses not been reduced. Total return does not reflect the effect of any sales charges. |
| * | Annualized |
| ** | Not annualized |
58
Table of Contents
Scudder Micro Cap Fund
Investment Class
Years Ended September 30, | 2004a | 2003 | 2002 | 2001 | 2000 | 1999b | 1998c | |||||||||||||||||||||
Selected Per Share Data | ||||||||||||||||||||||||||||
Net asset value, beginning of period | $ | 18.67 | $ | 14.06 | $ | 17.05 | $ | 24.36 | $ | 16.12 | $ | 9.88 | $ | 12.62 | ||||||||||||||
Income (loss) from investment operations: | ||||||||||||||||||||||||||||
Net investment income (loss) | (.15 | )d | (.17 | )d | (.18 | )d | (.15 | ) | (.14 | ) | (.14 | ) | (.06 | ) | ||||||||||||||
Net realized and unrealized gain (loss) on investment transactions | 3.19 | 4.78 | (2.81 | ) | (5.33 | ) | 9.79 | 6.38 | (2.19 | ) | ||||||||||||||||||
Total from investment operations | 3.04 | 4.61 | (2.99 | ) | (5.48 | ) | 9.65 | 6.24 | (2.25 | ) | ||||||||||||||||||
Less distributions from: | ||||||||||||||||||||||||||||
Net realized gains on investment transactions | — | — | — | (1.83 | ) | (1.41 | ) | — | (.49 | ) | ||||||||||||||||||
Net asset value, end of period | $ | 21.71 | $ | 18.67 | $ | 14.06 | $ | 17.05 | $ | 24.36 | $ | 16.12 | $ | 9.88 | ||||||||||||||
Total Return (%)e | 16.28 | ** | 32.79 | (17.54 | ) | (22.71 | ) | 63.87 | 63.16 | ** | (18.33 | ) | ||||||||||||||||
Ratios to Average Net Assets and Supplemental Data | ||||||||||||||||||||||||||||
Net assets, end of period ($ millions) | 22 | 18 | 12 | 7 | 5 | 1 | 1 | |||||||||||||||||||||
Ratio of expenses before expense reductions (%) | 2.11 | * | 2.16 | 2.21 | 2.23 | 2.55 | 3.25 | * | 2.68 | |||||||||||||||||||
Ratio of expenses after expense reductions (%) | 1.74 | * | 1.74 | 1.74 | 1.74 | 1.74 | 1.74 | * | 1.74 | |||||||||||||||||||
Ratio of net investment income (loss) (%) | (1.42 | )* | (1.09 | ) | (1.02 | ) | (1.03 | ) | (1.05 | ) | (1.29 | )* | (.98 | ) | ||||||||||||||
Portfolio turnover rate (%) | 78 | * | 74 | 66 | 79 | 137 | 115 | 85 | ||||||||||||||||||||
| a | For the six months ended March 31, 2004 (Unaudited). |
| b | For the eleven months ended September 30, 1999. |
| c | For the year ended October 31, 1998. |
| d | Based on average shares outstanding during the period. |
| e | Total return would have been lower had certain expenses not been reduced. |
| * | Annualized |
| ** | Not annualized |
59
Table of Contents
Scudder Micro Cap Fund
Institutional Class
Years Ended September 30, | 2004a | 2003 | 2002 | 2001 | 2000 | 1999b | 1998c | |||||||||||||||||||||
Selected Per Share Data | ||||||||||||||||||||||||||||
Net asset value, beginning of period | $ | 18.93 | $ | 14.22 | $ | 17.21 | $ | 24.52 | $ | 16.16 | $ | 9.90 | $ | 12.62 | ||||||||||||||
Income (loss) from investment operations: | ||||||||||||||||||||||||||||
Net investment income (loss) | (.13 | )d | (.14 | )d | (.14 | )d | (.13 | ) | (.14 | ) | (.14 | ) | (.05 | ) | ||||||||||||||
Net realized and unrealized gain (loss) on investment transactions | 3.23 | 4.85 | (2.85 | ) | (5.35 | ) | 9.91 | 6.40 | (2.18 | ) | ||||||||||||||||||
Total from investment operations | 3.10 | 4.71 | (2.99 | ) | (5.48 | ) | 9.77 | 6.26 | (2.23 | ) | ||||||||||||||||||
Less distributions from: | ||||||||||||||||||||||||||||
Net realized gains on investment transactions | — | — | — | (1.83 | ) | (1.41 | ) | — | (.49 | ) | ||||||||||||||||||
Net asset value, end of period | $ | 22.03 | $ | 18.93 | $ | 14.22 | $ | 17.21 | $ | 24.52 | $ | 16.16 | $ | 9.90 | ||||||||||||||
Total Return (%)e | 16.38 | ** | 33.12 | (17.37 | ) | (22.55 | ) | 64.49 | 63.23 | ** | (18.16 | ) | ||||||||||||||||
Ratios to Average Net Assets and Supplemental Data | ||||||||||||||||||||||||||||
Net assets, end of period ($ millions) | 94 | 79 | 52 | 33 | 37 | 17 | 14 | |||||||||||||||||||||
Ratio of expenses before expense reductions (%) | 1.86 | * | 1.91 | 1.96 | 1.98 | 2.30 | 3.00 | * | 2.59 | |||||||||||||||||||
Ratio of expenses after expense reductions (%) | 1.49 | * | 1.49 | 1.49 | 1.49 | 1.49 | 1.49 | * | 1.49 | |||||||||||||||||||
Ratio of net investment income (loss) (%) | (1.17 | )* | (.84 | ) | (.77 | ) | (.78 | ) | (.78 | ) | (1.07 | )* | (.75 | ) | ||||||||||||||
Portfolio turnover rate (%) | 78 | * | 74 | 66 | 79 | 137 | 115 | 85 | ||||||||||||||||||||
| a | For the six months ended March 31, 2004 (Unaudited). |
| b | For the eleven months ended September 30, 1999. |
| c | For the year ended October 31, 1998. |
| d | Based on average shares outstanding during the period. |
| e | Total return would have been lower had certain expenses not been reduced. |
| * | Annualized |
| ** | Not annualized |
60
Table of Contents
Notes to Financial Statements (Unaudited)
Scudder Micro Cap Fund
A. Significant Accounting Policies
Micro Cap Fund (“Scudder Micro Cap Fund” or the “Fund”) is a diversified series of Scudder MG Investments Trust (the “Trust”) which is registered under the Investment Company Act of 1940, as amended (the “1940 Act”), as an open-end management investment company organized as a Delaware business trust.
The Fund offers multiple classes of shares which provide investors with different purchase options. Class A shares are offered to investors subject to an initial sales charge. Class B shares are offered without an initial sales charge but are subject to higher ongoing expenses than Class A shares and a contingent deferred sales charge payable upon certain redemptions. Class B shares automatically convert to Class A shares six years after issuance. Class C shares are offered to investors without an initial sales charge and are subject to higher ongoing expenses than Class A shares and a contingent deferred sales charge payable upon certain redemptions within one year of purchase. Prior to March 1, 2004, Class C shares were offered with an initial sales charge. Class C shares do not convert into another class. Investment Class shares are not subject to initial or contingent deferred sales charges. Institutional Class shares are offered to a limited group of investors, are not subject to initial or contingent deferred sales charges and have lower ongoing expenses than other classes.
Investment income, realized and unrealized gains and losses, and certain fund-level expenses and expense reductions, if any, are borne pro rata on the basis of relative net assets by the holders of all classes of shares, except that each class bears certain expenses unique to that class such as distribution fees, service fees and certain other class-specific expenses. Differences in class-level expenses may result in payment of different per share dividends by class. All shares of the Fund have equal rights with respect to voting subject to class-specific arrangements.
The Fund’s financial statements are prepared in accordance with accounting principles generally accepted in the United States of America which require the use of management estimates. Actual results could differ from those estimates. The policies described below are followed consistently by the Fund in the preparation of its financial statements.
Security Valuation. Investments are stated at value determined as of the close of regular trading on the New York Stock Exchange on each day the exchange is open for trading. Equity securities are valued at the most recent sale price or official closing price reported on the exchange (US or foreign) or over-the-counter market on which the security is traded most extensively. Securities for which no sales are reported are valued at the calculated mean between the most recent bid and asked quotations on the relevant market or, if a mean cannot be determined, at the most recent bid quotation.
Money market instruments purchased with an original or remaining maturity of sixty days or less, maturing at par, are valued at amortized cost. Investments in open-end investment companies and Scudder Cash Management QP Trust are valued at their net asset value each business day.
61
Table of Contents
Securities and other assets for which market quotations are not readily available or for which the above valuation procedures are deemed not to reflect fair value are valued in a manner that is intended to reflect their fair value as determined in accordance with procedures approved by the Trustees.
Federal Income Taxes. The Fund’s policy is to comply with the requirements of the Internal Revenue Code, as amended, which are applicable to regulated investment companies, and to distribute all of its taxable income to its shareholders. Accordingly, the Fund paid no federal income taxes and no federal income tax provision was required.
At September 30, 2003 the Fund had a net tax basis capital loss carryforward of approximately $6,650,000 which may be applied against any realized net taxable capital gains of each succeeding year until fully utilized or until September 30, 2010 ($1,687,000) and September 30, 2011 ($4,963,000), the respective expiration dates, whichever occurs first.
In addition, from November 1, 2002 through September 30, 2003, the Fund incurred approximately $7,931,000 of net realized capital losses. As permitted by tax regulations, the Fund intends to elect to defer these losses and treat them as arising in the fiscal year ending September 30, 2004.
Distribution of Income and Gains. Distributions of net investment income, if any, are made annually. Net realized gains from investment transactions, in excess of available capital loss carryforwards, would be taxable to the Fund if not distributed, and, therefore, will be distributed to shareholders at least annually.
The timing and characterization of certain income and capital gains distributions are determined annually in accordance with federal tax regulations which may differ from accounting principles generally accepted in the United States of America. These differences primarily relate to securities sold at a loss. As a result, net investment income (loss) and net realized gain (loss) on investment transactions for a reporting period may differ significantly from distributions during such period. Accordingly, the Fund may periodically make reclassifications among certain of its capital accounts without impacting the net asset value of the Fund.
The tax character of current year distributions, if any, will be determined at the end of the current fiscal year.
Other. Investment transactions are accounted for on a trade date plus one basis for daily net asset value calculations. However, for financial reporting purposes, investment security transactions are reported on trade date. Interest income is recorded on the accrual basis. Dividend income is recorded on the ex-dividend date. Realized gains and losses from investment transactions are recorded on an identified cost basis.
B. Purchases and Sales of Securities
During the six months ended March 31, 2004, purchases and sales of investment securities (excluding short-term investments) aggregated $66,666,005 and $51,368,998, respectively.
C. Related Parties
Scudder Investments is part of Deutsche Asset Management, which is the marketing name in the US for the asset management activities of Deutsche Bank AG. Deutsche Asset Management, Inc. (“DeAM, Inc.” or the “Advisor”), an indirect, wholly owned subsidiary of Deutsche Bank AG, is the Advisor and Administrator for the Fund.
62
Table of Contents
Investment Advisory Agreement. Under the Investment Advisory Agreement the Advisor directs the investments of the Fund in accordance with its investment objectives, policies and restrictions. The Advisor determines the securities, instruments and other contracts relating to investments to be purchased, sold or entered into by the Fund. The investment advisory fee payable under the Investment Advisory Agreement is equal to an annual rate of 1.50% of the Fund’s average daily net assets, computed and accrued daily and payable monthly.
For the six months ended March 31, 2004, the Advisor and Administrator have contractually agreed to waive their fees or reimburse expenses to the extent necessary to maintain the annualized expenses of the classes of the Fund as follows:
Class A | 1.74 | % | |
Class B | 2.49 | % | |
Class C | 2.49 | % | |
Investment Class | 1.74 | % | |
Institutional Class | 1.49 | % |
Accordingly, for the six months ended March 31, 2004, the Advisor waived a portion of its fee pursuant to an Expense Limitation Agreement aggregating $263,591 and the amount imposed aggregated $814,054 which was equivalent to an annualized effective rate of 1.13% of the Fund’s average daily net assets.
Administrator. For its services as Administrator, DeAM, Inc. receives a fee (the “Administrator Service Fee”) of 0.22% of the average daily net assets of the Fund, computed and accrued daily and payable monthly. For the six months ended March 31, 2004, the Administrator Service Fee was $158,057, of which $31,045 is unpaid.
Distribution Agreement. Under the Distribution Agreement, in accordance with Rule 12b-1 under the 1940 Act, Scudder Distributors, Inc. (“SDI”), an affiliate of the Advisor, receives a fee (“Distribution Fee”) of 0.25% of the average daily net assets of the Class A shares and 0.75% of average daily net assets of the Class B and C shares. Pursuant to the agreement, SDI enters into related selling group agreements with various firms at various rates for sales of Class B and C shares. For the six months ended March 31, 2004, the Distribution Fee was as follows:
Distribution Fee | Total Aggregated | Unpaid at March 31, 2004 | ||||
Class A | $ | 22,862 | $ | 4,914 | ||
Class B | 17,622 | 3,578 | ||||
Class C | 39,729 | 9,497 | ||||
| $ | 80,213 | $ | 17,989 | |||
In addition, SDI provides information and administrative services (“Shareholder Servicing Fee”) to Class B, C and Investment Class shareholders at an annual rate of 0.25% of average daily net assets for each such class. SDI in turn has various agreements with financial services firms that provide these services and pays these fees based upon the assets of shareholder accounts the firms service. For the six months ended March 31, 2004, the Shareholder Servicing Fee was as follows:
Shareholder Servicing Fee | Total Aggregated | Unpaid at March 31, 2004 | Effective Rate | ||||||
Class B | $ | 5,874 | $ | 1,119 | .25 | % | |||
Class C | 13,243 | 3,013 | .25 | % | |||||
Investment Class | 26,117 | 37,302 | .25 | % | |||||
| $ | 45,234 | $ | 41,434 | ||||||
63
Table of Contents
Underwriting Agreement and Contingent Deferred Sales Charge. SDI is the principal underwriter for the Fund. Underwriting commissions paid in connection with the distribution of Class A and C shares for the six months ended March 31, 2004 aggregated $7,534 and $72, respectively.
In addition, SDI receives any contingent deferred sales charge (“CDSC”) from Class B share redemptions occurring within six years of purchase and Class C share redemptions occurring within one year of purchase. There is no such charge upon redemption of any share appreciation or reinvested dividends. The CDSC is based on declining rates ranging from 4% to 1% for Class B and 1% for Class C, of the value of the shares redeemed. For the six months ended March 31, 2004, the CDSC for the Fund’s Class B and Class C shares was $1,452 and $987, respectively. A deferred sales charge of up to 1% is assessed on certain redemptions of Class A shares. For the six months ended March 31, 2004, SDI received $21.
Trustees’ Fees and Expenses. As compensation for his or her services, each Independent Trustee receives an aggregate annual fee, plus a fee for each meeting attended (plus reimbursement for reasonable out-of-pocket expenses incurred in connection with his or her attendance at board and committee meetings) from each Fund in the Fund Complex for which he or she serves. In addition, the Chairman of the Fund Complex’s Audit Committee receives an annual fee for his services.
Scudder Cash Management QP Trust. Pursuant to an Exemptive Order issued by the SEC, the Fund may invest in the Scudder Cash Management QP Trust (the “QP Trust”) and other affiliated funds managed by the Advisor. The QP Trust seeks to provide as high a level of current income as is consistent with the preservation of capital and the maintenance of liquidity. The QP Trust does not pay the Advisor a management fee for the affiliated funds’ investments in the QP Trust.
D. Line of Credit
The Fund and several other affiliated funds (the “Participants”) share in a $1.25 billion revolving credit facility administered by J.P. Morgan Chase Bank for temporary or emergency purposes, including the meeting of redemption requests that otherwise might require the untimely disposition of securities. The Participants are charged an annual commitment fee which is allocated, based upon net assets, among each of the Participants. Interest is calculated at the Federal Funds Rate plus 0.5 percent. The Fund may borrow up to a maximum of 33 percent of its net assets under the agreement.
E. Share Transactions
The following table summarizes share and dollar activity in the Fund:
Six Months Ended March 31, 2004 | Year Ended September 30, 2003 | |||||||||||||
| Shares | Dollars | Shares | Dollars | |||||||||||
Shares sold | ||||||||||||||
Class A | 782,737 | $ | 16,621,769 | 580,974 | $ | 9,280,233 | ||||||||
Class B | 103,558 | 2,140,255 | 176,480 | 2,818,390 | ||||||||||
Class C | 486,115 | 10,058,585 | 269,304 | 4,320,522 | ||||||||||
Investment Class | 380,088 | 8,106,405 | 678,872 | 11,349,080 | ||||||||||
Institutional Class | 720,970 | 15,337,293 | 2,203,386 | 34,755,845 | ||||||||||
| $ | 52,264,307 | $ | 62,524,070 | |||||||||||
Shares redeemed | ||||||||||||||
Class A | (227,381 | ) | $ | (4,888,686 | ) | (74,483 | ) | $ | (1,221,233 | ) | ||||
Class B | (21,239 | ) | (452,837 | ) | (19,570 | ) | (309,042 | ) | ||||||
Class C | (69,997 | ) | (1,480,214 | ) | (26,322 | ) | (416,546 | ) | ||||||
Investment Class | (340,175 | ) | (7,222,225 | ) | (561,094 | ) | (9,441,743 | ) | ||||||
Institutional Class | (616,056 | ) | (13,007,443 | ) | (1,726,837 | ) | (29,160,223 | ) | ||||||
| $ | (27,051,405 | ) | $ | (40,548,787 | ) | |||||||||
Net increase (decrease) | ||||||||||||||
Class A | 555,356 | $ | 11,733,083 | 506,491 | $ | 8,059,000 | ||||||||
Class B | 82,319 | 1,687,418 | 156,910 | 2,509,348 | ||||||||||
Class C | 416,118 | 8,578,371 | 242,982 | 3,903,976 | ||||||||||
Investment Class | 39,913 | 884,180 | 117,778 | 1,907,337 | ||||||||||
Institutional Class | 104,914 | 2,329,850 | 476,549 | 5,595,622 | ||||||||||
| $ | 25,212,902 | $ | 21,975,283 | |||||||||||
F. Regulatory Matters and Litigation
Since at least July 2003, federal, state and industry regulators have been conducting ongoing inquiries and investigations (“inquiries”) into the mutual fund industry, and have requested information from numerous mutual fund companies, including Scudder Investments. We are unable to determine what the outcome of these inquiries will be or what the effect, if any, would be on the funds or their advisers. Publicity about mutual fund practices arising from these industry wide inquiries serve as the general basis of a number of private lawsuits against the Scudder Funds. These lawsuits, which previously have been reported in the press, involve purported class action and derivative lawsuits, making various allegations and naming as defendants various persons, including certain Scudder funds, Deutsche Asset Management (“DeAM”) and its affiliates, certain individuals, including in some cases Fund Trustees/Directors, and other parties. DeAM has undertaken to bear all liabilities and expenses incurred by the Scudder funds in connection with these lawsuits, or other lawsuits or regulatory actions that may be filed making allegations similar to these lawsuits regarding fund valuation, market timing, revenue sharing or other subjects of the pending inquiries. Based on currently available information, DeAM believes the likelihood that the pending lawsuits will have a material adverse financial impact on a Scudder fund is remote and such actions are not likely to materially affect its ability to perform under its investment management agreements with the Scudder funds.
64
Table of Contents
For shareholders of Classes A, B, C, Investment and Institutional Classes
| Automated Information Lines | ScudderACCESS (800) 972-3060 | |
| Personalized account information, information on other Scudder funds and services via touchtone telephone and for Classes A, B, and C only, the ability to exchange or redeem shares. | ||
| Web Site | scudder.com | |
| View your account transactions and balances, trade shares, monitor your asset allocation, and change your address, 24 hours a day. Obtain prospectuses and applications, blank forms, interactive worksheets, news about Scudder funds, subscription to fund updates by e-mail, retirement planning information, and more. | ||
| For More Information | (800) 621-1048 | |
| To speak with a Scudder service representative. | ||
| Written Correspondence | Scudder Investments | |
PO Box 219356 Kansas City, MO 64121-9356 | ||
| Proxy Voting | A description of the fund’s policies and procedures for voting proxies for portfolio securities can be found on our Web site - scudder.com (type “proxy voting” in the search field) - or on the SEC’s Web site - www.sec.gov. To obtain a written copy without charge, call us toll free at (800) 621-1048. | |
| Principal Underwriter | If you have questions, comments or complaints, contact: | |
| Scudder Distributors, Inc. | ||
222 South Riverside Plaza Chicago, IL 60606-5808 (800) 621-1148 | ||
For shareholders of Class R
| Automated Information Lines | Scudder Flex Plan Access (800) 532-8411 | |
| 24-hour access to your retirement plan account. | ||
| Web Site | scudder.com | |
| Click “Retirement Plans” to reallocate assets, process transactions and review your funds through our secure online account access. Obtain prospectuses and applications, blank forms, interactive worksheets, news about Scudder funds, subscription to fund updates by e-mail, retirement planning information, and more. | ||
| For More Information | (800) 543-5776 | |
| To speak with a Scudder service representative. | ||
| Written Correspondence | Scudder Retirement Services | |
222 South Riverside Plaza Chicago, IL 60606-5806 | ||
| Proxy Voting | A description of the fund’s policies and procedures for voting proxies for portfolio securities can be found on our Web site - scudder.com (type “proxy voting” in the search field) - or on the SEC’s Web site - www.sec.gov. To obtain a written copy without charge, call us toll free at (800) 543-5776. | |
| Principal Underwriter | If you have questions, comments or complaints, contact: | |
| Scudder Distributors, Inc. | ||
222 South Riverside Plaza Chicago, IL 60606-5808 (800) 621-1148 | ||
| Scudder Mid Cap Fund | Scudder Small Cap Fund | Scudder Micro Cap Fund | ||||||
Class A | Nasdaq Symbol | SMCAX | SSDAX | SMFAX | ||||
| CUSIP Number | 81111R 882 | 81111R 791 | 81116P 634 | |||||
Class B | Nasdaq Symbol | SMCBX | SSDBX | SMFBX | ||||
| CUSIP Number | 81111R 874 | 81111R 783 | 81116P 626 | |||||
Class C | Nasdaq Symbol | SMCCX | SSDCX | SMFCX | ||||
| CUSIP Number | 81111R 866 | 81111R 775 | 81116P 618 | |||||
Class R* | Nasdaq Symbol | SMCRX | SSDRX | N/A | ||||
| CUSIP Number | 81111R 726 | 81111R 718 | N/A | |||||
Investment Class | Nasdaq Symbol | BTCAX | BTSCX | MMFSX | ||||
| CUSIP Number | 81111R 841 | 81111R 767 | 81116P 584 | |||||
Institutional Class | Nasdaq Symbol | BTEAX | N/A | MGMCX | ||||
| CUSIP Number | 81111R 858 | N/A | 81116P 592 |
| * | Scudder Mid Cap Fund Class R shares commenced operations on July 1, 2003. Scudder Small Cap Fund Class R shares commenced operations on October 1, 2003. |
65
Table of Contents
This privacy statement is issued by Deutsche Investment Management Americas Inc., Deutsche Asset Management, Inc., Scudder Distributors, Inc., Scudder Investor Services, Inc., Scudder Trust Company and the Scudder Funds.
We never sell customer lists or individual client information. We consider privacy fundamental to our client relationships and adhere to the policies and practices described below to protect current and former clients’ information. Internal policies are in place to protect confidentiality, while allowing client needs to be served. Only individuals who need to do so in carrying out their job responsibilities may access client information. We maintain physical, electronic and procedural safeguards that comply with federal standards to protect confidentiality. These safeguards extend to all forms of interaction with us, including the Internet.
In the normal course of business, clients give us nonpublic personal information on applications and other forms, on our websites, and through transactions with us or our affiliates. Examples of the nonpublic personal information collected are name, address, Social Security number and transaction and balance information. To be able to serve our clients, certain of this client information is shared with affiliated and nonaffiliated third party service providers such as transfer agents, custodians, and broker-dealers to assist us in processing transactions and servicing your account with us. In addition, we may disclose all of the information we collect to companies that perform marketing services on our behalf or to other financial institutions with which we have joint marketing agreements. The organizations described above that receive client information may only use it for the purpose designated by the Scudder Companies listed above.
We may also disclose nonpublic personal information about you to other parties as required or permitted by law. For example, we are required or we may provide information to government entities or regulatory bodies in response to requests for information or subpoenas, to private litigants in certain circumstances, to law enforcement authorities, or any time we believe it necessary to protect the firm.
Questions on this policy may be sent to:
Scudder Investments
Attention: Correspondence - Chicago
P.O. Box 219415
Kansas City, MO 64121-9415
August 2003
Notes
Notes
[GRAPHIC APPEARS HERE]
66
Table of Contents
[Scudder Investments logo]
Scudder Dynamic
Growth Fund
Annual Report to Shareholders
September 30, 2003
Table of Contents
Contents
Scudder Investments is part of Deutsche Asset Management, which is the marketing name in the US for the asset management activities of Deutsche Bank AG, Deutsche Investment Management Americas Inc., Deutsche Asset Management Inc., Deutsche Asset Management Investment Services Ltd., Deutsche Bank Trust Company Americas and Scudder Trust Company.
This report must be preceded or accompanied by a prospectus. To obtain a prospectus for any of our funds, refer to the Account Management Resources information provided in the back of this booklet. The prospectus contains more complete information, including a description of the risks of investing in the fund, management fees and expenses. Please read it carefully before you invest or send money.
Fund shares are not FDIC-insured and are not deposits or other obligations of, or guaranteed by, any bank. Fund shares involve investment risk, including possible loss of principal.
Table of Contents
Performance Summary September 30, 2003
Average Annual Total Returns* (Unadjusted for Sales Charge)
Scudder Dynamic Growth Fund | 1-Year | 3-Year | 5-Year | 10-Year | ||||||||
Class A | 43.69 | % | -25.35 | % | -4.28 | % | .86 | % | ||||
Class B (a) | 42.70 | % | -26.12 | % | -5.29 | % | -.25 | % | ||||
Class C (a) | 42.86 | % | -26.06 | % | -5.01 | % | -.03 | % | ||||
Russell Midcap Growth Index+ | 38.89 | % | -17.28 | % | 4.49 | % | 8.50 | % | ||||
S&P 500 Index++ | 24.40 | % | -10.13 | % | 1.00 | % | 10.05 | % |
Scudder Dynamic Growth Fund | 1-Year | 3-Year | 5-Year | Life of Class** | ||||||||
Class I*** | 44.44 | % | -25.03 | % | -3.80 | % | .36 | % | ||||
Russell Midcap Growth Index+ | 38.89 | % | -17.28 | % | 4.49 | % | 7.88 | % | ||||
S&P 500 Index++ | 24.40 | % | -10.13 | % | 1.00 | % | 9.35 | % |
Sources: Lipper Inc. and Deutsche Investment Management Americas Inc.
Net Asset Value
| Class A | Class B | Class C | Class I | |||||||||
Net Asset Value: | ||||||||||||
9/30/03 | $ | 2.96 | $ | 2.54 | $ | 2.60 | $ | 3.12 | ||||
9/30/02 | $ | 2.06 | $ | 1.78 | $ | 1.82 | $ | 2.16 | ||||
Class A Lipper Rankings* - Mid-Cap Growth Funds Category
Period | Rank | Number of Funds Tracked | Percentile Ranking | |||||
1-Year | 27 | of | 497 | 6 | ||||
3-Year | 295 | of | 368 | 80 | ||||
5-Year | 221 | of | 233 | 95 | ||||
10-Year | 70 | of | 73 | 95 |
Rankings are historical and do not guarantee future results. Rankings are based on total return unadjusted for sales charges with distributions reinvested. If sales charges had been included, rankings might have been less favorable.
Source: Lipper Inc.
4
Table of Contents
Growth of an Assumed $10,000 Investment(b)* (Adjusted for Sales Charge)
¨ Scudder Dynamic Growth Fund - Class A
¨ Russell Midcap Growth Index+
¨ S&P 500 Index++
[GRAPHIC]
Yearly periods ended September 30
Comparative Results* (Adjusted for Sales Charge)
Scudder Dynamic Growth Fund | 1-Year | 3-Year | 5-Year | 10-Year | ||||||||||||||
Class A(c) | Growth of $10,000 | $ | 13,543 | $ | 3,920 | $ | 7,575 | $ | 10,269 | |||||||||
| Average annual total return | 35.43 | % | -26.81 | % | -5.40 | % | .27 | % | ||||||||||
Class B(c) | Growth of $10,000 | $ | 13,970 | $ | 3,970 | $ | 7,570 | $ | 9,752 | |||||||||
| Average annual total return | 39.70 | % | -26.50 | % | -5.42 | % | -.25 | %(a) | ||||||||||
Class C(c) | Growth of $10,000 | $ | 14,143 | $ | 4,002 | $ | 7,655 | $ | 9,866 | |||||||||
| Average annual total return | 41.43 | % | -26.31 | % | -5.20 | % | -.13 | %(a) | ||||||||||
Russell Midcap Growth Index+ | Growth of $10,000 | $ | 13,889 | $ | 5,661 | $ | 12,455 | $ | 22,609 | |||||||||
| Average annual total return | 38.89 | % | -17.28 | % | 4.49 | % | 8.50 | % | ||||||||||
S&P 500 Index++ | Growth of $10,000 | $ | 12,440 | $ | 7,258 | $ | 10,508 | $ | 26,053 | |||||||||
| Average annual total return | 24.40 | % | -10.13 | % | 1.00 | % | 10.05 | % | ||||||||||
Scudder Dynamic Growth Fund | 1-Year | 3-Year | 5-Year | Life of Class** | ||||||||||||||
Class I*** | Growth of $10,000 | $ | 14,444 | $ | 4,213 | $ | 8,239 | $ | 10,301 | |||||||||
| Average annual total return | 44.44 | % | -25.03 | % | -3.80 | % | .36 | % | ||||||||||
Russell Midcap Growth Index+ | Growth of $10,000 | $ | 13,889 | $ | 5,661 | $ | 12,455 | $ | 18,700 | |||||||||
| Average annual total return | 38.89 | % | -17.28 | % | 4.49 | % | 7.88 | % | ||||||||||
S&P 500 Index++ | Growth of $10,000 | $ | 12,440 | $ | 7,258 | $ | 10,508 | $ | 20,905 | |||||||||
| Average annual total return | 24.40 | % | -10.13 | % | 1.00 | % | 9.35 | % | ||||||||||
The growth of $10,000 is cumulative.
Notes to Performance Summary
| * | Returns and rankings during the 3-, 5- and 10-year periods shown reflect a temporary fee waiver and/or expense reimbursement. Without this waiver/reimbursement, returns and rankings would have been lower. |
| ** | Class I shares commenced operations on July 3, 1995. Index returns begin June 30, 1995. |
| *** | Class I shares are not subject to sales charge |
| a | Returns shown for Class B and C shares for the periods prior to their inception on May 31, 1994 are derived from the historical performance of Class A shares of the Scudder Dynamic Growth Fund during such periods and have been adjusted to reflect the higher gross total annual operating expenses of each specific class. Any difference in expenses will affect performance. |
| b | The Fund’s growth of an assumed $10,000 investment is adjusted for the maximum sales charge of 5.75%. This results in a net initial investment of $9,425. |
| c | Returns shown for Class B and C shares for the periods prior to their inception on May 31, 1994 are derived from the historical performance of Class A shares of the Scudder Dynamic Growth Fund during such periods and have been adjusted to reflect the higher gross total annual operating expenses and the current applicable sales charges of each specific class. Returns for Class A reflect the current maximum initial sales charge of 5.75%. Class B share performance is adjusted for the applicable contingent deferred sales charge (“CDSC”), which is 4% within the first year after purchase, declining to 0% after six years. Returns for Class C reflect an initial sales charge of 1%. Redemptions on Class C shares within one year of purchase may be subject to a CDSC of 1%. Any difference in expenses will affect performance. |
| + | Russell Midcap Growth Index is an unmanaged index that measures the performance of those Russell Midcap companies with higher price-to-book ratios and higher forecasted growth values. The stocks are also members of the Russell 1000 Growth Index. |
| ++ | The Standard & Poor’s (S&P) 500 Index is a capitalization-weighted index of 500 stocks. The index is designed to measure performance of the broad domestic economy through changes in the aggregate market value of 500 stocks representing all major industries. |
Index returns assume reinvestment of dividends and, unlike Fund returns, do not reflect any fees or expenses. It is not possible to invest directly into an index.
All performance is historical, assumes reinvestment of all dividends and capital gains, and is not indicative of future results. Investment return and principal value will fluctuate, so an investor’s shares, when redeemed, may be worth more or less than when purchased. Performance figures do not reflect the deduction of taxes that a shareholder would pay on fund distributions or the redemption of fund shares. Returns and rankings may differ by share class.
Investments in funds involve risk. Some funds have more risk than others. These include funds that allow exposure to or otherwise concentrate investments in certain sectors, geographic regions, security types, market capitalization or foreign securities (e.g., political or economic instability, which can be accentuated in emerging market countries). Please read this fund’s prospectus for specific details regarding its investments and risk profile.
Please call (800) 621-1048 for the Fund’s most up-to-date performance.
5
Table of Contents
Scudder Dynamic Growth Fund: A Team Approach to Investing
Deutsche Investment Management Americas Inc. (“DeIM” or the “Advisor”), which is part of Deutsche Asset Management, is the investment advisor for Scudder Dynamic Growth Fund. DeIM and its predecessors have more than 80 years of experience managing mutual funds and DeIM provides a full range of investment advisory services to institutional and retail clients. DeIM is also responsible for selecting brokers and dealers and for negotiating brokerage commissions and dealer charges.
Deutsche Asset Management is a global asset management organization that offers a wide range of investing expertise and resources. This well-resourced global investment platform brings together a wide variety of experience and investment insight across industries, regions, asset classes and investing styles.
DeIM is an indirect, wholly owned subsidiary of Deutsche Bank AG. Deutsche Bank AG is a major global banking institution that is engaged in a wide range of financial services, including investment management, mutual funds, retail, private and commercial banking, investment banking and insurance.
Portfolio Management Team
Audrey M.T. Jones
CFA, Managing Director of Deutsche Asset Management and Lead Portfolio Manager of the fund.
| • | Joined Deutsche Asset Management in 1986 and the fund in 2002. |
| • | Portfolio manager with a primary focus on the credit sensitive, communications services, energy, process industries and transportation sectors. |
| • | Over 30 years of investment industry experience. |
| • | BBA, Pace University, Lubin School of Business. |
Doris R. Klug
CFA, Director of Deutsche Asset Management and Portfolio Manager of the fund.
| • | Joined Deutsche Asset Management in 2000 and the fund in 2002. |
| • | Portfolio manager with a primary focus on the consumer and capital goods sectors. |
| • | Vice President of Mutual of America from 1993-2000. |
| • | Over 21 years of financial industry experience. |
| • | MBA, New York University, Stern School of Business. |
Samuel A. Dedio
Director of Deutsche Asset Management and Portfolio manager of the fund.
| • | Joined Deutsche Asset Management in 1999 and the fund in 2002. |
| • | Portfolio manager for US small- and mid-cap equity and senior small cap analyst for technology. |
| • | Over 13 years of investment management experience. |
| • | MS, American University, Kogod School of Business. |
6
Table of Contents
On December 1, 2002, Portfolio Managers Audrey M.T. Jones, Doris R. Klug and Samuel A. Dedio assumed responsibility for managing Scudder Dynamic Growth Fund. Below, they review the fund’s performance and the market environment for the 12-month period ended September 30, 2003.
Q: How did Scudder Dynamic Growth Fund perform during its fiscal year?
A: The fund outperformed its benchmark for the 12 months ended September 30, 2003. Scudder Dynamic Growth Fund produced a total return of 43.69% (Class A shares unadjusted for sales charge) for the annual period, outperforming the 38.89% total return of its benchmark, the Russell Midcap Growth Index. The fund’s peer group, the Lipper Mid-Cap Growth Funds category, had an average return of 27.72% for the same time frame.1 The fund’s strong 12-month performance placed it in the sixth percentile of its Lipper category.2 Scudder Dynamic Growth Fund (Class A shares) ranked 27, 295, 221 and 70 for the 1-year, 3-year, 5-year and 10-year periods, respectively, based on total return as of September 30, 2003. There were 497, 368, 233 and 73 funds, respectively, in Lipper’s Mid-Cap Growth Funds category.
| 1 | Source: Lipper Inc. The Lipper Mid-Cap Growth Funds category includes portfolios that invest at least 75% of equity assets in companies with market capitalizations of less than 300% of the dollar-weighted median market capitalization of the middle 1,000 securities of the S&P SuperComposite 1500 Index. These portfolios typically have above-average price-to-earnings ratios and price-to-book ratios compared with the S&P MidCap 400 Index. It is not possible to invest directly in an index or a Lipper category. |
| 2 | Source: Lipper Inc. Rankings are historical and do not guarantee future results. Rankings are based on the fund’s total returns unadjusted for sales charges with distributions reinvested. If sales charges had not been included rankings may have been less favorable. |
Q: What changes did you make to the fund since taking over its management in December?
A: We continued to manage Scudder Dynamic Growth Fund as a stock picker’s fund, building the portfolio on a bottom-up basis. We are dedicated to closely monitoring the entire portfolio of securities and focusing on companies with superior and sustainable growth prospects relative to the overall equity market. Since assuming responsibility for managing the fund, we have maintained the fund’s dynamic growth style while at the same time taking a long-term investment perspective. As of the end of the annual period, the fund was overweight vs. its benchmark index in information technology and consumer staples. The fund was underweight relative to its benchmark in consumer discretionary and financials and had a slightly less-than-index position in health care.
We have also sought to reduce benchmark risk, reduce or eliminate positions in low-confidence securities, add fundamentally sound growth companies and reduce the cash position within the portfolio. In carrying out these strategies, we have reduced the number of stocks in the portfolio. We believe this strategy will allow us to broaden diversification across the growth sectors of the economy while providing a more concentrated, closely monitored portfolio. Based on our quantitative, qualitative and fundamental analyses, we further believe the portfolio is now effectively focused on delivering strong relative performance for our shareholders over a full market cycle.
Q: What were the best and worst stock performers for the fund?
A: The top securities by contribution during the annual period were primarily in the health care and information technology sectors. These included National Semiconductor Corp., Celgene Corp., Biovail Corp., Network Appliance, Inc., Invitrogen Corp., QLogic Corp., Vishay Intertechnology, Inc., Xilinx, Inc., MedImmune, Inc. and Jabil Circuit, Inc. Several of the fund’s disappointments for the 12 months were also in health care and information technology, including DaVita, Inc.,* Copart, Inc.,* THQ, Inc.* IDEC Pharmaceuticals Corp.* and CV Therapeutics, Inc.* Other poor performers included LaBranche & Co., Inc. in financial services and Advance Auto Parts, Inc.* and Men’s Wearhouse, Inc.* in consumer discretionary. Oil and gas company Talisman Energy, Inc.* and aerospace and defense company Precision Castparts Corp.* were also among the fund’s worst stock performers for the 12 months.
| * | As of September 30, 2003, positions were sold. |
Q: How was the fund positioned by sector, and what impact did this have on its results?
A: For the annual period as a whole, the fund’s over- weighting in information technology and underweighting in consumer discretionary boosted relative performance, as did strong stock selection in both of these sectors. Effective stock selection in health care and consumer staples also had a positive impact on fund results. Poor stock selection in financials, materials and utilities as well as an overweighting in consumer staples detracted from performance.
7
Table of Contents
Q: What were the major factors affecting mid-cap US equities during the annual period?
A: As was the case in the last fiscal year, mid-cap stocks, as measured by the S&P MidCap 400 Index, outperformed large-cap stocks, as measured by the S&P 500 index,3 for the 12 months ended September 30, 2003. Still, for the 12-month period, US equities across all capitalizations produced strong double-digit returns. Within the annual period, the mid-cap equity market, like the broader equity markets, saw divergent performance.
| 3 | The unmanaged S&P MidCap 400 Index tracks the stock movement of 400 midsize US companies. The Standard & Poor’s 500 index (S&P 500) is an unmanaged group of large-company stocks. Index returns assume reinvestment of all distributions and do not reflect fees or expenses. It is not possible to invest directly into an index. |
After bottoming in early October 2002, US equities rebounded sharply in the fourth calendar quarter, with the S&P MidCap 400 Index up 5.83%. During October, despite economic indicators that showed dropping retail sales, declining manufacturing activity and a contracting labor market, the US equity markets responded with their best-performing month since March 2000. Within the mid-cap market segment, growth stocks and riskier sectors returned to favor, as investors focused primarily on technology and telecommunications securities. In November, the Federal Reserve Board lowered the targeted federal funds rate by 50 basis points to a new record low of 1.25% in an effort to jump-start an economy that it thought may be decelerating. However, in a move probably meant to quell overreaction to this interest rate cut and to boost confidence about a potential economic recovery, the Federal Reserve Board also shifted from a loosening to a neutral stance. Also boosting the powerful equity rally during these weeks was the release of more tentatively positive economic data. For example, transportation and nondefense capital goods orders increased. Third-quarter gross domestic product (GDP) was revised upward to a stronger-than-expected 4.0%. Consumer confidence rebounded after five months of decline. Even more positive was the fact that business spending for equipment and software increased a strong 6.6% for the month, while consumers continued to take advantage of low interest rates to purchase and refinance homes. As in the prior month, the technology and telecommunications sectors led the equity market advance in November. During December, concerns over a possible conflict with Iraq and rising tensions between North Korea and the United States adversely affected investor and consumer confidence, detracting from equity market performance. Economic data remained generally positive, but the equity markets declined during the month, primarily as a result of the technology sector’s giving back some of its prior two months’ gains.
For the first calendar quarter of 2003, US equities across all market capitalizations declined, with the S&P MidCap 400 Index down 4.44%. Small- and mid-cap stocks, with their lesser liquidity vs. large-cap stocks, were particularly hard hit during the quarter, as the looming war with Iraq led investors to pull money out of the equity markets and shift to more liquid and defensive instruments. Atypically in a declining equity environment, growth stocks outperformed value stocks across the broad equity market. During January, the economy took a backseat in investors’ minds as the nation’s attention was focused on the geopolitical tensions with Iraq and North Korea. In fact, at its January meeting, the Federal Reserve Board indicated that with the prospect of military conflict, monetary policy would have limited impact as an economic stimulus. Rising oil prices, falling consumer spending, and declining consumer and investor sentiment added to the geopolitical concerns in February. US manufacturing contracted in March after four months of expansion, primarily due to higher oil prices and uncertainty regarding near-term consumer spending. Equity markets initially responded favorably to the actual confrontation of coalition troops with the Iraqi military in March, but the markets paused later in the month as expectations of a swift resolution to the war declined.
For the second calendar quarter of 2003, US equities across all market capitalizations rebounded strongly, with the S&P MidCap 400 Index up 17.63%. During April, despite high unemployment, ongoing contraction in the manufacturing sector and dropping retail sales, there were signs of improvement in the economy. Factory orders increased for the third month in a row, with the nondefense capital goods component, an important barometer of business capital spending, on the rise. In addition, with the conclusion of major military operations in Iraq and generally positive corporate earnings announcements, consumer and investor confidence improved. The broad equity markets responded favorably, with the small-cap segment leading the way. In May, economic signals continued to be mixed. Manufacturing activity remained low, but in spite of both adverse weather conditions in most of the nation and a late spring holiday, healthy sales gains were seen in several industries, including electronics, retail and restaurants. The equity markets continued to perform well, with the small-cap segment outperforming its mid-cap and large-cap brethren. In June, the Federal Reserve Board reduced interest rates by 25 basis points. Manufacturing continued to contract, but there was growth in the services segment of the economy. For the quarter as a whole, mid-cap stocks underperformed small-cap stocks but outperformed their large-cap brethren. Within the mid-cap sector, value-oriented stocks outperformed their growth-oriented counterparts.
In the last quarter of the fiscal year, the US equity markets across all capitalizations remained in positive territory, with the S&P MidCap 400 Index up 6.59%. During July and August, most indicators continued to point toward improvement in the US economy. Second-quarter GDP expanded at a 3.3% (revised) rate, fueled by consumer purchases, business investment and an increase in defense spending. The manufacturing sector expanded, and industrial production, specifically in high-technology products, had its best growth rate since September 2000. The services sector of the economy also continued to grow. Corporate earnings announcements were generally positive. However, unemployment remained above 6%, mortgage refinancing activity slowed and consumer confidence declined. Overall, the equity markets responded favorably, with the small-cap segment leading the way. During September, the US equity markets lost some ground, due primarily to concerns regarding the upcoming corporate earnings announcement season, weakness in the US dollar and rising energy prices. As in the previous quarter, mid-cap stocks underperformed small-cap stocks but outperformed their large-cap brethren. Within the mid-cap sector, value-oriented stocks again outperformed their growth-oriented counterparts.
8
Table of Contents
Q: What investment strategies do you intend to pursue in the fund?
A: We continue to seek to invest in fundamentally sound companies with strong balance sheets.
Despite the recent and anticipated high volatility in the stock market, we remain disciplined in our investment process. Our investment strategy continues to:
| • | focus on mid-cap companies with above-average growth prospects selling at reasonable valuations with the potential to be the blue chips of the future |
| • | focus on individual stock selection, with the goal of providing value-added performance relative to the universe of US companies |
| • | use extensive and intensive fundamental research to identify companies with innovation, leading or dominant positions in their niche markets, a high rate of return on invested capital and the ability to finance a major part of future growth from internal sources |
| • | strictly adhere to our sell discipline to reduce exposure to stocks with diminished appreciation potential |
We will continue to monitor economic conditions and their effect on financial markets as we seek capital growth over the long term.
The views expressed in this report reflect those of the portfolio managers only through the end of the period of the report as stated on the cover. The managers’ views are subject to change at any time based on market and other conditions and should not be construed as a recommendation.
9
Table of Contents
Portfolio Summary September 30, 2003
Asset Allocation | 9/30/03 | 9/30/02 | ||||
Common Stocks | 94 | % | 93 | % | ||
Cash Equivalents | 6 | % | 7 | % | ||
| 100 | % | 100 | % | |||
Sector Diversification (Excludes Cash Equivalents) | 9/30/03 | 9/30/02 | ||||
Information Technology | 29 | % | 22 | % | ||
Health Care | 19 | % | 27 | % | ||
Consumer Discretionary | 15 | % | 15 | % | ||
Industrials | 12 | % | 6 | % | ||
Financials | 10 | % | 11 | % | ||
Consumer Staples | 7 | % | 4 | % | ||
Energy | 5 | % | 8 | % | ||
Materials | 2 | % | 5 | % | ||
Telecommunication Services | 1 | % | 1 | % | ||
Utilities | — | 1 | % | |||
| 100 | % | 100 | % | |||
Asset allocation and sector diversification are subject to change.
Ten Largest Equity Holdings at September 30, 2003 (25.8% of Portfolio) | |||
1. Vishay Intertechnology, Inc. | 3.0 | % | |
Manufacturer of electronic components | |||
2. Invitrogen Corp. | 3.0 | % | |
Developer of research kits | |||
3. Chico’s FAS, Inc. | 2.7 | % | |
Seller of women’s clothing and accessories | |||
4. Rowan Companies, Inc. | 2.6 | % | |
Contractor of drilling oil and gas wells | |||
5. NPS Pharmaceuticals, Inc. | 2.5 | % | |
Developer of small molecule drugs | |||
6. Harman International Industries, Inc. | 2.5 | % | |
Manufacturer of high fidelity audio and video components | |||
7. Jabil Circuit, Inc. | 2.4 | % | |
Designer and manufacturer of circuit board assemblies for original equipment manufacturers | |||
8. Celgene Corp. | 2.4 | % | |
Producer of pharmaceuticals | |||
9. Cognos, Inc. | 2.4 | % | |
Manufacturer and distributor of software | |||
10. Investors Financial Services Corp. | 2.3 | % | |
Provider of asset administration services | |||
Portfolio holdings are subject to change.
For more complete details about the fund’s investment portfolio, see page 16. A quarterly Fact Sheet and Portfolio Holdings are available upon request.
10
Table of Contents
Investment Portfolio as of September 30, 2003
| Shares | Value ($) | |||
Common Stocks 93.7% | ||||
Consumer Discretionary 14.4% | ||||
Automobiles 1.0% | ||||
Thor Industries, Inc. | 49,200 | 2,657,784 | ||
Hotels, Restaurants & Leisure 4.0% | ||||
GTECH Holdings Corp. | 124,500 | 5,334,825 | ||
The Cheesecake Factory, Inc.* | 155,100 | 5,609,967 | ||
| 10,944,792 | ||||
Household Durables 2.4% | ||||
Harman International Industries, Inc. | 68,800 | 6,766,480 | ||
Media 2.1% | ||||
Citadel Broadcasting Co.* | 46,300 | 914,888 | ||
Entercom Communications Corp.* | 108,700 | 4,871,934 | ||
| 5,786,822 | ||||
Specialty Retail 3.7% | ||||
Chico’s FAS, Inc.* | 243,400 | 7,457,776 | ||
Regis Corp. | 83,600 | 2,683,560 | ||
| 10,141,336 | ||||
Textiles, Apparel & Luxury Goods 1.2% | ||||
Columbia Sportswear Co.* | 61,100 | 3,223,025 | ||
Consumer Staples 7.0% | ||||
Beverages 1.0% | ||||
Constellation Brands, Inc. “A”* | 93,000 | 2,835,570 | ||
Food & Drug Retailing 4.0% | ||||
Performance Food Group Co.* | 140,000 | 5,699,400 | ||
Whole Foods Market, Inc.* | 98,100 | 5,413,158 | ||
| 11,112,558 | ||||
Food Products 2.0% | ||||
Dean Foods Co.* | 172,600 | 5,355,778 | ||
Energy 4.5% | ||||
Energy Equipment & Services | ||||
BJ Services Co.* | 155,800 | 5,323,686 | ||
Rowan Companies, Inc.* | 287,300 | 7,061,834 | ||
| 12,385,520 | ||||
Financials 9.2% | ||||
Banks 2.3% | ||||
Investors Financial Services Corp. | 199,800 | 6,273,720 | ||
Diversified Financials 6.0% | ||||
Ameritrade Holding Corp.* | 515,500 | 5,799,375 | ||
Chicago Mercantile Exchange | 42,700 | 2,938,187 | ||
Investment Technology Group, Inc.* | 259,400 | 4,975,292 | ||
LaBranche & Co., Inc. | 183,800 | 2,683,480 | ||
| 16,396,334 | ||||
Insurance 0.9% | ||||
Radian Group,Inc. | 56,800 | 2,521,920 | ||
Health Care 17.6% | ||||
Biotechnology 9.9% | ||||
Celgene Corp.* | 154,200 | 6,681,486 | ||
Invitrogen Corp.* | 141,200 | 8,188,188 | ||
Martek Biosciences Corp.* | 107,200 | 5,646,224 | ||
MedImmune, Inc.* | 118,100 | 3,898,481 | ||
Millennium Pharmaceuticals, Inc.* | 177,400 | 2,730,186 | ||
| 27,144,565 | ||||
Health Care Providers & Services 3.6% | ||||
Caremark Rx, Inc.* | 259,100 | 5,855,660 | ||
Lincare Holdings, Inc.* | 109,000 | 3,994,850 | ||
| 9,850,510 | ||||
Pharmaceuticals 4.1% | ||||
Biovail Corp.* | 118,800 | 4,413,420 | ||
NPS Pharmaceuticals, Inc.* | 246,026 | 6,851,824 | ||
| 11,265,244 | ||||
11
Table of Contents
Industrials 10.9% | ||||
Aerospace & Defense 1.7% | ||||
Alliant Techsystems, Inc.* | 95,900 | 4,607,995 | ||
Airlines 3.3% | ||||
SkyWest, Inc. | 187,600 | 3,249,232 | ||
Southwest Airlines Co. | 322,100 | 5,701,170 | ||
| 8,950,402 | ||||
Commercial Services & Supplies 4.1% | ||||
Corinthian Colleges, Inc.* | 91,700 | 5,241,572 | ||
ITT Educational Services, Inc.* | 128,100 | 6,138,552 | ||
| 11,380,124 | ||||
Road & Rail 1.8% | ||||
Swift Transportation Co., Inc.* | 216,800 | 4,919,192 | ||
Information Technology 27.4% | ||||
Communications Equipment 3.2% | ||||
Adaptec, Inc.* | 621,900 | 4,701,564 | ||
Emulex Corp.* | 155,700 | 3,965,679 | ||
| 8,667,243 | ||||
Computers & Peripherals 1.9% | ||||
Network Appliance, Inc.* | 254,000 | 5,214,620 | ||
Electronic Equipment & Instruments 5.4% | ||||
Jabil Circuit, Inc.* | 257,800 | 6,715,690 | ||
Vishay Intertechnology, Inc.* | 470,300 | 8,239,656 | ||
| 14,955,346 | ||||
Semiconductor Equipment & Products 13.3% | ||||
Applied Micro Circuits Corp.* | 1,080,700 | 5,263,009 | ||
Linear Technology Corp. | 139,100 | 4,981,171 | ||
Microchip Technology, Inc. | 142,500 | 3,411,450 | ||
National Semiconductor Corp.* | 162,300 | 5,240,667 | ||
QLogic Corp.* | 53,600 | 2,519,736 | ||
Teradyne, Inc.* | 201,700 | 3,751,620 | ||
Varian Semiconductor Equipment Associates, Inc.* | 163,000 | 6,104,350 | ||
Xilinx, Inc.* | 186,500 | 5,317,115 | ||
| 36,589,118 | ||||
Software 3.6% | ||||
Cognos, Inc.* | 214,300 | 6,647,586 | ||
Take-Two Interactive Software, Inc.* | 98,900 | 3,379,413 | ||
| 10,026,999 | ||||
Materials 1.9% | ||||
Containers & Packaging | ||||
Packaging Corp. of America* | 271,300 | 5,268,646 | ||
Telecommunication Services 0.8% | ||||
Wireless Telecommunication Services | ||||
Nextel Partners, Inc.* | 285,400 | 2,240,390 | ||
Total Common Stocks (Cost $214,567,802) | 257,482,033 | |||
Preferred Stocks 0.1% | ||||
Information Technology 0.1% | ||||
Software | ||||
fusionOne* (c) | 690,608 | 131,216 | ||
Planetweb, Inc. “E”* (c) | 413,603 | 0 | ||
| 131,216 | ||||
Telecommunication Services 0.0% | ||||
Diversified Telecommunication Services | ||||
Convergent Networks, Inc.* (c) | 345,565 | 44,923 | ||
Total Preferred Stocks (Cost $6,000,001) | 176,139 | |||
Cash Equivalents 6.2% | ||||
Scudder Cash Management QP Trust, 1.08% (b) (Cost $17,056,332) | 17,056,332 | 17,056,332 | ||
Total Investment Portfolio - 100.0% (Cost $237,624,135) (a) | 274,714,504 | |||
| * | Non-income producing security. |
| (a) | The cost for federal income tax purposes was $242,682,257. At September 30, 2003, net unrealized appreciation for all securities based on tax cost was $32,032,247. This consisted of aggregate gross unrealized appreciation for all securities in which there was an excess of value over tax cost of $47,472,001 and aggregate gross unrealized depreciation for all securities in which there was an excess of tax cost over value of $15,439,754. |
| (b) | Scudder Cash Management QP Trust is also managed by Deutsche Investment Management Americas Inc. The rate shown is the annualized seven-day yield at period end. |
| (c) | The Fund may purchase securities that are subject to legal or contractual restriction on resale (“restricted securities”). Restricted securities are securities which have not been registered with the Securities and Exchange Commission under the Securities Act of 1933. The Fund may be unable to sell a restricted security and it may be more difficult to determine a market value for a restricted security. Moreover, if adverse market conditions were to develop during the period between the Fund’s decision to sell a restricted security and the point at which the Fund is permitted or able to sell such security, the Fund might obtain a price less favorable than the price that prevailed when it decided to sell. This investment practice, therefore, could have the effect of increasing the level of illiquidity of the Fund. |
Schedule of Restricted Securities
Securities | Acquisition Date | Acquisition Cost ($) | Value ($) | Value as % of Net Assets | ||||
Convergent Networks, Inc. | September 2000 | — | 44,923 | .02 | ||||
fusionOne | October 2000 | 3,750,001 | 131,216 | .05 | ||||
Planetweb, Inc. “E” | September 2000 | 2,250,000 | — | — | ||||
Total Restricted Securities | 176,139 | .07 | ||||||
The accompanying notes are an integral part of the financial statements.
12
Table of Contents
Statement of Assets and Liabilities as of September 30, 2003
Assets | ||||
Investments: Investments in securities, at value (cost $220,567,803) | $ | 257,658,172 | ||
Investment in Scudder Cash Management QP Trust, (cost $17,056,332) | 17,056,332 | |||
Total investments in securities, at value (cost $237,624,135) | 274,714,504 | |||
Cash | 1,127,890 | |||
Receivable for investments sold | 6,475,470 | |||
Dividends receivable | 3,709 | |||
Receivable for Fund shares sold | 145,095 | |||
Total assets | 282,466,668 | |||
Liabilities | ||||
Payable for investments purchased | 19,478,552 | |||
Payable for Fund shares redeemed | 322,300 | |||
Accrued management fee | 205,191 | |||
Other accrued expenses and payables | 200,612 | |||
Total liabilities | 20,206,655 | |||
Net assets, at value | $ | 262,260,013 | ||
Net Assets | ||||
Net assets consist of: Accumulated net investment loss | (21,114 | ) | ||
Net unrealized appreciation (depreciation) on investments | 37,090,369 | |||
Accumulated net realized gain (loss) | (349,125,426 | ) | ||
Paid-in capital | 574,316,184 | |||
Net assets, at value | $ | 262,260,013 | ||
The accompanying notes are an integral part of the financial statements.
13
Table of Contents
Statement of Assets and Liabilities as of September 30, 2003 (continued)
Net Asset Value | |||
Class A Net Asset Value and redemption price per share ($216,549,428 / 73,212,743 outstanding shares of beneficial interest, $.01 par value, unlimited number of shares authorized) | $ | 2.96 | |
Maximum offering price per share (100 / 94.25 of $2.96) | $ | 3.14 | |
Class B Net Asset Value, offering and redemption price (subject to contingent deferred sales charge) per share ($34,549,177 / 13,597,900 outstanding shares of beneficial interest, $.01 par value, unlimited number of shares authorized) | $ | 2.54 | |
Class C Net Asset Value and redemption price (subject to contingent deferred sales charge) per share ($10,911,908 / 4,198,828 outstanding shares of beneficial interest, $.01 par value, unlimited number of shares authorized) | $ | 2.60 | |
Maximum offering price per share (100 / 99 of $2.60) | $ | 2.63 | |
Class I Net Asset Value, offering and redemption price per share ($249,500 / 79,968 outstanding shares of beneficial interest, $.01 par value, unlimited number of shares authorized) | $ | 3.12 |
The accompanying notes are an integral part of the financial statements.
14
Table of Contents
Statement of Operations for the year ended September 30, 2003
Investment Income | ||||
Income: | ||||
Dividends | $ | 443,481 | ||
Interest - Scudder Cash Management QP Trust | 234,176 | |||
Total Income | 677,657 | |||
Expenses: | ||||
Management fee | 1,411,238 | |||
Administrative fee | 919,531 | |||
Distribution service fees | 852,360 | |||
Trustees’ fees and expenses | 31,552 | |||
Other | 4,829 | |||
Total expenses, before expense reductions | 3,219,510 | |||
Expense reductions | (400 | ) | ||
Total expenses, after expense reductions | 3,219,110 | |||
Net investment loss | (2,541,453 | ) | ||
Realized and Unrealized Gain (Loss) on Investment Transactions | ||||
Net realized gain (loss) from investments | (70,009,022 | ) | ||
Net unrealized appreciation (depreciation) during the period on investments | 156,446,777 | |||
Net gain (loss) on investment transactions | 86,437,755 | |||
Net increase (decrease) in net assets resulting from operations | $ | 83,896,302 | ||
The accompanying notes are an integral part of the financial statements.
15
Table of Contents
Statement of Changes in Net Assets
| Years Ended September 30, | ||||||||
| 2003 | 2002 | |||||||
Increase (Decrease) in Net Assets | ||||||||
Operations: | ||||||||
Net investment income (loss) | $ | (2,541,453 | ) | $ | (3,324,525 | ) | ||
Net realized gain (loss) on investment transactions | (70,009,022 | ) | (92,552,604 | ) | ||||
Net unrealized appreciation (depreciation) on investment transactions during the period | 156,446,777 | (3,345,554 | ) | |||||
Net increase (decrease) in net assets resulting from operations | 83,896,302 | (99,222,683 | ) | |||||
Fund share transactions: | ||||||||
Proceeds from shares sold | 41,693,562 | 252,844,693 | ||||||
Cost of shares redeemed | (73,127,815 | ) | (349,676,560 | ) | ||||
Net increase (decrease) in net assets from Fund share transactions | (31,434,253 | ) | (96,831,867 | ) | ||||
Increase (decrease) in net assets | 52,462,049 | (196,054,550 | ) | |||||
Net assets at beginning of period | 209,797,964 | 405,852,514 | ||||||
Net assets at end of period (including accumulated net investment loss of $21,114 and $19,695, respectively) | $ | 262,260,013 | $ | 209,797,964 | ||||
The accompanying notes are an integral part of the financial statements.
16
Table of Contents
Class A
Years Ended September 30, | 2003 | 2002 | 2001 | 2000 | 1999 | |||||||||||||||
Selected Per Share Data | ||||||||||||||||||||
Net asset value, beginning of period | $ | 2.06 | $ | 3.02 | $ | 9.10 | $ | 6.12 | $ | 5.30 | ||||||||||
Income from investment operations: | ||||||||||||||||||||
Net investment income (loss) | (.02 | )a | (.02 | )a | (.03 | ) | (.08 | )a | (.04 | )a | ||||||||||
Net realized and unrealized gain (loss) on investment transactions | .92 | (.94 | ) | (4.73 | ) | 3.42 | 1.27 | |||||||||||||
Total from investment operations | .90 | (.96 | ) | (4.76 | ) | 3.34 | 1.23 | |||||||||||||
Less distributions from: | ||||||||||||||||||||
Net realized gains on investment transactions | — | — | (1.32 | ) | (.36 | ) | (.41 | ) | ||||||||||||
Net asset value, end of period | $ | 2.96 | $ | 2.06 | $ | 3.02 | $ | 9.10 | $ | 6.12 | ||||||||||
Total Return (%)b | 43.69 | (31.79 | )c | (57.42 | )c | 55.94 | 23.91 | |||||||||||||
Ratios to Average Net Assets and Supplemental Data | ||||||||||||||||||||
Net assets, end of period ($ millions) | 217 | 168 | 325 | 821 | 565 | |||||||||||||||
Ratio of expenses before expense reductions (%) | 1.23 | 1.08 | 1.14d | 1.34 | 1.01 | |||||||||||||||
Ratio of expenses after expense reductions (%) | 1.23 | 1.07 | 1.10d | 1.33 | 1.01 | |||||||||||||||
Ratio of net investment income (loss) (%) | (.94 | ) | (.74 | ) | (.67 | ) | (1.02 | ) | (.64 | ) | ||||||||||
Portfolio turnover rate (%) | 134 | 59 | 132 | 156 | 133 | |||||||||||||||
| a | Based on average shares outstanding during the period. |
| b | Total return does not reflect the effect of any sales charges. |
| c | Total return would have been lower had certain expenses not been reduced. |
| d | The ratios of operating expenses excluding costs incurred in connection with a fund complex reorganization before and after expense reductions were 1.11% and 1.10%, respectively. |
17
Table of Contents
Class B
Years Ended September 30, | 2003 | 2002 | 2001 | 2000 | 1999 | |||||||||||||||
Selected Per Share Data | ||||||||||||||||||||
Net asset value, beginning of period | $ | 1.78 | $ | 2.65 | $ | 8.29 | $ | 5.67 | $ | 4.98 | ||||||||||
Income from investment operations: | ||||||||||||||||||||
Net investment income (loss) | (.04 | )a | (.04 | )a | (.08 | ) | (.16 | )a | (.10 | )a | ||||||||||
Net realized and unrealized gain (loss) on investment transactions | .80 | (.83 | ) | (4.24 | ) | 3.14 | 1.20 | |||||||||||||
Total from investment operations | .76 | (.87 | ) | (4.32 | ) | 2.98 | 1.10 | |||||||||||||
Less distributions from: | ||||||||||||||||||||
Net realized gains on investment transactions | — | — | (1.32 | ) | (.36 | ) | (.41 | ) | ||||||||||||
Net asset value, end of period | $ | 2.54 | $ | 1.78 | $ | 2.65 | $ | 8.29 | $ | 5.67 | ||||||||||
Total Return (%)b | 42.70 | (32.83 | ) | (57.94 | ) | 53.95 | 22.78 | |||||||||||||
Ratios to Average Net Assets and Supplemental Data | ||||||||||||||||||||
Net assets, end of period ($ millions) | 35 | 31 | 63 | 186 | 136 | |||||||||||||||
Ratio of expenses before expense reductions (%) | 2.13 | 2.01 | 2.26 | c | 2.51 | 2.28 | ||||||||||||||
Ratio of expenses after expense reductions (%) | 2.13 | 2.01 | 2.25 | c | 2.50 | 2.28 | ||||||||||||||
Ratio of net investment income (loss) (%) | (1.84 | ) | (1.68 | ) | (1.82 | ) | (2.19 | ) | (1.91 | ) | ||||||||||
Portfolio turnover rate (%) | 134 | 59 | 132 | 156 | 133 | |||||||||||||||
| a | Based on average shares outstanding during the period. |
| b | Total return does not reflect the effect of any sales charges. |
| c | The ratios of operating expenses excluding costs incurred in connection with a fund complex reorganization before and after expense reductions were 2.19% and 2.19%, respectively. |
18
Table of Contents
Class C
Years Ended September 30, | 2003 | 2002 | 2001 | 2000 | 1999 | |||||||||||||||
Selected Per Share Data | ||||||||||||||||||||
Net asset value, beginning of period | $ | 1.82 | $ | 2.70 | $ | 8.39 | $ | 5.71 | $ | 5.00 | ||||||||||
Income from investment operations: | ||||||||||||||||||||
Net investment income (loss) | (.04 | )a | (.04 | )a | (.06 | ) | (.13 | )a | (.08 | )a | ||||||||||
Net realized and unrealized gain (loss) on investment transactions | .82 | (.84 | ) | (4.31 | ) | 3.17 | 1.20 | |||||||||||||
Total from investment operations | .78 | (.88 | ) | (4.37 | ) | 3.04 | 1.12 | |||||||||||||
Less distributions from: | ||||||||||||||||||||
Net realized gains on investment transactions | — | — | (1.32 | ) | (.36 | ) | (.41 | ) | ||||||||||||
Net asset value, end of period | $ | 2.60 | $ | 1.82 | $ | 2.70 | $ | 8.39 | $ | 5.71 | ||||||||||
Total Return (%)b | 42.86 | (32.59 | ) | (58.02 | ) | 55.38 | 23.10 | |||||||||||||
Ratios to Average Net Assets and Supplemental Data | ||||||||||||||||||||
Net assets, end of period ($ millions) | 11 | 8 | 11 | 21 | 10 | |||||||||||||||
Ratio of expenses before expense reductions (%) | 2.05 | 1.91 | 1.97 | c | 2.10 | 1.93 | ||||||||||||||
Ratio of expenses after expense reductions (%) | 2.05 | 1.91 | 1.89 | c | 2.10 | 1.93 | ||||||||||||||
Ratio of net investment income (loss) (%) | (1.76 | ) | (1.58 | ) | (1.46 | ) | (1.79 | ) | (1.56 | ) | ||||||||||
Portfolio turnover rate (%) | 134 | 59 | 132 | 156 | 133 | |||||||||||||||
| a | Based on average shares outstanding during the period. |
| b | Total return does not reflect the effect of any sales charges. |
| c | The ratios of operating expenses excluding costs incurred in connection with a fund complex reorganization before and after expense reductions were 1.89% and 1.89%, respectively. |
19
Table of Contents
Class I
Years Ended September 30, | 2003 | 2002 | 2001 | 2000 | 1999 | |||||||||||||||
Selected Per Share Data | ||||||||||||||||||||
Net asset value, beginning of period | $ | 2.16 | $ | 3.16 | $ | 9.38 | $ | 6.27 | $ | 5.39 | ||||||||||
Income from investment operations: | ||||||||||||||||||||
Net investment income (loss) | (.01 | )a | (.01 | )a | (.02 | ) | (.05 | )a | (.01 | )a | ||||||||||
Net realized and unrealized gain (loss) on investment transactions | .97 | (.99 | ) | (4.88 | ) | 3.52 | 1.30 | |||||||||||||
Total from investment operations | .96 | (1.00 | ) | (4.90 | ) | 3.47 | 1.29 | |||||||||||||
Less distributions from: | ||||||||||||||||||||
Net realized gains on investment transactions | — | — | (1.32 | ) | (.36 | ) | (.41 | ) | ||||||||||||
Net asset value, end of period | $ | 3.12 | $ | 2.16 | $ | 3.16 | $ | 9.38 | $ | 6.27 | ||||||||||
Total Return (%) | 44.44 | (31.65 | ) | (57.33 | ) | 56.87 | 24.66 | |||||||||||||
Ratios to Average Net Assets and Supplemental Data | ||||||||||||||||||||
Net assets, end of period ($ millions) | .25 | 3 | 7 | 20 | 12 | |||||||||||||||
Ratio of expenses before expense reductions (%) | .72 | .60 | .71b | .97 | .58 | |||||||||||||||
Ratio of expenses after expense reductions (%) | .72 | .60 | .70b | .96 | .58 | |||||||||||||||
Ratio of net investment income (loss) (%) | (.43 | ) | (.27 | ) | (.27 | ) | (.65 | ) | (.21 | ) | ||||||||||
Portfolio turnover rate (%) | 134 | 59 | 132 | 156 | 133 | |||||||||||||||
| a | Based on average shares outstanding during the period. |
| b | The ratios of operating expenses excluding costs incurred in connection with a fund complex reorganization before and after expense reductions were .70% and .69%, respectively. |
20
Table of Contents
A. Significant Accounting Policies
Scudder Dynamic Growth Fund (the “Fund”) is registered under the Investment Company Act of 1940, as amended (the “1940 Act”), as an open-end, diversified management investment company organized as a Massachusetts business trust.
The Fund offers multiple classes of shares which provide investors with different purchase options. Class A shares are offered to investors subject to an initial sales charge. Class B shares are offered without an initial sales charge but are subject to higher ongoing expenses than Class A shares and a contingent deferred sales charge payable upon certain redemptions. Class B shares automatically convert to Class A shares six years after issuance. Class C shares are offered to investors subject to an initial sales charge and are subject to higher ongoing expenses than Class A shares and a contingent deferred sales charge payable upon certain redemptions within one year of purchase. Prior to February 3, 2003, Class C shares were offered without an initial sales charge. Class C shares do not convert into another class. Class I shares are offered to a limited group of investors, are not subject to initial or contingent deferred sales charges and have lower ongoing expenses than other classes.
Investment income, realized and unrealized gains and losses, and certain fund-level expenses and expense reductions, if any, are borne pro rata on the basis of relative net assets by the holders of all classes of shares, except that each class bears certain expenses unique to that class such as distribution service fees, administrative fees and certain other class-specific expenses. Differences in class-level expenses may result in payment of different per share dividends by class. All shares of the Fund have equal rights with respect to voting subject to class-specific arrangements.
The Fund’s financial statements are prepared in accordance with accounting principles generally accepted in the United States of America which require the use of management estimates. Actual results could differ from those estimates. The policies described below are followed consistently by the Fund in the preparation of its financial statements.
Security Valuation. Investments are stated at value determined as of the close of regular trading on the New York Stock Exchange on each day the exchange is open for trading. Equity securities are valued at the most recent sale price reported on the exchange (US or foreign) or over-the-counter market on which the security is traded most extensively. Securities for which no sales are reported are valued at the calculated mean between the most recent bid and asked quotations on the relevant market or, if a mean cannot be determined, at the most recent bid quotation.
Money market instruments purchased with an original or remaining maturity of sixty days or less, maturing at par, are valued at amortized cost. Investments in open-end investment companies and Scudder Cash Management QP Trust are valued at their net asset value each business day.
Securities and other assets for which market quotations are not readily available or for which the above valuation procedures are deemed not to reflect fair value are valued in a manner that is intended to reflect their fair value as determined in accordance with procedures approved by the Trustees.
21
Table of Contents
Federal Income Taxes. The Fund’s policy is to comply with the requirements of the Internal Revenue Code, as amended, which are applicable to regulated investment companies and to distribute all of its taxable income to its shareholders. Accordingly, the Fund paid no federal income taxes and no federal income tax provision was required.
At September 30, 2003, the Fund had a net tax basis capital loss carryforward of approximately $308,862,000 which may be applied against any realized net taxable capital gains of each succeeding year until fully utilized or until September 30, 2010 ($194,045,000) and September 30, 2011 ($114,817,000), the respective expiration dates, whichever occurs first.
In addition, from November 1, 2002 through September 30, 2003, the Fund incurred approximately $35,206,000 of net realized capital losses. As permitted by tax regulations, the Fund intends to elect to defer these losses and treat them as arising in the fiscal year ended September 30, 2004.
Distribution of Income and Gains. Distributions of net investment income, if any, are made annually. Net realized gains from investment transactions, in excess of available capital loss carryforwards, would be taxable to the Fund if not distributed, and, therefore, will be distributed to shareholders at least annually.
The timing and characterization of certain income and capital gains distributions are determined annually in accordance with federal tax regulations which may differ from accounting principles generally accepted in the United States of America. These differences primarily relate to certain securities sold at a loss. As a result, net investment income (loss) and net realized gain (loss) on investment transactions for a reporting period may differ significantly from distributions during such period. Accordingly, the Fund may periodically make reclassifications among certain of its capital accounts without impacting the net asset value of the Fund.
At September 30, 2003, the Fund’s components of distributable earnings (accumulated losses) on a tax-basis are as follows:
Undistributed ordinary income* | $ | — | ||
Undistributed net long-term capital gains | $ | — | ||
Capital loss carryforwards | $ | (308,862,000 | ) | |
Net unrealized appreciation (depreciation) on investments | $ | 32,032,247 |
| * | For tax purposes short-term capital gains distributions are condidered ordinary income distributions. |
Other. Investment transactions are accounted for on the trade date. Interest income is recorded on the accrual basis. Dividend income is recorded on the ex-dividend date net of foreign withholding taxes. Realized gains and losses from investment transactions are recorded on an identified cost basis.
B. Purchases and Sales of Securities
During the year ended September 30, 2003, purchases and sales of investment securities (excluding short-term investments) aggregated $290,109,864 and $314,638,934, respectively.
22
Table of Contents
C. Related Parties
Management Agreement. Under the Management Agreement with Deutsche Investment Management Americas Inc. (“DeIM” or the “Advisor”), the Advisor directs the investments of the Fund in accordance with its investment objectives, policies and restrictions. The Advisor determines the securities, instruments and other contracts relating to investments to be purchased, sold or entered into by the Fund. In addition to portfolio management services, the Advisor provides certain administrative services in accordance with the Management Agreement. The management fee payable monthly under the Management Agreement is equal to 1/12 of the annual rate of 0.65% of the Fund’s average daily net assets computed and accrued daily, which is then adjusted monthly upward or downward by a maximum of 0.30% based upon the performance for the immediately preceding twelve months of the Class A shares of the Fund as compared to the performance of the Standard & Poor’s 500 Index.
Accordingly, for the year ended September 30, 2003, the fees pursuant to the Management Agreement were as follows:
Base fee | $ | 1,722,708 | ||
Performance adjustment | (311,470 | ) | ||
Total fees | $ | 1,411,238 | ||
Administrative Fee. Under the Administrative Agreement (the “Administrative Agreement”), the Advisor provides or pays others to provide substantially all of the administrative services required by the Fund (other than those provided by the Advisor under its Management Agreement with the Fund, as described above) in exchange for the payment by each class of the Fund of an administrative services fee (the “Administrative Fee”) of 0.375%, 0.525%, 0.425% and 0.10% of average daily net assets for Class A, B, C and I shares, respectively, computed and accrued daily and payable monthly.
Various third-party service providers, some of which are affiliated with the Advisor, provide certain services to the Fund under the Administrative Agreement. Scudder Fund Accounting Corporation, a subsidiary of the Advisor, computes the net asset value for the Fund and maintains the accounting records of the Fund. Scudder Investments Service Company, an affiliate of the Advisor, is the transfer, shareholder service and dividend-paying agent for Class A, B, C and I shares of the Fund. Scudder Trust Company, also an affiliate of the Advisor, provides subaccounting and recordkeeping services for the shareholders in certain retirement and employee benefit plans. These affiliated entities have in turn entered into various agreements with third-party service providers to provide these services. In addition, other service providers, not affiliated with the Advisor, provide certain services (i.e., custody, legal and audit) to the Fund under the Administrative Agreement. The Advisor pays the service providers for the provision of their services to the Fund and pays other Fund expenses, including insurance, registration, printing, postage and other costs. Certain expenses of the Fund will not be borne by the Advisor under the Administrative Agreement, such as taxes, brokerage, interest and extraordinary expenses, and the fees and expenses of the Independent Trustees (including the fees and expenses of their independent counsel). For the year ended September 30, 2003, the Administrative Fee was as follows:
Administrative Fee | Total Aggregated | Unpaid at September 30, 2003 | ||||
Class A | $ | 708,345 | $ | 74,502 | ||
Class B | 170,957 | 12,838 | ||||
Class C | 38,340 | 3,556 | ||||
Class I | 1,889 | 745 | ||||
| $ | 919,531 | $ | 91,641 | |||
The Administrative Agreement between the Advisor and the Fund terminated September 30, 2003 and the Fund will directly bear the cost of those expenses formerly covered under the Administrative Agreement.
Effective October 1, 2003 through September 30, 2005, the Advisor has agreed to contractually waive all or a portion of its management fee and reimburse or pay certain operating expenses of the Fund to the extent necessary to maintain the operating expenses of each class at 1.50% of average daily net assets for Class A, B and C shares, respectively, and 1.00% of average daily net assets for Class I shares (excluding certain expenses such as Rule 12b-1 and/or service fees, trustees and trustee counsel fees, extraordinary expenses, taxes, brokerage and interest).
Distribution Service Agreement. Under the Distribution Service Agreement, in accordance with Rule 12b-1 under the 1940 Act, Scudder Distributors, Inc. (“SDI”), a subsidiary of the Advisor, receives a fee (“Distribution Fee”) of 0.75% of average daily net assets of Class B and C shares. Pursuant to the agreement, SDI enters into related selling group agreements with various firms at various rates for sales of Class B and C shares. For the year ended September 30, 2003, the Distribution Fee was as follows:
Distribution Fee | Total Aggregated | Unpaid at September 30, 2003 | ||||
Class B | $ | 244,121 | $ | 22,878 | ||
Class C | 67,628 | 7,103 | ||||
| $ | 311,749 | $ | 29,981 | |||
23
Table of Contents
In addition, SDI provides information and administrative services (“Service Fee”) to Class A, B and C shareholders at an annual rate of up to 0.25% of average daily net assets for each such class. SDI in turn has various agreements with financial services firms that provide these services and pay these fees based upon the assets of shareholder accounts the firms service. For the year ended September 30, 2003, the Service Fee was as follows:
Service Fee | Total Aggregated | Unpaid at September 30, 2003 | Effective Rate | ||||||
Class A | $ | 442,659 | $ | 48,641 | .23 | % | |||
Class B | 75,398 | 10,937 | .23 | % | |||||
Class C | 22,554 | 2,397 | .25 | % | |||||
| $ | 540,611 | $ | 61,975 | ||||||
Underwriting Agreement and Contingent Deferred Sales Charge. SDI is the principal underwriter for Class A, B and C shares. Underwriting commissions paid in connection with the distribution of Class A and C shares for the year ended September 30, 2003 aggregated $13,622 and $27, respectively.
In addition, SDI receives any contingent deferred sales charge (“CDSC”) from Class B share redemptions occurring within six years of purchase and Class C share redemptions occurring within one year of purchase. There is no such charge upon redemption of any share appreciation or reinvested dividends. The CDSC is based on declining rates ranging from 4% to 1% for Class B and 1% for Class C, of the value of the shares redeemed. For the year ended September 30, 2003, the CDSC for Class B and C shares aggregated $61,122 and $243, respectively. A deferred sales charge of up to 1% is assessed on certain redemptions of Class A shares. For the year ended September 30, 2003, SDI received $28.
Trustees’ Fees and Expenses. The Fund pays each Trustee not affiliated with the Advisor retainer fees plus specified amounts for attended board and committee meetings.
Scudder Cash Management QP Trust. Pursuant to an Exemptive Order issued by the SEC, the Fund may invest in the Scudder Cash Management QP Trust (the “QP Trust”), and other affiliated funds managed by the Advisor. The QP Trust seeks to provide as high a level of current income as is consistent with the preservation of capital and the maintenance of liquidity. The QP Trust does not pay the Advisor a management fee for the affiliated funds’ investments in the QP Trust.
D. Expense Off-Set Arrangement
The Fund has entered into an arrangement with its custodian whereby credits realized as a result of uninvested cash balances were used to reduce a portion of the Fund’s custodian expenses. During the year ended September 30, 2003, pursuant to the Administrative Agreement, the Administrative Fee was reduced by $400 for custodian credits earned.
24
Table of Contents
E. Line of Credit
The Fund and several other affiliated Funds (the “Participants”) share in a $1.25 billion revolving credit facility administered by J.P. Morgan Chase Bank for temporary or emergency purposes, including the meeting of redemption requests that otherwise might require the untimely disposition of securities. The Participants are charged an annual commitment fee which is allocated, pro rata based upon net assets, among each of the Participants. Interest is calculated at the Federal Funds Rate plus 0.5 percent. The Fund may borrow up to a maximum of 33 percent of its net assets under the agreement.
F. Share Transactions
The following table summarizes share and dollar activity in the Fund:
Year Ended September 30, 2003 | Year Ended September 30, 2002 | |||||||||||||
| Shares | Dollars | Shares | Dollars | |||||||||||
Shares sold | ||||||||||||||
Class A | 10,750,826 | $ | 26,396,706 | 65,930,232 | $ | 227,153,163 | ||||||||
Class B | 5,024,492 | 10,647,555 | 5,382,936 | 14,489,319 | ||||||||||
Class C | 1,725,147 | 3,731,260 | 2,030,390 | 5,674,744 | ||||||||||
Class I | 391,412 | 918,041 | 1,809,837 | 5,527,467 | ||||||||||
| $ | 41,693,562 | $ | 252,844,693 | |||||||||||
Shares redeemed | ||||||||||||||
Class A | (19,216,790 | ) | $ | (46,569,104 | ) | (91,738,076 | ) | $ | (305,222,086 | ) | ||||
Class B | (8,766,669 | ) | (18,394,412 | ) | (11,827,007 | ) | (31,629,506 | ) | ||||||
Class C | (1,670,737 | ) | (3,570,247 | ) | (1,823,314 | ) | (5,074,696 | ) | ||||||
Class I | (1,914,302 | ) | (4,594,052 | ) | (2,489,794 | ) | (7,750,272 | ) | ||||||
| $ | (73,127,815 | ) | $ | (349,676,560 | ) | |||||||||
Net increase (decrease) | ||||||||||||||
Class A | (8,465,964 | ) | $ | (20,172,398 | ) | (25,807,844 | ) | $ | (78,068,923 | ) | ||||
Class B | (3,742,177 | ) | (7,746,857 | ) | (6,444,071 | ) | (17,140,187 | ) | ||||||
Class C | 54,410 | 161,013 | 207,076 | 600,048 | ||||||||||
Class I | (1,522,890 | ) | (3,676,011 | ) | (679,957 | ) | (2,222,805 | ) | ||||||
| $ | (31,434,253 | ) | $ | (96,831,867 | ) | |||||||||
25
Table of Contents
Independent Auditors
To the Board of Trustees and Shareholders of Scudder Dynamic Growth Fund:
We have audited the accompanying statement of assets and liabilities, including the investment portfolio, of Scudder Dynamic Growth Fund, (the “Fund”), as of September 30, 2003, and the related statement of operations for the year then ended, the statements of changes in net assets for each of the two years in the period then ended and the financial highlights for the five years in the period then ended. These financial statements and the financial highlights are the responsibility of the Fund’s management. Our responsibility is to express an opinion on these financial statements and financial highlights based on our audits.
We conducted our audits in accordance with auditing standards generally accepted in the United States. Those standards require that we plan and perform the audit to obtain reasonable assurance about whether the financial statements and financial highlights are free of material misstatement. An audit includes examining, on a test basis, evidence supporting the amounts and disclosures in the financial statements and financial highlights. Our procedures included confirmation of investments owned as of September 30, 2003, by correspondence with the custodian and brokers or other appropriate auditing procedures where replies from brokers were not received. An audit also includes assessing the accounting principles used and significant estimates made by management, as well as evaluating the overall financial statement presentation. We believe that our audits provide a reasonable basis for our opinion.
In our opinion, the financial statements and financial highlights referred to above present fairly, in all material respects, the financial position of the Scudder Dynamic Growth Fund at September 30, 2003, the results of its operations for the year then ended, the changes in its net assets for each of the two years in the period then ended and the financial highlights for the five years in the period then ended, in conformity with accounting principles generally accepted in the United States.
Boston, Massachusetts November 14, 2003 | /s/ Ernst & Young LLP |
26
Table of Contents
Please consult a tax advisor if you have questions about federal or state income tax laws, or on how to prepare your tax returns. If you have specific questions about your account, please call 1-800-SCUDDER.
The following table presents certain information regarding the Trustees and Officers of the fund as of September 30, 2003. Each individual’s age is set forth in parentheses after his or her name. Unless otherwise noted, (i) each individual has engaged in the principal occupation(s) noted in the table for at least the most recent five years, although not necessarily in the same capacity, and (ii) the address of each individual is c/o Deutsche Asset Management, 222 South Riverside Plaza, Chicago, Illinois, 60606. Each Trustee’s term of office extends until the next shareholder’s meeting called for the purpose of electing Trustees and until the election and qualification of a successor, or until such Trustee sooner dies, resigns or is removed as provided in the governing documents of the fund.
| Independent Trustees | ||||
Name, Age, | Principal Occupation(s) During Past 5 Years and Other Directorships Held | Number of Funds in Fund Complex Overseen | ||
John W. Ballantine (57) Trustee, 1999-present | Retired; formerly, Executive Vice President and Chief Risk Management Officer, First Chicago NBD Corporation/The First National Bank of Chicago (1996-1998); Executive Vice President and Head of International Banking (1995-1996). Directorships: Enron Corporation (energy trading firm) (effective May 30, 2002); First Oak Brook Bancshares, Inc.; Oak Brook Bank; Tokheim Corporation (designer, manufacturer and servicer of electronic and mechanical petroleum marketing systems); American Healthways, Inc. (provider of disease and care management services). | 82 | ||
Lewis A. Burnham (70) Trustee, 1977-present | Retired; formerly, Director of Management Consulting, McNulty & Company (1990-1998); prior thereto, Executive Vice President, Anchor Glass Container Corporation. | 82 | ||
Donald L. Dunaway (66) Trustee, 1980-present | Retired; formerly, Executive Vice President, A.O. Smith Corporation (diversified manufacturer) (1963-1994). | 82 | ||
James R. Edgar (57) Trustee, 1999-present | Distinguished Fellow, University of Illinois, Institute of Government and Public Affairs (1999-present); formerly, Governor, State of Illinois (1991-1999). Directorships: Kemper Insurance Companies; John B. Sanfilippo & Son, Inc. (processor/packager/marketer of nuts, snacks and candy products); Horizon Group Properties, Inc.; Youbet.com (online wagering platform); Alberto-Culver Company (manufactures, distributes and markets health and beauty-care products). | 82 | ||
Paul K. Freeman (53) Trustee, 2002-present | President, Cook Street Holdings (consulting); Adjunct Professor, University of Denver; Consultant, World Bank/Inter-American Development Bank; formerly, Project Leader, International Institute for Applied Systems Analysis (1998-2001); Chief Executive Officer, The Eric Group, Inc. (environmental insurance) (1986-1998). | 82 | ||
Robert B. Hoffman (66) Trustee, 1981-present | Retired; formerly, Chairman, Harnischfeger Industries, Inc. (machinery for the mining and paper industries) (1999-2000); prior thereto, Vice Chairman and Chief Financial Officer, Monsanto Company (agricultural, pharmaceutical and nutritional/food products) (1994-1999). | 82 | ||
Shirley D. Peterson (62) Trustee, 1995-present | Retired; formerly, President, Hood College (1995-2000); prior thereto, Partner, Steptoe & Johnson (law firm); Commissioner, Internal Revenue Service; Assistant Attorney General (Tax), US Department of Justice. Directorships: Bethlehem Steel Corp.; Federal Mogul Corp. (supplier of automotive components and subsystems); Trustee, Bryn Mawr College. | 82 | ||
Fred B. Renwick (73) Trustee, 1988-present | Retired; Professor Emeritus of Finance, New York University, Stern School of Business (2001-present); formerly, Professor, New York University Stern School of Business (1965-2001). Directorships: The Wartburg Foundation; Chairman, Finance Committee of Morehouse College Board of Trustees; formerly, Director of Board of Pensions, Evangelical Lutheran Church in America; member of the Investment Committee of Atlanta University Board of Trustees; Chair of the Investment Committee, American Bible Society Board of Trustees. | 82 | ||
William P. Sommers (70) Trustee, 1979-present5 | Retired; formerly, President and Chief Executive Officer, SRI International (research and development) (1994-1998); prior thereto, Executive Vice President, lameter (medical information and educational service provider); Senior Vice President and Director, Booz, Allen & Hamilton Inc. (management consulting firm). Directorships: PSI Inc. (satellite engineering and components); Evergreen Solar, Inc. (develop/manufacture solar electric system engines); H2 Gen (manufacture hydrogen generators); Zassi Medical Evolutions, Inc. (specialists in intellectual property opportunities in medical device arena); Guckenheimer Enterprises (executive food services). | 82 | ||
John G. Weithers (70) Trustee, 1993-present | Retired; formerly, Chairman of the Board and Chief Executive Officer, Chicago Stock Exchange. Directorships: Federal Life Insurance Company; Chairman of the Members of the Corporation and Trustee, DePaul University; formerly, International Federation of Stock Exchanges; Records Management Systems. | 82 | ||
27
Table of Contents
Interested Trustees and Officers2
Name, Age, | Principal Occupation(s) During Past 5 Years and Other Directorships Held | Number of Funds in Fund Complex Overseen | ||
Richard T. Hale3 (58) Chairman and Trustee, 2002-present President, 2003-present | Managing Director, Deutsche Investment Management Americas Inc. (2003-present); Managing Director, Deutsche Bank Securities Inc. (formerly Deutsche Banc Alex. Brown Inc.) and Deutsche Asset Management (1999 to present); Director and President, Investment Company Capital Corp. (registered investment advisor) (1996 to present); Director, Deutsche Global Funds, Ltd. (2000 to present), CABEI Fund (2000 to present), North American Income Fund (2000 to present) (registered investment companies); Director, Scudder Global Opportunities Fund (since 2003); Director/Officer Deutsche/Scudder Mutual Funds (various dates); President, Montgomery Street Income Securities, Inc. (2002 to present) (registered investment companies); Vice President, Deutsche Asset Management, Inc. (2000 to present); formerly, Director, ISI Family of Funds (registered investment companies; 4 funds overseen) (1992-1999) | 201 | ||
Philip J. Collora (57) Vice President and Assistant Secretary, 1986-present | Director, Deutsche Asset Management | n/a | ||
Daniel O. Hirsch3 (49) Vice President and Assistant Secretary, 2002-present | Managing Director, Deutsche Asset Management (2002-present) and Director, Deutsche Global Funds Ltd. (2002-present); formerly, Director, Deutsche Asset Management (1999-2002); Principal, BT Alex. Brown Incorporated (now Deutsche Bank Securities Inc.) (1998-1999); Assistant General Counsel, United States Securities and Exchange Commission (1993-1998) | n/a | ||
Audrey M.T. Jones (58) Vice President, 2003-present | Managing Director, Deutsche Asset Management | n/a | ||
Kenneth Murphy4 (39) Vice President, 2002-present | Vice President, Deutsche Asset Management (2000-present); Vice President, Scudder Distributors, Inc. (December 2002-present); formerly, Director, John Hancock Signature Services (1992-2000) | n/a | ||
Charles A. Rizzo4 (46) Treasurer, 2002-present | Director, Deutsche Asset Management (April 2000-present). Formerly, Vice President and Department Head, BT Alex. Brown Incorporated (now Deutsche Bank Securities Inc.) (1998-1999); Senior Manager, Coopers & Lybrand L.L.P. (now PricewaterhouseCoopers LLP) (1993-1998) | n/a | ||
Salvatore Schiavone4 (37) Assistant Treasurer, 2003-present | Director, Deutsche Asset Management | n/a | ||
Lucinda H. Stebbins4 (57) Assistant Treasurer, 2003-present | Director, Deutsche Asset Management | n/a | ||
Kathleen Sullivan D’Eramo4 (46) Assistant Treasurer, 2003-present | Director, Deutsche Asset Management | n/a | ||
John Millette4 (41) Secretary, 2001-present | Director, Deutsche Asset Management | n/a | ||
Lisa Hertz3 (33) Assistant Secretary, 2003-present | Assistant Vice President, Deutsche Asset Management | n/a | ||
Caroline Pearson4 (41) Assistant Secretary, 1998-present | Managing Director, Deutsche Asset Management | n/a | ||
| 1 | Length of time served represents the date that each Trustee was first elected to the common board of trustees which oversees a number of investment companies, including the fund, managed by the Advisor. For the Officers of the fund, length of time served represents the date that each Officer was first elected to serve as an officer of any fund overseen by the aforementioned common board of trustees. |
| 2 | As a result of their respective positions held with the Advisor, these individuals are considered “interested persons” of the Advisor within the meaning of the 1940 Act, as amended. Interested persons receive no compensation from the fund. |
| 3 | Address: One South Street, Baltimore, Maryland |
| 4 | Address: Two International Place, Boston, Massachusetts |
| 5 | Mr. Sommers has taken a leave of absence from the fund’s Board until December 31, 2003. |
The fund’s Statement of Additional Information (“SAI”) includes additional information about the Trustees. The SAI is available, without charge, upon request. If you would like to request a copy of the SAI, you may do so by calling the following toll-free number: 1-800-621-1048.
28
Table of Contents
Scudder Funds
Growth Funds
Scudder 21st Century Growth Fund
Scudder Aggressive Growth Fund
Scudder Blue Chip Fund
Scudder Capital Growth Fund
Scudder Development Fund
Scudder Dynamic Growth Fund
Scudder Flag Investors
Communications Fund
Scudder Gold & Precious Metals Fund
Scudder Global Biotechnology Fund
Scudder Growth Fund
Scudder Health Care Fund
Scudder Large Company Growth Fund
Scudder Micro Cap Fund
Scudder Mid Cap Fund
Scudder Small Cap Fund
Scudder Strategic Growth Fund
Scudder Technology Fund
Scudder Technology Innovation Fund
Scudder Top 50 US Fund
29
Table of Contents
Value Funds
Scudder Contrarian Fund
Scudder-Dreman Financial Services Fund
Scudder-Dreman High Return Equity Fund
Scudder-Dreman Small Cap Value Fund
Scudder Flag Investors Equity
Partners Fund
Scudder Growth and Income Fund
Scudder Large Company Value Fund
Scudder-RREEF Real Estate Securities Fund
Scudder Small Company Stock Fund
Scudder Small Company Value Fund
Scudder Tax Advantaged Dividend Fund
Multicategory/Asset Allocation Funds
Scudder Balanced Fund
Scudder Flag Investors Value Builder Fund
Scudder Focus Value+Growth Fund
Scudder Lifecycle Mid Range Fund
Scudder Lifecycle Long Range Fund
Scudder Lifecycle Short Range Fund
Scudder Pathway Conservative Portfolio
Scudder Pathway Growth Portfolio
Scudder Pathway Moderate Portfolio
Scudder Target 2013 Fund
Scudder Total Return Fund
International/Global Funds
Scudder Emerging Markets Growth Fund
Scudder Emerging Markets Income Fund
Scudder European Equity Fund
Scudder Global Fund
Scudder Global Bond Fund
Scudder Global Discovery Fund
Scudder Greater Europe Growth Fund
Scudder International Fund
Scudder International Equity Fund
Scudder International Select Equity Fund
Scudder Japanese Equity Fund
Scudder Latin America Fund
Scudder New Europe Fund
Scudder Pacific Opportunities Fund
Income Funds
Scudder Cash Reserves Fund
Scudder Fixed Income Fund
Scudder GNMA Fund
Scudder High Income Plus Fund (formerly Deutsche High Yield Bond Fund)
Scudder High Income Fund (formerly Scudder High Yield Fund)
Scudder High Income Opportunity Fund (formerly Scudder High Yield Opportunity Fund)
Scudder Income Fund
Scudder PreservationPlus Fund
Scudder PreservationPlus Income Fund
Scudder Short Duration Fund (formerly Scudder Short-Term Fixed Income Fund)
Scudder Short-Term Bond Fund
Scudder Strategic Income Fund
Scudder U.S. Government Securities Fund
30
Table of Contents
Scudder Funds (continued)
Tax-Free Income Funds
Scudder California Tax-Free Income Fund
Scudder Florida Tax-Free Income Fund
Scudder High Yield Tax-Free Fund
Scudder Intermediate Tax/AMT Free Fund (formerly Scudder Medium Term Tax-Free Fund)
Scudder Managed Municipal Bond Fund
Scudder Massachusetts Tax-Free Fund
Scudder Municipal Bond Fund
Scudder New York Tax-Free Income Fund
Scudder Short-Term Municipal Bond Fund
Index-Related Funds
Scudder EAFE ® Equity Index Fund
Scudder Equity 500 Index Fund
Scudder S&P 500 Index Fund
Scudder S&P 500 Stock Fund
Scudder Select 500 Fund
Scudder US Bond Index Fund
Money Market
A large number of money market funds are available through Scudder Investments.
Retirement Programs and Education Accounts
Retirement Programs
Traditional IRA
Roth IRA
SEP-IRA
Inherited IRA
Keogh Plan
401(k), 403(b) Plans
Variable Annuities
Education Accounts
Coverdell Education Savings Account
UGMA/UTMA
IRA for Minors
31
Table of Contents
Closed-End Funds
The Brazil Fund, Inc.
The Korea Fund, Inc.
Montgomery Street Income Securities, Inc.
Scudder Global High Income Fund, Inc.
Scudder New Asia Fund, Inc.
Scudder High Income Trust
Scudder Intermediate Government Trust
Scudder Multi-Market Income Trust
Scudder Municipal Income Trust
Scudder RREEF Real Estate Fund, Inc.
Scudder RREEF Real Estate Fund II, Inc.
Scudder Strategic Income Trust
Scudder Strategic Municipal Income Trust
The Central Europe and Russia Fund, Inc. (formerly The Central European Equity Fund, Inc.)
The Germany Fund, Inc.
The New Germany Fund, Inc.
Not all funds are available in all share classes.
Scudder open-end funds are offered by prospectus only. For more complete information on any fund or variable annuity registered in your state, including information about a fund’s objectives, strategies, risks, advisory fees, distribution charges, and other expenses, please order a free prospectus. Read the prospectus before investing in any fund to ensure the fund is appropriate for your goals and risk tolerance.
A money market mutual fund investment is not insured or guaranteed by the Federal Deposit Insurance Corporation or any other government agency. Although a money market mutual fund seeks to preserve the value of your investment at $1 per share, it is possible to lose money by investing in such a fund.
The products described should not be considered a solicitation to buy or an offer to sell a security to any person in any jurisdiction where such offer, solicitation, purchase, or sale would be unlawful under the securities laws of such jurisdiction.
32
Table of Contents
Automated
Information Lines | ScudderACCESS (800) 972-3060
Personalized account information, information on other Scudder funds and services via touchtone telephone and for Classes A, B, and C only, the ability to exchange or redeem shares. | |||||
| Web Site | scudder.com
View your account transactions and balances, trade shares, monitor your asset allocation, and change your address, 24 hours a day. Obtain prospectuses and applications, blank forms, interactive worksheets, news about Scudder funds, subscription to fund updates by e-mail, retirement planning information, and more. | |||||
For More
Information | (800) 621-1048
To speak with a Scudder service representative. | |||||
Written
Correspondence | Scudder Investments
PO Box 219356 Kansas City, MO 64121-9356 | |||||
| Proxy Voting | A description of the fund’s policies and procedures for voting proxies for portfolio securities can be found on our Web site - scudder.com (type “proxy voting” in the search field) - or on the SEC’s Web site - www.sec.gov. To obtain a written copy without charge, call us toll free at (800) 621-1048. | |||||
Principal
Underwriter | If you have questions, comments or complaints, contact:
Scudder Distributors, Inc.
222 South Riverside Plaza Chicago, IL 60606-5808 (800) 621-1148 | |||||
Class A | Class B | Class C | ||||
Nasdaq Symbol | KSCAX | KSCBX | KSCCX | |||
CUSIP Number | 81114R-103 | 81114R-202 | 81114R-301 | |||
Fund Number | 004 | 204 | 304 |
Notes
Notes
Notes
Notes
Notes
[GRAPHIC ]
33
Table of Contents
[Scudder Investments logo]
Scudder Dynamic Growth Fund
Semiannual Report to Shareholders
March 31, 2004
Contents
| 3 | ||
| 8 | ||
| 9 | ||
| 11 | ||
| 15 | ||
| 19 | ||
| 25 | ||
| 26 | ||
This report must be preceded or accompanied by a prospectus. To obtain a prospectus for any of our funds, refer to the Account Management Resources information provided in the back of this booklet. We advise you to consider the fund’s objectives, risks, charges and expenses carefully before investing. The prospectus contains this and other important information about the fund. Please read the prospectus carefully before you invest.
Investments in mutual funds involve risk. Some funds have more risk than others. This fund is subject to stock market risk. Stocks of small- to medium-sized companies involve greater risk than securities of larger, more established companies, as they often have limited product lines, markets or financial resources and may be more sensitive to erratic and abrupt market movements than securities of larger, more-established companies. Additionally, the fund may focus its investments on certain industry sectors, thereby increasing its vulnerability to any single industry or regulatory development. All of these factors may result in greater share price volatility. Please read this fund’s prospectus for specific details regarding its investments and risk profile.
Scudder Investments is part of Deutsche Asset Management, which is the marketing name in the US for the asset management activities of Deutsche Bank AG, Deutsche Investment Management Americas Inc., Deutsche Asset Management Inc., Deutsche Asset Management Investment Services Ltd., Deutsche Bank Trust Company Americas and Scudder Trust Company.
Fund shares are not FDIC-insured and are not deposits or other obligations of, or guaranteed by, any bank. Fund shares involve investment risk, including possible loss of principal.
2
Table of Contents
Performance Summary March 31, 2004
All performance shown is historical, assumes reinvestment of all dividends and capital gains, and does not guarantee future results. Investment return and principal value fluctuate with changing market conditions so that, when redeemed, shares may be worth more or less than their original cost. Current performance may be lower or higher than the performance quoted. Please visit scudder.com for the product’s most recent month-end performance.
The maximum sales charge for Class A shares is 5.75%. For Class B shares, the maximum contingent deferred sales charge (CDSC) is 4% within the first year after purchase, declining to 0% after six years. Class C shares have no adjustment for front-end sales charges but redemptions within one year of purchase may be subject to a CDSC of 1%. Unadjusted returns do not reflect sales charges and would have been lower if they had. Class I shares are not subject to sales charges.
Returns and rankings during all periods shown for Class B, C and I and for the 3-, 5- and 10-year periods shown for Class A reflect a temporary fee waiver and/or expense reimbursement. Without this waiver/reimbursement, returns and rankings would have been lower.
Performance figures do not reflect the deduction of taxes that a shareholder would pay on fund distributions or the sale of fund shares. Returns and rankings may differ by share class.
Returns shown for Class B and C shares for the periods prior to their inception on May 31, 1994 are derived from the historical performance of Class A shares of the Scudder Dynamic Growth Fund during such periods and have been adjusted to reflect the higher gross total annual operating expenses of each specific class. Any difference in expenses will affect performance.
Average Annual Total Returns (Unadjusted for Sales Charge) as of 3/31/04
Scudder Dynamic Growth Fund | 6-Month++ | 1-Year | 3-Year | 5-Year | 10-Year | ||||||||||
Class A | 9.80 | % | 43.17 | % | -5.24 | % | -4.69 | % | 2.29 | % | |||||
Class B | 9.45 | % | 41.84 | % | -6.21 | % | -5.64 | % | 1.19 | % | |||||
Class C | 9.23 | % | 42.00 | % | -6.10 | % | -5.43 | % | 1.38 | % | |||||
Russell Midcap Growth Index+ | 17.58 | % | 49.63 | % | 5.00 | % | 2.29 | % | 10.27 | % | |||||
S&P 500 Index++ | 14.08 | % | 35.12 | % | .63 | % | -1.20 | % | 11.68 | % | |||||
Scudder Dynamic Growth Fund | 6-Month++ | 1-Year | 3-Year | 5-Year | Life of Class* | ||||||||||
Class I | 10.26 | % | 43.93 | % | -4.74 | % | -4.19 | % | 1.47 | % | |||||
Russell Midcap Growth Index+ | 17.58 | % | 49.63 | % | 5.00 | % | 2.29 | % | 9.42 | % | |||||
S&P 500 Index++ | 14.08 | % | 35.12 | % | .63 | % | -1.20 | % | 10.44 | % | |||||
Sources: Lipper Inc. and Deutsche Investment Management Americas Inc.
| ++ | Total returns shown for periods less than one year are not annualized. |
| * | Class I shares commenced operations on July 3, 1995. Index returns begin June 30, 1995. |
3
Table of Contents
Net Asset Value
| Class A | Class B | Class C | Class I | |||||||||
Net Asset Value: | ||||||||||||
3/31/04 | $ | 3.25 | $ | 2.78 | $ | 2.84 | $ | 3.44 | ||||
9/30/03 | $ | 2.96 | $ | 2.54 | $ | 2.60 | $ | 3.12 | ||||
Class A Lipper Rankings - Mid-Cap Growth Funds Category as of 3/31/04
Period | Rank | Number of Funds Tracked | Percentile Ranking | |||||
1-Year | 250 | of | 497 | 51 | ||||
3-Year | 339 | of | 399 | 85 | ||||
5-Year | 227 | of | 249 | 91 | ||||
10-Year | 90 | of | 92 | 97 |
Source: Lipper Inc. Rankings are historical and do not guarantee future results. Rankings are based on total return unadjusted for sales charges with distributions reinvested. If sales charges had been included, results might have been less favorable. Rankings are for Class A shares; other share classes may vary.
Growth of an Assumed $10,000 Investment (Adjusted for Maximum Sales Charge)
[] Scudder Dynamic Growth Fund - Class A
[] Russell Midcap Growth Index+
[] S&P 500 Index++
[GRAPHIC APPEARS HERE]
Yearly periods ended March 31
The Fund’s growth of an assumed $10,000 investment is adjusted for the maximum sales charge of 5.75%. This results in a net initial investment of $9,425.
The growth of $10,000 is cumulative.
4
Table of Contents
Comparative Results (Adjusted for Maximum Sales Charge) as of 3/31/04
Scudder Dynamic Growth Fund | 1-Year | 3-Year | 5-Year | 10-Year | ||||||||||||||
Class A | Growth of $10,000 Average annual total return | $ | 13,494 34.94 | % | $ | 8,019 -7.10 | % | $ | 7,415 -5.81 | % | $ | 11,824 1.69 | % | |||||
Class B | Growth of $10,000 Average annual total return | $ | 13,884 38.84 | % | $ | 8,084 -6.84 | % | $ | 7,425 -5.78 | % | $ | 11,260 1.19 | % | |||||
Class C | Growth of $10,000 Average annual total return | $ | 14,200 42.00 | % | $ | 8,280 -6.10 | % | $ | 7,563 -5.43 | % | $ | 11,463 1.38 | % | |||||
Russell Midcap Growth Index+ | Growth of $10,000 Average annual total return | $ | 14,963 49.63 | % | $ | 11,576 5.00 | % | $ | 11,197 2.29 | % | $ | 26,577 10.27 | % | |||||
S&P 500 Index++ | Growth of $10,000 Average annual total return | $ | 13,512 35.12 | % | $ | 10,191 .63 | % | $ | 9,414 -1.20 | % | $ | 30,191 11.68 | % | |||||
Scudder Dynamic Growth Fund | 1-Year | 3-Year | 5-Year | Life of Class* | ||||||||||||||
Class I | Growth of $10,000 Average annual total return | $ | 14,393 43.93 | % | $ | 8,643 -4.74 | % | $ | 8,072 -4.19 | % | $ | 11,357 1.47 | % | |||||
Russell Midcap Growth Index+ | Growth of $10,000 Average annual total return | $ | 14,963 49.63 | % | $ | 11,576 5.00 | % | $ | 11,197 2.29 | % | $ | 21,989 9.42 | % | |||||
S&P 500 Index++ | Growth of $10,000 Average annual total return | $ | 13,512 35.12 | % | $ | 10,191 .63 | % | $ | 9,414 -1.20 | % | $ | 23,848 10.44 | % | |||||
The growth of $10,000 is cumulative.
| * | Class I shares commenced operations on July 3, 1995. Index returns begin June 30, 1995. |
| + | Russell Midcap Growth Index is an unmanaged index that measures the performance of those Russell Midcap companies with higher price-to-book ratios and higher forecasted growth values. The stocks are also members of the Russell 1000 Growth Index. |
| ++ | The Standard & Poor’s (S&P) 500 Index is a capitalization-weighted index of 500 stocks. The index is designed to measure performance of the broad domestic economy through changes in the aggregate market value of 500 stocks representing all major industries. Index returns assume reinvestment of dividends and, unlike Fund returns, do not reflect any fees or expenses. It is not possible to invest directly into an index. |
5
Table of Contents
Portfolio Management Review
In the following interview, Portfolio Managers Audrey M.T. Jones and Samuel A. Dedio discuss Scudder Dynamic Growth Fund’s performance, strategy and the market environment for the six-month period ended March 31, 2004.
Q: How did the US stock market perform during the semiannual period?
A: The past six months provided a positive backdrop for the stock market, which continued its rally that began in March of 2003. First, the economy continued to stage an impressive recovery from the post-bubble recession. Gross domestic product (the total market value of all goods and services produced in the United States) rose 4.1% in the fourth calendar quarter of 2003, which followed on the heels of the 8.2% growth registered in the third quarter. The continuation of the recovery helped fuel the ongoing rebound in corporate earnings and raised expectations that full-year earnings for 2004 will be strong as well. In addition, the fact that inflation pressures remained muted enabled both the US Federal Reserve and other central banks around the world to maintain accommodative, growth-oriented interest rate policies. These factors, in combination, enabled the US stock market to post strong returns for the full period.
However, the semiannual period was not without challenges. After producing steady gains from October through mid-January, the market faltered in the latter half of the first quarter. Concerns about an increasingly uncertain outlook for the US economy and the resurgence of geopolitical turmoil, such as the Madrid rail bombings, prompted investors to take profits in areas that had performed well in 2003. Stocks staged a comeback in the final two weeks of the period as terrorism concerns dissipated somewhat and bargain hunters moved in to take advantage of the sell-off.
Overall, the market environment for the full six months provided a continued positive environment for growth stocks. But in contrast to the second and third quarters of last year, the group as a whole underperformed value stocks across all market capitalizations. Mid-cap stocks outperformed their large-cap counterparts for the period, as investors continued to be rewarded for moving down the capitalization spectrum.
Q: How did the fund perform in relation to its benchmark and its peer group?
A: For the six-month period ended March 31, 2004, the fund returned 9.80%. (Fund return is for Class A shares unadjusted for sales charges. If sales charges had been included, return would have been lower. Past performance is no guarantee of future results. Please see pages 3 through 5 for performance of other share classes and more complete performance information.) This represented underperformance with respect to both the 17.58% total return of the fund’s benchmark - the Russell Midcap Growth Index - and the 15.36% average return of the 519 funds in the Lipper Mid-Cap Growth Funds category.1
| 1 | The Lipper Mid-Cap Growth Funds category includes portfolios that invest at least 75% of equity assets in companies with market capitalizations of less than 300% of the dollar-weighted median market capitalization of the middle 1,000 securities of the S&P SuperComposite 1500 Index. These portfolios typically have above-average price-to-earnings ratios and price-to-book ratios compared with the S&P MidCap 400 Index. It is not possible to invest directly in an index or a Lipper category. |
We are displeased with the fund’s recent relative performance. However, we believe it is important to measure performance from a longer-term perspective than is afforded by a six-month interval. This importance becomes apparent when we review the primary reasons for underperformance: our focus on higher-quality stocks and the fund’s underweight position in the smallest, most speculative companies in the market.2 In managing the fund, we strive to invest in companies with above-average growth prospects and reasonable valuations. More specifically, we use fundamental research to identify companies with innovative products, leading or dominant market positions, a high rate of return on invested capital and the ability to finance the majority of their growth through internal sources (rather than taking on debt or selling more equity). This means that we avoid lower-quality and heavily indebted companies, micro caps and stocks selling for less than $5 per share.
| 2 | “Underweight” means a fund holds a lower sector or company weighting than the benchmark index. “Overweight” means a fund holds a higher weighting than the benchmark. |
6
Table of Contents
During the reporting period, these types of lower-quality companies outperformed. While this will often be the case at times when the economy and stock market are recovering from a downturn, this type of market environment is usually short-lived and does not reward those who attempt to chase the performance of lower-tier stocks. Investing in lower-quality companies, even for the short term, would mean exposing the fund to excessive risk. Therefore, we believe the best way to generate long-term outperformance is by using a disciplined investment style to identify higher-quality companies. We anticipate that our approach will prove effective when measured over a multiyear period.
Q: What other factors hurt performance during the period?
A: The biggest drag on performance was the fund’s holdings in the health care sector. More specifically, the fund is underweight in the equipment and services area, which performed better than the health care sector as a whole. At the same time, it holds a corresponding overweight in the underperforming pharmaceuticals industry. We are taking steps to adjust this positioning by assessing the fund’s subsector weightings relative to those of the benchmark. The worst-performing holding in health care was Biovail Corp., which was also the largest negative individual contributor. (As of 3/31/04, position in Biovail was sold.)
Performance also was hurt by stock selection within industrials. Here, performance in the commercial services subgroup was weighed down by holdings in private secondary-education stocks such as ITT Educational Services, Inc. and Corinthian Colleges, Inc. Both performed well in the 2003 calendar year but lagged in the first quarter of 2004 when it was announced that ITT was being investigated by the Securities and Exchange Commission and the U.S. Justice Department for submitting false information to the federal government to secure grants and financial aid payments. We continue to hold positions in the stocks in the fund, believing that they will be supported in the long term by continued market acceptance as well as growth in revenue and earnings.
Q: What were some of your decisions that helped performance?
A: Our stock selection in consumer stocks was favorable, which was a positive given the sector’s large representation in the mid-cap benchmark. Our third-largest individual contributor was Chico’s FAS, Inc., a specialty retailer of women’s fashions. The company’s Chico’s brand targets the 35-and-up age group, while its new brand - Pazo - targets women 25-40 years old. Chico’s is becoming increasingly popular and is experiencing earnings growth well above its peer-group average. The company has beaten earnings estimates for the past three quarters, and analyst estimates for the upcoming quarter and year have been rising. Chico’s stock closed the reporting period up significantly from the beginning of the period.
We also received strong performance from our position in GTECH Holdings Corp., which operates on-line lottery systems and supplies equipment and services to lottery authorities in the United States and overseas. Given that states are suffering heavy budget shortfalls and need to close the gap, many have turned to lotteries as an alternative to raising taxes. As a result, GTECH has benefited from higher revenues and expanding profits, and its stock rose over the course of the semiannual period.
The top contributor to performance overall was Harman International Industries, Inc., which makes an “infotainment” system for automobiles that allows them to run DVD players and global positioning systems (GPS). More cars are being produced with one or both of these features. For instance, BMW used to make these technologies available only in its 7-Series, but they now can be added to the 5-Series as well. Harman also supplies its system to the Mercedes E Class, the Audi 8 and the Porsche Cayenne. On the domestic front, Chrysler is offering Harman’s system as an option on the Dodge Ram pickup. Consumer preference for both the GPS and DVD options is rising rapidly, and Harman has been well-positioned to capitalize on the trend.
Q: Are you still finding investment opportunities even after the strong market rally of the past year?
A: Yes. One benefit of investing in mid caps is the ability to select from a wide range of companies and put our strong research capabilities to work. We continue to add to the fund’s positions in the consumer sector as well as areas that can benefit from rising capital spending by corporations, namely the technology and industrial sectors. The fund maintains a modest overweight in all of these areas.
We believe that the return to a more rational market environment is inevitable. When this occurs, investors who focus on fundamental research and individual stock selection are likely to be rewarded. As a result, we are not changing our approach by investing in smaller, more speculative companies. Although the fund’s relative performance was not strong when viewed within the short, six-month time frame, we are confident in the long-term potential benefits of our investment approach.
The views expressed in this report reflect those of the portfolio managers only through the end of the period of the report as stated on the cover. The managers’ views are subject to change at any time based on market and other conditions and should not be construed as a recommendation.
7
Table of Contents
Portfolio Summary March 31, 2004
Asset Allocation | 3/31/04 | 9/30/03 | ||||
Common Stocks | 99 | % | 94 | % | ||
Cash Equivalents | 1 | % | 6 | % | ||
| 100 | % | 100 | % | |||
Sector Diversification (Excludes Cash Equivalents) | 3/31/04 | 9/30/03 | ||||
Information Technology | 31 | % | 29 | % | ||
Consumer Discretionary | 21 | % | 15 | % | ||
Health Care | 18 | % | 19 | % | ||
Financials | 10 | % | 10 | % | ||
Industrials | 9 | % | 12 | % | ||
Energy | 4 | % | 5 | % | ||
Materials | 3 | % | 2 | % | ||
Consumer Staples | 3 | % | 7 | % | ||
Telecommunication Services | 1 | % | 1 | % | ||
| 100 | % | 100 | % | |||
Asset allocation and sector diversification are subject to change.
Ten Largest Equity Holdings at March 31, 2004 (27.9% of Portfolio) | |||
1. Corinthian Colleges, Inc. Provider of higher education | 3.3 | % | |
2. Invitrogen Corp. Developer of research kits | 3.1 | % | |
3. Vishay Intertechnology, Inc. Manufacturer of electronic components | 3.0 | % | |
4. Harman International Industries, Inc. Manufacturer of high fidelity audio and video components | 3.0 | % | |
5. Cognos, Inc. Manufacturer and distributor of software | 2.8 | % | |
6. Celgene Corp. Producer of pharmaceuticals | 2.8 | % | |
7. Columbia Sportswear Co. Manufacturer of active outdoor apparel | 2.6 | % | |
8. Caremark Rx, Inc. Provider of pharmaceutical services in the United States | 2.5 | % | |
9. Investors Financial Services Corp. Provider of asset administration services | 2.5 | % | |
10. Tempur-Pedic International, Inc. Manufacturer of foam mattresses and pillows | 2.3 | % |
Portfolio holdings are subject to change.
For more complete details about the fund’s investment portfolio, see page 14. A quarterly Fact Sheet is available upon request. Information concerning portfolio holdings of the Fund as of month end is available upon request on the 16th of the following month. Please see the Account Management Resources section for contact information.
8
Table of Contents
Investment Portfolio as of March 31, 2004 (Unaudited)
| Shares | Value ($) | |||
Common Stocks 99.3% | ||||
Consumer Discretionary 20.8% | ||||
Automobiles 1.5% | ||||
Thor Industries, Inc. | 147,400 | 3,959,164 | ||
Hotels Restaurants & Leisure 5.3% | ||||
Alliance Gaming Corp.* | 171,100 | 5,497,443 | ||
GTECH Holdings Corp. | 100,300 | 5,931,742 | ||
The Cheesecake Factory, Inc.* | 58,000 | 2,675,540 | ||
| 14,104,725 | ||||
Household Durables 5.3% | ||||
Harman International Industries, Inc. | 99,600 | 7,928,160 | ||
Tempur-Pedic International, Inc.* | 397,900 | 6,223,156 | ||
| 14,151,316 | ||||
Media 1.4% | ||||
Entercom Communications Corp.* | 79,800 | 3,612,546 | ||
Specialty Retail 4.7% | ||||
Advance Auto Parts, Inc.* | 105,400 | 4,286,618 | ||
Chico’s FAS, Inc.* | 122,300 | 5,674,720 | ||
Regis Corp. | 61,300 | 2,724,172 | ||
| 12,685,510 | ||||
Textiles, Apparel & Luxury Goods 2.6% | ||||
Columbia Sportswear Co.* | 125,400 | 6,952,176 | ||
Consumer Staples 2.9% | ||||
Beverages 1.3% | ||||
Constellation Brands, Inc. “A”* | 111,100 | 3,566,310 | ||
Food Products 1.6% | ||||
Dean Foods Co.* | 123,900 | 4,138,260 | ||
Energy 3.5% | ||||
Energy Equipment & Services | ||||
BJ Services Co.* | 76,300 | 3,301,501 | ||
Rowan Companies, Inc.* | 287,300 | 6,059,157 | ||
| 9,360,658 | ||||
Financials 9.7% | ||||
Consumer Finance 1.1% | ||||
Providian Financial Corp.* | 218,800 | 2,866,280 | ||
Diversified Financial Services 8.6% | ||||
Ameritrade Holding Corp.* | 392,800 | 6,049,120 | ||
Chicago Mercantile Exchange | 42,700 | 4,130,798 | ||
Investment Technology Group, Inc.* | 259,400 | 3,968,820 | ||
Investors Financial Services Corp. | 163,100 | 6,739,292 | ||
Labranche & Co., Inc. | 183,800 | 2,060,398 | ||
| 22,948,428 | ||||
Health Care 17.7% | ||||
Biotechnology 9.2% | ||||
Invitrogen Corp.* | 113,700 | 8,151,153 | ||
Martek Biosciences Corp.* | 107,200 | 6,110,400 | ||
MedImmune, Inc.* | 118,100 | 2,725,748 | ||
Millennium Pharmaceuticals, Inc.* | 177,400 | 2,998,060 | ||
Neurocrine Biosciences, Inc.* | 77,500 | 4,580,250 | ||
| 24,565,611 | ||||
Health Care Equipment & Supplies 1.1% | ||||
Kinetic Concepts, Inc.* | 66,100 | 2,964,585 | ||
Health Care Providers & Services 2.5% | ||||
Caremark Rx, Inc.* | 203,300 | 6,759,725 | ||
Pharmaceuticals 4.9% | ||||
Celgene Corp.* | 154,200 | 7,347,630 | ||
NPS Pharmaceuticals, Inc.* | 200,326 | 5,719,307 | ||
| 13,066,937 | ||||
Industrials 9.4% | ||||
Airlines 1.4% | ||||
SkyWest, Inc. | 187,600 | 3,609,424 | ||
Commercial Services & Supplies 6.6% | ||||
Corinthian Colleges, Inc.* | 266,900 | 8,823,714 | ||
ITT Educational Services, Inc.* | 110,400 | 3,444,480 | ||
Stericycle, Inc.* | 113,600 | 5,436,896 | ||
| 17,705,090 | ||||
Road & Rail 1.4% | ||||
Swift Transportation Co., Inc.* | 216,800 | 3,722,456 | ||
Information Technology 30.7% | ||||
Communications Equipment 4.4% | ||||
Adaptec, Inc.* | 621,900 | 5,447,844 | ||
Emulex Corp.* | 202,400 | 4,309,096 | ||
Foundry Networks, Inc.* | 123,300 | 2,117,061 | ||
| 11,874,001 | ||||
Computers & Peripherals 1.6% | ||||
Network Appliance, Inc.* | 198,400 | 4,255,680 | ||
Electronic Equipment & Instruments 5.2% | ||||
Jabil Circuit, Inc.* | 198,600 | 5,844,798 | ||
Vishay Intertechnology, Inc.* | 376,500 | 8,034,510 | ||
| 13,879,308 | ||||
Semiconductors & Semiconductor Equipment 14.6% | ||||
Applied Micro Circuits Corp.* | 1,080,700 | 6,214,025 | ||
Linear Technology Corp. | 139,100 | 5,149,482 | ||
Microchip Technology, Inc. | 142,500 | 3,784,800 | ||
National Semiconductor Corp.* | 100,000 | 4,443,000 | ||
QLogic Corp.* | 113,500 | 3,746,635 | ||
Teradyne, Inc.* | 240,400 | 5,728,732 | ||
Varian Semiconductor Equipment Associates, Inc.* | 97,700 | 4,103,400 | ||
Xilinx, Inc.* | 150,300 | 5,711,400 | ||
| 38,881,474 | ||||
Software 4.9% | ||||
Cognos, Inc.* | 241,500 | 7,500,990 | ||
Intuit, Inc.* | 126,300 | 5,668,344 | ||
| 13,169,334 | ||||
Materials 3.3% | ||||
Containers & Packaging 2.3% | ||||
Packaging Corp. of America* | 271,300 | 6,120,528 | ||
Metals & Mining 1.0% | ||||
United States Steel Corp. | 71,200 | 2,653,624 | ||
Telecommunication Services 1.3% | ||||
Wireless Telecommunication Services | ||||
Nextel Partners, Inc. “A”* | 285,400 | 3,613,164 | ||
Total Common Stocks (Cost $212,049,743) | 265,186,314 | |||
Preferred Stock 0.1% | ||||
Information Technology 0.1% | ||||
Software | ||||
fusionOne* (c) | 690,608 | 99,448 | ||
Planetweb, Inc. “E”* (c) | 413,603 | 0 | ||
| 99,448 | ||||
Telecommunication Services 0.0% | ||||
Diversified Telecommunication Services | ||||
Convergent Networks, Inc.* (c) | 345,565 | 44,923 | ||
Total Preferred Stock (Cost $6,000,001) | 144,371 | |||
Cash Equivalents 0.6% | ||||
Scudder Cash Management QP Trust, 1.1% (b) (Cost $1,665,341) | 1,665,341 | 1,665,341 | ||
Total Investment Portfolio - 100.0% (Cost $219,715,085) (a) | 266,996,026 | |||
| * | Non-income producing security. |
| (a) | The cost for federal income tax purposes was $224,685,777. At March 31, 2004, net unrealized appreciation for all securities based on tax cost was $42,310,249. This consisted of aggregate gross unrealized appreciation for all securities in which there was an excess of value over tax cost of $61,564,185 and aggregate gross unrealized depreciation for all securities in which there was an excess of tax cost over value of $19,253,936. |
| (b) | Scudder Cash Management QP Trust is also managed by Deutsche Investment Management Americas Inc. The rate shown is the annualized seven-day yield at period end. |
| (c) | The Fund may purchase securities that are subject to legal or contractual restriction on resale (“restricted securities”). Restricted securities are securities which have not been registered with the Securities and Exchange Commission under the Securities Act of 1933. The Fund may be unable to sell a restricted security and it may be more difficult to determine a market value for a restricted security. Moreover, if adverse market conditions were to develop during the period between the Fund’s decision to sell a restricted security and the point at which the Fund is permitted or able to sell such security, the Fund might obtain a price less favorable than the price that prevailed when it decided to sell. This investment practice, therefore, could have the effect of increasing the level of illiquidity of the Fund. |
9
Table of Contents
Schedule of Restricted Securities
Securities | Acquisition Date | Acquisition Cost ($) | Value ($) | Value as % of Net Assets | ||||
Convergent Networks, Inc. | September 2000 | — | 44,923 | .02 | ||||
fusionOne | October 2000 | 3,750,001 | 99,448 | .04 | ||||
Planetweb, Inc. “E” | September 2000 | 2,250,000 | — | — | ||||
Total Restricted Securities | 144,371 | .06 | ||||||
The accompanying notes are an integral part of the financial statements.
10
Table of Contents
Statement of Assets and Liabilities as of March 31, 2004 (Unaudited)
Assets | ||||
Investments: | ||||
Investments in securities, at value (cost $218,049,744) | $ | 265,330,685 | ||
Investment in Scudder Cash Management QP Trust (cost $1,665,341) | 1,665,341 | |||
Total investments in securities, at value (cost $219,715,085) | 266,996,026 | |||
Receivable for investments sold | 1,671,729 | |||
Dividends receivable | 50,745 | |||
Interest receivable | 5,051 | |||
Receivable for Fund shares sold | 60,135 | |||
Other assets | 11,690 | |||
Total assets | 268,795,376 | |||
Liabilities | ||||
Payable for Fund shares redeemed | 831,165 | |||
Accrued management fee | 207,308 | |||
Other accrued expenses and payables | 360,944 | |||
Total liabilities | 1,399,417 | |||
Net assets, at value | $ | 267,395,959 | ||
Net Assets | ||||
Net assets consist of: Accumulated net investment loss | (2,016,797 | ) | ||
Net unrealized appreciation (depreciation) on investments | 47,280,941 | |||
Accumulated net realized gain (loss) | (331,808,413 | ) | ||
Paid-in capital | 553,940,228 | |||
Net assets, at value | $ | 267,395,959 | ||
The accompanying notes are an integral part of the financial statements.
11
Table of Contents
Statement of Assets and Liabilities as of March 31, 2004 (Unaudited) (continued)
Net Asset Value
Class A | |||
Net Asset Value and redemption price per share ($223,858,184 / 68,926,673 outstanding shares of beneficial interest, $.01 par value, unlimited number of shares authorized) | $ | 3.25 | |
Maximum offering price per share (100 / 94.25 of $3.25) | $ | 3.45 | |
Class B | |||
Net Asset Value, offering and redemption price (subject to contingent deferred sales charge) per share ($32,679,806 / 11,775,386 outstanding shares of beneficial interest, $.01 par value, unlimited number of shares authorized) | $ | 2.78 | |
Class C | |||
Net Asset Value, offering and redemption price (subject to contingent deferred sales charge) per share ($10,617,849 / 3,740,624 outstanding shares of beneficial interest, $.01 par value, unlimited number of shares authorized) | $ | 2.84 | |
Class I | |||
Net Asset Value, offering and redemption price per share ($240,120 / 69,730 outstanding shares of beneficial interest, $.01 par value, unlimited number of shares authorized) | $ | 3.44 |
The accompanying notes are an integral part of the financial statements.
12
Table of Contents
Statement of Operations for the six months ended March 31, 2004 (Unaudited)
Investment Income
Income: | ||||
Dividends | $ | 223,833 | ||
Interest - Scudder Cash Management QP Trust | 40,301 | |||
Total Income | 264,134 | |||
Expenses: | ||||
Management fee | 1,162,646 | |||
Services to shareholders | 493,249 | |||
Custodian fees | 6,041 | |||
Distribution service fees | 517,335 | |||
Auditing | 25,893 | |||
Legal | 3,891 | |||
Trustees’ fees and expenses | 15,143 | |||
Reports to shareholders | 38,487 | |||
Registration fees | 28,372 | |||
Other | 4,094 | |||
Total expenses, before expense reductions | 2,295,151 | |||
Expense reductions | (35,334 | ) | ||
Total expenses, after expense reductions | 2,259,817 | |||
Net investment loss | (1,995,683 | ) | ||
Realized and Unrealized Gain (Loss) on Investment Transactions | ||||
Net realized gain (loss) from investments | 17,317,013 | |||
Net unrealized appreciation (depreciation) during the period on investments | 10,190,572 | |||
Net gain (loss) on investment transactions | 27,507,585 | |||
Net increase (decrease) in net assets resulting from operations | $ | 25,511,902 | ||
The accompanying notes are an integral part of the financial statements.
13
Table of Contents
Statement of Changes in Net Assets
Increase (Decrease) in Net Assets | Six Months Ended March 31, 2004 (Unaudited) | Year ended September 30, 2003 | ||||||
Operations: | ||||||||
Net investment income (loss) | $ | (1,995,683 | ) | $ | (2,541,453 | ) | ||
Net realized gain (loss) on investment transactions | 17,317,013 | (70,009,022 | ) | |||||
Net unrealized appreciation (depreciation) on investment transactions during the period | 10,190,572 | 156,446,777 | ||||||
Net increase (decrease) in net assets resulting from operations | 25,511,902 | 83,896,302 | ||||||
Fund share transactions: | ||||||||
Proceeds from shares sold | 25,843,154 | 41,693,562 | ||||||
Cost of shares redeemed | (46,219,110 | ) | (73,127,815 | ) | ||||
Net increase (decrease) in net assets from Fund share transactions | (20,375,956 | ) | (31,434,253 | ) | ||||
Increase (decrease) in net assets | 5,135,946 | 52,462,049 | ||||||
Net assets at beginning of period | 262,260,013 | 209,797,964 | ||||||
Net assets at end of period (including accumulated net investment loss of $2,016,797 and $21,114, respectively) | $ | 267,395,959 | $ | 262,260,013 | ||||
The accompanying notes are an integral part of the financial statements.
14
Table of Contents
Class A
Years Ended September 30, | 2004a | 2003 | 2002 | 2001 | 2000 | 1999 | ||||||||||||||||||
Selected Per Share Data | ||||||||||||||||||||||||
Net asset value, beginning of period | $ | 2.96 | $ | 2.06 | $ | 3.02 | $ | 9.10 | $ | 6.12 | $ | 5.30 | ||||||||||||
Income from investment operations: | ||||||||||||||||||||||||
Net investment income (loss) | (.02 | )b | (.02 | )b | (.02 | )b | (.03 | ) | (.08 | )b | (.04 | )b | ||||||||||||
Net realized and unrealized gain (loss) on investment transactions | .31 | .92 | (.94 | ) | (4.73 | ) | 3.42 | 1.27 | ||||||||||||||||
Total from investment operations | .29 | .90 | (.96 | ) | (4.76 | ) | 3.34 | 1.23 | ||||||||||||||||
Less distributions from: | ||||||||||||||||||||||||
Net realized gains on investment transactions | — | — | — | (1.32 | ) | (.36 | ) | (.41 | ) | |||||||||||||||
Net asset value, end of period | $ | 3.25 | $ | 2.96 | $ | 2.06 | $ | 3.02 | $ | 9.10 | $ | 6.12 | ||||||||||||
Total Return (%)c | 9.80 | ** | 43.69 | (31.79 | )d | (57.42 | )d | 55.94 | 23.91 | |||||||||||||||
Ratios to Average Net Assets and Supplemental Data | ||||||||||||||||||||||||
Net assets, end of period ($ millions) | 224 | 217 | 168 | 325 | 821 | 565 | ||||||||||||||||||
Ratio of expenses before expense reductions (%) | 1.43 | * | 1.23 | 1.08 | 1.14e | 1.34 | 1.01 | |||||||||||||||||
Ratio of expenses after expense reductions (%) | 1.43 | * | 1.23 | 1.07 | 1.10e | 1.33 | 1.01 | |||||||||||||||||
Ratio of net investment income (loss) (%) | (1.24 | )* | (.94 | ) | (.74 | ) | (.67 | ) | (1.02 | ) | (.64 | ) | ||||||||||||
Portfolio turnover rate (%) | 49 | * | 134 | 59 | 132 | 156 | 133 | |||||||||||||||||
| a | For the six months ended March 31, 2004 (Unaudited). |
| b | Based on average shares outstanding during the period. |
| c | Total return does not reflect the effect of any sales charges. |
| d | Total return would have been lower had certain expenses not been reduced. |
| e | The ratios of operating expenses excluding costs incurred in connection with a fund complex reorganization before and after expense reductions were 1.11% and 1.10%, respectively. |
| * | Annualized |
| ** | Not annualized |
15
Table of Contents
Class B
Years Ended September 30, | 2004a | 2003 | 2002 | 2001 | 2000 | 1999 | ||||||||||||||||||
Selected Per Share Data | ||||||||||||||||||||||||
Net asset value, beginning of period | $ | 2.54 | $ | 1.78 | $ | 2.65 | $ | 8.29 | $ | 5.67 | $ | 4.98 | ||||||||||||
Income from investment operations: | ||||||||||||||||||||||||
Net investment income (loss) | (.03 | )b | (.04 | )b | (.04 | )b | (.08 | ) | (.16 | )b | (.10 | )b | ||||||||||||
Net realized and unrealized gain (loss) on investment transactions | .27 | .80 | (.83 | ) | (4.24 | ) | 3.14 | 1.20 | ||||||||||||||||
Total from investment operations | .24 | .76 | (.87 | ) | (4.32 | ) | 2.98 | 1.10 | ||||||||||||||||
Less distributions from: | ||||||||||||||||||||||||
Net realized gains on investment transactions | — | — | — | (1.32 | ) | (.36 | ) | (.41 | ) | |||||||||||||||
Net asset value, end of period | $ | 2.78 | $ | 2.54 | $ | 1.78 | $ | 2.65 | $ | 8.29 | $ | 5.67 | ||||||||||||
Total Return (%)c | 9.45d | ** | 42.70 | (32.83 | ) | (57.94 | ) | 53.95 | 22.78 | |||||||||||||||
Ratios to Average Net Assets and Supplemental Data | ||||||||||||||||||||||||
Net assets, end of period ($ millions) | 33 | 35 | 31 | 63 | 186 | 136 | ||||||||||||||||||
Ratio of expenses before expense reductions (%) | 2.68 | * | 2.13 | 2.01 | 2.26e | 2.51 | 2.28 | |||||||||||||||||
Ratio of expenses after expense reductions (%) | 2.51 | * | 2.13 | 2.01 | 2.25e | 2.50 | 2.28 | |||||||||||||||||
Ratio of net investment income (loss) (%) | (2.32 | )* | (1.84 | ) | (1.68 | ) | (1.82 | ) | (2.19 | ) | (1.91 | ) | ||||||||||||
Portfolio turnover rate (%) | 49 | * | 134 | 59 | 132 | 156 | 133 | |||||||||||||||||
| a | For the six months ended March 31, 2004 (Unaudited). |
| b | Based on average shares outstanding during the period. |
| c | Total return does not reflect the effect of any sales charges. |
| d | Total return would have been lower had certain expenses not been reduced. |
| e | The ratios of operating expenses excluding costs incurred in connection with a fund complex reorganization before and after expense reductions were 2.19% and 2.19%, respectively. |
| * | Annualized |
| ** | Not annualized |
16
Table of Contents
Class C
Years Ended September 30, | 2004a | 2003 | 2002 | 2001 | 2000 | 1999 | ||||||||||||||||||
Selected Per Share Data | ||||||||||||||||||||||||
Net asset value, beginning of period | $ | 2.60 | $ | 1.82 | $ | 2.70 | $ | 8.39 | $ | 5.71 | $ | 5.00 | ||||||||||||
Income from investment operations: | ||||||||||||||||||||||||
Net investment income (loss) | (.03 | )b | (.04 | )b | (.04 | )b | (.06 | ) | (.13 | )b | (.08 | )b | ||||||||||||
Net realized and unrealized gain (loss) on investment transactions | .27 | .82 | (.84 | ) | (4.31 | ) | 3.17 | 1.20 | ||||||||||||||||
Total from investment operations | .24 | .78 | (.88 | ) | (4.37 | ) | 3.04 | 1.12 | ||||||||||||||||
Less distributions from: | ||||||||||||||||||||||||
Net realized gains on investment transactions | — | — | — | (1.32 | ) | (.36 | ) | (.41 | ) | |||||||||||||||
Net asset value, end of period | $ | 2.84 | $ | 2.60 | $ | 1.82 | $ | 2.70 | $ | 8.39 | $ | 5.71 | ||||||||||||
Total Return (%)c | 9.23d | ** | 42.86 | (32.59 | ) | (58.02 | ) | 55.38 | 23.10 | |||||||||||||||
Ratios to Average Net Assets and Supplemental Data | ||||||||||||||||||||||||
Net assets, end of period ($ millions) | 11 | 11 | 8 | 11 | 21 | 10 | ||||||||||||||||||
Ratio of expenses before expense reductions (%) | 2.54 | * | 2.05 | 1.91 | 1.97e | 2.10 | 1.93 | |||||||||||||||||
Ratio of expenses after expense reductions (%) | 2.51 | * | 2.05 | 1.91 | 1.89e | 2.10 | 1.93 | |||||||||||||||||
Ratio of net investment income (loss) (%) | (2.32 | )* | (1.76 | ) | (1.58 | ) | (1.46 | ) | (1.79 | ) | (1.56 | ) | ||||||||||||
Portfolio turnover rate (%) | 49 | * | 134 | 59 | 132 | 156 | 133 | |||||||||||||||||
| a | For the six months ended March 31, 2004 (Unaudited). |
| b | Based on average shares outstanding during the period. |
| c | Total return does not reflect the effect of any sales charges. |
| d | Total return would have been lower had certain expenses not been reduced. |
| e | The ratios of operating expenses excluding costs incurred in connection with a fund complex reorganization before and after expense reductions were 1.89% and 1.89%, respectively. |
| * | Annualized |
| ** | Not annualized |
17
Table of Contents
Class I
Years Ended September 30, | 2004a | 2003 | 2002 | 2001 | 2000 | 1999 | ||||||||||||||||||
Selected Per Share Data | ||||||||||||||||||||||||
Net asset value, beginning of period | $ | 3.12 | $ | 2.16 | $ | 3.16 | $ | 9.38 | $ | 6.27 | $ | 5.39 | ||||||||||||
Income from investment operations: | ||||||||||||||||||||||||
Net investment income (loss) | (.01 | )b | (.01 | )b | (.01 | )b | (.02 | ) | (.05 | )b | (.01 | )b | ||||||||||||
Net realized and unrealized gain (loss) on investment transactions | .33 | .97 | (.99 | ) | (4.88 | ) | 3.52 | 1.30 | ||||||||||||||||
Total from investment operations | .32 | .96 | (1.00 | ) | (4.90 | ) | 3.47 | 1.29 | ||||||||||||||||
Less distributions from: | ||||||||||||||||||||||||
Net realized gains on investment transactions | — | — | — | (1.32 | ) | (.36 | ) | (.41 | ) | |||||||||||||||
Net asset value, end of period | $ | 3.44 | $ | 3.12 | $ | 2.16 | $ | 3.16 | $ | 9.38 | $ | 6.27 | ||||||||||||
Total Return (%) | 10.26c | ** | 44.44 | (31.65 | ) | (57.33 | ) | 56.87 | 24.66 | |||||||||||||||
Ratios to Average Net Assets and Supplemental Data | ||||||||||||||||||||||||
Net assets, end of period ($ millions) | .24 | .25 | 3 | 7 | 20 | 12 | ||||||||||||||||||
Ratio of expenses before expense reductions (%) | 2.10 | * | .72 | .60 | .71d | .97 | .58 | |||||||||||||||||
Ratio of expenses after expense reductions (%) | 1.01 | * | .72 | .60 | .70d | .96 | .58 | |||||||||||||||||
Ratio of net investment income (loss) (%) | (.82 | )* | (.43 | ) | (.27 | ) | (.27 | ) | (.65 | ) | (.21 | ) | ||||||||||||
Portfolio turnover rate (%) | 49 | * | 134 | 59 | 132 | 156 | 133 | |||||||||||||||||
| a | For the six months ended March 31, 2004 (Unaudited). |
| b | Based on average shares outstanding during the period. |
| c | Total return would have been lower had certain expenses not been reduced. |
| d | The ratios of operating expenses excluding costs incurred in connection with a fund complex reorganization before and after expense reductions were .70% and .69%, respectively. |
| * | Annualized |
| ** | Not annualized |
18
Table of Contents
Notes to Financial Statements (Unaudited)
A. Significant Accounting Policies
Scudder Dynamic Growth Fund (the “Fund”) is registered under the Investment Company Act of 1940, as amended (the “1940 Act”), as an open-end, diversified management investment company organized as a Massachusetts business trust.
The Fund offers multiple classes of shares which provide investors with different purchase options. Class A shares are offered to investors subject to an initial sales charge. Class B shares are offered without an initial sales charge but are subject to higher ongoing expenses than Class A shares and a contingent deferred sales charge payable upon certain redemptions. Class B shares automatically convert to Class A shares six years after issuance. Class C shares are offered to investors without an initial sales charge and are subject to higher ongoing expenses than Class A shares and a contingent deferred sales charge payable upon certain redemptions within one year of purchase. Prior to March 1, 2004, Class C shares were offered with an initial sales charge. Class C shares do not convert into another class. Class I shares are offered to a limited group of investors, are not subject to initial or contingent deferred sales charges and have lower ongoing expenses than other classes.
Investment income, realized and unrealized gains and losses, and certain fund-level expenses and expense reductions, if any, are borne pro rata on the basis of relative net assets by the holders of all classes of shares, except that each class bears certain expenses unique to that class such as distribution service fees, administrative fees and certain other class-specific expenses. Differences in class-level expenses may result in payment of different per share dividends by class. All shares of the Fund have equal rights with respect to voting subject to class-specific arrangements.
19
Table of Contents
The Fund’s financial statements are prepared in accordance with accounting principles generally accepted in the United States of America which require the use of management estimates. Actual results could differ from those estimates. The policies described below are followed consistently by the Fund in the preparation of its financial statements.
Security Valuation. Investments are stated at value determined as of the close of regular trading on the New York Stock Exchange on each day the exchange is open for trading. Equity securities are valued at the most recent sale price or official closing price reported on the exchange (US or foreign) or over-the-counter market on which the security is traded most extensively. Securities for which no sales are reported are valued at the calculated mean between the most recent bid and asked quotations on the relevant market or, if a mean cannot be determined, at the most recent bid quotation.
Money market instruments purchased with an original or remaining maturity of sixty days or less, maturing at par, are valued at amortized cost. Investments in open-end investment companies and Scudder Cash Management QP Trust are valued at their net asset value each business day.
Securities and other assets for which market quotations are not readily available or for which the above valuation procedures are deemed not to reflect fair value are valued in a manner that is intended to reflect their fair value as determined in accordance with procedures approved by the Trustees.
Federal Income Taxes. The Fund’s policy is to comply with the requirements of the Internal Revenue Code, as amended, which are applicable to regulated investment companies and to distribute all of its taxable income to its shareholders. Accordingly, the Fund paid no federal income taxes and no federal income tax provision was required.
At September 30, 2003, the Fund had a net tax basis capital loss carryforward of approximately $308,862,000 which may be applied against any realized net taxable capital gains of each succeeding year until fully utilized or until September 30, 2010 ($194,045,000) and September 30, 2011 ($114,817,000), the respective expiration dates, whichever occurs first.
In addition, from November 1, 2002 through September 30, 2003, the Fund incurred approximately $35,206,000 of net realized capital losses. As permitted by tax regulations, the Fund intends to elect to defer these losses and treat them as arising in the fiscal year ended September 30, 2004.
Distribution of Income and Gains. Distributions of net investment income, if any, are made annually. Net realized gains from investment transactions, in excess of available capital loss carryforwards, would be taxable to the Fund if not distributed, and, therefore, will be distributed to shareholders at least annually.
The timing and characterization of certain income and capital gains distributions are determined annually in accordance with federal tax regulations which may differ from accounting principles generally accepted in the United States of America. These differences primarily relate to certain securities sold at a loss. As a result, net investment income (loss) and net realized gain (loss) on investment transactions for a reporting period may differ significantly from distributions during such period. Accordingly, the Fund may periodically make reclassifications among certain of its capital accounts without impacting the net asset value of the Fund.
20
Table of Contents
The tax character of current year distributions, if any, will be determined at the end of the current fiscal year.
Other. Investment transactions are accounted for on the trade date plus one basis for daily net asset value calculations. However, for financial reporting purposes, investment transactions are reported on trade date. Interest income is recorded on the accrual basis. Dividend income is recorded on the ex-dividend date net of foreign withholding taxes. Realized gains and losses from investment transactions are recorded on an identified cost basis.
B. Purchases and Sales of Securities
During the six months ended March 31, 2004, purchases and sales of investment securities (excluding short-term investments) aggregated $67,204,855 and $87,039,927, respectively.
C. Related Parties
Management Agreement. Under the Management Agreement with Deutsche Investment Management Americas Inc. (“DeIM” or the “Advisor”), the Advisor directs the investments of the Fund in accordance with its investment objectives, policies and restrictions. The Advisor determines the securities, instruments and other contracts relating to investments to be purchased, sold or entered into by the Fund. In addition to portfolio management services, the Advisor provides certain administrative services in accordance with the Management Agreement. The management fee payable monthly under the Management Agreement is equal to 1/12 of the annual rate of 0.65% of the Fund’s average daily net assets computed and accrued daily, which is then adjusted monthly upward or downward by a maximum of 0.30% based upon the performance for the immediately preceding twelve months of the Class A shares of the Fund as compared to the performance of the Standard & Poor’s 500 Index.
Accordingly, for the six months ended March 31, 2004, the fees pursuant to the Management Agreement were as follows:
Base fee | $ | 787,866 | |
Performance adjustment | 374,780 | ||
Total fees | $ | 1,162,646 | |
Effective October 1, 2003 through September 30, 2005, the Advisor has agreed to contractually waive all or a portion of its management fee and reimburse or pay certain operating expenses of the Fund to the extent necessary to maintain the operating expenses at 1.50% of average daily net assets for Class A, B and C shares, respectively, and 1.00% of average daily net assets for Class I shares (excluding certain expenses such as Rule 12b-1 and/or service fees, trustees and trustee counsel fees, extraordinary expenses, taxes, brokerage and interest).
Service Provider Fees. Scudder Investments Service Company (“SISC”), an affiliate of the Advisor, is the Fund’s transfer, dividend-paying agent and shareholder service agent. Pursuant to a sub-transfer agency agreement between SISC and DST Systems, Inc. (“DST”), SISC has delegated certain transfer agent and dividend paying agent functions to DST. The costs and expenses of such delegation are borne by SISC, not by the Fund. For the six months ended March 31, 2004, the amount charged to the Fund by SISC was as follows:
Service Provider Fee | Total Aggregated | Not Imposed | Unpaid at March 31, 2004 | ||||||
Class A | $ | 312,299 | $ | — | $ | 222,744 | |||
Class B | 139,332 | 31,705 | — | ||||||
Class C | 36,554 | 1,779 | — | ||||||
Class I | 1,946 | 1,826 | �� | ||||||
| $ | 490,131 | $ | 35,310 | $ | 222,744 | ||||
21
Table of Contents
Distribution Service Agreement. Under the Distribution Service Agreement, in accordance with Rule 12b-1 under the 1940 Act, Scudder Distributors, Inc. (“SDI”), a subsidiary of the Advisor, receives a fee (“Distribution Fee”) of 0.75% of average daily net assets of Class B and C shares. Pursuant to the agreement, SDI enters into related selling group agreements with various firms at various rates for sales of Class B and C shares. For the six months ended March 31, 2004, the Distribution Fee was as follows:
Distribution Fee | Total Aggregated | Unpaid at March 31, 2004 | ||||
Class B | $ | 133,679 | $ | 21,767 | ||
Class C | 44,071 | 7,321 | ||||
| $ | 177,750 | $ | 29,088 | |||
In addition, SDI provides information and administrative services (“Service Fee”) to Class A, B and C shareholders at an annual rate of up to 0.25% of average daily net assets for each such class. SDI in turn has various agreements with financial services firms that provide these services and pay these fees based upon the assets of shareholder accounts the firms service. For the six months ended March 31, 2004, the Service Fee was as follows:
Service Fee | Total Aggregated | Unpaid at March 31, 2004 | Annualized Effective Rate | ||||||
Class A | $ | 284,217 | $ | 41,862 | 0.24 | % | |||
Class B | 40,995 | 5,885 | 0.23 | % | |||||
Class C | 14,373 | 1,969 | 0.24 | % | |||||
| $ | 339,585 | $ | 49,716 | ||||||
Underwriting Agreement and Contingent Deferred Sales Charge. SDI is the principal underwriter for the Fund. Underwriting commissions paid in connection with the distribution of Class A and C shares for the six months ended March 31, 2004 aggregated $11,237 and $125, respectively.
In addition, SDI receives any contingent deferred sales charge (“CDSC”) from Class B share redemptions occurring within six years of purchase and Class C share redemptions occurring within one year of purchase. There is no such charge upon redemption of any share appreciation or reinvested dividends. The CDSC is based on declining rates ranging from 4% to 1% for Class B and 1% for Class C, of the value of the shares redeemed. For the six months ended March 31, 2004, the CDSC for Class B and C shares aggregated $49,506 and $481, respectively. A deferred sales charge of up to 1% is assessed on certain redemptions of Class A shares. For the six months ended March 31, 2004, SDI received $48.
Trustees’ Fees and Expenses. The Fund pays each Trustee not affiliated with the Advisor retainer fees plus specified amounts for attended board and committee meetings.
22
Table of Contents
Scudder Cash Management QP Trust. Pursuant to an Exemptive Order issued by the SEC, the Fund may invest in the Scudder Cash Management QP Trust (the “QP Trust”), and other affiliated funds managed by the Advisor. The QP Trust seeks to provide as high a level of current income as is consistent with the preservation of capital and the maintenance of liquidity. The QP Trust does not pay the Advisor a management fee for the affiliated funds’ investments in the QP Trust.
D. Expense Off-Set Arrangement
The Fund has entered into an arrangement with its custodian whereby credits realized as a result of uninvested cash balances were used to reduce a portion of the Fund’s custodian expenses. During the six months ended March 31, 2004, the custodian fee was reduced by $24 for custodian credits earned.
E. Line of Credit
The Fund and several other affiliated Funds (the “Participants”) share in a $1.25 billion revolving credit facility administered by J.P. Morgan Chase Bank for temporary or emergency purposes, including the meeting of redemption requests that otherwise might require the untimely disposition of securities. The Participants are charged an annual commitment fee which is allocated, based upon net assets, among each of the Participants. Interest is calculated at the Federal Funds Rate plus 0.5 percent. The Fund may borrow up to a maximum of 33 percent of its net assets under the agreement.
F. Share Transactions
The following table summarizes share and dollar activity in the Fund:
Six Months Ended March 31, 2004 | Year Ended September 30, 2003 | |||||||||||||
| Shares | Dollars | Shares | Dollars | |||||||||||
Shares sold | ||||||||||||||
Class A | 5,515,786 | $ | 17,841,065 | 10,750,826 | $ | 26,396,706 | ||||||||
Class B | 2,008,357 | 5,589,548 | 5,024,492 | 10,647,555 | ||||||||||
Class C | 846,797 | 2,407,414 | 1,725,147 | 3,731,260 | ||||||||||
Class I | 488 | 5,127 | 391,412 | 918,041 | ||||||||||
| $ | 25,843,154 | $ | 41,693,562 | |||||||||||
Shares redeemed | ||||||||||||||
Class A | (9,801,856 | ) | $ | (31,815,891 | ) | (19,216,790 | ) | $ | (46,569,104 | ) | ||||
Class B | (3,830,871 | ) | (10,656,765 | ) | (8,766,669 | ) | (18,394,412 | ) | ||||||
Class C | (1,305,001 | ) | (3,710,165 | ) | (1,670,737 | ) | (3,570,247 | ) | ||||||
Class I | (10,726 | ) | (36,289 | ) | (1,914,302 | ) | (4,594,052 | ) | ||||||
| $ | (46,219,110 | ) | $ | (73,127,815 | ) | |||||||||
Net increase (decrease) | ||||||||||||||
Class A | (4,286,070 | ) | $ | (13,974,826 | ) | (8,465,964 | ) | $ | (20,172,398 | ) | ||||
Class B | (1,822,514 | ) | (5,067,217 | ) | (3,742,177 | ) | (7,746,857 | ) | ||||||
Class C | (458,204 | ) | (1,302,751 | ) | 54,410 | 161,013 | ||||||||
Class I | (10,238 | ) | (31,162 | ) | (1,522,890 | ) | (3,676,011 | ) | ||||||
| $ | (20,375,956 | ) | $ | (31,434,253 | ) | |||||||||
23
Table of Contents
G. Regulatory Matters and Litigation
Since at least July 2003, federal, state and industry regulators have been conducting ongoing inquiries and investigations (“inquiries”) into the mutual fund industry, and have requested information from numerous mutual fund companies, including Scudder Investments. We are unable to determine what the outcome of these inquiries will be or what the effect, if any, would be on the funds or their advisers. Publicity about mutual fund practices arising from these industry wide inquiries serve as the general basis of a number of private lawsuits against the Scudder Funds. These lawsuits, which previously have been reported in the press, involve purported class action and derivative lawsuits, making various allegations and naming as defendants various persons, including certain Scudder funds, Deutsche Asset Management (“DeAM”) and its affiliates, certain individuals, including in some cases Fund Trustees/Directors, and other parties. DeAM has undertaken to bear all liabilities and expenses incurred by the Scudder funds in connection with these lawsuits, or other lawsuits or regulatory actions that may be filed making allegations similar to these lawsuits regarding fund valuation, market timing, revenue sharing or other subjects of the pending inquiries. Based on currently available information, DeAM believes the likelihood that the pending lawsuits will have a material adverse financial impact on a Scudder fund is remote and such actions are not likely to materially affect its ability to perform under its investment management agreements with the Scudder funds.
24
Table of Contents
Automated Information Lines | ScudderACCESS (800) 972-3060 | |
| Personalized account information, information on other Scudder funds and services via touchtone telephone and for Classes A, B, and C only, the ability to exchange or redeem shares. | ||
Web Site | scudder.com | |
| View your account transactions and balances, trade shares, monitor your asset allocation, and change your address, 24 hours a day. Obtain prospectuses and applications, blank forms, interactive worksheets, news about Scudder funds, subscription to fund updates by e-mail, retirement planning information, and more. | ||
For More Information | (800) 621-1048 | |
| To speak with a Scudder service representative. | ||
Written Correspondence | Scudder Investments | |
PO Box 219356 Kansas City, MO 64121-9356 | ||
| Proxy Voting | A description of the fund’s policies and procedures for voting proxies for portfolio securities can be found on our Web site - scudder.com (type “proxy voting” in the search field) - or on the SEC’s Web site - www.sec.gov. To obtain a written copy without charge, call us toll free at (800) 621-1048. | |
| Principal Underwriter | If you have questions, comments or complaints, contact: | |
| Scudder Distributors, Inc. | ||
222 South Riverside Plaza Chicago, IL 60606-5808 (800) 621-1148 | ||
| Class A | Class B | Class C | ||||
Nasdaq Symbol | KSCAX | KSCBX | KSCCX | |||
CUSIP Number | 81114R-103 | 81114R-202 | 81114R-301 | |||
Fund Number | 004 | 204 | 304 |
25
Table of Contents
This privacy statement is issued by Deutsche Investment Management Americas Inc., Deutsche Asset Management, Inc., Scudder Distributors, Inc., Scudder Investor Services, Inc., Scudder Trust Company and the Scudder Funds.
We never sell customer lists or individual client information. We consider privacy fundamental to our client relationships and adhere to the policies and practices described below to protect current and former clients’ information. Internal policies are in place to protect confidentiality, while allowing client needs to be served. Only individuals who need to do so in carrying out their job responsibilities may access client information. We maintain physical, electronic and procedural safeguards that comply with federal standards to protect confidentiality. These safeguards extend to all forms of interaction with us, including the Internet.
In the normal course of business, clients give us nonpublic personal information on applications and other forms, on our websites, and through transactions with us or our affiliates. Examples of the nonpublic personal information collected are name, address, Social Security number and transaction and balance information. To be able to serve our clients, certain of this client information is shared with affiliated and nonaffiliated third party service providers such as transfer agents, custodians, and broker-dealers to assist us in processing transactions and servicing your account with us. In addition, we may disclose all of the information we collect to companies that perform marketing services on our behalf or to other financial institutions with which we have joint marketing agreements. The organizations described above that receive client information may only use it for the purpose designated by the Scudder Companies listed above.
We may also disclose nonpublic personal information about you to other parties as required or permitted by law. For example, we are required or we may provide information to government entities or regulatory bodies in response to requests for information or subpoenas, to private litigants in certain circumstances, to law enforcement authorities, or any time we believe it necessary to protect the firm.
Questions on this policy may be sent to:
Scudder Investments
Attention: Correspondence - Chicago
P.O. Box 219415
Kansas City, MO 64121-9415
August 2003
26
Table of Contents
PART C. OTHER INFORMATION
| Item 15 | Indemnification |
Incorporated by reference to Post-Effective Amendment No. 38 to Registrant’s Registration Statement as filed with the Commission on April 29, 1996.
| Item 16 | Exhibits |
| (1) | Declaration of Trust dated July 21, 1986; 1 |
| (a) | Supplement to Declaration of Trust dated October 20, 1986; 1 |
| (b) | Second Supplement to Declaration of Trust dated May 16, 1988; 1 |
| (c) | Amendment to Declaration of Trust dated August 16, 1996; 10 |
| (d) | Certificate of Amendment dated May 16, 2003; 10 |
| (2) | By-Laws; 1 |
| (3) | Incorporated by reference to Exhibit (b) above; |
| (4) | Agreement and Plan of Reorganization; ** |
| (5) | Rule 18f-3 Plan, as amended; 10 |
| (6) | (a) Investment Advisory Agreement dated July 30, 2002 between International Equity Portfolio and Deutsche Asset Management, Inc.; 6 |
| (b) Investment Sub-Advisory Agreement dated September 30, 2002 among International Equity Portfolio, Deutsche Asset Management, Inc. and Deutsche Asset Management Investment Services Limited; 6 |
| (c) Investment Advisory Agreement dated July 30, 2002 between BT Investment Funds and Deutsche Asset Management, Inc., 11 |
| (d) Investment Advisory Agreement dated July 30, 2003 between the Registrant and Deutsche Asset Management, Inc.; 7 |
| (e) Investment Advisory Agreement dated July 30, 2003 between the BT Investment Portfolios and Deutsche Asset Management, Inc.; 7 |
| (f) Investment Advisory Agreement dated July 30, 2003 between Cash Management Portfolio and Deutsche Asset Management, Inc.; 11 |
| (g) Investment Advisory Agreement dated July 30, 2002 between Treasury Money Portfolio and Deutsche Asset Management, Inc.; 7 |
| (h) Form of Amendment to Investment Sub-Advisory Agreement between the Registrant, Deutsche Asset Management, Inc. and Deutsche Asset Management Investment Services Limited;10 |
| (7) | Distribution Agreement dated August 19, 2002; 4 |
| (8) | Not applicable; |
Table of Contents
| (9) | (a) Custodian Agreement dated July 1, 1996; 2 |
| (b) | Custodian Agreement between the Registrant and State Street Bank and Trust Company, dated April 1, 2003; 7 |
| (10) | Rule 12b-1 Plan(s); 5, 8 |
| (11) | (a) Opinion and consent of Willkie Farr & Gallagher LLP;** |
| (b) | Opinion and consent of local counsel;** |
| (12) | Form of tax opinion of Willkie Farr & Gallagher LLP;** |
| (13) | (a) Administration Agreement dated July 1, 2001; 3 |
| (b) Expense Limitation Agreement dated September 4, 2002; 4 |
| (c) Fund Accounting Agreement between Investment Company Capital Corporation and Scudder Fund Accounting Corporation dated June 3, 2002; 7 |
| (d) Sub-Administration and Sub-Fund Accounting Agreement between Investment Company Capital Corporation, Scudder Fund Accounting and State Street Bank and Trust Company dated April 1, 2003; 11 |
| (e) Transfer Agency Agreement dated December 16, 2002 with Scudder Investment Services Company; 10 |
| (f) Agency Agreement between Scudder Investments Service Company and DST Systems, Inc., dated January 15, 2003; 7 |
| (g) Expense Limitation Agreement dated April 25, 2003; 9 |
| (h) Expense Limitation Agreement dated August 1, 2003; 11 |
| (14) | Consent of Independent Accountants;** |
| (15) | Not applicable |
| (16) | Power of Attorney;* |
| (17) | Not applicable |
| 1 | Incorporated by reference to Post-Effective Amendment No. 34 to Registrant’s Registration Statement on Form N-lA (“Registration Statement”) as filed with the Securities and Exchange (“Commission”) on July 31, 1995. |
| 2 | Incorporated by reference to Post-Effective Amendment No. 44 to Registrant’s Registration Statement as filed with the Commission on July 1, 1997. |
| 3 | Incorporated by reference to Post-Effective Amendment No. 84 to Registrant’s Registration Statement as filed with the Commission on June 29, 2001. |
| 4 | Incorporated by reference to Post-Effective Amendment No. 95 to Registrant’s Registration Statement as filed with the Commission on November 27, 2002. |
| * | Filed herewith. |
| ** | To be filed by pre-effective amendment. |
2
Table of Contents
| 5 | Incorporated by reference to Post-Effective Amendment No. 98 to Registrant’s Registration Statement as filed with the Commission on February 3, 2003. |
| 6 | Incorporated by reference to Post-Effective Amendment No. 99 to Registrant’s Registration Statement as filed with the Commission on February 28, 2003. |
| 7 | Incorporated by reference to Post-Effective Amendment No. 100 to Registrant’s Registration Statement as filed with the Commission on April 30, 2003. |
| 8 | Incorporated by reference to Post-Effective Amendment No. 104 to Registrant’s Registration Statement as filed with the Commission on October 1, 2003. |
| 9 | Incorporated by reference to Post-Effective Amendment No. 105 to Registrant’s Registration Statement as filed with the Commission on January 30, 2004. |
| 10 | Incorporated by reference to Post-Effective Amendment No. 106 to Registrant’s Registration Statement as filed with the Commission on February 27, 2004. |
| 11 | Incorporated by reference to Post-Effective Amendment No. 107 to Registrant’s Registration Statement as filed with the Commission on April 29, 2004. |
| Item 17 | Undertakings: |
(1) The undersigned registrant agrees that prior to any public reoffering of the securities registered through the use of a prospectus which is a part of this Registration Statement by any person or party who is deemed to be an underwriter within the meaning of Rule 145(c) of the Securities Act [17 CFR 230.145c], the reoffering prospectus will contain the information called for by the applicable registration form for reofferings by persons who may be deemed underwriters, in addition to the information called for by the other items of the applicable form.
(2) The undersigned registrant agrees that every prospectus that is filed under paragraph (1) above will be filed as a part of an amendment to the Registration Statement and will not be used until the amendment is effective, and that, in determining any liability under the Securities Act of 1933, as amended, each post-effective amendment shall be deemed to be a new registration statement for the securities offered therein, and the offering of the securities at that time shall be deemed to be the initial bona fide offering of them.
3
Table of Contents
SIGNATURES
As required by the Securities Act of 1933, as amended, this Registration Statement has been signed on behalf of the registrant, in the City of New York and State of New York, on the 2nd day of August, 2004.
Scudder Advisor Funds | ||
By: | /s/ Julian Sluyers | |
Julian Sluyters | ||
Chief Executive Officer | ||
Pursuant to the requirements of the Securities Act of 1933, as amended, this Registration Statement has been signed below by the following persons in the capacities and on the dates indicated:
Signature | Title | Date | ||
/s/ Julian Sluyters Julian Sluyters | Chief Executive Officer | August 2, 2004 | ||
/s/ Charles A. Rizzo Charles A. Rizzo | Treasurer and Chief Financial Officer | August 2, 2004 | ||
/s/ Richard A. Burt* Richard R. Burt | Trustee | August 2, 2004 | ||
/s/ S. Leland Dill* S. Leland Dill | Trustee | August 2, 2004 | ||
/s/ Martin J. Gruber* Martin J. Gruber | Trustee | August 2, 2004 | ||
/s/ Joseph R. Hardiman* Joseph R. Hardiman | Trustee | August 2, 2004 | ||
/s/ Richard J. Herring* Richard J. Herring | Trustee | August 2, 2004 | ||
/s/ Graham E. Jones* Graham E. Jones | Trustee | August 2, 2004 | ||
/s/ Rebecca W. Rimel* Rebecca W. Rimel | Trustee | August 2, 2004 | ||
/s/ Philip Saunders, Jr.* Philip Saunders, Jr. | Trustee | August 2, 2004 | ||
/s/ William N. Searcy* William N. Searcy | Trustee | August 2, 2004 | ||
Robert H. Wadsworth | Trustee | August , 2004 | ||
Table of Contents
*By: | /s/ Caroline Pearson | |
| Caroline Pearson** | ||
| Assistant Secretary | ||
| ** | Attorney-in-fact pursuant to the powers of attorney filed herein. |
Table of Contents
SCUDDER ADVISOR FUNDS
Exhibit Index
| (16 | ) | Power of attorney | |