CORPORATE
Profile
The South Financial Group, headquartered in Greenville, South Carolina, is a financial holding company focused on fast-growing banking markets in the Southeast. Founded in 1986, it now has approximately $ 10.7 billion in total assets and 134 branch offices in South Carolina, North Carolina and Florida. The South Financial Group operates through two subsidiary banks:
| • | | Carolina First Bank, the largest South Carolina-headquartered commercial bank, operates in South Carolina, North Carolina and on the Internet under the brand name, Bank Caroline, and |
| • | | Mercantile Bank, principally serving Jacksonville, Orlando and Tampa Bay, Florida. |
The South Financial Group uses a super-community bank strategy serving small and middle market businesses and retail consumers by offering a full range of financial services, including cash management, investments, insurance and trust services. Its common stock trades on The Nasdaq Stock Market under the symbol TSFG.
TABLE
of Contents
| | | | | |
| | Inside front cover |
| | | 1 | |
| | | 2 | |
| | | 6 | |
| | | 8 | |
| | | 14 | |
| | | 15 | |
| | | 16 | |
| | | 20 | |
| | | 22 | |
| | | 24 | |
| | | 26 | |
| | Inside back cover |
SUMMARY
Annual Report
The 2003 Annual Report is presented in a summary format intended to provide information in a concise, summarized manner that will be meaningful and useful to the widest range of readers. The audited financial statements and detailed analytical schedules are contained in The South Financial Group’s Annual Report on Form 10-K for the year ended December 31, 2003 filed with the Securities and Exchange Commission.
FINANCIAL
Highlights
($ in thousands, except per share data)
| | | | | | | | | | | | | |
| | | 2003
| | 2002
| | % Change
|
EARNINGS AND DIVIDENDS | | | | | | | | | | | | |
| Net interest income | | $ | 272,591 | | | $ | 218,252 | | | | 25 | % |
| Noninterest income | | | 95,490 | | | | 59,640 | | | | 60 | |
| Total revenue | | | 368,081 | | | | 277,892 | | | | 32 | |
| Provision for loan losses | | | 20,581 | | | | 22,266 | | | | (8 | ) |
| Noninterest expenses, excluding merger-related costs | | | 202,043 | | | | 156,176 | | | | 29 | |
| Merger-related costs | | | 5,127 | | | | 6,664 | | | | n/m | |
| Net income | | | 95,058 | | | | 59,158 | | | | 61 | |
| Operating earnings (a) | | | 89,232 | | | | 63,500 | | | | 41 | |
| Per share — diluted: | | | | | | | | | | | | |
| Net income | | $ | 1.89 | | | $ | 1.38 | | | | 37 | |
| Operating earnings (a) | | | 1.77 | | | | 1.49 | | | | 19 | |
| Cash dividends declared per share | | | 0.57 | | | | 0.50 | | | | 14 | |
RATIOS | | | | | | | | | | | | |
| Return on average assets | | | 1.03 | % | | | 0.91 | % | | | | |
| Return on average equity | | | 13.40 | | | | 11.89 | | | | | |
| Average balances: | | | | | | | | | | | | |
| Assets | | $ | 9,260,767 | | | $ | 6,497,607 | | | | 43 | % |
| Shareholders’ equity | | | 709,139 | | | | 497,341 | | | | 43 | |
AT YEAR END | | | | | | | | | | | | |
| Total assets | | $ | 10,719,401 | | | $ | 7,941,010 | | | | 35 | % |
| Loans held for investment | | | 5,732,205 | | | | 4,434,011 | | | | 29 | |
| Securities | | | 4,007,571 | | | | 2,572,186 | | | | 56 | |
| Shareholders’ equity | | | 979,869 | | | | 646,799 | | | | 51 | |
| Book value per share | | $ | 16.59 | | | $ | 13.66 | | | | 21 | |
| Market price per share (Nasdaq) | | | 27.75 | | | | 20.66 | | | | 34 | |
ASSET QUALITY RATIOS | | | | | | | | | | | | |
| Nonperforming assets | | | 1.06 | % | | | 1.67 | % | | | | |
Nonperforming assets, excluding
Rock Hill Bank & Trust Workout Loans (b) | | | 0.72 | | | | 1.03 | | | | | |
| Net loan charge-offs | | | 0.62 | | | | 0.49 | | | | | |
Net loan charge-offs, excluding
Rock Hill Bank & Trust Workout Loans (b) | | | 0.41 | | | | 0.50 | | | | | |
OPERATIONS DATA | | | | | | | | | | | | |
| Branch offices (c) | | | 134 | | | | 117 | | | | 15 | % |
| ATMs | | | 122 | | | | 105 | | | | 16 | |
| Employees (full-time equivalent) | | | 1,918 | | | | 1,700 | | | | 13 | |
Notes:
| (a) | | See page 19 for a reconciliation of GAAP net income and operating earnings. |
| |
| (b) | | At December 31, 2003, Rock Hill Bank & Trust Workout Loans totaled $28.6 million with nonperforming assets of $19.6 million. At December 31, 2002, Rock Hill Bank & Trust Workout Loans totaled $72.4 million with nonperforming assets of $29.2 million. Net loan charge-offs for Rock Hill Bank & Trust Workout Loans totaled $10.3 million and a recovery of $(367,000) for 2003 and 2002, respectively. |
| |
| (c) | | Excludes one branch office for Community National Bank of Pulaski, Virginia, which TSFG acquired as part of its MountainBank Financial Corporation acquisition. On February 3, 2004, TSFG entered into a definitive asset sale agreement to sell substantially all of Community National Bank’s assets and liabilities. |
 1
1
Focus. Discipline. Execution.
At The South Financial Group, we’ve put our
strategic plan into motion. Going forward, we’re focused
on executing that plan, increasing profitability and
bringing the highest possible value
to our Shareholders...
The year 2003 was the best year in the history of The South Financial Group. We delivered another year of record earnings. As promised, we achieved double-digit growth in revenues, loans and deposits. We increased our returns to shareholders. However, as proud as I am ofwhatThe South Financial Group achieved in 2003, I’m even more proud ofhowwe did it. We focused on what we needed to accomplish. We maintained our discipline. And we put the right team of professionals in place to execute our strategic plans.
For our first fourteen years, The South Financial Group emphasized strategicgrowth and expansion,focusing on the most attractive banking markets in the Southeast. We have created an impressive geographic footprint in the region. Three years ago, we shifted that focus toprofitability.Consequently, we developed a strategic plan that balanced profitability and growth, and concentrated on creating value for our shareholders. With a disciplined management team in place to execute this plan, we are witnessing the results of that focus and discipline.
For 2003, net income increased 61% over 2002 to $95.1 million. For eleven consecutive quarters, operating EPS has increased. Over this eleven quarter period, our operating earnings per share have increased at an annualized rate of 37%.
In 2003, TSFG’s total return to shareholders was 37%, making 2003 a rewarding year for our shareholders. Over the past three years, TSFG’s annualized total return to shareholders has exceeded 30%, outperforming most bank and stock market indexes.
Focus, discipline and execution produced results throughout 2003. Here are some of the highlights:
Loans and transaction deposits grew at double-digit rates.While we operate in thriving markets, The South Financial Group is actually growingfasterthan the markets themselves. More importantly, Carolina First and Mercantile Bank are taking market share from competitors.
Key credit quality measures continued to show improvement.Both our nonperforming asset ratio and charge-off ratio declined in 2003. We are very close to resolving the Rock Hill Bank & Trust workout loans; only $29 million remains in the portfolio, representing less than one half of 1% of our total loans.
Elevate sales process made impressive inroads. Our Elevate sales process did what it was designed to do: increase the number of products per household. By year’s end, we met our goal of 3.5 products per household (excluding the recently acquired MountainBank operations), and we significantly increased our overall number of households, up 25% for the year. This represents a solid foundation for future improvement.
We expanded and strengthened our geographic franchise.While our focus remains on profitability, we expanded our footprint in Western North Carolina with our acquisition of MountainBank. And in January, we announced an agreement to acquire CNB Florida Bancshares. Upon completion of this merger, we will have 50 branches and over $3 billion in assets in Florida.
2
Corporate Headquarters, Greenville, SC 7:43 a.m.
“The year 2003 was one of dramatic progress for The south Financial Group. The successes of the past year have given us a great deal of confidence in our long-term growth potential. We have talented, experienced professionals in place. We operate in superior banking markets. We are focused on our goals. We have the discipline to stick to our plans and execute them successfully. In short, we are prepared for the future right now.”
Mack I. Whittle, Jr.
President and Chief Executive Officer
Mack I. Whittle, Jr., a founder of the company in 1986, has led The South Financial Group since its inception. In the past seventeen years, The South Financial Group has grown from a local, start-up bank to a regional super-community bank with $10.7 billion in assets. Under his guidance, The South Financial Group has remained true to its mission to “take banking personally.”

Focus. Discipline. Execution.
Successful equity offering raised $161 million in new capital.The infusion of new capital in 2003 created a tangible equity to tangible asset ratio exceeding 6%. This laid the foundation for profitable expansion with solid capital levels. Additionally, Carolina First Bank received an “investment grade” rating from Moody’s, enhancing our ability to borrow at reasonable rates.
Setting three-year goals focused our team.In 2001, we set strategic, three-year goals. During this three-year period, we completed four strategic acquisitions and a very successful equity offering. The last acquisition, MountainBank, and our equity offering occurred in the final quarter of our plan and added approximately $300 million in new equity. However, excluding MountainBank and the equity offering, we exceeded our ROE goal and came close to our ROA goal. This is a tribute to our management team and our people.
Focus for 2004
Moving forward, we remain focused on increased earnings growth, higher performance and enhanced value for shareholders. What can you expect in 2004... and the next three years?
Continued focus on our geographic footprint.The South Financial Group operates in superior geographic markets having superior market demographics. In fact, growth rates in our markets exceed the Southeastern and U.S. medians for number of households and per capita income. This market strength enhances our opportunities to provide noninterest income products and services, as well as organic growth of loans and deposits. In short, we have the opportunity to gain more share and revenue.
4
“Three years ago, we shifted our focus toprofitability.Consequently, we developed a strategic plan that balanced profitability and growth, and concentrated on creating value for our shareholders. With a disciplined management team in place to execute this plan, we are witnessing the results of that focus and discipline.”
An efficiency ratio below 55%.During the past sixteen months, we acquired four banks with nearly $2 billion in assets. These new customers represent significant opportunities for future growth and increased market share. And while the recent acquisitions were smoothly and successfully integrated, we’ve yet to realize the full potential from these new customers. Enhanced efficiency from revenue growth and expense control in all of our operations will keep our operating efficiency ratio (noninterest expenses divided by total revenue) below 55%, a level we attained in the final quarter of 2003.
Increased noninterest income.We are still below our high performance peer group’s 30% average for noninterest income as a percentage of total revenue. (For 2003, we averaged 26% using GAAP results, or 22% on an operating basis.) It is important to note that our solid performance over the past three years occurred without us achieving our potential in noninterest income. Consequently, this area represents one of the best opportunities for growth and improvement in our operations. Our Elevate sales process is designed to help bring us to that peer average. In addition, we enhanced our efforts to generate additional fee income by diversifying our noninterest income sources. We added two insurance agencies to our product portfolio, developed a successful Sales and Service Center, and expanded our cash management services. Our management team is committed to showing improvements in the coming quarters.
Reduced credit costs.Our early warning credit system is developing into a more mature credit culture for The South Financial Group. And this culture helps us maintain the discipline that ultimately results in lower credit costs.
New three-year goals based on high performing peer banks.We are raising the bar and setting new three-year goals of double-digit EPS growth (targeting the mid-teens) and by the end of 4th quarter 2006, a 1.30% ROA, a 15 to 17% ROE and a 20% cash return on equity. The results for 2003 proved that multiple-year goals effectively focus our team. We plan to continue that strategy in 2004 and beyond. These ambitious three-year goals clearly underscore a tremendous opportunity for The South Financial Group and its shareholders.
The year 2003 was one of dramatic progress for The South Financial Group. The successes of the past year have given us a great deal of confidence in our long-term growth potential. We have talented, experienced professionals in place. We operate in superior banking markets. We are focused on our goals. We have the discipline to stick to our plans and execute them successfully. In short, we are prepared for the future right now.
And finally, this letter would not be complete without expressing our appreciation to our employees for their dedicated performance. We are grateful to our shareholders and our customers for continuing to support our efforts. Ultimately, it is your confidence as investors and your loyalty as customers that make the success of The South Financial Group possible.
Sincerely,

Mack I. Whittle, Jr.
President and Chief Executive Officer
5
Focus. Discipline. Execution.
Communication is crucial to successful relationships with our
shareholders and customers. That’s why we always keep the lines
of communication open ... and always make time for
Questions & Answers.
Q:How do acquisitions coincide with your three-year goals?
A:We will pursue acquisitions that build our franchise and our earnings. However, acquisitions will not distract us from achieving our three-year goals. Furthermore, any acquisitions will be in our targeted footprint and in markets growing faster than the U.S. and Southeast medians for household growth and per capita income growth. We will not get into a pricing war on acquisitions. We will be disciplined. In short, we will do acquisitions if they meet these strict criteria.
Q:Why divide your franchise into banking markets, each run by a Market President?
A:We divide our franchise into market areas because it allows us to operate like a community bank from a customer perspective. The Market President knows the customers and can make the banking decisions locally. However, because of the size of our overall organization, we can offer a full range of sophisticated products and services that community banks cannot. Our model is very similar to one used by the former Barnett Bank. Because each market is different, our pricing, mix of loans and deposits, and demand for particular products vary from place to place. Having a Market President who is a member of the community also ensures that we provide the right types of products and services.

Q:Could you provide an update on the progress of Elevate, the Cohen-Brown sales process?
A:Our Elevate sales process provides the foundation for making our bank a “sales and service” organization. In 2003, the Elevate process allowed us to increase our number of total households 25%, which is excellent progress. We’ve also increased the number of products per household. At the end of 2003, we increased to 3.3 products per household or, if you exclude MountainBank, 3.5 products per household, which was our year-end 2003 goal.
Q:How have you been able to meet your goal of double-digit loan growth during challenging economic times?
A:First, we operate in some of the best markets in the Southeast. Plus, we are gaining business in all of our markets. Our Florida markets are especially strong, with 2003 growth ranging from 8% in Tampa Bay to 29% in North Florida. Also, we continue to refine and develop our Elevate sales process, which helps us increase market share and increase the number of products we provide to these customers.
6
Q:How do you manage your securities portfolio?
A:The composition and risk profile of our balance sheet dictate the size and composition of our securities portfolio. We use our securities portfolio for four primary purposes: (1) to provide liquidity to fund loan growth, (2) to manage interest rate risk for the entire balance sheet, (3) to provide collateral for pledges on public deposits and securities sold under repurchase agreements and (4) to provide additional income. We have taken steps to reduce the portfolio risk and have shortened the duration to approximately three and a half years. The short weighted average life and duration provide us with cash flow to proactively manage as market conditions change. During 2004, we expect to reduce the level of our securities portfolio as a percentage of total assets, as loan growth replaces a portion of the securities with new loans.
Q:Congress, as well as investors, is focused on “corporate governance.” How does The South Financial Group measure up in this area?
A:The short answer is that an independent industry group rated our corporate governance as being in the top 15% of all public companies. This rating is, in part, reflective of our increased attention to this area over the past two years. For example, in 2002, our Board of Directors established a Nominating and Corporate Governance Committee, consisting entirely of independent directors. We fully implemented the CEO and CFO certification requirements of the Sarbanes-Oxley Act of 2002 and created a Disclosure Committee to ensure compliance with the disclosure obligations of that Act. The Board of Directors has also designated two members of its Audit Committee as “financial experts,” as defined in the Act. We intend to continue to run our company within a good corporate governance framework.
7
Our Market Presidents will have the authority
to make decisions locally for their local customers.
We want to feel like a community bank
every time a customer walks in the door
or runs down the sidewalk.
Sandberg Drive, Flat Rock, NC 6:34 a.m.
“True Story. Really. I was out jogging early one morning, and on the other side of the street, coming at me, is my banker, J.W. Davis. We must have both been on about mile five, because we’re huffing and puffing. I gotta say, he looked worse off than I did. Anyway, we’re about to pass each other and I have just enough breath to yell at him, “I think I might need a loan for a new oven!” And he yells back, “Come on by today and we’ll talk!” By the end of business that afternoon, I had the loan to buy a large capacity oven for our cookies. You see, J.W. can make decisions on the spot. He doesn’t have to run things by some corporate office a thousand miles away. He doesn’t have to sell my story upstream. He lives in this community. He knows folks in this area, so he can be responsive to our needs. I never get the feeling that some strangers are making decisions looking at a spread sheet and a computer screen. Who I am counts for something. I mean, how many banks will let you ask for a loan on your morning jog? This one will.”

Scott Blackwell
President and CEO, Immaculate Baking Company
We will continue to truly know each of our customers,
living up to our promise to “take banking personally.”
We’ll be able to recommend the products and services
to meet their needs, from a business loan
to a new pew.
First Nazareth Baptist Church, Columbia, SC Sunday Afternoon
“From our first interview with them,we were very impressed with Carolina First. And they have maintained the same image. After becoming our lending agent, they made sure to reiterate that they desired to establish a relationship with our members, and they have done just that. We have referred others to them, and the response was positive and prompt. We are grateful to God that Carolina First has worked to make that first impression a lasting one.”

Blakely N. Scott
Pastor, First Nazareth Baptist Church
Focus. Discipline. Execution.
In each of our markets, we will give our employees the tools they
need to achieve our strategic goals — the training and products and
services that allow them to cultivate lasting customer relationships.
And when employees of The South Financial Group shine, we will
recognize their efforts.
12
1200 Riverplace Boulevard, Jacksonville, FL Tuesday Morning
“Winning the President’s Award means we were a successful team. It means we have people who truly care about our customers and the experience they have when they come through our door. We listen. We consult. We advise. The basis for our success is customer service. I learned that lesson years ago. My dad owned an appliance business and if one of his customers had a problem with a television set, he’d let them borrow the one in our living room... just to make them happy. Seriously, whatever it took, that’s what he’d do. I saw the value of customer service. Dad’s customers knew he would always go the extra mile. That’s the same attitude we have here. We work hard as a team to know our customers better and to find the right solutions to help them be successful. When our customers are successful, we’re successful.”

Cindy Stover
Market President, North Florida
Winner of the President’s Award, 2003
The President’s Award, the most prestigious recognition given by The South Financial Group, is presented to the top performing Market President for each bank. The award is based on performance in multiple categories including profitability, efficiency, credit quality, loan, deposit and noninterest income growth.
CONDENSED CONSOLIDATED
Balance Sheets
The South Financial Group and Subsidiaries
($ in thousands, except per share data)
| | | | | | | | | |
| | | December 31,
|
| | | 2003
| | 2002
|
ASSETS | | | | | | | | |
| Cash and due from banks | | $ | 184,057 | | | $ | 201,333 | |
| Interest-bearing bank balances | | | 2,048 | | | | 58,703 | |
| Federal funds sold | | | 137 | | | | 31,293 | |
| Securities | | | | | | | | |
| Trading | | | 480 | | | | 350 | |
| Available for sale | | | 3,915,994 | | | | 2,488,944 | |
| Held for maturity (market value $93,188 in 2003 and $85,371 in 2002) | | | 91,097 | | | | 82,892 | |
| | | |
| | | |
| |
| Total securities | | | 4,007,571 | | | | 2,572,186 | |
| | | |
| | | |
| |
| Loans | | | | | | | | |
| Loans held for sale | | | 29,619 | | | | 67,218 | |
| Loans held for investment | | | 5,732,205 | | | | 4,434,011 | |
| Allowance for loan losses | | | (73,287 | ) | | | (70,275 | ) |
| | | |
| | | |
| |
| Net loans | | | 5,688,537 | | | | 4,430,954 | |
| | | |
| | | |
| |
| Premises and equipment, net | | | 142,705 | | | | 137,501 | |
| Accrued interest receivable | | | 48,365 | | | | 37,080 | |
| Intangible assets | | | 353,079 | | | | 242,182 | |
| Other assets | | | 292,902 | | | | 229,778 | |
| | | |
| | | |
| |
| | | $ | 10,719,401 | | | $ | 7,941,010 | |
| | | |
| | | |
| |
LIABILITIES AND SHAREHOLDERS’ EQUITY | | | | | | | | |
| Liabilities | | | | | | | | |
| Deposits | | | | | | | | |
| Noninterest-bearing | | $ | 882,129 | | | $ | 743,174 | |
| Interest-bearing | | | 5,146,520 | | | | 3,849,336 | |
| | | |
| | | |
| |
| Total deposits | | | 6,028,649 | | | | 4,592,510 | |
| Federal funds purchased and repurchase agreements | | | 834,866 | | | | 1,110,840 | |
| Other short-term borrowings | | | 56,079 | | | | 81,653 | |
| Long-term debt | | | 2,702,879 | | | | 1,221,511 | |
| Debt associated with trust preferred securities | | | — | | | | 95,500 | |
| Accrued interest payable | | | 24,520 | | | | 20,945 | |
| Other liabilities | | | 92,539 | | | | 84,840 | |
| | | |
| | | |
| |
| Total liabilities | | | 9,739,532 | | | | 7,207,799 | |
| | | |
| | | |
| |
| Minority interest in consolidated subsidiary | | | — | | | | 86,412 | |
| | | |
| | | |
| |
| Shareholders’ Equity: | | | | | | | | |
| Preferred stock — no par value; authorized 10,000,000 shares; issued and outstanding none | | | — | | | | — | |
| Common stock — par value $1 per share; authorized 100,000,000 shares; issued and outstanding 59,064,375 shares in 2003 and 47,347,375 shares in 2002 | | | 59,064 | | | | 47,347 | |
| Surplus | | | 712,788 | | | | 427,448 | |
| Retained earnings | | | 216,678 | | | | 150,948 | |
| Guarantee of employee stock ownership plan debt and nonvested restricted stock | | | (2,494 | ) | | | (3,094 | ) |
| Common stock held in trust for deferred compensation | | | (151 | ) | | | — | |
| Deferred compensation payable in common stock | | | 151 | | | | — | |
| Accumulated other comprehensive income (loss), net of tax | | | (6,167 | ) | | | 24,150 | |
| | | |
| | | |
| |
| Total shareholders’ equity | | | 979,869 | | | | 646,799 | |
| | | |
| | | |
| |
| | | $ | 10,719,401 | | | $ | 7,941,010 | |
| | | |
| | | |
| |
14
CONDENSED CONSOLIDATED
Statements of Income
The South Financial Group and Subsidiaries
($ in thousands, except per share data)
| | | | | | | | | | | | | |
| | | Years Ended December 31,
|
| | | 2003
| | 2002
| | 2001
|
| INTEREST INCOME | | | | | | | | | | | | |
| Interest and fees on loans | | $ | 280,609 | | | $ | 260,718 | | | $ | 301,312 | |
| Interest and dividends on securities | | | | | | | | | | | | |
| Taxable | | | 128,060 | | | | 87,554 | | | | 65,381 | |
| Exempt from Federal income taxes | | | 4,980 | | | | 4,367 | | | | 4,025 | |
| | | |
| | | |
| | | |
| |
| Total interest and dividends on securities | | | 133,040 | | | | 91,921 | | | | 69,406 | |
| Interest on short-term investments | | | 479 | | | | 1,100 | | | | 1,383 | |
| | | |
| | | |
| | | |
| |
| Total interest income | | | 414,128 | | | | 353,739 | | | | 372,101 | |
| | | |
| | | |
| | | |
| |
| INTEREST EXPENSE | | | | | | | | | | | | |
| Interest on deposits | | | 76,344 | | | | 82,858 | | | | 144,858 | |
| Interest on short-term borrowings | | | 11,419 | | | | 21,975 | | | | 25,342 | |
| Interest on long-term debt | | | 53,774 | | | | 30,654 | | | | 27,124 | |
| | | |
| | | |
| | | |
| |
| Total interest expense | | | 141,537 | | | | 135,487 | | | | 197,324 | |
| | | |
| | | |
| | | |
| |
| NET INTEREST INCOME | | | 272,591 | | | | 218,252 | | | | 174,777 | |
| PROVISION FOR LOAN LOSSES | | | 20,581 | | | | 22,266 | | | | 22,045 | |
| | | |
| | | |
| | | |
| |
| Net interest income after provision for loan losses | | | 252,010 | | | | 195,986 | | | | 152,732 | |
| NONINTEREST INCOME | | | 95,490 | | | | 59,640 | | | | 53,484 | |
| NONINTEREST EXPENSES | | | 207,170 | | | | 162,840 | | | | 140,820 | |
| | | |
| | | |
| | | |
| |
| Income before income taxes, minority interest, and cumulative effect of change in accounting principle | | | 140,330 | | | | 92,786 | | | | 65,396 | |
| Income taxes | | | 43,260 | | | | 28,972 | | | | 22,422 | |
| | | |
| | | |
| | | |
| |
| Income before minority interest and cumulative effect of change in accounting principle | | | 97,070 | | | | 63,814 | | | | 42,974 | |
| Minority interest in consolidated subsidiary, net of tax | | | (2,012 | ) | | | (3,250 | ) | | | (1,364 | ) |
| | | |
| | | |
| | | |
| |
| Income before cumulative effect of change in accounting principle | | | 95,058 | | | | 60,564 | | | | 41,610 | |
| Cumulative effect of change in accounting principle, net of tax | | | — | | | | (1,406 | ) | | | 282 | |
| | | |
| | | |
| | | |
| |
| NET INCOME | | $ | 95,058 | | | $ | 59,158 | | | $ | 41,892 | |
| | | |
| | | |
| | | |
| |
| AVERAGE COMMON SHARES OUTSTANDING, BASIC | | | 49,204,173 | | | | 41,714,994 | | | | 42,098,395 | |
| AVERAGE COMMON SHARES OUTSTANDING, DILUTED | | | 50,328,353 | | | | 42,714,938 | | | | 42,823,513 | |
| PER COMMON SHARE, BASIC: | | | | | | | | | | | | |
| Net income before cumulative effect of change in accounting principle | | $ | 1.93 | | | $ | 1.45 | | | $ | 0.99 | |
| Cumulative effect of change in accounting principle | | | — | | | | (0.03 | ) | | | 0.01 | |
| | | |
| | | |
| | | |
| |
| Net income | | $ | 1.93 | | | $ | 1.42 | | | $ | 1.00 | |
| | | |
| | | |
| | | |
| |
| PER COMMON SHARE, DILUTED: | | | | | | | | | | | | |
| Net income before cumulative effect of change in accounting principle | | $ | 1.89 | | | $ | 1.42 | | | $ | 0.97 | |
| Cumulative effect of change in accounting principle | | | — | | | | (0.04 | ) | | | 0.01 | |
| | | |
| | | |
| | | |
| |
| Net income | | $ | 1.89 | | | $ | 1.38 | | | $ | 0.98 | |
| | | |
| | | |
| | | |
| |
15
SIX-YEAR SUMMARY
of Selected Financial Data
The South Financial Group and Subsidiaries
($ in thousands, except per share data)
| | | | | | | | | | | | | | | | | | | | | | | | | | | | | |
| | | Years Ended December 31,
| | Five-Year
Compound |
| | | 2003
| | 2002
| | 2001
| | 2000
| | 1999
| | 1998
| | Growth Rate
|
| INCOME STATEMENT DATA | | | | | | | | | | | | | | | | | | | | | | | | | | | | |
| Net interest income | | $ | 272,591 | | | $ | 218,252 | | | $ | 174,777 | | | $ | 167,111 | | | $ | 174,614 | | | $ | 149,341 | | | | 12.8 | % |
| Provision for loan losses | | | 20,581 | | | | 22,266 | | | | 22,045 | | | | 23,378 | | | | 18,273 | | | | 15,646 | | | | 5.6 | |
| Noninterest income | | | 95,490 | | | | 59,640 | | | | 53,484 | | | | 48,545 | | | | 59,649 | | | | 34,924 | | | | 22.3 | |
| Noninterest expenses(a) | | | 202,043 | | | | 156,176 | | | | 141,321 | | | | 152,340 | | | | 147,674 | | | | 109,857 | | | | 13.0 | |
| Merger-related costs (recoveries) | | | 5,127 | | | | 6,664 | | | | (501 | ) | | | 29,198 | | | | 7,155 | | | | 3,526 | | | | n/m | |
| Net income | | | 95,058 | | | | 59,158 | | | | 41,892 | | | | 6,989 | | | | 40,450 | | | | 34,656 | | | | 22.4 | |
| | | |
| | | |
| | | |
| | | |
| | | |
| | | |
| | | |
| |
| PER COMMON SHARE DATA | | | | | | | | | | | | | | | | | | | | | | | | | | | | |
| Net income — basic | | $ | 1.93 | | | $ | 1.42 | | | $ | 1.00 | | | $ | 0.16 | | | $ | 0.95 | | | $ | 0.90 | | | | 16.5 | % |
| Net income — diluted | | | 1.89 | | | | 1.38 | | | | 0.98 | | | | 0.16 | | | | 0.93 | | | | 0.87 | | | | 16.8 | |
| Book value (December 31) | | | 16.59 | | | | 13.66 | | | | 11.11 | | | | 11.04 | | | | 11.55 | | | | 10.64 | | | | 9.3 | |
| Market price (December 31) | | | 27.75 | | | | 20.66 | | | | 17.75 | | | | 13.25 | | | | 18.25 | | | | 25.31 | | | | 1.9 | |
| Cash dividends declared | | | 0.57 | | | | 0.50 | | | | 0.45 | | | | 0.41 | | | | 0.37 | | | | 0.33 | | | | 11.6 | |
| Dividend payout ratio | | | 30.16 | % | | | 36.23 | % | | | 45.92 | % | | | 256.25 | % | | | 39.78 | % | | | 37.93 | % | | | | |
| | | |
| | | |
| | | |
| | | |
| | | |
| | | |
| | | |
| |
| BALANCE SHEET DATA (YEAR END) | | | | | | | | | | | | | | | | | | | | | | | | | | | | |
| Total assets | | $ | 10,719,401 | | | $ | 7,941,010 | | | $ | 6,029,442 | | | $ | 5,220,554 | | | $ | 4,768,656 | | | $ | 4,136,647 | | | | 21.0 | % |
| Securities | | | 4,007,571 | | | | 2,572,186 | | | | 1,643,395 | | | | 899,544 | | | | 964,146 | | | | 729,993 | | | | 40.6 | |
| Loans(b) | | | 5,761,824 | | | | 4,501,229 | | | | 3,736,763 | | | | 3,735,182 | | | | 3,291,720 | | | | 2,841,077 | | | | 15.2 | |
| Allowance for loan losses(b) | | | 73,287 | | | | 70,275 | | | | 44,587 | | | | 43,024 | | | | 33,756 | | | | 29,812 | | | | 19.7 | |
| Total earning assets | | | 9,783,087 | | | | 7,127,160 | | | | 5,479,252 | | | | 4,651,807 | | | | 4,262,837 | | | | 3,664,392 | | | | 21.7 | |
| Deposits | | | 6,028,649 | | | | 4,592,510 | | | | 3,605,255 | | | | 3,894,662 | | | | 3,481,651 | | | | 3,302,523 | | | | 12.8 | |
| Long-term debt | | | 2,702,879 | | | | 1,221,511 | | | | 411,294 | | | | 318,326 | | | | 314,279 | | | | 116,125 | | | | 87.7 | |
| Shareholders’ equity | | | 979,869 | | | | 646,799 | | | | 458,174 | | | | 468,653 | | | | 500,590 | | | | 450,989 | | | | 16.8 | |
| Nonperforming assets(b) | | | 60,774 | | | | 74,186 | | | | 43,857 | | | | 21,514 | | | | 13,972 | | | | 9,119 | | | | 46.1 | |
| | | |
| | | |
| | | |
| | | |
| | | |
| | | |
| | | |
| |
| BALANCE SHEET DATA (AVERAGE) | | | | | | | | | | | | | | | | | | | | | | | | | | | | |
| Total assets | | $ | 9,260,767 | | | $ | 6,497,607 | | | $ | 5,459,515 | | | $ | 5,032,700 | | | $ | 4,282,274 | | | $ | 3,726,204 | | | | 20.0 | % |
| Securities | | | 3,471,324 | | | | 1,850,798 | | | | 1,125,602 | | | | 875,876 | | | | 711,276 | | | | 637,089 | | | | 40.4 | |
| Loans | | | 4,915,437 | | | | 4,008,094 | | | | 3,769,358 | | | | 3,545,336 | | | | 3,045,913 | | | | 2,577,018 | | | | 13.8 | |
| Total earning assets | | | 8,425,590 | | | | 5,924,077 | | | | 4,928,970 | | | | 4,450,016 | | | | 3,820,904 | | | | 3,384,157 | | | | 20.0 | |
| Deposits | | | 5,147,627 | | | | 3,855,929 | | | | 3,688,250 | | | | 3,699,553 | | | | 3,373,282 | | | | 3,050,268 | | | | 11.0 | |
| Shareholders’ equity | | | 709,139 | | | | 497,341 | | | | 483,634 | | | | 479,800 | | | | 483,214 | | | | 371,707 | | | | 13.8 | |
| | | |
| | | |
| | | |
| | | |
| | | |
| | | |
| | | |
| |
| FINANCIAL RATIOS | | | | | | | | | | | | | | | | | | | | | | | | | | | | |
| Net interest margin (tax-equivalent) | | | 3.27 | % | | | 3.72 | % | | | 3.59 | % | | | 3.81 | % | | | 4.62 | % | | | 4.46 | % | | | | |
| Return on average assets | | | 1.03 | | | | 0.91 | | | | 0.77 | | | | 0.14 | | | | 0.94 | | | | 0.93 | | | | | |
| Return on average equity | | | 13.40 | | | | 11.89 | | | | 8.66 | | | | 1.46 | | | | 8.37 | | | | 9.32 | | | | | |
| Average equity as a % of average assets | | | 7.66 | | | | 7.65 | | | | 8.86 | | | | 9.53 | | | | 11.28 | | | | 9.98 | | | | | |
| | | |
| | | |
| | | |
| | | |
| | | |
| | | |
| | | | | |
| ASSET QUALITY RATIOS | | | | | | | | | | | | | | | | | | | | | | | | | | | | |
| Nonperforming assets as a % of loans held for investment and other real estate owned(b) | | | 1.06 | % | | | 1.67 | % | | | 1.17 | % | | | 0.58 | % | | | 0.43 | % | | | 0.33 | % | | | | |
| Net charge-offs to average loans held for investment | | | 0.62 | | | | 0.49 | | | | 0.54 | | | | 0.39 | | | | 0.39 | | | | 0.52 | | | | | |
| Allowance for loan losses as a % of loans held for investment(b) | | | 1.28 | | | | 1.58 | | | | 1.20 | | | | 1.16 | | | | 1.04 | | | | 1.09 | | | | | |
| | | |
| | | |
| | | |
| | | |
| | | |
| | | |
| | | | | |
| OPERATIONS DATA | | | | | | | | | | | | | | | | | | | | | | | | | | | | |
| Branch offices(c) | | | 134 | | | | 117 | | | | 90 | | | | 94 | | | | 108 | | | | 104 | | | | | |
| Employees (full-time equivalent) | | | 1,918 | | | | 1,700 | | | | 1,346 | | | | 1,374 | | | | 1,514 | | | | 1,345 | | | | | |
| | | |
| | | |
| | | |
| | | |
| | | |
| | | |
| | | | | |
Notes:
| (a) | | Excluding merger-related costs (recoveries). |
| |
| (b) | | At December 31, 2003, Rock Hill Bank & Trust Workout Loans totaled $28.6 million with nonperforming assets of $19.6 million and an allowance for loan losses of $3.2 million. At December 31, 2002, Rock Hill Bank & Trust Workout Loans totaled $72.4 million with nonperforming assets of $29.2 million and an allowance for loan losses of $16.3 million. Excluding these balances, nonperforming assets as a % of loans held for investment and other real estate owned totaled 0.72% and 1.03% at December 31, 2003 and 2002, respectively, and net charge-offs to average loans held for investment were 0.41% and 0.50% for 2003 and 2002, respectively. |
| |
| (c) | | Excludes one branch office for Community National Bank of Pulaski, Virginia, which TSFG acquired as part of its MountainBank Financial Corporation acquisition. On February 3, 2004, TSFG entered into a definitive asset sale agreement to sell substantially all of Community National Bank’s assets and liabilities. |
16
STATEMENT OF
Financial Responsibility
Management of The South Financial Group, Inc. and subsidiaries is committed to quality customer service, enhanced shareholder value, financial stability, and integrity in all dealings. Management has prepared the consolidated financial statements in conformity with accounting principles generally accepted in the United States of America. The statements include amounts that are based on management’s best estimates and judgments. Other financial information in this report is consistent with the consolidated financial statements.
In meeting its responsibility, management relies on its internal control structure that is supplemented by a program of internal audits. The internal control structure is designed to provide reasonable assurance that financial records are reliable for preparing financial statements and maintaining accountability for assets, and that assets are safeguarded against unauthorized use or disposition.
KPMG LLP, independent auditors, audited TSFG’s consolidated financial statements in accordance with auditing standards generally accepted in the United States of America. These standards include a study and evaluation of internal control for the purpose of establishing a basis for reliance thereon relative to the determination of the scope of their audits. KPMG LLP reviews the results of its audit with both management and the Audit Committee of the Board of Directors of TSFG. The consolidated financial statements have not been reviewed, or confirmed for accuracy or relevance, by the Federal Deposit Insurance Corporation.
The Audit Committee, composed entirely of independent directors, meets periodically with management, TSFG’s internal auditors and KPMG LLP (separately and jointly) to discuss audit, financial reporting and related matters. KPMG LLP and the internal auditors have direct access to the Audit Committee.
| | | |
| |  |
| Mack I. Whittle, Jr. | | William S. Hummers III |
President and
Chief Executive Officer | | Executive Vice President and
Chief Financial Officer |
INDEPENDENT AUDITORS’ REPORT
The Board of Directors
The South Financial Group, Inc.:
We have audited, in accordance with auditing standards generally accepted in the United States of America, the consolidated balance sheets of The South Financial Group, Inc. and subsidiaries as of December 31, 2003 and 2002, and the related consolidated statements of income, changes in shareholders’ equity and comprehensive income, and cash flows for each of the years in the three-year period ended December 31, 2003 (not presented herein); and in our report dated March 5, 2004, we expressed an unqualified opinion on those consolidated financial statements. Our report refers to the fact that on January 1, 2002 The South Financial Group, Inc. adopted Statement of Financial Accounting Standards No. 142, “Goodwill and Other Intangible Assets.”
In our opinion, the information set forth in the accompanying condensed consolidated balance sheets and statements of income is fairly stated, in all material respects, in relation to the consolidated financial statements from which it has been derived.

KPMG LLP
Greenville, South Carolina
March 5, 2004
17
COMPONENTS OF NONINTEREST
Income and Expenses
($ in thousands)
| | | | | | | | | | | | | |
| | | Years Ended December 31,
|
| | | 2003
| | 2002
| | 2001
|
| NONINTEREST INCOME | | | | | | | | | | | | |
| Service charges on deposit accounts | | $ | 30,856 | | | $ | 23,410 | | | $ | 18,689 | |
| Mortgage banking income | | | 10,481 | | | | 5,144 | | | | 6,370 | |
| Fees for investment services | | | 8,464 | | | | 6,423 | | | | 5,633 | |
| Bank-owned life insurance | | | 8,320 | | | | 7,429 | | | | 7,209 | |
| Merchant processing income | | | 7,214 | | | | 5,908 | | | | 5,799 | |
| Insurance income | | | 3,565 | | | | 1,698 | | | | 1,085 | |
| Gain (loss) on trading and derivative securities | | | 1,843 | | | | (934 | ) | | | 176 | |
| Other | | | 7,690 | | | | 4,442 | | | | 3,751 | |
| | | |
| | | |
| | | |
| |
| Noninterest income, excluding non-operating gains on asset sales | | | 78,433 | | | | 53,520 | | | | 48,712 | |
| Gains on non-operating asset sales, net | | | 17,057 | | | | 6,120 | | | | 4,772 | |
| | | |
| | | |
| | | |
| |
| Total noninterest income | | $ | 95,490 | | | $ | 59,640 | | | $ | 53,484 | |
| | | |
| | | |
| | | |
| |
| NONINTEREST EXPENSES | | | | | | | | | | | | |
| Personnel expense | | $ | 100,778 | | | $ | 75,118 | | | $ | 62,321 | |
| Occupancy | | | 18,925 | | | | 15,238 | | | | 14,269 | |
| Furniture and equipment | | | 17,922 | | | | 15,341 | | | | 13,526 | |
| Amortization of intangibles | | | 3,433 | | | | 1,519 | | | | 5,765 | |
| Other | | | 57,506 | | | | 45,311 | | | | 41,426 | |
| | | |
| | | |
| | | |
| |
| Noninterest expenses, excluding non-operating items | | | 198,564 | | | | 152,527 | | | | 137,307 | |
| | | |
| | | |
| | | |
| |
| Merger-related costs (recoveries) | | | 5,127 | | | | 6,664 | | | | (501 | ) |
| Loss on early extinguishment of debt | | | 2,699 | | | | 354 | | | | 3,106 | |
| Other, non-operating items | | | 780 | | | | 3,295 | | | | 908 | |
| | | |
| | | |
| | | |
| |
| Non-operating noninterest expenses | | | 8,606 | | | | 10,313 | | | | 3,513 | |
| | | |
| | | |
| | | |
| |
| Total noninterest expenses | | $ | 207,170 | | | $ | 162,840 | | | $ | 140,820 | |
| | | |
| | | |
| | | |
| |
FORWARD-LOOKING STATEMENTS
and Non-GAAP Financial Information
This Summary Annual Report contains forward-looking statements that are provided to assist in the understanding of anticipated future financial performance. These statements include, but are not limited to, factors which may affect earnings, return goals, expected financial results for mergers, market growth and credit quality assessment. However, such performance involves risks and uncertainties, such as market deterioration, that may cause actual results to differ materially from those in such statements. For a discussion of certain factors that may cause such forward-looking statements to differ materially from TSFG’s actual results, see TSFG’s Annual Report on Form 10-K for the year ended December 31, 2003. The South Financial Group undertakes no obligation to release revisions to these forward-looking statements or reflect events or circumstances after the date of this report.
This Summary Annual Report also contains financial information determined by methods other than in accordance with Generally Accepted Accounting Principles (“GAAP”). The table provided on page 19 provides reconciliations between GAAP net income and operating earnings. As has been TSFG’s practice, operating earnings adjust GAAP information to exclude the after-tax effect of non-operating items (such as merger-related costs, gain or losses on asset sales, loss on early extinguishment of debt, and other non-operating expenses).
TSFG’s management uses these non-GAAP measures in their analysis of TSFG’s performance and believes presentations of financial measures excluding these non-operating items provide useful supplemental information, a clearer understanding of TSFG’s financial performance, and better reflect its core operating activities. Management uses operating earnings, in particular, to analyze on a consistent basis and over a longer period of time the performance of which it considers to be its core operating activities. TSFG believes the non-GAAP measures enhance investors’ understanding of the company’s business and performance. These measures are also useful in understanding performance trends and facilitate comparisons with the performance of others in the financial services industry.
The limitations associated with utilizing operating earnings and cash basis information are the risk that persons might disagree as to the appropriateness of items comprising these measures and that different companies might calculate these measures differently. Management compensates for these limitations by providing detailed reconciliations between GAAP information and operating earnings. These disclosures should not be considered an alternative to GAAP.
18
RECONCILIATION OF REPORTED NET INCOME (GAAP)
To Operating Earnings (Non-GAAP)
($ in thousands)
| | | | | | | | | | | | | | | | | | | | | |
| | | | | | | | | | | | | | | | | | | |
| | | Three Months Ended,
| | Year Ended
December 31, |
| | | 3/31/03
| | 6/30/03
| | 9/30/03
| | 12/31/03
| | 2003
|
Net income, as reported (GAAP) | | $ | 20,045 | | | $ | 22,699 | | | $ | 23,893 | | | $ | 28,421 | | | $ | 95,058 | |
Adjustments for non-operating items: | | | | | | | | | | | | | | | | | | | | |
| Gain on available for sale securities | | | (2,861 | ) | | | (3,197 | ) | | | (5,953 | ) | | | (4,445 | ) | | | (16,456 | ) |
| Gain on disposition of assets and liabilities | | | — | | | | (601 | ) | | | — | | | | — | | | | (601 | ) |
| Merger-related costs | | | 1,497 | | | | 382 | | | | 345 | | | | 2,903 | | | | 5,127 | |
| Employment contract payments | | | — | | | | — | | | | — | | | | 512 | | | | 512 | |
| Loss on early extinguishment of debt | | | — | | | | — | | | | 2,699 | | | | — | | | | 2,699 | |
| Impairment loss from write-down of assets | | | — | | | | 268 | | | | — | | | | — | | | | 268 | |
| Related income taxes | | | 437 | | | | 1,007 | | | | 872 | | | | 309 | | | | 2,625 | |
| | | |
| | | |
| | | |
| | | |
| | | |
| |
Operating earnings (non-GAAP) | | $ | 19,118 | | | $ | 20,558 | | | $ | 21,856 | | | $ | 27,700 | | | $ | 89,232 | |
| | | |
| | | |
| | | |
| | | |
| | | |
| |
Average common shares outstanding, diluted | | | 48,257,498 | | | | 47,760,781 | | | | 47,992,601 | | | | 57,229,604 | | | | 50,328,353 | |
Per common share data, diluted: | | | | | | | | | | | | | | | | | | | | |
| Net income, as reported (GAAP) | | $ | 0.42 | | | $ | 0.48 | | | $ | 0.50 | | | $ | 0.50 | | | $ | 1.89 | |
| Operating earnings (non-GAAP) | | | 0.40 | | | | 0.43 | | | | 0.46 | | | | 0.48 | | | | 1.77 | |
| | | | | | | | | | | | | | | | | | | | | |
| | | | | | | | | | | | | | | | | | | |
| | | Three Months Ended,
| | Year Ended
December 31, |
| | | 3/31/02
| | 6/30/02
| | 9/30/02
| | 12/31/02
| | 2002
|
Net income, as reported (GAAP) | | $ | 13,107 | | | $ | 15,339 | | | $ | 14,776 | | | $ | 15,936 | | | $ | 59,158 | |
Adjustments for non-operating items: | | | | | | | | | | | | | | | | | | | | |
| Gain on available for sale securities | | | (40 | ) | | | (36 | ) | | | (4,317 | ) | | | (1,727 | ) | | | (6,120 | ) |
| Merger-related costs | | | — | | | | — | | | | 4,465 | | | | 2,199 | | | | 6,664 | |
| Employment contract payments | | | — | | | | — | | | | 1,583 | | | | 263 | | | | 1,846 | |
| Loss on early extinguishment of debt | | | — | | | | — | | | | 354 | | | | — | | | | 354 | |
| Impairment loss from write-down of assets | | | — | | | | — | | | | — | | | | 1,449 | | | | 1,449 | |
| Related income taxes | | | 13 | | | | 12 | | | | (636 | ) | | | (646 | ) | | | (1,257 | ) |
| Cumulative effect of change in acctg. principle, net of tax | | | 1,406 | | | | — | | | | — | | | | — | | | | 1,406 | |
| | | |
| | | |
| | | |
| | | |
| | | |
| |
Operating earnings (non-GAAP) | | $ | 14,486 | | | $ | 15,315 | | | $ | 16,225 | | | $ | 17,474 | | | $ | 63,500 | |
| | | |
| | | |
| | | |
| | | |
| | | |
| |
Average common shares outstanding, diluted | | | 42,059,462 | | | | 41,232,890 | | | | 42,504,741 | | | | 45,032,301 | | | | 42,714,938 | |
Per common share data, diluted: | | | | | | | | | | | | | | | | | | | | |
| Net income, as reported (GAAP) | | $ | 0.31 | | | $ | 0.37 | | | $ | 0.35 | | | $ | 0.35 | | | $ | 1.38 | |
| Operating earnings (non-GAAP) | | | 0.34 | | | | 0.37 | | | | 0.38 | | | | 0.39 | | | | 1.49 | |
| | | | | | | | | | | | | | | | | | | | | |
| | | | | | | | | | | | | | | | | | | |
| | | Three Months Ended,
| | Year Ended
December 31, |
| | | 3/31/01
| | 6/30/01
| | 9/30/01
| | 12/31/01
| | 2001
|
Net income, as reported (GAAP) | | $ | 8,632 | | | $ | 9,644 | | | $ | 11,000 | | | $ | 12,616 | | | $ | 41,892 | |
Adjustments for non-operating items: | | | | | | | | | | | | | | | | | | | | |
| Gain on available for sale securities | | | (1,224 | ) | | | (183 | ) | | | (1,151 | ) | | | (1,860 | ) | | | (4,418 | ) |
| Gain (loss) on disposition of assets and liabilities | | | 262 | | | | 970 | | | | 19 | | | | (1,605 | ) | | | (354 | ) |
| Merger-related costs (recoveries) | | | (413 | ) | | | — | | | | (89 | ) | | | 1 | | | | (501 | ) |
| Charitable contribution of premises | | | — | | | | — | | | | — | | | | 665 | | | | 665 | |
| Loss on early extinguishment of debt | | | — | | | | — | | | | 1,093 | | | | 2,013 | | | | 3,106 | |
| Impairment loss (recovery) from write-down of assets | | | 215 | | | | — | | | | 176 | | | | (148 | ) | | | 243 | |
| Related income taxes | | | 400 | | | | (272 | ) | | | (43 | ) | | | 272 | | | | 357 | |
| Cumulative effect of change in acctg. principle, net of tax | | | (282 | ) | | | — | | | | — | | | | — | | | | (282 | ) |
| | | |
| | | |
| | | |
| | | |
| | | |
| |
Operating earnings (non-GAAP) | | $ | 7,590 | | | $ | 10,159 | | | $ | 11,005 | | | $ | 11,954 | | | $ | 40,708 | |
| | | |
| | | |
| | | |
| | | |
| | | |
| |
Average common shares outstanding, diluted | | | 43,117,270 | | | | 43,179,212 | | | | 43,091,562 | | | | 41,906,297 | | | | 42,823,513 | |
Per common share data, diluted: | | | | | | | | | | | | | | | | | | | | |
| Net income, as reported (GAAP) | | $ | 0.20 | | | $ | 0.22 | | | $ | 0.26 | | | $ | 0.30 | | | $ | 0.98 | |
| Operating earnings (non-GAAP) | | | 0.18 | | | | 0.24 | | | | 0.26 | | | | 0.29 | | | | 0.95 | |
19
Focus. Discipline. Execution.
LEADERSHIP
Executive Management

Mack I. Whittle, Jr.
President and Chief Executive Officer
Age: 55 With TSFG since: 1986
Mack I. Whittle, Jr. has served as President/CEO and a Director of The South Financial Group since its inception in 1986. He began his banking career with Bankers Trust of South Carolina where he served in several capacities from 1969 to 1986. Whittle is Chairman of the Board of Trustees for the University of South Carolina and a past President of the South Carolina Bankers Association. He received his undergraduate degree and MBA from the University of South Carolina.

William S. Hummers III
Vice Chairman, Executive Vice President and Chief Financial Officer
Age: 58 With TSFG since: 1988
William S. Hummers III is also a Director of The South Financial Group. His responsibilities include finance, treasury, mergers and acquisitions, regulatory relations and risk management. Hummers held various positions with Southern Bank & Trust, including Controller, from 1972 to 1986 and with First Union (following its acquisition of Southern Bank) from 1986 to 1988. A graduate of the University of South Carolina, Hummers also serves as a Director of World Acceptance Corporation, a consumer finance company.

Andrew B. Cheney
President, Mercantile Bank
Age: 54 With TSFG since: 2000
Andrew B. Cheney is responsible for the Market Presidents (North Florida, Central Florida and Tampa Bay) and Florida operations. During his 27 years with Barnett Bank and Bank of America, he served as President of Barnett affiliate banks, including Jacksonville Market President, and as commercial growth executive for North Florida. A graduate of the University of Florida and the Stonier Graduate School of Banking, Cheney currently serves on the board of the Gator Bowl and is a former Chairman of the Jacksonville Chamber of Commerce.

William P. Crawford, Jr.
Executive Vice President, General Counsel
Age: 41 With TSFG since: 2002
William P. Crawford, Jr. is primarily responsible for SEC-related matters, the legal aspects of M&A and financing activities and supervision of the company’s day-to-day legal activities. From 1989 until 2001, Crawford was a member of Wyche, Burgess, Freeman & Parham, P.A., where he served as the primary counsel for The South Financial Group with responsibility for all of its corporate transactions. From 2001 to 2002, he served as Assistant General Counsel at Bowater Incorporated. Crawford received his law degree from Harvard and graduated from Indiana University with a bachelor’s and a master’s degree in piano performance.

M. Alex Crotzer
Executive Vice President, Director of Corporate Banking
Age: 50 With TSFG since: 2003
M. Alex Crotzer has functional responsibility for the banks’ business relationships and direct responsibility for treasury services, mortgage, international and merchant services. He spent 20 years with Barnett Bank in positions throughout Florida, including Chief Business Banking Executive and President of two Barnett affiliate banks. Crotzer received his undergraduate degree from the University of Florida and MBA from the University of North Florida.

J. W. Davis
President, Carolina First Bank / North Carolina
Age: 57 With TSFG since: 2003
J.W. Davis, also a Director of The South Financial Group, is responsible for the Market President (Mountain) and Western North Carolina operations. In 1997, he founded MountainBank (acquired by TSFG in 2003) and served as its President and Chief Executive Officer. He previously served over 20 years in senior management positions with NationsBank in North Carolina and South Carolina. A graduate of the University of South Carolina and the Graduate School of Banking at LSU, J.W. Davis also serves as a member of the North Carolina Banking Commission.

John C. DuBose
President, CF Technology Services Company
Age: 52 With TSFG since: 1998
John C. DuBose’s responsibilities include developing and delivering superior technology and financial-based products and services for The South Financial Group and its subsidiaries. He is also responsible for financial services (including trust, brokerage and insurance), branch administration and the Sales and Service Center. DuBose was Director of Technology Services at Barnett Bank from 1992 to 1997 and in charge of nationwide service delivery at NationsBank (following its acquisition of Barnett). He graduated from the University of South Carolina.

Mary A. Jeffrey
Executive Vice President, Corporate Director of Human Resources
Age: 53 With TSFG since: 2002
Mary A. Jeffrey’s responsibilities include compensation, benefits, employee relations, talent development, payroll and coordination of all human resources activities for the company. She began her banking career in 1979 with Barnett Bank and NationsBank (following its acquisition of Barnett). A graduate of the University of Central Florida, Jeffrey was Regional Human Resources Manager for Huntington National Bank prior to joining The South Financial Group.
20

J. Stanley Ross
Executive Vice President, Finance
Age: 52 With TSFG since: 2001
J. Stanley Ross is responsible for finance, accounting and budgets. Prior to joining The South Financial Group, Ross was a partner with Tatum CFO, where he served as CFO for clients in manufacturing, banking and other service-related industries. His prior executive financial experience also includes the chemical and pharmaceutical industries. Ross holds an undergraduate degree from the University of Georgia and MBA from the University of Southern Mississippi.

Kendall L. Spencer
Executive Vice President, Director of Retail Banking
Age: 51 With TSFG since: 2000
Kendall L. Spencer is responsible for marketing, strategic planning, company-wide sales management and product development. With 24 years in the financial services industry, he served as President of two Barnett Bank affiliate banks and director of professional/executive banking with NationsBank (following its acquisition of Barnett). A graduate of the Stonier Graduate School of Banking, Spencer holds an undergraduate degree from the University of Florida and master’s degree of divinity from Trinity Evangelical Divinity School.

Michael W. Sperry
Executive Vice President, Chief Credit Officer
Age: 58 With TSFG since: 1998
Michael W. Sperry is responsible for the quality of credit risk-taking activities, loan administration, credit administration, special assets and loan operations. Sperry was Chief Credit Officer at Southern National Corporation from 1990 to 1995 and Senior Executive Vice President over commercial lending/corporate banking at BB&T from 1995 to 1997 (following its acquisition of Southern National). In banking since 1965, Sperry also held credit and commercial lending positions at three other financial institutions. A graduate of the Stonier Graduate School of Banking, Sperry earned his undergraduate and MBA degrees from Georgia State University.

James W. Terry, Jr.
President, Carolina First Bank
Age: 56 With TSFG since: 1991
James W. Terry, Jr. is responsible for the Market Presidents (Upstate, Piedmont, Midlands and Coast) and operations in South Carolina and Coastal North Carolina. Terry began his banking career in 1970 and held numerous senior management positions with First Union until joining Carolina First. Terry is Chairman of the Greater Greenville Chamber of Commerce and is a former Chairman for the Greenville United Way. Terry graduated from the University of North Carolina.
MARKET
Presidents
South Carolina
Robert E. Brown
Executive Vice President / Piedmont
Offices: 4 Assets: $157 million
Robert R. DuRant
Executive Vice President / Coastal
Offices: 28 Assets: $1,159 million
F. Justin Strickland
Executive Vice President / Midlands
Offices: 24 Assets: $945 million
C. Fredrick West
Executive Vice President / Upstate
Offices: 25 Assets: $1,086 million
North Carolina
Scott M. Frierson
Executive Vice President / Mountain
Offices: 19 Assets: $646 million
Florida
Bruce W. May
Executive Vice President / Central Florida
Offices: 10 Assets: $459 million
Cynthia S. Stover
Executive Vice President / North Florida
Offices: 6 Assets: $219 million
Douglas Winton
Executive Vice President / Tampa Bay
Offices: 18 Assets: $630 million
21
Focus. Discipline. Execution.
LEADERSHIP
Board of Directors
THE SOUTH FINANCIAL GROUP
William P. Brant
Attorney
Brant, Abraham, Reiter
& McCormick, PA.
Chief Executive Officer
Thayendanegea Timber, LLC
Gordon W. Campbell
Vice Chairman
Mercantile Bank
J.W. Davis
President
Carolina First Bank/North Carolina
Judd B. Farr
President
Greenco Beverage Co., Inc.
C. Claymon Grimes, Jr.
Attorney
M. Dexter Hagy
Principal
Vaxa Capital Management, LLC
William S. Hummers III
Vice Chairman and
Executive Vice President
The South Financial Group
Thomas J. Rogers
Secretary — Treasurer
Strand Media, Inc.
H. Earle Russell, Jr., M.D.
Surgeon
Greenville Surgical Associates
Charles B. Schooler, O.D.
Optometrist
Edward J. Sebastian
Retired — Founder, Chairman & CEO Resource Bancshares Mortgage Group,
Inc.
Resource Bancshares Corporation
John C.B. Smith, Jr.
Owner
John C.B. Smith Real Estate
Attorney/Of Counsel
Nexsen Pruet Jacobs & Pollard, LLC
Eugene E. Stone IV
Chief Executive Officer
Stone International, LLC
William R. Timmons, Jr.
Chairman
The South Financial Group
Chairman
Canal Insurance Company
William R. Timmons III
Secretary and Treasurer
Canal Insurance Company
Samuel H. Vickers
Chairman and
Chief Executive Officer
Design Containers, Inc.
David C. Wakefield III
President
Wakefield Enterprises, LLC
Mack I. Whittle, Jr.
President and
Chief Executive Officer
The South Financial Group
CAROLINA FIRST BANK
Mary Rainey Belser
Community Volunteer
Converse College
Board of Trustees
Robin H. Dial
Partner
Dial, Dunlap & Edwards, LLC
Claude M. Epps, Jr.
Attorney
Bellamy, Rutenberg, Copeland,
Epps, Gravely & Bowers, PA.
Judd B. Farr
President
Greenco Beverage Co., Inc.
J. Bryan Floyd*
President
Caro-Strand Corporation
M. Dexter Hagy
Principal
Vaxa Capital Management, LLC
Michael R. Hogan
President
Puckett, Scheetz & Hogan Insurance
Charles B. McElveen
Co-Owner
Swamp Fox Timber Co.
W. Gairy Nichols III
Partner
Dunes Realty, Inc.
Thomas J. Rogers
Secretary — Treasurer
Strand Media, Inc.
H. Earle Russell, Jr., M.D.
Surgeon
Greenville Surgical Associates
John C.B. Smith, Jr.
Owner
John C.B. Smith Real Estate
Attorney/Of Counsel
Nexsen Pruet Jacobs & Pollard, LLC
Andrew Sorensen
President
University of South Carolina
David H. Swinton, Ph.D.
President
Benedict College
James W. Terry, Jr.
President
Carolina First Bank
William R. Timmons, Jr.
Chairman
The South Financial Group
Chairman
Canal Insurance Company
William R. Timmons III
Secretary and Treasurer
Canal Insurance Company
David C. Wakefield III
President
Wakefield Enterprises, LLC
Mack I. Whittle, Jr.
President and
Chief Executive Officer
The South Financial Group
MERCANTILE BANK
William P. Brant
Attorney
Brant, Abraham, Reiter
& McCormick, PA.
Chief Executive Officer
Thayendanegea Timber, LLC
Gordon W. Campbell
Vice Chairman
Mercantile Bank
Michael L. Carrere
Executive Vice President
Lykes Bros., Inc.
Paul D. Causey
President
Causey Fern, Inc.
U.S. Exports, Inc.
Andrew B. Cheney
President
Mercantile Bank
William F. Crider
Retired
Thomas B. Drage, Jr.
Attorney
William S. Hummers III
Vice Chairman and
Executive Vice President
The South Financial Group
Algis Koncius
President
Koncius Enterprises, Ltd.
M. Rodney Metz
Retired/Real Estate Investor
Cecil D. Moore
Moore Foundry & Machine
Louis P Ortiz
Senior Partner
Garcia & Ortiz, P.A.
Joe H. Pickens
Member
Florida House of Representatives
Attorney
Joe H. Pickens, P.A.
Ross E. Roeder
Chairman and
Chief Executive Officer
Smart & Final, Inc.
Michael W. Sperry
Executive Vice President
and Chief Credit Officer
The South Financial Group
William R. Timmons III
Secretary and Treasurer
Canal Insurance Company
Samuel H. Vickers
Chairman and
Chief Executive Officer
Design Containers, Inc.
Mack I. Whittle, Jr.
President and
Chief Executive Officer
The South Financial Group
* Deceased
22
LEADERSHIP
Advisory Board Members
ANDERSON, SC
Robert G. Austin, D.M.D.
Philip C. Cahaly
David Eugene Clary
Todd R. Davidson
Daniel J. Fleming, M.D.
Virginia Hinnant
Greg L. Shore
CHARLESTON, SC
Lodema R. Adams
Samuel H. Altman
Martha Ballenger
Henry Berlin
W. Carlyle Blakeney, Jr.
Brian M. Carmody
Joseph P. Griffith, Jr.
Warren F. Lasch
Thomas M. Leland, M.D.
Ernest L. Masters
Dennis E. O’Neill
Thomas J. Parsell
LaVonne N. Phillips
Harold R. Pratt-Thomas, Jr.
Michael C. Robinson
John I. Saalfield
William S. Stuhr, Sr.
Arthur M. Swanson
O. L. Thompson III
CLINTON, SC
Lumus Byrd, Jr.
Robert L. Cason
Joy Gault
Joe J. Gresham
John V. Griffith, Ph.D.
Lykes Henderson, Jr.
Jay J. Peay
COLUMBIA, SC
Donald H. Burkett
T. Moffatt Burriss
William C. Cantey, Jr.
Craig G. Dawson
Charlie W. Devlin, M.D.
Robin H. Dial
D. Christian Goodall
Charles R. Jackson
S. Stanley Juk, Jr., M.D., FACC
Jerry C. Kline
Robert E. Kneece, Jr.
Robert C. Pulliam
John C. B. Smith, Jr.
John P. Sutton, M.D.
James T. Tharp
Susie H. VanHuss, Ph.D.
James H. Walker
CONWAY SC
Larry L. Biddle
Jonathan L. Dieter, Jr., M.D.
J. Charley Ray
Bobby J. Smith
Kenneth Ward
William D. Witherspoon
GEORGETOWN
COUNTY, SC
T. M. Andrews
William S. Duncan
John P. Grimes
William N. Miller III
Charles A. Moore
Mark A. Nash
Louis P. Parsons
Robert B. Plowden, Jr.
Julian A. Reynolds, Jr.
Wright S. Skinner III, M.D.
R. Frank Swinnie, Jr.
John B. Trotter
GREENVILLE, SC
Judith P. Alexander
Glenn E. Batson
Alfred N. Bell, Jr.
Susan J. Bichel
Steven R. Brandt
R. Jack Dill, Sr.
Nathan A. Einstein
C. Douglass Harper
A. Foster McKissick III
Mary Louise Mims
Ruben Montalvo
E. Hays Reynolds III
Porter B. Rose
Morris E. Williams, M.D.
HAYWOOD
COUNTY, NC
Robert Steve Davis
Edward E. Jones
Robert H. Morris
HENDERSON/
BUNCOMBE COUNTY, NC
William A. Banks
Thomas L. Cooper
Ken Feagin
Danny Ford
Boyd L. Hyder
Robert P. Ingle II
J. Edward Jones
Ronald R. Lamb
James F. Miller III
Hiawatha Nicely
W. Leonard Overstreet III
Maurice O. Scott
HILLSBOROUGH
COUNTY, FL
Susan V. Cody
Thomas E. Doozan
P. H. Doyle
David J. Epstein
Jeffrey Greenacre
Theodore Jay Hamilton
Walter D. Harmon
Stephen B. Horton
Perry Jacobsen
Nancy M. Kirk, M.D.
Jefferson C. Knott
Kenneth E. Lane, Jr.
Nicholas Lanese
John Lynch
Van L. McNeel
Patrick Morelli
William R. Potter
John Prahl
Neil J. Rauenhorst
P. N. Risser III
Linda Shattles
Bruce Silverman
John E. Sullivan
James G. Summerall
Leonard Vandermast III
Susan Welsh, D.C.
Jody J. Whitmyer
Millie Woolf
JACKSONVILLE, FL
John G. Harrison III
Ken Kuester
William A. McArthur
A. C. Skinner III
Harvey E. Stringer
Edgar B. Vickers
Mark S. Wood
LAKE CITY, SC
Marlene Askins
Joe F. Boswell
Rev. Matthew C. Brown
William C. Garner, Jr.
Roger K. Kirby
James C. Lynch, Sr.
E. Leroy Nettles, Jr.
William J. Sebnick
MCDOWELL
COUNTY, NC
Lanetta Byrd
James T. Cook
E. L. Cunningham
W. Hill Evans
David Ricketts, Ph.D.
MYRTLE BEACH, SC
Dorothy K. Anderson
James Arakas
J. Carson Benton, Jr.
Cecil Brandon, Jr.
David L. Brittain
D. Richard Crumpler
Calhoun Cunningham, M.D.
A. Shaw Dargan III
William W. DesChamps
John S. Divine IV
Miles M. Herring
Douglas R. Martin
Stephen L. McMillan
Leroy Rainbow
NORTH CAROLINA
COAST
W. James Brandon
Walter R. Conlogue
J. Wright Holman
Ruppert L. Piver
Charles G. Smith IV
Harry W. Stovall III
NORTH STRAND, SC
Jay O. Baldwin III
Martin H. Barrier
John L. Martini, Jr.
Raymond L. Sessions, Jr.
C. Gene Sheppard
Lattie M. Upchurch, Jr.
Terry W. White, Sr.
PASCO COUNTY, FL
Steve Athanassie
Allen S. Crumbley
Gary L. Davis
Patrick I. Epting
David Greene
Roger E. Michels
Lori A. Mowry
G. Michael Stone
Steven M. Strobbe, D.O.
Betty Thorp
PEE DEE, SC
Donald C. Ball
Mark W. Buyck III
N. Bryant Cooper, Jr.
Reaves H. Gasque
Jean C. Leatherman
Robert E. Mottern
James K. O’Kelley
Roy E. Roberts, Jr.
PICKENS COUNTY, SC
Roddey E. Gettys
C. E. Lawton
Joel D. Ledbetter
Thomas O’Hanlan
Phil Owens
Christopher P. Robinson
Mendel Stewart
PIEDMONT, SC (CITY)
Larry Ayers
M. J. Cooper
Norma J. Hedstrom
Max Kennedy
Dawn H. Nappi
Elizabeth G. Pack
T. D. Thomason, D.C.
Jerry M. Yeargin
PIEDMONT
REGION. SC
David G. Anderson
Edwin L. Barnes
William C. Beaty, Jr.
Claude W. Burns III
Fred W. Faircloth III
Jean M. Gaillard
Hugh L. Harrelson, Sr.
Jerry H. Padgett, Ph.D.
Richard S. Powell
Betty Jo Rhea
Elvin F. Walker
PINELLAS
COUNTY, FL
Brian Bunbury
Barbara Capalbo
Frank Carr
Robert J. Carter
Joseph Connell
Kenneth C. Deacon, Jr.
Larry Garuti
C. L. Glasbrenner
John K. Handel
Thomas M. Harris
Raymond P. Hempstead
Theodore C. Henter, Jr.
Harold R. Hildebrandt
Terry Hunt
Kevin M. Hussey
Al Kamavicius
Vincent Lawrence
Doug Linder
James J. LoBianco
John F. Michel, Jr.
William C. Moore
William Newton
Farhod Nikjeh
Madeleine B. Olster
Dennis A. Palso
Emil Pratesi
Jamilou T. Rosenkrans
Keith Rowland
Michael A. Shaluly
Marga Shefman
Randy L. Stowell
Joel R. Tew
John G. Thomas
Michael Wetzel, D.Min.
Richard D. Wilkes, D.V.M.
Jerry Witts
Michael R. Zoller
POLK COUNTY, NC
Stephen H. Brady
Norman D. Brannon
Daryl Kim Talbot
Laurence M. Wassong
RUTHERFORD
COUNTY, NC
John Mark Bennett, M.D.
Terry M. Campbell
H. Lee Harrill
Todd B. Morse
Peter O’Leary
Timothy J. Ridenhour
SOUTH STRAND, SC
Michael J. Arakas
William J. Epperson, M.D.
Albert W. Hitchcock
W. Winston Hoy, Jr.
R. Kirkland McQuiddy
W. Gairy Nichols
Jerry W. Oakley
Dennis G. Permenter
E. J. Servant III
Willie C. Shelley, Jr.
John S. Springs
J. Roddy Swaim
23
Focus. Discipline. Execution.
High Performance
MARKETS
The South Financial Group operates in outstanding geographic markets with superior market demographics. The growth rates in our markets exceed the U.S. and Southeast medians for household growth and per capita income growth.
Currently, we rank fourth in total deposit share in South Carolina (a $45 billion deposit market) with a top four position in the three largest markets. In Florida’s significantly larger markets (Tampa Bay approximately $36 billion, Orlando $23 billion and Jacksonville $16 billion), we currently rank tenth or lower in deposit market share. Given our accomplishments in the Carolinas, we see tremendous opportunities in Florida.
Fast Growing
COMMUNITIES
CAROLINA FIRST
www.carolinafirst.com
Carolina First/South Carolina
| | | |
Aiken (2)
Anderson (4)
Andrews
Camden
Chapin
Charleston (4)
Clemson
Clinton (2)
Columbia (8)
Conway
Easley (2)
Edgefield
Florence (2)
Fort Mill
Garden City
Georgetown (2)
Greenville (6)
Greenwood
Greer (2)
Hampstead, NC
Hilton Head (2)
Irmo
Jacksonville, NC (2)
Lake City | | Laurens
Lexington (2)
Litchfield
Little River
Marion
Mauldin
Moncks Corner
Mount Pleasant
Mullins
Murrells Inlet
Myrtle Beach (3)
N. Myrtle Beach (2)
Newberry
Pendleton
Pickens
Piedmont
Rock Hill (3)
Summerville
Surfside Beach
Swansea
Taylors
Travelers Rest
West Columbia
Wilmington, NC (3) |
Carolina First/North Carolina
| | | |
Asheville (2)
Bakersville
Burnsville
Columbus
Fletcher
Forest City
Franklin
Hendersonville (2)
Lake Lure | | Marion
Morganton
Rutherfordton
Spruce Pine
Sylva
Tyron
Waynesville
Weaverville |
Bank CaroLine
www.bankcaroline.com
*Deposit weighted by county based on TSFG deposits in each market
** Includes AL, FL, GA, MS, NC, SC, TN, VA
Note: The regions highlighted are MSAs except for Greater South Charlotte, which is York County (“Rock Hill”), and Hendersonville, which is Henderson County
Source: SNL Financial, Claritas
24
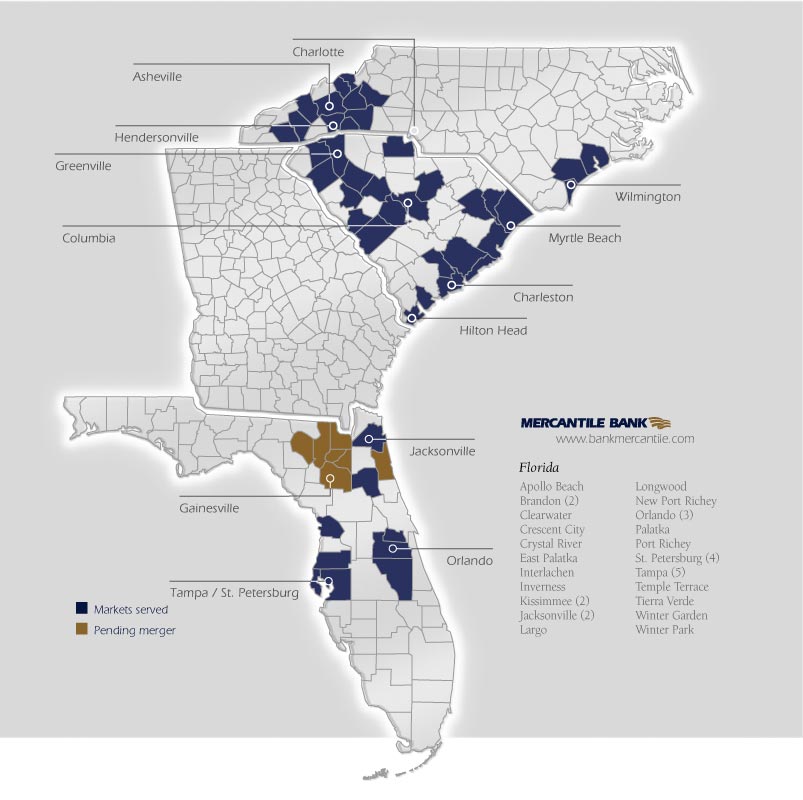
MERCANTILE BANK www.bankmercantile.com
| | | |
Florida
Apollo Beach
Brandon (2)
Clearwater
Crescent City
Crystal River
East Palatka
Interlachen
Inverness
Kissimmee (2)
Jacksonville (2)
Largo | | Longwood
New Port Richey
Orlando (3)
Palatka
Port Richey
St. Petersburg (4)
Tampa (5)
Temple Terrace
Tierra Verde
Winter Garden
Winter Park
|
25
Focus. Discipline. Execution.
Shareholder
SUMMARY
Dividend Information
Calendar
Dividends have been customarily paid as follows:
Record Dates: January 15, April 15, July 15, and October 15
Payment Dates: February 1, May 1, August 1, and November 1
Quarterly Dividend Rate
Our current quarterly dividend is $.15 per share. The South Financial Group has paid dividends in each quarter since the first quarter of 1994. Cash dividends have increased every year at an average rate of 15%.
Direct Deposit
The South Financial Group offers shareholders the convenience of automatic deposit of dividends into personal bank accounts on the same day dividends are paid. For more information, please contact the Transfer Agent by phone at (800) 368-5948 or by e-mail at info@rtco.com.
Dividend Reinvestment Plan
Shareholders may purchase additional shares of common stock at a 5% discount by reinvesting cash dividends. Participants in the plan may also invest additional cash, up to a maximum of $10,000 per month, for purchase of common stock at market value. For more information, please contact Investor Relations by phone at (800) 951-2699 ext. 54919 or by e-mail at investor@thesouthgroup.com.
Annual Meeting
The Annual Meeting of Shareholders will be held at 10:30 a.m., April 27, 2004 at the Gunter Theatre, Peace Center for the Performing Arts, Greenville, South Carolina.
Stock Listing
The Nasdaq Stock Market
Ticker Symbol: TSFG
Stock Information
| | | | | | | | | | | | | |
For the Year
| | 2003
| | 2002
| | % Change
|
| Stock price ranges: | | | | | | | | | | | | |
| High | | $ | 29.58 | | | $ | 24.29 | | | | 22 | % |
| Low | | | 19.25 | | | | 17.51 | | | | 10 | |
| Close | | | 27.75 | | | | 20.66 | | | | 34 | |
| Cash dividends paid per share | | | 0.56 | | | | 0.48 | | | | 17 | |
Total return to shareholders(a) | | | 37.03 | % | | | 19.10 | % | | | | |
| Annual shares traded (000s) | | | 56,997 | | | | 33,782 | | | | 69 | |
| | | | | | | | | | | | | |
At December 31
|
| Shares outstanding (000s) | | | 59,064 | | | | 47,347 | | | | 25 | % |
| Shareholders of record | | | 8,896 | | | | 7,560 | | | | 18 | |
Price/earnings multiple(b) | | | 14.68 | x | | | 14.97 | x | | | | |
| Price/book multiple | | | 1.67 | | | | 1.51 | | | | | |
Notes:
| (a) | | Based on stock price and cash dividends paid. |
| |
| (b) | | Based on year-end closing price divided by net income per share. |
Form 10-K
A copy of The South Financial Group’s Annual Report on Form 10-K as filed with the Securities and Exchange Commission is available at no charge by contacting Investor Relations at the address on the inside back cover of this report and at www.thesouthgroup.com under Investor Relations.
26
CORPORATE
Headquarters
The South Financial Group
104 South Main Street
Poinsett Plaza, 10th Floor
Greenville, South Carolina 29601
(864) 255-7900
www.thesouthgroup.com
CONTACT
Information
Customer Service
For customers requesting assistance regarding accounts, products or services, please contact our Sales and Service Center by phone at(800) 476-6400 (for NC and SC) or (800) 238-8681 (for FL)or by e-mail atcustomerassistance@thesouthgroup.com.
Investor Relations
For analysts, investors and others seeking financial information, please contact:
Investor Relations
The South Financial Group
P.O. Box 1029
Greenville, South Carolina 29602
(800) 951-2699 ext. 54919
e-mail: investor@thesouthgroup.com
Transfer Agent
For shareholders seeking help with a change of address, records or information about lost certificates, stock transfers, dividends checks or dividend reinvestment, please contact our Transfer Agent:
Registrar and Transfer Company
10 Commerce Drive
Cranford, New Jersey 07016-3572
(800) 368-5948
e-mail: info@rtco.com
www.rtco.com
INTERNET
Information
News releases and other information about The South Financial Group are available on the Internet at our corporate website, www.thesouthgroup.com.
| | | |
| | |
| The South Financial Group | | |
| 104 South Main Street | | |
| Poinsett Plaza | | |
| Greenville, SC 29601 | | |
| www.thesouthgroup.com | | |