
Second Quarter 2008
Financial Review
July 23, 2008

Forward-Looking Statements
and Non-GAAP Financial Information
The forward-looking statements, as defined in the applicable federal securities laws, being made today are subject to risks
and uncertainties. TSFG’s actual results may differ materially from those set forth in such forward-looking statements.
These statements include, but are not limited to, factors that may affect TSFG’s return goals, loan growth, customer
funding growth, expense control, income tax rate, expected financial results for acquisitions, noninterest income, adequacy
of capital and future capital levels, factors that will affect credit quality and the net interest margin, effectiveness of
hedging strategies, risks and effects of changes in interest rates, effects of future economic conditions, and market
performance. Reference is made to TSFG’s reports filed with the Securities and Exchange Commission for a discussion of
factors that may cause such differences to occur. TSFG undertakes no obligation to release revisions to these forward-
looking statements or reflect events or circumstances after today’s presentation.
This presentation contains certain non-GAAP measures that exclude the impact of certain nonoperating items. TSFG
management uses these non-GAAP, or operating measures, in its analysis of TSFG’s performance. TSFG believes
presentations of financial measures excluding the impact of certain items provide useful supplemental information and
better reflect its core operating activities. Management uses operating measures, in particular, to analyze on a consistent
basis and over a longer period of time, the performance of which it considers to be its core operations.
Operating measures adjust GAAP information to exclude the effects of nonoperating items, such as gains or losses on
certain asset sales, early extinguishment of debt, employment contract buyouts, impairment charges, and other
nonoperating expenses. The limitations associated with utilizing operating measures are the risk that persons might
disagree as to the appropriateness of items comprising these measures and different companies might calculate these
measures differently. Management compensates for these limitations by providing detailed reconciliations between GAAP
and operating measures. These disclosures should not be considered an alternative to GAAP results. A reconciliation of
GAAP results and non-GAAP measures is provided in the Quarterly Financial Data Supplement on our web site,
www.thesouthgroup.com, in the Investor Relations section under Quarterly Earnings.

2Q08 Highlights
Fortified capital and balance sheet
Took aggressive actions to manage problem loans
Improved net interest margin
Realigned corporate organizational structure to enhance focus
on strategic objectives
Initiating formal project for efficiency improvements through
expense savings and revenue growth
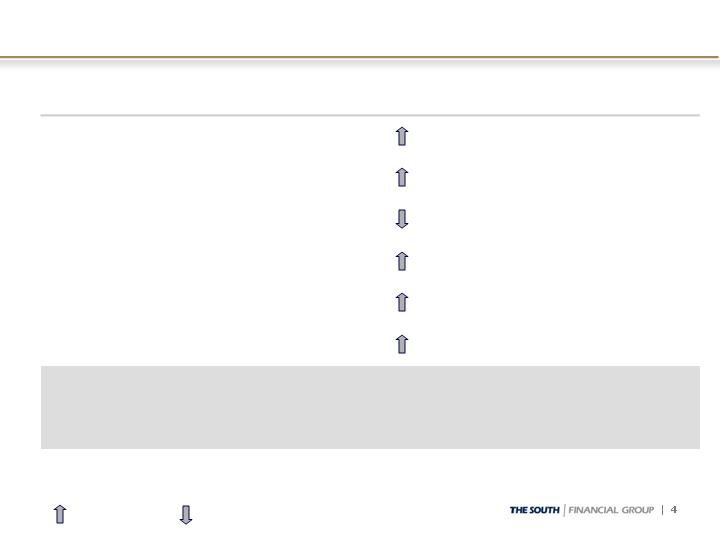
Favorable change Unfavorable change
2Q08 Financial Results
Exceeded NCOs by $16.8 million;
increased allowance to 1.85%
(9.5)
73.3
63.8
Provision for credit losses
4.6
41.3
45.8
Pre-tax, pre-provision
operating income*
$(0.02)
$(1.6)
14.1
4.6
1.7
$7.5
$ Change
$(0.20)
$(0.22)
Per diluted share*
(32.0)
(17.9)
Pre-tax operating loss*
2Q08 included $5.8 million in
preferred stock dividends
$(14.5)
$(16.1)
Operating loss available to
common shareholders*
$1.2 million for increase in loan
collection and monitoring
80.1
84.7
Operating noninterest
expenses*
Higher customer fee and mortgage
banking income
28.6
30.3
Operating noninterest
income*
$100.2
2Q08
NIM improved 17 bps to 3.24%
$92.7
Net interest income
Comments
1Q08
* Excludes non-operating items. Net loss available to common shareholders totaled $16.8 million, or $(0.23) per diluted share, for 2Q08 and $201.3
million, or $(2.78) per diluted share, for 1Q08. For non-operating items, see slide 15 for non-operating noninterest income and slide 16 for non-
operating noninterest expenses. Reconciliations of GAAP to non-GAAP measures are provided on page 15 of the Quarterly Financial Data Supplement
for 2Q08 available in the Investor Relations section of TSFG’s web site, www.thesouthgroup.com.
($ in millions, except per share data)

Credit Quality Results
NPAs of 2.30% of loans HFI and foreclosed property, up slightly from
2.26% in prior quarter
NPLs of 2.10% of loans HFI, down 8 bps from 2.18% in prior quarter
NCOs $47.0 million, or 1.81% of average loans annualized, up from $25
million, or 0.98% annualized, in first quarter
Provision of $63.8 million, down from $73.3 million in prior quarter
Exceeds NCOs by $16.8 million; built reserve from 1.72% at 3/31/08
to 1.85% at 6/30/08
Coverage of NPLs increased from 0.78x at 3/31/08 to 0.87x at
6/30/08
Key drivers:
Inflow of new nonaccrual loans down 53% from elevated first quarter
levels
Sold approximately $40 million in NPLs, including 3 of the largest 7
2Q08 NCOs include $16.1 million related to the sale
Successful in moving $10.5 million in commercial NPLs into OREO
Workout efforts showing results
Residential construction continues to be primary stress
Loan and Credit Quality Composition
0.84%
$71.9
$47.0
2.09%
$219
100%
$10,476
Total Loans HFI
3.21%
5.0
3.8
4.51%
28
6%
629
Mortgage*
1.46%
5.7
3.3
0.07%
1
7%
729
Indirect – sales
finance
0.74%
0.9
0.8
0.60%
5
7%
781
Home equity
2.16%
0.20%
8.47%
0.57%
0.84%
0.43%
0.98%
NAL %
of O/S
Balance
1.0
33.6
10.0
2.9
0.9
$11.8
YTD Net
Charge-
offs
$25.0
1.0
22.3
8.7
2.6
0.4
$4.4
QTD Net
Charge-
offs
1.14%
1.95%
1.33%
0.86%
0.21%
0.43%
0.50%
30-day
past due
%
17
19%
2,037
Completed
income property
3
6%
575
Commercial
development
$10,276
100
1,550
1,184
$ 2,891
Outstanding
Balance
1%
15%
11%
28%
% of O/S
Balance
0
Other*
5
Owner-occupied
CRE
$28
C&I
131
Residential
construction
$222
Nonaccrual
Loans
Total, 3/31/08
As of June 30, 2008, $ in millions
HFI = Held for Investment; 30-day past due % of outstanding balance excludes nonaccrual loans
* Mortgage includes Consumer Lot Loans. Other includes Direct Retail and Unsecured Lines.
See page 9 of the Quarterly Financial Data Supplement for Commercial Real Estate loans by product type and by
geography. Commercial Development includes Commercial A&D and Commercial Construction. Residential
Construction includes Residential A&D, Residential Construction, Residential Condo, and Undeveloped Land.
Also, see Appendix for comparative information as of March 31, 2008.
Residential Construction by Geography
0.29%
$1.0
$0.8
2.93%
$15
32%
$499
Total SC
0.14%
$0.2
2.67%
$14
31%
$506
Total SC, 3/31/08
1.77%
$1.2
5.48%
$17
19%
$316
Total NC, 3/31/08
2.40%
$30.8
$20.9
13.18%
$96
47%
$729
Total FL
2.41%
$9.8
12.80%
$103
50%
$806
Total FL, 3/31/08
1.33%
$33.6
$22.3
8.47%
$131
100%
$1,550
Overall Total
1.58%
$11.2
8.23%
$134
$1,628
Overall Total, 3/31/08
0.52%
$1.7
$0.6
6.43%
$21
21%
$322
Total NC
33.19%
5.79%
16.90%
6.88%
NAL %
of O/S
Balance
10.6
2.3
11.5
$6.3
YTD Net
Charge-
offs
7.7
2.3
6.5
$4.4
QTD Net
Charge-
offs
4.91%
8.47%
0.40%
1.33%
30-day
past due
%
44
17%
259
FL residential A&D
6
7%
103
FL residential
construction
80
$287
Outstanding
Balance
5%
18%
% of
Resid.
Constr.
27
FL residential
condo
$20
FL undeveloped
land
Residential Construction:
Nonaccrual
Loans
As of June 30, 2008, $ in millions
30-day past due % of outstanding balance excludes nonaccrual loans.
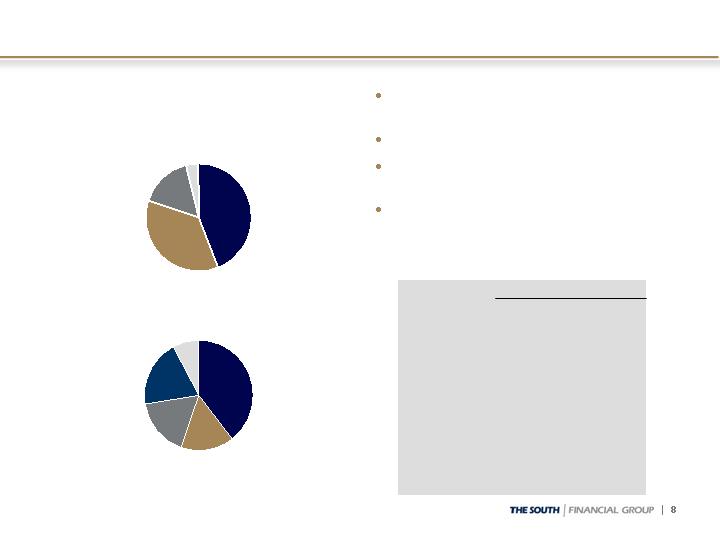
Home Equity Lines/Loans
SC, $343
43.8%
FL, $277
35.6%
NC, $127
16.3%
As of June 30, 2008, $ in millions
Originated by TSFG sales force
in-market; no broker loans
Strong FICO scores
Conservative LTV position and
usage amounts
Not pushed as a growth product
Home Equity Portfolio = HE Line and HE Loan portfolios
Geography based on customer address
Other, $34
4.3%
Summary Statistics
NA
NA
53%
WAvg Util %
70%
55%
45%
730
729
$781
Total
67%
71%
Orig WAvg
LTV %
20%
67%
2ndLien %
80%
33%
1stLien %
693
740
Jul 08 FICO
698
737
Orig FICO
$199
$582
Balance $
Loans
Lines
2008, $61
7.8%
2007, $154
19.7%
2006, $134
17.1%
2004 or before
$307
39.5%
2005, $125
15.9%
By Vintage
Total Home Equity Portfolio, $781
By Geography
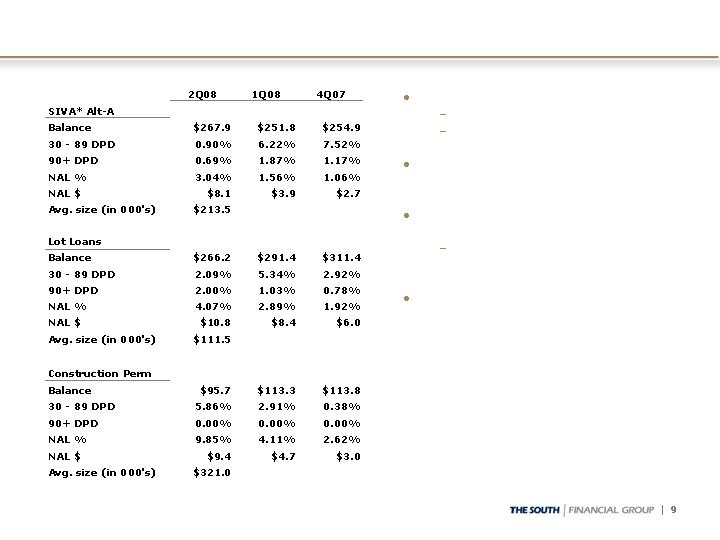
Mortgage Portfolio
Small portion of portfolio
$629 million
6% of total loans HFI
NAL increased from $17.0 in
Q1 to $28.4 in Q2
Increases primarily from
higher risk portions
Lot Loans and
Construction Perm
Lot Loans and Construction
Perm balance declining due
to tightened underwriting
standards implemented
several quarters ago
As of June 30, 2008, $ in millions
Mortgage Portfolio = Mortgage, Consumer Lot Loans, and Construction Perm products (excludes HE Loan)
* SIVA = Stated Income Verified Assets

Balance Sheet Actions
Fortified capital position
5/08: $239 million of mandatory convertible preferred stock
5/08: Reduced quarterly cash dividend to $0.01 per share; preserves $52 million
annually in retained capital
7.94% tangible equity ratio at June 30th, above 6-6.5% TSFG targeted range
$9.63 tangible book value per share at June 30th, assuming preferred stock
conversion
Manage balance sheet size
Limit loan growth during second half of 2008
Shut down indirect lending in Florida
Let existing portfolio of $484 million runoff
Projected runoff of approximately $114 million for second half of 2008
Continue relationship lending with focus on deposit balances
Shift in CRE focus to high quality income property production
Increased allowance for credit losses to 1.85% of LHI
Maintain coverage ratio on NPLs in 0.8x range
Enhance strategic focus on retail banking/deposit gathering
Elevated retail banking in corporate reorganization
6/08: Purchased 5 retail branch offices in Orlando from BankAtlantic
Limited credit exposure in investment portfolio
Includes no Fannie Mae or Freddie Mac common or preferred stock

Capital Position
Capital in Excess of Well
Capitalized Minimum
$742
$269
$675
$989
$474
$923
$403
Pre-tax $
assuming
35% tax rate
5%
10%
6%
5%
10%
6%
TSFG target
6-6.5%
Well
Capitalized
Minimum
8.61%
11.48%
9.71%
9.81%
12.59%
11.05%
7.94%
6/30/08
Actual*
$175
Total risk-based
$482
Leverage
CAROLINA FIRST BANK
$439
Tier 1 risk-based
$308
Total risk-based
$643
Leverage
$600
Tier 1 risk-based
$262
Tangible equity to tangible
assets
THE SOUTH FINANCIAL GROUP
After-tax $
($ in millions)
* Estimated
** Assuming preferred stock conversion
Excess Loss Absorption – Next 12 Months
554
55
Capital associated with losses ($554 at 10%)
$609
40
63
182
$269
Pre-tax $
assuming 35%
tax rate
Excess cash at TSFG (parent company)4
Pre-tax, pre-provision operating income for 4 qtrs2
Estimated loss absorption potential5
Allowance for credit losses in excess of 1.25% of LHI3
Capital in excess of “Well Capitalized” minimum1
CAROLINA FIRST BANK: Total Risk-Based
($ in millions)
Notes:
1 Per previous slide
2 Based on average pre-tax, pre-provision operating income for the last 6 quarters of $45.4 million. Assumes income would be
available to absorb losses incurred over the next 12 months. Also, excludes losses recognized in 1H08 totaling approximately
$71.9 million for net loan charge-offs.
3 Based on June 30, 2008 allowance for credit losses of 1.85%
4 Assumes no CFB to TSFG dividend and coverage of preferred dividends, common dividends, and debt service requirements
through December 31, 2010.
5 Does not include any shrinkage of the balance sheet over next 12 months.

Net Interest Income and Margin
0.10
5.1
Balance sheet management
3.24%
$101.5
SECOND QUARTER 2008
0.03
1.0
Decrease in nonaccrual interest reversals
0.04
1.2
New preferred stock issuance - $239 million, net
Estimated impact from:
$94.2
Net
Interest
Income (FTE)
3.07%
FIRST QUARTER 2008
Net
Interest
Margin
($ in millions)
2H08 HEADWIND: Expect pressure on customer funding and wholesale borrowing pricing

Customer Funding
(1.1)%
(80)
7,576
7,496
Customer deposits
(14.9)%
(94)
631
537
Customer sweep accounts
Customer deposits:
(2.1)%
(11.9)%
2.5%
(4.8)%
0.2%
LQ %
Change
(77)
1,618
1,541
Commercial
16
645
661
Public funds
(31)
260
229
Other
$(174)
$8,207
$8,033
Total customer funding
$12
$ Change
$5,053
3/31/08
Balance
$5,065
6/30/08
Balance
Retail
($ in millions)
Customer funding reflects total deposits excluding brokered deposits plus customer sweeps.

Noninterest Income
Non-operating items:
n/m
0.2
--
0.2
Gain on certain derivative activities
(5.6)
(0.1)
0.9
0.8
Merchant processing income, net
(7.5)
(0.3)
3.2
2.9
Bank-owned life insurance
n/m
(1.9)
1.9
--
Gain on Visa IPO share redemption
4.1%
$ 1.3
$30.9
$32.2
Total noninterest income
n/m
5.9
22.5
25.1
1.0
5.6%
% Change
0.1
7.0
7.1
Wealth management income
0.4
1.5
1.9
Mortgage banking income
0.6
2.4
3.0
Other
1.7
28.6
30.3
Operating noninterest income
1.5
0.4
1.9
Gain on securities
$ 0.8
$ Change
$13.6
1Q08
$14.4
2Q08
Customer fee income
($ in millions)

Noninterest Expenses
Non-operating items:
10.5
0.2
2.5
2.7
Advertising and business development
n/m
0.9
(0.9)
--
Visa-related litigation
n/m
$(180.6)
$268.2
$87.6
Total noninterest expenses
n/m
n/m
n/m
n/m
5.8%
5.9
14.3
123.4
2.5%
% Change
(188.4)
188.4
--
Goodwill impairment
1.2
1.0
2.1
2.5
2.2
Loan collection and monitoring
0.3
2.4
FDIC insurance
1.8
30.4
32.2
Other
4.6
80.1
84.7
Operating noninterest expenses
(0.6)
0.5
(0.1)
(Gain) loss on early extinguishment of
debt
0.7
--
0.7
BankAtlantic conversion costs
2.3
--
2.3
Employment contract buyout and
severance
$1.1
$ Change
$44.1
1Q08
$45.2
2Q08
Salaries and employee benefits
($ in millions)
Organizational Structure
OPERATING COUNCIL
Chris Holmes
Chief Retail
Banking Officer
Lynn Harton
Chief Commercial
Banking Officer
James Gordon
Chief Financial
Officer
Mack Whittle
Chairman, President & CEO
Rob Edwards
Chief Risk Officer
Board Risk
Committee
Other Direct Reports to
Mack Whittle:
Jim Terry
Workout Team
William Crawford
General Counsel
Keith Williamson
General Auditor
Board Audit
Committee

APPENDIX
Comparative Information
as of 3/31/08
Loan and Credit Quality Composition, 3/31/08
1.14%
$25.0
2.16%
$222
100%
$10,276
Total Loans HFI
6.43%
1.2
2.59%
17
6%
657
Mortgage*
1.20%
2.4
0.12%
1
7%
711
Indirect – sales
finance
1.26%
0.1
0.53%
4
7%
754
Home equity
0.06%
8.23%
3.50%
0.93%
0.57%
0.80%
NAL % of
O/S
Balance**
0.3
11.2
1.3
0.3
0.6
$7.6
QTD Net
Charge-
offs
1.58%
1.58%
1.93%
0.20%
0.26%
0.39%
30-day
past due
%
18
19%
1,972
Completed
income property
20
6%
557
Commercial
development
101
1,628
1,107
$ 2,789
Outstanding
Balance
1%
16%
11%
27%
% of O/S
Balance
0
Other*
6
Owner-occupied
CRE
$22
C&I
134
Residential
construction
Nonaccrual
Loans**
As of March 31, 2008, $ in millions
HFI = Held for Investment; 30-day past due % of outstanding balance excludes nonaccrual loans
* Mortgage includes Consumer Lot Loans. Other includes Direct Retail and Unsecured Lines.
** Reflects the reclassification of Construction Perm loans from C&I to Mortgage.
Residential Construction by Geography, 3/31/08
0.14%
$0.2
2.67%
$14
31%
$506
Total SC
2.41%
$9.8
12.80%
$103
50%
$806
Total FL
1.77%
$1.2
5.48%
$17
19%
$316
Total NC
1.58%
$11.2
8.23%
$134
100%
$1,628
Overall Total
37.11%
5.05%
13.06%
5.46%
NAL % of
O/S Balance
3.0
--
4.9
$1.9
Net
Charge-
offs
3.33%
4.46%
2.74%
1.07%
30-day
past due
%
38
18%
292
FL residential A&D
5
6%
97
FL residential
construction
118
$299
Outstanding
Balance
7%
19%
% of
Resid.
Constr.
44
FL residential
condo
$16
FL undeveloped
land
Residential Construction:
Nonaccrual
Loans
As of March 31, 2008, $ in millions
30-day past due % of outstanding balance excludes nonaccrual loans

Current as of 7/22/08